an economic analysis of photovoltaics versus … economic analysis of photovoltaics versus...
TRANSCRIPT

An Economic Analysis of Photovoltaics versus Traditional Energy Sources: Where are We Now and Where Might We Be
in the Near Future?
NREL is a national laboratory of the U.S. Department of Energy, Office of Energy Efficiency and Renewable Energy, operated by the Alliance for Sustainable Energy, LLC.
Michael WoodhouseAdditional NREL Authors: Alan Goodrich,
Ted James, Robert Margolis, David Feldman, and Tony Markel2
Strategic Energy Analysis Center and 2Electric Vehicles ProgramThe National Renewable Energy Laboratory
Analysis Funding Provided by The United States DOE, Solar Energy Technologies ProgramPresented at the IEEE Photovoltaic Specialist Conference (PVSC) 2011, June 19-24, 2011, Seattle, Washington
NREL/PR-6A20-52311
Analysis DisclaimerDISCLAIMER AGREEMENT
These manufacturing cost model results (“Data”) are provided by the National Renewable Energy Laboratory (“NREL”), which is operated by the Alliance for Sustainable Energy LLC (“Alliance”) for the U.S. Department of Energy (the “DOE”).
It is recognized that disclosure of these Data is provided under the following conditions and warnings: (1) these Data have been prepared for reference purposes only; (2) these Data consist of forecasts, estimates or assumptions made on a best-efforts basis, based upon present expectations; and (3) these Data were prepared with existing information and are subject to change without notice.
The names DOE/NREL/ALLIANCE shall not be used in any representation, advertising, publicity or other manner whatsoever to endorse or promote any entity that adopts or uses these Data. DOE/NREL/ALLIANCE shall not provide any support, consulting, training or assistance of any kind with regard to the use of these Data or any updates, revisions or new versions of these Data.
YOU AGREE TO INDEMNIFY DOE/NREL/ALLIANCE, AND ITS AFFILIATES, OFFICERS, AGENTS, AND EMPLOYEES AGAINST ANY CLAIM OR DEMAND, INCLUDING REASONABLE ATTORNEYS' FEES, RELATED TO YOUR USE, RELIANCE, OR ADOPTION OF THESE DATA FOR ANY PURPOSE WHATSOEVER. THESE DATA ARE PROVIDED BY DOE/NREL/ALLIANCE "AS IS" AND ANY EXPRESS OR IMPLIED WARRANTIES, INCLUDING BUT NOT LIMITED TO, THE IMPLIED WARRANTIES OF MERCHANTABILITY AND FITNESS FOR A PARTICULAR PURPOSE ARE EXPRESSLY DISCLAIMED. IN NO EVENT SHALL DOE/NREL/ALLIANCE BE LIABLE FOR ANY SPECIAL, INDIRECT OR CONSEQUENTIAL DAMAGES OR ANY DAMAGES WHATSOEVER, INCLUDING BUT NOT LIMITED TO CLAIMS ASSOCIATED WITH THE LOSS OF DATA OR PROFITS, WHICH MAY RESULT FROM AN ACTION IN CONTRACT, NEGLIGENCE OR OTHER TORTIOUS CLAIM THAT ARISES OUT OF OR IN CONNECTION WITH THE USE OR PERFORMANCE OF THESE DATA.
The National Renewable Energy Laboratory Innovation for Our Energy Future

Overview: The Need for a Low Carbon Energy FutureProjected Trends in Primary Power Consumption:
≈15 TW in 2004; ≈30 TW in 2050
Pre-Industrial CO2 concentration: 280 ppm
Carbon-Free Power Requirements(including efficiency)In 2035 to keep CO2 <550 ppm:
≈10 TWIn 2050 to keep CO2 <550 ppm:
A LOT!!!!
WRE= Wigley, Richels, and Edmonds
M. I. Hoffert et. al., Nature, 1998, 395, 881The National Renewable Energy Laboratory Innovation for Our Energy Future
CO2Concentration
(ppm)
Global Mean Temperature
Increase Above Pre-Industrial Levels
445-490 2.0-2.4
490-535 2.4-2.8
535-590 2.8-3.2(‘Dire Increase’)
590-710 3.2-4.0
710-855 4.0-4.9
855-1130 4.9-6.1
(Table 3.5 in IPCC Fourth Assessment Report)
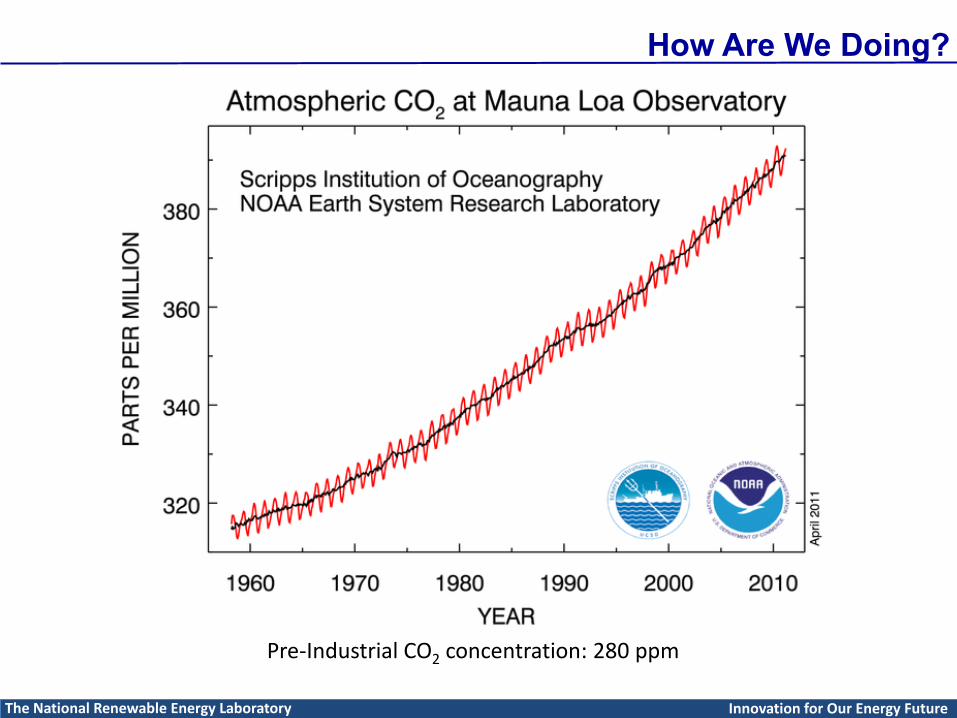
How Are We Doing?
Pre-Industrial CO2 concentration: 280 ppm
The National Renewable Energy Laboratory Innovation for Our Energy Future

Overcoming The Oil Conundrum: The Other Value Proposition of Renewables
The National Renewable Energy Laboratory Innovation for Our Energy Future
2010 U. S. Crude Oil Trade Balance: Imports – Exports= $252.06 Billion – $1.32 Billion= 50.4% of the 2010 U. S. Trade Deficit
Data Sources:U. S. Bureau of Economic Analysis, U. S. International Trade in Goods and Services Reports & DOE (EIA)
U. S. Crude Oil Trade
Deficit ($ Billion)
Oil Price($/ bbl, Weekly
Averages)
2005 $180 $49
2006 $220 $60
2007 $250 $69
2008 $340 $96
2009 $190 $60
2010 $251 $81
2011 (to 5/31/11) --- $98

Lets Start Here: What are the costs for a PV Installation?
Materials:• Module ($1.50 – $2.00/ W)• Inverter (<$0.50/ W)• Racking, Roof Mounts, Wiring,
Frames, Combiner Boxes, etc.
Labor:• Electrical and Manual
(Varies regionally, we use RS Means)
• System Design and Engineering• Grid Connection
The National Renewable Energy Laboratory Innovation for Our Energy Future
Margins:• Manufacturing• Distribution• Installation
Soft Costs:• Permitting (Estimated $500 for 5 kW)• Sales Tax (5% in this analysis (CO))

System Costs
The National Renewable Energy Laboratory Innovation for Our Energy Future
$/W to LCOE is not necessarily a perfect correlation:
Efficiency, System Reliability, andCapacity Factor are additional factors(e.g., the low light level efficiency benefit
of CdTe or the approximately 25-30%increase in capacity factor, kWh/ kWp,for 1-axis tracking).Goodrich, A.; Feldman, D.; James, T.; Woodhouse, M. Installed Cost of U.S.-
Based Solar Photovoltaic Systems. ; NREL Report No. TP-6A20-52225.

Estimated Residential System Costs Along the c-Si Roadmap
The National Renewable Energy Laboratory Innovation for Our Energy Future
Non-Module costs may most significantly limit thedownward trajectory of system costs; reaching the SunShot$2/W residential equivalent goal will certainly require newinnovations in BOS as well as modules.

Calculating The Levelized Cost of Electricity (LCOE) for PV
LCOE ($/ kWh) =Total Life Cycle Cost ($)
Total Lifetime Energy Production (kWh)
=Initial Investment + Annual O & M Costsn
1+ Discount Rate( )nn =1
N
∑ −Depreciationn
1+ Discount Rate( )n x(Tax Rate)n =1
N
∑Rated kWh/ kWp x Capacity Factor
1+ Discount Rate( )n x(1- System Degradation Rate)n
n =1
N
∑
CostStability/ Reliability Financing
(Standard Deductions from Tax Liability)
Efficiency(AND SYSTEM LOCATION)
The National Renewable Energy Laboratory Innovation for Our Energy Future

The Estimated LCOE for the Residential System
NREL Solar Advisory Model (SAM) Input Assumptions
PV System Lifetime of 30 yearsModule degradation: 0.5%/yr; Temperature coefficient: -0.38%/ C
Financing assumptions (John Bartlett, formerly DOE, and David Feldman, NREL):2.5% Inflation RateMortgage Loan (80% Debt, 30 years, 7% Discount Rate)28% Federal Tax Rate for Interest Expense DeductionsLease (100% Cash, But Leases are not yet a SAM functionality)35% Federal Tax Rate for 5 Year MACRS Depreciation
LCOE ($/ kWh) = Total Life Cycle CostTotal Lifetime Energy Production
30% ITC
The National Renewable Energy Laboratory Innovation for Our Energy Future
30%ITC
Assuming Same System Cost for All Locations.LCOE Differences shown are Solely Due to Different Irradiation Levels.
2011 Residential PV LCOE Estimates

The LCOE for PV Against Traditional Power Rates in the U. S.:A Range of Considerations
The National Renewable Energy Laboratory Innovation for Our Energy Future
LCOE Assumptions: Incentives: No federal, state, local or utility incentives are included.Taxes : Residential PV segment assumes host ownership, therefore no taxes are paid on electricity. Mortgage payments in residential sector are tax-deductable. Utility PV Assumes IPP or IOU ownership, and thus the LCOE includes the taxes paid on the profit from electricity generated and sold. LCOE includes 5-year MACRS in the Utility PV segment. Financing: Residential PV assumes a high financing scenario of a nominal 6% Weighted Average Capacity Cost (WACC). The low financing scenario assumes 80% of system cost is paid through a mortgage loan, with a 7% interest rate. Utility PV assumes a high financing scenario with a nominal 9.89% WACC, with a 50% debt level. The low financing scenario assumes a nominal 8.15% WACC, with a 60% debt level. Location: LCOE calculations were performed assuming a range of solar insolation. New York and Phoenix were used as proxies.
For a complete list of LCOE assumptions, see “Levelized Cost of solar Electronic Technologies,” Bartlett et. al. Publication forthcoming. Figure courtesy of David Feldman, NREL.
$0.00
$0.05
$0.10
$0.15
$0.20
$0.25
$0.30
$0.35
Residential Utility (Fixed axis) Utility (One axis)
Cos
t of E
nerg
y in
$/k
Wh
(201
0$)
UNsubsidized Continental U.S. Installed Solar PV System LCOEAgainst Current Statewide Average Electricity Rates
National Retail Average: 11.1 ¢/ kWh(EIA May 2011 Electric Power Monthly)
National Industrial Average: 6.7 ¢/ kWh(EIA May 2011 Electric Power Monthly)
PV LCOE PV LCOE
PV LCOE
AverageStatewideElectricity
RatesAverage
StatewideElectricity
Rates
AverageStatewideElectricity
Rates

Let’s Examine the U. S. Market Even More Closely
Rates Source: DOE (EIA): May 15, 2011 Release of Electric Power Monthly.Note: California alone is the eighth largest economy in the world (EconPost.com., 2009).While sizable ‘transition markets’ are available, the costs of PV will have to continue their downward trend in order to meet broader ‘Grid Parity’.
2010 Costs and Incentives•Includes 30% Federal ITC. (Guaranteed until 2016; 10% thereafter). State incentives not included.
•$6.50/WDC Residential system (4.4 kW); however, more recent costs are lower.
•Electricity rate source: EIA
Tiered Rate Structure for California’s SCE and P G & E
Baseline
12 ¢/ kWh
Tier 2
0 - 30% Above
Baseline
14 ¢/ kWh
Tier 3
31 -100% Above
Baseline
29 ¢/ kWh
Tier 4
>100%Above
Baseline
40 ¢/ kWh
The National Renewable Energy Laboratory Innovation for Our Energy Future
¢/ kWh Missouri California Texas NationalResidential 8.2 15.1 11.0 11.1
Commercial
7.0 12.6 8.9 10.0
Industrial 5.4 9.7 6.1 6.7
Weighted Avg
7.3 13.0 9.1 9.7

Current and Projected LCOE for Residential PV Compared to State-by-State Electricity Rates
The National Renewable Energy Laboratory Innovation for Our Energy Future
Notes: -- Unsubsidized LCOE shown at the top of each bar. The White numbers estimate the LCOE with the current and post-2016 ITC benefit.-- 2011 average residential rates for each state (May 2011 EIA Electric Power Monthly data) is indicated with blue horizontal bar.-- Grid Parity in ‘transitional markets’ is clearly possible with wafer-Si; however, new technologies will be needed for the cost of PV to arrive at
NATIONAL Grid Parity. The DOE SunShot Initiative specifically addresses this challenge.

An Oil Alternative: Electric Vehicle Charging with Solar Energy
The National Renewable Energy Laboratory Innovation for Our Energy Future
4 - 5 miles/ kWhChevy, Nissan, Toyota, Tesla, et al; Duetsche Bank,
& Tony Markel (NREL Electric Vehicle Team).

And Why it Makes Economic Sense≈$1.15/ Gallon
ENERGY Price Per Gallon Equivalent for Electric Vehicle Charging with an UNsubsidizedUS residential PV system at 2011 costs (mid-Range Solar Resource- $0.21/ kWh ).
25 mpg gasoline car comparison, 4.5 miles/ kWh.
The National Renewable Energy Laboratory Innovation for Our Energy Future

EV Battery and Related Components: The Additional Cost Considerations
Electric Vehicles Are A Valuable Hedge Against Ever-Increasing Oil PricesFossil Fuel Based Vehicles: Low CapEx, High OpEx
Electric and Hybrid Vehicles: High CapEx, Low OpExThe National Renewable Energy Laboratory Innovation for Our Energy Future
Estimated Battery Costs:2011: ≈ $700/ kWh capacity;
70% Battery Capacity Utilization-- About 12 kWh total capacity needed for 40-mile range-- About $9000 for EV Battery & Additional Components1
-- Typical 2011 Charging Parameters: 120 V, 16 A= 4.7 hours with 2.26 kWDC of PV2
(A typical residential PV System is around 5 kWp DC)-- 240 V, 80 A in the near future: Much shorter charging times
1One can research the costs for an EV car versus a comparable all-gasoline car to check; we are not here to mention or endorse specific brands. EV price depicted here includes federal tax credits.
2 Active Capacity: 9 kWh of charging; 0.85 DC-to-AC derate.
Projected Near- Term Costs: ≈$300/ kWh

And Why it Makes Economic Sense≈$3.50/ Gallon
Energy and Plug-In Battery Price Per Gallon Equivalent for Electric Vehicle Charging with an Unsubsidized residential PV system in CA, but Subsidized EV at 2011 costs.
25 mpg gasoline car comparison.Estimated EV CapEx to End-Consumer: [$9000/ (12,000 miles/ year* 8 years)]*25 mpg ≈ $2.35/ gallon1
The National Renewable Energy Laboratory Innovation for Our Energy Future
≈$1.70/ gallon equivalent (With Near-Term Estimates of PV LCOE and EV Costs)

Conclusion
We CAN (and should) think about the economics of using PV to reduce oil consumption, as well as traditional electricity.
To that end, storage costs need the biggest reductions; the energy price is already quite compelling.
The National Renewable Energy Laboratory Innovation for Our Energy Future
Adoption dynamics must also be improved. Is it enough to simply be at ‘cost parity’?

Another reason why storage is critical
Woche des maximalen PV-Ertrags
0
10
20
30
40
50
60
70
80
1 2 3 4 5 6 7Tag der Woche
Last
und
Str
omei
nspe
isun
g [G
W]
Konv. KW Wind (17 GW)
5 GWp PV 10 GWp PV
15 GWp PV 20 GWp PV
25 GWp PV 30 GWp PV
Day of the week
Load
and
Elec
tric
ityFe
ed-In
[GW
]
Week with Maximum PV Harvesting (Germany)
Energy storage solutions are needed for penetration >10-20%:Denholm, P.; Margolis, R. M., Energy Policy 2007, 35, 2852-2861.
Baseload Power:>80% of total electricity production
Coal, Hydro, Nuclear, Geothermal, or Natural Gas
Natural Gas, PV, CSP, Wind, ‘Spinning Reserves’
Source of Figure: European Photovoltaics Industry Association
The National Renewable Energy Laboratory Innovation for Our Energy Future

Conclusions
“I’d put my money on the sun and solar energy. What a source of power! I hope we don’t have to wait until oil
and coal run out before we tackle that.”
Thomas Edison, 1931
The National Renewable Energy Laboratory Innovation for Our Energy Future
Please ReadM. I. Hoffert et. al., Nature, 1998, 395, 881
Intergovernmental Panel on Climate Change (IPCC) Fourth Assessment Report
DOE, Energy Information Administration Website
Denholm, P.; Margolis, R. M., Energy Policy 2007, 35, 2852-2861.
Duetsche Bank Reports:- Price Dynamics at the End of the Oil Age- Natural Gas and Renewables:
A Secure Low Carbon Energy FutureThe National Renewable Energy Laboratory Innovation for Our Energy Future

Supplemental Slides
The National Renewable Energy Laboratory Innovation for Our Energy Future
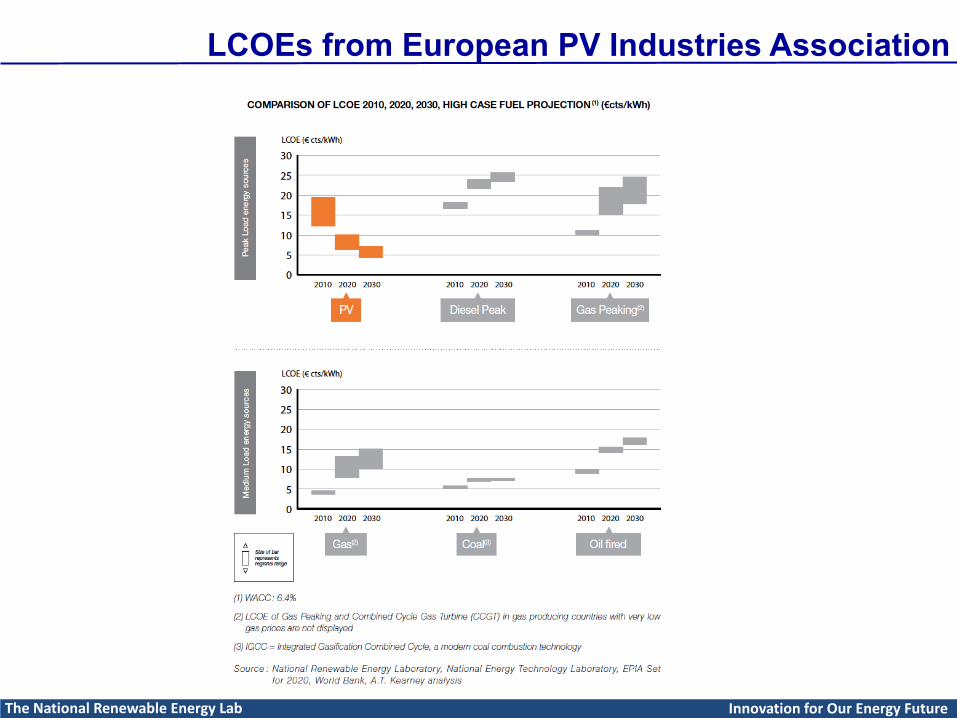
LCOEs from European PV Industries Association
The National Renewable Energy Lab Innovation for Our Energy Future

The National Renewable Energy Laboratory Innovation for Our Energy Future
Residential PV without ITC (Mortgage):Initial Grid Parity: 2013Widespread Grid Parity: 2015
Residential PV without ITC (Cash):Initial Grid Parity: 2014Widespread Grid Parity: 2017
∗ No state, local or utility incentives are included. The range in residential PV LCOE values is due to different geographic locations. For a complete list of LCOE values, see Table A-1.The electricity rate range represents one standard deviation below and above the mean U.S. residential electricity prices.
Figure shows the LCOE for residential PV systems without the ITC, as there is no permanent 10% ITC as is the case for commercial and utility systems. To illustrate the effect of financing, we show both cash purchase (with a 6.0% discount rate) and mortgage financing (with a 7.0% interest rate). Even without any incentives, residential PV is projected to be competitive with high residential electricity rates under above-average insolation conditions by 2014 for cash purchases (2013 for mortgage financing) and under below-average insolation conditions by 2017 for cash purchases (2015 for mortgage financing). As residential PV system costs continue to decline thereafter, so too does the LCOE range. By 2030, residential PV has expected levelized costs in all geographic cases and both financing assumptions that are lower than most residential electricity rates. The path of residential PV to grid parity and beyond is mostly due to PV cost reductions. From 2009 to 2030, the LCOE of PV is projected to decline by over 2.5 times whereas average electricity rates are expected to increase by only about one-fifth.
J E Bartlett, R M Margolis, A Goldstein. “Levelized Costs of Solar Technologies Through 2030”. Technical Report (2011)

The National Renewable Energy Laboratory Innovation for Our Energy Future
∗ Assumes IPP or IOU ownership of PV, and thus the LCOE includes the taxes paid on the profit from electricity generated and sold.Includes 5-year MACRS but not state or local incentives. The range in utility PV LCOE values is due to different geographiclocations and financing conditions. For a complete list of LCOE values, see Table A-3.The electricity rate range represents one standard deviation below and above the mean U.S. wholesale electricity prices.
Figure 3 shows the LCOE of utility PV systems with only the permanent 10% ITC and 5-year MACRS. By 2015, utility PV is forecasted to be competitive with high commercial electricity rates given above-average insolation conditions and good financing terms. Utility PV has proportionally similar differences as commercial PV between the upper and lower ends of the LCOE range, and it is not until 2026 that all utility cases modeled are within the same range as wholesale electricity prices.
The 2009 – 2030 trajectories of PV LCOE and electricity rates are somewhat different for utility residential compared to commercial and residential systems, with a projected LCOE decline of just over 2 1/3 times and average electricity rate increase of almost 30%. Similar to commercial systems, utility PV system costs (and LCOE) decline more sharply than residential systems in the early years but more modestly thereafter. Due to the larger project sizes and less fragmented market compared to residential PV, the utility PV market is expected to mature more rapidly but with less total headroom for cost reductions.
J E Bartlett, R M Margolis, A Goldstein. “Levelized Costs of Solar Technologies Through 2030”. Technical Report (2011)
Utility PV with 10% ITC:Initial Grid Parity: 2015Widespread Grid Parity: 2026

Overarching Realization: Increasing Domestic Demand for PV Installations= More Domestic PV Manufacturing
The National Renewable Energy Laboratory Innovation for Our Energy Future
y = 0.9206x + 55.965R² = 0.9564
0
50
100
150
200
250
300
350
400
450
0 50 100 150 200 250 300 350 400
Annu
al P
V Do
mes
tic S
hipm
ents
(MW
)
Total Annual US PV Installations (MW)
Annual Domestic PV Manufacturing vs Installations
2000
2008
Sources: EIA

The National Renewable Energy Lab Innovation for Our Energy Future
Remaining Crude Oil Reserves(Bn bbls, Conventional Sources1)Rank Remaining Reserves Share of Total Oil Orthodoxy
1 Saudi Arabia 264.1 21.0% OPEC
2 Iran 137.6 10.9% OPEC
3 Iraq 115 9.1% OPEC
4 Kuwait 101.5 8.1% OPEC
5 Venezuela 99.4 7.9% OPEC
6 United Arab Emirates 97.8 7.8% OPEC
7 Russian Federation 79 6.3%
8 Libya 43.7 3.5% OPEC
9 Kazakhstan 39.8 3.2%
10 Nigeria 36.2 2.9% OPEC
Top 10 Total 1014.1 80.0%
14 U. S. Total2(ANWR, Offshore, etc.) 19 - 21 1.8%
Sources: EIA, BP andDuetsche Bank
1Including Oil Sands puts Canada in the top two or three(with caveats surrounding increased CO2 intensity & environmental damage).
224% of Global Oil Consumption
U.S. Oil Consumption (from EIA Website):
• 6.5 - 7 Billion Barrels of Crude Consumed Annually
• Net Dependence on Imports: 60-70%

The Oil Conundrum: 2009
The National Renewable Energy Laboratory Innovation for Our Energy Future
2009 U. S. Crude Oil Trade Balance: Imports – Exports= $188.57 Billion – $1.01 Billion= 49.3% of the 2009 U. S. Trade Deficit
Data Sources: U. S. Bureau of Economic Analysis, U. S. International Trade in Goods and Services Reports & DOE (EIA)