an assessment of worldsid 50th perc entile … · and fmvss 201. a 32 km/h oblique (75º) pole ......
TRANSCRIPT
AN ASSESSMENT OF WORLDSID 50TH PERCENTILE MALE INJURY RESPONSES TO OBLIQUE AND PERPENDICULAR POLE SIDE IMPACTS Thomas Belcher, Mark Terrell Australian Government Department of Infrastructure and Transport
Suzanne Tylko Transport Canada
Paper No. 11-0133 ABSTRACT Pole side impact crash tests are in use in regulatory and consumer programs around the world. There is some diversity in the test methods that are applied, including the suitability of available side impact dummies for use in these tests. For the WorldSID 50th percentile adult male dummy, much theoretical discussion has focussed on the likely rib response, including the direction of this response in oblique and perpendicular pole side impacts. With the advent of multi-dimensional rib deflection measurement systems, such as 2D-IRTRACC and “RibEye”, it is possible to investigate this question. This paper reports on a series of six vehicle-to-pole side impact tests conducted using a WorldSID 50th percentile male dummy on the struck side of the vehicle fitted with the “RibEye” measuring system for the abdomen, thorax and shoulder. In addition, a WorldSID 50th percentile male fitted with the conventional IRTRACC system was installed on the non-struck side. Two large Australian made passenger sedans were tested using three different pole side impact methods. The test methods investigated were a perpendicular impact aimed at the head centre of gravity, a perpendicular impact aimed 100 mm forward of the head centre of gravity, and an FMVSS 214 based oblique impact. All tests were conducted with an impact velocity of 32 km/h. Theoretical IRTRACC deflections are calculated from the “RibEye” data. The objective of this study was to evaluate the effect of pole impact angle and alignment on injury risk as predicted by struck and non-struck side WorldSID 50th percentile adult males. Important contributing factors to this response including the vehicle structural response, recorded airbag fire time, and airbag deployment characteristics are also analysed. Both vehicle models selected were fitted with combination head and thorax side airbags, but with different impact sensing systems. The vehicles also represented different generations of structural and airbag development. X and Y axis deflections are analysed in comparison with the calculated IRTRACC values.
These show a distinct difference between perpendicular and oblique test configurations, and differences resulting from impact location. An additional factor is airbag deployment, as in some cases airbag entrapment resulted in differences in thorax and head response. Occupant-to-occupant interaction is also analysed, with this contact producing HIC36 results normally associated with a high probability of fatal head injury in five of the six tests conducted. INTRODUCTION The development of the WorldSID 50th percentile male (WorldSID 50th male) began in June 1997. A WorldSID Task Group comprised of government and industry representatives was formed under the ISO working group on Anthropomorphic Test Devices (TC22/SC12/WG5). Key objectives of this group included; the realisation of a world harmonized side impact dummy to eliminate the use of different dummies in different parts of the world, and development of a side impact dummy with superior biofidelity and anthropometry, suitable for use in side impacts ± 30º from pure lateral (i.e. perpendicular ± 30º impacts). The first production version of the WorldSID 50th male was released in 2004. The ISO WorldSID Task Group has evaluated the biofidelity of the WorldSID 50th male using the ISO/TR9790 impact test methods and biofidelity rating scale [4]. Overall and individual body region ratings are reported on a scale between 0 (unacceptable) and 10 (excellent). Drop tests, pendulum impact tests and sled tests are used to determine individual biofidelity ratings for the head, neck, shoulder, thorax, abdomen and pelvis. Each individual rating is determined from a weighted comparison of dummy responses with defined (i.e. target) 50th percentile adult male corridor responses. The overall biofidelity rating is then calculated by weighting and summing the individual body region biofidelity ratings. The ISO/TR9790 biofidelity rating for the WorldSID 50th production dummy is 8.0 [9], which is considered “good”, and represents a significant improvement on the 5.7 of BioSID, 4.6 of ES-2, 4.2 of ES-2re and 2.3 of USDOT-SID.
Belcher 1

The United States National Highway Traffic Safety Administration (NHTSA) has also completed an evaluation of the WorldSID 50th male [8] using an updated version of the NHTSA biofidelity ranking system first described in Rhule [7]. Internal and external biofidelity ratings were determined for the WorldSID 50th male and ES-2re dummies. External biofidelity provides a measure of how closely a given dummy simulates PMHS external loadings to the surrounding impact structures (as measured by pendulum and sled load plate force-time history responses). Internal biofidelity provides a measure of how closely the internal injury responses of a dummy simulate post mortem human subject (PMHS) internal injury responses (e.g. rib deflection). This NHTSA biofidelity evaluation also showed the WorldSID 50th male to have superior internal and external biofidelity to ES-2re. In 2009, Petitjean et al [6] published injury risk curves for the WorldSID 50th male shoulder, thorax, abdomen and pelvis. It is important to note that these injury risk curves were derived from numerical correlation of PMHS Abbreviated Injury Scores (AIS) and WorldSID injury responses in matched lateral pendulum and sled impact tests. The WorldSID 50th male thorax and abdomen rib deflection responses, as measured by the conventional IRTRACC system, are therefore expected to have occurred in a lateral direction. This means the abdomen and thorax injury risk curves are likely to be most suitable for application in pole test conditions producing predominantly lateral rib deflections, but the injury risk from loadings producing any substantive deflection of the WorldSID 50th male ribs in the longitudinal and vertical directions is not known. At the 151st session of the United Nations World Forum for Harmonization of Vehicle Regulations (WP.29), the United States of America submitted a proposal to establish a GRSP informal group to finalize the development of the WorldSID 50th percentile male and 5th percentile female dummies [14]. WP.29 agreed to the establishment of this group to be chaired and sponsored by the United States. The group aims to complete the technical tasks necessary for the WorldSID 50th percentile male and 5th percentile female dummies to be used in regulation. These tasks include; finalization of the dummy specifications, calibration procedures, and injury risk curves, as well as compilation and documentation of biofidelity, durability, repeatability and reproducibility. Also at the 151st session of WP.29, Australia submitted a proposal to establish a GRSP informal group to develop a Global Technical Regulation (GTR) on Pole Side Impact [1]. It was agreed to
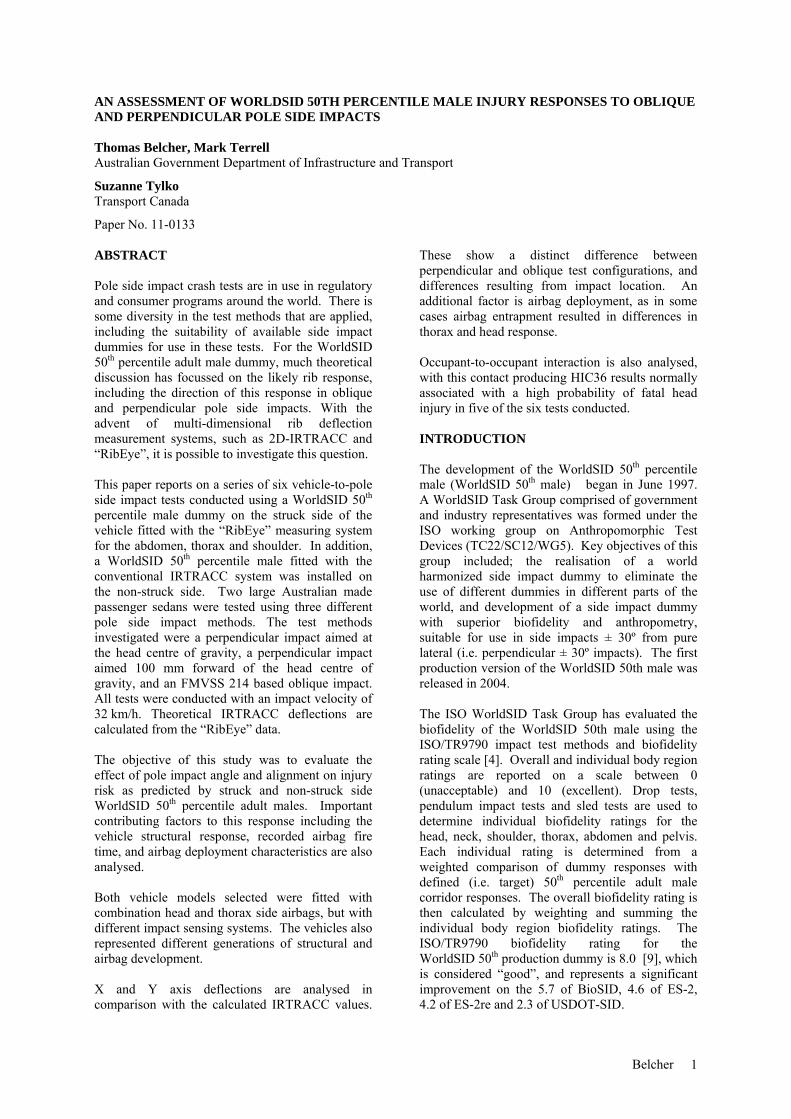
develop this GTR and establish an informal group. Australia is now technical sponsor and chair of this group. The Australian proposal envisaged this GTR would require the use of WorldSID dummies, given the superior biofidelity of these dummies. There are currently two impact angles used in pole side impact tests applied in regulation and/or used by various consumer evaluation programs. A 29 km/h perpendicular pole side impact test is currently used in EuroNCAP, ANCAP, KNCAP and FMVSS 201. A 32 km/h oblique (75º) pole side impact test is currently being phased in, as a mandatory requirement of FMVSS 214 [13]. The WorldSID rib deflection response and the measurement of this response are expected to be an important consideration for both the WorldSID and pole side impact informal groups. There are currently three rib deflection measurement systems available for the WorldSID 50th male. These are the conventional IRTRACC system, the 2D-IRTRACC system, and “RibEye” multipoint sensing. The conventional IRTRACC (Infra Red Telescoping Rod for the Assessment of Chest Compression) system is shown in Figure 1. Each IRTRACC has two pivot points; one at the accelerometer mounting block and one at the central spine box of the dummy. The IRTRACC can compress/expand along the measurement axis and rotate forward/back and up/down. The deflection recorded by the IRTRACC represents the change in length of the IRTRACC (relative to the undeformed / zero output condition), and is equivalent to the change in distance between the two pivot points. However, WorldSID ribs are capable of moving in all three dimensions. The IRTRACC system is therefore not capable of measuring rib motion in all directions which the ribs could move during side impact testing. For this reason, much theoretical discussion has focussed on the likely rib response, including the direction of this response, in oblique and perpendicular pole side impacts. The WorldSID 50th male “RibEye” system uses two sensor sets to measure the three dimensional location of a total of 18 light emitting diodes (LEDs) mounted on the shoulder, thorax and abdomen ribs. Both sensor sets are mounted near the spine box inside the inner ribs. The “RibEye” LEDs used in the “RibEye” multipoint rib deflection measurement system are shown in Figure 2. Each rib is fitted with three LEDs (front/middle/rear). The middle LED (see Figure 2) is fitted to the accelerometer mounting block at the same location as the IRTRACC pivot attachment point (see Figure 1). The front and rear LEDs of
Belcher 2
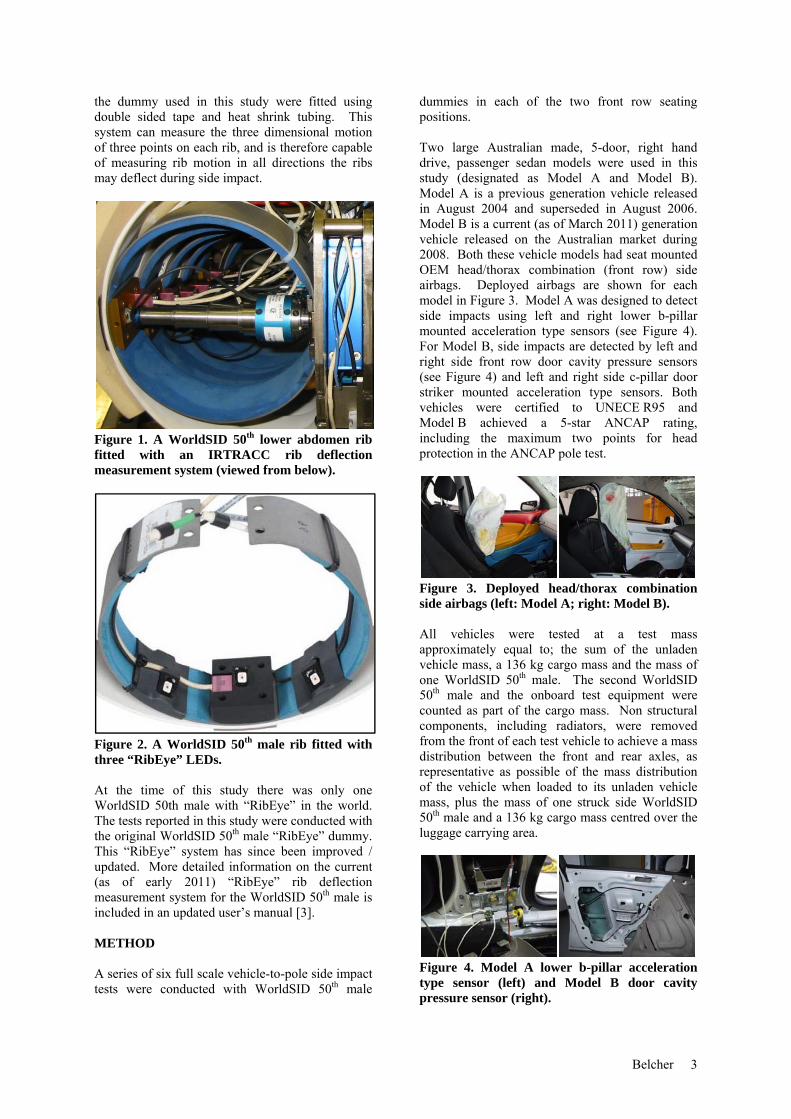
the dummy used in this study were fitted using double sided tape and heat shrink tubing. This system can measure the three dimensional motion of three points on each rib, and is therefore capable of measuring rib motion in all directions the ribs may deflect during side impact.
Figure 1. A WorldSID 50th lower abdomen rib fitted with an IRTRACC rib deflection measurement system (viewed from below).
Figure 2. A WorldSID 50th male rib fitted with three “RibEye” LEDs. At the time of this study there was only one WorldSID 50th male with “RibEye” in the world. The tests reported in this study were conducted with the original WorldSID 50th male “RibEye” dummy. This “RibEye” system has since been improved / updated. More detailed information on the current (as of early 2011) “RibEye” rib deflection measurement system for the WorldSID 50th male is included in an updated user’s manual [3]. METHOD A series of six full scale vehicle-to-pole side impact tests were conducted with WorldSID 50th male
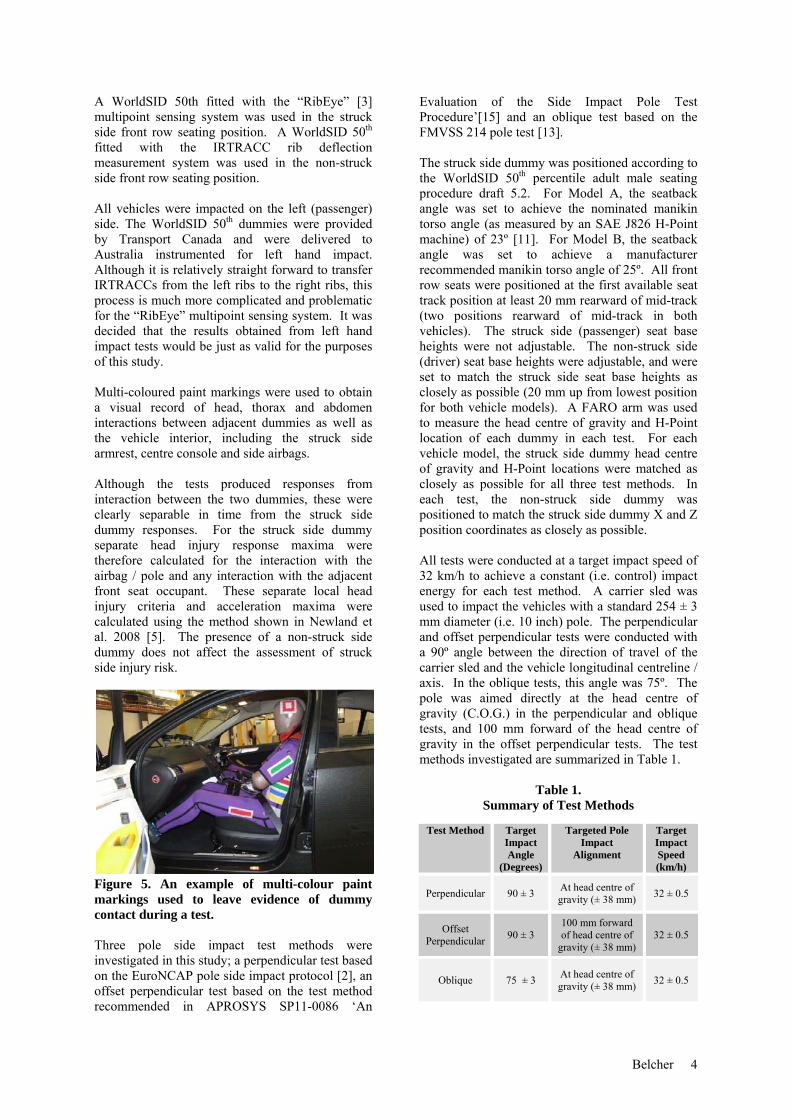
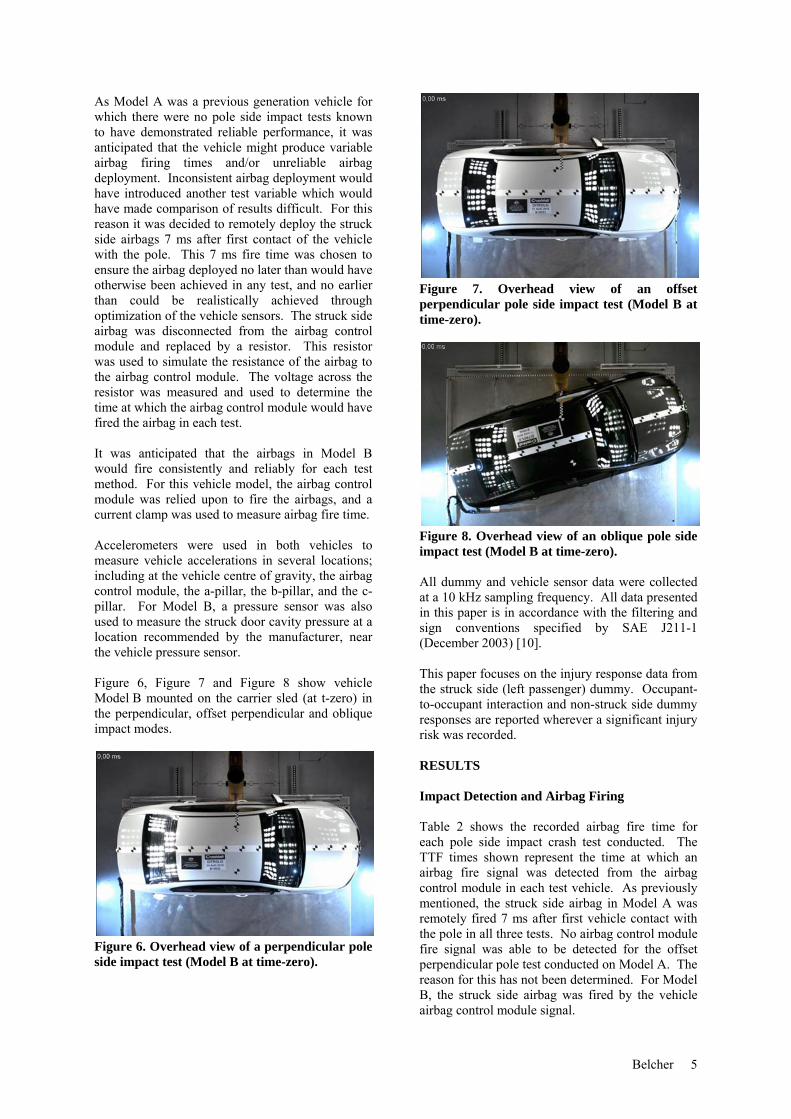
dummies in each of the two front row seating positions. Two large Australian made, 5-door, right hand drive, passenger sedan models were used in this study (designated as Model A and Model B). Model A is a previous generation vehicle released in August 2004 and superseded in August 2006. Model B is a current (as of March 2011) generation vehicle released on the Australian market during 2008. Both these vehicle models had seat mounted OEM head/thorax combination (front row) side airbags. Deployed airbags are shown for each model in Figure 3. Model A was designed to detect side impacts using left and right lower b-pillar mounted acceleration type sensors (see Figure 4). For Model B, side impacts are detected by left and right side front row door cavity pressure sensors (see Figure 4) and left and right side c-pillar door striker mounted acceleration type sensors. Both vehicles were certified to UNECE R95 and Model B achieved a 5-star ANCAP rating, including the maximum two points for head protection in the ANCAP pole test.
Figure 3. Deployed head/thorax combination side airbags (left: Model A; right: Model B). All vehicles were tested at a test mass approximately equal to; the sum of the unladen vehicle mass, a 136 kg cargo mass and the mass of one WorldSID 50th male. The second WorldSID 50th male and the onboard test equipment were counted as part of the cargo mass. Non structural components, including radiators, were removed from the front of each test vehicle to achieve a mass distribution between the front and rear axles, as representative as possible of the mass distribution of the vehicle when loaded to its unladen vehicle mass, plus the mass of one struck side WorldSID 50th male and a 136 kg cargo mass centred over the luggage carrying area.
Figure 4. Model A lower b-pillar acceleration type sensor (left) and Model B door cavity pressure sensor (right).
Belcher 3
A WorldSID 50th fitted with the “RibEye” [3] multipoint sensing system was used in the struck side front row seating position. A WorldSID 50th fitted with the IRTRACC rib deflection measurement system was used in the non-struck side front row seating position. All vehicles were impacted on the left (passenger) side. The WorldSID 50th dummies were provided by Transport Canada and were delivered to Australia instrumented for left hand impact. Although it is relatively straight forward to transfer IRTRACCs from the left ribs to the right ribs, this process is much more complicated and problematic for the “RibEye” multipoint sensing system. It was decided that the results obtained from left hand impact tests would be just as valid for the purposes of this study. Multi-coloured paint markings were used to obtain a visual record of head, thorax and abdomen interactions between adjacent dummies as well as the vehicle interior, including the struck side armrest, centre console and side airbags. Although the tests produced responses from interaction between the two dummies, these were clearly separable in time from the struck side dummy responses. For the struck side dummy separate head injury response maxima were therefore calculated for the interaction with the airbag / pole and any interaction with the adjacent front seat occupant. These separate local head injury criteria and acceleration maxima were calculated using the method shown in Newland et al. 2008 [5]. The presence of a non-struck side dummy does not affect the assessment of struck side injury risk.
Figure 5. An example of multi-colour paint markings used to leave evidence of dummy contact during a test. Three pole side impact test methods were investigated in this study; a perpendicular test based on the EuroNCAP pole side impact protocol [2], an offset perpendicular test based on the test method recommended in APROSYS SP11-0086 ‘An
Evaluation of the Side Impact Pole Test Procedure’[15] and an oblique test based on the FMVSS 214 pole test [13]. The struck side dummy was positioned according to the WorldSID 50th percentile adult male seating procedure draft 5.2. For Model A, the seatback angle was set to achieve the nominated manikin torso angle (as measured by an SAE J826 H-Point machine) of 23º [11]. For Model B, the seatback angle was set to achieve a manufacturer recommended manikin torso angle of 25º. All front row seats were positioned at the first available seat track position at least 20 mm rearward of mid-track (two positions rearward of mid-track in both vehicles). The struck side (passenger) seat base heights were not adjustable. The non-struck side (driver) seat base heights were adjustable, and were set to match the struck side seat base heights as closely as possible (20 mm up from lowest position for both vehicle models). A FARO arm was used to measure the head centre of gravity and H-Point location of each dummy in each test. For each vehicle model, the struck side dummy head centre of gravity and H-Point locations were matched as closely as possible for all three test methods. In each test, the non-struck side dummy was positioned to match the struck side dummy X and Z position coordinates as closely as possible. All tests were conducted at a target impact speed of 32 km/h to achieve a constant (i.e. control) impact energy for each test method. A carrier sled was used to impact the vehicles with a standard 254 ± 3 mm diameter (i.e. 10 inch) pole. The perpendicular and offset perpendicular tests were conducted with a 90º angle between the direction of travel of the carrier sled and the vehicle longitudinal centreline / axis. In the oblique tests, this angle was 75º. The pole was aimed directly at the head centre of gravity (C.O.G.) in the perpendicular and oblique tests, and 100 mm forward of the head centre of gravity in the offset perpendicular tests. The test methods investigated are summarized in Table 1.
Table 1. Summary of Test Methods
Test Method Target Impact Angle
(Degrees)
Targeted Pole Impact
Alignment
Target Impact Speed (km/h)
Perpendicular 90 ± 3 At head centre of gravity (± 38 mm) 32 ± 0.5
Offset Perpendicular 90 ± 3
100 mm forward of head centre of
gravity (± 38 mm) 32 ± 0.5
Oblique 75 ± 3 At head centre of gravity (± 38 mm) 32 ± 0.5
Belcher 4
As Model A was a previous generation vehicle for which there were no pole side impact tests known to have demonstrated reliable performance, it was anticipated that the vehicle might produce variable airbag firing times and/or unreliable airbag deployment. Inconsistent airbag deployment would have introduced another test variable which would have made comparison of results difficult. For this reason it was decided to remotely deploy the struck side airbags 7 ms after first contact of the vehicle with the pole. This 7 ms fire time was chosen to ensure the airbag deployed no later than would have otherwise been achieved in any test, and no earlier than could be realistically achieved through optimization of the vehicle sensors. The struck side airbag was disconnected from the airbag control module and replaced by a resistor. This resistor was used to simulate the resistance of the airbag to the airbag control module. The voltage across the resistor was measured and used to determine the time at which the airbag control module would have fired the airbag in each test. It was anticipated that the airbags in Model B would fire consistently and reliably for each test method. For this vehicle model, the airbag control module was relied upon to fire the airbags, and a current clamp was used to measure airbag fire time. Accelerometers were used in both vehicles to measure vehicle accelerations in several locations; including at the vehicle centre of gravity, the airbag control module, the a-pillar, the b-pillar, and the c-pillar. For Model B, a pressure sensor was also used to measure the struck door cavity pressure at a location recommended by the manufacturer, near the vehicle pressure sensor. Figure 6, Figure 7 and Figure 8 show vehicle Model B mounted on the carrier sled (at t-zero) in the perpendicular, offset perpendicular and oblique impact modes.
Figure 6. Overhead view of a perpendicular pole side impact test (Model B at time-zero).
Figure 7. Overhead view of an offset perpendicular pole side impact test (Model B at time-zero).
Figure 8. Overhead view of an oblique pole side impact test (Model B at time-zero). All dummy and vehicle sensor data were collected at a 10 kHz sampling frequency. All data presented in this paper is in accordance with the filtering and sign conventions specified by SAE J211-1 (December 2003) [10]. This paper focuses on the injury response data from the struck side (left passenger) dummy. Occupant-to-occupant interaction and non-struck side dummy responses are reported wherever a significant injury risk was recorded. RESULTS Impact Detection and Airbag Firing Table 2 shows the recorded airbag fire time for each pole side impact crash test conducted. The TTF times shown represent the time at which an airbag fire signal was detected from the airbag control module in each test vehicle. As previously mentioned, the struck side airbag in Model A was remotely fired 7 ms after first vehicle contact with the pole in all three tests. No airbag control module fire signal was able to be detected for the offset perpendicular pole test conducted on Model A. The reason for this has not been determined. For Model B, the struck side airbag was fired by the vehicle airbag control module signal.
Belcher 5

Table 2. Recorded Airbag Control Module Fire Time
Airbag Control Module (TTF from t-zero) (ms) Test Model A Model B
Perpendicular 8.0 11.9 Offset Perpendicular - 12.3
Oblique 13.5 12.2 Note: Model A airbag fire times cannot be directly compared to Model B airbag fire times. Model A has a flush door handle design and first contact of the vehicle with the pole (t-zero) is made by the door panel. In contrast, first contact of the Model B door handle with the pole (t-zero – see Figure 6, Figure 7 and Figure 8) occurred up to 2.6 ms before first contact of the outer door panel with the pole. For Model A, it is important to note that the airbag control module would have actually fired the airbag 5.5 (13.5 – 8.0) ms later in the oblique test, than the perpendicular test. For Model B, the combination head/thorax side airbag consistently fired around 12 ms after first contact with the pole in each test. Figure 9 shows vehicle Model A y-axis acceleration at the lower b-pillar mounted airbag sensor, for each pole impact method. As indicated in this figure, the airbag control module fired the struck side airbag 2.1 ms and 2.4 ms after the peak y-axis acceleration in the perpendicular and oblique tests, respectively. In the offset perpendicular test, similar peak y-axis acceleration was recorded at approximately 10 ms, yet no fire signal was detected. The accelerometer data from the test vehicle suggests the airbag control module probably should have fired the airbag at around 12.5 ms (i.e. 2 to 2.5 ms after the peak sensor acceleration), as indicated by the dashed red line in Figure 9.
Figure 9. Model A lower b-pillar airbag sensor y-axis acceleration time history (unfiltered). Figure 10 shows the vehicle Model B struck door cavity pressure response for each pole side impact test. The door cavity pressure time histories are quite similar for all three test methods, particularly during the first 10 ms.
Figure 10. Model B front left door cavity pressure time history (unfiltered). Airbag Deployment – Model A Figure 11 shows the Model A head/thorax combination side airbag deploys from beside the lower thorax and abdomen of the WorldSID 50th male. This airbag was observed to be vulnerable to entrapment below the shoulder, between the thorax and the intruding interior door trim. To provide head protection, this airbag must successfully inflate up past the point of the dummy shoulder, before the available gap becomes too small or closes completely.
Figure 11. Model A airbag deployment near lower thorax and abdomen of WorldSID male. The Model A head/thorax combination side airbag deployed fully in the oblique pole test, but was entrapped beneath the dummy shoulder, between the thorax and door trim, in the perpendicular and offset perpendicular pole tests. Figure 12, Figure 13 and Figure 14 show the vehicle Model A airbag deployment 18 ms after first contact with the pole during the perpendicular, offset perpendicular and oblique pole side impact tests. Each figure is a still frame taken from the high speed video footage, to illustrate the most critical interactions between the airbag, dummy and the interior door trim in each test.
AAAIIIRRRBBBAAAGGG
Belcher 6
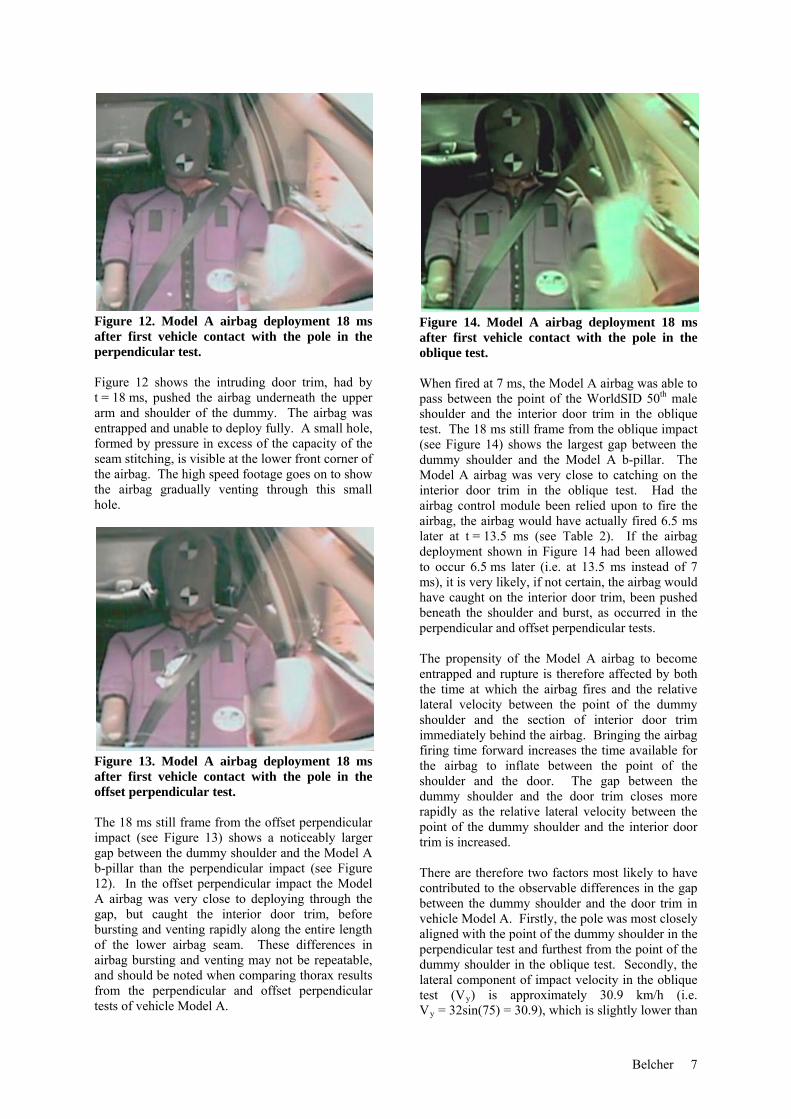
Figure 12. Model A airbag deployment 18 ms after first vehicle contact with the pole in the perpendicular test. Figure 12 shows the intruding door trim, had by t = 18 ms, pushed the airbag underneath the upper arm and shoulder of the dummy. The airbag was entrapped and unable to deploy fully. A small hole, formed by pressure in excess of the capacity of the seam stitching, is visible at the lower front corner of the airbag. The high speed footage goes on to show the airbag gradually venting through this small hole.
Figure 13. Model A airbag deployment 18 ms after first vehicle contact with the pole in the offset perpendicular test. The 18 ms still frame from the offset perpendicular impact (see Figure 13) shows a noticeably larger gap between the dummy shoulder and the Model A b-pillar than the perpendicular impact (see Figure 12). In the offset perpendicular impact the Model A airbag was very close to deploying through the gap, but caught the interior door trim, before bursting and venting rapidly along the entire length of the lower airbag seam. These differences in airbag bursting and venting may not be repeatable, and should be noted when comparing thorax results from the perpendicular and offset perpendicular tests of vehicle Model A.
Figure 14. Model A airbag deployment 18 ms after first vehicle contact with the pole in the oblique test. When fired at 7 ms, the Model A airbag was able to pass between the point of the WorldSID 50th male shoulder and the interior door trim in the oblique test. The 18 ms still frame from the oblique impact (see Figure 14) shows the largest gap between the dummy shoulder and the Model A b-pillar. The Model A airbag was very close to catching on the interior door trim in the oblique test. Had the airbag control module been relied upon to fire the airbag, the airbag would have actually fired 6.5 ms later at t = 13.5 ms (see Table 2). If the airbag deployment shown in Figure 14 had been allowed to occur 6.5 ms later (i.e. at 13.5 ms instead of 7 ms), it is very likely, if not certain, the airbag would have caught on the interior door trim, been pushed beneath the shoulder and burst, as occurred in the perpendicular and offset perpendicular tests. The propensity of the Model A airbag to become entrapped and rupture is therefore affected by both the time at which the airbag fires and the relative lateral velocity between the point of the dummy shoulder and the section of interior door trim immediately behind the airbag. Bringing the airbag firing time forward increases the time available for the airbag to inflate between the point of the shoulder and the door. The gap between the dummy shoulder and the door trim closes more rapidly as the relative lateral velocity between the point of the dummy shoulder and the interior door trim is increased. There are therefore two factors most likely to have contributed to the observable differences in the gap between the dummy shoulder and the door trim in vehicle Model A. Firstly, the pole was most closely aligned with the point of the dummy shoulder in the perpendicular test and furthest from the point of the dummy shoulder in the oblique test. Secondly, the lateral component of impact velocity in the oblique test (Vy) is approximately 30.9 km/h (i.e. Vy = 32sin(75) = 30.9), which is slightly lower than
Belcher 7
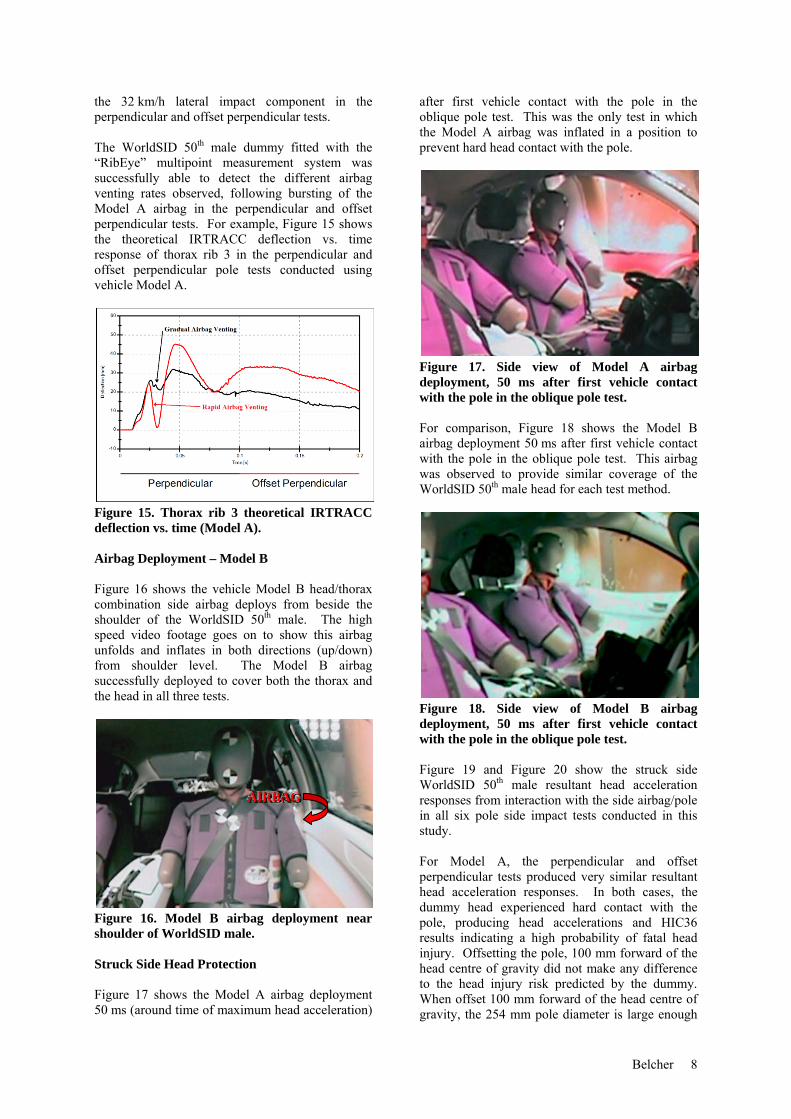
the 32 km/h lateral impact component in the perpendicular and offset perpendicular tests. The WorldSID 50th male dummy fitted with the “RibEye” multipoint measurement system was successfully able to detect the different airbag venting rates observed, following bursting of the Model A airbag in the perpendicular and offset perpendicular tests. For example, Figure 15 shows the theoretical IRTRACC deflection vs. time response of thorax rib 3 in the perpendicular and offset perpendicular pole tests conducted using vehicle Model A.
Figure 15. Thorax rib 3 theoretical IRTRACC deflection vs. time (Model A). Airbag Deployment – Model B Figure 16 shows the vehicle Model B head/thorax combination side airbag deploys from beside the shoulder of the WorldSID 50th male. The high speed video footage goes on to show this airbag unfolds and inflates in both directions (up/down) from shoulder level. The Model B airbag successfully deployed to cover both the thorax and the head in all three tests.
Figure 16. Model B airbag deployment near shoulder of WorldSID male. Struck Side Head Protection Figure 17 shows the Model A airbag deployment 50 ms (around time of maximum head acceleration)
after first vehicle contact with the pole in the oblique pole test. This was the only test in which the Model A airbag was inflated in a position to prevent hard head contact with the pole.
Figure 17. Side view of Model A airbag deployment, 50 ms after first vehicle contact with the pole in the oblique pole test. For comparison, Figure 18 shows the Model B airbag deployment 50 ms after first vehicle contact with the pole in the oblique pole test. This airbag was observed to provide similar coverage of the WorldSID 50th male head for each test method.
Figure 18. Side view of Model B airbag deployment, 50 ms after first vehicle contact with the pole in the oblique pole test. Figure 19 and Figure 20 show the struck side WorldSID 50th male resultant head acceleration responses from interaction with the side airbag/pole in all six pole side impact tests conducted in this study. For Model A, the perpendicular and offset perpendicular tests produced very similar resultant head acceleration responses. In both cases, the dummy head experienced hard contact with the pole, producing head accelerations and HIC36 results indicating a high probability of fatal head injury. Offsetting the pole, 100 mm forward of the head centre of gravity did not make any difference to the head injury risk predicted by the dummy. When offset 100 mm forward of the head centre of gravity, the 254 mm pole diameter is large enough
AAAIIIRRRBBBAAAGGG
Belcher 8

to ensure the dummy head is sufficiently overlapped by the pole (i.e. the 127 mm radius pole overlaps the head c.o.g. by 27 mm). High speed video footage from the offset perpendicular test conducted on vehicle Model A captured the forehead of the dummy impacting the pole. The head then rotated sufficiently, to directly interact with the pole through the head centre of gravity. For vehicle Model A, the oblique test produced a completely different resultant head acceleration response due to the previously discussed differences in the side airbag deployment.
Figure 19. Struck side dummy, resultant head acceleration time history responses from each pole side impact test conducted on Model A. For Model B, the offset perpendicular and oblique tests produced almost identical head acceleration responses. For this vehicle model, the head acceleration response in the perpendicular impact was phased slightly earlier than the offset perpendicular and oblique pole side impacts. The peak accelerations and HIC36 results indicate similar AIS 3+ head injury risk for each of the tests.
Figure 20. Struck side dummy, resultant head acceleration time history responses from each pole side impact test conducted on Model B. Although both, the Model A and Model B head/thorax combination side airbags were relatively narrow (i.e. do not extend very much forward of the head) in width, they were both able to provide adequate (i.e. HIC36 << 1000) struck
side head protection from the pole in the 75º oblique pole side impact. Multi-dimensional Analysis of RibEye Responses The “RibEye” multipoint rib deflection measurement system provides a very large amount of data. Despite this, the results were able to be relatively easily analysed using computational methods. Filtered “RibEye” data was exported to a spreadsheet and a macro developed and used to plot the incremental position changes of the ribs. These plots were then exported as slide show images and then combined in a 1000 frame per second movie using a movie making software package. Each movie was then able to be conveniently synchronised, for analysis purposes, with the high speed video test footage. For example, Figure 21, Figure 22 and Figure 23 show still frame images taken from the “RibEye” movies produced for the middle thorax rib in the oblique, perpendicular and offset perpendicular tests conducted using Model B. Each still plot shows the x-y plane position of the “RibEye” LEDs at maximum theoretical IRTRACC deflection. For left-hand impact, the coordinate system is oriented such that each rib is viewed from below (i.e. is in accordance with the sign conventions of SAE J211-1 [10]). The horizontal x-axis is therefore positive in the forward (to the right of page) direction. The position of the rear (left most), middle and front (right most) “RibEye” LEDs are indicated by the blue round dot markers. The position where the IRTRACC of an IRTRACC equipped dummy would have been located is indicated by the double blue line. Lines of constant theoretical IRTRACC deflection (purple and red lines) were used to gauge the magnitude of the deflection. A black polygon was plotted to represent the approximate location of the “RibEye” middle LED ± 1 mm accuracy measurement range for z-axis deflections less than 10 mm.
Figure 21. Still frame (at maximum theoretical IRTRACC deflection) from the “RibEye” movie used to analyse thorax rib 2 motion for the oblique pole test conducted on Model B.
Belcher 9
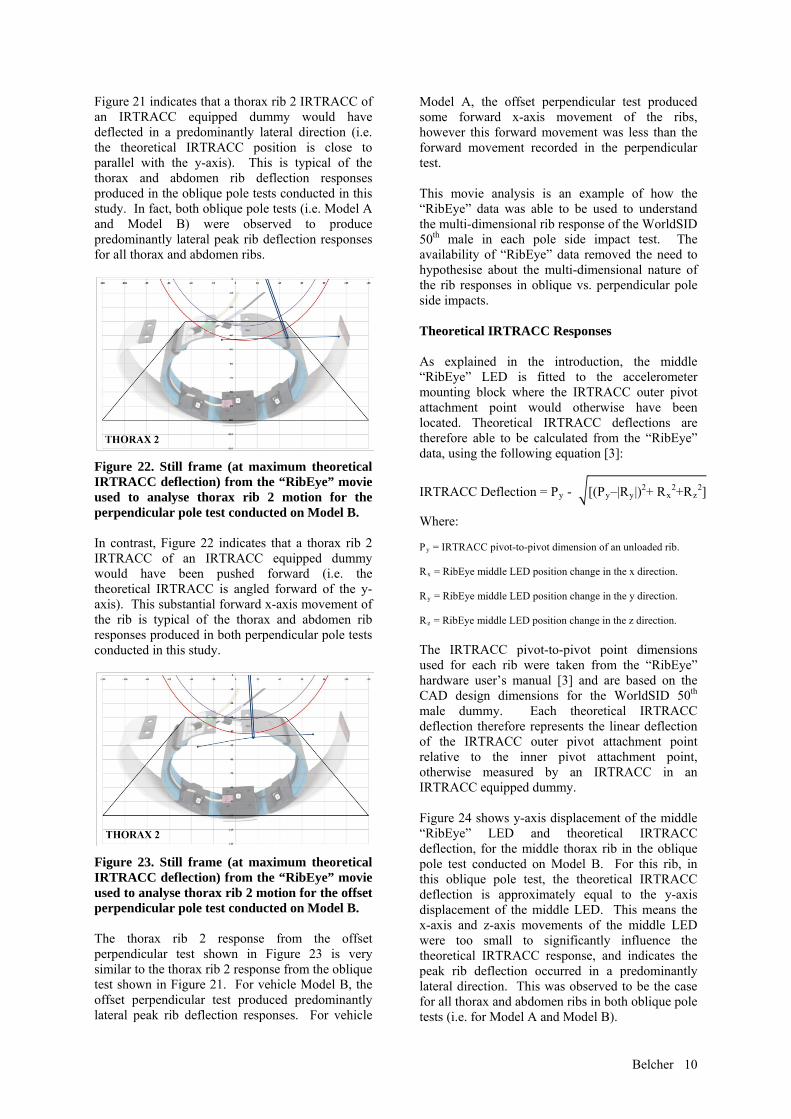
Figure 21 indicates that a thorax rib 2 IRTRACC of an IRTRACC equipped dummy would have deflected in a predominantly lateral direction (i.e. the theoretical IRTRACC position is close to parallel with the y-axis). This is typical of the thorax and abdomen rib deflection responses produced in the oblique pole tests conducted in this study. In fact, both oblique pole tests (i.e. Model A and Model B) were observed to produce predominantly lateral peak rib deflection responses for all thorax and abdomen ribs.
Figure 22. Still frame (at maximum theoretical IRTRACC deflection) from the “RibEye” movie used to analyse thorax rib 2 motion for the perpendicular pole test conducted on Model B. In contrast, Figure 22 indicates that a thorax rib 2 IRTRACC of an IRTRACC equipped dummy would have been pushed forward (i.e. the theoretical IRTRACC is angled forward of the y-axis). This substantial forward x-axis movement of the rib is typical of the thorax and abdomen rib responses produced in both perpendicular pole tests conducted in this study.
Figure 23. Still frame (at maximum theoretical IRTRACC deflection) from the “RibEye” movie used to analyse thorax rib 2 motion for the offset perpendicular pole test conducted on Model B. The thorax rib 2 response from the offset perpendicular test shown in Figure 23 is very similar to the thorax rib 2 response from the oblique test shown in Figure 21. For vehicle Model B, the offset perpendicular test produced predominantly lateral peak rib deflection responses. For vehicle
Model A, the offset perpendicular test produced some forward x-axis movement of the ribs, however this forward movement was less than the forward movement recorded in the perpendicular test. This movie analysis is an example of how the “RibEye” data was able to be used to understand the multi-dimensional rib response of the WorldSID 50th male in each pole side impact test. The availability of “RibEye” data removed the need to hypothesise about the multi-dimensional nature of the rib responses in oblique vs. perpendicular pole side impacts. Theoretical IRTRACC Responses As explained in the introduction, the middle “RibEye” LED is fitted to the accelerometer mounting block where the IRTRACC outer pivot attachment point would otherwise have been located. Theoretical IRTRACC deflections are therefore able to be calculated from the “RibEye” data, using the following equation
IRTRACC Deflection = P
[3]:
y - [(Py–|RRy|) + R2x
2+Rz2]
Where: Py = IRTRACC pivot-to-pivot dimension of an unloaded rib.
Rx = RibEye middle LED position change in the x direction.
Ry = RibEye middle LED position change in the y direction.
Rz = RibEye middle LED position change in the z direction. The IRTRACC pivot-to-pivot point dimensions used for each rib were taken from the “RibEye” hardware user’s manual [3] and are based on the CAD design dimensions for the WorldSID 50th male dummy. Each theoretical IRTRACC deflection therefore represents the linear deflection of the IRTRACC outer pivot attachment point relative to the inner pivot attachment point, otherwise measured by an IRTRACC in an IRTRACC equipped dummy. Figure 24 shows y-axis displacement of the middle “RibEye” LED and theoretical IRTRACC deflection, for the middle thorax rib in the oblique pole test conducted on Model B. For this rib, in this oblique pole test, the theoretical IRTRACC deflection is approximately equal to the y-axis displacement of the middle LED. This means the x-axis and z-axis movements of the middle LED were too small to significantly influence the theoretical IRTRACC response, and indicates the peak rib deflection occurred in a predominantly lateral direction. This was observed to be the case for all thorax and abdomen ribs in both oblique pole tests (i.e. for Model A and Model B).
Belcher 10
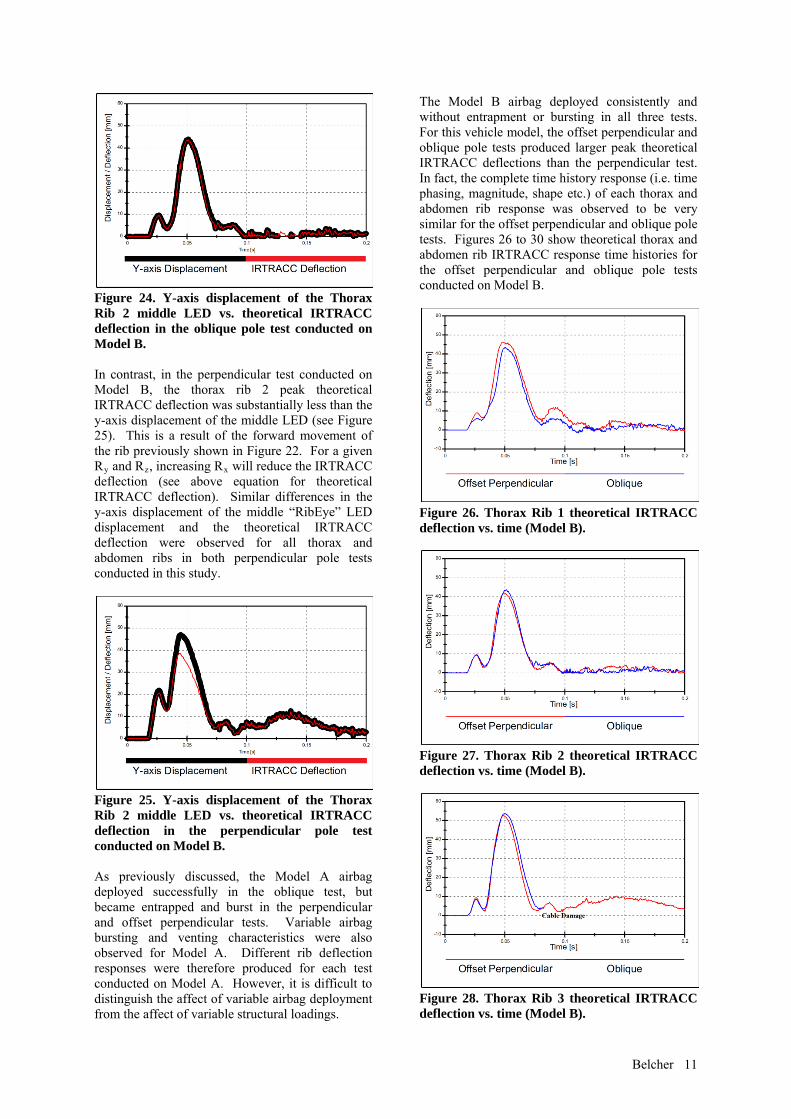
Figure 24. Y-axis displacement of the Thorax Rib 2 middle LED vs. theoretical IRTRACC deflection in the oblique pole test conducted on Model B. In contrast, in the perpendicular test conducted on Model B, the thorax rib 2 peak theoretical IRTRACC deflection was substantially less than the y-axis displacement of the middle LED (see Figure 25). This is a result of the forward movement of the rib previously shown in Figure 22. For a given RRy and Rz, increasing Rx will reduce the IRTRACC deflection (see above equation for theoretical IRTRACC deflection). Similar differences in the y-axis displacement of the middle “RibEye” LED displacement and the theoretical IRTRACC deflection were observed for all thorax and abdomen ribs in both perpendicular pole tests conducted in this study.
Figure 25. Y-axis displacement of the Thorax Rib 2 middle LED vs. theoretical IRTRACC deflection in the perpendicular pole test conducted on Model B. As previously discussed, the Model A airbag deployed successfully in the oblique test, but became entrapped and burst in the perpendicular and offset perpendicular tests. Variable airbag bursting and venting characteristics were also observed for Model A. Different rib deflection responses were therefore produced for each test conducted on Model A. However, it is difficult to distinguish the affect of variable airbag deployment from the affect of variable structural loadings.
The Model B airbag deployed consistently and without entrapment or bursting in all three tests. For this vehicle model, the offset perpendicular and oblique pole tests produced larger peak theoretical IRTRACC deflections than the perpendicular test. In fact, the complete time history response (i.e. time phasing, magnitude, shape etc.) of each thorax and abdomen rib response was observed to be very similar for the offset perpendicular and oblique pole tests. Figures 26 to 30 show theoretical thorax and abdomen rib IRTRACC response time histories for the offset perpendicular and oblique pole tests conducted on Model B.
Figure 26. Thorax Rib 1 theoretical IRTRACC deflection vs. time (Model B).
Figure 27. Thorax Rib 2 theoretical IRTRACC deflection vs. time (Model B).
Figure 28. Thorax Rib 3 theoretical IRTRACC deflection vs. time (Model B).
Belcher 11
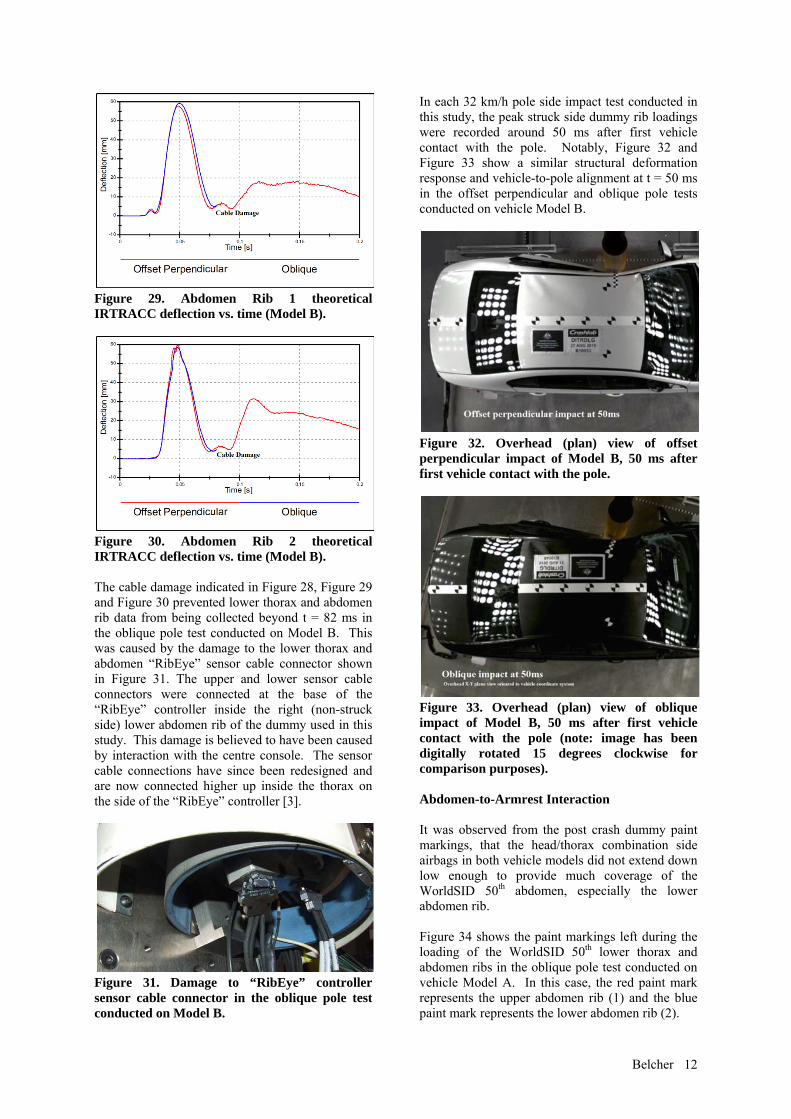
Figure 29. Abdomen Rib 1 theoretical IRTRACC deflection vs. time (Model B).
Figure 30. Abdomen Rib 2 theoretical IRTRACC deflection vs. time (Model B). The cable damage indicated in Figure 28, Figure 29 and Figure 30 prevented lower thorax and abdomen rib data from being collected beyond t = 82 ms in the oblique pole test conducted on Model B. This was caused by the damage to the lower thorax and abdomen “RibEye” sensor cable connector shown in Figure 31. The upper and lower sensor cable connectors were connected at the base of the “RibEye” controller inside the right (non-struck side) lower abdomen rib of the dummy used in this study. This damage is believed to have been caused by interaction with the centre console. The sensor cable connections have since been redesigned and are now connected higher up inside the thorax on the side of the “RibEye” controller [3].
Figure 31. Damage to “RibEye” controller sensor cable connector in the oblique pole test conducted on Model B.
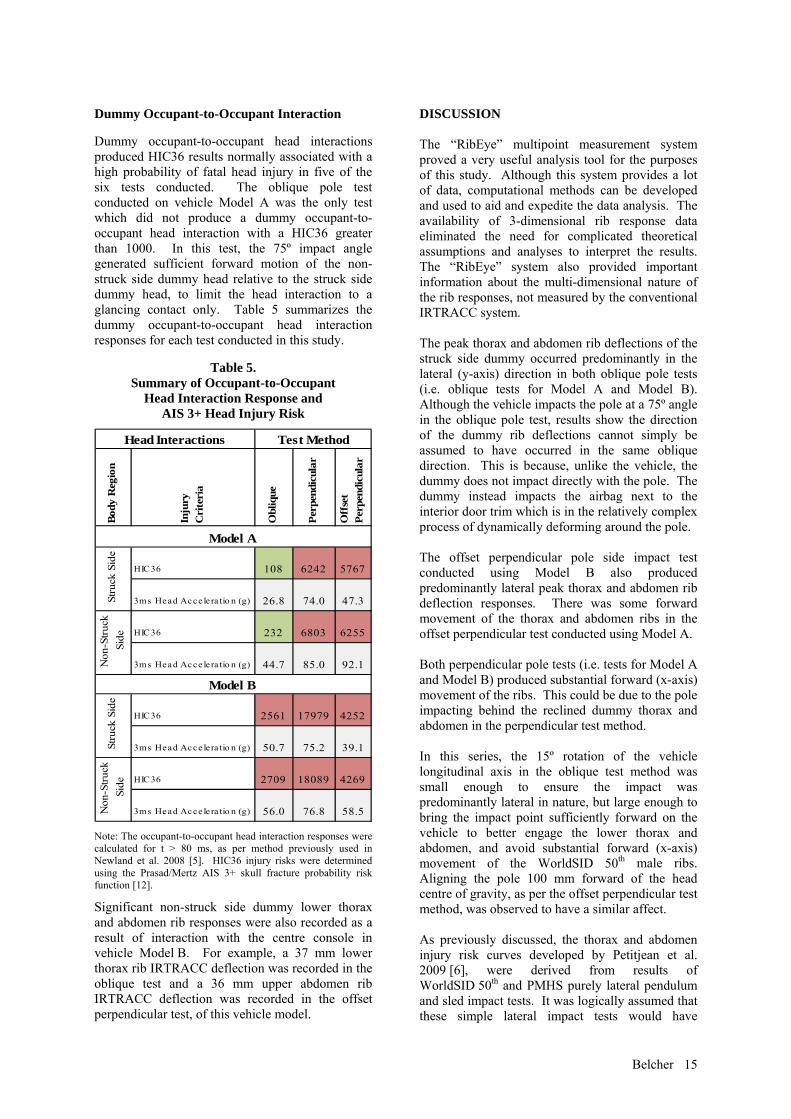
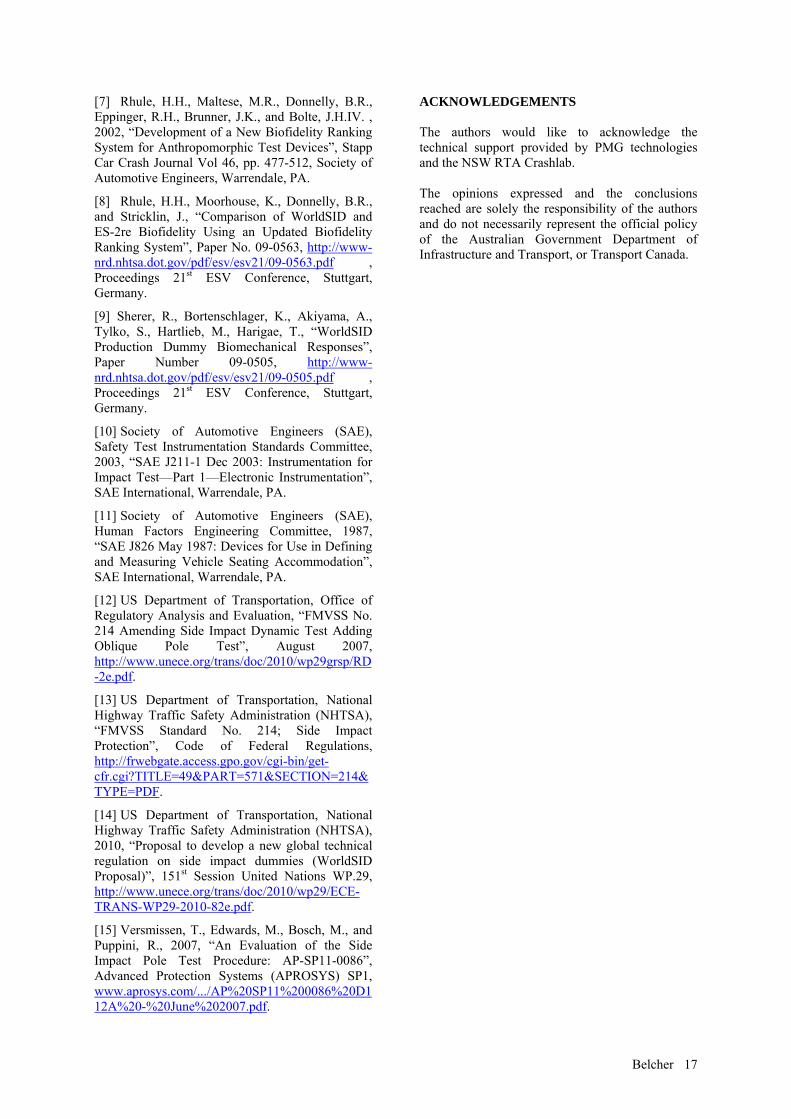
In each 32 km/h pole side impact test conducted in this study, the peak struck side dummy rib loadings were recorded around 50 ms after first vehicle contact with the pole. Notably, Figure 32 and Figure 33 show a similar structural deformation response and vehicle-to-pole alignment at t = 50 ms in the offset perpendicular and oblique pole tests conducted on vehicle Model B.
Figure 32. Overhead (plan) view of offset perpendicular impact of Model B, 50 ms after first vehicle contact with the pole.
Figure 33. Overhead (plan) view of oblique impact of Model B, 50 ms after first vehicle contact with the pole (note: image has been digitally rotated 15 degrees clockwise for comparison purposes). Abdomen-to-Armrest Interaction It was observed from the post crash dummy paint markings, that the head/thorax combination side airbags in both vehicle models did not extend down low enough to provide much coverage of the WorldSID 50th abdomen, especially the lower abdomen rib. Figure 34 shows the paint markings left during the loading of the WorldSID 50th lower thorax and abdomen ribs in the oblique pole test conducted on vehicle Model A. In this case, the red paint mark represents the upper abdomen rib (1) and the blue paint mark represents the lower abdomen rib (2).
Belcher 12

Figure 34. Struck side dummy thorax/abdomen rib to airbag and armrest interaction in the oblique pole test conducted on Model A. Likewise, Figure 35 shows the paint markings left during the loading of the WorldSID 50th lower thorax and abdomen ribs in the oblique pole test conducted on vehicle Model B. In this test, the blue paint mark represents the upper abdomen rib (1) and the yellow paint mark represents the lower abdomen rib (2).
Figure 35. Struck side dummy thorax/abdomen rib to airbag and armrest interaction in the oblique pole test conducted on Model B. The struck side WorldSID 50th male dummy fitted with the “RibEye” measurement system was also successfully able to detect differences in airbag loading from the upper thorax to the lower abdomen. Figure 36 shows the theoretical IRTRACC deflection vs. time response of the upper thorax, lower thorax and lower abdomen ribs during the oblique pole test conducted using vehicle Model A. These rib response time-history traces are consistent with the evidence provided by the paint markings shown in Figure 34. Wherever a rib substantially interacts with the airbag, the rib deflection response is broadly characterized by an initial increase to a local maxima followed by a decrease to a local minima and a further increase to the overall maximum rib deflection (see generalised example inset top right corner of Figure 36). Thorax rib 1 illustrates this response characteristic most clearly. In contrast, there is little evidence of this type of initial rib response for abdomen rib 2. This is because thorax rib 1 interacted with the
airbag, while abdomen rib 2 directly impacted the armrest below the airbag (as shown by the blue paint mark in Figure 34). Similarly, the abdomen rib 2 deflection response for vehicle Model B (see Figure 30) shows no evidence of airbag interaction and the post test paint markings support this (see Figure 35).
Figure 36. Theoretical IRTRACC deflection vs. time responses from the oblique pole test conducted on Model A. Summary of Results / Estimated Injury Risk Table 3 and Table 4 summarize the struck side WorldSID 50th male responses and estimated AIS 3+ injury risk for each pole side impact test conducted on Model A and Model B respectively. In each of these tables, the struck side dummy head injury response and injury risk values are for the dummy head to airbag / pole interaction phase (i.e. t ≤ 80 ms). The legend below defines the colour coding used in this paper to indicate the estimated injury risk, as well as the abbreviated WorldSID rib descriptions used in Table 3 and Table 4. The methods used to estimate each AIS 3+ injury risk are also noted.
P ≤ 25%25% < P < 50%
P ≥ 50%
Rib 4 = Lower Thorax Rib = Thorax Rib 3Rib 5 = Upper Abdomen Rib = Abdomen Rib 1Rib 6 = Lower Abdomen Rib = Abdomen Rib 2
AIS 3+ Injury ProbabilityLegend
Rib 1 = Shoulder RibRib 2 = Upper Thorax Rib = Thorax Rib 1Rib 3 = Middle Thorax Rib = Thorax Rib 2
Notes:
HIC36 injury risks were determined using the Prasad/Mertz AIS 3+ skull fracture probability risk function [12].
Thorax, abdomen and pelvis injury risks were determined from the survival method AIS 3+ injury risk curves published by Petitjean et al., 2009 [6].
Belcher 13

Table 4. Table 3. Summary of Struck Side Dummy Response
and AIS 3+ Injury Risk (Model B) Summary of Struck Side Dummy Response
and AIS 3+ Injury Risk (Model A)
Body
Reg
ion
Inju
ry
Cri
teri
a
Obl
ique
Perp
endi
cula
r
Off
set
Perp
endi
cula
r
HIC36 275 5667 5944
3ms Head Acce le ra tio n (g) 60.2 103.6 84.7
Rib 2 Deflec tio n (mm) 46.3 36.4 > 46
Rib 2 Vis co us Crite rio n (m/s ) 0.74 0.40 -
Rib 3 Deflec tio n (mm) 43.4 35.5 50.9
Rib 3 Vis co us Crite rio n (m/s ) 0.68 0.54 0.95
Rib 4 Deflec tio n (mm) 46.7 32.0 45.3
Rib 4 Vis co us Crite rio n (m/s ) 0.89 0.32 0.62
Rib 5* Deflec tio n (mm) 56.0 28.7 53.4
Rib 5* Vis co us Crite rio n (m/s ) 0.82 0.19 0.82
Rib 6* Deflec tio n (mm) 54.2 23.8 43.9
Rib 6* Vis co us Crite rio n (m/s ) 0.83 0.43 0.65
Rib 5* Deflec tio n (mm) 56.0 28.7 53.4
Rib 5* Vis co us Crite rio n (m/s ) 0.82 0.19 0.82
Rib 6* Deflec tio n (mm) 54.2 23.8 43.9
Rib 6* Vis co us Crite rio n (m/s ) 0.83 0.43 0.65
3ms T12 Accele ra tio n (g) 55.7 45.9 58.3
3ms P e lvis Acce le ra tio n (g) 67.0 44.3 70.1
P ubic Symphys is Fo rce (kN) 1.23 0.74 1.19
Test MethodModel A
Hea
d Th
orax
A
bdom
en
Pelv
is
Body
Reg
ion
Inju
ry
Cri
teri
a
Obl
ique
Perp
endi
cula
r
Off
set
Perp
endi
cula
r
HIC36 343 377 355
3ms Head Acce le ra tio n (g) 65.0 61.5 65.1
Rib 2 Deflec tio n (mm) 43.5 42.6 46.3
Rib 2 Vis co us Crite rio n (m/s ) 0.82 0.42 0.80
Rib 3 Deflec tio n (mm) 43.8 38.7 42.1
Rib 3 Vis co us Crite rio n (m/s ) 0.66 0.60 0.75
Rib 4 Deflec tio n (mm) 53.6 45.9 52.6
Rib 4 Vis co us Crite rio n (m/s ) 0.83 0.89 0.89
Rib 5* Deflec tio n (mm) 59.2 50.6 57.9
Rib 5* Vis co us Crite rio n (m/s ) 0.98 1.02 1.04
Rib 6* Deflec tio n (mm) 58.6 41.6 60.0
Rib 6* Vis co us Crite rio n (m/s ) 1.77 0.71 2.22
Rib 5* Deflec tio n (mm) 59.2 50.6 57.9
Rib 5* Vis co us Crite rio n (m/s ) 0.98 1.02 1.04
Rib 6* Deflec tio n (mm) 58.6 41.6 60.0
Rib 6* Vis co us Crite rio n (m/s ) 1.77 0.71 2.22
3ms T12 Acce le ra tio n (g) 59.6 69.9 61.4
3ms P e lvis Acce le ra tio n (g) 66.4 70.2 74.2
P ubic Symphys is Fo rce (kN) 1.18 1.07 1.33
Model B Test Method
Hea
d Th
orax
A
bdom
en
Pelv
is
The rib deflections shown in Tables 3 and 4 are theoretical IRTRACC values and the viscous criterion values have been calculated from the theoretical IRTRACC responses.
For vehicle Model B, each struck side dummy head-to-airbag interaction response indicates a low probability of AIS 3+ skull fracture. Notably, the peak theoretical IRTRACC deflections were higher in the oblique and offset perpendicular test than the perpendicular test. For vehicle Model A, the struck side dummy head
responses indicate a high probability of fatal head injury in the perpendicular and offset perpendicular pole tests, and a low probability of AIS 3+ skull fracture in the oblique pole test. This is a predictable consequence of the head/thorax combination side airbag failing to deploy fully and therefore failing to prevent hard head contact with the pole in the perpendicular and offset perpendicular tests.
According to the survival method injury risk curve values published by Petitjean et al. [6], the lower thorax and abdomen rib deflection and viscous criterion values recorded in the oblique and offset perpendicular tests indicate greater than 50% probability of AIS 3+ thoracic skeletal injury. The lower abdomen rib viscous criterion values from the oblique and offset perpendicular tests also indicate greater than 50% probability of AIS 3+ abdomen injury; however the lower abdomen rib deflection values suggest less than 25% probability of AIS 3+ abdomen injury. The risk of AIS 3+ pelvis injury was less than 25% in each test.
According to the survival method injury risk curve values published by Petitjean et al. [6], none of the Model A tests produced more than 25% probability of AIS 3+ abdomen or pelvis injury. However, some of the viscous criterion values from the offset perpendicular and oblique tests exceeded the 50% probability of AIS 3+ thoracic skeletal injury threshold.
*Note: Petitjean et al., 2009 [6] expressed AIS 3+ thoracic skeletal injury risk in terms of both thorax and abdomen rib responses. This is based on the fact that humans have 12 thorax ribs (on each side) some of which cover a portion of the WorldSID 50th abdomen. The 50% AIS 3+ dummy response thresholds were lower for thoracic skeletal injury than for abdomen injury. In this table, abdomen rib responses have therefore been included in both the thorax and abdomen body region sections. For each section, the abdominal rib responses have been shaded to indicate either probability of AIS 3+ thoracic skeletal injury or AIS 3+ abdominal soft tissue injury, as applicable.
Belcher 14
Dummy Occupant-to-Occupant Interaction Dummy occupant-to-occupant head interactions produced HIC36 results normally associated with a high probability of fatal head injury in five of the six tests conducted. The oblique pole test conducted on vehicle Model A was the only test which did not produce a dummy occupant-to-occupant head interaction with a HIC36 greater than 1000. In this test, the 75º impact angle generated sufficient forward motion of the non-struck side dummy head relative to the struck side dummy head, to limit the head interaction to a glancing contact only. Table 5 summarizes the dummy occupant-to-occupant head interaction responses for each test conducted in this study.
Table 5. Summary of Occupant-to-Occupant
Head Interaction Response and AIS 3+ Head Injury Risk
Body
Reg
ion
Inju
ry
Cri
teri
a
Obl
ique
Perp
endi
cula
r
Off
set
Perp
endi
cula
r
HIC36 108 6242 5767
3ms Head Acce lera tio n (g) 26.8 74.0 47.3
HIC36 232 6803 6255
3ms Head Acce lera tio n (g) 44.7 85.0 92.1
HIC36 2561 17979 4252
3ms Head Acce lera tio n (g) 50.7 75.2 39.1
HIC36 2709 18089 4269
3ms Head Acce lera tio n (g) 56.0 76.8 58.5
Head Interactions Test Method
Stru
ck S
ide
Model A
Stru
ck S
ide
Model B
Non
-Stru
ck
Side
Non
-Stru
ck
Side
Note: The occupant-to-occupant head interaction responses were calculated for t > 80 ms, as per method previously used in Newland et al. 2008 [5]. HIC36 injury risks were determined using the Prasad/Mertz AIS 3+ skull fracture probability risk function [12].
Significant non-struck side dummy lower thorax and abdomen rib responses were also recorded as a result of interaction with the centre console in vehicle Model B. For example, a 37 mm lower thorax rib IRTRACC deflection was recorded in the oblique test and a 36 mm upper abdomen rib IRTRACC deflection was recorded in the offset perpendicular test, of this vehicle model.
DISCUSSION The “RibEye” multipoint measurement system proved a very useful analysis tool for the purposes of this study. Although this system provides a lot of data, computational methods can be developed and used to aid and expedite the data analysis. The availability of 3-dimensional rib response data eliminated the need for complicated theoretical assumptions and analyses to interpret the results. The “RibEye” system also provided important information about the multi-dimensional nature of the rib responses, not measured by the conventional IRTRACC system. The peak thorax and abdomen rib deflections of the struck side dummy occurred predominantly in the lateral (y-axis) direction in both oblique pole tests (i.e. oblique tests for Model A and Model B). Although the vehicle impacts the pole at a 75º angle in the oblique pole test, results show the direction of the dummy rib deflections cannot simply be assumed to have occurred in the same oblique direction. This is because, unlike the vehicle, the dummy does not impact directly with the pole. The dummy instead impacts the airbag next to the interior door trim which is in the relatively complex process of dynamically deforming around the pole. The offset perpendicular pole side impact test conducted using Model B also produced predominantly lateral peak thorax and abdomen rib deflection responses. There was some forward movement of the thorax and abdomen ribs in the offset perpendicular test conducted using Model A. Both perpendicular pole tests (i.e. tests for Model A and Model B) produced substantial forward (x-axis) movement of the ribs. This could be due to the pole impacting behind the reclined dummy thorax and abdomen in the perpendicular test method. In this series, the 15º rotation of the vehicle longitudinal axis in the oblique test method was small enough to ensure the impact was predominantly lateral in nature, but large enough to bring the impact point sufficiently forward on the vehicle to better engage the lower thorax and abdomen, and avoid substantial forward (x-axis) movement of the WorldSID 50th male ribs. Aligning the pole 100 mm forward of the head centre of gravity, as per the offset perpendicular test method, was observed to have a similar affect. As previously discussed, the thorax and abdomen injury risk curves developed by Petitjean et al. 2009 [6], were derived from results of WorldSID 50th and PMHS purely lateral pendulum and sled impact tests. It was logically assumed that these simple lateral impact tests would have
Belcher 15

produced predominantly lateral rib deflections, directly measured by the conventional IRTRACC system. This assumption seems entirely reasonable, logical and well founded given the simple lateral nature of the tests, but could be validated through analysis of some matched lateral pendulum and sled impact tests with a “RibEye” equipped dummy. The currently available injury risk curves for the WorldSID 50th male were therefore concluded by Petitjean et al. to be applicable to lateral rib loadings only. Notably, in both perpendicular pole tests in this series, the y-axis displacement of the middle LED of each rib was somewhat larger than the corresponding theoretical IRTRACC deflection. This was a result of forward (x-axis) movement of each rib. The IRTRACC point-to-point deflection measurement, and hence the injury risks attributed to these IRTRACC deflections in Table 3 and Table 4 may therefore understate the actual injury risk produced in the perpendicular tests conducted in this study. Given the predominantly lateral rib responses recorded by the “RibEye” system in both oblique pole tests conducted in this study, it is possible the current WorldSID 50th male injury risk curves might actually be more suitable for application in 75º oblique pole tests than perpendicular pole tests aimed at the head centre of gravity. CONCLUSIONS The struck side dummy head injury responses
were significantly affected by the airbag deployment in the tests conducted on vehicle Model A.
The angle of impact and the alignment of the vehicle relative to the pole affected the timing of the Model A airbag control module fire signal.
The “RibEye” multipoint measurement system provided important, useful and informative multi-dimensional rib response data.
The WorldSID 50th “RibEye” responses reveal that oblique pole tests should not simply be assumed to produce oblique rib loadings and perpendicular pole tests should not simply be assumed to produce lateral rib loadings: - predominantly lateral peak rib deflection
responses were recorded for each thorax and abdomen rib in both oblique pole tests; and
- significant forward (x-axis) movement was recorded for each thorax and abdomen rib in both perpendicular pole tests.
The WorldSID 50th male rib deflection responses were influenced by the initial impact alignment of the pole relative to the vehicle and dummy: - the offset perpendicular test method
produced less forward (x-axis) movement of the WorldSID 50th male ribs than the perpendicular test method; and
- the offset perpendicular and oblique tests produced almost identical thorax and abdomen rib responses for vehicle Model B.
For each vehicle model, the peak theoretical thorax and abdomen rib IRTRACC deflections were higher for the oblique and offset perpendicular tests than the perpendicular test.
REFERENCES
[1] Australian Department of Infrastructure and Transport, 2010, “Proposal to Develop a New Global Technical Regulation on Pole Side Impact”, 151st Session United Nations WP.29 (June 22-25 2010),http://www.unece.org/trans/doc/2010/wp29/ECE-TRANS-WP29-2010-81e.pdf.
[2] European New Car Assessment Programme (EuroNCAP), 2009, “EuroNCAP Pole Side Impact Testing Protocol Version 5.0”, EuroNCAP, http://www.euroncap.com/files/Euro-NCAP-Pole-Protocol-Version-5.0---0-67e37cf7-8e74-4fe5-a72a-db24061a8e91.pdf.
[3] Handman, D., 2011, “HARDWARE USER’S MANUAL: RibEye™ Multi-Point Deflection Measurement System 3-Axis Version for the WorldSID 50th ATD”, Boxboro Systems, http://www.boxborosystems.com/worldsidhwmanual22011_1.pdf.
[4] International Standards Organization (ISO), 1999, “ISO/TR 9790:1999(E) — Road vehicles — Anthropomorphic side impact dummy — Lateral impact response requirements to assess the biofidelity of the dummy”, ISO, Geneva, Switzerland.
[5] Newland, C., Belcher, T., Bostrom, O., Gabler, H.C., Cha, J.G., Wong, H.L., Tylko, S., Dal Nevo, R., “Occupant-to-Occupant Interaction and Impact Injury Risk in Side Impact Crashes”, Stapp Car Crash Journal Vol. 52 (November 2008), pp. 327-347, Society of Automotive Engineers, Warrendale, PA.
[6] Petitjean, A., Trosseille, X., Petit, P., Irwin, A., Hassan, J., and Praxl, N., 2009, “Injury Risk Curves for the WorldSID 50th Male Dummy”, Stapp Car Crash Journal Vol. 53 (November 2009), pp. 443-476, Society of Automotive Engineers, Warrendale, PA.
Belcher 16
Belcher 17
[7] Rhule, H.H., Maltese, M.R., Donnelly, B.R., Eppinger, R.H., Brunner, J.K., and Bolte, J.H.IV. , 2002, “Development of a New Biofidelity Ranking System for Anthropomorphic Test Devices”, Stapp Car Crash Journal Vol 46, pp. 477-512, Society of Automotive Engineers, Warrendale, PA.
[8] Rhule, H.H., Moorhouse, K., Donnelly, B.R., and Stricklin, J., “Comparison of WorldSID and ES-2re Biofidelity Using an Updated Biofidelity Ranking System”, Paper No. 09-0563, http://www-nrd.nhtsa.dot.gov/pdf/esv/esv21/09-0563.pdf , Proceedings 21st ESV Conference, Stuttgart, Germany.
[9] Sherer, R., Bortenschlager, K., Akiyama, A., Tylko, S., Hartlieb, M., Harigae, T., “WorldSID Production Dummy Biomechanical Responses”, Paper Number 09-0505, http://www-nrd.nhtsa.dot.gov/pdf/esv/esv21/09-0505.pdf , Proceedings 21st ESV Conference, Stuttgart, Germany.
[10] Society of Automotive Engineers (SAE), Safety Test Instrumentation Standards Committee, 2003, “SAE J211-1 Dec 2003: Instrumentation for Impact Test—Part 1—Electronic Instrumentation”, SAE International, Warrendale, PA.
[11] Society of Automotive Engineers (SAE), Human Factors Engineering Committee, 1987, “SAE J826 May 1987: Devices for Use in Defining and Measuring Vehicle Seating Accommodation”, SAE International, Warrendale, PA.
[12] US Department of Transportation, Office of Regulatory Analysis and Evaluation, “FMVSS No. 214 Amending Side Impact Dynamic Test Adding Oblique Pole Test”, August 2007, http://www.unece.org/trans/doc/2010/wp29grsp/RD-2e.pdf.
[13] US Department of Transportation, National Highway Traffic Safety Administration (NHTSA), “FMVSS Standard No. 214; Side Impact Protection”, Code of Federal Regulations, http://frwebgate.access.gpo.gov/cgi-bin/get-cfr.cgi?TITLE=49&PART=571&SECTION=214&TYPE=PDF.
[14] US Department of Transportation, National Highway Traffic Safety Administration (NHTSA), 2010, “Proposal to develop a new global technical regulation on side impact dummies (WorldSID Proposal)”, 151st Session United Nations WP.29, http://www.unece.org/trans/doc/2010/wp29/ECE-TRANS-WP29-2010-82e.pdf.
[15] Versmissen, T., Edwards, M., Bosch, M., and Puppini, R., 2007, “An Evaluation of the Side Impact Pole Test Procedure: AP-SP11-0086”, Advanced Protection Systems (APROSYS) SP1, www.aprosys.com/.../AP%20SP11%200086%20D112A%20-%20June%202007.pdf.
ACKNOWLEDGEMENTS The authors would like to acknowledge the technical support provided by PMG technologies and the NSW RTA Crashlab. The opinions expressed and the conclusions reached are solely the responsibility of the authors and do not necessarily represent the official policy of the Australian Government Department of Infrastructure and Transport, or Transport Canada.