an assessment of the relationship between the faculty ... · pdf filean assessment of the...
TRANSCRIPT

Research in Higher Education Journal
An assessment of the relationship, Page 1
An assessment of the relationship between the faculty performance
in teaching, scholarly endeavor, and service at Qatar University
Lina Omar Hassna
Qatar Foundation
Syed Raza
Qatar University Abstract:
Qatar University is the national and major institution of higher education in Qatar. It has
undergone several reforms targeting excellence in teaching and research to become one of the
leading schools in the Middle East region and beyond. Among the recent reforms, the colleges in
the university have developed faculty appraisal systems. Although there are differences among
the colleges in regards to faculty appraisal, however, all colleges at the university have three
major components in their faculty appraisal system: (i) Teaching, (ii) Scholarly endeavor; and
(iii) Service to the university. In order to improve the scholarship at the Qatar University, it is
very important that all of these three components should have harmony so that the university can
achieve its desired excellence. This study explores the relationship between the three
components of the university appraisal system. Two major colleges, Arts and Science, and
Business and Economics are chosen for this study. A conceptual model is developed to study the
relationship among these three components of faculty appraisal system which uses Structural
Equation modeling approach. The conceptual model is tested using a random sample collected
from the Academic Evaluation Office at Qatar University. The results indicate the presence of a
significant positive relation between the faculty Teaching and Service performances. In addition,
there is no support to establish significant relationship between the Scholarly endeavor with
either of teaching or service performance.
Key Words: Qatar University, Faculty Appraisal System, Teaching Performance, Scholarly
Endeavor, Services.
Acknowledgement: The authors would like to thank Dr. Mohd Al-Naemi, Director of Office of
Assessment and Evaluation at Qatar University for his assistance.
Research in Higher Education Journal
An assessment of the relationship, Page 2
1. Introduction
The Institutions of higher education around the world have undergone reforms targeting
the advancement of faculty members by encouraging them to engage in other activities beside
teaching. These activities include conducting research in addition to providing different
university and community services. The major responsibilities of academics nowadays in the
universities around the globe became teaching, research, and providing services to the
university and community. Mostly universities have a sound faculty appraisal systems which
consist of these three main performance measure for a faculty member. An issue that can be
raised here is that whether these three components of a professor’s yearly evaluation are
interdependent, diametrically opposed or synergistic in nature. Great attention and efforts are
given to investigate the relation between teaching and research , numerous studies and editorials
have been written concerning specifically the relation between research productivity and
teaching effectiveness from a number of different perspectives .However , there is virtually no
research that addresses the nature of the relation between the faculty service provided and
research or teaching.
In this research, the author presents the faculty appraisal system at Qatar University
(QU). QU was founded in1977, and it is the country’s national and major institution of higher
education, with the widest variety of program both at undergraduate and graduate levels in Qatar.
At present, QU (www.qu.edu.qa) is comprised of seven colleges: College of Education; College
of Arts & Sciences; College of Sharia & Islamic Studies, College of Engineering; College of
Law; College of Pharmacy; and College of Business & Economics. It assumes great importance
not only on high quality teaching, but also on research that contributes to the advancement of the
university and to Qatari society. The College of Arts and Sciences (CAS) is the largest college at
Qatar University, It was established in the academic year 2004/2005 by merging two
colleges: College of Humanities & Social Sciences, and College of Science. The College offers
many quality programs at the undergraduate level majoring in Social Sciences, History,
Geography, Humanities, International Affairs, Social Work, Mass Communications, Nutrition,
Earth Sciences, Mathematics and Statistics, Chemistry, Biology, Physics and Environmental
Sciences. The College of Business & Economics (CBE) was established in 1985. CBE offers
undergraduate business degrees in the fields of Accounting, Finance, Economics, Management
Information Systems, Management, and Marketing. It also offers the country’s only MBA
program at graduate level as well as an executive CPA program. CBE has been fully accredited
by AACSB international at both the undergraduate and graduate levels since 2010.
With the recent evidence of significant growth of QU compared to peer institutions of
higher learning, the university has a faculty appraisal system. Following a global standard, QU
faculty appraisal system has three domains: i) Teaching Performance; ii) Scholarly Endeavor;
and iii) Services of the university. This research is inspired by giving an overview on how the
faculty appraisal system is adapted at QU, and how does the three components of the faculty
appraisal system are related. Given the fact that there is no previous study focusing Qatar in this
field, this study is expected to fulfill the gaps in the field of studies in faculty performance
evaluation at the Qatar’s only national university.
The rest of this paper is organized as follows: in section2, a brief literature review is
presented which mainly comprise previously conducted studies on university faculty appraisal
policies and systems, relationships between different components of the faculty appraisal system,
and the research productivity and teaching effectiveness. In section 3, the main objectives of this
Research in Higher Education Journal
An assessment of the relationship, Page 3
research are mentioned and research importance is highlighted. Section 4 briefly discusses the
present QU faculty appraisal system. Section 5, presents the descriptive study and an exploratory
analysis of the data collected for office of evaluation
(http://www.qu.edu.qa/offices/vpcao/faculty_resource.php) at QU. The section also compares
the colleges performances in the domains of three components of faculty evaluation. A
conceptual models are presented to study the relationships between the three components of
faculty appraisal system of QU in section 6, and this study uses Structural Equation Modeling
(SEM) approach. The outcomes of the analysis are discussed in section 7. Finally the conclusions
are drawn in section 8.
2. Literature Review
In this section, a brief literature review is presented to discuss the researches that have
been carried out in the different areas of university faculty appraisal system. In addition,
research in the area of how the different components of the faculty appraisal system are related to
each other.
2.1. Faculty Appraisal system
A comprehensive faculty performance review is necessary for any academic institution
looking forward to maintain a high standard of excellence, effectiveness and accountability
(Aubrecht, 1984). The goals of such a review are to assess individual job performance and to
promote faculty development and productivity (Centra, 1977). At most universities, the
evaluation of the college faculty is done on the basis of teaching, research and service
(Aleomoni, 1984) as the Faculty members usually divide their professional time among these
three domains for example developing manuscripts for publication , conceptualizing a program
of research ,formulating new courses ,documenting teaching effectiveness and serving on various
college committees (Adams,1989) .The application of specific criteria under these broad
headings, and their weighting, may vary among academic units and among faculty members.
In evaluating the teaching performance, the key is to collect data from different resources
(Kreber, 2002) such as Student Rating, as they are in a better position than anyone else to judge
certain aspects of teaching, Peer Rating and Course Portfolio (Ory, 1991). On the other hand the
criterion for evaluating the research activities of the faculty members most of the time includes
Number and Types of Publications, Publisher and Grants (Elton, 1992). For services, according
to Braskamp, and Ory. (1994), faculty members spend about 20% - 30% of their time serving on
committees and college support activities and their evaluation in this domain includes
Administrative and Committee service in the Department, College and University, Public service
to the community, Advising and Mentoring students, giving professional workshops/trainings
and attending conferences. Johnston et al. (1995) reported the details of assessment strategies in
teaching and learning in literature based classrooms. Darling-Hammond and Snyder (2000)
extended the research in assessment of teaching performance. Lucal et al. (2003) researched the
faculty assessment and scholarship of teaching and learning. They identified their perspective in
regards to knowledge available and knowledge needed for assessment. A view of faculty voices
on assessment in presented in the work of Pat and Elaine (1988). Recently, Pettitt (2008)
discussed the issue of assessment in general education programs. Pigge and Marso (1997)’s
paper discussed, a seven year longitudinal multi-factor assessment of teaching concerns

Research in Higher Education Journal
An assessment of the relationship, Page 4
development through preparation and early years of teaching. Tang and Chow (2007) focused
research on the issue of communication of feedback in teaching practice supervision in a
learning-oriented field experience assessment framework. Verhey (1999)’s work addressed the
development, implementation, and evaluation on information literacy in an undergraduate
nursing curriculum. Among recent works, Weschke and Canipe (2010) discussed the faculty
evaluation process in an online university. Youngs and Bird (2010) described the usage of
embedded assessments to promote pedagogical reasoning among secondary teaching school
candidates.
2.2. Relation between the components of the Appraisal System
Looking to the previous studies that investigate the relation between the three previously
mentioned domains of the faculty’s appraisal system found that most of them have incorporated
just the two variables of research and teaching, without giving any concern to the service domain
.Even those who gave attention to the service domain have suggested to be included under the
evaluation of teaching effectiveness as it will make it more comprehensive (Brodzinski and
Scherer, 1990).
Nowadays most of the universities are engaged in research and trying to create a research
culture. Kfir et al(1999) in considering the role of research activities in academic college of
education in Israel ,concluded that although not all faculty members can or should engage in
research ,the college as a whole should be exposed to research and participate in the academic
research culture .It can be assumed that involvement in research is an intrinsic motivator, and the
institution benefits from a more effectively functioning person ,as well as more effective job
performance(Eva and Marianne ,2001). However a number of authors view faculty research and
teaching roles as being in conflict (Clark, 1987; Kerr, 1963; Veysey, 1965). Altbach and Lewise
(1995) conducted the Carnegie Foundation 's international survey of the academic profession
including 20,000 professors from 14 countries, they found that many professors feel that they
are under pressure to do more research than they would like to.
In-depth, qualitative studies designed to probe the academic staff perceptions on the
relationship between the research productivity and quality of teaching have most often indicated
a strong belief in the existence of, and need for, a symbiotic relationship (Robertson & Bond
2001) . According to Feldman (1987), there are several major possible rationales behind
connecting the degree of research productivity and the enhancement of teaching; these include
linkages between research and the development of skills and knowledge that should improve
teaching. On the other hand, many attempts have been made to account for the actual relation
between teaching and research (Allen, 1996; Fox, 1992; Hattie and Marsh, 1996; Neumann,
1996; Wachtel, 1998; Webster, 1985) and have been achieved by conducting empirical studies
on the relationship between research productivity and teaching effectiveness. The findings are
often seemingly contradictory; it continues to report either a weak positive relationship or no
relationship ( Kremer, 1990, 1991; Neumann, 1996; Ramsdenand Moses, 1992; Tanner et al.,
1992).
The research that indicates a lack of relationship tends to derive from quantitative studies
and more recently, from meta-analyses. For example, Tanner et al. (1992) found a weak
relationship between the two factors. Their research did not establish significant relationships
between excellence in teaching and research performance. Moreover in the meta-analysis of 43
studies that conducted by Feldman (1987) concluded that research productivity is only slightly
Research in Higher Education Journal
An assessment of the relationship, Page 5
associated with teaching proficiency, that means the likelihood that research productivity
actually benefits teaching is extremely small. Similarly, in Hattie and Marsh (1996) meta-
analysis of 58 studies, they demonstrated a zero relationship and concluded by saying “… the
common belief that research and teaching are in extricable entwined is an enduring myth. At best
research and teaching are very loosely coupled” .Depending on this study as well as other, Brew
in 1999 said “The belief that research activity benefits teaching and the student learning
experience, has remained strong in the myths of academia, while being difficult to support with
empirical evidence”. However, Robertson & Bond (2001) argued that the usual measures of
teaching effectiveness (student evaluations and self-ratings) and research activity (numbers of
publications, grants, publications) are misleading and they indicate a need to re-conceptualize the
way in which research and teaching and their potential relation are explored as objects of study.
Ramsden (1998) suggested that the interrelationships will less likely be discovered because the
research and teaching are treated as relatively discrete entities and the faculty are rewarded and
appraised in these two domains separately.
3. Qatar University and its faculty appraisal system:
QU has well established faculty assessments schemes. The evaluation of faculty is carried
out in the three main areas: (i) teaching; (ii) research; and (iii) services to university. For QU to
advance and achieve its mission, it is expected from the faculty to accomplish excellence in all
performance domains. In the following, the constituents considered under each of these
domains are described.
(i) Teaching Performance: The faculty’s total score in Teaching Performance in addition to
his/her score in Student Rating and Course Portfolio. QU has online course evaluation system for
all the courses it offers both at undergraduate and graduate levels. The course portfolio contains
the course syllabus, learning outcomes, all exams, sample students’ answers in the exams,
sample course project reports, etc.
(ii) Scholarly Endeavor: The faculty’s total score in Scholarly Endeavor, in addition to the
total number of instructor's publications and nature of participation. As mentioned earlier, other
data related to the Scholarly Endeavor score e.g. Grant, Publisher –etc are not provided since
they are confidential. Once the data has received from the Academic Evaluation office at Qatar
University, two modifications were done. The first one is to recalculate the Services and
Teaching Performance total scores. Because in the academic year 2008/2009 the Academic
Advising was under Teaching Performance while currently (as shown in Figure 1) it is under
Services, depending on the new rules. This makes the data up to date .The second modification is
related to the nature of participation. In the given data, the nature of participation in a published
scholarly work is distinguished by either first author, or participant (other than first) author. For
each publication, if the faculty participates as a first author he/she is awarded two points
otherwise one point is given. Accordingly, the total number of points is recorded as a new field
to be used in the analysis.
(iii) Services: The faculty’s total score in service in addition to his/her score in academic
advising and other services .The other services category includes participating in committees
inside & outside university, presenting a seminar, lecture, workshop or training session and
other services to the society. So all of these are collected and grouped under one category
named, other services. The other services receive one score.

Research in Higher Education Journal
An assessment of the relationship, Page 6
The Performance Evaluation at Qatar University is done annually as a joint effort that
involves several participants, faculty member, department head, college dean, and the office of
evaluation. It provides an assessment of each faculty member’s overall performance according to
the faculty appraisal system. The evaluation domains which are teaching performance, scholarly
endeavor, and services are required to guidelines about their weights which are described in
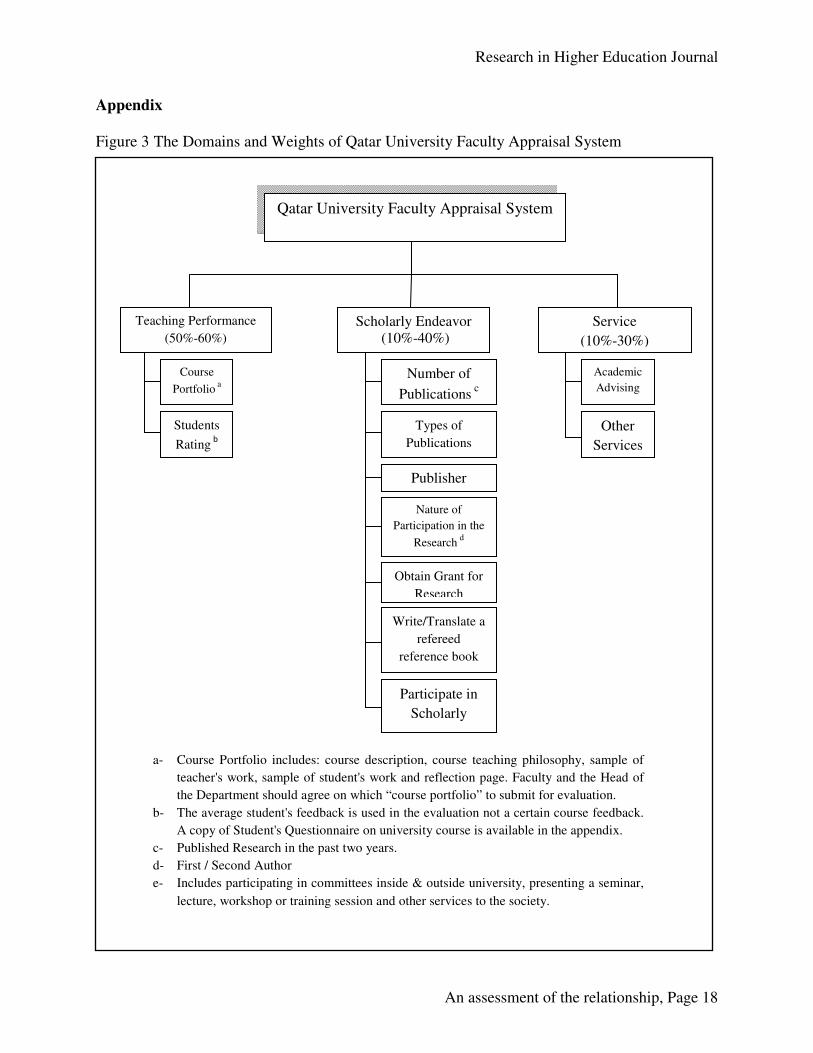
Figure 3. It can be noticed from the figure that the assigned weight for each domain is a
possible range of percentage of the total. The teaching performance weight is 50-60%, the
scholarly endeavor’s weight is 30-40%, and the service contributes 10-30%. The deans, and
department Heads in collaboration with their faculty member, regularly agreed on the different
weights for teaching performance, scholarly endeavor, and the service at the beginning of each
academic year. However, the total contribution from the three components should be 100%. The
Faculty Performance Rating Scale of Qatar University is a Five-point performance rating scale
used to objectively evaluate faculty performance. The point is a score that determines the
qualitative performance of a faculty member which is listed in Table 1.
Quantitative/qualitative
Grade
Specific performance/in
different domains
General performance
Exceptional 5 4.7 - 5.0
More than expected 4 4.6 - 3.8
Expected 3 3.7 - 2.8
Less than expected 2 2.7 - 1.8
Unsatisfactory 1 1.7 - 1.0
Table 1: Faculty performance grade domains
The overall effectiveness rating of the Faculty Member will be the result of multiplying
the percentage (weight) with the grade in each of the three previously mentioned domains.
4. The Data collection
A request was sent to the QU office of academic evaluation to provide a sample from
the archival records of the most recent available instructor's evaluation data. The offered sample
was composed of 40 university's instructor evaluation data of the academic year 2008/2009
without any names or information that can indicate the identity of the instructor to ensure the
confidentiality. The sample was drawn randomly of equal size from the two colleges, CAS and
CBE at QU. Due to the fact that these colleges represent the largest QU faculty body as well as
having adopted the standard QU faculty appraisal systems, only these two colleges are
considered. Some aspects of the data is constrained by the confidentiality, among these are the
demographical information e.g. gender, rank, year of experience, etc. In addition, some part of
the data that is related to the faculty’s scholarly endeavor evaluation score, e.g. grant information
is not provided due to the fact that this information deem to reveal the identification of a faculty
Research in Higher Education Journal
An assessment of the relationship, Page 7
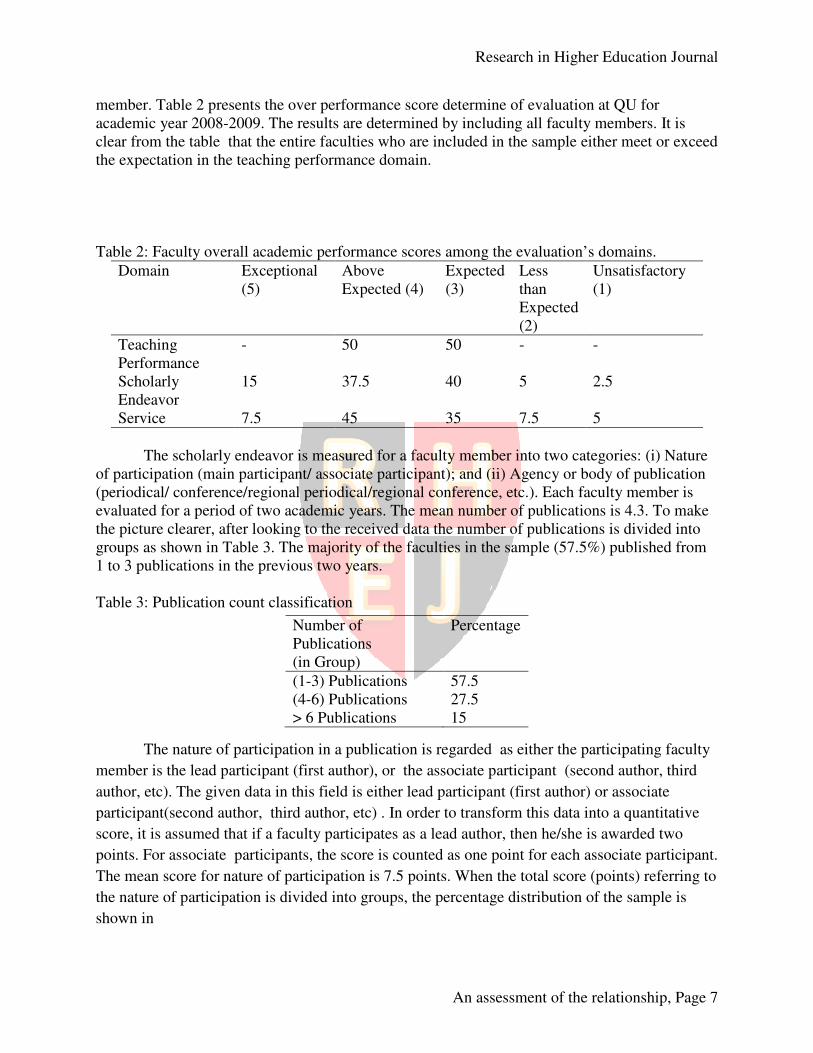
member. Table 2 presents the over performance score determine of evaluation at QU for
academic year 2008-2009. The results are determined by including all faculty members. It is
clear from the table that the entire faculties who are included in the sample either meet or exceed
the expectation in the teaching performance domain.
Table 2: Faculty overall academic performance scores among the evaluation’s domains.
Unsatisfactory
(1)
Less
than
Expected
(2)
Expected
(3)
Above
Expected (4)
Exceptional
(5)
Domain
- - 50 50 - Teaching
Performance
2.5 5 40 37.5 15 Scholarly
Endeavor
5 7.5 35 45 7.5 Service
The scholarly endeavor is measured for a faculty member into two categories: (i) Nature
of participation (main participant/ associate participant); and (ii) Agency or body of publication
(periodical/ conference/regional periodical/regional conference, etc.). Each faculty member is
evaluated for a period of two academic years. The mean number of publications is 4.3. To make
the picture clearer, after looking to the received data the number of publications is divided into
groups as shown in Table 3. The majority of the faculties in the sample (57.5%) published from
1 to 3 publications in the previous two years.
Table 3: Publication count classification
The nature of participation in a publication is regarded as either the participating faculty
member is the lead participant (first author), or the associate participant (second author, third
author, etc). The given data in this field is either lead participant (first author) or associate
participant(second author, third author, etc) . In order to transform this data into a quantitative
score, it is assumed that if a faculty participates as a lead author, then he/she is awarded two
points. For associate participants, the score is counted as one point for each associate participant.
The mean score for nature of participation is 7.5 points. When the total score (points) referring to
the nature of participation is divided into groups, the percentage distribution of the sample is
shown in
Number of
Publications
(in Group)
Percentage
(1-3) Publications 57.5
(4-6) Publications 27.5
> 6 Publications 15

Research in Higher Education Journal
An assessment of the relationship, Page 8
Table 4.
Table 4: Nature of participation classification
5. Comparing Colleges at QU:
In this section, we present an statistical study that enables us comparing the two colleges
at QU, CAS, and CBE. The faculty performances in teaching, scholarly endeavor, and services
are compared between the two college. The independent sample t-test is conducted to check if
there is a statistical significant difference between the CAS and CBE in terms of teaching
performance, scholarly endeavor, and service.
In Table 9, two independent sample t-test (see Kunter et al., 2004) result is presented which
compares the mean teaching performance of faculty members of CAS with CBE. It can be
noticed that the two colleges are comparable in teaching performances of their faculty (i.e.,
Sig=0.539 > 0.05, from Table 5). There is not statistical evidence at 5% significance level that
the two colleges are different in their faculties’ teaching performances.
Table 5: t-test examining the difference between colleges in teaching performance.
Nature of Publications
(in Group)
Percentage
(1-3) Points 35
(4-6) Points 25
(7-9) Points 17.5
>9 points 22.5
Levene's
Test for
Equality of
Variances t-test for Equality of Means
F Sig. T Df
Sig.
(2-
tailed)
Mean
Difference
Std. Error
Difference
95% Confidence
Interval of the
Difference
Lower Upper
Teaching
performance
Equal
variances
assumed
0.000 1.00 -0.6 38 0.539 -0.10000 0.16141 -
0.42675 0.2267

Research in Higher Education Journal
An assessment of the relationship, Page 9
In
Table 6, t-test output is presented which compares the mean Scholarly Endeavor of CAS with
CBE. It can be noticed that the two are comparable in Scholarly Endeavor of their faculty at 5%
statistical significance level (i.e., Sig=0.38 > 0.05 from
Table 6)
Table 6: t-test examining the difference between colleges in Scholarly Endeavor
In Table 7, again t-test output is presented which compares the mean service performance
of faculty members at CAS with CBE. It can be noticed that the two colleges are comparable at
5% statistical significance level (i.e., Sig=0.86 > 0.05 from Table 7)
Equal
variances
not
assumed
-0.6 38 0.539 -0.10000 0.16141 -
0.42675 0.2267
Levene's Test
for Equality of
Variances t-test for Equality of Means
F Sig. t Df
Sig.
(2-
tailed)
Mean
Difference
Std. Error
Difference
95% Confidence
Interval of the
Difference
Lower Upper
Scholarly
Endeavor
Equal
variances
assumed
4.334 0.044 0.873 38
0.38
0.25000 0.28631
-
0.3296
0.82961
Equal
variances
not
assumed
0.873 34.92 0.38 0.25000 0.28631 -
0.3312 0.83129
Levene's Test
for Equality
of Variances t-test for Equality of Means
F Sig. T Df
Sig.
(2-
tailed)
Mean
Difference
Std. Error
Difference
95% Confidence
Interval of the
Difference
Lower Upper
Service Equal
variances
assumed
1.595 0.214 -
0.168 38 0.868 -0.05000 0.29802 -0.6533 0.55331
Equal
variances
not
-
0.168 33.83 0.868 -0.05000 0.29802 -0.6557 0.55576

Research in Higher Education Journal
An assessment of the relationship, Page 10
Table 7: t-test examining the difference between colleges in service
All of these three distinct comparisons between CAS and CBE do not support that there
is any difference between the faculty performance in the three domains: teaching, research, and
services. Next, this research the relationship between the three components of the faculty
appraisal system is studied.
6. Conceptual models to analyze faculty appraisal system:
In this section, the authors propose conceptual models to study the relationships between
the three different components of faculty appraisal system at QU. The Structural Equation
Modeling (SEM) technique is used for the development the models. SEM is a statistical
methodology that takes a confirmatory (i.e., Hypothesis testing) approach to the analysis of a
structural theory bearing on some phenomenon (Byrne, 2001). Typically, this theory represents
“causal” processes that generate observations on multiple variables (Bentler, 1988; Bollen,
1989). The term SEM conveys two important aspects of the procedure: i) that the causal
processes under study are represented by a series of structural (i.e., regression) equations, and ii)
that these structural relationships can be modeled pictorially to enable a clearer conceptualization
of the theory under study. The hypothesized model can then be tested statistically in a
simultaneous analysis of the entire system variables to determine the extent to which it is
consistent with the data for inferential purposes. If the goodness-of-fit is adequate, the model
argues for the plausibility of postulated relations among variables; if it is inadequate, the
tenability of such relations is rejected. There are several aspects of SEM which set it apart from
the older generation of multivariate procedures. Firstly, it takes a confirmatory rather than an
exploratory approach (Kutner et al.2004). Moreover, by demanding that the pattern of inter-
variable relations be specified a priori, SEM lends itself well to analysis of data for inferential
purposes. By contrast, most other multivariate procedures are essentially descriptive by nature
(e.g., exploratory factor analysis), so that hypothesis testing is difficult, if not impossible.
Secondly, whereas traditional multivariate procedures are incapable of either assessing or
correcting for measurement error, SEM provides explicit estimates of these error variance
parameters. Indeed, alternative methods such as linear regression (Kutner et al. 2004) assume
that error(s) is the exploratory (i.e., independent) variables vanish(es). Thus, applying those
methods when there is error in the exploratory variables is tantamount to ignoring error, which
may lead, ultimately, to serious inaccuracies, especially when errors are sizeable. Such mistakes
are not encountered normally when SEM analyses are used. Thirdly, although data analyses
using the former methods are based on observed measurements only, those using SEM
procedures can incorporate both unobserved (latent) and observed variables. Lastly, there are no
widely and easily applied alternative methods for modeling multivariate relations, or for
estimating point and/or interval indirect effects, these important features are available using SEM
methodology. Given, these highly desirable characteristics, SEM has become a popular
methodology for non-experimental research, where methods for testing theories are not well
developed an ethical considerations make experimental design unfeasible (Bentler, 1988). Thus,
assumed
SEM can be utilized very effectively to address numerous research problems involving non
experimental research. The software package AMOS, developed by SPSS Inc is very
comprehensive and easy to use for the development and analysis of SEM (Arbuckle, 2007),
however, it is essential that some of the key concepts related to the SEM methodology are
explained briefly.
In behavioral sciences, researchers are often interested in studying theoretical constructs
that cannot be observed directly. These abstract phenomena are terme
factors. Because the latent variables are not observed directly, it follows that they are not
measurable directly. Thus, a researcher must operationally define the latent variable in terms of
behavioral believe used to represent it.
observable, and thus making its measurement possible. Assessment of the behavior, then,
constitutes the direct measurement of an observed variable, albeit the indirect measurement of an
unobserved variable. These measured scores (i.e., measurements) are termed observed or
manifest variables; within the context of SEM methodology, they serve as indicators of the
underlying construct which they are presumed to represent. Given this necessary bridging
process between observed variables and unobserved latent variables, it is important to indentify
that SEM model still requires researchers to be circumspect in their selection of assessment
measures.
SEMs are schematically portrayed using particular config
symbols-a circle (or ellipse), a square (or rectangle), a single
arrow. By convention, circles (or ellipses) represent unobserved latent factors. Squares (or
rectangles) represent observed variabl
variable on another, and the double
between pairs of variables. As mentioned previously, the motive of this
relationship between the three components of QU faculty’s appraisal system, which are the
Teaching Performance, Scholarly Endeavor and Service. In this regard, the conducted research
presents two conceptual models,
between these three variables .While the se
2 specifies the relationship between the factors that are related to these variables . Those factors
are listed in Table13. Since the data are taken from QU Academic Evaluation Office, so all t
variables that are used in the conceptual models can be considered as observed variables.
variables are regressed as un-standardized estimates and 5% level of statistical significanc
observed to establish any inferences.
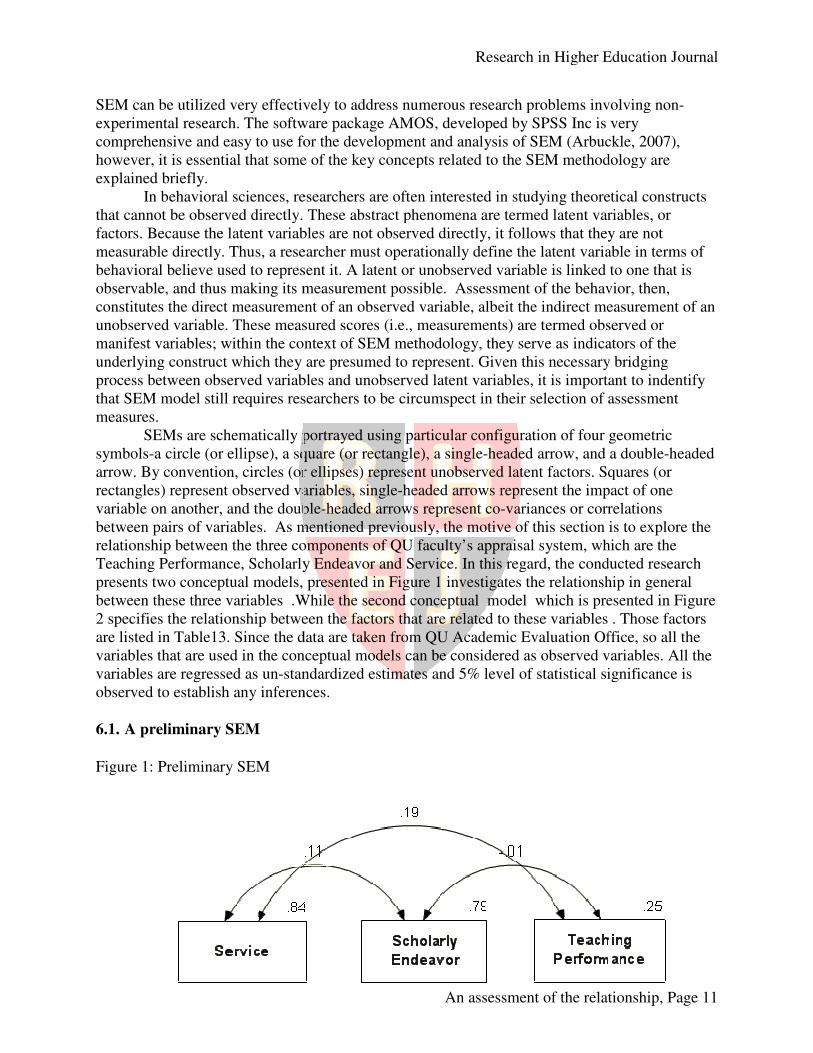
6.1. A preliminary SEM
Figure 1: Preliminary SEM
Research in Higher Education Journal
An assessment of the relationship, Page
lized very effectively to address numerous research problems involving non
experimental research. The software package AMOS, developed by SPSS Inc is very
comprehensive and easy to use for the development and analysis of SEM (Arbuckle, 2007),
s essential that some of the key concepts related to the SEM methodology are
In behavioral sciences, researchers are often interested in studying theoretical constructs
that cannot be observed directly. These abstract phenomena are termed latent variables, or
factors. Because the latent variables are not observed directly, it follows that they are not
measurable directly. Thus, a researcher must operationally define the latent variable in terms of
behavioral believe used to represent it. A latent or unobserved variable is linked to one that is
observable, and thus making its measurement possible. Assessment of the behavior, then,
constitutes the direct measurement of an observed variable, albeit the indirect measurement of an
ariable. These measured scores (i.e., measurements) are termed observed or
manifest variables; within the context of SEM methodology, they serve as indicators of the
underlying construct which they are presumed to represent. Given this necessary bridging
rocess between observed variables and unobserved latent variables, it is important to indentify
that SEM model still requires researchers to be circumspect in their selection of assessment
SEMs are schematically portrayed using particular configuration of four geometric
a circle (or ellipse), a square (or rectangle), a single-headed arrow, and a double
arrow. By convention, circles (or ellipses) represent unobserved latent factors. Squares (or
rectangles) represent observed variables, single-headed arrows represent the impact of one
variable on another, and the double-headed arrows represent co-variances or correlations
As mentioned previously, the motive of this section
tween the three components of QU faculty’s appraisal system, which are the
Scholarly Endeavor and Service. In this regard, the conducted research
presents two conceptual models, presented in Figure 1 investigates the relationship in general
between these three variables .While the second conceptual model which is presented in
specifies the relationship between the factors that are related to these variables . Those factors
are listed in Table13. Since the data are taken from QU Academic Evaluation Office, so all t
variables that are used in the conceptual models can be considered as observed variables.
standardized estimates and 5% level of statistical significanc
any inferences.
Research in Higher Education Journal
An assessment of the relationship, Page 11
lized very effectively to address numerous research problems involving non-
experimental research. The software package AMOS, developed by SPSS Inc is very
comprehensive and easy to use for the development and analysis of SEM (Arbuckle, 2007),
s essential that some of the key concepts related to the SEM methodology are
In behavioral sciences, researchers are often interested in studying theoretical constructs
d latent variables, or
factors. Because the latent variables are not observed directly, it follows that they are not
measurable directly. Thus, a researcher must operationally define the latent variable in terms of
A latent or unobserved variable is linked to one that is
observable, and thus making its measurement possible. Assessment of the behavior, then,
constitutes the direct measurement of an observed variable, albeit the indirect measurement of an
ariable. These measured scores (i.e., measurements) are termed observed or
manifest variables; within the context of SEM methodology, they serve as indicators of the
underlying construct which they are presumed to represent. Given this necessary bridging
rocess between observed variables and unobserved latent variables, it is important to indentify
that SEM model still requires researchers to be circumspect in their selection of assessment
uration of four geometric
headed arrow, and a double-headed
arrow. By convention, circles (or ellipses) represent unobserved latent factors. Squares (or
headed arrows represent the impact of one
or correlations
is to explore the
tween the three components of QU faculty’s appraisal system, which are the
Scholarly Endeavor and Service. In this regard, the conducted research
investigates the relationship in general
cond conceptual model which is presented in Figure
specifies the relationship between the factors that are related to these variables . Those factors
are listed in Table13. Since the data are taken from QU Academic Evaluation Office, so all the
variables that are used in the conceptual models can be considered as observed variables. All the
standardized estimates and 5% level of statistical significance is

Research in Higher Education Journal
An assessment of the relationship, Page 12
The Preliminary model is very simple; it gives brief general information about the nature
of the relationship between QU Faculty’s Appraisal System components which include the score
in teaching performance, scholarly endeavor, and service. In Figure 1 the proposed relationships
between the considered observed variables are conceptualized. The model fit is tested using the
Goodness of Fit Index (GFI). GFI takes value between 0 and 1 where 1 indicates a perfect fit,
the GFI for this model is 0.89. The AMOS output of the analysis is reported in Table 8.
Table 8: Output of proposed preliminary SEM
Table 8 lists the un-standardized regression weights between the three observd variables
teaching performance, scholarly endeavor, and service. The teaching performance and service
are positively related at 5% statistical significance. This is due to the fact that the measured
regression coefficient (covariance) between teaching performance and service is 0.187 with
p=0.018. Whereas there is no statistically significant relationship noticed between the scholarly
endeavor,and teaching performance (p=0.861 > 0.05) at 5% level. Similarly, no statistically
significant relationship is found bewtween scholarly endeavor and service (p=0.424 > 0.05).
6.2. An extended SEM
An extended conceptual model investigates more specifically the relationship between
teaching performance, scholarly endeavor, and service at QU faculty’s appraisal system by
identifying the nature of the relationship between the factors that are used to calculate the total
score of these three variables .Table 9 provides a brief description of the variables that are used
in the extended conceptual model.
Table 9: Description of the observed variables in an extended SEM
Estimate S.E. C.R. P
Scholarly
Endeavor <--> Service .106 .132 .799 .424
Scholarly
Endeavor <-->
Teaching
Performance -.013 .071 -.175 .861
Service <--> Teaching
Performance .187 .079 2.360 .018*
Variable name Description
Service
S1 Other Services
S2 Academic Counseling
Scholarly endeavor
R1 Number of Publications
R2 Nature of Participation
Teaching
T1 Course Portfolio
T2 Students Rating

In Figure 2, the proposed relationships between the observed variables of the extended SEM
model are conceptualized and the output of the analysis is reported in
Figure 2: An extended SEM
Table 10: Output of proposed extended SEM
S1 <-->
R2 <-->
T1 <-->
S1 <-->
S1 <-->
T2 <-->
S1 <-->
S2 <-->
R2 <-->
T2 <-->
S2 <-->
T2 <-->
Research in Higher Education Journal
An assessment of the relationship, Page
, the proposed relationships between the observed variables of the extended SEM
model are conceptualized and the output of the analysis is reported in Table 10.
: Output of proposed extended SEM
Estimate S.E. C.R. P
> T2 .044 .049 .886 .376
> S2 -1.337 1.251 -1.069 .285
> R1 -.025 .334 -.074 .941
> R2 .604 .910 .663 .507
> R1 .161 .491 .327 .744
> S2 .186 .080 2.308 .021*
> T1 .156 .067 2.325 .020*
> T1 -.102 .076 -1.344 .179
> T1 .530 .612 .866 .387
> R1 .260 .292 .889 .374
> R1 .189 .657 .288 .773
> R2 -1.053 .581 -1.811 .070
Research in Higher Education Journal
An assessment of the relationship, Page 13
, the proposed relationships between the observed variables of the extended SEM

Research in Higher Education Journal
An assessment of the relationship, Page 14
The model fit is tested using the Goodness of Fit Index (GFI).GFI takes value between
0 and 1 where 1 indicates a perfect fit, the GFI for this model is 0.83. An extended SEM helps
looking more specifically to the relation between the teching performance and service. As listed
in Table 9 that teching performane score for a faculty member is comprised of two factors: the
course portfolio (T1); and students’ evaluation (T2). The services score is also contributed by
two factors; university committee (other) services (S1); and academic (students’) counselling
(S2). In Table 10 the outputs of AMOS model which is shown in Figure 2 are presented. The
course portfolio a faculty member prepares for his/her teaching and the faculty’s other services
are positively related at 5% statistical significance .Also the academic counseling and faculty’s
student rating are positively related at the statistical significant level of 5%. These results
supports the initial findings of the positive relation between the teaching performance and the
service and identify about the relationships at individual basis. In conclusion, the two SEM
model enable us to establish following hypotheses:
Hypothesis 1: There exist significant positive correlation between a faculty’s teaching
performance and services
This hypothesis is supported as Table 8 shows overwhelming evidence that the teaching
performance and the service are positively related. Thus, it can be concluded that the faculty
with higher teaching score rating are also noticed to be strongly active and provides more
university and community services including academic counseling.
Hypothesis 2: There is week relationship between teaching performance and the scholarly
endeavor.
This hypothesis can be noticed from Table 8, there is no statistically significant relation
between the teaching performance score of the university faculty and his/her scholarly endeavor
score. Table 10 shows that various teaching outcomes (students rating of teaching, course
portfolio) are not related with scholarly endeavor (number of publications and nature of
participation). This finding is coupled with the comprehensive Hattie and March (1996)’s meta-
analysis and it supports the view that is cited by Terenzini and Pascarella (1994) which states
about one of the of the myths of higher education that is good researchers are good teachers.
However, this result can be justified as limited to a single institution, Qatar University.
Hypothesis 3: There is also a week relationship between faculty’s service and the scholarly
endeavor.
This hypothesis can be also be concluded from Table 8 , there is no statistically
significant relationship between the service performance and the scholarly endeavor. This result
might be viewed again as limited to QU.
8. Conclusion and Future Works
The objective of the study was to investigate the relationship between Qatar University
faculty’s performance (score) in the three domains (teaching performance, scholarly endeavor,
and service) of the Appraisal System. In this regards, a sample from office of academic

Research in Higher Education Journal
An assessment of the relationship, Page 15
evaluation, Qatar University from its two major colleges, College of Business & Economics,
and College of Arts & Science. Two conceptual models are proposed to explore the faculty
performance at Qatar University. The study shows that the two colleges’ faculties are equally
performing and there is no significant difference among the two colleges in regards to the three
different performance domains: teaching performance, scholarly endeavor, and service. This
research also explores the relationships between aforementioned three components. Two distinct
models of relationships are hypothesized and tested using Structural Equation Modeling
approach. Later, a confirmatory analysis is used that establishes that there is statistically
significant positive relationship between the teaching performance and services. Whereas, the
other components are not significantly related at the Qatar university. Thus, it can be concluded
that teaching performance and scholarly endeavor are not related ,which seems to be consistent
with the previous studies in this field (Hattie and March 1996 ).While it may be limited to the
two colleges of Qatar University , this study demonstrates that good teaching performance is also
related to the enhance of university and community services.
This research can be extended in the future by considering more colleges or even more
institutions inside or outside Qatar e.g. GCC. Those institutions may have different appraisal
systems, so applying this study among them will help advances in exploring the relationship
between teaching and research that is found in this study.
9. References
Adams, M.R. (1989). “Tenuring and Promoting Faculty”. Thought and Action,Vol.5 No.2
,pp.55-60
Aleomoni, L. M. (1984). “The dynamics of faculty evaluation”. In P. Seldin, Changing
practices in faculty evaluation: A critical assessment and recommendations for
improvement (pp. 75-79). San Francisco: Jossey-Bass
Allen, M. (1996). “Research productivity and positive teaching evaluations”: examining the
relationship through meta-analysis. Journal of the Association for Communication.
Administration, Vol. 2, pp.77–96
Altbach ,P.G. and Lewis ,L.S. (1995). “College teacher’s attitudes”. Change, Vol.27
Aubrecht, J. D. (1984). “Better faculty evaluation systems”. In P. Seldin, Changing practices
in faculty evaluation: A critical assessment and recommendations for improvement
(pp. 85-91). San Francisco: Jossey-Bass
Bentler,P.M. (1988). “Causal modeling via structural equation systems”. In J.R. Nesselroads
& R. B
Bollen, K. A. (1989). “Structural Equations with Latent Variables”. Wiley, ISBN 0471-
01171-1
Braskamp, L. A. and J.C. Ory. (1994). “Assessing faculty work”. San Francisco: Jose Bass,
333 p
Brew, A. (1999). “Research and teaching: changing relationships in a changing context”.
Studies in Higher Education, Vol.24(3), pp. 291-301
Brodzinski, J.D. and Scherer, R.F. (1990). “Developing effective teachers in business schools:
A holistic approach”, The Journal of Education for Business, Vol. 66, (1), pp.38- 42
Byrne, B. M. (2001). “Structural Equation Modeling with AMOS - Basic Concepts,
Applications, and Programming”.LEA, ISBN 0-8058-4104-0
Research in Higher Education Journal
An assessment of the relationship, Page 16
Centra, J.A., (1977). “How Universities Evaluate Faculty Performance: A Sur vey
Of Department Heads”. Prince ton, NJ Educational Testing Service, GRE Board Research
Report, No. 75- 5bR
Clark, B.R. (1987). Academic Life: Small Worlds, Different Worlds, Princeton, N.J.:
Carnegie Foundation for the Advancement of Teaching
Darling-Hammond, L., and Snyder, J.(2000) Authentic assessment of teaching in context,
Teaching and Teacher Education, Vol. 16, No. 5-6,pp. 523-545
Elton,L.(1992). “Research, Teaching and Scholarship in an expanding higher education
system”,Higher Education Quarterly,pp.252-267
Eva K.,Marianne C.(2001). “The growing importance of research at academic colleges of
education in Israel”, Education and Training,Vol.43,No. 2,pp.82-93
Feldman, K. (1987). “Research productivity and scholarly accomplishment of college teachers
as related to their instructional effectiveness: A review and exploration”. Research
Higher Education,Vol 26, pp.227–298
Fox, M. F. (1992). “Research, teaching, and publication productivity: Mutuality vs.
competition in academia”. Social. Education,Vol. 65,pp. 293–305
Hattie, J., and Marsh, H. W. (1996). “The relationship between research and teaching: A
meta-analysis”. Review of Educational Research, Vol.66, pp.507–542
Johnston, P., Guice, S., Baker, K., Malone, J., and Michelson, N., (1995) Assessment of
teaching and learning in 'literature-based' classrooms, Teaching and Teacher
Education, Vol. 11, No. 4,Pages 359-371
Kerr, C. (1963). The Uses of the University, New York: Harper and Row.
Kfir,D.,Libman ,Z. and Shamai ,S.(1999). “The role of research activities in academic
colleges of education”, Dapim (in Hebrew),Vol.28, pp.8-16
Kreber, C. (2002). “Teaching excellence, teaching expertise, and the scholarship of teaching”.
Innovative Higher Education,Vol. 27,pp. 5-23
Kremer, J. (1991). “Identifying faculty types using peer ratings of teaching, research, and
service”. Research. Higher Education, Vol.32,pp. 351–361
Kremer, J. F. (1990). “Construct validity of multiple measures in teaching, research, and
service and reliability of peer ratings”. Journal of Educational Psychology, Vol. 82,
pp. 213–218
Kutner, M.,Neter, J., Wasserman, W., Nachtsheim, C. (2004). “Applied Linear Statistical
Models”, McGraw-Hill
Lucal, B., Albers, C., Ballantine, J., and Burmeister-May, J. (2003) Faculty assessment and
the scholarship of teaching and learning: Knowledge available/knowledge
needed. Teaching Sociology, Vol. 31, No. 2, pp. 146-161.
Metzler M. W., Blankenship, B. T. (2008), Taking the next step: Connecting teacher
education, research on teaching, and programme assessment, Teaching and Teacher
Education, Vol. 24, No. 4, pp. 1098-1111
N Arbuckle, J.L. (2007). AMOS 16 user’s guide. Chicago: SPSS o.6, P.50
Neumann, R. (1996). “Researching the teaching-research nexus: A critical review”.
Australian Journal of Education, Vol. 40, pp.5–18
Ory, J. C. (1991). “Changes in evaluating teaching in higher education”. Theory into Practice,
Vol.30, pp. 30-36
Pat, H., and Elaine, R., 1988. Faculty Voices on Assessment: Expanding the
Conversation. Change 20, no. 4, (July 1): 48

Research in Higher Education Journal
An assessment of the relationship, Page 17
Pettitt, M.. 2008. Assessing General Education Programs, Journal of Applied Research in the
Community College 15, no. 2, (April 1): 171-172.
Pigge F. L., and Marso R. N. (1997) A seven year longitudinal multi-factor assessment of
teaching concerns development through preparation and early years of teaching,
Teaching and Teacher Education, Vol. 13, No. 2,pp. 225-235
Ramsden ,P.(1998). “Managing the effective university “,Higher Education Research and
Development ,17(3),pp.347-371
Ramsden, P., and Moses, I. (1992). “Associations between research and teaching in
Australian higher education”. Higher Education Vol. 23, pp. 273–295
Robertson, J. & Bond, C. H. (2001). “Experiences of the relation between teaching and
research:
what do academics value? ” Higher Education Research and Development,Vol. 20(1),
Tang, S. Y. F., and Chow, A. W. K. (2007) Communicating feedback in teaching practice
supervision in a learning-oriented field experience assessment framework, Teaching
and Teacher Education, Vol. 23, No. 7, pp. 1066-1085
Tanner, J. R., Manakyan, H., and Hotard, D. (1992). “Management-faculty research
productivity and perceived teaching effectiveness”. Journal of Education for Business,
Vol. 68, pp. 261–265
Terenzini,P.T.,and Pascarella,E.T.(1994).Living with myth: Undergraduate education in
America. Change 26(1):28-32
Verhey. M. P., 1999. Information literacy in an undergraduate nursing curriculum:
Development, implementation, and evaluation. Journal of Nursing
Education 38, no. 6, (September 1): 252-261
Veysey, L.R. (1965). The Emergence of the American University, Chicago, Ill: University of
Chicago Press
Wachtel, H. K. (1998). “Student evaluations of college teaching effectiveness: A brief
review”. Assessment and Evaluation in. Higher Education, Vol. 23, pp. 191–211
Webster, D. S. (1985). “Does research productivity enhance teaching?” Educational Record,
Vol.66, PP.60–62.
Weschke, B., and Canipe, S. 2010. The Faculty Evaluation Process: The First Step In
Fostering Professional Development In An Online University. Journal of College
Teaching and Learning 7, no. 1, (January 1): 45-57.
Youngs P. , and Bird T., (2010) Using embedded assessments to promote pedagogical
reasoning among secondary teaching candidates, Teaching and Teacher Education,
Vol. 26, No. 2, pp. 185-198
Research in Higher Education Journal
An assessment of the relationship, Page 18
Appendix
Figure 3 The Domains and Weights of Qatar University Faculty Appraisal System
Students
Rating b
Course
Portfolio a
Service
(10%-30%)
Write/Translate a
refereed
reference book
Number of
Publications c
Types of
Publications
Publisher
Nature of
Participation in the
Research d
Obtain Grant for
Research
Qatar University Faculty Appraisal System
Scholarly Endeavor
(10%-40%)
Teaching Performance
(50%-60%)
Academic
Advising
Other
Services
Participate in
Scholarly
Project
a- Course Portfolio includes: course description, course teaching philosophy, sample of
teacher's work, sample of student's work and reflection page. Faculty and the Head of
the Department should agree on which “course portfolio” to submit for evaluation.
b- The average student's feedback is used in the evaluation not a certain course feedback.
A copy of Student's Questionnaire on university course is available in the appendix.
c- Published Research in the past two years.
d- First / Second Author
e- Includes participating in committees inside & outside university, presenting a seminar,
lecture, workshop or training session and other services to the society.