an assessment of the potential economic impacts of rcep on
TRANSCRIPT

source: https://doi.org/10.7892/boris.97908 | downloaded: 27.12.2021
Working Paper No. 05/2017 | March 2017
An Assessment of the Potential Economic Impacts of RCEP on Vietnam Automobile Sector Tu Thuy Anh Foreign Trade University (FTU), Vietnam [email protected]
Le Minh Ngoc Foreign Trade University (FTU), Vietnam [email protected]
Nguyễn Quỳnh Hương Foreign Trade University [email protected]
This research aims at examining impacts of ASEAN+6 trade agreements on automobile industry in
Vietnam. Vietnam automobile industry competes with Thailand, Indonesia and those ASEAN countries
as well as China, Korea, Japan and those assigned with ASEAN agreement. By 2018, the automobile
import tariff from China, Korea and Japan will reduced to 5%. In the context of multiple trade
agreements, the study of automobile industry has recently become an interesting topic, especially for
the policy debate.
Research for this paper was funded by the Swiss State Secretariat for Economic Affairs under the SECO / WTI Academic
Cooperation Project, based at the World Trade Institute of the University of Bern, Switzerland.
SECO working papers are preliminary documents posted on the WTI website (www.wti.org) and widely circulated to
stimulate discussion and critical comment. These papers have not been formally edited. Citations should refer to a “SECO / WTI
Academic Cooperation Project” paper with appropriate reference made to the author(s).

AN ASSESSMENT OF THE POTENTIAL ECONOMIC IMPACTS OF
RCEP ON VIETNAM AUTOMOBILE SECTOR1
TU Thuy Anh2
LE Minh Ngoc3
NGUYỄN Quỳnh Hương4
1. Introduction
1.1. Overview of Vietnam automobile market and import
The formation of automobile market in Vietnam was relatively late compared to the
world. In 1986, Vietnam kicked off the Renovation initiative. Along with political and
economic reform efforts of the country, relations with capitalist countries have been
gradually resumed, which facilitated the automobile market in Vietnam become more
dynamic with various types of automobiles from different foreign branch names such as
Toyota, Ford, Honda, Mercedes Benz, etc.
The automobile market in Vietnam has two major segments: Completely Knocked
Down (CKD) and Completely Build Up (CBU). A CKD vehicle means a vehicle is
assembled locally using all the major parts, components, and technology imported from the
country of its origin. A CBU import means a vehicle is completely built out of the country.
If a vehicle is tagged as CBU import, it means the vehicle is imported to the country as a
whole piece.
Generally speaking, the localization ratio of Vietnam automobile industry is still very
low. Thus, importation of both final and intermediate products related to automobile
manufacture plays a very important role. For Vietnam, value of trade in automobile
products accounts for a good proportion in total value of trade in commodities. According
to Trade Map5 database, in 2015, products in the HS
6 87 group (Vehicles other than
railway, tramway) ranks at the 6th
among the top 10 product groups with highest import
value.
1 The authors would like to thank WTI/SECO for funding this research. This paper was presented at the
Vietnam Economist Annual Meeting (VEAM 2016) organized in Da Nang on 11 and 12 August 2016. 2 Foreign Trade University, 91, Chua Lang, Dong Da, Ha Noi, Vietnam. Email: [email protected].
3 Foreign Trade University, 91, Chua Lang, Dong Da, Ha Noi, Vietnam. Email: [email protected].
4 Foreign Trade University, 91, Chua Lang, Dong Da, Ha Noi, Vietnam. Email: [email protected].
5 http://www.trademap.org/
6 Harmonized System.

Figure 1: Import values of top 10 products imported by Viet Nam
Source: Authors’ compilation from Trade Map database
Figure 2: Top 10 supplying markets for the product group HS - 87 (Vehicles other
than railway, tramway) imported by Vietnam
Source: Trade Map
0
5'000'000
10'000'000
15'000'000
20'000'000
25'000'000
30'000'000
35'000'000
40'000'000
45'000'000
2005 2006 2007 2008 2009 2010 2011 2012 2013 2014 2015
Imp
ort
valu
e in
US
doll
ar
thou
san
d
Year
'85
'84
'39
'72
'27
'87
'60
'90
'03
'76

Table 1: List of supplying markets from ASEAN+6 for the product group HS – 87
(Vehicles other than railway, tramway) imported by Viet Nam
Unit: US Dollar thousand
Imported value
Exporters 2010 2011 2012 2013 2014
World 2,304,410 2,437,897 1,721,976 1,886,317 3,183,011
ASEAN +6 Aggregation 1,720,374 1,851,378 1,279,530 1,555,345 2,722,195
ASEAN +6 Aggregation
(as percentage in total imported
value from the world)
75% 76% 74% 82% 86%
China 376,786 385,845 303,227 371,893 926,484
Korea, Republic of 506,942 507,022 308,393 338,772 558,983
Thailand 337,005 427,782 297,664 397,849 529,845
Japan 383,882 384,067 261,216 302,965 508,234
Indonesia 61,475 72,255 55,991 83,543 101,591
India 15,909 37,921 25,967 38,180 72,768
Malaysia 8,197 9,031 10,501 9,728 14,244
Philippines 23,603 22,734 13,210 8,868 7,328
Singapore 5,179 3,996 2,715 2,263 1,243
Australia 1,097 710 273 1,180 1,195
Cambodia 112 8 346 96 259
New Zealand 23 7 27 8 21
Lao 164 0 0 0 0
Myanmar 0 0 0 0 0
Brunei Darussalam 0 0 0 0 0
Source: Authors’ compilation from Trade Map database
As shown by Figure 2, among the 10 biggest supplying markets of vehicles imported
by Vietnam, there are six countries belonging the proposed free trade area of ASEAN + 6,
namely China, Thailand, Indonesia, India, Republic of Korea and Japan. China, Korea,
Thailand and Japan that are the 4 biggest supplying markets are all participating members
in ASEAN+6 negotiating FTA. It means that ASEAN+6 could be considered as a critical
significant group of partner countries of Vietnam’s automobile sector. Thus, the formation
of ASEAN+6 free trade area is expected to bring remarkable effects on this sector of
Vietnam. Table 1 supplements further statistics of imported value by Vietnam from
ASEAN+6 supplying market compared to the total imported value from the world, which
confirm the importance of ASEAN+6 partners to the Vietnam’s trade in vehicles.
Vietnam is considered as a transitional economy, shifting from the centrally-planned
economy with state subsidies to a socialist-oriented market economy. As the domestic
automobile industry has not been developed, the automobile market has been still under a
moderate control of the Government. However, along with the irreversible process of
economic integration, this control has been relaxed. Before 2004, the Government
controlled the domestic automobile market by tariffs and quotas, especially import tariffs.
For example, vehicles under 12 seats were not allowed to be imported into Vietnam market

to serve the purpose of personal consumption. Special Purpose Vehicle (SPV) import was
restricted by quotas, in order to ensure competitiveness of domestic products (mainly SPV
at that time). Until 2005, the CBU import duty to all vehicles for passengers and under-
five-ton cargos was over 100%.
Figure 3: Sales in Vietnam automobile market from 2005 to 2015
Unit: vehicle
Source: OICA7 Report, 2015
In the context of globalization and economic integration, the regulatory policies of
the Government are in conformity with terms and conditions negotiated and stipulated in
international trade agreements. After the accession to the World Trade Organization
(WTO) in 2007 and by implementing the commitments of tariff reduction, import tariffs
imposed by Vietnamese government on imported automobiles started being cut. Outputs,
as well as consumption quantity of vehicles in all segments have increased over the years.
Sales in Vietnam automobile market increased 4.5 times in ten years (from 2005-2015),
from 41,133 to 183,382 vehicles (Figure 3). It is noteworthy that demand for cars increased
nearly three times (from 41,133 to 111,950) during the period from 2005 to 2007, which
marks the obvious effect of the Government’s policies on the automobile effects,
especially the policy of tariff reduction.
1.2. Overview of the Regional Comprehensive Economic Partnership (RCEP)
The Regional Comprehensive Economic Partnership (RCEP) is a FTA negotiation
that has been developed among 16 countries: the 10 members of ASEAN and the 6
countries with which ASEAN has existing FTAs – Australia, China, India, Japan, South
Korea, and New Zealand, which is also considered as ASEAN+6. When completed, the
agreement will comprise of 16 countries, which represent over 45% of the world
population (3,435 million in 2013) and contribute about a third of the world’s GDP
(US$21.3 trillion, in 2013), and make up almost 30% of world exports (WEF, 2014, 33).
On November 2012, RCEP negotiations were launched in Phnom Penh. The 1st
round of RCEP negotiations was held on 9–13 May 2013 in Bandar Seri Begawan, Brunei.
7 Organisation Internationale des Constructeurs d'Automobiles
41133
111950 112224 110938
96692
183382
0
50000
100000
150000
200000
2005 2007 2009 2011 2013 2015

Recognizing the ASEAN Framework for RCEP, the objective of launching RCEP
negotiations is to achieve a modern, comprehensive, high quality and mutually beneficial
economic partnership agreement that will cover trade in goods, trade in services,
investment, economic and technical cooperation, intellectual property, competition, dispute
settlement and other issues among the ASEAN Member States and ASEAN’s FTA
Partners. RCEP will broaden and deepen current engagement that has already been
achieved through the existing ASEAN+1 FTAs. Compatibility with WTO trade rules on
goods and services is also a principle for RCEP negotiations.
The latest 13th
round was held in Auckland in June 2016. All RCEP countries have
now submitted initial offers for trade in goods and trade in services, as well as initial
reservation lists for investment. In goods, negotiators continued to engage in discussions
on the way forward, in light of the statement last year that leaders were looking forward to
the conclusion of RCEP negotiations in 2016. The next round is scheduled for August
2016 and will be held in Ho Chi Minh City, Viet Nam. The RCEP appears to overlap and
compete with the Trans-Pacific Partnership (TPP) agreement which has become heavily
influenced by the United States’ economic and geopolitical agenda in the Asia-Pacific. (7
of RCEP’s member governments belong to the TPP.) Additionally, China has recently
decided to champion the Free Trade Area for the Asia-Pacific (FTAAP), an old US-
initiated proposal to have a single free trade agreement covering all Asia-Pacific Economic
Cooperation (APEC) member states.
Participating in such great FTAs like RCEP or TPP is placing numerous issues on
FTA negotiating capacity of countries involved including Vietnam. Preparing well for the
negotiations, which makes the actual negotiations a more manageable undertaking, is the
first and foremost concern. In order to work out the negotiating objectives and strategies, it
is necessary for policymakers and stakeholders to determine the potential economic effects
of an FTA. Ex-ante economic assessment of an FTA may be not only an estimation of
overall effects on an economy participated in the FTA as a whole but also an anticipation
of impacts on particular sectors in a country that plans to join the FTA. Assessments of
potential impacts of TPP are relatively extensive while those of RCEP are fairly modest,
especially analyses for a specific sector of the economy, like the automobile. The more
RCEP negotiation rounds Vietnam participates in, the more urgent the need to assess
potential impacts of RCEP on Vietnam. Given the context, this paper is aimed at
examining the potential impacts of the proposed RCEP on the automobile sector in
Vietnam.
2. Impacts of RCEP on Vietnam oil import – a partial equilibrium analysis
2.1. The partial equilibrium SMART model
In FTA impact assessment, policymakers may want to focus on examining how an
FTA will affect production, consumption, and trade flows in the domestic market for a
single commodity. We will consider a model that is partial equilibrium. Partial equilibrium

implies that the analysis only considers the effects of a given policy action in the market(s)
that are directly affected. In general, by virtue of their simplicity, partial equilibrium
models tend to be more transparent and easy to implement. Modelling is straightforward
and results can be easily explained. However, due to their simplicity, partial equilibrium
models may miss important interactions and feedback between various markets. Moreover,
as it is only a “partial” model of the economy, the analysis is only done on a pre-
determined number of economic variables.
There are several partial equilibrium modelling techniques. This paper adopts the
partial equilibrium model known as the SMART model – Software for Market Analysis
and Restrictions on Trade – that can be used in assessing the trade, tariff revenue, and
welfare effects of an FTA. This model and the simulation tools are part of the World
Integrated Trade Solutions (WITS) trade database and software developed by the World
Bank (WB), in close collaboration and consultation with the various International
Organizations such as the United Nations Conference on Trade and Development
(UNCTAD), International Trade Centre (ITC), United Nations Statistical Division (UNSD)
and World Trade Organization (WTO).
2.2. Methodology and data sources
For the purpose of this paper, the authors define only one scenario representing a
total opening of Vietnamese market to the rest of 15 RCEP negotiating partners. This
should not be the exact outcome of FTA negotiations in general and RCEP negotiation in
particular. Article XXIV of the GATT, under which the WTO compliance of RTAs will be
established does allow for some products to be excluded from the coverage of
liberalization. For RCEP, one of the Guiding Principles8 for negotiating is stated that
“Taking into consideration the different levels of development of the participating
countries, the RCEP will include appropriate forms of flexibility including provision for
special and differential treatment, plus additional flexibility to the least-developed ASEAN
Member States, consistent with the existing ASEAN+1 FTAs, as applicable.” However,
analysing the impact of full liberalization in a partial equilibrium framework allows
distinguishing the products and sectors where the impact is greatest. Identifying the
products for which the impact of liberalization is greatest may help Viet Nam to define the
most “sensitive products” for which the country may want to benefit from the provision of
Special and Differential treatment. The sensitivity parameters analysed here are import
increase and tariff revenue loss. Therefore, the authors apply a 100 per cent tariff reduction
to all products at the HS-6 level.
The WB, in close collaboration and consultation UNCTAD, ITC, UNSD and WTO
have developed WITS for access and retrieval of information on various merchandise trade
and tariffs data compilation maintained by various International Organizations:
8 Guiding Principles (ASEAN, n.d.) were approved by Economic Ministers on 30 August 2012 and endorsed
by Leaders and provide a roadmap for negotiators.
The Commodity Trade (UN Comtrade) database maintained by UNSD;
The Trade Analysis Information System (TRAINS) maintained by UNCTAD; and
The Integrated Data Base (IDB) and the Consolidated Tariff Schedule Data Base
(CTS) maintained by WTO.
The SMART model runs on information contained in TRAINS database. SMART,
therefore, uses TRAINS data for tariffs (applied tariffs) and trade values. For trade values,
TRAINS data is based on the data collected in the COMTRADE database. With regard to
tariffs, the SMART model uses applied tariffs as recorded in TRAINS.
2.3. Results
The assessment of impacts on import and tariff revenue is based on results from
Market View Report and Revenue Impact Report, which are created by the SMART. Table
2 reports on the top 20 products at HS 6-digit level arranged in order of highest to lowest
increase in imports to Viet Nam. A half of these 20 products will increase by more than
100 per cent in imports. The most remarkable product is 611790 (Parts of garments/of
cloth accessories, of textile materials, knitted) which has the biggest import increase in
terms of both absolute value (1,425,183,125 USD) and percentage (803%). This product
might be an important input for the sector of textile and clothing. In the context of trade
liberalization, Vietnam specializes and exports more textile and clothing products – the
sector which Vietnam has comparative advantage, which leads to the high demand for
inputs of this sector.
Table 3 reports on simulation results for the top 20 products at HS 6-digit level
arranged in order of biggest to smallest loss in tariff revenue of Vietnamese government
when Vietnamese market is 100-per-cent-open to the RCEP partners. The government will
lose the biggest revenue of 314,369,344 USD from import tariff imposed on the product of
271019 (Other petroleum oils and preparations). Since the gap between old weighted rate
(6.63%) and new weight rate (1.48%) is not large, the loss of revenue may be mainly
caused by the fact that this is one of the biggest import sector of Vietnam. The losses in
overall budget revenue seems significant. Clearly, the country will need to enhance the
fiscal base to be able to cope with the loss in tariff revenue.
It is interesting to find that there are 10 products that appear in both Table 2 and
Table 3, meaning that the RCEP impacts on these products not only raise a concern to the
government with regards to the revenue loss, but attract attention of the market regarding
the import increase also. These most notable products are presented in the intersection of
“20 highest import-increase products” collection and “20 biggest tariff revenue-loss
products” collection (Figure 4). Their HS 6-digit codes are 271019, 271012, 852872,
100590, 600622, 551519, 551219, 640620, 870323, and 611790. These product groups
critically deserve a cross check of their importance to the economy and a deeper
assessment of RCEP’s impacts on the sectors producing these products. Regarding
automobile sector, the product coded 870323(Automobiles with diesel engine displacing

more than 1500 cc to 2500 cc) which belongs to the product group HS – 87 would be
examined more carefully in order to understand more deeply the effect of RCEP on
automobile sector in Vietnam.
Figure 4: Top 20 products with the highest increases in imported value
vs. Top 20 products with the biggest losses in tariff revenue
Source: Authors’ compilation from SMART – WITS simulation results.

Table 2: Increases in imports of merchandise from RCEP negotiating partners to Vietnamese market after RCEP
Ranked by
Import Change
Product
Code Product Description
Imports Before
(USD)
Import Change
(USD)
Percentage
change (%)
1 611790 Parts of garments/of cloth accessories, of textile materials, knitted 177,413,172 1,425,183,125 803.31
2 271019 Other petroleum oils and preparations 6,359,577,500 890,558,625 14.00
3 100590 Maize (corn) nes 462,771,438 508,894,125 109.97
4 271119 Petroleum gases and other gaseous hydrocarbons nes, liquefied 289,447,469 448,035,125 154.79
5 540742 Woven fabrics,>/=85% of nylon/other polyamides filaments, dyed,
nes 99,630,055 426,730,719 428.32
6 551219 Woven fabrics,containg>/=85% of polyester staple fibres,o/t unbl
or bl 384,841,438 321,091,188 83.43
7 600622 Dyed cotton fabrics, knitted or crocheted, of a width of > 30 cm
(excl 632,906,000 280,819,344 44.37
8 410799 Leather "incl. parchment-dressed leather" of the portions, strips or
s 355,410,469 209,517,750 58.95
9 600690 Fabrics, knitted or crocheted, of a width of > 30 cm (excl. of artific 219,725,438 197,040,422 89.68
10 350691 Adhesives based on rubber or plastics, nes 83,920,320 186,685,125 222.46
11 071410 Manioc (cassava), fresh or dried, whether or not sliced or pelleted 159,636,047 180,043,344 112.78
12 640620 Outer soles and heels, of rubber or plastics 126,958,938 162,135,547 127.71
13 271012 Bituminous coal 2,995,499,750 160,285,297 5.35
14 080131 Cashew nuts, in shell, fresh or dried 321,547,281 148,598,219 46.21
15 030342 Tunas, yellowfin, frozen excluding heading No 03.04, livers and
roes 82,962,016 142,660,766 171.96
16 290321 Vinyl chloride (chloroethylene) 194,141,266 100,954,461 52.00
17 551599 Woven fabrics of synthetic staple fibres, nes 163,549,344 95,079,703 58.14
18 870332 Automobiles with diesel engine displacing more than 1500 cc to
2500 cc 11,859,014 86,078,422 725.85
19 852872 Reception apparatus for television, colour, whether or not
incorporati 290,416,219 82,636,336 28.45
20 030349 Tunas nes, frozen, excluding heading No 03.04, livers and roes 27,804,104 79,824,320 287.10
Source: Authors ‘compilation from SMART – WITS simulation results.

Table 3: Decreases in tariff revenue of Vietnamese government after RCEP
Ranked by
Revenue
Effect
Product
Code Product Description
Tariff
Revenue
(USD)
Revenue
Effect
(USD)
Percentage
change (%)
1 271019 Other petroleum oils and preparations 421,321,990 -314,369,344 -74.61
2 271012 Bituminous coal 348,761,840 -292,687,906 -83.92
3 852872 Reception apparatus for television, colour, whether or not
incorporati
101,645,670 -101,550,500 -99.91
4 151190 Palm oil and its fractions refined but not chemically modified 99,831,220 -99,830,914 -100.00
5 853690 Electrical app for switchg/protec elec circuits,not exced 1,000
V,nes
84,884,480 -80,789,461 -95.18
6 100590 Maize (corn) nes 80,985,000 -64,813,410 -80.03
7 600622 Dyed cotton fabrics, knitted or crocheted, of a width of > 30 cm
(excl
75,948,720 -63,315,211 -83.37
8 392690 Articles of plastics or of other materials of Nos 39.01 to 39.14 nes 57,277,570 -49,086,445 -85.70
9 871120 Motorcycles with reciprocatg piston engine displacg > 50 cc to 250
cc
49,639,570 -48,788,090 -98.28
10 551519 Woven fabrics of polyester staple fibres, nes 57,012,890 -48,303,727 -84.72
11 732690 Articles, iron or steel, nes 52,159,210 -43,851,891 -84.07
12 841510 Air conditioning machines window or wall types, self-contained 41,568,090 -41,405,449 -99.61
13 841821 Refrigerators, household type, compression-type 39,556,540 -39,543,414 -99.97
14 551219 Woven fabrics,containg>/=85% of polyester staple fibres,o/t unbl
or bl
46,180,970 -36,903,680 -79.91
15 852580 Television cameras, digital cameras and video camera recorders 35,854,080 -35,091,855 -97.87
16 640620 Outer soles and heels, of rubber or plastics 38,087,680 -34,417,313 -90.36
17 870323 Automobiles w reciprocatg piston engine displacg > 1500 cc to
3000 cc 50,608,140 -34,039,328 -67.26
18 611790 Parts of garments/of clothg accessories,of textile materials,knittd 35,482,630 -33,852,867 -95.41
19 401120 Pneumatic tires new of rubber for buses or lorries 32,147,810 -30,183,547 -93.89
20 392630 Fittings for furniture, coachwork or the like, of plastics 29,868,210 -29,183,293 -97.71
Source: Authors’ compilation from SMART – WITS simulation results.

3. Impacts of RCEP on Vietnam oil import – an econometric analysis
3.1. Econometric model
Gravity has been one of the most frequently used models in economics. An
interesting fact is that, though widely used in the field of economics, gravity model based
on Newton’s Law of Gravitation, not an economic theory. As Murat Genç and David Law
(2013), the main idea of this model is that a mass of goods or factors for production like
labour, capital… from country i, Mi, is attracted to the demand for them at country j, Mj,
but the distance between i and j, Dij, causes trade cost to transport the goods and makes the
actual trade flow lower than it should be. G indicates proportionality constant. Traditional
gravity is expressed by the formula below
The larger the supply and demand from i and j, the larger the trade flows; the larger
the distance between the countries, the smaller the trade flows. By taking logarithms of
both sides of the multiplicative form above, we have this additive form
ln Xij = lnG + α lnMi + β lnMj – θlnDij
which can be estimated by OLS or other methods. Broadening the view, we can use
various structures of gravity model to estimate many factors that influent trade flows
among countries. Mi and Mj can be represented by data of GDP, GDP per capita,
population…or in other words, size of the economics. Dij is any factor affecting trade
friction, for instance, distance as in the traditional model, language, border or
Governments’ trade policies… There are many empirical researches based on gravity
models have stated that tariff and non – tariff policies cause certain impact on trade cost.
For instance, Linders et al. (2008) analysed the effects of trade barriers by using trade-
weighted applied bilateral importer tariffs and dummy variable for ‘low tariff and non-
tariff barriers’, and found out both tariffs and non-tariff barriers have negative impact on
the volume of trade; Winchester (2009) investigates the tariff equivalents of NTMs for
New Zealand using bilateral tariffs, ad valorem export subsidy paid to exporters, and some
dummy variables for NTBs and behind-the-border costs, NTBs are found to be strongly
significant; Bao and Qiu (2010) examine the influence of tariffs and technical barriers to
trade in case of China, using frequency index and coverage ratios to measure NTMs, the
results they get are varied through different periods; Hoekman and Nicita (2011) find that
tariffs, NTMs and behind-the-border transaction costs are all statistically significant
determinants of bilateral trade.
Empirical studies based on gravity models state that tariffs and non-tariff measures
(especially technical barriers to trade) are important factors affecting trade cost. However,
those studies investigate TBTs under the form of dummy variable then converted into ad-
valorem equivalents (AVEs), frequency ratio or coverage ratio. There has no research

estimate TBTs with specific requirements in order to particularly analyse how the change
in policies of NTMs determine trade value. This paper will dig deeper into a specific case
of Vietnam’s import value from RCEP countries with products in group 8703239 – Vehicle
with spark-ignition internal combustion reciprocating piston engine of a cyliner capacity
exceeding 1,500 cc but not exceeding 3,000 cc; using gravity model as follows:
lnIMitt = β1 + β2ln lndisij + β3GDPij
t + β4lnPOPij
t + β5lnGDPpcij
t
+ β6lnexrateijt + β7lntariffj
t + β8lnNTMj
t + uij
t
The volume of trade is expected to be greater when the size of partner’s economics is
larger. The distance variable expresses that more distant countries have a tendency to trade
less due to the rise of transportation costs. Exchange rate is expected to have negative
impact on our import10
. Similarity, tariff should promote trade volume when it is lessened.
In case of NTMs variables, we expect the higher the numbers11
are, the more opened the
policy is, which leads to a larger trade volume. Result of the model will show how
traditional variables of gravity affect Vietnam’s vehicle import from RCEP countries.
Also, it will shed light on the possible impacts of exchange rate and especially tariff and
NTMs variables on import value.
3.2. Data description
Data are assembled for a panel of 16 RCEP countries on average for the years 1988
to 2014, so that the sample size is 432. However, the actual number of observations is far
smaller because of the inadequate statistic data of developing countries in RCEP. Data on
imports come from UNCOMTRADE, based on statistical value of vehicle exports12
of
other 15 RCEP countries in order to surmount the missing problem when Vietnam’s
reported data is not very adequate.
Data on tariffs come from WITS. We use two types of tariffs which are Effectively
Applied Tariffs (AHS) and Most Favoured Nation Tariffs (MFN) because of the difference
between them. According to WITS, MFN tariffs are what countries promise to impose on
imports from other members of the WTO, unless the country is part of a preferential trade
agreement. Besides, AHS is the lowest available tariff. If a preferential tariff exists, it will
be used as AHS; or else the MFN applied tariff will be used. It seems to be more
reasonable to use AHS in case of RCEP countries, which have widely applied preferential
tariffs in most goods thanks to many regional FTAs. But AHS has a problem that it only
exists when there has trade on the product, which means when a very high tariff leads to
zero trade, it will not count as AHS. So we use both types of tariffs in the model. There are
two ways to calculate AHS and MFN. The first one is simple average tariff, which is
calculated as in the equation below:
9 Code of product line in HS 6-digit
10 In this study, we use indirect exchange rate.
11 We use the specific number of maximum allowed quantity of emission for product 870323, regulated by
Vietnam Government. 12
Value of exports is based on FOB price.

τsa=∑τk/n
in which τk is the tariff of product k, n is the number of tariffs. The second one is weighted
average tariff, calculated as
τwa=∑wkτk
in which wk is the proportion of trade of product k, τk is the tariff of product k. Because we
analyse the product in HS 6-digit code so these calculations show the same results. There is
only difference between AHS and MFN in the model.
Data on NTMs are collected from Vietnam’s legal documents, which stipulate
technical requirements with product 870323.
Other important variables such as each country’s GDP, GDP per capita come from
IMF. Data on population come from WB. Data on distance are taken from Google map.
The variables are listed in Table 4.
Table 4: Variables used in the model
Variable name Definition
lnIM Log of the vehicle’ import value of Vietnam from RCEP
countries.
lnexrate Log of the real exchange rate. An increase in this variable is
associated with an depreciation of Vietnamese Dong.
lndis Log of the distance between the foreign country’s capital and
Hanoi.
lnPOPi Log of a foreign country’s population.
lnPOPvn Log of Vietnam’s population.
lnGDPpci Log of a foreign country’s nominal GDP per capita.
lnGDPpcVN Log of Vietnam’s nominal GDP per capita.
lnGDPi Log of a foreign country’s nominal GDP.
lnGDPvn Log of Vietnam’s nominal GDP.
lnAHS Log of the average AHS tariff level that applies in Vietnam.
lnMFN Log of the average MFN tariff level that applies in Vietnam.
dummy A dummy variable taking a value of one if there is a regulation on
maximum allowed quantity of emission.
CO The maximum allowed quantity of CO emission in Vietnam.
HC&NOx The maximum allowed quantity of HC & NOx emission in
Vietnam.
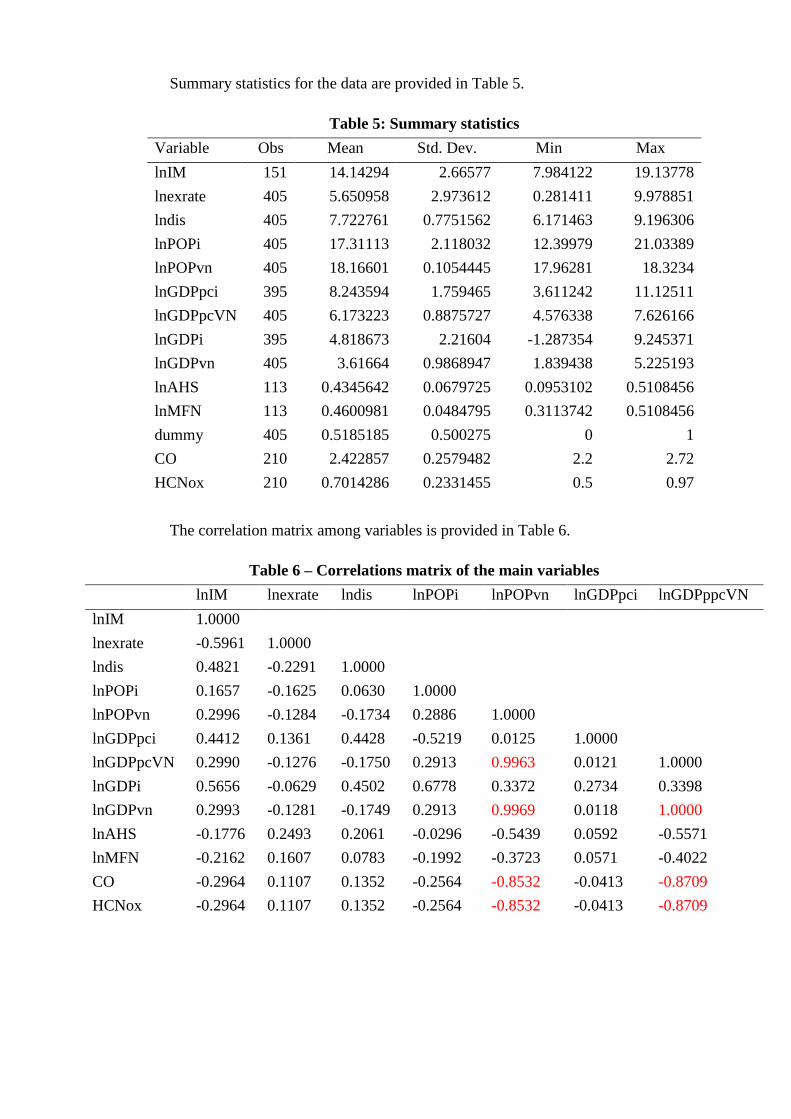
Summary statistics for the data are provided in Table 5.
Table 5: Summary statistics
Variable Obs Mean Std. Dev. Min Max
lnIM 151 14.14294 2.66577 7.984122 19.13778
lnexrate 405 5.650958 2.973612 0.281411 9.978851
lndis 405 7.722761 0.7751562 6.171463 9.196306
lnPOPi 405 17.31113 2.118032 12.39979 21.03389
lnPOPvn 405 18.16601 0.1054445 17.96281 18.3234
lnGDPpci 395 8.243594 1.759465 3.611242 11.12511
lnGDPpcVN 405 6.173223 0.8875727 4.576338 7.626166
lnGDPi 395 4.818673 2.21604 -1.287354 9.245371
lnGDPvn 405 3.61664 0.9868947 1.839438 5.225193
lnAHS 113 0.4345642 0.0679725 0.0953102 0.5108456
lnMFN 113 0.4600981 0.0484795 0.3113742 0.5108456
dummy 405 0.5185185 0.500275 0 1
CO 210 2.422857 0.2579482 2.2 2.72
HCNox 210 0.7014286 0.2331455 0.5 0.97
The correlation matrix among variables is provided in Table 6.
Table 6 – Correlations matrix of the main variables
lnIM lnexrate lndis lnPOPi lnPOPvn lnGDPpci lnGDPppcVN
lnIM 1.0000
lnexrate -0.5961 1.0000
lndis 0.4821 -0.2291 1.0000
lnPOPi 0.1657 -0.1625 0.0630 1.0000
lnPOPvn 0.2996 -0.1284 -0.1734 0.2886 1.0000
lnGDPpci 0.4412 0.1361 0.4428 -0.5219 0.0125 1.0000
lnGDPpcVN 0.2990 -0.1276 -0.1750 0.2913 0.9963 0.0121 1.0000
lnGDPi 0.5656 -0.0629 0.4502 0.6778 0.3372 0.2734 0.3398
lnGDPvn 0.2993 -0.1281 -0.1749 0.2913 0.9969 0.0118 1.0000
lnAHS -0.1776 0.2493 0.2061 -0.0296 -0.5439 0.0592 -0.5571
lnMFN -0.2162 0.1607 0.0783 -0.1992 -0.3723 0.0571 -0.4022
CO -0.2964 0.1107 0.1352 -0.2564 -0.8532 -0.0413 -0.8709
HCNox -0.2964 0.1107 0.1352 -0.2564 -0.8532 -0.0413 -0.8709

lnGDPi lnGDPvn lnAHS lnMFN CO HCNOx
lnGDPi 1.0000
lnGDPvn 0.3396 1.0000
lnAHS 0.0172 -0.5562 1.0000
lnMFN -0.1754 -0.3999 0.6353 1.0000
CO -0.3256 -0.8695 0.5852 0.5044 1.0000
HCNox -0.3256 -0.8695 0.5852 0.5044 1.0000 1.0000
In the Table 6, correlations between Vietnam’s population, Vietnam’s GDP and
Vietnam’s GDP per capita are very large and positive. Correlations between the three
variables and NTMs variables (CO and HC&NOx) are strong and negative. CO and
HC&NOx is perfectly positive correlated. The remaining variables are not very strongly
correlated with each other, so perfect multicollinearity might not happen.
3.3. Regression strategy and results
Use of panel data permits models of the form
lnIMitt = β1 + β2ln lndisij + β3GDPij
t + β4lnPOPij
t + β5lnGDPpcij
t
+ β6lnexrateijt + β7lntariffj
t + β8lnNTMj
t + uij
t
where i, j refers to country i, j, t refers to year t, uij is a time-varying idiosyncratic
error. We first estimate the model using a Random Effects approach. If the model does not
have heteroscedasticity, then we use POLS to estimate. If it does, we do Hausman test to
choose between Random Effects and Fixed Effects approach to estimate the model. The
models used in this research pass all the diagnostic tests as multicollinearity,
autocorrelation, cross – sectional dependent and normal distribution of residual.
The results of the trade equation for imports of products 870323 are presented in
Table 7. There are five models estimated. The first model estimates impacts of gravity
variables and tariffs on import value. The second model analyses effects of not only those
variables, but also dummy variable of NTMs on trade. The third model uses CO instead of
dummy variables. The last two models only shows impacts of gravity variables and the two
NTMs variables on import.
As this is a log – log model, coefficients can be interpreted as elasticities, which
means one percent increase in the explanation variable will be associated with a β%
increase in the dependent variable. For dummy variable, the dependent variable will be β%
higher when the dummy variable equals one. For the two NTMs variables without log, one
unit increase in the variable will be associated with a β% increase in the dependent
variable.
The variables GDP and GDP per capita reflect size of the economics effects. The
results indicate that those variables have positive impacts on Vietnam’s imports of 870323
products. A one percent increase in foreign GDP causes a 1.007% (model 1), 0.992%
(model 2), 0.973% (model 3), 0.938% (model 4 and 5) increase in Vietnam’s imports.

Similarly, a one percent increase in foreign GDP per capita causes a 0.778% (model 1),
0.829% (model 2), 0.777% (model 3), 0.492% (model 4 and 5) increase in import value.
GDP of Vietnam is also found to cause a 0.417% (model 1) increase in imports when
increasing one percent. The real exchange rate has an adverse effect on vehicle imports,
which is a one percent increase in exchange rate is found to cause a 0.652% (model 1),
0.643% (model 2), 0.626% (model 3), 0.716% (model 4), 0.715% (model 5) decrease in
imports.
Surprisingly, both tariffs appear not to have a statistically significant effect on
Vietnam’s imports. Moreover, the dummy variable shows that when there have regulations
on maximum allowed quantity of emission, the import increase 0.981% (model 2). CO and
HC&NOx are also found to have significant effects on dependent variable when a one
percent increase in CO and HC&NOx in turn causes a 1.41% (model 4) and 1.559%
(model 5) decrease in imports of 870323 products.
Table 7 – Estimation results of Vietnam’s import value of 870323 products
(1) (2) (3) (4) (5)
lnIM lnIM lnIM lnIM lnIM
lnexrate -0.652*** -0.643*** -0.626*** -0.716*** -0.715***
lndis -0.383 -0.371 -0.064 -0.142 -0.142
lnGDPpci 1.007*** 0.992*** 0.973*** 0.938*** 0.938***
lnGDPi 0.778*** 0.829*** 0.777*** 0.492*** 0.492***
lnGDPvn 0.417* 0.087 0.087
lnAHS 1.315 -0.052 -0.249
lnMFN -3.402 -3.917
dummy 0.981**
CO -0.815 -1.410**
HC&NOx -1.559**
Num.of obs 78 78 69 95 95
R-squared 0.815 0.82 0.796 0.767 0.767
Notes: (***) indicates that the coefficient is significantly different from zero at the 1%
significance level, (**) indicates that it is significant at the 5% level, (*) indicates that
it is significant at the 10% level.
3.4. Interpretation
In general, the results of gravity variables in the models are as we expected. The
larger the partners’ economics, the more Vietnam imports from them. The more
Vietnamese dong is depreciated, the less value Vietnam imports. However, remaining
variables show surprised outcomes. The models show that tariffs do not affect the import

value. In fact, Figure 5 presents Vietnam’s import value from top regional exporters and
the tariffs level imposed on their vehicle products.
Figure 5: Import value and tariffs applied to some RCEP countries
In 2007, Vietnam applied a tariff of below 10% on Korea’s vehicle products, make
Korea become the biggest partner. After that, the government increases the tariff but the
import value from Korea is still the highest. From 2002 to 2014, tariffs on Japan’s product
tend to be reduced, but the import value from this country shows a down trend. Indonesia
and Thailand enjoy the same preferential tariff for ASEAN countries, which is sharply
lowered through the period, but imports from these countries seem to increase very slowly.
A quick look at the data may explain the estimation’s result. Vehicles in 870323 group are
listed as discouraged import goods on Document number 1380/QD-BCT stipulated by
Vietnam Ministry of Industry and Trade in 2011. They are considered as luxury goods that
trigger deficit in trade balance and need controlling. Moreover, demand for luxury vehicles
like cars of Vietnamese people nowadays is growing too quickly, makes traffic
infrastructure overloaded and many environmental problems. That is the reason why
government has used many policies to control the quantity of products in 870323 group.
One of them is tariffs. These goods has been imposed the highest tariff level, but only
tariffs seems to be not enough because the import value of 870323 group still increases
continuously and plays an important role in Vietnam import turnover. The estimation
results have already stated that. Also, as can be seen in Figure 1, there is a time lag of
about more than one year in the effect of Vietnam’s tariff policy. In addition, the
international economics integration process requires all countries to remove tariffs for free
0.00
10.00
20.00
30.00
40.00
50.00
60.00
70.00
80.00
-
50'000'000
100'000'000
150'000'000
200'000'000
250'000'000
2002 2003 2004 2005 2006 2007 2008 2009 2010 2011 2012 2013 2014
% USD
Korea Japan Indonesia Thailand
Korea Japan Indonesia Thailand

trade. So that tariffs is no more an important determinant of trade nowadays. In fact, the
government has used other measures to control import such as TBT, para-tariff measures
or quantity-control measures… About TBT, the estimation shows adverse results to
expectation, which is the stricter the barrier is, the larger import value is. This result maybe
the consequence of using TBT to reduce import from big exporters. However, Vietnam,
with a low level of technology, can not stipulate TBT regulations strictly enough to affect
trade. At present, the government prefers para-tariff measures. To illustrate, an import car
in 870323 group has suffered many kinds of tariffs, taxes and fees such as specific tariffs,
Value Added Tax, Excise tax, protecting environment fee, traffic maintenance fee… Most
recently, by the end of 2015, an amendment of Law on excise tax has changed the way to
calculate taxed price, made the cost even higher for customers regardless of the decrease in
import tariffs. Besides, prolixity in customs procedures or lack of transparent information
are also barriers to import products of 870323 group.

Reference
The World Bank, 2010, Types of tariffs,
http://wits.worldbank.org/wits/wits/witshelp/Content/Data_Retrieval/P/Intro/C2.Typ
es_of_Tariffs.htm
UNCTAD. (2012). Classification of Non-Tariff measures,
http://ntb.unctad.org/docs/Classification%20of%20NTMs.pdf
The National Assembly, 2008, Law on excise tax,
http://moj.gov.vn/vbpq/en/Lists/Vn%20bn%20php%20lut/View_Detail.aspx?ItemID
=10509
Bo Xiong, 2012, Three essays on non-tariff measures and the gravity equation approach to
trade, Iowa State University,
http://lib.dr.iastate.edu/cgi/viewcontent.cgi?article=3536&context=etd
Xiaohua Bao, Larry D. Qiu, 2009, Quantifying the Trade Effects of Technical Barriers to
Trade: Evidence from China, http://www.sef.hku.hk/apts2009/paper/A1620-
Xiaohua%20Bao.pdf
WTO, 2012, World trade report 2012, Trade and public policies: A closer look at non-
tariff measures in the 21st century, http://www.sef.hku.hk/apts2009/paper/A1620-
Xiaohua%20Bao.pdf
Murat Genç and David Law, 2014, A Gravity Model of Barriers to Trade in New Zealand,
http://www.treasury.govt.nz/publications/research-policy/wp/2014/14-05/twp14-
05.pdf
Tu Thuy Anh and Chu Thi Mai Phuong, 2014, On the border effect in the Regional
Comprehensive Economic Partnership (RCEP),
http://old.wti.org/fileadmin/user_upload/wti.org/7_SECO-
WTI_Project/Publications/On_the_border_effect_in_the_Regional_Comprehensive_
Economic_Partnership_TU_Thuy_Anh_and_CHU_Thi_Mai_Phuong.pdf
Tu Thuy Anh and Le Minh Ngoc, 2015, Challenges to Vietnam from the comprehensive
integration into ASEAN+6: Analyses for sectors (In Vietnamese), Journal of
Economics and Development, Volume 21, Number 212, National Economics
University, Hanoi, Vietnam, February, 2015.
Winchester, N. (2009) Is There a Dirty Little Secret? Non-Tariff Barriers and the Gains
from Trade, https://ourarchive.otago.ac.nz/handle/10523/887
Hoekman, B. and A. Nicita, (2011) Trade Policy, Trade Costs, and Developing Country
Trade, http://elibrary.worldbank.org/doi/abs/10.1596/1813-9450-4797
Linders, G-J.M., M. Burger, and F. G. van Oort (2008), A rather empty world: The many
faces of distance and the persistent resistance to international trade, Cambridge
Journal of Regions, Economy and Society,
http://cjres.oxfordjournals.org/content/1/3/439.abstract

OICA, 2015, Production Statistics by country, http://www.oica.net/category/production-
statistics/
David Cheong, Methods for Ex Ante Economic Evaluation of Free Trade Agreements.
ADB Working Paper Series on Regional Economic Integration No. 52, Asian
Development Bank, June 2010.
Michael G. Plummer, David Cheong, and Shintaro Hamanaka, Methodology for impact
assessment of free trade agreements, Publication Stock Number RPT102843,
Mandaluyong City, Philippines: Asian Development Bank, 2010.
Australia, Department of Foreign Affairs and Trade, Background to the Regional
Comprehensive Economic Partnership (RCEP) Initiative, 2012, available at
http://www.dfat.gov.au/fta/rcep/rcep-background-paper-background.html, accessed
on 2nd
August 2014.
ASEAN (n.d.), Guiding Principles and Objectives for Negotiating the Regional
Comprehensive Economic Partnership., available at
http://www.asean.org/images/2012/documents/Guiding%20Principles%20and%20O
bjectives%20for%20Negotiating%20the%20Regional%20Comprehensive%20Econo
mic%20Partnership.pdf
World Economic Forum (WEF), Mega-regional Trade Agreements: Game-Changers or
Costly Distractions for the World Trading System, A report from Global Agenda
Council on Trade & Foreign Direct Investment, July 2014.