an assessment of soil geochemical methods for detecting ...€¦ · mineralization through...
TRANSCRIPT

Geoscience BC Report 2010-08
An Assessment of Soil Geochemical Methods for Detecting Copper-Gold Porphyry
Mineralization through Quaternary Glaciofluvial Sediments at the WBX-MBX and 66
Zones, Mt. Milligan, North-Central British Columbia
by
David R. Heberlein1
1 Heberlein Geoconsulting, Suite 325-210 West 2
nd St. North Vancouver, BC

GEOSCIENCE BC REPORT 2010-08
Page | i
EXECUTIVE SUMMARY This study is the second and final part of a Geoscience BC funded project (Project 2009-19) carried out by the
author to test the effectiveness of a variety of commonly used chemical extractions at detecting mineralization
through thick Quaternary glaciofluvial cover. In the first part carried out at the Kwanika Central Zone (Heberlein
and Samson, 2010), results showed that conventional soil sampling (an aqua regia digestion of -80 mesh screened,
upper B horizon) is ineffective at detecting the buried mineralization. Furthermore, laboratory specific extractions
like MMI-M (SGS) and Ionic Leach (ALS-Chemex), Enzyme Leach and Bioleach (Actlabs) also performed poorly.
These methods, which are widely recognized as being capable of detecting deeply buried mineralization in a variety
of environments, did not produce convincing responses at Kwanika. In fact, none of the methods that tested the B
horizon, the traditional soil sampling medium, did very well. The most robust responses for ore and pathfinder
elements were found at the base of the organic layer in the Ah horizon. An aqua regia digestion carried out on
samples from this layer identified high to moderate contrast apical or rabbit-ear responses for Cu, Au, Ag, W, As, Sb
and Ca on both lines. A sodium pyrophosphate extraction performed almost as well, producing convincing responses
for Cu, Au, Ag, As and U. The Kwanika study also demonstrated that soil pH and electrical conductivity
measurements produced credible responses defining the position of the underlying mineralization. On one sample
transect, mineralization was detected through 300 metres of cover consisting of up to 40 metres of Quaternary
glaciofluvial deposits and an older post-mineral sedimentary basin. These results were obtained from an area with
little surface disturbance as one might expect to find in a real exploration setting.
Results from Mt. Milligan, the subject of this report, show that the same chemical extractions behave quite
differently in an area of significant surficial disturbance. Extensive logging and drilling activities over the MBX and
66 Zones have resulted in the modification, burial or complete destruction of the original soil profile. This
disturbance has resulted in an almost complete loss of a geochemical anomaly from the underlying mineralization,
which is covered by 2 to 25 metres of glaciofluvial sediments and till. The most effective method in this
environment proved to be conventional aqua regia on upper B horizon soil. This produced apical anomalies for Cu
and Au and a possible rabbit ear response for W over part of the MBX deposit where the cover was thinnest (<2m).
Aqua regia on the Ah horizon, which was the most robust method at Kwanika, also performed relatively well at Mt.
Milligan forming rabbit ear anomalies over part of the MBX and 66 Zone. Credible Cu anomalies were also present
in Enzyme Leach and Bioleach results from the upper B horizon and in MMI. These three methods defined apical
responses over the thinnest cover. The best methods for detecting Au appear to be aqua regia on the Ah horizon and
fire assay on lower B. Again, the responses are apical over the thinnest cover.
Many of the methods produced what is interpreted to be a hydromorphic anomaly immediately adjacent to the
northwest margin of the WBX Zone. High contrast single and double peak anomalies in that area coincide with the
lower slopes of a hill and a drainage, where organic-rich soils are believed to have scavenged and concentrated
metals. It is difficult to relate this anomaly to the position of the Cu-Au deposits. Soil pH also produced an IDH
anomaly at that location. It is not known whether this represents one side of a rabbit-ear response indicating
remobilized carbonate at the edges of the mineralization or if the IDH anomaly is caused by high evaporation rates
in the drainage. Unfortunately, the position of the corresponding rabbit ear anomaly to the southeast of the
mineralization falls off the end of the line. Additional pH sampling would be required to confirm its presence.
SGH performed very well in this study. Copper pathfinder class clearly identifies the position of the mineralization
as a deep central low, bracketed by rabbit-ear highs. The low is interpreted to be an expression of a reduced chimney
developed in the overburden above the mineralization. Edges of the reduced chimney are further defined by the ratio
of weak extraction Ca to aqua regia Ca, which shows well defined rabbit ear responses for Ionic Leach and hot and
cold hydroxylamine hydrochloride extractions inside the Cu pathfinder class rabbit-ears. The Au pathfinder class

GEOSCIENCE BC REPORT 2010-08
Page | ii
defines a high contrast apical response directly over the 66 Zone, which is the gold-rich part of the Mt. Milligan
deposits.
In summary, surface disturbance has significantly downgraded the effectiveness of most of the chemical extractions
tested in this study. Nevertheless, results indicate that the Ah and upper B horizons are the most appropriate sample
media and that aqua regia is the favoured digestion method, which is consistent with the outcomes of the Kwanika
study. Poor element responses for just about all of the extractions are attributable to destruction of the soil profile
over the mineralization. Nevertheless, SGH and the ratio of weak extraction Ca to aqua regia Ca, accurately locate
the position of the mineralization through the cover.

GEOSCIENCE BC REPORT 2010-08
Page | iii
TABLE OF CONTENTS Executive Summary ........................................................................................................................................................i
1. Introduction and Objectives ................................................................................................................................... 1
Objectives .................................................................................................................................................................. 2
Benefits to the Mining Industry ................................................................................................................................. 2
2. Location and Access .............................................................................................................................................. 2
3. Geology and Exploration History .......................................................................................................................... 3
Regional Setting ........................................................................................................................................................ 3
Local Geology ........................................................................................................................................................... 4
Lithology ............................................................................................................................................................... 4
Alteration ............................................................................................................................................................... 6
Structure ................................................................................................................................................................ 6
Resources ............................................................................................................................................................... 6
Exploration History ................................................................................................................................................... 6
4. Surficial environment ............................................................................................................................................ 8
5. Field Methods ...................................................................................................................................................... 11
Sampling Procedures ............................................................................................................................................... 11
Soil pH and conductivity measurements.................................................................................................................. 14
Quality Control ........................................................................................................................................................ 14
6. Laboratory Methods ............................................................................................................................................ 14
Sample Preparation .................................................................................................................................................. 14
Digestions and Analyses .......................................................................................................................................... 16
7. Results ................................................................................................................................................................. 17
Data Quality ............................................................................................................................................................. 17
Soil pH and conductivity ..................................................................................................................................... 18
Partial and selective extractions ........................................................................................................................... 18
Soil Gas Hydrocarbons (SGH) ............................................................................................................................ 22
Soil pH and Conductivity Results ............................................................................................................................ 25
Aqua Regia Analyses ............................................................................................................................................... 27
Responses down the soil profile .......................................................................................................................... 30
Responses along sample lines. ............................................................................................................................. 32
Partial and selective extractions ............................................................................................................................... 40
Data processing.................................................................................................................................................... 41
Element responses ............................................................................................................................................... 41
Analytical results ................................................................................................................................................. 41

GEOSCIENCE BC REPORT 2010-08
Page | iv
The ratio of weak extraction calcium to aqua regia calcium ............................................................................... 52
Gold Methods ...................................................................................................................................................... 54
Soil Gas Hydrocarbons ........................................................................................................................................ 55
8. Discussion ............................................................................................................................................................ 58
Effectiveness of conventional soil geochemistry ................................................................................................. 60
Responses in the Ah horizon ............................................................................................................................... 61
Effectiveness of partial and selective extractions. ............................................................................................... 62
9. Conclusions ......................................................................................................................................................... 64
10. Acknowledgements ........................................................................................................................................ 65
12. References ...................................................................................................................................................... 66
LIST OF FIGURES Figure 1. Location of the study area (map courtesy of Terrane Metals Corp.) .............................................................. 3 Figure 2. Regional geological setting (map courtesy of Terrane Metals Corp.). ........................................................... 4 Figure 3. Local geology map showing lithology, major structures, sample sites and the proposed open pit outlines
(map courtesy of Terrane Metals Corp.). ....................................................................................................................... 5 Figure 4. Surficial geology of the study area (after Ricker, 1991): Points indicate sample locations for this study and
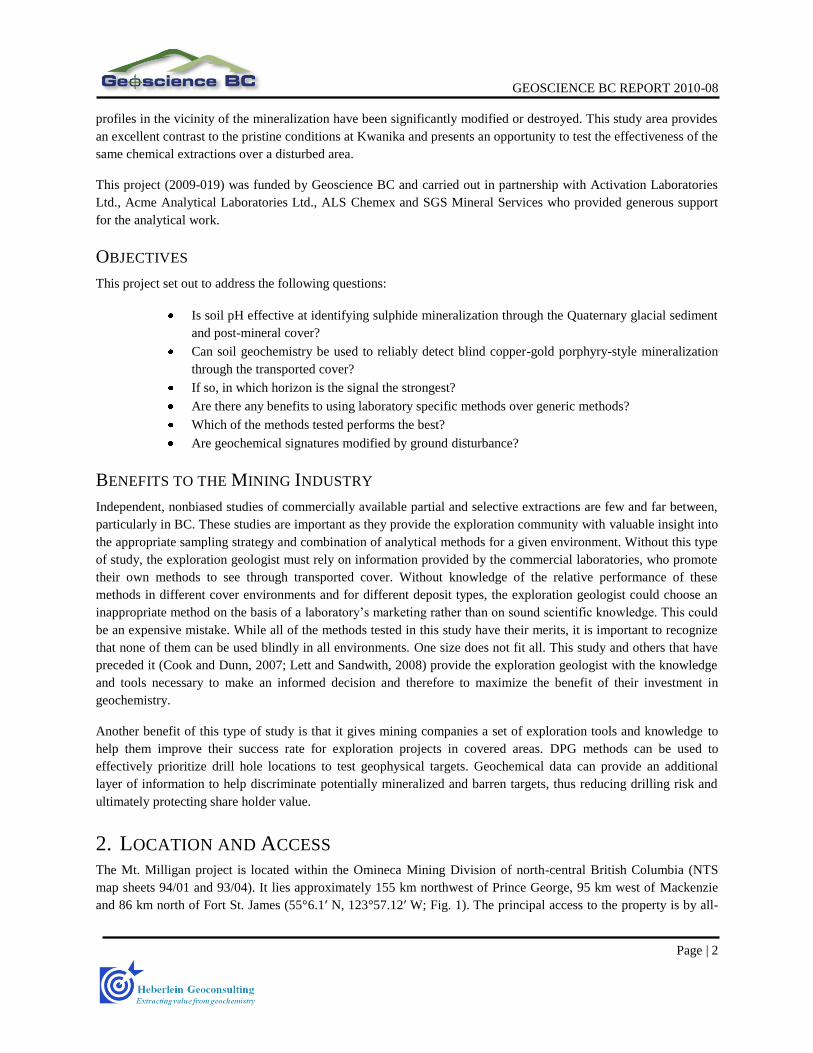
green outlines the limits of the mineral deposits. .......................................................................................................... 9 Figure 5. A typical podzol profile from the MBX Zone. ............................................................................................. 10 Figure 6. View looking southeast over the 66 Zone illustrating modification of the surface by drilling activities. .... 11 Figure 7. A long section across the sample traverse showing grade distribution, overburden thickness (olive), major
structures and sample locations ................................................................................................................................... 12 Figure 8. A Summary of sampling and analytical methods used in this study ............................................................ 13 Figure 9. Average RSD% values for lighter compounds. Green dashed line indicates average RSD% value for hole
duplicates. Blue dashed line indicates average RSD% value for site duplicates. ....................................................... 23 Figure 10. Average RSD% values for heavier compounds. Green dashed line indicates average RSD% value for
hole duplicates. Blue dashed line indicates average RSD% value for site duplicates. ............................................... 24 Figure 11. Profiles over the MBX, WBX and 66 zones (red outlines) at Mt. Milligan, British Columbia: a)
conductivity; b) hydrogen ion concentration; c) acidified hydrogen ion concentration; d) inverse difference between
the acidified and non-acidified hydrogen ion concentration (IDH). Profiles are of response ratios after data levelling
to account for overburden type. Refer to Figure 4 for geology legend. ....................................................................... 27 Figure 12. Box and Whisker plots for selected elements, Aqua regia analyses. Abbreviations: Ah = Ah Horizon;
UB=upper B horizon; LB=lower B horizon. ............................................................................................................... 31 Figure 13. Aqua regia results for copper in different soil horizons. ............................................................................ 33 Figure 14. Aqua regia results for molybdenum in different soil horizons. .................................................................. 33 Figure 15. Aqua regia results for silver in different soil horizons. .............................................................................. 34 Figure 16. Aqua regia results for lead in different soil horizons ................................................................................. 34 Figure 17. Aqua regia results for zinc in different soil horizons ................................................................................. 35 Figure 18. Aqua regia results for arsenic in different soil horizons ............................................................................. 35 Figure 19. Aqua regia results for antimony in different soil horizons ......................................................................... 36 Figure 20. Aqua regia results for iron in different soil horizons .................................................................................. 36 Figure 21. Aqua regia results for manganese in different soil horizons ...................................................................... 37 Figure 22. Aqua regia results for tungsten in different soil horizons. .......................................................................... 38

GEOSCIENCE BC REPORT 2010-08
Page | v
Figure 23. Aqua regia results for uranium in different soil horizons. .......................................................................... 38 Figure 24. Aqua regia results for bismuth in different soil horizons. .......................................................................... 39 Figure 25. Aqua regia results for mercury in different soil horizons. .......................................................................... 39 Figure 26. Aqua regia results for calcium in different soil horizons. .......................................................................... 40 Figure 27. Selective and partial extraction results for copper: A. Generic extraction methods. B. Laboratory specific
extraction methods. ...................................................................................................................................................... 42 Figure 28. Selective and partial extraction results for molybdenum. A. Generic extraction methods. B. Laboratory
specific extraction methods. ........................................................................................................................................ 43 Figure 29. Selective and partial extraction results for arsenic. A. Generic extraction methods. B. Laboratory specific
extraction methods. ...................................................................................................................................................... 44 Figure 30. Selective and partial extraction results for antimony. A. Generic extraction methods. B. Laboratory
specific extraction methods. ........................................................................................................................................ 45 Figure 31. Selective and partial extraction results for tungsten. A. Generic extraction methods. B. Laboratory
specific extraction methods. ........................................................................................................................................ 46 Figure 32. Selective and partial extraction results for uranium. A. Generic extraction methods. B. Laboratory
specific extraction methods. ........................................................................................................................................ 47 Figure 33. Selective and partial extraction results for tungsten. A. Generic extraction methods. B. Laboratory
specific extraction methods. ........................................................................................................................................ 48 Figure 34. Selective and partial extraction results for zinc. A. Generic extraction methods. B. Laboratory specific
extraction methods. ...................................................................................................................................................... 49 Figure 35. Selective and partial extraction results for silver: A. Generic extraction methods. B. Laboratory specific
extraction methods. ...................................................................................................................................................... 50 Figure 36. Selective and partial extraction results for calcium: A. Generic extraction methods. B. Laboratory
specific extraction methods. ........................................................................................................................................ 51 Figure 37. Ratio of weak extraction calcium to aqua regia calcium: A. Generic extraction methods. B. Laboratory
specific extraction methods. Note for EL and BL the ratio of weak leach strontium/aqua regia strontium has been
used. ............................................................................................................................................................................. 53 Figure 38. Gold results: A. Generic extraction methods. B. Laboratory specific extraction methods. C. Fire assay
results. .......................................................................................................................................................................... 55 Figure 39. SGH Results – Copper pathfinder class map: Red outlines represent the limits of the proposed open pits.
Black dashed lines highlight the position of the main intrusions associated with the mineralization. ........................ 57 Figure 40. SGH Results – Gold pathfinder class map: Red outlines represent the limits of the proposed open pits.
Black dashed lines highlight the position of the main intrusions associated with the mineralization. ........................ 58 Figure 41. IDH, SGH and weak extraction calcium to aqua regia calcium ratio. ........................................................ 60 Figure 42. Selected ore and pathfinder element responses in upper B horizon aqua regia digestion. ......................... 61 Figure 43. Selected ore and pathfindere element responses in Ah horizon aqua regia digestion. ............................... 61 Figure 44. New soil profile exposed in a road cut. The original profile has been disrupted or removed during clear
cut logging activities .................................................................................................................................................... 62 Figure 45. An example of a buried soil profile. The original surface lies beneath 60cm of bulldozed material. Note
the beginnings of a new profile at the current surface. ................................................................................................ 62
LIST OF TABLES Table 1. Average RSD% values for soil pH and conductivity measurements. ............................................................ 18 Table 2. Average RSD% values for hole duplicates. ................................................................................................... 20 Table 3. Average RSD% Values for site duplicates. ................................................................................................... 21 Table 4. Summary statistics for soil pH and conductivity measurements ................................................................... 26

GEOSCIENCE BC REPORT 2010-08
Page | vi
Table 5. Summary statistics for Ah horizon aqua regia analyses. ............................................................................... 28 Table 6. Summary statistics for upper B horizon aqua regia analyses. ........................................................................ 29 Table 7. Summary statistics for lower B horizon aqua regia analyses. ........................................................................ 29 Table 8. Summary statistics for C horizon aqua regia analyses. .................................................................................. 30 Table 9. Summary statistics for Gold methods. ........................................................................................................... 54 Table 10. Summary of results for the methods tested .................................................................................................. 63
LIST OF APPENDICES (SEPARATE) Appendix 1 Summary Statistics, analytical methods and detection limits.
Appendix 2 Quality control.
Appendix 3 Correlation matrices for aqua regia analyses.
Appendix 4 Field data.
Appendix 5 Analytical results.

GEOSCIENCE BC REPORT 2010-08
Page | 1
1. INTRODUCTION AND OBJECTIVES Exploration geochemistry in British Columbia has up to now relied on traditional methods, such as stream sediment
and soil geochemistry, to detect metals dispersed mechanically and hydromorphically from outcropping sources.
These methods have proven to be highly effective and there has been a long and impressive history of discoveries
using them. As exploration maturity increases, however, mining companies are faced with the challenge of
exploring more and more in areas of transported cover where traditional geochemical methods are less effective.
Much of the central interior of British Columbia is covered by an extensive blanket of glacially derived sediments
that completely masks the underlying bedrock. In order to deal with this cover, government, industry and academic
institutions have invested heavily in developing airborne and ground geophysical methods to see through the exotic
overburden. Unfortunately, geochemical exploration has not evolved as rapidly, despite the availability of a wide
range of partial and selective extractions provided by the commercial laboratories. Reasons for this are varied and
range from a general lack of understanding by the exploration community of the use and interpretation of these
methods to skepticism about their effectiveness. It is only through well documented, nonbiased, comparative field
testing of these methods that the exploration community can gain the knowledge and confidence to apply deep-
penetrating geochemistry (DPG) to routine exploration programs.
There are relatively few examples of comprehensive comparative studies of DPG methods in BC. Cook and Dunn
(2007) evaluated a number of partial leach methods over the 3T‟s epithermal Au-Ag prospect. They showed that B-
horizon soils were more suitable than C-horizon tills for detailed geochemical sampling. Of the methods tested, they
concluded that Mobile Metal Ion (MMI®) and Enzyme Leach
TM produced superior contrast responses to
conventional aqua-regia digestion, although the latter method did detect mineralization in areas of thin cover. Lett
and Sandwith (2008) carried out soil orientation surveys to test the effectiveness of a variety of selective and partial
extraction methods at the Mouse Mountain, Shilo Lake and Soda Creek properties in the area of Quesnel and
Williams Lake. Their study found that the most anomalous Cu and Au values, reflecting blind Cu-Au
mineralization, occur in the C and lower B horizons with an aqua-regia digestion. A discussion of the performance
of the various partial and selective extraction methods is still in preparation at the time of writing.
Outside BC, there have been a number of important studies of DPG in a variety of climatic and physiographic
environments. Perhaps the landmark study has been the Deep Penetrating Geochemistry project, carried out by the
Canadian Mining Industry Research Organization (CAMIRO). This study was funded by 26 mining companies, the
Ontario Geological Survey and Geological Survey of Canada. Phase I considered movements of elements and ions
from buried mineral deposits and nuclear waste facilities in arid and semi-arid environments. It showed that metals
and ions can be transported to the surface by advective transport in gases and ground waters (Cameron et al., 2002)
and can be effectively detected by partial-extraction methods. In Phase II, a variety of test sites in arid, semi-arid and
temperate boreal forest environments were studied (Hamilton et al, 2001a, b). It was found that in all environments
partial- and selective-extraction anomalies were detected in soils above buried mineralization (Cameron et al., 2004)
and in some cases through appreciable thickness of complex transported cover.
This is the second and final report for a Geoscience BC funded study carried out by the author to test the
effectiveness of a variety of commonly used geochemical extractions on soil samples over blind porphyry copper-
gold style mineralization. The first study, which was released as Geoscience BC Report 2010-3 (Heberlein and
Samson, 2010) was completed over the Kwanika porphyry copper-gold prospect in north-central BC. Kwanika
represents an early stage project with a defined mineral resource where the original surface and soil profiles are well
preserved. It provides a good test for the different methods in a real exploration context. Mt. Milligan, on the other
hand (the subject of this report) is an advanced project, currently in the pre-development stages. The surficial
environment has been extensively modified by clear-cut logging and drilling activities over the last 25 years and soil
GEOSCIENCE BC REPORT 2010-08
Page | 2
profiles in the vicinity of the mineralization have been significantly modified or destroyed. This study area provides
an excellent contrast to the pristine conditions at Kwanika and presents an opportunity to test the effectiveness of the
same chemical extractions over a disturbed area.
This project (2009-019) was funded by Geoscience BC and carried out in partnership with Activation Laboratories
Ltd., Acme Analytical Laboratories Ltd., ALS Chemex and SGS Mineral Services who provided generous support
for the analytical work.
OBJECTIVES
This project set out to address the following questions:
Is soil pH effective at identifying sulphide mineralization through the Quaternary glacial sediment
and post-mineral cover?
Can soil geochemistry be used to reliably detect blind copper-gold porphyry-style mineralization
through the transported cover?
If so, in which horizon is the signal the strongest?
Are there any benefits to using laboratory specific methods over generic methods?
Which of the methods tested performs the best?
Are geochemical signatures modified by ground disturbance?
BENEFITS TO THE MINING INDUSTRY
Independent, nonbiased studies of commercially available partial and selective extractions are few and far between,
particularly in BC. These studies are important as they provide the exploration community with valuable insight into
the appropriate sampling strategy and combination of analytical methods for a given environment. Without this type
of study, the exploration geologist must rely on information provided by the commercial laboratories, who promote
their own methods to see through transported cover. Without knowledge of the relative performance of these
methods in different cover environments and for different deposit types, the exploration geologist could choose an
inappropriate method on the basis of a laboratory‟s marketing rather than on sound scientific knowledge. This could
be an expensive mistake. While all of the methods tested in this study have their merits, it is important to recognize
that none of them can be used blindly in all environments. One size does not fit all. This study and others that have
preceded it (Cook and Dunn, 2007; Lett and Sandwith, 2008) provide the exploration geologist with the knowledge
and tools necessary to make an informed decision and therefore to maximize the benefit of their investment in
geochemistry.
Another benefit of this type of study is that it gives mining companies a set of exploration tools and knowledge to
help them improve their success rate for exploration projects in covered areas. DPG methods can be used to
effectively prioritize drill hole locations to test geophysical targets. Geochemical data can provide an additional
layer of information to help discriminate potentially mineralized and barren targets, thus reducing drilling risk and
ultimately protecting share holder value.
2. LOCATION AND ACCESS The Mt. Milligan project is located within the Omineca Mining Division of north-central British Columbia (NTS
map sheets 94/01 and 93/04). It lies approximately 155 km northwest of Prince George, 95 km west of Mackenzie
and 86 km north of Fort St. James (55°6.1′ N, 123°57.12′ W; Fig. 1). The principal access to the property is by all-

GEOSCIENCE BC REPORT 2010-08
Page | 3
weather Forest Service roads from Mackenzie or by a longer and less maintained logging road from Fort St. James.
The property, which is owned by Terrane Metals Corp., includes 80 contiguous mineral claims.
Figure 1. Location of the study area (map courtesy of Terrane Metals Corp.)
3. GEOLOGY AND EXPLORATION HISTORY
REGIONAL SETTING
The Mt. Milligan porphyry deposits (Panteleyev, 1995; DeLong, 1996 and Jago, 2008) lies in the northern part of
the Quesnel Terrane, or Quesnel Trough, which consists of a northwest-trending, 1300 km long belt of Late Triassic
to Early Jurassic sedimentary, volcanic and coeval intrusive rocks that extend from the US border in the south to the
almost Yukon border in the north. Quesnellia is sandwiched between highly deformed Proterozoic and Paleozoic
strata of the Slide Mountain Terrane to the east and deformed Upper Paleozoic strata of the Cache Creek Terrane to
the west (Garnett, 1978; Fig. 2). In the Mt. Milligan area, these rocks are assigned to the Takla Group, which
consists of a lower sedimentary succession comprised of the Inzana and Rainbow Creek Formations; and an upper
volcanic and volcaniclastic sequence dominated by augite-phyric basalts and andesites of calc-alkaline to
shoshonitic composition comprising the Witch Lake and Chuchi Formations. The reader is referred to Nelson et al.
(1991, 1992) and Nelson and Bellafontaine (1996) for detailed descriptions of these units. The Takla Group is
interpreted to be part of an island arc assemblage that formed within the Quesnellia-Stikinia oceanic island arc
superterrane between 210 and 180 Ma (Jago, 2008). The Mt. Milligan intrusions themselves are dated at 183 to 182
Ma (Ghosh, 1992), which is contemporaneous with the accretion of Quesnellia with ancestral North America (186-
181 Ma - Murphy et al., 1995; Nixon, 1995). This makes the Mt. Milligan intrusions the final gasp in the island arc
plutonism.

GEOSCIENCE BC REPORT 2010-08
Page | 4
Figure 2. Regional geological setting (map courtesy of Terrane Metals Corp.).
LOCAL GEOLOGY
LITHOLOGY
Much of the deposit area is underlain by volcanic rocks of the Witch Lake Formation (Fig. 3). These consist of a
northeast-dipping sequence of inter-layered coherent and fragmental, augite-phyric basaltic-trachyandesites (Jago,
2008). Close to the MBX stock and 66 Zone, these grade into paler coloured trachyandesites that have slightly
higher silica and alkali contents and a well-developed trachytic texture. These rocks have previously been described

GEOSCIENCE BC REPORT 2010-08
Page | 5
as augite porphyritic lapilli tuffs with minor augite crystals and lithic tuff with minor augite porphyritic flows, flow
breccias and heterolithic debris flows (Heberlein et al., 1984, Rebagliati et al., 1988; Sketchley et al., 1995; and
DeLong, 1996).
At least two levels of „trachyte‟: the Upper and Lower Trachyte, have been mapped within the Witch Lake
Formation to the south of the MBX stock (purple – Fig. 3). These units are so named because of their distinctive
trachytic texture rather than their chemical composition. Compositionally they plot as tephrophonolites (Jago, 2008)
but could be also be potassically altered trachyandesites.
Figure 3. Local geology map showing lithology, major structures, sample sites and the proposed open pit outlines (map courtesy of
Terrane Metals Corp.).
There are several intrusions in the deposit area. The largest is the MBX stock (Fig. 3), which consists of a circular-
shaped body approximately 400 metres in diameter. It is a composite intrusion, consisting of three distinct phases
ranging in composition from quartz monzonite to monzodiorite. All three varieties are plagioclase porphyritic.
Protruding from the southern and eastern edges of the MBX stock is the Rainbow Dyke. This monzodiorite body
consists of an east-dipping stratiform sill with a distinctive curvi-linear form. It has a characteristic crowded

GEOSCIENCE BC REPORT 2010-08
Page | 6
plagioclase porphyry texture and close to its contacts contains abundant „gravel‟ size monzonite xenoliths (Jago,
2008).
The Southern Star stock, is located south-southwest of the MBX stock and Rainbow Dyke. It is a moderately west-
dipping, northwest striking tabular body that has a distinctive fork at its north end (Sketchley et al., 1995).
Compositionally it is similar to the MBX stock, consisting of crowded plagioclase porphyry.
In addition to the larger intrusions, there are a large number of smaller stocks and dykes that cut the MBX and
Southern Star deposits. Three different suites of dykes have been mapped: trachyte, monzonite and diorite. Trachyte
dykes represent the earliest set. These are most common in the southwest part of the MBX stock and in the northern
part of Southern Star. They range from 1 to 15 metres wide and generally strike northeast. Monzonite dykes are later
than the trachyte dykes and intrude throughout the MBX and Southern Star area. They can reach 10 metres in width
and strike northeast with a moderate westerly dip. Youngest are the diorite dykes, which are prevalent in the
northern part of the MBX stock. These strike northwest and dip steely northeast.
ALTERATION
Copper-gold mineralization at Mt. Milligan is associated with an early potassic-propylitic alteration event. At the
MBX and Southern Star stocks, potassic alteration is concentrated around the intrusion margins (Sketchley et al.,
1994). It decreases in intensity in towards the core of the intrusions as well as outwards where it grades into
propylitic alteration. Dominant alteration minerals in the potassic zone are hydrothermal K-feldspar and biotite.
Magnetite is also abundant in the margins of the MBX stock, where it is associated with higher grade copper
mineralization. Hydrothermal biotite is prevalent in the trachyandesites close to the intrusions, where it forms
pervasive replacement of the groundmass. It also occurs as envelopes on K-feldspar veinlets in the volcanic units.
Sodic-calcic (albite-actinolite-epidote) alteration overprints the outer margin of the potassic zone and grades
outwards to inner and outer propylitic alteration. Highest copper and gold grades occur where albitization of the
potassic zone is strongest. A phyllic alteration consisting of carbonate-sericite-pyrite occurs within the distal parts of
the Rainbow Dyke as well as along structural zones overprinting the potassic alteration.
STRUCTURE
Several generations of faults cut the Mt. Milligan deposits (Sketchley et al., 1995). The earliest are represented by
north striking, shallow east-dipping bedding parallel faults such as the Rainbow Fault (Fig. 3). Also north-striking is
the Great Eastern Fault, which is likely a branch of the regionally important Manson-MacLoed Lake fault system.
This structure forms a 150 metre wide fault zone that truncates the MBX and 66 Zone alteration and mineralization
to the east and juxtaposes younger Tertiary volcanic and sedimentary rocks against the Takla Group. East and east-
northeast faults are represented by the Oliver Fault that limits the alteration and mineralization to the north.
RESOURCES
Potentially exploitable mineralization is localized in three main deposits: MBX (including the WBX Zone – copper
gold-rich), the 66 Zone (gold-rich) and Southern Star (copper gold-rich). Together these mineralized bodies
constitute a resource (measured and indicated) of 590.8 million tonnes at 0.193% Cu and 0.352 g/t Au (Mills, 2008).
EXPLORATION HISTORY
Exploration in the study area dates back to 1937 when prospector George Snell discovered gold bearing float with
gold values up to 148.8 g/t on the western slopes of Mt. Milligan. The source of the float was never located.
Following the war, there was no exploration activity until 1972 when Pechiney Development Ltd. staked the
Mosquito 1-10 two-post claims in the Heidi Lake area. Pechiney carried out an IP survey and soil geochemistry on

GEOSCIENCE BC REPORT 2010-08
Page | 7
the slopes north of the lake that resulted in a five hole diamond drilling program. Results were unfavourable and the
claims were allowed to expire.
Selection Trust Inc. (Selco) started to explore the area again in 1983 and soon after their merger with BP Resources
Canada Limited (BP) in 1984 staked the Phil 1-12 claims over Heidi Lake. At the same time, prospector Richard
Haslinger staked the Heidi claims on the adjoining ground to the east to cover two newly discovered copper
showings known as the Creek and Boundary zones. BP optioned the Haslinger claims and proceeded to stake a
sizable land position, the Phil 21-29 claims, covering the area between Heidi and Mitzi lakes and the plains
immediately to the east. Over the course of the 1985 and 1986 field seasons BP carried out an aggressive exploration
program that included mapping, grid soil sampling, lithogeochemistry, ground magnetic and IP surveys.
In 1986 BP made a strategic decision to pull out of the mining sector and the property was optioned to Lincoln
Resources Inc. In September 1987, Lincoln undertook a diamond drilling program that resulted in the discovery of
significant copper-gold mineralization on the slopes southeast of Heidi Lake. This mineralization now forms part of
the Southern Star deposit. Low-grade porphyry style mineralization was also discovered at the North Slope and
Goldmark zones by the same drilling program. In July 1988, Lincoln reorganized to become United Lincoln
Resources Inc. and soon after staked the Milligan, Rainbow 1-4 and Skud claims as well as the MBX 1-13 placer
claims. In August 1988 Continental Gold Corp. acquired 64% of the shares of United Lincoln and in March 1989 the
two companies merged.
Drilling by the new Continental Gold Corp. in the summer of 1989 discovered further copper and gold
mineralization at the Main zone (now MBX and 66 zones). In September 1990, Placer Dome purchased from BP its
share of the Phil and Heidi mineral claims and subsequently launched a successful takeover of Continental, thereby
consolidating ownership of the Mt. Milligan property. Drilling resumed in November 1990 and by April 1991 had
outlined sufficient resources to publish a Stage 1 development report. Unfortunately the low metal prices at the time
rendered the low grade mineralization uneconomic and Placer Dome was forced to take a write down on the carried
value in the project.
Mt. Milligan lay dormant until 1996 when Placer Dome re-evaluated the project and investigated a variety of mining
and development scenarios. A new resource model was developed and test pits excavated to obtain additional
geotechnical information. An economic re-evaluation was completed in 1998. This work included re-logging of drill
core to investigate an apparent discrepancy in grades between angle and vertical drill holes.
In 2003, Mining Solutions consultants completed an external review of the existing Mt. Milligan data including
Placer Dome‟s proprietary hydrometallurgy process. Recommendations from this study resulted in a number of
activities during the summer of 2004 to further assess the project. These included compilation of all historical data
into a GIS, alteration studies on archived pulps using an ASD spectrometer and a 14 hole drilling program to
provide samples for additional metallurgical testing. A new 3D geological model was constructed to provide a more
robust geological model for an updated resource estimation.
Over the period of 1984 to 2004, Placer Dome and other companies completed over 900 drill holes totalling over
200,000 metres to define the resources. Following Barrick Gold Corp‟s takeover of Placer Dome in April 2006 and
the acquisition of Placer‟s Canadian assets by Goldcorp, Atlas Cromwell Corp. purchased a 100% interest in the
project. In July 2006, Atlas Cromwell changed its name to Terrane Metals Corp. and immediately initiated a
metallurgical drilling program and new feasibility study. A preliminary economic assessment completed in October,
2007 identified „Mineable Resources‟ of 317 million tonnes at a grade of 0.22% Cu and 0.43 g/t Au (Terrane news
release, October 16th
, 2007). In September 2009, Terrane received its mining permit from the British Columbia
government and in December Federal government approval of its Environmental Assessment.

GEOSCIENCE BC REPORT 2010-08
Page | 8
4. SURFICIAL ENVIRONMENT The MBX and 66 zones lie on the eastern slopes of a northwest-trending ridge of hills, which rises 300–500 m above
the elevation of the surrounding plains. The highest point at 1508 m is the summit of Mt. Milligan itself, which lies
at the northwestern end of the ridge. Drainage patterns along the ridge are dendritic, becoming anastomosing on the
surrounding plains where glacially fed, short, meandering streams connect pothole lakes, ponds and swamps (Gravel
and Sibbick, 1991). In the vicinity of the mineral deposits, the ridge is divided by a steeply incised east-west valley
occupied by Heidi Lake, which drains east into King Richard Creek (Fig. 4).
Quaternary geology mapping by Kerr and Bobrowsky (1991) and Ricker (1991) identified a variety of surficial
sediments in the study area (Fig. 4). Colluvium derived from tills and bedrock dominates the flanks of the hills to the
north and west of the MBX–66 Zone area. Away from the hills, the landscape is blanketed by a veneer of glacial till,
which is overlain by a highly variable and complex sequence of glaciofluvial sand and gravel deposits containing
cobble- and boulder-rich layers. These deposits form a fan-like feature originating at Heidi Lake and spreading out
over the MBX–66 Zone area to the east (Fig. 5). Drilling and surface mapping has shown that the cover thickness is
highly variable, ranging from less than 1 m over parts of the MBX Zone to several tens of metres in the King
Richard creek valley, suggesting significant paleotopographic relief on the pre-Quaternary surface (Kerr and
Bobrowsky, 1991).
Soils developed on the glaciofluvial deposits are predominantly Orthic Humo-Ferric Podzols1. They typically have a
thin organic layer made up of a 1–2 cm thick LFH horizon composed of partially decomposed twigs, needles and
moss, which overlies a thin (0.5–2 cm) Ah horizon comprised of decomposed organic matter. The organic-rich
layers sit on top of a sandy textured, white, grey or pinkish eluviated Ae horizon or Aej horizon (a thin,
discontinuous or barely discernable eluviated Ae horizon), which may vary from absent to over 10 cm in thickness.
A strongly illuviated, red-orange, iron-rich Bf horizon is commonly found beneath the Ae and in some places
exceeds 15 cm in thickness. This horizon tends to have a fine silty or silty-clay texture. Bf horizon grades
downwards over a few centimetres into a medium to olive brown Bm (an undifferentiated, uniform-coloured B
horizon) or transitional BC horizon. Depth to the C horizon may vary from 25 cm over colluvium to 70 cm on sand
and gravel deposits. A typical Podzol profile from Mt. Milligan is illustrated in Figure 5.
Organic soils and rare brunisol profiles are also present in the survey area. These tend to occur in or adjacent to
boggy areas in drainage channels, particularly to the north of the MBX deposit (Fig. 4). These profile types make up
a very small proportion of the sampled sites.
Widespread surface disturbance from drill access roads, drill pads and logging activities has resulted in either
complete destruction or burial of the original soil profile over large parts of the study area. As much of the area was
clear-cut logged in the 1980‟s, original tree species are restricted to small enclaves between disturbed areas, water
courses or steep slopes. White spruce and lodgepole pine are the dominant species on the well drained flats east of
Heidi Lake. In the creek valleys, black spruce, balsam poplar and trembling aspen are common. In the clear-cut
areas, vegetation is dominated by pioneer shrub species like mountain alder and willow, which form dense thickets
between the drill roads. Figure 6 shows a typical disturbed area at the 66 Zone.
1 Canadian System of Soil Classification

GEOSCIENCE BC REPORT 2010-08
Page | 9
Figure 4. Surficial geology of the study area (after Ricker, 1991): Points indicate sample locations for this study and green outlines the
limits of the mineral deposits.

GEOSCIENCE BC REPORT 2010-08
Page | 10
Figure 5. A typical podzol profile from the MBX Zone.
GEOSCIENCE BC REPORT 2010-08
Page | 11
Figure 6. View looking southeast over the 66 Zone illustrating modification of the surface by drilling activities.
5. FIELD METHODS
SAMPLING PROCEDURES
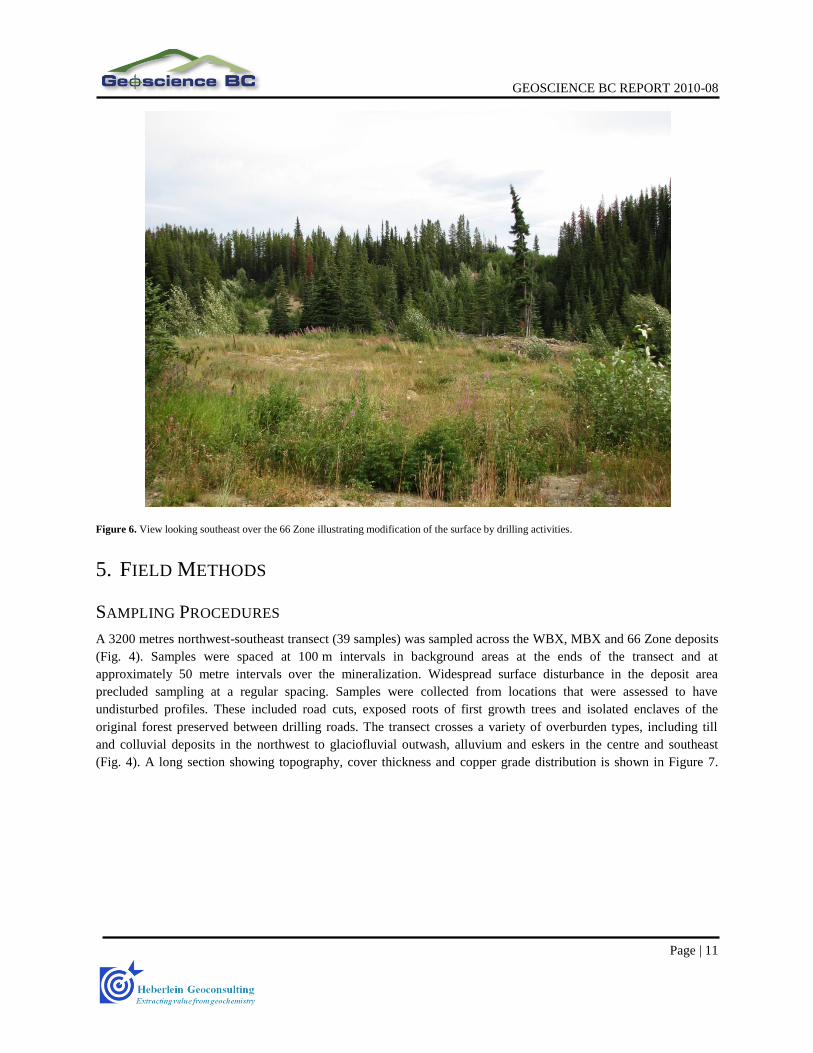
A 3200 metres northwest-southeast transect (39 samples) was sampled across the WBX, MBX and 66 Zone deposits
(Fig. 4). Samples were spaced at 100 m intervals in background areas at the ends of the transect and at
approximately 50 metre intervals over the mineralization. Widespread surface disturbance in the deposit area
precluded sampling at a regular spacing. Samples were collected from locations that were assessed to have
undisturbed profiles. These included road cuts, exposed roots of first growth trees and isolated enclaves of the
original forest preserved between drilling roads. The transect crosses a variety of overburden types, including till
and colluvial deposits in the northwest to glaciofluvial outwash, alluvium and eskers in the centre and southeast
(Fig. 4). A long section showing topography, cover thickness and copper grade distribution is shown in Figure 7.

Figure 7. A long section across the sample traverse showing grade distribution, overburden thickness (olive), major structures and sample locations

GEOSCIENCE BC REPORT 2010-08
Page | 13
At each site a 50 by 50 centimetre hole was excavated down to the C horizon to expose the complete soil profile.
Each hole was photographed and described using a geochemical coding form and codes proposed by Hoffman
(1986), along with the details of the immediate area. Parameters recorded include colour, texture, abundance and
shape of coarse fragments, dampness and profile type. A variety of samples were collected from each sample hole as
summarized in Figure 8. Five samples were taken from the upper B horizon and one each from the Ah, lower B and
C. Ah samples were collected from several spots around the sample site but not from the hole itself. This was done
to avoid contamination from excavated material and to ensure enough sample material was collected. Sampling was
done by hand by peeling back the surface layer of mosses and undecomposed organic matter and sampling the black
decomposed material at the mineral soil interface. The sample was placed into a Hubco™ polyweave sample bag to
allow it to breath and to prevent decomposition prior to arrival at the laboratory.
Upper B, lower B and C horizon samples were collected in the same way. Material was taken from the sides of the
hole using a trowel and screened to -12 mesh onto a plastic sheet to remove rock fragments and organic debris.
Approximately 500 grams of this material was placed in breathable Hubco™ polyweave sample bags. Where soil
moisture precluded screening, rocks and other coarse debris was removed from the sample by hand. MMI samples
were collected using the SGS Minerals Services recommended protocol. Material was taken from a continuous
vertical interval from 10 to 25 centimetres below the base of the organic layer using a plastic scoop. A composite of
approximately 350 grams was collected and sealed in heavy duty Ziploc bags. At most localities, this constant depth
interval corresponds to a mixture of upper B (Bf or Bm) and lower B (BC) horizons. Finally, samples for pH and
conductivity measurements were collected from the top centimetre of the mineral soil, located immediately beneath
the organic Ah layer. Approximately 100 grams of this material, usually from the leached Ae horizon, was collected
and sealed in Ziploc bags for analysis at the camp the same day.
Figure 8. A Summary of sampling and analytical methods used in this study

GEOSCIENCE BC REPORT 2010-08
Page | 14
SOIL PH AND CONDUCTIVITY MEASUREMENTS
A description of the soil pH and conductivity survey over the Kwanika Central Zone is included in Heberlein
(2010). Conductivity measurements were made on a 1:1 slurry of soil in demineralized water using a VWR
International conductivity meter. pH readings were taken on the same slurry using an Oakton® Instruments double
junction pHTestr® 30 handheld pH meter. The instrument was calibrated daily using standard pH buffer solutions at
pH 4.00, 7.00 and 10.00. Two pH measurements were taken on each sample: one 20 seconds after immersion of the
electrode into the slurry and a second measurement 20 seconds after adding one drop of 10% hydrochloric acid and
stirring. pH readings were recorded into an Excel spreadsheet and converted to H+ concentrations for interpretation.
QUALITY CONTROL
Quality control (QC) measures used in this study include the collection of two types of field duplicates. In each
survey area, five sites (about 10%) were randomly selected for field duplicate sampling. Two types of duplicates
were collected at these sites: within-hole and between-hole duplicates. Within-hole duplicates are a repetition of the
original sampling procedure, collecting another soil sample from the cleaned walls of the soil pit. Between-hole
duplicates are taken from a second hole dug as close to the original as possible, usually within 2 metres. All
duplicate samples were submitted blind to the laboratory.
No standard reference materials were used. The reason for this is the unavailability of suitable matrix-matched
standards for the range of sample media collected that are certified for the methods being tested. In order to monitor
and mitigate analytical drift, the samples were randomized prior to submission to the laboratory. Randomization has
the benefit of distributing the effects of instrumental drift randomly throughout the sample population. It also allows
for drift monitoring by plotting the samples in analytical order.
In addition to the field QC procedures, a number of steps were taken at the laboratories to ensure the quality of the
analytical results. These include the introduction of analytical standards, blanks and lab duplicates into the sample
stream.
6. LABORATORY METHODS
SAMPLE PREPARATION
Soil samples were shipped to four different commercial laboratories for a variety of analyses. Ah horizon samples
were processed at Acme Analytical Laboratories in Vancouver, where they were air dried at 35 to 40 °C and milled
prior to leaching with sodium pyrophosphate and digested with aqua regia. Loss on Ignition (LOI) was also carried
out on these samples to measure the organic carbon content.
Upper B, lower B and C horizon samples sent to SGS Minerals Services in Toronto for conventional aqua regia
digestion and 30g fire assay were prepared by drying at 105 °C, disaggregating and screening to -0.18mm. MMI
samples, also analyzed at SGS, were air dried at <60 °C but otherwise received no other preparation prior to
leaching. Upper B horizon samples for hot and cold Hydroxylamine Hydrochloride extraction and Supertrace gold
analyses were prepared at ALS-Chemex in Vancouver by air drying at <60 °C and screening to -0.18 mm. A second
upper B horizon sample was shipped directly to ALS-Chemex in Perth, Australia without preparation. There the
sample was split and one half screened to <0.18 mm for cold aqua regia digestion and the other half leach leached
whole by Ionic Leach.

GEOSCIENCE BC REPORT 2010-08
Page | 15
Upper B horizon samples sent to Activation Laboratories (Actlabs) in Ancaster, Ontario for Bioleach, Enzyme
Leach and Soil Gas Hydrocarbons (SGH). There the samples were air dried and screened to <0.23mm for Enzyme
Leach and 0.18mm for Bioleach. Preparation of samples for SGH is a proprietary method of Actlabs Ltd.

GEOSCIENCE BC REPORT 2010-08
Page | 16
DIGESTIONS AND ANALYSES
Analyses carried out at the four laboratories included a variety of generic and laboratory specific2 partial and
selective extractions (Table 1). Laboratory specific extractions included Enzyme leach (EL), Bioleach (BL) Ionic
leach (IL) and MMI-M (MMI). In addition, SGH was performed by Activation Laboratories using their proprietary
method (Sutherland, 2009).
Several low detection limit gold methods were employed in this study. These include ALS-Chemex‟s Supertrace
(ST) gold method (0.2 ppb detection limit), MMI (0.1 ppb detection limit), Acme Laboratories‟ Ultratrace gold (0.2
ppb detection limit), ALS-Chemex‟s Ionic Leach (0.02 ppb Detection limit) and Cold aqua regia (1 ppb detection
limit). In addition to these, conventional fire assay-AAS analyses were carried out on upper B, lower B and C
horizon samples (1 ppb detection limit).
The following is a brief description of the analytical methods employed in this study. A list of methods and their
corresponding detection limits is included in Appendix 1.
Aqua regia (SGS Code ICM14B): This method is a traditional aqua regia digestion using a 3:1 combination
of HCl:HNO3 on a 15 gram sample aliquot of the <0.18mm fraction. Analyses for 52 elements are by a
combination of ICP-OES and ICP-MS.
Aqua Regia (Acme Code 1F05): This is a modified aqua regia digestion utilizing a 1:1:1 HCl:HNO3:H2O
combination to achieve ultra low detection limits for many elements. Analysis for 53 elements is carried
out on a 15 gram aliquot of the <0.18mm fraction using the Perkin Elmer Elan 6000 or 9000 ICP-MS to
resolve very low concentrations.
Cold aqua regia (CAR - ALS-Chemex Code ME-MS41b): This variant of the aqua regia digestion uses a
conventional 3:1 combination of HCl:HNO3 at room temperature (25°C). The digestion is carried out on a
0.5 gram aliquot of the <0.18 mm fraction and analysis for 51 elements is by a combination of ICP-OES
and ICP-MS. Cold aqua regia is considered to be a less aggressive leach than conventional aqua regia and
is able to extract the most leachable components from the sample, including fine grained gold particles. The
extraction is non selective.
Supertrace Gold (ST - ALS-Chemex Code Au-ST43): This method uses a conventional aqua regia
digestion on a 25 gram aliquot of the <0.18mm fraction. The dissolved gold is complexed with dibutyl
sulphide and extracted into an organic solvent. The gold is determined by Zeeman graphite furnace AAS.
Cold Hydroxylamine Hydrochloride (CHDX - ALS-Chemex Codes ME-MS05): Cold hydroxylamine
hydrochloride leach is selective for manganese oxides (also dissolving a small amount of amorphous
hydrous iron oxide). It is useful for liberating metal ions adsorbed onto manganese oxide coatings on
mineral grains in the soil. The method uses a 1.0 gram aliquot of <0.18mm fraction and mixes it with 20ml
of 0.1M hydroxylamine hydrochloride in 0.01M HNO3. The sampled is rolled for two hours at room
temperature. The final solution is separated by centrifuging and the supernatant fluid is decanted. Analysis
for 51 elements is by ICP-MS. The final solution pH is also measured.
Hot Hydroxylamine Hydrochloride (HHDX - ALS-Chemex Code ME-MS06): This method is more
aggressive than the cold leach and is used to decompose amorphous hydrous iron (and manganese) oxides.
A 1.0 gram sample of the <0.18mm fraction is mixed with 20ml of 0.25M hydroxylamine hydrochloride (in
0.25M HCl) and digested in a hot water bath at 60°C for two hours. The supernatant fluid is separated and
analysed for 51 elements by ICP-MS. Final solution pH is also measured.
2 These are proprietary or non proprietary methods specific to individual laboratories.

GEOSCIENCE BC REPORT 2010-08
Page | 17
Sodium pyrophosphate (SPY - Acme Code 1SLO): This leach is used to extract elements adsorbed by
humic and fulvic compounds in organic rich soils. A 1.0 gram sample of milled organic material (Ah
horizon) is mixed with 25ml of a neutral (pH 7) 0.1M sodium pyrophosphate solution and rolled for one
hour at room temperature. The final solution is centrifuged and the supernatant fluid decanted and analyzed
for 58 elements by ICP-MS.
Distilled water (DI - Acme Code 1SLW): Leaching with distilled water was carried out on a 1.0 gram
aliquot of <0.18 mm sample. The sample was mixed with 10ml of distilled water and rolled for two hours
at room temperature. Analysis of the supernatant fluid for 33 elements was done by ICP-MS.
Ionic Leach (IL - ALS-Chemex Code ME-MS23): This is a new partial leach developed by ALS-Chemex
to detect subtle variations in trace element concentrations in soils caused by ionic dispersion from
underlying mineralization. The method uses a sodium cyanide leach buffered to pH 8.5 and containing
chelating agents ammonium chloride, citric acid and EDTA to liberate weakly bound ions from particle
surfaces. The leach is carried out on a 50g aliquot of <0.18mm fraction. Samples are agitated every two
hours for six hours at 21°C. The final solution is centrifuged and the fluid decanted for analysis for 58
elements by ICP-MS.
Enzyme Leach (EL - Actlabs Code 7): This is a selective leach method that targets amorphous manganese
and iron oxide grain coatings in the soil. A 0.75 gram sample of <0.23mm fraction is leached in a solution
containing glucose oxidaze and dextrose at 30°C for one hour. The enzyme reacts with the glucose to
produce a weak hydrogen peroxide solution, which reduces and dissolves amorphous iron and manganese
oxides. Released metals become complexed with the gluconic acid reaction product. Solutions are analyzed
on a Perkin Elmer ELAN 6000, 6100 or 9000 ICP-MS.
Bioleach (BL - Actlabs): A proprietary selective leach designed to liberate metals from bacterial protein
remnants in the soil. A 0.75g aliquot of -0.18mm upper B horizon material is leached for 1 hour at 30 °C.
Solutions are analyzed on a Perkin Elmer ELAN 6000, 6100 or 9000 ICP-MS.
SGH (SGH - Actlabs): This proprietary method extracts organic compounds adsorbed onto particles in the
soil B horizon. It provides highly sensitive analysis of 162 organic compounds in the C5-C17 range using
gas chromatography/mass spectrometry (GC/MS). Analysis utilizes a very weak leach to liberate the
hydrocarbons from the sample. They are then separated using high capillary column gas chromatography.
Together with Bioleach (see above) this method is designed to detect near surface redox variations present
above deeply buried sulphide mineralization and hydrocarbons produced directly from the sulphide source
as a result of bacterial activity.
MMI-M (MMI - SGS Minerals Services): MMI-M is a proprietary method designed to liberate weakly
bound elements from the soil either by desorption or dissolution. The extraction uses strong ligands to bind
released metal ions and keep them in solution. Analysis of the leacheate is done by low detection limit ICP-
MS.
7. RESULTS
DATA QUALITY
For the purpose of this report, data quality is assessed using average percent relative standard deviation (also known
as the % coefficient of variation), or average RSD% as an estimate of precision or reproducibility of the analytical
results. Average RSD% is estimated using the results of the field duplicates (for both hole and site duplicates) and
can therefore be considered an estimate of the cumulative uncertainty of the sampling and analytical process. Field
duplicate results provide important information about the homogeneity of the sample medium and the

GEOSCIENCE BC REPORT 2010-08
Page | 18
representativeness of the sampling method employed. Through the use of site duplicates the within-site variability
can also be assessed.
Average RSD% is determined from the duplicate results by first calculating the mean and standard deviation of each
duplicate pair. An RSD% value is then calculated for each duplicate pair using the formula:
RSD% = (standard deviation/mean) x 100
The average RSD% is then determined by averaging the RSD% values for the duplicate pairs. This has been done
for soil pH and conductivity measurements and a selection of elements for each analytical method. A spreadsheet
with the calculations is included in Appendix 2. In the following discussions, average RSD% values below 30% are
considered to indicate very good data quality; between 30 and 50%, moderate quality and over 50%, poor quality.
The higher an average RSD% value is, the less likely it is to be able distinguish a real patterns from noise. Noise is
considered as the cumulative effect of geological background variation plus sampling error.
SOIL PH AND CONDUCTIVITY
Table 2 shows the results of the field duplicate samples for soil pH and conductivity measurements. Values for the
pH and acidified pH are below 5% indicating that the results are highly reproducible and that the data is of a very
high quality. It is interesting to note that the RSD% values for the between-hole (site) duplicates are actually slightly
lower than for the within-hole (hole) duplicates. The reason for this is unclear. These results show that there is little
variation in the soil pH values over distances of a few metres from a sample site.
Table 1. Average RSD% values for soil pH and conductivity measurements.
pH pH
(Acid)
Conductivity
Hole Duplicate 4.62% 5.69% 23.71%
Site Duplicate 4.31% 3.09% 19.85%
Conductivity measurements have a higher uncertainty than the pH measurements with average RSD% values of
23.71% for hole duplicates and 19.85% for site duplicates. This is still within an acceptable range. Once again the
between-hole values are marginally lower than those from the same hole; an observation that is not easily explained.
PARTIAL AND SELECTIVE EXTRACTIONS
Average RSD% values for selected elements from the partial and selective extractions are presented in Tables 3 and
4. Values have been classified to reflect data quality, with black signifying good quality (RSD% <30%), green
acceptable quality (RSD% >30 and < 50%) and red marginal quality (RSD% >50%).
Table 3 shows the average RSD% values for the hole duplicate samples. The majority of elements show either good
or acceptable quality for most methods. Several elements however, exhibit poor quality for some extractions. The
most notable of these is gold, which has unacceptably high average RSD% values for upper B horizon aqua regia
(84.85%), Ah horizon aqua regia (93.86%), and IL (52.59%). A value of 119.66% for C horizon aqua regia means
that gold values for this digestion are essentially random numbers. Poor gold precision in the aqua regia digestions
may be attributable to a nugget effect caused by the presence of detrital gold particles in the glaciofluvial sediments.
Of the individual methods, SPY has the poorest overall precision with an average RSD% value of 44.6%. Four of
the 18 elements (Bi, Ca, Cu and Mn) reporting values above the detection limit have average RSD% values over
50%. IL has four elements (Au, Cd, Mo and Zn) with unacceptable RSD% values. Methods with the lowest RSD%

GEOSCIENCE BC REPORT 2010-08
Page | 19
values, or better precision, are the aqua regia digestions, HHDX, CHDX and EL. These all have RSD% values of
less than 30%.
Results for the site duplicates are summarized in Table 4. As with the hole duplicates, the majority of elements are
of either good or acceptable quality. A notable exception is manganese, which has RSD% values of over 50% for
eight of the 12 methods tested. Zinc results are also quite poor with six of the methods having unacceptable quality.
Six methods report gold values above detection limit for the field duplicates. Of these, MMI and SPY have
unacceptable data quality. Ah horizon aqua regia has a RSD% of 103.67% meaning that the gold values for this
method are not usable.
Precision of individual methods is quite variable. Average values indicate either good or acceptably quality. Poorest
overall data quality is shown by BL (47.20%), SPY (43.72%) and MMI (42.42%). Aqua regia (UB, LB, and C
horizons) has the best overall reproducibility between adjacent sample holes. Precisions for this method are
consistently below 20%. These results show that the lowest RSD% values, or the best precisions, are produced by
the stronger digestions, which extract higher concentrations of these elements from the sample. Weaker extractions
that extract significantly lower concentrations have poorer precisions, which is no big surprise.

GEOSCIENCE BC REPORT 2010-03
Page | 20
Table 2. Average RSD% values for hole duplicates.
Abbreviations: na – not analyzed; bdl – below detection limit; CHDX – Cold Hydroxylamine Hydrochloride; HHDX - Hot Hydroxylamine Hydrochloride; AR-
AH – Aqua Regia – Ah horizon; CAR; Cold Aqua Regia; SPY- Sodium Pyrophosphate; DI – Deionised Water; AR-UB – Aqua Regia – Upper B Horizon; AR-
LB – Aqua Regia – Lower B Horizon; AR-C – Aqua Regia – C Horizon; BL – Bioleach; EL – Enzyme Leach; IL – Ionic Leach; MMI – Mobile Metal Ions
(MMI-M).
Black – Good quality; Green – Acceptable Quality; Red – Unacceptable Quality.

GEOSCIENCE BC REPORT 2010-03
Page | 21
Table 3. Average RSD% Values for site duplicates.
Abbreviations: na – not analyzed; bdl – below detection limit; CHDX – Cold Hydroxylamine Hydrochloride; HHDX - Hot Hydroxylamine Hydrochloride; AR-
AH – Aqua Regia – Ah horizon; CAR; Cold Aqua Regia; SPY- Sodium Pyrophosphate; DI – Deionised Water; AR-UB – Aqua Regia – Upper B Horizon; AR-
LB – Aqua Regia – Lower B Horizon; AR-C – Aqua Regia – C Horizon; BL – Bioleach; EL – Enzyme Leach; IL – Ionic Leach; MMI – Mobile Metal Ions
(MMI-M).
Black – Good quality; Green – Acceptable Quality; Red – Unacceptable Quality.

GEOSCIENCE BC REPORT 2010-03
Page | 22
SOIL GAS HYDROCARBONS (SGH)
Field duplicate results for the SGH method are summarized in Figures 9 and 10. Only 36 of the 162 compounds
report values above the detection limit. Average RSD% values for the lighter compounds are presented in Figure 9.
The bar chart shows that for most compounds, values for site duplicates fall below a RSD% of 20% with average
values of 15.64% for the hole duplicates (green dashed line) and 14.37 for the site duplicates (blue dashed line),
which confirms good reproducibility. Three compounds, namely 004LA, 008LA and 026LBA have much higher
RSD% values of between 37% and 62% for the hole duplicates and 28% to 58% for the site duplicates. The reason
why these specific compounds have poorer precisions is unclear. Overall, the precision for the lighter compounds is
good.
Results for the heavier compounds are shown in Figure 10. RSD% values are generally lower than those of the
lighter compounds, with the majority falling between 5 and 17%. Average values are 14.24% for the hole duplicates
and 9.48% for the site duplicates. Heavier compounds generally display higher concentrations, which may explain
the slightly lower RSD% values. Only one compound, 150 HPH, has a value 30% and this is only for the site
duplicate; the corresponding hole duplicate has an RSD% value of 19%. The overall reproducibility for the heavier
compounds is considered to be good.

GEOSCIENCE BC REPORT 2010-03
Page | 23
Figure 9. Average RSD% values for lighter compounds. Green dashed line indicates average RSD% value for hole duplicates. Blue
dashed line indicates average RSD% value for site duplicates.

GEOSCIENCE BC REPORT 2010-03
Page | 24
Figure 10. Average RSD% values for heavier compounds. Green dashed line indicates average RSD% value for hole duplicates. Blue
dashed line indicates average RSD% value for site duplicates.

GEOSCIENCE BC REPORT 2010-03
Page | 25
SOIL PH AND CONDUCTIVITY RESULTS
There is a growing body of evidence to indicate that variations in soil pH, or hydrogen ion (H+) concentration, occur
at the surface over buried sulphide mineralization. Smee (1983) proposed a mechanism, based on laboratory
experiments and field tests, for the formation of metal anomalies in soils developed on glaciolacustrine clays over
massive sulphides in the Abitibi Belt, northern Quebec. His work showed that H+ released as a byproduct of
sulphide oxidation at the water table diffuses to the surface to form detectable acidic anomalies, and that pH
sensitive elements like Ca, Sr, Mg, Fe and Mn in a boreal forest environment (i.e., slightly oxidizing to reducing)
become redistributed in response to the pH shift.
Smee (1997, 1998) proposed a similar model for ion transport and indirect anomaly formation for arid
environments. Results from a multi-company sponsored orientation survey at the Marigold gold deposit in Nevada
(Smee, 1998) showed that Ca concentration, in all weak leaches tested, displayed a distinctive rabbit-ear or double-
peak response with the peaks occurring over the edges of the mineralization. The ratio of weak leach Ca (e.g., acetic
acid or hydroxylamine HCl) to aqua-regia digested Ca showed clear residual anomalies with the same rabbit-ear
form and proposed that two forms of Ca exist in the soil; one of which is easily soluble and spatially related to
mineralization and a second less soluble form, which represents background carbonate. Smee (1999) concluded that
near-surface Ca over oxidizing mineralization is being remobilized in response to the upward movement of H+.
Reprecipitation of Ca (carbonate) occurs where pH conditions permit, in other words over the edges of the sulphide
body.
More recent work by Hamilton et al. (2004 a, b) at the Marsh zone gold prospect and the Cross Lake volcanogenic
massive sulphide (VMS) prospect in Ontario showed that similar rabbit-ear patterns occur in H+ at the surface,
above the edges of mineralization. They concluded that pH correlates with oxidation-reduction potential (ORP) and
proposed that H+
production is a function of the redox conditions in the overburden column. In an earlier paper,
Hamilton (1998) proposed the existence of reduced columns or chimneys in the overburden column above a reduced
metal source. Reduction of the overburden column is postulated to occur as a result of upward migration of reduced
anionic species between the top of a conductive body and the ground surface. Charge is transferred by the reaction
with oxidized cationic species migrating in the other direction. This process results in the formation of an oxidation
front that propagates to the surface to form a chimney or column. Within the reduced core of the chimney, oxidation
of the underlying mineralization is inhibited thus limiting the amount of H+ released. At the edges, however,
oxidation is enhanced thus promoting H+ accumulation at the surface over the edges of the underlying
mineralization. This process results in a typical rabbit-ear response for H+, with a pronounced central low over the
reduced chimney, from samples collected at the very top of the mineral soil profile.
Inverse Difference Hydrogen (IDH) values were also calculated using Smee‟s (2009) method. Summary statistics
for the pH and conductivity measurements are presented in Table 4.

GEOSCIENCE BC REPORT 2010-03
Page | 26
Table 4. Summary statistics for soil pH and conductivity measurements
Conductivity (µS/cm) pH Acidified pH
N 39 39 39
Min 5.2 4.41 2.96
Max 30.3 7.66 5.52
Range 25.1 3.25 2.56
Mean 12.58 5.15 3.50
StdDev 5.13 0.66 0.60
Var 26.32 0.43 0.36
Sum 490.6 200.75 136.51
SumSq 7171.48 1049.6947 491.6409
Median 12.1 5.01 3.27
Mode 12.1 4.46 3.15
Soil pH and conductivity measurements were collected using the same procedures employed at Kwanika (Heberlein
and Samson, 2010). Results of the soil EC and pH measurements are shown in Figure 11. EC measurements (Fig.
11a) display little contrast between background and mineralized areas. Most of the variation appears to be noise. The
only exception being a very subtle peak (2.05 times the background levels) located over the northwestern boundary
of the MBX Zone. This feature is barely distinguishable from background values.
Hydrogen ion concentrations (Fig. 11b) also display a very low contrast. A subtle, double-peak feature (six and three
times the background levels) occurs immediately adjacent to the northwestern boundary of the WBX Zone. There is
no corresponding peak on the southeastern boundary of the 66 Zone, where values are indistinguishable from
background levels. A more robust response occurs in the acidified H+ profile (Fig. 11c). Again, the profile is
asymmetrical, with the highest values (5.8 times the background levels) occurring adjacent to the WBX Zone with
no identifiable response on the southeastern boundary of the 66 Zone.
The asymmetry of the pH response is highlighted by the IDH profile (Fig. 11d). A high-contrast, double-peak
feature (39 and 17 times the background levels) can clearly be seen adjacent to the northwestern boundary of the
WBX Zone. The peaks show an antithetic relationship with the H+
profile, strongly suggesting that they are caused
by carbonate remobilization in response to changes in the H+ concentration. Once again there is a lack of a
corresponding feature on the southeastern boundary of the 66 Zone.

GEOSCIENCE BC REPORT 2010-03
Page | 27
Figure 11. Profiles over the MBX, WBX and 66 zones (red outlines) at Mt. Milligan, British Columbia: a) conductivity; b) hydrogen ion
concentration; c) acidified hydrogen ion concentration; d) inverse difference between the acidified and non-acidified hydrogen ion
concentration (IDH). Profiles are of response ratios after data levelling to account for overburden type. Refer to Figure 4 for geology
legend.
AQUA REGIA ANALYSES
This study is designed to compare the effectiveness of a variety of geochemical methods at detecting mineralization
located at different depths from the surface. This is done in two ways: a) by comparing the responses of single
elements across a range of extraction methods, and b) by comparing performance of a single extraction at various
depths in the soil profile. This section presents the results of aqua regia analyses carried out on Ah, upper B, lower B
and C horizons. An aqua regia digestion on upper B horizon soil is considered to be the traditional method for soil
geochemistry in British Columbia and as such provides a good baseline for assessing the performance of other
extraction methods. Aqua regia digestion of the Ah horizon samples was done at Acme Analytical Laboratories in
Vancouver using their 1F15 package. Digestion and analysis of the upper B, lower B and C horizons was completed
by SGS Minerals Services in Toronto using their ICM14B package. There are differences in the two aqua regia

GEOSCIENCE BC REPORT 2010-03
Page | 28
methods, which may have an impact on the interpretation of metal distributions through the soil profile discussed
below. Comparative statistics for selected elements in each soil horizon are presented in Tables 5 to 8.
Table 5. Summary statistics for Ah horizon aqua regia analyses.

GEOSCIENCE BC REPORT 2010-03
Page | 29
Table 6. Summary statistics for upper B horizon aqua regia analyses.
Table 7. Summary statistics for lower B horizon aqua regia analyses.

GEOSCIENCE BC REPORT 2010-03
Page | 30
Table 8. Summary statistics for C horizon aqua regia analyses.
RESPONSES DOWN THE SOIL PROFILE
Figure 12 shows box and whisker plots for a selection of ore and pathfinder elements. It is clear from these plots that
each element behaves differently down the soil profile and that there is no zone of preferential enrichment for ore or
pathfinder elements. The ore elements copper and molybdenum have quite similar trends. They both display a
progressive increase in values from the Ah horizon to the C horizon. There is no enrichment in the upper B horizon
as one might expect, despite the presence of visible iron and manganese enriched Bf horizons at many sample
localities. Iron and manganese also fail to show enrichment in the upper B horizon. Iron appears to be depleted in
the organic-rich Ah horizon but has a more or less even distribution between the upper B, lower B and C horizons.
Manganese on the other hand appears to be enriched in the Ah horizon with a subtle trend to increasing
concentrations from the upper B to C horizons.
Zinc and cobalt patterns mimic that of iron with lowest values in the Ah horizon and progressively higher values
through the upper B, lower B and C horizons. Arsenic also has its lowest concentrations in the Ah horizon but below
in the B and C horizons concentrations are relatively constant. Outlier values indicate that the maximum
concentrations are present in the C horizon.
Antimony and bismuth show very subtle increases with depth in the profile. These are manifest as a slight increase
in median values from the upper B to C horizons. Maximum concentrations for these elements, as indicated by the
outliers, occur in the upper B and lower B horizons respectively.
Silver shows little variation through the soil profile as median values for each of the horizons are very close. Highest
values indicated by the upper quartile and outliers occur in the lowest parts of the profile in the lower B and C
horizons.
Maximum concentrations for mercury are present in the Ah horizon suggesting the presence of organic-mercury
compounds. Lowest values occur in the upper B horizon and progressively higher concentrations present in the
lower B and C horizons.

GEOSCIENCE BC REPORT 2010-03
Page | 31
Figure 12. Box and Whisker plots for selected elements, Aqua regia analyses. Abbreviations: Ah = Ah Horizon; UB=upper B horizon; LB=lower B horizon.

GEOSCIENCE BC REPORT 2010-08
Page | 32
RESPONSES ALONG SAMPLE LINES
The previous section illustrates how element concentrations vary between different soil horizons. Results show that
for aqua regia, no single horizon is appropriate for all elements and that the geochemical signal from blind
mineralization will most likely vary in contrast and element combinations depending on the horizon sampled. This
section compares the aqua regia responses from each horizon, along the sample transect over the Mt. Milligan
deposit. On the following figures, the red bar on the X-axis represents the surface projection of the mineralization as
defined by drill hole information. References to the mineralization in the following descriptions refer this surface
projection.
Figures 13 to 23 illustrate the aqua regia results for selected elements from the four sampled soil horizon. Results are
plotted as response ratio (RR) profiles after correction for overburden type. Corrections were done by categorizing
samples on the basis of their overburden type (i.e. subcrop, colluvium, till blanket, glaciofluvial sediments etc.) and
then calculating response ratios using the median of the lower quartile for each overburden category. This procedure
removes background shifts from the results caused by variations in overburden. Results are displayed for Ah (Red),
upper B (orange), lower B (green) and C (blue) horizons.
COPPER Results for copper are shown in Figure 13. In general the background levels for all four horizons are reasonable flat,
defined by RR values of less than 3. A moderate to high contrast response is present over the WBX Zone in the Ah,
Upper B and C horizon samples. This feature is strongest in the C horizon (blue) where is reaches a maximum
contrast of 21 response ratio units. Peaks for Ah and upper B samples have similar contrasts of 16 response ratio
units (RR<16). The anomaly is defined by two adjacent samples. A less well defined response is present in the lower
B results (green) where a single peak anomaly is offset slightly to the west of the Ah, upper B and C horizon peaks.
Lower B is the only soil horizon with an apparent response over the MBX Zone. This single sample feature is of low
contrast (RR<8) and should be regarded as a low confidence result. None of the soil horizons detect the 66 Zone.
Anomalous copper values in the Ah horizon to the west of WBX Zone do not appear to be directly related to
mineralization. One anomalous site (the westernmost) lies near a break of slope and two anomalous samples to the
east are from organic-rich soils in a drainage channel. Their elevated responses are likely caused by hydromorphic
dispersion and concentration in a seepage zone and organic material in the drainage. A possible source is low grade
mineralization or elevated background in the Takla Group andesites higher on the hill to the northwest.
MOLYBDENUM Results for molybdenum are illustrated in Figure 14. Aqua regia does not produce a credible response in any of the
sampled soil horizons over the MBX or the 66 zones. Profiles are flat with subtle variations between 1 and 4 RR.
This is interpreted to represent background. Only one sample exceeds an RR value of 5. This occurs in the C horizon
on the west side of the 66 Zone. As this feature is a single sample peak, it is not considered to be significant and may
possibly be part of the background variation. Its location adjacent to the 66 Zone may be coincidental.

GEOSCIENCE BC REPORT 2010-08
Page | 33
Figure 13. Aqua regia results for copper in different soil horizons.
Figure 14. Aqua regia results for molybdenum in different soil horizons.
SILVER Like molybdenum, silver does not exhibit any convincing responses to the mineralization in any of the soil horizons.
Variations are interpreted to represent background noise. Maximum values for upper B (RR=9) and C horizons
(RR=7) occur just west of the WBX Zone in the vicinity of the above mentioned drainage channel and likely
represent weak hydromorphic anomalies.

GEOSCIENCE BC REPORT 2010-08
Page | 34
Figure 15. Aqua regia results for silver in different soil horizons.
LEAD AND ZINC Results for lead and zinc are shown in Figures 16 and 17. Lead shows almost no contrast for any soil horizons.
Values range between 1 and 2 RR, which represents background variation. There is a low contrast, single sample
feature over the 66 Zone that appears in the lower B (5 RR) and C horizon (3RR) results. This is not considered to
be a credible response to the underlying mineralization.
Figure 16. Aqua regia results for lead in different soil horizons
Zinc displays a similar lack of contrast to lead as illustrated in Figure 16. Values for all four soil horizons are
consistently below 3 RR. Slightly elevated values (<4 RR) in the Ah results immediately southeast of the 66 Zone
coincide with the King Richard Creek valley and are interpreted to represent hydromorphic dispersion from the
nearby mineralization however there is no response directly over the mineralization.

GEOSCIENCE BC REPORT 2010-08
Page | 35
Figure 17. Aqua regia results for zinc in different soil horizons
ARSENIC AND ANTIMONY
Arsenic and antimony results are shown in Figures 18 and 19. Neither of these elements responds to the
mineralization in any of the soil horizons. Highest arsenic values (Fig. 18) occur in the Ah horizon but there is little
spatial coincidence between the highs and the mineralization. The maximum value (10 RR) occurs in the drainage to
the northwest of the WBX Zone. Slightly elevated values (7 and 5) also occur at the northwest limit of the WBX
Zone and over the barren area in the middle of the deposit but are impossible to distinguish from background
variation. Values for the upper B, lower B and C horizon samples are very low, generally between 1 and 3 RR.
Figure 18. Aqua regia results for arsenic in different soil horizons
Antimony (Fig. 19) behaves in much the same way as arsenic but with even lower contrast. Values for all four soil
horizons vary between 1 and 4 RR, which are considered to be background levels. There is no response over the
mineralization.

GEOSCIENCE BC REPORT 2010-08
Page | 36
Figure 19. Aqua regia results for antimony in different soil horizons
IRON AND MANGANESE Profiles for iron and manganese are very flat across the transect. Iron (Fig. 20) has very flat background values
(RR=1) for upper B, lower B and C horizon samples over much of the line. Very subtle areas of elevated RR values
are present over the WBX Zone and 66 Zone. Although very low contrast (<5 RR), these features are probably
genuine responses to the mineralization. Similar values are not present in the background area at the northwest end
of the transect although slightly elevated values occur near the southeast end of the transect. Higher values occur in
the Ah horizon, where background values fluctuate between 1 and 6 RR. In this case there is no distinction between
values over mineralization and in background areas.
Figure 20. Aqua regia results for iron in different soil horizons
Patterns for manganese (Fig. 21) are less clear. As with iron, upper B, lower B and C horizon results have very low
contrast with individual values varying between 1 and 4 RR. For manganese, there are no clear anomalies over
mineralization. Manganese appears to be significantly concentrated in the organic-rich Ah horizon where many
samples have RR values between 10 and 20. Some of the high values lie close to drainages, suggesting that they

GEOSCIENCE BC REPORT 2010-08
Page | 37
may represent hydromorphic concentration of manganese. Elevated values in the Ah horizon also occur over
mineralization but they are not considered to be credible anomalies as similar features also occur in background
areas particularly at the northwest end of the line.
Figure 21. Aqua regia results for manganese in different soil horizons
TUNGSTEN AND URANIUM Tungsten (Fig. 22) has highest values in the upper B horizon. Maximum values occur in the Ah horizon where peaks
of 10 and 6 RR coincide with drainages southeast of the 66 Zone and northwest of the WBX Zone. Over the rest of
the transect, tungsten values fluctuate between 1 and 4 RR and do not show any spatial coincidence of higher values
with mineralization.
The only potentially significant anomaly occurs in the upper B horizon where a two sample peak with maximum
values of 15 RR occurs over the gap between the 66 Zone and MBX Zone. The highest value falls quite close to the
surface projection of the Rainbow Fault (Fig. 3).
Uranium results (Fig. 23) show very little contrast. For the B and C horizon samples, values vary between 1 and 2
RR with no enrichment over the mineralization. Again, highest RR values occur in the Ah horizon where peaks of
between 4 and 12 RR occur close to drainages and on the colluvium covered hillside northwest of the WBX Zone.
Over the mineralization itself, values are essentially flat (RR=2).

GEOSCIENCE BC REPORT 2010-08
Page | 38
Figure 22. Aqua regia results for tungsten in different soil horizons.
Figure 23. Aqua regia results for uranium in different soil horizons.
BISMUTH AND MERCURY Results for bismuth (Fig. 24) appear to show low contrast responses to the mineralization in some of the soil
horizons. The most compelling response is present in the upper B horizon over the 66 Zone, where a single sample
anomaly reaching 35 RR occurs directly over the mineralization. More subtle responses are present in the Ah and
lower B horizon results, which have peak values of 6 and 5 RR respectively. Interestingly neither the Ah, upper B or
lower B horizons define anomalies over the MBX Zone. In the C horizon (blue) however, there is a very low
contrast (RR<7), multi-sample anomaly over the WBX Zone.

GEOSCIENCE BC REPORT 2010-08
Page | 39
Figure 24. Aqua regia results for bismuth in different soil horizons.
Mercury results are much less clear as illustrated in Figure 25. All four horizons display quite noisy profiles with
values fluctuating between 1 and 4 RR. Higher peaks are present in the upper B horizon, which has elevated values
bracketing the northwest margin of the WBX Zone and between the MBX and 66 zones. The latter has the highest
contrast with an RR value of 20. Elevated values up to 10 RR also occur over non-mineralized background near the
southeast end of the transect. In the C horizon, there is a moderate contrast peak (14 RR) near the southeast end of
the line but over mineralization the profile is essentially flat. It cannot be concluded with any degree of confidence
that these features truly reflect the mineralization or whether they represent random patterns in background. One
possibility is that aqua regia is digesting detrital cinnabar grains within the glaciofluvial sediments.
Figure 25. Aqua regia results for mercury in different soil horizons.
CALCIUM Variations in calcium are illustrated in Figure 26. For all soil horizons values are extremely flat. For the upper B,
lower B and C horizons RR values range between 1 and 2 with no evidence of higher concentrations over the

GEOSCIENCE BC REPORT 2010-08
Page | 40
mineralization. Ah horizon results appear to show a low contrast response. This has a rabbit-ear form bracketing the
MBX mineralization. Contrast of this feature is so low (RR<5) that it has to be considered as a low confidence
anomaly.
Figure 26. Aqua regia results for calcium in different soil horizons.
Overall the results of the aqua regia digestions performed on the different soil horizons are very poor. No elements
define unequivocal anomalies that loyally reflect the position of the underlying mineralization. Several elements
such as copper, zinc, manganese, arsenic, uranium and tungsten appear to show hydromorphic anomalies close to
drainages and at the break in slope immediately northwest of the WBX Zone. These are likely indirect responses to
the mineralization resulting from mobilization of trace elements in ground water and reprecipitation in organic-rich
soils close to creeks.
PARTIAL AND SELECTIVE EXTRACTIONS
Partial and selective extractions are designed to detect subtle variations in trace element concentrations caused by
the exogenic signal. This is the proportion of the total element concentration that is added to the soil in water soluble
(ionic) or gaseous form. It typically comprises a very small percentage of the total metal content. The far greater
proportion of elements comes from primary and secondary minerals that constitute the soil itself. This is known as
the endogenic signal. Cations and anions derived from buried mineralization and other sources are captured by a
variety of mechanisms (e.g. adsorption, co-precipitation, ion exchange, chelation etc.) in different trap sites in the
soil profile (Cameron et al., 2004). Depending on the Eh and pH conditions of the surficial environment, these may
include secondary minerals such as amorphous iron and manganese oxides, hydroxides, clays, carbonates and
organic matter. Partial and selective extractions work by liberating these weakly bound ions into solution, either by
dissolving target minerals containing a high proportion of the exogenic phase (selective extraction), or by liberating
labile metals from all phases in the sample through a weak acid attack or ion exchange (non-selective or partial
extraction).
Contrast between the exogenic and endogenic signal is a function of extraction strength. Stronger leaches like aqua
regia dissolve a higher proportion of primary and secondary minerals (endogenic component) than weaker
extractions. This can overwhelm the exogenic signal and is the reason why aqua regia is often ineffective at defining
bedrock derived geochemical signatures in soils developed on transported overburden. Weaker extractions liberate

GEOSCIENCE BC REPORT 2010-08
Page | 41
only the most labile components without attacking the soil minerals themselves. Patterns defined by these methods
can accurately reflect both ionic signals from underlying bedrock and hydromorphic dispersion along faults and
seepages caused by ground water movement. Patterns produced from selective extractions are strongly influenced by
the abundance of the target mineral phase. For example results for a cold hydroxylamine hydrochloride extraction
are influenced by the abundance of amorphous manganese oxide present in the sample. In order to reveal the true
exogenic signal, results must be corrected for the concentration of the target phase or controlling variable (Smee,
1983). This is done by correcting for the aqua regia concentration of the controlling variable (e.g. aqua regia Mn for
cold hydroxylamine hydrochloride). Without applying a correction and just plotting raw values or response ratios of
raw values, important patterns can be missed.
DATA PROCESSING
In order to prepare the partial and selective extraction results for interpretation a number of steps were taken.
Analytical results were first merged with the sample location information using Geosoft‟s Target™ Geochemistry
software. During the loading procedure, the software automatically replaces less than detection limit symbols (< and
-) with a value equal to half the detection limit. Next, results for field and analytical duplicates were extracted from
the dataset for QAQC evaluation. The completed dataset was then validated to ensure that sample locations were
correct and that no merging errors had occurred. For the selective extractions the following corrections were applied
to the data:
Sodium pyrophosphate results were corrected for organic carbon content by normalizing to LOI. While
not a true organic carbon determination, LOI is a reasonable substitute for organic carbon in organic
rich soils.
Cold hydroxylamine hydrochloride results were corrected for aqua regia manganese.
Hot hydroxylamine hydrochloride results were corrected for aqua regia iron and manganese.
The final step in the procedure is to convert the corrected data into response ratios. This is done using Geosoft‟s
Target™ Geochemistry software. Response ratios are calculated by first classifying each sample point by
overburden type and then dividing the corrected values by the median of the lower quartile for each and rounding to
the nearest integer. Results for each element are displayed as profile plots with the responses for each method
plotted as coloured lines.
ELEMENT RESPONSES
Diagrams showing the responses for a suite of ore and pathfinder elements are presented in Figures 27 to 36. There
are two figures for each element: one presents profiles for generic3 partial and selective extractions and the second
for laboratory specific4 methods. The red bars on the following figures indicate the position of the underlying
mineralization as defined by drill hole information. Summary statistics for selected elements for each extraction are
summarized in Appendix 1
ANALYTICAL RESULTS
The Transect passes over a portion of the mineralization that subcrops beneath approximately 40 metres of
Quaternary glaciofluvial cover.
3 Generic extractions are non-laboratory specific methods.
4 Laboratory specific extractions are proprietary and non-proprietary methods available from specific laboratories.

GEOSCIENCE BC REPORT 2010-08
Page | 42
COPPER Results for copper are presented in Figure 27. Sodium pyrophosphate (SPY – Fig. 27a) has the highest contrast
response of the generic methods. It defines a moderate contrast, multi-sample anomaly over the WBX Zone (30
RR). There is only a subtle response over the southeastern part of MBX Zone and no direct response over 66 Zone.
A low contrast peak located in the drainage just east of the 66 Zone is likely a hydromorphic anomaly. Strongly
anomalous values (80 and 70 RR) also occur on the hill slopes and in the drainage northwest of the WBX Zone.
These are likely caused by hydromorphic metal accumulation in a seepage zone at the base of slope and by
accumulation in the organic-rich soils of the drainage.
Figure 27. Selective and partial extraction results for copper: A. Generic extraction methods. B. Laboratory specific extraction methods.
Deionized water (DI) is also anomalous in this area although the response has a lower contrast (RR<19) and is much
broader, covering the entire hill northwest of the WBX Zone. There is only a subtle response over the WBX Zone
and no obvious response over the 66 Zone for this method. Neither of the hydroxylamine hydrochloride extractions
(CHDX and HHDX) detects the mineralization. Their variation between 1 and 7 RR is interpreted to be background

GEOSCIENCE BC REPORT 2010-08
Page | 43
variation. Cold aqua regia (CAR) does display a response over mineralization; however it consists of a single sample
anomaly centred over the western part of the WBX Zone in an area with very thin cover. Over the eastern part of the
MBX and the 66 zones there is no response.
Of the laboratory specific methods (Fig. 27b), MMI, Bioleach (BL) and Enzyme Leach (EL) have low contrast
responses (RR<25, 11 and 11 respectively) over the WBX Zone; again in an area with very thin cover. Ionic Leach
(IL) does not detect the mineralization but does define a very high contrast anomaly (239 RR) close to the drainage
northwest of the WBX Zone. This is interpreted to be a hydromorphic anomaly.
MOLYBDENUM Figure 28 shows the results for molybdenum. Responses for all of the methods tested are relatively flat over the
Figure 28. Selective and partial extraction results for molybdenum. A. Generic extraction methods. B. Laboratory specific extraction
methods.

GEOSCIENCE BC REPORT 2010-08
Page | 44
projection of the mineralization. EL (Fig. 28b) is the only method to show a recognizable feature over the
mineralization for this element. It defines a low contrast (RR<10) rabbit-ear anomaly (green line), more or less
bracketing the position of the mineralization. SPY and DI (Fig. 28a) highlight the break in slope and drainage
northwest of the WBX Zone. These features are of relatively low contrast and are interpreted to represent
hydromorphic anomalies. IL (Fig. 27b) shows a similar pattern.
ARSENIC Results for arsenic are shown in Figure 29. For the generic extractions (Fig. 29a) there appears to be no discernable
response over mineralization for any of the methods. SPY (green) does highlight the drainage northwest of the WBX
Zone, suggesting hydromorphic concentration in the organic-rich soils at that location.
Figure 29. Selective and partial extraction results for arsenic. A. Generic extraction methods. B. Laboratory specific extraction methods.
Of the laboratory specific extractions (Fig. 29b), only EL (green) appears to produce a credible response. It has the
form of a moderate contrast (RR<19) multi-peak anomaly centred more or less over the deposits. MMI (yellow)

GEOSCIENCE BC REPORT 2010-08
Page | 45
displays a noisy pattern with a grouping of elevated values (RR<15) over the southeastern part of the MBX and the
66 zones. These features would be quite compelling if it was not for the presence of higher contrast, single peak
features in background areas at the northwest end of the line. At least one of these corresponds with a drainage and
organic-rich soils. BL and IL do not respond to the mineralization.
ANTIMONY Profiles for antimony (Fig. 30), like arsenic, are generally subdued for most methods over the mineralization. None
of the generic methods (Fig. 30a) display a credible response. SPY has elevated values for antimony close to the
drainages suggesting hydromorphic scavenging of this element by organic matter.
Figure 30. Selective and partial extraction results for antimony. A. Generic extraction methods. B. Laboratory specific extraction
methods.
For the laboratory specific extractions (Fig. 30b), MMI shows a broad, unfocussed increase in values over the
deposits but contrast is so low (RR<8) that this feature would not be recognized without prior knowledge of the

GEOSCIENCE BC REPORT 2010-08
Page | 46
position of the mineralization. BL highlights the drainage northwest of the WBX Zone but is very flat over the rest
of the transect. IL and EL show only background values over mineralization.
TUNGSTEN
Figure 31. Selective and partial extraction results for tungsten. A. Generic extraction methods. B. Laboratory specific extraction
methods.
Tungsten results for the different extractions are illustrated in Figure 31. Once again, most of the methods tested do
not produce credible anomalies over the mineralization. SPY (Fig. 31a - green) exhibits a low contrast single sample
peak over the WBX Zone but no response over the other mineralized zones. Noisy values of almost the same
intensity are present in background areas at the northwest and southeast ends of the line: some of these coincide with
drainages. HHDX appears to be slightly elevated over the mineralized zones but contrast values are very low
(RR<10). The validity of these features as genuine responses to the mineralization are doubtful as higher values
(RR<24) occur in un-mineralized areas at the southeastern end of the transect. DI, CHDX and CAR are essentially
flat across the transect.

GEOSCIENCE BC REPORT 2010-08
Page | 47
The laboratory specific methods show even less contrast than the generic methods. Figure 31b shows that MMI, EL
and IL have flat profiles with no indications of a response over the mineralized zones. BL does highlight the
drainage northwest of the WBX Zone as being anomalous.
URANIUM Patterns shown by uranium (Fig. 32) do not differentiate mineralized from non-mineralized areas. The generic
extractions (Fig. 32a) are flat across the MBX and 66 zones. SPY has the highest contrast of the five methods and
displays several single point features ranging between 12 and 49 RR that coincide with the break in slope and
drainage northwest of the WBX Zone. As with other elements, these features are interpreted to be hydromorphic
anomalies developed in a seepage zone at the base in slope and in organic rich soils in the drainage. CHDX and SPY
also highlight drainages southeast of the 66 Zone, albeit with very low contrast.
Figure 32. Selective and partial extraction results for uranium. A. Generic extraction methods. B. Laboratory specific extraction
methods.

GEOSCIENCE BC REPORT 2010-08
Page | 48
Of the laboratory specific extractions (Fig. 32b), only IL displays any sort of contrast. It clearly highlights the
drainage to northwest of the WBX Zone as a low-contrast anomaly (RR<11). None of the other methods have any
response over the mineralization and their background values are equally flat.
LEAD
Figure 33. Selective and partial extraction results for tungsten. A. Generic extraction methods. B. Laboratory specific extraction
methods.
Lead results for the generic extractions are presented in Figure 33a. None of them display more than background
variations and show no contrast over mineralization. Values for all five methods range between 1 and 6 RR.
Laboratory specific methods (Fig. 33b) have similar profiles to the generic methods. Only IL has a definitive
anomaly. This feature coincides with the drainage northwest of the WBX Zone, where lead values reach 295 RR.
MMI exhibits a single point anomaly (30 RR) further to the northwest. The sample location falls on a north-facing
slope where colluvial and till veneer deposits predominate. This feature is not considered to be significant.

GEOSCIENCE BC REPORT 2010-08
Page | 49
ZINC Figure 34 shows results for Zinc. Generic methods (Fig. 32a) do not show any significant variation. Values over
mineralization and background are essentially the same, ranging between 1 and 7 RR for all methods.
Figure 34. Selective and partial extraction results for zinc. A. Generic extraction methods. B. Laboratory specific extraction methods.
MMI (Fig. 34b) appears to have a low contrast anomaly (RR<19) located over the WBX Zone. There is also a subtle
feature over the 66 Zone (RR<11), which lies close to a large drainage channel. Single sample MMI peaks are also
observed at the northwest and near the southeast ends of the transect. The latter coincides with the edge of a
drainage; the former cannot be readily explained. EL produces a strong single sample anomaly over the 66 Zone (75
RR) but no discernable response over the MBX Zone. The presence of this feature adjacent to a large drainage
suggests that it could be caused by hydromorphic concentration. IL and BL show no obvious patterns.

GEOSCIENCE BC REPORT 2010-08
Page | 50
SILVER Results for silver (Fig. 35) do not show any convincing responses over the mineralization for either the generic or
laboratory methods. Profiles are quite flat, with values ranging between 1 and 6 RR. A single sample peak is noted
in the CAR. This feature coincides with a drainage and therefore is likely caused by hydromorphic concentration
within organic-rich soil.
Elevated values for MMI and BL located slightly northwest of the drainage (Fig. 35b) fall on a hill side with thin
colluvial cover and possibly represent a change in surficial environment from glaciofluvial cover to colluvium.
These features are not detected by other methods.
Figure 35. Selective and partial extraction results for silver: A. Generic extraction methods. B. Laboratory specific extraction methods.

GEOSCIENCE BC REPORT 2010-08
Page | 51
CALCIUM This element has perhaps the most compelling results of any of the elements described in this section. Figure 36a
shows that both HHDX and CHDX define strong rabbit-ear patterns bracketing the MBX Zone. Maximum contrast
(23 RR) occurs in the weaker cold extraction. DI (red) also appears to highlight this feature, albeit with lower
contrast. Unfortunately in this case, the northwestern rabbit ear is missing due to a missing sample for that method
(dashed line).
For the laboratory specific methods (Fig. 36b), IL has the most compelling response, also defining a rabbit anomaly
bracketing the MBX Zone. MMI does not show this feature. Elevated MMI values occur at the northwest end of the
line in an area of background values. Highest RR values coincide with the upper southeast facing slopes of a hill
where cover is thin and dominated by colluvium. Calcium results are not reported for EL and BL.
Figure 36. Selective and partial extraction results for calcium: A. Generic extraction methods. B. Laboratory specific extraction
methods.

GEOSCIENCE BC REPORT 2010-08
Page | 52
THE RATIO OF WEAK EXTRACTION CALCIUM TO AQUA REGIA CALCIUM
Expressions of buried mineralization can also show up as indirect anomalies caused by redistribution of Eh and pH
sensitive elements in the soil in response to oxidation of sulphides at depth or reduction of the overburden column
above (Hamilton, 1998; Smee, 1997, 1998). This phenomenon, as mentioned earlier in the description of soil pH and
conductivity results, is manifested as double-peak anomalies for IDH and H+. Smee (1998) in his study at Marigold,
Nevada, noted similar patterns in weak extraction results. He observed that in a desert environment, regardless of the
weak extraction used, double peak anomalies for calcium and strontium occur over the edges of the mineralization.
He proposed a model whereby H+ released from sulphide oxidation at depth migrates to the surface and causes
disequilibrium in pH sensitive compounds such as calcium carbonate. In areas of H+ accumulation, calcium
carbonate becomes unstable and dissolves and its components (e.g. calcium and strontium) migrate away from the
acidified zones and reprecipitate where ambient pH conditions allow, usually over the edges of the mineralization.
Alternate mechanisms for the formation of calcium and strontium rabbit-ear patterns under wet temperate conditions
have been proposed by Hamilton (1998, 2000). Hydrogen ions released as a result of (microbially mediated?)
oxidation of ferrous iron to ferric iron at the edges of reduced chimneys over sulphide mineralization form localized
zones of acidity. These cause dissolution of soil carbonate which remobilizes away from the acid zones and
reprecipitates immediately outside the edges of the reduced zone. In the absence of soil carbonate, for example
where pH conditions are too acid for the existence of carbonate minerals, carbonate deposition could also occur as
the result of anaerobic oxidation of methane to bicarbonate by methanotrophic bacteria at the edges of a reduced
chimney.
Weak extractions, particularly unbuffered weak acid leaches like CHDX, HHDX and EL, are sensitive to the
carbonate content of the soil. Soils with higher (and more reactive) carbonate contents, resulting from this
remobilization and reprecipitation process, react with the weak acid solutions and cause a rise in the final solution
pH (Smee, 1997). Therefore, final solution pH in a weak acid leach is a reliable measurement of soil carbonate
content. Zones of remobilized carbonate can also be identified using the ratio of partial or selective extraction
calcium to aqua regia calcium. As pointed out by Smee (1997), residual anomalies from this ratio indicate areas
where the more reactive calcium carbonate related to mineralization is present.
Figure 37a shows the results of this ratio for the generic extractions plotted as response ratios. Both CHDX and
HHDX display compelling asymmetrical rabbit-ear anomalies indicating the presence of remobilized carbonate.
These are comparable in contrast to the calcium anomalies for the different extractions described above. Maximum
contrast (RR<17 and 7) is shown by CHDX, which defines single point rabbit-ears located close to the edges of the
projected mineralization. HHDX has a slightly lower contrast (RR<11 and 5). Subtle rabbit ear features are also
observed in CAR. These are coincident with the CHDX and HHDX responses but have a very low contrast (RR<4
and 3). DI potentially has the highest contrast of all generic methods; however only the southeast rabbit ear is
measured (10 RR). As mentioned earlier, where the northwestern rabbit ear should occur, there is a missing sample.
SPY does not produce a rabbit ear anomaly.
Results for the laboratory specific methods are illustrated in Figure 37b. Of these, only IL defines a robust rabbit-ear
response. In this case, the stronger rabbit-ear (RR<17) occurs over the 66 Zone. MMI does not produce a similar
pattern nor do EL and BL, for which the ratio for strontium is plotted.5
5 Calcium is not reported for Enzyme Leach or Bioleach. Strontium is used here as a proxy for calcium.

GEOSCIENCE BC REPORT 2010-08
Page | 53
Figure 37. Ratio of weak extraction calcium to aqua regia calcium: A. Generic extraction methods. B. Laboratory specific extraction
methods. Note for EL and BL the ratio of weak leach strontium/aqua regia strontium has been used.

GEOSCIENCE BC REPORT 2010-08
Page | 54
GOLD METHODS
This study included several methods for detecting gold. These ranged from traditional fire assay-AAS on upper B,
lower B and C horizons, SPY and low detection limit methods like Supertrace (ALS-Chemex), Ultratrace (Acme),
IL (ALS-Chemex) and MMI (SGS). Summary statistics for these methods are shown in Table 9.
Table 9. Summary statistics for Gold methods.
MMI Sodium
Pyro Ultra Trace
Ionic Leach
Super Trace
Fire Assay
Fire Assay
Fire Assay
Horizon 10-25cm Ah Ah Upper B Upper
B Upper B Lower B C Horizon
Channel Au Au Au Au Au Au Au Au
Unit ppb ppb ppb ppb ppm ppb ppb ppb
N 40 40 38 39 39 39 37 39
Min 0.1 0.1 0.1 0.1 0.0017 4 5 3
Max 157 4.7 153.6 25.2 0.14 661 596 916
Range 156.9 4.6 153.5 25.1 0.1383 657 591 913
Mean 5.08 0.89 15.74 1.38 0.02 67.03 104.54 61.59
StdDev 24.735 1.07 32.05 4.04 0.03 130.94 178.33 150.35
Var 611.82 1.15 1027.15 16.33 0.00 17145.10 31802.50 22606.20
Sum 203.2 35.5 598.1 53.97 0.9569 2614 3868 2402
GeoMean 0.75 0.49 5.07 0.51 0.02 26.63 34.39 25.84
Median 0.6 0.6 5.1 0.39 0.0132 18 27 26
Mode 0.2 0.1 0.4 0.74 0.0086 15 5 8
Gold results for the generic methods are presented in Figure 38a. As one might expect there is a fair amount of noise
in the results for most methods. Acme‟s Ultratrace aqua regia method on Ah horizon (yellow) has the cleanest
response. Background is relatively flat with variations between 5 and 39 RR. The higher background results occur
close to the drainage located northwest of the WBX Zone. This method does appear to identify the mineralization at
the 66 Zone (gold-rich mineralization) and at the MBX Zone. Over the 66 Zone Ultratrace defines a single point,
high-contrast anomaly (132 RR) directly over the mineralization. The response at the MBX Zone has a slightly
lower contrast (RR<115) but is comprised of three contiguous anomalous samples, making it a more robust
anomaly.
Fire assay of the upper and lower B horizons also appears to detect the mineralization. The best response occurs in
the upper B horizon (green), which has a single sample peak (80 RR) over the MBX Zone and a lower contrast,
single sample peak (58 RR) over the 66 Zone. Lower B horizon responses (blue) are comparable in contrast to the
upper B horizon response but are stronger over the 66 Zone. Here, there is a high contrast, three sample anomaly
(RR<75) directly over the mineralization. Weaker, single sample peaks are noted over the WBX and MBX zones.
Fire assay of C horizon also produces a single sample peak over the 66 Zone but fails to detect the MBX Zone.
Both the lower B and C horizon fire assay results detect a high-contrast feature located near the northwest of the
transect. This response is unexplained.
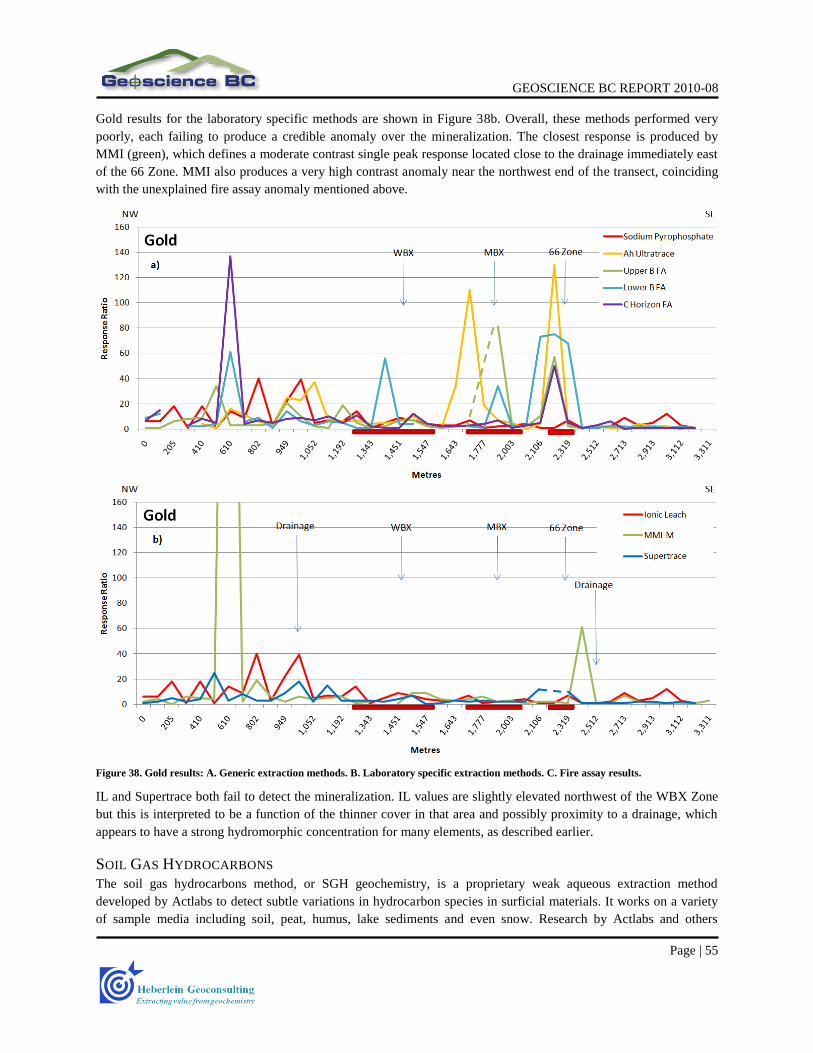
GEOSCIENCE BC REPORT 2010-08
Page | 55
Gold results for the laboratory specific methods are shown in Figure 38b. Overall, these methods performed very
poorly, each failing to produce a credible anomaly over the mineralization. The closest response is produced by
MMI (green), which defines a moderate contrast single peak response located close to the drainage immediately east
of the 66 Zone. MMI also produces a very high contrast anomaly near the northwest end of the transect, coinciding
with the unexplained fire assay anomaly mentioned above.
Figure 38. Gold results: A. Generic extraction methods. B. Laboratory specific extraction methods. C. Fire assay results.
IL and Supertrace both fail to detect the mineralization. IL values are slightly elevated northwest of the WBX Zone
but this is interpreted to be a function of the thinner cover in that area and possibly proximity to a drainage, which
appears to have a strong hydromorphic concentration for many elements, as described earlier.
SOIL GAS HYDROCARBONS
The soil gas hydrocarbons method, or SGH geochemistry, is a proprietary weak aqueous extraction method
developed by Actlabs to detect subtle variations in hydrocarbon species in surficial materials. It works on a variety
of sample media including soil, peat, humus, lake sediments and even snow. Research by Actlabs and others

GEOSCIENCE BC REPORT 2010-08
Page | 56
(Sutherland, 2010, Southam and Saunders, 2005) has shown that certain types of chemotrophic bacteria grow on the
surfaces of sulphide minerals in the hypogene zone. They metabolize sulphide minerals or sulphates produced from
abiotic oxidation or iron sulphide and synthesize a variety of new compounds, including a range of hydrocarbon
species, as byproducts. On the death of the bacterial cells, these compounds are released and migrate to the surface
to form detectable anomalies. Anomalies can also be developed, presumably by other species of bacteria, for
deposits not generally associated with sulphides, i.e. kimberlites. Analysis of the extraction solution is done by high
resolution Gas Chromatography/Mass Spectroscopy (GC/MS) with reporting limits down to 1 ppt for most
compounds. A total of 162 compounds in the C5 to C17 range are analyzed by the method. These are grouped into
19 classes of compounds for interpretation. Class groupings are based on a combination of the molecular weight and
the chemical structure of the compounds. Lighter class groups tend to disperse more rapidly to the surface than the
heavier class groups, forming apical anomalies directly over the mineralization. Heavier compound groups tend to
disperse more slowly and form peripheral haloes around the margins of the mineralized source. This process is
known as „geochromatography‟. Therefore zonation patterns in the different compound groups can be used as a
vector towards mineralization. The specific mixture of the groups found provide a chemical signature that can
identify the type of mineralization at depth.
Hamilton (1998, 2000) proposed a model to explain the presence of reduced zones observed in overburden above
mineralization and other reduced bedrock sources. His model suggests that ion movement at the top and bottom of
an electrolytic cell caused by the reduced bedrock source would be achieved through charge transfer within the
electrolyte. Maintenance of the charge balance would be facilitated by the migration or mass transfer of ions toward
or away from their respective electrodes. As electrons move up the conductor, oxidizing agents in the overlying
overburden are consumed and a negative redox anomaly forms above the reduced source. As this process continues,
a redox front migrates up and away from the source until it reaches the surface (a continuous source of oxidizing
agents). This process forms a reduced column or chimney. Reducing conditions within the reduced zone would
facilitate the transfer of hydrocarbon species to the surface. In fact, studies of forest rings in northern Ontario
(Hamilton et al., 2004c, 2005) has shown that these reduced zones are naturally enriched with methane and other
hydrocarbon species. The correlation between SGH anomalies and reduced overburden has been documented at
Cross Lake VMS deposit (CAMIRO report 01E02, 2002) and at the Thorn North forest ring in northern Ontario
(Hamilton, 2005).
SGH RESULTS SGH Samples were collected from 39 sites along the northwest-southeast traverse over the MBX, WBX and 66
zones. Approximately 350g of material was collected from the upper B horizon (usually corresponding to the Bf
horizon). Material was placed in Hubco type polyweave sample bags and shipped to Actlabs in Ancaster, Ontario for
SGH analysis. A full report of the methodologies used and interpretation of the results (Sutherland 2010) is included
in Appendix 5
Results for the copper pathfinder class are illustrated in Figure 39. This class represents relatively low molecular
weight compounds whose concentrations in that group have been summed. The gridded profile shows a strong rabbit
ear anomaly that clearly brackets a deep central low corresponding with the position of the WBX, MBX
mineralization and the 66 Zone. A similar but lower contrast feature also occurs on the southeast facing hill side to
the northwest of the WBX Zone. These features are interpreted to represent expressions of reduced chimneys
developed in the overburden column above mineralization.
Gold pathfinder class results are shown in Figure 40. Results show a strong apical anomaly over the 66 Zone, which
is the gold-rich part of the Mt. Milligan mineralization. Corresponding lows delineate the copper-rich MBX zone.

GEOSCIENCE BC REPORT 2010-08
Page | 57
Figure 39. SGH Results – Copper pathfinder class map: Red outlines represent the limits of the proposed open pits. Black dashed lines
highlight the position of the main intrusions associated with the mineralization.
WBX
MBX

GEOSCIENCE BC REPORT 2010-08
Page | 58
Figure 40. SGH Results – Gold pathfinder class map: Red outlines represent the limits of the proposed open pits. Black dashed lines
highlight the position of the main intrusions associated with the mineralization.
8. DISCUSSION Results from a similar soil geochemistry study carried out by the author at the Kwanika porphyry Cu-Au prospect
(Heberlein, 2010, Heberlein and Samson, 2010) demonstrated that the best response for ore and pathfinder elements
occurs in the Ah horizon near the top of the soil profile. Anomalies were readily detected using an aqua regia
digestion and Ultratrace ICP-MS analysis. Results also showed that SPY was also effective on the same soil horizon.
Tests by a variety of methods, including several laboratory specific extractions (the same used in this study) on the
upper B, lower B and C horizons failed to produce convincing responses to the mineralization in areas where it was
sub-cropping beneath 20 to 40 metres of glaciofluvial sediments or at depths of 300 metres beneath Quaternary
sediments and a post mineral sedimentary rocks. Of these methods only IL appeared to identify the mineralization
through the deeper cover, but performed poorly over the shallower cover. The Kwanika study also showed that the
element Tungsten was strongly anomalous directly over mineralization for both methods. Geochemical patterns at
WBX
MBX

GEOSCIENCE BC REPORT 2010-08
Page | 59
Kwanika are consistent with the presence of a well developed reduced chimney over the mineralization. Evidence
for such a reduced zone came from a variety of methods including: SGH, soil pH and electrical conductivity and the
presence of remobilized carbonate in the soils measured using the ratio of weak extraction to aqua regia calcium.
The Kwanika results were obtained from a relatively pristine area, where soil profiles are well preserved. At Mt.
Milligan the situation is quite different. Much of the area has been clear-cut logged over the last 25 years and there
is significant disturbance over a large part of the survey area, particularly over the mineralization, by drilling roads
and drill pads. While an attempt was made to sample undisturbed ground, it is unlikely that many sites could be
considered pristine. Therefore this report presents a good contrast to the Kwanika study by testing the effectiveness
of the same geochemical methods in a highly disturbed setting.
At Kwanika, IDH and EC results clearly define the edges of the underlying mineralization. At Mt. Milligan the
responses are much less clear. There are no rabbit ear anomalies for EC, H+ or IDH bracketing the sulphide zone as
predicted by the Smee and Hamilton models. In fact, there is no response over the mineralization at all. The high
contrast anomaly in the IDH located immediately to the northwest of WBX (Fig. 11d) coincides with patterns seen
in a variety of elements in several of the extraction methods, which are attributed to hydromorphic concentration in
organic-rich soils in a drainage and/or the presence of a seepage zone on the lower slopes of the hill. The high IDH
values in that area are harder to explain.
One possible explanation is that this feature does represent a rabbit-ear anomaly and that the corresponding one that
should be present on the southeast side of the 66 Zone has been destroyed by the extensive surface disturbance in
that area. An alternative explanation is that the transect does not extend far enough to the southeast to capture the
other side of the anomaly. This would be reasonable if there was an extensive zone of low-grade or barren sulphide
mineralization extending southeast of the 66 zone. Drilling southeast of the 66 zone has confirmed the presence of
barren pyrite mineralization at depth, however its extent to the south is unknown (D. O‟Brien, pers. comm., 2009).
Figure 41 shows the IDH response superimposed over the SGH copper pathfinder class. Profiles of the ratio of weak
extraction calcium divided by aqua regia calcium are also shown for HHDX, CHDX and IL. Assuming that the SGH
copper pathfinder results indicate the position of a reduced chimney over the mineralization, coincident or spatially
related patterns should be exhibited by the pH (IDH) and weak leach calcium ratios as demonstrated at Kwanika.
The IDH response (red dashed line) occurs at some distance (about 300m) outside the peak of the northwest SGH
rabbit-ear of the SGH rabbit ear. If this is part is a rabbit ear response, then the corresponding IDH peak to the
southeast may be expected to occur at a similar distance outside the peak of the southeastern SGH rabbit-ear. This
would put it close to the end of the transect. Therefore, the interpretation that the line stopped short of the second
rabbit-ear is plausible. Additional pH sampling to the southeast would be necessary to resolve this.
Profiles for the ratio of weak extraction calcium to aqua regia calcium are also shown on Figure 41. They reveal a
different pattern to IDH. High contrast rabbit ear responses are shown for HHDX/aqua regia (purple), CHDX/aqua
regia (green) and IL/AR (cyan). The peaks, which are defined by single samples, do not coincide with either IDH or
the SGH results. The rabbit ears fall well within the IDH anomaly with the northwestern one matching the SGH
peak and the southeastern one falling within the SGH low. The reason for the apparent offset in these features is
unclear. Nevertheless, the datasets do support the notion of a reduced chimney over the mineralization.

GEOSCIENCE BC REPORT 2010-08
Page | 60
Figure 41. IDH, SGH and weak extraction calcium to aqua regia calcium ratio.
EFFECTIVENESS OF CONVENTIONAL SOIL GEOCHEMISTRY
Results for the upper B horizon aqua regia analysis for selected elements are shown in Figure 42. For most elements,
there is no credible response over the mineralization. Two elements however, do appear to have anomalous values
over parts of the mineralization. Copper (red) defines a moderate contrast, single sample peak close to MBX and
tungsten (pale blue) displays a moderate contrast, single sample peak located over the gap between MBX and the 66
Zone. Without prior knowledge of the mineralization, it is doubtful that either feature would be classified as an
important anomaly. Silver (dark blue) also appears to show a low contrast peak but this falls well away from the
mineralization to the northwest and is likely a hydromorphic anomaly.
WBX WBX
MBX
66 Zone

GEOSCIENCE BC REPORT 2010-08
Page | 61
Figure 42. Selected ore and pathfinder element responses in upper B horizon aqua regia digestion.
RESPONSES IN THE AH HORIZON
One of the outcomes of the Kwanika study (Heberlein and Samson, 2010) was the finding that the highest
concentrations of ore and certain pathfinder elements are present in the Ah horizon and that an aqua regia digestion
was most effective at highlighting anomalies in this medium. Figure 43 shows the results of the Ah horizon aqua
regia digestion for selected elements.
Figure 43. Selected ore and pathfindere element responses in Ah horizon aqua regia digestion.
In contrast to Kwanika, the Ah horizon at Mt. Milligan does not yield a robust expression of the underlying
mineralization. Copper is the only element to respond over mineralization. It forms a double sample peak over the
WBX Zone: there is no anomaly over the 66 Zone. Elevated copper values of similar magnitude are also present
northwest of WBX. As mentioned earlier, this is believed to be hydromorphic enrichment associated with a break in
slope and drainage in that area. There are single peak anomalies for tungsten, and arsenic at various locations on the

GEOSCIENCE BC REPORT 2010-08
Page | 62
transect, however these are not considered to be indicators of mineralization but rather spurious highs possibly
related to background variation.
Why is the Ah horizon unresponsive at Mt. Milligan and responsive at Kwanika? The most likely explanation is that
much of the original Ah horizon over the mineralization has been destroyed by logging and drilling activities. In
many instances the organic layer sampled appeared to be developed on disturbed ground. This implies that the
current soil profile (less than 30 years old) is too immature to have developed a geochemical signature. Figure 44
illustrates an example of the recent soil profile exposed in a road cutting. The vegetation above the road bank is new
growth in a former clear-cut. At some localities the original profile has been buried by earth moving related to road
building and drilling activities (Fig. 45). It is possible that some samples were collected from the new profile
developed on top of the bulldozed soil despite great effort to identify and avoid where this has happened.
Figure 44. New soil profile exposed in a road cut. The original profile
has been disrupted or removed during clear cut logging activities
Figure 45. An example of a buried soil profile. The original
surface lies beneath 60cm of bulldozed material. Note the
beginnings of a new profile at the current surface.
EFFECTIVENESS OF PARTIAL AND SELECTIVE EXTRACTIONS.
In order to compare the large amount of data generated for the partial and selective extractions, the results are
compiled in Table 10. Responses for selected ore and pathfinder elements for each extraction are categorized on the
basis of: a) the form of the response (i.e. apical, rabbit-ear or single peak); b) contrast; and c) level of confidence in
the anomaly. For the level of confidence classification, each field with a recognizable response is assigned a colour
ranging from red, indicating very high confidence, to blue, low confidence. The colours aid in visually assessing the
relative performance of each extraction. In addition, each cell is assigned a value based on its level of confidence.
Very high confidence responses are assigned a 4, high a 3, moderate 2 and low 1. Scores are summed for each
extraction to provide an overall measure of effectiveness. These scores reflect both the number of elements
responding and the levels of confidence in the response. Finally a relative score is calculated by subtracting the
Upper B horizon aqua regia score from the score for each method. This provides an indication of the relative

GEOSCIENCE BC REPORT 2010-08
Page | 63
performance of each extraction with respect to the traditional B horizon aqua regia approach. Relative scores with
positive values indicate better performance and negative values poorer performance.
Overall the results are quite disappointing. None of the methods produced high confidence responses for the ore
elements copper and gold. While several of the methods did detect some sort of copper anomaly, the responses were
not of high contrast or in most cases only identified a small part of the underlying mineralization. Strongest copper
responses were produced by SPY and upper B horizon aqua regia, although C horizon aqua regia also produced a
recognizable anomaly. The gold methods likewise performed very poorly. The most convincing response was found
in the Ah horizon, where Acme‟s Ultratrace aqua regia digestion produces a reasonable rabbit-ear response. Lower
confidence apical anomalies were obtained by conventional fire assay on upper B and lower B horizons.
Table 10. Summary of results for the methods tested
* - Fire Assay on upper B, lower B and C horizon. ? – ambiguous response
Of the pathfinder elements only tungsten had a recognizable response in upper B horizon aqua regia. None of the
generic or laboratory specific methods produced convincing anomalies for any of the elements. Laboratory specific
methods did not provide any advantage over the generic methods.
Perhaps the most interesting result of this survey is the strong calcium response. As described earlier, this element
defines robust rabbit-ear anomalies in four of the methods tested: DI, CHDX, HHDX and IL. These anomalies are
enhanced when ratioed to aqua regia calcium.
The relative performance of the individual methods is shown by the relative scores in Table 10. It is clear from the
negative scores that none of the methods outperformed conventional B horizon aqua regia. B horizon and Ah
horizon aqua regia both detected high confidence anomalies for copper and moderate to high contrast anomalies for
gold over part of the mineralization. Ah horizon SPY also identified a credible copper anomaly over the WBX Zone.
Lower confidence copper anomalies were also defined by several other extractions, including: MMI, EL and BL

GEOSCIENCE BC REPORT 2010-08
Page | 64
9. CONCLUSIONS This study set out to answer several questions about the effectiveness of soil geochemistry in areas of transported
glaciofluvial cover. It tests a variety of methods over a heavily disturbed area to see how effective or how
compromised they are as a result of the modified soil profile. The project also provides a contrast to the first study
carried out by the author at Kwanika, where surficial conditions are close to pristine.
Based on the results presented here, the following conclusions can be made:
1. Results of this study show that the effectiveness of most of the soil methods tested is significantly
compromised by the ground disturbance at Mt. Milligan. In comparison to Kwanika where Ah horizon aqua
regia and SPY as well as upper B horizon IL all significantly outperformed conventional B horizon aqua
regia. At Mt. Milligan the results of these methods are comparable to or slightly poorer than conventional
soil sampling.
2. Poor results are directly attributable to destruction of the upper parts of the soil profile by extensive logging
and drilling activities over WBX, MBX and 66 zones at Mt. Milligan. In many instances, soil samples for
this study were collected from the current surface, which represents a soil profile developed over the last 25
years or so. It is clear that geochemical patterns have not had time to become re-established.
3. Nevertheless, some of the methods that performed best at Kwanika are also the best performers at Mt.
Milligan. These are Ah horizon aqua regia, which detected high confidence copper and gold anomalies over
parts of the mineralization; and SPY, which detected a high confidence copper anomaly over the MBX
Zone. This observation confirms that Ah horizon sampling is generally more effective than deeper horizons
in the profile.
4. Many of the methods highlighted multi-element anomalies in and around a drainage northwest of the WBX
Zone. There is no known mineralization directly beneath this drainage. Strongly elevated values are
interpreted to be the result of hydromorphic scavenging by organic-rich soils in that area. Strongly
anomalous values occurring at adjacent break in slope and lower hill side are harder to explain. They too
are most probably of hydromorphic origin but there is no known source of mineralization higher up the
slope to explain the anomalies.
5. SGH performed well in this study and clearly defined a potential reduced chimney directly over the WBX,
MBX and 66 zones. Both the copper and gold pathfinder classes would have identified the copper and
gold-rich parts of the system if carried out as an exploration survey.
6. Calcium appears to show strong rabbit-ear patterns in the upper B horizon despite the soil disturbance. As
discussed in the Kwanika report (Heberlein and Samson, 2010), the presence of rabbit-ear calcium
anomalies in an acidic environment where calcium carbonate is unstable, suggests that these anomalies are
self-sustaining and possible related to microbial oxidation of methane to bicarbonate at the edges of a
reduced chimney. In the presence of free calcium ions this could precipitate calcium carbonate locally.
Unfortunately the rabbit-ear anomalies do not coincide with the edges of the reduced chimney indicated by
the SGH. The reason for this is unclear. Undoubtedly the expression of reduced chimneys in different
methods is more complex than our current level of understanding allows us to interpret.
7. Soil pH results are ambiguous. At Kwanika IDH and EC both clearly defined the limits of the
mineralization at depth. At Mt. Milligan however, the response is difficult to interpret. The strong IDH
anomaly on the northwest side of the WBX Zones coincides with the drainage and lower slopes mentioned
above. Whether this is a coincidence or not is debatable. Additional pH sampling extending the transect to
the southeast could identify a corresponding IDH rabbit ear. This would confirm the origin of the feature
identified in this study as being caused by the sulphide mineralization. If a second rabbit-ear is not present,
then the IDH feature would have to be related to the drainage. One possible explanation for increased soil

GEOSCIENCE BC REPORT 2010-08
Page | 65
reactivity in that area is the higher evaporation rate in the drainage compared to the surrounding area. This
would cause precipitation of salts and carbonates close to the surface, which would make the soils more
reactive. The question is: why do we not see similar features in every drainage? These results cannot be
properly interpreted without additional data.
Respectfully submitted by:
Dave Heberlein M.Sc., P.Geo.
April 8th, 2010
10. ACKNOWLEDGEMENTS Funding for this study was provided by Geoscience BC. The author thanks Acme Analytical Laboratories Ltd.,
Activation Laboratories Ltd., ALS Chemex and SGS Mineral Services for their generous discounts and
contributions to the analytical work. Thanks also go to Terrane Metals Corp. and in particular to Cory Dumas,
whose assistance in the field was invaluable; and to Darren O‟Brien for making supporting data available and
allowing access to the site. The author also thanks Henry Awmack and Darcy Baker for their support and helpful
suggestions that led to the inception of this project; to Katie Heberlein for her diligent hole digging and navigation;
and to Kirstie Simpson and Kim Heberlein for their thorough editing.

GEOSCIENCE BC REPORT 2010-08
Page | 66
12. REFERENCES Cameron, E.M., Leybourne, M.I. and Kelley, D.L. (2002): Exploring for deeply-covered mineral deposits: formation
of geochemical anomalies in northern Chile by earthquake-induced surface flooding of mineralized ground
waters: Geology, v 30, p. 1007–1010.
Cameron, E.M., Hamilton, S.M., Leybourne, M.I., Hall, G.E.M and McClenaghan, M.B. (2004): Finding deeply
buried deposits using geochemistry: Geochemistry: Exploration, Environment, Analysis, v. 4, p. 7–32.
Canada Soil Survey Committee, Subcommittee on Soil Classification (1978): The Canadian system of soil
classification; Canadian Department of Agriculture, Publication 1646, 164 pp.
Cook, S.J. and Dunn, C.E. (2007): Final report on results of the Cordilleran Geochemistry Project: a comparative
assessment of soil geochemical methods for detecting buried mineral deposits – 3Ts Au-Ag prospect, central
British Columbia; Geoscience BC, Paper 2007-7, 225 pp.
Delong, R.C., 1996, Geology, alteration, mineralization and metal zonation of the Mt. Milligan porphyry copper-
gold deposits: M.Sc. thesis, University of British Columbia.
Garnett, J. A., (1978): Geology and Mineral Occurrences of the Southern Hogem Batholith. Province of British
Columbia, Ministry of Energy, Mines and Petroleum Resources, Bulletin 70, 75 pp.
Ghosh, D. (1992): Isotope Geochemistry, In Copper-Gold Porphyry Systems of British Columbia, Annual Technical
Report, Year One, July 1991-June 1992, University of British Columbia, Mineral Deposits Research Unit.
Gravel, J. and Sibbick, S. (1991): Mount Milligan: geochemical exploration in complex glacial drift; in Exploration
in British Columbia 1990, BC Ministry of Energy, Mines and Petroleum Resources, Part B, p.117–134.
Hamilton, S.M. (1998): Electrochemical mass-transport in overburden: a new model to account for the formation of
selective leach geochemical anomalies in glacial terrain; Journal of Geochemical Exploration, v. 63, p. 155–
172.
Hamilton, S.M. (2000): Spontaneous potentials and electrochemical cells: in Govett, G.J.S. (ed.), Geochemical
Remote Sensing of the Subsurface. Handbook of Exploration Geochemistry, v. 7. Elsevier, Amsterdam, p. 81–
119.
Hamilton, S.M., (2005): Geochemical exploration in areas of thick glacial overburden: Recent advances and
ongoing challenges: Ontario Geological Survey PowerPoint presentation.
Hamilton, S.M., Cameron, E., McClenaghan, B., and Hall, G. (2001a): A comparative study of selective leaches and
evaluation of element migration processes through thick overburden, Abitibi Clay Belt, Ontario: CAMIRO
Report 18, Deep Penetrating Geochemistry Project; Ontario Geological Survey PowerPoint Presentation.
Hamilton, S.M., Cameron, E, McClenaghan, B., and Hall, G.E.M. (2001b): Deep Penetrating Geochemistry – Cross
Lake Final Report: CAMIRO Deep Penetrating Geochemistry Phase II, 74 pp.
Hamilton, S.M., Cameron, E.M., McClenaghan, M.B. and Hall, G.E.M. (2004a): Redox, pH and SP variation over
mineralization in thick glacial overburden. Part I: methodologies and field investigation at the Marsh zone gold
property; Geochemistry: Exploration, Environment, Analysis, v. 4, p. 33–44.

GEOSCIENCE BC REPORT 2010-08
Page | 67
Hamilton, S.M., Hall, G.E.M and McClenaghan, M.B. (2004b): Redox, pH and SP variation over mineralization in
thick glacial overburden. Part II: field investigation at Cross Lake VMS property; Geochemistry: Exploration,
Environment, Analysis, v. 4, p. 45–58.
Hamilton, S.M., Burt, A.K., Hattori, K.H. and Shirota, J. (2004c): Project Unit 04-025. The distribution and source
of forest ring-related methane in North-eastern Ontario: Summary of Fieldwork and Other Activities 2004,
Ontario Geological Survey, Open File Report 6145, p. 21-1 to 21-26.
Heberlein, D.R., Rebagliati, C.M. and Hoffman, S.J. (1984): Assessment report on the 1984 geological and
geochemical exploration activities; PHIL A, B and 1 Claim Groups, Selco Division – BP Resources Canada
Limited, Assessment Report No. 12882, 38 pp.
Heberlein, D.R. (2010): Comparative study of partial and selective extractions of soils over blind porphyry copper-
gold mineralization at Kwanika and Mount Milligan, central British Columbia (NTS 093N/01, 19): field work,
soil conductivity and pH results; in Geoscience BC Summary of Activities 2009, Geoscience BC, Report 2010-
1, p. 11–24.
Heberlein, D. R. and Samson, H. (2010): Comparative study of partial and selective extractions of soils over blind
porphyry copper-gold mineralization at Kwanika and Mount Milligan, central British Columbia (NTS 093N/01,
19): fieldwork, soil conductivity and pH results; in Geoscience BC Summary of Activities2009, Geoscience
BC, Report 2010-1, p. 11–24.
Hoffman, S.J. (1986): Soil sampling: in Exploration Geochemistry: Design and Interpretation of Soil Surveys, W.K.
Fletcher, S.J. Hoffman, M.B. Mehrtens, A.J. Sinclair and I. Thomson (ed.), Society of Economic Geologists,
Reviews in Economic Geology, v. 3, p. 39–76.
Jago, C.P. (2008): Metal and alteration-zoning and hydrothermal flow paths at the moderately-tilted, silica-saturated
Mt. Milligan Cu-Au alkalic porphyry deposit. M.Sc. Thesis. The University of British Columbia, 227 pp.
Kerr, D.E. and Bobrowsky, P.T. (1991): Quaternary geology and drift exploration at Mount Milligan (93N/lE,
930/4W) and Johnny Mountain (104B/6E, 7W, 10W, 11E), British Columbia; in Exploration in British
Columbia 1990, BC Ministry of Energy, Mines and Petroleum Resources, p. 135–152.
Lett, R.E. and Sandwith, Z. (2008): Geochemical orientation surveys in the Quesnel Terrane between Quesnel and
Williams Lake, central British Columbia (NTS 093A, B, G); in Geological Fieldwork 2007, BC Ministry of
Energy, Mines and Petroleum Resources, Paper 2008-1, p. 49–60.
Mills, K. (2008): Technical report – feasibility, Mt. Milligan Property - northern BC; unpublished report to Terrane
Metals Corp.
Murphy, D.C., Gerasimoff, M., van der Heyden, P., Parrish, R.R., Klepacki, D.W. McMillan, W., Struik, L.C.,
Gabites, J.(1995): New geochronological constraints on Jurassic deformation of the Western Edge of North
America, Southeaster Canadian Cordillera, in Jurassic Magmatism and Tectonics of the North American
Cordillera: Geological Society of America, Special Paper 299, p. 159-172.
Nelson, J., Bellefontaine, K., Green, K., and MacLean, M., (1991): Regional Geological Mapping Near the Mt.
Milligan Copper-Gold Deposit (93W16, 93Nll): In Geological Fieldwork 1990, Paper 1991 -1. British
Columbia Ministry of Energy, Mines and Petroleum Resources.

GEOSCIENCE BC REPORT 2010-08
Page | 68
Nelson, J., Bellefontaine, K., Rees, C., and MacLean, M., (1992): Regional Geological Mapping in the Nation Lakes
Area (93N/2E,7E): In Geological Field Work 1991, Paper 1992-1. British Columbia Ministry of Energy, Mines
and Petroleum Resources.
Nelson, J., and Bellefontaine, K. (1996): The Geology and Mineral Deposits of North-Central Quesnellia; Tezzeron
Lake to Discovery Creek, Central British Columbia; British Columbia Geological Survey. Bulletin 99, 112 pp.
Nixon, G.T., (1993): 40
Ar-39
Ar and U-Pb geochronometry of the Polaris Alaskan-type complex, British Columbia:
precise timing of Quesnellia-North America interaction. Geological Association of Canada / Mineralogical
Association of Canada, Program and Abstracts Joint Annual Meeting, Edmonton, P. A76.
Panteleyev, A. (1995): Porphyry Cu-Au: Alkalic; in Selected British Columbia Mineral Deposit Profiles, Volume 1 -
Metallics and Coal, D.V. Lefebure and G.E. Ray (ed.), BC Ministry of Energy, Employment and Investment,
Open File 1995-20, p. 83–86.
Rebagliati, C.M., 1988, Mt. Milligan property assessment report, Assessment Report No. 17936, Rebagliati
Geological Consulting, September 30th
, 1988, Omineca Mining Division
Ricker, K. E. (1991): A Preliminary Appraisal of the Surficial Geology of the Mt. Milligan Mine Site with Special
Reference to Tailings Impoundment Area “A”: unpublished report to Placer Dome Inc., January 31, 1991.
Sketchley, D.A., Rebagliati, C.M., Delong, C., 1995, Geology, alteration and zoning patterns of the Mt. Milligan
copper-gold deposit: Canadian Institute of Mining and Metallurgy, Special Vol. 46, p. 650-665.
Smee, B.W. (1983): Laboratory and field evidence in support of the electrogeochemically enhanced migration of
ions through glaciolacustrine sediment; in Geochemical Exploration 1982, G.R. Parslow (ed.), Journal of
Geochemical Exploration, v. 19, p. 277–304.
Smee, B.W. (1997): The formation of surficial geochemical pattern over buried epithermal gold deposits in desert
environments. Results of a test of partial extraction techniques; in Exploration „97, Symposium Volume,
Toronto, p. 301–314.
Smee, B.W. (1998): A new theory to explain the formation of soil geochemical responses over deeply covered gold
mineralization in arid environments; Journal of Geochemical Exploration, v. 61, p. 149–172.
Smee, B.W. (1999): The effect of soil composition on weak leach solution pH: a potential exploration tool in arid
environments; Explore, No. 102, p. 4–8.
Smee, B.W. (2009): Soil micro-layer, airborne particles and pH: the Govett connection; in Proceedings of the 24th
International Applied Geochemistry Symposium, Fredericton, 2009, v. 1, p. 91–95.
Southam, G. and Saunders, J. A. (2005): The geomicrobiology of ore deposits; Econ. Geol., v. 100, No. 6., p. 1067-
1084.
Sutherland, D. (2009): Soil Gas Hydrocarbons: A dual purpose geochemical exploration tool used in the search for
various types of blind targets; presentation at the 24th
International Applied Geochemical Symposium,
University of New Brunswick, Fredericton, June 1st – 4
th, 2009.
Sutherland, D. (2010): Soil Gas Hydrocarbons (SGH): presentation at PDAC, Toronto, March, 2010.