an assessment of projects on the clean development ...unctad.org/en/docs/ditcted20065_en.pdf · an...
TRANSCRIPT

19 October 2006
ENGLISH ONLY
United Nations Conference on Trade and Development
An Assessment of Projects on the Clean Development Mechanism (CDM) in India*
Prepared by
Joseph B. Gonsalves1
*The views expressed in this paper are those of the author and do not necessarily reflect the views of the United Nations.
1 Consultant, United Nations Conference on Trade and Development, Geneva. The author wishes to thank Mr. Lucas Assunção, Climate Change Programme and Biotrade Initiative, UNCTAD, for helpful discussions. UNCTAD/DITC/TED/2006/5


Contents
Executive summary....................................................................................................................7 Overview of CDM market .........................................................................................................9
..................................................................9Analysis from India’s national strategic study .........................................................................11World Bank study of the carbon market
.........................................................................12CDM project locations worldwide ........................................................................13Types of CDM projects worldwide ............................................................14Structure of CDM transactions worldwide
GHG emissions in India...........................................................................................................14 Areas of potential CDM in India .............................................................................................19
..............................................................20CDM potential in India’s electric power sector .........................................................21Overview of India’s electric power industry .................................................23Better utilization of power generation technology
.........................................24Integrated Gasification Combined Cycle (IGCC) ................................................................24Cogeneration and combined cycle ..........................................................................24Supercritical thermal plants .............................................................................24Fluidized bed combustion
................................................................................25Fuel switching in power generation .......................................................25CDM potential in renewal energy (RE) technology
...........................................27Barriers in commercializing biomass energy projects .........................................28Financing from IREDA for renewable energy projects .......................................................................28CDM projects in renewable energy
..........................................................29Biomass (excluding bagasse) projects ............................................................................................29Bagasse projects ...................................................................................29Hydroelectric projects ................................................................................................29Wind projects ............................................................................................29Manure projects ..............................................................................................29Biogas projects .....................................................................................30Gasification projects ..........................................................................................30Biodiesel projects
..........................................................................30Improved energy efficiency in industry ..........................................................................................................30Iron and steel ...................................................................................................................31Cement .................................................................................................................31Fertilizer .............................................................................................................31Aluminium ........................................................................................................32Pulp and paper
......................................................................................32Thermal destruction of HFC-23 ............................................................................................33Thermal destruction of N2O .......................................................................33GHG mitigation in the transport industry ...................................................33Power generation from municipal solid waste (MSW)
National CDM Authority .........................................................................................................34 .......................................................35Indian CDM National Authority’s approval criteria
Financing structures for CDM eligible projects.......................................................................37 ..............................................................................................................37Equity financing .......................................................................37Venture capital and special mutual funds ............................................................................................................38Corporate finance ...........................................................................................................................38Lending ............................................................38Merchant financing – Lease/equipment finance
3

................................................................................................................38Project finance .................................................................................................39Banking sector structure ................................................................................................................................39Risks
Issues and concerns related to project preparation and foreign participation..........................40 Projects approved by Indian CDM Authority..........................................................................41 Status of Indian CDM projects at the UNFCCC Executive Board..........................................45
....................................................................................45Procedure for obtaining approval ...................................................................................................46Baseline scenario ..................................................................................................46Baseline approach ..........................................................................................................47Additionality ...............................................................................................................49Validation ............................................................................................................49Registration ............................................................................................................49Verification ...........................................................................................................49Certification
................................................................................................49Registered CDM projects ...................................50GHG emission reduction by thermal oxidation of HFC-23 .............50Biomass in Rajasthan: Electricity generation from mustard crop residue ........................515 MW Dehar Grid-connected Small Hydroelectric Project (SHP)
........................................................................52CDM projects submitted for registration ...........................................52Clarion (12 MW) renewable sources biomass project
..........................53CDM projects under request for registration or review of registration ......................................................53Indian CDM methodologies approved by UNFCCC .....................................54Indian CDM methodologies under consideration by UNFCCC ........................................................56Indian CDM methodologies rejected by UNFCCC
Conclusions..............................................................................................................................59 References................................................................................................................................63
4

Tables Table 1. Summary of projected demand for carbon reduction ...............................................10 Table 2. Estimates of total CDM demand (MTCO2eq) in 2010 ................................................10 Table 3. India’s initial national greenhouse gas inventories ...................................................15 Table 4. CO2 emissions from India in 1994.............................................................................17 Table 5. Project design documents funded by international donors in India...........................40 Table 6. CDM project-cycle related issues ..............................................................................41 Table 7. Projects approved by the National CDM Authority ..................................................42 Table 8. Indian CDM methodologies approved by UNFCCC ................................................53 Table 9. Indian CDM methodologies under consideration by UNFCCC ...............................54 Table 10. CDM methodologies rejected by UNFCCC ...........................................................56
Figures Figure 1. CER traded, million tons CO2 equivalent.................................................................11 Figure 2. Buyers of CERs from January 2004 to April 2005 ..................................................11 Figure 3. CDM projects, by country ........................................................................................12 Figure 4. Types of CDM projects worldwide ..........................................................................13 Figure 5. Sectoral GHG emissions, 1994.................................................................................16 Figure 6. Contribution of various industries to GHG emissions in 1994 ................................18 Figure 7. GHG emissions from fuel combustion .....................................................................19 Figure 8. GHG mitigation potential in India in key sectors.....................................................20 Figure 9. GHG mitigation potential from power generation in India ......................................20 Figure 10. Growth of India's electric power generation capacity ............................................21 Figure 11. Distribution of power generation, by sector ...........................................................22 Figure 12. Distribution of renewable energy projects, by sector.............................................28 Figure 13. GHG mitigation potential from industries..............................................................32
5

Executive summary India is expected to capture between 20 and 30 per cent of the CDM market, bringing in up to $300 million in revenue. Several favourable enabling factors have contributed to India’s pre-eminent position in the CDM market such as a good technical base and a pro-active National CDM authority, which includes secretaries from ministries such as finance, non-conventional energy sources and power. The Ministry of Environment and Forests is the nodal ministry for CDM issues in India. Over the eighteen-month period from January 2004 to June 2005, 80 projects were approved by the National CDM Authority, far more than in any other country during the same period. The biggest sources of greenhouse gas emissions in India are the energy sector (61 per cent), the agricultural sector (28 per cent) and industrial processes (8 per cent). Projects in renewable energy, improved industrial efficiency and industrial processes, fuel switching and municipal solid waste disposal offer the greatest potential for CDM. The 44 CDM projects in renewable energy that have received host-country approval as of June 2005 include projects based on biomass (bagasse, rice husk and cotton stalk) for generating electricity, small hydroelectric plants, wind power, biogas, biodiesel and biomass gasification. Improved energy efficiency projects (25) include waste heat recovery projects in the iron and steel, cement, ammonia and pulp and paper industries, and other energy efficiency projects such as installing more efficient pumps and metering devices in a municipal water delivery system. The five fuel switching projects involve changing to a fuel having a lower carbon-to-hydrogen ratio, such as from coal to oil or natural gas, or from oil to natural gas, in power generating plants. Included in the five projects on improved industrial processes are two on the thermal destruction of HFC-23, a greenhouse gas, and one on the replacement of clinker in cement by non-cementitous material like fly-ash. The lone municipal solid waste disposal project involves the anaerobic digestion of organically degradable matter to produce methane, which serves as the fuel for the power plant. In a CDM project, the buyer of the generated carbon emission reduction (typically a government of an Annex I country or its agent) buys the certified emission reduction just like the purchase of a commodity or service. The development of CDM projects in India is largely consultant-driven and/or influenced by international donors’ capacity-building initiatives in support of PDD (project design document) development. Financing for the projects is available through banks and financial institutions and the Indian Renewable Energy Development Agency. The PDD is the key document required for the approval of a CDM, and there are several hurdles in preparing the PDD. Firstly, the data for developing the baseline case might be difficult to obtain. But frequently it is not easy to demonstrate the necessary additionality. Additionality means proving that the proposed CDM project leads to a lower carbon emission than the baseline case, that no official development funds would be used in the CDM project, that there are feasible alternate technologies other than the one to be used in the CDM project, and that the CDM project would not be financially viable without CDM revenue. In conclusion, high quality CDM projects must be developed within the next two years for India to capitalize on its CDM potential during the first commitment period, 2008-2012. Implementation of the CDM in India can deliver significant local, economic and sustainable
7

development co-benefits. India’s CDM strategy, policy, and implementation plans should include guidance on unresolved issues such as the sharing of CER revenue between project proponents and utilities. Finally, cooperation with potential investors and stakeholders from the public and private sectors should be encouraged to establish facilities for risk management and project financing. This could take the form of a national CDM fund that supports the development of good quality and highly relevant CDM projects.
8

Overview of CDM market A review of the National Communications submitted by Annex 1 countries (EU15 + OECD) reveals that the total annual carbon demand of the Annex 1 countries is in the range of 415– 1250 MTCO2eq (million tonnes of CO2 equivalent). This estimate takes into account the emission trajectories of those countries and domestic action to reduce the emissions since 1990. Given the supply potential of "hot air" (the excess of the 1990 emission level over the current level) in some countries and JI ERU (joint implementation emission reduction units), the global CDM market is expected to be between 38 and 264 MTCO2eq per year. The GHG emission is reported in terms of million tonnes of CO2 equivalent since the main GHGs — carbon dioxide, methane, nitrous oxide, perfluorocarbons, hydrofluorocarbons and sulphur hexafluoride — have different global warming potentials (GWPs). Relative to carbon dioxide, methane has a GWP of 21 and nitrous oxide a GWP of 310. The other GHGs have much larger GWPs. Hence since a 1 million tonne emission of methane has the same global warming effect as a 21 million tonne emission of carbon dioxide, it is considered to be the same as a 21 MTCO2eq. India faces a potential CDM market that has become smaller than the originally envisioned size, primarily because of the rejection of the Kyoto Protocol by the United States, which is the largest emitter of GHGs in the world, accounting for over a third of the CO2 emitted by Annex 1 countries. The existence of huge amounts of "hot air", mainly from the Russian Federation and Ukraine (and now possibly from Kazakhstan), and the rules concerning the inclusion of sinks in the Marrakesh Accords have further reduced the CDM market. Analysis from India’s national strategic study Literature-based analysis and carbon emission reduction trade (CERT) models indicate that India is likely to capture 10 per cent of the global carbon market during the first commitment period of 2008–2012. However, data from the World Bank Study, indicating a range of 20–30 per cent, are more realistic since they are based on project data. Thus India’s volume of CER (carbon dioxide emission reduction) exports in 2010 may range between 7.5 MTCO2eq and 79 MTCO2eq, bringing in revenue in the range of $30–300 million per year. To meet a CER supply level of 15 MTCO2eq by 2010, a few large and several medium-to-small size projects would have to be in operation by 2007.
9

Table 1. Summary of projected demand for carbon reduction (Carbon Emission Reduction Trade Model and literature-based analysis)
Global carbon market 415–1250 MTCO2eq/year Global market carbon price range 1.3–6.1 $/TCO2eqGlobal CDM volume 37.8–264 MTCO2eqVolume of Indian CER exports* 7.5–78 MTCO2eqIndia’s CDM export revenue 30–300 million$/year India's share in CDM market 20–30 per cent
* The global CDM market volume and market price, the volume of Indian CER exports, and India’s export revenues and market share summarize the results of various CERT scenarios. The CER price of the scenario with the highest Indian CER export is $4/TCO2eq only. Therefore, the resulting export revenues are $30–300 million. Source: National Strategic Study (2005).
CERT results consider potential CER volume and price, but not crucial enabling factors such as institutional arrangements, project preparation and technical capacity, transaction costs, risk profile of country/project, transaction types, contractual arrangements, or host country CDM policies which determine the relative competitiveness of a host country. These factors seem to make India quite attractive at present, particularly relative to China. India could achieve CER exports closer to 20–25 MTCO2eq per year if it takes a proactive approach to CDM and if prospects for an extension of the Kyoto regime beyond 2012 emerge in the coming years. Currently, the emphasis is on contractual obligations for the first commitment period only. Table 2 shows that most of the CDM demand will be from the European Union and Japan. Table 2. Estimates of total CDM demand (MTCO2eq) in 2010
Government demand Industry demand Total demand
Natsource (2003)
Criquii and
Kitous (2003)
Natsource (2003)
Criquii and
Kitous (2003)
Natsource (2003)
Criquii and
Kitous (2003)
Australia and New Zealand
12 23
35
Canada 12.0–81.8 74 22.4 20 34.4–104.2 94European Union 25 53.9–462.8 113 45.0–173.7 111 98.9–636.5 224
Japan 17.7–217.6 26 34.8–92.4 34 52.5–310 60Norway and Switzerland
16 10 26
Total demand
83.6–762.2 241 102.2–288.5 198 185.8–1050.7 439
Source: National Strategic Study (2005).
10

The current early CDM market is a buyers’ market. Accordingly, prices reflect the buyers’ willingness to pay, the project type, the size and cost of transactions, the risks involved and the modalities for sharing them between buyers and sellers, and the premium for sustainable development contributions. When deals are transacted in the form of CER purchase agreements, as opposed to investment deals, the investors see India as an important CER supplier. World Bank study of the carbon market The World Bank Study for the International Emission Trading Association (IETA) indicates that the project-based emissions traded are rapidly increasing, approaching 107 million tons in 2004 (figure 1), a 38 per cent increase over the preceding year. The share of volume of emission reductions purchased by various countries from January 2004 to April 2005 is shown in figure 2, again confirming that most of the CDM demand is from the EU and Japan.
Figure 1. CER traded, million tons CO2 equivalent
0
20
40
60
80
100
120
1999 2000 2001 2002 2003 2004 2005 (Jan-Apr)
Year
CER
Source: World Bank/IETA.
Figure 2. Buyers of CERs from January 2004 to April 2005
Other EU32%
UK12%
Gov. Netherlands
16%
Japan21%
USA4%
Australia3%
Canada5%
New Zealand7%
11
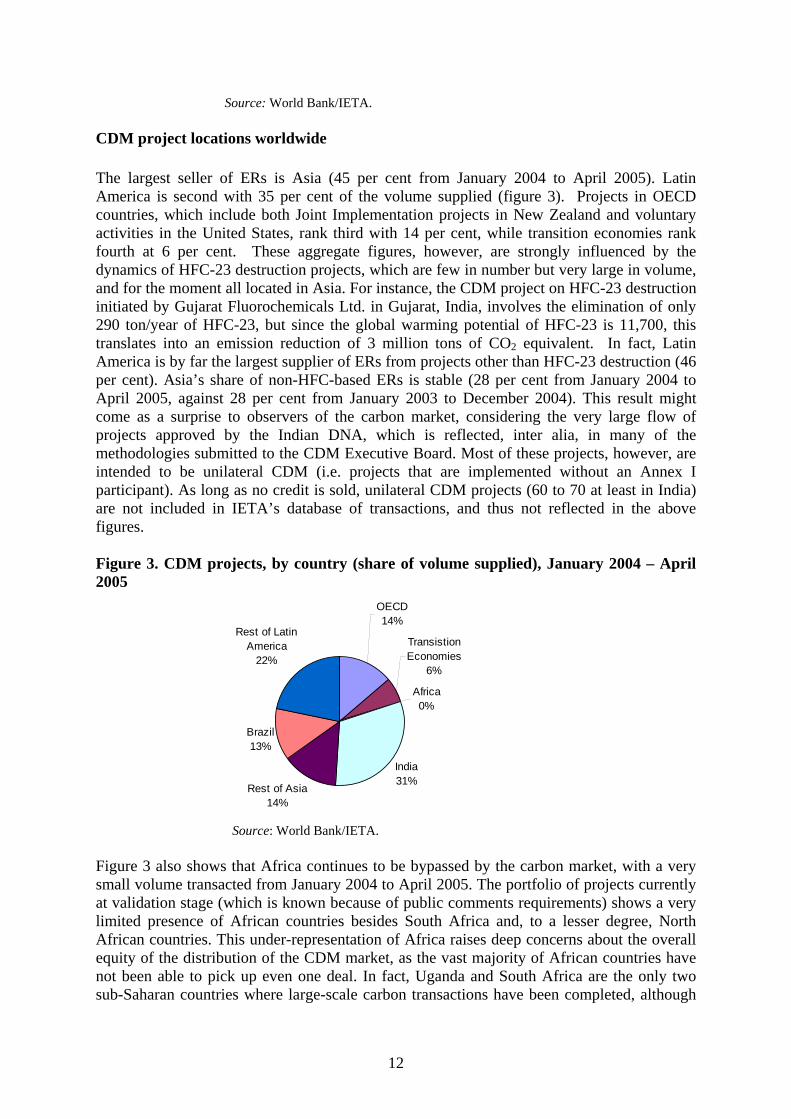
Source: World Bank/IETA. CDM project locations worldwide The largest seller of ERs is Asia (45 per cent from January 2004 to April 2005). Latin America is second with 35 per cent of the volume supplied (figure 3). Projects in OECD countries, which include both Joint Implementation projects in New Zealand and voluntary activities in the United States, rank third with 14 per cent, while transition economies rank fourth at 6 per cent. These aggregate figures, however, are strongly influenced by the dynamics of HFC-23 destruction projects, which are few in number but very large in volume, and for the moment all located in Asia. For instance, the CDM project on HFC-23 destruction initiated by Gujarat Fluorochemicals Ltd. in Gujarat, India, involves the elimination of only 290 ton/year of HFC-23, but since the global warming potential of HFC-23 is 11,700, this translates into an emission reduction of 3 million tons of CO2 equivalent. In fact, Latin America is by far the largest supplier of ERs from projects other than HFC-23 destruction (46 per cent). Asia’s share of non-HFC-based ERs is stable (28 per cent from January 2004 to April 2005, against 28 per cent from January 2003 to December 2004). This result might come as a surprise to observers of the carbon market, considering the very large flow of projects approved by the Indian DNA, which is reflected, inter alia, in many of the methodologies submitted to the CDM Executive Board. Most of these projects, however, are intended to be unilateral CDM (i.e. projects that are implemented without an Annex I participant). As long as no credit is sold, unilateral CDM projects (60 to 70 at least in India) are not included in IETA’s database of transactions, and thus not reflected in the above figures. Figure 3. CDM projects, by country (share of volume supplied), January 2004 – April 2005
OECD14%
Transistion Economies
6%
Africa0%
India31%
Rest of Asia14%
Brazil13%
Rest of Latin America
22%
Source: World Bank/IETA.
Figure 3 also shows that Africa continues to be bypassed by the carbon market, with a very small volume transacted from January 2004 to April 2005. The portfolio of projects currently at validation stage (which is known because of public comments requirements) shows a very limited presence of African countries besides South Africa and, to a lesser degree, North African countries. This under-representation of Africa raises deep concerns about the overall equity of the distribution of the CDM market, as the vast majority of African countries have not been able to pick up even one deal. In fact, Uganda and South Africa are the only two sub-Saharan countries where large-scale carbon transactions have been completed, although
12
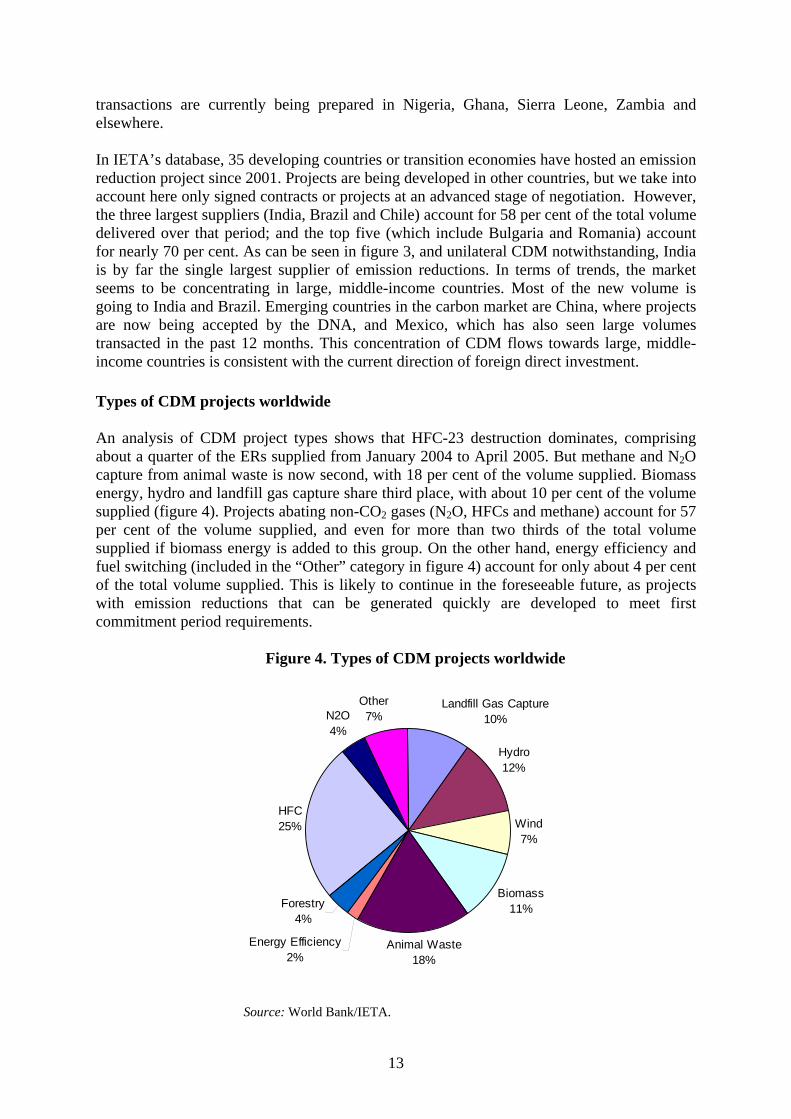
transactions are currently being prepared in Nigeria, Ghana, Sierra Leone, Zambia and elsewhere. In IETA’s database, 35 developing countries or transition economies have hosted an emission reduction project since 2001. Projects are being developed in other countries, but we take into account here only signed contracts or projects at an advanced stage of negotiation. However, the three largest suppliers (India, Brazil and Chile) account for 58 per cent of the total volume delivered over that period; and the top five (which include Bulgaria and Romania) account for nearly 70 per cent. As can be seen in figure 3, and unilateral CDM notwithstanding, India is by far the single largest supplier of emission reductions. In terms of trends, the market seems to be concentrating in large, middle-income countries. Most of the new volume is going to India and Brazil. Emerging countries in the carbon market are China, where projects are now being accepted by the DNA, and Mexico, which has also seen large volumes transacted in the past 12 months. This concentration of CDM flows towards large, middle-income countries is consistent with the current direction of foreign direct investment. Types of CDM projects worldwide An analysis of CDM project types shows that HFC-23 destruction dominates, comprising about a quarter of the ERs supplied from January 2004 to April 2005. But methane and N2O capture from animal waste is now second, with 18 per cent of the volume supplied. Biomass energy, hydro and landfill gas capture share third place, with about 10 per cent of the volume supplied (figure 4). Projects abating non-CO2 gases (N2O, HFCs and methane) account for 57 per cent of the volume supplied, and even for more than two thirds of the total volume supplied if biomass energy is added to this group. On the other hand, energy efficiency and fuel switching (included in the “Other” category in figure 4) account for only about 4 per cent of the total volume supplied. This is likely to continue in the foreseeable future, as projects with emission reductions that can be generated quickly are developed to meet first commitment period requirements.
Figure 4. Types of CDM projects worldwide
Landfill Gas Capture10%
Hydro12%
Wind7%
Biomass11%
Animal Waste18%
Energy Efficiency2%
Forestry4%
HFC25%
N2O4%
Other7%
Source: World Bank/IETA.
13
Structure of CDM transactions worldwide Most project-based transactions to date (nearly all since January 2004) follow a commodity model, whereby the buyer of carbon purchases the emission reductions generated by the project as it would purchase any other commodity or service. Only a few transactions follow an investment model, whereby the buyer invests either equity or debt in a project and gets the emission reductions as part of its returns. This has important implications for the financial structure of CDM projects. Indeed, carbon buyers under a commodity model tend to pay for the carbon on delivery, thereby reducing their exposure to project risks. Although this future cash flow adds to the internal rate of return, the projects often need upfront financing to cover, inter alia, construction costs. Most carbon contracts thus do not directly address the upfront financing barrier, but do so indirectly. Since carbon payments are payable in strong currencies (typically, dollars, euros or yens) and originate from buyers with high credit ratings, they can reduce risks, increase financiers’ confidence in the project and leverage additional capital. So far, there are few cases where upfront financing (or better terms for upfront financing) was leveraged by a carbon contract. The relatively small size of the market and the underlying uncertainties have up to now discouraged large financial institutions, leaving the market to specialized entities such as mezzanine financiers. The simultaneous entry into force of the EU Emission Trading Scheme (ETS) and of the Kyoto Protocol might provide additional incentives for financial institutions to lend against carbon revenues. Some buyers increasingly offer upfront financing as well. Even within the broad parameters defined above (commodity purchase, payment on delivery), there is as yet no standard contract for the purchase of emission reductions from projects. Contractual arrangements still vary greatly, depending on how various risks are allocated between buyer and seller: in the case of project risk(s), whether or not the project will adequately perform and produce the expected amount of ERs; and in the case of country risk(s) and Kyoto-related risks, the risk that the project might ultimately not be registered under the Kyoto Protocol (if, for example, the project is not deemed additional by the CDM Executive Board). Various contractual features are used to allocate these risks between the buyer and the seller. They include transfer of risk of the ERs purchased (definition of the ERs, and point of delivery), guarantee structures, upfront payments, penalties and damage clauses, default clauses or the disbursement schedule. The limited data on the contractual structure of project-based transactions indicate that the treatment of Kyoto-related risks is especially variable across contracts. GHG emissions in India India’s first National Communication (2004) is the latest official estimate of GHG emissions from India. Table 3 summarizes the GHG emissions from various sectors by sources and removals by sinks for India for the base year 1994. The aggregate emissions from the anthropogenic activities in India totalled 793.49 million tons (MT) of CO2, 18.08 MT of CH4 and 0.18 MT of N2O. In terms of CO2 equivalent, these emissions amounted to 1,228.5 MT. The per capita CO2 emissions were 0.87 T-CO2 in 1994, 4 per cent of the US per capita CO2 emissions in 1994, 8 per cent of Germany, 9 per cent of the United Kingdom, 10 per cent of Japan and 23 per cent of the global average. On the basis of the global warming potential (GWP) indices, CO2 emissions contributed 65 per cent of total GHGs, CH4 contributed 31 per cent and 4 per cent of emissions were contributed by N2O.
14

Table 3. India’s initial national greenhouse gas inventories of anthropogenic emissions by sources and removal by sinks of all greenhouse gases not controlled by the Montreal Protocol for the base year 1994
GHG source and sink categories (kilotons, kT, per year)
CO2emissions
CO2 removals CH4 N2O CO2eq
emissions* Total (net) national emissions 817 023 23 533 18 083 178 1 228 540 1 All energy 679 470 2 896 11.4 743 820 Fuel combustion Energy and transformation industries 353 518 4.9 355 037 Industry 149 806 2.8 150 674 Transport 79 880 9 0.7 80 286 Commercial/institutional 20 509 0.2 20 571 Residential 43 794 0.4 43 918 All other sectors 31 963 0.4 32 087 Biomass burnt for energy 1 636 2.0 34 976 Fugitive fuel emission Oil and natural gas system 601 12 621 Coal mining 650 13 650 2 Industrial processes 99 878 2 9 102 710 3 Agriculture 14 175 151 344 485 Enteric fermentation 8 972 188 412 Manure management 946 1 20 176 Rice cultivation 4 090 85 890 Agricultural crop residue 167 4 4 747 Emission from soils 146 45 260
4 Land use, land-use change and forestry*
37 675 23 533 6.5 0.04 14 292
CO2emissions
CO2 removals
CH4 N2O CO2eqemissions*
Changes in forest and other woody biomass stock
14 252 (14 252)
Forest and grassland conversion 17 987 17 987 Trace gases from biomass burning 6.5 0.04 150 Uptake from abandonment of managed
lands 9 281 (9 281)
Emissions and removals from soils 19 688 19 688
5 Other sources as appropriate and to the extent possible
5a Waste 1 003 7 23 233 Municipal solid waste disposal 582 12 222 Domestic waste water 359 7 539 Industrial waste water 62 1 302 Human sewage 7 2 170 5b Emissions from bunker fuels* 3 373 3 373 Aviation 2 880 2 880 Navigation 493 493 * Converted by using GWP indexed multipliers of 21 and 310 for converting CH4 and N2O respectively. Source: National Communication (2004).
15

Figure 5 graphically depicts the GHG emissions in India in 1994. Figure 5. Sectoral GHG emissions, 1994 (total: 1,228 MT CO2eq)
Energy61%
Industrial Processes8%
Others (including waste)
2%
Agriculture28%
Land use, land use change and forestry
1%
Source: National Communication (2004). Energy-related GHG emissions are mainly a result of combustion of fossil fuels. Among the fossil fuels, coal combustion had a dominant share of emissions, amounting to about 475.53 MTCO2eq GHGs (i.e. about 64 per cent of all energy emissions). The non-CO2 emissions in this category are from biomass burning and fugitive emissions released from coal mining and handling of oil and natural gas systems. An analysis of the distribution of the total CO2eq emissions across all the sub-components of all energy activities indicates that the major emitters were the energy and transformation industries (47 per cent), constituting mainly electric power generation, industry (20 per cent) and the transport sector (11 per cent). Eight per cent (i.e. 102.71 MTCO2eq) of total GHGs released in 1994, were from the industrial process sector. These include CO2, CH4, and N2O emissions from production processes of chemicals, metals, minerals, cement, lime, soda ash, ammonia, nitric acid, calcium carbide, iron and steel, ferro alloys, aluminium, limestone, and dolomite use (table 4 and figure 6).
16

Table 4. CO2 emissions from India in 1994
GHG source and sink CO2 (emissions) CO2 (removals)
Categories (kilotonnes, kT)
Total CO2 817 023 23 553
1. All energy 679 470 Energy and transformation industries 353 518 Industry 149 806 Transport 79 880 Commercial/institutional 20 509 Residential 43 794 All other sectors 31 963 2. Industrial processes 99 878 Cement production 30 767 Lime production 1 901 Lime stone and dolomite use 5 751 Soda ash use 273 Ammonia production 14 395 Carbide production 302 Iron and steel production 44 445 Ferro alloys production 1 295 Aluminum production 749 3. Land use, land-use change and forestry 37 675 23 533Changes in forest and other woody biomass stock 14 252Forest and grassland conversion 17 987 Uptake from abandonment of managed lands 9 281 Emissions and removals from soils 19 688 4. Emissions from bunker fuels 3 373 Aviation 2 880 Navigation 493
Source: National Communication (2004).
17

Figure 6. Contribution of various industries to GHG emissions in 1994
Iron and Steel43%
Lime, Limestone, Dolomite
7%
Cement30%
Ammonia14%
Others6%
Source: National Communication (2004).
In 1994, the agriculture sector contributed 29 per cent of total CO2eq GHG emissions, amounting to 344.49 MTCO2eq. The agriculture sector mainly emitted CH4 and N2O. The CO2 emissions due to energy use in the agriculture sector are accounted for as a part of all energy emissions. The emissions sources accounted for in the agriculture sector are enteric fermentation in livestock, manure management, rice cultivation, agricultural soils and burning of agricultural crop residue. The bulk of the GHG emissions from the agriculture sector were from enteric fermentation (59 per cent), followed by rice paddy cultivation (23 per cent), and the rest were contributed by manure management, burning of agriculture crop residue and application of fertilizers to soils. GHG emissions from the land use, land-use change and forestry (LULUCF) sector are an aggregation of emissions from changes in forests and other woody biomass stock, forest and grassland conversion, abandonment of managed lands, and forest soils. The net CO2eq emission from this sector was 14.29 MT, which includes CO2 emission and sequestration, as well as the emission of CH4 and N2O. The LULUCF sector emitted 14.142 MT net CO2 in 1994. Methane and N2O emissions from this sector were 0.137 MTCO2eq and 0.0124 MTCO2eq, respectively. The disposal of waste and the processes employed to treat these wastes also create GHG emissions. The two main sources of GHGs from the waste sector in India are municipal solid waste disposal and wastewater handling for commercial and domestic sectors. The collection of waste takes place primarily in large cities. In smaller cities and towns, waste decomposes under aerobic conditions and thus methane is not emitted. The Ministry of Environment and Forests (MoEF) treats industrial wastewater in India using the responsibility of large industrial units. GHGs emitted from the waste sector in 1994 totalled 23.233 MTCO2eq, which is 2 per cent of the total national CO2-equivalent emissions. Out of this, the major
18

contribution was from municipal solid waste disposal activities (53 per cent), followed by domestic wastewater, which contributed 32 per cent of total GHG emissions from the sector. Areas of potential CDM in India A comparative analysis of GHG emissions from the energy sector (fuel combustion in different sectors) in 1994 with the estimates for 2000 shows an increase from 744 to 922 MTCO2. The bulk of this increase is in the energy and transformation sector, and for the most part includes fuel consumed for power generation (figure 7).
Figure 7. GHG emissions from fuel combustion
Source: National Communication (2004).
Given the predominance of the energy sector, the following areas have been identified for mitigating GHG emissions:
1. Electric power generation; 2. Renewable energy; 3. Industry — energy efficiency; 4. Transport; and 5. Municipal waste.
The potential reduction in GHG emissions up to the year 2012 (period 2004–2012) has been estimated at 417 MTCO2eq and is presented in figure 8.
19
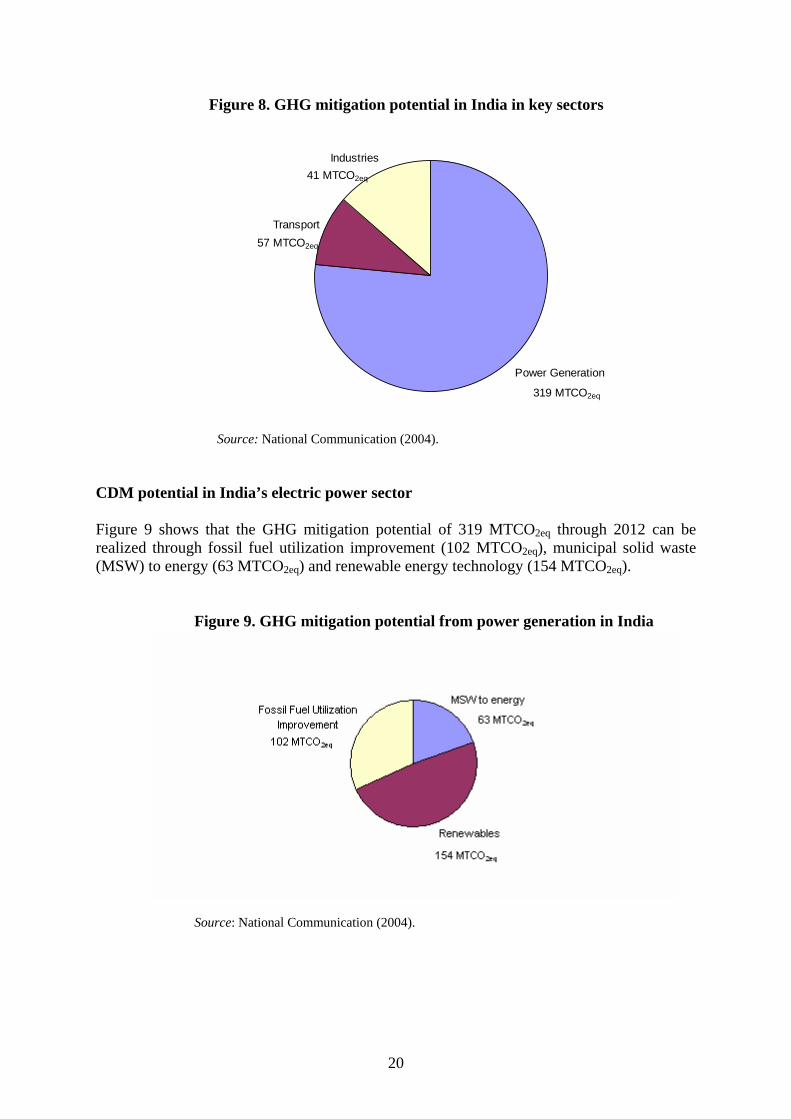
Figure 8. GHG mitigation potential in India in key sectors
Power Generation
Transport
Industries
319 MTCO2eq
41 MTCO2eq
57 MTCO2eq
Source: National Communication (2004).
CDM potential in India’s electric power sector Figure 9 shows that the GHG mitigation potential of 319 MTCO2eq through 2012 can be realized through fossil fuel utilization improvement (102 MTCO2eq), municipal solid waste (MSW) to energy (63 MTCO2eq) and renewable energy technology (154 MTCO2eq).
Figure 9. GHG mitigation potential from power generation in India
Source: National Communication (2004).
20

Overview of India’s electric power industry Figure 10 shows the rapid increase in India’s power generation capacity, which currently stands at 115,000 MW. Figure 10. Growth of India's electric power generation capacity
Source: Ministry of Power, Government of India (2005).
Although installed capacity in India has been growing, the supply of electricity has been unable to keep pace with the growth in demand. For instance, in January 2005, the shortfall in electricity supply was 12.4 per cent at peak demand (Central Electricity Authority, Ministry of Power, http://cea.nic.in/exe_summ/jan/21.pdf). In addition, a high electrical energy – GDP elasticity of 1.5 in India between 1985 and 1985, three times that in the United States, has resulted in considerable pressure to increase electricity supply from new and existing capacity. This large elasticity reflects the inefficiency of existing energy-using technologies in India, and the high energy-intensiveness of basic infra-structural industries, which contribute proportionately less to GDP. The distribution of electric power generation is shown in figure 11.
21

Figure 11. Distribution of power generation (115,545 MW), by sector
Source: Ministry of Power, Government of India (2005).
The electricity sector in India is largely owned by the state and central governments. Of the total installed capacity in 1990–1991, the State Electricity Boards (SEBs) accounted for 63 per cent, the central sector power corporations (owned by the central government) for 33 per cent, while private corporations accounted for only 4 per cent. The SEB is a vertically integrated industry responsible for generation, transmission and distribution of electricity for the entire state. Although state governments are required only to play an advisory role, in practice they have played an influential role in setting electricity prices for SEBs on the basis of social considerations and political interests. As a result, prices for domestic and agricultural consumers have been set below the average cost of generation and supply, while those for commercial and industrial use are above the average cost. In spite of this cross-subsidization, average revenue is still less than average cost and the gap has increased over time. This, together with non-payment of bills by customers and energy theft during transmission (20–25 per cent), has resulted in large financial losses for the SEBs, which have to be met through government subsidies. The average rate of return for all SEBs was negative, at –13.5 per cent in 1995. The poor performance of India's existing generating units has been a principal cause of power shortages and unreliable quality of power supply. The main culprits are the coal-fired thermal power stations, which account for 60 per cent of total installed capacity. The average plant load factor (PLF) of thermal power stations in India is less than 60 per cent, but varies considerably across regions. In 1989/1990, the southern region had the highest PLF (65.6 per cent), while the eastern and the north-eastern regions recorded low PLFs of 38.5 per cent and 26.8 per cent, respectively. In contrast, hydropower stations have far better track records since their performance relies largely on water flow.
22

The main reasons for the under-performance by the coal-fired thermal plants are as follows:
1. Design deficiencies, manufacturing and generic defects; 2. The operation and maintenance (O&M) deficiencies, causing prolonged and repeated
forced outages; 3. Inadequate and non-timely availability of spare parts, especially for imported
equipment; 4. Lack of resources for SEBs even for making payments to providers for supplies and
services, and to coal companies for coal supplies. Consequently, the SEBs were not able to take up the renovation and modernization programmes to the extent required;
5. The quality of coal being supplied had deteriorated as compared with the design quality. For instance, the heating value of Indian coal has dropped from 6,000 kcal/kg in the 1960s to the current 4,000 kcal/kg. Furthermore, the coal has a high ash content (40 per cent) and contains stones, boulders, shale and sand; and
6. There was excessive and inadequately trained manpower for the O&M of the plant. However, not all the thermal generating stations have such dismal records. For instance, the performance of 500 MW and 200 MW units has been satisfactory, and their PLFs have been higher than the national average. It is, in fact, the thermal units of 120/140 MW and below that are cause for concern. Most of these units have already logged more than 100,000 running hours and their performance can be improved only through a long-term rehabilitation or re-powering programme. Better utilization of power generation technology The Ministry of Power has identified 170 thermal units with installed capacity of 11,000 MW and 35 hydroelectric units with installed capacity of 3,000 MW that need renovation and modernization (R&M) and life extension (LE). Upgrading their performance/life extension is a cost-effective method of capacity creation (Rs. 10 million per MW for thermal and Rs. 6-7 million per MW for hydro as compared with Rs. 40 to 50 million per MW for new greenfield power projects). A state-wide R&M action plan is being formulated. R&M measures include installing more efficient equipment such as boilers, furnaces, pumps, turbines and generators, improving maintenance procedures and implementing coal beneficiation processes such as coal washing for optimal utilization of coal. An annual additional generation benefit of about 90 billion units (20 per cent of existing annual generation) is expected through R&M measures. Under the Accelerated Power Development Programme (APDP) funds would be provided for R&M schemes. As a result of R&M/LE improvements, the plant load factor of the thermal plants concerned has increased from 49 to 75 per cent (Ministry of Power, http://powermin.nic.in/JSP_SERVLETS/internal.jsp). CDM projects in four areas (see below) have the potential to be developed in power generation, although none has yet been submitted by India to the Executive Board of UNFCCC.
23

Integrated Gasification Combined Cycle (IGCC) IGCC technology heats coal to the point of gasification with steam in a controlled supply of air. The gas product contains hydrogen and carbon monoxide and is scrubbed to remove hydrogen sulphide. The cleaned gas is combusted, and the hot gases are expanded to drive a gas turbine and produce electricity. The turbine exhaust gas is still hot and is used to produce steam and drive a steam turbine, as well as to generate additional electricity. Overall efficiency is above 45 per cent. There is no particulate matter or hydrogen sulphide emission. The major drawback to this technology is capital cost, which may be offset by CDM revenue. Cogeneration and combined cycle In cogeneration and combined cycle, high-pressure steam is generated in boilers and fed to a high-pressure steam turbine that produces electricity. The exhaust from the high-pressure steam turbine still has thermal energy and can be used as process steam for providing heat. This is called cogeneration since electricity and heat have been produced. If the exhaust from the high-pressure turbine is sent to an intermediate pressure turbine, further electricity can be generated. This is the combined cycle, where efficiencies can exceed 45 per cent. Supercritical thermal plants Above a pressure of 22.1 mega pascals (225 kg/cm2) and a temperature of 374oC, water is in a supercritical state, with no distinction between the vapour and liquid states. In a normal, sub-critical boiler, the vapour (steam) has to be separated from the liquid before being sent to the steam turbine. In supercritical boilers, no separation is needed. The only difference in supercritical thermal plants is the special material of construction, such as inconel, a nickel-based alloy, required to withstand the elevated pressures in feedwater pumps and feedwater train equipment. Over 400 supercritical thermal plants are in operation worldwide, many with efficiencies of over 45 per cent. Fluidized bed combustion The coal is burnt in a bed through which hot air is passed, fluidizing the bed. At lower air velocities, the coal particles are in bubbling motion (bubbling fluidized bed combustion), but at higher air velocities the coal particles take on circulatory motion (circulation fluidized bed combustion). As the coal particles are burnt away and become smaller, they are elutriated with the gases, and subsequently removed as fly ash. In-bed tubes are used to control the bed temperature and generate steam. The flue gases are normally cleaned using a cyclone, and then pass through further heat exchangers, raising steam. The steam drives the steam turbines, producing electricity. Fluidized bed combustion is more efficient than the common pulverized coal combustion, especially for high-ash coal usually available in India. Combustion in a fluidized bed takes place at 800–900oC instead of the 1200–1400oC in a pulverized coal combustor, thus resulting in reduced emission of nitrous oxides and particulate matter to the atmosphere.
24

A comparison of the cost and benefits of some of the above technologies is as follows:
GHG mitigation option Abatement cost
National mitigation potential (million ton
CO2/year) Fluidized bed combustion Low 8.2 Renovation and modernization High 8.6 Integrated Gasification Combined Cycle High 14.6 Fuel switching in power generation Switching to fuels with a lower carbon-to-hydrogen ratio, such as from coal to oil or natural gas, and from oil to natural gas, can reduce emissions. Natural gas has the lowest CO2 emissions per unit of energy of all fossil fuels, at about 15 kg C/GJ, compared with oil with about 20 kg C/GJ and coal with about 25 kg C/GJ (all based on low heating values) (Intergovernmental Panel On Climate Change Technologies, Policies and Measures for Mitigating Climate Change, November 1996). The lower-carbon-containing fuels can, in general, be converted with higher efficiency than coal. For instance, the efficiencies of a coal-fired plant and natural-gas-fired plant are 30 per cent and 45 per cent, respectively. Thus the reduction in CO2 emission when switching from coal to natural gas is 50 per cent per kWh of electricity generated. Five CDM fuel-switching projects (to natural gas) have been submitted to the Executive Board from India. They are as follows:
1. A 1,050 MW natural-gas-based grid-connected combined cycle power generation project at Akhakhol by M/s Gujarat Torrent Power Generation Limited;
2. A 535 MW project by Essar Power Limited at its power plant at Hazira in Surat District, Gujarat;
3. A 200 MW project for switching of fuel from naphtha to natural gas by BSES Andhra Power Limited (BAPL) at its CCGT power plant at Samalkot, East Godavri District, Andhra Pradesh;
4. A 25 MW natural gas captive power plant, Coromondal Electric company Ltd, Tamil Nadu; and
5. An 18 MW natural gas plant, OPG Energy Private Ltd., Tamil Nadu. CDM potential in renewal energy (RE) technology The Government of India is making a concerted effort to promote renewal energy technology. Fifty-five per cent of the 80 projects approved by the Indian CDM Authority are in the RE sector. India is the only country in the world that has a dedicated ministry for promoting renewable energy, the Ministry for Non-conventional Energy Sources (MNES), and an exclusive public sector financial sector, the Indian Renewable Energy Development Agency (IREDA). MNES prepared between 1993 and 1996 a set of guidelines for “Promotional and Fiscal Incentives by State Governments for Power Generation from Non-Conventional Energy Sources". These guidelines were designed to bring about a level playing field for power generation from renewable energy sources. Salient features included a preferential
25
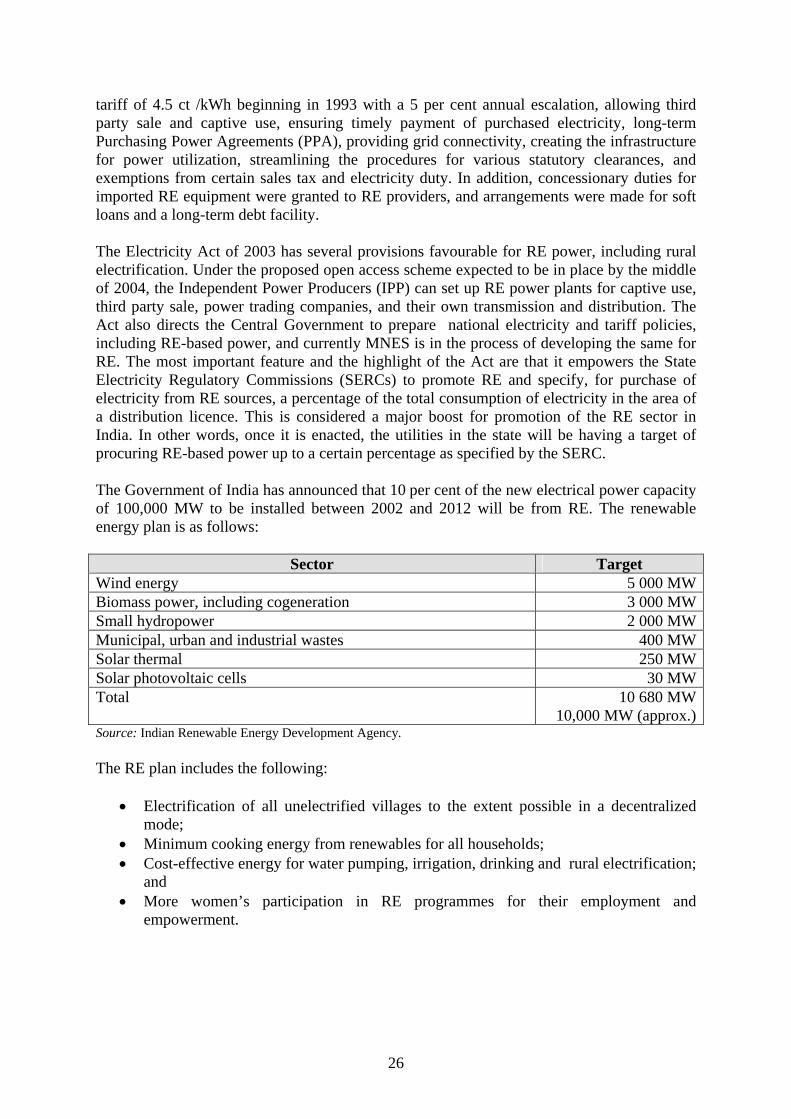
tariff of 4.5 ct /kWh beginning in 1993 with a 5 per cent annual escalation, allowing third party sale and captive use, ensuring timely payment of purchased electricity, long-term Purchasing Power Agreements (PPA), providing grid connectivity, creating the infrastructure for power utilization, streamlining the procedures for various statutory clearances, and exemptions from certain sales tax and electricity duty. In addition, concessionary duties for imported RE equipment were granted to RE providers, and arrangements were made for soft loans and a long-term debt facility. The Electricity Act of 2003 has several provisions favourable for RE power, including rural electrification. Under the proposed open access scheme expected to be in place by the middle of 2004, the Independent Power Producers (IPP) can set up RE power plants for captive use, third party sale, power trading companies, and their own transmission and distribution. The Act also directs the Central Government to prepare national electricity and tariff policies, including RE-based power, and currently MNES is in the process of developing the same for RE. The most important feature and the highlight of the Act are that it empowers the State Electricity Regulatory Commissions (SERCs) to promote RE and specify, for purchase of electricity from RE sources, a percentage of the total consumption of electricity in the area of a distribution licence. This is considered a major boost for promotion of the RE sector in India. In other words, once it is enacted, the utilities in the state will be having a target of procuring RE-based power up to a certain percentage as specified by the SERC. The Government of India has announced that 10 per cent of the new electrical power capacity of 100,000 MW to be installed between 2002 and 2012 will be from RE. The renewable energy plan is as follows:
Sector Target Wind energy 5 000 MWBiomass power, including cogeneration 3 000 MWSmall hydropower 2 000 MWMunicipal, urban and industrial wastes 400 MWSolar thermal 250 MWSolar photovoltaic cells 30 MWTotal 10 680 MW
10,000 MW (approx.)Source: Indian Renewable Energy Development Agency. The RE plan includes the following:
• Electrification of all unelectrified villages to the extent possible in a decentralized mode;
• Minimum cooking energy from renewables for all households; • Cost-effective energy for water pumping, irrigation, drinking and rural electrification;
and • More women’s participation in RE programmes for their employment and
empowerment.
26
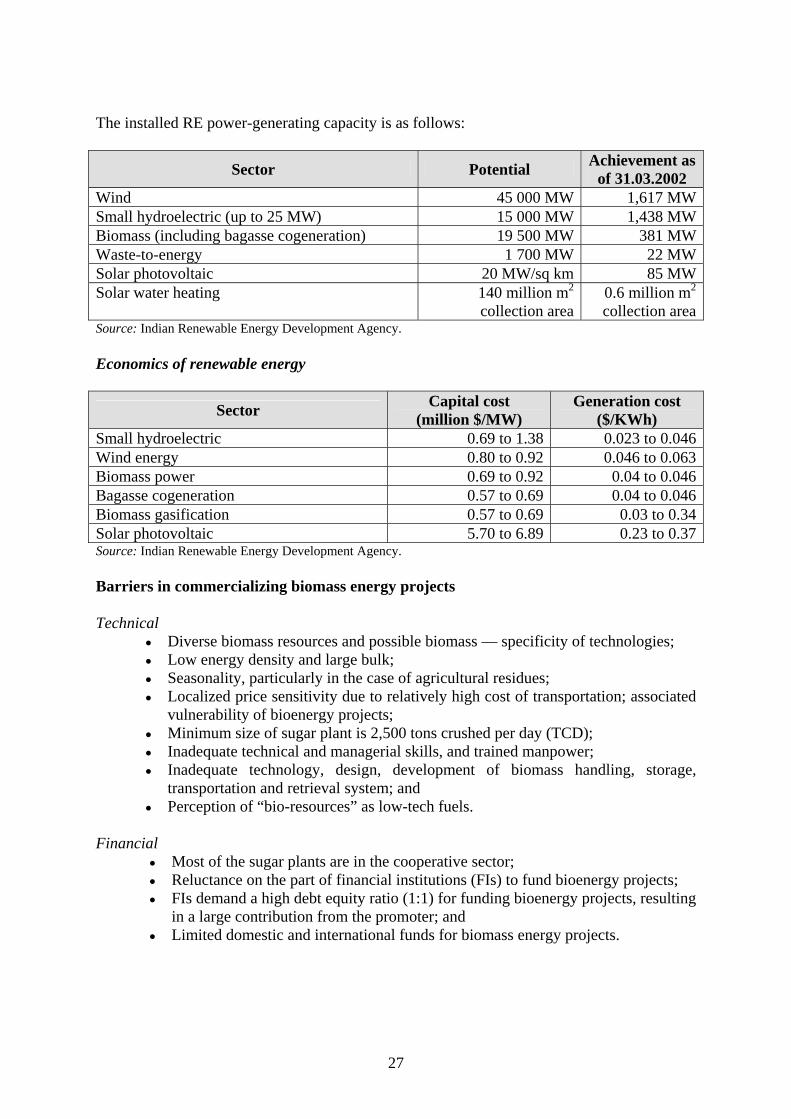
The installed RE power-generating capacity is as follows:
Sector Potential Achievement as of 31.03.2002
Wind 45 000 MW 1,617 MWSmall hydroelectric (up to 25 MW) 15 000 MW 1,438 MWBiomass (including bagasse cogeneration) 19 500 MW 381 MWWaste-to-energy 1 700 MW 22 MWSolar photovoltaic 20 MW/sq km 85 MWSolar water heating 140 million m2
collection area 0.6 million m2
collection areaSource: Indian Renewable Energy Development Agency. Economics of renewable energy
Sector Capital cost (million $/MW)
Generation cost ($/KWh)
Small hydroelectric 0.69 to 1.38 0.023 to 0.046Wind energy 0.80 to 0.92 0.046 to 0.063Biomass power 0.69 to 0.92 0.04 to 0.046Bagasse cogeneration 0.57 to 0.69 0.04 to 0.046Biomass gasification 0.57 to 0.69 0.03 to 0.34Solar photovoltaic 5.70 to 6.89 0.23 to 0.37Source: Indian Renewable Energy Development Agency. Barriers in commercializing biomass energy projects Technical
• Diverse biomass resources and possible biomass — specificity of technologies; • Low energy density and large bulk; • Seasonality, particularly in the case of agricultural residues; • Localized price sensitivity due to relatively high cost of transportation; associated
vulnerability of bioenergy projects; • Minimum size of sugar plant is 2,500 tons crushed per day (TCD); • Inadequate technical and managerial skills, and trained manpower; • Inadequate technology, design, development of biomass handling, storage,
transportation and retrieval system; and • Perception of “bio-resources” as low-tech fuels.
Financial
• Most of the sugar plants are in the cooperative sector; • Reluctance on the part of financial institutions (FIs) to fund bioenergy projects; • FIs demand a high debt equity ratio (1:1) for funding bioenergy projects, resulting
in a large contribution from the promoter; and • Limited domestic and international funds for biomass energy projects.
27
Utility/SEB-related
• There is no compensation for grid fluctuations/failure by SEB; • There is no cost sharing with RE developers for installation of transmission
lines/grid evacuation equipment; and • Clear-cut carbon trading mechanisms are not in place.
Financing from IREDA for renewable energy projects The Indian Renewable Energy Development Agency offers attractive financing schemes, such as loans of up to 85 per cent of the project cost and up to 75 per cent of the equipment cost; a 5 to 14 per cent rate of interest; a moratorium of up to three years in loan repayment; and a repayment period of up to ten years. For biomass projects (except bagasse), the maximum loan amount is 70 per cent of the project cost.
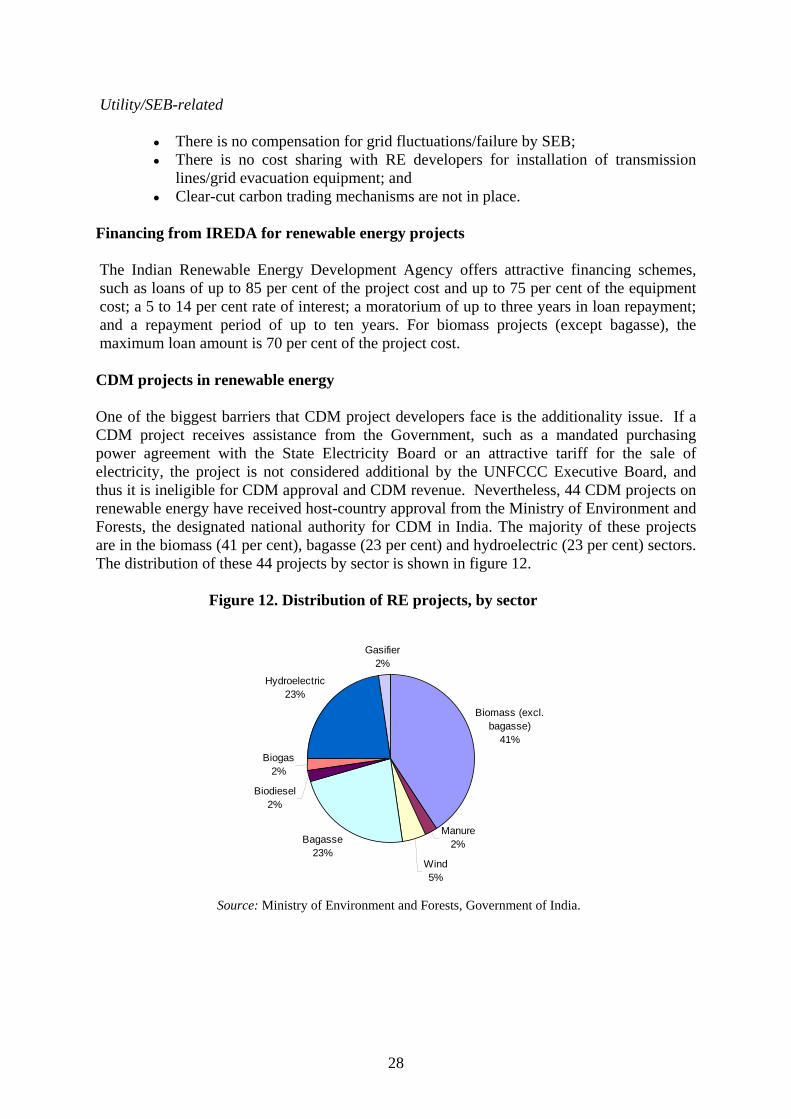
CDM projects in renewable energy One of the biggest barriers that CDM project developers face is the additionality issue. If a CDM project receives assistance from the Government, such as a mandated purchasing power agreement with the State Electricity Board or an attractive tariff for the sale of electricity, the project is not considered additional by the UNFCCC Executive Board, and thus it is ineligible for CDM approval and CDM revenue. Nevertheless, 44 CDM projects on renewable energy have received host-country approval from the Ministry of Environment and Forests, the designated national authority for CDM in India. The majority of these projects are in the biomass (41 per cent), bagasse (23 per cent) and hydroelectric (23 per cent) sectors. The distribution of these 44 projects by sector is shown in figure 12.
Figure 12. Distribution of RE projects, by sector
Biomass (excl. bagasse)
41%
Manure2%
Wind5%
Bagasse23%
Biodiesel2%
Biogas2%
Hydroelectric23%
Gasifier2%
Source: Ministry of Environment and Forests, Government of India.
28

Biomass (excluding bagasse) projects Eighteen CDM projects have been approved by the Indian CDM authority for submission to the Executive Board (EB). The biomass used as fuel for generating power includes rice husk and cotton stalks. The 7.8 MW biomass project in Rajasthan using mustard crop residue has been accorded registration by the EB. In addition, the 12 MW biomass project by Clarion Power Corporation in Andhra Pradesh has been validated by the EB and is in the process of being registered. Bagasse projects India’s sugar industry is the second largest in the world, after Brazil. The annual sugarcane output is 320 million tons, which results in about 270 million tons of bagasse. There are 430 sugar mills in India, most of which use bagasse to generate steam. However, an increasing number of mills are turning to cogeneration to produce electricity. There are 10 CDM projects approved by the CDM authority on cogeneration that use bagasse. For commercialization of bagasse cogeneration, the minimum size of the mill is 2,500 tons crushed per day (TCD). The average generation cost of electricity from bagasse is Rs. 2/kWh. Hydroelectric projects Ten small hydroelectric CDM projects (4 to 20 MW) have been approved by the Indian CDM authority. All these projects are run-of-the-river projects, none of which involve construction of dams. The 5 MW grid-connected Dehar Hydroelectric Project in Himachal Pradesh has been accorded registration by the EB. Wind projects A 3 MW and a 16.8 MW wind project in Karnataka have been approved by the Indian CDM authority. In addition, a 15 MW project by Suzlon and a 14.48 MW project by Vestas, both in Tamil Nadu, were submitted to the EB, independently of approval by the Indian CDM Authority. Manure projects A 7.5 MW poultry-litter-based power plant has been set up by Raja Bhaskar Power Pvt. Ltd. in Karnataka. Biogas projects A biogas CDM project has been set up by ADATS in Bagepalli, Karnataka.
29

Gasification projects A CDM project involving five biomass gasifier-based power plants totalling 2 MW in various locations throughout Karnataka and Tamil Nadu is being developed by Women for Sustainable Development. Biodiesel projects A 30-ton per day biodiesel project in Samasthan Narayanpur village, Andhra Pradesh, is being set up by Southern Biotechnologies. Improved energy efficiency in industry Improvements in energy efficiency lead to reduced use of fuel and a consequent reduction of CO2 produced by burning the fuel. Energy efficiency enhancements have been implemented in the following energy-intensive industries in India:
1. Iron and steel; 2. Cement; 3. Fertilizer; 4. Aluminium; and 5. Pulp and paper.
Iron and steel India is the world’s ninth largest producer of steel, with an output of 34.8 million tons in 2004. It is also the largest producer of sponge iron. Iron is produced in a blast furnace by the reduction of iron oxides by carbon monoxide. The feed consists of iron ore (oxides), coke and lime, and is introduced at the top of the furnace. Preheated air is blown through nozzles at the bottom of the furnace. The oxygen in the blown air converts the coke to carbon monoxide, which in turn reduces the iron oxides to iron. The molten iron and slag are drawn off from the bottom of the furnace and the furnace gases leave from the top. Energy efficiency can be achieved by using the hot furnace gases to heat the air entering at the bottom of the furnace, thereby reducing the fuel needed to preheat the air, or by raising steam in a waste heat recovery boiler (WHRB). Another way to save energy is dry coking. The coking coal is first created by heating coal in the absence of air and then cooling it by quenching it with water. In dry quenching the hot coke is air-cooled. The hot air can be used for raising steam in a WHRB to produce electricity via a steam turbine. Steel is manufactured from iron by oxidizing the impurities such as carbon, silicon and phosphorus in a basic oxygen furnace (BOF). The exhaust gas is hot and contains carbon monoxide. This gas can be further combusted to drive a gas turbine and generate electricity. Currently, a total of 12 CDM projects on improved energy efficiency (heat recovery from waste gases) in the iron and steel industry have been submitted by the following:
1. Shri Bajrang Sponge Iron Works; 2. Ispat Godavari Ltd. Sponge Iron Mfgr; 3. Industrial Growth Centre;
30
4. Tata Iron and Steel (TISCO); 5. Usha Martin; 6. Jindal Vijayanagar COREX; 7. Jindal Vijayanagar BOF; 8. TSIL Power Plant; 9. Orissa Sponge Iron Limited;
10. OCL India Limited Sponge Iron Works; 11. Shri Rampurai Balaji Steel Limited (SRBSL); and 12. Jai Balaji Sponge Limited (JBSL).
Cement Cement manufacture is a highly energy-intensive process involving the production of clinker by roasting lime (calcium carbonate) and siliceous material at elevated temperatures. The process produces 0.34 ton carbon per ton of cement (60 per cent from energy used in production and 40 per cent as a process gas). A new technology called Lower Cement Concrete Technology (LCCT) lowers the cement content through (a) use of high-range water- reducing admixtures, and (b) a partial replacement of cement clinker with alternative cementitious materials such as fly ash. There are four CDM projects on energy efficiency in the cement industry through WHRBs:
1. Jaypee Associates (Cement) Madhya Pradesh; 2. Hindusthan Cement — energy efficiency of construction in cement industries across
various locations in India; 3. Shree Cement Limited; and 4. JK Cement Works (Unit of JK Cement Limited).
Fertilizer The main ingredient of fertilizer is ammonia produced by the reaction between hydrogen and nitrogen at a temperature of 450oC over an iron oxide catalyst. Huge electric-driven centrifugal compressors bring the pressure up to 250 bar. Improvements in compressor technology can reduce the power requirements, thus reducing the amount of emitted CO2. However, most of the CO2 is produced in the manufacture of hydrogen through a process called steam reforming of hydrocarbons, usually methane CH4:
CH4 + H2O → CO + 3H2 (steam reforming) CO + H2O → CO2 + H2 (shift reaction)
The CO2 is absorbed in a solution and then expelled using steam. A CDM project proposed by IndoGulf Fertilizers uses waste heat from other process streams. Thus the amount of steam required is decreased, and this leads to lower fuel consumption and a decrease in CO2 emissions. Aluminium Aluminium production also requires a highly energy-intensive process. To manufacture aluminium, bauxite ore (Al2O3) is melted in a smelter and then electrolysed. Aluminium collects at the cathode, and the oxygen goes to the carbon anodes, where it reacts to form
31

CO2. The newer, more efficient technology from ALCOA leads to a smaller amount of CO2 produced. These improvements are due in part to the computerization of smelting cells, an improvement that has largely been unrecognized outside the industry. The computer takes into account the various current operating variables so that the voltage in the pot is always the best for prevailing conditions. Other energy-saving advances include the following:
• Improvements in bath chemistry to lower both the smelting temperature and heat losses, and to increase the efficiency of the use of electrical current;
• Improved insulation to reduce heat losses; • Improved baking technology for carbon anodes; • Reduced carbon anode consumption per kilogram of aluminum produced.
Pulp and paper The pulp-making process generates effluent with high organic load through a series of washing steps where part of the lignin in the pulp is removed from weak black liquor. The black liquor generated from the pulping process is concentrated at the evaporator to a desired solids level for firing at a soda recovery boiler (SRB). The method proposed by ITC Paper in their CDM project for increasing recovery of additional waste biomass (black liquor solids) for steam generation uses oxygen delignification coupled with efficient free-flow falling film evaporation. Thus, the increased black liquor solids reduce the requirement for fossil fuel in the steam boiler, and this leads to lower CO2 emissions. Figure 13 shows the potential for GHG emission reduction through energy efficiency improvements in some of the major industries in India. Figure 13. GHG mitigation potential from industries in India (57 MTCO2eq) until 2012
Iron and Steel
Fertilizer
Cement
Aluminium
N2O
HFC23
14 MTCO2eq12 MTCO2eq
10 MTCO2eq
3 MTCO2eq
5 MTCO2eq
14 MTCO2eq
Source: National Communication (2004).
Thermal destruction of HFC-23 HFC-23 (chemical formula CHF3) is a greenhouse gas with a global warming potential (GWP) of 11,700, the highest GWP in UNFCCC’s basket of GHG gases. It is a by-product
32

formed during the manufacture of HCFC-22 (chemical formula CHClF2), a refrigerant. In the certified CDM project proposed by Gujarat Fluorochemicals Ltd., HFC-23 is burnt in an oxidizing chamber at 1,200oC as per the following equation:
CHF3 + H2O + ½ O2 CO2 + 3 HF Thermal destruction of N2O Nitrous oxide, chemical formula N2O and GWP of 310, is formed during fuel combustion in thermal plants and automobile engines where high temperatures cause nitrogen and oxygen in combustion air to combine to form N2O. Typically, nitrogen oxides (NOx) scrubbers are installed at power plants to remove the nitrogen oxides from the effluent stack gases. In some cases the N2O is first oxidized to NO before it is absorbed (scrubbed) in a solution. There are also catalytic converters designed to convert N2O to the harmless N2 by reacting with ammonia. N2O is a by-product in the manufacture of nitric acid and adipic acid, the latter being an important intermediary in the production of nylon. Although there are currently no N2O CDM projects in India, two CDM projects have been proposed by Rhodia Polyamide, a manufacturer of adipic acid and nylon, at its plants in Onsan, Republic of Korea, and Paulina, Brazil. The process involves combining N2O with methane in a combustion chamber and burning the mixture at 1,300oC. The reaction is:
CH4 + 4N2O CO2 + 2H2O + 4N2 GHG mitigation in the transport industry Fuel substitution from petrol to natural gas leads to reduction of CO2 emissions. Under government mandate, taxis and some public transport buses have been fitted with engines running on compressed natural gas (CNG) in the major metropolitan areas of Delhi and Mumbai. Coal-fired locomotives have been replaced by diesel-powered engines wherever possible on the State-run Indian Railways system. A CDM project proposed by E. F. Energy Ltd. plans to offer AutoLPG (a mixture of propane and butanes) as an alternative automobile fuel in India to 4-stroke 2-wheeler motorcycles and scooters, 4-stroke 3-wheelers, private cars, taxis, multi-utility vehicles (MUVs), minibuses and light commercial vehicles (LCV). The project proponents plan to set up 1,493 AutoLPG retail outlets by 2008. The biofuels, ethanol and biodiesel, will play an important role in reducing the dependence on petroleum while reducing CO2 emissions The Government of India has announced a plan to replace 5 per cent petrol by ethanol and 20 per cent diesel by biodiesel by 2012. Ethanol is produced by fermenting sugarcane juice and biodiesel is manufactured by the transesterification of vegetable oil obtained from oilseeds such as Jatropha. Southern Biotechnologies of Hyderabad, Andhra Pradesh, has announced a CDM project which will set up a 30 ton per day biodiesel plant using vegetable oil feedstock. The annual CO2 emission reduction is estimated to be about 24,000 tons. Power generation from municipal solid waste (MSW) Power generation from MSW is an important process for GHG emission reduction and is the basis for several CDM projects worldwide. In India, Asia Bioenergy India Ltd. (ABIL) is
33
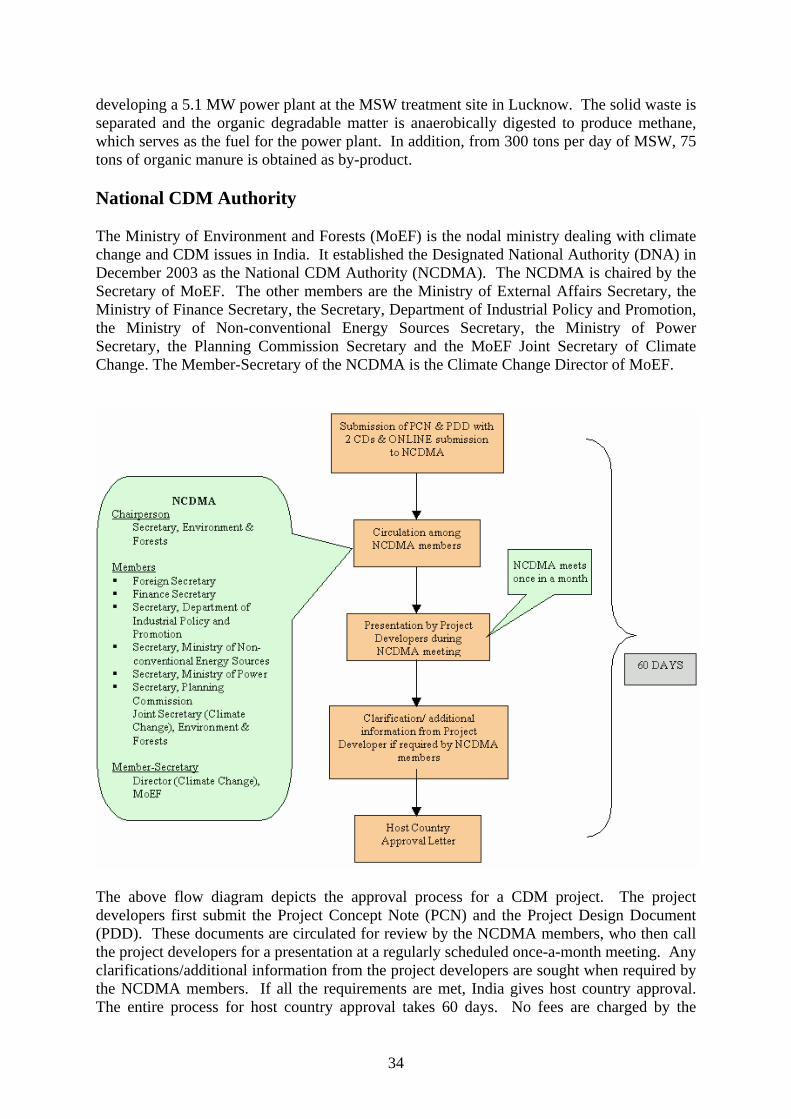
developing a 5.1 MW power plant at the MSW treatment site in Lucknow. The solid waste is separated and the organic degradable matter is anaerobically digested to produce methane, which serves as the fuel for the power plant. In addition, from 300 tons per day of MSW, 75 tons of organic manure is obtained as by-product. National CDM Authority The Ministry of Environment and Forests (MoEF) is the nodal ministry dealing with climate change and CDM issues in India. It established the Designated National Authority (DNA) in December 2003 as the National CDM Authority (NCDMA). The NCDMA is chaired by the Secretary of MoEF. The other members are the Ministry of External Affairs Secretary, the Ministry of Finance Secretary, the Secretary, Department of Industrial Policy and Promotion, the Ministry of Non-conventional Energy Sources Secretary, the Ministry of Power Secretary, the Planning Commission Secretary and the MoEF Joint Secretary of Climate Change. The Member-Secretary of the NCDMA is the Climate Change Director of MoEF.
The above flow diagram depicts the approval process for a CDM project. The project developers first submit the Project Concept Note (PCN) and the Project Design Document (PDD). These documents are circulated for review by the NCDMA members, who then call the project developers for a presentation at a regularly scheduled once-a-month meeting. Any clarifications/additional information from the project developers are sought when required by the NCDMA members. If all the requirements are met, India gives host country approval. The entire process for host country approval takes 60 days. No fees are charged by the
34

National CDM Authority. The project developers then present their documents to the CDM Executive Board for approval and registration. Indian CDM National Authority’s approval criteria A project proposal should establish the following in order to qualify for consideration as a CDM project activity: Additionalities:
• Emission additionality. The project should lead to real, measurable and long-term GHG mitigation. The additional GHG reductions are to be calculated with reference to a baseline.
• Financial additionality. The funding for CDM project activity should not lead to diversion of official development assistance. The project participants may demonstrate how this is being achieved.
• Technological additionality. The CDM project activities should lead to transfer of environmentally sound technologies and know-how.
Sustainable development indicators It is the prerogative of the host Party to confirm whether a clean development mechanism project facilitates sustainable development in its country. Also, a CDM should be oriented towards improving the quality of life of the very poor from an environmental standpoint. The following aspects should be considered when designing CDM project activity:
1. Social well-being. The CDM project activity should improve the quality of life of people through poverty alleviation, job creation, social disparity removal and the provision of basic amenities.
2. Economic well-being. The CDM project activity should attract additional investment consistent with the needs of the people.
3. Environmental well-being. The project should include a discussion of its impact on resource sustainability, resource degradation, biodiversity friendliness, impact on human health and reduction of pollution levels in general.
4. Technological well-being. The CDM project activity should lead to transfer of environmentally sound technologies, with priority given to renewable and energy efficiency projects consistent with best practices in order to assist in upgrading the technological base.
Baselines The project proposal must clearly and transparently describe the methodology used to determine baselines. Methodologies should:
• Create baselines that are precise, transparent, comparable and workable; • Avoid overestimation; • Be homogeneous and reliable; • Indicate potential errors; • Establish system boundaries of baselines; • Describe clearly intervals between baseline updates of baselines;
35

• Highlight the role of externalities (social, economic and environmental); • Include historical emission data sets wherever available; and • Mention the lifetime of the project cycle clearly.
Baselines should be created on a project-by-project basis except for those categories that qualify for simplified procedures. The project proposal should indicate the formulae used for calculating GHG offsets in the project and baseline scenario. Leakage, if any, should be described. For the purpose of project concept notes (PCN), default values may be used with justification. Determination of the base project, which would have come up in the absence of the proposed project, should be clearly described in the project proposal. Financial indicators The project participants should highlight the following financial aspects:
• Flow of additional investment; • Cost-effectiveness of energy saving; • Internal rate of return (IRR) without accounting for CERs; • IRR with CERs; • Liquidity, NPV, cost/benefit analysis, cash flow, and so forth, establishing that
there is a strong probability that the project will eventually be implemented; • Agreements reached with the stakeholders, if any, including power purchase
agreements, memorandum of understanding, and so forth; • Inclusion of indicative costs related to validation, approval, registration,
monitoring and verification, certification and share of proceeds; and • Available funds, financing agency, and a description of how it is sought to achieve
financial closure. Technological feasibility The proposal should include the following technical elements:
• The proposed technology/process; • Product/technology/material supply chain; • Technical complexities, if any; • Preliminary designs and schematics for all major equipment needed, design
requirements, manufacturer's name and details, and capital cost estimates; • Technological reliability; • Organizational and management plan for implementation, including timetable,
personnel requirements, staff training, project engineering and CPM/PERT-Chart. Risk analysis The project proposal should clearly state risks associated with a project, including apportionment of risks and liabilities as well as insurance and guarantees, if any. Credentials The credentials of the project participants must be clearly described.
36

Financing structures for CDM-eligible projects Conventionally, the CDM projects in India eligible for CDM investments have made use of standard financial instruments offered by banks/financial institutions (FIs). Equity financing Equity funds are basically company owners’ funds either raised through a fresh share issue or brought in through reinvestment of profits. At any time, the cash-generating companies are looking for possible projects for investment so as to improve their profitability. The main criterion for investment in projects is incremental revenue from them. The project that performs best in terms of return on capital will have priority in the use of equity capital. However, many companies have policies that fix a base rate of return below which the money will be invested in short-term deposits or other safe securities. This “hurdle” rate affects management decisions. The decision-making process follows the steps shown below:
Idea generation Initial screening Techno-economic feasibility study
Various sources Dept. concerned Strat
The return on investment target varies from comMany organizations also have policies by which thmay be on account of a higher risk perception or sectors. Generally, investments to upgrade operatiobe most attractive as they improve the overall oppolicies on clean energy projects do not follow a made between these and other projects. The Indiafiscal benefits against the hurdles for the power pumobilization of subsidies by the Ministry of Non-c Large corporate entities often shun clean energprojects. The main reason for their reluctance is leads to a higher percentage of overhead costs. Tespecially since there is greater awareness of the For example, Tata Iron & Steel Company has cbottlenecking projects into carbon offset projects. Japanese investors. As the carbon market maturesby creditworthy Indian companies may shift to a foa higher risk perception and a greater ability to abs Venture capital and special mutual funds The mutual funds sector has been developing proso. Many professional fund managers in collaborafloated several funds in the last two years. Some osuch as pharmaceuticals and telecommunication
37
Pre-feasibilitystudy
egic planning/TEC Techno-economic
consultant (TEC)
pany to company, as does risk aversion. ey give preference to certain sectors. This
policies against diversifying into unrelated ns or expand captive power supply would
erational efficiency of the company. The focused approach. Very little distinction is n industry weighs these projects for their rchase agreement and transaction costs for onventional Energy Sources (MNES).
y projects, especially renewable energy the small investment size involved, which his trend is gradually changing, however, energy cost in energy efficiency projects. onverted many of its efficiency and de-
The company is currently negotiating with , the carbon investments in CDM projects rm of equity capital. Global investors have orb liability.
gressively in India over the last decade or tion with international fund managers have f these have specialized in specific sectors s. Similarly, venture capital funds have
grown over the past decade and half. There are some venture capital funds that specialize in the energy sector. A CDM fund would be feasible as the CDM market gains momentum. At present, among existing mutual and venture capital fund managers awareness about UNFCCC and market mechanisms such as CDM is limited. Corporate finance The current trend among banks is to consider a corporate entity as a whole when deciding credit ratings. The investments considered by banks/FIs include, apart from capital investments, other fund requirements such as payments for voluntary retirement schemes. The main security for corporate loans is the balance sheet. The lending institution conducts a due diligence of the company’s operations and gives it a credit rating. On the basis of the rating and the risk premium practices, the applicable rate is decided. The actual investments in individual purposes are left to the company concerned. The financial institutions could consider CDM projects as a part of corporate clients' investment programmes. However, separate monitoring and verification of such projects are essential. Lending Some years ago, the development finance institutions (DFIs) were engaged in pure lending for concrete projects. The process involved a detailed appraisal of the promoter, the market for the product/service, project cost and profitability. Today, only a few of the long-term lending institutions, such as PFC, IREDA, IDFC and select banks, are engaged in this activity. However, the majority of the renewable energy projects that have been cleared in India have been able to get loans from these institutions. This is mainly due to the mandates and subsidies given by the Government to the above-mentioned FIs promoted by it. These institutions are already considering the CDM benefits that a project may be able to generate. They are, however, debating the appropriate way in which CER revenues can be integrated into the profitability analyses of the CDM projects. Another major lending instrument is debentures issued by companies. These are debt instruments, which are issued through public or limited offer. Normally, they are rated by rating companies such as CRISIL or ICRA. Similarly, large corporate houses raise money in the financial market by issuing commercial paper because their credit rating enables them to borrow over short terms at market rates. There are many such companies that are in good standing in the market and on the bourses. Merchant financing — Lease/equipment finance Though not prevalent in the case of CDM-eligible projects, this could be one possible route for investors, especially those supplying equipment/technology. Here the assets leased out remain on the balance sheet of the borrower, who is able to claim depreciation benefits. Obviously, the implicit interest rates would be higher than in the case of equity and, it is likely, also corporate financing. Project finance This route is emerging mainly for infrastructure projects that involve large investments and whose revenue accrues over a long period (15–20 years). Essentially, this future income stream is securitized and funding is provided to the proponent, which could be a specially floated new entity or special purpose vehicle (SPV). Underlying the income stream is a
38

contract or a concession that provides comfort to the lenders and strategic investors. This structure is most suitable for CDM projects as the CERs accrue from year to year and an emission reduction purchase agreement (ERPA) would be the underlying contract. Banking sector structure The structure and the operation of the banking system in developing countries are crucial for speedier implementation of CDM projects. The Indian banking system has undergone several changes in the recent past. The development banking system, which financed long-term projects with long-term financial instruments, has almost been dismantled as their funding sources have shifted to shorter terms. The duration has decreased from 8–10 years to 3–5 years. In addition, the asset–liability mismatch between fund sources and the lender has widened. The present banking system relies on short-term deposits and saving account deposits. A portion of these, which is basically the dormant portion, is used for lending operations. Many banks have developed, or are in the process of developing, their own credit rating system. The largest bank — the State Bank of India — has developed a system which is likely to be adopted by smaller banks, with minor modifications. The commercial banks in India have large pools of funds available for investment. After the statutory liquidity criteria of RBI have been met, these funds may be available for medium-term lending. While many banks invest these funds in money markets, some large banks have started financing energy/infrastructure projects for their effective utilization. Risks The poor financial condition of the State Electricity Boards (SEBs) is one of the risks facing RE project developers. An example is the Dabhol Power Project in Maharashtra. The Dabhol Power Company, in which the now bankrupt US company Enron was a major shareholder, had constructed and commissioned a 740 MW diesel-powered plant and was in the process of building a gas-fired 1,444 MW plant. The project was stalled as the Maharashtra SEB defaulted on its payments, asserting that the price of electricity, Rs. 4.8/kWh ($0.11/kWh), charged by the Dabhol Power Company was too high. Another important risk issue is the fuel supply, which is of special concern for biomass projects. The experience of insiders in the Indian biomass market has shown that waste biomass availability might be high in theory but most of that waste biomass is inappropriate for energy generation purposes owing to its poor quality. Moreover, since agro-residue collection is not an organized business (except in the case of rice husks, which are generated in industry, i.e. rice mills), enforceable forward sales agreements cannot be entered into. Different potential CDM project types face different project development risks because of the specific characteristics of the project. Generally speaking, industrial energy efficiency projects, as well as wind energy projects (if planned in states with efficient and transparent PPA procedures), have a lower project development risk than projects that depend on a reliable biomass fuel supply or those that are perceived to have a negative impact on the environment (e.g. waste gasification projects).
39
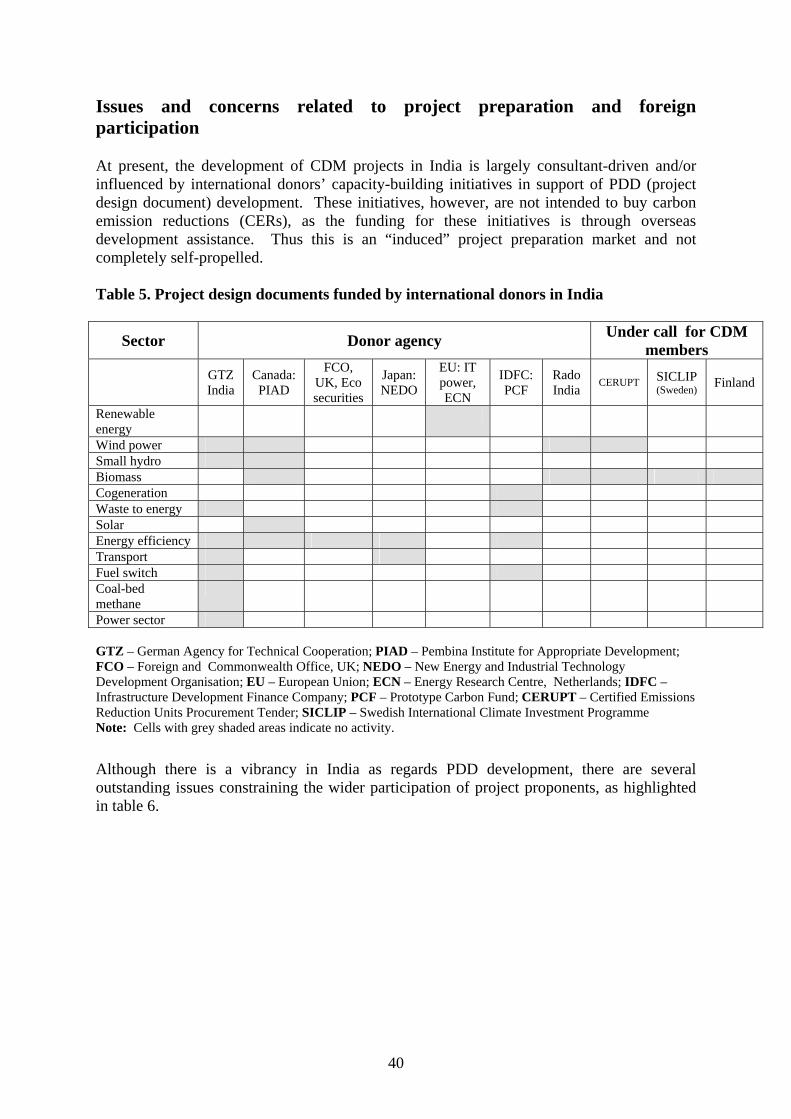
Issues and concerns related to project preparation and foreign participation At present, the development of CDM projects in India is largely consultant-driven and/or influenced by international donors’ capacity-building initiatives in support of PDD (project design document) development. These initiatives, however, are not intended to buy carbon emission reductions (CERs), as the funding for these initiatives is through overseas development assistance. Thus this is an “induced” project preparation market and not completely self-propelled. Table 5. Project design documents funded by international donors in India
Sector Donor agency Under call for CDM members
GTZ India
Canada: PIAD
FCO, UK, Eco securities
Japan: NEDO
EU: IT power, ECN
IDFC: PCF
Rado India CERUPT SICLIP
(Sweden) Finland
Renewable energy
Wind power Small hydro Biomass Cogeneration Waste to energy Solar Energy efficiency Transport Fuel switch Coal-bed methane
Power sector GTZ – German Agency for Technical Cooperation; PIAD – Pembina Institute for Appropriate Development; FCO – Foreign and Commonwealth Office, UK; NEDO – New Energy and Industrial Technology Development Organisation; EU – European Union; ECN – Energy Research Centre, Netherlands; IDFC – Infrastructure Development Finance Company; PCF – Prototype Carbon Fund; CERUPT – Certified Emissions Reduction Units Procurement Tender; SICLIP – Swedish International Climate Investment Programme Note: Cells with grey shaded areas indicate no activity. Although there is a vibrancy in India as regards PDD development, there are several outstanding issues constraining the wider participation of project proponents, as highlighted in table 6.
40

Table 6. CDM project-cycle related issues
Project steps Key issues
Project conceptualization The project developers are often not sure whether a project being undertaken by them will be eligible for CDM.
Host country approval
Greater clarity is required in order to understand the approval criteria of the national CDM authority. The fault lies mainly with the approval criteria of the EB, which form the basis of the approval criteria of the national CDM authority. Eighty CDM projects have been approved by India’s national CDM authority in the last 18 months, far more than in any other country for the same period.
PDD preparation
The data for developing the baseline case are difficult to obtain in many cases. The available methodologies are limited, but the EB is constantly approving new methodologies. Demonstrating additionality can be difficult. The services of a consultant for PDD preparation may prove expensive.
Registration with the CDM EB
The registration process seems to be a protracted one. Only 12 CDM projects had been registered by the EB as of July 2005, three of which were from India. Requests for reviews by the EB have slowed the pace of approval.
Project implementation
Integration of CDM revenues in project financing is lacking. Most financial institutions do not yet know how to properly value the CER revenue stream in carbon purchase transactions. The risk of non-delivery of CERs due to non-performance necessitates risk management measures.
Monitoring and verification Rigorous monitoring and verification contribute to transaction costs, which can make smaller projects financially unviable, although rules for small-scale projects provide relief.
All the steps in the project cycle have associated costs which contribute to the aggregation of transaction costs. In some cases, given the prevailing prices of CERs, these costs may not be offset by the CDM revenues. This may dampen the supply of projects. The experience of the Infrastructure Development Financial Corporation (IDFC) reveals that the transaction costs today range between $65,000 and $250,000 in India; at a price of $5 per CER, a threshold of 4,000 CERs needs to be generated per year just to break even. The EB should step up its pace of approval of CDM projects. According to one estimate, the EB must approve about 1,700 projects by 2010 to meet the global demand for CDM credits of 428 MTCO2eq (RFF, 2004). Projects approved by the Indian CDM authority Of the 80 projects approved by the Indian CDM authority, listed in table 7, 44 are in renewable energy, 25 in energy efficiency, 5 each in fuel switching and industrial processes, and 1 in municipal solid waste. These projects are then submitted to the UNFCCC’s Executive Board for validation and registration.
41
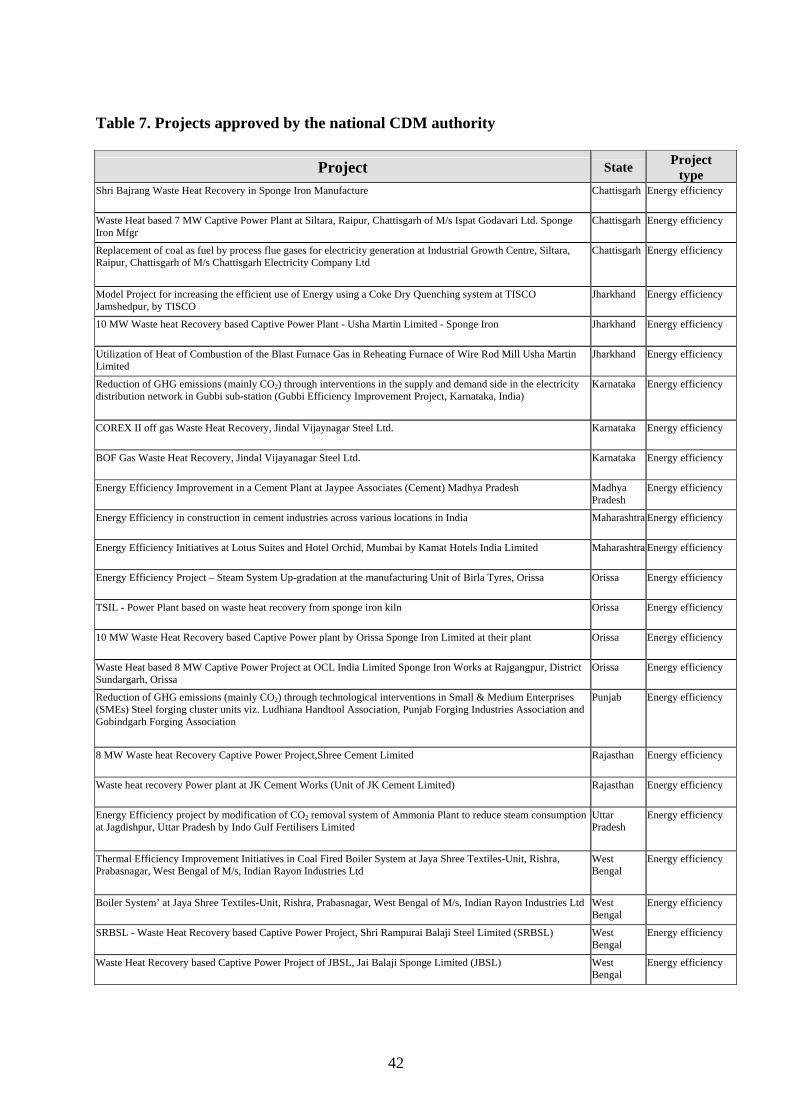
Table 7. Projects approved by the national CDM authority
Project State Project type
Shri Bajrang Waste Heat Recovery in Sponge Iron Manufacture Chattisgarh Energy efficiency
Waste Heat based 7 MW Captive Power Plant at Siltara, Raipur, Chattisgarh of M/s Ispat Godavari Ltd. Sponge Iron Mfgr
Chattisgarh Energy efficiency
Replacement of coal as fuel by process flue gases for electricity generation at Industrial Growth Centre, Siltara, Raipur, Chattisgarh of M/s Chattisgarh Electricity Company Ltd
Chattisgarh Energy efficiency
Model Project for increasing the efficient use of Energy using a Coke Dry Quenching system at TISCO Jamshedpur, by TISCO
Jharkhand Energy efficiency
10 MW Waste heat Recovery based Captive Power Plant - Usha Martin Limited - Sponge Iron Jharkhand Energy efficiency
Utilization of Heat of Combustion of the Blast Furnace Gas in Reheating Furnace of Wire Rod Mill Usha Martin Limited
Jharkhand Energy efficiency
Reduction of GHG emissions (mainly CO2) through interventions in the supply and demand side in the electricity distribution network in Gubbi sub-station (Gubbi Efficiency Improvement Project, Karnataka, India)
Karnataka Energy efficiency
COREX II off gas Waste Heat Recovery, Jindal Vijaynagar Steel Ltd. Karnataka Energy efficiency
BOF Gas Waste Heat Recovery, Jindal Vijayanagar Steel Ltd. Karnataka Energy efficiency
Energy Efficiency Improvement in a Cement Plant at Jaypee Associates (Cement) Madhya Pradesh Madhya Pradesh
Energy efficiency
Energy Efficiency in construction in cement industries across various locations in India Maharashtra Energy efficiency
Energy Efficiency Initiatives at Lotus Suites and Hotel Orchid, Mumbai by Kamat Hotels India Limited Maharashtra Energy efficiency
Energy Efficiency Project – Steam System Up-gradation at the manufacturing Unit of Birla Tyres, Orissa Orissa Energy efficiency
TSIL - Power Plant based on waste heat recovery from sponge iron kiln Orissa Energy efficiency
10 MW Waste Heat Recovery based Captive Power plant by Orissa Sponge Iron Limited at their plant Orissa Energy efficiency
Waste Heat based 8 MW Captive Power Project at OCL India Limited Sponge Iron Works at Rajgangpur, District Sundargarh, Orissa
Orissa Energy efficiency
Reduction of GHG emissions (mainly CO2) through technological interventions in Small & Medium Enterprises (SMEs) Steel forging cluster units viz. Ludhiana Handtool Association, Punjab Forging Industries Association and Gobindgarh Forging Association
Punjab Energy efficiency
8 MW Waste heat Recovery Captive Power Project,Shree Cement Limited Rajasthan Energy efficiency
Waste heat recovery Power plant at JK Cement Works (Unit of JK Cement Limited) Rajasthan Energy efficiency
Energy Efficiency project by modification of CO2 removal system of Ammonia Plant to reduce steam consumption at Jagdishpur, Uttar Pradesh by Indo Gulf Fertilisers Limited
Uttar Pradesh
Energy efficiency
Thermal Efficiency Improvement Initiatives in Coal Fired Boiler System at Jaya Shree Textiles-Unit, Rishra, Prabasnagar, West Bengal of M/s, Indian Rayon Industries Ltd
West Bengal
Energy efficiency
Boiler System’ at Jaya Shree Textiles-Unit, Rishra, Prabasnagar, West Bengal of M/s, Indian Rayon Industries Ltd West Bengal
Energy efficiency
SRBSL - Waste Heat Recovery based Captive Power Project, Shri Rampurai Balaji Steel Limited (SRBSL) West Bengal
Energy efficiency
Waste Heat Recovery based Captive Power Project of JBSL, Jai Balaji Sponge Limited (JBSL) West Bengal
Energy efficiency
42

Project State Project type
Demand-side energy efficiency programme in the Humidification Towers at Jaya Shree Textiles-Unit, Rishra, Prabasnagar, West Bengal of M/s Indian Rayon and Industries Ltd
West Bengal
Energy efficiency
Switching of fuel from Naphtha to Natural gas by BSES Andhra Power Limited (BAPL) at their CCGT power plant at Samalkot, East Godavri District, A.P.
Andhra Pradesh
Fuel switching
1050 MW Natural gas based grid connected combined cycle power generation project at Akhakhol by M/s Gujarat Torrent Power Generation Limited
Gujarat Fuel switching
Switching of fuel from Naphtha to Natural gas by Essar Power Limited at their power plant at Hazira in Surat District, Gujarat
Gujarat Fuel switching
18 MW Natural Gas OPG Energy Pvt Tamil Nadu Fuel switching 25 MW Natural Gas Captive Power plant, Coromondal Electric company Ltd. Tamil Nadu Fuel switching HFC-23 Decomposition by Gujarat Flurochemicals Ltd., Gujarat Gujarat Industrial process
Optimum utilization of Clinker & Conversion Factor Improvement at Birla Corporation Limited, Chittorgarh, Rajasthan by Birla Corporation Limited
Karnataka Industrial process
Optimal Utilization of Clinker, Shree Cement Limited Rajasthan Industrial process
GHG Emission Reduction by Oxidation of HFC–23 at Refrigerant (HFC-22) manufacturing facility of SRF Ltd.” Rajasthan Industrial process
Methane Extraction and fuel Conservation Project, TNPL, Kagitapuram, Tamil Nadu Tamil Nadu Industrial process
4.5 MW biomass power plant, Matrix Power Pvt. Ltd. Andhra Pradesh
Renewable energy
12 MW Biomass based power project at Prakasam, Andhra Pradesh by Clarion Power Corporation Limited Andhra Pradesh
Renewable energy
6 MW Biomass based power project at Chittoor, Andhra Pradesh by Rithwik Energy Systems Limited Andhra Pradesh
Renewable energy
6 MW Biomass Power Plant, Satyamaharshi Power Corporation Ltd. Andhra Pradesh
Renewable energy
30 TPD Biodiesel Project at Samasthan Narayanpur village, Choutuppal Mandal, Nalgonda District, Andhra Pradesh
Andhra Pradesh
Renewable energy
18 MW Jalaput Grid connected Hydroelectric project located at Jalaput, Visakhapatnam District, Andhra Pradesh by Orissa Power consortium Ltd.
Andhra Pradesh
Renewable energy
7.7 MW Rice Husk Based Power Plant at Vandana Vidhyut Limited, Bilaspur, Chattisgarh by Vandana Vidhyut Limited
Chattisgarh Renewable energy
9 MW hydel power project at Dobi Village, Kullu District, Himachal Pradesh by Cosmos Consulting Himachal Pradesh
Renewable energy
5.0 MW Dehar SHP in Bithal Village, Chamba District, Himachal Pradesh’ of M/s Astha Projects (India) Ltd. Himachal Pradesh
Renewable energy
4.5 MW Maujhi SHP in Khanyara Village, Kangra District, Himachal Pradesh’ of M/s Dharamshala Hydro Power Ltd.
Himachal Pradesh
Renewable energy
5 Biomass Gasifier Based Power Plants Based Power Plants totalling 2 MW for different locations in Karnataka and Tamil Nadu by Women for Sustainable Development
Karnataka Renewable energy
Bagepalli Biogas Programme, Karnataka, ADATS Karnataka Renewable energy
Malavili Power Plant Pvt Limited - power plant using cotton stalks Karnataka Renewable energy
20 MW biomass based power plant R.K. Powergen Pvt. Ltd. Karnataka Renewable energy
7.5 MW poultry litter based power plant, Raja Bhaskar Power Pvt. Ltd. Karnataka Renewable energy
7.5 MW power plant, Santoshimata Power Projects Ltd, biomass Karnataka Renewable energy
Bagasse based cogeneration facility by Shree Renuka Sugars Ltd. at their plant in Belgaum District, Karnataka Karnataka Renewable energy
6 MW Small Hydro Power project at Somanamaradi Village, Deodurga Taluk, Raichur district, Karnataka Karnataka Renewable energy
3 MW Wind power project at Chitradurga district, Karnataka by Encon Services Limited Karnataka Renewable energy
43

Project State Project type
22 MW Bagasse Based Cogeneration Project Activity at Sri Chamundeswari Sugar Limited, Mandya, Karnataka by Sri Chamundeswari Sugar Limited
Karnataka Renewable energy
16.8 MW Enercon Bundled Wind Power Project at Chitradurga District Wind Power Karnataka Renewable energy
20 MW Bagasse based Cogeneration Power Project at Bannari Amman Sugars Limited, Nanjangud, Karnataka by Bannari Amman Sugars Limited
Karnataka Renewable energy
10.25 MW SHP at Chunchi Doddi, Kanakapura (Taluk), Bangalore Rural (District) Hydroelec Karnataka Renewable energy
3 MW biomass (rice husk) based Power Project by M/s Deepak Spinners Ltd. at village Pagara, Distt. Guna, Madhya Pradesh
Madhya Pradesh
Renewable energy
37 MW Small Hydroelectric project located at two locations on Kolab river Orissa Renewable energy
20 MW Hydroelectric Project located at Samal, Angul District in Orissa by Orissa Power consortium Ltd. Orissa Renewable energy
JCT “5 MW Small Scale Biomass Project Punjab Renewable energy
3.5 MW Rice Husk based Cogeneration Project at Dhandari Kalan at Ludhiana Punjab by M/s Nahar Spinning Mills Limited
Punjab Renewable energy
3.5 MW Rice Husk based Cogeneration Project at Sherpur Woollen Mills, Ludhiana, Punjab by M/s Oswal Woollen Mills Ltd.
Punjab Renewable energy
‘24 MW Biomass based project at Gujarat Ambuja Cements Limited Ropar, Punjab Punjab Renewable energy
7.5 MW Mustard Crop Residue based Power Project of Alwar Power Company (P) Ltd., Alwar, Rajasthan Rajasthan Renewable energy
Utilization of biomass fuels for Pyro- processing, Shree Cement Limited Rajasthan Renewable energy
7.5 MW Biomass Chambal Power Limited Rajasthan Renewable energy
Electricity Generation from Mustard Crop Residues- Kalpataru Power Transmission Limited Rajasthan Renewable energy
Raghu Rama Renewable Energy Limited (RRREL) Biomass Tamil Nadu Renewable energy
20 MW Bagasse based Cogeneration Power Project at Bannari Amman Sugars Limited, Sathyamangalam, Tamil Nadu by Bannari Amman Sugars Limited
Tamil Nadu Renewable energy
RSCL 22 MW Cogeneration expansion project at RSCL Unit 2 Sugar Factory, Mundiyampakkam, Villupuram Taluk, Tamil Nadu by M/s Rajashree Sugars & Chemicals Limited
Tamil Nadu Renewable energy
Bagasse based cogeneration power projects at Haidargarh Chini Mills, Haidargarh Uttar Pradesh
Renewable energy
Bagasse/ Biomass based 22 MW Cogeneration project by Triveni Engineering & Industries Ltd. at their Deoband sugar plant
Uttar Pradesh
Renewable energy
Bagasse based Cogeneration Power Project with Export of Surplus Power at Dhampur, Uttar Pradesh by Dhampur Sugar Mills Limited
Uttar Pradesh
Renewable energy
Bagasse based cogeneration power projects at Balrampur Chini Mills Ltd. Balrampur Uttar Pradesh
Renewable energy
Ajbapur Sugar Complex Cogeneration Project at Ajbapur Village, Lakhimpur Kheri District, Uttar Pradesh of M/s DCM Shriram Consolidated Ltd.
Uttar Pradesh
Renewable energy
Himalayan Small Hydroelectric Projects in Uttaranchal India, - 6 MW Bundled SSC CDM Project Uttaranchal Renewable energy
Chamoli Small Hydroelectric Projects in Uttaranchal India, - 6 MW Bundled SSC CDM Project Uttaranchal Renewable energy
Municipal Solid Waste (MSW) processing cum power generation plant at Lucknow (UP) by Asia Bioenergy Limited (ABIL)
Uttar Pradesh
Solid waste
44

Status of Indian CDM projects at UNFCCC Executive Board Procedure for obtaining approval The procedure for obtaining approval for a CDM project activity is somewhat arduous and complicated and requires strict adherence to the CDM guidelines. A project design document (PDD) describing the project activity and other CDM requirements has first to be developed and presented to the Executive Board of UNFCCC. The PDD prescribes the methodology for accomplishing the reduction in GHG emission and a monitoring method. Monitoring refers to the collection and archiving of all relevant data necessary for determining the baseline, measuring anthropogenic emissions by sources of greenhouse gases (GHG) within the project boundary of a CDM project activity and leakage, as applicable. The project boundary is required to encompass all anthropogenic emissions by sources of greenhouse gases (GHG) under the control of the project participants that are significant and reasonably attributable to the CDM project activity. If the methodology and monitoring method are new, the project proponents (developers) have to seek approval from the Executive Board. As of 15 July 2005, the Executive Board had approved 23 methodologies, mainly in the areas of renewable energy generation through biomass, gas capture in landfills, fuel switching to more efficient fuel sources such as natural gas, and improvements in energy efficiency. These 23 approved methodologies are as follows:
1. Incineration of HFC-23 waste streams; 2. Greenhouse gas emission reductions through landfill gas capture and flaring where the
baseline is established by a public concession contract; 3. Simplified financial analysis for landfill gas capture projects; 4. Grid-connected biomass power generation that avoids uncontrolled burning of
biomass; 5. Small grid-connected, zero-emissions renewable electricity generation; 6. GHG emission reductions from manure management systems; 7. Analysis of the least-cost fuel option for seasonally operating; 8. Industrial fuel switching from coal and petroleum fuels to natural gas without
extension of capacity and lifetime of the facility; 9. Recovery and utilization of gas from oil wells that would otherwise be flared;
10. Landfill gas capture and electricity generation projects where landfill gas capture is not mandated by law;
11. Landfill gas recovery with electricity generation and no capture or destruction of methane in the baseline scenario;
12. Biomethanation of municipal solid waste in India, using compliance with MSW rules; 13. Forced methane extraction from organic waste-water treatment plants for grid-
connected electricity supply; 14. Natural gas-based package cogeneration; 15. Bagasse-based cogeneration connected to an electricity grid; 16. Greenhouse gas mitigation from improved animal waste management systems in
confined animal feeding operations; 17. Steam system efficiency improvements by replacing steam traps and returning; 18. Steam optimization systems;
45
19. Renewable energy project activities replacing part of the electricity production of one single fossil-fuel-fired power plant that stands alone or supplies electricity to a grid, excluding biomass project;
20. Baseline methodology for water-pumping efficiency improvements; 21. Baseline methodology for decomposition of N2O from existing adipic acid production
plants; 22. Avoided wastewater and on-site energy use emissions in the industrial sector; and 23. Leak reduction from natural gas pipeline compressor or gate stations.
In addition, there are four approved methodologies involving a consolidation of various other methodologies. Baseline scenario After the methodology and monitoring method, the baseline scenario is the most important element in the PDD. The baseline scenario for a CDM project activity is the scenario that reasonably represents the anthropogenic emissions by sources of greenhouse gases (GHG) that would occur in the absence of the proposed project activity. A baseline covers emissions from all gases, sectors and source categories listed in Annex A of the Kyoto Protocol within the project boundary. A baseline is deemed to reasonably represent the anthropogenic emissions by sources that would occur in the absence of the proposed project activity if it is derived using a baseline methodology referred to in paragraphs 37 and 38 of the CDM modalities and procedures. Different scenarios may be elaborated as potential evolutions of baseline scenarios, including the continuation of a current activity and implementing the proposed project activity. Baseline methodologies must require a narrative description of all reasonable baseline scenarios. To elaborate the different scenarios, different elements must be taken into consideration, including related guidance issued by the Executive Board. For instance, the project participants must take into account, among other things, national/sectoral policies and circumstances, ongoing technological improvements and investment barriers (see Appendix C, paragraph b (vii) and paragraphs 45 (e), 46, 48 (b), of decision 17/CP.7). Baseline approach In developing the baseline scenario, the baseline approach is the basis for a baseline methodology. The Executive Board agreed to apply to CDM project activities only the three approaches identified in subparagraphs 48 (a) to (c) of the CDM modalities and procedures. They are as follows:
1. Existing actual or historical emissions, as applicable; 2. Emissions from a technology that represents an economically attractive course of
action, taking into account barriers to investment; or 3. The average emissions of similar project activities undertaken in the previous five
years, in similar social, economic, environmental and technological circumstances, whose performance is among the top 20 per cent in their category.
Establishing a baseline in a transparent and conservative manner (paragraph 45 (b) of the CDM modalities and procedures) means that assumptions are made explicitly and choices are substantiated. If there is uncertainty regarding values of variables and parameters, the
46

establishment of a baseline is considered conservative if the resulting projection of the baseline does not lead to an overestimation of emission reductions attributable to a CDM project activity (that is, in the case of doubt, values that generate a lower baseline projection are to be used). Additionality Establishing that the project is additional is the determining step in obtaining approval. The steps set out below are required for additionality. Step 1. Identification of alternatives to the project activity consistent with current laws and regulations Identify realistic and credible alternative(s) available to the project participants or similar project developers that provide outputs or services comparable with the proposed CDM project activity. If the proposed project activity is the only alternative considered by the project participants in compliance with all regulations with which there is general compliance, the proposed CDM project activity is not additional. Step 2. Investment analysis Determine whether the proposed project activity is economically less attractive than other alternatives without the revenue from the sale of certified emission reductions (CERs). Determine whether to apply simple cost analysis, investment comparison analysis or benchmark analysis. If the CDM project activity generates no economic benefits other than CDM-related income, apply the simple cost analysis (Option I). Otherwise, use the investment comparison analysis (Option II) or the benchmark analysis (Option III). If simple cost analysis shows that the proposed CDM project activity is not financially attractive, proceed to Step 4 (common practice analysis), otherwise the project is not additional. If investment comparison analysis or benchmark analysis shows that the proposed CDM activity is not the most financially attractive option, go to Step 3 (barrier analysis), otherwise the project is not additional. Step 3. Barrier analysis Establish that there are barriers that would prevent the implementation of this type of proposed project activity from being carried out if the project activity was not registered as a CDM activity. Such barriers may include: Investment barriers, other than the economic/financial barriers in Step 2 above, inter alia:
- Debt funding is not available for this type of innovative project activity. - No access to international capital markets due to real or perceived risks associated
with domestic or foreign direct investment in the host country.
47

Technological barriers, inter alia:
- Skilled and/or properly trained labour to operate and maintain the technology is not available and no education/training institution in the host country provides the needed skill.
- Lack of infrastructure for technological implementation. Barriers due to prevailing practice, inter alia:
- The project activity is the “first of its kind”: no project activity of this type is currently operational in the host country or region.
The identified barriers are sufficient grounds for demonstration of additionality only if they would prevent potential project proponents from carrying out the proposed project activity if it was not expected to be registered as a CDM activity. If the identified barriers would not prevent the implementation of at least one of the alternatives (except the proposed project activity), go to Step 4 (common practice analysis), otherwise the CDM project is not additional. Step 4. Common practice analysis Analyse other activities similar to the proposed project activity. Discuss any similar options that are occurring. If similar activities cannot be observed or similar activities are observed, but essential distinctions between the project activity and similar activities can reasonably be explained, go to Step 5 (impact of CDM registration). If similar activities can be observed and essential distinctions between the project activity and similar activities cannot reasonably be explained, the proposed CDM project activity is not additional Step 5. Impact of CDM registration Explain how the approval and registration of the project activity as a CDM activity and the attendant benefits and incentives derived from the project activity will alleviate the economic and financial hurdles (Step 2) or other identified barriers (Step 3) and thus enable the project activity to be undertaken. The benefits and incentives can be of various types, such as:
• Anthropogenic greenhouse gas emission reductions; • The financial benefit of the revenue obtained by selling CERs; • Attracting new players who are not exposed to the same barriers, or can accept a
lower IRR (for instance, because they have access to cheaper capital); • Attracting new players who bring the capacity to implement a new technology;
and • Reducing the inflation/exchange rate risk affecting expected revenues and
attractiveness for investors. If Step 5 is satisfied, the proposed CDM project activity is additional. If Step 5 is not satisfied, the proposed CDM project activity is not additional.
48

Validation After completing the PDD, the next step is project validation. Validation is the process of independent evaluation of a project activity by a designated operational entity (DOE) against the requirements of the CDM as set out in decision 17/CP.7 and its annex and relevant decisions of the COP/MOP, on the basis of the project design document. Registration Upon validation by the DOE, the project proponents make a request for registration. Registration is the formal acceptance by the Executive Board of a project activity as a CDM project activity. Registration is the prerequisite for the verification, certification and issuance of CERs related to project activities. Verification Verification is the periodic, independent review and ex-post determination by a designated operational entity of monitored reductions in anthropogenic emissions by sources of greenhouse gases that have occurred as a result of a registered CDM project activity during the verification period. There is no prescribed length for the verification period. It must, however, not be longer than the crediting period. Certification Certification is the written assurance by the designated operational entity that, during a specified period, a project activity achieved the reductions in anthropogenic emissions by sources of greenhouse gases as verified. A certified emission reduction or CER is a unit issued pursuant to Article 12 and is equal to one metric tonne of carbon dioxide equivalent, calculated using global warming potentials defined by decision 2/CP.3. Once the Executive Board has issued the CERs, the purchaser of the latter makes payments to the CDM project proponents in accordance with the purchase agreements. Registered CDM projects As of 20 July 2005, 12 CDM projects had been registered by the Executive Board. Of these 12, three were from India, two from Honduras, and one each from Chile, China, Brazil, the Republic of Korea and Bhutan. In terms of methodology, two projects were on HFC mitigation, five were hydroelectric projects, two were on landfill gas, and one each on wind energy, biomass to electric energy and fuel switching. The following is a description of the three registered CDM projects from India.
49

1. GHG emission reduction by thermal oxidation of HFC-23 Project proponents and project site Gujarat Fluorochemicals Ltd, Ranjitnagar, Gujarat Technology licensors Ineos Fluor Limited, United Kingdom Project activity description HFC-23 (chemical formula CHF3) is a greenhouse gas with a global warming potential (GWP) of 11,700. It is a by-product formed during the manufacture of HCFC-22 (chemical formula CHClF2), a refrigerant. Note that HCFC-22, being an ozone-depleting compound, is banned in many developed countries by the Montreal Protocol, but its manufacture in India is allowed up till the year 2040. Typically, about 2.9 per cent of the HCFC-22 produced is HFC-23. This by-product, HFC-23, used to be disposed of by simply venting into the atmosphere, where it can lead to global warming. In this project, HFC-23 is now disposed off by burning (oxidizing) in a furnace at 1,200oC. The chemical reactions are:
CHF3 ( = HFC 23) + H2O + ½ O2 CO2 + 3 HF CHClF2 ( = CFC 22) + H2O + ½O2 CO2 + 2 HF + HCl CH4 (natural gas, methane) + 2 O2 CO2 + 4 H2O
In the combustion chamber some steam (H2O) and hydrocarbon fuel (shown above as CH4) are added to provide the hydrogen to convert the fluorine and chlorine atoms to HF and HCl, respectively. Ineos Fluor is guaranteeing a 99.999 per cent combustion of HFC-23. CER The carbon dioxide emission reduction is estimated on the basis of a HCFC-22 production rate of 10,000 ton/year, a HFC-23 composition of 2.9 per cent and a GWP of 11,700. The CER amount per year is 10,000 x 0.029 x 11,700 ≈ 3,000,000 ton. CER purchase Rabobank International will act as intermediary on behalf of the Government of the Netherlands for purchase of CERs. Likewise, Sumitomo Corporation will act as translator/facilitator for CER purchase by the Government of Japan. 2. Biomass in Rajasthan: Electricity generation from mustard crop residue Project proponents and project site Kalpataru Power Transmission Ltd. (KPTL), Ganganagar, Rajasthan
50
Project activity description The project involves the implementation of a biomass-based power generation plant with an installed capacity of 7.8 MW using direct combustion boiler technology. It is a case of utilizing an existing technology of combusting biomass fuels in a high-pressure steam boiler (modified Rankine cycle with regenerative feed water heating and water-cooled condensation). The power plant will be designed for operation with multiple agricultural biomass residues. The major part of the feedstock will comprise mustard crop residue, together with Prosopis juli flora, cotton stalk and rice husks. The residues are available in abundance and are currently mostly burnt in the fields. The project proposes to use less than 33 per cent of the total agricultural residue for generation, leaving enough for household fuel consumption and other uses, while reducing the environmental effects from burning the biomass in the fields. The electricity generated is to be supplied primarily to the state grid with an option to deliver the balance to third parties (large industrial customers) via that grid. The technology of biomass-based high-steam pressure power generation itself is known and in use in India. However, the use of mustard crop residue as a fuel for power generation is a pioneering effort by KPTL: this project represents the first time mustard crop residue will have been used for the generation of electricity on a commercial scale. CER The carbon dioxide emission reduction is estimated at 31,374 ton/year. CER purchase SenterNovem (a union of the formerly separate organizations of Senter and Novem) is an agency of the Dutch Ministry of Economic Affairs. SenterNovem has a long track record of involvement with CDM projects, including the Cerupt and Erupt projects where carbon credits are purchased on behalf of the Dutch Government. SenterNovem has signed a contract with Kalpataru concerning the delivery of CERs to the Netherlands. 3. 5 MW Dehar Grid-connected Small Hydroelectric Project (SHP) in Himachal Pradesh, India Project proponents and project site Astha Projects (India) Ltd., Bithal Village, Himachal Pradesh Project activity description The main activity of the project is generation of electricity using hydro potential available in Dehar Khad in Himachal Pradesh state and exporting the generated electricity to Himachal Pradesh State Electricity Board (HPSEB), a state-owned power utility company. The proposed Dehar SHP is a run-of-the-river small hydro power project implemented across Dehar Khad, a tributary of Gaj Khad which joins river Beas on the right bank in Sihunte Taluk of Chamba District in Himachal Pradesh state. Dehar Khad flows in the westerly direction with a steep gradient. The project design comprises head works, a powerhouse and a
51

power evacuation system. The head works include a diversion structure and an intake structure located near Gorgu village. The power channel, desilting tank, forebay, penstock and powerhouse are located on the left bank of the Dehar Khad. The powerhouse and outdoor switchyard are to be constructed near the village of Bithal. CER The carbon dioxide emission reduction is estimated at 16,374 ton/year. CDM projects submitted for registration Seven validated projects had been submitted to the Executive Board for registration as of 20 July 2005. Of these, three are on landfill gas capture (one each in Brazil, Argentina and Bangladesh) and three are on methane capture from swine manure projects in Chile. The seventh is from India, on electricity generation from biomass. Clarion (12 MW) renewable sources biomass project Project proponents and project site Clarion Power Corporation Limited (CPCL), Tanguturu Village, Andhra Pradesh Project activity description The project activity is a 12 MW (gross) capacity grid-connected, biomass-based renewable energy power plant with high-pressure steam turbine configuration. The main resources for power generation are biomass fuels such as Prosopis juliflora, cotton stalks and rice husks. Crop residues are collected from the farmers out of their field and brought to the project; this generates additional revenue source for crop residues which so far are otherwise being under-utilized/burnt with no commercial value. On average, the project exports around 10.92 MW power to the Andhra Pradesh Transmission Company (APTRANSCO) grid annually, with auxiliary power consumption of 9 per cent. The plant will be operating with an annual average plant load factor of 80 per cent. In accordance with the Ministry of Non-conventional Energy Sources (MNES) guidelines and with Andhra Pradesh Coal Board (APCB) consent, coal can constitute up to 30 per cent of fuel annually. Although CPCL proposes to use coal in case of shortage of biomass only (15 to 25 per cent only), maximum use of coal (30 per cent) has been considered for estimation of project emissions to arrive at a conservative figure of GHG emission reductions. CPCL will be using Indian coal and imported coal in the plant, according to availability. To arrive at the average CO2 emission factor of coal, low-calorific Indian and high-calorific imported coal were used for calculations. However, actual figures of calorific values and carbon contents need to be used during the verification. Furthermore, no transmission and distribution losses are considered while calculating GHG emission reductions, since the project exports power to the APTRANSCO grid, which is located at about 18 km from the site. The power plant has one condensing steam turbo generator unit with a matching boiler of the travelling grate type capable of firing multi fuels. All necessary auxiliary facilities of the power plant are provided. The boiler is sized to produce a maximum of 57 tons per hour of steam. The steam turbine is a straight condensing type machine with two bleed offs, one to the deaerator and one to the low pressure heater for
52
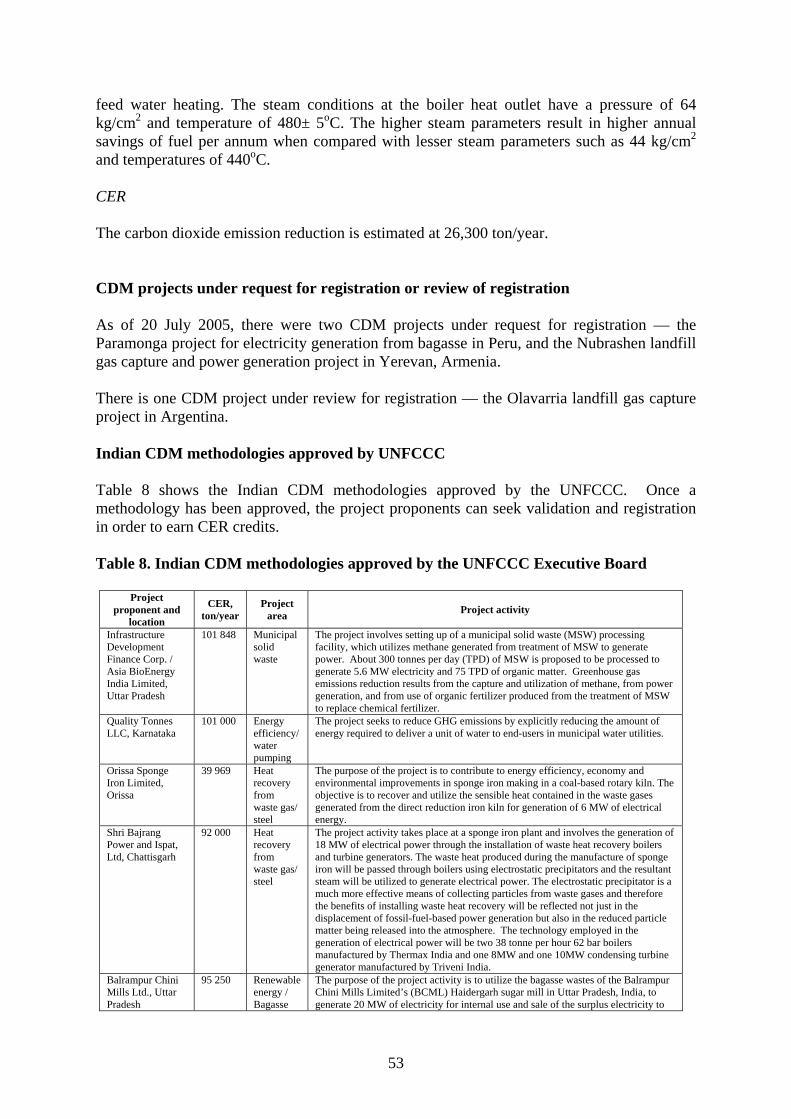
feed water heating. The steam conditions at the boiler heat outlet have a pressure of 64 kg/cm2 and temperature of 480± 5oC. The higher steam parameters result in higher annual savings of fuel per annum when compared with lesser steam parameters such as 44 kg/cm2 and temperatures of 440oC. CER The carbon dioxide emission reduction is estimated at 26,300 ton/year. CDM projects under request for registration or review of registration As of 20 July 2005, there were two CDM projects under request for registration — the Paramonga project for electricity generation from bagasse in Peru, and the Nubrashen landfill gas capture and power generation project in Yerevan, Armenia. There is one CDM project under review for registration — the Olavarria landfill gas capture project in Argentina. Indian CDM methodologies approved by UNFCCC Table 8 shows the Indian CDM methodologies approved by the UNFCCC. Once a methodology has been approved, the project proponents can seek validation and registration in order to earn CER credits. Table 8. Indian CDM methodologies approved by the UNFCCC Executive Board
Project proponent and
location
CER, ton/year
Project area Project activity
Infrastructure Development Finance Corp. / Asia BioEnergy India Limited, Uttar Pradesh
101 848 Municipal solid waste
The project involves setting up of a municipal solid waste (MSW) processing facility, which utilizes methane generated from treatment of MSW to generate power. About 300 tonnes per day (TPD) of MSW is proposed to be processed to generate 5.6 MW electricity and 75 TPD of organic matter. Greenhouse gas emissions reduction results from the capture and utilization of methane, from power generation, and from use of organic fertilizer produced from the treatment of MSW to replace chemical fertilizer.
Quality Tonnes LLC, Karnataka
101 000 Energy efficiency/ water pumping
The project seeks to reduce GHG emissions by explicitly reducing the amount of energy required to deliver a unit of water to end-users in municipal water utilities.
Orissa Sponge Iron Limited, Orissa
39 969 Heat recovery from waste gas/ steel
The purpose of the project is to contribute to energy efficiency, economy and environmental improvements in sponge iron making in a coal-based rotary kiln. The objective is to recover and utilize the sensible heat contained in the waste gases generated from the direct reduction iron kiln for generation of 6 MW of electrical energy.
Shri Bajrang Power and Ispat, Ltd, Chattisgarh
92 000 Heat recovery from waste gas/ steel
The project activity takes place at a sponge iron plant and involves the generation of 18 MW of electrical power through the installation of waste heat recovery boilers and turbine generators. The waste heat produced during the manufacture of sponge iron will be passed through boilers using electrostatic precipitators and the resultant steam will be utilized to generate electrical power. The electrostatic precipitator is a much more effective means of collecting particles from waste gases and therefore the benefits of installing waste heat recovery will be reflected not just in the displacement of fossil-fuel-based power generation but also in the reduced particle matter being released into the atmosphere. The technology employed in the generation of electrical power will be two 38 tonne per hour 62 bar boilers manufactured by Thermax India and one 8MW and one 10MW condensing turbine generator manufactured by Triveni India.
Balrampur Chini Mills Ltd., Uttar Pradesh
95 250 Renewable energy / Bagasse
The purpose of the project activity is to utilize the bagasse wastes of the Balrampur Chini Mills Limited’s (BCML) Haidergarh sugar mill in Uttar Pradesh, India, to generate 20 MW of electricity for internal use and sale of the surplus electricity to
53

Project proponent and
location
CER, ton/year
Project area Project activity
the state power grid. By displacing imported carbon-intensive grid energy with a renewable, zero-carbon energy source, the BCML Haidergarh Bagasse Cogeneration Project reduces carbon dioxide emissions over the project life. A feature of the project is the use of high efficiency boilers for optimizing the energy produced per unit of bagasse burnt.
Indo-Gulf Fertilisers Ltd., Uttar Pradesh
24 526 Energy efficiency/ CO2 removal in ammonia plant
Energy efficiency project by modification of CO2 removal system of ammonia plant to reduce steam consumption
Shree Renuka Sugars Agrinergy Ltd., Karnataka
22 000 Renewal energy/ bagasse
The project is an expansion of a bagasse cogeneration unit located at Shree Renuka Sugars (SRS) factory. The project involves the addition of a new boiler and turbine generator unit (TG3). The boiler has a capacity of 50 tph, an operating temperature of 500oC and pressure of 45 kg/cm2. The turbine generator is a 9.3 MW, back pressure type turbine, producing power at 11kV with an exhaust pressure of 1.5kg/cm2 and a 7 kg/cm2 bleed.
Thiru Arooran Sugars Ltd. and Prototype Carbon Fund Karnataka
584 000 Renewal energy/ bagasse, biomass
The project involves increasing the electricity-generating capacity at the sugar mills by replacing low-efficiency boilers by high- efficiency boilers, and installing additional turbines. Also, the fossil fuel (coal) used during the off-season will be replaced by locally produced agro-biomass such as wood chips and sugarcane trash.
Indian CDM methodologies under consideration by UNFCCC Table 9 shows the Indian CDM methodologies that are under consideration. Table 9. Indian CDM methodologies under consideration by the UNFCCC Executive Board
Project proponent and
location
CER, ton/year Project area Project activity
Hindusthan Construction Co. – various states in India
99 785 Reduction in cement composition of concrete
The project activity proposes to reduce quantum of Ordinary Portland Cement (OPC) used during concrete mix production in different construction applications of the Hindustan Construction Company Limited (HCC). It promotes, establishes and implements a new technology called the lower cement concrete technology (LCCT), which involves (1) use of high-range water -reducing admixtures to decrease the OPC content in concrete mix, and (if permitted by client), (2) further decrease the OPC content in the concrete mix obtained under (1) through partial replacement with alternate cementitious materials such as fly ash.
Associated Cement Companies, Karnataka
136 368 Replacement of clinker by fly ash in cement
The project activity consists of an increase in the percentage of fly ash blended in the Portland Pozzolonic Cement (PPC) produced by the New Wadi cement plant. A key impact of the project activity is environmental – limestone is a finite resource, and the (open cast) mining of limestone can have adverse environmental effects. Fly ash is a by-product of electricity generation, and is a product for which disposal can be difficult. Replacing limestone-derived clinker with fly ash therefore provides two benefits. Moreover, clinker production is highly energy-intensive. Reducing clinker production will therefore conserve energy and, given the power shortages that are prevalent in many parts of India, will assist India’s overall development process. Finally, the project will reduce emissions of greenhouse gases.
Birla Cement Companies, Rajasthan
23 904 Replacement of clinker by fly ash in cement
The project entails a reduction in the clinker content of Portland Pozzolanic Cement by increasing the fly ash additive, thereby replacing an equivalent amount of clinker. Clinker manufacturing, which includes pre-processing (grinding) and pyro-processing of the raw meal, is a highly energy-intensive process. This reduction of the percentage of clinker in the cement would conserve natural resources such as limestone and coal fuel used to meet the thermal and electrical energy requirements of pre-processing and pyro-processing of cement manufacture.
Southern Biotechnologies, Andhra Pradesh
24 000 Biodiesel production and fuel switching from petroleum to biodiesel
The purpose of the project activity is to manufacture biodiesel (30 ton per day) from edible/ non-edible oils derived from tree-borne oil- bearing seeds, fatty acids, animal fats etc. for substituting petro-diesel or using as a blend in petro-diesel. The proposed project promotes mitigation of greenhouse gas emissions by partially or fully substituting the petro-diesel in transportation vehicles and to a small extent in stationary applications such as water pumps, power generation sets, industrial thermal applications etc. Biodiesel is a renewable energy source and contributes to the sustainable development of the region.
Alexandria Carbon Black Co.
147 391
Waste gas for power
The proposed project activity involves addition of a new boiler and turbine generating unit based on the utilization of additional waste gas being generated by
54

Project proponent and
location
CER, ton/year Project area Project activity
(ACB), a joint venture between Aditya Birla group of India and the Egyptian Govt., Alexandria Egypt
and steam cogeneration
new production line #4 at the carbon black production facility. The boiler has a 65 ton per hour capacity, operating at 405oC and a pressure of 42 Kg/cm2. The turbine generator has a capacity of 12.65 MW. The CDM project activity will meet the steam and power requirements of the Alexandria Fibre Co. operating in the adjoining area.
Torrent Power Generation Limited, Gujarat
Natural gas for grid-connected power supply using combined cycle
Torrent Power Generation Limited (hereafter TPGL) proposes to set up a power generation unit of 1,050 +10 per cent MW capacity using natural gas as fuel and based on combined cycle technology. As required under mega power policy by the Government of India, TPGL is free to supply the power to be generated from the project activity to any entity in India subject to certain quantum (which is yet to be specified) being supplied on an inter-state basis. Currently, TPGL proposes to supply 75 per cent of the power generated to the Surat Electricity Company Limited (SEC) and the Ahmedabad Electricity Company Limited (AEC), which are also equity partners in TPGL, under a long-term power purchase agreement (subject to approval by the Regulatory Commission).
DESI Power, Netpro, Women for Sustainable Development, Karnataka and Tamil Nadu
Renewable energy/ biomass, gasification
Under this project various promoters are establishing 9 biomass gasification-based power plants totalling 2.25 MW, with capacities ranging from 100 to 1,000 kW, at different locations in the states of Karnataka and Tamil Nadu. The project involves using woody biomass as fuel in open top gasifiers, which generate producer gas. This gas is then cleaned, cooled and used for power generation, thus replacing conventional fossil fuel which would otherwise have been used for power generation.
Sai Spurthi Power Limited, Karnataka
Renewable energy/ grid-connected hydroelectric
The project activity is generation of 10.25 MW of electrical power using hydro potential available in river Arkavathi near Chuchi Doddi village in Karnatatka and exporting the generated electricity to the state-owned power utility company. The proposed project is a run-of-the-river hydroelectric scheme that comprises a diversion structure, power canal, penstocks, powerhouse, power evacuation system and tailrace canal. No storage facility such as a dam is envisaged in the project design..
Parpikala Power Limited, Karnataka
Renewable energy/ grid-connected hydroelectric
The project activity is generation of 9 MW of electrical power using hydro potential available in the river Shishila near Parpikala village in Karnatatka and exporting the generated electricity to the state-owned power utility company. This is a run -of- the- river project without involving long-term storage of water and will only utilize water flowing in the stream at any given time.
Rithwik Energy Systems Limited (RESL), Andhra Pradesh
Renewable energy/ grid-connected biomass
Rithwik Energy Systems Limited (RESL) has set up the 6 MW biomass-based power plant at Rachagunneri village, Srikalahasthi mandal, Chittoor district, Andhra Pradesh, India. The primary fuels for the power plant are rice husk, bagasse, groundnut shell, Juliflora, Sugarcane tops, etc. Various combinations have been considered as fuels and the fuel requirement varies with the combination. RESL utilizes the availability of fuel from the nearby villages, rice mills and sugar plants
Hassan Biomass Power Company Private Limited, Karnataka
Renewable energy/ grid-connected biomass
Hassan Biomass Power Company Private Limited (HBPCPL) is currently implementing an 8 MW biomass-based power plant, in Karnataka, India. The purpose of the project is to effectively use available, sustainably grown and un-utilized waste biomass resources for the generation of electricity. The power generated will be exported to the Karnataka state grid through Karnataka State Power Transmission Corporation Limited by means of an already contracted purchase agreement.
55

Indian CDM methodologies rejected by UNFCCC Table 10 shows the rejected Indian CDM methodologies. The project proponents may reapply after addressing the concerns raised by the EB. Table 10. CDM methodologies rejected by the UNFCCC Executive Board
Project proponent and
location
CER, ton/year
Project area Project activity Reasons for non-approval
Jaypee Associates, Madhya Pradesh
108 447 Energy efficiency/ cement
The project proposes to improve thermal and electric energy efficiency. Key process changes being implemented are the following: increasing the number of pre-heaters from 4 to 6, thus increasing recovery of thermal energy; improving kiln burner insulation and operating speeds, which will increase output and reduce thermal energy consumption; improving the technology of cooling of clinker to improve thermal energy consumption; use of high -efficiency classifiers in various grinding operations; and use of mechanical conveying (bucket elevators) in place of pneumatic conveying.
The required changes in the baseline methodology would necessitate significant changes to the proposed monitoring methodology — for example, to monitor outputs of products and other parameters, and to assess whether product mix has changed substantially and whether it has a substantial impact on energy consumption.
Essar Power Limited, Gujarat
413 706 Fuel switching
The principal aim of the project is to effect a change in primary fuel from naphtha to natural gas. The power plant (capacity 515 MW) has been using naphtha as the primary fuel and effected a shift to natural gas from mid- December 2002 at an additional investment of Rs 31.4 million, with a view to effecting a decrease in GHG emissions and minimizing other environmental impacts.
The methodology is not transparent and not conservative. It has a number of gaps and is not a stand-alone methodology to provide adequate information for review. Major reasons for non-approval include the following; 1. weak baseline analysis; 2. inadequate additionality analysis; 3. faulty Leakage analysis; 4. incorrect project emissions; 5. unjustified emission reduction formulae/algorithms.
Aban Power Company, Tamil Nadu
231 673 Fuel switching/ IGCC
Project is a grid-connected natural-gas-based combined cycle power plant. With an installed capacity of 119.8 MW, it has one gas turbine generating unit of 70 MW rated capacity, one heat recovery steam generator and one steam turbine generating unit of around 49.8 MW rated capacity, along with all electrical systems, controls and instrumentation, and civil, structural and architectural works.
Additionality concerns: The proposed additionality analysis is insufficiently developed, and most statements are general. The arrangement of tests is vague and overlapping, and it is not clear how the different tests relate to each other. In the evaluation of likely non-project options it is not clear which technologies will be incorporated in a dynamic market. Baseline concerns: The analysis suggested to evaluate the emissions in the case of captive power should consider lifetime and capacity of the old installation.
Coromandel Elelctric Compamy Limited, Tamil Nadu
62 682 Fuel switching
Coromandel Elelctric Compamy Limited (CECL) is setting up a 25 MW, natural-gas- based power plant. The company has a natural gas allocation from Gas Authority India Ltd. to the tune of 120,000 SCM/day. The project will use gas engine technology to generate power. The entire power from the project will be consumed by the cement plants of India Cements Ltd.
In general, the methodology is not stand-alone, applicability conditions are not relevant, and practically all the sections in PDD are to be re-drafted or significantly improved. Although the methodology stipulates a broader applicability to fuels, it seems that its applicability is rather limited to natural gas/proposed project activity described in the draft CDM-PDD. The methodology should be stand-alone and not refer to specific projects.
Chennai Petroleum Corporation Ltd, Tamil Nadu
101 000 Refinery residue/ IGCC
This project involves the use of high sulphur petroleum refinery residue for power generation (492 MW) using the integrated gasification combined cycle (IGCC) technology.
Feasibility study only
56

Project proponent and
location
CER, ton/year
Project area Project activity Reasons for non-approval
Suzlon (India), Tamil Nadu
37 000 Renewable energy/ wind
The project involves the implementation of 15 wind turbines of 1 MW each with a total capacity of 15 MW. The size of the turbines (1 MW each) is much larger than the average size of wind turbines in India (250-300 kW). The electricity is sold to the Tamil Nadu Electricity Board (State grid).
Project proposal withdrawn
Jindal Vijayanagar Steel Limited, Karnataka
57 600 Energy recovery from waste gas/ steel
During the operation of the Basic Oxygen Furnace (BOF) converter, waste gases (called BOF gases) are generated. Such gas has a combustible proportion in the form of carbon monoxide (CO), which makes this a health hazard and cannot be emitted to the atmosphere. Hence, the BOF gas is currently being flared, in a business as usual scenario. The BOF gas also has a latent heat potential due to the presence of CO, which may be extracted and utilized by combustion to generate thermal power in the form of electricity. Such efforts need collection, stabilization (to ensure continuous and steady flow at required pressure) and delivery of the BOF gas from the BOF plant to the thermal power plant. JVSL has a sister concern called the Jindal Thermal Power Company Limited (JTPCL)3, and few other thermal power plants are also proposed for the near future, it being proposed that the BOF gases be delivered through a gas grid to be established.
A proper justification for the use of weighted average of “worst performing” power plants for calculating the operating margin (OM) for the grid has not been provided. Not necessarily the "worst performing plants", defined by project participants as low performance ratio plants that contributed about 10 per cent of the total power generated in the grid in the operating year, are the ones replaced by the new electricity to the grid. There may be electrical, or other, reasons to keep them running. Also, it is said that “OM emission factor will be dynamic, i.e., can change annually for every crediting year”. How will that occur if the project itself will now be providing electricity to the grid and, as such, replacing some electricity that, otherwise, would be part of the baseline? The required changes in the baseline methodology would necessitate significant changes to the proposed monitoring methodology.
Paperboard and Specialty Papers Division
Energy efficiency/ increased use of biomass in pulp and paper industry
The Paperboard and Specialty Papers Division unit has installed a two-stage oxygen deligninfication (ODL) process, an efficient free flow falling film (FFFF) evaporator and an efficient soda recovery boiler (SRB) that has increased biomass-based energy in the plant and at the same time reduced organic load at the effluent treatment plant. The FFFF evaporator has reduced the steam required for evaporating black liquor solids over the rising film evaporator while the new and efficient soda recovery boilers generate more steam for the same quantity of black liquor fired at the boiler. This CDM project initiative increases biomass generation as well as improving its processing and utilization through the ODL-FFFF-SRB route, thus obviating the need for fossil-fuel-generated steam energy.
The methodology has not been described in an adequate and concise manner. Formulae and algorithms: the methodology has an unclear set of equations for emission reduction calculation that are erroneous and not easy to follow. No methodology is provided to select baseline or to demonstrate that continuation of current practice is the baseline. The methodology seems to be tailored to the proposed project activity only and difficult to apply to other projects.
SCM Sugar, Karnataka – 26 MW Bagasse Cogeneration
Renewable energy/ bagasse
The purpose of the project essentially is to utilize available mill generated bagasse efficiently for generation of steam and electricity required for sugar manufacturing and export surplus power to the state electricity grid and generate additional revenue. The project will meet the captive steam and power requirement of the sugar unit and cogeneration plant auxiliaries, and the power requirement of the colony. The balance power will be sold to the state grid for additional revenue generation. In addition, this project activity will lead to sustainable economic growth, conservation of the environment through use of biomass fuel and GHG emission reduction.
No methodology regarding whether the project activity is not the baseline scenario; the simple statements that the technology is less carbon -intensive (statements a, b, c, d page 13, of section B.4 of draft CDM-PDD) and that the technology is new (statements f, g and h) and more costly (statement e) do not demonstrate additionality, since it is also stated that the technology is more efficient and will generate additional revenues when compared with the baseline, and no methodology is proposed to demonstrate that these additional revenues are not sufficient to ensure investment.
57


Conclusions The total annual global carbon demand is quite robust, estimated at between 415 and 1,250 MTCO2eq (million tons CO2 equivalent). Even though the potential CDM market has become smaller than originally envisioned owing to the rejection of the Kyoto Protocol by the United States, and the significant amount of "hot air" (the excess of the 1990 emission level over the current level) in the Russian Federation, Ukraine and Kazakhstan, the global CDM market is expected to be between 38 and 264 MTCO2eq per year. On the basis of data on trade of carbon dioxide emission reductions (CER), India is expected to capture between 20 and 30 per cent of the CDM market. Thus its volume of CER exports in 2010 may range between 7.5 MTCO2eq and 78 MTCO2eq. At a price of $4/ton CER, this will bring in revenue from $30 million to 300 million per year. Other major exporters of CERs are Brazil and Chile. The major buyers of CERs are Japan (21 per cent), the Netherlands (16 per cent), the United Kingdom (12 per cent) and other EU countries (32 per cent). The distribution of CDM projects worldwide by sector is as follows: HFC abatement (25 per cent), animal waste (18 per cent), hydroelectric (12 per cent), electricity generation from biomass (11 per cent), landfill gas capture (10 per cent), wind (7 per cent) and others (17 per cent). India’s pre-eminent position in the CDM market is due to many favourable enabling factors such as a good technical base, and a proactive National CDM Authority approving projects for submission to the UNFCCC Executive Board in a time-bound manner and ensuring the contribution of CDM activities to sustainable development priorities in India. Eighty CDM projects have been approved by India’s National CDM Authority in the last 18 months, far more than in any other country for the same period. The Ministry of Environment and Forests is the nodal ministry for CDM issues in India. It has established the National CDM Authority, which also includes secretaries from other important ministries such as foreign affairs, finance, non-conventional energy sources, and power. Data for 1994 from the National Communication, the latest official source of GHG emissions, indicate that 743.8 MTCO2eq of GHGs were emitted from energy sector (61 per cent); 344.5 MTCO2eq emissions came from the agriculture sector (28 per cent); 102.7 MTCO2eq were contributed by industrial processes (8 per cent); 23.2 MTCO2eq were from waste disposal (2 per cent) activities and 14.3 MTCO2eq were generated from land use, land-use change and the forestry sector (1 per cent). Most of the GHG emissions in the energy sector are from the coal-fired plants in the electric power industry. India’s installed power generation capacity is 115,545 MW, and the electric energy–GDP elasticity is 1.5, which means that for a GDP growth rate of 7 per cent, the required growth rate of electric energy is 10 per cent. Thus an additional power capacity of 100,000 MW is planned for installation in the period 2002–2012. To improve power generation efficiency while cutting down on CO2 emissions, the State Electricity Boards are embarking on renovation and modernization (R&M) and life extension (LE) programmes. These measures include installing more efficient boilers, furnaces, pumps, turbines and generators, improving maintenance procedures, and implementing coal beneficiation processes such as coal washing for optimal utilization of coal. The greatest potential for CDM lies in the areas of renewable energy (RE), enhanced industrial efficiency and industrial processes, fuel switching, and municipal solid waste (MSW). The Government of India is making a concerted effort to promote renewal energy technology. Fifty-five per cent of the 80 projects approved by the Indian CDM Authority are in the RE sector. India is the only country in the world that has a dedicated ministry for
59

promoting renewable energy, the Ministry for Non-conventional Energy Sources (MNES), and an exclusive public sector financial sector, the Indian Renewable Energy Development Agency (IREDA). MNES prepared in 1993 and 1996 a set of guidelines for “Promotional and Fiscal Incentives by State Governments for Power Generation from Non-Conventional Energy Sources". These guidelines were designed to bring about a level playing field for power generation from renewable energy sources. Salient features included a preferential tariff of 4.5 ct /kWh from 1993 with a 5 per cent annual escalation, allowing third-party sale and captive use, ensuring timely payment of purchased electricity, long-term purchasing power agreements (PPA), providing grid connectivity, creating the infrastructure for power utilization, streamlining the procedures for various statutory clearances, and exemptions from certain sales tax and electricity duty. In addition, concessional customs duties for imported RE equipments were granted to RE providers, and arrangements were made for soft loans and a long-term debt facility. Of the 44 CDM projects on renewable energy that have received host-country approval:
• Eighteen projects are based on biomass, excluding bagasse. The biomass used as fuel for generating power includes rice husk and cotton stalks. The 7.8 MW biomass project in Rajasthan using mustard crop residue has been accorded registration by the EB. In addition, the 12 MW biomass project by Clarion Power Corporation in Andhra Pradesh has been validated by the EB and is in the process of being registered.
• Ten projects are based on cogeneration from bagasse. India is the second largest sugar producer (just slightly behind Brazil); sugarcane output is 320 million tons, resulting in about 270 tons of bagasse annually.
• Ten projects are small hydroelectric plants (4 to 20 MW). All these projects are run-of-the-river projects, none of which involve construction of dams. The EB has accorded registration to the 5 MW Grid-connected Dehar Hydroelectric Project in Himachal Pradesh.
• Two projects are on wind power. • The biogas, biodiesel, manure and gasification areas have one project each.
There are 25 projects on improved industrial efficiency, which include:
• Twelve projects on recovering waste heat for electricity generation in the iron and steel industry;
• Four projects on waste energy recovery in the cement industry; • One project each in the ammonia and pulp and paper industries; and • Seven other projects on energy efficiency, including one on installing more
efficient pumps and metering devices in a municipal water delivery system. There are five projects on switching to fuels with a lower carbon-to-hydrogen ratio, such as from coal to oil or natural gas, and from oil to natural gas. These projects include the 1,050 MW natural-gas-based grid-connected combined cycle power generation project at Akhakhol by M/s Gujarat Torrent Power Generation Limited, and the 535 MW project by Essar Power Limited at its power plant at Hazira in Surat District, Gujarat. Natural gas has the lowest CO2 emissions per unit of energy of all fossil fuels, at about 15 kg C/GJ, compared with oil with about 20 kg C/GJ and coal with about 25 kg C/GJ (all based on low heating values). The lower-carbon-containing fuels can, in general, be converted with greater efficiency than coal. For instance, the efficiencies of a coal-fired plant and natural gas fired plant are 30 per cent
60

and 45 per cent, respectively. Thus, the reduction in CO2 emission when switching from coal to natural gas is 50 per cent per kWh of electricity generated. The five projects on improved industrial processes include two on thermal destruction of HFC-23. One of these, developed by Gujarat Fluorochemicals, has been granted registration by the EB, and has a CER of 3 million ton per year, the highest so far of any Indian CDM project. This is mainly due to the fact that HFC-23 has a global warming potential of 11,700, far more than any other gas in the UNFCCC’s basket of GHG gases. Another project on improved industrial processes involves replacement of clinker in cement by non-cementitious material such as fly ash. Asia Bioenergy India Ltd. (ABIL) is developing a 5.1 MW power plant at the MSW treatment site in Lucknow. The solid waste is separated and the organic degradable matter is anaerobically digested to produce methane, which serves as the fuel for the power plant. In addition, from 300 tons per day of MSW, 75 tons of organic manure is obtained as a by-product. All CDM project-based transactions in India follow a commodity model, whereby the buyer of carbon purchases the certified emission reductions generated by the project as it would purchase any other commodity or service. Thus, for the HFC-23 oxidation project of Gujarat Fluorochemicals with a CER of 3 million ton/year, Rabobank International will act as intermediary on behalf of the Government of Netherlands for purchase of CERs. Likewise, Sumitomo Corporation will act as translator/facilitator for CER purchase by the Government of Japan. For the 7.8 MW mustard crop residue project developed by Kalpataru Power Transmission Ltd. (KPTL), Rajasthan, SenterNovem, an agency of the Dutch Ministry of Economic Affairs, has signed a contract with Kalpataru concerning the delivery of CERs to the Netherlands. At present, the development of CDM projects in India is largely consultant-driven and/or influenced by international donors’ capacity-building initiatives in support of PDD (project design document) development. The following international organizations have assisted in PDD development: GTZ – German Agency for Technical Cooperation; PIAD – Pembina Institute for Appropriate Development, Canada; FCO – Foreign and Commonwealth Office, United Kingdom; NEDO – New Energy and Industrial Technology Development Organisation; ECN – Energy Research Centre, Netherlands; IDFC – Infrastructure Development Finance Company; PCF – Prototype Carbon Fund; CERUPT – Certified Emissions Reduction Units Procurement Tender; SICLIP – Swedish International Climate Investment Programme Conventionally, the CDM projects in India eligible for CDM investments have made use of standard financial instruments offered by banks/financial institutions. The development banking system, which financed long-term projects with long-term financial instruments, has almost been dismantled, as the funding sources for them have become more short-term. The Indian Renewable Energy Development Agency offers attractive financing schemes for renewable energy projects such as loans of up to 85 per cent of the project cost and up to 75 per cent of the equipment cost; a 5 to 14 per cent rate of interest; a moratorium of up to three years in loan repayment; and a repayment period of up to ten years. For biomass projects (except bagasse), the maximum loan amount is 70 per cent of the project cost.
61

Different potential CDM project types face different project development risks owing to the specific characteristics of the project. Generally speaking, industrial energy efficiency projects as well as wind energy projects (if planned in states with efficient and transparent PPA procedures) face relatively low project development risks compared with projects that depend on a reliable biomass fuel supply or projects that are perceived to have a negative impact on the environment (e.g. waste gasification projects). There are several hurdles in preparing the PDD. The data for developing the baseline case are often difficult to obtain. The available methodologies are limited, but the EB is constantly approving new methodologies, thus demonstrating that additionality can be difficult. For instance, the special tariffs or the purchasing power agreements, which the Government has established for renewable energy projects, may make the projects non-additional and thus ineligible for CDM status and revenue. Also, with crude oil prices climbing to over $64/barrel, the cost of biodiesel and bioethanol production might easily fall below that of petroleum diesel and petrol, and this would make the biodiesel and bioethanol projects non-additional. The services of a consultant for PDD preparation may prove expensive. The transaction cost of a CDM project has been estimated at between $65,000 and $250,000; thus, the project has to generate 2,000 CERs just to break even. The slow pace of approval of CDM projects (only 12 have been registered so far, including three from India), and the numerous calls for review have proved frustrating. According to one estimate, the EB must approve about 1,700 projects by 2010 to meet the global demand for CDM credits of 428 MTCO2eq. In conclusion, high-quality CDM projects must be developed within the next two years (2005 and 2006) for India to capitalize on its CDM potential during the first commitment period, 2008–2012. Implementation of the CDM in India can deliver significant local, economic and sustainable development co-benefits. However, the projects most in demand such as HFC-23 removal offer the greatest CER but yield lower sustainable co-benefits. India’s CDM strategy, policy, and implementation plans should include guidance on unresolved issues such as the sharing of CER revenue between project proponents and utilities. Finally, cooperation with potential investors and stakeholders from the public and private sectors should be encouraged to establish facilities for risk management and project financing. This could take the form of a national CDM fund that supports the development of good-quality and relevant CDM projects.
62

References Babu, N. Y. D., and A. Michaelowa (2003). Removing Barriers for Renewable Energy CDM Projects in India and Building Capacity at the State Level, Hamburgisches Welt-Wirtschafts-Archiv (HWWA) [Hamburg Institute of International Economics], HWWA Discussion Paper 237. Can be accessed at www.hwwa.de. CDM India Designated National Authority (2005). Designated National Authority, Ministry of Environment and Forests, Government of India. Can be accessed at http://envfor.nic.in/cdm/index.htm. Criqui, P., and A. Kitous (2003). Kyoto Protocol Implementation: Impacts of linking JI and CDM credits to the European emission allowance trading scheme (KPI-ETS). Prepared for the Directorate-General Environment. Cited in Haites (2004). Deodhar, V., A. Michaelowa and M. Krey (2003). Financing Structures for CDM Projects in India and Capacity Building Options for EU-Indo Collaboration, Hamburgisches Welt-Wirtschafts-Archiv (HWWA) [Hamburg Institute of International Economics], HWWA Discussion Paper 247. Can be accessed at www.hwwa.de. Gokarn, S. (2003). Economic Policy Reform: Implications for Energy Consumption. Chapter 4 in India and Global Climate Change, M. A. Toman, U. Chakravorty, and S. Gupta (eds.), Resources for the Future Press, Washington, DC. Grubb, M. et al. (2003). A Strategic Assessment of the Kyoto-Marrakech System, Briefing Paper No. 6, London, Royal Institute of International Affairs. Haites, E. (2004). Estimating the market potential for the Clean Development Mechanism: Review of models and lessons learnt. Prepared for the World Bank, Internal Energy Agency, and International Emission Trading Association. Indian Renewable Energy Development Agency (IREDA) (2002). Financing of Bagasse Cogeneration: Issues and Opportunities. Presented by D. Majumdar, Director, IREDA, at the 3rd International CHP and Decentralized Energy Symposium, New Delhi, October 2002. Khanna, M. (2003). Policies for Carbon Abatement. Chapter 7 in India and Global Climate Change, M. A. Toman, U. Chakravorty, and S. Gupta (eds.), Resources for the Future Press, Washington, DC. Marrakesh Accords (2001). The Marrakesh Accords and the Marrakesh Declaration adopted by the Conference of the Parties at its seventh session (COP7). Can be accessed at http://unfccc.int/cop7/. Ministry of Power, Government of India (2005). Status of Power Generation. Can be accessed at http://powermin.nic.in. National Communication (2004). India’s Initial National Communication to the United Nations Framework Convention on Climate Change. Submitted by the Ministry of Environment and Forests, Government of India. Can be accessed at http://www.natcomindia.org.
63

Natsource (2003). Governments as participants in international markets for greenhouse gas commodities. Natsource Ltd., Washington, DC. Cited in Haites (2004). National Strategic Study (2005). CDM Implementation in India. Prepared by the Energy and Resources Institute, New Delhi. Can be accessed at http://www.teriin.org. Resources for the Future (2004). The EU Emissions Trading Directive: Opportunities and Potential Pitfalls. Resources for the Future Press, Washington, DC. Sengupta, R. and M. Gupta (2003). Developmental Sustainability Implications of the Economic Reforms in the Energy Sector. Chapter 3 in India and Global Climate Change, M. A. Toman, U. Chakravorty, and S. Gupta (eds.), Resources for the Future Press, Washington, DC. United Nations Framework Convention for Climate Change (2005). Clean Development Mechanism (CDM). Can be accessed at http://cdm.unfccc.int/. World Bank/International Emission Trading Association (2005). State and Trends of the Carbon Market 2005. Washington, DC. Can be accessed at http://carbonfinance.org/docs/CarbonMarketStudy2005.pdf.
64