an assessment of heavy metal contamination in soils …
TRANSCRIPT
AN ASSESSMENT OF HEAVY METAL CONTAMINATION IN SOILS AND
VEGETATION – A CASE STUDY OF KORLE LAGOON RECLAMATION SITE
BY
EMMANUEL ADDAE
10363359
THIS THESIS IS SUBMITTED TO THE UNIVERSITY OF GHANA, LEGON IN
PARTIAL FULFILMENT OF THE REQUIREMENT FOR THE AWARD OF
MASTER OF PHILOSOPHY DEGREE IN ENVIRONMENTAL SCIENCE
INSTITUTE FOR ENVIRONMENTAL AND SANITATION STUDIES (IESS).
UNIVERSITY OF GHANA, LEGON
JULY, 2013
University of Ghana http://ugspace.ug.edu.gh
i
DECLARATION
I hereby declare that except for references of other people’s work which have been cited
and duly acknowledge, this work is the result of my own research and initiative conducted
under supervision, and that this thesis has neither in whole nor in part been presented for
an award of a degree elsewhere.
……………………………….…….
Emmanuel Addae
(Student)
………………………
Date
………………………………… ………………………………….
Prof. Frank K. Nyame Dr. Benedicta Y. Fosu-Mensah
(Principal Supervisor ) (Co-supervisor)
Date:……………………………. Date:……………………..
University of Ghana http://ugspace.ug.edu.gh
ii
ABSTRACT
This study investigated the concentration of heavy metals and vegetation around the Korle
Lagoon Reclamation site in Accra (Ghana). The dispersion of heavy metals such as Pb,
Hg, Cd, As, Zn, Sn, Ni, Cu and Cr within the soil profile from a depth of 0 – 60cm (at
20cm intervals) were assessed. A total of ninety (90) soil samples were taken from the e-
waste zone (EW), central gardens zone (GZ), recreational zone (KD), reclaimed zone (RZ)
and estuary zone (ES) and eighteen (18) soil samples were sampled from the control zone
(CZ) at the Korle-Bu flats. Ten (10) samples of forage grasses (Panicum maxima and
Imperata cylindrical) were also taken from each of the sampling zones and ten (10)
samples each of lettuce (Latuca sativa) and bissap (Hibiscus sabdariffa) were taken from
central garden zone (GZ) and the control zone (CZ). At the depth of 0 – 20cm, the ranges
of heavy metal concentrations recorded were Hg (<0.001 – 0.67), Pb (1.28 – 183.66), Cu
(3.47 – 202.99), Zn (0.83 – 37.33), Cr (2.28 – 56.00), Cd (<0.001 – 103.66), Ni (0.91 –
72.00), Sn (8.77 – 705.32) and As (0.04 – 3.67) in mg/kg. At the depth of 20 – 40cm, Hg
(<0.001 – 0.67), Pb (1.12 – 167.96), Cu (2.57 – 199.99), Zn (0.73 – 34.33), Cr (0.11 –
49.99), Cd (0.04 – 68.32), Ni (0.55 – 66.65), Sn (8.67 – 334.25) and As (0.21 – 15.66) in
mg/kg. At the depth of 40 – 60cm, Hg (0.00 – 0.00), Pb (0.96 – 134.00), Cu (1.49 –
98.66), Zn (0.52 – 27.66), Cr (1.13 – 52.67), Cd (0.04 – 68.32), Ni (0.55 – 66.65), Sn
(8.67 – 334.25) and As (0.21 – 10.99) in mg/kg. The levels of Pb, Cd and As analyzed
from some of the zones exceeded international thresholds for agriculture lands. The ranges
of heavy metal concentrations in the vegetation were: Hg (<0.001 – 0.08), Pb (<0.001 –
36.72), Cd (0.16 – 1.64), Cr (0.24 – 3.84), Cu (0.16 – 95.56), Zn (1.16 -34.92), Ni (0.40 –
7.00), As (<0.001 – 0.32) and Sn (2.52 – 28.52) in mg/kg with Cu, Pb and Cd exceeding
the acceptable limits of heavy metals in plants.
University of Ghana http://ugspace.ug.edu.gh
iii
The enrichment factor of the heavy metals had a general trend of Cr = Ni < Zn < Cu < Hg
< As < Pb < Cd < Sn. The geoaccumaltion index also had a general trend of Cr < Ni < Zn
< Cu < As < Cd < Pb < Hg < Sn. The pollution index also recorded a general trend Cr <
Zn <Ni < As < Cu < Hg < Pb < Sn < Cd. The presence of heavy metals in the vegetation
from the other sampling zones may probably be due to frequent dumping of solid waste.
The plants sampled are shallow rooted plants that absorb nutrient from the top soil. This
might have contributed to the presence of heavy metals in their leaves since most of the
heavy metals were within a depth of 0 – 20cm.
The significantly high concentration of heavy metals such Cd, Pb and As in the soils and
vegetation may have adverse effect on human health and grazing cattle from the Abossey
Okai Zongo Community.
University of Ghana http://ugspace.ug.edu.gh

iv
DEDICATION
With love to my mum MARY QUAYE-BRUCE and my late aunt NAOMI TSOTSOO
BRUCE
University of Ghana http://ugspace.ug.edu.gh
v
ACKNOWLEDGEMENT
I am most grateful to the Lord God for His bountiful wisdom, security, favour and
guidance throughout my graduate studies. A number of individuals made contribution
towards the successful implementation of this work to whom am most grateful. I express
my heartfelt gratitude to Prof. Frank K. Nyame and Dr. Benedicta Y. Fosu-Mensah for
their patience, good guidance, constructive criticism and suggestions. My gratitude also
goes to the lecturers of the Institute for Environmental and Sanitation Studies, university
of Ghana for their constructive criticism and suggestion. I express my profound gratitude
to Emmanuel Osae Addo, Dinah Naa Okaikor Addae, Michael Saah, Nash (GAEC) and
Rosalyne Baddoo for their immense contribution towards the execution of this project. I
am grateful to all my family members and friends who supported me in diverse ways. God
bless you all.
University of Ghana http://ugspace.ug.edu.gh
vi
LIST OF ABBREVIATIONS
ATSDR Agency for Toxic Substances and Disease Registry
CCME Canadian Council of Ministers of the Environment
CEC Cation Exchange Capacity
ECB European Chemicals Bureau
FAO Food and Agricultural organization
FIAM Free Ion Activity Model
GPS Global Positioning System
IPCS International Programme on Chemical Safety
JECFA Joint FAO/WHO Expert Committee on Food Addictives
LEAD Lead Education and Abatement Design
NIEHS National Institute of Environmental Health Sciences
NRC National Research Council
UNEP United Nations Environment Programme
USEPA United States Environmental Protection Agency
UV Ultraviolet
WHO World Health Organization
University of Ghana http://ugspace.ug.edu.gh
vii
TABLE OF CONTENTS
DECLARATION ................................................................................................................... i
ABSTRACT .......................................................................................................................... ii
DEDICATION ..................................................................................................................... iv
ACKNOWLEDGEMENT .................................................................................................... v
LIST OF ABBREVIATIONS .............................................................................................. vi
LIST OF FIGURES ........................................................................................................... xiii
LIST OF PLATES ............................................................................................................. xiv
CHAPTER ONE ................................................................................................................... 1
INTRODUCTION ................................................................................................................ 1
1.1 Background ..................................................................................................................... 2
1.2 Research Problem ........................................................................................................... 3
1.3 Objectives........................................................................................................................ 5
1.4 Justification ..................................................................................................................... 5
CHAPTER TWO .................................................................................................................. 6
LITERATURE REVIEW ..................................................................................................... 6
2.1 Cadmium (Cd)................................................................................................................. 7
2.1.1 Occurrence in environment ...................................................................................... 7
2.1.2 Uses .......................................................................................................................... 8
2.1.3 Health effect ............................................................................................................. 9
2.2 Nickel (Ni) ...................................................................................................................... 9
2.2.1 Occurrence in the environment .............................................................................. 10
2.2.2 Uses ........................................................................................................................ 10
2.2.3 Health effect ........................................................................................................... 11
2.3 Chromium (Cr) .............................................................................................................. 11
University of Ghana http://ugspace.ug.edu.gh
viii
2.3.1 Uses ........................................................................................................................ 12
2.3.2 Health effect on the environment ........................................................................... 12
2.4 Lead (Pb) ....................................................................................................................... 12
2.4.2 Uses ........................................................................................................................ 13
2.4.3 Health effect ........................................................................................................... 14
2.5 Zinc (Zn) ....................................................................................................................... 14
2.5.1 Occurrence in the environment ........................................................................... 15
Zinc(I) compounds ....................................................................................................... 15
Zinc (II) Compounds ................................................................................................. 15
2.5.2 Uses ........................................................................................................................ 15
2.5.3 Health effect ........................................................................................................... 16
2.6 Arsenic (As) .................................................................................................................. 17
2.6.1 Occurrence in the environment .............................................................................. 17
2.6.2 Uses ........................................................................................................................ 18
2.6.3 Health effect ........................................................................................................... 19
2.7 Copper (Cu)................................................................................................................... 19
2.7.1 Occurrence in the environment .............................................................................. 19
2.7.2 Uses ........................................................................................................................ 20
2.7.3 Health effect ........................................................................................................... 20
2.8 Mercury (Hg) ................................................................................................................ 21
2.8.1 Occurrence in the environment .............................................................................. 23
2.8.2. Uses ....................................................................................................................... 23
2.8.3 Health effect ........................................................................................................... 24
2.9 Tin ( Sn) ........................................................................................................................ 24
2.9.1 Occurrence in the environment .............................................................................. 25
2.9.2 Uses ........................................................................................................................ 25
2.9.3 Health effect ........................................................................................................... 25
University of Ghana http://ugspace.ug.edu.gh
ix
2.10 Physicochemical analysis of soils ............................................................................... 26
2.10.1Total organic carbon / total organic matter ........................................................... 26
2.10.2 Soil pH .................................................................................................................. 27
2.10.3 Cation exchange capacity ..................................................................................... 28
CHAPTER THREE............................................................................................................. 29
MATERIALS AND METHODS ........................................................................................ 29
3.1 Study site ....................................................................................................................... 29
3.1.1 Vegetation .............................................................................................................. 32
3.2 Sampling ....................................................................................................................... 34
3.2.1 Soil sampling .......................................................................................................... 34
3.2.2 Plant sampling ........................................................................................................ 35
3.3 Sample treatment........................................................................................................... 37
3.4 Precautions taken during sampling ............................................................................... 37
3.5 Preparation of soil for AAS analysis............................................................................. 37
3.5.1 Soil Sample ............................................................................................................. 37
3.5.2 Preparation of Plants for AAS Analysis ................................................................. 38
3.6 Determination of organic carbon .................................................................................. 39
3.6.1 Reagents Preparation: ............................................................................................. 39
3.6.2 Procedure ................................................................................................................ 40
3.7 Determination of pH ..................................................................................................... 41
3.8 Digestion of soil and plants ........................................................................................... 42
3.8.1 Acid digestion of soil ............................................................................................. 42
3.8.2. Acid digestion for plants ....................................................................................... 42
3.9 Determination of heavy metals ..................................................................................... 42
3.9.1 Quality control and quality assurance .................................................................... 44
3.10 Geoaccumulation Index (Igeo).................................................................................... 44
University of Ghana http://ugspace.ug.edu.gh
x
3.11 Enrichment factor (EF) ............................................................................................... 45
3.12 Pollution index (PI) ..................................................................................................... 46
3.13 Data Analysis .............................................................................................................. 46
CHAPTER FOUR ............................................................................................................... 47
RESULTS ........................................................................................................................... 47
4.1 Physicochemical Properties .......................................................................................... 47
4.1.1 pH of soils .............................................................................................................. 47
4.1.2 Percentage organic matter ...................................................................................... 48
4.1.3 Percentage organic carbon ...................................................................................... 49
4.2 Concentration of heavy metals at various depths at the research areas ........................ 49
4.2.1 Lead (Pb) concentrations in soils at various depths ............................................... 49
Fig.4.4: Lead (Pb) concentration (mg/kg) in soils at 0 – 60 cm depth ........................ 51
4.2.2 Copper (Cu) concentrations in soils at various depths ........................................... 51
4.2.3 Zinc (Zn) concentrations in soils at various depths ................................................ 52
4.2.4 Chromium (Cr) concentrations in soils at various depths ...................................... 54
4.2.5 Cadmium (Cd) concentrations in soil at various depths ......................................... 55
4.2.6 Arsenic (As) concentrations in soils at various depths ........................................... 56
4.2.7 Nickel (Ni) concentrations in soil at various depths .............................................. 57
4.2.8 Mercury (Hg) concentrations in soil at various depths .......................................... 58
4.2.9 Tin (Sn) concentrations in soils at various depths .................................................. 59
4.3 Geoaccumulation Index (Igeo)...................................................................................... 61
4.4 Enrichment factor (EF) ................................................................................................. 62
4.5 Pollution Index (PI) ....................................................................................................... 63
4.6 Correlation of heavy metals concentration and physicochemical properties ................ 64
4.7 Concentration of heavy metals in vegetation ................................................................ 68
4.7.1 Forage grasses (Imperata maximum and Panicum maximum) ............................... 68
University of Ghana http://ugspace.ug.edu.gh
xi
4.7.2 Bissap (Hibiscus sabdariffa) .................................................................................. 70
4.7.3 Lettuce (Latuca sativa) ........................................................................................... 71
CHAPTER FIVE................................................................................................................. 73
DISCUSSION ..................................................................................................................... 73
5.1. Heavy metals concentration in Soils ............................................................................ 73
5.2 Organic Matter Content ................................................................................................ 76
5.3 Geoaccumulation Index(Igeo)....................................................................................... 77
5.4 Enrichment factor (EF) ................................................................................................. 78
5.5 Pollution Index (PI) ....................................................................................................... 78
5.6 Heavy Metals In Plants ................................................................................................. 79
5.6.1 Heavy metals in forage grasses .............................................................................. 79
5.6.2 Heavy metals in Bissap and Lettuce ....................................................................... 81
CHAPTER SIX ................................................................................................................... 85
CONCLUSION AND RECOMMENDATION .................................................................. 85
6.1 Conclusion .................................................................................................................... 85
6.2 Recommendation .......................................................................................................... 86
REFERENCES.................................................................................................................... 88
APPENDICES .................................................................................................................. 104
Appendix 1.Heavy metal concentration and physicochemical parameters of soils in the
reclamation area and the control area ............................................................................ 104
Appendix 2. Summary of heavy metal concentration (mg/kg) at depth of 0 - 20cm .... 105
Appendix 3. Summary of heavy metal concentration (mg/kg) at depth of 20 - 40 ....... 105
Appendix 4. Summary of heavy metals concentration (mg/kg) at depth of 40 - 60 .... 105
Appendix 5. Correlation of heavy metal concentration(mg/kg) at a depth of 0 - 20cm 106
University of Ghana http://ugspace.ug.edu.gh
xii
Appendix 6.Correlation of heavy metals concentration (mg/kg) at a depth of 20 - 40cm
....................................................................................................................................... 107
Appendix 7. Correlation of heavy metals concentration (mg/kg) at a depth of 40 -60cm
....................................................................................................................................... 108
Appendix 8. Summary of Igeo, EF and PI values at the depth of 0 - 20 (cm) .............. 109
Appendix 9. Summary of Igeo, EF and PI values at the depth of 20 - 40 (cm) ............ 110
Appendix 10. Summary of Igeo, EF, and PI values at the depth of 40 - 60 (cm) ......... 111
Appendix 11. Concentration of heavy metals (mg/kg) in vegetation. ........................... 112
Appendix 12. Summary of concentration of heavy metals (mg/kg) in vegetation. ....... 112
University of Ghana http://ugspace.ug.edu.gh
xiii
LIST OF FIGURES
Fig. 3.1: A Map of Korle Lagoon Reclamation area in the A.M.A……………… 31
Fig. 4.1: pH of soils at the various depths………………………………………… 47
Fig. 4.2: Percentage organic matter content in soils at various depths……………. 48
Fig. 4.3: Percentage organic carbon content in soils at various depths……………. 49
Fig. 4.4: Lead (Pb) concentration (mg/kg) in soils at 0 – 60 cm depth…………… 51
Fig. 4.5: Copper (Cu) concentration (mg/kg) in soils at 0 – 60 cm depth………… 52
Fig. 4.6: Zinc (Zn) concentration (mg/kg) in soils at 0 – 60 cm depth……………. 54
Fig. 4.7: Chromium (Cr) concentration (mg/kg) in soils at 0 – 60 cm depth……… 55
Fig. 4.8: Cadmium (Cd) concentration (mg/kg) in soils at 0 – 60 cm depth………. 56
Fig. 4.9: Arsenic (As) concentration (mg/kg) in soils at 0 – 60 cm depth………… 57
Fig. 4.10: Nickel (Ni) concentration (mg/kg) in soils at 0 – 60 cm depth………… 58
Fig. 4.11: Mercury (Hg) concentration (mg/kg) in soils at 0 – 60 cm depth……… 59
Fig. 4.12: Tin (Sn) concentration (mg/kg) in soils at 0 – 60 cm depth……………. 60
Fig. 4.13: Heavy metals concentration (mg/kg) in forage grasses………………… 70
Fig. 4.14: Heavy metals concentration (mg/kg) in Bissap………………………… 71
Fig. 4.15: Heavy metals concentration (mg/kg) in Lettuce……………………….. 72
University of Ghana http://ugspace.ug.edu.gh
xiv
LIST OF PLATES
Plate 3.1a: Burning of electronic waste at the Old Fadama E-waste grounds. …… 33
Plate 3.1b: Vegetation and soil after burning of electronic waste………………… 33
Plate 3.2: Soil sampling at the central garden zone……………………………… 34
Plate 3.3: Soil and vegetation samples taken at the Control Zone, Korle-Bu Flats. 35
Plate 3.4: Plant samples being taken at the Control Zone, Korle-Bu Flats………… 36
Plate 3.5: Cattle grazing at the e-waste zone, Old Fadama………………………… 36
Plate 3.6: Soil being dried after sampling………………………………………….. 37
Plate 3.7: Freeze drying of plants samples…………………………………………. 39
University of Ghana http://ugspace.ug.edu.gh
1
CHAPTER ONE
INTRODUCTION
Heavy metals are found naturally in undisturbed soils and, in fact, small amounts of many
metals are required by plants to remain healthy. Metals found in waste dumps exist in
various forms either as the pure metal or alloyed with various other metals. Heavy metals
impairing the quality of our environment come from various sources that can be
categorized into urban-industrial aerosols, liquid and solid wastes from animal and man,
mining and industry and agricultural chemicals (Gerard, 1996; Ideriah et al., 2010). Heavy
metals are largely present in e-wastes, especially Cu used for wires, and also Cr, Ni, Zn,
Cd, and Hg as well as many other metals and rare-earth elements. Because of high air
emissions or liquid leaking, significant amounts of metals are concentrated in landfills or
dispersed in the environment despite recycling (Robinson, 2009).
The labile fraction of particle-bound metals is considered to be more readily available to
environmental receptors and hence possesses greater environmental risk than the resistant
fraction. (Adamson et al.,2000; X.D. Feng et al.,2009). Soil has the ability to immobilize
chemicals like heavy metals in any form introduce to it. The immobilization of xenobiotics
are mainly due to sorption properties which are determined by physicochemical properties
of the soil such as: amount of clay and organic fraction, pH, water content, temperature of
the soil and properties of the particular metal ion (Dube et al.,2000). The most important
heavy metals with regard to potential hazards and occurrence in contaminated soils are:
arsenic (As), cadmium (Cd), chromium (Cr), mercury (Hg), lead (Pb), antimony (Sb),
molybdenum (Mo) and zinc (Zn) (Asio, 2007).
Asio, (2007) further stated that the sources of heavy metal pollutants are metal mining,
metal smelting, metallurgical industries, and other metal-using industries, waste disposal,
corrosion of metals in use, agriculture and forestry, fossil fuel combustion, and sports and
University of Ghana http://ugspace.ug.edu.gh
2
leisure activities. Heavy metals may be found in water, soil, sediments and plants in divers
amounts this may be as a result of natural or anthropogenic. Chemicals found in the
environment may contain some amounts of heavy metals and this may be absorbed by the
components of the soil profile. The mechanism by which the heavy metals are transported
through the soil profile has long presented great interest to both environmental and soil
scientists because of the possibility of groundwater contamination through metal leaching.
The protection of soils is and should be a principal objective of environmental policy
makers to prevent pollution of soils.
1.1 Background
Landfill reclamation is the process of transforming a full landfill from waste land to
woodland by successfully turning garbage into resilient landscape. Landfill sites are large
areas of land found near cities that in some cases have had a previous life as mine or
quarry and now acts as a large garbage receptacle. In the past decades there has been an
interest in reclaiming these areas for recreational purposes. The land cover around the
Korle Lagoon in Accra Metropolitan Assembly has different uses. The area can be
classified into four zones namely the wetland, reclaimed land, waste dump site and
wildlife habitat.
This research seeks to assess the levels of heavy metals in soils of the reclaimed landfill
site, e-waste dump site and central gardens site around the study area. Landfills are
sources of groundwater and soil pollution due to the production of leachate and its
migration through refuse.
Soon and Bates (1982) reported that high concentrations of heavy metals contamination
can frequently be established in the vicinity of mining sites, public roads, smelting sites
University of Ghana http://ugspace.ug.edu.gh
3
and solid waste dump sites. They can be present in soils forming chemical and physical
associations of different availability:
i. Simple or complex ions in soils solution
ii. Exchangeable ions
iii. Linked to organic substances
iv. Occluded or co-precipitated with oxides, carbonates, and phosphates or other
secondary minerals.
v. Ions in the crystalline lattices of primary minerals
1.2 Research Problem
An emerging environmental and human health problem in the world in the 21st century is
as a result of the indiscriminate disposal of electrical and electronic waste (e-waste)
(Schmidt, 2002, 2006; Asante et al., 2012). Electronic waste (e-waste) can be said to be
the end-of-life for electronic goods including televisions, monitors, computers, audio and
stereo equipment, video cameras, fax/photocopy machines and other peripheral items
(Frazzoli et al., 2010; Asante et al., 2012 ). According to the United Nations Environment
Programme (UNEP) (2005) as reported by Asante et al. (2012), 20–50 million tons of e-
waste is generated annually in the world. Of these quantities, significant amounts of e -
waste have been exported to developing countries such as China, India, Pakistan, Vietnam,
and the Philippines for disposal. The environmental problem with heavy metals is that
they are unaffected during degradation of organic waste and have toxic effects on living
organisms when exceeding a certain concentration. Exposure of heavy metals may cause
blood and bone disorders, kidney damage and decreased mental capacity and neurological
damage (NIEHS, 2002; Esakku, 2003).
University of Ghana http://ugspace.ug.edu.gh
4
In recent times, developing nations in West Africa (e.g., Ghana and Nigeria) have become
major destinations for e-waste worldwide (Asante et al., 2012). On the north-eastern part
of the Korle lagoon lies the Agbogbloshie slum, one of Ghana’s largest electronics-waste
processing sites. Electronic gadgets of no value are disposed off in a large area on the edge
of the e-waste market that is also used for the disposal of a wide range of other types of
wastes (Brigden et al., 2008) which normally find their way into the Korle lagoon. Settlers
burn discarded electronic gadgets at a section of the Korle lagoon reclamation area to
extract copper and other valuable metals. Local manufacturers buy the commodities,
offering one of the only steady income streams for most of the young men in the slum.
Unfortunately, the fumes which contain heavy metals and polyaromatic compounds from
the burning e-waste which eventually fall on soils and vegetation in the reclaimed area are
extremely hazardous (Schmidt, 2006; Otsuma et al., 2011).
Herds of cattle cross from the Abossey Okai Zongo and Korle Gonno communities to
graze on the vegetation at the reclaimed waste land. Just beside the reclaimed area is a
former dump site which has been converted to an active vegetable garden by the urban
poor in the vicinity. Ideriah et al. (2010) reported that concentrations of heavy metals in
soil around waste dumps are predisposed by all types of wastes. If high concentrations of
heavy metals are found in the vegetation, this may bioaccumulate in the herds of cattle and
other animals. This will further cause health problems along the food chain. The fumes
from the e-waste site may end up at the reclaimed portion (RZ) of the study area since its
topography is higher. A section of the reclamation area has been turned into a recreational
zone (KD) where children come to play especially on weekends and during school
vacations. These children may be exposed to heavy metals which may affect their health.
As reported by Ideriah et al. (2010), it has been shown that considerable amounts of toxic
metals arising from human activities are accumulated in soil (Agirtas et al., 1999) and
University of Ghana http://ugspace.ug.edu.gh
5
vegetation. This may have serious effect on the health of humans and animals. Although,
research works have been carried out on the Korle Lagoon, the presence of heavy metals
along the soil profile, forage grasses and crops grown have not been critically assessed. It
is therefore highly imperative that the presence of these metals be evaluated which is the
rationale for this research.
1.3 Objectives
The objectives of this project are:
To assess the level of heavy metal pollution in soils and vegetation around the
research area.
To assess the variability in heavy metal along the soil profile from the surface of
the soil to a depth of 60cm.
To identify possible sources, and
Risk assessment on the environment
1.4 Justification
Soils and vegetation in waste dump sites and e-waste areas are contaminated with heavy
metals, persistent organic pollutants and other pollutant as well. There is visible presence
of huge piles of dismantled e-waste materials some of which are frequently burnt in the
study area, leading to possible release of various elements or compounds, heavy metals
inclusive, originally contained in the e-waste into the immediate environment. This study
sought to investigate the extent of the heavy metal contamination in soils and vegetation
around the area where e-waste is dumped including around the waste dump, areas already
reclaimed and an area extensively used for vegetable farming by many low income
residents in the area.
University of Ghana http://ugspace.ug.edu.gh
6
CHAPTER TWO
LITERATURE REVIEW
A heavy metal is a member of an ill – defined subset of elements that exhibit metallic
properties, which would mainly include the transition metals, some metalloids, lanthanides
and actinides. Many different definitions have been proposed, some based on density,
some on atomic weight and some on chemical properties or toxicity. Heavy metals can
include elements lighter than carbon and can exclude some of the heaviest metals. The
speciation and bioavailability of trace metals in water are controlled by physical and
chemical interactions and equilibra. These interactions are affected by many factors,
including pH, redox, temperature, hardness, carbon dioxide concentrations, the type and
concentration of available ligands, chelating agents and type and concentrations of metal
ions (Lente et al., 2011). Beyersmann and Hartwig (2008) concluded that the toxicity of
heavy metals and their compounds largely depends on their bioavailability, that is, the
mechanisms of uptake through cell membranes, intracellular distribution, and binding to
cellular macromolecules.
According to Baird and Cann (2008), biologically the mechanism of the toxic action of
heavy metals usually arises from the strong affinity of the cations for sulphur which aid to
ingest molecules that contain metals. The sulfhydryl group, -SH which occurs commonly
in enzymes that control the speed of critical metabolic reactions in the human body. The
resultant metal-sulphur bonding affects the functioning of the enzyme to act normally and
as a result human health is adversely affected or sometimes fatal. The reaction of heavy-
metal cations M2+
(where M is Hg, Pb, or Cd) with the sulfhydryl units of enzymes R-S-H
to produce stable systems such as R-S-M-S-R (where R is an alkyl or aryl group and S is
sulphur) is analogous to their reaction with the simple inorganic chemical hydrogen
sulfide, H2S, with which they yield the insoluble solid MS (Baird and Cann, 2008).
University of Ghana http://ugspace.ug.edu.gh
7
High concentration of some heavy metals has a cumulative carcinogenic health effect on
human and this need to be avoided. Olawoyin et al.(2012) concluded that the extents of
deleterious health effects are aggravated mostly for children, especially the non-
carcinogenic risks. The individual heavy metals do not show significant health risk, but
their combined effects are of particular concern.
2.1 Cadmium (Cd)
Cadmium (Cd) is a silvery-white metallic element that can easily be shaped. The atomic
number of cadmium is 48; the element is one of the transition elements in group 12 (or
IIb) of the periodic table. Cadmium melts at 321°C (610°F), boils at 767°C (1413°F), and
has a specific gravity of 8.64; the atomic weight of cadmium is 112.41. When heated,
cadmium burns in air with a bright light, forming the oxide CdO. Because of its high rates
of soil-to-plant transfer, cadmium is a contaminant found in most human foodstuffs, which
renders diet a primary source of exposure among nonsmoking, non-occupationally
exposed populations (Clemens, 2006; Franz et al., 2008; McLaughlin et al., 2006).
2.1.1 Occurrence in environment
Cadmium occurs naturally in soils as a result of the weathering of the parent rock
(Alloway, 1995; Environment Agency, 2009). Sedimentary rocks have the greatest range
of cadmium concentrations with the highest values found in sedimentary phosphate
deposits and black slates (Alloway, 1995; Environment Agency, 2009). Large
concentrations of Cd in the soil are associated with parent material (black slates) and most
are manmade (burning of fossil fuels, application of fertilizers, sewage sludge, plastic
waste and e-waste) which is responsible for soil contamination and also contaminates
pasture (Reis et al.,2010)
University of Ghana http://ugspace.ug.edu.gh
8
Anthropogenic sources of cadmium are much more significant than natural emissions and
account for its ubiquitous presence in soil (Alloway, 1995; ECB, 2007; ATSDR, 2008;
Environment Agency, 2009).
Atmospheric deposition is also an important source of cadmium pollution (Alloway, 1995;
ECB, 2007; ATSDR, 2008; Environment Agency, 2009). The major sources of
atmospheric emissions are non-ferrous metal production, fossil fuel combustion, waste
incineration, and iron and steel production (Alloway, 1995; ATSDR, 2008). A
representative deposition rate to agricultural land across the European Union has been
estimated to be 3 g of cadmium per hectare per year (Alloway, 1995; Kabata-Pendias and
Mukherjee, 2007; Environment Agency, 2009).
The primary commercial source of cadmium is as a byproduct from the processing of zinc
ores including sphalerite and smithsonite (Alloway, 1995; ECB, 2007; Environment
Agency, 2009a). Cadmium metal, its alloys and compounds have been used in a variety of
different industrial and consumer products, although most uses are now declining due to
concerns about its toxicity (ATSDR, 2008; Environment Agency, 2009a).
Adsorption of cadmium by soil depends strongly on pH, which affects mobility of
cadmium but decreases with increasing alkalinity (Anderson and Christensen, 1988;
Alloway, 1995; Holm et al., 2003; Environment Agency, 2009) and soil organic matter
(SOM) is also an important factor (Holm et al., 2003; Kabata-Pendias and Mukherjee,
2007; Environment Agency, 2009c).
2.1.2 Uses
Cadmium lowers the melting point of metals with which it is alloyed; it is used with lead,
tin, and bismuth in the manufacture of fusible metals for automatic sprinkler systems, fire
alarms, and electric fuses. An alloy of cadmium with lead and zinc is used as a solder for
University of Ghana http://ugspace.ug.edu.gh
9
iron. Cadmium salts are used in photography and in the manufacture of fireworks, rubber,
fluorescent paints, glass, and porcelain. Cadmium has been used as a control or shielding
material in atomic energy plants because of its high absorption of low-energy neutrons.
Cadmium sulfide is employed in a type of photovoltaic cell, and nickel-cadmium batteries
are in common use for specialized purposes. Cadmium (Cd) occurs in electronics both as
cadmium metal, in some switches and solder joints, and as cadmium compounds in
rechargeable batteries, UV stabilizers in older PVC cables and “phosphor” coatings in
older cathode ray tubes.
2.1.3 Health effect
According to Olawoyin et al.(2012) cadmium (Cd) causes damage to the lungs, kidneys
and bones, and it is a known human carcinogen. Its toxicity is linked with reproduction
problem because it affects sperm and reduces birth weight. It is a potential carcinogen and
seems to be a causal factor in cardiovascular diseases and hypertension
Like lead, cadmium can accumulate in the body over time, with long-term exposure
causing damage to the kidneys and bone structure. Oral, dermal and inhalation exposures
contribute to the same systemic effects on the kidney and bone (Environment Agency,
2009c). Cadmium and its compounds are known human carcinogens, primarily through
inhalation of contaminated fumes and dusts. (Asio, 2007, http://soil-
environment.blogspot.in/search/label/heavy%20metalsretrieved on the 18th
February
2013).
2.2 Nickel (Ni)
The nickel institute reported that nickel is a naturally occurring element (the 24th most
abundant element in the periodic table) and as a consequence of natural and man-made
processes can be found ubiquitously in the air, soil, sediments and water. As with all
University of Ghana http://ugspace.ug.edu.gh
10
metals and chemicals, excessive amounts of nickel in any of these environmental
compartments can result in deleterious impacts on the quality of the environment for flora
and fauna.
Barceloux (1999) reported that nickel is abundant in the crust of the earth, comprising
about 3% of the composition of the earth. Nickel averages 50 mgkg-1
in soils and
commonly varies from 5 to 500 mgkg-1
but ranges up to 24,000 to 53,000 mgkg-1
in soil
near metal refineries or in dried sewage sludge, respectively. Agricultural soils typically
contain 3 to 1000 mgkg-1
, whereas soils derived from basic igneous rocks may contain
from 2000 to 6000 mgkg-1
2.2.1 Occurrence in the environment
Most nickel on Earth is inaccessible because it is locked away in the planet's iron-nickel
molten core, which is 10 % nickel. The total amount of nickel dissolved in the sea has
been calculated to be around 8 billion tons. Organic matter has a strong ability to absorb
the metal which is why coal and oil contain considerable amounts. The nickel content in
soil can be as low as 0.2mgkg-1
or as high as 450mgkg-1
in some clay and loamy soils. The
average is around 20mgkg-1
. Nickel occurs in some beans where it is an essential
component of some enzymes. Another relatively rich source of nickel is tea which has 7.6
mg/kg of dried leaves.
(http://www.lenntech.com/periodic/elements/ni.htm#ixzz2DiaUqP74 retrieved on 29th
November 2012).
2.2.2 Uses
Humans use nickel for many applications like the use of nickel as an ingredient of steel
and other metal products.
University of Ghana http://ugspace.ug.edu.gh
11
2.2.3 Health effect
Foodstuffs have low natural content of nickel but high amounts can occur in food crops
growing in polluted soils. Humans may also be exposed to nickel by inhalation, drinking
water, smoking, and eating contaminated food. Uptake of high quantities of nickel can
cause cancer, respiratory failure, birth defects, allergies, and heart failure
(www.Lenntech.com/periodic-chart-elements/Ni-en.htm retrieved on the 29th
November
2012).
2.3 Chromium (Cr)
Chromium has atomic number of 24 and electronic configuration of [Ar] 4s13d
5. The
stable forms of Cr in the environment are the trivalent Cr(III) and the hexavalent Cr(VI)
species, although there are various other valency states that are unstable and short-lived in
biological systems. Chromium(VI) exists in soils as a relatively soluble anion under most
conditions (CrO42-
or HCrO4-). While sodium and potassium salts of chromates are freely
soluble over the pH range 1–14, calcium chromate (CaCrO4) is only moderately soluble,
and lead and barium chromates (PbCrO4) and (BaCrO4) are only sparingly soluble at near-
neutral pH values. In the absence of solubility-controlling solids, Cr(VI) aqueous
concentrations under acidic to slightly alkaline conditions will primarily be controlled by
adsorption/desorption reactions. Cr(VI) is adsorbed by mineral solids that have exposed
inorganic hydroxyl groups on their surfaces, including iron and aluminum oxides,
kaolinite, and, to a lesser extent, montmorillonite ( Rai et al., 1989; Zupancic et al., 2008).
Cr(VI) adsorption increases with decreasing pH as a result of protonation of the surface
hydroxyl site (SOH+
2) and aqueous speciation of Cr(VI). Chromium (III) is less mobile,
less toxic and mainly bound to organic matter in soil and aquatic environments (Shanker et
University of Ghana http://ugspace.ug.edu.gh
12
al., 2005). Zupancic et al. 2008 asserted that Cr (III) in soil, is found predominantly in
insoluble forms, such as sparingly soluble Cr2O3 and Cr(OH)3.
2.3.1 Uses
Chromium and its compounds have multifarious industrial uses. They are extensively
employed in leather processing and finishing, in the production of refractory steel,
electroplating cleaning agents, catalytic manufacture, etc., (Shanker et al., 2005). These
anthropogenic activities have led to widespread contamination of the environment by Cr,
as well as to deposition of Cr-contaminated waste (Zupancic et al., 2008).
2.3.2 Health effect on the environment
Shanker et al.(2005) reported that chromium is a toxic, non-essential element to plants
therefore they do not possess specific mechanisms for its uptake. This metal’s toxicity in
plants is observed at multiple levels, from reduced yield, through effects on leaf and root
growth, to inhibition of enzymatic activities and mutagenesis. It is required for
carbohydrate and lipid metabolism and the utilization of amino acids. Toxic levels are
common in soils applied with sewage sludge.
2.4 Lead (Pb)
Lead(Pb) is a chemical element with symbol Pb and atomic number of 82 and it is a main
group element belonging to group 4. It forms oxidation states +2 and +4, with +4 being
achieved with highly electronegative elements (F, O) (Greenwood and Earnshaw, 1997).
Lead has many isotopes but four (4) stable ones. The four (4) stable isotopes are 204
Pb,
206Pb,
207Pb and
208Pb with
204Pb regarded as primordial Pb and Pb-206, Pb-207, Pb-208
are formed from decay of Uranium(U) and Th. The one common radiogenic isotope, 202
Pb,
has a half-life of approximately 53,000 years.
University of Ghana http://ugspace.ug.edu.gh
13
2.4.1 Occurrence in the environment
LEAD Group Inc.(2011) asserted that lead deposited on the ground is transferred to the
upper layers of the soil surface, where it may be retained for many years (up to 2000
years). In undisturbed ecosystems, organic matter in the upper layer of soil surface retains
atmospheric lead. In cultivated soils, this lead is mixed with soil to a depth of 25cm (i.e.,
within the root zone). Atmospheric lead in the soil will continue to move into the micro-
organism and grazing food chains, until equilibrium is reached. The central nervous of
animals are affected by lead and this inhibits their ability to synthesis red blood cells.
Lead has been known to be toxic since the 2nd century BC in Greece according to Asio,
(2007) (retrieve on the 18th
February 2013 from http://soil-
environment.blogspot.in/search/label/heavy%20metals). It is a widespread contaminant in
soils and lead poisoning is one of the most prevalent public health problems in many parts
of the world. It was the first metal to be linked with failures in reproduction.
The metal can affect all components of the environment and can move through the
ecosystem until it reaches equilibrium. Lead accumulates in the environment, but in
certain chemical environments it will be transformed in such a way as to increase its
solubility (e.g., the formations of lead sulfate in soils), its bioavailability or its toxicity.
The effects of lead at the ecosystem level are usually seen as a form of stress (US EPA,
1986).
2.4.2 Uses
LEAD Group Inc.(2011) reported from Lead action news, (1993) that lead moves into and
throughout the ecosystems in different routes. Atmospheric lead is deposited in vegetation,
ground and water surfaces. The chemical and physical properties of lead and the
University of Ghana http://ugspace.ug.edu.gh
14
biogeochemical processes within ecosystems will influence the movement of lead through
ecosystems.
The main sources of lead entering an ecosystem are atmospheric lead (primarily from
automobile emissions), paint chips, used ammunition, fertilizers and pesticides and lead-
acid batteries or other industrial products. The transport and distribution of lead from
major emission sources, both fixed and mobile, are mainly through air (UNEP, 1991). Pb
is widely used in electronic goods, as a major component of solders (as an alloy with tin)
and its compounds have also been used as stabilizers in some PVC cables and other
products.
2.4.3 Health effect
Lead affects the brain, causing hyperactivity and deficiency in the fine motor functions,
thus, it results in damage to the brain. The nervous systems of children are especially
sensitive to Pb leading to retardation. It is also cardiotoxic and contributes to
cardiomyopathy (disease of the heart muscle leading to the enlargement of the heart). Lead
is highly toxic to humans, as well as to animals and plants (Khan et al., 2008)
2.5 Zinc (Zn)
Zinc has an electron configuration of [Ar]3d10
4s2 and is a member of the group 12 of
the periodic table. Zinc is a metallic chemical element; it has the symbol Zn and atomic
number 30. It is the first element in group 12 of the periodic table. According to Wikipedia
zinc is, in some respects, chemically similar to magnesium, because its ion is of similar
size and its only common oxidation state is +2. Zinc is the 24th most abundant element in
the Earth's crust and has five stable isotopes. It is a moderately reactive metal and
strong reducing agent (CRC, 2006). The surface of the pure metal tarnishes quickly,
eventually forming a protective passivating layer of the basic carbonate Zn5(OH)6(CO3)2,
University of Ghana http://ugspace.ug.edu.gh
15
by reaction with atmospheric carbon dioxide (Porter, 1994). This layer helps prevent
further reaction with air and water.
Zinc burns in air with a bright bluish-green flame, giving off fumes of zinc oxide. Zinc
reacts readily with acids, alkalis and other non-metals. Extremely pure zinc reacts only
slowly at room temperature with acids. Strong acids, such as hydrochloric or sulfuric acid,
can remove the passivating layer and subsequent reaction with water releases hydrogen
gas (Holleman et al., 1985).
2.5.1 Occurrence in the environment
Zinc(I) compounds
Zinc (I) compounds are rare, and requires bulky ligands to stabilize the low oxidation
state. Most zinc(I) compounds contains formally the [Zn2]2+
core, which is analogous to
the [Hg2]2+
dimeric cation present in mercury(I) compounds (Housecroft and Sharpe,
2008).
Zinc (II) Compounds
Binary compounds of zinc are known for most of the metalloids and all
the nonmetals except the noble gases. The chemistry of zinc is dominated by the +2
oxidation state (Ritchie, 2004). The oxide ZnO is a white powder that is nearly insoluble
in neutral aqueous solutions, but is amphoteric, dissolving in both strong basic and acidic
solutions (Holleman et al.,1985).
2.5.2 Uses
Zinc oxide is widely used as a white pigment in paints, and as a catalyst in the
manufacture of rubber. It is also used as a heat disperser for the rubber and acts to protect
its polymers from ultraviolet radiation (the same UV protection is conferred to plastics
University of Ghana http://ugspace.ug.edu.gh
16
containing zinc oxide) (Emsley, 2001).The semiconductor properties of zinc oxide make it
useful in varistors and photocopying products (Zhang, 1996). Zinc sulfide (ZnS) is used
in luminescent pigments such as on the hands of clocks, X-ray and television screens,
and luminous paints. Crystals of ZnS are used in lasers that operate in the mid-
infrared part of the spectrum (Paschotta, 2008). Zinc sulfate is a chemical in dyes and
pigments. Zinc pyrithione is used in antifouling paints (Konstantinou and Albanis, 2004)
2.5.3 Health effect
Even though zinc is an essential requirement for a healthy body, excess zinc can be
harmful, and cause zinc toxicity (Fosmire, 1990). Excessive absorption of zinc can
suppress copper and iron absorption. The free zinc ion in solution is highly toxic to plants,
invertebrates, and even vertebrate fish. The Free Ion Activity Model (FIAM) is well-
established in the literature, and shows that just micromolar amounts of the free ion kills
some organisms. A recent example showed 6 micromolar killing 93% of all Daphnia in
water (Muyssen, 2006).
The free zinc ion is also a powerful Lewis acid up to the point of being corrosive. Stomach
acid contains hydrochloric acid, in which metallic zinc dissolves readily to give
corrosive zinc chloride. Swallowing a post-1982 American one cent piece (97.5% Zinc)
can cause damage to the stomach lining due to the high solubility of the zinc ion in the
acidic stomach (Bothwell et al., 2003).
There is also a condition called the zinc shakes or "zinc chills" that can be induced by the
inhalation of freshly formed zinc oxide formed during the welding of galvanized materials
(Fosmire, 1990). Soils contaminated with zinc through the mining of zinc-containing ores,
refining, or where zinc-containing sludge is used as fertilizer, can contain several grams of
zinc per kilogram of dry soil. Levels of zinc in excess of 500 ppm in soil interfere with the
University of Ghana http://ugspace.ug.edu.gh
17
ability of plants to absorb other essential metals, such as iron and manganese. Zinc levels
of 2000 ppm to 180,000 ppm (18%) have been recorded in some soil samples (Emsley,
2001).
Zinc (Zn) is an indispensable element required by the human body within an allowable
daily intake of 15 mg and 5 mg for adults and children respectively. Levels of zinc above
150 mg/day are considered to have deleterious effects in humans (RAIS, 2009; Olawoyin
et al., 2012).
2.6 Arsenic (As)
Arsenic has atomic number of 33 and is in group 5. In its elemental form arsenic occurs in
two forms under ambient conditions – a steel grey coloured brittle metallic solid or a dark
grey amorphous solid (ATSDR, 2007; Environment Agency, 2009b). Although it is
commonly described as a heavy metal, arsenic is a metalloid with a complex chemistry
similar to phosphorous (CCME, 2001).Arsenic is a well-known poison and a carcinogen.
It has an average concentration in the soil of 5 to 6 mg/kg. Its amount in the soil is related
to rock type and industrial activity.
2.6.1 Occurrence in the environment
Arsenic occurs naturally in the environment although rarely in its elemental form (CCME,
2001). Over 200 arsenic-containing minerals have been identified, with approximately 60
per cent being arsenates, 20 per cent sulphides and sulphosalts, and the remaining 20 per
cent including arsenides, arsenites and oxides. The most commonly occurring form is
arsenopyrite, an iron arsenic sulphide associated with many types of mineral deposits and
especially those including sulphide mineralisation (O’Neill, 1995; Farago et al., 2003).
Arsenate reportedly binds strongly to iron and manganese oxides, and therefore remains in
the surface soil layer after deposition (ATSDR, 2007). Arsenic was observed to be still
University of Ghana http://ugspace.ug.edu.gh
18
concentrated after 15 years in the top 20–40 cm of orchard soils treated with lead arsenate
(Merwin et al. 1994; Environmental Agency, 2009c).
Arsenic forms organic and inorganic compounds with the most common valence states
being -3, +3 or +5 (ATSDR, 2007). Arsenic trioxide is a white crystalline solid at room
temperature. It is produced commercially as a by-product of the smelting of non-ferrous
ores including copper and lead (IPCS, 2001; ATSDR, 2007). Most arsenic trioxide is
subsequently converted to arsenic acid (H3AsO4), which forms arsenate salts (ATSDR,
2007; Environment Agency, 2009c).
In typical surface soils, the most important inorganic forms of arsenic are arsenite (AsO33)
and arsenate (AsO43–
), with the latter dominating under aerobic/oxidizing conditions
(O’Neill, 1995; Kabata-Pendias and Mukherjee, 2007).
Anthropogenic activity has resulted in the widespread atmospheric deposition of arsenic
from the burning of coal and the smelting of non-ferrous metals including copper (O’Neil,
1995; Environmental Agency, 2009c). Agricultural practice including the historical use of
arsenic-based pesticides and ongoing application of fertilizers, sludges and manures
containing arsenic has resulted in the accumulation of arsenic in topsoils (O’Neil, 1995;
Kabata-Pendias and Mukherjee, 2007, Environment Agency, 2009c).
2.6.2 Uses
Arsenic and its inorganic compounds have also been used as a decolourizer in the
manufacture of glass, in various metallurgical processes including the production of
alloys, in veterinary and human medicines, and lead– acid batteries (CCME, 2001; IPCS,
2001; ATSDR, 2007; Kabata-Pendias and Mukherjee, 2007).
University of Ghana http://ugspace.ug.edu.gh
19
2.6.3 Health effect
The organs of the body that are usually affected by arsenic poisoning are the lungs, skins,
kidney and liver (Mayo Medical Laboratory, 2012). Arsenic is related to heart diseases
(hypertension and cardiovascular), cancer and stroke (Tseng et al., 2003). The final result
of arsenic poisoning is coma to death.
2.7 Copper (Cu)
Copper is a chemical element with atomic number 29 with symbol Cu. It has electronic
configuration [Ar] 3d10
4s1. It is a ductile metal with very high thermal and electrical
conductivity. Pure copper is soft and malleable; a freshly exposed surface has a reddish-
orange color. It is used as a conductor of heat and electricity, a building material, and a
constituent of various metal alloys.
Copper (III) and Copper(IV)
Copper (III) is mostly characteristically found in oxides. A simple example is potassium
cuprate, KCuO2, a blue-black solid. The best studied copper (III) compounds are the
cuprate superconductors. Yttrium barium copper oxide (YBa2Cu3O7) consists of both Cu
(II) and Cu (III) centres. Like oxide, fluoride is a highly basic anion and is known to
stabilize metal ions in high oxidation states. Indeed, both copper (III) and even copper
(IV) fluorides are known, K3CuF6 and Cs2CuF6, respectively (Holleman et al., 2001).
2.7.1 Occurrence in the environment
Copper is a very common element that occurs naturally in the environment and spreads
through the environment through natural phenomena. Humans widely use copper in
industries and in agriculture. Globally, production of copper has increased over the years
and this has increase the copper in the environment.
University of Ghana http://ugspace.ug.edu.gh
20
Rivers are depositing sludge on their banks that is contaminated with copper, due to the
disposal of copper-containing wastewater. Copper evaporate into the air, mainly through
release during the combustion of fossil fuels. Copper in air will remain there for an
eminent period of time, before it settles when it starts to rain. It will then end up mainly in
soils. As a result soils may also contain large quantities of copper after copper resulting in
absorption or uptake by some plants.
2.7.2 Uses
Most copper is used for electrical equipment (60%); construction, such as roofing and
plumbing (20%); industrial machinery, such as heat exchangers (15%) and alloys (5%).
The main long established copper alloys are bronze, brass, copper-tin-zinc, which is strong
enough to make guns and cannons, and is known as gun metal. Copper and nickel is
known as cupronickel, which is the preferred metal for low-denomination coins( Emsley,
2003). Copper is ideal for electrical wiring because it is easily worked, can be drawn into
fine wire and has a high electrical conductivity.
2.7.3 Health effect
Copper is an essential micronutrient required by plants, animals, and human health. It is
also required for the normal functioning of aerobic microorganisms. Soils that are
naturally deficient in copper often require copper supplements before agricultural crops,
such as cereals, can be grown.
Copper deficiencies in soil can lead to crop failure. Copper deficiency is a major issue in
global food production, resulting in losses in yield and reduced quality of output. Nitrogen
fertilizers can worsen copper deficiency in agricultural soils.
University of Ghana http://ugspace.ug.edu.gh
21
The most effective strategy to counter copper deficiency is to supplement the soil with
copper, usually in the form of copper sulfate. Sewage sludge is also used in some areas to
replenish agricultural land with organics and trace metals, including copper.
In livestock, cattle and sheep commonly show indications when they are copper deficient.
Swayback, a sheep disease associated with copper deficiency, imposes enormous costs on
farmers in many tropical countries.
Toxicity from copper deficiency can be treated with a balanced diet or supplementation
under the supervision of a doctor. On the contrary, like all substances, excess copper
intake at levels far above World Health Organization limits can become toxic
(http://www.copperinfo.com/health/facts.html retrieved on the 13th
March 2013)
2.8 Mercury (Hg)
Mercury is a chemical element with atomic number of 80 and symbol Hg. It has electronic
configuration of [Xe] 4f14
5d10
6S2 . Mercury exists in two main oxidation states, I and II.
Higher oxidation states are unimportant, but have been detected, e.g., mercury(IV)
fluoride (HgF4) but only under extraordinary conditions (Wang et al, 2007). Azevedo et
al.(2012) quoted in a review of phytotoxicity of mercury in plants that among metals, Hg
is unique as it is found in the environment in several physical and chemical forms: for
example, elemental Hg(Hg0), inorganic Hg (Hg
2+), associated with ions (SHg), mercurous
chloride or calomel (Hg2Cl2), and organic Hg (e.g. CH3-Hg) (Boening, 2000; Zahir et al.,
2005; Clarkson et al., 2007).
According to Environment Agency (2009) mercury is most commonly encountered in the
environment in elemental form, as inorganic mercuric (Hg2) compounds, or as
University of Ghana http://ugspace.ug.edu.gh
22
monomethylmercury compounds with the general formula, CH3HgX2.The most important
source of mercury is the naturally occurring mineral, cinnabar (HgS).
In its elemental form, mercury is a dense, silvery white metal, which is a volatile liquid at
room temperature (ATSDR, 1999). Mercury readily forms amalgams with a variety of
other metals including sodium and zinc, although not with the lighter transition metals
such as iron (Greenwood and Earnshaw, 1997; Environment Agency, 2009b).
Mercury(II) oxide, the main oxide of mercury, arises when the metal is exposed to air for
long periods at elevated temperatures. It reverts to the elements upon heating near 400 °C,
as was demonstrated by Priestly in an early synthesis of pure oxygen (Greenwood and
Earnshaw, 1997).
Being a soft metal, mercury forms very stable derivatives with the heavier chalcogens.
Preeminent is mercury(II) sulfide, HgS, which occurs in nature as the ore cinnabar and is
the brilliant pigment vermillion. Like ZnS, HgS crystallizes in two forms, the reddish
cubic form and the black zinc blend form (Hammond, 2005). Mercury(II) selenide (HgSe)
and mercury(II) telluride (HgTe) are also known, these as well as various derivatives, e.g.
mercury cadmium telluride and mercury zinc telluride being semiconductors useful as
infrared detector materials (Rogalski, 2000).
Hammond (2005) reported that mercury(II) salts form a variety of complex derivatives
with ammonia. These include Millon's base (Hg2N+), the one-dimensional polymer (salts
of HgNH+
2)n, and "fusible white precipitate" or [Hg(NH3)2]Cl2. Known as Nessler's
reagent, potassium tetraiodomercurate(II)(HgI2−
4) is still occasionally used to test for
ammonia owing to its tendency to form the deeply colored iodide salt of Millon's base.
Mercury fulminate is a detonator widely used in explosives.
University of Ghana http://ugspace.ug.edu.gh
23
Organic mercury usually have the formula HgR2, which are often volatile, or HgRX,
which are often solids, where R is aryl or alkyl and X is usually halide or acetate.
Methylmercury, a generic term for compounds with the formula CH3HgX, is a dangerous
family of compounds that are often found in polluted water (National Research Council,
2000).
2.8.1 Occurrence in the environment
Almost all commercial production of mercury comes from the sulphide ore, cinnabar,
which results from hydrothermal mineralization associated with volcanic activity
(Steinnes, 1995; Kabata-Pendias and Mukherjee, 2007; Environment Agency, 2009c).
Anthropogenic activity is a major source of aerial emissions of mercury and a significant
contributor to soil contamination (Steinnes, 1995; ATSDR, 1999). Most of the mercury in
air is present as elemental mercury vapour: 90–99% according to European Commission
(2001); over 95% according to ATSDR (1999); and 75% according to IPCS (1990), which
assumed 5% occurred as inorganic mercury and 20% as methylmercury (Environment
Agency, 2009b). The main sources of contamination have been mining and smelting,
burning of fossil fuels, industrial production of sodium hydroxide and chloride, and waste
incineration although mercury also occurs in trace amounts in fertilizers used on farmland
(Steinnes, 1995).
2.8.2. Uses
Elemental mercury was employed in hundreds of applications, many of which (e.g.,
electrical switches) took advantage of the unusual property that it is a liquid that conducts
electricity well (US EPA, 2005).
University of Ghana http://ugspace.ug.edu.gh
24
Mercury is still used in some batteries and lighting components for flat screen electronic
displays, and was formerly used also in switches and relays. Mercury can also be used in
the preservation of wood.
2.8.3 Health effect
Mercury is the most volatile of metals, and its vapor is highly toxic as asserted by Colin
Baird. Mercury and most of its compounds are extremely toxic and must be handled with
care; in cases of spills involving mercury (such as from certain thermometers or
fluorescent light bulbs), specific cleaning procedures are used to avoid exposure and
contain the spill (US EPA, 2005).This heavy metal is toxic even at low concentrations to a
wide range of organisms including humans. Mercury and its compounds are highly toxic,
causing damage to the central nervous system and kidneys. Once in the environment,
mercury can be converted to its organic methylated form by bacterial activity, a form,
which is highly bio-accumulative, as well as being toxic.
The organic form of mercury can be particularly toxic, and the methyl-and ethyl-forms
have been the cause of several major epidemics of poisoning in humans resulting from the
ingestion of contaminated food, e.g. fish. Two major epidemics in Japan were caused by
the release of methyl and other mercury compounds from an industrial site followed by
accumulation of the chemicals in edible fish. The poisoning became well-known as
Minamata disease (Posted by Victor B. Asio (2007), http://soil-
environment.blogspot.in/search/label/heavy%20metals; retrieved on 18th
February 2013).
2.9 Tin ( Sn)
Tin has atomic number 50 and electronic configuration [Kr] 4d10
5s2 5p
2. It is in group 14
of the periodic table with symbol Sn. Tin shows chemical similarity to both neighboring
group 14 elements, germanium and lead and has two possible oxidation states, +2 and the
University of Ghana http://ugspace.ug.edu.gh
25
slightly more stable +4. Tin is the 49th most abundant element and has 10 stable isotopes,
the largest number of stable isotopes in the periodic table. Tin is obtained chiefly from the
mineral cassiterite, where it occurs as tin dioxide, SnO2.
2.9.1 Occurrence in the environment
Tin is a natural element in the earth's crust. It is a soft, white, silvery metal that does not
dissolve in water. It is present in brass, bronze, pewter, and some soldering materials. Tin
metal is used to line cans for food, beverages, and aerosols. Tin is a component of many
soils. Tin may be released in dusts from wind storms, roads, and farming activities. Gases,
dusts, and fumes containing tin may be released from smelting and refining processes,
burning of waste, and burning of fossil fuels (coal or oil). Tin binds to soils and to
sediments in water and is generally regarded as being relatively immobile in the
environment. Tin cannot be destroyed in the environment. It can only change its form or
become attached or separated from particles in soil, sediment, and water (ATSDR, 2005)
2.9.2 Uses
Tin can combine with other chemicals to form compounds. Combinations with chemicals
like chlorine, sulfur, or oxygen are called inorganic tin compounds (i.e., stannous chloride,
stannous sulfide, stannic oxide). These are used in toothpaste, perfumes, soaps, food
additives and dyes. Tin also can combine with carbon to form organotin compounds (i.e.,
dibutyltin, tributyltin, triphenyltin) (Hon and Shiraishi, 2001). These compounds are used
to make plastics, food packages, plastic pipes, pesticides, paints, and pest repellents.
2.9.3 Health effect
Draggan, 2012, published an article on http://www.eoearth.org (Retrieved December 5,
2012) titled “Health effects of tin” wrote that tin is present in the air, water, soil, and
University of Ghana http://ugspace.ug.edu.gh
26
landfills and is normally found in plants and animals. Tin is therefore found in human
tissues even though there is no evidence that tin is an essential element for a healthy body.
Tin concentrations in vegetables, fruits and fruit juices, nuts, dairy products, meat, fish,
poultry, eggs, beverages, and other foods not packaged in metal cans are generally less
than 2ppm. Humans exposed to tin when contaminated food or juice are eaten or taken.
Canned food from lacquered tin-lined cans contains less than 25 ppm of tin since the
lacquer prevents the food from reacting with the tin. Food from unlacquered tin-lined cans
contains up to 100 ppm of tin since the reaction of the food with the can causes some of
the tin to dissolve in the contents of the can.
Humans are usually exposed to tin at far less than 1 ppm from air and water. The amounts
in air and water near hazardous waste sites could be higher. Young children sometimes eat
soil during play. While most soil contains about 1 ppm tin, some soils may contain as
much as 200 ppm tin (http://www.eoearth.org/article/Health_effects_of_tin.html retrieved
on 5th
December 2012).
2.10 Physicochemical analysis of soils
2.10.1Total organic carbon / total organic matter
Total organic carbon (TOC) is the carbon (C) stored in soil organic matter (SOM).
Organic carbon (OC) enters the soil through the decomposition of plant and animal
residues, root exudates, living and dead microorganisms, and soil biota. SOM is the
organic fraction of soil exclusive of non-decomposed plant and animal residues.
Nevertheless, most analytical methods do not distinguish between decomposed and non-
decomposed residues. SOM is a heterogeneous, dynamic substance that varies in particle
size, Carbon content, decomposition rate, and turnover time.
University of Ghana http://ugspace.ug.edu.gh
27
Soil Organic Carbon (SOC) is the main source of energy for soil microorganisms. The
ease and speed with which SOC becomes available is related to the SOM fraction in which
it resides. In this respect, SOC can be partitioned into fractions based on the size and
breakdown rates of the SOM in which it is contained.
SOM contains approximately 58% C; therefore, a factor of 1.72 can be used to convert OC
to SOM. There is more inorganic C than TOC in calcareous soils. TOC is expressed as
percent C per 100 g of soil (Edwards et al., 1999;
http://soilquality.org/indicators/total_organic_carbon.html retrieved on 29th
November
2012)
2.10.2 Soil pH
Soil pH generally refers to the degree of soil acidity or alkalinity. Chemically, it is defined
as the log10 hydrogen ions (H+) in the soil solution. The pH scale ranges from 0 to 14; a
pH of 7 is considered neutral. If pH values are greater than 7, the solution is considered
basic or alkaline; if they are below 7, the solution is acidic. A few changes in the pH units
can induce significant changes in the chemical environment and sensitive biological
processes. For example, a soil with pH 5 is 10 or 100 times more acidic than a soil with
pH 6 or 7, respectively. Sources of H+ ions in soil solution include carbonic acid produced
when carbon dioxide (CO2) from decomposing organic matter, root respiration, and the
soil atmosphere is dissolved in the soil water. Other sources of H+ ions are root release,
reaction of aluminum ions (Al+3
) with water, nitrification of ammonium from fertilizers
and organic matter mineralization, reaction of sulfur compounds, rainwater, and acid rain.
Certain soils are more resistant to a drop or rise in pH (buffering capacity). Soil pH affects
the soil's physical, chemical, and biological properties and processes, as well as plant
growth. The nutrition, growth, and yields of most crops decrease where pH is low and
University of Ghana http://ugspace.ug.edu.gh
28
increase as pH rises to an optimum level (Smith and Doran, 1996;
http://soilquality.org/indicators/soil_ph.html retrieved on 29th November 2012).
2.10.3 Cation exchange capacity
The cation exchange capacity (CEC) of a soil is a measure of the quantity of negatively
charged sites on soil surfaces that can retain positively charged ions (cations) such as
calcium (Ca2+
), magnesium (Mg2+
), and potassium (K+), by electrostatic forces.
Cation exchange sites are found primarily on clay minerals and organic matter (OM)
surfaces. Soil OM will develop a greater CEC at near-neutral pH than under acidic
conditions (pH-dependent CEC). Thus, addition of an organic material will likely increase
a soil's CEC over time. On the other hand, a soil’s CEC can decrease with time as well,
through e.g. natural or fertilizer-induced acidification and/or OM decomposition. Soil
CEC is normally expressed in one of two numerically equivalent sets of units: meq/100 g
(milliequivalents of charge per 100 g of dry soil) or cmolc/kg (centimoles of charge per
kilogram of dry soil) (Ross and Kettering, 2011).
University of Ghana http://ugspace.ug.edu.gh
29
CHAPTER THREE
MATERIALS AND METHODS
3.1 Study site
A general site survey was done prior to the main sampling. This was done for effective
sampling and reduces major obstacles during sampling. Mock sampling points were taken
using the GPS in each case. The Korle Lagoon is a coastal wetland comprising beautiful
sand dunes, open lagoon, salt pans, marsh and scrubs, which provide extensive suitable
feeding, roosting and nesting grounds for various species of seabirds and it used to be a
haven for bird-watchers.
Located in the south-west of the central business district of Accra, it is the major basin into
which the greater proportion of the floodwaters from metropolitan Accra flows before
finally entering the sea.
The lagoon covers a total surface area of about 0.6 km2 and drains a total catchment area
of about 400 km2.The major inlets into the lagoon are the Odaw River with its major
tributary, River Onyasia, which drains the northern parts of Accra including Haatso, Papao
and Agbogba.
The research area, Korle Lagoon Reclamation Area is separated from the densely
populated Old Fadama slum (Sodom and Gomorrah slum) by the Korle Lagoon. The
research area covers the popular E-waste area (EW) where burning of electronic waste
collected along the length and breadth of the capital is brought for burning, in order for the
essential components taken for onward sale abroad. The Garden area (GZ) is behind the
International Central Gospel Church, where growing of vegetables is on the increase.
Farmers keep expanding their farms at this area which used to be a waste dumping area for
the Abossey Okai zongo community. The reclaimed waste dump site (RZ) opposite the
University of Ghana http://ugspace.ug.edu.gh
30
Ghana Revenue Authority office for the Ablekuma District use to be one of the waste
dumping sites in the Accra metropolis. The recreational site (KD) created during the Korle
lagoon reclamation project (even though not complete) which is almost opposite the Accra
waste treatment site which has some see-saws and a well-planned football field where
children normally comes to play from Korle Gonno and the Agbogbloshie communities
through to the land area at the estuary area (ES) end of the Korle Lagoon just behind the
Ablekumah district Assembly office.
University of Ghana http://ugspace.ug.edu.gh
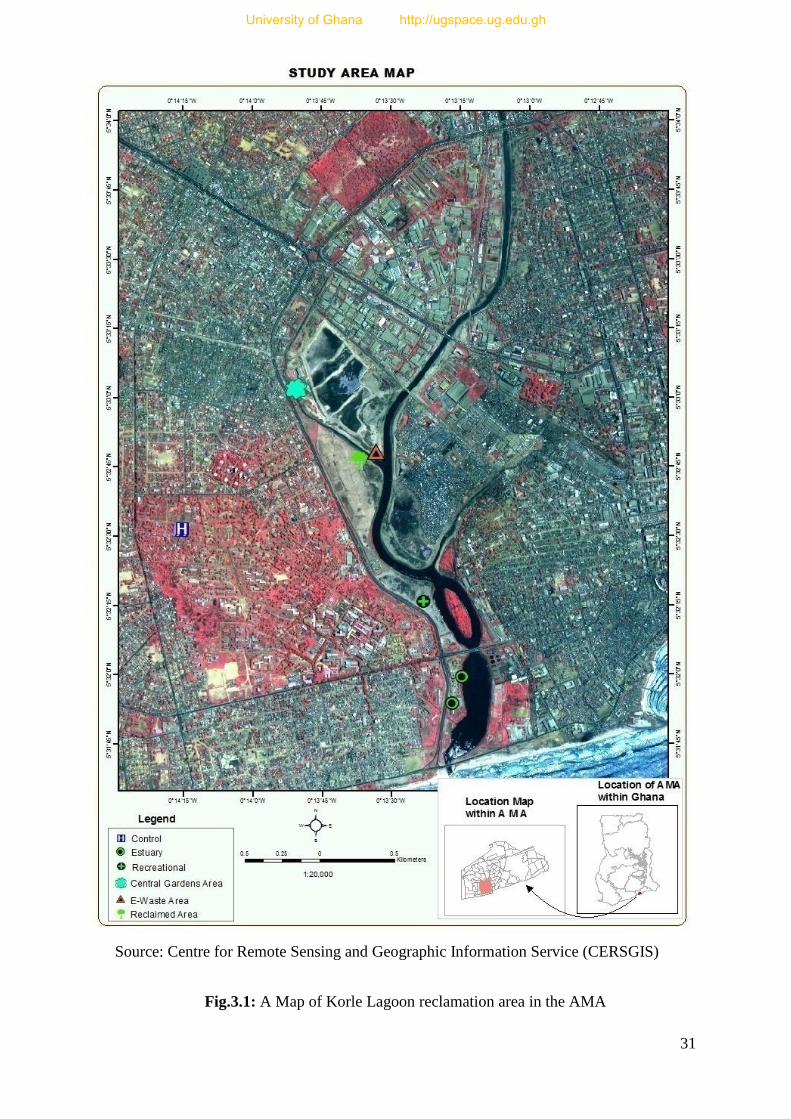
31
Source: Centre for Remote Sensing and Geographic Information Service (CERSGIS)
Fig.3.1: A Map of Korle Lagoon reclamation area in the AMA
University of Ghana http://ugspace.ug.edu.gh
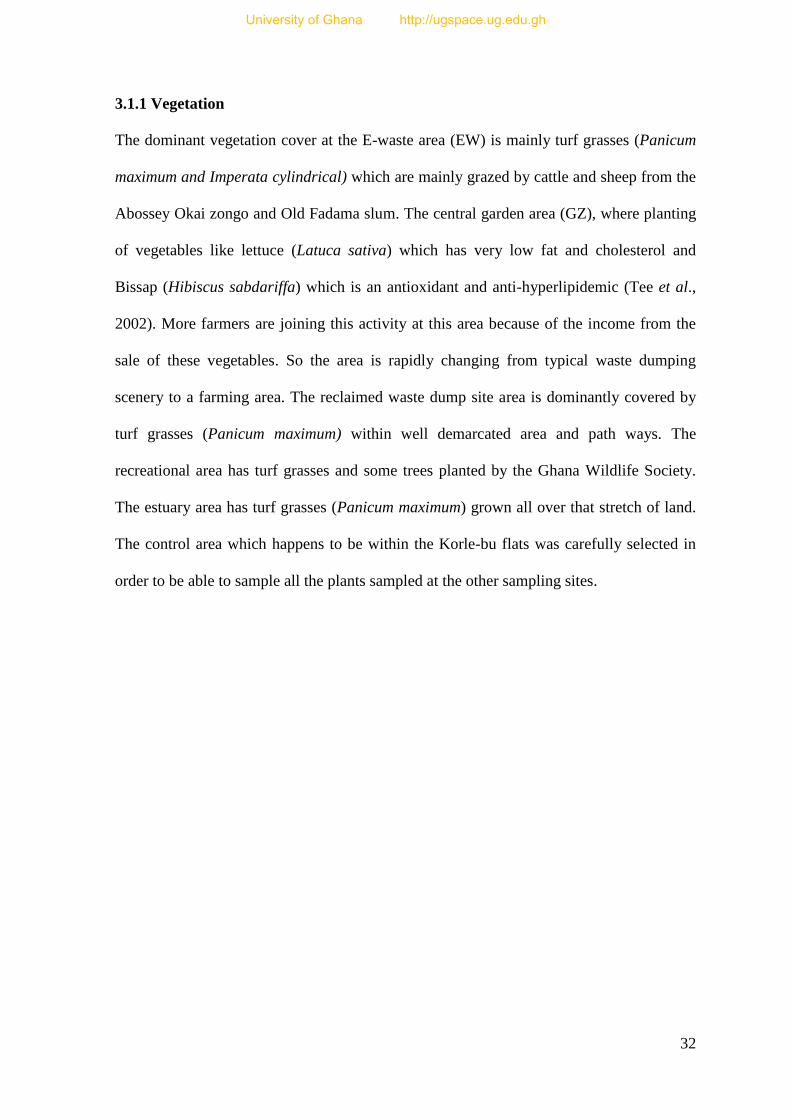
32
3.1.1 Vegetation
The dominant vegetation cover at the E-waste area (EW) is mainly turf grasses (Panicum
maximum and Imperata cylindrical) which are mainly grazed by cattle and sheep from the
Abossey Okai zongo and Old Fadama slum. The central garden area (GZ), where planting
of vegetables like lettuce (Latuca sativa) which has very low fat and cholesterol and
Bissap (Hibiscus sabdariffa) which is an antioxidant and anti-hyperlipidemic (Tee et al.,
2002). More farmers are joining this activity at this area because of the income from the
sale of these vegetables. So the area is rapidly changing from typical waste dumping
scenery to a farming area. The reclaimed waste dump site area is dominantly covered by
turf grasses (Panicum maximum) within well demarcated area and path ways. The
recreational area has turf grasses and some trees planted by the Ghana Wildlife Society.
The estuary area has turf grasses (Panicum maximum) grown all over that stretch of land.
The control area which happens to be within the Korle-bu flats was carefully selected in
order to be able to sample all the plants sampled at the other sampling sites.
University of Ghana http://ugspace.ug.edu.gh
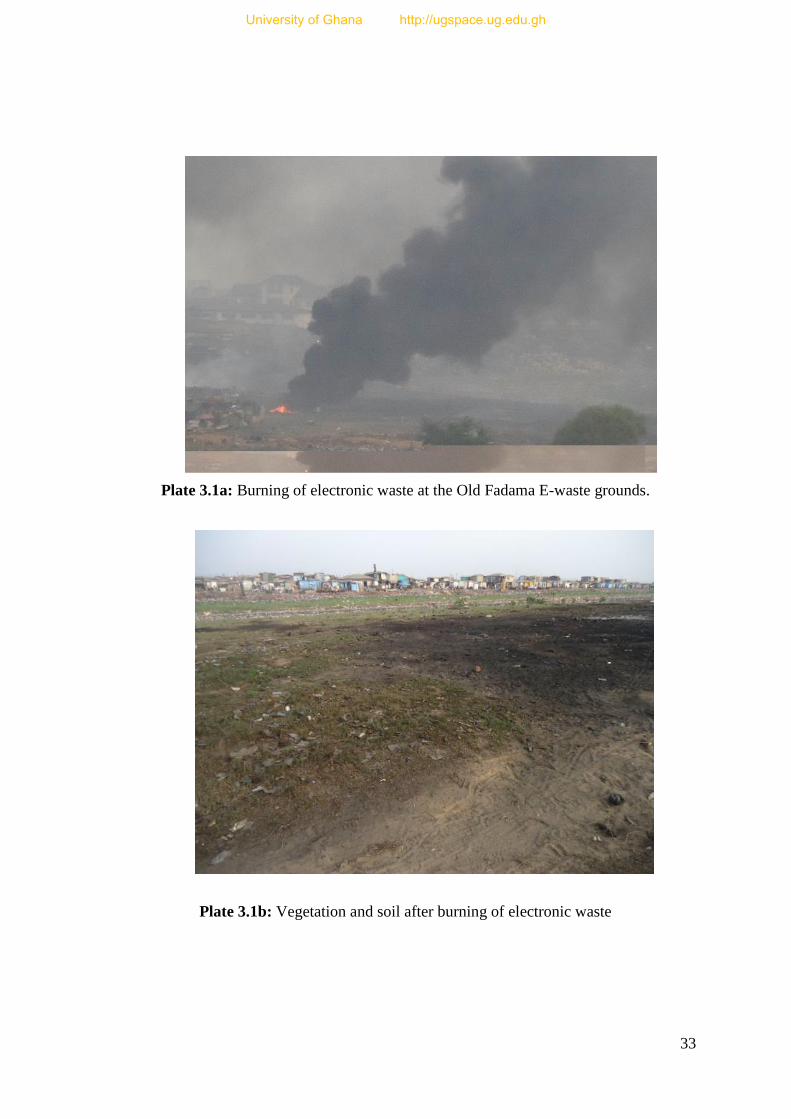
33
Plate 3.1a: Burning of electronic waste at the Old Fadama E-waste grounds.
Plate 3.1b: Vegetation and soil after burning of electronic waste
University of Ghana http://ugspace.ug.edu.gh
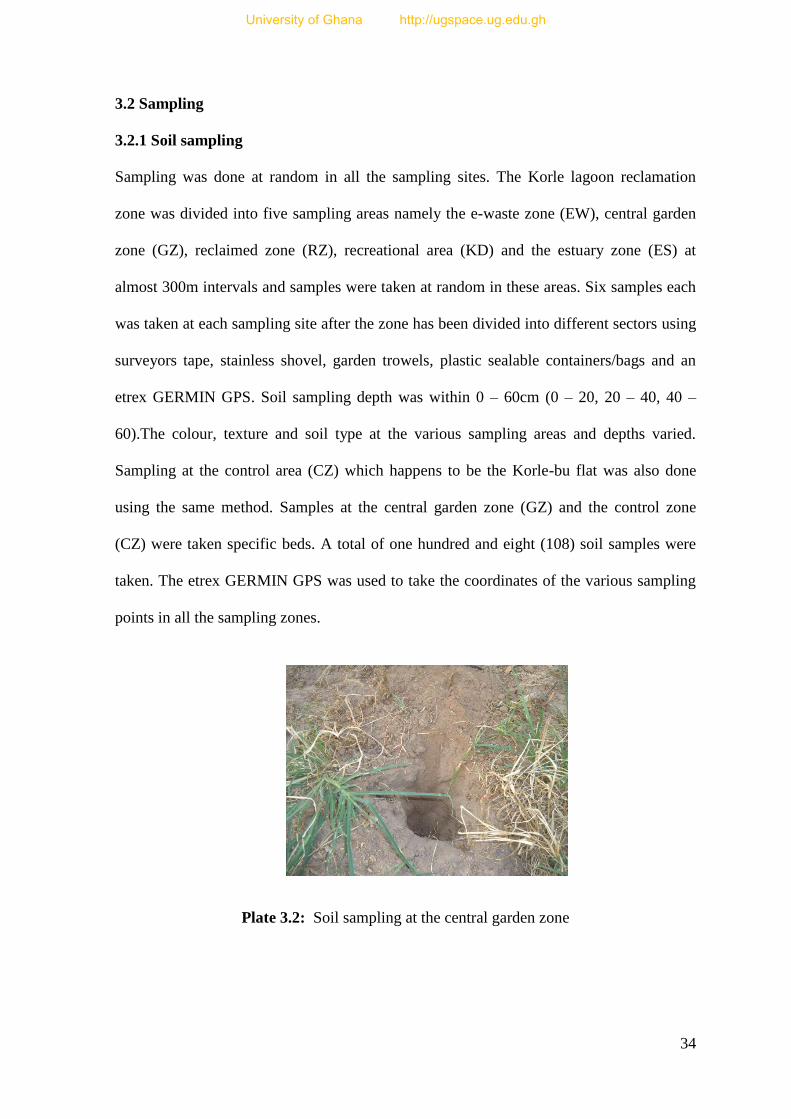
34
3.2 Sampling
3.2.1 Soil sampling
Sampling was done at random in all the sampling sites. The Korle lagoon reclamation
zone was divided into five sampling areas namely the e-waste zone (EW), central garden
zone (GZ), reclaimed zone (RZ), recreational area (KD) and the estuary zone (ES) at
almost 300m intervals and samples were taken at random in these areas. Six samples each
was taken at each sampling site after the zone has been divided into different sectors using
surveyors tape, stainless shovel, garden trowels, plastic sealable containers/bags and an
etrex GERMIN GPS. Soil sampling depth was within 0 – 60cm (0 – 20, 20 – 40, 40 –
60).The colour, texture and soil type at the various sampling areas and depths varied.
Sampling at the control area (CZ) which happens to be the Korle-bu flat was also done
using the same method. Samples at the central garden zone (GZ) and the control zone
(CZ) were taken specific beds. A total of one hundred and eight (108) soil samples were
taken. The etrex GERMIN GPS was used to take the coordinates of the various sampling
points in all the sampling zones.
Plate 3.2: Soil sampling at the central garden zone
University of Ghana http://ugspace.ug.edu.gh
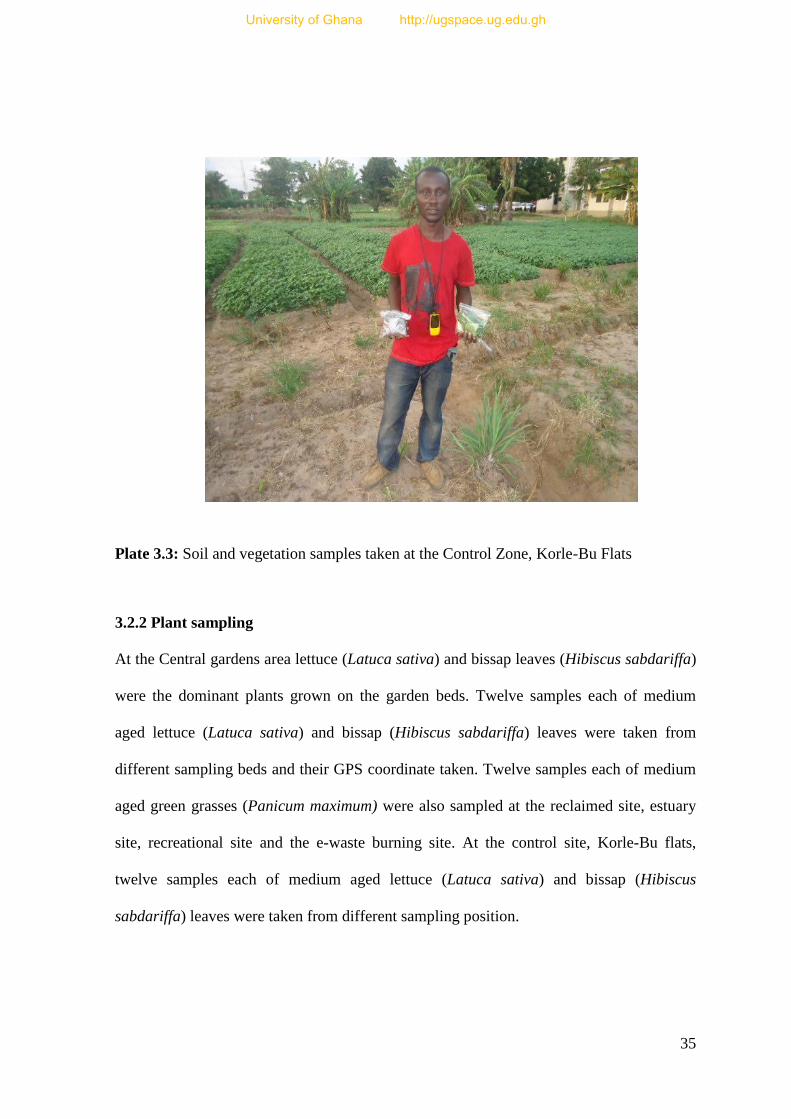
35
Plate 3.3: Soil and vegetation samples taken at the Control Zone, Korle-Bu Flats
3.2.2 Plant sampling
At the Central gardens area lettuce (Latuca sativa) and bissap leaves (Hibiscus sabdariffa)
were the dominant plants grown on the garden beds. Twelve samples each of medium
aged lettuce (Latuca sativa) and bissap (Hibiscus sabdariffa) leaves were taken from
different sampling beds and their GPS coordinate taken. Twelve samples each of medium
aged green grasses (Panicum maximum) were also sampled at the reclaimed site, estuary
site, recreational site and the e-waste burning site. At the control site, Korle-Bu flats,
twelve samples each of medium aged lettuce (Latuca sativa) and bissap (Hibiscus
sabdariffa) leaves were taken from different sampling position.
University of Ghana http://ugspace.ug.edu.gh
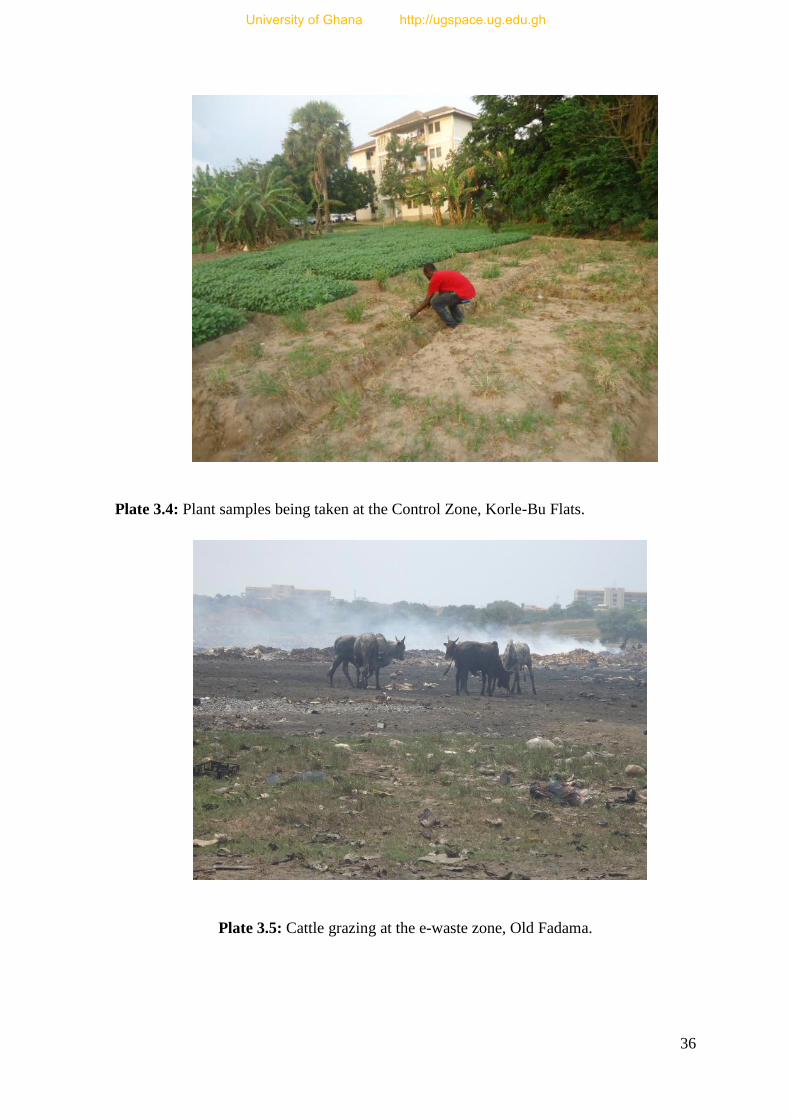
36
Plate 3.4: Plant samples being taken at the Control Zone, Korle-Bu Flats.
Plate 3.5: Cattle grazing at the e-waste zone, Old Fadama.
University of Ghana http://ugspace.ug.edu.gh
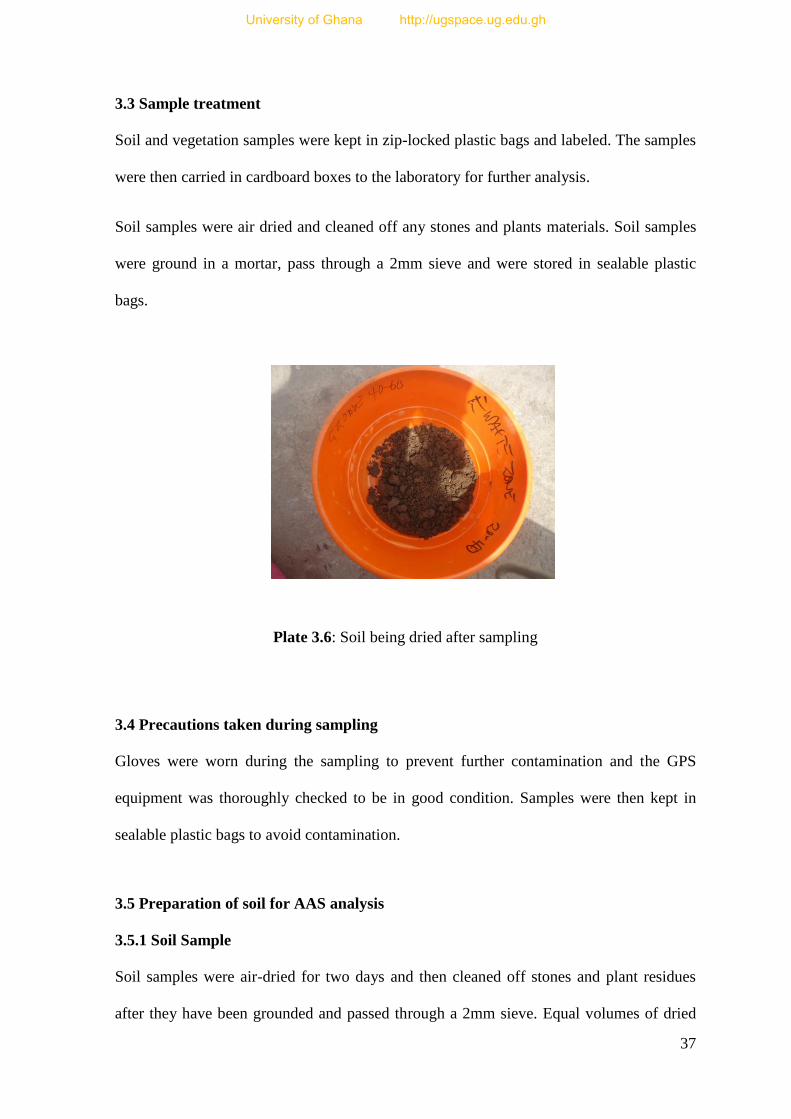
37
3.3 Sample treatment
Soil and vegetation samples were kept in zip-locked plastic bags and labeled. The samples
were then carried in cardboard boxes to the laboratory for further analysis.
Soil samples were air dried and cleaned off any stones and plants materials. Soil samples
were ground in a mortar, pass through a 2mm sieve and were stored in sealable plastic
bags.
Plate 3.6: Soil being dried after sampling
3.4 Precautions taken during sampling
Gloves were worn during the sampling to prevent further contamination and the GPS
equipment was thoroughly checked to be in good condition. Samples were then kept in
sealable plastic bags to avoid contamination.
3.5 Preparation of soil for AAS analysis
3.5.1 Soil Sample
Soil samples were air-dried for two days and then cleaned off stones and plant residues
after they have been grounded and passed through a 2mm sieve. Equal volumes of dried
University of Ghana http://ugspace.ug.edu.gh
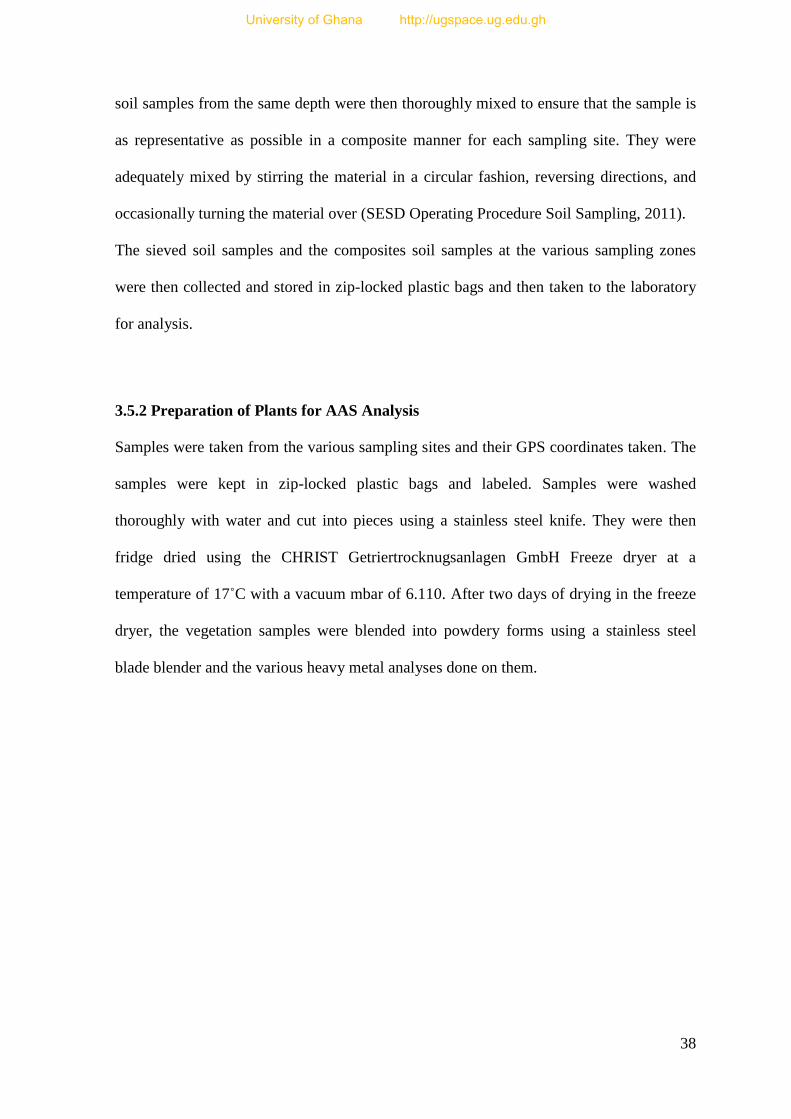
38
soil samples from the same depth were then thoroughly mixed to ensure that the sample is
as representative as possible in a composite manner for each sampling site. They were
adequately mixed by stirring the material in a circular fashion, reversing directions, and
occasionally turning the material over (SESD Operating Procedure Soil Sampling, 2011).
The sieved soil samples and the composites soil samples at the various sampling zones
were then collected and stored in zip-locked plastic bags and then taken to the laboratory
for analysis.
3.5.2 Preparation of Plants for AAS Analysis
Samples were taken from the various sampling sites and their GPS coordinates taken. The
samples were kept in zip-locked plastic bags and labeled. Samples were washed
thoroughly with water and cut into pieces using a stainless steel knife. They were then
fridge dried using the CHRIST Getriertrocknugsanlagen GmbH Freeze dryer at a
temperature of 17˚C with a vacuum mbar of 6.110. After two days of drying in the freeze
dryer, the vegetation samples were blended into powdery forms using a stainless steel
blade blender and the various heavy metal analyses done on them.
University of Ghana http://ugspace.ug.edu.gh
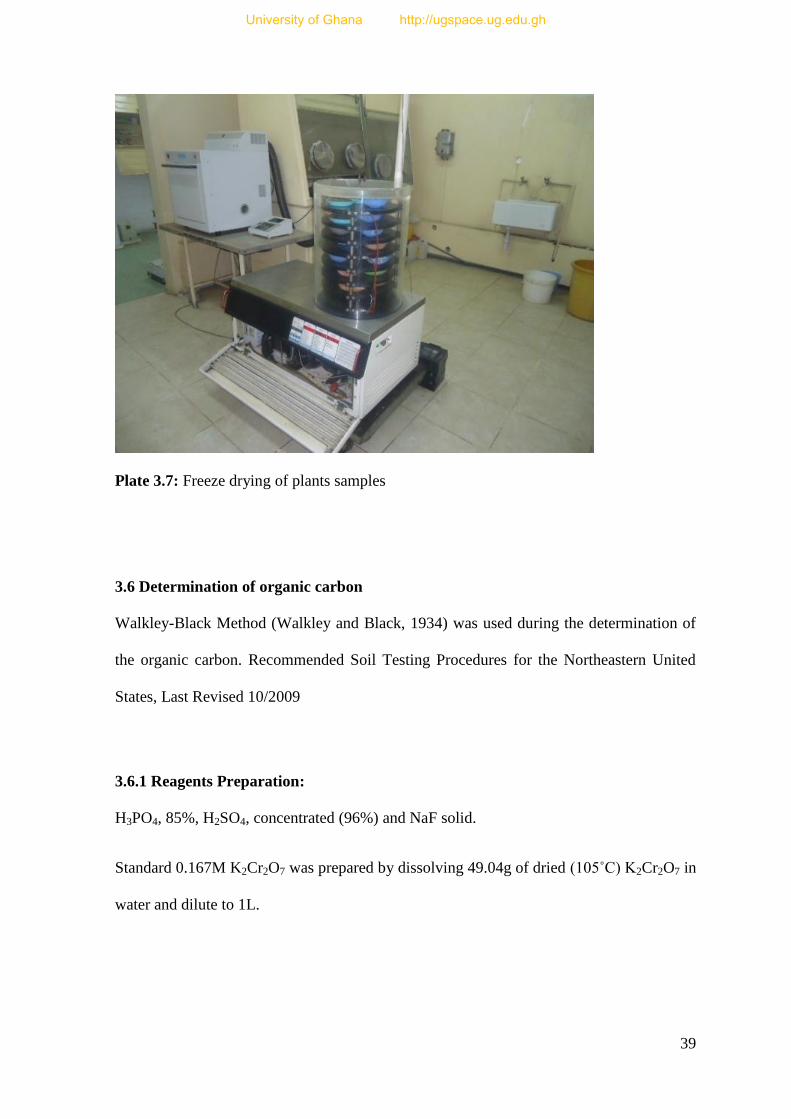
39
Plate 3.7: Freeze drying of plants samples
3.6 Determination of organic carbon
Walkley-Black Method (Walkley and Black, 1934) was used during the determination of
the organic carbon. Recommended Soil Testing Procedures for the Northeastern United
States, Last Revised 10/2009
3.6.1 Reagents Preparation:
H3PO4, 85%, H2SO4, concentrated (96%) and NaF solid.
Standard 0.167M K2Cr2O7 was prepared by dissolving 49.04g of dried (105˚C) K2Cr2O7 in
water and dilute to 1L.
University of Ghana http://ugspace.ug.edu.gh
40
A 0.5M Fe2+
solution: Prepared by dissolving 196.1g of Fe(NH4)2(SO4).6H2O in 800ml of
water containing 20ml of concentrated H2SO4 and dilute to 1L. The Fe2+
in the solution
oxidizes slowly on exposure to air so it was standardized against dichromate.
Ferroin indicator: Prepared by dissolving 3.71g of o-phenanthroline and 1.74g of
FeSO4·7H2O in 250ml of water.
3.6.2 Procedure
A 0.10 to 2.00g of dried soil (ground to <60 mesh) was weighed and transferred to a
500ml Erlenmeyer flask. A 10ml of 0.167M K2Cr2O7 was added by means pipette.20ml of
concentrated H2SO4 was then added by means of a dispenser and swirled gently to mix.
Excessive swirling was avoided to prevent organic particles adhering to the sides of the
flask.
The suspension was allowed to stand an insulating pad (asbestos) for 30 minutes. This was
done to avoid rapid heat loss. The suspension was diluted with 200ml of water to provide a
clearer suspension when viewing the endpoint.
A 10ml of 85% H3PO4 was added, using a suitable dispenser, and 0.2g of NaF was then
added. The H3PO4 and NaF were added to complex the Fe3+
which would interfere with
the titration endpoint.10drops of ferroin indicator was added. The indicator was added
prior to the titration to avoid deactivation by adsorption onto clay surfaces.
The titration was done with 0.5M Fe2+
to a burgundy endpoint. The colour of the solution
at the beginning was yellow-orange to dark green, depending on Cr2O72-
remaining , which
shifts to a turbid gray before the endpoint and then changes sharply to a wine red at the
endpoint. A magnetic stirrer was use to stir the solution during the titration.
University of Ghana http://ugspace.ug.edu.gh
41
A reagent blank was run using the above procedure without soil. The blank was used to
standardize the Fe2+
solution daily.
The %C and %organic matter were then calculated.
% Easily oxidizable Organic C
%C = (B – S) x M of Fe2+
x 12 x 100
G of soil x 4000
Where:
B = ml of Fe2+
solution used to titrate blank
S = ml of Fe2+
solution used to titrate sample
12/4000 = milli-equivalent weight of C in g
To convert easily oxidizable organic C to total C, divided by 0.77(or multiply by 1.30) or
other experimentally determined correction factor. Total organic C is converted to organic
matter using the following equation:
% Organic Matter(OM)
%OM = % total organic carbon x 1.72
3.7 Determination of pH
A 10g of soil samples was weighed into a beaker and 20ml distilled water added. The
suspension was stirred for 15minutes using a glass rod and allowed to settle for 20minutes.
A buffer solution of pH 4 and pH 7 was used to standardize the pH meter. The electrodes
of the pH meter were inserted into supernatant and the pH of the samples was measured to
the nearest 0.10. The electrodes of the pH were rinsed with distilled water before each
University of Ghana http://ugspace.ug.edu.gh
42
reading. The pH of the various suspensions was recorded digitally by the pH meter. pH
meter used was the Wissenschaftlich-Technische Werkstatten 8120 Weilheim i. OB.
3.8 Digestion of soil and plants
3.8.1 Acid digestion of soil
A 1.5g of soil sample was weighed into a previously acid washed labeled 100ml
polytetraflouroethylene (PTFE) Teflon bombs.6ml of concentrated nitric acid (HNO3,
65%), 3ml of concentrated hydrochloric acid (HCl,35%) and 0.25ml of hydrogen peroxide
(H2O2,30%) was added to each sample in a fume chamber. The samples were then loaded
on the microwave carousel. The vessel caps were secured tightly using a wrench. The
complete assembly was microwave irradiated for 26minutes using milestone microwave
labstation ETHOS 900, INSTR: MLS-1200 MEGA.
3.8.2. Acid digestion for plants
A 0.5g of vegetable sample was weighed into a previously acid washed labeled 100ml
polytetraflouroethylene (PTFE) Teflon bombs.6ml of concentrated nitric acid (HNO3,
65%), and 1ml of hydrogen peroxide (H2O2,30%) was added to each sample in a fume
chamber. The samples were then loaded on the microwave carousel. The vessel caps were
secured tightly using a wrench. The complete assembly was microwave irradiated for
25minutes using milestone microwave labstation ETHOS 900, INSTR: MLS-1200
MEGA.
3.9 Determination of heavy metals
After digestion the Teflon bombs mounted on the microwave carousel were cooled in a
water bath to reduce internal pressure and allowed volatilized material to re- stabilize. The
digestate was made up to 20ml with double distilled water and an analytical blank was
University of Ghana http://ugspace.ug.edu.gh
43
prepared for each sample. A series of calibration solutions (standard) containing known
amounts of analyte elements were also prepared and used to calibrate the VARIAN AA
240FS- Atomic Absorption Spectrometer AA240FS. Blanks were atomized followed by
the standards and calibration graphs plotted showing response from the ASS. The
concentrations were then calculated based on the absorbance obtained using the Beer
Lambert law. Responses of standard were used to establish accurate performance of
machine and accurate concentration values of elements. The machine was calibrated after
every three analysis.
Light was generated from a hollow cathode lamp at wavelength characteristic to each
analyte.
Each analyte were then atomized using an atomizer to create free atoms from the samples.
Air-acetylene gas was used as the source of energy for the production of free atoms for the
elements Zinc (Zn), Lead (Pb), Copper (Cu), Nickel (Ni), Chromium (Cr), Cadmium (Cd),
and argon-acetylene gas for Mercury (Hg) and Arsenic (As) and nitrous oxide-acetylene
for Tin(Sn). The sample was introduced as an aerosol into the flame and the burner
aligned in the optical path to allow the light beam pass through the flame where the light
was absorbed. The light was then directed into a monochromator which then isolates the
specific analytical wavelength of the light emitted by the hollow cathode lamp from the
non-analytical. The sensitive light detector then measures the light and translates the
response into the analytical measurements.
Calculation of concentration of heavy metals were done using
Final conc. (mg/L or mg/kg) = Conc.(analytical measurement) ×Nominal volume
Sample weight in gramme
Where conc. = instrumental measurement
Nominal volume = final volume of digestate sample solution
University of Ghana http://ugspace.ug.edu.gh
44
Conc. (mg/kg) = concentration of metals in soil and plants.
3.9.1 Quality control and quality assurance
The following Quality Control and Quality Assurance techniques were used during the
analysis.
Blanks: They were to check contamination during sample preparation.
Duplicates: To check the reproducibility of the method used.
Standards: To check the efficiency of the equipments being used.
Reference standards used for the elements of interest, blanks and duplicates of samples
were digested the same conditions as the samples. These served as internal positive
controls.
Reference standards used are from FLUKA ANALYTICAL, Sigma-Aldrich Chemie
GmbH, product of Switzerland. Before the analysis, equipment were calibrated using the
appropriate standards.
3.10 Geoaccumulation Index (Igeo)
The index of geoaccumulation (Igeo) is widely used in the evaluation of contamination by
comparing the levels of heavy metal obtained to a background levels originally used with
bottom sediments (Muller, 1969; Atiemo, 2011). It is calculated using the equation:
Igeo = log2(Cn /1.5Bn)
where Cn is the measured concentration of the heavy metal in soil being studied and Bn is
the geochemical background concentration of the heavy metal (crustal average) (Taylor
and Meclenan, 1985). The constant 1.5 is introduced to minimize the effect of possible
variations in the background values which may be attributed to lithologic variations in the
sediments (Lu et al., 2009; Atiemo, 2011).
University of Ghana http://ugspace.ug.edu.gh
45
The following classification is given for geoaccumulation index (Muller, 1969; Huu et al.,
2010; Atiemo, 2011).
<0 = practically unpolluted, 0-1 = unpolluted to moderately polluted, 1-2 = moderately
polluted,
2-3 = moderately to strongly polluted, 3-4 = strongly polluted, 4-5 = strongly to extremely
polluted and >5 = extremely polluted.
3.11 Enrichment factor (EF)
Enrichment Factor (EF) of an element in the studied samples is based on the
standardization of a measured element against a reference element. A reference element is
often the one characterized by low occurrence variability such as Al, Fe, Ti, Si, Sr, K, Sn,
etc. (Li et al., 2001; Sezgin et al., 2003, Duzgoren-Aydin, 2007, Ahiamadjie et al., 2011).
It is used to differentiate heavy metals originating from human activities and those of
natural sources. This is determined by the relation:
EF = [Cx/Cref]sample
[Cx/Cref]background
Where Cx is the element of interest
Cref is the concentration of reference element for normalization.
Values of EF above 5 are considered significant because EF below 5 may arise from
difference in soil composition of local soil material and reference soil used in EF
calculation (Sezgin et al., 2003; Ahiamedjie et al., 2011).
Five contamination categories are recognized on the basis of the enrichment factor: EF < 2
states deficiency to minimal enrichment, EF = 2-5 moderate enrichment, EF = 5-20
significant enrichment, EF = 20-40 very high enrichment and EF > 40 extremely high
enrichment (Sezgin et al., 2003; Duzgoren-Aydin et al., 2006; Ahiamedjie et al., 2011).
University of Ghana http://ugspace.ug.edu.gh
46
3.12 Pollution index (PI)
Pollution index and integrated pollution index are also commonly used to assess the
environment quality (dos Anjos et al., 2000). The PI is defined as the ratio of element
concentration in the study to the background content of the abundance of chemical
elements in the continental crust. The PI of each element is and classified as either low (PI
≤ 1), middle (1< PI ≤ 3) or high (PI >3).
3.13 Data Analysis
The data obtained was subjected to SPSS 16.0 and XLSTAT-2012 analysis. Correlation
analysis was done to determine the association between soil heavy metals, pH, percentage
Organic matter content, percentage organic carbon, K+, Na
+, Ca
2+ and Mg
2+,
University of Ghana http://ugspace.ug.edu.gh
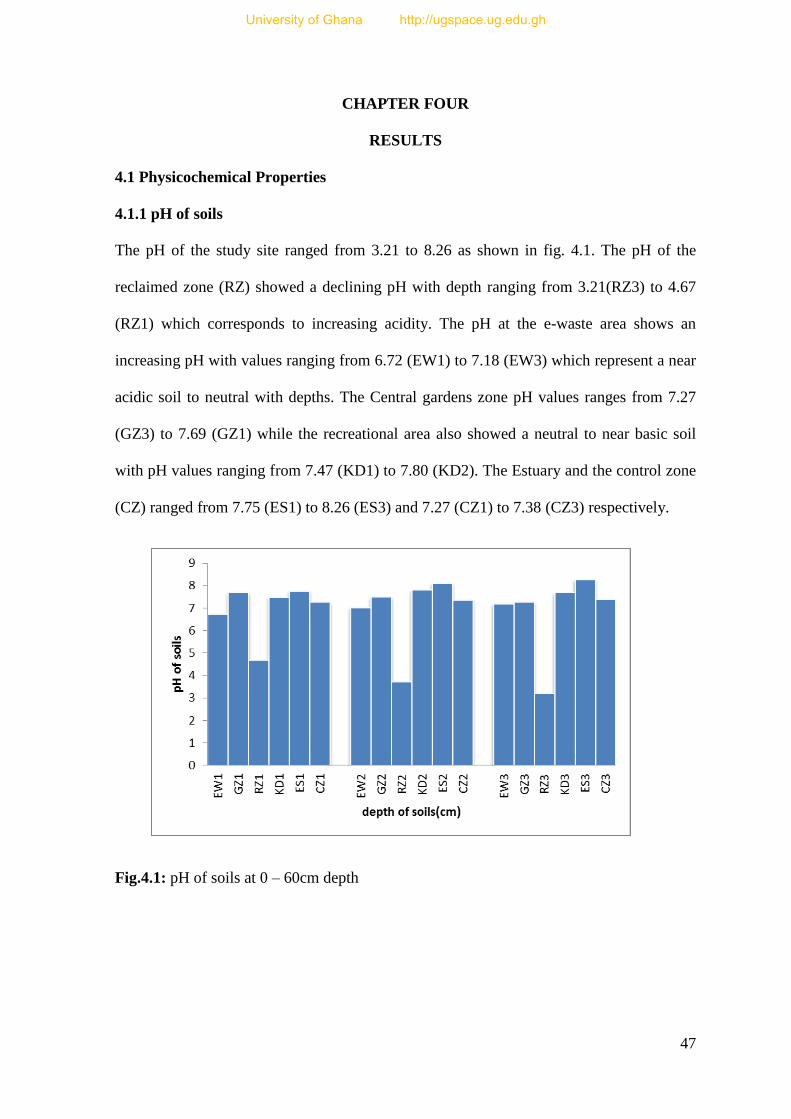
47
CHAPTER FOUR
RESULTS
4.1 Physicochemical Properties
4.1.1 pH of soils
The pH of the study site ranged from 3.21 to 8.26 as shown in fig. 4.1. The pH of the
reclaimed zone (RZ) showed a declining pH with depth ranging from 3.21(RZ3) to 4.67
(RZ1) which corresponds to increasing acidity. The pH at the e-waste area shows an
increasing pH with values ranging from 6.72 (EW1) to 7.18 (EW3) which represent a near
acidic soil to neutral with depths. The Central gardens zone pH values ranges from 7.27
(GZ3) to 7.69 (GZ1) while the recreational area also showed a neutral to near basic soil
with pH values ranging from 7.47 (KD1) to 7.80 (KD2). The Estuary and the control zone
(CZ) ranged from 7.75 (ES1) to 8.26 (ES3) and 7.27 (CZ1) to 7.38 (CZ3) respectively.
Fig.4.1: pH of soils at 0 – 60cm depth
University of Ghana http://ugspace.ug.edu.gh
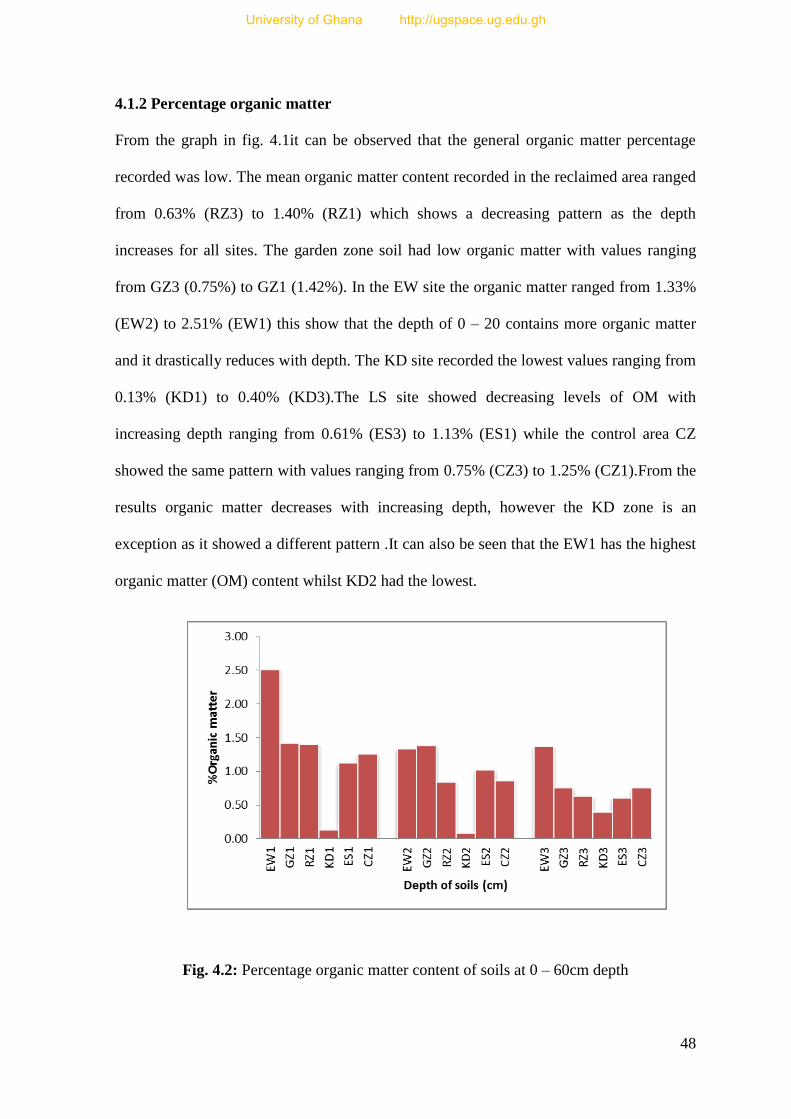
48
4.1.2 Percentage organic matter
From the graph in fig. 4.1it can be observed that the general organic matter percentage
recorded was low. The mean organic matter content recorded in the reclaimed area ranged
from 0.63% (RZ3) to 1.40% (RZ1) which shows a decreasing pattern as the depth
increases for all sites. The garden zone soil had low organic matter with values ranging
from GZ3 (0.75%) to GZ1 (1.42%). In the EW site the organic matter ranged from 1.33%
(EW2) to 2.51% (EW1) this show that the depth of 0 – 20 contains more organic matter
and it drastically reduces with depth. The KD site recorded the lowest values ranging from
0.13% (KD1) to 0.40% (KD3).The LS site showed decreasing levels of OM with
increasing depth ranging from 0.61% (ES3) to 1.13% (ES1) while the control area CZ
showed the same pattern with values ranging from 0.75% (CZ3) to 1.25% (CZ1).From the
results organic matter decreases with increasing depth, however the KD zone is an
exception as it showed a different pattern .It can also be seen that the EW1 has the highest
organic matter (OM) content whilst KD2 had the lowest.
Fig. 4.2: Percentage organic matter content of soils at 0 – 60cm depth
University of Ghana http://ugspace.ug.edu.gh
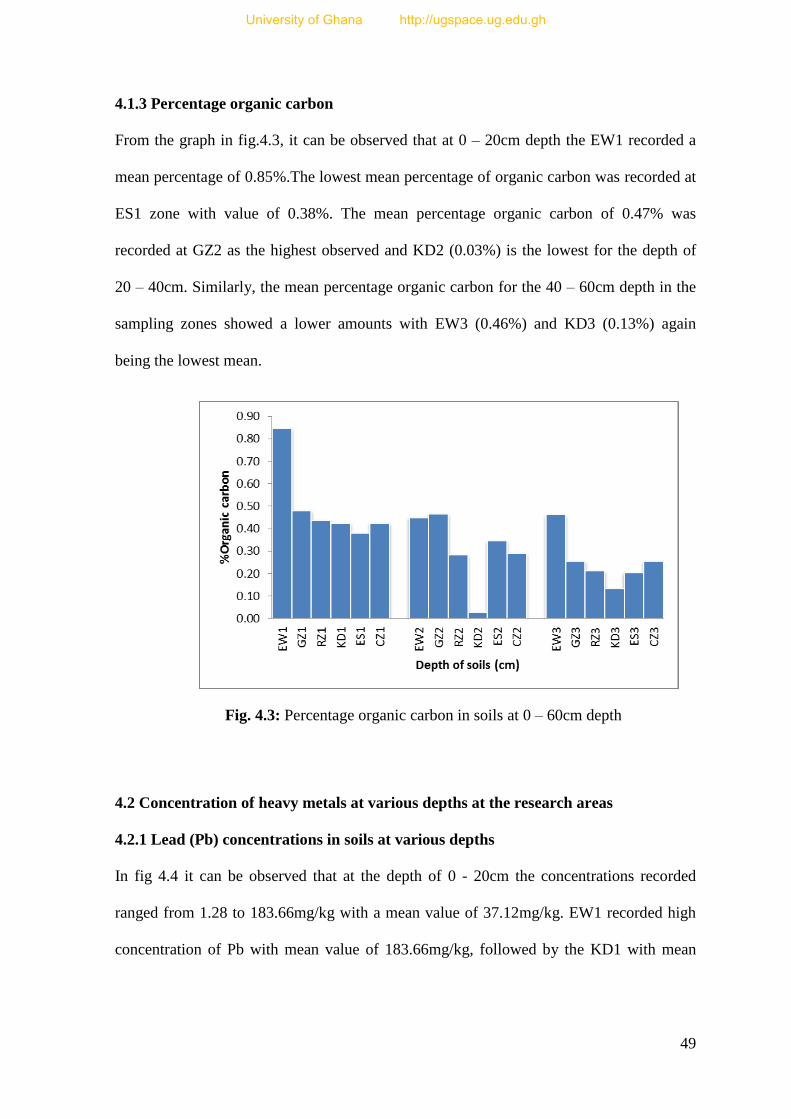
49
4.1.3 Percentage organic carbon
From the graph in fig.4.3, it can be observed that at 0 – 20cm depth the EW1 recorded a
mean percentage of 0.85%.The lowest mean percentage of organic carbon was recorded at
ES1 zone with value of 0.38%. The mean percentage organic carbon of 0.47% was
recorded at GZ2 as the highest observed and KD2 (0.03%) is the lowest for the depth of
20 – 40cm. Similarly, the mean percentage organic carbon for the 40 – 60cm depth in the
sampling zones showed a lower amounts with EW3 (0.46%) and KD3 (0.13%) again
being the lowest mean.
Fig. 4.3: Percentage organic carbon in soils at 0 – 60cm depth
4.2 Concentration of heavy metals at various depths at the research areas
4.2.1 Lead (Pb) concentrations in soils at various depths
In fig 4.4 it can be observed that at the depth of 0 - 20cm the concentrations recorded
ranged from 1.28 to 183.66mg/kg with a mean value of 37.12mg/kg. EW1 recorded high
concentration of Pb with mean value of 183.66mg/kg, followed by the KD1 with mean
University of Ghana http://ugspace.ug.edu.gh
50
concentration of 17.41mg/kg. GZ1 recorded the lowest mean concentration of 1.28mg/kg.
The soil texture was sandy loamy at that depth.
At 20 - 40cm depth the concentration of Pb recorded ranged from 1.12mg/kg to
167.96mg/kg with a mean value 32.13mg/kg. EW2 recorded the highest concentration of
Pb with mean value of 167.96mg/kg. The estuary zone (ES2) had Pb mean concentration
of 11.02mg/kg. The lowest concentration was observed at the GZ2 zone with a mean
concentration of 1.12mg/kg. The soil texture at this depth is sandy loam.
At 40 - 60cm depth the overall concentrations of heavy metals in soils recorded ranged
from 0.96 to 137.00mg/kg with mean value of 27.43mg/kg. The EW3 recorded the highest
mean concentration of Pb with value 137.00mg/kg. ES3 also recorded Pb with mean
concentration of 7.38mg/kg. The GZ3 recorded the lowest Pb concentration of with mean
value of 0.96mg/kg. The control zone (CZ) also recorded the presence of this heavy metals
at the various depths with mean concentrations of 4.39mg/kg, 4.88mg/kg and 4.16mg/kg
corresponding to the depths of 20cm 40cm and 60cm respectively. The soil type in this
zone is Sandy loamy texture.
University of Ghana http://ugspace.ug.edu.gh
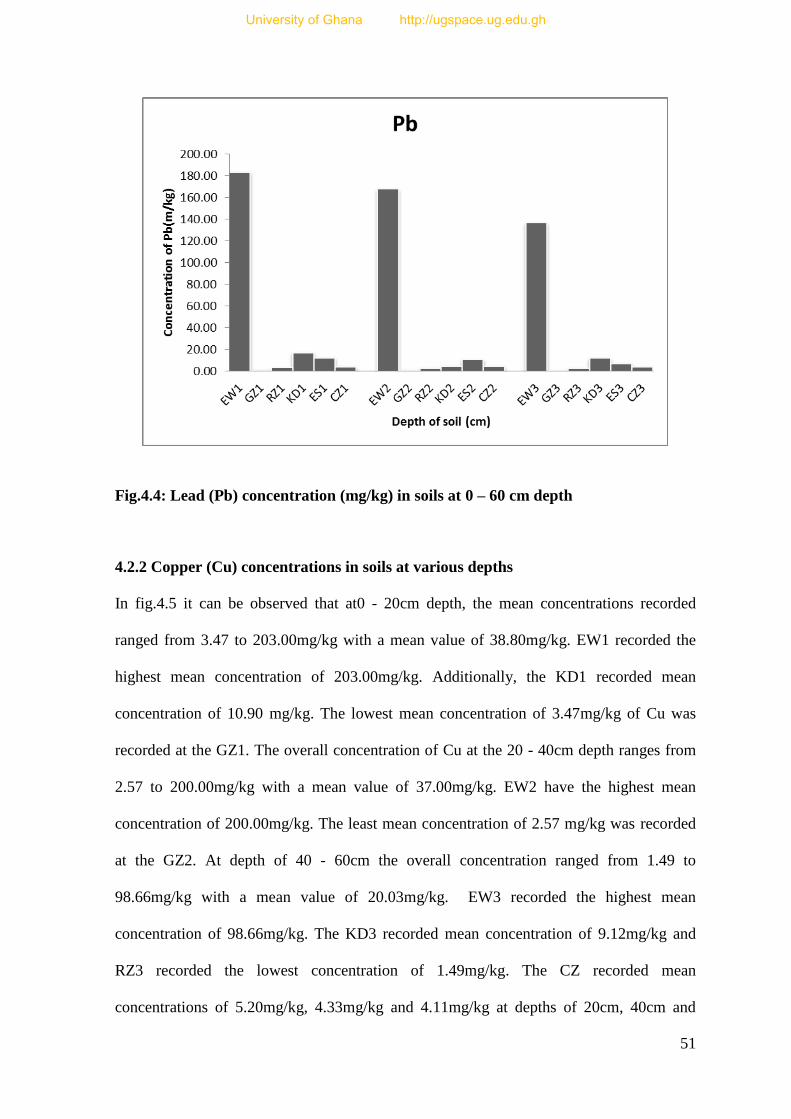
51
Fig.4.4: Lead (Pb) concentration (mg/kg) in soils at 0 – 60 cm depth
4.2.2 Copper (Cu) concentrations in soils at various depths
In fig.4.5 it can be observed that at0 - 20cm depth, the mean concentrations recorded
ranged from 3.47 to 203.00mg/kg with a mean value of 38.80mg/kg. EW1 recorded the
highest mean concentration of 203.00mg/kg. Additionally, the KD1 recorded mean
concentration of 10.90 mg/kg. The lowest mean concentration of 3.47mg/kg of Cu was
recorded at the GZ1. The overall concentration of Cu at the 20 - 40cm depth ranges from
2.57 to 200.00mg/kg with a mean value of 37.00mg/kg. EW2 have the highest mean
concentration of 200.00mg/kg. The least mean concentration of 2.57 mg/kg was recorded
at the GZ2. At depth of 40 - 60cm the overall concentration ranged from 1.49 to
98.66mg/kg with a mean value of 20.03mg/kg. EW3 recorded the highest mean
concentration of 98.66mg/kg. The KD3 recorded mean concentration of 9.12mg/kg and
RZ3 recorded the lowest concentration of 1.49mg/kg. The CZ recorded mean
concentrations of 5.20mg/kg, 4.33mg/kg and 4.11mg/kg at depths of 20cm, 40cm and
University of Ghana http://ugspace.ug.edu.gh
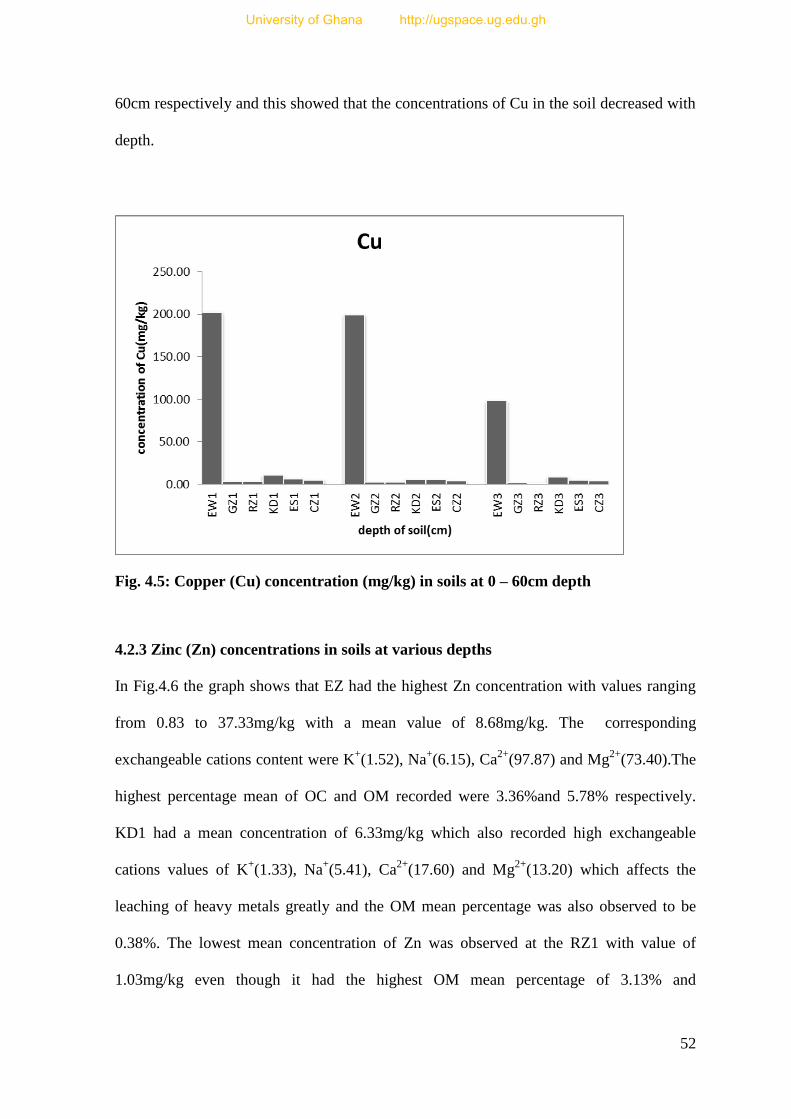
52
60cm respectively and this showed that the concentrations of Cu in the soil decreased with
depth.
Fig. 4.5: Copper (Cu) concentration (mg/kg) in soils at 0 – 60cm depth
4.2.3 Zinc (Zn) concentrations in soils at various depths
In Fig.4.6 the graph shows that EZ had the highest Zn concentration with values ranging
from 0.83 to 37.33mg/kg with a mean value of 8.68mg/kg. The corresponding
exchangeable cations content were K+(1.52), Na
+(6.15), Ca
2+(97.87) and Mg
2+(73.40).The
highest percentage mean of OC and OM recorded were 3.36%and 5.78% respectively.
KD1 had a mean concentration of 6.33mg/kg which also recorded high exchangeable
cations values of K+(1.33), Na
+(5.41), Ca
2+(17.60) and Mg
2+(13.20) which affects the
leaching of heavy metals greatly and the OM mean percentage was also observed to be
0.38%. The lowest mean concentration of Zn was observed at the RZ1 with value of
1.03mg/kg even though it had the highest OM mean percentage of 3.13% and
University of Ghana http://ugspace.ug.edu.gh
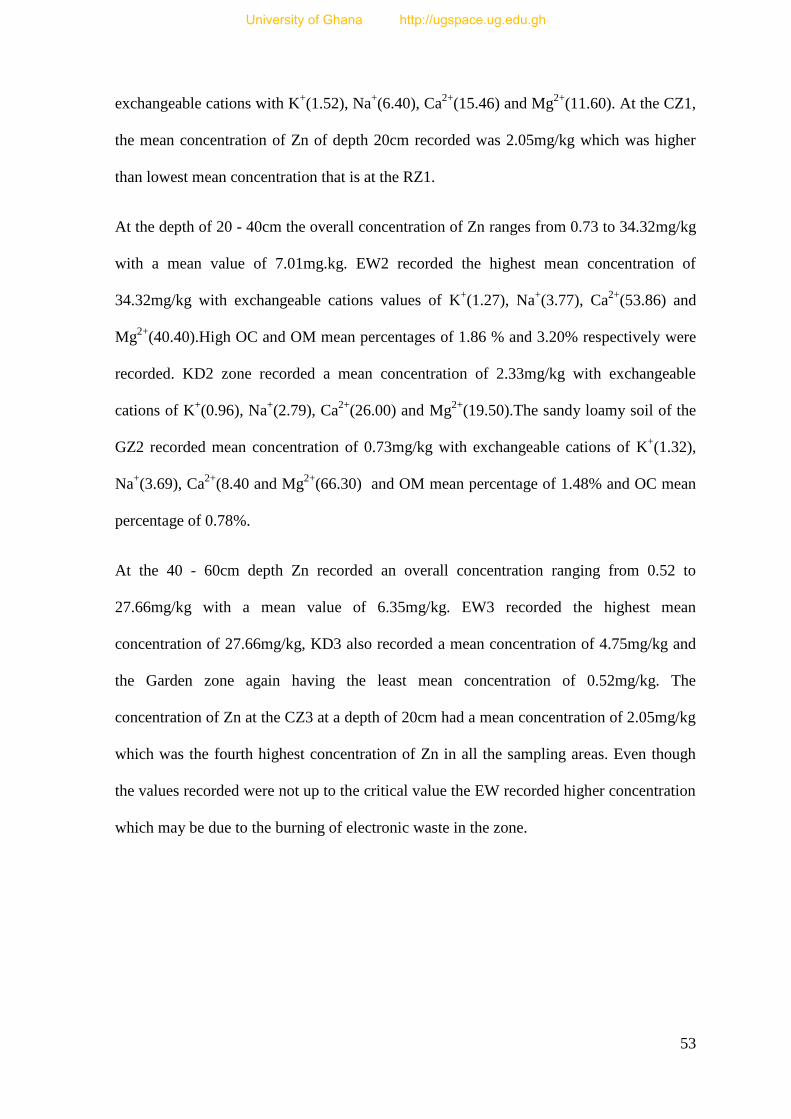
53
exchangeable cations with K+(1.52), Na
+(6.40), Ca
2+(15.46) and Mg
2+(11.60). At the CZ1,
the mean concentration of Zn of depth 20cm recorded was 2.05mg/kg which was higher
than lowest mean concentration that is at the RZ1.
At the depth of 20 - 40cm the overall concentration of Zn ranges from 0.73 to 34.32mg/kg
with a mean value of 7.01mg.kg. EW2 recorded the highest mean concentration of
34.32mg/kg with exchangeable cations values of K+(1.27), Na
+(3.77), Ca
2+(53.86) and
Mg2+
(40.40).High OC and OM mean percentages of 1.86 % and 3.20% respectively were
recorded. KD2 zone recorded a mean concentration of 2.33mg/kg with exchangeable
cations of K+(0.96), Na
+(2.79), Ca
2+(26.00) and Mg
2+(19.50).The sandy loamy soil of the
GZ2 recorded mean concentration of 0.73mg/kg with exchangeable cations of K+(1.32),
Na+(3.69), Ca
2+(8.40 and Mg
2+(66.30) and OM mean percentage of 1.48% and OC mean
percentage of 0.78%.
At the 40 - 60cm depth Zn recorded an overall concentration ranging from 0.52 to
27.66mg/kg with a mean value of 6.35mg/kg. EW3 recorded the highest mean
concentration of 27.66mg/kg, KD3 also recorded a mean concentration of 4.75mg/kg and
the Garden zone again having the least mean concentration of 0.52mg/kg. The
concentration of Zn at the CZ3 at a depth of 20cm had a mean concentration of 2.05mg/kg
which was the fourth highest concentration of Zn in all the sampling areas. Even though
the values recorded were not up to the critical value the EW recorded higher concentration
which may be due to the burning of electronic waste in the zone.
University of Ghana http://ugspace.ug.edu.gh
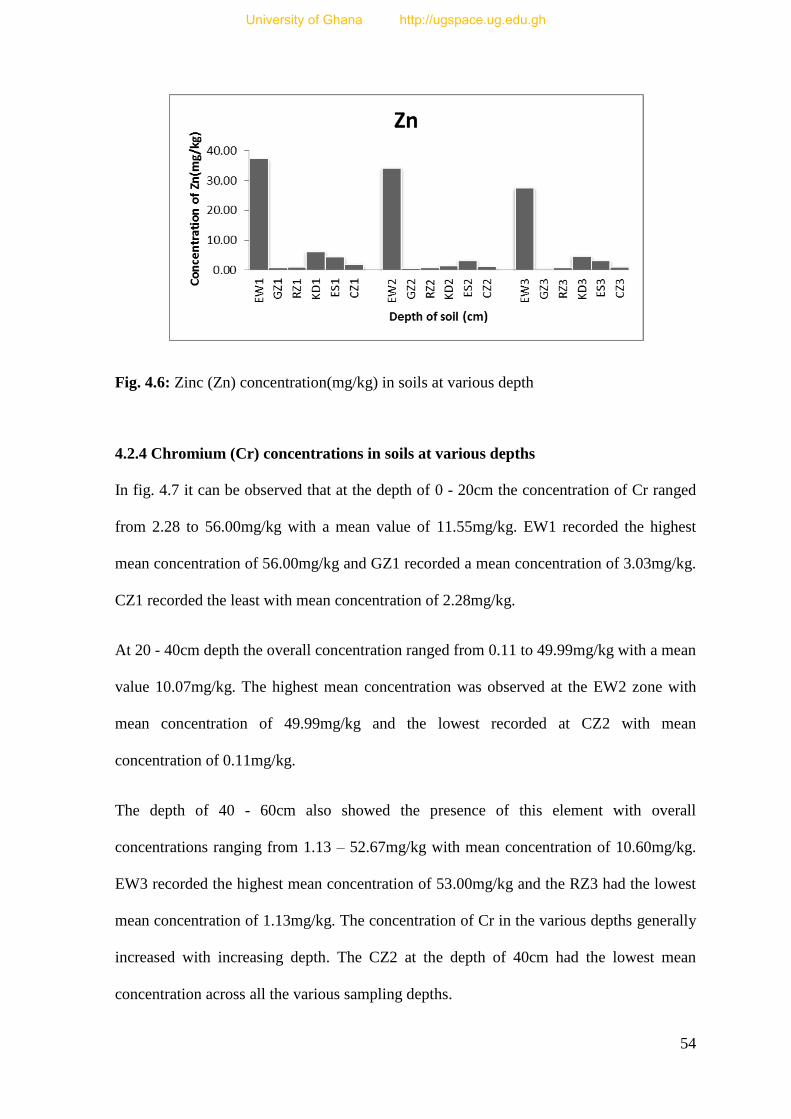
54
Fig. 4.6: Zinc (Zn) concentration(mg/kg) in soils at various depth
4.2.4 Chromium (Cr) concentrations in soils at various depths
In fig. 4.7 it can be observed that at the depth of 0 - 20cm the concentration of Cr ranged
from 2.28 to 56.00mg/kg with a mean value of 11.55mg/kg. EW1 recorded the highest
mean concentration of 56.00mg/kg and GZ1 recorded a mean concentration of 3.03mg/kg.
CZ1 recorded the least with mean concentration of 2.28mg/kg.
At 20 - 40cm depth the overall concentration ranged from 0.11 to 49.99mg/kg with a mean
value 10.07mg/kg. The highest mean concentration was observed at the EW2 zone with
mean concentration of 49.99mg/kg and the lowest recorded at CZ2 with mean
concentration of 0.11mg/kg.
The depth of 40 - 60cm also showed the presence of this element with overall
concentrations ranging from 1.13 – 52.67mg/kg with mean concentration of 10.60mg/kg.
EW3 recorded the highest mean concentration of 53.00mg/kg and the RZ3 had the lowest
mean concentration of 1.13mg/kg. The concentration of Cr in the various depths generally
increased with increasing depth. The CZ2 at the depth of 40cm had the lowest mean
concentration across all the various sampling depths.
University of Ghana http://ugspace.ug.edu.gh
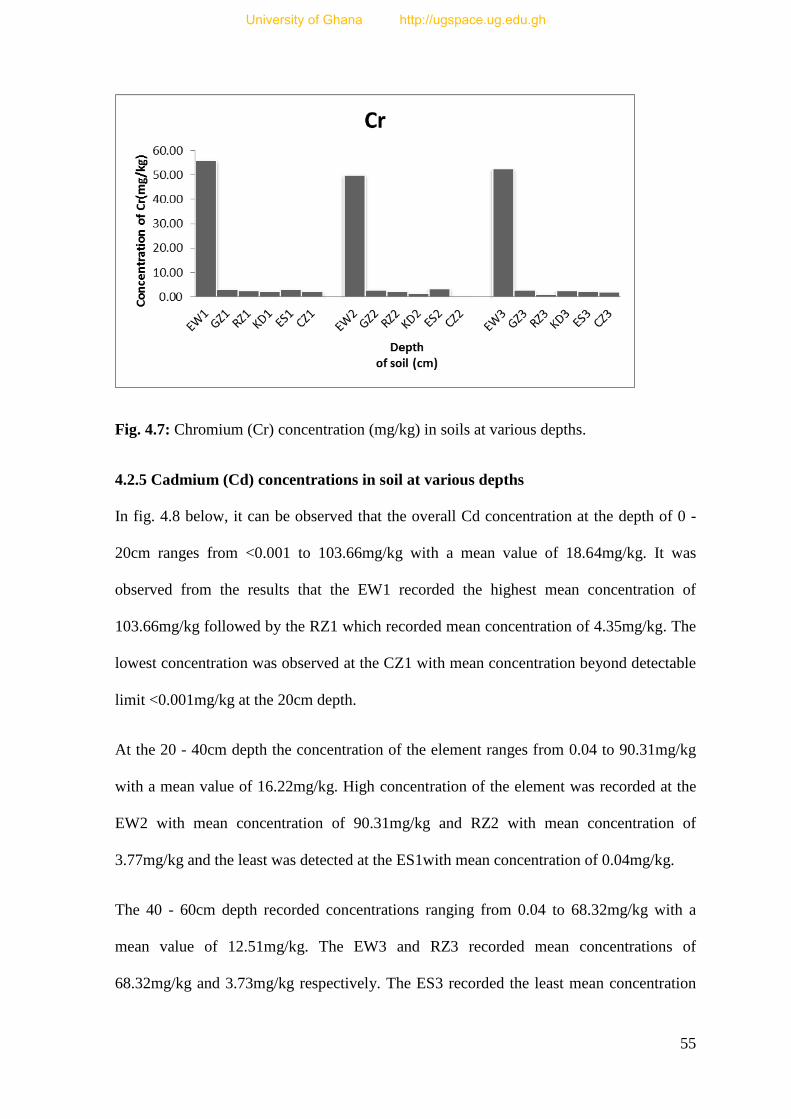
55
Fig. 4.7: Chromium (Cr) concentration (mg/kg) in soils at various depths.
4.2.5 Cadmium (Cd) concentrations in soil at various depths
In fig. 4.8 below, it can be observed that the overall Cd concentration at the depth of 0 -
20cm ranges from <0.001 to 103.66mg/kg with a mean value of 18.64mg/kg. It was
observed from the results that the EW1 recorded the highest mean concentration of
103.66mg/kg followed by the RZ1 which recorded mean concentration of 4.35mg/kg. The
lowest concentration was observed at the CZ1 with mean concentration beyond detectable
limit <0.001mg/kg at the 20cm depth.
At the 20 - 40cm depth the concentration of the element ranges from 0.04 to 90.31mg/kg
with a mean value of 16.22mg/kg. High concentration of the element was recorded at the
EW2 with mean concentration of 90.31mg/kg and RZ2 with mean concentration of
3.77mg/kg and the least was detected at the ES1with mean concentration of 0.04mg/kg.
The 40 - 60cm depth recorded concentrations ranging from 0.04 to 68.32mg/kg with a
mean value of 12.51mg/kg. The EW3 and RZ3 recorded mean concentrations of
68.32mg/kg and 3.73mg/kg respectively. The ES3 recorded the least mean concentration
University of Ghana http://ugspace.ug.edu.gh
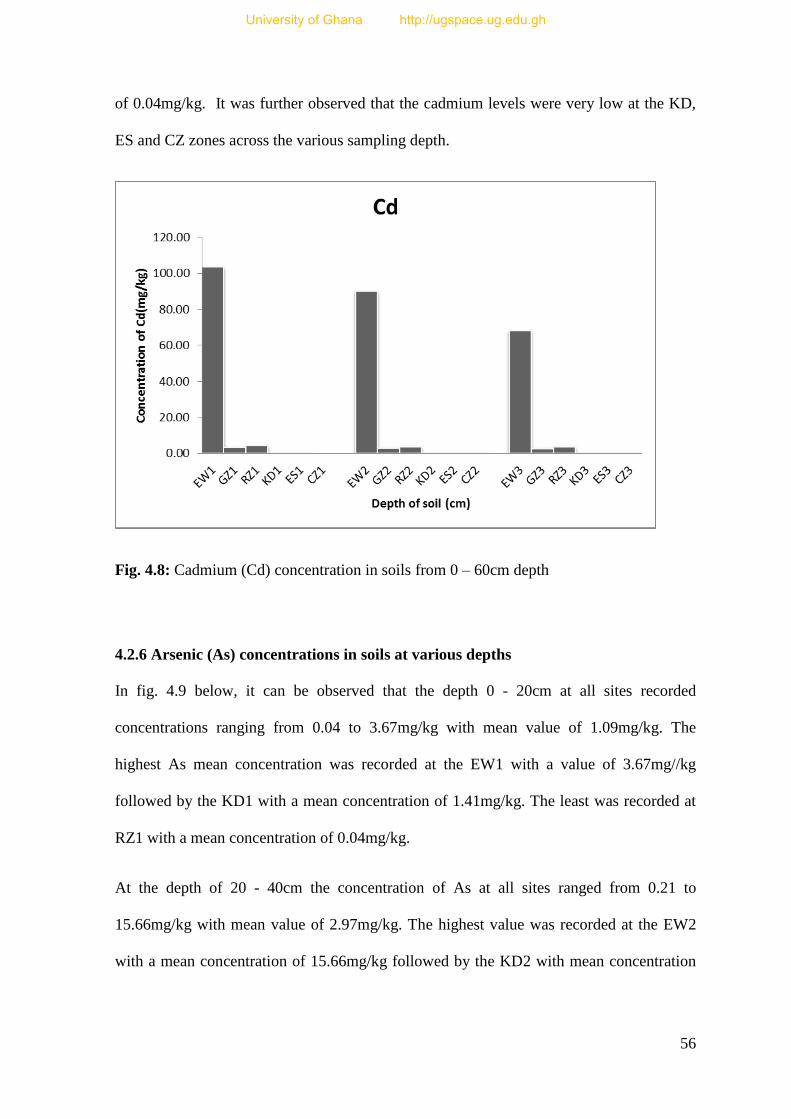
56
of 0.04mg/kg. It was further observed that the cadmium levels were very low at the KD,
ES and CZ zones across the various sampling depth.
Fig. 4.8: Cadmium (Cd) concentration in soils from 0 – 60cm depth
4.2.6 Arsenic (As) concentrations in soils at various depths
In fig. 4.9 below, it can be observed that the depth 0 - 20cm at all sites recorded
concentrations ranging from 0.04 to 3.67mg/kg with mean value of 1.09mg/kg. The
highest As mean concentration was recorded at the EW1 with a value of 3.67mg//kg
followed by the KD1 with a mean concentration of 1.41mg/kg. The least was recorded at
RZ1 with a mean concentration of 0.04mg/kg.
At the depth of 20 - 40cm the concentration of As at all sites ranged from 0.21 to
15.66mg/kg with mean value of 2.97mg/kg. The highest value was recorded at the EW2
with a mean concentration of 15.66mg/kg followed by the KD2 with mean concentration
University of Ghana http://ugspace.ug.edu.gh
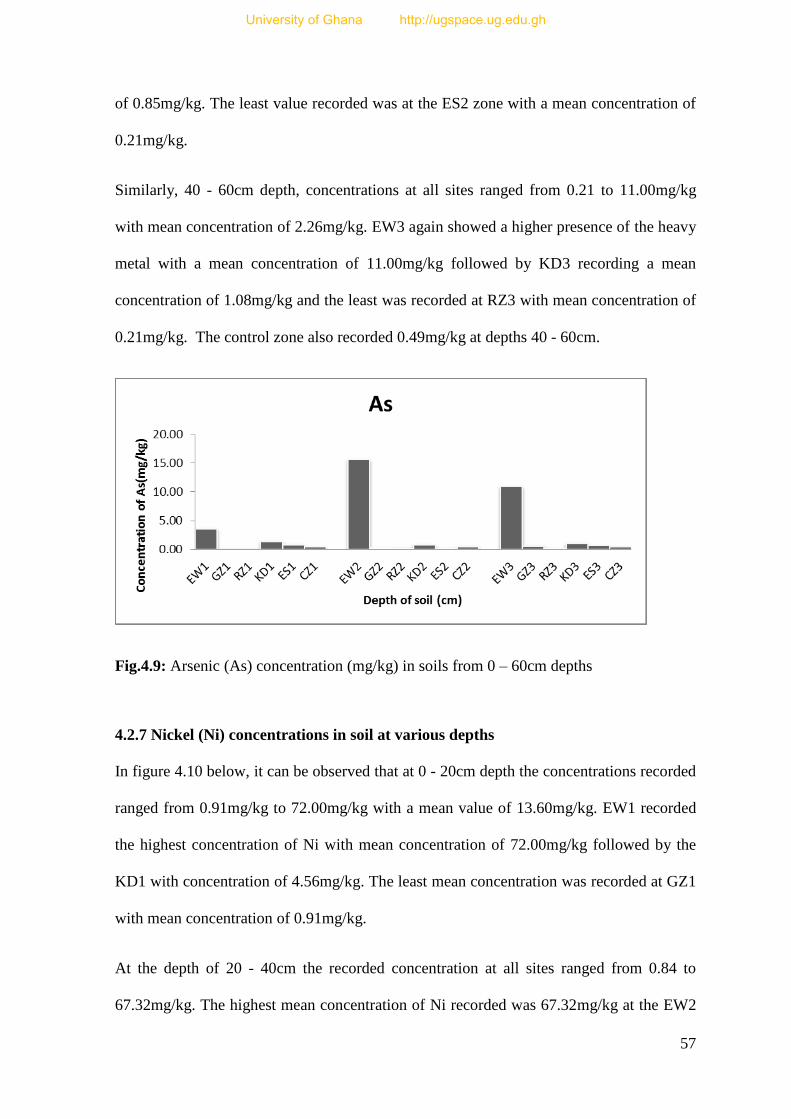
57
of 0.85mg/kg. The least value recorded was at the ES2 zone with a mean concentration of
0.21mg/kg.
Similarly, 40 - 60cm depth, concentrations at all sites ranged from 0.21 to 11.00mg/kg
with mean concentration of 2.26mg/kg. EW3 again showed a higher presence of the heavy
metal with a mean concentration of 11.00mg/kg followed by KD3 recording a mean
concentration of 1.08mg/kg and the least was recorded at RZ3 with mean concentration of
0.21mg/kg. The control zone also recorded 0.49mg/kg at depths 40 - 60cm.
Fig.4.9: Arsenic (As) concentration (mg/kg) in soils from 0 – 60cm depths
4.2.7 Nickel (Ni) concentrations in soil at various depths
In figure 4.10 below, it can be observed that at 0 - 20cm depth the concentrations recorded
ranged from 0.91mg/kg to 72.00mg/kg with a mean value of 13.60mg/kg. EW1 recorded
the highest concentration of Ni with mean concentration of 72.00mg/kg followed by the
KD1 with concentration of 4.56mg/kg. The least mean concentration was recorded at GZ1
with mean concentration of 0.91mg/kg.
At the depth of 20 - 40cm the recorded concentration at all sites ranged from 0.84 to
67.32mg/kg. The highest mean concentration of Ni recorded was 67.32mg/kg at the EW2
University of Ghana http://ugspace.ug.edu.gh
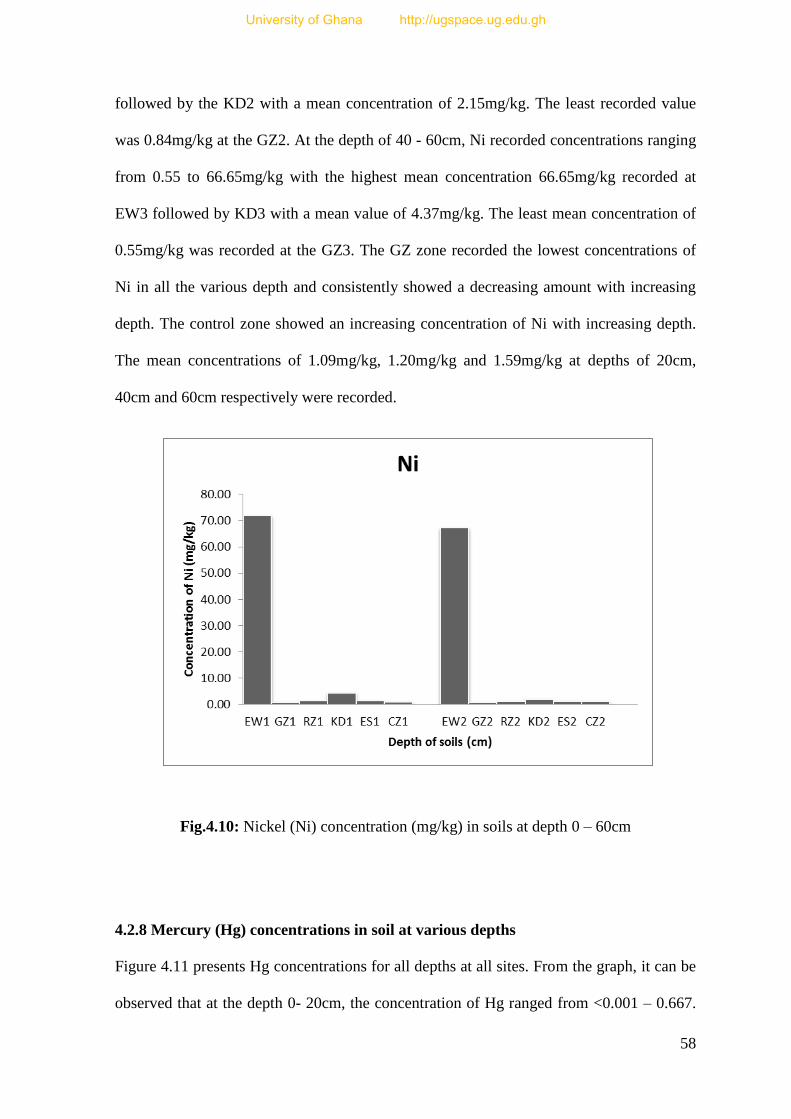
58
followed by the KD2 with a mean concentration of 2.15mg/kg. The least recorded value
was 0.84mg/kg at the GZ2. At the depth of 40 - 60cm, Ni recorded concentrations ranging
from 0.55 to 66.65mg/kg with the highest mean concentration 66.65mg/kg recorded at
EW3 followed by KD3 with a mean value of 4.37mg/kg. The least mean concentration of
0.55mg/kg was recorded at the GZ3. The GZ zone recorded the lowest concentrations of
Ni in all the various depth and consistently showed a decreasing amount with increasing
depth. The control zone showed an increasing concentration of Ni with increasing depth.
The mean concentrations of 1.09mg/kg, 1.20mg/kg and 1.59mg/kg at depths of 20cm,
40cm and 60cm respectively were recorded.
Fig.4.10: Nickel (Ni) concentration (mg/kg) in soils at depth 0 – 60cm
4.2.8 Mercury (Hg) concentrations in soil at various depths
Figure 4.11 presents Hg concentrations for all depths at all sites. From the graph, it can be
observed that at the depth 0- 20cm, the concentration of Hg ranged from <0.001 – 0.667.
University of Ghana http://ugspace.ug.edu.gh
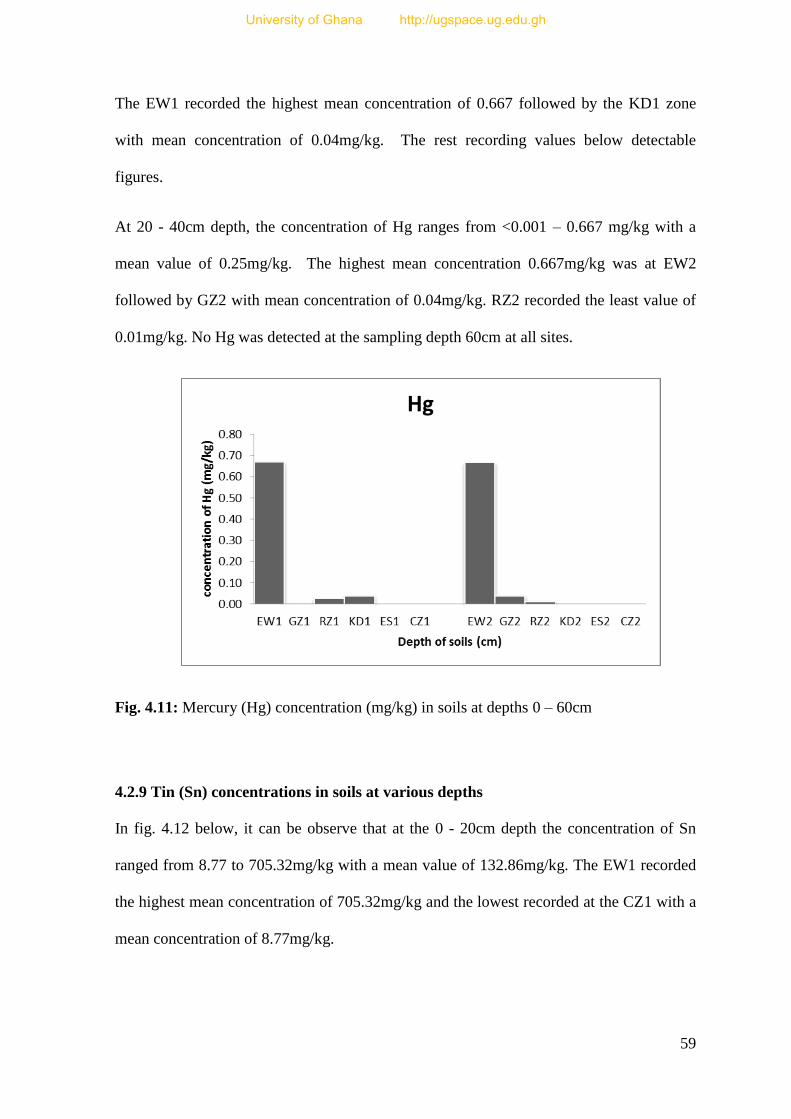
59
The EW1 recorded the highest mean concentration of 0.667 followed by the KD1 zone
with mean concentration of 0.04mg/kg. The rest recording values below detectable
figures.
At 20 - 40cm depth, the concentration of Hg ranges from <0.001 – 0.667 mg/kg with a
mean value of 0.25mg/kg. The highest mean concentration 0.667mg/kg was at EW2
followed by GZ2 with mean concentration of 0.04mg/kg. RZ2 recorded the least value of
0.01mg/kg. No Hg was detected at the sampling depth 60cm at all sites.
Fig. 4.11: Mercury (Hg) concentration (mg/kg) in soils at depths 0 – 60cm
4.2.9 Tin (Sn) concentrations in soils at various depths
In fig. 4.12 below, it can be observe that at the 0 - 20cm depth the concentration of Sn
ranged from 8.77 to 705.32mg/kg with a mean value of 132.86mg/kg. The EW1 recorded
the highest mean concentration of 705.32mg/kg and the lowest recorded at the CZ1 with a
mean concentration of 8.77mg/kg.
University of Ghana http://ugspace.ug.edu.gh
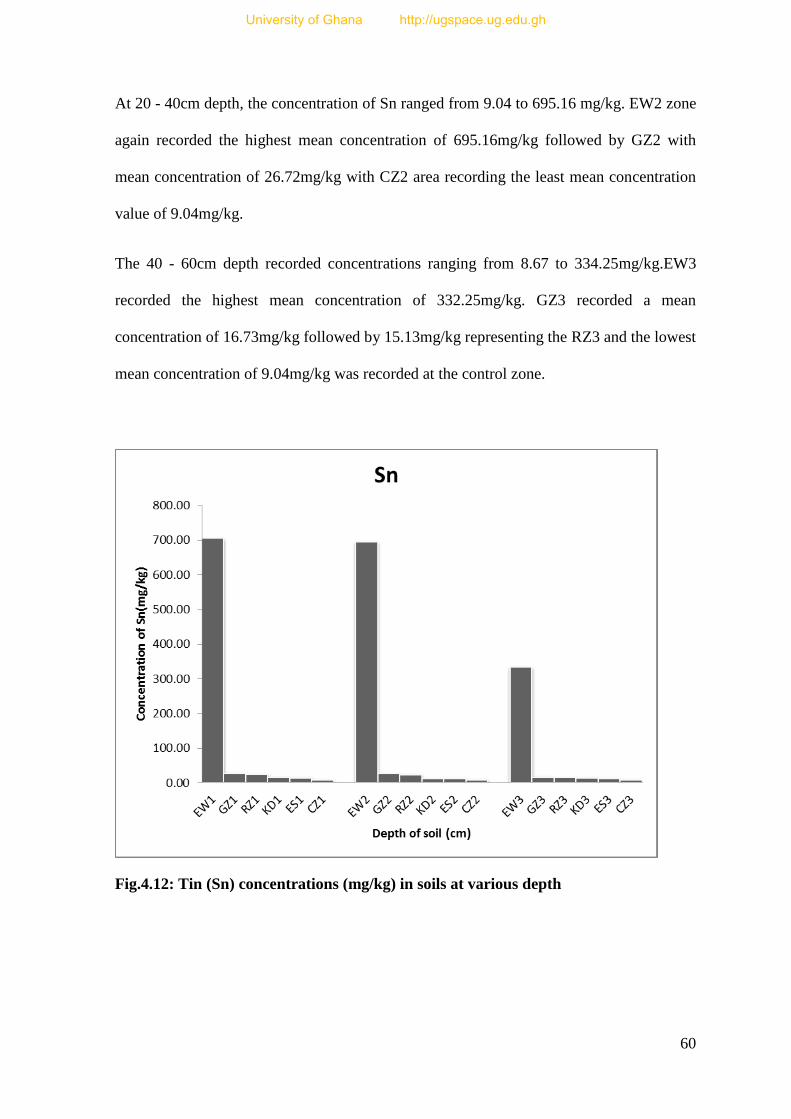
60
At 20 - 40cm depth, the concentration of Sn ranged from 9.04 to 695.16 mg/kg. EW2 zone
again recorded the highest mean concentration of 695.16mg/kg followed by GZ2 with
mean concentration of 26.72mg/kg with CZ2 area recording the least mean concentration
value of 9.04mg/kg.
The 40 - 60cm depth recorded concentrations ranging from 8.67 to 334.25mg/kg.EW3
recorded the highest mean concentration of 332.25mg/kg. GZ3 recorded a mean
concentration of 16.73mg/kg followed by 15.13mg/kg representing the RZ3 and the lowest
mean concentration of 9.04mg/kg was recorded at the control zone.
Fig.4.12: Tin (Sn) concentrations (mg/kg) in soils at various depth
University of Ghana http://ugspace.ug.edu.gh
61
4.3 Geoaccumulation Index (Igeo)
In appendix 8 it can be observed that the Igeo values recorded at a depth of 0 - 20cm for
Hg ranges from -5.322 to 2.474 with a mean value of -1.100. Lead value ranges from -
3.873 to 3.292 while Cu values ranged from -4.573 to 1.299.Similarly, Zn recorded values
ranging from -6.989 to -1.492 and Cr values ranging from -6.040 to -1.421. Cadmium
values ranges from -2.907 to 8.433 while Ni values ranges from -6.955 to -0.644.The
values for Tin ranges from 1.548 to 7.877 with As values ranging from -6.077 to
0.441.The mean values of Igeo increases in the order of Cr < Ni < Zn < Cu < As < Cd <
Pb < Hg < Sn.
It can be observed from appendix 9, that at depth 20 - 40cm Hg Igeo values ranges from -
3.170 to 2.474 while that of Pb ranges from -4.065 to 3.163. Copper had values ranging
from -5.003 to 1.277 with Zn recording values ranging from -7.162 to -1.613.Cadmium
had values ranging from -10.458 to -1.585 with Cd values ranging from -2.907 to
8.234.Nickel values ranges from -7.065 to -0.741 with Sn values ranging from 1.591 to
7.856 while As had values ranging from -3.662 to 2.536.The mean values of Igeo increase
in the order of Zn < Ni < Cu < As < Pb < Hg < Cr < Sn < Cd.
In appendix 10, it can be observed at depth of 40 - 60cm that Hg recorded no value for
Igeo. Lead had values ranging from -4.288 to 2.887 while Cu recorded values ranging
from -5.788 to 0.258 with Zn values ranging from -7.658 to -1.925.Chromium values
ranges from -7.048 to -1.510 with Cd values ranging from -2.907 to 7.831.Similarly, Ni
values ranges from -7.685 to -0.755Sn values ranging from 1.530 to 6.800. The Igeo
values for As ranges from -3.662 to 2.026.The mean values of Igeo increases in order of
Zn < Cr < Ni < Cu < As < Pb < Hg < Sn < Cd.
University of Ghana http://ugspace.ug.edu.gh
62
4.4 Enrichment factor (EF)
The EF values recorded at a depth of 0 - 20cm in appendix 8 shows that for Hg values
range from 0.000 to 0.061 with a mean value of 0.019.Lead values ranges from 0.008 to
0.169 with a mean value of 0.076while Cu values ranging from 0.005 to 0.024 with a
mean value of 0.014.Zinc values ranges from 0.001 to 0.011 with mean values 0.005. Cr
values ranges from 0.002 to 0.005 with mean value of 0.003. Cd values ranges from 0.000
to 1.759 with a mean value of 0.784. Ni values ranges from 0.001 to 0.007 with mean
value of 0.003. Sn values ranges from 1.000 to 1.000 with a mean value 1.000 and As
values ranges from 0.002 to 0.095 with a mean value of 0.039. The mean EF values
increases in the order of Cr = Ni < Zn < Cu<Hg< As < Pb < Cd < Sn.
At a depth of 20 - 40cm EF values recorded in the appendix 9 shows that Hg ranges from
0.000 to 0.030 with a value 0.013, Pb ranges 0.007 to 0.136 with a mean value of 0.059.
Cu ranges from 0.004 to 0.018 with a mean of 0.012. Zn ranges from 0.001 to 0.007 with a
mean value of 0.003. Cr ranges from 0.000 to 0.005 with a mean value of 0.002. Cd ranges
from 0.031 to 1.567 with a mean value 0.696. Ni ranges from 0.001 to 0.005 with a mean
value of 0.003. Sn ranges from 1.000 to 1.000 with a mean value of 1.000 and As ranges
from 0.012 to 0.081 with a mean value of 0.036. The mean EF values increases in the
order of Cr < Ni = Zn < Cu < Hg < As < Pb < Cd < Sn. The mean EF values falls within
the deficiency to minimal enrichment category since all the mean values have EF < 2.
From appendix 10, 40 - 60cm depth recorded EF values for Hg ranges from 0.000 to 0.000
with mean of 0.000. Pb values ranges from 0.009 to 0.133 with mean value of 0.069. Cu
values range from 0.004 to 0.023 with mea value of 0.012. Zn values ranges from 0.001 to
0.009 with mean value of 0.004. Cr values ranges from 0.001 to 0.005 with a mean value
of 0.003. Cd values ranges from 0.033 to 2.467 with mean value of 1.060. Ni values
ranges from 0.001 to 0.008 with a mean value of 0.004. Sn values ranges from 1.000 to
University of Ghana http://ugspace.ug.edu.gh
63
1.000 with a mean value of 1.000 and As values ranges from 0.016 to 0.082 with a mean
value of 0.051. The mean EF values increases in the order of Hg < Cr < Zn < Ni < Cu <
As < Pb < Sn < Cd.
4.5 Pollution Index (PI)
It can be observed from appendix 8 that at the depth of 0 - 20cm PI values ranges from
0.000 to 8.333 with mean value of 1.534 for Hg and Pb values ranging from0.102 to
14.693.Copper values ranges from 0.063 to 3.691 with mean value of 0.705 while Zn
values ranges from 0.012 to 0.533 with mean value of 0.124. Chromium values ranges
from 0.023 to 0.560 with mean values of 0.115. Cd values ranges from 0.000 to 518.320
with mean value of 93.187. Ni values ranges from 0.012 to 0.960 with mean values of
0.181. Sn values ranges from 4.386 to 352.658 with mean values of 66.432 and As values
ranges from 0.022 to 2.037 with mean value of 0.691. The PI values increase in the order
Cr < Zn <Ni < As < Cu < Hg < Pb < Sn < Cd.
At a depth of 20 - 40cm it can be observed from appendix 9 that PI values for Hg ranges
from 0.000 to 8.331 with mean value of 1.500. Pb values ranges from 0.090 to 13.437 with
mean value of 2.571. Cu values ranged from 0.047 to 3.636 with mean value of 0.673. Zn
values ranges from 0.010 to 0.490 with mean value of 0.100. Cr values ranges from 0.001
to 0.500 with mean values of 0.101. Cd values ranged from 0.200 to 451.554 with mean
value of 81.114 and Ni values ranged from 0.011 to 0.898 with mean values of 0.165. Sn
values ranges from 4.519 to 347.580 with mean values of 64.974 and As values ranged
from 0.118 to 8.702 with mean value of 1.650. The PI values increase in the order Zn < Cr
< Ni < Cu < Hg < As < Pb < Sn < Cd.
At a depth of 40 - 60cm it can be observed from appendix 10, that PI values for Hg ranges
from 0.000 to 0.000 with mean value of 0.000. Pb values ranged from0.077 to 10.960 with
University of Ghana http://ugspace.ug.edu.gh
64
mean value of 2.195and Cu values ranged from 0.027 to 1.794 with mean value of 0.364.
Zn values ranged from 0.007 to 0.395 with mean value of 0.091 and Cr values ranged
from 0.011 to 0.527 with mean values of 0.106. Cd values ranged from 0.200 to 341.581
with mean value of 62.530 and Ni values ranged from 0.001 to 0.889 with mean values of
0.169. Sn values ranges from 4.332 to 167.125 with mean values of 33.464 and As values
ranged from 0.119 to 6.110 with mean value of 1.312. The PI values increase in the order
Hg < Zn < Cr < Ni < Cu < As < Pb < Sn < Cd.
4.6 Correlation of heavy metals concentration and physicochemical properties
From the correlation of heavy metals concentration (mg/kg) at depth 0 – 20 cm in the
appendix 5, it was observed that all the heavy metals (Cu and Ni, Cr and Sn, and Cd and
Sn) recorded had strong positive correlation at this depth as all recording a near perfect
correlation (0.995). Arsenic and Cadmium recorded a very strong positive correlation
with a value of 0.911. This value was however the least recorded amongst the heavy
metals. The heavy metals and the pH recorded weak positive correlation with Hg and pH
(0.462), Pb and pH(0.453), Cd and pH(0.444),As and pH(0.499). Sn and pH(0.448), pH
and %OM(0.012), pH and K+(0.917), pH and Na
+(0.775), pH and Ca
2+(0.343) and pH and
Mg2+
(0.342). All the metals recorded negative values for their correlation with %OC.
Mercury and %OC (-0.187), Pb and %OC(-0.222), Cu and %OC(-0.190), Zn and %OC(-
0.258), Cr and %OC(-0.165), Cd and %OC(-0.144), Ni and %OC(-0.190), Sn and %OC(-
0.155), As and %OC(-0.374).The Correlation between %OC and physicochemical
parameters recorded strong positive correlation with the exception of %OC and
pH(0.403); %OC and %OM(0.794), %OC and K+(0.524), %OC and Na
+(0.582), %OC
and Ca2+
(0.930) and %OC and Mg2+
(0.929). %OM and Hg(0.022), %OM and Pb(-
0.014), %OM and Cu(0.031), %OM and Zn(-0.070), %OM and Cr(-0.070), %OM and
University of Ghana http://ugspace.ug.edu.gh
65
Cd(0.090), %OM and Ni(0.021), %OM and Sn (0.074), %OM and As(-0.271), %OM and
K+(0.211), %OM and Na
+(0.453), %OM and Ca
2+( 0.723) and %OM and Mg
2+(0.721). K
+
and the heavy metals recorded significant positive correlation, K+ and Hg(0.528), K
+ and
Pb(0.514), K+ and Cu(0.517), K
+ and Zn(0.517), K
+ and Cr(0.515), K
+ and Cd(0.523), K
+
and Ni(0.525), K+ and Sn(0.524) and K
+ and As(0.503), K
+ and Na
+(0.921), K
+ and
Ca2+
(0.498) and K+ and Mg
2+(0.497). Na
+ recorded significant positive correlation with
the heavy and the physicochemical parameters. Na+
and Hg(0.577), Na+ and Pb(0.573),
Na+ and Cu(0.582), Na
+ and Zn(0.566), Na
+ and Cr(0.592), Na
+ and Cd(0.595), Na
+ and
Ni(0.583), Na+ and Sn(0.596), Na
+ and As (0.511), Na
+ and Ca
2+(0.620) and Na
+ and
Mg2+
(0.620). Ca2+
recorded weak negative correlation with all the heavy metals but had
strong positive correlation with the physicochemical parameters with the exception of
K+.Ca
2+ and Hg(-0.243), Ca
2+ and Pb(-0.253), Ca
2+ and Cu(-0.233), Ca
2+ and Zn(-0.273),
Ca2+
and Cr(-0.211), Ca2+
and Cd(-0.202), Ca2+
and Ni(-0.236), Ca2+
and Sn(-0.206), Ca2+
and As(-0.340) and Ca2+
and Mg2+
(0.995). Mg2+
recorded weak negative correlation with
all the heavy metals but had strong positive correlation with the physicochemical
parameters with the exception of K+. Mg
2+ and Hg(-0.244), Mg
2+ and Pb(-0.254), Mg
2+
and Cu(-0.235), Mg2+
and Zn(-0.274), Mg2+
and Cr(-0.212), Mg2+
and Cd(-0.204), Mg2+
and Ni(-0.238), Mg2+
and Sn(-0.208), Mg2+
and As(-0.341).
From the correlation of heavy metal concentration (mg/kg) at the depth 20 – 40 cm in
appendix 6, it can be observed that all the heavy metals recorded strong positive
correlation above 0.994 among themselves with Ni and Cu, Ni and As, Cd and Sn and Zn
and Pb recording near perfect positive correlation (0.995). pH recorded significant positive
correlation with the heavy metals, K+ and Na
+ , the rest of the physicochemical parameters
recorded were negative and weak positive correlated. pH and Hg(0.606), pH and
Pb(0.583), pH and Cu(0.595), pH and Zn(0.586), pH and Cr(0.607), pH and Cd(0.593),
University of Ghana http://ugspace.ug.edu.gh
66
pH and Ni(0.599), pH and Sn(0.597), pH and As(0.608),pH and %OC(-0.457), pH and
%OM(-0.457), pH and K+(0.530), pH and Na
+(0.924), pH and Ca
2+(0.277), pH and
Mg2+
(0.277). Percentage OC and the heavy metals recorded a negative correlation, perfect
positive correlation with %OM(0.995) and weak positive correlation with the
physicochemical parameters with the exception of Na+(-0.426). Percentage OC and heavy
metals were, % OC and Hg(-0.051), %OC and Pb(-0.096), %OC and Cu(-0.098), %OC
and Zn(-0.098), %OC and Cr(-0.062), %OC and Cd(-0.053), %OC and Ni(-0.100), %OC
and Sn(-0.068), %OC and As(-0.121),%OC and K+(0.249), %OC and Na
+(-0.426), %OC
and Ca2+
(0.308), %OC and Mg2+
(0.308). The correlation between the heavy metals and
the physicochemical parameters recorded same values as recorded in the case of the %OC.
K+ and the heavy metals recorded weak positive correlation and weak positive correlation
with the physicochemical parameters with the exception of pH(0.530) and Na+(0.568). K
+
and Hg(0.183), K+ and Pb(0.128), K
+ and Cu(0.143), K
+ and Zn(0.130), K
+ and Cr(0.188),
K+ and Cd(0.183), K
+ and Ni(0.150), K
+ and Sn(0.170), K
+ and As(0.141), K
+ and
N+(0.568), K
+ and Ca
2+(0.352) and K
+ and Mg
2+(0.352). Na
+ and heavy metals recorded
strong positive correlations and the physicochemical parameters recorded weak negative
correlation with the exception of K+
(0.568). Na+ and Hg(0.723), Na
+ and Pb(0.707), Na
+
and Cu(0.720), Na+ and Zn(0.7060, Na
+ and Cr(0.726), Na
+ and Cd(0.723), Na
+ and Ni
(0.726), Na+ and Sn(0.723), Na
+ and As(0.733), Na
+ and Ca
2+(-0.055), Na
+ and Mag
2+(-
0.055). Ca2+
and the heavy metals recorded weak negative correlation and weak positive
correlation with the physicochemical parameters with the exceptions of Mg2+
which
recorded a perfect correlation (0.995). Mg2+
and Hg(-0.169), Mg2+
and Pb(-0.227), Mg2+
and Cu(-0.221), Mg2+
and Zn(-0.219), Mg2+
and Cr(-0.183), Mg2+
and Cd(-0.202), Mg2+
and Ni(-0.222), Mg2+
and Sn(-0.201), Mg2+
and As(-0.226).
University of Ghana http://ugspace.ug.edu.gh
67
From the correlation of heavy metal concentration (mg/kg) at the depth 40 – 60 cm in
appendix 7, it can be observed that all the heavy metals recorded almost near perfect
correlation with the exception of Hg which recorded values beyond detectable limit at that
depth, therefore had no correlation with the other heavy metals and the physicochemical
parameters. Zn and Pb(0.997), Sn and Cr(0.995), Pb and Cu(0.995) and Ni and Cu(0.995).
pH recorded weak negative correlation with the heavy metals and physicochemical
parameters with the exception of K+(0.202), Ca2+
(-0.774) and Mg2+
(0.775). pH and Pb(-
0.095), pH and Cu(-0.091), pH and Zn(-0.134), pH and Cr(-0.095), pH and Cd(-0.088), pH
and Ni(-0.083), pH and Sn(-0.097), pH and As(-0.115), pH and %OC(-0.115), pH and
%OM(-0.155), pH and Na+(-0.242). %OM recorded weak negative correlation with the
heavy metals and strong positive correlation with the physicochemical parameters with the
exception Na+(-0.024). %OM and Pb(-0.244), %OM and Cu(-0.235), %OM and Zn(-
0.300), %OM and Cr(-0.176), %OM and Cd(-0.149), %OM and Ni(-0.221), %OM and
Sn(-0.175), %OM and As(-0.203), %OM and K+(0.672), %OM and Ca2+
(0.539) and
%OM and Mg2+
(0.537). K+ recorded weak negative correlation with the heavy metals and
positive correlations with the physicochemical parameters with the exception of
N+(0.291). K
+ and Pb(-0.458), K
+ and Cu(-0.441), K
+ and Zn(-0.485), K
+ and Cr(-0.415),
K+ and Cd(-0.432), K
+ and Ni(-0.443), K
+ and Sn(-0.432), K
+ and As(-0.422), K
+ and
Ca2+
(0.316) and K+ and Mg
2+(0.314). Na+ recorded almost near perfect correlation with
the heavy metals and weak negative correlation with the physicochemical parameters with
the exception of Ca2+
(0.053) and Mg2+
(0.052). Na+ and Pb(0.959), Na
+ and Cu(0.962),
Na+ and Zn(0.952), Na
+ and Cr(0.969), Na
+ and Cd(0.967), Na
+ and Ni(0.963), Na
+ and
Sn(0.968), Na+ and As(0.971). Ca
2+ recorded weak negative correlation with the heavy
metals but recorded a near perfect correlation with Mg2+
( 0.995). Ca2+
and Pb(-0.124),
Ca2+
and Cu(-0.120), Ca2+
and Zn(-0.111), Ca2+
and Cr(-0.093), Ca2+
and Cd(-0.114),
University of Ghana http://ugspace.ug.edu.gh
68
Ca2+
and Ni(-0.130), Ca2+
and Sn(-0.105), Ca2+
and As(-0.087). Mg2+
recorded weak
negative correlation with the heavy metals but recorded positive correlation with the
physicochemical parameters. Mg2+
and Pb(-0.124), Mg2+
and Cu(-0.120), Mg2+
and Zn(-
0.111), Mg2+
and Cr(-0.093), Mg2+
and Cd(-0.155), Mg2+
and Ni(-0.131), Mg2+
and Sn(-
0.105), Mg2+
and As(-0.088).
4.7 Concentration of heavy metals in vegetation
4.7.1 Forage grasses (Imperata maximum and Panicum maximum)
Forage grasses in all sampling zones recorded all the heavy metals under study with
different concentrations as shown in fig. 4.13 with the exception of Hg which was below
detectable limits. Forage grasses had roots which did not go beyond 20cm depth.
The EW forage grasses recorded the highest concentration of heavy metals due to the
constant exposure of these grasses to the smoke that emanates from the burning of the
electronic gadgets. The KD section has been corded off and some plants grown on them.
The ES zone is currently not exposed to lot of insanitary activity. The control zone
recorded the least concentration of this element with mean concentration of 0.16mg/kg.
Forage grasses at the recreational zone (KD) recorded the highest mean concentration of
3.84mg/kg for Cr. The Estuary zone recorded a mean concentration of 3.52mg/kg and
forage grasses at EW site recorded mean concentration of 1.56mg/kg. The control zones
recorded concentration higher than that of the EW zone with a mean concentration of
2.20mg/kg.
The e-waste zone (EW) recorded the highest concentration (95.56mg/kg) of Cu in the
forage grasses. This was followed by the KD with a mean concentration of 6.92mg/kg
while mean concentration of 5.48mg/kg was recorded in forage grasses at ES. The
elevated RZ zone recorded a mean concentration of 2.68mg/kg and the control zone
University of Ghana http://ugspace.ug.edu.gh
69
recording the least exposure or presence of Cu in the forage with a mean concentration of
0.26mg/kg. The EW zone again recorded the highest concentration of Zn with mean
concentration of 34.92mg/kg followed by the RZ zone with a mean concentration of
14.84mg/kg. The KD and ES recorded mean concentrations of 7.88mg/kg and 7.36mg/kg
respectively. The control zone recorded the least concentration of Zn in the forage grasses
with a mean concentration of 1.56mg/kg. The EW zone recorded the highest concentration
of Pb in the forage grasses with mean concentration of 36.72mg/kg. This was followed by
the ES zone forage grasses with a concentration 3.64mg/kg. The RZ recorded a mean
concentration of 0.48mg/kg whilst the concentration of Pb at the KD zone was beyond
detectable limit. The control zone recorded a mean concentration of 0.80mg/kg in the
forage grasses and which can be attributed to the soil or running water used in watering
the plants grown in the sampling zone.
The various sampling areas recorded some concentration of Ni in the forage grasses. The
EW, KD and RZ recorded relatively equal mean concentration of Ni with values
2.00mg/kg, 2.20mg/kg and 2.28mg/kg respectively. The highest mean concentration was
recorded at the ES zone with mean concentration of 6.80mg/kg. The control zone recorded
the least mean concentration of 0.80mg/kg. Arsenic (As) concentration in the EW zone
forage grasses was recorded as the highest with mean concentration of 0.32mg/kg
followed by the ES zone forage grasses and the control zone all recording a mean
concentration 0.16mg/kg each. The RZ zone recorded a mean concentration of 0.12mg/kg
whilst the KD zone recorded the least mean concentration of 0.08mg/kg. Tin (Sn) in the
forage grasses recorded showed that the EW zone recorded the highest with mean
concentration of 22.00mg/kg and the minimum was recorded at the KD zone with a mean
concentration of 2.52mg/kg. The concentration of Hg in the forage grasses was beyond
detectable limits <0.001mg/kg.
University of Ghana http://ugspace.ug.edu.gh
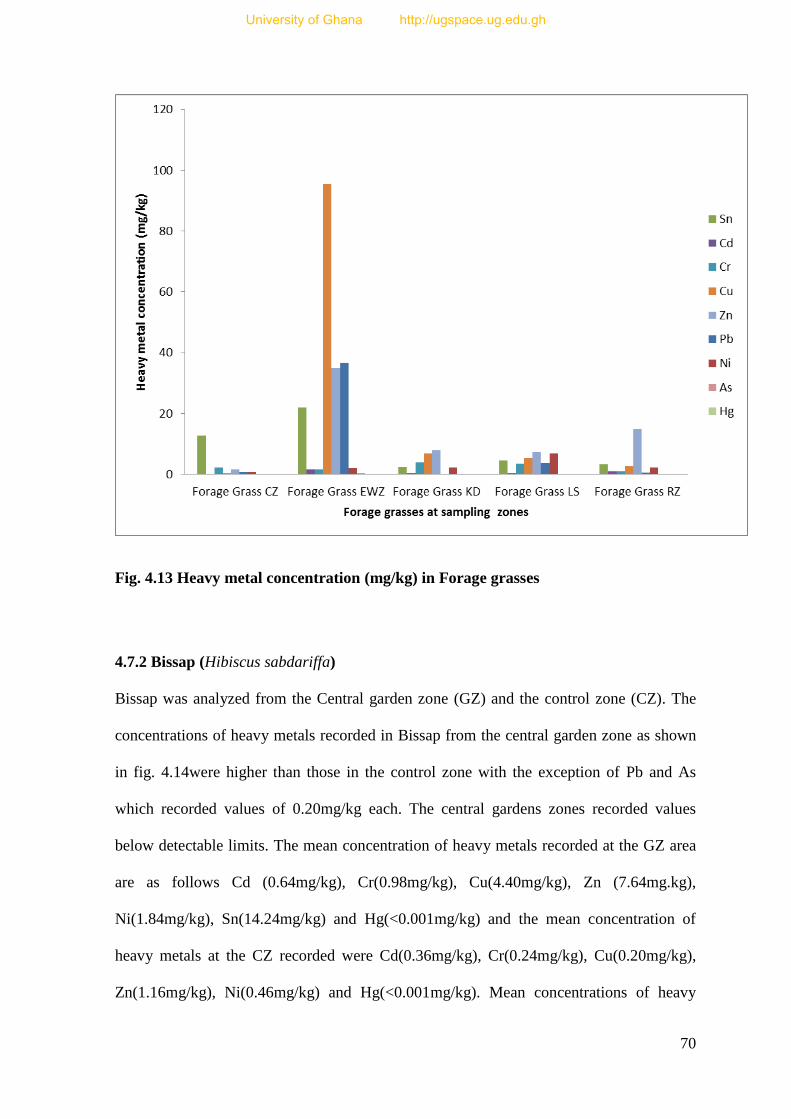
70
Fig. 4.13 Heavy metal concentration (mg/kg) in Forage grasses
4.7.2 Bissap (Hibiscus sabdariffa)
Bissap was analyzed from the Central garden zone (GZ) and the control zone (CZ). The
concentrations of heavy metals recorded in Bissap from the central garden zone as shown
in fig. 4.14were higher than those in the control zone with the exception of Pb and As
which recorded values of 0.20mg/kg each. The central gardens zones recorded values
below detectable limits. The mean concentration of heavy metals recorded at the GZ area
are as follows Cd (0.64mg/kg), Cr(0.98mg/kg), Cu(4.40mg/kg), Zn (7.64mg.kg),
Ni(1.84mg/kg), Sn(14.24mg/kg) and Hg(<0.001mg/kg) and the mean concentration of
heavy metals at the CZ recorded were Cd(0.36mg/kg), Cr(0.24mg/kg), Cu(0.20mg/kg),
Zn(1.16mg/kg), Ni(0.46mg/kg) and Hg(<0.001mg/kg). Mean concentrations of heavy
University of Ghana http://ugspace.ug.edu.gh
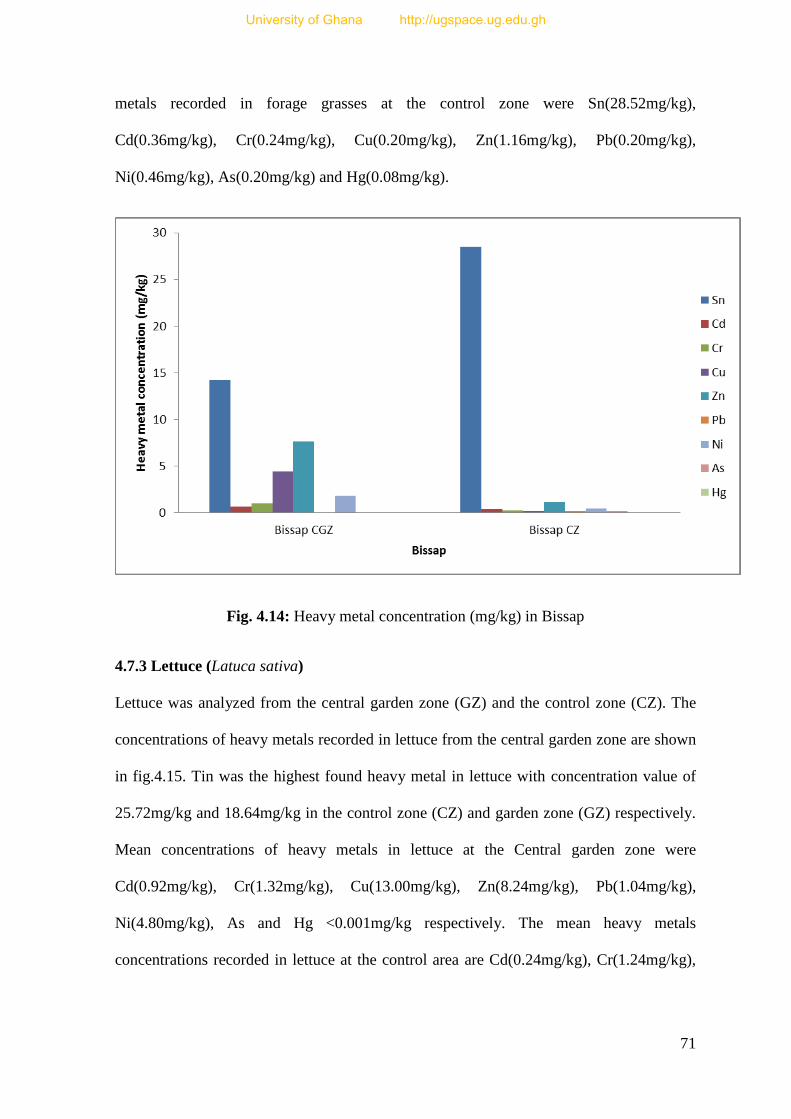
71
metals recorded in forage grasses at the control zone were Sn(28.52mg/kg),
Cd(0.36mg/kg), Cr(0.24mg/kg), Cu(0.20mg/kg), Zn(1.16mg/kg), Pb(0.20mg/kg),
Ni(0.46mg/kg), As(0.20mg/kg) and Hg(0.08mg/kg).
Fig. 4.14: Heavy metal concentration (mg/kg) in Bissap
4.7.3 Lettuce (Latuca sativa)
Lettuce was analyzed from the central garden zone (GZ) and the control zone (CZ). The
concentrations of heavy metals recorded in lettuce from the central garden zone are shown
in fig.4.15. Tin was the highest found heavy metal in lettuce with concentration value of
25.72mg/kg and 18.64mg/kg in the control zone (CZ) and garden zone (GZ) respectively.
Mean concentrations of heavy metals in lettuce at the Central garden zone were
Cd(0.92mg/kg), Cr(1.32mg/kg), Cu(13.00mg/kg), Zn(8.24mg/kg), Pb(1.04mg/kg),
Ni(4.80mg/kg), As and Hg <0.001mg/kg respectively. The mean heavy metals
concentrations recorded in lettuce at the control area are Cd(0.24mg/kg), Cr(1.24mg/kg),
University of Ghana http://ugspace.ug.edu.gh
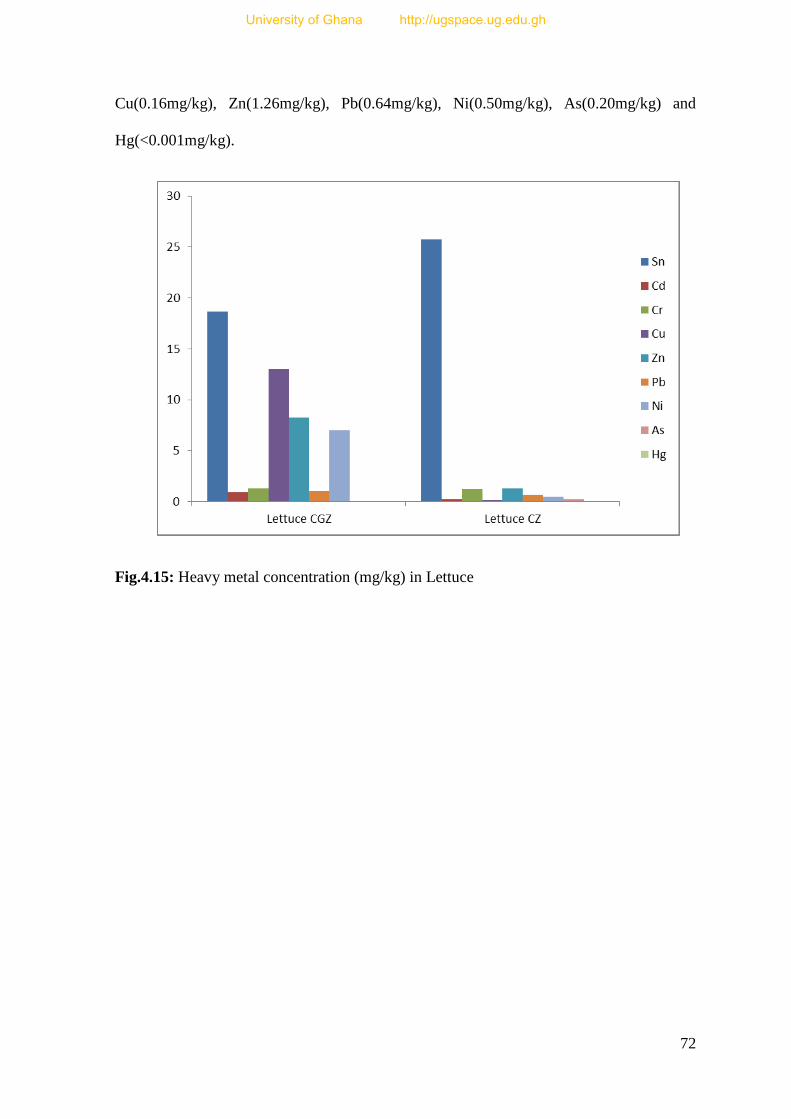
72
Cu(0.16mg/kg), Zn(1.26mg/kg), Pb(0.64mg/kg), Ni(0.50mg/kg), As(0.20mg/kg) and
Hg(<0.001mg/kg).
Fig.4.15: Heavy metal concentration (mg/kg) in Lettuce
University of Ghana http://ugspace.ug.edu.gh
73
CHAPTER FIVE
DISCUSSION
5.1. Heavy metals concentration in Soils
The presence of heavy metals in soils is as a result of absorption of the metals from
anthropogenic sources, adsorption, and the natural occurrence of heavy metals in some
soils. The mobility of heavy metals depends on soil properties, metal properties and
environmental factors (Fagbote et al., 2010).
The study revealed that soil depth of 20cm recorded higher concentrations of the heavy
metals especially at the e-waste zone followed by the recreational zone (KD) and the
reclaimed zone (RZ). Li et al., (2011), reported that high concentrations of heavy metals
are recorded at the pollution source instead of the expected diffusion into the surrounding
environment. It was observed that the concentration of the heavy metals in the soils of
these zones recorded higher concentrations as a result of continuous burning of electronic
waste and other anthropogenic activities. The Accra Metropolitan Assembly (A.M.A)
placed a ban on dumping of refuse at the reclaimed (RZ) and recreational (KD) zones but
some residents continue to dump various kinds of refuse in these areas. The Ghana
Wildlife Society (GWS) has planted some trees on the KD zone and some parts of the RZ
zone in other to revegetate the land but encroachment in these areas is very extensive.
The concentration of the heavy metals at soil depth of 20cm was generally high. Singh et
al. (2010) reported that at lower concentrations, some heavy metals act as micro-nutrients
but they become toxic at higher concentrations.
The maximum Cd mean concentration of 103.66mg/kg was recorded at the e-waste zone
(EW1). This was far above the WHO/FAO (2001) permissible limit of 3.00mg/kg in soils
for cultivating plants. The minimum mean concentration recorded was <0.001mg/kg at the
University of Ghana http://ugspace.ug.edu.gh
74
control zone (CZ1). Zhang et al. (2009) reported that Cd and Cu are very much connected
with non-residual fractions and thus makes them mobile and potentially bio-available for
uptake by plants. The higher concentration of Cd in the e-waste zone (EW1) can be
attributed to continuous burning of electronic gadgets at the burning site. The soil in this
area is clayey with high percentage organic matter and carbon content which reduce
mobility of heavy metals thereby aiding in adsorption of these heavy metals on the
surfaces of soil particles.
The maximum mean concentration of Cu recorded at the e-waste zone (EW1) was
202.99mg/kg and this was above the WHO/FAO (2001) permissible limit of 100.00mg/kg.
Zhang et al.(2012) recorded extremely high concentrations of Cu in e-waste soils, which
are beyond the acceptable agricultural soils limits of 50.00mg/kg in China. The high
concentration of Cu recorded can be attributed to the burning of coppers wires into ashes
during the burning of the electronic gadgets at the e-waste zone (EW1).The maximum
mean concentration of Pb recorded was 183.66mg/kg at the e-waste zone (EW1) which is
above the WHO/FAO(2001) permissible limit of 50.00mg/kg for soils. High concentration
of the metal was also recorded at the EW2 and EW3 with values of 167.96mg/kg and
137.00mg/kg respectively. Pendias and Pendias (1989) recorded a value of 100.00mg/kg
as reported by Agyarko et al.(2010)who recorded a value of 59.20mg/kg for a refuse dump
soil in Accra. The high concentration of Pb recorded can be attributed to the use of tyres of
vehicles in burning the electronic waste. Some parts of the electric gadgets may contain
batteries made of Pb. Lead is known to cause lead poisoning in humans as well as chronic
neurological disorders especially in foetuses and children (Opaluwa et al., 2012).
The maximum mean concentration of Zn recorded at the e-waste zone (EZ1)was
37.33mg/kg which is below the WHO/FAO(2001) permissible limit of 300.00mg/kg. The
minimum mean concentration of 0.82mg/kg was recorded at the garden zone (GZ1).
University of Ghana http://ugspace.ug.edu.gh
75
Agyarko et al.(2010) recorded a value of 297.10mg/kg on a waste dump soil in Accra. The
40cm and 60cm depths had maximum mean concentrations of 1.23mg/kg and 1.15mg/kg
respectively. According to Knezevic et al.(2009) as reported from Adriano (1986) an
average range of 50.00 – 100.00mg/kg was recommended. Wietes (1966) suggested that
the critical value for zinc in soil is 170.00mg/kg and Pendias and Pendias (1989) define
70.00mg/kg as the lower ''toxic'' limit. Zinc is an essential microelement and plays a very
essential catalytic role in enzyme reactions but its content varies with the type of soil
(Knezevic et al., 2009). High Zn concentration can be attributed to dry cells in municipal
waste and zinc containing pesticides (Thorpe and Harrison, 2008).
The maximum mean concentration of Hg obtained was 0.66mg/kg at e-waste zone (EZ1).
This was below the acceptable WHO/FAO (2001) limit of 2.00mg/kg. Agyarko et
al.(2010) recorded a value of 0.04mg/kg on a waste dump soil in Accra. The low
concentration can be attributed to the fact that Hg easily evaporates into its organo-
mercury forms. Available mercury in soil is affected by the amounts which are absorbed
by plants. Soil adsorption of Hg may decrease above pH 5 and therefore there is a
potential that more Hg will be available for plant uptake (Environment Agency,
2009b).The main sources of the contamination were burning of electronic waste and waste
incineration. Mercury also occurs in trace amounts in fertilizers used on farmland
(Steinnes, 1995).
The maximum mean concentration of Ni obtained was 72.00mg/kg at the EW1. This value
was above WHO/FAO (2001) acceptable value of 50.00mg/kg. The maximum mean
concentration of Sn obtained was 705.32mg/kg at the EW1. The value is far above
WHO/FAO(1984) permissible value of Sn. Tin may be released to soils from landfills of
tin-containing wastes, including used cans (IPCS, 1980). There are no data to indicate any
adverse effects in organisms associated with chronic exposure to tin (JECFA, 1989; 2000).
University of Ghana http://ugspace.ug.edu.gh
76
Maximum mean concentration of As obtained was 3.67mg/kg at the EW1. This value is
below the WHO/FAO(2001) permissible limit of 20.00mg/kg. Arsenic occurs naturally in
the earth’s crust, with levels ranging between 2.00mg/kg and 5.00mg/kg (ATSDR, 2000).
The maximum mean concentration of As recorded for the depths of 40cm and 60cm were
15.66mg/kg and 11.00mg/kg respectively. Arsenate is reported to bind strongly to iron and
manganese oxides, and therefore remains in the surface soil layer after deposition
(ATSDR, 2007). Arsenic was observed to be still concentrated after 15 years in the top
20–40 cm of orchard soils treated with lead arsenate (Merwin et al., 1994; Environmental
Agency, 2009).Arsenic is related to heart diseases (hypertension and cardiovascular),
cancer and stroke (Tseng et al., 2003). The final result of arsenic poisoning is coma or
death.
The study revealed that at depths of 40cm and 60cm, the heavy metal concentrations
recorded in table 4.1, were within the WHO/FAO (2001) permissible limit. However, Cd
recorded concentration of 90.31mg/kg and 68.32mg/kg respectively in the e-waste zone
(EW2 and EW3 respectively) which were beyond the WHO/FAO (2001).
5.2 Organic Matter Content
The organic matter contents analyzed were generally below 2.00% with the exception of
the EW1 which recorded a value of 2.51%. Odai et al. (2008) described organic matter
content as the levels of mineral elements for plants development and growth. Odai et al.
(2008) reported from Enwezor et al, (1988) who classified organic matter for cultivation
as follows: values less than 2.00% as low, being values below critical limits. 2.10 – 3.00%
as medium, values above the critical levels and values greater than 3.10% as high, and
above the critical levels.
University of Ghana http://ugspace.ug.edu.gh
77
5.3 Geoaccumulation Index(Igeo)
Across the depth of 0 - 20cm in the research area, the mean Igeo values in appendix 8
shows that Sn and Cd are the heavy metals which falls within the category of moderately
polluted. The rest falls within the category of practically unpolluted (this is with respect to
using the mean Igeo values). The maximum Igeo Hg recorded was 2.474 which fall within
the category of moderately polluted. The maximum Igeo of Pb recorded was 3.292 which
fall with the category of moderately to strongly polluted. Tin and Cd are within the
category of extremely polluted with a recorded maximum Igeo values of 7.877 and 8.433
respectively.
From the depth of 20 – 40cm the mean Igeo values recorded in appendix 9showsthat Sn
and Cd are the heavy metals that falls within the category of moderately polluted with the
rest within the category of practically unpolluted (this is with respect to their mean Igeo
values). The maximum values of Hg, As, Pb, Sn and Cd recorded were 2.474, 2.536,
3.163, 7.856 and 8.234 respectively. These falls within the categories of moderately to
strongly polluted for Hg and As, strongly polluted for Pb, and extremely polluted for Sn
and Cd.
For the depth of 40 – 60cm the mean Igeo values recorded in appendix 10 shows that Sn
and Cd are the heavy metals that falls within the category of moderately polluted and the
rest with the category of practically unpolluted (with respect to the use of their mean Igeo
values). The maximum values of As recorded was 2.026 which fall within the category of
moderately polluted. The Sn value recorded was 6.800 which fall within the extremely
polluted category and Cd recorded a value of 7.831 which fall within the extremely
polluted category.
University of Ghana http://ugspace.ug.edu.gh
78
5.4 Enrichment factor (EF)
Along the soil profile 0 - 60cmin the study area the mean EF values in appendices 8, 9 and
10, fall within the deficiency to minimal enrichment category since all the mean values
have EF < 2. The low EF value can be attributed to the fact that, it is only the e-waste zone
(EZ) which churns out most of the heavy metals in the soils. The other zones and the
control zone recorded low concentrations of heavy metals. This may probably originate
from natural sources or the anthropogenic activities going on there, which are not
intensive to churn out high volumes of these heavy metals.
5.5 Pollution Index (PI)
Along the depth of 0 - 20cm in the study area the mean PI values in appendix 8shows that
the following heavy metals Cu, Zn, Cr, As and Ni falls within the PI ≤ 1 category. This
means that the presence of these heavy metals in the earth crust is low and their pollution
in the soil is very minimal. Hg and Pb belong to 1 < PI ≤ 3 category which means that
their PI values falls within the middle category. This means that their presence in the study
area falls between low to high pollutants in the soil. Cd and Sn are within the high
category with PI > 3. This means that their presence is high in the earth crust and therefore
they are high risk pollutant in the soil.
Along the depth of 20 - 40cm in the study area the mean PI values in appendix 9shows
that the following heavy metals Cu, Zn, Cr and Ni falls within the PI ≤ 1 category. This
means that the presence of these heavy metals in the earth crust is low and their pollution
in the soil is very minimal. Pb, Hg and As belong to 1 < PI ≤ 3 which means that the PI
values falls with the middle category. The presence of these metals in the study area fall
between low to high pollutants in the soil. Cadmium and Sn are within the high category
University of Ghana http://ugspace.ug.edu.gh
79
with PI > 3.This means their presence is high in the earth crust and therefore they are high
risk pollutant in the soil.
At the depth of 40 – 60cm,the mean PI values in appendix 10 shows that the following
heavy metals Hg, Cu, Zn, Cr and Ni falls within the PI ≤ 1 category. This means that the
presence of these heavy metals in the earth crust is low and their pollution in the soil is
very minimal at these depths. Lead and As belong to 1 < PI ≤ 3 category. This means that
their presence in the study area fall between low to high pollutants in the soil. Cadmium
and Sn are within the high category with PI > 3.This means that their presence is high in
the earth crust and therefore they are high risk pollutant in the soil at the study area.
5.6 Heavy Metals In Plants
5.6.1 Heavy metals in forage grasses
Heavy metal accumulates in plants and also in herbivorous animals along the food chain.
Cadmium concentration recorded ranged between 0.16 - 1.64 mg/kg, with mean value of
0.63mg/kg which was far above the WHO/FAO (1989) permissible limit of 0.20mg/kg for
edible plants. This result is in line with the finding of Odai et al. (2008) who reported
values ranging between 0.68 – 1.78mg/kg on urban waste dumpsites in Kumasi. The high
concentration of Cd recorded at the EW zone might be as a result of the burning of e-waste
containing cadmium-nickel batteries and pigments and paints. Significant concentrations
of Cd may have gastrointestinal effect and reproductive effect on livestock (Maobe et al.,
2012).
Copper concentrations ranged between 0.16 - 95.56mg/kg, with value of 14.23mg/kg
which was above the WHO/FAO(1984) permissible limit of 3.00mg/kg for edible plants
occurring at the EW zone. This could be attributed to continuous dumping of copper-
containing electrical gadgets. Agyarko et al.(2010) recorded mean concentrations of
University of Ghana http://ugspace.ug.edu.gh
80
10.80mg/kg for copper (Cu) in Eleusine indica (L.) Gaertn on waste dump site in Accra,
whilst Odai et al.(2008) recorded a range between 16.17 – 90.33mg/kg in vegetables
grown on urban waste dumpsites in Kumasi. High concentrations of Cu may cause liver
disorders in livestock especially in cattle.
Zinc recorded was within the range of 1.16 - 34.92mg/kg, with a mean value of 9.43mg/kg
which was below the WHO/FAO (1984) permissible limit of 27.3mg/kg. Odai et al.
(2008) recorded values ranging between 26.77 – 106.83mg/kg in vegetables grown on
waste dump soil in Kumasi. Opaluwa et al. (2012) recorded a value of 0.03mg/kg for
spinach planted on waste dump soils in Lafia, Nasarawa State in Nigeria. Zn is also
phytotoxic and high concentrations in forage grasses may result in adverse health effect in
livestock.
Lead (Pb) concentrations recorded ranged from <0.001 to 36.72mg/kg, with mean value of
4.84mg/kg which was beyond the WHO/FAO (1984) acceptable value of 0.43mg/kg in
edible plants. This can be attributed to the burning of lead containing products like scrap
metals and batteries in the e-waste. Livestock that graze in the e-waste area stand a high
risk with regards to lead toxicity through the consumption of forage grasses growing in
this area.
The Tin recorded ranged from 2.52 - 22.00mg/kg, with mean value of 14.68mg/kg and this
is below the recommended WHO/FAO (1984) permissible limit of 200.00mg/kg in edible
plants. There is no data to indicate any adverse effects in humans associated with chronic
exposure to tin (JECFA, 1989).
Chromium recorded was within the range of 1.08 – 3.84mg/kg, with mean value of
1.78mg/kg this falls below the critical range of 5.00 - 30.00mg/kg given by Radojevic and
Bushkin (2008) as reported by Agyarko et al. (2010).
University of Ghana http://ugspace.ug.edu.gh
81
Nickel concentrations recorded ranged from 0.80 - 6.86mg/kg, with mean value of
2.65mg/kg which was lower than the value of 23.65mg/kg recorded by Singh et al. (2010)
and attributed it to the use of sewage sludge. However, the maximum concentration was
higher than the WHO/FAO permissible limit of 1.63mg/kg. The Ni concentrations in the
forage grasses can be attributed to Cadmium-Nickel batteries in the electrical gadgets and
some paints used to polish the surfaces of the gadgets. Arsenic concentrations recorded
ranged from 0.16 - 0.32mg/kg with mean value of 0.14mg/kg. Agyarko et al.(2010)
recorded mean concentrations of 0.13mg/kg for Arsenic (As)in the leaves of Eleusine
indica (L.) Gaertn on a waste dump site in Accra. The presence of these heavy metals in
the soils might be due to the fact that the research area used to be a waste dumpsite and the
result of continuous burning of e-waste from the e-waste zone (EW).
5.6.2 Heavy metals in Bissap and Lettuce
The mean heavy metal concentration recorded in Bissap and Lettuce at the central garden
zone (GZ) and control zone (CZ) recorded values were generally within the WHO/FAO
(1984) permissible limits with the exception of Cadmium (Cd), Lead (Pb), Mercury (Hg).
Bissap recorded mean concentrations of 0.64mg/kg for the central garden zone (GZ) and
the control zone (CZ) recorded a value of 0.36mg/kg for Cd. Lettuce recorded mean
concentration of 0.92mg/kg at the central garden zone and the control zone recorded a
value of 0.24mg/kg for Cd. The values recorded were above the WHO/FAO (1984)
permissible limit 0.20mg/kg for edible plants. Odai et al. (2008) recorded values ranging
between 0.68 – 1.78mg/kg in edible plants grown on urban waste dumpsites in Kumasi.
Jabeen et al. (2010) reported that cadmium causes both acute and chronic poisoning,
adverse effect on kidney, liver, vascular and the immune system.
University of Ghana http://ugspace.ug.edu.gh
82
Bissap mean concentrations of <0.001mg/kg and 0.08mg/kg were recorded for the central
garden zone (GZ) and the control zone(CZ) respectively for Hg. Lettuce mean
concentration of <0.001mg/kg and <0.001mg/kg were recorded at the central garden (GZ)
and control (CZ) zones These values were below the WHO/FAO(1984) permissible limit
of 0.02mg/kg in edible plants as reported by Jabeen et al.(2010) with the exception of the
Bissap at the control zone. Maobe et al.(2012) reported a value of 0.00572mg/kg for
Physalis peruviana. The lower concentrations recorded can be attributed to the minimal or
no usage of mercury in the activities undertaken at these zones. It might also be the fact
that Hg can easily transform into other organic forms which are more poisonous.
Exposures to high levels of metallic, inorganic, or organic mercury can permanently
damage the brain, kidneys and developing foetus. The effects of mercury on brain
functioning result in irritability, changes in vision or hearing and memory problems
(Vaikosen and Alade, 2011).
Bissap mean concentration of <0.001 was recorded at the central garden zone (CZ) and
0.20mg/kg at the control zone for Pb. Lettuce mean concentration 1.04mg/kg and
0.64mg/kg were recorded at the garden zone (GZ) and control zone (CZ) respectively for
Pb. The permissible limit set by WHO/ FAO (1984) as reported by Jabeen et al.(2010) is
0.43mg/kg in edible plants. Bissap values are within WHO/FAO (1984) whilst the lettuce
values were above the acceptable limit. This can be attributed to the burning of refuse and
e-waste close to the garden zone. The zone use to be an active waste dumpsite and
therefore the zone might be polluted with Pb containing substances like batteries and
electrical gadgets. Agyarko et al. (2010) recorded value of 1.00mg/kg for Eleusine indica
(L.) Gaertn leaves and 1.43mg/kg Sida acuta (F.) leaves on refuse dump soils in Accra for
Pb. Odai et al. (2008) recorded Pb values ranging between 2.42 – 13.50mg/kg in
vegetables grown from waste dump soils in Kumasi. The relatively lower concentrations
University of Ghana http://ugspace.ug.edu.gh
83
of lead recorded can be attributed to reduce levels of it usage in the zone and it can also be
that Pb might have formed organic compounds with other elements in the soil. Khan et
al.(2008) reported that lead causes both acute and chronic poisoning and also poses
adverse effects on kidney, liver, vascular and immune system. Lead is a non-essential
trace element in humans and plants.
Bissap mean concentrations of 4.40mg/kg was recorded for Cu at the central garden
zone(CZ) and the control zone recorded 0.20mg/kg. Lettuces mean concentrations of
13.00mg/kg and 0.16mg/kg of Cu at the garden zone (GZ) and control zone respectively.
The permissible limit set by WHO/FAO(1984) in edible plants is 3.00mg/kg as reported
by Jabeen et al.(2010). The recorded values at the garden zone were above the threshold
limit and this can be attributed to the area been a refuse dump site. Maobe et al. (2012)
recorded copper concentration of 1.44mg/kg in Physalis peruvianaa malaria curing plant
in Kisii region, Southwest Kenya. Moabe et al.(2012) reported from Ullah et al.(2012) that
the high levels of copper may cause metal fumes fever with flue like symptoms, hair and
skin decolouration, dermatitis, irritation of the upper respiratory tract, metallic taste in the
mouth and nausea. Copper deficiency results in anaemia and congenital inability.
Mean concentrations of Zn recorded at the central garden zone was 7.64mg/kg and the
control zone recorded 1.16mg/kg in Bissap. Whilst lettuce recorded a mean concentration
8.24mg/kg and 1.26mg/kg at the garden zone (GZ) and control zone (CZ) respectively.
The permissible limit set by WHO/FAO (1984) as reported by Jabeen et al. (2010) is
27.30mg/kg. Whilst Opaluwa et al. (2012) recorded a value of 0.03mg/kg for spinach
planted on waste dump soils in Lafia, Nasarawa State in Nigeria. Moabe et al. (2012)
reported from Jabeen et al. (2010) that zinc is an essential trace element and plays an
important role in various cell processes including normal growth, brain development,
University of Ghana http://ugspace.ug.edu.gh
84
behavioural response, bone formation and wound healing. Zinc deficient diabetics fail to
improve their power of sensitivity and cause loss of sense of touch and smell.
Nickel mean concentration recorded at the central garden zone (GZ) was 1.84mg/kg and
0.46mg/kg at the control zone (CZ) in Bissap. Lettuce recorded mean concentrations of
7.00mg/kg and 0.50 mg/kg for the garden and control zones. The permissible limit as set
by WHO/FAO(1984) as reported by Jabeen et al. (2010) is 1.63mg/kg. The mean value of
lettuce is beyond the permissible limit. Agyarko et al. (2010) recorded Ni concentrations
of 8.10 mg/kg in Eleusine indica (L.) Gaertn leaves and 6.10 mg/kg in Sidaacuta
Burm(F.) leaves from refuse dump soils in Accra. Although nickel is required in minute
quantities for the body, it is mostly present in the pancreas and hence plays an important
role in the production of insulin. Its deficiency results in liver disorder (Khan et al., 2008).
The heavy metals may have entered the plants through adsorption, which refers to the
binding of materials or the heavy metals onto the surface or absorption which implies
penetration of the trace metals into the inner matrix of the plants. The uptake of heavy
metals by plants occurs always during their vegetative period and the highest values are
obtained at the end of the vegetation period (Krstic et al., 2007; Stankovic, 2006; Milan
Knezevic et al., 2009).Toxic heavy metals will bio-accumulate and lead to bio-
magnification. These metals get accumulated in soils and plants and have negative impact
on physicochemical of soils and activities of plants (Suciu et al., 2008; Fagbote et al.,
2010).
University of Ghana http://ugspace.ug.edu.gh
85
CHAPTER SIX
CONCLUSION AND RECOMMENDATION
6.1 Conclusion
Significantly high contents of heavy metals in soils and vegetation around the Korle
lagoon reclamation area were recorded, especially at the e-waste zone. The heavy metal
concentrations of the soils were used to calculate enrichment factor (EF), index of
geoaccummulation (Igeo) and pollution index (PI). The results of the heavy metals were
then compared with the WHO/FAO acceptable values. Heavy metal analysis was then
assessed in the dominant plant species in the reclamation area. Three species of plants
were analyzed for these heavy metals.
The elemental analysis at the e-waste zone recorded significantly high concentrations of
Cd, Pb, Cu, Ni and Sn across the various depths with all recording values above the
WHO/FAO acceptable limit for soils whilst concentration of Hg, Zn, As and Cr were
within the permissible limit. The concentrations of the heavy metals recorded at the
control zone were within the WHO/FAO acceptable limits for soils. The soils at the garden
zone (GZ), reclaimed zone (RZ), recreational zone (KD) and the estuary zone (EZ) all
recorded values within the WHO/FAO acceptable limits of soils. The high concentration
of the heavy metals in the soil at the e-waste zone is probably due to the burning of e-
waste by the urban poor in the community and the dumping of solid waste.
The heavy metals concentrations recorded within the depth of 0 – 20 cm were significantly
higher concentrations across the soil profile. Plants roots can take up these heavy metals
during nutrient uptake and accumulate them in their tissues. Heavy metals like cadmium
and lead can cause both acute and chronic poisoning, adverse effect on the kidney, liver,
vascular and the immune system.
University of Ghana http://ugspace.ug.edu.gh
86
The forage grass cover at the various zones analyzed recorded concentrations of heavy
metals, with the e-waste zone recording the highest concentrations. The concentrations of
Hg in the grasses were below detectable limit. Lead (Pb), Cd, Ni, As and Cu recorded
concentrations above the WHO/FAO permissible limits whilst Zn, Sn and Cr however
recorded concentrations within the permissible limit. The lettuce and bissap grown at the
garden zone (GZ) had higher concentrations of heavy metals than those from the control
zone (CZ).
The levels of heavy metals in plants were relatively lower when compared to the soil. This
may be influenced by the plant species and the form of the elements and the
physicochemical properties of the soil. The burning of e-waste may have resulted in the
significantly high concentrations of heavy metals in soil, forage grasses, bissap and lettuce
sampled in the EW zone.
The presence of heavy metals in the vegetation from the other sampling zones may be due
to frequent dumping of solid waste. The plants sampled are shallow rooted plants that
absorb nutrient from the top soil. This might have contributed to the presence of heavy
metals in their leaves since most of the heavy metals were within a depth of 0 – 20cm.
Consumption of lettuce and bissap from the zones where significantly high concentrations
of Cd, Pb and Cu were detected poses a threat to human health. The high concentrations
of heavy metals detected in the forage grasses from the EW zone may also pose health
threat to herds of cattle and sheep grazing on the grasses.
6.2 Recommendation
The management of e-waste must be given the utmost priority due to the health
effect if not properly separated from solid waste materials.
University of Ghana http://ugspace.ug.edu.gh
87
The Accra Metropolitan Assembly must enforce the law on open air burning and
fast track the Korle Lagoon Reclamation Project in order to curtail the activities of
these e-waste dealers and the burning of e-waste at the reclamation area. These
electronic waste, ends up in the lagoon, thereby polluting it and hence making
dredging cost intensive. The e-waste may end in the sea affecting the marine
environment and therefore marine life can be compromised.
The fumes generated during the burning of the electronic waste are toxic and may
end up in foods or drinking water within the neighborhood. Environmental and
sanitation officers should educate food vendors on proper handling of food and the
health effect of consumption of polluted food from fumes from burning e-waste.
Herds of cattle crossing from the Abossey Okai Zongo should be banned from
grazing on the forage grasses on the reclamation site since most of them contain
high concentrations of heavy metals due to the activities of the e-waste dealers.
The Environmental Protection Agency and the Ghana Immigration Service should
collaborate to educate importers on e-waste separation at the various entry points.
E-waste dealers must be educated occasionally to create awareness on the potential
health risks they are exposed to.
Farmers cultivating along the borders of the reclamation zones should be educated
to cultivate deep rooted crops since the heavy metals were found to accumulate
within 0 -10 cm of the soil layer to avoid transfer of heavy metals along the food
chain.
Children must be restricted from playing within the recreational zone since it
contains some hazardous chemicals.
University of Ghana http://ugspace.ug.edu.gh
88
REFERENCES
Adamson, I. Y. R., Prieditis, H., Hedgecock, C., &Vincent, R. (2000). Zinc is the toxic
factor in the lung response to an atmospheric particulate sample. Toxicology of
Applied Pharmacology, 166 (2), 111-119.
Adriano, D.C. (1986). Trace elements in the terrestrial environment. Springer, New York.
Agency for Toxic Substances and Disease Registry (ATSDR) (1999). “ToxFAQ”. Atlanta,
GA: U.S. Department of Health and Human Services, Public Health Service.
Agency for Toxic Substances and Disease Registry (ATSDR) (2005). Toxicological
Profile for Tin and Compounds. Atlanta, GA: U.S. Department of Health and
Human Services, Public Health Service 2012.
Agirtas, M.S., & Kilicel, F. (1999). Determination of Cu, Ni, Mn. and Zn pollution in soil
at the shore of Van Lake with Flame Atomic Spectrophotometry. Bulletin of Pure
and Applied Science, 18, 45-47.
Agyarko, K., Darteh, E., & Berlinger B. (2010). Metal levels in some refuse damp soils
and plants in Ghana. Plant Soil Environment, 56 (5), 244-251.
Ahiamadjie, H., Adukpo, O.K., Agyemang, O., Tandoh, J.B., Ackah, M., Gyampo, O.,
Otoo, F., Nyarku, M., Dampare, S.B.,& Mumuni, I.I. (2011). Determination of the
Elemental Contents in Soils Around Diamond Cement Factory, Aflao. Research
Journal of Environmental and Earth Sciences, 3(1), 46-50.
Alloway, B.J., & Ayres, D.C. (1995). Chemical Principles of Environmental Pollution
(2nd
ed.). Blackie Academic and Professional, Chapman and Hall, London.
Asante, K. A., Adu-Kumi, S., Nakahiro, K., Takahashi, S., Isobe, T., & Sudaryanto, A.
(2011). Human exposure to PCBs, PBDE s and HBCDs in Ghana: temporal
variation, sources of exposure and estimation of daily intakes by infants.
Environment International, 37, 921 –928.
University of Ghana http://ugspace.ug.edu.gh
89
Asante, K. A., Agusa, T., Biney, C. A., Agyekum , W. A., Bello, M., Otsuka, M., Itai, T.,
Takahashi, S., & Tanabe, S. (2012). Multi-trace element levels and arsenic
speciation in urine of e-waste recycling workers from Agbogbloshie, Accra in
Ghana. Science of the Total Environment, 424, 63–73.
Asante, K.A., Y. Obayashi, T. Isobe, A. Subramanian, S. Suzuki, S. Tanabe & Ntow, W.J.
(2009). Status of Environmental Contamination in Ghana, the perspective of a
research scientist. TERRAPUB, 253–260.
Asio, V.B. (2007). http://soil-environment.blogspot.in/search/label/heavy%20metals.html
retrieved on the 18th
February 2013.
Atiemo, S. M., Ofosu, F.G., Kuranchie-Mensah, H., Osei Tutu, A., Palm Linda N.D.M., &
Blankson, A. S. (2011). Contamination Assessment of Heavy Metals in Road Dust
from Selected Roads in Accra, Ghana. Research Journal of Environmental and
Earth Sciences, 3(5), 473-480.
Audi, G., Bersillon, O., Blachot, J., & Wapstra, A.H. (2003). "Nubase2003 Evaluation of
Nuclear and Decay Properties". Nuclear Physics Atomic Mass Data Center. 729: 3.
Bibcode2003NuPhA.7293A. doi:10.1016. http://dx.dio.org/10/1016/j.nuclphysa
retrieved on 4th June 2013.
Azevedo, R. & Rodriguez, E. (2012). Phytotoxicity of Mercury in Plants: A Review.
Hindawi Publishing Corporation. Journal of Botany, 2012.
Baird, C. & Cann, M. (2008). Environmental Chemistry (4th
ed.). W.H. Freeman and
Company. New York.
Barceloux, D.G. (1999). Nickel. Journal on Clinical Toxicology, 37, 239–242.
University of Ghana http://ugspace.ug.edu.gh
90
Beyersmann, D. & Hartwig, A. (2008). Carcinogenic metal compounds: recent insight into
molecular and cellular mechanisms. Archives of Toxicology, 82, 493-512.
Boening, D. W. (2000). Ecological effects, transport , and fate of mercury : A general
review. Chemosphere, 40(12), 1335– 1351.
Bothwell, D. N., Mair, E. A. & Cable, B. B. (2003). Chronic Ingestion of a Zinc-Based
Penny. Pediatrics, 111 (3), 689–691.
Brigden, K., Labunska, I., Santillo, D., & Johnston, P. (2008). Chemical contamination at
e-waste recycling and disposal sites in Accra and Korforidua, Ghana. Greenpeace
Research Laboratories Technical Note, 10, 1–24.
CCME, (2001). Canadian Soil Quality Guidelines for the Protection of Environmental and
Human Health: Arsenic (inorganic) [originally published in 1997, updated 2001].
Winnipeg: Canadian Council of Ministers of the Environment.
Centre for Remote Sensing and Geographic Information Service (CERSGIS) (2013).
Geographical map of Accra Metropolitan Assembly. University of Ghana, Legon –
Accra.
Clarkson, T. W., Vyas, J.B., & Ballatori, N. (2007). Mechanisms of mercury disposition in
the body. American Journal of Industrial Medicine, 50 (10), 757–764.
Clemens, S. (2006). Toxic metal accumulation, responses to exposure and mechanisms of
tolerance in plants. Biochimie, 88(11), 1707–1719.
Copper Alliance (2013). http://www. copperinfo.com/health/facts.html retrieved on the
13th March 2013.
Deng, W.J., Louie, P.K.K., Liu, W.K., Bi, X.H., Fu, J.M., &Wong, M. H. (2006).
Atmospheric levels and cytotoxicity of PAHs and heavy metals in TSP and PM2.5
University of Ghana http://ugspace.ug.edu.gh
91
at an electronic waste recycling site in southeast China. Atmospheric Environment,
40, 6945–6955.
dos Anjos, M.J., Lopes, R.T., De Jesus, E.F.O., Assis, J.T., Cesareo, R.,& Barradas,
C.A.A. (2000). Quantitative analysis of metals in soil using X-ray fluorescence,
Spectrochim. Acta, B., 55, 1189-1194.
Draggan, S. (2008). Health effects of tin. In: Encyclopedia of Earth. Eds. Cutler J.
Cleveland (Washington, D.C.: Environmental Information Coalition, National
Council for Science and the Environment).
http://www.eoearth.org/article/Health_effects_of_tin. Retrieved 5th
December
2012.
Duffus,J. H. (2002). Heavy Metals a meaningless term?. Pure and applied chemistry. 74,
793-807.
Duzgoren-Aydin, N.S. (2007). Sources and characteristics of lead pollution in the urban
environment of Guangzhou. Science of the Total Environment, 385, 182-195.
ECB (2007). European Union Risk Assessment Report. Cadmium oxide and cadmium
metal, Part 1 – environment. Volume 72. EUR 22919EN. Luxembourg: Office for
Official Publications of the European Communities.
http://ecb.jrc.ec.europa.eu/documents/ExistingChemicals/RISK_ASSESSMENT/R
EPORT/cdmetal_cdo xideENVreport302.pdf. Retrieved 24th
Febuary 2013.
Edwards, J.H., Wood, C.W., Thurlow, D.L., & Ruf, M.E. (1999). Tillage and crop rotation
effects on fertility status of a Hapludalf soil. Soil Science Society of America. 56,
1577-1582. http://soilquality.org/indicators/total_organic_carbon.html. Retrieved
from 29th
November 2012.
University of Ghana http://ugspace.ug.edu.gh
92
Emsley, J. (2001). Zinc. Nature's Building Blocks: An A-Z Guide to the Elements. Oxford,
England, UK: Oxford University Press.
Environment Agency (2009). Human health toxicological assessment of contaminants in
soil. Science Report SC050021/SR2. Bristol: Environment Agency.
Environment Agency (2009). Updated technical background to the CLEA model. Science
Report SC050021/SR3. Bristol: Environment Agency.
Environment Agency, (2007). UK Soil and Herbage Pollutant Survey. Report No. 7:
Environmental concentrations of heavy metals in UK soil and herbage. Bristol:
Environment Agency.
Enwezor, W.O., Ohiri, A.C., Opubaribo, E.E. & Udoh, E.J. (1988). A review of soil
fertitity investigation South Eastern Nigeria, A review of soil fertility investigation.
Vol II, F.D.A. Lagos, Nigeria.
Esakku, S., Palanivelu, K. & Kurian, J. (2003). Assessment of Heavy Metals in a
Municipal Solid Waste Dumpsite. Workshop on Sustainable Landfill Management
3–5 December, 2003, Chennai, India, pp.139-145.
European Commission (EC) (1986). Council Directive 66/278/EEC on the protection of
environment and in particular of soil, when sewage sludge is used in agriculture.
European Commission Office for Official publications of the European
Communities; Luxembourg;
Fagbote , E.O. & Olanipekun, E.O. (2010).Evaluation of the Status of Heavy Metal
Pollution of Soil and Plant (Chromolaena odorata) of Agbabu Bitumen Deposit
Area, Nigeria. American-Eurasian Journal of Scientific Research, 5(4), 241-248.
FAO/WHO (1984). Contaminants. In Codex Alimentarius, vol. XVII, Edition 1.,Codex
Alimentarius Commision, Rome.
University of Ghana http://ugspace.ug.edu.gh
93
Farago, M.E., Kavanagh, P.J., Leite, M.J., Mossom, J., Sawbridge, G.,& Thornton, I.
(2003). Uptake of arsenic by plants in southwest England. Biogeochemistry of
Environmentally Important Trace Elements, 835, 115-127.
Feng, X. D., Dang , Z., Huang, W. L.,& Yang C. (2009). Chemical speciation of fine
particle bound trace metals. Int. J. Environ. Sci. Tech., 6 (3), 337-346.
Fosmire, G. J. (1990). Zinc toxicity. American Journal of Clinical Nutrition, 51(2), 225-
227.
Franz, E., Römkens, P., van Raamsdonk, L., &van der Fels-Klerx, I. (2008). A chain
modeling approach to estimate the impact of soil cadmium pollution on human
dietary exposure. J. Food Prot., 71(12), 2504–2513.
Frazzoli, C., Orisakwe, O.E., Dragone, R., &Mantovani, A. (2000). Diagnostic health risk
assessment of electronic waste on the general population in developing countries '
scenarios. Environmental Impact Assessment. 30,388 –99.
Gerard, K. (1996). Agricultural Pollution. Environmental Engineering. McGraw-Hill
Publishing Company, United Kingdom.
Greenwood, N. N.,& Earnshaw, A. (1997). Chemistry of the Elements (2nd
ed.).
Bulterworth-Heinemaa.
Hammond, C. R. (2005). The Elements. CRC Handbook of Chemistry and Physics (86th
ed.). Boca Raton (FL): CRC Press.
Henderson, W. (2000). Main group chemistry. Great Britain. Royal Society of Chemistry.
162.
Holleman Arnold F, Wiberg Egon, & Willberg Nils (1985). Zinc. Inorganic chemistry (91-
100 ed). Walter de Gruyler. pp. 1034-1041.
University of Ghana http://ugspace.ug.edu.gh
94
Holleman, A.F.&Wiberg, N. (2001). Inorganic Chemistry. San Diego: Academic Press.
Holm, P.E., Rootzén, H., Borggaard, O.K., Moberg, J.P. And Christensen, T.H. ( 2003).
Correlation of cadmium distribution coefficients to soil characteristics. Journal of
Environmental Quality, 32, 138-145.
Hon, D. N. S. & Shiraishi N. (2001). Preservation of wood and cellulosic chemistry.
New York, NY. Dekker. 799.
Housecroft, C. E. & Sharpe, A.G. (2008). Inorganic Chemistry (3rd
ed). Pentice Hall.
Huu, H.H., Rudy, S., &. Damme, A.V. (2010). Distribution and contamination status of
heavy metals in estuarine sediments near Cau Ong harbor, Ha Long Bay, Vietnam.
Geol. Belgica, 13(1-2): 37-47.
Ideriah, T.J.K., Harry, F.O., Stanley, H. O., & Igbara J.K. (2010). Heavy Metal
Contamination of Soils and Vegetation around Solid Waste Dumps in Port
Harcourt, Nigeria. Journal of Applied Science and Environmental
Management,14(1), 101 – 109.
Ideriah, T.J.K., Omuaru, V. O. T., & Adiukwu, P.A. (2005). Heavy metal contamination
of soils around municipal solid wastes dump in Port Harcourt, Nigeria. Global
Journal of Environmental Sciences, 4 (1), 1-4.
IPCS (1980). Tin and organotin compounds. A preliminary review. Geneva , World
Health Organization (Environmental Health Criteria 15). Geneva.
IPCS (2001). Arsenic and arsenic compounds (2nd
ed).Environmental Health Criteria 224.
Geneva: WHO, International Programme on Chemical Safety. Available from:
http://www.inchem.org/documents/ehc/ehc/ehc224.htm Retrived on the 13th
March 2013.
University of Ghana http://ugspace.ug.edu.gh
95
Jabeen, S., Shah, M. T., Khan, S., & Hayat, M.Q. (2010). Determination of major and
trace elements in ten important folk therapeutic plants of Haripur basin, Pakistan.
Journal of Medicinal Plants Research,4(7), 559-566.
Joint FAO/WHO Expert Committee on Food Additives. (1984). Toxicological Evaluation
of Certain Food Additives. ILSI Press International Life Sciences Institute,
Washington, DC.
Kabata-Pendias, A., & Mukherjee, A. B.(2007). Trace Elements from Soil to Human.
Berlin. Springer Verlag.
Kabata-Pendias, A., & Pendias, H. (2001). Trace elements in soils and plants.(3rd
ed). New
York: CRC.
Khan, S.A., Khan, L., Hussain,I., Marwat, K.B., & Ashtray, N. (2008). Profile of heavy
metals in selected medicinal plants. Pakistan Journal of Weed Science Research,
14(1-2),101-110.
Knezevic M., Stankovic D., Krstic B., Nikolic M.S.,& Vilotic D. (2009). Concentrations
of heavy metals in soil and leaves of plant species Paulownia elongata and
Paulownia fortunei. African Journal of Biotechnology , 8 (20), 5422-5429.
Konstantinou, I. K & Albanies, T. A. (2002). A review on worldwide occurrence and
effects of antifouling paints booster on biocides in the aquatic environment”.
Environment International, 30(2), 235.
Krstic, B., Stankovi, D., Igi, R., & Nikoli, N. (2007). The potential of different plant
species for nickel accumulation. Journal of Biotechnology. And Biotechnology
Equipments, 21, 431-436.
University of Ghana http://ugspace.ug.edu.gh
96
Lead Action News (1993). http://www.lead.org.au/lanv1n2.html retrieved on the 12th
March 2013.
LEAD Group Inc. (2011). http://soil-environment.blogspot.in/search/label/heavymetals;
Lenntech (2012). http://www.lenntech.com/periodic/elements/ni.html. Retrieved on 29th
November 2012.
Lenntech (2013). http://www.lenntech.com/periodic/elements/cu.html. Retrieved on 13th
March 2013.
Lente I., Keraita B., Drechsel P., Ofusu-Anim J., and Brimah A.K., (2012). Risk
assessment of heavy metal contamination in vegetables grown in long-term
wastewater irrigated urban farming sites in Accra, Ghana. Water Quality Exposure
and Health, 4(4). 77-8
Li, J. H., Duan, H. B., & Shi, P. X. (2011). Heavy metal contamination of surface soil in
electronic waste dismantling area: site investigation and source-apportionment
analysis. Waste Management Research, 29, 727–738.
Lu, X., Wang, L., Lei, K., Huang J., & Zhai,Y. (2009). Contamination assessment of
copper, lead, zinc, manganese and nickel in street dust of Baoji, NW China,
Journal of Hazardous Material., 161,1058-1062.
Maobe, M. A.G., Gatebe, E., Gitu, L., & Rotich, H. (2012). Profile of Heavy Metals in
Selected Medicinal Plants Used for the Treatment of Diabetes, Malaria and
Pneumonia in Kisii Region, Southwest Kenya. Global Journal of Pharmacology, 6
(3), 245-251.
University of Ghana http://ugspace.ug.edu.gh
97
Mayo Medical Laboratories (2012). "Test ID: ASU. Arsenic, 24 Hour, Urine, Clinical
Information". Catalogue of Mayo
Clinic.http://www.mayomedicallaboratories.com/testcat.htm Retrieved 24-06-
2013.
McLaughlin , M. J., Parker D. R., & Clarke J. M. (2006). Metals and micronutrients - food
safety issues. Field Crops Research, 60( 1-2), 143–163.
Merwin, I., Pruyne, P.T., Ebel, J. G., Manzell, K. L., & Lisk, D. J.(1994). Persistence,
phytotoxicity, and management of arsenic, lead and mercury residues in old
orchard soils of New York State. Chemosphere, 29, 1361-1367.
Muller, G. (1969). Index of geoaccumulation in sediments of the Rhine River. Journal of
Geology, 2,108-118.
Muyssen, B. T. A., De Schamphelaere, K. A. C., & Janssen, C. R. (2006). Mechanisms
of chronic waterborne Zn toxicity in Daphnia magna. Aquatic
Toxicology, 77 (4),393 - 401.
National Institute of Environmental Health Sciences (NIEHS)(2002).
http://www.niehs.nih.gov/external/faq/landfill.html. Retrieved on 17th March
2011.
National Research Council (US)- Board on environmental Studies and Toxicology (2000).
Toxicological effect of methylmercury. National Academies Press.
O’Neill, P. (1995). Mercury. In Heavy Metals in Soils (2nd
ed.) (ed. B.J. Alloway).
London: Blackie Academic & Professional.
University of Ghana http://ugspace.ug.edu.gh
98
Odai, S.N., Mensah, E., Sipitey, D., Ryo, S., &Awuah E. (2008). Heavy metals uptake by
vegetables cultivated on urban waste dumpsites: case study of Kumasi, Ghana.
Research Journal of Environmental Toxicology, 2, 92–99.
Olawoyin, R., Oyewole, S. O., & Grayson, R. L., (2012). Potential risk effect from
elevated levels of soil heavy metals on human health in the Niger Delta.
Ecotoxicological Environment. Saf.,
Opaluwa, O.D., Aremu, M.O., Ogbo, L.O.,Abiola, K.A., Odiba, I.E., Abubakar, M. M., &
Nweze, N.O. (2012). Heavy metals concentration of soil, plant leaves and crops
grown around dump sites in Lafia metropolis, Nasara State, Nigeria, Pelagia
Research Library , Advances in Applied Science Research, 3 (2),80-784.
Otsuka, M., Ita, T., Asante, K. A., Muto, M., & Tanabe S. (2012). Trace element
contamination around the e-waste recycling site at Agbogbloshie, Accra City,
Ghana . Interdisciplinary Studies on Environmental Chemistry, 6,161 – 7.
Oxford University. Safety data for mercuric sulphide.
http://msds.chem.ox.ac.uk/ME/mercuric_sulphide.html. Retrieved 7th March 2013.
Paschotta, R. (2008). Encyclopedia of Laser Physics and Technology. Wiley VCH, 798.
Porter, F. C. (1994). Corrosion Resistance of Zinc and Zinc alloys. CRC Press, 121.
Radojevic, M. & Bashkin, V.N., (2006). Practical Environmental Analysis. Royal Society
of Chemistry. Cambridge.
Rai, D., Eary, L. E., & Zachara, J.M. (1989). Environmental chemistry of chromium.
Science of the Total Environment ,86, 15–23.
RAIS (2009). The Risk Assessment Information System.
http://rais.ornl.gov/tools/tox_profiles.html Retrieved on 13th
March 2012.
University of Ghana http://ugspace.ug.edu.gh
99
Reis, L.S.L.S., Pardo, P.E., Camargos and Oba, E. (2010). Mineral element and heavy
metal poisoning in animals. Journal of Medicine and Medical Sciences, 1(12), 560-
579.
retrieved on 18th
February 2013.
Ritchie, R. (2004). Chemistry (2nd
ed). Letts and Londale.
Robinson, B. H. (2009). E-waste: An assessment of global production and environmental
impacts. Science of the Total Environment,408, 183–191.
Rogalski, A. (2000). Infrared detectors. CRC Press.
Ross, D. S. & Kettering, Q. (2011). Recommended Method for Determining Soil Cation
Exchange Capacity, Cooperative Bulleting No. 493.
Schmidt, C. W. (2006). Unfair trade: e-waste in Africa. Environmental Health Perspect;
114, 32– 35.
Schmidt, C.W. (2002). E-junk explosion. Environmental Health Perspect, 110, 88 –94.
Sepulveda, A., Schluep, M., Renaud, F.G., Streicher, M., Kuehr, R., Hageluken, C., &
Gerecke, A. C. (2010). A review of the environmental fate and effects of hazardous
substances released from electrical and electronic equipments during recycling:
Examples from China and India. Environmental Impact Assessment.30, 28–41.
SESD Operating Procedure for Soil Sampling, SESD PROC-300-R2 , Most recent
version.
Sezgin, N., Ozcan, H.K., Demir G., Nemlioglu S., & Bayat C. (2003). Determination of
heavy metal concentrations in street dusts in Istanbul E-5 highway. Environment
International. 29, 979-985.
University of Ghana http://ugspace.ug.edu.gh
100
Shanker, A.K., Cervantes, C., Loza-Tavera, H., & Avudainayagamdet, S. (2005).
Chromium toxicity in plants. Environment International, 31, 739–753.
Singh , A., Sharma, R. K., Agrawal , M. & Marshall, F. M. (2010). Risk assessment of
heavy metal toxicity through contaminated vegetables from waste water irrigated
area of Varanasi, India. International Society for Tropical Ecology,51(2S): 375-
387.
Smith, J. L., & Doran J.W. (1996). Measurement and use of pH and electrical conductivity
for soil quality analysis. In Methods for assessing soil quality. Soil Science Society
of America Special Publication, 49, 169-182.
http://soilquality.org/indicators/soil_ph.html. Retrieved date 29th November 2012
Soon, J. K., & Bates T.E. (1982). Chemical pools of Cadmium, nickel and zinc in polluted
soils and some preliminary indications of their availability to plants. Journal of
Soil Science, 33, 477- 488.
Steinnes, E. (1995). Mercury. In Heavy Metals in Soils (2nd edn.) (ed. B.J. Alloway).
London: Blackie Academic & Professional.
Suciu, I., Cosma C., Todica M., Bolboaca, S. D., &Jantschi L. (2008). Analysis of soil
heavy metal pollution and pattern in Central Transylvania. International Journal
on Molecular Science, 9, 434-453.
Taylor, S. R., & McLennan, S.M. (1985). The Continental Crust: Its Composition and
Evolution. Blackwell Scientific Publications, Oxford.
Tee P.L (2002). Antioxidative properties of roselles (Hibiscus sabdariffa L.) in linoleic
acid model system. Nutrition & Food Science; 32 (1):17-20
University of Ghana http://ugspace.ug.edu.gh
101
The Lead Education and Abatement Design (LEAD) Group Incoporated (2011) .
http://www.lead.org.au/lg.las.mr.html Retrieved on 2nd
February 2013.
The Risk Assessment Information System., (RAIS) (2009).
http://rais.ornl.gov/tools/tox_profiles.html. Retrieved on 8th
January 2013.
Thorpe, A., & Harrison, R. M. (2008). A review of sources and properties of non-exhaust
particulate matter from road traffic. Science of the Total Environment. Article in
press.
Tseng, C.H., Chong, C. K., & Tseng, C. P. (2003). Long-term arsenic exposure and
ischemic heart disease in arseniasis-hyperendemic villages in Taiwan. Toxicol.
Lett.137 (1–2): 15–21.
Ullah, R., Khader, J.A., Hussain, I., AbdElsalam, N. M., Talha, M., & Khan, N. (2012).
Investigation of macro and micro-nutrients in selected medicinal plants. African
Journal of Pharmacy and Pharmacology, 6(25),1829-1832.
United Nations Environment Programme (UNEP) (2005). DEWA/GRID-Europe , e-waste,
the hidden side of IT equipment's manufacturing and use. Chapter 5- early warning
on emerging environmental threats. http :/ /www .grid.unep.ch/product/publication/
download /ew_ewaste.en.pdf.
United States Environmental Protection Agency (2005).Mercury: Spills, Disposal and Site
Cleanup. http://www.epa.gov/mercury/spills/index.html Retrieved 2012-09-27
Vaikosen, E. N., & Alade, G.O. (2011). Evaluation of pharmacognostical parameters and
heavy metals in some locally manufactured herbal drugs. Journal of Chemical and
Pharmaceutical Research, 3(2), 88-97.
University of Ghana http://ugspace.ug.edu.gh
102
Vanmechelen, L., Groenemens, R.,& van Raust, E. (1997). Forest soil condition in
Europe. Results of a large scale soil survey, Technical report. EC, UN/ECE,
Ministry of the Flemich Community, Brusseles, Geneva, 259.
Walkley, A., &Black I.A. (1934): An examination of the Degtajareff method for soil
organic matter determination and a proposed modification of the chronic acid
titration. Soil Science, 37, 29–38.
Wang, H., Han, M., Yang, S., Chen, Y., Liu, Q., & Ke, S. (2007). Urinary heavy metal
levels and relevant factors among people exposed to e-waste dismantling.
Environment International, 37, 80 – 85.
WHO/FAO (2001). Codex Alimentarius Commission. Food Additives and Contaminants.
Joint FAO/WHO Food standards Programme, ALINORM 10/12A: 1-289.
Fertilizer and their efficient use.
http://www.transpaktrading.com/static/pdf/research/achemistry/introTofertilizers.p
df retrieved on 20th
July, 2013
WHO/FAO(1989). Report of 33rd
meeting of joint WHO/FAO expect committee on food
addictives. Toxicological evaluation of certain foods additives and contaminants.
No. 24 International Program on chemical safety, WHO, Geneva
Widmer, R., Oswald-Krapf, H., Sinha-Khetriwal, D., Schnellmann, M., & Boni, H.
(2005). Global perspectives on e-waste. Environmental Impact Assessment. 25,
436–458.
Zahir, F., Rizwi S.J., Haq S. K., & Khan, R.H. (2005). Low dose mercury toxicity and
human health. Environmental Toxicology and Pharmacology, 20(2), 351–360.
University of Ghana http://ugspace.ug.edu.gh
103
Zhang, W. H., Wu, Y. X., & Simonnot, M. O. (2012). Soil contamination due to e-waste
disposal and recycling activities: A review with special focus on China.
Pedosphere, 21(4), 434–455.
Zhang, X. G. (1996). Corrossion and electrochemistry of zinc. Springer. 93.
Zupancic, M., Zupancic, M. J., Bukovec, P., & Šelih, V. S. (2008). Chromium in soil
layers and plants on closed landfill site after landfill leachate application. Waste
Management, 29, 1860–1869.
University of Ghana http://ugspace.ug.edu.gh
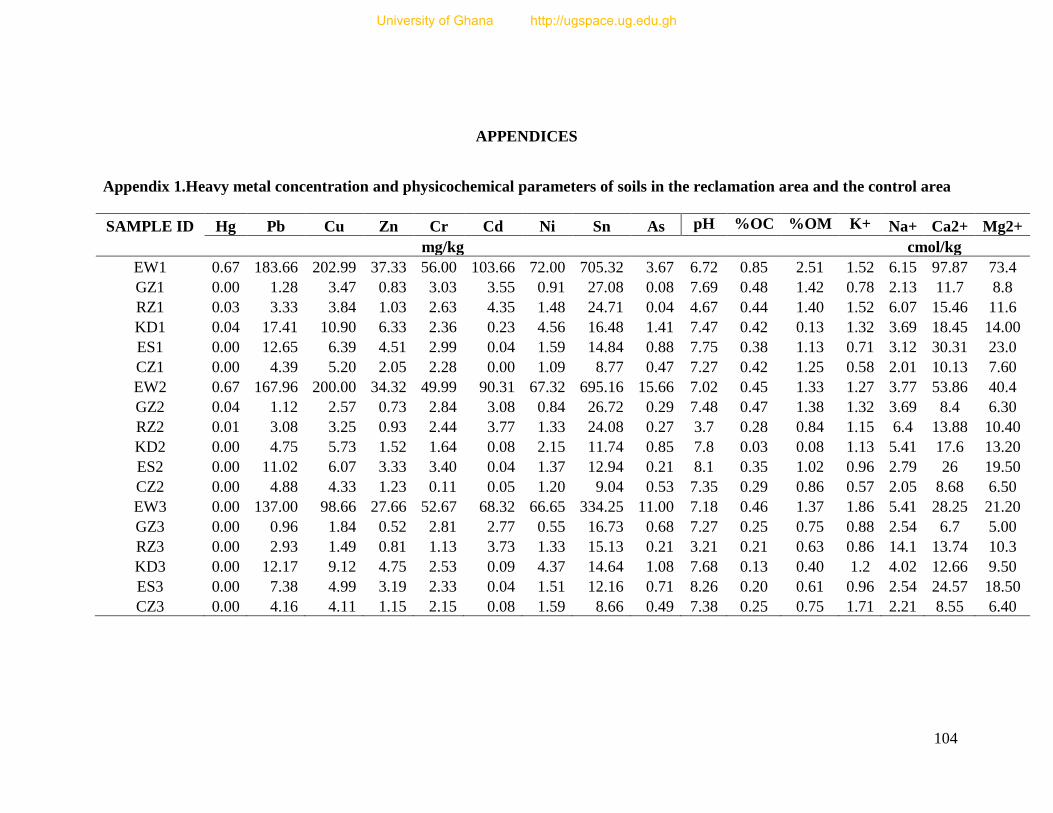
104
APPENDICES
Appendix 1.Heavy metal concentration and physicochemical parameters of soils in the reclamation area and the control area
SAMPLE ID Hg Pb Cu Zn Cr Cd Ni Sn As pH %OC %OM K+ Na+ Ca2+ Mg2+
mg/kg cmol/kg
EW1 0.67 183.66 202.99 37.33 56.00 103.66 72.00 705.32 3.67 6.72 0.85 2.51 1.52 6.15 97.87 73.4
GZ1 0.00 1.28 3.47 0.83 3.03 3.55 0.91 27.08 0.08 7.69 0.48 1.42 0.78 2.13 11.7 8.8
RZ1 0.03 3.33 3.84 1.03 2.63 4.35 1.48 24.71 0.04 4.67 0.44 1.40 1.52 6.07 15.46 11.6
KD1 0.04 17.41 10.90 6.33 2.36 0.23 4.56 16.48 1.41 7.47 0.42 0.13 1.32 3.69 18.45 14.00
ES1 0.00 12.65 6.39 4.51 2.99 0.04 1.59 14.84 0.88 7.75 0.38 1.13 0.71 3.12 30.31 23.0
CZ1 0.00 4.39 5.20 2.05 2.28 0.00 1.09 8.77 0.47 7.27 0.42 1.25 0.58 2.01 10.13 7.60
EW2 0.67 167.96 200.00 34.32 49.99 90.31 67.32 695.16 15.66 7.02 0.45 1.33 1.27 3.77 53.86 40.4
GZ2 0.04 1.12 2.57 0.73 2.84 3.08 0.84 26.72 0.29 7.48 0.47 1.38 1.32 3.69 8.4 6.30
RZ2 0.01 3.08 3.25 0.93 2.44 3.77 1.33 24.08 0.27 3.7 0.28 0.84 1.15 6.4 13.88 10.40
KD2 0.00 4.75 5.73 1.52 1.64 0.08 2.15 11.74 0.85 7.8 0.03 0.08 1.13 5.41 17.6 13.20
ES2 0.00 11.02 6.07 3.33 3.40 0.04 1.37 12.94 0.21 8.1 0.35 1.02 0.96 2.79 26 19.50
CZ2 0.00 4.88 4.33 1.23 0.11 0.05 1.20 9.04 0.53 7.35 0.29 0.86 0.57 2.05 8.68 6.50
EW3 0.00 137.00 98.66 27.66 52.67 68.32 66.65 334.25 11.00 7.18 0.46 1.37 1.86 5.41 28.25 21.20
GZ3 0.00 0.96 1.84 0.52 2.81 2.77 0.55 16.73 0.68 7.27 0.25 0.75 0.88 2.54 6.7 5.00
RZ3 0.00 2.93 1.49 0.81 1.13 3.73 1.33 15.13 0.21 3.21 0.21 0.63 0.86 14.1 13.74 10.3
KD3 0.00 12.17 9.12 4.75 2.53 0.09 4.37 14.64 1.08 7.68 0.13 0.40 1.2 4.02 12.66 9.50
ES3 0.00 7.38 4.99 3.19 2.33 0.04 1.51 12.16 0.71 8.26 0.20 0.61 0.96 2.54 24.57 18.50
CZ3 0.00 4.16 4.11 1.15 2.15 0.08 1.59 8.66 0.49 7.38 0.25 0.75 1.71 2.21 8.55 6.40
University of Ghana http://ugspace.ug.edu.gh
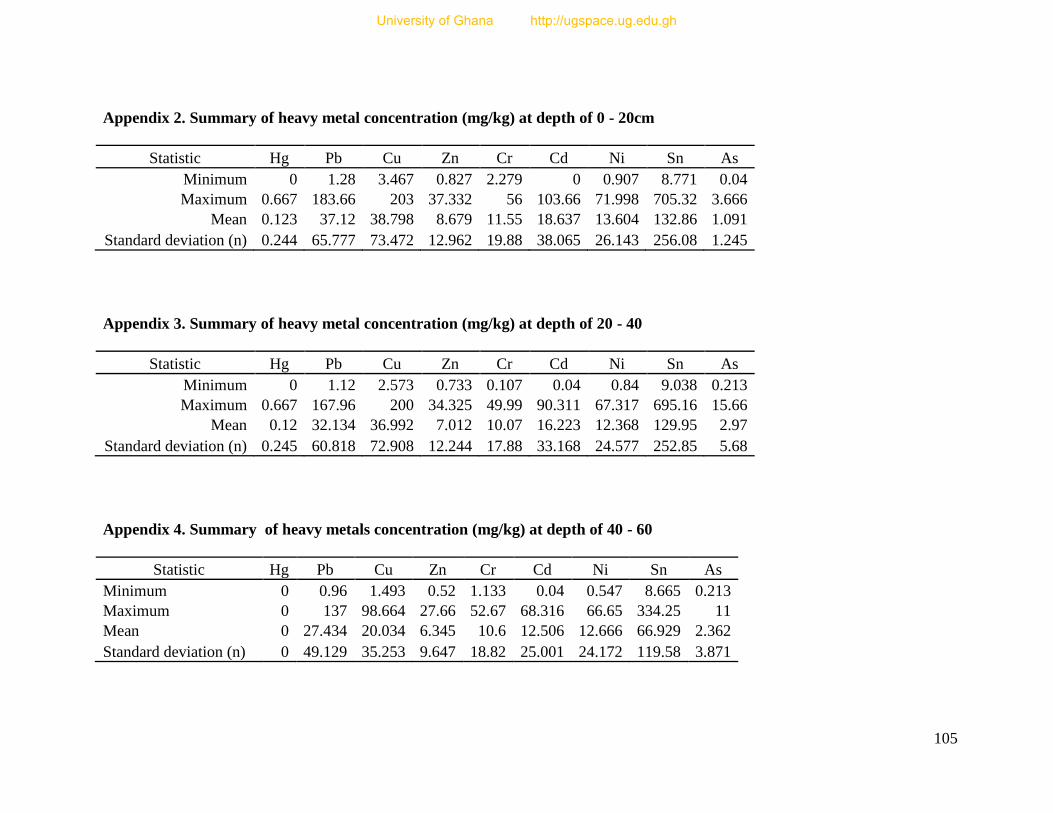
105
Appendix 2. Summary of heavy metal concentration (mg/kg) at depth of 0 - 20cm
Statistic Hg Pb Cu Zn Cr Cd Ni Sn As
Minimum 0 1.28 3.467 0.827 2.279 0 0.907 8.771 0.04
Maximum 0.667 183.66 203 37.332 56 103.66 71.998 705.32 3.666
Mean 0.123 37.12 38.798 8.679 11.55 18.637 13.604 132.86 1.091
Standard deviation (n) 0.244 65.777 73.472 12.962 19.88 38.065 26.143 256.08 1.245
Appendix 3. Summary of heavy metal concentration (mg/kg) at depth of 20 - 40
Statistic Hg Pb Cu Zn Cr Cd Ni Sn As
Minimum 0 1.12 2.573 0.733 0.107 0.04 0.84 9.038 0.213
Maximum 0.667 167.96 200 34.325 49.99 90.311 67.317 695.16 15.66
Mean 0.12 32.134 36.992 7.012 10.07 16.223 12.368 129.95 2.97
Standard deviation (n) 0.245 60.818 72.908 12.244 17.88 33.168 24.577 252.85 5.68
Appendix 4. Summary of heavy metals concentration (mg/kg) at depth of 40 - 60
Statistic Hg Pb Cu Zn Cr Cd Ni Sn As
Minimum 0 0.96 1.493 0.52 1.133 0.04 0.547 8.665 0.213
Maximum 0 137 98.664 27.66 52.67 68.316 66.65 334.25 11
Mean 0 27.434 20.034 6.345 10.6 12.506 12.666 66.929 2.362
Standard deviation (n) 0 49.129 35.253 9.647 18.82 25.001 24.172 119.58 3.871
University of Ghana http://ugspace.ug.edu.gh
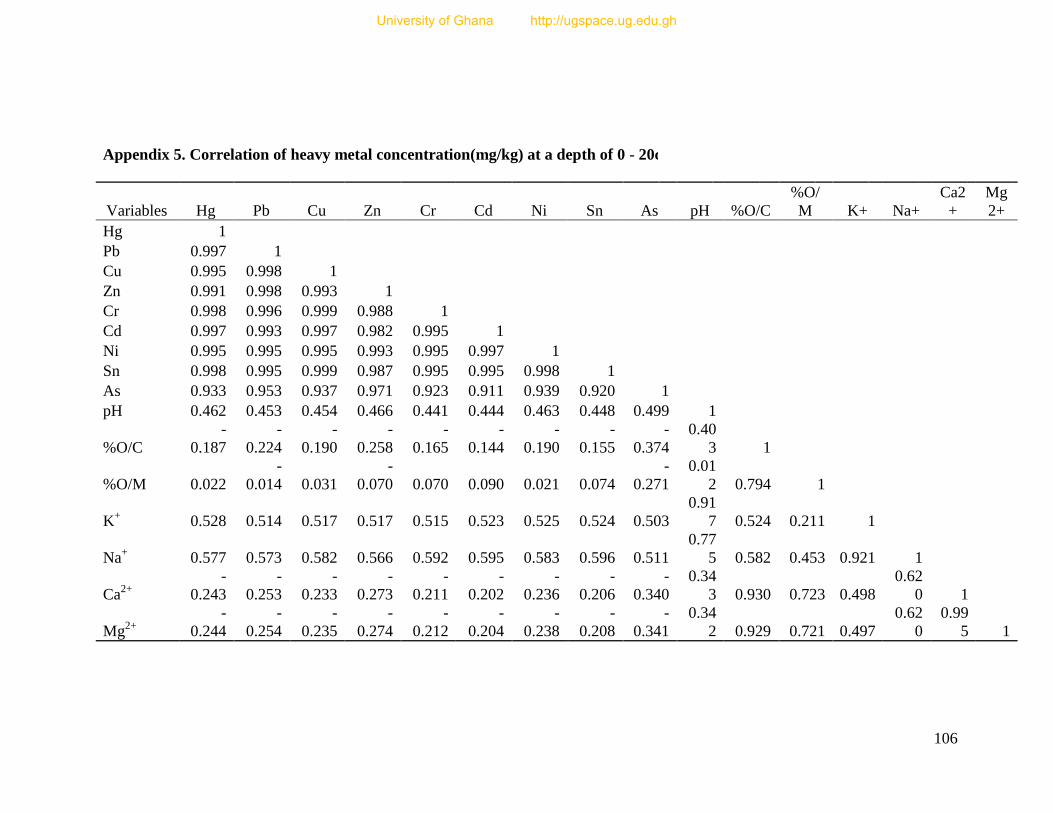
106
Appendix 5. Correlation of heavy metal concentration(mg/kg) at a depth of 0 - 20cm
Variables Hg Pb Cu Zn Cr Cd Ni Sn As pH %O/C
%O/
M K+ Na+
Ca2
+
Mg
2+
Hg 1
Pb 0.997 1
Cu 0.995 0.998 1
Zn 0.991 0.998 0.993 1
Cr 0.998 0.996 0.999 0.988 1
Cd 0.997 0.993 0.997 0.982 0.995 1
Ni 0.995 0.995 0.995 0.993 0.995 0.997 1
Sn 0.998 0.995 0.999 0.987 0.995 0.995 0.998 1
As 0.933 0.953 0.937 0.971 0.923 0.911 0.939 0.920 1
pH 0.462 0.453 0.454 0.466 0.441 0.444 0.463 0.448 0.499 1
%O/C
-
0.187
-
0.224
-
0.190
-
0.258
-
0.165
-
0.144
-
0.190
-
0.155
-
0.374
0.40
3 1
%O/M 0.022
-
0.014 0.031
-
0.070 0.070 0.090 0.021 0.074
-
0.271
0.01
2 0.794 1
K+ 0.528 0.514 0.517 0.517 0.515 0.523 0.525 0.524 0.503
0.91
7 0.524 0.211 1
Na+ 0.577 0.573 0.582 0.566 0.592 0.595 0.583 0.596 0.511
0.77
5 0.582 0.453 0.921 1
Ca2+
-
0.243
-
0.253
-
0.233
-
0.273
-
0.211
-
0.202
-
0.236
-
0.206
-
0.340
0.34
3 0.930 0.723 0.498
0.62
0 1
Mg2+
-
0.244
-
0.254
-
0.235
-
0.274
-
0.212
-
0.204
-
0.238
-
0.208
-
0.341
0.34
2 0.929 0.721 0.497
0.62
0
0.99
5 1
University of Ghana http://ugspace.ug.edu.gh
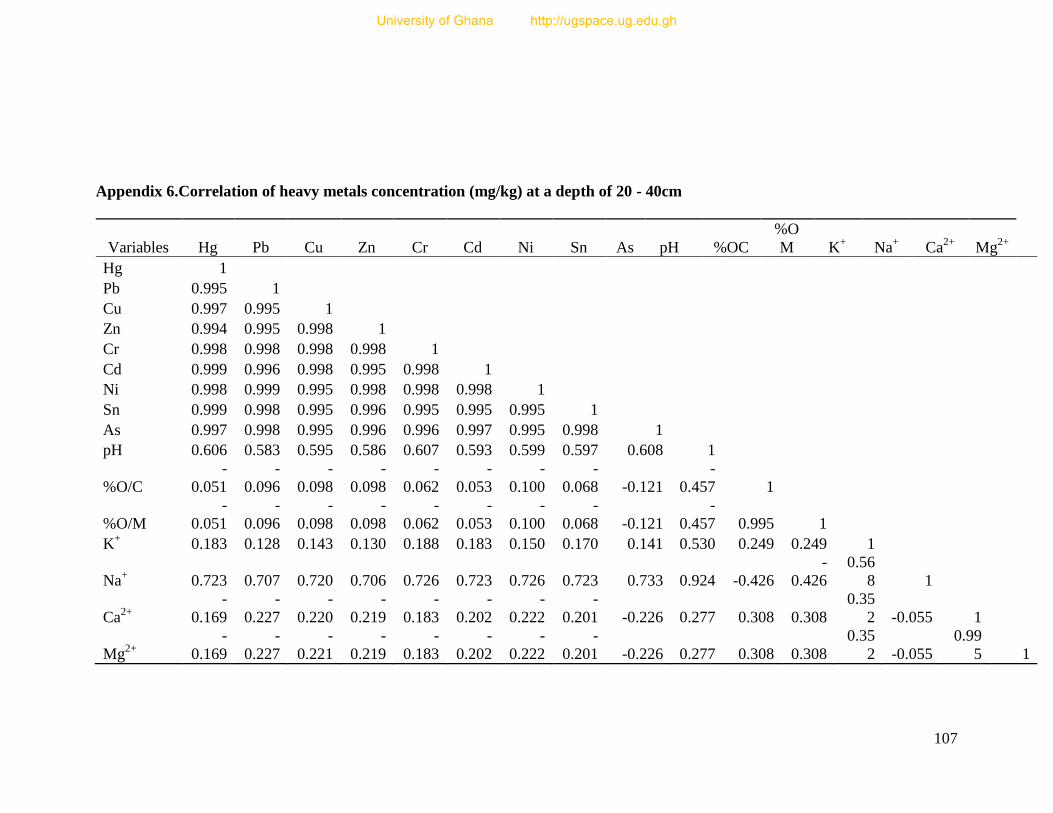
107
Appendix 6.Correlation of heavy metals concentration (mg/kg) at a depth of 20 - 40cm
Variables Hg Pb Cu Zn Cr Cd Ni Sn As pH %OC
%O
M K+ Na
+ Ca
2+ Mg
2+
Hg 1
Pb 0.995 1
Cu 0.997 0.995 1
Zn 0.994 0.995 0.998 1
Cr 0.998 0.998 0.998 0.998 1
Cd 0.999 0.996 0.998 0.995 0.998 1
Ni 0.998 0.999 0.995 0.998 0.998 0.998 1
Sn 0.999 0.998 0.995 0.996 0.995 0.995 0.995 1
As 0.997 0.998 0.995 0.996 0.996 0.997 0.995 0.998 1
pH 0.606 0.583 0.595 0.586 0.607 0.593 0.599 0.597 0.608 1
%O/C
-
0.051
-
0.096
-
0.098
-
0.098
-
0.062
-
0.053
-
0.100
-
0.068 -0.121
-
0.457 1
%O/M
-
0.051
-
0.096
-
0.098
-
0.098
-
0.062
-
0.053
-
0.100
-
0.068 -0.121
-
0.457 0.995 1
K+ 0.183 0.128 0.143 0.130 0.188 0.183 0.150 0.170 0.141 0.530 0.249 0.249 1
Na+ 0.723 0.707 0.720 0.706 0.726 0.723 0.726 0.723 0.733 0.924 -0.426
-
0.426
0.56
8 1
Ca2+
-
0.169
-
0.227
-
0.220
-
0.219
-
0.183
-
0.202
-
0.222
-
0.201 -0.226 0.277 0.308 0.308
0.35
2 -0.055 1
Mg2+
-
0.169
-
0.227
-
0.221
-
0.219
-
0.183
-
0.202
-
0.222
-
0.201 -0.226 0.277 0.308 0.308
0.35
2 -0.055
0.99
5 1
University of Ghana http://ugspace.ug.edu.gh
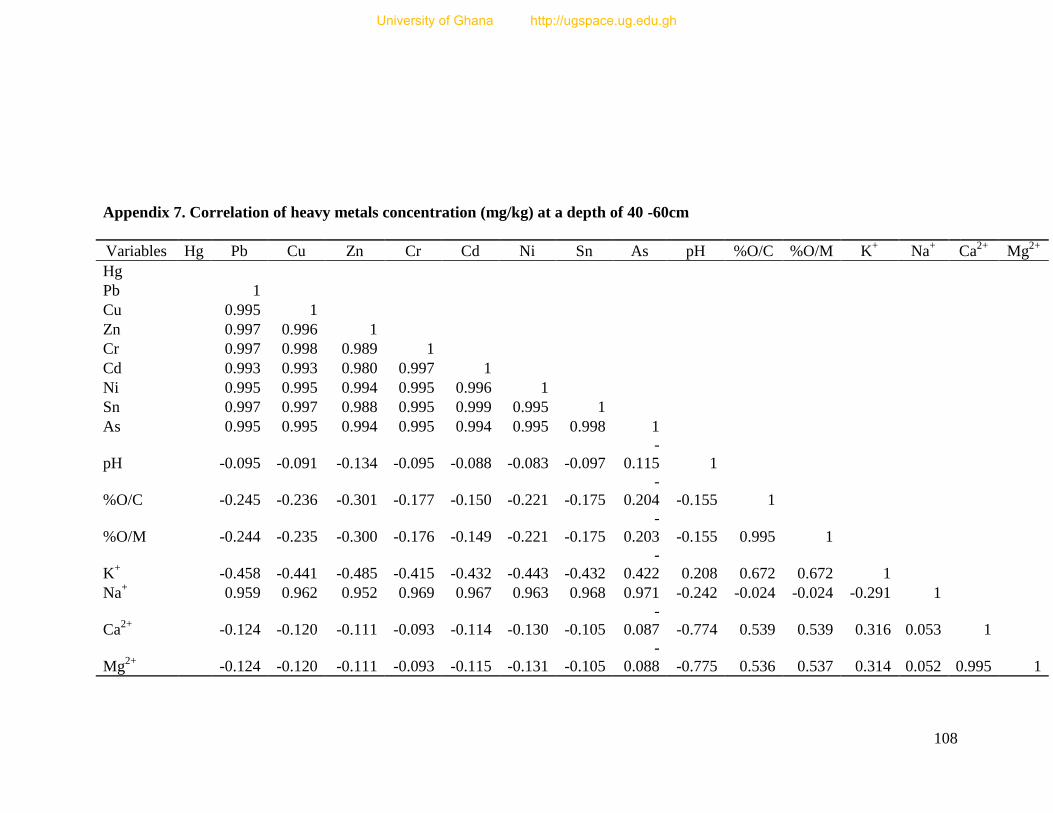
108
Appendix 7. Correlation of heavy metals concentration (mg/kg) at a depth of 40 -60cm
Variables Hg Pb Cu Zn Cr Cd Ni Sn As pH %O/C %O/M K+ Na
+ Ca
2+ Mg
2+
Hg
Pb
1
Cu
0.995 1
Zn
0.997 0.996 1
Cr
0.997 0.998 0.989 1
Cd
0.993 0.993 0.980 0.997 1
Ni
0.995 0.995 0.994 0.995 0.996 1
Sn
0.997 0.997 0.988 0.995 0.999 0.995 1
As
0.995 0.995 0.994 0.995 0.994 0.995 0.998 1
pH
-0.095 -0.091 -0.134 -0.095 -0.088 -0.083 -0.097
-
0.115 1
%O/C
-0.245 -0.236 -0.301 -0.177 -0.150 -0.221 -0.175
-
0.204 -0.155 1
%O/M
-0.244 -0.235 -0.300 -0.176 -0.149 -0.221 -0.175
-
0.203 -0.155 0.995 1
K+
-0.458 -0.441 -0.485 -0.415 -0.432 -0.443 -0.432
-
0.422 0.208 0.672 0.672 1
Na+
0.959 0.962 0.952 0.969 0.967 0.963 0.968 0.971 -0.242 -0.024 -0.024 -0.291 1
Ca2+
-0.124 -0.120 -0.111 -0.093 -0.114 -0.130 -0.105
-
0.087 -0.774 0.539 0.539 0.316 0.053 1
Mg2+
-0.124 -0.120 -0.111 -0.093 -0.115 -0.131 -0.105
-
0.088 -0.775 0.536 0.537 0.314 0.052 0.995 1
University of Ghana http://ugspace.ug.edu.gh
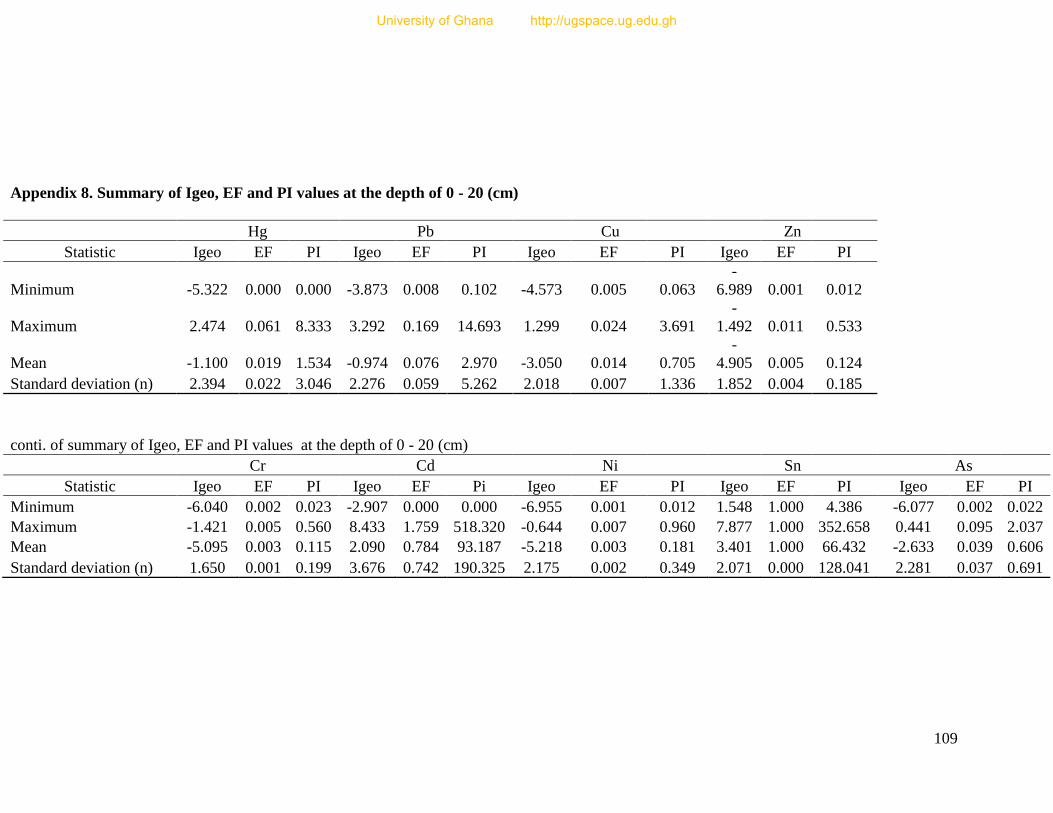
109
Appendix 8. Summary of Igeo, EF and PI values at the depth of 0 - 20 (cm)
Hg Pb Cu Zn
Statistic Igeo EF PI Igeo EF PI Igeo EF PI Igeo EF PI
Minimum -5.322 0.000 0.000 -3.873 0.008 0.102 -4.573 0.005 0.063
-
6.989 0.001 0.012
Maximum 2.474 0.061 8.333 3.292 0.169 14.693 1.299 0.024 3.691
-
1.492 0.011 0.533
Mean -1.100 0.019 1.534 -0.974 0.076 2.970 -3.050 0.014 0.705
-
4.905 0.005 0.124
Standard deviation (n) 2.394 0.022 3.046 2.276 0.059 5.262 2.018 0.007 1.336 1.852 0.004 0.185
conti. of summary of Igeo, EF and PI values at the depth of 0 - 20 (cm)
Cr Cd Ni Sn As
Statistic Igeo EF PI Igeo EF Pi Igeo EF PI Igeo EF PI Igeo EF PI
Minimum -6.040 0.002 0.023 -2.907 0.000 0.000 -6.955 0.001 0.012 1.548 1.000 4.386 -6.077 0.002 0.022
Maximum -1.421 0.005 0.560 8.433 1.759 518.320 -0.644 0.007 0.960 7.877 1.000 352.658 0.441 0.095 2.037
Mean -5.095 0.003 0.115 2.090 0.784 93.187 -5.218 0.003 0.181 3.401 1.000 66.432 -2.633 0.039 0.606
Standard deviation (n) 1.650 0.001 0.199 3.676 0.742 190.325 2.175 0.002 0.349 2.071 0.000 128.041 2.281 0.037 0.691
University of Ghana http://ugspace.ug.edu.gh
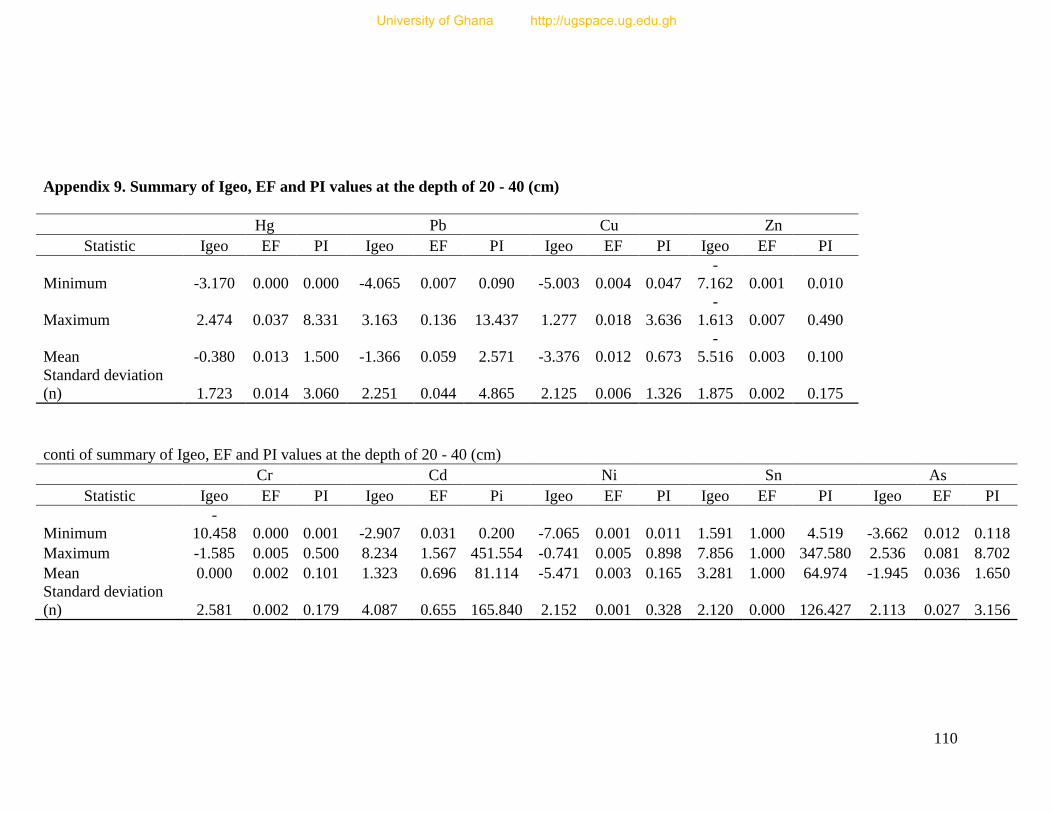
110
Appendix 9. Summary of Igeo, EF and PI values at the depth of 20 - 40 (cm)
Hg Pb Cu Zn
Statistic Igeo EF PI Igeo EF PI Igeo EF PI Igeo EF PI
Minimum -3.170 0.000 0.000 -4.065 0.007 0.090 -5.003 0.004 0.047
-
7.162 0.001 0.010
Maximum 2.474 0.037 8.331 3.163 0.136 13.437 1.277 0.018 3.636
-
1.613 0.007 0.490
Mean -0.380 0.013 1.500 -1.366 0.059 2.571 -3.376 0.012 0.673
-
5.516 0.003 0.100
Standard deviation
(n) 1.723 0.014 3.060 2.251 0.044 4.865 2.125 0.006 1.326 1.875 0.002 0.175
conti of summary of Igeo, EF and PI values at the depth of 20 - 40 (cm)
Cr Cd Ni Sn As
Statistic Igeo EF PI Igeo EF Pi Igeo EF PI Igeo EF PI Igeo EF PI
Minimum
-
10.458 0.000 0.001 -2.907 0.031 0.200 -7.065 0.001 0.011 1.591 1.000 4.519 -3.662 0.012 0.118
Maximum -1.585 0.005 0.500 8.234 1.567 451.554 -0.741 0.005 0.898 7.856 1.000 347.580 2.536 0.081 8.702
Mean 0.000 0.002 0.101 1.323 0.696 81.114 -5.471 0.003 0.165 3.281 1.000 64.974 -1.945 0.036 1.650
Standard deviation
(n) 2.581 0.002 0.179 4.087 0.655 165.840 2.152 0.001 0.328 2.120 0.000 126.427 2.113 0.027 3.156
University of Ghana http://ugspace.ug.edu.gh
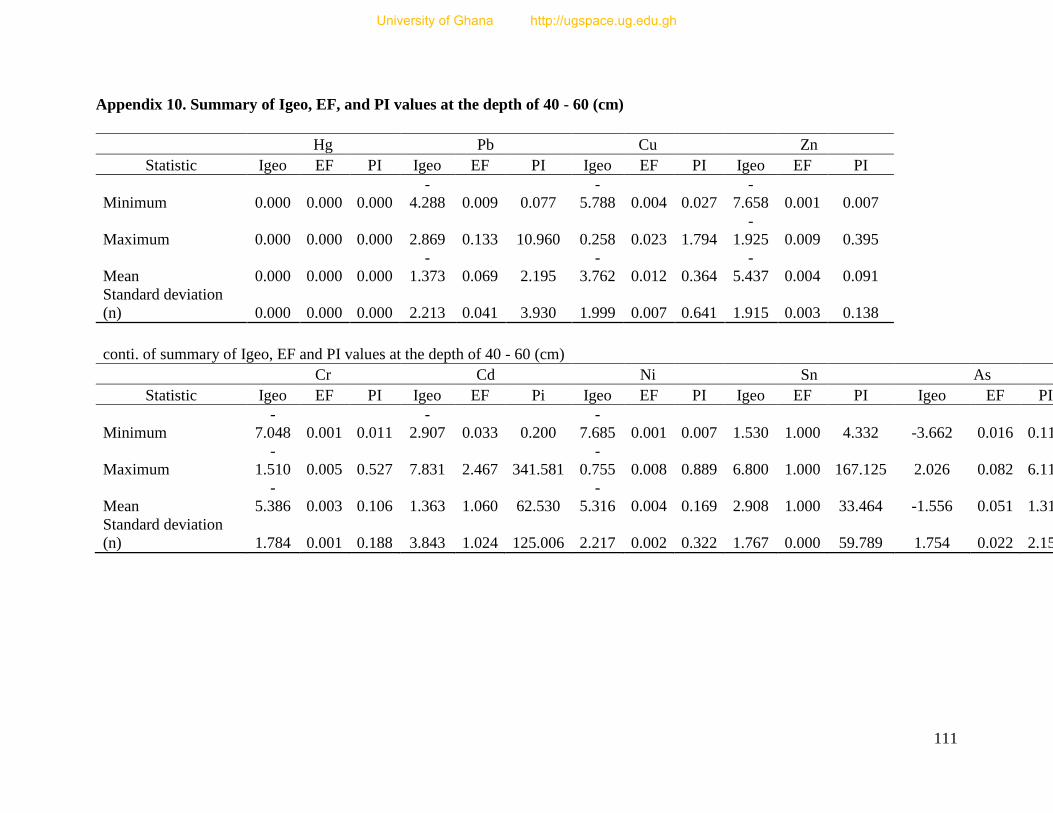
111
Appendix 10. Summary of Igeo, EF, and PI values at the depth of 40 - 60 (cm)
Hg Pb Cu Zn
Statistic Igeo EF PI Igeo EF PI Igeo EF PI Igeo EF PI
Minimum 0.000 0.000 0.000
-
4.288 0.009 0.077
-
5.788 0.004 0.027
-
7.658 0.001 0.007
Maximum 0.000 0.000 0.000 2.869 0.133 10.960 0.258 0.023 1.794
-
1.925 0.009 0.395
Mean 0.000 0.000 0.000
-
1.373 0.069 2.195
-
3.762 0.012 0.364
-
5.437 0.004 0.091
Standard deviation
(n) 0.000 0.000 0.000 2.213 0.041 3.930 1.999 0.007 0.641 1.915 0.003 0.138
conti. of summary of Igeo, EF and PI values at the depth of 40 - 60 (cm)
Cr Cd Ni Sn As
Statistic Igeo EF PI Igeo EF Pi Igeo EF PI Igeo EF PI Igeo EF PI
Minimum
-
7.048 0.001 0.011
-
2.907 0.033 0.200
-
7.685 0.001 0.007 1.530 1.000 4.332 -3.662 0.016 0.119
Maximum
-
1.510 0.005 0.527 7.831 2.467 341.581
-
0.755 0.008 0.889 6.800 1.000 167.125 2.026 0.082 6.110
Mean
-
5.386 0.003 0.106 1.363 1.060 62.530
-
5.316 0.004 0.169 2.908 1.000 33.464 -1.556 0.051 1.312
Standard deviation
(n) 1.784 0.001 0.188 3.843 1.024 125.006 2.217 0.002 0.322 1.767 0.000 59.789 1.754 0.022 2.150
University of Ghana http://ugspace.ug.edu.gh
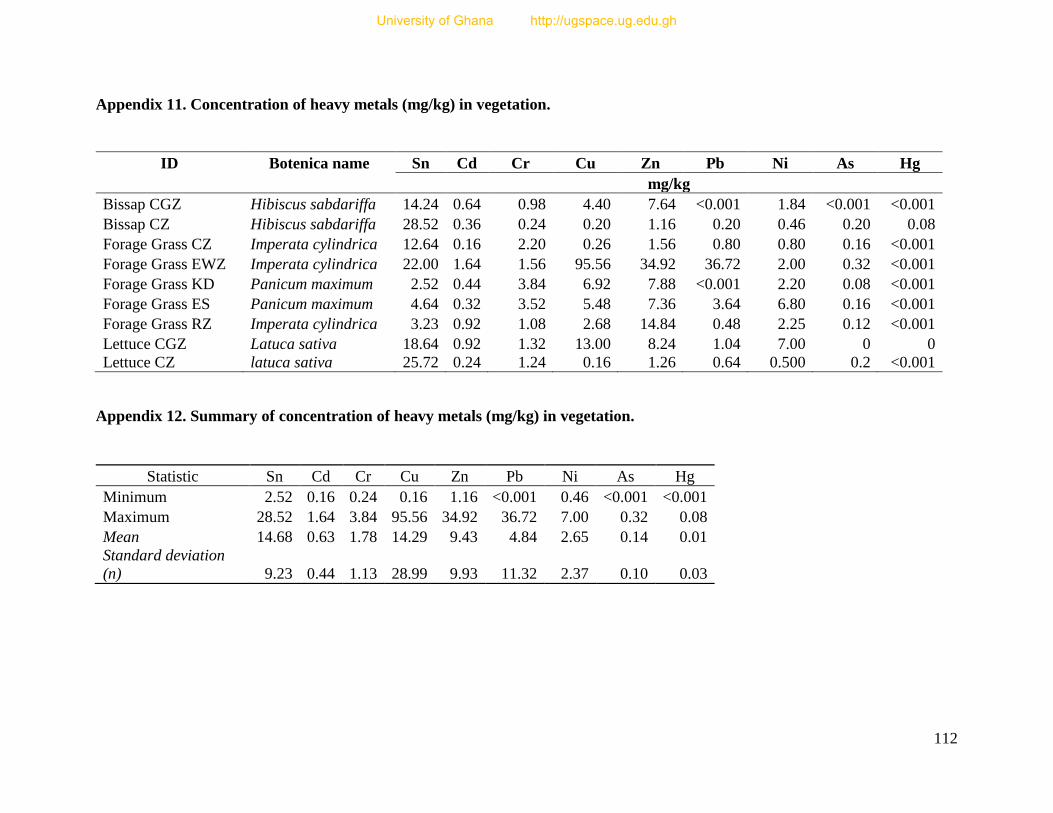
112
Appendix 11. Concentration of heavy metals (mg/kg) in vegetation.
ID Botenica name Sn Cd Cr Cu Zn Pb Ni As Hg
mg/kg
Bissap CGZ Hibiscus sabdariffa 14.24 0.64 0.98 4.40 7.64 <0.001 1.84 <0.001 <0.001
Bissap CZ Hibiscus sabdariffa 28.52 0.36 0.24 0.20 1.16 0.20 0.46 0.20 0.08
Forage Grass CZ Imperata cylindrica 12.64 0.16 2.20 0.26 1.56 0.80 0.80 0.16 <0.001
Forage Grass EWZ Imperata cylindrica 22.00 1.64 1.56 95.56 34.92 36.72 2.00 0.32 <0.001
Forage Grass KD Panicum maximum 2.52 0.44 3.84 6.92 7.88 <0.001 2.20 0.08 <0.001
Forage Grass ES Panicum maximum 4.64 0.32 3.52 5.48 7.36 3.64 6.80 0.16 <0.001
Forage Grass RZ Imperata cylindrica 3.23 0.92 1.08 2.68 14.84 0.48 2.25 0.12 <0.001
Lettuce CGZ Latuca sativa 18.64 0.92 1.32 13.00 8.24 1.04 7.00 0 0
Lettuce CZ latuca sativa 25.72 0.24 1.24 0.16 1.26 0.64 0.500 0.2 <0.001
Appendix 12. Summary of concentration of heavy metals (mg/kg) in vegetation.
Statistic Sn Cd Cr Cu Zn Pb Ni As Hg
Minimum 2.52 0.16 0.24 0.16 1.16 <0.001 0.46 <0.001 <0.001
Maximum 28.52 1.64 3.84 95.56 34.92 36.72 7.00 0.32 0.08
Mean 14.68 0.63 1.78 14.29 9.43 4.84 2.65 0.14 0.01
Standard deviation
(n) 9.23 0.44 1.13 28.99 9.93 11.32 2.37 0.10 0.03
University of Ghana http://ugspace.ug.edu.gh