an assessment of cross-contamination issues in the context of chemical and pharmaceutical
TRANSCRIPT

An Assessment of Cross-contamination Issues in the
Context of Chemical and Pharmaceutical Processes
Using a Continuous Oscillatory Baffled Reactor
Ricardo Luis Franco de Caldeira
Thesis submitted for the degree of Doctor of Philosophy to Heriot-Watt University, Edinburgh, UK
on the completion of research in the Centre for Oscillatory Baffled Reactor Application (COBRA)
School of Engineering and Physical Sciences Chemical Engineering
July 2010
The copyright in this thesis is owned by the author. Any quotation from the thesis or
use of any of the information contained in it must acknowledge this thesis as the
source of the quotation or information.

i
Abstract
Past research in oscillatory baffled reactors has shown that there are significant
technological and business advantages in using such reactor technology in fine chemical
and pharmaceutical industries: shorter reaction times, fewer by-products, uniform
product quality and higher yields, while at the same time with a significant saving in
space, capital and running costs.
This project focused on the robustness and adaptability of the continuous
oscillatory baffled reactor (COBR) for a large spectrum of chemical reactions that are
performed in very different fields of industry: from cosmetics and fine chemicals to
pharmaceutical products. In particular, the emphasis was on cross contamination issues
which may occur when different reactions are performed in a tandem fashion in this
reactor.
The experimental results indicate that the COBR is well suited to a broad
spectrum of chemical reactions, as well as for crystallization operations. During the
continuous production of a fine chemical and two active pharmaceutical ingredients in
tandem the conditions inside the reactor remained stable and were easily controlled. The
minimal amounts of contaminants present and the high quality of the products obtained
are a testament to the consistent operation and robust nature of the COBR.
The three production phases were interspersed with a well-defined cleaning
procedure. The established cleaning protocol is simple, efficient and fast, while the
amount of waste generated is minimized. The cleaning kinetics is of first order, which is
consistent with previous work.
The results reported in this thesis show that the COBR, which incorporates
quality-by-design principles, is a suitable alternative to current mixing technologies and
can be readily assimilated into a variety of fine chemical and pharmaceutical
manufacturing processes.

ii
Dedicated to my family, in particular to my father
and to Reem, for her unreserved love and support

iii
Acknowledgments
I would like to acknowledge the importance of Prof. Xiong-Wei Ni, my
supervisor, to the work presented in here. Prof. Ni has always accompanied and guided
me with his sound advice, giving me the motivation necessary when I most needed it.
I wish to thank everyone at NiTech Solutions, Ltd. – especially Dr. Lihua Zhao,
my second supervisor, and Brian McDonald, Operations Engineer, for their continuous
support. They were always available for me when I needed their valuable input. I also
wish to thank all the support NiTech Solutions, Ltd. gave me and for allowing me to use
their HPLC instrumentation. A word of appreciation is also due to the staff at the
School of Engineering and Physical Sciences for letting me use their instrumentation
and for being very helpful when needed.
Special thanks to my family, who throughout my stay in Scotland were always
there to support me. My father, who in sickness has never lost the willingness to fight
for his life, is my role model. He taught me how insignificant mundane problems are,
and with his recommendations and advice showed me how to succeed in life.
Thanks are also due to EPSRC and NiTech Solutions Ltd for the necessary
financial support to pursue my PhD.

iv
Table of Contents
Abstract ................................................................................................ i
Dedication ............................................................................................ ii
Acknowledgement ................................................................................. iii
Table of Contents .................................................................................. iv
List of Figures ...................................................................................... viii
List of Tables ........................................................................................ xiii
List of Abbreviations ............................................................................. xiv
List of General Nomenclature ............................................................... xvi
List of Greek Symbols ............................................................................ xvii
List of Publications ............................................................................... xviii
CHAPTER 1 - INTRODUCTION
1.1 – Mixing Technology, OBR and COBR ......................... 1
1.2 – Motivation and Structure of the Project ....................... 5
CHAPTER 2 – LITERATURE REVIEW
2.1 – OBR and COBR ............................................................. 7
2.1.1 – OBR................................................................................. 9
2.1.1.a – Flow characteristics.......................................... 9
2.1.1.b – Geometrical parameters and operating conditions……...............................................
10
2.1.1.c – Heat and mass transfer….................................... 12
2.1.1.d – Numerical and simulation studies in OBR ....... 13
2.1.1.e – Applications ........................................................ 14
2.1.2 – COBR……....................................................................... 15
2.1.2.a – Residence time distribution (RTD)….................. 15
2.1.2.b – Heat and mass transfer….................................... 15
2.1.2.c – Scale-up/down….................................................. 16

v
2.1.2.d – Applications……................................................. 16
2.2 – Fouling and cross-contamination ...................................
2.2.1 – Fouling and Encrustation…….........................................
18
18
2.2.2 – Cross contamination……................................................. 24
2.3 – Fouling Prevention and Cleaning .................................. 25
2.3.1 – The Cleaning Continuum……......................................... 27
2.4 – From quality-by-analysis to quality-by-design ............ 29
2.5 – Regulatory Bodies and Good Manufacturing Practices . 31
2.6 – Acceptable Limits of Cross-Contamination .................. 34
2.7 – Summary ........................................................................ 36
CHAPTER 3 – EXPERIMENTAL APPARATUS
3.1 – The Setup of OBR ......................................................... 38
3.2 – The Setup of COBR ....................................................... 40
3.3 – Materials ......................................................................... 45
3.3.1 – Bis(2,4,6-trichlorophenyl) oxalate................................... 45
3.3.2 – Methyl diantilis................................................................ 45
3.3.3 – Vanisal sodium................................................................. 46
3.3.4 – Acetylsalicylic Acid......................................................... 46
3.3.5 – Paracetamol...................................................................... 46
3.4 – Analytic Equipment ........................................................ 47
3.4.1 – Infrared Spectroscopy...................................................... 47
3.4.2 – Nuclear Magnetic Resonance Spectroscopy.................. 48
3.4.3 – High Performance Liquid Chromatography.................... 48
3.4.4 – Scanning Electron Microscopy........................................ 49
3.4.5 – X-Ray Diffractometry...................................................... 50
3.3.6 – Particle Size Distribution……......................................... 50

vi
CHAPTER 4 – CHEMISTRY SCREENING
4.1 – Chemistries excluded ...................................................... 53
4.1.1 – Warfarin sodium.............................................................. 53
4.1.2 – Nitisinone......................................................................... 55
4.1.3 – Tesmilifene....................................................................... 56
4.1.2 – Acamprosate sodium........................................................ 56
4.2 – Chemistries selected........................................................ 57
4.2.1 – Bis(2,4,6-trichlorophenyl) oxalate................................... 60
4.2.1.a – Synthesis of bis(2,4,6-trichlorophenyl) oxalate..... 61
4.2.1.b – Results................................................................... 62
4.2.2 – Methyl diantilis................................................................ 65
4.2.2.a – Synthesis of methyl diantilis.................................. 66
4.2.2.b – Results................................................................... 67
4.2.3 – Vanisal sodium................................................................. 76
4.2.3.a – Synthesis of vanisal sodium.................................. 77
4.2.3.b – Results................................................................... 78
4.2.4 – Acetylsalicylic acid.......................................................... 81
4.2.4.a – Synthesis of acetylsalicylic acid........................... 83
4.2.4.b – Results................................................................... 83
4.2.5 – Paracetamol…….............................................................. 86
4.2.5.a – Synthesis of paracetamol....................................... 88
4.2.5.b – Results................................................................... 88
4.3 – Summary ....................................................................... 92
CHAPTER 5 – COBR EXPERIMENTS
5.1 – Mixing and Residence Time Distribution ...................... 93
5.2 – Vanisal Sodium .............................................................. 97
5.2.1 – Experimental Method....................................................... 97
5.2.2 – Results.............................................................................. 98
5.3 – Acetylsalicylic acid ........................................................ 104
5.3.1 – Experimental Method....................................................... 104

vii
5.3.2 – Results……...................................................................... 105
5.4 – Paracetamol ................................................................... 113
5.4.1 – Experimental Method……............................................... 113
5.4.2 – Results.............................................................................. 114
5.5 – Summary ....................................................................... 125
CHAPTER 6 – CONCLUSIONS AND RECOMMENDATIONS FOR
FUTURE WORK
6.1 – Conclusions ................................................................... 126
6.2 – Recommendations for Future Work ............................... 128
Appendix A – cGMP Regulations and Guidelines and Compliance Actions...
130
Appendix B – HPLC Chromatograms (Aspirin OBR Experiments)................ 140
Appendix C – HPLC Chromatograms (Paracetamol OBR Experiments)......... 144
References ............................................................................................. 148

viii
List of Figures Figure 1.1 Flow pattern in an OBR operating with oscillation; a) down
stroke,b) up stroke.
4
Figure 2.1 Scheme of Van Dick’s reciprocating plate column
8
Figure 2.2
Number of publications containing the words “oscillatory” and “baffled”, according to ISI Web of Knowledge
9
Figure 2.3 Schematic representation of an OBR. di – reactor internal diameter, δ – baffle thickness, L – baffles spacing, d0 – orifice diameter
11
Figure 2.4 The COBR installed in James Robinson Ltd’s plant is considerably smaller than the STR it replaced
17
Figure 3.1 Photo of the batch OBR
39
Figure 3.2 Scheme of the OBR
39
Figure 3.3 Photo of the COBR
41
Figure 3.4 Layout of the COBR
42
Figure 3.5 The Copley Controls XTA38 actuator
42
Figure 3.6 The Watson-Marlow 520S peristaltic pump, used to pump starting materials to the COBR
43
Figure 3.7 The batch OBR feeder
44
Figure 3.8 Grant W28 water bath
44
Figure 3.9 Perkin Elmer Spectrum FT-IR system used (Organic Chemistry Laboratory, Heriot-Watt University)
47
Figure 3.10 Bruker DPX400 NMR spectrometer
48
Figure 3.11 Varian Prostar 230 used for HPLC analysis
49
Figure 3.12 Hitachi S-2700 Microscope used for SEM analysis
49
Figure 3.13 Bruker D8Discover transmission X-ray diffractometer used for XRD analysis
50
Figure 3.14 Malvern Mastersizer S used for particle size distribution studies
51
Figure 4.1 Synthesis of warfarin sodium
54

ix
Figure 4.2 Synthesis of nitisinone 55 Figure 4.3 Synthesis of tesmilifene 56 Figure 4.4 Synthesis of acamprosate calcium 57 Figure 4.5 Western European Cosmetics and Toiletries Market sales in 2005
and the World Pharmaceutical Market in 2007, in COLIPA 2008 and EFPIA 2009 (adapted)
59
Figure 4.6 Synthesis of bis(2,4,6-trichlorophenyl) oxalate 60
Figure 4.7 Temperature profile inside the OBR
62
Figure 4.8 IR spectrum of the synthesized Bis(2,4,6-trichlorophenyl) oxalate, KBr disc
63
Figure 4.9 IR spectrum for Bis(2,4,6-trichlorophenyl) oxalate, KBr disc
64
Figure 4.10 Synthesis of Methyl diantilis
66
Figure 4.11 Temperature profile and sampling times for the methyl diantilis reaction
68
Figure 4.12 IR spectrum of the synthesized methyl diantilis, sample 1
69
Figure 4.13 1H 400Mhz NMR spectrum of the synthesized methyl diantilis, sample 1
70
Figure 4.14 IR spectrum of the synthesized methyl diantilis, sample 2
70
Figure 4.15 1H 400Mhz NMR spectrum of the synthesized methyl diantilis, sample 2
71
Figure 4.16 IR spectrum of the synthesized methyl diantilis, sample 3
71
Figure 4.17 1H 400Mhz NMR spectrum of the synthesized methyl diantilis, sample 3
72
Figure 4.18 IR spectrum of the synthesized methyl diantilis, sample 4
72
Figure 4.19 1H 400Mhz NMR spectrum of the synthesized methyl diantilis, sample 4
73
Figure 4.20 13C 100Mhz NMR spectrum of the synthesized methyl diantilis, sample 4
73
Figure 4.21 13C 100Mhz (depth) NMR spectrum of the synthesized methyl diantilis, sample 4
74

x
Figure 4.22 IR spectrum of the synthesized methyl diantilis, sample 5
74
Figure 4.23 1H 400Mhz NMR spectrum of the synthesized methyl diantilis, sample 5
75
Figure 4.24 Synthesis of vanisal sodium
77
Figure 4.25 NMR spectrum of vanisal sodium
79
Figure 4.26 Reference NMR spectrum of vanillin
80
Figure 4.27 Popular uses for aspirin 82 Figure 4.28 The synthesis of acetylsalicilic acid
82
Figure 4.29 Temperature profile for the acetylsalicylic acid samples
84
Figure 4.30 HLPC chromatogram of the synthesized acetylsalicylic acid, sample 1
85
Figure 4.31 HLPC chromatogram of the synthesized acetylsalicylic acid, sample 2
85
Figure 4.32 HLPC chromatogram of the pure aspirin sample
85
Figure 4.33 The synthesis of paracetamol
87
Figure 4.34 Temperature profile for the paracetamol samples
89
Figure 4.35 HLPC chromatogram of the synthesized paracetamol, sample 1
90
Figure 4.36 HLPC chromatogram of the synthesized paracetamol, sample 2
90
Figure 4.37 HLPC chromatogram of the pure paracetamol sample
90
Figure 5.1 Temperature measurements during the vanisal sodium reaction
98
Figure 5.2 Concentration profile for the vanisal sodium production run
99
Figure 5.3 Washing data for vanisal sodium
102
Figure 5.4 First order kinetics plot for Vanisal Sodium cleaning data
103
Figure 5.5 Temperature measurements during the acetylsalicylic acid production run reaction
105
Figure 5.6 Acetylsalicylic acid produced continuously in the COBR
106
Figure 5.7 a) XRD results for the produced acetylsalicylic acid; b) XRD results for acetylsalicylic acid (form I)
107

xi
Figure 5.8 a) SEM images of produced acetylsalicylic acid crystals; b) Plate
shaped acetylsalicylic acid crystals, in Cambeiro et al. (2006)
108
Figure 5.9 Second order plot for the reaction between salicylic acid and acetic anhydride at 90 oC
109
Figure 5.10 Washing data for aspirin
111
Figure 5.11 First order kinetics plot for aspirin cleaning data
112
Figure 5.12 Temperature measurements for the paracetamol production run
115
Figure 5.13 Concentration profile of the produced paracetamol
115
Figure 5.14 XRD data for paracetamol produced in the COBR
117
Figure 5.15 Literature XRD data for paracetamol (form I)
117
Figure 5.16 SEM images of paracetamol crystals taken at different times of operation. a) 7.5 hrs b) 26.25 hrs c) 45 hrs d) 63.75 hrs e) 75 hrs f) 93.75 hrs
118
Figure 5.17 Optical micrographs of monoclinic paracetamol crystals 118
Figure 5.18 Particle size distribution of paracetamol samples (time of sampling = 3 hours)
119
Figure 5.19 Kinetics of the reaction between p-aminophenol and acetic anhydride at 80 oC
121
Figure 5.20 Washing data for Paracetamol
122
Figure 5.21 Paracetamol cleaning kinetics
123
Figure B.1 HLPC chromatogram of the synthesized acetylsalicylic acid, sample 3
141
Figure B.2 HLPC chromatogram of the synthesized acetylsalicylic acid, sample 4
141
Figure B.3 HLPC chromatogram of the synthesized acetylsalicylic acid, sample 5
141
Figure B.4 HLPC chromatogram of the synthesized acetylsalicylic acid, sample 6
142
Figure B.5 HLPC chromatogram of the synthesized acetylsalicylic acid, sample 7
142

xii
Figure B.6 HLPC chromatogram of the synthesized acetylsalicylic acid, sample 8
142
Figure B.7 HLPC chromatogram of the synthesized acetylsalicylic acid, sample 9
143
Figure C.1 HLPC chromatogram of the synthesized paracetamol, sample 3
145
HLPC chromatogram of the synthesized paracetamol, sample 4
145
Figure C.2 HLPC chromatogram of the synthesized paracetamol, sample 5
145
Figure C.3 HLPC chromatogram of the synthesized paracetamol, sample 6
146
Figure C.4 HLPC chromatogram of the synthesized paracetamol, sample 7
146
Figure C.5 HLPC chromatogram of the synthesized paracetamol, sample 8
146

xiii
List of Tables Table 2.1 The cleaning continuum
27
Table 2.2 Applicable thresholds for impurities in new drug substances
35
Table 2.3 Applicable thresholds for degradation products in new drug products
35
Table 4.1 IR spectrum peaks and its molecular significance
64
Table 4.2 IR spectrum peaks/bands and its molecular significance
69
Table 4.3 Selection criteria fulfilled by the screened chemistries
92
Table 5.1 Comparison between terminal velocity (ut) and mixing velocity (um) for the aspirin and paracetamol campaigns
96
Table 5.2 Experimental conditions and results for this work and in literature
106
Table 5.3 Experimental conditions and results for this work and in literature
116
Table 5.4 Particle size distribution for paracetamol samples
119
Table 5.5 Comparison of cleaning data from different studies
124

xiv
List of Abbreviations
API – Active Pharmaceutical Ingredient
C&T – Cosmetics & Toiletry
CFD – Computational Fluid Dynamics
CIP – Cleaning-in-place
COBR – Continuous Oscillatory Baffled Reactor
CPI – Critical Path Initiative
CSTR – Continuous Stirred Tank Reactor
DPIV – Digital Particle Image Velocimetry
EPSRC – Engineering and Physical Sciences Research Council
FDA – Food and Drug Administration
FEP – Flourinated Ethylene Propylene
GLP – Good Laboratory Practice
GMP – Good Manufacturing Practice
HPLC – High Performance Liquid Chromatography
ICH – International Conference on Harmonisation of Technical Requirements for
Registration of Pharmaceuticals for Human Use
IR – Infrared Spectroscopy
ISPE – International Society of Pharmaceutical Engineers
MHLW - Ministry of Health, Labour and Welfare
MHRA – Medicines and Healthcare products Regulatory Agency
NMR – Nuclear Magnetic Resonance Spectroscopy
OBR – Oscillatory Baffled Reactor
OTC – Over-the-counter
PAT – Process Analytical Technologies
PFA – Perfluoroalkoxy
PFR – Plug Flow Reactor
PIV – Particle Imaging Velocimetry
PTFE – Polytetrafluoroethylene
PSD – Particle Size Distribution
QbD – Quality by Design
RPC – Reciprocating Plate Column

xv
RTD – Residence Time Distribution
SEM – Scanning Electron Microscopy
STR – Stirred Tank Reactor
TCPO – bis(2,4,6-trichlorophenyl) oxalate
TDI – Total Daily Intake
WARF – Wisconsin Alumni Research Foundation
WHO – World Health Organization
XRD – X-Ray Diffractometry

xvi
List of General Nomenclature
Symbol
Ap Projected area of the particle [m2]
BL1 Limit of the target residue [g.L-1]
BL2 Residue limit in the API used in the manufacture of the
finished drug [g.L-1]
C Concentration of the chemical species at a given time [mg mL-1]
C0 Concentration of the chemical species at the start of washing [mg mL-1]
CD Drag coefficient
D OBR diameter [m]
di Internal diameter [m]
do Orifice diameter [m]
f Frequency [s-1]
Fb Buoyant force [N]
Fd Drag force [N]
Fg Force of gravity [N]
g Gravitational acceleration [m.s-2]
L Baffle spacing [m]
m Mass [kg]
Re Oscillatory Reynolds number
Ren Net flow Reynolds number
SF Safety Factor
St Strouhal number
u Superficial net flow velocity [m.s-1]
ut Terminal velocity [m.s-1]
um Mixing velocity [m.s-1]
uo Oscillatory velocity [m.s-1]
un Net flow velocity [m.s-1]
Vr Reactor volume [L]
Vw Washing volume [L]
x0 Centre-to-peak oscillation amplitude [m]

xvii
Greek Symbols α Baffle free area
δ Baffle thickness [m]
µ Dynamic viscosity [N.s.m-2]
ρ Density [kg.m-3]
ρl Density of the fluid [kg.m-3]
ρp Density of the particle [kg.m-3]
v Fluid kinematic viscosity [Pa.s]
ω Angular oscillation frequency [rad.s-1]
Ψ Cleaning index
Ω Wash index

xviii
List of Publications
Caldeira, R.; Ni, X., Evaluation and Establishment of a Cleaning Protocol for the
Production of Vanisal Sodium and Aspirin Using a Continuous Oscillatory Baffled
Reactor. Organic Process Research & Development 2009, 13, (6), 1080-1087
Caldeira, R.; Ni, X., Suitability Assessment of the Continuous Oscillatory Baffled
Reactor for the Pharmaceutical Industry: Production, Crystallization and Cross
Contamination Studies for Two Model APIs. Organic Process Research &
Development, in print.

1
CHAPTER 1
INTRODUCTION
A good engineer is a person who makes a design
that works with as few original ideas as possible.
Freeman Dyson, theoretical physicist and mathematician
1.1 - Mixing technology, OBR and COBR
Fine chemicals and drugs manufacturing has long been associated with batch
processing because production runs are segregated into lots, making it relatively easy to
pinpoint out of specification product. In addition, laboratory scale experiments on new
pharmaceutical compounds are often done in batch and the shortest way of migrating a
process to full-scale is to mimic what happens at a small-scale (Kossik 2002; Jr. and
Lodaya 2004; Swichtenberg 2008). The mindset of pharmaceutical companies is then
geared towards batch-wise production, even if it compromises quality and yield, whilst
increasing downstream purification units with associated wastes as well as processing
time of pharmaceutical products (Plumb 2005; TL LaPorte 2007).
The drive towards implementing innovative continuous manufacturing
technologies in the pharmaceutical production environment has gathered significant
momentum recently. A recent report by AstraZeneca showed that crystallisation of an
active pharmaceutical ingredient (API) for one of its best selling drugs was done in 12
minutes in a continuous crystallizer in comparison of 9 hours and 40 minutes in a
traditional batch stirred tank crystallizer of 6.5 m3 to achieve the same solid
concentration with better specifications, e.g. filterability (Lawton et al 2009). This
example has offered a paradigm shift to the long-established batch manufacturing
processes. In fact, there are several drivers making the use of continuous reactors more
appealing than its batch counterpart, such as minimizing the footprint and chemicals

2
inventory in newly built plants while maintaining the production volume flexibility that
a continuous process is able to deliver, therefore keeping initial investment and
production costs down (Jr. and Lodaya 2004; Pellek and Arnum 2008; Thakore and
Bhatt 2008).
In terms of retro-fit, i.e. just to replace batch stirred tank crystallizers by
continuous crystallizers in existing plants, this allows for better and greater control on
product quality and eliminates in some cases the need for milling processes. In the
AstraZeneca case, this represented an estimated 50% reduction in capital costs, and
further avoidance of >£300k per annum costs in personnel, milling losses and other
inefficiencies (Lawton, Steele et al 2009). Continuous processing minimizes the
downtime associated with batch operations, can run continuously for either a short or a
long period of time depending on the throughput (T/yr) required. The operational
conditions are monitored and controlled continuously along the length of the continuous
reactor/crystallizer. In fact, continuous reactor technologies offer a more simple,
predictable and controllable solution for pharmaceutical manufacturers together with
using less energy and solvents, while minimizing the production of waste (Liu, Lipták et
al 1997; Angelucci 1999; Vervaet and Remon 2005; Crosby 2006).
In addition to this, regulatory bodies have recently published guidelines with the
purpose of making manufacturers to fully understand and optimize the way their
pharmaceutical products are developed, evaluated and manufactured, such as the
Critical Path Initiative (CPI) issued by the FDA or the Q8 guideline published by the
International Conference on Harmonisation of Technical Requirements for Registration
of Pharmaceuticals for Human Use (ICH), which focuses on Quality by Design (QbD)
(Plumb 2005; Pellek and Arnum 2008; Swichtenberg 2008). These regulatory efforts
present the perfect opportunity for continuous process technology to be embraced and to
be successfully implemented. One example is that of Genzyme’s manufacturing
process, which utilizes continuous reactors that have been approved by FDA and been
running since 2007 (Ni 2009).
One of the important aspects of both CPI and QbD is the prevention of cross-
contamination. The design of modern pharmaceutical equipment has to take into
account that there is a current trend for new drugs to be tailored for narrower population

3
targets and so manufactured in smaller production runs (Gassmann et al 2004; Voelter-
Mahlknecht and Mahlknecht 2004). In order to maximize the plant productivity it is
then a requirement to use the same parts, such as chemical reactors, to manufacture
different products. In this case avoiding cross-contamination is of critical importance.
The cleaning of a continuous reactors utilizes a single-path cleaning-in-place (CIP)
procedure that does not require cleaning to be done in contact with the outside
environment, which reduces process downtime, waste, risk of cross-contamination and
brings operational costs down (Perka et al 1993; Gambrill 1995; Chew, Tonneijk et al
2006).
One successful development in the continuous process technology design is the
Continuous Oscillatory Baffled Reactor (COBR). The COBR is a reaction/mixing
device and consists of a glass or stainless steel tube with periodically spaced circular
orifice baffles within, perpendicularly orientated in relation to the flow. The fluid inside
the tube is mixed by means of oscillatory movement, caused by a motor placed at one or
both ends of the reactor.
Coupling a baffled tube with oscillatory movement results in excellent mixing of
fluids. When a fluid that is being oscillated at a reasonable velocity encounters a sharp
barrier, disruption of the flow occurs and eddies around the annular baffles are formed:
as illustrated in Figure 1.1, a doughnut-shaped vortex is produced downstream of each
baffle pulling the fluid to the tube wall when the oscillatory cycle begins and when the
direction of flow is reversed the vortex is pushed back in to the centre of the tube, while
a new vortex is formed on the other side of each baffle (Brunold et al 1989; Gelicourt
2000). This continuous generation and cessation of eddies provides a vigorous axial and
radial mixing within each baffled region defined by two adjacent baffles, which can be
considered as a perfectly mixed continuous stirred-tank reactor (CSTR) (Mackley and
Ni 1991; Nelson 2001). As a consequence, the entire COBR behaves as a series of
perfectly mixed CSTRs – very sharp residence time distribution measurements are
achieved using this technology (Ni 1995; Ni and Pereira 2000; Ni et al 2003).
There are two designations that are frequently used throughout this thesis: OBR
(oscillatory baffled reactor) and COBR. The former refers to batch operation, while the
latter to continuous operation, as suggested by the name.

4
Figure 1.1 Flow pattern in an OBR operating with oscillation;
a) down stroke, b) up stroke
The characteristic oscillatory flow of an OBR is defined by two dimensionless
groups, the oscillatory Reynolds number (Reo) and the Strouhal number (St) (Brunold et
al 1989):
µωρ 0Re
Dxo =
(1.1)
04t
xDSπ
= (1.2)
When dealing with the flow in a COBR, the net flow Reynolds number is also
pertinent dimensionless group:

5
µρuD
n =Re (1.3)
where ρ is the density of the bulk fluid (kg.m-3), D is the OBR diameter (m), x0 the
centre-to-peak oscillation amplitude (m), ω the angular oscillation frequency (rad.s-1), µ
dynamic viscosity (N.s.m-2) and u the superficial net flow velocity (m.s-1).
1.2 - Motivation and Structure of the Project
It is believed that a central role in the adoption of a new technology by its
potential users is that research done behind closed doors needs to be published to be
legitimized (Technologies 2008; Thomas 2008). In this way, proactive companies that
are prepared to adopt a proven, yet emerging technology earlier than their rivals can
gain a competitive advantage. Examples can be found in diverse technology intensive
businesses. For example, the introduction of a rear wing in the 1968 Lotus 49 in
Formula 1 proved to be so competitive that by the end of that year most other cars were
updated in a similar fashion; the Apple Macintosh 128K was such a commercial success
due to its use of a graphical user interface (GUI) that Microsoft applied the same
interface principles in its Windows package as a GUI for its own MS-DOS operating
system (Scarso 1996; Rios 2007).
Having proved that the OBR and COBR design is a better alternative to
conventional reactors in a number of diverse applications such as heat and mass transfer
(Hewgill et al 1993; Mackley and Ni 1993; Mackley and Stonestreet 1995),
polymerization (Ni et al 1999; Ni et al 2003), fermentation (Gaidani et al 2005;
Masngut et al 2006), crystallization (Ni et al 2004; Caldeira and Ni 2009; Ni and Liao
2010), biodiesel production (Harvey et al 2003) or fine chemicals (Winder 2003; Ni
2006), the time has arrived to demonstrate that this relatively young technology is also
suitable for extended pharmaceuticals and fine chemicals syntheses, in order to establish
the robustness, versatility and adaptability of COBR – not only several chemical

6
reactions will be studied using this reactor technology, but also will these be done in a
sequential fashion, with cleaning procedures in between. Each product must meet the
stringent quality standards set by regulatory agencies. The synthesis of different
products in tandem also allows for the degree of cross-contamination in the
manufacturing process to be assessed, and the efficiency and kinetics of the cleaning to
be evaluated.
The structure of this thesis is as follows: after the introduction in Chapter 1, the
literature survey is given in Chapter 2, covering the oscillatory baffled reactors, fouling
encrustation and cross-contamination, cleaning approaches, quality by design, the
relevant regulatory matters in the chemical and pharmaceutical industries and
acceptable limits of cross-contamination. The experimental setup, materials used and
analytical techniques are presented in Chapter 3, and the chemistry screening together
with a brief introduction for each of the chemical reactions performed is described in
Chapter 4. Chapter 5 is dedicated to the results and discussion of the production
campaigns performed in the COBR for the selected chemistries. Conclusions and
suggestions for future work to be carried out are outlined in Chapter 6.

7
CHAPTER 2
LITERATURE REVIEW
Learning and innovation go hand in hand. The arrogance of success is to
think that what you did yesterday will be sufficient for tomorrow.
William Pollard, physicist and priest
This chapter presents literature studies covering the fields of the oscillatory
baffled reactors, fouling and encrustation, cleaning methods and strategies, the relevant
regulations to which the chemical and pharmaceutical industries must abide to in order
to market up-to-standard products as well as the levels of cross-contamination
acceptable in a finished product.
2.1- OBR and COBR
The origins of oscillatory flow can be traced to Van Dijck’s patent on a
reciprocating plate column (RPC) as a means to improve extraction or washing
processes by bringing into close contact two immiscible or slightly miscible liquids
(Dijck 1935). One of his original drawings is shown in Figure 2.1.
According to the classification put forward by Lema and co-workers (2001)
there are two types of oscillatory flow reactors concerning the way in which the
contents inside are forced into motion: reactors in which the movement is provoked by
the cyclic introduction of feed via a pump (plug or membrane) and reactors in which the
oscillation is created via the characteristic cyclic motion of a part of the reactor. Both
the RPC and OBR/COBR belong to the latter group - in RPCs and laboratory scale
batch OBRs, oscillatory flow movement is created by the cyclic movement of the plates

8
and annular baffles; in COBRs and some batch OBRs it is the oscillation piston
connected to one or both ends of the reactor that creates the oscillatory movement
(Dijck 1935; Mackley and Ni 1991).
Since Van Dijck’s pioneering work hundreds of scientific papers have been
published in this research field, but it was not until the last two decades that the research
on oscillatory flow mixing and its application in the chemical industry has grown
substantially and there has been a constant stream of research papers published in this
area since the early 1990’s, as is illustrated in Figure 2.2.
Figure 2.1 Scheme of Van Dick’s reciprocating plate column

9
Figure 2.2 Number of publications containing the words “oscillatory” and “baffled”,
according to ISI Web of Knowledge (www.isiknowledge.com)
2.1.1 – OBR
A review of the several studies carried out in OBR is presented in the following
sections. Fundamental research in oscillatory flow in a baffled tube has been carried out
covering flow patterns, mixing, the effect of several OBR geometrical parameters on
mixing (e.g. baffle orifice diameter, baffle spacing, baffle thickness, reactor diameter),
the effect of oscillation frequency and amplitude on mixing, heat and mass transfer
characteristics, residence time distribution and turbulent properties, which include both
experimental and numerical studies. These scientific publications set the basis for this
further study in both batch OBR and COBR, regarding their applicability and suitability
to a number of different chemical reactions and processes.
2.1.1.a – Flow characteristics
Brunold et al (1989) first reported that large scale eddy mixing can be generated
in regions between sharp edges present in rectangular or cylindrical cross-section ducts

10
when oscillatory flow was introduced. A year later Howes and Mackley (1990)
observed axial dispersion in a series of tracer experiments and concluded that the OBR
was able to operate at near plug-flow conditions. Ni and Gelicourt (2002) found that the
axial dispersion increased with the density of the solution when they studied the axial
dispersion in a baffled column with 50 mm diameter. Both axial and radial dispersion
were characterized in a batch OBR using the Laser Induced Fluorescence technique
(Fitch and Ni 2003). Electrical Impedance Tomography was used for on-line
measurements and the analysis of the dispersion enabled the description and prediction
of the characteristics of the oil-water emulsion present in an OBR (Vilar et al 2008).
Gao and colleagues used the Particle Imaging Velocimetry (PIV) technique to
determine local velocity components and found that complete mixing was consistently
achieved under low oscillatory Reynolds numbers (Gao et al 2002). PIV was also used
by Fitch and co-workers (2005) in conjuction with computational fluid dynamic to
study the mixing effects of fluid viscosity in an OBR and concluded that good mixing
was achieved in the OBR if the ratio between the plane-averaged axial and radial
velocities was lower than 3.5.
2.1.1.b – Geometrical parameters and operating conditions
Eddy formation and the impact of the OBR geometrical parameters on these
characteristics was first studied by Knott and Mackley (1980) and followed by Brunold
et al (1989). Both studies reported that the cycle of eddies formation and disruption was
optimal for a baffle spacing of 60% in a tube with an internal diameter of 25 mm. Since
then a multitude of other studies investigated the impact of the baffle free area (α),
baffle spacing (L), baffle thickness (δ), and of the frequency (f) and amplitude (x) of
oscillation on mixing efficiency. Those geometric parameters are shown in Figure 2.3.

11
Figure 2.3 Schematic representation
of an OBR. di – reactor internal
diameter, δ – baffle thickness, L –
baffles spacing, d0 – orifice diameter
The influence of the baffle free area (α), defined as d02/di
2, on mixing time was
evaluated by Brunold et al (1989). They reported that α should be 34% in order for
optimal mixing to occur. Later on, Ni et al (1998) varied α from 11 to 51% and found
that a ratio of 20-22% was the optimum. As a result, a ratio of 21% was used in the
experimental work for this project.
The ideal baffle spacing (L) is the one that allows the generated eddies to fully
develop in between the baffles, whilst at the same time creating the conditions for good
mixing to occur. In other words, if L is too small the formation of eddies in the inter-
baffle space due to the oscillatory motion of the flow is severely disturbed; however, if
L is too big, eddies formed won’t be able to cover the inter-baffle space in its entirety
thereby rendering mixing less efficient. While Brunold et al (1989) suggested that L
should be 1.5d, Ni and Gao (1996) recommended that L should be 1.8d for better
mixing.

12
Another important parameter in the design of an OBR is the baffle thickness (δ).
If the baffles are too thick and eddies remain on the edges of the baffles for too long, the
formation of vortex can be compromised. These findings were corroborated by Ni et al
(1998) who suggested that thinner baffles helped reducing mixing times. Ni and
Stevenson (1999) also reported that the existence of a gap between the outer baffle and
the inner tube diameter affected the mixing patterns and resulted in a lengthening of
mixing time in an OBR.
The operational parameters of the OBR, e.g. frequency (f) and amplitude (x0),
have a decisive input on the way in which fluid behaves inside the OBR, for example,
on controlling both droplet and particle sizes in suspension polymerization of
acrylamide and methylmethacrylate (Gough, Ni et al 1997; Ni et al 1998; Ni et al 1999;
Ni et al 2001; Ni et al 2003). The impact of f and x0 on backmixing was also studied by
Takriff and Masyithah (2002) and later by Reis and co-workers (Reis et al 2004; Reis et
al 2010), who demonstrated that the oscillation, with a particular relevance to x0
affected the backmixing phenomena due to the variation in mixing length.
2.1.1.c – Heat and mass transfer
Heat and mass transfer characteristics of the OBR were the subject of study by
different researchers. Stephens and Mackley (2002) used two different OBR
configurations – one where annular baffles were oscillated within the tube and other
where oscillatory motion was applied to the fluid in a tube with fixed annular baffles –
and demonstrated that the heat transfer coefficient depended on the intensity of
oscillation. Zhang et al (2005) also showed the significance of frequency and amplitude
with regards to heat transfer, and concluded that an increase in oscillatory velocity led
to an enhancement of heat transfer in the OBR.
The effect that periodic oscillatory motion inside a baffled tube has on mass
transfer of oxygen into water was discussed by Hewgill and co-workers (1993). They
found that the volumetric oxygen transfer coefficient offered a 6-fold increase when a

13
tube was set up in the presence of both baffles and fluid oscillation. In a comparison
between the performance of an OBR and a STR in a yeast re-suspension operation made
by Ni et al (1995), it was concluded that the volumetric oxygen transfer coefficient was
75% higher in the OBR than that in a conventional STR.
2.1.1.d – Numerical and simulation studies in OBR
Howes (1988) first studied the dispersion of unsteady flow in baffled tubes using
a numerical code. This work was later further developed by Roberts (1992) into the
study of the flow in 2-D baffled channels.
Computational fluid dynamics (CFD) has been used extensively in recent times
in order to get a better insight into the flow characteristics in the OBR. Examples of this
are the published work by Ni et al (2002) and by Chew et al (2004). In the former, CFD
was used to generate a 3-D numerical simulation of the flow in a batch OBR, which
were in good agreement with laboratory experiments. In the later study, the flow
patterns of both OBR and STR are compared using CFD and the spatial and temporal
distribution analysis showed that the OBR is an attractive mixing technology alternative
for process intensification. The effect of viscosity on mixing performance in a batch
OBR was investigated by Fitch et al (2005) using CFD together with Digital Particle
Image Velocimetry (DPIV) in order to provide guidance notes for future industrial
applications of this mixing technology when dealing with viscous fluids.
Mathematical models were also developed by Hounslow and Ni (2004) in which
the coalescence and breakage of methylmethacrylate droplets were modelled and results
compared agreeably with experimental data. Zhang and co-workers similarly developed
a mathematical model with the objective of optimizing the heat transfer in the OBR
(Zhang et al 2005).

14
2.1.1.e – Applications
The fundamental research on batch OBRs was complemented with studies on
the applicability of this novel mixing technology, namely with regards to chemical
reactions, energy efficiency, polymerization, crystallization, fermentation, mass and
heat transfer, product engineering and process intensification.
Ni and Mackley (1993) followed a simple chemical reaction in the batch OBR
and STR and found that the former was much more energy-efficient alternative. Later
Ni et al (2001) compared the flocculation of bentonite and of a bacterial species using
the same type of reactors. A similar level of flocculation was obtained in the OBR with
much lower strain rate, when compared with a STR.
In suspension polymerization, Ni et al (1999; 2003) reported that by changing
both the amplitude and frequency of the oscillation, they were able to control the size
and shape of the polymers synthesized. These conclusions were later confirmed for the
inverse phase suspension polymerisation of acrylamide (Ni et al 2003).
More recently, Gaidhani et al (2005) used the batch OBR in the production of
pullulan (a polysaccharide polymer) and compared the microbial growth rates in the
OBR and the STR. The results showed that the growth rate was much faster in the batch
OBR due to the enhanced mass transfer rate. These results were later supported by
Masngut et al (2006), who investigated solvent fermentation from palm oil mill effluent,
cell growth, glucose consumption and solvent production.
Ni and Liao (2008) studied the crystallization of L-glutamic acid and found that
the metastable zone width was narrower in the OBR than that in the STR, due to the
more uniform mixing and better heat transfer characteristics. Following from this work,
the effects of mixing, crystal seeding and baffle material on the crystallization of L-
glutamic were examined, and by finely controlling OBR parameters the desired crystal
polymorph were obtained (Ni and Liao 2010). The OBR performed well against the
STR in a protein refolding operation due to its superior mixing and linear scale-up
characteristics (Mackley et al 2001).

15
2.1.2 - COBR
The expansion of the OBR is the COBR, which follows the same principles but
works in a continuous fashion. This section reviews the fundamental research for the
COBR, as well as some of its applications.
2.1.2.a – Residence time distribution (RTD)
Dickens et al (1989) examined the RTD profiles of a COBR and near plug-flow
characteristics were achieved, with similar magnitudes of axial and radial velocities.
Similar results were observed by Mackley and Ni (1991) and by Ni (1994). With the aid
of a thin beam of light reflecting from small particles suspended in the fluid, Baird and
Rao (1995) were able to observe well defined flow patterns. Particle velocities inside a
COBR were measured by Liu et al (1995) and it was shown that narrower RTDs are
achievable for particles with a density distribution. Ni and Pereira (2000) confirmed
earlier results obtained by Mackley et al (1996), affirming that plug-flow behaviours
dominated in the COBR for a range of laminar-flow net Reynolds numbers.
The breakage of oil droplets dispersed in water was studied by Mignard et al
(2004) using a high speed camera and the impact of frequency and amplitude of
oscillation in a COBR was investigated. Studies regarding mean size distribution of
droplets in a COBR were carried out by Pereira and Ni (2001) and it was found that
frequency and amplitude of oscillation were more important than the net flow in
shaping the mean size distribution of the droplets.
2.1.2.b – Heat and mass transfer
Mackley et al (1990) reported that when a net flow was superimposed with
oscillatory motion in a baffled tube a significant increase of the convective heat transfer
coefficient was observed. Mackley and Stonestreet (1995) also performed heat transfer
experiments where they remarked that under certain oscillation conditions a 30-fold

16
increase in the Nusselt number, the ratio between convective and conductive heat
transfer, was observed under low net flow Reynolds numbers.
2.1.2.c – Scale-up/down
The versatility of this mixing technology was illustrated by Harvey et al (2003)
when a scaled-down version of the design was studied and the good mixing and particle
suspension characteristics found in bigger versions were retained. These results are
particularly interesting for speciality chemicals production and high-throughput
screening. Reis et al (2004) confirmed the same oscillatory flow mixing principles of
the COBR using a mini screening reactor (total volume = 4.5 ml). In a series of
experiments using 3 different sets of baffled tubes (from 1 to 4.5 m long and 24 to 150
mm of internal diameter) working either in batch or continuous, Smith and Mackley
(2006) showed that mixing intensity was largely independent of the internal diameter of
the tubes, thus making this type of reactor technology easy to scale up linearly, from
laboratory scale to pilot-plant and up to full industrial size.
2.1.2.d - Applications
The fundamental research on the COBR created a knowledge base for exploring
applications. One of the first examples was in wastewater treatment area. The treatment
of organic matter in aqueous solution was achieved using a photo-oxidation reactor,
whereby the excellent gas-liquid mixing kept the solid catalyst-coated particles in
suspension (Harvey and Stonestreet 2001). In a saponification reaction for the
continuous production of sterols using the COBR mixing technology, an eight-fold
reduction of reaction time and a 100-fold footprint minimization were achieved when
comparing with a full-scale batch reactor, maintaining the same production rates and the
quality of the batch operaton (Harvey et al 2001). A significant reduction of residence
time was also achieved in biodiesel production, thereby intensifying the existing process
(Harvey et al 2003). Using a COBR micro-bioreactor, Reis et al (2006) reported a 50%
decrease in residence time in the production of γ-decalactone, when compared to the

17
STR. This result was accomplished due to the enhanced mass transfer capabilities
through the increase of the interfacial area between the two immiscible liquid phases
involved in this process.
In the production of a speciality chemical product the existing two STRs were
replaced by a COBR at a James Robinson Ltd. plant (Figure 2.4) (Ni 2006). The total
process time was reduced drastically from 12 hours to 40 minutes, the reaction yield
was increased and the reactor footprint was only 5% of the existing one (1200 m3
compared to 60 m3), even though the daily output remained unchanged (Winder 2003).
Figure 2.4 The COBR installed in James Robinson Ltd’s plant is considerably smaller
than the STR it replaced

18
Genzyme has recently built the largest-patent protected continuous API
manufacturing plant in the world, where a COBR is used in one of the synthesis steps to
produce hundreds of tonnes of a pharmaceutical compound per year. This reactor design
was chosen primarily because of the reduction in reaction time (30-fold reduction) and
due to the 99% footprint reduction when the COBR was implemented (2008).
Novartis has recently partnered with the Massachusetts Institute of Technology
(MIT) to form the Novartis-MIT Centre for Continuous Manufacturing with the
objective of researching new technologies that can transform current batch-based
manufacturing processes into fully continuous processes, from start to finish (Trout
2009). Continuous reactor technologies offer a more simple, predictable and
controllable solution for pharmaceutical manufacturers together with using less energy
and solvents, while minimizing the production of waste (Liu et al 1997; Angelucci
1999; Vervaet and Remon 2005; Crosby 2006). For example, a 10% solvent
consumption reduction would result in £400k per annum savings for a AstraZeneca’s
chemical at a production scale case-study (Lawton et al 2009). These and other factors
will continue to play a significant role in the drive to adopt continuous mixing
technology.
2.2 – Fouling and cross-contamination
2.2.1 – Fouling and Encrustation
If the residues existent inside the reactor are not cleaned systematically and
periodically fouling might occur and encrustation of these particles on the reactor
surface can seriously disrupt the normal operation of a manufacturing plant – for
instance deposition on the bottom of batch reactors can have an important effect on the
mixing patterns and, therefore, the quality of the product; a simple blockage in pipes
connecting reactors usually results in the disruption of the production schedule, with a
possible negative impact in the plant’s cash-flow and reputation. Fouling is defined as
the accumulation of solid particles at interfaces, such as reactor walls or baffles. Fouling
is a phenomenon which can take place without a temperature gradient in a great many

19
natural, domestic, and industrial processes, but in the presence of such a gradient,
fouling or encrustation might be enhanced (Minton 1986).
Considering the liquid-solid interface in the reactor, fouling can occur as a result
of different phenomena. Accordingly, the following classification is based on the key
physical or chemical process essential to the particular fouling phenomenon. Six
primary categories have been identified (Minton 1986; Mwaba 2003), of which four
may have relevance for this project:
1. Precipitation Fouling: crystallization from solution of dissolved substances onto
the heat transfer surface as the fluid becomes supersaturated with the fouling
material, and is sometimes called encrustation or scaling (e.g. for acetylsalicylic
acid or paracetamol, the crystals formed on sub-cooled surfaces might induce the
formation of fouling);
2. Sedimentation Fouling: the accumulation of finely divided solids suspended in
the bulk fluid onto the reactor’s surface. In a minority of instances settling by
gravity prevails, and the process may then be referred to as particulate fouling.
This type of fouling might occur in the synthesis of methyl diantilis: the solid
catalyst spheres might become entrapped in the reactor and accumulate on the
walls and baffles, thereby disrupting normal operation;
3. Chemical Reaction Fouling: the deposit formation on the reactor surface by
chemical reactions in which the surface material itself is not a reactant. Such
might be the case with the synthesis of cyalume;
4. Corrosion Fouling: the accumulation of indigenous corrosion products on the
heat transfer surface, which is caused by the reaction between the species in the
fluid and the stainless steel, glass or fluoropolymer that form the reactor surface.
Corrosion products may act as catalysts for other fouling mechanisms, e.g. as the
reactor surface becomes corroded, there is an increase in nucleation sites,
promoting undesired sedimentation and crystallization.

20
The net rate of the formation of the deposits is the generally accepted starting
point for all fouling models. Two competing processes are involved in this – formation
and removal of the fouling.
The formation of fouling and encrustation involves the following processes
acting in sequence:
- processes in the body of the fluid;
- transport to the reactor surface;
- attachment/formation of the deposit.
Removal involves one or more of the following:
- dissolution (material leaves in molecular or ionic form);
- erosion or reentrainment (material leaves in particulate form);
- spalling (material leaves as a large mass).
Whereas spalling, or sloughing, takes place at random times and at random
locations inside the reactor, in a normal process dissolution and erosion are taking place
continuously across all the deposit’s surface.
The fouling characteristics of a fluid in contact with a reactor surface are a
function of a variety of parameters:
- properties of the material used in the reactor;
- geometry of the reactor surface;
- temperature difference of the boundary region between the fouling liquid and
the reactor surface;
- rheology of the system;
- characteristics of the fouling fluid.
The sequence in which fouling or encrustation occurs for every category of
fouling mechanism is the following (Minton 1986; Mersmann 2001; Mwaba 2003):

21
1) Initiation of the process (delay, nucleation, induction, incubation, surface
conditioning);
2) Transport (mass transfer);
3) Attachment (surface integration, sticking, adhesion, bonding);
4) Removal (release, reentrainment, detachment, scouring, erosion,
spalling, sloughing);
5) Aging.
1) Initiation - After starting up a process with a clean reactor there is usually a
short period before any appreciable fouling can be registered. This is called
the initiation period and it is the time when conditions that make the
deposition of fouling material onto the surface of the reactor more prone are
established. In the case of precipitation fouling, it is closely associated with
the nucleation process of product crystals, which increases with increasing
degrees of supersaturation. For chemical reaction fouling, the lag period
usually decreases as the temperature on the internal surface of the reactor is
increased. If the surface roughness of the reactor is increased, there is a
tendency for the lag time to be decreased. This can be explained by the fact
that there is an increase in the availability of sites for nucleation, adsorption,
and chemical surface-activity, while the small indentations at the surface act
as a shelter for deposits, which are then protected from the mainstream flow.
Surface roughness also increases eddy transport to the wall.
2) Transport - This period of the fouling sequence starts when the components
from the bulk of the fluid travel to the surface of the reactor. There are two
ways in which this can occur: for sedimentation, precipitation and chemical
reaction fouling, the fouling material itself is brought from the fluid to the
surface, but for the corrosion fouling mechanism it is not the fouling material
that is transported but an ionic species, which contributes to the corrosion
reaction in the surface of the reactor (e.g. when an strong acid or base is
being used). This in turn results in the formation of reaction products that
cause fouling - the transported ionic species acts as a trigger for the deposits’
growth. Deposition of fouling substances can either be controlled by
diffusion or by adhesion. If the rate of diffusion to the walls of the reactor is

22
higher than the rate at which they are adhering to the surface, the deposition
is adhesion controlled. On the other hand, if the rate of adhesion is much
higher than the rate of diffusion then the deposition is said to be diffusion
controlled. During this early stage of deposits formation and encrustation
there is a tendency for the creation of nuclei on the surface of the reactor or,
simply by the action of gravity, the particles have a natural tendency to settle
on a surface where the fluid dynamics of the system are not sufficient to get
those particle back into suspension. This creates the optimal conditions for
the formation a crust on the surface of the reactor. To avoid fouling and
encrustation phenomena the local fluid velocity throughout the reactor has to
be greater than the minimum velocity at which settling of particles will take
place;
3) Attachment - Apart from the sedimentation fouling process, the attachment
of the deposit takes place in the reactor’s wall region, where the solid species
is formed. The adherence of the different particles to a solid surface depends
not only on the characteristics of the particles but also on the type and
smoothness of the surface. Glass, glass-lined material and polished stainless
steel are generally more favoured than regular steel to be used as reactor
surfaces. The pipes and ducts should be as smooth as possible and without
traps that might capture any type of particle.
4) Removal - The speed at which removal phenomenon takes place is directly
proportional to the mass of deposit and the shear stress on the surface of the
reactor and the properties of the bulk fluid, and inversely proportional to the
absorption force of the fouling deposit when interacting with the walls of the
reactor. The characteristics of the deposit influence the particular removal
process and it can happen that more than one removal process may occur
during the period in which fouling is taking place. Dissolving the deposit is a
way of removing it, and must be accompanied by a change in the
characteristics of the stream or of the deposit (e.g. changing solvents, the
temperature or the pH may influence the solubility of the fouling deposit).
Sloughing and spalling of materials might happen due to changes in the
characteristics of the deposit or due to changes in stream conditions, but the

23
essential event for sloughing to occur is a change in the character of the
deposit after its formation that weakens its attachment to the reactor surface.
Re-entrainment of deposited material by the flowing fluid involves fluid
mechanical forces and the mutual interaction between the elemental particles
of the deposit. The most severe problem that can happen in this process is
when the detachment of crusts takes place: plugging of tubes or pumps may
occur, leading to operation shutdowns. Not only is this a concern in terms of
lost operation time, but there is also an increase in energy consumption used
for the hot water or solvent needed to dissolve the crusts;
5) Aging - The deposit starts to age as soon as it contacts with the reactor
surface and may comprise changes in the chemical or crystal structure. These
events may, with time, lead to a strengthening of the deposit in the surface
but also can trigger the opposite effect – this is visible when a deposit is
removed suddenly without a change in the normal operating conditions of
the reactor.
Fouling and encrustation or even a simple contamination issue can seriously
undermine a chemical or pharmaceutical plant’s operation, and on certain occasions
might lead to a complete halt of the manufacturing process. Genzyme faced this
scenario recently, when one of its plants had to shut down due to a virus contamination.
This provoked a shortage of two of Genzyme’s most lucrative drugs, which prompted
the US Food and Drug Administration (FDA) to consider issuing a $175M fine and to
allow patients access to competitors drugs, even though these had not been approved for
human consumption at that time. In that period of time Genzyme’s stock market value
dropped sharply, with investors considering suing the company (Clarke 2009; Pollack
2010). It is then of paramount importance to prevent these situations from arising in
order for a chemical or pharmaceutical plant to operate safely.
One of the major concerns in the chemical industry, especially for those dealing
with active pharmaceutical ingredients (APIs), is the possibility of having their products

24
contaminated. As delineated by the International Conference on Harmonisation (ICH)
Guidelines (FDA 2003; FDA 2006), an impurity is a component present in the product
that is not defined as its chemical entity. In the case of finished products, this definition
is extended to include any excipients or the product in itself (Basak et al 2007).
2.2.2 – Cross-contamination
In the case of chemical and pharmaceutical products, there are two types of
contaminants: the ones associated with the production process and the ones related to
the formulation of the finished product or to its aging. Of particular interest to this work
are the impurities that are formed during the manufacture of the chemical and
pharmaceutical products. These can be classified as organic contaminants, inorganic
contaminants and residual solvents (Roy 2002; FDA 2003; FDA 2006; Basak et al
2007).
Contaminants of organic origin in the product include starting materials,
intermediates, by-products and degradation products of the chemical reaction, and
catalysts. It is very rare to obtain a 100% yield in any chemical process and although
end products are generally isolated with the use of solvents and other purification
techniques, there is always the possibility that a residual portion of the aforementioned
types of impurities can still be found in the product – in fact, these are the most
common sources of impurities and manufacturers have to take extra care to design
processes that avoid them, or at least diminish their occurrence to acceptable levels. It’s
interesting to note that in the case of some pharmaceutical products, enantiomeric forms
of the product other than the one considered to be the most effective can be classed as
an organic impurity, and as such have to be removed from the final product.
Contaminants classed as inorganic include reagents, ligands and catalysts, heavy
metals and other substances (such as activated carbon or filter aids). Contamination of
the product by heavy metals can occur when non-demineralized water is used in
stainless steel where an acidification or acid hydrolysis is taking place. The use of USP
water and glass-lined reactor is essential to prevent contaminations of inorganic origin.

25
The very nature of solvents and its widespread use in chemical processes means
that it’s very difficult to completely remove residues of this kind. However, due to their
toxicity factor, the presence of solvent residues in the finished products must be avoided
(class 1 – known or suspected human carcinogens, environmental hazards) or reduced to
acceptable levels (classes 2 and 3 – non geno-toxic animal carginogens and solvents
with low toxic potential hazard, respectively), as described in the ICH guideline Q3
(Roy 2002; Basak et al 2007).
The contaminations may also result from a series of diverse factors - e.g.
introduction of the wrong ingredients; introduction of out-of-date, damaged or
contaminated ingredients; microbial growth inside the piping or vessel and, of particular
interest to this project, contamination from a previous batch if the vessel or piping was
badly cleaned. It is of utmost importance to control and reduce the occurrence of these
events, both through the intelligent design of the chemical reactor – avoiding the use of
pipes of different diameter and “dead-volume” areas where contaminants can settle –
and through the use of a cleaning procedure that guarantees a degree of cleaning of the
reactor that is up to the stringent standards set by regulatory organizations (Gambrill
1995; Argentine et al 2007; Basak et al 2007).
2.3 – Fouling Prevention and Cleaning
Until fairly recently the typical industrial approach to cleaning was empirical
and not based on concrete and studied measures to tackle this issue (Perka et al 1993).
However, with the increased stringency concerning the purity of produced APIs and
other fine chemicals enforced by regulatory agencies around the world, there is a current
drive towards better cleaning standards and practices. Another factor influencing
chemical companies to take actions to reduce waste and energy use is public opinion. In
an age when global warming and climate change are receiving so much media attention,
companies are putting an extra effort to be perceived as environmentally-friendly,
therefore raising their profile; even in a sector traditionally regarded as being very
polluting such as the pharmaceutical sector, there are good examples of this trend, with

26
companies such as Bayer and Bristol-Myers Squibb leading the way in the efforts to
reduce toxic emissions and generated waste (Marwaha 2007).
Prevention of fouling and waste generation can be done by monitoring the
operation conditions and synthetic route more closely, in order to maximize the
efficiency of the process. For example, in cooling crystallization fouling and
encrustation problems can be greatly reduced by minimizing the temperature difference
between the jackets and the solution in the reactor. In theory, encrustation can be
eliminated if this temperature differential is inferior to the width of the metastable zone,
because larger temperature differences can increase the possibility of spontaneous
crystal formation to occur. Using a reactor in which the surface-to-volume ratio is small
increases the heat transfer efficiency and reduces this risk (Mullin 2007; Wieckhusen
2008; Tung, Paul et al 2009).
Nonetheless, in large-scale conventional reactors it’s almost impossible to
completely eliminate these factors and therefore process down-time is required,
lengthening turnaround times and reducing yields, thereby increasing operational costs
(Chew et al 2006). In order to proceed to the cleaning stage between different batches,
conventional mixers normally have to be disassembled and often require off-line time-
consuming cleaning of parts to prevent contamination. That might also be another
source of contamination, since typically these cleaning procedures are done while the
vessel is in contact with the outside atmosphere (Gambrill 1995). Although the cleaning
of vessels has always been a potential source of contamination and waste, it is necessary
to put in place a more cost effective solution to reduce waste generation and cleaning
times. While the cleaning of STRs is seen as time-consuming, the cleaning of plug-flow
reactors is perceived to be a costly procedure (Coker 2001).

27
2.3.1 – The Cleaning Continuum
Given the variety of facilities, manufacturing processes and final products in the
chemical and pharmaceutical industry and in the absence of a universal approach to
cleaning, a cleaning continuum has been established. This concept can be defined as an
“organizational model that helps to draft the operational details of a specific cleaning
validation programme” (Potdar 2007). By coupling several opposed extremes that
represent current industry cleaning practices, the cleaning continuum serves as a guide
in order to establish the most appropriate cleaning validation protocol (Table 2.1).
Table 2.1 The cleaning continuum
(Note: The extremes which are more attuned with this project are in bold)
Manual ................................................... Automated Cleaning
Clean-out-of-Place (COP) ................................................... Clean-in-Place (CIP)
Dedicated Equipment ................................................... Non-Dedicated
Equipment
Product Contact Surfaces
................................................... Non-Product Contact
Surfaces
Minor Equipment ................................................... Major Equipment
Low Risk Drugs ................................................... High Risk Drugs
Highly Characterized ................................................... Poorly Characterized
Sterile ................................................... Non-Sterile
Soluble ................................................... Insoluble
Campaigned Production ................................................... Non-Campaigned
Production
An advantage of using automated cleaning is that it is easier to reproduce and
will yield more reproducible results. This type of operation suits continuous reactors.
The validation of the automated procedure is done using sampling and analytical

28
techniques that have been extensively used in the industry with proven results (Madsen
1998).
The cleaning of continuous reactors can be done using a single-path cleaning-in-
place (CIP) procedure that does not require cleaning to be done in contact with the
outside environment, which reduces process downtime, waste, risk of cross-
contamination and brings operational costs down. Moreover, the cleaning conditions
(e.g. temperature, pH, high detergent concentration) used while performing CIP can be
more extreme due to the fact that there is no direct operator contact with the cleaning
solution (Perka et al 1993; Gambrill 1995; Bismuth and Neumann 2000; Chew et al
2006).
Chemical reactors are often not used as dedicated equipment, in the sense that
they may be used to perform different tasks, according to the plant’s requirements.
Cross-contamination is a possible occurrence if the cleaning procedure is not well
designed or performed and so particular attention is put in the detection of residues, in
both the cleaning and production phases.
The cleaning procedure can be designed towards detecting residues and
contaminant species inside the reactor when using closed continuous reactors, in which
reactants, products and possible by-products of the reactions to be performed will be in
direct contact with its walls. When considering a manufacturing process, the chemical
reactor plays a central role and as such it is considered as a “major equipment”.
Therefore, materials of construction have to be carefully selected to ensure excellent
chemical and temperature resistance. Due to their non-reactive characteristics and
smooth surfaces (low friction coefficients make the deposition of residues more difficult
to occur) materials such as glass, stainless steel or fluoropolymers are usually chosen
when considering the design of a reactor to be used in the manufacture of fine chemicals
and APIs (Madsen 1998).
In order to pass regulatory norms and get their products on the market,
manufacturing companies have to be able to characterise extensively the chemical
entities that are included in the process. These pose various degrees of health risks and
knowing the safe limits of exposure constitutes an added layer of protection for both the
29
operators of the reactor and final users of the products being made. This is why it is
important to determine appropriate cleaning acceptance criteria, based both on the
allergenicity/toxicity/mutagenicity/potency of the chemical entities and on the
characteristics of the reactors being used in the specific manufacturing processes
(Madsen 1998; LeBlanc 2000).
Sterile facilities have to ensure that while in operation no microbial life or
endotoxin will contaminate the system. Generally, the reaction conditions present in a
typical fine chemical or API production campaign are considerably harsh either because
of the high temperatures or strong acids or bases are used. As such, the possibility of
contamination of the reactor by the aforementioned agents is not a very likely event to
happen. On the other hand, the residues that might indeed remain in the reactor before
the cleaning stages start are normally expected to be soluble and will be easier to rinse
out, making cleaning a more simple process.
The planned experimental work to be undertaken in the COBR for this project
includes week-long production campaigns of three different chemical entities. Apart
from testing the capability of the COBR as a suitable alternative chemical reactor from
the production point of view, the cleaning procedure to be put in place must be
adequate, verifiable and reproducible (Scarso 1996; Rios 2007).
2.4 – From quality-by-analysis to quality-by-design
The chemical and pharmaceutical industries are traditionally batch-oriented.
Processes devised and registered with regulatory agencies decades ago are still in use
and are not easy to be changed. Due to factors such as the existence of patents or due
the simple fact that processes in place “work” and generate a constant stream of profit
there is no urgency in making these same manufacturing processes more efficient and
making the shift from batch to continuous unless this change is driven by the ever more
stringent quality criteria being put in place or by the fierce competition existent in the
chemical and pharmaceutical industries (Malhotra 2009).

30
Quality concerns and regulatory bodies dictate that a plant that operates in a
batch fashion must test each product batch and check if it conforms to all the quality
parameters. In a world where quality parameters are increasingly more stringent this
“quality-by-analysis” approach might serve as a safety blanket, but it also means that
expensive testing equipment must be used (Malhotra 2008). The testing procedures
frequently take a long time to be performed and all the while the whole batch cannot be
moved out of the plant, adding further financial strain because adequately dimensioned
facilities have to be built in order to store the plant’s production. Furthermore, if a batch
that has been stored - while samples are being tested - does not meet the required quality
criteria, all of it has to be discarded or reprocessed. The treatment of waste APIs that are
not good enough to be marketed is in itself an expensive process and regarded as anti-
ecological.
Together with compliance and supply chain issues, a different approach to
product quality has also been driven by the expiration of patents and the dwindling
number of new molecular entities that are approved to market each year by regulatory
agencies. Chemical, and in particular, pharmaceutical companies are being forced to
find ways in which to optimize manufacturing processes in order to remain competitive
(Malhotra 2008; Cook, Venkateshwaran et al 2009). The “quality-by-design” (QbD)
approach, whereby entire processes are designed from the beginning with a profound
knowledge of the chemistry and the variables involved, is associated with continuous
manufacturing.
Designing product quality into a continuous process instead of addressing
quality at the end of the production stage ensures that the chemical or API being
manufactured is of the highest and most consistent quality. Process Analytical
Technologies (PAT) is an essential feature of QbD and includes all analysis (chemical,
physical, microbiological, etc) done in-process, in a timely manner. According to the
FDA, PAT is a “system for designing, analyzing, and controlling manufacturing through
timely measurements (i.e., during processing) of critical quality and performance attributes
of raw and in-process materials and processes, with the goal of ensuring final product
quality. The goal of PAT is to enhance understanding and control the manufacturing
process, which is consistent with our current drug quality system: quality cannot be tested
into products; it should be built-in or should be by design.” (CDER 2004).

31
In addition to the above-cited guideline, other published material shows how
important the drive for the adoption of continuous manufacturing has been in recent
times. This is the subject of the following section.
2.5 - Regulatory Bodies and Good Manufacturing Practices
In order to sell their products, pharmaceutical companies must be aware of
current regulations of the markets where they want to operate. For example, if the
product is to be marketed in the USA, it has to be compliant with the requirements set
by the FDA; similarly, if it wishes for its product to be marketed in Japan, it has to
comply with the Japanese Ministry of Health, Labour and Welfare (MHLW)
regulations. Global manufacturers have also to operate in compliance to rules and
guidance set out by the International Society of Pharmaceutical Engineers (ISPE) and
the World Health Organization (WHO).
Because of the increasing globalization effects, there has been an effort in recent
years towards harmonization of these rules in international markets. Following the birth
of the International Conference on Harmonization (ICH) in April 1990 there has been a
continuous effort to bring “together the regulatory authorities of Europe, Japan and the
United States and experts from the pharmaceutical industry in the three regions to
discuss scientific and technical aspects of product registration”1. For example, the
“Rules Governing Medicinal Products in the European Union”, Volume 4, published by
the European Commission concerning Good Manufacturing Practice (GMP) is in
accordance with “FDA Good Manufacturing Practices for Finished Pharmaceuticals”;
additionally, these two sets of rules are consistent with ISPE good automated
manufacturing practice. Japan’s pharmaceutical affairs law also had to undergo major
changes in order to make it comparable to the Western world rules and regulations on
GMP (Bonanomi 2006).
1 In www.ich.org

32
In the European Union and the European Economic Area2 a framework of laws
and regulations is in place in order to ensure the good functioning of the chemical
products market. Since 1965, when the Council Directive 65/65/EEC on “the
approximation of provisions laid down by law, regulation or administrative action
relating to medicinal products” was put in place, there has been a continuous effort to
regulate the market, in the form of several other directives and amendments to
directives.
Nowadays, as a result of Title IV of Directive 2001/83/EC (last amended in
2004), Governments of Member States have to ensure that pharmaceutical
manufacturers are authorized to operate, in accordance, among other requirements, to
GMP. The guidelines and principles of GMP for medicinal products for human use are
described in Directive 2003/94/EC and the European Community Guide to GMP
includes elements from ISO 9001:2000 with additional requirements specific to
medicines; in the UK, these regulations and other are described in the Rules and
Guidance for Pharmaceutical Manufacturers and Distributors, compiled by the
Inspection and Standards Division of the Medicines and Healthcare products Regulatory
Agency (MHRA), and is also commonly known as the “Orange Book” (MHRA 2007).
In order to be authorized to produce and market chemicals, a company must
comply with the country’s regulatory body’s requirements in order to reduce the risk to
the client due to inadequate safety, quality or lack of efficacy. In particular to the case of
medicinal products and APIs, the manufacturer has to have in place “a comprehensively
designed and correctly implemented system of Quality Assurance incorporating Good
Manufacturing Practice and thus Quality Control”3.
With particular relevance to this work there is the definition and scope of GMP,
the requirements on premises and equipment4, documentation5, production (with special
attention to the “Prevention of Cross-contamination in Production” sub-section)6, the
regulations on buildings and facilities (namely those pertaining to the design and 2 This includes the EU countries plus Iceland, Liechtenstein and Norway 3 in Rules and Guidance for Pharmaceutical Manufacturers and Distributors 2007, p. 43, London, Pharmaceutical Press. 4 Described in Chapter II, Part I, Section 3 of the “Orange Book” 5 Described in Chapter II, Part I, Section 4 of the “Orange Book” 6 Described in Chapter II, Part I, Section 5 of the “Orange Book”

33
construction sub-section)7, process equipment8, guidelines for documentation and
records9 and for the production and process controls (with particular attention to the
contamination control subsection)10.
As defined in the “Orange Book”, GMP is “that part of Quality Assurance which
ensures that products are consistently produced and controlled to the quality standards
appropriate to their intended use and as required by the Marketing Authorization or
product specification.
GMP is concerned with both production and quality control. The basic
requirements of GMP are that:
(i) all manufacturing processes are clearly defined, systematically
reviewed in light of experience and shown to be capable of
consistently manufacturing medicinal products of the required quality
and complying with their specifications;
(ii) critical steps of manufacturing processes and significant changes to
the process are validated;
(iii) all necessary facilities for GMP are provided including:
a. appropriately qualified and trained personnel;
b. adequate premises and space;
c. suitable equipment and services;
d. correct materials, containers and labels;
e. approved procedures and instructions;
f. suitable storage and transport;
(iv) instructions and procedures are written in an instructional form in
clear and unambiguous language, specifically applicable to the
facilities provided;
(v) operators are trained to carry out procedures correctly;
(vi) records are made, manually and/or by recording instruments, during
manufacture which demonstrate that all the steps required by the 7 Described in Chapter II, Part II, Section 4 of the “Orange Book” 8 Described in Chapter II, Part II, Section 5 of the “Orange Book” 9 Described in Chapter II, Part I, Section 6 of the “Orange Book” 10 Described in Chapter II, Part I, Section 8 of the “Orange Book”

34
defined procedures and instructions were in fact taken and that the
quantity and quality of the product was as expected. Any significant
deviations are fully recorded and investigated;
(vii) records of manufacture including distribution which enable the
complete history of a batch to be traced, are retained in a
comprehensible and accessible form.”
The relevant regulations for this work and the adequate measures taken are
described in Table A.1 in the Appendix A.
In addition to this, regulatory bodies have recently published guidelines with the
purpose of making manufacturers fully understand and optimize the way their
pharmaceutical products are developed, evaluated and manufactured, such as the
Critical Path Initiative (CPI) issued by the FDA or the Q8 guideline published by the
ICH guideline which focuses on QbD. These regulatory efforts present the perfect
opportunity for continuous process technology to be embraced and to be successfully
implemented (ICH 2006; FDA 2009).
2.6 - Acceptable Limits of Cross-Contamination
In order to have a sound cleaning procedure, there is the need to set limits with
regard to contamination, most critically in APIs and their finished products. While the
FDA merely affirms that residue limits must be logical, practical, achievable, and
verifiable in its publication “Guide to Inspections of Validation of Cleaning Processes”
(1993), the same regulatory agency, in light of the ICH, has published a set of limits for
impurities in drug substances and drug products (FDA 2003; FDA 2006) (Tables 2.3
and 2.4).

35
Table 2.2 Applicable thresholds for impurities in new drug substances. Notes: 1- Higher reporting thresholds should be scientifically justified; 2 - Lower thresholds can be appropriate if the impurity is unusually toxic. Source: FDA, USA.
Maximum Daily Dose (g)
Reporting Threshold (1,2)
Identification Threshold (2)
Qualification Threshold (2)
≤2
0.05%
0.10% or 1.0 mg per day intake (whichever is lower)
0.15% or 1.0 mg per day intake (whichever is lower)
> 2
0.03%
0.05%
0.05%
Table 2.3 Applicable thresholds for degradation products in new drug products. Notes: 1- Higher reporting thresholds should be scientifically justified; 2 - Lower thresholds can be appropriate if the impurity is unusually toxic; 3 – whichever is lower; TDI – Total Daily Intake. Source: FDA, USA.
Maximum Daily Dose
Reporting Threshold (1,2)
Identification Threshold (2)
Qualification Threshold (2)
≤ 1 g
0.1%
> 1 g 0.05%
< 1 mg 1.0% or 5 µg TDI (3)
1 mg - 10 mg 0.5% or 20 µg TDI (3)
>10 mg - 2 g 0.2% or 2 mg TDI (3)
> 2 g 0.10%
< 10 mg 1.0% or 50 µg TDI (3)
10 mg - 100 mg 0.5% or 200 µg TDI (3)
>100 mg - 2 g 0.2% or 3 mg TDI (3)
> 2 g 0.15%
The regulatory bodies do not set limits of acceptable contamination for specific
manufacturing processes. That is the responsibility of the manufacturer, and the limit set
must be sufficient to guarantee that the bulk API or finished product conform to the
quality requirements. It is, therefore, of utmost importance to clearly define residue
limits both in APIs, finished products and also in the manufacturing equipment used due
to the possible effects those can have in public health (LeBlanc 2000; Basak et al 2007).

36
A particularly relevant study about acceptable contamination levels was carried out by
LeBlanc (2000) and limits are defined in the following way:
Considering BL1 as the limit of the target residue (in this case, the target residue
is the bulk active APIA) in any finished drug product in which the residue may
ultimately be found, it is calculated as:
SF1000000Prod of dosedaily minimumAPI of dosedaily minimum BL
B
A1 ××
= (2.3)
APIA – Bulk active A. ProdB – Finished product B SF – Safety Factor (= 0.001)
Taking BL2 as the limit of the residue in the API used in the manufacture of the
finished drug:
×=
B B12 Prodin API %
100 BL BL (2.4)
Cross-contamination levels can then be set and safety limits of operation can be
established when the production of different chemicals are involved, as in this project,
ensuring that the manufactured chemical and pharmaceutical entities respect the quality
guidelines currently in place.
2.7 – Summary
The relevant background information covering OBR and COBR, fouling and
cross-contamination, cleaning strategies, regulatory guidelines and acceptable limits of
cross-contamination is reviewed in this chapter. While it is evident that extensive work
has been carried out in order to understand the characteristics and possible applications

37
for the OBR, the work herein described is the first to investigate the robustness and
adaptability of the COBR to different synthesis of chemical and pharmaceutical entities
in tandem. It is also the first to establish a reliable, fast and cost-efficient cleaning
procedure that satisfies the current regulatory guidelines in a GLP/GMP environment.

38
Chapter 3
EXPERIMENTAL APPARATUS
An experiment is a question which science poses to Nature,
and a measurement is the recording of Nature's answer.
Max Planck, physicist
This chapter is dedicated to the description of the equipment used in the
experiments carried out in the OBR and COBR, as well as in the analytical assessment.
There are three main sections in this chapter: the first addresses the OBR experimental
setup, the second focuses on the planning, design and setup of the continuous work and
the last section describes the analytical methods used to assess the quality of the work
executed.
3.1 – The Setup of OBR
A description of the OBR setup used for batch studies of the various chemistries
is presented in this section.
The OBR was 25 mm in diameter and had a total working volume of 60 mL.
Figure 3.1 shows the OBR with the baffle set, when dismounted from the supporting
frame. Figure 3.2 represents the scheme of the used OBR.

39
Figure 3.2 Scheme of the OBR
A – Sew Eurodrive motor; B – Temperature reading unit; C – PTFE lid; D – Supporting
frame; E – Baffle set; F – Thermocouple; G – Glass-jacketed OBR; H – Discharge valve
Figure 3.1 Photo of the batch OBR

40
The reactor was made of jacketed glass in order to perform temperature-
controlled experiments and has a burette-style valve at the bottom for sampling. The
used baffle set was made of stainless steel plates; the baffles had a thickness of 3 mm
and the internal diameter was 13.5 mm. The distance between the baffles is 33.5 mm.
The oscillation was provided by a SEW Eurodrive motor and was controlled by a SEW
Eurodrive frequency inverter. The hot water that circulated inside the OBR jacket
during the experiments was provided by a Grant W28 hot water bath and a K-type
thermocouple (limit of error ±0.55 oC) fitted through the OBR top was used for
temperature control.
3.2 – The Setup of COBR
A COBR was purposefully designed and built to specifications in order to carry
out the selected synthesis of the fine chemical and active pharmaceutical ingredients.
The reactor has an internal diameter of 15 mm and a total working volume of circa two
litres. Figure 3.3 is a photo of the reactor, which is supported by an aluminium frame.
The COBR was made of jacketed glass with PFA (perfluoroalkoxy) baffles and
composed of 15 glass sections, each 700 mm long. Each baffle was 22.7 mm apart from
the others and 3mm thick with an internal diameter of 7.5 mm. PFA was the baffle
material of choice because it belongs to a class of compounds known to have the lowest
surface energy of all solid materials and a fully fluorinated, micro-void free surface,
which makes this a non-stick material (McKeen 2006). Those characteristics coupled
with the fact that PFA is virtually chemically inert and the possibility of using it at
temperatures up to 260 oC (Fleming et al 2001) make it ideal to be used in the type of
chemical reactions to be undertaken in the COBR, where strong acids and high
temperature are going to be used. The use of any other common and cheaper materials
for the construction of the reactor would carry the risk of chemical or heat degradation.
Product deposition and encrustation is also a phenomenon that is reduced by using PFA.

41
Figure 3.3 Photo of the COBR
The following scheme (Figure 3.4) details the COBR setup, with the relative
location of the valves, ports, thermocouples and pressure gauges. The assembly of the
COBR was carried out by NiTech Solutions Ltd.

42
Oscillation was provided by the Copley Controls Corp. XTA38 servotube
actuator connected to the PTFE bellows, which provide the linkage to the COBR
(Figure 3.5). The actuator is controlled by a purpose built control unit, which allows a
fine control over frequency and amplitude.
Figure 3.4 Layout of the COBR: B – Bellows; F1 and F2 – Feed valves; P1 to P3 – Pressure gauges; PV – Product 3-way valve; S1 to S4 – Sampling valves; T1 to T4 – Thermocouples; V1 to V4 – Purge valves (V3 and V4 can also be used as sampling valves).
Figure 3.5 The Copley Controls XTA38 actuator. Source: Copley Controls – Division Analogic Corporation

43
The COBR was equipped with two entry ports and two discharging ports. The
latter ports were controlled via a 3-way valve. The sampling of the reaction mixture
inside the reactor was done via four sample ports located along the reactor. Located at
each top bend there are the purge valves which can also function as sample ports. In
order to control the operational conditions four K-class thermocouples (limit of error
±0.55 oC) and three pressure gauges (0-4 bar) were fitted at different locations along the
COBR shown as T1-T4 and P1-P3 in Figure 3.4. All the 36.5 mm long sleeves that
connect the glass tubes, valves, taps and pressure gauges were made of stainless steel
316 with BSP threads.
The product hoses were made of temperature and chemical resistant non-
corrugated FEP (Flourinated Ethylene Propylene) and have an internal diameter of 14.7
mm. The entry ports are connected to chemically resistant Chem-Durance® peristaltic
pump ready tubes, with an internal
diameter of 7.9 mm.
Two Watson-Marlow 520S pumps
(Figure 3.6) were employed to pump the
starting materials and solvents into the
COBR, ensuring that the range of
operational flowrates used are covered.
One of the COBR’s entry ports was
connected to a purpose-built feeder DN80
glass-jacketed OBR, which is supported
by an aluminium frame located inside the
fume hood.
The OBR feeder had a total volume capacity of 1000 ml and can be sealed with
a PTFE lid, as a first barrier for developing fumes. It was equipped with 3 entry ports
(internal diameters of 22.2 mm, 17.2 mm and 12.7 mm, respectively) and a PTFE tap-
controlled outlet port. The baffle set was made of PTFE connected by stainless steel
rods, with an interval of 113 mm. The baffles had an internal diameter of 34.7 mm and
are 3.4 mm thick. These materials were chosen due to their high chemical and heat
resistance, and were found adequate for the chemistry being studied. The motor that
Figure 3.6 The Watson-Marlow 520S peristaltic pump, used to pump starting materials to the COBR. Source: Wtson-Marlow Bredel Pumps – Spirax-Sarco Engineering Group

44
drives the baffle set was a Parvalux RS718-010 - a powerful and small-footprint unit -
and was controlled by a Eurotherm 650 frequency inverter. Figure 3.7 shows the
assembled OBR in the supporting frame. This setup was placed inside a fully ventilated
fume hood for safe operation.
The hot water was provided to the
COBR and the OBR feeder via two water
baths: Grant W28 and Grant Y28, both with
28 litres of capacity and a maximum working
temperature of 99 oC (Figure 3.8).
Figure 3.7 The batch OBR feeder
Figure 3.8 Grant W28 water bath

45
3.3 – Materials
This section describes the materials used for each of the experiments carried out
in this project.
3.3.1 - Bis(2,4,6-trichlorophenyl) oxalate
All the reactants used for this experiment were supplied by Sigma-Aldrich (St.
Louis, USA). The 2,4,6-trichlorophenol 98% (code T55301-50G) used was is powder
form and had a light brown appearance. Triethylamine >99% (code T0886-100ML) was
a colourless liquid with an amine-like odour. Oxalyl chloride >99% (code 221015-25G)
was a pungent, clear liquid. The solvent used, anhydrous toluene 99.8% (code 244511-
1L), was a colourless liquid. Anhydrous hexane 95% (code 296090-1L), used for the
vacuum filtration, was a clear liquid.
3.3.2 - Methyl diantilis
Methanol and amberlyst-15 were sourced from Sigma-Aldrich (St. Louis, USA).
3-ethoxy-4-hydroxybenzyl alcohol was acquired from Fluorochem (Glossop, UK).
Acting both as reaction medium and reactant, anhydrous methanol 99.8% (code
322415-1L) was a colourless liquid. The catalyst used, amberlyst-15 (code 216380-
25G), was in the form of light yellow spherical pellets that had to be treated with
methanol before being used in the experiment. 3-ethoxy-4-hydroxybenzyl alcohol (code
018670) had a white powder appearance.
3.3.3 – Vanisal sodium
Vanillin and sodium hydrogen sulphite was purchased from Sigma-Aldrich (St.
Louis, USA). The purified water used was sourced from Heriot-Watt University
(Edinburgh, UK). Vanillin 99% (code V1104-100G) had a very light yellow powder

46
appearance and sodium hydrogen sulphite 40% solution (code 13438-1L-R) was a clear
liquid.
3.3.4 – Acetylsalicylic acid
The salicylic acid, acetic anhydride and sulphuric acid used for this experiment
were acquired from Sigma-Aldrich (St. Louis, USA). The purified water, used to
decompose excess acetic anhydride and in the vacuum filtration, was sourced from
Heriot-Watt University (Edinburgh, UK). Salicylic acid >99% (code 247588-500G) had
a white crystalline appearance. The acetic anhydride >99% (code 320102-1L) used was
a pungent, colourless liquid. Sulphuric acid 95-98% (code 320501-1L) was a clear,
thick liquid.
3.3.5 – Paracetamol
The p-aminophenol and acetic anhydride used were acquired from Sigma-
Aldrich (St, Louis, USA). The purified water, used as a solvent and also in the vacuum
filtration, was sourced from Heriot-Watt University (Edinburgh, UK). The p-
aminophenol 98% (code A71328-1KG) used had a light brown powder appearance.
The acetic anhydride used had the same origin as the one utilized for the acetylsalicylic
acid experiments.
3.4 – Analytical Equipment
The following section describes the analytical instrumentation that was used to
analyze the samples taken from the experiments. The equipment covers a wide range of
analytical techniques: Infrared Spectroscopy, Nuclear Magnetic Resonance

47
Spectroscopy, High Performance Liquid Chromatograpy, Scanning Electron
Microscopy, X-Ray Diffractometry and Particle Size Distribution.
3.4.1 – Infrared Spectroscopy
Infrared spectroscopy (IR) was used to analyze the Bis(2,4,6-trichlorophenyl)
oxalate and methyl diantilis produced. The equipment used at Heriot-Watt University
was a Perkin Elmer Spectrum FT-IR System (Figure 3.9). For the cyalume analysis the
KBr pellet technique was used, whereas to analyse the fragrance tetrafluorocarbon-
washed glass disks were used.
Figure 2.9 The Perkin Elmer Spectrum FT-IR system used (Organic Chemistry laboratory, Heriot-Watt University)

48
3.4.2 – Nuclear Magnetic Resonance Spectroscopy
The produced vanisal sodium was analyzed using Nuclear Magnetic Resonance
(NMR) spectroscopy. The equipment used at Heriot-Watt University was a Bruker
DPX400 NMR spectrometer (13C at 100 MHz) equipped with pulsed field gradients, as
illustrated in Figure 3.10.
3.4.3 – High Performance Liquid Chromatography
The High Performance Liquid Chromatography (HPLC) equipment used at
NiTech Solutions Ltd was a Varian Prostar 230 (Figure 3.11) and the method used for
analysing both acetylsalicylic acid, paracetamol and vanisal sodium was an adaptation
of the method developed by Franeta et al (2002): the chromatography column was a
reverse-phase YMC ODS-AQ (250 x 4.6 mm; 5 μm packing), the UV detector was set
at 254 nm and the mobile phase was composed by acetonitrile (A) and water with
phosphoric acid at pH 2.6 (B). In each run the chromatography program was started
with 10% v/v of A and 90% v/v of B, with a flow rate of 1 mL min-1. The mobile phase
composition was then gradually transformed to 100% of A over a period of 20 minutes
and the program was stopped at 25 minutes.
Figure 3.10 Bruker DPX400 NMR spectrometer

49
3.4.4 – Scanning Electron Microscopy
Scanning Electron Microscopy (SEM) was used to observe in detail samples of
the acetylsalicylic acid and paracetamol crystals produced. These were imaged using a
Hitachi S-2700 Microscope (Figure 3.12), available at the Chemistry Department in
Heriot-Watt University. The crystals were gold coated and then observed at a
magnification of 30× and 200×, using 10 kV accelerating voltage.
Figure 3.11 Varian Prostar 230 used for HPLC analysis
Figure 3.12 Hitachi S-2700 Microscope used for SEM analysis

50
3.4.5 – X-Ray Diffractometry
X-Ray Diffractometry (XRD) was carried out to determine the diffraction
patterns of the acetylsalicylic acid and paracetamol produced. A Bruker D8 Discover
transmission X-Ray diffractometer with a Cu-Kα target, pictured in Figure 3.13, was
used. The tube voltage and current was 40 kV and 40 mA, respectively and the θ angle
increments of two degrees. The gathered data was obtained using the wide angle x-ray
scattering (WAXS) technique and the EVA data handling package was used to process
the results. It is available in the Chemistry Department at Heriot-Watt University.
3.4.6 – Particle Size Distribution
A Malvern Mastersizer S equipped with a liquid sample holder, available at the
Institute of Petroleum Engineering in Heriot-Watt University (Figure 3.14), was used
for particle size distribution studies of the paracetamol crystals produced. After testing
Figure 3.13 Bruker D8 Discover transmission X-ray diffractometer used for XRD analysis

51
several liquid media, Multipar H oil was found to be the best in order to suspend the
studied particles.
Figure 3.14 Malvern Mastersizer S used for particle size distribution studies
52
Chapter 4
CHEMISTRY SCREENING
Just as houses are made of stones, so is science made of facts;
but a pile of stones is not a house and a collection of facts is not necessarily science.
Henri Pointcaré, mathematician, philosopher of science
The selection process for the chemical entities to be studied in a batch OBR and,
subsequently, in continuous fashion using a COBR began by screening different
chemistries. A series of criteria were established in order to narrow down the potential
candidates to a maximum of three. These were:
1. Type of chemistry
Considering that the OBR/COBR mixing technology is suitable for a wide range
of chemistry, pharmaceutical and food processes (see Chapter 2), this work is
focused on the fine chemicals and pharmaceuticals.
2. Industrial relevance
This PhD project is sponsored by EPSRC and NiTech Solutions Ltd. via an
EPSRC industrial CASE studentship. The chemistries that are relevant to
NiTech Solutions Ltd. are industrially driven, with a particular emphasis on the
pharmaceutical market.
3. Cost
The cost of carrying out the experiments was one of the major factors that shape
the scope of the project. With a final objective of carrying out a week-long
production run for each of the three selected chemical reactions, the overall costs

53
for the equipment (e.g. COBR), consumables (e.g. solvents and reactants) and
analytical tests must be within the limited budget.
4. Reaction time
Bearing in mind the budget of the project, the reaction time should ideally be
less than one hour in literature, ensuring that the reactor will not be too long and
thus expensive;
4.1 – Chemistries excluded
With the objective of proving that the OBR/COBR design can be a viable
alternative to the stirred tank reactor in the manufacture of fine chemicals and
pharmaceuticals both in terms of efficiency of the process and quality of the products
obtained, several different chemistries were initially considered for this project. Four of
them were excluded from experimental studies due to factors such as cost of starting
materials, cost of having to use more equipment associated with the synthetic or
isolation steps or simply because the experimental workup required time-consuming
steps (eg. sample treatment for analysis) that prevented a single operator to carry out the
experiments in a focused and safe manner. These chemistries, described in the
following sections, were warfarin sodium, nitisinone, tesmilifene and acamprosate
calcium.
4.1.1 – Warfarin sodium
Warfarin sodium is a well-know and established anticoagulant drug and
powerful rodenticide (Ashkar et al 2004). The name is derived from the initials of the
Wisconsin Alumni Research Foundation, the organism that provided funding for initial
research into this chemical entity to Karl Link, a professor at the University of
Wisconsin (Link 1959).

54
Link’s work on warfarin was first motivated by a series of unexplained cattle
deaths in the 1920’s. These deaths were later associated with spoiled hay made from
sweet clover that caused cattle death by severe haemorrhaging. Link and his team were
eventually successful in isolating the anticoagulant agent and finally proved that
synthetic dicoumarol was identical to the naturally occurring chemical entity, in 1940.
(Stahmann 1941) Work on several similar chemicals wielded more potent anti-
coagulants, and one of those new chemical entities, warfarin, was patented by Karl Link
and first marketed as a rodenticide. Further studies investigated its properties as a
therapeutic anti-coagulant and warfarin started being prescribed for heart attack
sufferers in 1955 (Link 1959).
The synthesis of warfarin sodium involves stirring pure warfarin acid and
sodium carbonate (1:1.6 molar ratio) in an absolute ethanol medium at a temperature of
30 oC for two hours, with the isolation steps requiring a vacuum filtration and oven
drying. Figure 4.1 describes the synthetic step (Ashkar 2004):
Figure 4.1 Synthesis of warfarin sodium
This synthesis was not selected for experimental studies due to the high cost of
purchasing warfarin acid. Also, the stirring time is above what was desirable for this
project.
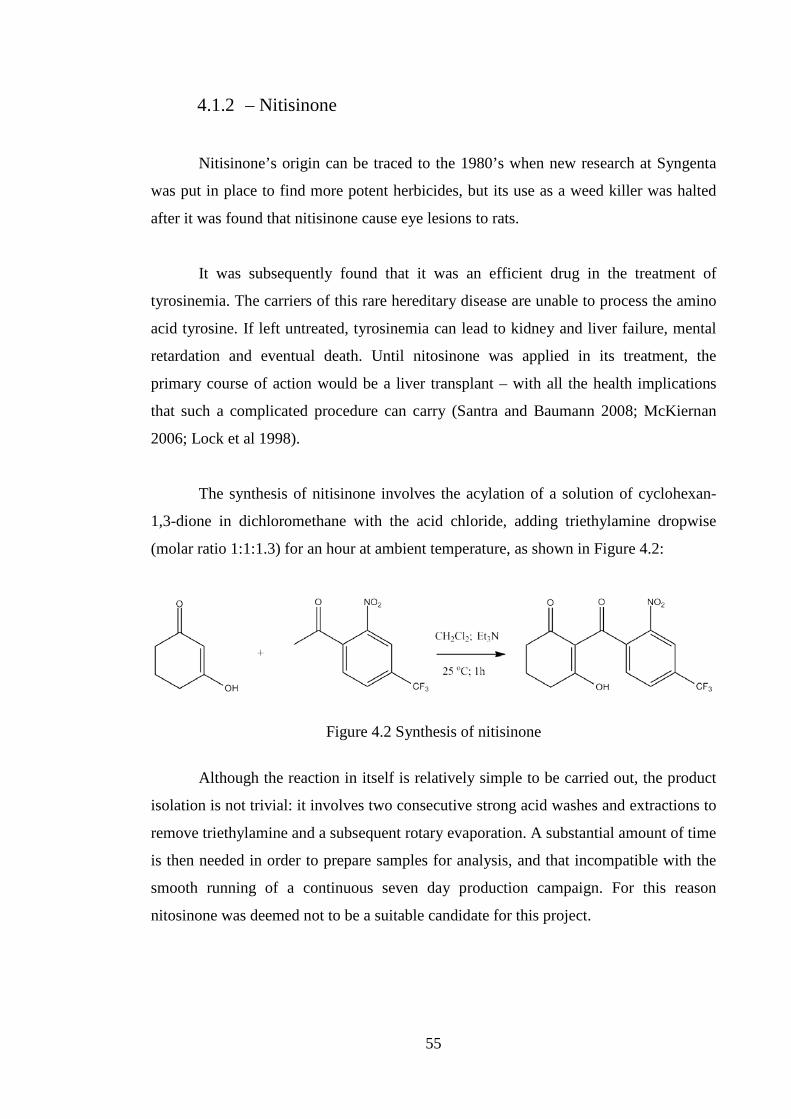
55
4.1.2 – Nitisinone
Nitisinone’s origin can be traced to the 1980’s when new research at Syngenta
was put in place to find more potent herbicides, but its use as a weed killer was halted
after it was found that nitisinone cause eye lesions to rats.
It was subsequently found that it was an efficient drug in the treatment of
tyrosinemia. The carriers of this rare hereditary disease are unable to process the amino
acid tyrosine. If left untreated, tyrosinemia can lead to kidney and liver failure, mental
retardation and eventual death. Until nitosinone was applied in its treatment, the
primary course of action would be a liver transplant – with all the health implications
that such a complicated procedure can carry (Santra and Baumann 2008; McKiernan
2006; Lock et al 1998).
The synthesis of nitisinone involves the acylation of a solution of cyclohexan-
1,3-dione in dichloromethane with the acid chloride, adding triethylamine dropwise
(molar ratio 1:1:1.3) for an hour at ambient temperature, as shown in Figure 4.2:
Figure 4.2 Synthesis of nitisinone
Although the reaction in itself is relatively simple to be carried out, the product
isolation is not trivial: it involves two consecutive strong acid washes and extractions to
remove triethylamine and a subsequent rotary evaporation. A substantial amount of time
is then needed in order to prepare samples for analysis, and that incompatible with the
smooth running of a continuous seven day production campaign. For this reason
nitosinone was deemed not to be a suitable candidate for this project.

56
4.1.3 – Tesmilifene
Tesmilifene, a drug still in development, has shown promise as an antitumor
agent. The mode of action is as yet unknown, but it has been proved that it enhances
the activity of several classes of chemotherapy agents against cancers that are
resistant to other drugs in patients with symptomatic metastases (Raghavan et al
2005; Lednicer and Mitscher 1999).
The last synthetic step is an alkylation. An acidic solution of p-benzylphenol is
reacted with 2-chlorotriethylamine for 30 to 60 minutes, at 55 to 60 oC, as shown in
Figure 4.3 (Brandes and Hermonat 1989):
Figure 4.3 Synthesis of tesmilifene
The synthesis is relatively simple to carry out, but during the reaction two layers
are formed. Similarly to the nitisinone product isolation, this involves two washes (the
first one with sodium hydroxide and the second with hydrochloric acid) and a
subsequent vacuum drying step. Thus, preparing samples for analysis is a labour
intensive procedure that is not compatible with the running of a production campaign.
The synthesis of tesmilifene was not pursued in this project due to this reason.
4.1.4 – Acamprosate calcium
In recent years there has been a drive towards finding effective drugs to control
alcohol addiction. Homotaurine, an antagonist of γ-aminobutyric acid (the main
inhibitory neurochemical which takes part in the regulation of excitability throughout
the mammalian nervous systems), is thought to stabilize the brain’s chemical balance
that is disrupted by the abuse of alcoholic substances. Acamprosate calcium, the

57
calcium salt of the n-acetyl derivative of homotaurine has the same therapeutic effects
and helps maintaining abstinence by preventing relapse. It was approved by the FDA
for human use in 2004 (Williams 2005; Watanabe 2002; Lednicer and Mitscher 1999).
For this acylation calcium hydroxide, acetic acid and homotaurine are stirred in
water until dissolution at a temperature of no more than 40 oC (molar ratio 1:2:2). A
slight excess of acetic anhydride is then added and the solution is left to stir between 30
and 40 oC for an hour. The solution is then concentrated under vacuum (Durlach 1982;
Lednicer and Mitscher 1999) Figure 4.4 shows the scheme of the reaction:
Figure 4.4 Synthesis of acamprosate calcium
Acamprosate calcium is a very interesting molecule from the point of view of its
therapeutic effects, and its synthesis and isolation is straightforward. It would be an
ideal chemistry to include in this project, but the prohibitive cost of homotaurine
excluded the possibility of studying this chemistry further.
4.2 – Chemistries selected
Five different chemistries were pre-selected for screening. The chemical
products studied in batch belong to the cosmetics & toiletries (C&T) and the
pharmaceutical markets and include a cyalume (bis(2,4,6-trichlorophenyl) oxalate), two
fragrances (methyl diantylis and vanisal sodium) and two APIs (acetylsalicylic acid and
paracetamol).
The European pharmaceutical industry alone accounts for 19.2% of all business
related R&D investments and represents around 3.5% of the total EU manufacturing
value added. Despite being valued at circa €150 billion in 2007, having grown at a

58
median rate of 7% over the previous ten years, the pharmaceutical market in Europe
accounted for less than a third of the total world pharmaceutical market in that year
(EFPIA 2009). On the other hand, the European Union Cosmetics & Toiletry (C&T)
market was valued at circa €62 billion in 2008. Accounting for 14.8% of this total, the
market in the UK had grown by circa 10% from the previous year (COLIPA 2008).
Figure 4.5 depicts the European Union C&T market and the relative importance of each
continent in the world pharmaceutical market.
In the following sections the fine chemicals and pharmaceutical compounds that
were screened for this study are described in more detail. The synthesis of each studied
compound was executed according to the literature and the results obtained from the
batch experiments can directly be applied to the COBR. In order to perform the
experiments in the batch OBR the available protocols had to be adapted and typical
procedures used are described hereinafter, followed by the obtained results.

59
Figure 4.5 European Union Cosmetics and Toiletries Market sales in 2006 and the World Pharmaceutical Market in 2007, in COLIPA 2008 and EFPIA 2009 (adapted)

60
4.2.1 – Bis(2,4,6-trichlorophenyl) oxalate
This compound belongs to the family of cyalumes. Cyalumes are symmetrical
diesters that when in contact with peroxides undergo a series of exothermal chemical
reactions, producing carbon dioxide and light in the presence of a colorizing molecule.
This class of molecules is the result of long years of research that started in the 1960’s,
when scientists were trying to explain the chemiluminescence phenomenon. One such
scientist was Edwin Chandross: when working at Bells Laboratories, he discovered the
underlying mechanism behind this type of reaction. Currently the owner of more than
60 patents (Sturchio 2005), he later found out that because he failed to patent his
discovery he missed on a very profitable business. The company that patented the
“Chemical Light Device” was the American Cyanamid Company (Zandt 1977), which
benefited from Edwin Chandross’ work and took it one step further - Michael Rauhut
tried to improve the efficiency of the chemiluminescent reaction by synthesizing a series
of oxalate esters and was ultimately able to raise Edwin’s 1% quantum yield to 5%
(Wilson 1999; Peters 2002).
Nowadays, the lightstick business is a multimillion industry. It has found uses in
the military, fire-fighters, police corps, in outdoors activities such as fishing, hiking and
camping and even in our cars and homes. Its popularity is due to its durable and
waterproof container that does not depend on batteries and does not create sparks,
therefore being one of the most dependable and safe sources of light. Cytec Industries,
the company that owns the Cyalume trademark, was worth circa €534M in March 2009
(Fortune 2009).
The chemical reaction that is used to produce bis(2,4,6-trichlorophenyl) oxalate
is as shown in Figure 4.6:
Cl
Cl
Cl
OHCl Cl
O O
Cl
Cl
Cl
O
Cl
Cl
Cl
O
O O
+22Et3N
+ 2Et3NH. Cl
2,4,6-Trichlorophenol oxalyl chloride Bis(2,4,6-trichlorophenyl)oxalate Figure 4.6 Synthesis of bis(2,4,6-trichlorophenyl) oxalate

61
The synthesis procedure described in literature is similar to the one described in
the following section, with the exception that reflux is required for 20 minutes.
Refluxing the solvent requires more equipment and makes the setup more complicated,
which is a clear process disadvantage. The reported yield for this reaction is 60%
(McCapra 2000; Jasperse 2007).
4.2.1.a – Synthesis of bis(2,4,6-trichlorophenyl) oxalate
The procedure used is as follows:
1. Weigh out 5.27 g of trichlorophenol; transfer it to the batch OBR;
2. Add 40 mL of toluene and 3.70 mL triethylamine (using a syringe) and begin
oscillation (ν = 2.0 sec-1; x0 = 40 mm);
3. Cool the reactor to 5 °C using ice-water bath and add 1.30 mL of oxalyl
chloride;
4. Plug a hot water bath (Twater = 95°C) to the OBR for 10 minutes;
5. Transfer the reaction product to an Erlenmeyer flask and chill it, using a ice-
water bath;
6. Perform a vacuum filtration, using hexane;
7. Dry the solid in the oven for two hours at 30°C;
8. Wash the solid with purified water (the cyalume is insoluble, whereas the
formed triethylamine hydrochloride is soluble in water);
9. Filter the product using a vacuum apparatus and purified water;
10. Oven-dry the solid (o/n, 30 °C) and weigh the samples.
Due to the toxicity of the chemical compounds involved in this synthesis, it was not
possible to take several samples along the reaction time. A 10 mL sample was taken at
the end of the reaction and was isolated in the way previously described.

62
4.2.1.b – Results
Due to the toxicity risk posed by all of the reactants used it was not possible to
sample the reaction while it was occurring - the safety guidelines suggested that it was
advisable to stop the reaction at a given time so that the product could be analyzed
safely. Figure 4.7 shows the temperature profile inside the OBR after the oxalyl chloride
was added to the solution, when the hot water bath was plugged to the reactor. The
boiling point of the used solvent (toluene) is 110-111 oC. Refluxing the reaction
mixture, as suggested in literature, indicates that the reaction should be performed at
higher temperatures than those recorded in this experiment.
Upon addition of oxalyl chloride the reaction progressed and the mixture inside
the reactor changed within the first minute from orange to a brownish colour. The
resulting precipitate became a pale yellow powder after the isolation steps. The obtained
yield of 67% is superior to that described in literature (60%).
Figure 4.7 Temperature profile inside the OBR

63
Figures 4.8 and 4.9 compare the IR spectrum obtained for the product sample
with the IR spectrum published in literature. It is evident that they are similar, proving
that the obtained product is indeed the cyalume. The band at 3435 cm-1 indicates the
presence of the hydroxyl group, possibly from water residues left from the isolation
procedure. Table 4.1 correlates the IR peaks from the spectrum with the molecular
structure of the synthesised bis(2,4,6-trichlorophenyl) oxalate.
Figure 4.8 IR spectrum of the synthesized Bis(2,4,6-trichlorophenyl) oxalate, KBr disc

64
Table 4.1 IR spectrum peaks and its molecular significance11
Bond Experimental data
peak (cm-1)
Literature data
peak (cm-1)
Aromatic C-H
3084.0
3086
Ester C=O 1786.3 1786
Aromatic C-C 1567.3 1568
1447.4 1449
Ether C-O 1228.0 1229
1110.4 1115
11 The reference IR bands and peaks are described in Morrison, R. and R. Boyd (1992). Organic Chemistry. New Jersey, Prentice-Hall. Literature peaks in National Institute of Advanced Industrial Science and Technology (Japan)
Figure 4.9 IR spectrum for Bis(2,4,6-trichlorophenyl) oxalate, KBr disc. Source: National Institute of Advanced Industrial Science and Technology (Japan)

65
The results gathered for this set of experiments show that performing this
synthesis in OBR would have a number of advantages over the method reported in the
literature (Jasperse 2007). Not only was the reaction time faster than the 20 minutes
cited, but also toluene refluxing was not needed to accelerate and complete the reaction.
It is well-known that the superior mixing and heat-transfer capabilities of the OBR
confer this reactor design a marked advantage over more traditional types of reactors.
This means that less heat is delivered to the system and energy is saved, the risk of
decomposing reactants or product is greatly reduced and the experimental apparatus is
simplified.
The aforementioned health and safety compliance issues prevented further
studies on this chemical species from taking place. In conclusion, it would not be
impossible to adapt this synthesis to the COBR, but this chemistry was not chosen for
further studies in the COBR given the increased cost of adapting and implementing
further safety procedures and equipment.
4.2.2 – Methyl diantilis
The use of perfume and scented materials goes back thousands of years. The
origin of the word “perfume” is associated with the burning of incense, one of the oldest
rituals where aromatic materials played an important part (Latin: per fume). In every
great world civilization references to perfumes and fragrances can be found – from the
Sumerian to the Greek civilizations, the Egyptians and Romans, in all of these cultures
perfume was an important part of life (Pybus 1999; Fortineau 2004). At the end of the
19th century chemistry was replacing alchemy and the work on fragrances prompted
Jean-François Houbigant to produce “Fougère Royale”, founding modern perfumery
(Kraft et al 2000). Nowadays, the perfume industry is a relatively mature one and
thousands of fragrances enter the composition of a myriad of different products. In the
continuous search for new and attractive chemical compounds, organic chemists
regularly synthesize new fragrances.
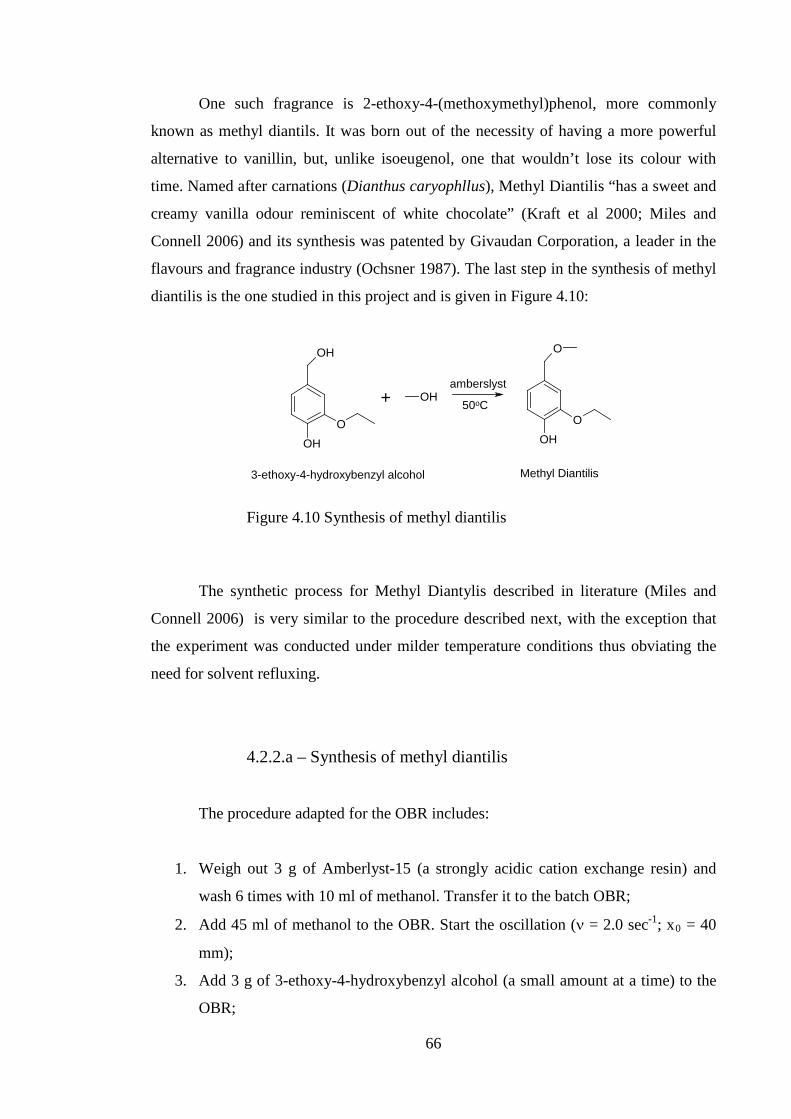
66
One such fragrance is 2-ethoxy-4-(methoxymethyl)phenol, more commonly
known as methyl diantils. It was born out of the necessity of having a more powerful
alternative to vanillin, but, unlike isoeugenol, one that wouldn’t lose its colour with
time. Named after carnations (Dianthus caryophllus), Methyl Diantilis “has a sweet and
creamy vanilla odour reminiscent of white chocolate” (Kraft et al 2000; Miles and
Connell 2006) and its synthesis was patented by Givaudan Corporation, a leader in the
flavours and fragrance industry (Ochsner 1987). The last step in the synthesis of methyl
diantilis is the one studied in this project and is given in Figure 4.10:
O
OH
OH
OH
O
O
OH
+
3-ethoxy-4-hydroxybenzyl alcohol Methyl Diantilis
amberslyst
50oC
Figure 4.10 Synthesis of methyl diantilis
The synthetic process for Methyl Diantylis described in literature (Miles and
Connell 2006) is very similar to the procedure described next, with the exception that
the experiment was conducted under milder temperature conditions thus obviating the
need for solvent refluxing.
4.2.2.a – Synthesis of methyl diantilis
The procedure adapted for the OBR includes:
1. Weigh out 3 g of Amberlyst-15 (a strongly acidic cation exchange resin) and
wash 6 times with 10 ml of methanol. Transfer it to the batch OBR;
2. Add 45 ml of methanol to the OBR. Start the oscillation (ν = 2.0 sec-1; x0 = 40
mm);
3. Add 3 g of 3-ethoxy-4-hydroxybenzyl alcohol (a small amount at a time) to the
OBR;

67
4. Plug the hot water bath (Twater = 62 oC) to the reactor for 15 minutes;
5. Perform a vacuum filtration of the product, using methanol;
6. Remove the solvent using a rotary evaporator under vacuum at 30 oC;
7. Weigh the samples.
The OBR oscillation had to be stopped for a few seconds each time a sample
was taken from the reactor because the design of the particular OBR prevented on-line
sampling. Each 10 ml sample was taken on regular intervals from step 4) in the
procedure, using a small pipette. All samples were isolated as described in steps 5 to 6.
4.2.2 – Results
In line with what happened for bis(2,4,6-trichlorophenyl) oxalate, the synthesis
of methyl diantilis was done with a simpler setup and was quicker to complete in the
OBR than what is described in literature (Miles and Connell 2006) because the use of a
refluxing apparatus was obviated.
As described in the procedure, a pre-treatment of the used catalyst by applying a
methanol washing was necessary before the synthesis could be started, which
transformed the previously crème amberlyst spheres to “dirty white”.
Figure 4.11 displays the temperature profile of the reaction at sampling times
and shows that the temperature inside the OBR remained very stable throughout the
experiment, which was carried out without the need for refluxing the methanol.

68
A deep vanilla scent with carnation notes was evident even from the first sample
taken, thus implying the presence of methyl diantilis. The peak data available by Miles
and Connel (2006) for this chemical compound is the following: IR (neat)
3427,2981,1606 cm-1; 1H NMR (400 MHz, CDCl3) δ 6.87 (m, 2 H), 6.80 (dd, J =1.8,
8.0 Hz, 1H), 5.89 (s, 2 H), 4.11 (q, J = 7.1 Hz, 2 H), 3.35 (s, 3 H), 1.43 (t, J = 7.2 Hz, 3
H). Figures 4.12 to 4.23 show the IR and NMR spectra of the samples, which confirm
the smell analysis and indicate that the reaction was completed within 8 minutes from
the start, considerably faster than the 20 minutes reaction time described by Miles and
Connel (2006). Notwithstanding, the data obtained for some of the samples suggest that
the solvent elimination was not complete – as affirmed by Dr. Alan Boyd, of Heriot-
Watt University, the extra peaks reveal the presence of methanol that was not totally
evaporated from the samples analyzed – and so the vacuum filtration should have been
more thorough. The reaction time might indeed be shorter, but the methanol
contamination of some of the samples prevents from drawing a more definite
conclusion on this matter.
After the isolation steps, the resulting end product was a pale yellow liquid with
the characteristic vanilla and carnation odour of methyl diantilis. The identification of
Figure 4.11 Temperature profile and sampling times for the methyl diantilis reaction.

69
the IR spectrum peaks for the sample where less solvent was found (sample 4) is
described in Table 4.2.
Table 4.2 IR spectrum peaks/bands and its molecular significance1
Bond Literature
Peak/band (cm-1)
Experimental (sample 4)
Peak/band (cm-1)
Aromatic O-H
3427
3367
Aromatic C-H 2981 2945
Aromatic C-C 1606 1604
Figure 4.12 IR spectrum of the synthesised methyl diantilis, sample 1

70
Figure 4.13 1H 400Mhz NMR spectrum of the synthesised methyl diantilis, sample 1
Figure 4.14 IR spectrum of the synthesised methyl diantilis, sample 2

71
Figure 4.15 1H 400Mhz NMR spectrum of the synthesised methyl diantilis, sample 2
Figure 4.16 IR spectrum of the synthesised methyl diantilis, sample 3

72
Figure 4.18 IR spectrum of the synthesised methyl diantilis, sample 4
Figure 4.17 1H 400Mhz NMR spectrum of the synthesised methyl diantilis, sample 3

73
Figure 4.19 1H 400Mhz NMR spectrum of the synthesised methyl diantilis, sample 4
Figure 4.20 13C 100Mhz NMR spectrum of the synthesised methyl diantilis, sample 4

74
Figure 4.21 13C 100Mhz (depth) NMR spectrum of the synthesised methyl diantilis, sample 4
Figure 4.22 IR spectrum of the synthesised methyl diantilis, sample 5

75
In summary, there are two main advantages of performing this reaction in OBR:
it is faster and it is carried out at lower temperatures (energy is saved), which, in turn,
makes the experimental apparatus simpler because there is no need to reflux the solvent.
Once again it is proved that the more efficient mixing occurring in each of the OBR’s
cells leads to better heat transfer and thus to faster reaction times than those observed
for more traditional reactors
The synthesis of this chemical compound was not pursued further in the COBR
due in part to the high costs associated with the purchase of the catalyst, but more
importantly the intrinsic need for its methanol pre-treatment which is more time
consuming than what was foreseen.
Figure 4.23 1H 400Mhz NMR spectrum of the synthesised Methyl Diantilis, sample 5

76
4.2.3 – Vanisal sodium
Vanilla is one of the most popular odours in the fragrance industry. Since the
early 1990’s perfume makers have been incorporating it in their creations as a
significant part of the odour note, and, more recently, Body Shop introduced a pure
vanilla fragrance in the market (Fox 2005).
But while in perfumes vanillin - the molecule that is normally used to evocate
the smell of vanilla - is relatively stable, that does not occur in soap formulations. Due
to the combination of light, heat and the basic conditions in soaps, vanillin and its
derivatives undergo chemical reactions that rapidly transform them into polyphenols
and other detergent products. The outcome of these events is the discolouring of soaps –
from a light tone progressively to brown and eventually black; another consequence is
the loss of foaming power (Vidal 2006; Turin 2007).
The most common path to overcome this problem is to use more odour-potent
chemical variations of vanillin (such as ethyl vanillin) in low enough concentration, use
colouring agents or non-discolouring chemical alternatives to mask the aforementioned
problems. This means that either the resulting soap cannot be clear or the soap does not
have the desired scent properties.
Flexitral Inc. was founded by Luca Turin - the “Emperor of Scent” - where he
has had the opportunity to put to the test the highly controversial vibrational theory in
the creation of new odour molecules. As opposed to the widely accepted lock-and-key
concept defended by the shape theory, the vibrational theory defends that after fitting in
the receptor site, the odour molecule must have a vibrational energy compatible with the
different receptor’s energy levels so that electrons can travel through the molecule via
inelastic electron tunnelling, thus triggering a signal transduction.
This flavours and fragrances company has recently launched in the market two
solutions to the aforementioned problem: vanisal and ethyl vanisal. The company
claims that these two compounds, which are the product of the treatment of vanillin and
ethyl vanillin with a sulfiting agent, do not suffer from discoloration when used in the

77
composition of soaps and retain the much appreciated vanilla scent (O'Hare 2006;
Brechbill 2007; Turin 2007).
The reaction scheme to the production of vanisal sodium is as shown in Figure
4.24:
O
O
OH
NaHSO3
OOH
OH SO3Na
+
vanillin vanisal sodium
H2O
60oC
Figure 4.24 Synthesis of vanisal sodium According to the Flexitral patent, vanisal sodium can be prepared by mixing
equimolar amounts of sodium hydrogen sulphite and vanillin in water, either at room
temperature or at 50 to 60 oC. The reaction is complete when there is no undissolved
vanillin, an indication that it has reacted to form the sulphite adduct.
4.2.3.a – Synthesis of vanisal sodium
The following steps are followed in order to perform this synthesis:
1) Transfer 35 mL of purified water to the batch OBR;
2) Heat the reactor to 60 °C; Measure 3.86 g of vanillin and 7.2 mL of sodium
hydrogen sulphite 40%. Transfer it to the batch OBR;
3) Start the oscillation (ν = 2.0 sec-1; x0 = 40 mm) and mix for 10 minutes;
4) Transfer the solution to a beaker and put it in the oven (35 °C, overnight) and
weigh the samples.

78
4.2.3.b – Results
For the experiments just 10 to 12 seconds were sufficient after the oscillation
had started in the OBR for the mixture to become transparent, a clear indication that the
reaction was complete. This suggests that the reaction can indeed progress at lower
temperatures using an OBR, thus saving energy in the process. Although the patent that
describes the method of manufacture of vanisal sodium (Turin 2007) does not mention
reaction times, it was later stated in private correspondence with Luca Turin, the Chief
Technical Officer of Flexitral, that the reaction times obtained in this set of experiments
are “a little fast, but not wildly so” compared to the benchmark set by the company that
markets this chemical entity. The mixing and heat transfer capabilities of the OBR were
again tested and, as it had happened for the previously studies chemistries, this reactor
design proved to be more efficient when compared to a more traditional design.
Because the solution became transparent so quickly, only one sample was taken
after 15 seconds of reaction time. The vanillin scent was evident and after the sample
was oven-dried the resulting powder was analysed via NMR. A comparison between the
spectrum obtained and the reference for pure vanillin (Figures 4.25 and 4.26) show a
new peak at δ = 85.49 ppm, revealing the presence of a previously non-existent
hydroxyl group attached to a tertiary carbon atom. This proves that the analysed sample
was of vanisal sodium. The dried sample had a brittle white solid aspect, which was also
consistent with the appearance of vanisal sodium as described by Luca Turin in the
aforementioned private correspondence.

79
Figure 4.25 NMR spectrum of vanisal sodium

80
While being relevant for the valuable cosmetics and toiletries market, this was
also the first chemical compound that gathered all the conditions and characteristics
suitable for further studies in COBR, in order to prove its competence in the
manufacture of fine chemicals. It was proved that the reaction is fast, economical and
safe to operate from a health and safety point of view.
Figure 4.26 Reference NMR spectrum of vanillin. Source: AIST, Japan

81
4.3.4 – Acetylsalicylic acid
Acetylsalicylic acid, or aspirin as it is more commonly known, was born out of
the necessity of having an alternative to salicylic acid, which, despite working well to
relieve aches and pains, is hard to swallow and causes irritation to the digestive tract
(Osborne 1998). When assigned to this task, Felix Hoffman of the Bayer
pharmaceutical company came up with a method to make acetylsalicylic acid in 1897,
two years after having started his research – a drug that not only was very efficient in
the treatment of pain fever and inflammation, but also tasted better – and was granted a
US patent to the process in 1900 (Hoffmann 1900; Henderson 2007)12.
More than a century after the Bayer pharmaceutical company started selling
aspirin, it still is one of the most widely used over-the-counter (OTC) drugs in the
world. Nowadays over 100 billion tablets are produced and consumed annually, the
equivalent to circa 35,000 tons. Despite facing hard competition coming from the
generics manufacturers, aspirin is the 2nd top selling Bayer Consumer Health product,
with sales close to €720M (BAYER 2009). With around 3500 scientific papers every
year dedicated to it, aspirin is no longer regarded simply as a pain reliever or an anti-
inflammatory drug. Figure 4.27 shows the current usage trends for aspirin, and recent
studies claim that this drug might be used against colon, ovarian and breast cancer and
also to improve brain function (Nordenberg 1999).
12 Despite this being the “official” version of Bayer AG., there is still some controversy to whom should the discovery and commercialization be credited. in Sneader, W. (2000). "The discovery of aspirin: a reappraisal." British Medical Journal 2000(321): 1591-1594.

82
The synthesis of acetylsalicylic acid, as idealized by Hoffmann, involves the
acetylation of salicylic acid by acetic anhydride in an acidic medium, as showed in
Figure 4.28:
OH
COOH
O
CH3CH3
OO
COOH
OCH3
OO
CH3OH+ +
salicilic acid acetic anhydride acetylsalicylic acid acetic acid
H+
95oC
Figure 4.28 The synthesis of acetylsalicilic acid
The traditional process of producing acetylsalicylic acid typically involves
mixing a small stoichiometric excess of acetic anhydride with salicylic acid. This
reaction is catalyzed by sulphuric acid and, and when performed at 85-90 oC takes
between 20 minutes to 2 hours to complete (Kamlet 1956; McKetta and Cunningham
1977; Metz 2002).
14.10%
12.20%
13.80%
23.30%
37.60%
Other
Body ache
Headache
Arthritis
Heart disease
%
Figure 4.27 – Popular used for aspirin. Source: Bayer AG. (adapted)
salicylic

83
4.2.4.a – Synthesis of acetylsalicylic acid
The synthesis of acetylsalicylic acid involves the following steps:
1. Weigh out 15 g of salicylic acid and transfer it to the batch OBR;
2. Add 40 mL of acetic anhydride and 2 mL of concentrated sulphuric acid;
3. Switch on the pre-heated water bath (Twater = 95 °C) to heat the OBR. Switch the
oscillation (ν = 2.0 sec-1; x0 = 40 mm) on and mix for 10 minutes;
4. Transfer the solution to an Erlenmeyer flask. Chill the mixture using an ice-
water bath and add 20 mL of purified water to decompose any excess acetic
anhydride. Chill it until crystals of aspirin no longer form; mix it gently
occasionally to decompose residual acetic anhydride. If an oily substance
appears instead of a solid precipitate, reheat the solution until the substance
disappears and cool it again.
5. Perform a vacuum filtration of the product, using purified water to wash the
crystals;
6. Dry the crystals in the oven (30 °C; overnight);
7. Determine the mass of the crude aspirin crystals.
Each sample was taken at regular intervals from step 3) in the procedure, using a
small pipette. All samples were purified in a similar fashion to the way described.
4.2.4.b – Results
Samples were taken from the reactor every 2 minutes for a total duration of 10
minutes. Figure 4.29 shows the temperature profile of the reaction at sampling times.

84
The temperature measurements taken at sampling times indicate that the
temperature inside the OBR rose steadily, quickly providing a suitable environment for
the reaction to proceed rapidly.
It was also observed that 10 seconds after the heated water-bath was connected
to the reactor and the oscillation was started the solution was already clear, with no
signs of salicylic acid solid aggregates, a sign that the mixing inside the OBR was
efficient. In fact, the HPLC chromatograms (Figures 4.30 and 4.31) indicated that even
in the first sample (taken 60 seconds after the reaction was started) there was little sign
of reactants left or side products, as confirmed in Figure 4.30 – the existent peak at 10
minutes of elution is relative to acetylsalicylic acid, as confirmed by the commercial
sample chromatogram (Figure 4.32). The HPLC chromatograms for the remaining
samples analysed can be found in the Appendix B. These results show that the reaction
proceeded in the OBR at lower temperatures than those indicated to be necessary in the
literature.
Figure 4.29 Temperature profile for the acetylsalicylic acid samples

85
Figure 4.30 HLPC chromatogram of the synthesized acetylsalicylic acid, sample 1
Figure 4.31 HLPC chromatogram of the synthesized acetylsalicylic acid, sample 2
Figure 4.32 HLPC chromatogram of the pure aspirin sample

86
While it is known that higher temperature accelerates the reaction rate, the
results show that the reaction can be undertaken under milder conditions. The product
obtained after the crystallization and purification steps was in the form of fairly small
crystals and white in colour.
The results obtained from the experiments clearly indicate that the recommended
reaction time was greatly reduced. The reaction can be considered to be completed in
two minutes, which is shorter when compared with what is found in literature: typical
reaction durations range from 30 minutes to 2 hours (Kamlet 1956; McKetta and
Cunningham 1977). The OBR proved to be a superior alternative once again, this time
in the manufacture of a popular API. The superior heat transfer and mixing capabilities
of the OBR confer this design a definite advantage over others in the manufacture of
both fine chemicals and pharmaceuticals.
In light of these findings and of the fact that this chemistry fulfils all the pre-
requisites set out in the beginning of the chapter, this was the second reaction to be
chosen for further studies in COBR.
4.2.5 – Paracetamol
When it was discovered - by mere dispensing accident - that acetanilide had
anti-pyretic activity despite causing serious haemoglobin deactivation problems,
researchers at Bayer synthesized phenacetin, a chemical derivative of acetanilide.
However, due to its damaging effects in the kidneys of long-term patients, phenacetin
had to be replaced by an alternative with fewer side effects. It was in 1893 that Joseph
von Mering, came up with such drug: paracetamol. Unfortunately, having proved its
anti-pyretic and pain-relieving properties this new molecule was put on hold for nearly
half a century, when von Mering wrongly affirmed that it had the same side-effects as
acetanilide13 (Ellis 1998).
13 It is currently believed that the side effects that von Mering observed were due to an impurity, 4-aminophenol in Brown, T., A. T. Dronsfield, et al (2005). "Pain relief: from coal tar to paracetamol." Education in Chemistry 42: 102.

87
By 1946 Bernard Brodie and Julius Axelrod were given a grant to investigate the
effects observed by von Mering and discovered that acetanilide was indeed associated
with methemoglobinemia and its therapeutic properties derived from paracetamol, to
which it was metabolized in the human body (Brodie and Axelrod 1948). As a result
they advocated the use of paracetamol to reduce pain and fever in patients and by 1955
paracetamol was first marketed in the USA by McNeil Laboratories, under the name
Tylenol Elixir (Brown et al 2005).
Since then paracetamol has become one of the most widely used drugs in the
world. The world paracetamol market is worth circa 800 million Euros, equating to
circa 160 thousand tonnes produced worldwide (Chassany 2008). In the UK alone there
are over 90 different drugs brands with paracetamol in its composition and the most
popular of them all, Anadin, is worth over 65 million Euros, selling 27 million packs
every year (ANADIN 2006; Naish 2008).
The synthesis of paracetamol involves the reaction of acetic anhydride with 4-
aminophenol in aqueous medium (Figure 4.33):
OH NH2O
O O OH NH
CH3O
+
4-aminophenol acetic anhydride paracetamol
H+, H2O
95oC
Figure 4.33 The synthesis of paracetamol
In the traditional process for the synthesis of paracetamol, p-aminophenol is
mixed with a small stoichiometric excess of acetic anhydride in an aqueous medium at
high temperature and in the presence of phosphoric acid, which acts as a catalyst. The
benchmark reaction time is circa 20 minutes for laboratory scale synthesis, as described
in literature (Pavia et al 1990),

88
4.2.5.a – Synthesis of Paracetamol
1. Weigh 1.8 g of p-aminophenol; transfer it to the batch OBR;
2. Add 30 g of pure water and 2 ml of phosphoric acid. Mix it until the amine has
been dissolved;
3. Switch on the pre-heated water-bath (Twater = 80 oC) to heat the OBR and
carefully add 2.4 mL of acetic anhydride to the OBR;
4. Mix the solution for 10 minutes (ν = 2.0 sec-1; x0 = 40 mm) and transfer the
solution to a flask;
5. Chill the mixture in an ice-water bath;
6. Perform a vacuum filtration of the mixture, washing the flask with purified
water;
7. Oven-dry the produced crystals (30 °C; 2h);
8. Determine the mass of the crude paracetamol crystals.
Each sample was taken with regular intervals from step 4) in the procedure,
using a small pipette. All samples were purified according to the protocol.
4.2.5.b – Results
Samples were taken from the reactor regularly for a total duration of 6 minutes.
Figure 4.34 illustrates the temperature profile at the sampling times. It shows that the
temperature rise in the OBR was quick, providing the required heat for the reaction to
progress.

89
The HPLC data revealed that the reaction was considered complete well before
the reaction time cited in literature, and the reaction progressed fast even though it was
performed at lower temperatures. The amine was dissolved 30 seconds after the
oscillation was started and the last sample was taken at the end of 6 minutes of reaction,
at which point the low volume left inside the OBR meant that it was not feasible to take
more samples from the reactor. The peak found in each of the chromatograms with an
elution time of 7.5 minutes (Figures 4.35 and 4.36) refers to acetaminophen, which is
identical to the peak found for the pure chemical compound (Figure 4.37). The HPLC
chromatograms for the remaining samples analysed can be found in the Appendix C.
Figure 4.34 Temperature profile for the paracetamol samples

90
Figure 4.36 HLPC chromatogram of the synthesized paracetamol, sample 2
Figure 4.37 HLPC chromatogram of the pure paracetamol sample
Figure 4.35 HLPC chromatogram of the synthesized paracetamol, sample 1

91
In line with the findings for the acetylsalicylic acid experiments, the temperature
profile and chromatograms suggest that the reaction can be carried out under milder
conditions, given the short reaction times. The end product was in the shape of large
white crystals (0.5-1 cm).
This was the third chosen chemistry to be studied in COBR. Paracetamol is one
of the most common anti-inflammatory drugs in the world and, in tune with what
happens for acetylsalicylic acid and vanisal sodium, it complies with all the selection
criteria.
The OBR proved to be a better alternative to the STR in each of the five
chemistries studied. The constant pattern of eddie formation and cessation inside each
cell of the OBR increase the probability of different particles to collide and react with
each other. This translates into better mixing and heat transfer capabilities and allows
for faster reaction times, even at lower process temperatures, as it was proven in the
experiments described in the previous sections. A finer control of process variables,
such as reaction temperature, particle morphology and even particle size modulation can
be achieved – this is a significant OBR advantage over the STR that has to be taken in
consideration by pharmaceutical and fine chemical companies trying to optimize their
manufacturing processes. Table 4.3 compares the chemistries that underwent screening,
summarizing which selection criteria each chemical reaction fulfils. On this basis, the
chosen chemical compounds to be studied further in COBR were vanisal sodium,
acetylsalicylic acid and paracetamol.

92
Table 4.3 Selection criteria fulfilled by the screened chemistries
Bis(2,4,6-
trichlorophenyl)
Oxalate
Methyl
Diantylis
Vanisal
Sodium
Acetylsalicylic
Acid
Paracetamol
Chemistry type
FC
FC
FC
API
API
Relevance Reaction time Cost Safety
Key: FC – fine chemical; API – active pharmaceutical ingredient
4.3 – Summary
This chapter described the experimental results for the five different chemical
entities that were screened. While the results obtained were positive with regard to
reaction conditions, reaction times and product yields, the chemical entities to be
subjected to further studies in COBR were narrowed down to three. All the selection
criteria were fullfiled for the following chemistries: vanisal sodium, acetylsalicylic acid
and paracetamol.

93
CHAPTER 5
COBR EXPERIMENTS
Argument is conclusive, but it does not remove doubt,
so that the mind may rest in the sure knowledge of the truth,
unless it finds it by the method of experiment.
Roger Bacon, philosopher
From the results obtained in the screening experiments it was determined that
three chemistries, namely vanisal sodium, acetylsalicylic acid and paracetamol, were
better suited for the purpose of studying the robustness and adaptability of the COBR,
as well as the degree of cross-contamination. One of advantages of this mixing
technology is that the results obtained from the batch OBR can directly be applied to the
continuous operation because the scale up is linear. This means that the procedure, the
operation and the analysis done at the screening stage are transferable here with
minimal adaptations.
Critical product and chemical process attributes, such as reaction times, particle
size, morphology and campaign waste and turnaround times were given special
relevance in the COBR experiments due to the importance of these aspects to the fine
chemical and pharmaceutical industries. The experimental procedure and the results
gathered for each of these are described in the following sections, preceded by mixing
and residence time distribution (RTD) considerations for the used COBR.
5.1 – Mixing and Residence Time Distribution
Inside a COBR with no oscillation being applied a particle is subjected to three
different forces: gravity, buoyancy and fluid drag. Therefore, the particle will

94
continuously accelerate downwards until the fluid drag force balances out the force of
gravity, at which point it will fall at a constant velocity until it is deposited in the COBR
wall (Levenspiel and Kunii 1991; Coker and Ludwig 2007). This constant velocity is
also referred to as terminal velocity and can be derived in the following way:
0=−−= dbg FFFdtdum (5.1)
where Fg is the force of gravity, Fb the buoyant force and Fd the drag force (N). Thus:
dbg FFF =− (5.2)
and
gmgVFF lpp
lppbg )()( ρρρ
ρρ −=−=− (5.3)
2
2lptD
d
AuCF
ρ= (5.4)
Substitution of equations 5.3 and 5.4 in 5.2 gives:
2
)(2
lPtDlp
p
AuCgm ρρρ
ρ=− (5.5)
lDpp
lpt CA
mgu
ρρρρ )(2 −
= (5.6)
where ut is the terminal velocity (m.s-1), g the gravitational acceleration (m.s-2), ρp and
ρl the densities of the particle and of the fluid, respectively (kg.m-3), m the mass of the
particle (kg), Ap the projected area of the particle (m2) and CD the drag coefficient. If
the shape of the particle is considered to be spherical with a diameter D, then the
particle mass is

95
6
3pD
mρπ
= (5.7)
and its projected area is
4
2DApπ
= (5.8)
Substitution of equations 5.8 and 5.7 into equation 5.6 gives:
lD
lpt C
Dgu
ρρρ
3)(4 −
= (5.9)
In order for particles to remain in suspension, other forces must come into play.
The combined velocity imposed in the COBR by the net flow and the oscillatory motion
must then be equal or greater than the terminal velocity of the particles, if it is to remain
in suspension in the fluid.
Applying oscillatory motion to a fluid in a baffled tube results in the
improvement of mixing conditions of the system. Whereas mixing is independent of net
flow in a COBR, this does not happen in a traditional PFR, where a minimum Reynolds
number has to be maintained for good mixing to occur. One of the advantages of the
COBR is that it allows for a small net flow type of operation while maintaining good
mixing conditions. It was shown by Harvey and colleagues (2001) that an increase of
Ren will not significantly impact on the rheology and residence time distribution of the
system.
Good mixing was achieved in the COBR during the three week-long campaigns
due to the imposition of a high oscillatory Reynolds number (Reo) coupled with a low
flow rate. This ensured that good radial mixing and narrow RTD was achieved,
guaranteeing that all the non-dissolved particles remained in suspension, thus
preventing deposition and, in a worst-case scenario, the clogging of the COBR. The

96
utilization of a low net flow also allows for savings to be made in expensive raw
materials. A comparison between the terminal velocity and the mixing velocity in the
COBR for the aspirin and paracetamol campaigns can be found in Table 5.1. vanisal
sodium’s product is in the form of very fine particles and can thus be easily suspended
in solution in the COBR.
Table 5.1 Comparison between terminal velocity (ut) and mixing velocity (um) for the
aspirin and paracetamol campaigns
Aspirin Paracetamol
ρp (kg.m-3)
1.350
1.263
ρl (kg.m-3) 1.108 1.046
D (m*10-6)14 400 425
CD 15 0.8 0.8
ut (m.s-1) 0.0378 0.0379
x0 (m) 0.02 0.02
f (s-1) 2 2
uo (m.s-1) 0.04 0.04
un (m.s-1) 0.0002 0.0019
um (m.s-1) 0.0402 0.0419
It is evident that um was superior to ut for both cases. This ensured good mixing
conditions in the COBR and that the particles remained in suspension for the duration of
the campaigns.
14 These are literature values taken from crystallization experiments for the studies chemistries (in Cambeiro, L. et al (2006). "Crystallization of Aspirin Crystals in Polar and Non Polar Solvents in the Presence of Surfactants: An Experimental Approach to Control Size and Shape of Crystals." The New Jersey Governor's School of Engineering and Technology Research Journal. and Granberg, R. A. and Å. C. Rasmuson (2005). "Crystal growth rates of paracetamol in mixtures of water + acetone + toluene." Particle Technology and Fluidization 59(1): 2441 - 2456. 15 Value taken from Hölzera, A. and M. Sommerfeld (2007). "New simple correlation formula for the drag coefficient of non-spherical particles " Powder Technology 184(3): 361-365.

97
5.2 – Vanisal Sodium
Vanisal sodium was the first chemical compound to be produced in the purpose-
built COBR. The experimental method is described next. This is followed by the results
gathered during a week-long run.
5.2.1 – Experimental Method The operational procedure is as follows:
1) The COBR was flooded with purified water;
2) The COBR and the OBR feeder were heated up to 60 oC and oscillation was started (ν = 2.0 sec-1; x0 = 40 mm);
3) 143 mL of sodium hydrogen sulphite 40% was measured;
4) 77.1 g of vanillin was weighted and 700 mL of purified water was measured.
These were transferred to the OBR and mixed until vanillin was dissolved;
5) The COBR was fed with the contents of the OBR feeder along with the sodium
hydrogen sulphite via the second feeder line;
6) The feed rate of the contents to the COBR was checked at a flowrate of 2
mL.min-1 and temperature readings were taken;
7) Samples were taken and dried for analysis;
8) Steps 3 to 7 were repeated 27 times.

98
Figure 5.1 Temperature measurements during the vanisal sodium reaction
5.2.2 – Results
Vanisal sodium was synthesized in a continuous fashion using the purpose-built
COBR for the duration of seven days, 24 hours a day. The temperature measurements
from the four thermocouples during the reaction are shown in Figure 5.1 and constant
temperatures are seen along the COBR. This indicates that the environment within the
COBR is highly consistent and reliable for the reaction, promoting the synthesis of a
highly homogenous and uniform product throughout the campaign. Samples were taken
regularly from the sampling valves and analyzed and the amount of vanisal sodium
produced was plotted against time.
Figure 5.2 displays the data from the sample locations S1 and S4 along the
COBR as shown in Figure 3.4. It is clear that there is a time delay in the product at the
start from the furthest sample port in comparison to that at the closest location from the
feed line. The production of vanisal sodium was consistent during the whole the
operation, in light of the stability of the temperature readings and concentration data.
The samples recovered and dried all had the same brittle white solid appearance, which
was consistent with both the sample recovered and dried in the OBR experiment (see

99
Chapter 4) and the description given by Luca Turin in the private correspondence
maintained.
The purity of the product was assessed using both NMR spectroscopy and
HPLC over 54 samples, with 99.92% and 99.95% purity of vanisal sodium,
respectively. The calculated average was 99.94%, which demonstrates the robustness of
both analytical methods and the high product purity obtained in this campaign. The
percent weight yield, calculated as the ratio between the actual yield over the theoretical
yield (Kotz et al 2009), averaged 91.4% over the analysed samples.
The cleaning of the COBR started after the production run had been completed,
so that cross-contamination could be assessed and the second campaign could be
started. A cleaning-in-place (CIP) procedure was used, as explained previously in
Chapter 2. As this is the first time that the cleaning process and procedure in a COBR is
reported, two dimensionless groups are introduced that are relevant to the protocol: the
cleaning index and the wash index.
Figure 5.2 Concentration profile for the vanisal sodium production run

100
In order to assess the cleaning intensity of a cleaning process, it is useful to
employ the cleaning index (Ψ), which is defined as the ratio between the net flow
Reynolds numbers and the oscillatory Reynolds numbers used in both the cleaning
(Rec) and the operation (Reop) periods. This ratio allows for a comparison to be made
between the various cleaning procedures that took place during this project. It also
allows for future comparisons to be made, if continuous oscillatory reactors are tested
with different chemistries or operating conditions:
O
op
O
c
ReRe
ReRe
=Ψ (5.10)
When the same oscillation conditions (Reo) were used, as in this campaign, the
cleaning index is defined in this case as:
op
c
ReRe
=Ψ (5.11)
An important measure of the effectiveness of a cleaning procedure is the amount
of waste produced during this operation. More specifically, it is of interest to compare
the volume of the used chemical reactor with the volume of the waste generated. This
can be studied and understood using the wash index (Ω), which is defined as the ratio
between the washing volume (Vw) and the reactor volume (Vr):
r
w
VV
=Ω (5.12)
The cleaning procedure was defined having in account previous experience and
advice from the pharmaceutical industry (Norton 2009). As such, the cleaning operation
was performed by continuously pumping tap water (measured pH = 7.3) in the COBR
(60 °C, ~0.5 L min-1), immediately followed by an industrial “free rinsing” cleaning

101
solution (Liquinox - Solujet, 1% solution), and lastly the USP grade water at room
temperature. The oscillation frequency and amplitude were 2 Hz and 40 mm,
respectively and the cleaning index was 228. Four samples per minute were taken from
the COBR during the cleaning phase and were analysed using the HPLC method
previously described. Figure 5.3 shows the remaining concentration of vanisal sodium
during the washing process in the vertical axis, while the volume of washing liquids
employed is the horizontal axis. This volume is also related to the time of cleaning
liquids used as the horizontal axis in Figure 5.4. The dotted line in Figure 5.3 denotes
the calculated maximum residual level of vanisal sodium (0.026 mg.mL-1) allowable
when the COBR is changed over to produce aspirin, in accordance to the limits set by
the International Pharmacopeia (2008), including a 100-fold safety factor, as shown:
100)aspirinin impurity Max.C(C
limit sodium Vanisal COBRin asprin min COBRin asprin min ×−= (5.13)
Maximum impurities level in aspirin (IP) = 1%
Minimum expected quantity of aspirin in COBR = 265 mg ml-1
It is evident that the COBR was clean well before the cleaning procedure had
been completed. The wash index was 5.18, meaning that a total 10.8 L of washing
liquids was used until the reactor was clean. To further prove the effectiveness of the
cleaning procedure, the reactor was disassembled at ports V3 and V4 (possible dead
legs due to valve design) and visually inspected for solid vanisal sodium residues. No
residues were found at those locations, confirming that the reactor was clean.
The loss of product, which is defined in this case as the ratio of the amount of
vanisal sodium lost in the cleaning over the total vanisal sodium produced, was 0.001%.
This is on a substantially lower level than the industry norm of 0.1-0.2% (Norton 2009).
This cleaning procedure proved to be complete and efficient and, with that in mind, the
same method was applied in the end of each of the following productions (Sections
5.2.2 and 5.2.3). The time used in cleaning is considerably shorter than the total
operation time, circa 0.28% of the total running time.

102
Figure 5.3 Washing data for vanisal sodium

103
Samples from ports S1 and S2 were taken during the cleaning process and
quenched for analysis. The kinetics of the cleaning process were assessed from the
washing data gathered from the samples and are shown in Figure 5.4 by plotting -
ln(C/C0) against time, where C is the concentration of the studied chemical species,
vanisal sodium in this case, at a given time t (mg mL-1) and C0 the concentration of that
chemical species at the start of washing (mg mL-1). The linearity of the fits in Figure 5.4
confirms first-order kinetics for the washing process in the COBR, with an averaged
rate constant of 0.0046 s-1 and t1/2 of 150 s. It should be noted that the process of
washing using water or detergent may not involve chemical reactions, the reaction
kinetics adopted here is a reasonable means to study the washing process.
Our data are in line with several other studies involving tubular equipment
where cleaning was described as a first-order kinetics (Jennings et al 1957; Bourne and
Jennings 1963; Karlsson et al 1998; Cabero et al 1999; Lelievre et al 2002).
Figure 5.4 First order kinetics plot for vanisal sodium cleaning data

104
5.3 – Acetylsalicylic Acid
The synthesis and crystallization of aspirin was carried out for a period of 7
days, 24 hours a day. In the next section the experimental procedure is described,
followed by the results obtained for the production campaign, including the cleaning
phase. The kinetics of the reaction were also studied and the results are presented.
5.3.1 – Experimental Method
The experimental procedure used in this campaign includes:
1) The COBR was flooded with acetic anhydride and the first 4 sections were
heated up to 60 oC. The COBR oscillation was started (ν = 2.0 sec-1; x0 = 40
mm);
2) 263.1 g of salicylic acid was weighted. It was then transfered to the OBR feeder,
previously heated up to 90oC. 700 mL of acetic anhydride were added;
3) The COBR was fed with the contents of the OBR feeder, along with sulphuric
acid via the second feed line;
4) The feed rate of the contents to the COBR was checked at a flowrate of 2
mL.min-1 and temperature readings were taken;
5) A sample was taken for analysis;
6) Steps 2 to 5 were repeated 27 times.

105
5.3.2 – Results
In this production process the reaction takes place first, which is then followed
by crystallization. It was therefore necessary to create a controlled temperature decrease
along the COBR for the crystallization to take place, as it is shown in Figure 5.5. It is
evident that during the week-long synthesis the temperature measured at each of the
four thermocouples was stable and consistent.
The amount of acetylsalicylic acid produced as a function of time is plotted in
Figure 5.6 and once again it is visible that the production of aspirin is consistent over
the course of the process. The purity of the product analyzed by HPLC was 99.57%
over 54 samples. The operational consistency of the COBR goes in line with what was
found for the production of vanisal sodium. The average yield over the 54 samples was
77.4%, which is higher than that the 75% indicated in literature even though the
concentration used in this work is lower than that found in literature (Kamlet 1956), as
shown in Table 5.2.
Figure 5.5 Temperature measurements during the acetylsalicylic acid production run reaction
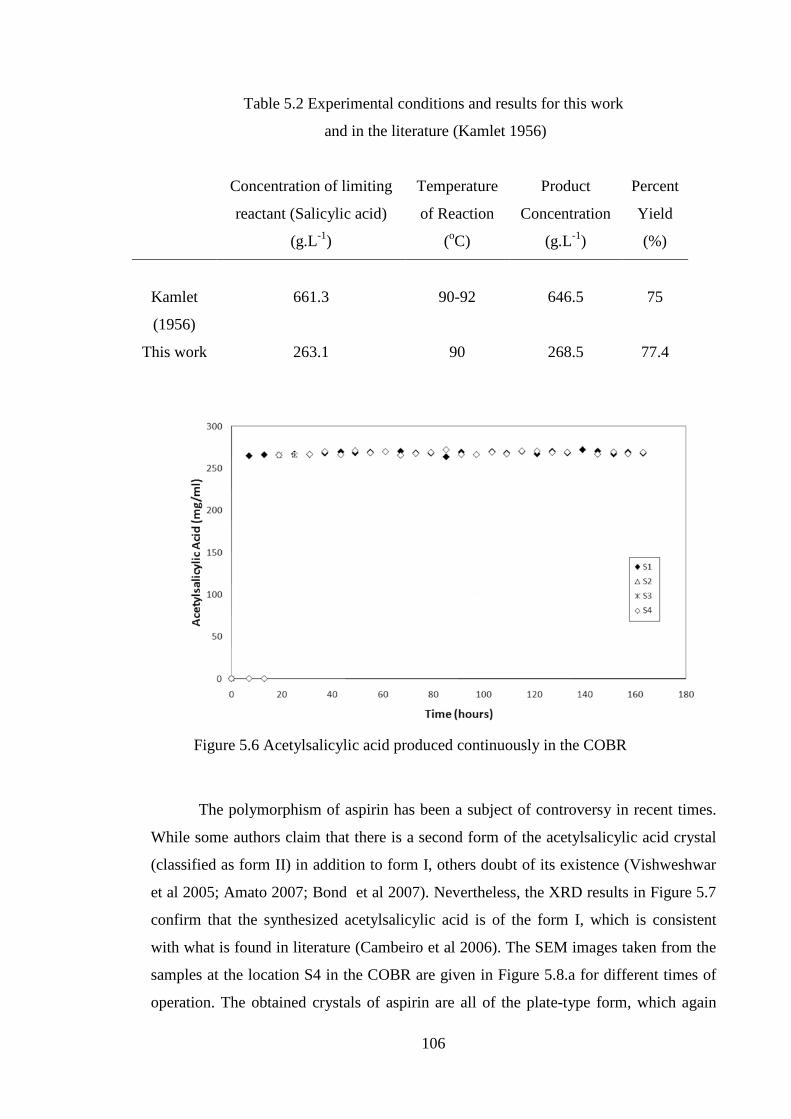
106
Table 5.2 Experimental conditions and results for this work
and in the literature (Kamlet 1956)
Concentration of limiting
reactant (Salicylic acid)
(g.L-1)
Temperature
of Reaction
(oC)
Product
Concentration
(g.L-1)
Percent
Yield
(%)
Kamlet
(1956)
661.3
90-92
646.5
75
This work 263.1 90 268.5 77.4
The polymorphism of aspirin has been a subject of controversy in recent times.
While some authors claim that there is a second form of the acetylsalicylic acid crystal
(classified as form II) in addition to form I, others doubt of its existence (Vishweshwar
et al 2005; Amato 2007; Bond et al 2007). Nevertheless, the XRD results in Figure 5.7
confirm that the synthesized acetylsalicylic acid is of the form I, which is consistent
with what is found in literature (Cambeiro et al 2006). The SEM images taken from the
samples at the location S4 in the COBR are given in Figure 5.8.a for different times of
operation. The obtained crystals of aspirin are all of the plate-type form, which again
Figure 5.6 Acetylsalicylic acid produced continuously in the COBR

107
shows the consistency of the product during the week-long run. These crystals are
comparable to the ones obtained by Cambeiro et al (2006) shown in Figure 5.8.b
Figure 5.7 a) XRD results for the produced acetylsalicylic acid; b) XRD results for
acetylsalicylic acid (form I) in Huang et al (2005)

108
The reaction kinetics between salicylic acid and acetic anhydride in the COBR
was studied. This was done by following the concentration of salicylic acid during the
reaction. Samples were taken at each of the sampling ports in the COBR, immediately
quenched, analyzed using HPLC and averaged over the number of samples at each site.
The concentration of salicylic acid as a function of time was then plotted and used to
confirm the order of the reaction and evaluate the rate constant of the reaction. Figure
5.9 shows ( 0
11SASA CC −
) against the time of reaction, where CSA0 and CSA are the
Figure 5.8 a) SEM images of produced acetylsalicylic acid crystals; b) Plate shaped acetylsalicylic acid crystals, in Cambeiro et al (2006)

109
concentration of salicylic acid at the start and at anytime during the reaction. The
concurrence between the results and the linear regression indicates that the reaction
follows a second order kinetics with a rate constant of 0.029 L.g-1.s-1.
Given that the cleaning procedure used for the vanisal sodium run was effective,
the same technique was employed for the acetylsalicylic acid. Tap water at 60 oC was
first pumped into the COBR, followed by a Liquinox - Solujet, 1% solution, and finally
by the USP grade water, one immediately after the next. The same values of oscillation
frequency and amplitude were also used during the cleaning.
It is widely accepted that higher production and cleaning standards are required
for pharmaceutical and biochemical products than for the fine chemical counterparts.
Yet, there is no published guideline or information on how much higher it should be.
That was the reason behind the higher cleaning index used for acetylsalicylic acid, 336,
which is 1.5x higher than that used for vanisal sodium. Four samples per minute were
taken during the cleaning cycle and analyzed. The results are shown in Figure 5.10,
where the dotted line indicates the calculated maximum contamination level for
Figure 5.9 Second order plot for the reaction between salicylic acid and acetic anhydride at 90 oC

110
cleaning validation purposes in the manufacture of paracetamol (2008), which was the
next API selected for production in the COBR after this cleaning process. The
maximum amount of residual acetylsalicylic acid (BL2) allowed in the COBR was
calculated using the following expression developed by Leblanc (2000):
SF1000000API of dosedaily minimumAPI of dosedaily minimum BL
B
A2 ××
= (5.14)
where BL2 is the limit of the target residue (in this case, the target residue is the bulk
active APIA) in any finished drug product in which the residue may ultimately be found,
APIA is the bulk active A, APIB is the bulk active B and SF is the Safety Factor (=
0.001). In this case, this calculated value was 0.113 mg mL-1. Similar to what had
happened with the vanisal sodium’s case, the COBR was cleaned after the washing was
completed. The loss of product due to the cleaning process amounted to 0.005% of the
total amount of product. This is again lower than the industry norm of 0.1-0.2% (Norton
2009). The swab sample test was carried out at the V3 location in the COBR (see Figure
3.4 in Chapter 3) according to the method developed by Nozal et al (2000) and is also
presented in Figure 5.10 (). It is noticeable that the degree of contamination detected
in the swab sample is well below the threshold. The result confirms that the cleaning of
the reactor was effective. The wash index is 5.07 when the reactor is cleaned, which
equates to 10.6 L of liquid waste. The amount of time used for cleaning is much smaller
than the corresponding total operation time, only circa 0.19%. The reactor was once
again disassembled and visually inspected for residues in sample ports V3 and V4. No
residues were found at these locations, another indication that the cleaning procedure
was effective.

111
Figure 5.10 Washing data for aspirin

112
The kinetics of the cleaning process for the acetylsalicylic acid run was also
evaluated, and a plot of -ln(C/C0) against time is shown in Figure 5.11. The first-order
kinetics are well suited to describe the cleaning process, which is in line with what was
found for the vanisal sodium case. The mean rate constant is 0.006 s-1. As a result of the
higher cleaning index used when compared to the one used in the vanisal sodium
cleaning procedure, a higher rate constant was expected for aspirin cleaning
(kaspirin/kvanisal sodium = 1.3). This indicates that at identical oscillation conditions, the rate
constants for the cleaning of the COBR depend on the cleaning intensity that is
regulated by the net flow, as suggested previously by Bird et al (1991). This implies that
the washing process is mainly a physical process, in which mixing plays an important
part.
Figure 5.11 First-order kinetics plot for aspirin cleaning data

113
5.4 – Paracetamol
The synthesis and crystallization of paracetamol was the next and final
campaign in this PhD project. A continuous production and subsequent cleaning process
of the COBR was carried out and the results are shown below, after the description of
the experimental method.
A first attempt of carrying out the synthesis and crystallization campaign of
paracetamol with the COBR in a vertical layout and at a flowrate of 2.0 mL min-1
(equivalent conditions to the aspirin campaign) proved to be unsuccessful, as crystals
started accumulating around the PFA baffles situated just before P2 (see Figure 3.4). As
the crystals accumulated, mixing on the subsequent sections was less and less efficient
and eventually the pipe was blocked. This was probably due to the differential in
pressure in the system - the top sections of the COBR were at a height of 2.80 m,
making it difficult for the pump used to move all the fluid inside the reactor at a
constant speed throughout the system. Thus, the fluid at the top sections was mixed
poorly and the crystals that were being formed at those locations had more probability
of interacting with the baffle surface. These conditions led to the continuous adherence
of crystals to the baffle and the eventual blocking of that pipe section. The campaign
had to be aborted and in light of these findings the COBR was re-orientated horizontally
and the flowrate of the system was increased.
5.4.1 – Experimental Method For this campaign, the following steps were used:
1) The COBR was flooded with purified water;
2) The reactor was heated up to 80 oC (4 first sections), the OBR feeder was heated up to 90 oC and oscillation was started (ν = 2.0 sec-1; x0 = 40 mm);
3) 48 g of p-aminophenol was weighted, 53.33 mL of phosphoric acid, 64 mL of
acetic anhydride and 800 mL of purified water were measured;
4) The purified water, p-aminophenol and phosphoric acid were transferred to the OBR feeder;

114
5) The COBR was fed with the contents of the OBR after all the amine was
dissolved, along with the acetic anhydride via the second feed line;
6) Feed flowrate of the contents to the COBR was kept at 20 mL min-1 and
temperature readings were taken;
7) A sample was taken for analysis;
8) Steps 3 to 7 were repeated 128 times.
5.4.2 – Results
Paracetamol was synthesized and crystallized in the COBR with the same
oscillation conditions used for the aspirin campaign and once again a constant
temperature profile is required in the process. In Figure 5.6 it is apparent that the
reaction and subsequent crystallization of aspirin was finished when the solution
reached the first sampling port. In the paracetamol run, the flow rate of the reactants
was increased by 10 fold to take that result in consideration. On one hand, this allows
more concentration data to be obtained, showing the profile of paracetamol generating;
on the other hand, this means that either the amount of starting materials required for
the reaction is increased accordingly, or the overall running time is reduced for the same
amount of material. In order to keep the project on budget the latter was the only option,
i.e. the campaign was reduced from the 7 days initially planned to 4 days, 24 hours a
day.
In this run the COBR was operated horizontally in order to demonstrate the
versatility of the system. Both reaction and crystallization were performed in this
campaign and the variable temperature profile is used. Figure 5.12 shows the
temperature profiles inside the COBR. The gathered data is once again in line with the
previous experimental results, and very stable temperatures were achieved in the
COBR.

115
Samples were taken from the various ports along the COBR and the amount of
paracetamol produced along the run was determined. The results are shown in Figure
5.13 and once again the data for each sample port was consistent. The product samples
were analyzed using HPLC and the averaged purity was 99.63% over 55 samples. The
Figure 5.12 Temperature measurements for the paracetamol production run
0
10
20
30
40
50
60
70
0 20 40 60 80 100
T ime (hr.)
Par
acet
amo
l (m
g/m
l) Valve S 2Valve V4Valve S 3Valve S 4Valve P V
Figure 5.13 Concentration profile of the produced paracetamol

116
average yield obtained for this campaign was 79%, which is higher than that found for
literature (circa 73%) even though the used feed concentration in this production run is
lower (Schulman et al 1975), as shown in Table 5.3.
Table 5.3 Experimental conditions and results for this work and in literature (Schulman,
Baron et al 1975)
Concentration of limiting
reactant (4-Amiphenol)
(g.L-1)
Temperature
of Reaction
(oC)
Product
Concentration
(g.L-1)
Percent
Yield
(%)
Schulmann
et al (1956)
147.2
85-90
148.6
72.8
This work 52.3 80 58.6 79.4
Crystals were taken from the PV sampling port (Figure 3.4) at different times of
COBR operation and the XRD data presented in Figures 5.14 and 5.15 show that
crystals are monoclinic (form I) (Yamamura and Momose 2003). The crystals were also
imaged using SEM at 30x and 200x amplifications, as shown in Figure 5.16. The
morphology of the sampled crystals was consistent throughout the run and its
monoclinic structure is consistent with what was found by Lee et al (2006), as shown in
Figure 5.17. This is the crystal structure currently in use for drug formulations (Florence
and Attwood 2007). It should, however, be noticed that production of different
crystalline forms of paracetamol and aspirin using oscillatory baffled reactors might be
achieved by regulating different variables (e.g. temperature, used solvent, pH), as
demonstrated in previous studies for glutamic acid (Ni and Liao 2008).

117
Figure 5.15 Literature XRD data for paracetamol (form I) (Yamamura and Momose 2003)
0
2000
4000
6000
8000
10000
12000
14000
0 5 10 15 20 25 30 35 40
2θ (deg.)
Inte
nsity
Figure 5.14 XRD data for paracetamol produced in the COBR

118
The size distributions of the paracetamol crystals along the COBR were
determined using the particle size distribution technique and are presented in Figure
5.18. Paracetamol crystals have a tendency to grow to large sizes and it is evident that
the distribution was initially broader with smaller sized particles at the earlier stage of
the crystallization and became narrower with bigger sized crystals. This shows that the
continued mixing at a determined fixed frequency and amplitude over time has a
selective effect on the particle size – this might be explored further in view to control
particle size distributions to the required specifications. The Gaussian-type of size
distribution obtained in the COBR is the direct result of the good mixing achieved
during operation. Table 5.4 complements Figure 5.18 and shows the mean sizes as well
Figure 5.16 SEM images of paracetamol crystals taken at different times of operation.
a) 7.5 hrs b) 26.25 hrs c) 45 hrs d) 63.75 hrs e) 75 hrs f) 93.75 hrs
Figure 5.17 Optical micrographs of monoclinic paracetamol crystals, in Lee et al (2006)

119
as Dv,0.1 and Dv,0.9, the sizes of particles with 10% and 90% of the samples being below
the corresponding sizes, respectively. The crystal size distribution results show how
well the COBR is suited for crystallization operations and, once again, the consistency
of the product obtained during the whole run.
Figure 5.18 Particle size distribution of paracetamol samples (time of sampling = 3 hours)

120
Table 5.4 Particle size distribution for paracetamol samples
Time of Sampling (hour)
Sampling Location Mean Size (Dv,0.5) (µm)
Dv,0.1 (µm)
Dv,0.9 (µm)
3
S2
185
45
692
3 V4 342 95 893
3 S3 389 125 936
3 S4 422 141 963
3 PV 439 146 820
7.5 PV 451 149 824
26.3 PV 436 143 817
45 PV 442 151 820
63.8 PV 448 149 826
75 PV 433 142 816
93.8 PV 444 153 824
Reaction kinetics of paracetamol in the COBR was also evaluated. Samples
were taken from different locations in the COBR and immediately quenched for HPLC
analysis. The decrease in the concentration of 4-aminophenol along the COBR was then
recorded and the reaction kinetics extracted as shown in Figure 5.19. Once again the
reaction of paracetamol is of a 2nd order with a rate constant of 0.011 ml mg-1 s-1. The
reaction times found in literature range from 5 to 12 minutes (Young 1963; Schulman et
al 1975), which are longer than what is found in this work (circa 3 minutes) due to the
superior mixing and heat-transfer capabilities of the oscillatory baffled reactor.

121
Figure 5.19 Kinetics of the reaction between p-aminophenol
and acetic anhydride at 80 oC
The COBR was again cleaned after the paracetamol experiments in COBR were
concluded. The same cleaning procedure was used for the paracetamol run. The
cleaning index was 33.9, which reflects the 10-fold increase in the flow rate used in the
paracetamol production run in comparison to the aspirin production campaign, which
allowed for a paracetamol concentration profile to be evident during the campaign.
Figure 5.20 shows the data collected during the cleaning stage. In a similar fashion to
what was done for the aspirin cleaning stage, a maximum allowed level of paracetamol
in the COBR was calculated as 0.125 mg mL-1, assuming that the production would be
reverted back to aspirin using the COBR. It is clear that the concentration of
paracetamol that remained in the cleaning solutions was lower than that required by the
time the cleaning was completed. The swab test () was also performed and the amount
of paracetamol detected was also well below the maximum permitted level. The results
show that the method used for cleaning was once more efficient. The loss of product
due cleaning was 0.004%, lower than the industry norm of 0.1-0.2%. The washing
index was 4.08, which correlates to a generated waste of 8.44 L during the cleaning
process.

122
Figure 5.20 Washing data for paracetamol

123
The kinetics of the cleaning process was evaluated and a plot of –ln(C/Co)
versus time is shown in Figure 5.21. The first-order kinetics fits well to the
experimental data and the mean rate constant is 0.007 s-1 for this case.
This is in line with the previously obtained results and is, once again, concurrent
with Bird’s view (1991) that the efficient mixing occurring inside the COBR during the
cleaning stage plays a critical part in what is considered to be mainly a physical process.
As explained in Chapter 2, it should be noted that while there are many factors that have
an impact in the cleaning efficiency, such as the nature of the fouling substance, the
flow rate, the cleaning temperature, the shape and nature of the cleaned surfaces or the
nature and the concentration of the cleaning solution, establishing an explicit correlation
between previous studies and this work is still not feasible. Table 5.5 compiles the
kinetic data for other cleaning studies in tubular type of reactors for indication only, as
the basis of comparison is not the same. On this standing point, the rate constants from
this work are comparable to these from the previous studies.
Figure 5.21 Paracetamol cleaning kinetics

124
Table 5.5 Comparison of cleaning data from different studies (s.s. – stainless steel)
Authors Cleaning Solution Fouling Substance Net flow velocity (m.s-1) Temperature (0C) Cleaned surface k (s-1)
Our data
Tap water
Liquinox 1% USP
water
vanisal sodium 0.043 60
room temp.
COBR
(glass/PFA) 0.0045
Our data
Tap water
Liquinox 1% USP
water
aspirin 0.064 60
room temp.
COBR
(glass/PFA) 0.0061
Bourne
(1963) NaOH 0.03M tristearin 0.095 ---
s.s. strip in a
glass pipe 0.023
Karlsson
(1998)
NaOH
0.1-0.2mg/mL β-lactoglobulin 0.033 24 s.s. cell 0.048 to 0.086
Lelievre
(2002) NaOH 0.5% Bacillus spores 0.2 to 3.3 60 s.s. pipe 0.0012 to 0.083

125
The ratio between the operation and the cleaning times is 427.5 for the
paracetamol run, which shows that the cleaning stage used only a very small fraction
(circa 0.23%) of the total operation time. As a consequence of this, the productivity is
maximized and the operational costs are minimized.
5.5 – Summary
The experimental results obtained for each of the chemistries selected for COBR
work are described in this chapter. Reaction time, production campaigns and cleaning
results are included and show that the COBR is a suitable continuous reactor for the
synthesis of vanisal sodium, acetylsalicylic acid and paracetamol to high standards. The
fast cleaning procedure devised for this project was effective. The reactor was cleaned
in compliance to the stringent regulatory standards at the end of each production
campaign.
126
CHAPTER 6
CONCLUSIONS AND
RECOMMENDATIONS FOR FUTURE WORK
Just a drink, a Martini, shaken not stirred.
James Bond, in Goldfinger (1964)
6.1 – Conclusions
This thesis reports the first experimental research with the objective of
establishing a cleaning protocol for fine chemicals and APIs manufactured in COBR.
Taking this into consideration, three different chemical entities were continuously
produced in tandem fashion, interspersed with well-defined cleaning procedures. The
main conclusions taken from this work are subsequently summarized:
• The reaction times for the studied chemistries were shorter than those described
in literature. Some were performed under milder temperature conditions, thus
obviating the use of reflux apparatus in the reactor.
• The crystalline forms of the produced APIs, aspirin and paracetamol, were
consistently of the most common form I for each of the chemical entities, which
is currently used in the pharmaceutical industry for medicine formulation
purposes.
• A precise control over the temperature profile was achieved while operating the
COBR. In addition, particle size distribution studies revealed the uniformity of
the crystal size obtained for the duration of the paracetamol production
campaign.

127
• All three chemical entities were produced to high purity standards, and one of
the main strengths of the COBR mixing technology was demonstrated by the
presence of minimal amounts of contaminants in the fine chemical and APIs
produced.
• Products of consistent quality and yield were obtained for the duration of each of
the production campaigns. The precise control of operational conditions in the
COBR and the data gathered during the experiments suggests that this type of
continuous reactor is well suited for the manufacture of high quality APIs and
fine chemical products.
• The cleaning kinetics for the studied chemical entities are of a first-order, which
is comparable to previous work. The cleaning protocol is very simple, efficient
and fast with a minimal amount of waste generated, in accordance to Good
Manufacturing Practice (GMP) and Good Laboratory Practice (GLP) standards.
• The COBR design can potentially incorporate QbD principles and will play an
important role in shaping the current pharmaceutical manufacturing industry.
The data gathered and the conclusions that are taken from this work suggest that
the COBR mixing technology is superior to current mixing technologies, not only in
terms of the consistency demonstrated by the COBR when performing chemical
reactions, but also in terms of crystallization and, not less importantly, the ease of
maintenance and cleaning.
The increasing trend towards process intensification and making the
pharmaceutical industry leaner, reaching the levels of efficiency already demonstrated
by the automotive or the semi-conductor industrial sectors is forcing the market players
into investing more into research and development programs. Instead of expending
large sums of money into making small improvements on already existing processes,
the time has come for a paradigm shift, from the traditional stirred to the more efficient
shaken.

128
6.2 – Recommendations for Future Work
The experimental work reported here suggests that the COBR is a better
alternative to current mixing technologies with regards to the production of fine
chemicals and APIs. The washing of the reactor is done with a simple, fast and effective
cleaning procedure, thereby allowing for short turn-around times in manufacturing
facilities.
There is, however, scope for more experimentation in this field of research in
order to better understand and optimize the processes studied. With that in mind, some
recommendations for future work are listed below:
• The intrinsic modular characteristics of the COBR design make it perfect for
adapting more in-line and on-line process analytical technologies. Investigating
ways of installing devices such as UV-Visible spectrophotometer or even real-
time HPLC or mass spectrometry apparatus will contribute to a better
understanding of the phenomena occurring in the COBR, enabling a more
informed modulation of the reaction or oscillation conditions.
• Although the results obtained in the experimental work confirm the suitability of
the COBR for performing chemical reactions and crystallization operations,
these could be the object of further studies. Investigating how crystallization
conditions affect both the size and crystalline structure by varying oscillation
conditions, using different solvents or even temperature profiles could provide
more data and help understanding these processes.
• An interesting path to follow in the continuation of this research would be to
investigate how the material that the COBR is made of interacts with how the
processes here studied occur. In other words, replacing the glass pipes and the
PFA baffles with a combination of materials such as stainless steel, different
kinds of polymers or even using glass baffles could have a positive impact on
how the chemical reactions, crystallization and cleaning processes evolve.

129
• A broader view in how the COBR interacts, complements and integrates in a
larger, industrial manufacturing process is needed. Having a project in which
the proven capabilities of the COBR are put to test in a real-world
pharmaceutical or fine chemicals plant would be the definite assessment of the
performance of this mixing technology. If successful, the publication of such
results would help in removing the cautiousness with which new technologies
are naturally met with by decision-makers in the industry.
• A logical and critical next step in this field of research is to broaden it to other
APIs and chemistries. This is probably the most important recommendation for
future work, as further successes would increase the COBR’s visibility in the
pharmaceutical and fine chemicals industries and reaffirm its place as a viable
alternative to current mixing technologies.

130
Appendix – A
cGMP Regulations and Guidelines and Compliance Actions

131
Table A.1 Applicable regulations and guidelines and compliance actions taken or to be taken.
1. PREMISES AND EQUIPMENT
Principle: Premises and equipment must be located, designed, constructed, adapted and maintained
to suit the operations to be carried out. Their layout and design must aim to minimise the risk of
errors and permit effective cleaning and maintenance in order to avoid cross-contamination, build
up of dust or dirt and, in general, any adverse effect on the quality of products.
Regulations and Guidelines Measures Taken
1.1 Premises should be situated in an environment
which, when considered together with measures to
protect the manufacture, presents minimal risk of
causing contamination of materials or products.
The equipment is located in a cleaned
laboratory; all the chemicals used are
labelled and stored according to suppliers
indications.
1.2 Premises should be carefully maintained,
ensuring that repair and maintenance operations do
not present any hazard to the quality of products.
They should be cleaned and, where applicable,
disinfected according to detailed written procedures.
The laboratory is regularly maintained and
properly staffed with trained personnel to
perform maintenance and repairs.
1.3 Lighting, temperature, humidity and ventilation
should be appropriate and such that they do not
adversely affect, directly or indirectly, either the
medicinal products during their manufacture and
storage, or the accurate functioning of equipment.
Lightning, temperature, humidity and
ventilation in the laboratory are adequate
to perform the chemical reactions
screened.
1.4 Premises should be designed and equipped so as
to afford maximum protection against the entry of
insects or other animals.
The laboratory is properly equipped for
that effect, preventing the entry of insects
or other animals.
1.5 Steps should be taken in order to prevent the
There are adequate signs in the laboratory

132
entry of unauthorised people. Production, storage and
quality control areas should not be used as a right of
way by personnel who do not work in them.
entrance. The laboratory is an obligatory
passage only to storage rooms and the
workshop.
1.6 The adequacy of the working and in-process
storage space should permit the orderly and logical
positioning of equipment and materials so as to
minimise the risk of confusion between different
medicinal products or their components, to avoid
cross-contamination and to minimise the risk of
omission or wrong application of any of the
manufacturing or control steps.
The working space is carefully laid-down
taking in account this guideline, as are the
chemical storage cupboards; the COBR
will be positioned in such way that permits
the reactant and product vessels to be
inside the ventilated hood.
1.7 Where starting and primary packaging materials,
intermediate or bulk products are exposed to the
environment, interior surfaces (walls, floors and
ceilings) should be smooth, free from cracks and
open joints, and should not shed particulate matter
and should permit easy and effective cleaning and, if
necessary, disinfection.
The laboratory was built taking in account
these considerations.
1.8 Pipework, light fittings, ventilation points and
other services should be designed and sited to avoid
the creation of recesses which are difficult to clean.
As far as possible, for maintenance purposes, they
should be accessible from outside the manufacturing
areas.
The COBR will be positioned in such way
that it will be readily accessible and
cleaning of the premises will constitute no
problem.
1.9 Production areas should be effectively ventilated,
with air control facilities (including temperature and,
where necessary, humidity and filtration) appropriate
both to the products handled, to the operations
undertaken within them and to the external
The COBR will be positioned in such way
that permits the reactant and product
vessels to be inside the ventilated hood.

133
environment.
1.10 Production areas should be well lit, particularly
where visual on-line controls are carried out.
The laboratory is well illuminated.
1.11 In-process controls may be carried out within
the production area provided they do not carry any
risk for the production.
Temperature and pressure sensors will be
connected to the reactor, and present no
risk for the reactions to be carried out.
1.12 Manufacturing equipment should be designed,
located and maintained to suit its intended purpose.
Careful thought was taken in the design
and layout of the equipment to be used.
1.13 Repair and maintenance operations should not
present any hazard to the quality of the products.
The COBR can be repaired/maintained off-
line to original specifications, and the
quality of the products should not suffer
from any quality concerns.
1.14 Manufacturing equipment should be designed so
that it can be easily and thoroughly cleaned. It should
be cleaned according to detailed and written
procedures and stored only in a clean and dry
condition. The success of this work depends largely
on cross-contamination control and
elimination, and as such cleaning protocols
will be tested and validated.
1.15 Washing and cleaning equipment should be
chosen and used in order not to be a source of
contamination.
1.16 Equipment should be installed in such a way as
to prevent any risk of error or of contamination.
1.17 Production equipment should not present any
hazard to the products. The parts of the production
Only non-reactive material such as glass,
PFA and stainless steel will be in contact

134
equipment that come into contact with the product
must not be reactive, additive or absorptive to such
an extent that it will affect the quality of the product
and thus present any hazard.
with reactants/products.
1.18 Balances and measuring equipment of an
appropriate range and precision should be available
for production and control operations.
Balances, digital thermometers and
pressure gauges are adequate for the
processes to be carried out.
1.19 Measuring, weighing, recording and control
equipment should be calibrated and checked at
defined intervals by appropriate methods. Adequate
records of such tests should be maintained.
This type of equipment is regularly
checked, according to University
regulations.
1.20 Fixed pipework should be clearly labelled to
indicate the contents and, where applicable, the
direction of flow.
Provisions will be taken during the
assembly of the reactor.
1.21 Defective equipment should, if possible, be
removed from production and quality control areas,
or at least be clearly labelled as defective.
2. DOCUMENTATION
Principle: Good documentation constitutes an essential part of the quality assurance system.
Clearly written documentation prevents errors from spoken communication and permits tracing of
batch history. Specifications, Manufacturing Formulae and instructions, procedures, and records
must be free from errors and available in writing. The legibility of documents is of paramount
importance.
Regulations and Guidelines Measures Taken
2.1 Formally authorised Manufacturing Formula and
All the documentation produced in-house

135
Processing Instructions should exist for each product
and batch size to be manufactured. They are often
combined in one document. The Manufacturing
Formula should include:
(a) the name of the product, with a product reference
code relating to its specification;
(b) a description of the pharmaceutical form, strength
of the product and batch size;
(c) a list of all starting materials to be used, with the
amount of each, described using the designated name
and a reference which is unique to that material;
mention should be made of any substance that may
disappear in the course of processing;
The Processing Instructions should include:
(a) a statement of the processing location and the
principal equipment to be used;
(b) the methods, or reference to the methods, to be
used for preparing the critical equipment (e.g.
cleaning, assembling, calibrating, sterilising);
(c) detailed stepwise processing instructions (e.g.
checks on materials, pre-treatments, sequence for
adding materials, mixing times, temperatures);
(d) the instructions for any in-process controls with
their limits;
(e) any special precautions to be observed.
takes in account these guidelines.
2.2 There should be written procedures for sampling,
The sampling procedures for the COBR

136
which include the person(s) authorised to take
samples, the methods and equipment to be used, the
amounts to be taken and any precautions to be
observed to avoid contamination of the material or
any deterioration in its quality.
will be written taking in account these
indications.
2.3 There should be written procedures for testing
materials and products, describing the methods and
equipment to be used. The tests performed should be
recorded.
Product testing will be carried out in-house
(IR, NMR, HPLC, PSD) and will be done
in accordance to guidelines.
3. PRODUCTION
Principle: Production operations must follow clearly defined procedures; they must comply with
the principles of Good Manufacturing Practice in order to obtain products of the requisite quality
and be in accordance with the relevant manufacturing and marketing authorisations.
Regulations and Guidelines Measures Taken
3.1 Production should be performed and supervised
by competent people.
Appropriately trained personnel will be in
charge of operating the equipment.
3.2 All handling of materials and products, such as
sampling, storage, (…) and processing should be
done in accordance with written procedures or
instructions and, where necessary, recorded.
Sampling, storage and production will all
be adequately documented.
3.3 All incoming materials should be checked to
ensure that the consignment corresponds to the order.
Containers should be cleaned where necessary and
labelled with the prescribed data.
This is done in line with Heriot-Watt
University practices.
3.4 All materials and products should be stored under
the appropriate conditions established by the
There are adequate storage rooms and
cupboards in order to keep chemicals well

137
manufacturer and in an orderly fashion to permit
batch segregation and stock rotation.
stored.
3.5 Operations on different products should not be
carried out simultaneously or consecutively in the
same room unless there is no risk of mix-up or cross-
contamination.
Special attention will be made to this, as
success of this work depends largely on
this and similar guidelines.
3.6 At every stage of processing, products and
materials should be protected from microbial and
other contamination.
3.7 At all times during processing, all materials, bulk
containers, major items of equipment and where
appropriate rooms used should be labelled or
otherwise identified with an indication of the product
or material being processed
Provisions will be made to clearly label
every item necessary.
3.8 Labels applied to containers, equipment or
premises should be clear, unambiguous and in an
agreed format.
3.9 Labels applied to containers, equipment or
premises should be clear, unambiguous and in the
company's agreed format.
3.10 Any deviation from instructions or procedures
should be avoided as far as possible. If a deviation
occurs, it should be approved in writing by a com-
petent person.
Provisions will be made to meet this
guideline
3.11 Access to production premises should be
There are adequate signs in the laboratory

138
restricted to authorised personnel. entrance to prevent the access of
unauthorized personnel to the premises.
3.12 Contamination of a starting material or of a
product by another material or product must be
avoided. This risk of accidental cross-contamination
arises from the uncontrolled release of dust, gases,
vapours, sprays or organisms from materials and
products in process, from residues on equipment, and
from operators' clothing.
The layout and operating procedures of the
COBR and ancillary equipment take in
account this recommendation.
3.13 Cross-contamination should be avoided by
appropriate technical or organisational measures, for
example:
(a) providing appropriate air-locks and air extraction;
(b) minimising the risk of contamination caused by
recirculation or re-entry of untreated or insufficiently
treated air;
(d) keeping protective clothing inside areas where
products with special risk of cross-contamination are
processed;
(e) using cleaning and decontamination procedures of
known effectiveness, as ineffective cleaning of
equipment is a common source of cross-
contamination;
(f) using "closed systems" of production;
(g) testing for residues and use of cleaning status
labels on equipment.
The product and reactants vessels are
safely kept in a ventilated cupboard;
protective clothing and safety goggles and
gloves are kept in the laboratory at all
times; cross-contamination avoidance and
minimization procedures will be put in
place when in operation.

139
3.14 Measures to prevent cross-contamination and
their effectiveness should be checked periodically
according to set procedures.

140
Appendix – B
HPLC Chromatograms (Aspirin OBR Experiments)

141
Figure B.1 HLPC chromatogram of the synthesized acetylsalicylic acid, sample 3
Figure B.2 HLPC chromatogram of the synthesized acetylsalicylic acid, sample 4
Figure B.3 HLPC chromatogram of the synthesized acetylsalicylic acid, sample 5

142
Figure B.5 HLPC chromatogram of the synthesized acetylsalicylic acid, sample 7
Figure B.6 HLPC chromatogram of the synthesized acetylsalicylic acid, sample 8
Figure B.4 HLPC chromatogram of the synthesized acetylsalicylic acid, sample 6

143
Figure B.7 HLPC chromatogram of the synthesized acetylsalicylic acid, sample 9
144
Appendix – C
HPLC Chromatograms (Paracetamol OBR Experiments)

145
Figure C.1 HLPC chromatogram of the synthesized paracetamol, sample 3
Figure C.3 HLPC chromatogram of the synthesized paracetamol, sample 5
Figure C.2 HLPC chromatogram of the synthesized paracetamol, sample 4

146
Figure C.5 HLPC chromatogram of the synthesized paracetamol, sample 7
Figure C.6 HLPC chromatogram of the synthesized paracetamol, sample 8
Figure C.4 HLPC chromatogram of the synthesized paracetamol, sample 6

147
References
Amato, I. (2007). "Aspirin's Dose Of Structural Insight." Chemical & Engineering
News 85(1): 27-28.
ANADIN (2006). Superbrand Anadin to be Revitalised by Spink. Berks, Wyeth
Consumer Healthcare.
Angelucci, L. A. I. (1999). "Current Good Manufacturing Practice Design Trends In
Active Pharmaceutical Ingredients Facilities." Drug Information Journal 33:
739–746.
Argentine, M. D, Owens P.K. and Olsen B.A. (2007). "Strategies for the Investigation
and Control of Process-Related Impurities in Drug Substances." Advanced Drug
Delivery Reviews 59: 12–28.
Ashkar, M., Bercovici, S. and Graff, R. (2004). Preparation of Warfarin Sodium From
Warfarin Acid. U. S. P. Office. United States of America, Taro Pharmaceutical
Industries, Ltd. 6673944
Baird, M. and N. Rao (1995). "Power Dissipation and Flow Patterns in Reciprocating
Baffle-Plate Columns." Canadian Journal of Chemical Engineering 73(4): 417-
425.
Basak, A. K., Al Hakim A.H., Furness S., Samaan N.I., Gill D.S., Patel H.B., Powers
R.F. and Yu L. (2007). "Pharmaceutical Impurities: Regulatory Perspective for
Abbreviated New Drug Applications." Advanced Drug Delivery Reviews 59:
64-72.
BAYER (2009). Annual Report. Leverkusen, Bayer AG.
Bird, M. R. and P. J. Fryer (1991). "An Experimental Study of the Cleaning of Surfaces
Fouled by Whey Proteins." Food and Bioproducts Processing 69c: 13-21.
Bismuth, G. and S. Neumann (2000). Cleaning Validation: A Practical Approach, CRC
Press.
Bonanomi, D. (2006). "The State of Validation in the European Union." Pharmaceutical
Technology Europe 18(9): 26-32.
Bond, A. D., Boese, R.and Desiraju, G.R. (2007). "Polymorphism of Aspirin:
Crystalline Aspirin as Intergrowths of Two Polymorphic Domains."
Angewandte Chemie International Edition 46: 618-622.

148
Bourne, M. C. and W. G. Jennings (1963). "Kinetic Studies of Detergency." The Journal
of the American Oil Chemists' Society 40: 517-523.
Brandes, L. J. and Hermonat, M. W. (1989) Aminoalkyl Ethers of Phenols as
Anticancer Agents for the Breast and Colon. U. S. P. Office. United States of
America, The University of Manitoba. 4803227
Brechbill, G. O. (2007). The Fragrance Industry - Profiles. New Jersey, Creative
Endeavor Books.
Brodie, B. and J. Axelrod (1948). "The Fate of Acetanilide in Man." Journal of
Pharmacology And Experimental Therapeutics 94(1): 29-38.
Brown, T., A. T. Dronsfield and Ellis, P. M. (2005). "Pain Relief: From Coal Tar to
Paracetamol." Education in Chemistry 42: 102.
Brunold, C. R., Hunns J. C. B. and Mackley M. R. (1989). "Experimental Observations
on Flow Patterns and Energy Losses for Oscillatory Flows in Ducts with Sharp
Edges." Chemical Engineering Science 44: 1227-1244.
Cabero, M. L., Riera F.A. and Álvarez R. (1999). "Rinsing of Ultrafiltration Ceramic
Membranes Fouled with Whey Proteins: Effects on Cleaning Procedures."
Journal of Membrane Science 154: 239-250.
Caldeira, R. and X. Ni (2009). "Evaluation and Establishment of a Cleaning Protocol for
the Production of Vanisal Sodium and Aspirin Using a Continuous Oscillatory
Baffled Reactor." Organic Process Research & Development 13(6): 1080-1087.
Cambeiro, L., Jobson, J., Pallay, M., Smith, A., White, C, and Yermakova, Y.. (2006).
"Crystallization of Aspirin Crystals in Polar and Non Polar Solvents in the
Presence of Surfactants: An Experimental Approach to Control Size and Shape
of Crystals." The New Jersey Governor's School of Engineering and Technology
Research Journal.
CDER (2004). Guidance for Industry: PAT — A Framework for Innovative
Pharmaceutical Development, Manufacturing, and Quality Assurance.
Rockville, FDA.
Chassany, A.-S. (2008) "Rhodia Shuts Europe’s Last Paracetamol Plant as China
Prevails ".
Chew, C. M. Ristic, R. I., Reynolds, G. K. and Ooi, R. C. (2004). "Characterisation of
Impeller Driven and Oscillatory Mixing by Spatial and Temporal Shear Rate
Distributions." Chemical Engineering Science 59(7): 1557-1568.
149
Chew, J. Y. M., Tonneijk, S.J., Paterson, W.R., and Wilson, D.I. (2006). "Solvent-based
Cleaning of Emulsion Polymerization Reactors." Chemical Engineering Journal
117(1): 61-69.
CIKTN (2008). Genzyme and NiTech Collaboration Delivers the World’s Largest
Patent Protected Continuous API Manufacturing Plant. C. I.-K. T. Network.
CIKTN (2008). Case Study: NiTech - Continuous Oscillatory Baffled Reactor™. C. I.-
K. T. Network.
Clarke, T. (2009) "Genzyme Virus Exposes Vulnerable Plant Processes." Reuters.
Coker, A. K. (2001). Modeling of Chemical Kinetics and Reactor Design. Houston,
Gulf Professional Publishing.
Coker, A. K. and E. E. Ludwig (2007). Ludwig's Applied Process Design for Chemical
and Petrochemical Plants. Oxford, Gulf Professional Printing.
COLIPA (2008). Value and Values in Today's Cosmetic Industry - COLIPA Annual
Report 2008. Brussels.
Cook, D., Venkateshwaran, T., and Simmon, S.P. (2009). "Quality by Design." World
Pharmaceutical Frontiers 1: 88-90.
Crosby, T. (2006). "Designing For the Future of Continuous Processing."
Pharmaceutical Processing 22(1).
Dickens, A. W., Mackley, M. R. and Williams, H. R. (1989). "Experimental Residence
Time Distribution Measurements for Unsteady Flow in Baffled Tubes."
Chemical Engineering Science 44(7): 1471-1479.
Dijck, W. J. V. (1935). Process and Apparatus for Intimately Contacting Fluids. U. S. P.
Office. United States of America. 2011186.
Durlach; J. P. (1982) Novel Derivatives of 3-aminopropanesulfonic acid Having a
Reinforced Activity on Membrane. U. S. P. Office. United States of America,
Les Laboratoires Meram. 4355043
EFPIA (2009). The Pharmaceutical Industry in Figures - 2006 Edition. Brussels, The
European Federation of Pharmaceutical Industries and Associations.
Ellis, F. (1998). Paracetamol - A Curriculum Resource. London, Education Division,
The Royal Society of Chemistry.
FDA (1993). Guide to Inspections of Validation of Cleaning Processes, Division of
Investigations, Office of Regional Operations, Office of Regulatory Affairs.
FDA (2003). "Guidance for Industry, Q3A Impurities in New Drug Substances."
FDA (2006). "Guidance for Industry, Q3B. Impurities in New Drug Products."

150
FDA (2009). The Critical Path Initiative - Projects Receiving Critical Path Support
Fiscal Year 2008. Rockville.
Fitch, A., Jian, H. and Ni, X. (2005). "An Investigation of the Effect of Viscosity on
Mixing in an Oscillatory Baffled Column Using Digital Particle Image
Velocimetry and Computational Fluid Dynamics Simulation." Chemical
Engineering Journal 112(1-3): 197-210.
Fitch, A. and X. Ni (2003). "On the Determination of Axial Dispersion Coefficient in a
Batch Oscillatory Baffled Column Using Laser Induced Fluorescence."
Chemical Engineering Journal 92(1-3): 243-253.
Fleming, J. R., Kemkes, D., Chatten R. G., Creshaw, L.E. and Imbalzano, J. F. (2001).
DuPont Fluoroproducts - Material of Construction for Pharmaceutical and
Biotechnology Processing: Moving into the 21st Century. Technical
Information. Wilmington, DuPont Fluoroproducts.
Florence, A. T. and D. Attwood (2007). Physicochemical Principles of Pharmacy.
London, UK, Pharmaceutical Press.
Fortineau, A.-D. (2004). "Chemistry Perfumes Your Daily Life." Journal of Chemical
Education 81(1): 45-50.
Fortune (2009). Fortune 500 - Our Annual Ranking of America's Largest Corporations.
Fortune. 159.
Fox, K. (2005). The Smell Report - An Overview of Facts and Findings. Oxford, Social
Issues Research Centre.
Franeta, J., Agbaba D., Eric S., Pavkov S., Aleksic M., and Vladimirov S. (2002).
"HPLC Assay of Acetylsalicylic Acid, Paracetamol, Caffeine and Phenobarbital
in Tablets." Il Farmaco 57: 709-713.
Gaidani, H. K., McNaeil B., and Ni X. (2005). "Fermentation of Pullulan Using an
Oscillatory Baffled Fermenter." Chemical Engineering Research and Design
83(A6): 640-645.
Gambrill, J. S. (1995). Apparatus and Method for In-place Cleaning of a Mixer. U. S. P.
Office. United States of America, General Signal Corporation. 5427450.
Gao, P., Ching, W. H., Herrmann, M., Chan, C. K., and Yue, P. L. (2002).
"Photooxidation of a Model Pollutant in an Oscillatory Flow Reactor with
Baffles." Chemical Engineering Science 58(3-6): 1013-1020.

151
Gassmann, O., Reepmeyer, G. and Zedtwitz, M. (2004). Leading Pharmaceutical
Innovation: Trends and Drivers for Growth in the Pharmaceutical Industry.
Berlin, Germany, Springer.
Gelicourt, Y. G. S. d. (2000). On Single-Phase Axial Dispersion in Oscillatory Baffled
Columns. Mechanical and Chemical Engineering Department. Edinburgh,
Heriot-Watt University. MSc: 125.
Gough, P., Ni, X. and Symes, K.C. (1997). "Experimental Flow Visualisation in a
Modified Pulsed Baffled Reactor." Journal of Chemical Technology &
Biotechnology 69(3): 321 - 328.
Granberg, R. A. and Å. C. Rasmuson (2005). "Crystal Growth Rates of Paracetamol in
Mixtures of Water + Acetone + Toluene." Particle Technology and Fluidization
59(1): 2441 - 2456.
Harvey, A., Mackley M.R., Reis N., Teixeira J.A. and Vicente A.A. (2003). Fluid
Mixing and Particle Suspension in a Novel Microreactor. 30th Conference
SSCHE, Tatranské Matliare, Slovakia.
Harvey, A. and Stonestreet, P. (2001). "Oscillatory flow : A Technology Ready to
Deliver." Chemical Engineer 720: 41.
Harvey, A. P., Mackley M.R., and Seliger T. (2003). "Process Intensification of
Biodiesel Production Using a Continuous Oscillatory Flow Reactor." Journal of
Chemical Technology and Biotechnology 78: 338-341.
Harvey, A. P., Mackley M.R. and Stonestreet, P. (2001). "Operation and Optimization
of an Oscillatory Flow Continuous Reactor : Novel Reactor Engineering for the
New Millennium." Industrial & Engineering Chemistry Research 40(23): 5371-
5377.
Henderson, N. (2007). 100 Years of Aspirin, The Aspirin Foundation.
Hewgill, M. R., Mackley, M.R., Pandit, A.B. and Pannu, S.S. (1993). "Enhancement of
Gas-Liquid Mass Transfer Using Oscillatory Flow in Baffled Tubes." Chemical
Engineering Science 48: 799-803.
Hoffmann, F. (1900). Acetyl Salicylic Acid. U. P. Office. United States of America,
Farbenfabriken of Elberfeld. 644077.
Hölzera, A. and M. Sommerfeld (2007). "New Simple Correlation Formula for the Drag
Coefficient of Non-Spherical Particles " Powder Technology 184(3): 361-365.

152
Hounslow, M. J. and Ni, X. (2004). "Population Balance Modelling of Droplet
Coalescence and Break-up in an Oscillatory Baffled Reactor." Chemical
Engineering Science 59(4): 819-828.
Howes, T. (1988). On the Dispersion of Unsteady Flow in Baffled Tubes. Cambridge,
University of Cambridge. PhD.
Howes, T. and Mackley, M. R. (1990). "Experimental Axial-Dispersion for Oscillatory
Flow through a Baffled Tube." Chemical Engineering Science 45(5): 1349-1358.
Huang, Z., Sun, G.B., Chiew, Y. C. and Kawi, S. (2005). "Formation of Ultrafine
Aspirin Particles Through Rapid Expansion of Supercritical Solutions (RESS)."
Powder Technology 160(2005): 127 – 134.
ICH (2006). Guidance for Industry - Q8: Pharmaceutical Development. Rockville,
FDA.
Jasperse, C. P. (2007). Chemiluminescence: Synthesis of Cyalume. Minnesota,
Minnesota State University.
Jennings, W. G. (1957). "Circulation Cleaning." Journal of Dairy Science 40(11): 1471–
1479.
Jr., M. J. M. and Lodaya, M. (2004). "Continuous Processing in Pharmaceutical
Manufacturing: Where We Have Been and Where We are Going." American
Pharmaceutical Review 7(4): 70-75.
Kamlet, J. (1956). Process for the Manufacture of Acetylsalicylic Acid. U. P. Office.
United States of America. 2731492.
Karlsson, C., Whalgreen, M. and Tragardh, C. (1998). "The Removal of Β-
Lactoglobulin from Stainless Steel Surfaces at High and Low Temperature as
Influenced by the Type and Concentration of Cleaning Agent" Journal of Food
Process Engineering 21(6): 485-501.
Knott, G. and Mackley M.R. (1980). "Eddy Motions near Plates and Ducts, Induced by
Water-Waves and Periodic Flows." Philosophical Transactions of the Royal
Society of London Series a-Mathematical Physical and Engineering Sciences
294(1412): 599.
Kossik, J. (2002). "Think Small." Pharmaceutical Manufacturing 1(1): 38-41.
Kotz, J. C., Treichel, P. M. and Townsend, J. R. (2009). Chemistry and chemical
reactivity. Belmont, CA, Thompson Brooks/Cole.

153
Kraft, P., Bajgrowicz, J. A., Denis, C. Fráter, G. (2000). "Odds and Trends: Recent
Developments in the Chemistry of Odorants." Angewandte Chemie 39(17):
2980 - 3010.
Lawton, S., Steele, G., Shering, P., Zhao, L., Laird, I. and Ni, X. (2009). "Continuous
Crystallization of Pharmaceuticals Using a Continuous Oscillatory Baffled
Crystallizer." Organic Process Research & Development. 13(6), 1357-1363
LeBlanc, D. (2000). "Establishing Scientifically Justified Acceptance Criteria for the
Cleaning Validation of API's." Pharmaceutical Technology 24(10): 160-168.
Lednicer, D. and Mitscher, L. (1999) The Organic Chemistry of Drug Synthesis.
Weinheim, Germany, Wiley-VCH Verlag GmbH & Co. KGaA.
Lee T., Kuo, S. and Chen, Y H. (2006) "Solubility, Polymorphism, Crystallinity, and Crystal
Habit of Acetaminophen and Ibuprofen by Initial Solvent Screening", Pharmaceutical
Technology 30(10): 72-92
Lelievre, C., Antonini, G., Faille, C. and Bénézech, T. (2002). "Modelling of Cleaning
Kinetics of Pipes Soiled by Bacillus Spores Assuming a Process Combining
Removal and Deposition." Trans IChemE 80(C): 305-311.
Lema, J. M., Roca, E., Sanromán, A., Nunez, M.J., Moreira M.T. and Feijoo G. (2001).
Pulsing Bioreactors. Multiphase Bioreactor Design. J. Tramper. London, Taylor
and Francis: 309-330.
Levenspiel, O. and Kunii, D. (1991). Fluidization Engineering. Oxford, UK,
Butterworth-Heinemann.
Link, K.P. (1959) The Discovery of Dicumarol and its Sequels. Circulation 19(1): 97-107.
Liu, D. H. F. and Liptak, B.G. (1997). Environmental Engineers' Handbook. Stamford,
USA Lewis Publishers, Inc.
Liu, S., Ni, X. Greated, C. A. and Fryer, P. J. (1995). "Measurements of Velocities of
Single Particles for Steady and Oscillatory Flows in Plain and Baffled Tubes."
Chemical Engineering Research and Design 73(6): 727-732.
Lock, E.A., Ellis, M.K., Gaskin, P., Robinson, M,. Auton, T.R., Provan, W.M., Smith,
L.L., Prisbylla, M.P., Mutter, L.C., Lee, D.L. (1998). "From Toxicological
Problem to Therapeutic Use: The Discovery of the Mode of Action of 2-(2-nitro-
4-trifluoromethylbenzoyl)-1,3-Cyclohexanedione (NTBC), its Toxicology and

154
Development as a Drug". Journal of Inherited Metabolic Disease 42(21): 498–
506.
Mackley, M. and Ni, X. (1993). "Experimental Fluid Dispersion Measurements in
Periodic Baffled Tube Arrays." Chemical Engineering Science 48(18): 3293-
3305.
Mackley, M. R. and Ni, X. (1991). "Mixing and Dispersion in a Baffled Tube for Steady
Laminar and Pulsatile Flow." Chemical Engineering Science 46(12): 3139-3151.
Mackley, M. R. and Stonestreet, P. (1995). "Heat Transfer and Associated Energy
Dissipation for Oscillatory Flow in Baffled Tubes " Chemical Engineering
Science 50(14): 2211-2224
Mackley, M. R., Lee, C. T., Stonestreet, P. and Middelberg A P. J. (2001). "Protein
Refolding in an Oscillatory Flow Reactor." Biotechnology Letters 23: 1899–
1901.
Mackley, M. R., Stonestreet, P., Roberts, E. P. L. and Ni, X. (1996). "Residence Time
Distribution Enhancement in Reactors Using Oscillatory Flow." Chemical
Engineering Research & Design 74(5): 509-583.
Mackley, M. R., Tweddle, G.M. and Wyatt, I.D. (1990). "Experimental Heat Transfer
Measurements for Pulsatile Flow in Baffled Tubes." Chemical Engineering
Science 45(5): 1237-1242.
Madsen, R. E. and Agalloco, J. P. (1998). "Technical Report No. 29, Points to Consider
for Cleaning Validation." PDA Journal of Pharmaceutical Sciencie and
Technology 52(S6)
Malhotra, G. (2008). "Is it the Antithesis of Creative Destruction?" Pharmaceutical
Manufacturing.(3)
Malhotra, G. (2009). "Hesitation in the Drive to a Continuous Pharmaceutical
Manufacturing Process: Real or Imaginary?" Pharmaceutical Processing. (7)
Marwaha, G. (2007). "Green pharma." Pharmaceutical Technology Europe 19(3): 9.
Masngut, A. N., Takriff, M. S., Kalil, M. S., Kadum, A. A. H. and Mohamad, A.W.
(2006). Performance of Oscillatory Flow Reactor and Stir Tank Reactor in
Solvent Fermentation From Palm Oil Mill Effluent. Proceedings of the 1st
International Conference on Natural Resources Engineering & Technology
2006, Putrajaya, Malaysia.
McCapra, F. (2000). "Demonstrations in Chemiluminescence." Methods in Enzymology
305(42): 633.

155
McKeen, L. W. (2006). Fluorinated Coatings and Finishes Handbook - -The Definitive
User's Guide and Databook. Norwich, NY, William Andrew Publishing.
McKetta, J. J. and Cunningham, W. A. (1977). Encyclopedia of Chemical Processing
and Design. Boca Raton, USA, CRC Press.
McKiernan P.J. (2006). "Nitisinone in the Treatment of Hereditary Tyrosinaemia Type
1". Drugs 66 (6): 743–50.
Mersmann, A., Ed. (2001). Crystallization Technology Handbook. New York, Marcel
Dekker, Inc.
Metz, P. A. (2002). Applying the Concept of Limiting Reactant to the Synthesis of
Aspirin. CER Modular Laboratory Program in Chemistry. P. A. Metz. Pacific
Grove, CA, Wadsworth Group.
MHRA (2007). Rules and Guidance for Pharmaceutical Manufaturers and Distributors.
London, Phamaceutical Press.
Mignard, D., Amin L. P. and Ni, X. (2004). "Modelling of Droplet Breakage
Probabilities in an Oscillatory Baffled Reactor." Chemical Engineering Science
59(11): 2189-2200.
Miles, W. H. and Connell, K. B. (2006). "Synthesis of Methyl Diantilis, a Commercially
Important Fragrance." Journal of Chemical Education 83(2): 285-286.
Minton, P. (1986). Handbook of Evaporation Technology. New Jersey, Noyes
Publications.
Morrison, R. and Boyd, R. (1992). Organic Chemistry. New Jersey, Prentice-Hall.
Mullin, J. (2007). Crystallization and Precipitation. Ullmann's Encyclopedia of
Industrial Chemistry. F. Ullmann. Weinheim, Germany, Wiley-VCH Verlag
GmbH & Co. KGaA.
Mwaba, M. G. (2003). Analysis of Heat Exchanger Fouling in Cane Sugar Industry.
Eindhoven, Technische Universiteit Eindhoven.
Naish, J. (2008). Are We all Addicted to Painkillers? The Times. London, UK.
Nelson, G. (2001). Scale-up Study of Suspension Polymerisation in an Oscillatory
Baffled Reactor. Department of Mechanical and Chemical Engineering.
Edinburgh, Heriot Watt University. Doctor of Philosophy: 264.
Ni, X. (1995). "A Study of Fluid Dispersion in Oscillatory Flow Through a Baffled
Tube." Journal of Chemical Technology & Biotechnology 64(2): 165-174.
Ni, X. (2009). Personal Correspondence from Nitech Solutions to Genzyme Corp. East
Kilbride, UK.

156
Ni, X., Cosgrove J. A., Cumming R. H., Greated C. A., Murray K. R., Norman P.
(2001). "Experimental Study of Flocculation of Bentonite and Alcaligenes
eutrophus in a Batch Oscillatory Baffled Flocculator." Trans IChemE 79(Part
A): 33-40.
Ni, X. , Fitch, A. and Webster, P. (2003). "From Maximum to Most Efficient
Production Using a Continuous Oscillatory Baffled Reactor." PIN News - The
Newsletter of Process Intenssification Network(9): 12-15.
Ni, X. and Gao S. (1996). "Scale-up Correlation for Mass Transfer Coefficients in
Pulsed Baffled Reactors." Chemical Engineering Journal 63: 157-166.
Ni, X., Gao S., Cumming R. H., Pritchard D.W. (1995). "A Comparative Study of Mass
Transfer in Yeast for a Batch Pulsed Baffled Bioreactor and a Stirred Tank
Fermenter." Chemical Engineering Science 50(13): 2127-2136.
Ni, X. and Liao, A. (2008). "Effects of Cooling Rate and Solution Concentration on
Solution Crystallization of l-Glutamic Acid in an Oscillatory Baffled
Crystallizer." Crystal Growth and Design 8(8): 2875–2881.
Ni, X. and Pereira, N. (2000). "Parameters Affecting Fluid Dispersion in a Continuous
Oscillatory Baffled Tube." AIChE Journal 46(1): 37-45.
Ni, X. (1994). "Residence Time Distribution Measurements in a Pulsed Baffled Tube
Bundle." Journal of Chemical Technology & Biotechnology 59(3): 213-221.
Ni, X. (2006). "Continuous Oscillatory Baffled Reactor Technology." Innovations in
Pharmaceutical Technology 20: 90-96.
Ni, X., Gelicourt, Y. S., Neil, J. and Howes, T. (2002). "On the Effect of Tracer Density
on Axial Dispersion in a Batch Oscillatory Baffled Column." Chemical
Engineering Journal 85(1): 17-25.
Ni, X., Jian, H. and Fitch, A.W. (2002). "Computational Fluid Dynamic Modelling of
Flow Patterns in an Oscillatory Baffled Column." Chemical Engineering Science
57(14): 2849-2862.
Ni, X., Johnstone J.C., Symes K. C., Grey B. D., Bennett D.C. (2001). "Suspension
Polymerization of Acrylamide in an Oscillatory Baffled Reactor: From Drops to
Particles." AIChE Journal 47(8): 1746 - 1757.
Ni, X. and Liao, A. (2010). "Effects of Mixing, Seeding, Material of Baffles and Final
Temperature on Solution Crystallization of l-glutamic Acid in an Oscillatory
Baffled Crystallizer " Chemical Engineering Journal 156(1): 226-233

157
Ni, X., Valentine, A; Liao, A., Sermage, S. B. C., Thomson, G. B. and Roberts, K.J.
(2004). "On the Crystal Polymorphic Forms of L-Glutamic Acid Following
Temperature Programmed Crystallization in a Batch Oscillatory Baffled
Crystallizer." Crystal Growth & Design 4(6): 1129 -1135.
Ni, X., Murray, K. R., Zhang, Y. M., Bennett, D. and Howes, T. (2002). "Polymer
Product Engineering Utilising Oscillatory Baffled Reactors." Powder
Technology 124: 281-286.
Ni, X. and Stevenson, C. (1999). "On the Effect of Gap Size Between Baffle Outer
Diameter and Tube Inner Diameter on the Mixing Characteristics in an
Oscillatory-Baffled Column." Journal of Chemical Technology and
Biotechnology 74(6): 587-593.
Ni, X., Zhang, Y. and Mustafa, I. (1998). "An Investigation of Droplet Size and Size
Distribution in Methylmethacrylate Suspensions in a Batch Oscillatory-Baffled
Reactor." Chemical Engineering Science 53(16): 2903-2919.
Ni, X., Zhang, Y. and Mustafa, I. (1999). "Correlation of Polymer Particle Size with
Droplet Size in Suspension Polymerisation of Methylmethacrylate in a Batch
Oscillatory Baffled Reactor." Chemical Engineering Science 54 (6): 841-850.
Nordenberg, T. (1999). "Aspirin's Other Uses." FDA Consumer Magazine(March-April
1999).
Norton, E. (2009). Visit to Piramal - Grangemouth. R. Caldeira. Grangemouth.
Nozal, M. J., Bernal, J. L., Toribio, L., Jiménez, J. J. and Martín, M. T. (2000).
"Validation of the Removal of Acetylsalicylic Acid: Recovery and
Determination of Residues on Various Surfaces by High Performance Liquid
Chromatographic." Journal of Chromatography A 870(1-2): 69-75.
O'Hare, M. (2006). "A Nose for Controversy." New Scientist(2578): 74-75.
Ochsner, P. A. (1987). Frangrance Compositions Containing Benzyl Ethers. U. P.
Office. USA, Givaudan Corporation. 4657700.
Osborne, C., Ed. (1998). Aspirin - A Curriculum for Post-16 Chemistry Courses.
London, Education Division, The Royal Society of Chemistry
Pavia, D., Lampman, G. M., Kriz, G. S. and Engel, R. G. (1990). Introduction To
Organic Laboratory Techniques: A Microscale Approach. Philadelphia,
Saunders College.
Pellek, A. and Arnum, P. V. (2008). "Continuous Processing: Moving with or against
the Manufacturing Flow." Pharmaceutical Technology 9 (32): 52-58

158
Pereira, N. and Ni, X. (2001). "Droplet Size Distribution in a Continuous Oscillatory
Baffled Reactor " Chemical Engineering Science 56(3): 735-739.
Perka, A. T., Grant, C. S. and Overcash, M. R. (1993). "Waste Minimization in Batch
Vessel Cleaning." Chemical Engineering Communications 119(1): 167-177.
Peters, M. (2002). "Summer Lights." The Catalyst 17(1): 5-6.
Plumb, K. (2005). "Continuous Processing in the Pharmaceutical Industry: Changing
the Mind Set " Chemical Engineering Research and Design 83(6): 730-738
Pollack, A. (2010). Genzyme Drug Shortage Leaves Users Feeling Betrayed. The New
York Times. New York.
Potdar, M. A. (2007). Pharmaceutical Quality Assurance. Pune, Nirali Prakashan.
Pybus, D. H. (1999). The History of Aroma Chemistry and Perfume. The chemistry of
fragrances. C. S. Sell. Cambridge, RSC.
Raghavan D., Brandes L. J., Klapp K., Snyder T., Styles E., Tsao-Wei D., Lieskovsky
G., Quinn D.I., Ramsey, E.W. (2005) "Phase II Trial of Tesmilifene Plus
Mitoxantrone and Prednisone for Hormone Refractory Prostate Cancer: High
Subjective and Objective Response in Patients With Symptomatic Metastases."
Journal of Urology 174(5):1808-13
Reis, N., Gonçalves C. N., Aguedo M., Gomes N., Teixeira J. A. and Vicente A. A..
(2006). "Application of a Novel Oscillatory Flow Micro-Bioreactor to the
Production of γ-Decalactone in a Two Immiscible Liquid Phase Medium."
Biotechnology Letters 28(7): 485-490.
Reis, N., Teixeira J. A., Vicente A. A. and Mackley, M. R. (2004). "Residence Times
and Mixing of a Novel Continuous Oscillatory Flow Screening Reactor."
Chemical Engineering Science 59(22-23): 4967-4974
Reis, N., Teixeira J. A. and Vicente A. A. (2010). "Liquid Backmixing in Oscillatory
Flow Through a Periodically Constricted Meso-tube " Chemical Engineering
and Processing: Process Intensification In press.
Rios, M. (2007). "Continuous Processing - Finally." Pharmaceutical Technology 31(4).
Roberts, E. (1992). Unsteady Flow and Mixing in Baffled Channels. Cambridge,
University of Cambridge. PhD.
Roy, J. (2002). "Pharmaceutical Impurities- A Mini-Review." AAPS PharmSciTech
3(2): E6.

159
Santra, S. and Baumann, U. (2008). Experience of Nitisinone for the Pharmacological
Treatment of Hereditary Tyrosinaemia Type 1. Expert Opinion on
Pharmacotherapy, 9(7): 1229-1236)
Scarso, E. (1996). "Timing the Adoption of a New Technology: An Option-Based
Approach." Management Decision 34(3): 41-48.
Schulman, H., Baron, F. A. and Weinberg, A. E. (1975). Preparation of n-Acetyl-p-
Aminophenol. U. P. Office. United States of America, Mallinckrodt, Inc.
3917695.
Smith, K. B. and Mackley, M. R. (2006). "An Experimental Investigation into the
Scale-up of Oscillatory Flow Mixing in Baffled Tubes " Chemical Engineering
Research and Design 84(11): 1001-1011.
Sneader, W. (2000). "The Discovery of Aspirin: a Reappraisal." British Medical Journal
2000(321): 1591-1594.
Stahmann, M.A., Huebner, C. F., Link, K. P. (1941) "Studies on the Hemorrhagic Sweet
Clover Disease. V. Identification and Synthesis of the Hemorrhagic Agent."
Journal of Biological Chemistry, 138, 513–527
Stephens, G. G. and Mackley, M. R. (2002). "Heat Transfer Performance for Batch
Oscillatory Flow Mixing " Experimental Thermal and Fluid Science 25(8): 583-
594.
Sturchio, M. (2005). "Edwin A. Chandross Receives the ACS Award in Industrial
Chemistry." The Indicator 86(3): 7.
Swichtenberg, B. (2008). "Moving Beyond the Batch." Pharmaceutical Manufacturing
7(1): 24-26.
Takriff, M. and Masyithah, Z. (2002). "Interstage Backmixing in Oscillatory Flow in a
Baffled Column." Chemical Engineering Communications 189(12): 1640-1652.
Technologies, D.-C. (2008). "Playing Ball With the Pharma 'Big Boys'." Next
Generation Pharmaceutical Europe(6).
Thakore, S. B. and Bhatt, B. I. (2008). Introduction to Process Engineering and Design,
Tata McGraw Hill.
Thomas, H. (2008). Transforming the Pharma Industry: Lean Thinking Applied To
Pharmaceutical Manufacturing. Lean Management: Concepts and Industry
Perspectives. E. Mrudula. Hyderabad, India, Icfai University Press.
160
TL LaPorte, C. W. (2007). "Continuous Processes for the Production of Pharmaceutical
Intermediates and Active Pharmaceutical Ingredients." Current Opinion in Drug
Discovery and Development 10: 738-745
Trout, B. (2009). "Next-Wave Model." World Pharmaceutical Frontiers 1: 74-76.
Tung, H.-H., Paul, E.L. Midler, M. and McCauley, J. (2009). Crystallization of Organic
Compounds - An Industrial Perspective. New Jersey, John Wiley & Sons, Inc.
Turin, L. (2007). Color-stabilization of Aromachemicals. W. I. P. Organization. United
States of America, Flexitral, Inc. WO 2007/013901 A2.
Vervaet, C. and Remon, J. P. (2005). "Continuous Granulation in the Pharmaceutical
Industry " Chemical Engineering Science 60(14): 3949-3957.
Vidal, J.-P. (2006). Vanillin. Encyclopedia of Chemical Technology. Kirk-Othmer.
New Jersey, John Wiley & Sons.
Vilar, G., Williams, R.A., Wang, M. and Tweedie, R.J. (2008). "On Line Analysis of
Structure of Dispersions in an Oscillatory Baffled Reactor Using Electrical
Impedance Tomography." Chemical Engineering Journal 141: 58-66.
Vishweshwar, P., McMahon, J.A., Oliveira, M., Peterson, M. L. and Zaworotko M. J.
(2005). "The Predictably Elusive Form II of Aspirin." Journal of the American
Society of Chemistry 127(48): 16802–16803.
Voelter-Mahlknecht, S. and Mahlknecht, U. (2004). "Darwinism and
Pharmacogenomics: From ‘One Treatment Fits All’ to ‘Selection of the
Richest’? ." Trends in Molecular Medicine 10(5): 208-209
Watanabe M., Maemura, K., Kanbara, K., Tamayama, T. and Hayasaki, H. (2002).
"GABA and GABA Receptors in the Central Nervous System and Other
Organs". International Review of Cytology. 213: 1–47
Wieckhusen, D. (2008). Designing Robust Crystallization Processes for Active
Pharmaceutical Ingredients - From Art to Science. Process Chemistry in the
Pharmaceutical Industry. K. Gadamasetti and T. Braish. Boca Raton, FL, CRC
Press. 2 - Challenges in a Ever Changing Climate.
Williams, S.H. (2005). "Medications for Treating Alcohol Dependence". American
Family Physician 72 (9): 1775–1780.
Wilson, E. (1999). "Light Sticks." Chemical and Engineering News 7(3): 65.
WHO (2008). Monographs: Pharmaceutical substances: Acidum acetylsalicylicum -
Acetylsalicylic acid. Geneva, WHO.
Winder, R. (2003). "OFBR Causes a Stir." Chemistry and Industry 18: 19-20.

161
Yamamura, S. and Momose, Y. (2003). "Characterization of Monoclinic Crystals in
Tablets by Pattern-Fitting Procedure Using X-ray Powder Diffraction Data "
International Journal of Pharmaceutics 259(1-2): 27-37.
Young, D. (1963). Preparation of n-Acetyl-p-Aminophenol. U. P. Office. United States
of America, Sinclair Research, Inc. 3113150.
Zandt, R. T. V. (1977). Chemical Light Device. U. P. Office. USA, American
Cyanamid Company. 4064428.
Zhang, X., Maruyama, Yamaguchi, S. H. (2005). "Laminar Natural Convection Heat
Transfer From a Vertical Baffled Plate Subjected to a Periodic Oscillation."
Journal of Heat Transfer 127(7): 733-739.