an arcjet plume - national space grant...
TRANSCRIPT
I- - 203 - IEPC-95-28
LASER INDUCED FLUORESCENCE OF GROUND STATE HYDROGEN ATOMS INAN ARCJET PLUME
Jeffrey A. Pobst', Ingrid J. Wysong**
Hughes STXPropulsion Directorate
OL-AC Phillips LaboratoryEdwards AFB, CA 93524
SRonald A. Spores t
Propulsion DirectorateOL-AC Phillips LaboratoryEdwards AFB, CA 93524
I AbstractWe report two photon laser induced fluorescence measurements near the nozzle exit and in the plume of a1 kW arcjet thruster. Atomic hydrogen number densities, axial and radial velocities, and translationaltemperatures are measured in the expansion plume of a 1 kW arcjet operating on hydrogen propellant.Data from recent computational models are compared with the atomic hydrogen density measurements.
I Introduction Significant arcjet energy loss results from velocityprofile losses due to thick internal boundary layers
Arcjets are expected to play an ever increasing role in the arcjet nozzle and from frozen flow losses suchin satellite propulsion needs, primarily for as molecular dissociation. To quantify profilestationkeeping and on-orbit maneuvering in the near losses, both gas velocity and density distributionsterm. While the technology is considered viable must be known. In addition, arcjet models, whichenough to be deployed on a Telstar IV are necessary for timely and cost-effectivecommunications satellite for stationkeeping,' arcjet improvements to design, must be tested bytechnology is far from maturity. In order to compete comparison with key physical parameters.successfully with chemical propulsion systems foron-orbit missions, further improvements in arcjet At present, only limited inroads have been madepropulsion systems are still required. 2 If needed into the problem of plume density measurements.improvements in the performance level and For hydrogen arcjet thrusters, determination ofefficiency of arcjets are to be achieved, an increased species density has previously only beenunderstanding of the fundamental physical processes accomplished through a few diagnostic techniques.that govern the operation of an arcjet is essential. Inaddition, an ability to predict the plume behavior of Our previous work using multi-photon laser induceda space propulsion device is necessary for prediction fluorescence (LIF) provided the first measurementand amelioration of spacecraft interactions, of ground state hydrogen in an arcjet plume.
S*cientist Atomic hydrogen density profiles were reported** Principal Scientist near nozzle exit and a preliminary calibration wast Research Engineer performed to convert the relative density profiles to
Copyright @ 1995 International Electric Propulsion Conference. absolute number densities.All rights reserved. No copyright is asserted in the United Statesunder Title 17. U.S.C. The Government has a royalty-freelicense Knowledge of the atomic density profile at nozzleto exercise all rights under the copyright claimed herein forGovernment purposes. All other rights are reserved by copyright exit is important for evaluating our understanding ofowner. This paper is declared a work of the U.S. Government and the physical processes in the arcjet thruster and theis not subject to copyright protection in the United States.

- 204 -
computational models that have been written to The apparatus is shown schematically in Figure 2.
describe these processes. 4 9 The density of atoms The laser is a pulsed dye laser pumped by a
relative to the density of molecules is an indication Nd:YAG with a repetition rate of 10 Hz and a pulse
of how much energy is lost into dissociation of the width of 6 ns. The dye laser output at 615 nm is
hydrogen molecules and not recovered through frequency tripled to achieve about 0.5 mJ per pulse
recombination into translational kinetic modes, at 205 nm. A mirror turns about 80% of the beam
toward the arcjet chamber through a variable
To determine the molecular dissociation fraction, attenuator placed in the beam, the remaining 20% of
the molecular species density needs to be known as beam energy is directed toward a microwave-
well as the atomic number density. The recent use discharge source of atomic hydrogen.
of Raman spectroscopy '10 " in an arcjet plume has
provided the first information on molecular For axial velocity measurements, the beam is sent
hydrogen densities at the arcjet nozzle plane. directly down the axis of the arcjet flow (Path 1) andis focused with a telescope lens configuration (not
In addition to LIF on the ground state atoms, other shown) outside the chamber with a focal length on
absorption spectroscopy techniques' 2"13 have been the order of 2 m. For radial measurements, the
used on arcjet plumes to characterize hydrogen atom unfocussed beam is sent to a turning prism inside
densities. These VUV and XUV spectroscopy the chamber located underneath the arcjet (Path 2),
approaches are quite difficult to implement in directed to pass vertically through the plume, and is
practice and are limited to determination of line-of- focused by a 200 mm lens. The laser beam and
sight averaged number densities at downstream optics remain fixed, while the arcjet is mounted on a
locations in the plume where the optical depth is not motion control x, y, z stage to translate it for probing
too high. different regions of the plume.
For measuring velocity and temperature, both A filtered photomultiplier tube (PMT) is placed
ground state LIF 3 and excited state LIF 4.14.15 have behind the final turning mirror before the chamber
proven to be accurate and essentially nonintrusive. in order to detect amplified spontaneous emission
Though the excited states of hydrogen are more (ASE) that may propagate back along the laser beam
accessible, most atoms in the plume region are path (see further discussion below). A 200 mm
expected to be in the ground state. These two types focal length, 2" diameter lens is placed inside the
of LIF temperature and velocity measurements allow chamber to collimate the LIF that is emitted toward
examination of the differences between the excited the side window. The light is collected outside the
state and ground state species in the non-equilibrium chamber, focused through a 1 mm aperture, and
plume environment, detected with a filtered, gated PMT. Since the LIF
occurs at 656 nm, the filters used are a 656 nm
Experiment bandpass interference filter and an RG 645 colorglass filter (thus all scattered laser light (205nm) is
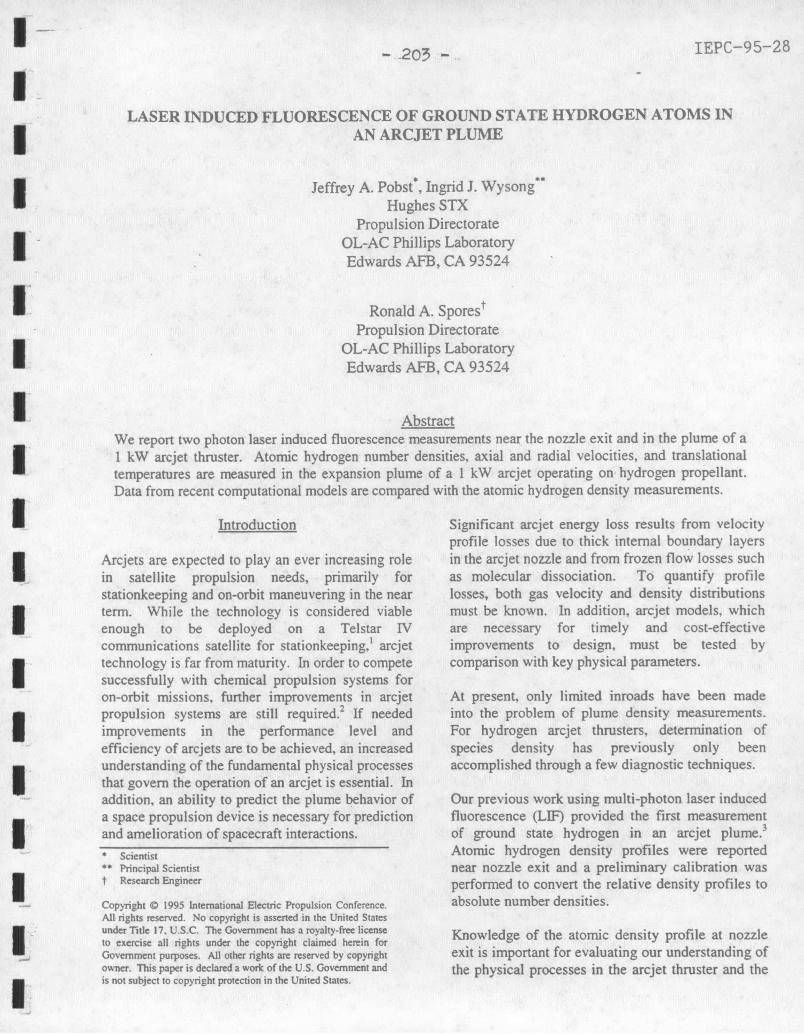
This work is performed using two-photon LIF filtered out). The gated PMT is an ordinary
(2PLIF) on ground-state hydrogen atoms in the Hamamatsu 928 tube with a special socket that is
plume of a 1-kW-class hydrogen arcjet. Since any triggered to detect light for 2 pts during each laser
propellant gas is opaque for the VUV radiation pulse and is off between pulses. This is an
required for single-photon excitation of ground state important feature that allows us to operate the PMT
atoms, 2PLIF at correspondingly longer wavelengths at full voltage without exceeding the anode current
is preferred. The diagnostic technique, which has limit due to the bright arcjet emission background.
been developed primarily for use in flames,' 6.17' 8 Saturation is avoided by setting the voltage level so
uses two photons at 205 nm to promote the atoms that both average current and peak current during
from the n=l to the n=3 electronic state (the LP the gate remain below the maximum specified for
transition). Subsequent 3-2 fluorescence is observed the PMT. A gated integrator with a 30 ns gate is
(the Ha transition), as indicated in the energy level used to amplify and average the Ha fluorescence
diagram in Figure 1. seen by the PMT. Alternatively, the PMT signal canbe digitized by a fast oscilloscope to obtainfluorescence lifetimes and quenching information.
I- 205 -
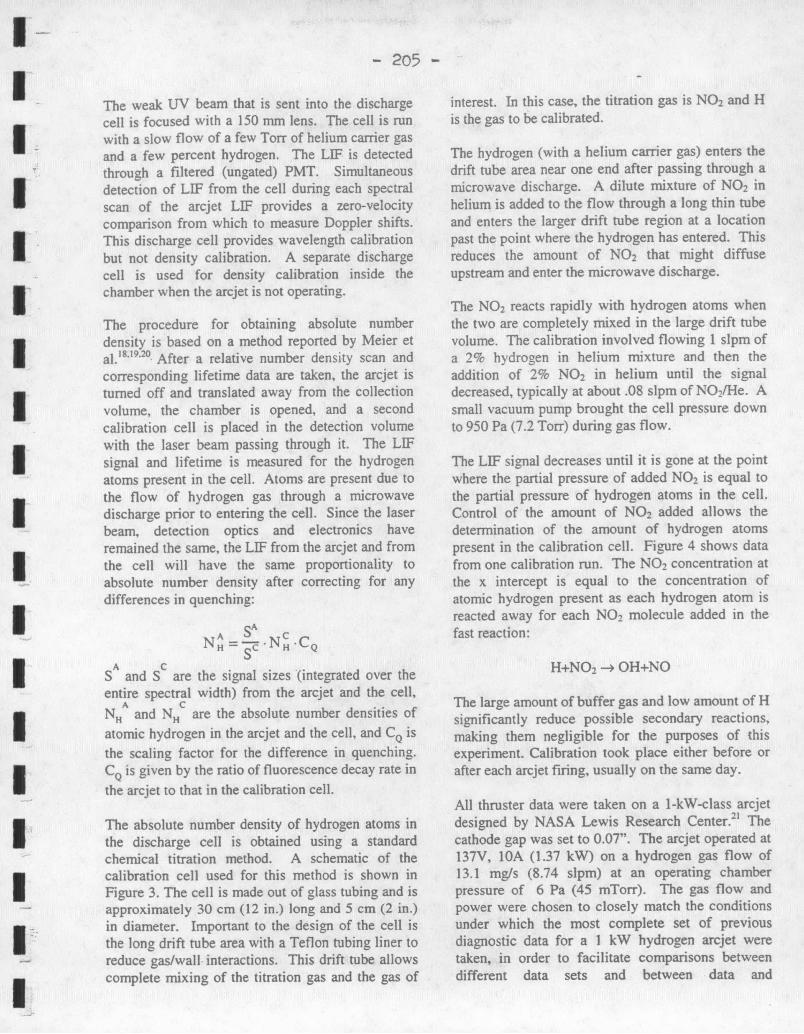
The weak UV beam that is sent into the discharge interest. In this case, the titration gas is NO 2 and H
cell is focused with a 150 mm lens. The cell is run is the gas to be calibrated.
with a slow flow of a few Torr of helium carrier gasand a few percent hydrogen. The LIF is detected The hydrogen (with a helium carrier gas) enters the
through a filtered (ungated) PMT. Simultaneous drift tube area near one end after passing through a
detection of LIF from the cell during each spectral microwave discharge. A dilute mixture of NO2 in
scan of the arcjet LIF provides a zero-velocity helium is added to the flow through a long thin tube
comparison from which to measure Doppler shifts. and enters the larger drift tube region at a location
This discharge cell provides wavelength calibration past the point where the hydrogen has entered. This
but not density calibration. A separate discharge reduces the amount of NO2 that might diffuse
cell is used for density calibration inside the upstream and enter the microwave discharge.chamber when the arcjet is not operating.
SThe NO 2 reacts rapidly with hydrogen atoms when
The procedure for obtaining absolute number the two are completely mixed in the large drift tubedensity is based on a method reported by Meier et volume. The calibration involved flowing 1 slpm ofal.'8 .19.2
0 After a relative number density scan and a 2% hydrogen in helium mixture and then thecorresponding lifetime data are taken, the arcjet is addition of 2% NO 2 in helium until the signalturned off and translated away from the collection decreased, typically at about .08 slpm of NO2/He. A
volume, the chamber is opened, and a second small vacuum pump brought the cell pressure downcalibration cell is placed in the detection volume to 950 Pa (7.2 Torr) during gas flow.
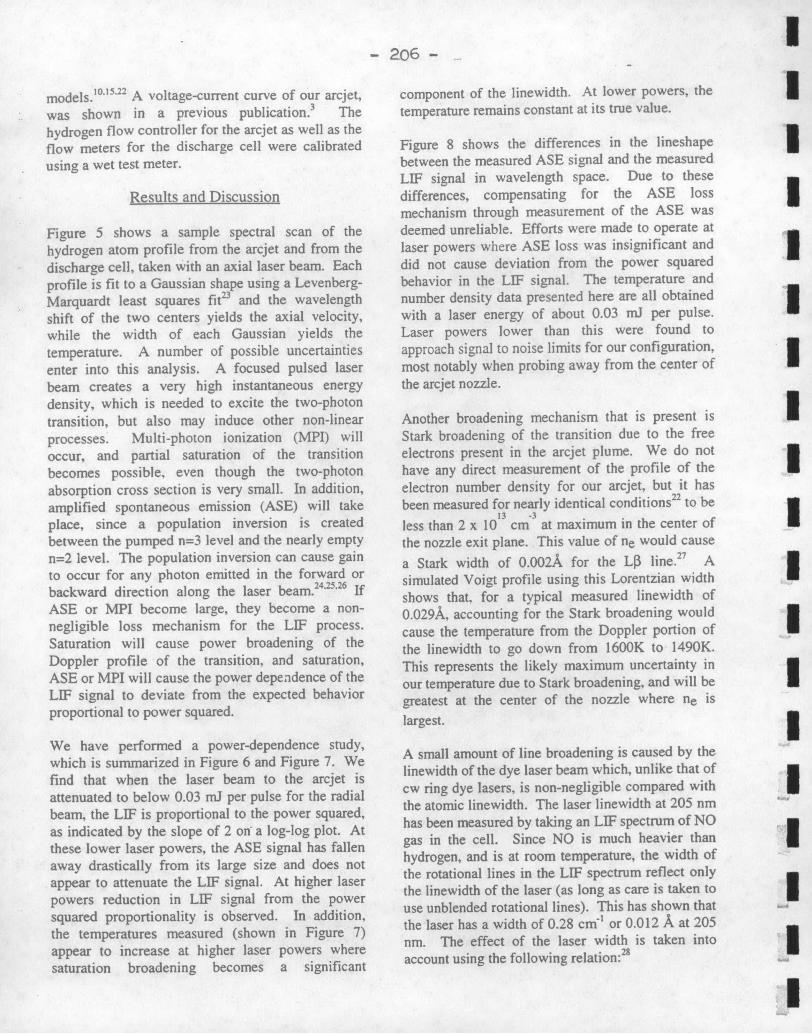
with the laser beam passing through it. The LIFsignal and lifetime is measured for the hydrogen The LIF signal decreases until it is gone at the point
atoms present in the cell. Atoms are present due to where the partial pressure of added NO 2 is equal tothe flow of hydrogen gas through a microwave the partial pressure of hydrogen atoms in the cell.I discharge prior to entering the cell. Since the laser Control of the amount of NO2 added allows the
beam, detection optics and electronics have determination of the amount of hydrogen atomsremained the same, the LIF from the arcjet and from present in the calibration cell. Figure 4 shows datathe cell will have the same proportionality to from one calibration run. The NO 2 concentration atabsolute number density after correcting for any the x intercept is equal to the concentration ofdifferences in quenching: atomic hydrogen present as each hydrogen atom is
A reacted away for each NO 2 molecule added in the
N SA N fast reaction:NH =c -N -CQ
SH+NO2 OH+NO
S and S are the signal sizes (integrated over the H+N0 2 -OH+NO
entire spectral width) from the arcjet and the cell,
N, and NH are the absolute number densities of significantly reduce possible secondary reactions,atomic hydrogen in the arcjet and the cell, and CQ is making them negligible for the purposes of thisthe scaling factor for the difference in quenching, experiment. Calibration took place either before orCQ is given by the ratio of fluorescence decay rate in after each arcjet firing, usually on the same day.
the arcjet to that in the calibration cell.All thruster data were taken on a 1-kW-class arcjet
The absolute number density of hydrogen atoms in designed by NASA Lewis Research Center.2' The
the discharge cell is obtained using a standard cathode gap was set to 0.07". The arcjet operated at
chemical titration method. A schematic of the 137V, 10A (1.37 kW) on a hydrogen gas flow ofcalibration cell used for this method is shown in 13.1 mg/s (8.74 slpm) at an operating chamber
Figure 3. The cell is made out of glass tubing and is pressure of 6 Pa (45 mTorr). The gas flow and
approximately 30 cm (12 in.) long and 5 cm (2 in.) power were chosen to closely match the conditionsin diameter. Important to the design of the cell is under which the most complete set of previous
the long drift tube area with a Teflon tubing liner to diagnostic data for a 1 kW hydrogen arcjet were
reduce gas/wall interactions. This drift tube allows taken, in order to facilitate comparisons betweenScomplete mixing of the titration gas and the gas of different data sets and between data and
- 206 -
models.10.15.22 A voltage-current curve of our arcjet, component of the linewidth. At lower powers, the
was shown in a previous publication.3 The temperature remains constant at its true value.
hydrogen flow controller for the arcjet as well as theflow meters for the discharge cell were calibrated Figure 8 shows the differences in the lineshape
using a wet test meter. between the measured ASE signal and the measuredLIF signal in wavelength space. Due to these
Results and Discussion differences, compensating for the ASE lossmechanism through measurement of the ASE was
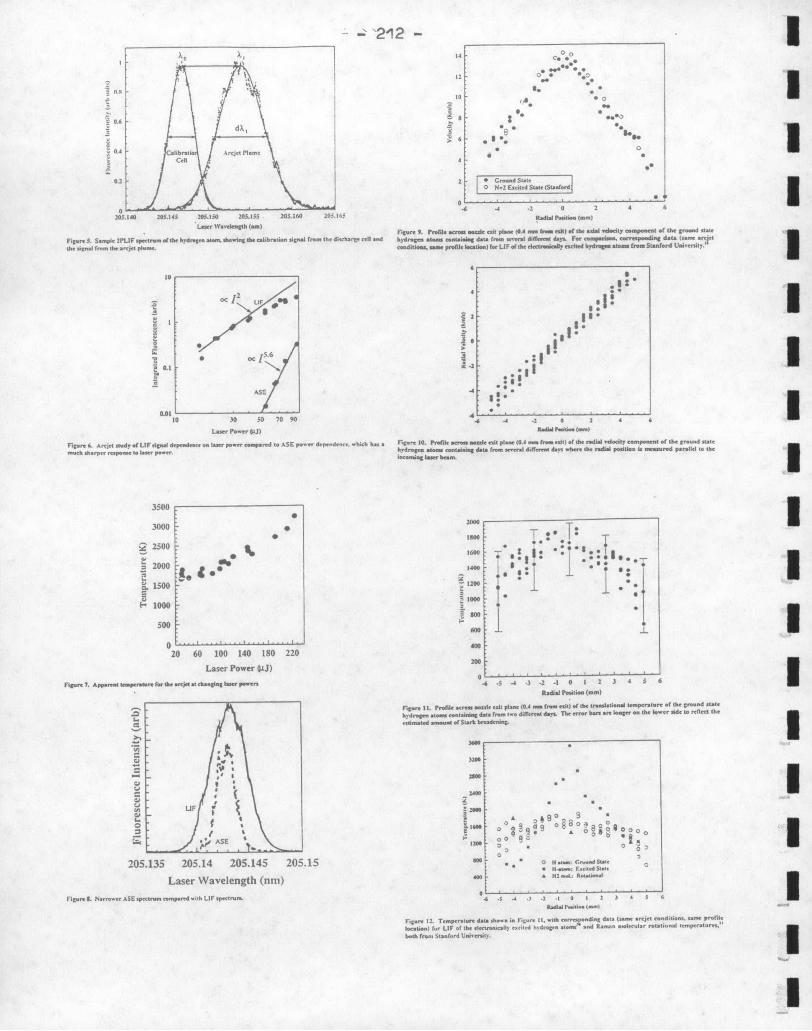
Figure 5 shows a sample spectral scan of the deemed unreliable. Efforts were made to operate at
hydrogen atom profile from the arcjet and from the laser powers where ASE loss was insignificant and
discharge cell, taken with an axial laser beam. Each did not cause deviation from the power squared
profile is fit to a Gaussian shape using a Levenberg- behavior in the LIF signal. The temperature and
Marquardt least squares fit 2 and the wavelength number density data presented here are all obtained
shift of the two centers yields the axial velocity, with a laser energy of about 0.03 mJ per pulse.
while the width of each Gaussian yields the Laser powers lower than this were found to
temperature. A number of possible uncertainties approach signal to noise limits for our configuration,enter into this analysis. A focused pulsed laser most notably when probing away from the center of
beam creates a very high instantaneous energy the arcjet nozzle.
density, which is needed to excite the two-photontransition, but also may induce other non-linear Another broadening mechanism that is present is
processes. Multi-photon ionization (MPI) will Stark broadening of the transition due to the free
occur, and partial saturation of the transition electrons present in the arcjet plume. We do not
becomes possible, even though the two-photon have any direct measurement of the profile of the
absorption cross section is very small. In addition, electron number density for our arcjet, but it has
amplified spontaneous emission (ASE) will take been measured for nearly identical conditions 22 to be
place, since a population inversion is created less than 2 x 10 cm at maximum in the center ofbetween the pumped n=3 level and the nearly empty the nozzle exit plane. This value of ne would causen=2 level. The population inversion can cause gain a Stark width of 0.002A for the L line.27 Ato occur for any photon emitted in the forward or simulated Voigt profile using this Lorentzian widthbackward direction along the laser beam. " If shows that, for a typical measured linewidth ofASE or MPI become large, they become a non- 0.029A, accounting for the Stark broadening would
negligible loss mechanism for the LF process. cause the temperature from the Doppler portion ofSaturation will cause power broadening of the the linewidth to go down from 1600K to 1490K.Doppler profile of the transition, and saturation, This represents the likely maximum uncertainty inASE or MPI will cause the power dependence of the our temperature due to Stark broadening, and will beLIF signal to deviate from the expected behavior greatest at the center of the nozzle where ne isproportional to power squared. largest.
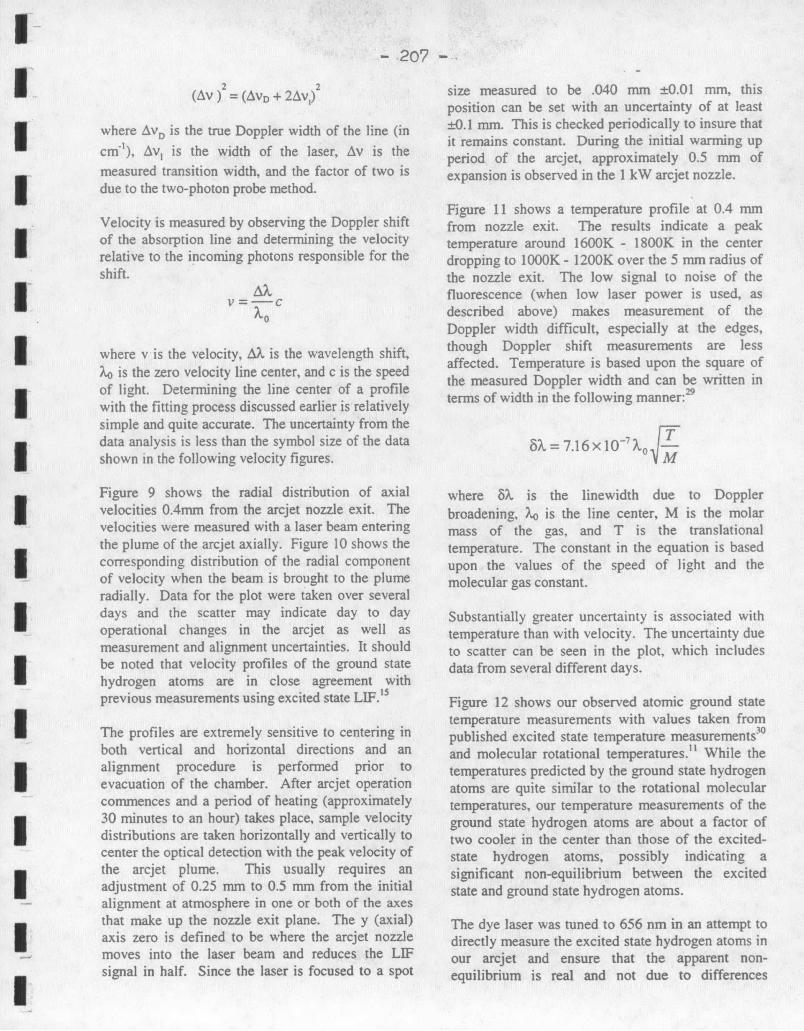
We have performed a power-dependence study,We have performed a powerdependence study, A small amount of line broadening is caused by thewhich is summarized in Figure 6 and Figure 7. We linewidth of the ele bea ic unie thfind that when the laser beam to the arcjet is line dye laser beam which, unlike that ofattenuated to below 0.03 mJ per pulse for the radial atoc linewidth. Thcw ring dye lasers, is non-negligible compared newidth at 205 nmbeam, the LIF is proportional to the power squared, the atomic linewidth. The laser linewidth at 205 nmas indicated by the slope of 2 on a log-log plot. At has been measured by taking an L spectrum of NOthese lower laser powers, the ASE signal has fallen gas in the cell. Since NO is much heavier thanaway drastically from its large size and does not hydrogen, and is at room temperature, the width ofappear to attenuate the L signal. At higher laser the rotational lines in the LIF spectrum reflect onlyappear to attenuate the LIF signal. At higher laser the linewidth of the laser (as long as care is taken topowers reduction in LIF signal from the powerrs redu roortion i n IF signal from the power use unblended rotational lines). This has shown thatsquared proportionality is observed. In addition, the laser has a width of 0.28 cm or 0.012 A at 205the temperatures measured (shown in Figure 7) the laser width 1 o 0 1 atappear to increase at higher laser powers where nm. The effect of the laser width is taken intosaturation broadening becomes a significant account using the following relation:
I1
- -207-
S(Av) = AD +2Av) 2 size measured to be .040 mm ±0.01 mm, thisposition can be set with an uncertainty of at least
where AVD is the true Doppler width of the line (in -0.1 mm. This is checked periodically to insure that
, it remains constant. During the initial warming upcm), Av is the width of the laser, v is the period of the arcjet, approximately 0.5 mm ofmeasured transition width, and the factor of two is expansion is observed in the 1 kW arcjet nozzle.due to the two-photon probe method.
Figure 11 shows a temperature profile at 0.4 mmVelocity is measured by observing the Doppler shift from nozzle exit. The results indicate a peakof the absorption line and determining the velocity temperature around 1600K - 1800K in the centerrelative to the incoming photons responsible for the dropping to 1000K - 1200K over the 5 mm radius ofshift. the nozzle exit. The low signal to noise of the
V Ak fluorescence (when low laser power is used, as
X0 described above) makes measurement of the
Doppler width difficult, especially at the edges,
where v is the velocity, AX is the wavelength shift, though Doppler shift measurements are less. affected. Temperature is based upon the square of
X0 is the zero velocity line center, and c is the speed .the measured Doppler width and can be written in
of light. Determining the line center of a profile 29with the fitting process discussed earlier is relatively terms of width in the following manner:
simple and quite accurate. The uncertainty from thedata analysis is less than the symbol size of the data R = 7.16 x 10 7 10. /shown in the following velocity figures. VM
Figure 9 shows the radial distribution of axial where 68 is the linewidth due to Dopplervelocities 0.4mm from the arcjet nozzle exit. The broadening, Xo is the line center, M is the molarvelocities were measured with a laser beam entering mass of the gas, and T is the translationalthe plume of the arcjet axially. Figure 10 shows the temperature. The constant in the equation is basedcorresponding distribution of the radial component upon the values of the speed of light and theof velocity when the beam is brought to the plume molecular gas constant.radially. Data for the plot were taken over severaldays and the scatter may indicate day to day Substantially greater uncertainty is associated withoperational changes in the arcjet as well as temperature than with velocity. The uncertainty duemeasurement and alignment uncertainties. It should to scatter can be seen in the plot, which includesbe noted that velocity profiles of the ground state data from several different days.hydrogen atoms are in close agreement withprevious measurements using excited state LIF.'J Figure 12 shows our observed atomic ground state
temperature measurements with values taken fromThe profiles are extremely sensitive to centering in published excited state temperature measurements 30
both vertical and horizontal directions and an and molecular rotational temperatures." While thealignment procedure is performed prior to temperatures predicted by the ground state hydrogenevacuation of the chamber. After arcjet operation atoms are quite similar to the rotational molecularcommences and a period of heating (approximately temperatures, our temperature measurements of the30 minutes to an hour) takes place, sample velocity ground state hydrogen atoms are about a factor ofdistributions are taken horizontally and vertically to two cooler in the center than those of the excited-center the optical detection with the peak velocity of state hydrogen atoms, possibly indicating athe arcjet plume. This usually requires an significant non-equilibrium between the excitedadjustment of 0.25 mm to 0.5 mm from the initial state and ground state hydrogen atoms.alignment at atmosphere in one or both of the axesthat make up the nozzle exit plane. The y (axial) The dye laser was tuned to 656 nm in an attempt toaxis zero is defined to be where the arcjet nozzle directly measure the excited state hydrogen atoms inmoves into the laser beam and reduces the LIF our arcjet and ensure that the apparent non-signal in half. Since the laser is focused to a spot equilibrium is real and not due to differences
- --208
between our system and Stanford's. The Ha LIF models. The Boyd model is authored by I. D. Boyd
was detected, but the power broadening due to the at Corell University. 9 It is a Direct Simulation
focused, pulsed laser was very severe. Decreasing Monte Carlo (DSMC) particle code that predicts
the laser power enough to alleviate the power physical properties through most of the arcjet nozzle
broadening led to an unacceptable signal-to-noise and out into the plume. The Butler model is
ratio, so this measurement could not be pursued, authored by G. W. Butler at Olin AerospaceCorporation and is a Navier Stokes (NS) code that
Figure 13 shows two sample fluorescence decay computes the flow properties throughout the arcjet
curves, one measured at the center of the nozzle exit nozzle, stopping at the nozzle exit.53' A separate
plane, and the other measured near the edge of the NS code written by Megli, Krier, and Burton from
nozzle exit plane. Change in the lifetime represents the University of Illinois predicts results that are
the effect of collisional quenching in the 3-2 also shown in the figure.2 Like the Butler model
transition. The curves are obtained by digitizing the the calculations extend to the nozzle exit, but not
LIF signal from the PMT using a 500 MHz into the plume.
oscilloscope. Also shown in the figure is a curvefrom the laser scatter only (with optical filters The number density differences between the data
removed from the PMT) to show the time resolution and the model indicate almost an order of magnitude
of the system with no LIF present. Decay curves higher atomic density than predicted by the two
such as Figure 13 are analyzed by starting at 10 ns Navier Stokes models and a factor of three higher
after the laser pulse and fitting the signal to an than the DSMC prediction.
exponential decay.Shown in Table 1 is a comparison of the predictions
Figure 14 shows results for lifetime measurements for both atomic hydrogen and molecular hydrogen
from several separate days as a function of position densities for each of the models. In addition
along the nozzle exit. The lifetimes measured in the experimental results on species density from this
arcjet plume indicate the collisional quenching due work and that of Beattie and Cappelli at Stanford
to electrons, H2, or most likely some combination of University are shown."
both. The LIF signal is only proportional to numberdensity if it is corrected for losses due to quenching. Note that the predictions for all three models agree
well with each other and with experiment for
The need for correcting for collisional quenching is molecular hydrogen density at the centerline of
evident in Figure 15 where the density prediction nozzle exit. As seen in the previous figure, the
before and after the correction for quenching is differences in atomic number density can be quite
seen. In this case the correction is significant in the large. These atomic discrepancies, in light of the
center region, and minimal at the edge of the profile. molecular density agreements, indicate differentmolecular dissociation fractions predicted by the
Figure 16 shows the calibrated number density codes and by the combination of the two
profile of hydrogen atoms near the exit plane of the experiments at the center of the nozzle exit.
nozzle (0.4mm from nozzle exit plane). This isobtained from the area under the curve of the The two experimental efforts indicate a dissociation
hydrogen atom profile (at low laser power to avoid fraction as large as 50% at the nozzle exit center.
ASE, MPI and saturation), and corrected by the This is an approximation for dissociation as the
fluorescence yield at each location. Separately error bars on both experiments are quite large and
calibrated data sets from many different days are the experiments were done on two different arcjets,
included in the plot. The peak of the density profile though every effort was made to operate at similar
is at the center of the nozzle exit plane and indicates arcjet conditions.
a number density of 1 x 1016 cm 3 and falls off aboutone and a half orders of magnitude over the 5 mm to The predicted dissociation fraction from each of the
the nozzle exit wall. models is substantially less ranging from 5% to 18%depending upon the model. Accurately predicting
Also shown in the figure are the predicted exit plane the dissociation fraction could be closely related to
number density distributions from three arcjet understanding the amount of frozen flow energy loss
.fl

- 209 -
in the arcjet thruster and an important step in nozzle exit leading to an even greater discrepancyimproving arcjet efficiency from the current 30% to with the predictions from the computational models.35% range.
Conclusions
Figure 16 shows a two dimensional profile of thehydrogen atomic number density data taken at .4 Using two-photon LIF, hydrogen ground statemm downstream of nozzle exit. This figure shows a number densities, velocities and temperatures have
generally axisymmetric flow with non-smooth been measured near the arcjet nozzle exit. Generalfeatures at the edges of each density range. The agreement with previous nozzle exit velocity
rough contours are caused partially by the I/distance distributions is seen, with no effect of translational
algorithm used to create the contours from a slip being observed. Temperature measurements of
Cartesian data set that was large and intensive to the atomic ground state appear to be significantlytake, but still less in quantity of points than perhaps cooler than those previously measured in excited
desirable for identifying precise gradients. In states indicating non-equilibrium behavior.
addition, the noise in the data as seen in the earlierdensity plot of Figure 16 is significant and can cause Number density measurements at the nozzle exit are
the appearance of shifting gradients in this type of made, carefully avoiding such loss mechanisms as
two dimensional representation. multi-photon ionization, amplified spontaneousemission, and laser saturation. Fluorescence
Figure 17 shows the same data in the two quenching was measured and corrected for.dimensional plot all collapsed onto a single axiswith radius as the ordinate. Each line is a single The number density distributions are compared with"spoke" of the two dimensional data shown in computational modeling data and indicate a
Figure 17. The lines are shown together to illustrate significantly higher, more peaked number densitythat the spread between the different radial profiles than predicted. Including recent molecular densityis within the scatter that is seen when examining just data, a higher dissociation fraction is observed than
one radial profile on several different days. This is currently predicted by the computational modelsindicates that the flow appears to be quite indicating that frozen flow energy loss may be aaxisymmetric within the experimental uncertainty, more significant contribution to the arcjet's low
efficiency.Examining the behavior of the density andtemperature as the flow exits the nozzle, Figure 19 Axial symmetry of the density at nozzle exit isshows the density and temperature gradients from observed within the scatter of the measurement and0.2mm past nozzle exit to 30 mm downstream along both density and temperature axial trends arethe nozzle centerline. One of the benefits of looking observed indicating that data taken at 0.4mm isat these trends was to examine the validity of likely representative of properties right at the nozzle
comparing data taken at 0.4 mm downstream to the exit and data across the nozzle exit in one direction
properties right at nozzle exit. Since the optical data is representative of the entire plane.for this experiment could not be observed inside thenozzle, many data points were taken close to thenozzle exit and the axial position axis is shown on a Referenceslogarithmic scale. Note that while the density doesappear to decrease as it exits, the difference between 1. W. W. Smith, et al, "Low Power Hydrazine Arcjet
the data taken at 0.4 mm and what would be Qualification," IEPC Pper 91-148, Oct. 1991.
extrapolated back to nozzle exit is well within the2. C. E. Vaughan, and R. J. Cassady, "An Updated
Assessment of Electric Propulsion Technology forthe data would not appear significantly different if Near-Earth Space Missions," Paper AIAA- 92-3202,the exact nozzle exit was able to be probed with this July 1992.technique. In addition, if the data fails to predict thecorrect atomic number density right at the nozzle 3. J. A. Pobst, I. J. Wysong, R.A. Spores, "Laserexit, it would appear from the trend in this figure to Induced Fluorescence of Ground State Hydrogenunderpredict the number of hydrogen atoms at Atoms at Nozzle Exit of an Arcjet Thruster," AIAA
- 210 -
Paper AIAA-95-1973, 26th Plasmadynamics and Plasmadynamics and Lasers Conference, 6-8 July,
Lasers Conference, 19-22 June, 1995, San Diego, 1992, Nashville, Tennessee.
California.13. D.H. Manzella and M.A. Cappelli, "Vacuum
4. D. Keefer, D. Burtner, T. Moeller, and R. Rhodes, Ultraviolet Absorption in a Hydrogen Arcjet," Paper
"Multiplexed Laser Induced Fluorescence and Non- AIAA-92-3564, 23rd Plasmadynamics and Lasers
Equilibrium Processes in Arcjets," Paper AIAA-94- Conference, 6-8 July, 1992, Nashville, Tennessee.
2656, 25th Plasmadynamics and Lasers Conference,20-23 July, 1994, Colorado Springs, Colorado. 14. D.A. Erwin, G.C. Pham-Van-Diep, and W.D.
Deininger, "Laser-induced Fluorescence
5. G.W. Butler, I. D. Boyd, and M. A Cappelli, "Non- Measurements of Flow Velocity in High-Power
Equilibrium Flow Phenomena in Low Power Arcjet Thruster Plumes," AIAA J. 29, 1298 (1991).
Hydrogen Arcjets," Paper AIAA-95-2819, 31st Joint
Propulsion Conference, 10-12 July, 1995, San Diego, 15. J.G. Liebeskind, R.K. Hanson, and M.A. Cappelli,
California. "Laser-induced Fluorescence Diagnostic forTemperature and Velocity Measurements in a
6. V. Babu, S.M. Aithal, and V.V. Subramaniam, Hydrogen Arcjet Plume," Appl. Optics 2, 6117
"Propellant Internal Mode Dis-equilibrium and (1993).Frozen flow Losses in arcjets," Paper AIAA-94-2655,25th Plasmadynamics and Lasers Conference, 20-23 16. J.E.M. Goldsmith, "Multiphoton-excited fluorescence
July, 1994, Colorado Springs, Colorado. measurements of atomic hydrogen in low-pressureflames," Proceedings of the 22nd Symposium
7. S. Miller and M. Martinez-Sanchez, "Nonequilibrium (International) on Combustion, Combustion Institute,
Numerical Simulation of Radiation -Cooled Arcjet 1403 (1988); J.E.M. Goldsmith, "Two-step saturated
Thrusters," Paper IEPC-93-218, 23rd International fluorescence detection of atomic hydrogen in
Electric Propulsion Conference, 13-16, September, flames," Opt. Lett. J1, 116 (1985); J.E.M Goldsmith,
1993, Seattle, Washington J.A.Miller, R.J.M. Anderson, and L.R. Williams,"Multiphoton-excited fluorescence measurements of
8. T.W. Megli, H. Krier, R.L. Burton, and A. E. absolute concentration profiles of atomic hydrogen inMertogul, "Two Temperature Modeling of N/H 2 low-pressure flames," Proceedings of the 23rd
Arcjets," Paper AIAA-94-2413, 25th Plasma- Symposium (International) on Combustion,
dynamics and Lasers Conference, 20-23 July, 1994, Combustion Institute, 1821 (1990).
Colorado Springs, Colorado.17. B.L Preppernau, D.A. Dolson, R.A. Gottscho, and
9. I. D. Boyd, private communication. Other results T.A. Miller, "Temporally resolved laser diagnosticfrom the same model are included as part of G.W. measurements of atomic hydrogen concentrations in
Butler, I. D. Boyd, and M. A Cappelli, "Non- RF plasma discharges," Plasma Chem. and Plasma
Equilibrium Flow Phenomena in Low Power Proc. 2, 157 (1989).Hydrogen Arcjets," Paper AIAA-95-2819, 31st JointPropulsion Conference, 10-12 July, 1995, San Diego, 18. J. Bittner, K. Kohse-Hoinghaus, U. Meier, S. Kelm,California. and T.H. Just, "Determination of Absolute H Atom
Concentrations in Low-Pressure Flames by Two-10. D. R. Beattie and M. A. Cappelli, "Molecular Photon Laser-Excited Fluorescence," Combustion
Hydrogen Raman Scattering in a Low Power Arcjet and Flame 71, 41-50 (1988).Thruster," Paper AIAA-92-3566, 28th JointPropulsion Conference, 6-8 July, 1992, Nashville, 19. U. Meier, K. Kohse-Hoinghaus, and Th. Just, "H andTennessee. O atom detection for combustion applications: study
of quenching and laser photolysis effects," Chem.11. D. R. Beattie and M. A. Cappelli, "Raman Scattering Phys. Lett. 126, 567 (1986); U. Meier, K. Kohse-
Measurements of Molecular Hydrogen in an Arcjet Hoinghaus, L. Schafer, and C.-P. Klages, "Two-Thruster Plume," . Paper AIAA-95-1956, 26th photon excited LIF determination of H-atomPlasmadynamics and Lasers Conference, 19-22 June, concentrations near a heated filament in a low-1995, San Diego, California. pressure H, environment," Appl. Opt. 29, 4993
(1990). 112. J.E. Pollard, "Arcjet diagnostics by XUV Absorption (1990).
Spectroscopy," Paper AIAA-92-2966, 23rd 20. A. D. Tserepi, J. R. Dunlop, B. L. Preppernau, and T.
A. Miller, "Absolute H-atom Concentration Profiles

- 21I- -
in Continuous and Pulsed RF Discharges," J. Appl.Phys. 72 No. 7. 2638 (1992).
21. F.M. Curran and T.W. Haag, "An Extended Life and 205 656
Performance Test of a Low Power Arcjet," PaperAIAA-88-3106, 24th Joint Propulsion Conference, 205
1988, New York, New York. 122. P.V. Storm and M.A. Cappelli, "High Spectral Finr- . Enu ,evehe-ic '""''mi .o. or hehdreno .- sh ing
h.,PLIFdi.nosictechliq-.
Resolution Emission Study of a Low Power
Hydrogen Arcjet Plume," Paper AIAA 95-1960, 26th.Plasmadynamics and Lasers Conference, 19-22 June,1995, San Diego, California. i , I '
23. W. H. Press, B. P. Flannery, S. A. Teukolsky, and W. "
T. Vetterling, Numerical Recipes: The Art ofScientific Computing, Ist ed., Cambridge Univ. Press, ! _ ,._
Cambridge, 1986.
24. N. Georgiev, K. Nyholm, R. Fritzon, and M. Alden, Gll
"Developments of the amplified stimulated emission -technique for spatially resolved species detection in ,i.r2 E2p.I .npp..
flames," Optics Comm. 108, 71-76 (1994).
25. M.S. Brown and J.B. Jeffries, "Measurement ofatomic concentrations in reacting flows through useof stimulated gain or loss," Applied Optics 4, 1127(1995).
26. J.E.M. Goldsmith, "Two-photon-excited stimulated o,, I Noen
emission from atomic hydrogen in flames," J. Opt. ectn -- I-ng -- -Tube ~ihThflon Li-r tl,\,,ghsn:
Soc. Am. B 6, 1979 (1989). q n;""" region
Pressre Tap27. C.R. Vidal, J. Cooper, and E.W. Smith, "Hydrogen HJHemi.,ircgoerdrift
tube after passing throughStark-broadening tables," Astrophys. J. Suppl. No. microwve.di.shar
214, vol. 25, 37-136 (1973). Bre'sa------ ' Wndow
28. D.J. Bamford, L.E. Jusinski, and W.K. Bischel, ==Lcne
"Absolute two-photon absorption and three-photon :?O25n scrL B
ionization cross sections for atomic oxygen," Phys.Rev A 34, 185-198 (1986). nur, . .lib....i. Celt tic.. I r , .idl. d-i .li n.-
29. W. Demtr6der, Laser Spectroscopy, Basic Conceptsand Instrumentation, 3rd Printing, Springer-Verlag,Berlin, 1988.
30. P. V. Storm and M. A. Cappelli, "High SpectralResolution Emission Study Of A Low PowerHydrogen Arcjet Plume," Paper AIAA-95-1960, 26thPlasmadynamics and Lasers Conference, 19-22 June, .1995, San Diego, California.
31. G. W. Butler, private communication. So, -- (T-)Fiture 4. I)lermin.tion of ltnmit h.dm en deraiy nd enlted 1i l lstr- t h tilration NO into calib-i.
32. T. Megli, Ph. D. Thesis. "A Nonequilibrium Plasma-dynamics Model for Nitrogen/Hydrogen Arcjets,"University of Illinois at Urbana-Champaign, 1995
I
x14 .
1216 ~ 0
0.6 .4 .2 0l~rr(aa 2 4 6
205.140 205.145 M" SO5 205.155 20S.160 205.164 Radial 61.(o(
L- ... h -.. 9. Profit. -11 -. O 0k pi-. (*.A k- I. 9).3 ofdol .Mdly o..pooant of th. graod ..
.3.. i.. fr. .1. .r'j" pl-,. ... diticom -om prolil. loction) fo I. of .6.13 .1.I..olmaly .0.43.4 b .p mo1. 6.. S3.ford Ura.,. l
UF IFXIF
*0S 0
41,6
*I.
ASE .4 .
0 V0 50 70 90 4 .4 .2 I 4 6
Los.0'.ote co; atecat lae(. To..., froj) d.)3. ofterdilvt-ryc0amoto h g3ml
35100
30000U* 3000To* T:
2 2500 -to0
2Z000 d 1 :3: s.~1500 1200j
1000
0400 ±20 60 100 140 180 220
FI.7.Ap.0030ph ~ ,Laser Power G.J) .43200 , ,
Radial pos31.0. (mm)
I. h~~bd,.g.. a,-. -o..Wn at 6ofr.o. diffevole do.. The.. boo.ea 1.0g.. .. l1 30,r aide. Wned the
.4iolated 0. b6 ... k og.
ZINI
A 000
205.135 205.14 205.145 205.15 0m Sl
Tigeled S.
F 1c.. . .- cASE~pretoo c.rll -d.h UT~p-1-bO. III 3.!. 30I
F.C-r 12. T-.prolore oltm.101. o. Idl. ida..~p~.04.0(o. ... j.3 co~4diio, or.. p-061,
I.oaiool ... LIFof I.rele.,.oicolly . 34........ hd1, r. l .o l or.0330i3.,lo.~0lood. f-., Smarte~d Urahe..ols.

. ........ N I1 o,,: 0 . I . ~ o
o c 5~~ t1.. 20 Il5 30 35~at 4,.l(00,..
.2 ~ b~- ~ Number Dowily emo
-;_E. to. 5.0I1E. 15
.1; -LSE: S :SEiS
O~JE.I
3
RAW~ Pwa6M.4 2 1,-4 2 3 4
'p an.*bra A, 11 T- dt.ha 7 t. m~aaa r~ . , ,, p., r( th, aba4j, mm~b,' daai, a r.d0
'~ot/
F.;., I( S. .n~r- , nt-t,a ncor q-in.g heit, danr-at.in J-t f.an . .I.c.- fl.-,-hc P'o., 11.41. Po- (n~n.Ih, ~ti. lt . ah tho panlik alo. h, qaahms , ~- n 6.0 6 .i, mtil .1'a( Kwpc-oa.aa att.Ch opL, .td-l tk-n i. Figor. 17a. dwtap Ir,,cn- .
10 6 *S330
' 306LI~~o a"to::.
RA 01.6* l I~h1 ______
..-.... I 0,ortd-,. h " -~
IT..I ., S --.-0-nI -...