an approach to the design of surface stress-based pdms ... · an approach to the design of surface...
TRANSCRIPT

An approach to the design of surface stress-based PDMS micro-membrane
biosensors — Concept, Numerical simulations and Prototypes
(PDMS-Mikro-Membran-Biosensoren auf Basis der Analyse von Oberflächenspannungen —
Konzept, numerische Simulation und Prototypenbau)
Dissertation zur Erlangung des akademischen Grades
Doktoringenieur (Dr.-Ing.)
vorgelegt der Fakultät für Maschinenbau
der Technischen Universität Ilmenau
von
M.-Eng. Shengbo Sang
geboren am 24. April 1979 in Shandong, P.R. China
urn:nbn:de:gbv:ilm1-2010000423

Tag der Einreichung: 15. Juni 2010 Tag der Verteidigung: 12. November 2010 1. Gutachter: Univ.-Prof. Dipl.-Ing. Dr. med. (habil.) Hartmut Witte
(Technische Universität Ilmenau)
2. Gutachter: Prof. Dr.-Ing. Klaus Liefeith (Institut für Bioprozess- und Analysenmesstechnik e.V.) 3. Gutachter: Professor Dr.-Ing. Theodor Doll
(Johannes-Gutenberg-Universität Mainz)

Acknowledgments
Taking the chance, I would like to acknowledge a number of people who have
contributed to the development of this thesis and to my overall experience as a PhD
student at Ilmenau University of Technology. First and foremost, I would like to thank
my supervisor Professor Hartmut Witte for having given me the opportunity to
conduct research in the exciting field of BioMEMS. I am also deeply indebted to him
for his support, encouragement and guidance as well as the freedom he gave me to
work on areas of my interest during my graduate study. The professional interaction
with my colleagues in biomechatronic group has had a significant influence on my
research work, especial Dipl.-Ing. Ulrike Fröber, Dipl.-Ing. Mike Stubenrauch.
I would also like to thank Dr. Arne Albrecht, Dipl.-Ing. Lars Dittrich and other
colleagues in the Center for Micro- and Nanotechnologies (ZMN) for their help and
support to the fabrication. Thanks to Prof. Michael Köhler, Dipl.-Ing. Jialan Cao,
M.Sc. Shuning Li and Dipl.-Ing. Steffen Schneider in the Department of Physical
Chemistry and Microreaction Technology. They not only provided me free the
functional chemical material and the media with E.coli, but technological advices and
supports. Thank also to Dipl.-Ing. Daniel Kapusi and Dipl.-Ing. Torsten Machleidt in
Department of Computer Sciences and Automation for the free use of smart white
light interferometer system and technological support.
I would also like to acknowledge the help and support from other colleagues and
friends, both past and present, namely (in no particular order) Dr. Cornelius Schilling,
Dr. Emanuel Andrada, Dipl.-Inf. Silvia Lehmann, Kerstin Schmidt, Wolfgang Kempf.
I would also give thank to my family for their encouragement, support and motivation
throughout my entire life. The uncompromising attitude of my family towards my
education through difficult times is greatly responsible for what I have achieved today
and the gratitude that I have for them cannot be expressed in simple words.
Finally, I would like to dedicate my dissertation to my passed away father. I miss and
love him very much all the time.
Abstract
BioMEMS (Biological Micro-Electro-Mechanical Systems) technology, especially for
biosensors, plays a critical role in the process of information gathering with the
technologically advanced development of our civilization. “Surface stress-based
biosensors” are a relatively new class of biosensors, which make use of the free
energy change, the underlying concept in any binding reaction, and hence offer a
universal platform for biological or chemical sensing. In the dissertation, a new
surface stress-based polydimethylsiloxane (PDMS) micro membrane biosensor is
proposed, designed, fabricated and tested. The biosensor is made of two main
conponents: microfluidics and sensor. Each sensor consists of two micro
membranes, one acts as active membrane and the other as reference. This design
has sensitive surface stress measurements associated with specific analytes
interactions on the active membrane’s surface.
The biosensors were fabricated successfully conquering many challenges in design
and fabrication, like integration of PDMS processing with conventional
microfabrication processes, fabrication of “perfect” PDMS thin films and release of
PDMS membranes. Furthermore, the bonding technology, uncured PDMS as the
intermediate layer method for the bond between biosensors and microfluidic devices
or components, was studied and tested and the bond strength is close to the bulk
PDMS.
Two biosensor test systems were built for testing the biosensor and its application.
One is with a smart white light interferometer (smartWLI), and another is with a fiber
optic interferometer (FOI). The smartWLI-based biosensor test system has a better
spatial resolution (1 nm), and the FOI-based biosensor test system has a higher time
resolution (< 0.5 sec.). Three alkanethiol molecules with different functional end
groups were tested as the membrane coating layer for E. coli detection. The results
of the experiments showed that the MUA is a better functional material to
functionalize the biosensor membranes than MUO and DOT. The status of E. coli
can be measured based on the surface analysis. Furthermore, the properties can be
analyzed according to the change of membrane deflection.
Zusammenfassung
Die BioMEMS(Biological Micro-Electro-Mechanical Systems)-Technologie spielt vor
allem für Biosensoren eine entscheidende Rolle im Prozess der
Informationsbeschaffung für die technologisch fortschreitende Entwicklung unserer
Zivilisation. „Oberflächenspannungsbasierte Biosensoren“ sind eine relativ neue
Klasse von Biosensoren, welche die Änderung der freien Energie nutzen (das
zugrunde liegende Prinzip jeder Bindungsreaktion), und bieten somit eine universelle
Plattform für biologische oder chemische Sensorik. In der Dissertationsschrift wird
ein neuer oberflächenspannungsbasierter Polydimethylsiloxan (PDMS)-
Mikro-Membran-Biosensor vorgeschlagen, konstruiert, gefertigt und getestet. Der
Biosensor besteht aus zwei Haupt-Funktionskomponenten: Mikrofluidik und
Sensorik. Jeder Sensor besteht aus zwei Mikro-Membranen, einer aktiven Membran
und einer Referenzmembran.
Die Biosensoren wurden erfolgreich unter Bewältigung vieler Herausforderungen
aufgebaut. Diese lagen insbesondere in den Bereichen Design und Herstellung, wie
zum Beispiel der Integration der PDMS-Mikroverarbeitung mit herkömmlichen
Verfahren, der Herstellung von „perfekten“ PDMS-Dünnschichten und der
Gewinnung der PDMS-Membran. Darüber hinaus wurde eine Klebetechnik, welche
unausgehärtes PDMS als Zwischenschicht für die Bindung zwischen Biosensor und
Mikrofluidikkomponenten oder -bauteilen nutzt, untersucht und getestet.
Für die Prüfung und Anwendung der Biosensoren wurden zwei Biosensor-
Testsysteme eingerichtet. Eines mit einem „smart Weißlichtinterferometer“
(smartWLI) und ein anderes mit einem „Fiberoptic Interferometer“ (FOI). Drei
Alkanthiol-Moleküle mit verschiedenen funktionellen Endgruppen wurden als
Biosensor-Überzugsschichten für die Anwendung getestet. MUA ist das derzeit beste
„funktionelle“ Material, um die Membran für den Nachweis von E. coli zu
funktionalisieren. Der PDMS-Mikro-Membran-Biosensor auf Basis der Analyse von
Oberflächenspannungen besitzt gute Empfindlichkeit, Reproduzierbarkeit und
Biokompatibilität. Der Zustand von E. coli-Bakterien kann auf der Grundlage der
Analyse der Oberflächenspannungen gemessen werden.

I
Table of contents
Index of figures .......................................................................................................... III
Index of Tables .........................................................................................................VII
Nomenclature ............................................................................................................ IX
Chapter 1 Introduction ................................................................................................ 1
1.1 Overview on BioMEMS ..................................................................................... 1
1.2 Biosensors ........................................................................................................ 3
1.2.1 Glucose biosensors .................................................................................... 8
1.2.2 Cell-based biosensors ................................................................................ 9
1.2.3 Mirofluidic devices or components for biosensors .................................... 11
1.2.4 Detection method ..................................................................................... 13
Conclusions for development process .................................................................. 22
Chapter 2 Biosensor Design..................................................................................... 23
2.1 Biological environmental requirement ............................................................. 23
2.1.1 Substrate .................................................................................................. 23
2.1.2 Temperature............................................................................................. 24
2.1.3 Medium..................................................................................................... 24
2.1.4 Gas phase ................................................................................................ 25
2.1.5 Aseptic environment ................................................................................. 27
2.1.6 Cytotoxicity ............................................................................................... 27
2.2 Theory of surface stress.................................................................................. 27
2.3 Conceptual design .......................................................................................... 30
2.4 Biosensor design ............................................................................................ 33
2.4.1 Theory of the sensitive element model ..................................................... 33
2.4.2 Material selection of the membrane.......................................................... 37
2.4.3 Decision of the square membrane parameters......................................... 42
2.4.4 Material and parameters of the substrate ................................................. 45
2.5 Design of the microfluidic devices or components .......................................... 46
2.5.1 Material selection...................................................................................... 46
2.5.2 Parameters decision................................................................................. 47
Summary............................................................................................................... 49
Chapter 3 Biosensor Fabrication ............................................................................ 51
3.1 Fabrication techniques .................................................................................... 51

II
3.2 Fabrication ...................................................................................................... 53
3.2.1 Fabrication of PDMS thin film ................................................................... 54
3.2.2 Sensor fabrication..................................................................................... 60
3.2.3 Microfluidic fabrication .............................................................................. 64
3.2.4 Bonding technique.................................................................................... 66
Summary............................................................................................................... 72
Chapter 4 Biosensor Testing and Application........................................................... 73
4.1 Design of the solution reservoirs..................................................................... 73
4.2 Biosensor test system..................................................................................... 74
4.2.1 SmartWLI-based biosensor test system................................................... 74
4.2.2 FOI-based biosensor test system............................................................. 76
4.3 Functionalization ............................................................................................. 81
4.3.1 Introduction of the three functional end groups ........................................ 81
4.3.2 Functionalization of the biosensor membranes ........................................ 82
4.3.3 Testing of the Functionalization................................................................ 84
4.4 Repeatability of the biosensor and test system............................................... 85
4.5 Application to E. coli........................................................................................ 88
4.5.1 Selection of SAMs for E. coli detection..................................................... 88
4.5.2 E. coli detection based on the smartWLI-based biosensor test system.... 94
4.5.3 E. coli detection based on the FOI-based biosensor test system ............. 96
4.6 Other experiments .......................................................................................... 98
4.6.1 Detection of different solutions based on the biosensor ........................... 98
4.6.2 Pressure reaction of the biosensor ........................................................... 99
Conclusions: Experiments................................................................................... 101
Chapter 5 Summary and Future Outlook................................................................ 103
5.1 Summary....................................................................................................... 103
5.2 The present problems ................................................................................... 105
5.3 Future outlook ............................................................................................... 107
Appendix І: FE Ansys simulation program of membrane....................................AI - 1 -
Appendix II: The detailed fabrication flow ..........................................................AII - 1 -
References ......................................................................................................... R - 1 -

III
Index of figures
Figure 1-1: MEMS components for life sciences market from 2005 to 2012............................2
Figure 1-2: Generalized schematic representation of a biological sensor................................4
Figure 1-3: Signal transduction pathway of a cell-based biosensor .......................................11
Figure 1-4: Classification of detection method of biosensors.................................................13
Figure 1-5: Principle of SPR detection in the mode of measuring the SPR angular shift.......14
Figure 1-6: Schematic of SPR sensing method ....................................................................15
Figure 1-7: The optical beam deflection technique is used to monitor the deflection of the
cantilever ........................................................................................................................18
Figure 1-8: Schematic diagram of a fiber interferometer........................................................18
Figure 1-9: Schematic diagram of fluorescence: Surface with different probe molecules is
exposed to solution with pre-labeled target molecules, presence of fluorophores on the
surface indicates a specific binding reaction and the presence of a target molecule.....20
Figure 2-1: Depiction of an alkanethiol SAM and a functionalized SAM used as a sensing
layer................................................................................................................................29
Figure 2-2: Side view of an alkanethiol SAM on gold.............................................................29
Figure 2-3: The schematic diagram of two kinds of structure in one wafer ............................29
Figure 2-4: The operational concept of the PDMS membrane biosensor ..............................30
Figure 2-5: The illustrated diagram of the first kind of biosensor ...........................................31
Figure 2-6: The illustrated diagram of the second kind of biosensor......................................32
Figure 2-7: The sketch-map of cantilever structure................................................................33
Figure 2-8: The sketch-map of beam structure ......................................................................35
Figure 2-9: The sketch-map of membrane structure ..............................................................36
Figure 2-10: The surface stress-based square membrane ....................................................37
Figure 2-11: FE model (1/4 symmetry) of the membrane with submaterial layer and gold
layer................................................................................................................................39
Figure 2-12: Simulation diagram of the deflection of the membrane introduced in fig. 2-11
due to surface stress ......................................................................................................39
Figure 2-13: The center deflection of membrane with different submaterial as the function of
geometry of coating gold ................................................................................................40
Figure 2-14: Membrane deflection caused by surface stress to different PDMS membrane
parameters as a function of geometry of coating gold....................................................43
Figure 2-15: The ratios making the membrane reach maximal deflection according to the
parameters of gold and PDMS .......................................................................................44
Figure 2-16: The center deflection of membrane as a function of PDMS thickness at the point
of maximum deflection....................................................................................................44

IV
Figure 2-17: The structure in silicon substrate and its parameters ........................................46
Figure 2-18: The size of normal analytes ...............................................................................47
Figure 2-19: The main paramerers of first microfluidics .........................................................48
Figure 2-20: The main parameters of second microfluidics ...................................................48
Figure 2-21: The detailed parameters of one biosensor chip.................................................48
Figure 3-1: Fabrication process flow of the biosensor............................................................54
Figure 3-2: Optical images of PDMS thin film on the Si substrate .........................................55
Figure 3-3(a): Measuring result for thickness of PDMS membrane from profilometer ...........56
Figure 3-3(b): Measuring result for thickness of PDMS membrane from tactile sensor.........56
Figure 3-4: The comparative thickness of different thin films .................................................56
Figure 3-5: The reference thickness of PDMS thin film related to the ratio of Hexane in
mixture ...........................................................................................................................57
Figure 3-6: The thickness measurement results of PDMS thin films fabricated based on the
“improved method” ........................................................................................................60
Figure 3-7: The masks to fabricate sensor: the blue is gold pattern and the green is
membrane pattern ..........................................................................................................61
Figure 3-8: Simple fabrication process sequence of sensor layer..........................................62
Figure 3-9: The fabricated sensor structure ...........................................................................63
Figure 3-10: The photo of sensor and profiles of the dome shaped Au-PDMS membrane ...63
Figure 3-11: Two kinds of microfluidic structure.....................................................................64
Figure 3-12: The masks for the microfluidic fabrication: the wine is the hole pattern, the pink
is the channel pattern .....................................................................................................65
Figure 3-13: The assembled mask, blue: gold pattern, green: membrane pattern, wine: hole
pattern, pink: channel pattern .........................................................................................66
Figure 3-14: Bonding process. (a) uniform uncured PDMS adhesive layer on a glass wafer by
spinning, (b) the cover glass wafer brought into contact with the adhesive, (c) selective
transfer of the adhesive to the cover glass wafer, (d) the cover wafer aligned with a
cured PDMS thin film on the biosensor, brought into contact and bonded.....................69
Figure 3-15: The test bonding chip ........................................................................................70
Figure 3-16: The assembly of Al-Cylinder and chip for bonding test .....................................70
Figure 3-17: Experimental set-up for the bonding test ..........................................................70
Figure 3-18: The bonding strength between glass and PDMS thin film using uncured PDMS
method ...........................................................................................................................71
Figure 4-1: The biosensors with medium chamber surrounding the micro-membranes ........74
Figure 4-2: The smartWLI system composed of light system, camera system, piezoelectric
control system and computer software control system ..................................................75
Figure 4-3: The smartWLI-based biosensor test system........................................................75

V
Figure 4-4: The test lines of smartWLI-based biosensor test system when nothing is on the
membrane ......................................................................................................................76
Figure 4-5: The fiber optic sensor system ..............................................................................77
Figure 4-6: Signal distance characteristics.............................................................................77
Figure 4-7: The FOI-based biosensor test system .................................................................78
Figure 4-8a: The logic schematic diagram of FOI-based biosensor test system software.....79
Figure 4-8b: The software interface of FOI-based biosensor test system..............................79
Figure 4-9: The test line of FOI-based biosensor test system when nothing is on the
membrane ......................................................................................................................80
Figure 4-10: Real characteristic curves to different biosensor membranes ...........................80
Figure 4-11: Model of carboxyl group.....................................................................................81
Figure 4-12: Model of Hydroxyl group ....................................................................................81
Figure 4-13: Model of Methyl group .......................................................................................82
Figure 4-14: The functional process to the membrane of biosensor, observed by fiber-optic
interferometer ................................................................................................................83
Figure 4-15: The schematic diagram of last biosensor membranes ......................................83
Figure 4-16: The membrane deflection before and after functionalization .............................85
Figure 4-17: The test results of two biosensors during five days based on smartWLI ...........86
Figure 4-18: The difference values of biosensors during five days based on smartWLI........86
Figure 4-19: The test results of two biosensors during five days based on FOI ....................87
Figure 4-20: The difference values of biosensors during five days based on FOI .................88
Figure 4-21: The normalization deflection of different functionalized membrane caused by
surface stress ................................................................................................................89
Figure 4-22: The composition of a Gram-negative bacterial membrane ...............................90
Figure 4-23: Saccharolipid Kdo-Lipid A..................................................................................91
Figure 4-24: O antigen (or O polysaccharide) .......................................................................91
Figure 4-25: The molecular structure diagram of different membrane surfaces ....................91
Figure 4-26: The possible bond way between MUA and E. coli .............................................92
Figure 4-27: The possible bond way between MUO and E. coli ............................................92
Figure 4-28: Illustration of Au nanochain and nanowire formation through dipole–dipole
interaction due to the zwitterionic nature of amino acids ...............................................92
Figure 4-29a: Structure of Gly and the mechanism of its adsorption onthe gold colloid: (A)
Gly with the positive charge; (B) Gly in theneutral state; (C) Gly with the negative charge
.......................................................................................................................................93
Figure 4-29b: Structure of Lys and the mechanism of its adsorption onthe gold colloid: (A)
Lys with the positive charge; (B) Lys in theneutral state; (C) Lys with the negative
charge ............................................................................................................................93

VI
Figure 4-30: The center deflection of membrane resulting from water load and different status
of E. coli .........................................................................................................................95
Figure 4-31: Hypothesis on the change of the membrane of E. coli after death by heating...95
Figure 4-32: The comparison of FOI signals between pure medium and the medium with
alive resp. dead E. coli ..................................................................................................97
Figure 4-33: The biosensor reaction to different solutions .....................................................98
Figure 4-34: SmartWLI-based biosensor test system, pressure as the load..........................99
Figure 4-35: The biosensor’s responding to pressure measured by the smartWLI-based
biosensor test system...................................................................................................100
Figure 4-36: FOI-based biosensor test system, pressure as the basic load ........................100
Figure 4-37: The biosensor’s responding to pressure measured by the FOI-based biosensor
test system ...................................................................................................................101
Figure 5-1: SmartWLI-based biosensor test system ...........................................................105
Figure 5-2: FOI-based biosensor test system .....................................................................105
Figure 5-3: Optical images of gold on the membrane ..........................................................106
Figure 5-4: The topographies of two membranes of one biosensor.....................................106

VII
Index of Tables
Table 1-1: The examples of biochemical measurements using cantilevers .............................5
Table 2-1: Type cellular oxygen consumption rates ..............................................................25
Table 2-2: Material and FE model properties ........................................................................38
Table 2-3: Material properties of PDMS .................................................................................40
Table 2-4: The membrane parameters and the corresponding simulation results .................43
Table 2-5: Summary of the membrane parameters selected for further design process .......45
Table 3-1: The evaporation rates of general reference material ............................................58
Table 4-1: The categorization of chemical bonds ..................................................................94

VIII

IX
Nomenclature
Terms
gα : Coefficient of thermal expansion
c: Specific Heat
δ: Loss tangent
Δζ1: Surface stress acting on the front side of cantilever
Δζ2: Surface stress acting on the back side of cantilever
T: Temperature load
Δz: Tip deflection of cantilver
gE : Young’s modulus
F: Force
G: Shear modulus
solventH : Heat of vaporization of solvent
l: Half length of square membrane
I: Moment of inertia of cantilever/beam
I1: Reference signal
I2: Sensing signal
lm: Membrane length
L: Length of cantilever/beam
қ: Electric conductivity
n: Index of refraction
p: Pressure
ρ: Distribution load
goldP : The size of gold
lsubmateriaP : The size of PDMS
ρ: Density
r: Radius of round membrane
R: Radius of curvature of cantilever
R1: Reflection at the fiber/air interface
R2: Reflection at the air/membrane interface
solventR : Evaporation rate of solvent

X
waterR : Evaporation rate of water
sζ : Surface stress load
t: Thickness of cantilever/beam/membrane
gT : Thickness of gold coating
TG: Glass transition temperature
υ: Poisson ratio,
w: The width of cantilever/beam
X: The air gap between the fiber and membrane
Abbreviations:
AFM: Atomic force microscope
AlN: Aluminium Nitride
ATP: Adenosine Tri-Phosphate
BioMEMS: Biological micro-electro-mechanical systems
BSA: Bovine serum albumin
CL: Chemiluminescence
CMOS: Complementary metal oxide semiconductor
CMP: Chemical-mechanical planarization
CVD: Chemical vapor deposition
DC: Direct current
DNA: Deoxyribonucleic acid
DOT: Dodecane thiol (SH-(CH2)11-CH3)
DRIE: Deep reactive-ion etching
E. coli: Escherichia coli
ELISA: Enzyme-linked immunosorbent assay
ER: Endoplasmic reticulum
FE: Finite element
FOI: Fiber optic interferometer
HEPES: N-2-hydroxyethylpiperazine-N’-2-ethanesulfonic
IDDM: Diabetes mellitus type 1
IGg: Immunoglobulin G
IPA: Isopropyl alcohol
LDL: Low-density lipoprotein
LPCVD: Low Pressure CVD

XI
LPS: Lipopolysaccharide
µTAS: Micro total analysis systems
MEMS: Micro-electro-mechanical systems
MUA: 11 Mercapto 1 undecanoicacid (SH-(CH2)10-COOH)
MUC5AC: Oligomeric mucus/gel-forming
MUO: 11 Mercapto 1 undecanol (SH- (CH2)11-OH)
oxLDL: Oxidated low-density lipoproteins
PAHs: Polycyclic aromatic hydrocarbons
PCBs: Polychlorinated biphenyls
PCD: Programmed cell death
PCR: Polymerase chain reaction
PDMS: Polydimethylsiloxane
PECVD: Plasma Enhanced CVD
PEG-silane: 2-[Methoxy(polyethylenoxy)propyl]trimethoxysilane
PMA: Phorbol-12-myristate-13-acetate
PMMA: polymethylmethacrylate
PrPc: The normal (cellular) form of prion protein
PrPTSE: Disease-associated form of prion protein
PSA: Prostate-specific antigen
PVD: Physical vapor deposition
RA: Rheumatoid arthritis
RER: Rough endoplasmic reticulum
RIE: Reactive-ion etching
SAM: Self-assembled monolayer
SER: Smooth endoplasmic reticulum
SiN: Silicon Nitride
SLE: Systemic lupus erythematosus
smartWLI: Smart white light interferometer
SNR: Signal-to-noise ratio
SPR: Surface plasmon resonance
STM: Scanning tunneling microscope
UV: Ultraviolet
VOC: Volatile organic compounds

Chapter 1 Introduction Shengbo Sang
1
Chapter 1 Introduction
1.1 Overview on BioMEMS
“Microelectromechanical systems” (MEMS) and relevant microfabrication
technologies have shown an exciting development since the birth of first transistor at
Bell Telephone Laboratories in 1947. There have been many commercial
applications, such as the commercially most successful MEMS devices and systems:
accelerometers and pressure sensors. In recent years, technologies have taken a
rapid expansion into different fields of physical sciences, engineering, and
biomedicine. MEMS technologies are also assisting in bridging the gap between
computers with our analog world. For example, various sensors and actuators
produced using MEMS technologies can be used as interfaces between computers
and the physical environment for purposes of information processing and intelligent
control [1].
“Biological microelectromechanical systems” (BioMEMS) is a special class of MEMS
where biological matter is manipulated for analyses and measures of its activity,
characterisations under any class of scientific study. The BioMEMS-based devices
are an attractive area of development based on microtechnology. The techonolgy
has more exciting developments in the application of MEMS technology in recent
decades. For scientific analysis and measurement, various novel sensor and
detection platforms in the BioMEMS and microfluidic fields are required and have
been reported, in addition to basic components, such as microchannels,
micropumps, microvalves, micromixers and microreactors for flow management at
microscopic volumes [1]. Any of the most important applications based on BioMEMS
are: biomedical and biological analysis and measurements, micro total analysis
systems (µTAS) and lab-on-a-chip systems [2-5], which will give new applications in
biomedicine and biology, especially the ability to perform point-of-care
measurements. The advantages of such systems are that they can deliver and
process the biological or biomedical samples in microvolumes for testing and
analysis in an integrated way therefore dramatically reducing the requirement to the
manipulation steps and the samples, and improving data quality and quantitative

Shengbo Sang Chapter 1 Introduction
2
capabilities. The BioMEMS technology also helps to reduce overall cost and time for
the measurement. At the same time it improves the sensitivity and specificity of the
analysis [1].
Sensing, therapeutic intervention (e.g. drug delivery), fluid handling, bio-reactors and
so on are areas of opportunity in the BioMEMS market. Following closely the
BioMEMS market has profound significance like Charles Cooney said “this very
broad interface between biology, electronic systems, mechanical systems, IT ... and
bringing that interface to some market opportunity” (web.mit.edu). The BioMEMS
worldwide market was around $10 billion in 2002 based on the investigation by the
European Nexus organization (www.nexus.org). The BioMEMS drug-delivery market
in the U.S. alone has been increased from $14.4 billion in 2002 to about $28.8 billion
in 2005 based on the research firm UBS Warburg LLC (www.ubswarburg.com).
According to Michael Reed who is a researcher at the University of Virginia
(www.uva.edu), the market for treating coronary restenosis (scar-tissue blockages)
increased from $2 billion in 2001 to about $5 billion in 2005 in the world. As well, the
revenues for the cancer/drug therapy market have increased from 1999’s $20 billion
to $31 billion by 2004 in the world, says President John T. Santini of Microchips Inc
(www.mchips.com). Technology consulting company Yole Development
(www.yole.fr) predicts that the worldwide market will grow from 30 % to 50 %
annually in the field of DNA microarrays. The global medical equipment industry
business volume was at $2.17 billion in 2006, growing at 15 % per year to reach
$4.97 billion by 2012 based on an analysis by Ernst & Young pegs. Yole’s BioMEMS
2008 report gave the tendency of MEMS components for life sciences market from
2005 to 2012, Figure 1-1(www.yole.fr).
Figure 1-1: MEMS components for life sciences market from 2005 to 2012(www.yole.fr)

Chapter 1 Introduction Shengbo Sang
3
1.2 Biosensors
To the BioMEMS technology and application, biosensors play a critical role in the
process of information gathering with the technologically advanced development of
our civilization, demand for information. With new applications in the areas –
genetics, diagnostics, drug discovery, environment and industrial monitoring, quality
control as well as security and threat evaluation [6], the need for high throughput
label-free multiplexed sensors for biological sensing has increased in the last
decade.
A biosensor is a device for the detection of an analyte that combines a biological
component with a physicochemical detector component [7]. In general, one concept
of biological sensors encompasses two main features in addition to the associated
signal processors used for the display of the results in a user-friendly way: the
sensitive biological element which is a chemically receptive or selective layer, and
the transducer or the detector element (it can work in a physico-chemical way,
optical, piezoelectric, electro-chemical, etc.) that transforms the signal induced by the
interaction between the analytes and the biological element into another more easily
measured and quantified signal, Figure 1-2. The chemical layer provides specific
binding sites for the target analyte of interest, such as molecules, proteins and cells.
To most biological and chemical sensors, sensitivity has been increased
tremendously in recent years, but it still has some deficiency and needs more
improvement. The selectivity of the receptive layer can be designed employing
principles of molecular and biomolecular recognition; for example antigen-antibody
binding (i.e. any chemicals, bacteria, viruses, or pollen binding to a specific
protein) [8]. Other surface functionalizations such as self-assembled monolayer [9,
10] and polymer coatings are also employed. The selectivity is then achieved by a
specific chemical reaction on the functionalized sensor’s surface. However, absolute
selectivity remains a major challenge. In fact, most sensing technologies are faced
with the issue of non-specific interactions which can complicate the sensor response,
produce false positives, and affect the reproducibility and the suitability of the sensor
system for a particular application. Therefore, the chemical layer must be designed to
maximize the sensor’s sensitivity to the specific response.

Shengbo Sang Chapter 1 Introduction
4
Figure 1-2: Generalized schematic representation of a biological sensor
Once the analyte is recognized by the chemical layer, the transducer converts the
chemical stimulus into a measurable output signal, as shown in Figure 1-2. Both the
chemical layer and the physical transducer impose limitations on the performance of
a certain class of sensors. Nevertheless it is often the physical transducer which
determines the limits of detection attainable. The search for new transduction
principles is therefore constantly stimulated [8]. In fact, each step depicted in
Figure 1-2 has an influence on the sensor’s performance. From the mechanism that
drives the analyte to the sensor (e.g. microfluidic, activated diffusion, etc.), to the
instrument reading the output signal of the transducer; all stages are the subject of
extensive research efforts.
Cantilevers are the most commonly used sensitive elements of sensors and since
their advent as a transducer in an AFM, their application space has expanded
tremendously in the areas of physical, chemical and biological sensing [8, 9, 11, 12].
Several groups have researched and reported the application of cantilever sensors
through the measurement of physical properties either by bending or resonant
frequency change. The physical properties include temperature [13-28], power [22-
25], pressure [19], Young’s and shear modulus [26], viscosity and density [29-35],
current [36], piezoelectric charge constant [37-43], frequency [43-53]. Many different
cantilever platforms have also been developed and utilized in the measurements of
several chemicals and chemical properties such as gases [54-72] (which includes
vapor concentration [54, 55], gas concentration [66-70], nerve agent [71], and

Chapter 1 Introduction Shengbo Sang
5
explosive [72]), pH [73], pesticide concentration [74], ethanol/water concentration
[75], and ion concentration [76-79]. Other researchers have demonstrated the
capability of surface stress based cantilever sensors in detecting a variety of
reactions, which include alkanethiol immobilization [80], water vapour adsorption [11],
DNA hybridization [81-84], antigen-antibody binding [85], and explosive vapor
detection [86]. A summary to some of the biochemical measurements using
cantilevers has been done in Table 1-1.
Table 1-1: The examples of biochemical measurements using cantilevers
Analyte Sensitivity/Range Cantilever type Detection method
DNA
6 × 10¹² chains/cm2 [87]
5 nN [88]
1 µM [89]
3 µM - 8 µM [90]
Flexoelectric [87]
Optical [88, 90]
Piezoresistor [89]
Bending mode
[87,88,90]
Static stress mode [89]
PSA
0.2 ng/ml-60 μg/ml [85]
10 pg/ml [91]
10 ng/mL - 1 μg/ml [92]
6 ng/mL - 60 μg/ml [90]
Optical [85,90]
Piezoelectric [91]
Piezoresistive [91]
Bending mode [85]
Frequency [91]
Resistance [92]
BSA
6 mg/ml [93]
2 mg/ml [94]
0.1 mg/ml [95]
Optical [93,95]
Piezoresistive [94]
Static stress mode [93]
Resistance [94]
Bending mode [95]
C-reactive
Protein
10 ng/ml - 1 μg/ml [92]
1 ng/ml [96]
Piezoresistive [92]
Piezoelectric [96]
Resistance [92]
Frequency [96]
Ligand-
receptor
force
Concanavalin A-yeast: 180 pN
[97]
Yeast to various surfaces [98]
PGA: 100 pN - 600 pN [99]
Antifluorescyl-IgG to
MASFM probe: 120 pN - 400 pN
[100]
Vitronection receptors-
MC3T3-E1 cells: 10-17 J/mm2
[101]
Optical
Bending mode
IGg 0.195 mg/ml & 5.85 mg/ml Optical Static stress mode [93]
Lipoptotiens
(LDL) &
LDL: 1.7 mg/ml
oxLDL: 0.3 mg/ml
Optical
Static stress mode [93]

Shengbo Sang Chapter 1 Introduction
6
(oxLDL)
Cystamine 1 mM Optical Frequency [102]
LPS/PMA to
Collagen
adhesion
Separation work:10-17 J/μm2
Optical
Frequency [103]
Biotin-avidin 100 nM Optical Bending [104]
Phospholipid
Vesicle
450 pg Optical
Frequency [105]
E. coli
O157:H7
1 × 10⁶ cfu/mL Optical Bending mode [106]
Escherichia
coli
140 pg/Hz Piezoelectric Frequency [107]
Yeast cells 400 ng/Hz ± 0.5 ng/Hz Piezoelectric Frequency [108]
Note: some data coming from reference [109]
Surface stress sensors are a new class of MEMS sensors that have immense
potential to satisfy the demand for better quality sensors and have been investigated
extensively in the recent years. “Surface stress” internationally either is represented
by force per unit length (its unit is N/m), or by energy per area (J/m2) [81, 82, 85, 110,
111], which is formally equaivalent by units (J/m² = Nm/m² = N/m), but neglects the
character of dimensions: forces are vectors, energy is scalar. Since “Surface stress”
in its histirical basics is a scalar thermodynamical term, it seems senseful to pont to
the fact that mechanical stress is defined by vectorial force per area, in the unit N/m²
= Pa. This kind of sensor uses a balance of free energy change, which is the
underlying concept in any binding reaction, and hence offers a universal platform for
biological and chemical sensing [6]. When bio/chemical reactions occur preferentially
on one surface of such a sensor, changes in intermolecular forces create a surface
stress that alters the curvature of the mechanical sensing element. The range of
surface stress in such reactions was reported to be 5 mJ/m2 to 50 mJ/m2 [81, 85,
110, 111] or as high as 200 mJ/m2 [80] or even 900 mJ/m2 [82].
The detection principles commonly used in cantilever based biosensors are based
upon changes in the deflection due to induced differential surface stress, resonant
frequency shifts due to mass changes, thermal changes that cause bending,
capacitance and resistance induced by the adsorption or attachment of analyte on

Chapter 1 Introduction Shengbo Sang
7
the cantilever’s surface or the bending of cantilever. To the surface stress-based
cantilever biosensors, it is possible to sensitize one surface of a cantilever differently
than the opposing surface. When the target molecule of interest interacts with the
sensitized surface, a surface stress is induced, and the cantilever bends due to the
different surface stresses acting on both sides of the cantilever.
Cantilever sensors will develop a differential-induced surface stress upon the
adsorption of analyte because the top and bottom surfaces of cantilever are different,
for example only one side has a “recognition layer”. The differential surface stress will
cause the cantilever to bend or deflect [112-116]. The adsorption induced surface
stress can be quantitated through measuring the curvature of the cantilever bending
using the “Stoney’s equation” [104,117]:
( )212
161 ζζυΔ−Δ⎟
⎠⎞
⎜⎝⎛ −
=EtR
(1)
Where R is the radius of curvature, t the thickness, E the Young modulus, υ is the
Poisson ratio, and (Δζ1 − Δζ2) the differential surface stress. For a cantilever of length
L that one end is fixed and the other is free, the tip deflection Δz can be expressed
as:
( )2122 13 ζζυ
Δ−Δ⎟⎠⎞
⎜⎝⎛ −
=ΔEt
Lz (2)
Therefore, the surface stress can be quantitated directly from the measured
cantilever deflection.
The high sensitive surface stress-based cantilever biosensors have found a growing
interest in the detection and quantification of biologics in the last decade. Cantilevers
are used as the sensitive elements of biosensors due to their high sensitivity.
However, surface stress based cantilever biosensors are not free from problems
which include limitations imposed by the bulky size of the optical detection system,
long term drift from non-specific adsorption on non-sensing side, loss of signal due to
severe bending of the cantilever, and limited dynamic range. Moreover, the cantilever
geometry is not the best for sensing in liquid media, which is most common in
biological applications, because the entire cantilever is immersed in the fluid and
Shengbo Sang Chapter 1 Introduction
8
non-specific adsorption at the back side of the cantilever could drastically reduce the
signal-to-noise ratio (SNR) [6]. The main other reason why micro and nano-sized
cantilevers cannot be used to directly measure in liquids is that the liquid significantly
dampens the sensor’s dynamics at resonance, which can decrease substantially the
quality of resonance and shifts resonance frequencies. The cantilever-based
technique may not reflect the true state of the biologics when taking measurements
because biological materials generally conform to their native state in a liquid
environment [109]. Furthermore, salt from residual buffer solution on the cantilever
will precipitate and increase the shift of measured resonant frequency and further
enhance the cantilever’s deflection. Also, there is the risk of breaking the cantilever in
transporting it between different locations. In the application ranges that the binding
and unbinding kinetics are needed and for real-time online monitoring of processes,
detection in liquid is the desirable modality [109]. In addition, direct measurement in
liquid will reduce false positive and false negative responses [109].
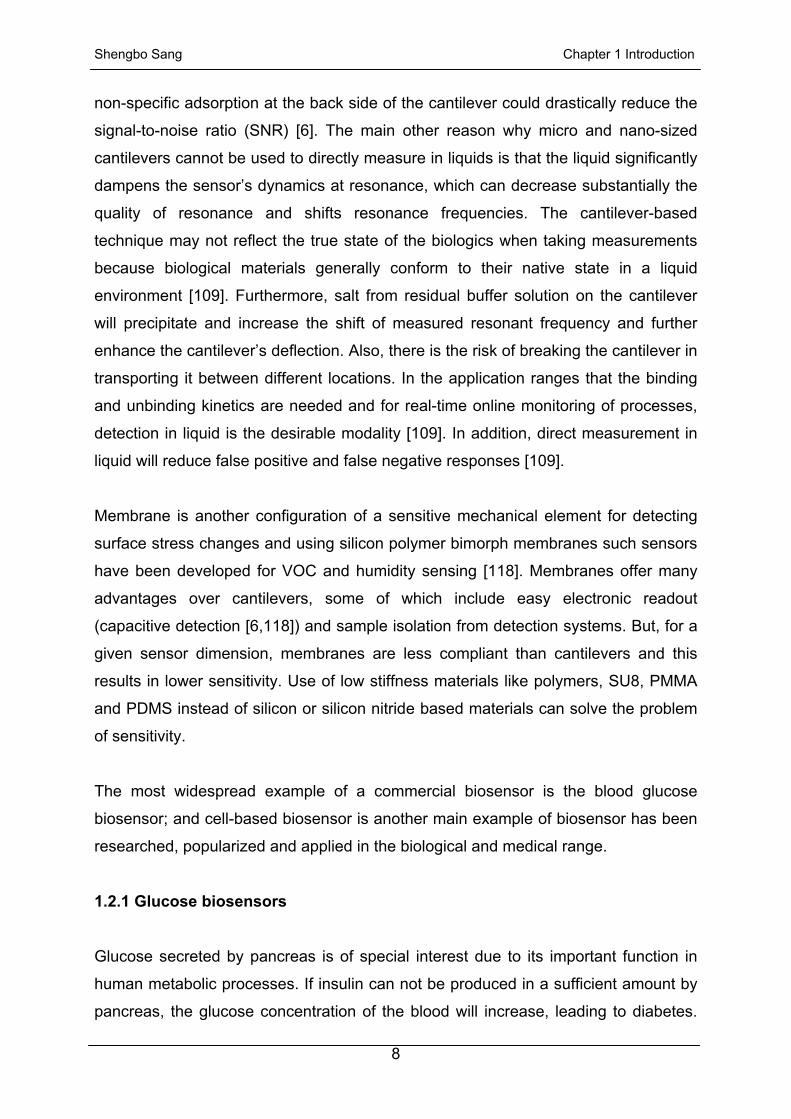
Membrane is another configuration of a sensitive mechanical element for detecting
surface stress changes and using silicon polymer bimorph membranes such sensors
have been developed for VOC and humidity sensing [118]. Membranes offer many
advantages over cantilevers, some of which include easy electronic readout
(capacitive detection [6,118]) and sample isolation from detection systems. But, for a
given sensor dimension, membranes are less compliant than cantilevers and this
results in lower sensitivity. Use of low stiffness materials like polymers, SU8, PMMA
and PDMS instead of silicon or silicon nitride based materials can solve the problem
of sensitivity.
The most widespread example of a commercial biosensor is the blood glucose
biosensor; and cell-based biosensor is another main example of biosensor has been
researched, popularized and applied in the biological and medical range.
1.2.1 Glucose biosensors
Glucose secreted by pancreas is of special interest due to its important function in
human metabolic processes. If insulin can not be produced in a sufficient amount by
pancreas, the glucose concentration of the blood will increase, leading to diabetes.

Chapter 1 Introduction Shengbo Sang
9
This is a worldwide problem. In 1921, F. G. Banting and C. Harbert discovered
insulin, which can move the glucose from the blood into the cells of human body and
then lowers blood glucose. Following its discovery, patients can be treated when
insulin is injected into the body of patients. But therapists need continuous monitoring
of glucose concentration in blood and the patients also need continuous monitoring
at home to control diabetes. The American Leland C. Clark first developed a
biosensor for monitoring glucose continuously in 1962, which is one of the most
commercially successful products of its kind in the world (Afrin Sultana, ECE 730-13
Nanoelectronics, Course Project, 2004).
Blood glucose biosensor breaks blood glucose down through the enzyme glucose
oxidase. For doing so, it first oxidizes glucose and the FAD (a component of the
enzyme) is reduced to FADH2 using two electrons. And then this is oxidized by the
electrode which accepts two electrons from the electrode in a number of steps. The
resulting current is a measure of the concentration of glucose. With the currently
available glucose biosensors, the patient himself or herself can extract one small
drop of blood and obtain a direct digital readout of the glucose concentration within
one minute (Chris D. Geddes and Joseph R. Lakowicz, Glucose Sensing, 2006).
1.2.2 Cell-based biosensors
A cell constitutes the basic unit of not only body but also of disease, hence cells can
be used to the analytes in biosensors as the target to measure the properties of cells
and the pathology of diseases. Cell-based sensors can be divided into several
classes. The first distinction may be made by the type of cells utilized in the system.
For the past 25 years cells from bacteria and algae have been used, mainly in
amperometric and potentiometric devices. In these sensors a cell layer is
immobilized on the surface of an electrode. The quality of water can be probed by
measuring the biological oxygen demand (BOD) by oxygen electrodes, and such
sensors are already comercially available. New developments aim at fully automated
systems [119]. Another parameter to monitor is the presence of herbicides which can
be measured by using cyanobacteria together with a redox couple such as
[Fe(CN)6]3–/4–. If the photosynthetic activity of the bacteria is reduced by the presence
of herbicides the reduction of the iron complex is also reduced and hence the

Shengbo Sang Chapter 1 Introduction
10
response of an amperometric sensor device [120]. Other applications make use of
the fact that some bacteria contain large amounts of a certain enzyme. The metabolic
product is measured, e.g. by an ion-selective electrode (see, e.g., [121]) or an
amperometric device (see, e.g., [122]). Examples also exist where the
bioluminescence or a fluorescence signal were measured as a response to an
enzymatic reaction (for a recent example see [123]). Another distinction may be
made by the kind of connectivity the cells keep in the sensor system. One can either
use single cells, cell layers, cell networks, tissue, or even whole animals/plants. Last
but not least the measurement principle may be used to classify cell-based sensors.
Three different approaches for whole cell sensors have mainly been applied: first, the
mechanical contact between cells and between cells and substrates is measured via
AC conductivity measurements in which the cells act as resistors; second, (bio-)
chemical sensors are used to measure metabolic products delivered from cultured
cells to the medium; third approach: the direct electrical response of electrogenic
cells (neural cells, heart muscle cells, pancreas beta cells) or a neural cell network is
measured [124].
Cells have also been studied for decades by using biochemical probes, efforts to
transition their role from test subjects to that of sensor elements are relatively
new [125]. Recent cell-based biosensor efforts have utilized a variety of secondary
transduction methods just like illustrated in Figure 1-3, which can detect the
responses of cells. Like reviewed in Bousse [125] and Pancrazio [126], these
methods include monitoring metabolism [127], fluorescent probes and reporter genes
[128], motility and adhesion [129], electrophysiology [130], and analyzing neuronal
network signaling patterns [131].
Cell-based biosensors utilize whole cells as the primary transducer (analytes) to
detect a biologically active agent as a cellular signal [132-134]. Figure 1-3 simply
illustrates the process of one kind of biosensor [135]. The cellular signal is converted
into an electrical signal (which can be processed and analyzed) by the secondary
transducer. Thus, cell-based biosensors explicitly use cells in vitro (“in glass” = out of
the body) to detect and classify cells by the response to cellular activity [135].
Manimaran et al designed a biosensor based microfluidic device as a deformation

Chapter 1 Introduction Shengbo Sang
11
assay to study the deformability and growth capability of cells through
microgaps [136].
Figure 1-3: Signal transduction pathway of a cell-based biosensor [135]
In contrast to other kinds of biosensors, such as antibody- or enzyme-based
biosensor to detect the binding of specific structural shapes in the method that get
some biological information, cell-based biosensors have been developed to detect a
broad range of biochemical agents each as a cellular response to specific stimuli.
This cellular response is detected by a secondary transducer and converted into the
mechanical or electronic signal suitable for measurement and analysis, which offer
the advantage of a functional assay without requiring foreknowledge of the chemical
structure. But to antibody- or enzyme-based biosensors, there is a problem resulting
from false positives because binding alone is not always sufficient to evidence that
an analyte will show the expected whole physiological effect. Subtle differences in
the sensitive structures of biosensors may also allow binding but prevent functional
activation. Hence, antibody-based and enzyme-based biosensors have limited
application range. These advantages would be benefit from functional screening of
unknown agents includes pharmacology, cell biology, drug discovery, toxicology, and
environmental monitoring [109,118].
1.2.3 Mirofluidic devices or components for biosensors
Microfluidic devices or components have emerged in the beginning of the 1980s and
were quickly used in the development of inkjet print heads, DNA chips, lab-on-a-chip
technology and micro-thermal devices. Microfluidics can precisely control and
manipulate fluids and analytes that are geometrically constrained to a small size,
typically sub-millimeter, and scale. Typically, the mean of “micro” has the following
features:
• the volumes are small (nl, pl, fl)

Shengbo Sang Chapter 1 Introduction
12
• the characteristic sizes are small
• energy consumption is low
• effects of the micro domain occur, esp. dominance of line and area (contact)
effects to volume (mass inertia) effects
It is a multidisciplinary field intersecting engineering, physics, chemistry,
microtechnology and biotechnology. To the design of practical systems, small
volumes, channels and pumps of fluids can be used. Batch-fabricated microfluidic
platforms that can mimic conventional sample handling techniques performed to
enable both medical research and healthcare advances. Such miniaturized
microfluidic devices or components have been termed “micro total analysis systems”
(μTAS) or “biochips” combining with biosensors that work in sensing mechanisms
(physical, optical, electrical, or chemical). These autonomous platforms have
attracted considerable research interest due to the opportunity for fabricating a highly
integrated system able to perform all necessary processing steps required for the
specific application.
One of the most attractive applications of microfluidics has been in biomedical and
life science diagnostics [137]. μTAS applications are attractive because of the
potential of such systems to allow faster analysis of biological material. Further they
can reduce the requirement to the amount of reagent and the number of processing
steps. In addition, miniaturization of such systems can result in higher repeatability
and precision of analysis, lower power consumption, and the potential to create
portable diagnostic tools for on-site analysis. These advantages result not only in
time and cost savings for diagnostic tests, but can also be life saving in time-critical
environments such as critical medical diagnostics or biowarfare pathogen detection.
A major research thrust in microfluidics has been the development of autonomous
platforms for controlled microscale fluid transport allowing fluid flow rates ranging
from nl/hrs to μl/min within compact fluid-handling and delivery systems —
micropumps [138, 139].
Micropumps are a desired component of biosensors and microfluidic devices
because of their wide application in surgery, drug delivery, drug discovery, and rapid
diagnosis and treatment of disease [1]. Micropumps may be coupled with other
microfluidic devices or components such as microfilters for particle [140] or molecular

Chapter 1 Introduction Shengbo Sang
13
filtration [141], microflow sensors for flow measurements [142], micromixers [143] for
analyte and reactant dosing and reaction engineering, microneedles [144] and
microdispensers [145] for precise fluid delivery, and microseparators [146] for
biological component separations.
1.2.4 Detection method
The detection techniques used in biosensors can be broadly classified into label-free
and label-based techniques [6]. The two methods can also be further classified as
shown in Figure 1-4. Label-based techniques rely on the specific properties of labels
like fluorescence, chemiluminescence etc. for detecting a particular target. However,
the process of labeling and purification processes is associated with sample losses,
which is critical when sample quantity is limited. Labeling processes can also have a
detrimental effect on the functionality and stability of molecules like proteins. Mass
spectrometry, surface plasmon resonance (SPR) and other optical method are label-
free techniques, which can conquer these disadvantages. The following subsections
are the detailed discussion to the respective advantages and disadvantages of every
technique.
Figure 1-4: Classification of detection method of biosensors [6]

Shengbo Sang Chapter 1 Introduction
14
Label-free techniques
Surface Plasmon Resonance (SPR): SPR-based instruments measure the refractive
index near a sensor surface through an optical method to for getting some
information. When a light beam impinges onto a metal film at a specific (resonance)
angle, the surface plasmons can be resonated with the light. As a result, it can
induce the absorption of light. For the widely used Kretschmann configuration, a
beam is focused onto the metal film. There is a range of incident angles provided
focused light and the reflected beam will have the same range of the angles while the
projection of the beam forms a band. A dark line will appear in the reflected band if
the SPR occurs within the spread angles. An intensity profile of this band can be
monitored and plotted against the range of angles as shown in Figure 1-5.
Inters
ity
Figure 1-5: Principle of SPR detection in the mode of measuring the SPR angular shift [W1]
Many researchers have worked on developing SPR sensors for studying various
kinds of biological reactions, and many reports have been published. The first
application of SPR in biosensing was demonstrated in 1982 and the first commercial
SPR sensor was introduced in 1990’s [148,149]. Biosensing Instrument Incorporated
uses a different approach to detect the SPR angle change, for example, using the
position-sensitive detector. Only the position shift of the dip is measured, so it offers
a highly sensitive detection scheme to measure extremely small angle changes of
the SPR. In the range of the SPR angle spread, the system delivers exceptionally
high angular resolution in its measurement [150]. Like Figure 1-6 illustrates, SPR is
observed as a sharp shadow in the reflected light from the surface at an angle that is
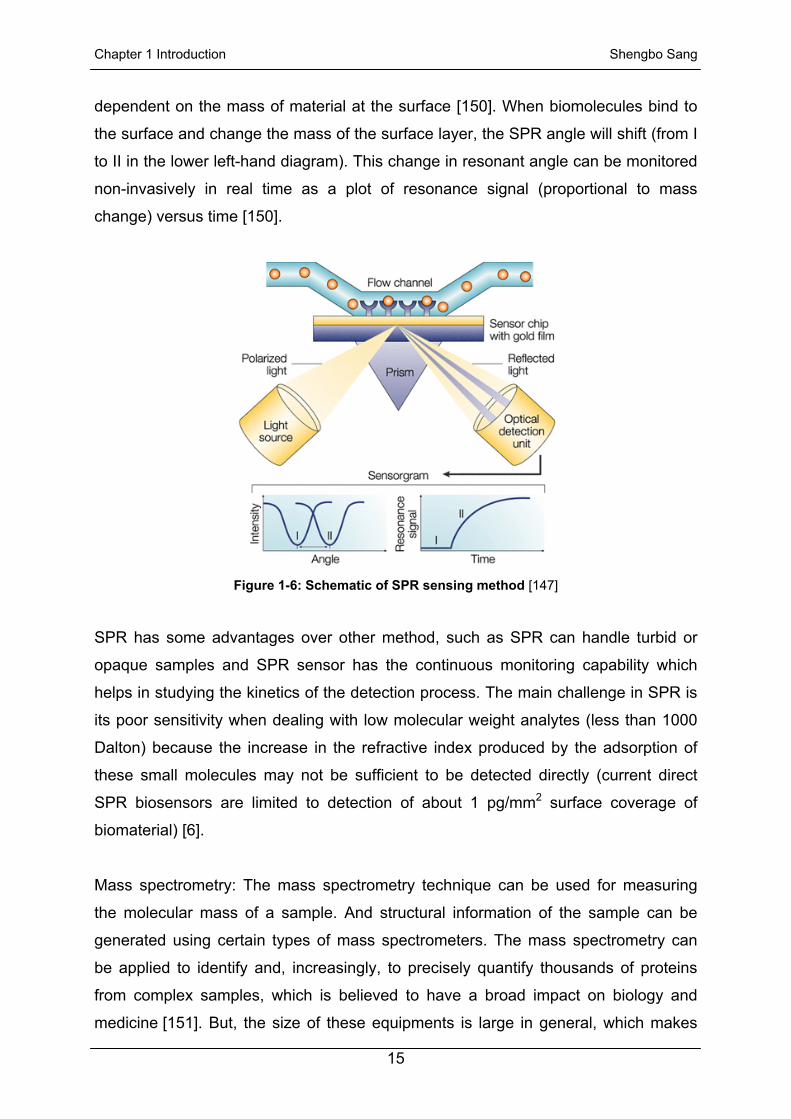
Chapter 1 Introduction Shengbo Sang
15
dependent on the mass of material at the surface [150]. When biomolecules bind to
the surface and change the mass of the surface layer, the SPR angle will shift (from I
to II in the lower left-hand diagram). This change in resonant angle can be monitored
non-invasively in real time as a plot of resonance signal (proportional to mass
change) versus time [150].
Figure 1-6: Schematic of SPR sensing method [147]
SPR has some advantages over other method, such as SPR can handle turbid or
opaque samples and SPR sensor has the continuous monitoring capability which
helps in studying the kinetics of the detection process. The main challenge in SPR is
its poor sensitivity when dealing with low molecular weight analytes (less than 1000
Dalton) because the increase in the refractive index produced by the adsorption of
these small molecules may not be sufficient to be detected directly (current direct
SPR biosensors are limited to detection of about 1 pg/mm2 surface coverage of
biomaterial) [6].
Mass spectrometry: The mass spectrometry technique can be used for measuring
the molecular mass of a sample. And structural information of the sample can be
generated using certain types of mass spectrometers. The mass spectrometry can
be applied to identify and, increasingly, to precisely quantify thousands of proteins
from complex samples, which is believed to have a broad impact on biology and
medicine [151]. But, the size of these equipments is large in general, which makes

Shengbo Sang Chapter 1 Introduction
16
them unfeasible for field applications which require portable devices, especially for
biosensors.
Acoustic wave sensors: The detection mechanism of acoustic wave sensors is a
acoustic (mechanical) wave. The velocity and/or amplitude of the acoustic wave can
be affected by the changes of the characteristics of the propagation path when the
acoustic wave propagates through or on the surface of the material [152]. Based on
the sensor, the changes of velocity can be monitored by measuring the frequency or
phase characteristics, and then it can be analyze based on the corresponding
physical quantity being measured [152]. Virtually all acoustic wave devices and
sensors use a piezoelectric material to generate the acoustic wave. The technology
has been utilized in the commercial range for more than 60 years. And the high mass
sensitivities of acoustic wave devices make them an attractive platform for monitoring
immunochemical and other biomolecular recognition events. However, not all
acoustic wave devices are suitable for liquid operation. If the sensor has surface
normal deformations and the velocity of acoustic wave is greater than the
compressional wave velocity of sound in liquid, then they can couple to compressive
waves in the liquid and cause severe attenuation of the sensor signal. In contrast,
devices in which surface particle motion is parallel to the sensor surface dissipate
energy into the liquid primarily by viscous coupling, which does not produce severe
losses and therefore are suited for liquid phase sensing.
Electrochemical techniques: Electrochemistry is to study the chemical reactions that
take place in a solution at the interface of an electron conductor (a metal or a
semiconductor) and the electrolyte. In the process, electrons transfer between the
electrode and the electrolyte in solution. Macro scale electrochemical sensors have
been used in chemical and biological sensing for a very long time. Electrochemical
biosensors build a bridge between the powerful analytical methods and the
recognition process of the biological specificity. Electrochemical sensors can be
classified into amperometric, potentiometric or conductometric sensors based on
whether current, potential or resistance is being measured during an electrochemical
reaction (oxidation or reduction) between the analyte of interest and the electrode
surface. Semiconductor field effect devices can also be used in biosensing either as

Chapter 1 Introduction Shengbo Sang
17
capacitors or as field-effect transistors (FETs). Binding of charged molecules to the
gate electrode changes the capacitance or the I-V characteristics of these devices.
The main adverse problems is long term stability and reliability associated with
incorporation of liquid electrolytes, life time and cycle time issues due to small
amount of reactants (consumable electrodes like Ag/AgCl). Secondly, non specific
reactions taking place between the electro active impurities on the surface and the
sample also limit the sensitivity of these sensors. [153] is a good and detailed
reference of microfabricated electrochemical biosensors.
Surface stress sensors: Microcantilever surface stress sensors have lots of
applications in medical flied. Integrated microfluidics enabled individual cantilever
addressing in the array for selective functionalization. Hansen et al. were able to
show that microcantilevers are sensitive enough to detect single base-pair mismatch
in DNA hybridization [154]. Wu et al. developed a PSA detection assay using a single
microcantilever at clinically relevant levels in a large background concentration of
human serum proteins – albumin and plasminogen [85]. Yue et al. [110] showed that
passivation of the backside with inert coatings like PEG is absolutely necessary in
order to make reliable protein interaction measurement. More detailed applications
have been introduced in the fore section. But this kind of biosensor must associate
with some detection methods to measure and analyse the usable information gotten
from the analyte, for example, optical method, piezoresistance, and capacitive
method.
Optical methods
The invention of the atomic force microscope (AFM) in 1986 [155] and its impact on
the fields of biotechnology and nanotechnology has created a new modality of
sensing: the cantilever. The most simple way of measuring cantilever deflection
resulting from surface stress between the analytes with cantilever to get some
measured information is by optical beam deflection as in most AFM instruments
[156].
In the optical beam deflection technique, a laser diode is focused on the end of the
free cantilever and the reflected laser beam is monitored using a position sensitive

Shengbo Sang Chapter 1 Introduction
18
photodetector, as shown in Figure 1-7 [9]. The typical displacement sensitivity
achieved using this technique is on the order of 10-9 m [8]. Fritz et al. demonstrated
DNA immobilization and hybridization using microcantilever measured by optical
deflection detection [157]. And Yue et al. demonstrated a 2D cantilever array with
integrated microfluidics using a single laser source and a CCD camera for
simultaneous interrogation of several hundred cantilevers for DNA and protein
sensing [158]. The advantages are its simplicity, linear response, and lack of
electrical connections. However it suffers some limitations. A calibration is needed in
order to obtain the recorded signal in terms of the actual cantilever deflection. Index
of refraction changes of the surrounding medium of the cantilever can produce
artificial deflection and the technique cannot be used in opaque media such as blood.
Figure 1-7: The optical beam deflection technique is used to monitor the deflection of the
cantilever [9]
amplifier amplifier
The optical direction
Laser diode fiber
2 x 2 coup
Foto diode
Foto diode
Signal Reference signal
R1 R2
I1 I2
L
I1+ I2Fiber
Figure 1-8: Schematic diagram of a fiber interferometer [160]

Chapter 1 Introduction Shengbo Sang
19
Another optical method which can attain better performance is interferometry [159].
When using a fiber optic interferometer [159,160], the interference signal from the
reflected light of the cleaved end of the fiber optic and of the cantilever surface is a
direct measure of the average cantilever displacement in the field of view. Deflection
in the range of 10-11 m to 10-13 m can be measured [161]. Fiber optic interferometer is
a mature technology and has many advantages, good performance, low loss, high
bandwidth, safety and relatively low cost, for example, which is suitable for
biosensors. The principle is as schematically shown in diagram Figure 1-8, the
interference is formed inside an optical fiber. When the laser diode light passes at the
fiber end-face, a portion is reflected off at the fiber/air interface (R1) and the
remaining light still passed through the air gap (L) with a second reflection occurring
at the air/membrane interface (R2). R1 is the reference reflection named the reference
signal (I1) and the sensing reflection is R2 called sensing signal (I2). These reflective
signals interfere constructively or destructively in the fiber due to the difference of the
optical path length between the reference and sensing signals, which is called the
interference signal [160]. Therefore, small deflection of the membrane causes a
change in the air gap (L), which changes the phase difference between the sensing
and reference signals producing fringes.
However, optical detection systems for cantilever arrays are still typically large and
are more suited for bench-top applications than for portable handheld use.
Nonspecific adsorption on the back side (non functionalized side) of the cantilever
because of sensor immersion in liquid sample during measurement is a significant
source of noise in these sensors.
Piezoresistance
Piezoresistivity is the variation of the bulk resistivity under applied stress. When a
silicon cantilever is stressed because of its bending caused by surface stress, a
highly doped region will change resistance in a sensitive way. The variation of
cantilever resistance is typically measured using a DC-biased Wheatstone bridge.
The advantage of piezoresistivity technique is that the sensor and the detection
scheme can be easily integrated into lab-on-a-chip type devices. In addition it is more
compatible with large array formats. Marie at al developed a cantilever system using

Shengbo Sang Chapter 1 Introduction
20
piezoresistive detection instead of optical deflection method for sensing DNA
hybridization [162].
Nevertheless, this method possesses electrical connections which need to be
protected for experiments performed in liquids and requires current to flow through
the cantilever. This results in heat dissipation and thermal drifts which causes
parasitic cantilever deflections.
Others
There are some less widely used and readout schemes existed methods [6], such as
the capacitive method, piezoelectric method and electron tunneling. More recently,
displacement detection methods for nanoscale cantilevers were implemented.
Cleland et al. [163] developed a scheme based on capacitively coupling a nanobeam
to a single electron transistor achieving sensitivity down to 10-14 m.
Label based techniques
Label based techniques use ‘tags’ or labels to detect a particular analyte in a
background of other materials. Fluorescence, chemiluminescence and radioactive
are three popular label based techniques in biosensors.
Labeled regeantProbe moleculars
Target moleculars
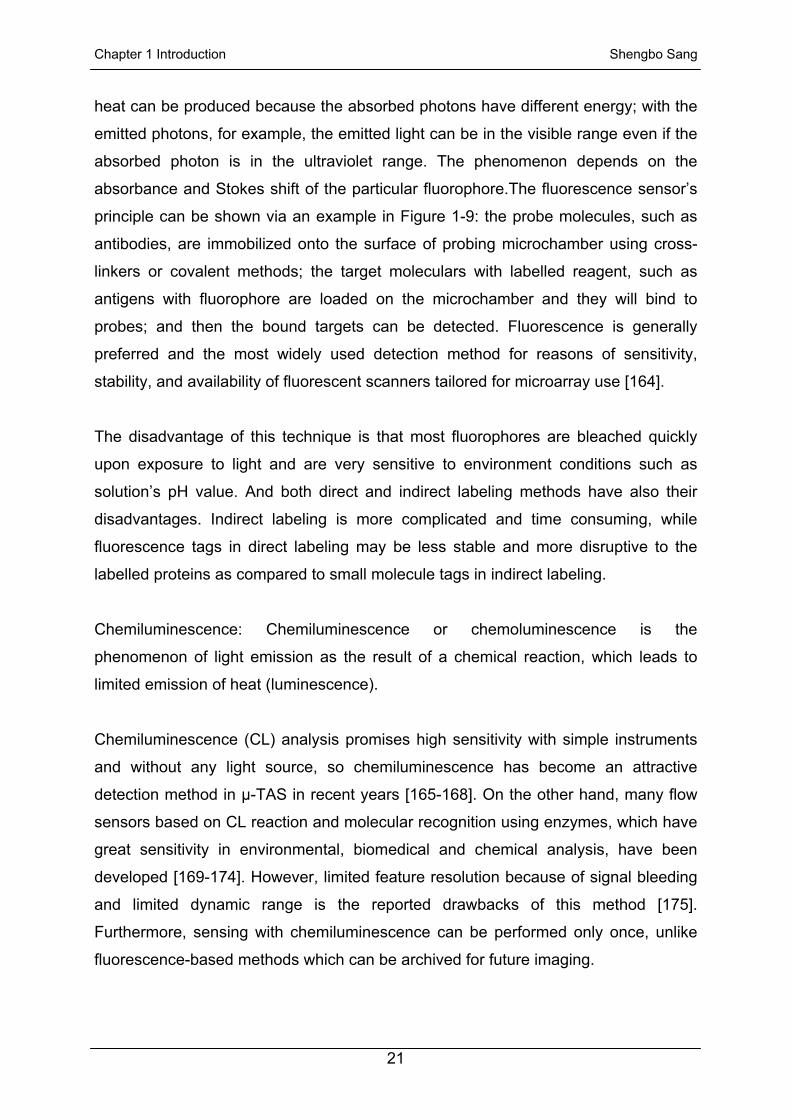
Figure 1-9: Schematic diagram of fluorescence: Surface with different probe molecules is exposed
to solution with pre-labeled target molecules, presence of fluorophores on the surface indicates a
specific binding reaction and the presence of a target molecule
Fluorescence: Fluorescence is the short-time (< 1 µs) category of luminescence,
which is mostly exploited as an optical phenomenon in cold bodies. For doing this,
the molecular component used absorbs a photon and can conesecutively emit a
photon with a longer (less energetic) wavelength. Molecular rotations, vibrations or
Chapter 1 Introduction Shengbo Sang
21
heat can be produced because the absorbed photons have different energy; with the
emitted photons, for example, the emitted light can be in the visible range even if the
absorbed photon is in the ultraviolet range. The phenomenon depends on the
absorbance and Stokes shift of the particular fluorophore.The fluorescence sensor’s
principle can be shown via an example in Figure 1-9: the probe molecules, such as
antibodies, are immobilized onto the surface of probing microchamber using cross-
linkers or covalent methods; the target moleculars with labelled reagent, such as
antigens with fluorophore are loaded on the microchamber and they will bind to
probes; and then the bound targets can be detected. Fluorescence is generally
preferred and the most widely used detection method for reasons of sensitivity,
stability, and availability of fluorescent scanners tailored for microarray use [164].
The disadvantage of this technique is that most fluorophores are bleached quickly
upon exposure to light and are very sensitive to environment conditions such as
solution’s pH value. And both direct and indirect labeling methods have also their
disadvantages. Indirect labeling is more complicated and time consuming, while
fluorescence tags in direct labeling may be less stable and more disruptive to the
labelled proteins as compared to small molecule tags in indirect labeling.
Chemiluminescence: Chemiluminescence or chemoluminescence is the
phenomenon of light emission as the result of a chemical reaction, which leads to
limited emission of heat (luminescence).
Chemiluminescence (CL) analysis promises high sensitivity with simple instruments
and without any light source, so chemiluminescence has become an attractive
detection method in μ-TAS in recent years [165-168]. On the other hand, many flow
sensors based on CL reaction and molecular recognition using enzymes, which have
great sensitivity in environmental, biomedical and chemical analysis, have been
developed [169-174]. However, limited feature resolution because of signal bleeding
and limited dynamic range is the reported drawbacks of this method [175].
Furthermore, sensing with chemiluminescence can be performed only once, unlike
fluorescence-based methods which can be archived for future imaging.

Shengbo Sang Chapter 1 Introduction
22
Radioactivity: Radioactivity-based detection method is comparable to fluorescence
method except that the labels are radioisotopes instead of fluorophores. Techniques
using radioactive labels offer robust and reproducible protocols in applications that
require ultimate sensitivity and/or resolution. Quantification of results is possible by
the following exposure of signal to autoradiography film or reusable storage phosphor
screens in automated imaging systems. However, automated liquid handling of
radioactivity is difficult due to the need for safe handling and disposal of radioactivity,
and is generally limited to manual, low-throughput applications.
Conclusions for development process Surface stress-based micro membrane biosensor is a relatively new class of sensors,
which holds a lot of promise because the technique is based on the universal
concept of free energy reduction occurring from binding reactions. This kind of
biosensor allows the detection in opaque media and the miniaturization of the sensor
to incorporate it in portable devices for point-of-use sensing. The technique is
advantageous since the process does not require any labeling of target molecules or
the addition of redox probes.
Microfluidic devices are comprised of simple channels or chambers into complex
components that can load the culture media and buffer, and perform digital logic,
individually culture cells, and determine optimal reaction conditions, and much more.
All these offer the advantages of small size for miniaturization and parallelization of
devices. Furthermore, this small size opens the door to the potential of portable
devices. With these advantages, the idea of biosensors can start to become a reality.
Such devices would be very useful to researchers, clinical laboratories, and point-of-
care clinicians in remote and/or resource-poor settings.
Labeling of biomolecules with fluorescent or other similar tags for detection can result
in sample losses during the labeling and purification process and occasional loss of
functionality, especially in proteins and other small molecules. Label-free detection
technique can conquer the disadvantage, and the optical interference method is easy
and simply to operate and high presicion to detect the deflection of membrane for
getting the information/properties of the biological analytes.

Chapter 2 Biosensor Design Shengbo Sang
23
Chapter 2 Biosensor Design
This chapter describes the detailed research to the design of the surface stress
based micro membrane biosensor. Section 2.1 is on the biological environmental
requirement for biological biosensors. The theory of surface stress utilized in the
biosensor is introduced simply in section 2.2. Conceptual design of the whole
biosensor is proposed in section 2.3. Section2.4 and 2.5 is on the biosensor design
and on the microfluidic design respectively.
2.1 Biological environmental requirement
Mammalian cells or molecules, either from animasl or humans, require special
environments for survival. The major environmental requirements include the
substrate material, the temperature, the physiochemical properties of the medium,
and the dissolved gas mixture [176] to be adequate. Additionally, the culture
environment should be kept aseptic (free from invading microorganisms), and the
media should be prohibited from contact with noncytotoxic materials. These
requirements are discussed in more detail in the following subsections. And all of
these must be considered for the design of the biosensor.
2.1.1 Substrate
To some biosensor, the analytes must contact with the interface of substrate to
analyze them and thus require attachment to a substrate in order to survive, spread,
and grow. Sometimes, cells typically attach to the extracellular matrix proteins that
are either contained in the culture media or excreted by the cells, they do not directly
attach to the substrate [135]. It has been demonstrated that cells adhere better to
surfaces with high free surface energies than those with low free surface energies
[177]. In general, the method used to test the biological suitability of a substrate is to
test the cellular growth on its surface. Cells are plated onto a control surface and
onto the tested film, and then it can be detected if there are any discernible

Shengbo Sang Chapter 2 Biosensor Design
24
differences by monitoring and analyzing the growth rates and morphology of
cells [135].
Glass and single-use disposable plastics (such as polystyrene) are the standard
substrates used in standard tissue culture [176]. Glass has been used since the
beginning of cell culture as the substrate because of the characteristics of good
optical properties, low cost, ease of sterilization, and favorable surface charge [176].
Disposable plastics, such as tissue-culture treated polystyrene, provide an uniform
and consistent substrate that helps achieve reproducible cultures [135].
To some cell-biosensors, the variety of possible substrates is constrained by the
available thin films in the photolithographic process. Thin films that have been shown
to support cell adhesion and growth include PDMS, some organic photoresists [178],
silicon dioxide [179], silicon nitride [180], and silicon carbide.
2.1.2 Temperature
The suitable temperature for a cell culture varies according to cell type and origin, but
most mammalian cells will grow satisfactorily at 37 °C. Cells can withstand
considerable temperature drops for short periods of times and some cells can be
stored for up to a month at 4 °C using hibernation media [181] or for years at
cryogenic temperatures [182]. Mammalian cells cannot tolerate higher temperatures
and will die rapidly at temperatures above 40 °C because protein enzymes denature
(lose their active conformational shape) although temperatures a few degrees below
optimal do not affect viability [176]. Thus, it is important to keep the constant
temperature or to regulate the temperature of biosensors to keep the cells living for
performing cell related experiments. Because both the metabolism and growth rate of
cells is temperature dependent, it is better for the regulation to maintain temperarture
within ±0.5 °C [176].
2.1.3 Medium
For a normal mammalian cell, the culture medium should contain salts, glucose,
amino acids, and vitamins. Some cells also require the addition of a serum (blood

Chapter 2 Biosensor Design Shengbo Sang
25
component) that contains polypeptide growth and adhesion factors that promote cell
growth and division. Further more, pH and osmolarity are another two important
properties of the media. Cellular metabolism and electrophysiology are sensitive to
changes in pH [183]. The carbon dioxide (CO2) gas phase regulates the pH through
the bicarbonate buffer system to a typical value of 7.4 [135]. The importance of
osmolarity arises in sample injection, as care must be taken to adjust the osmotic
strength of the sample to limit osmotic stresses across the cell membrane [176].
Consistency to within ±10 mOsm/l should be maintained although most cells are
tolerant of osmolarities in the range of 260 mOsm/l to 320 mOsm/l [176].
2.1.4 Gas phase
There are two most significant constituents of the gas phase for living cells: one is
oxygen, a metabolite, another is carbon dioxide, a metabolic waste product. Oxygen
is necessary for the metabolism of eukaryotic cells and consumption rate of human
cells is approximately 20 amol/cell/sec to 100 amol/cell/sec (Table 2-1) [135]. Carbon
dioxide is not only a waste product of cellular metabolism but is also required for
most cell types to regulate the pH through the bicarbonate buffer system.
Table 2-1: Type cellular oxygen consumption rates [135]
Cell Origin Oxygen Consumption Rate
[amol/(cell·s)] Reference
Human Skin 18 – 27 [184,185]
Human Heart 27 [184]
Human Lung 66 [184]
Human Conjunctiva 48 [184]
Human Liver 83 – 123 [184,185]
Human Intestine 36 – 110 [184,185]
Chick Heart 50 – 150 [184]
Oxygen partial pressures in vivo for blood leaving the lungs is approximately 13 kPa,
and this value drops to approximately 5 kPa after passing through tissue
capillaries [186]. Although the optimal oxygen partial pressure for maximum growth in

Shengbo Sang Chapter 2 Biosensor Design
26
vitro varies with cell type, a range of 5 kPa to 20 kPa is satisfactory for the metabolic
requirements of most cells [187]. At lower oxygen tensions, the impaired cellular
function and activity can be activated because the cell’s metabolism may more
depend on the anaerobic metabolic pathways under the condition. When oxygen
tensions above approximately 35 kPa (varies by cell type), the inhibition of cell
growth and cellular degeneration can occur after 48 hours of exposure [188].
The carbon dioxide pressure of the medium is also important due to its involvement
in the bicarbonate buffer system (Equation 1 [135]). The bicarbonate buffer system is
used to regulate the pH of the blood, and bicarbonate itself has been proved that it is
a necessary metabolite for the long term growth and survival of most cells [135]. The
range of 5 kPa to 6 kPa versus an atmospheric value of ≈ 0.1 kPa is the typical
partial pressure for carbon dioxide in blood. A decrease in carbon dioxide partial
pressure from typical blood values to atmospheric would result in a shift of the
equation to the left, resulting in the depletion of carbonic acid (H2CO3) and
bicarbonate (HCO3-) [135] .
+− +⇔⇔+ HHCOCOHOHCO 33222 (1)
Because bicarbonate plays an important role in the cellular metabolism, the
combination of bicarbonate and a regulated carbon dioxide headspace (air volume
above the culture media) is used as the buffer system of most culture media. The
pressure from 5 kPa to10 kPa is the typical carbon dioxide partial pressure range and
the appropriate concentration of bicarbonate is added to regulate the pH within the
range of 7.4 ± 0.2 [135].
However, the timescales of bicarbonate depletion is not deleterious or in bicarbonate-
independent cells, it can use the carbon dioxide independent buffer in reality which
may be preferable since bicarbonate can form precipitates with heavy metals and
other compounds [135]. For the bicarbonate buffer system, there are several carbon
dioxide independent alternatives. Each celluar buffer must be tested because the
sensitivity of cells to different buffers varies. The most commonly used is HEPES (N-
2-hydroxyethylpiperazine-N’-2-ethanesulfonic) acid which has a pKa of 7.31 at
37 ºC [135].

Chapter 2 Biosensor Design Shengbo Sang
27
2.1.5 Aseptic environment
It needs the order of twenty hours to grow a typical mammalian cell, which is ten
times longer than that of yeasts. The shorter cycle microorganisms can exponentially
outgrow if not prevented, such as bacteria, yeasts, mycoplasmas, and fungi. Viruses
and phages can cause disruption to the normal function and activity of the cells.
Aseptic techniques including the careful use of sterilized equipment in a sterile
environment are necessary to prevent unwanted microorganisms from access to the
culture during the operational lifetime.
2.1.6 Cytotoxicity
Cytotoxic materials leach physiologically significant amounts of toxins over the
duration of the biosensor’s lifetime. Hence, an additional important requirement to all
contacted materials with the culture medium is the absence of cytotoxicity. Namely,
the materials of the biosensor must not dissolve in media nor leach more quantity of
other substances; otherwise it will produce some effect on the metabolism, growth
rate, or viability of the cells.
2.2 Theory of surface stress
Surface stress [189, 190] is a macroscopic quantity that is governed by microscopic
processes. Although being a macroscopic quantity, the measurement of the surface
stress involved in a system can lead to insight into the microscopic mechanisms
basic for the generation of surface stress without detailed knowledge of the atomistic
processes involved. Recent investigations of surface reconstruction, interfacial
mixing, and self-organization at solid surfaces have renewed interest in the study of
surface stress [191-195]. Now the surface stress existing between biological
molecules, cells and some special functional materials has been used in the
biosensors for biological and medical research based on the surface stress analysis.
Biological sensing of numerous analytes based on surface stress can be achieved
using cantilever or membrane as the sensitive element of sensors. It is possible to

Shengbo Sang Chapter 2 Biosensor Design
28
sensitize one surface of the sensititive element differently than the opposing surface.
When the analytes of interest interact with the sensitized surface, a surface stress is
induced, and the cantilever or membrane bends due to the different surface stresses
acting on both sides of the cantilever or membrane. The sensor’s specificity, i.e. the
sensitivity of the sensor to a specific analyte, is determined by the chemical
functionalization of the sensitized surface of biosensors. Very specific surface
functionalizations can be achieved using molecular self-assembled monolayers
(SAMs) as sensing layers assembled on the surface of biosensor sensitive element.
Thiol-chemistry has been favored as a versatile method of sensitizing a surface.
Alkanethiol [HS(CH2)nCH3] SAMs are one of the most widely studied self-assembled
systems because of their versatility and stability [196-198]. Alkanethiol SAMs for long
time have been viewed as a simple model system whose properties can be applied
to more complex self-assembled systems. Alkanethiol SAMs provide stable and
ordered structures on surfaces, which are envisaged to be useful in a broad range of
applications, including protective coatings, wetting control, friction and adhesion
control, electronics [197, 199, 200], improve biocompatibility and provide sufficient
bending stiffness.
The functionalized SAMs used as the sensing layer on the cantilever surface is both
receptive (sensitized to react with analytes) and responsive (by allowing the
transduction of the surface stress to the cantilever beam) [201-204]. This
functionalized SAMs can be formed on a gold-coated cantilever, for example, turning
it into a sensor sensitive to specific analytes. Functionalized alkanethiol SAMs used
as the sensing layer when formed on the gold-coated cantilever surface is depicted in
Figure 2-1 [9], receptor groups can be immobilized on a gold surface using thiol
chemistry. In this case, the receptors only interact with ‘green triangular’ bio-targets,
and nothing else. When these thiolated species bind to a gold-coated cantilever, the
induced surface stress will vary as a function of the analyte concentration or structual
characteristic. In any case, an understanding of the origins of the surface stress in
these thiolated systems will lead to better design and optimization of this class of
sensors.
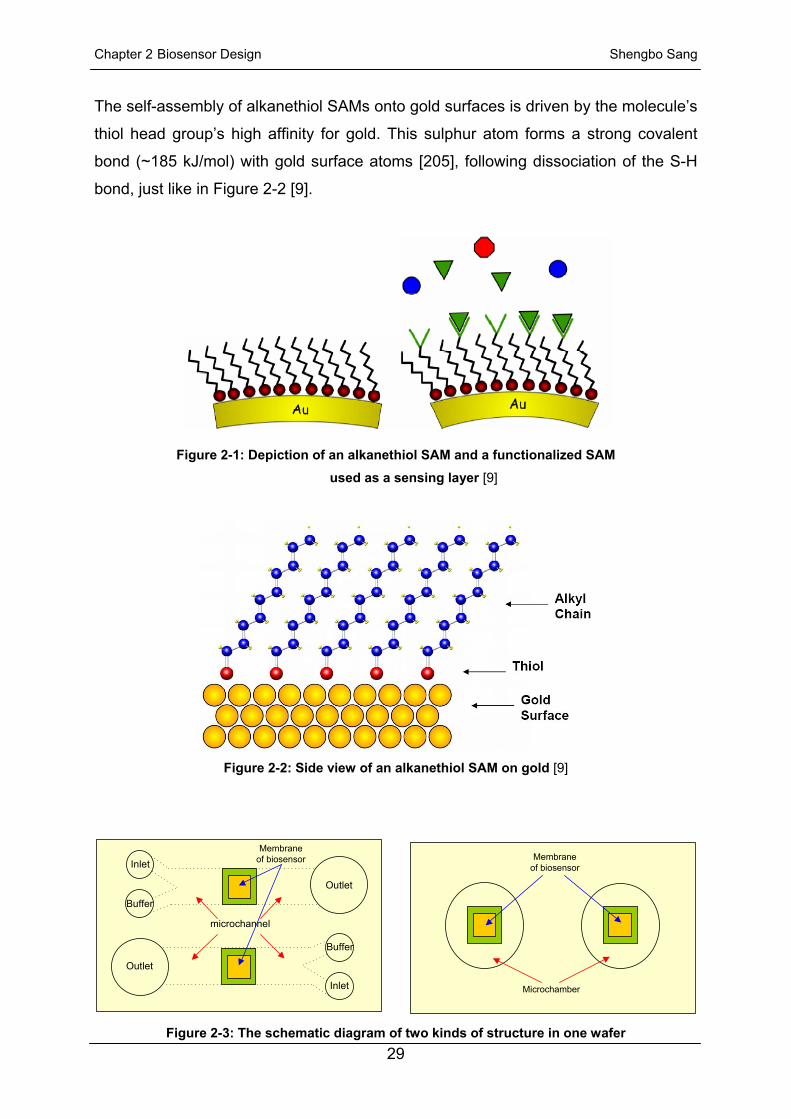
Chapter 2 Biosensor Design Shengbo Sang
29
The self-assembly of alkanethiol SAMs onto gold surfaces is driven by the molecule’s
thiol head group’s high affinity for gold. This sulphur atom forms a strong covalent
bond (~185 kJ/mol) with gold surface atoms [205], following dissociation of the S-H
bond, just like in Figure 2-2 [9].
Figure 2-1: Depiction of an alkanethiol SAM and a functionalized SAM
used as a sensing layer [9]
Figure 2-2: Side view of an alkanethiol SAM on gold [9]
Inlet
Outlet
Buffer
microchannel
Inlet
Buffer
Outlet
Membrane of biosensor Membrane
of biosensor
Microchamber
Figure 2-3: The schematic diagram of two kinds of structure in one wafer

Shengbo Sang Chapter 2 Biosensor Design
30
2.3 Conceptual design
The conceptual design of biosensor in this thesis is illustrated in Figure 2-3; two kinds
of biosensor structure are located on one wafer to make sure the later experiments
can be done easily and successfully. For the first biosensor chip, the microfluidic
structure is made of inlets, outlets, buffers and microchannels: the inlets are used to
load medium and analytes; the buffers are to clear chip after experiment; the waster
is drained from outlets. The mcirofluidics of second biosensor chip consists of only
two chambers over the membranes and all the manipulations will be realized in
vertical direction.
From the conceptual design it can also be seen that each biosensor chip contains
two micro-membranes, one acts as the active membrane and the other as reference.
Figure 2-4 illustrates the operational concept of the biosensor. The active membrane
is sensitized to react with specific analytes. The selective biochemical reactions
between the analytes and the membrane will induce a surface stress change that
causes the membrane to deflect. The analytes will not present on the reference
membrane, it is only used to remain sensitive to other environmental factors that can
also result in a deflection of the active membrane, such as temperature variations
(bimetallic effect), laminar or turbulent flow around the membrane, vibrational
(including acoustic) noise, non-specific binding (including the swell induced by
solution) and so on. The differential signal is solely due to the interaction of the
analytes with the membrane. This design has very sensitive surface stress
measurements for analytes detection, which is one main novelty of the biosensor.
Figure 2-4: The operational concept of the PDMS membrane biosensor

Chapter 2 Biosensor Design Shengbo Sang
31
(a) The 3D schematic diagram of the first biosensor structure
(b) The top view and cross-section view of the first chip
Figure 2-5: The illustrated diagram of the first kind of biosensor
Figure 2-5 shows the three-dimensional (3D) schematic diagram and cross-section
view of the first kind of biosensor. It consists of two layers: microfluidic layer and
sensor layer made of thin film layer and substrate. The thin membrane as the
crucially sensitive element of the biosensor is formed by the thin film, partly gold
coated on its surface, and the trapezoidal structure in substrate. The trapezoidal

Shengbo Sang Chapter 2 Biosensor Design
32
holes in substrate can be etched using standard microfabrication techiques. The gold
layer is essential to form the SAMs (the formation of SAMs will be introduced in
chapter 5) to react with special analytes. The SAMs can improve the biocompatibility
of the biosensor and provide sufficient bending stiffness. There are two microfluidic
systems in each microfluidics, which contains inlets, outlets, buffers and
microchannels.
The second kind of biosensor is equal to the first kind, illustrated in Figure 2-6,
except the arrangement of biosensor membranes and microfludics. There is no inlet,
outlet and microchannel in the microfluidic layer, only two chambers over the
membranes. All the manipulations will be realized in vertical direction.
(a) The 3D schematic diagram of the third chip
(b) The top view and cross-section view of the third chip
Figure 2-6: The illustrated diagram of the second kind of biosensor

Chapter 2 Biosensor Design Shengbo Sang
33
2.4 Biosensor design The sensitive element of biosensor plays a decisive role in the whole biosystem.
Hence, the prime work is the design of this sensitive element, including the structural
selection, the material selection and the parameter optimization.
2.4.1 Theory of the sensitive element model
Cantilever, beam and membrane are the three structures most commonly used as
the sensitive element of a sensor. Each structure is described by its own deflection
theory.
The typical cantilever is that one end is fixed and another end is free, it is shown in
Figure 2-7a. The load exerted on the cantilever can be classified into concentration
load (Figure 2-7b) and uniform load (Figure 2-7c). Based on the theory, the deflection
is dissimilar to the two different kinds of load, theoretical formulas (1) (2) for
concentration load and formulas (3) (4) for distribution load [206].
(a) The schematic diagram of cantilever
F
(b) The schematic deformation caused (c) The schematic deformation caused by concentration load by distribution load
Figure 2-7: The sketch-map of cantilever structure
( ) ( )3236
xLxEIFxy −= (1) ( ) ( )22
2
4624
xLxLEIxxy +−=ρ (3)

Shengbo Sang Chapter 2 Biosensor Design
34
EI
FLy3
3
max = (2) EILy
8
4
maxρ
= (4)
Where:
L = the length of cantilever
t = the thickness of cantilever
I = the moment of inertia of cantilever and 3
121 wtI = (5)
w = the width of cantilever
E = the Young’s modulus of cantilever
F = the force
ρ = distribution load (N/m)
When the stress is surface stress, the microcantilever sensor response ( y ), i.e.
microcantilever tip deflection, for a surface stress change (ζ) is given by Stoney’s
formula (Equation 6).
( ) 213⎟⎠⎞
⎜⎝⎛−
=tL
Ey νζ (6)
Where:
L and t is the length and thickness of microcantilever;
E is theYoung’s modulus;
υ is the the Poisson ratio.
The cantilever can become the beam structure when its other end is also fixed, like
shown in Figure 2-8a. To the two kinds of load, concentration load (Figure 2-8b) and
uniform load (Figure2-8c), reference [206] has deduced the deflection formulas (7)
(8) for concentration load and (9) (10) for distrubition load.
(a) The schematic diagram of cantilever

Chapter 2 Biosensor Design Shengbo Sang
35
F
ρ
(b) The schematic deformation caused (c) The schematic deformation caused
by concentration load by distribution load
Figure 2-8: The sketch-map of beam structure
( ) ( )24348
xLxEI
Fxxy −= (7) ( ) ( )22
24xL
EIxxy −=
ρ (9)
EIFLy
192
3
max = (8) EI
Ly384
4
maxρ
= (10)
Where:
L = the length of beam
t = the thickness of beam
I = the moment of inertia of beam and 3
121 wtI = (5)
w = the width of beam
E = the Young’s modulus of beam
F = the force
ρ = distribution load (N/m)
When all the edges of the structure are fixed, it becomes membrane: rectangular
membrane (Figure 2-9a), or square membrane (Figure 2-9b) and or round membrane
(Figure 2-9c). Figure 2-9d illustrates the cross-section view of the membrane
structures. Deflection formulas (11) [206] and (12) [207] can be deduced when the
load is uniform load, such as pressure.
(a) Rectangular membrane (b) Square membrane (c) Round membrane

Shengbo Sang Chapter 2 Biosensor Design
36
P
(d) The cross-section view of membrane (e) The schematic deformation due to uniform load
Figure 2-9: The sketch-map of membrane structure
To the round membrane
( )3
24
max 1613Et
pryy centerν−
== (11)
To the square membrane
( )4
24
max112
EtpLyy center
ν−== (12)
Where:
r = the radius of round membrane
L= the half length of square membrane
t = the thickness of membrane
ν = Poisson’s ration
E = Young’s modulus
p = the pressure (N/m2)
Based on the deflection theory, the cantilever is easiest to deflect (most compliant),
the beam under this aspect takes the second place and the membrane is last when
their basic parameters are same. But the cantilever and beam geometry is not
optimal for sensing in liquid media, which is common in biological applications, just
like noted in chapter 1. The main limiting reason is that the entire cantilever or beam
is immersed in the fluid and some non-specific adsorption on the back side of the
cantilever or beam drastically reduces the signal to noise ratio (SNR). Hence the
membrane is selected as the sensitive element of the biosensor that is designed and
fabricated for the work of this thesis. The sensitivity problem can be solved by using
material with lower elasticity modulus, such as SU8, PMMA and PDMS. For easy
fabrication and manipulation, the square membrane is the chosen geometry.

Chapter 2 Biosensor Design Shengbo Sang
37
2.4.2 Material selection of the membrane
One intention of the design process is to select the best material to optimize the
sensor signal, i.e. to maximize the deflection for a given surface stress change, when
the basic parameters of membrane are same. PDMS, silicon, aluminium nitride,
silicon nitride and PMMA are the commonly used membrane materials. The
deflection comparision of different membranes by the simulation method can
intuitively show which material is better as the membrane material. According to the
front discussion, a surface stress-based structure has two basic layers in addition to
SAMs: submaterial layer and contact, i.e. gold layer. Figure 2-10 illustrates the
schematic diagram of surface stress-based square membrane.
Figure 2-10: The surface stress-based square membrane
From basic membrane theory, it is obvious that the deflection of a composite
membrane is a function of the mechanical stiffnesses of both the gold and the
submaterial, and the membrane stiffness for surface stress loading is directly
proportional to (lm/tp)2, where lm is the membrane length and tp is the membrane
thickness. The gold layer on top of the membrane increases the membrane stiffness
and, hence, should be as thin as possible. During the research, the submaterial
thickness and the gold thickness is temporarily set 100 nm and 30 nm respectively to
simulate which material is better for optimal deflection.
Finite element (FE) analysis software ANSYS® was used to modelize the mechanical
behaviour of composite membranes. The details of material and FE model properties
are listed in Table 2-2. The FE model built in ANSYS® software is illustrated in
Figure 2-11, and the simulation program is given in Appendix I. In the ANSYS® FE
analysis software, there is no direct method to apply the surface stress load. Hence,
an equivalent temperature load instead of surface stress load was applied to the

Shengbo Sang Chapter 2 Biosensor Design
38
membrane. The equivalent temperature load (T ) for a surface stress load ( sζ ) was
evaluated using Eq. (13).
ggg
s
TET
αζ
= (13)
gE , gα and gT are the E, CTE and thickness of gold, respectively.
The material coefficient of thermal expansion (CTE) except the gold layer was set to
zero for the analysis [208], since the temperature changes here represent surface
stresses, and “real” thermal effects in the application on cells will be avoided by
homoeostasis, which beneath other aspects means constant temperature. It has to
be pronounced that under any application of the model results constant temperature
of the membrane has to be assured, to avoid that the membrane serves as a
thermometer. Based on (13) formula, ∆T/∆ζ is around 45, which means that the
membrane deflection induced by the change of surface stress is greater than by the
change of environmental temperature.
Table 2-2: Material and FE model properties [P1]
Material Parameters
Si AlN SiN PMMA PDMS Gold
E (GPa) 165 308 310 5 0.007 78
Poisson ratio 0.22 0.28 0.27 0.43 0.48 0.44
Length×Width (um) 200×200 200×200 200×200 200×200 200×200 variable
Thickness (nm) 100 100 100 100 100 30
Element type Solid186 Solid186 Solid186 Solid186 Solid186 Shell93
Once a typically compressive surface stress (vectorial, but unconventional unit, cp.
Chapter 1) of 10 mJ/m2 [208] is loaded on the model geometry based on (13)
formula, the deformation of the membrane can happen as a result of the surface
stress load. One deformed shape of the membrane is shown in Figure 2-12. The
center deflections of the membrane with different submaterials are plotted in
Figure 2-13.

Chapter 2 Biosensor Design Shengbo Sang
39
Figure 2-13 shows that the center deflection of membrane is one function of the
geometry of coating gold. With the decrease of submaterial’s E, the deflection of
membrane becomes larger and the ratio ( lsubmateriagold PP , P : the side length of the
square geometry) making the membrane reach the maximal deflection becomes
larger too, from 0.65 to 0.9. The blue short dot line indicates the upward tendency.
However, the size of gold making the deflections reach maximum is equal in some
certain range of E, just like the first three black round dots.
Figure 2-11: FE model (1/4 symmetry) of the membrane with submaterial layer and gold layer
Figure 2-12: Simulation diagram of the deflection of the membrane introduced in fig. 2-11 due
to surface stress

Shengbo Sang Chapter 2 Biosensor Design
40
90 100 110 120 130 140 150 160 170 180 190 200 2100,000
0,025
0,050
0,075
0,100
0,125
0,150
0,175
0,200
0,225
The
cent
er d
efle
ctio
n of
Mem
bran
e / µ
m
The side length of square gold / µm
Si AlN SiN PMMA PDMS
Figure 2-13: The center deflection of membrane with different submaterial as the function of
geometry of coating gold [P1]
PDMS is the best material selected as the sublayer of membrane based on the
simulations. Further, PDMS has the characteristic of biocompatibility and ease of
processing [209-213]. PDMS can also be easily processed to have a range of
Young’s modulus values that are physiologically relevant [214]. Table 2-3 gives the
total properties of PDMS material. In the following section, detailed simulation will be
done to decide the parameters of membrane for the optimation of the biosensor and
the feasibility of fabrication.
Table 2-3: Material properties of PDMS
(The raw material of PDMS consists of two parts: base and hardener. The ratio (e.g. 5:1) represents
the ratio of base to hardener.)
Property Numerical value and unit Reference
Mechanical Properties
Density ρ
0.918 g/cm3 — 0.987 g/cm3
5:1 0.952 g/cm3
7.5:1 0.918 g/cm3
10:1 0.920 g/cm3
12.5:1 0.927 g/cm3
15:1 0.987 g/cm3
[215]

Chapter 2 Biosensor Design Shengbo Sang
41
Specific Gravity 1.05 at 25 [216]
Young’s Modulus E
8.7 ×10⁵ Pa — 3.6 ×10⁵ Pa
5:1 8.68 ×10⁵ Pa
7.5:1 8.26 ×10⁵ Pa
10:1 7.50 ×10⁵ Pa
12.5:1 5.49 ×10⁵ Pa
15:1 3.60 ×10⁵ Pa
[215]
Shear Modulus G
1000 kPa — 3 MPa
≈ 205kPa at RT
1.1 kPa/K change of G with T
[217]
Poisson ratio υ
0.5
12
−=GEν with
E = 750 kPa and G = 250 kPa
[218]
Tensile / Fracture
Strength 2.24 MPa [219]
Dynamic Viscosity 3.9 Pa·s at 25 [219]
Volume Resistivity ρ 2×10¹⁴ Ω/cm [216]
Electric Conductivity қ 4×10³ Ωm [216]
Dielectric Strength 14 V/μm [217]
Dielectric Constant 2.3 — 2.8 [219]
Arc Resistance 115 s [216]
Electrical Properties
Loss Tangent δ
« 0.001
0.0009 at 100 Hz
0.001 at 100 kHz
[217]
[216]
[216]
Expedient Service
Temperature
-55 -+200
-100 -+100
[216]
[217]
Boiling Point > 100 [220]
Melting Point -49.9 --40 [219]
Thermal Expansivity а 20×10-5 K-1 [217]
Glass Transition
Temperature TG ≈ -125 [217]
Specific Heat c 1.46 kJ/(kg•K) [219]
Thermodynamic Properties
Thermal Conductivity 0.15 W/(m•K) [219]
Chemical Chemical Formula (H3C)[SiO(CH3)2]nSi(CH3)3 [220]

Shengbo Sang Chapter 2 Biosensor Design
42
Properties
Contact Angle with
Water (H2O)
Contact Angle with
Isopropanol (C3H8O)
Contact Angle with
Acetone (C3H6O)
90°-120°
18°
30°
[215]
Transparency transparent within the visible
spectrum [220]
Optical Properties Index of Refraction n 1.4 [219]
Wet etching method
Tetrabutylammonium fluoride
(C16H36FN) + n-methyl-2-
pyrrolidinone (C5H9NO) 3:1
Plasma etching method CF4+O2
[221]
Others
Biocompatibility
Nonirritating to skin, no
adverse effect on rabbits and
mice, only mild inflammatory
reaction when implanted
[222]
2.4.3 Decision of the square membrane parameters
For the optimal and practical purpose, a series of PDMS membranes with different
parameters were studied using the FE analysis software ANSYS® based on the prior
works and the simulation program in Appendix I. The value of surface stress applied
in these simulations is still 10 mJ/m2. Table 2-4 lists a serial of membrane parameters
and their corresponding simulation results. The PDMS membrane deflections
induced by surface stress are also plotted as a function of geometry of coating gold
based on Table 2-4, shown in Figure 2-14.
Figure 2-14 illustrates the change tendency of membrane. The membrane deflection
caused by surface stress becomes larger with the increase of PDMS size. For each
defined set of PDMS parameters, the deflection changes along with the coating gold
size and reaches its maximum at a special gold size, which were marked using the
big green round point in Figure 2-14. But the ratio ( PDMSgold PP ) that makes the
membrane reach maximal deflection varies with the parameters describing gold and
PDMS. Figure 2-15 shows clearly the ratio variation when the the gold has a fixed

Chapter 2 Biosensor Design Shengbo Sang
43
thickness (20 nm) and PDMS thickness is 0.5 µm and 1 µm respectively. When the
size of PDMS is 200 µm, 300 µm and 500 µm, the ratios are same even though the
PDMS thickness is different. But, the ratios are different when the size of PDMS is
400 µm. Hence, the simulation is a very important process to obtain the optimal
parameters for each defined membrane.
Table 2-4: The membrane parameters and the corresponding simulation results
Figure 2-14: Membrane deflection caused by surface stress to different PDMS membrane
parameters as a function of geometry of coating gold

Shengbo Sang Chapter 2 Biosensor Design
44
Figure 2-15: The ratios making the membrane reach maximal deflection according to the
parameters of gold and PDMS
1 2 3 4 5 6
20
40
60
80
100
120
140
160
180 To point A': PDMS: 500×500 µm2
Gold: 480×480 µm2× 20nmTo points B',C',D',E',F',G': PDMS: 500×500 µm2
Gold: 480×480 µm2× 70nm
To point A: PDMS: 400×400 µm2
Gold: 390×390 µm2× 20nmTo points B,C,D,E,F,G: PDMS: 400×400 µm2
Gold: 390×390 µm2× 70nm
G'
F'
E'
D'
C'
B'
A'
GFED
C
BA
The
cent
er d
efle
ctio
n of
mem
bran
e / n
m
The thickness of PDMS / µm
Figure 2-16: The center deflection of membrane as a function of PDMS thickness at the point of
maximum deflection

Chapter 2 Biosensor Design Shengbo Sang
45
At the points of maximal deflection shown in Figure 2-14, the center deflection of
membrane still has a big change with the increase of membrane thickness, just like
the simulation results shown in Figure 2-16 when the size of membrane is 400 x 400
µm2 and 500 × 500 µm2 respectively. The deflection decreases directly if gold
thickness increases and PDMS thickness is fixed. The membrane deflection also
exponentially decreases with the increase of PDMS thickness when the gold
thickness is fixed. The simulation results clearly show that the signal enhances when
the membrane size is changed from 400 × 400 µm2 to 500 × 500 µm2.
Founding on the simulation results and the real permission of fabrication techniques,
two types of membrane parameters can be selected to be fabricated, Table 2-5.
Table 2-5: Summary of the membrane parameters selected for further design process
Length / µm Width / µm Thickness
PDMS 400 400 1 µm Type 1
Gold 390 390 20 nm
PDMS 500 500 1 µm Type 2
Gold 480 480 20 nm
2.4.4 Material and parameters of the substrate
The carrier and basic function substrate of the biosensor is silicon (525 µm, 4’ silicon
wafer) not only because silicon allows to release the membrane and the membrane
device to be handled easily, but the silicon fabrication is one of best developed
technologies in the MEMS field. Since the beginning of semiconductor engineering,
silicon is one important material used to fabricate most integrated circuits for the
consumer electronics. The economies of scale and ready availability of cheap high-
quality materials make silicon attractive for a wide variety of MEMS applications.
Further, it can incorporate electronic functionality. The basic techniques to produce
the silicon-based MEMS devices include: material layers deposition, structure
patterning by photolithography, and etching to deposited layer or silicon for producing
the required shapes. Many BioMEMS technologies have also been developed based
on the silicon technologies.

Shengbo Sang Chapter 2 Biosensor Design
46
The decision on parameters of the trapezoidal frames in silicon substrate is ruled by
the parameters of membrane and the silicon anisotropic etching technique using
KOH, as shown in Figure 2-17.
Figure 2-17: The structure in silicon substrate and its parameters
2.5 Design of the microfluidic devices or components 2.5.1 Material selection
To date, many substrates, such as silicon [223-225], glass [226-229], ceramic [230],
polydimethylsiloxane [231], polymethyl methacrylate [232,233], and SU-8 [234] have
been used to fabricate microfluidic devices for biological and medical micro system,
micro total analysis system (μTAS) applications, etc. Among them, glass is a widely
used substrate material in microsystem technology, especially in the manufacturing
of microfluidic devices for biological analyses and biotechnical applications [235-237]
as it provides beneficial structural and functional material properties. With
comparison to silicon, the use of glass in μTAS applications is advantageous with
regard to its optical transparency which allows for visual inspection and on-line
optical detection (good fluorescence properties) as well as its good dielectric
properties used in a number of applications which allow it to withstand the high
voltages used in electrokinetically driven flows and separations (e.g. capillary
electrophoresis). Other beneficial properties of glass are its good chemical
resistance, high thermal stability, chemical inertness and established schemes for

Chapter 2 Biosensor Design Shengbo Sang
47
surface modification and functionalisation (silane modification) [236] which make
glass the most widely used substrate for the fabrication of DNA arrays. The use of
glass substrates may also improve the long-term chemical stability of the devices in
comparison with silicon-based systems. Many applications also require the high
mechanical strength and the good mechanical stability of glass. Therefore, the glass
is selected as the microfluidic material in the thesis.
2.5.2 Parameters decision
It is known from the conceptual design that the first kind microfluidic device is made
of inlet, outlet, microchannel and buffer, the second kind microfluidic device consists
of only two chambers over the membrane. The thickness of glass substrate available
and used in the biosensor is 700 µm based on a discussion with Little Things Factory
GmbH at Ilmenau. The key parameters mainly refer to the membrane size and some
other factors, such as the fabrication techniques, the experimental manipulation, and
the normal size of analytes. Figure 2-18 shows the size of some cells and molecules.
The chosen parameters for microfluidic device or component are illustrated in
Figure 2-19 and Figure 2-20.
Figure 2-18: The size of normal analytes

Shengbo Sang Chapter 2 Biosensor Design
48
1 mm
400 μm or 500 μm
0.5 mm
200 μm
A’A
400 µm 700
µm
AA’ cross-section view
Figure 2-19: The main paramerers of first microfluidics
700
µm2 mm
Figure 2-20: The main parameters of second microfluidics
(a) The parameters of first biosensor
(b) The parameters of second biosensor
Figure 2-21: The detailed parameters of one biosensor chip

Chapter 2 Biosensor Design Shengbo Sang
49
Summary
PDMS, glass and silicon were selected as the material of membrane, microfluidics
and substrate respectively based on fundamental and/or simulation researches. Two
kinds of biosensor structures were designed and will be fabricated. Each structure
contains two layers: microfluidic layer and sensor layer. To each kind of biosensor,
the sensor layer is similar, it consists of two membranes, one acts as the active
membrane and the other as reference. But the microfluidic structure is different, one
is made of inlets, buffers, microchannels and outlets, and the other has only two
chambers. The key parameters of membrane and microfluidics were chosen based
on the FE method, fabrication techniques, and experimental manipulation, and so on.
The detailed parameters of each kind of biosensor chip are shown in Figure 2-21.
The design of the novel micro membrane surface stress-based biosensor is feasible
and exploits the low elasticity modulus of PDMS, which will be fabricated (chapter 3)
and applied to typical cells (chapter 4).
Some simulation work has been published under the the title “Finite Element Analysis
of the Membrane Used in a Novel BioMEMS” in Journal of Biomimetics, Biomaterials
and Tissue Engineering (2009) 3:51-57 [P1].

Shengbo Sang Chapter 2 Biosensor Design
50

Chapter 3 Biosensor Fabrication Shengbo Sang
51
Chapter 3 Biosensor Fabrication
3.1 Fabrication techniques
Microfabrication or micromanufacturing is the technique for the processes of
fabrication of the structures with micrometer sizes and smaller. The microfabrication
technique was earliest applied for semiconductor devices in integrated circuit
fabrication. These microfabrication processes have been named by the term
"semiconductor device fabrication," "semiconductor manufacturing," etc. The general
methods of MEMS process flows can be classified into two primary categories:
surface micromachining and bulk (also called substrate) micromachining. Surface
micromachining is a method of producing MEMS by depositing, patterning and
etching a sequence of thin films, typically 1 μm – 100 μm thick. One of the most
important processing steps required for dynamic MEMS devices is the selective
removal of the underlying film named as sacrificial layer, without attacking an
overlying film, referred to as structural layer. Commercial examples of components
made from surface micromachining include airbag accelerometers and micromirror
projection arrays. Bulk micromachining is different from surface micromachining
because the substrate material, which is silicon, glass or other substrates, is used for
patterning and shaping to form an important functional component of the resulting
device. Many high-precision complex three-dimensional shapes, such as V-grooves,
channels, pyramidal pits, membranes, vias and nozzles, can be formed by exploiting
the predictable anisotropic etching characteristics of single-crystal silicon [238, 239].
It is most widely known commercially in production of membranes for pressure
sensors and nozzles for inkjet printing. In addition to surface and bulk
micromachining, there is in fact a third type of micromachining called “mold”
micromachining. To the technique, the part is formed by filling a mold which was
firstly defined through photolithographic methods. Micromachining molds can be
formed in some photopolymer with X-ray lithography (“LIGA”) or more conventional
UV lithography [206], with the aim of producing piece parts.
In the actual microfabrication, the main typical processes include:

Shengbo Sang Chapter 3 Biosensor Fabrication
52
1. Substrates: Microfabricated devices are not generally freestanding devices but
need usually a thicker substrate to support such as silicon wafer.
2. Deposition or Growth: Microfabricated devices are typically constructed using one
or more thin films by deposition techniques. Examples of deposition techniques
include [206]: 1) thermal oxidation, 2) sputtering, 3) evaporative deposition, 4)
epitaxy, 5) Physical Vapor Deposition (PVD), and 6) chemical vapor deposition
(CVD), the two most important CVD technologies in MEMS are Low Pressure CVD
(LPCVD) and Plasma Enhanced CVD (PECVD).
3. Patterning: It is often desirable to pattern a film into distinct features or to form
openings in some of the layers. Examples of patterning techniques include: 1)
photolithography and 2) shadow masking.
4. Etching: The technique used to remove of some portion of the thin film or substrate
is called etching [206]. Etching techniques include: 1) Dry etching or Plasma etching
such as Reactive-ion etching (RIE) or Deep reactive-ion etching (DRIE) [206] and 2)
wet etching or Chemical Etching [206].
5. Others:
1) Wafer cleaning, also known as "surface preparation";
2) Thermal diffusion or ion implantation, named as doping;
3) Chemical-mechanical planarization (CMP);
4) Wire bonding and substrate bonding: Silicon, glass, metal and polymeric
substrates can be bonded together through several methods [239,240] (for example,
fusion bonding [241], anodic bonding [242], eutectic bonding [243] and adhesive
bonding [244]);
5) Nonsilicon microfabrication: The development of MEMS has contributed
significantly to the improvement of nonsilicon microfabrication techniques. LIGA and
plastic molding from micromachined substrates [206] are two prominent examples;
6) Integration of circuits: the integration of circuits can make the performance of
many MEMS improvement greatly.

Chapter 3 Biosensor Fabrication Shengbo Sang
53
In this chapter, the fabrication techniques of PDMS micro membrane-based
biosensor are developed based on surface and bulk microfabrication techniques.
3.2 Fabrication
The process started with a flat, 4 inches silicon wafer (525 µm thickness). Ten main
processing steps were designed and used for the fabrication of biosensor according
to the biosensor structure and practical fabrication techniques, as shown in
Figure 3-1: (1) depositing Si3N4 on both sides of silicon wafer ([001] orientation); (2)
spinning coat PDMS thin film on the surface of the front Si3N4 layer; (3) depositing
and exposing the photoresist to form the gold layer pattern; (4) depositing gold using
Edwards Auto 306 (E306.CO.UK); (5) lift-off; (6) depositing and exposing the
photoresist on the backside of substrate; (7) etching Si3N4 using RIE (Reactive Ion
Etching) method; (8) KOH-etch silicon; (9) etching Si3N4 using RIE method to release
the membrane; (10) microfluidic bonding with sensor array. The detailed description
of the biosensor fabrication will be introduced in the following sections. Section 3.2.1
is the fore fabrication of membrane, i.e. the fabrication of PDMS thin film; the next
section 3.2.2 and 3.2.3 is the fabrication of sensor structure and microfluidic devices
or component respectively. The last section 3.2.4 is the bonding techniques to form
the later experimental biosensor.
From the fabrication flow it can be derived that one key point is to get the planned
thickness of PDMS thin film, which plays a crucial role in the whole fabrication and to
the function of biosensor itself. Hence, lots of experimental fabrications have firstly
been done to know under which conditions an 1 µm thick PDMS thin film can be
fabricated reproducibly.

Shengbo Sang Chapter 3 Biosensor Fabrication
54
Figure 3-1: Fabrication process flow of the biosensor [P2]
3.2.1 Fabrication of PDMS thin film
Sylgard 184, Dow Corning (DOW CORNING CORPORATION Midland – Michigan
USA) is the raw material of PDMS thin films, which have two components: base and
hardener. Different ratio of these two parts can be used to get different characteristic
thin film. A ratio of 20:1 for thin layer and 5:1 for thick layer was found to work

Chapter 3 Biosensor Fabrication Shengbo Sang
55
best [245]. Without diluting the PDMS, the thickness of thin film could only be
reduced down to about 3 μm [246]. Hence, it must be diluted to get the thinner thin
film, 1 μm for the aims of this thesis. Three materials, hexane, toluene and silicon oil
can be employed. In our fabrication, Sylgard 184 was diluted with hexane (CHEMOS
GmbH, Germany), which allowed the fabrication of membranes as thin as
~70 nm [247].
The PDMS thin film was spun on the silicon substrate using spin-coater (Photo
Resist Spinner Model 5000-1, Electronic Micro Systems Ltd., UK). Four kinds of
ratios, 10:1 and 20:1 (Base : Hardener), 10:1:1.5 and 10:1:3 (Base : Hardener :
Hexane), and two spin-coating fabrication programs, only one step (6200 rpm /
130 s) and three steps (1. step: 620 rpm / 120 s, 2. step: 1500 rpm / 120 s, 3. step:
4300 rpm / 110 s), were employed. Figure 3-2 is the optical micrograph of one PDMS
thin film on silicon substrate.
Figure 3-2: Optical images of PDMS thin film on the Si substrate [P2]
Profilometer (AMBIO Technology XP-2, Ambios Technology, Inc., USA) and Tactile
Sensor (Institute of PMS, TU-Ilmenau, Ilmenau / Germany) were used to measure
the thickness of PDMS thin films that have been fabricated accoding to different
ratios and different programs. Figure 3-3 is one measurement result of a same
PDMS thin film using the two different measuring methods. The comparative
thickness of PDMS membranes based on different fabrication conditions and
measuring mehods is shown in Figure 3-4.

Shengbo Sang Chapter 3 Biosensor Fabrication
56
100 200 800700600500400300 1000900
500
0
1000
1500
2000
2500
The
thic
knes
s of
PD
MS
mem
bran
e / n
m
The distance / µm
0
Figure 3-3(a): Measuring result for thickness of PDMS membrane from profilometer
Figure 3-3(b): Measuring result for thickness of PDMS membrane from tactile sensor
10:1:0 20:1:0 10:1:1.5 10:1:31,001,251,501,752,002,252,502,753,003,253,503,754,004,254,504,755,005,25
Base : Hardener : Hexane(V%)
10 : 1 : 0
20 : 1 : 0
10 : 1 : 3
10 : 1 : 1.5
Three steps One Step
5.063
3.031
3.289
2.762
1.883
1.458
2.243
2.187
2.508 1.213
2.314 1.183
Profilometer Tactile Sensor
Profilometer Tactile Sensor
The
thic
knes
s of
PD
MS
thin
film
/ um
Base : Hardener : Hexane
Three Steps : Profilometer One Step : Profilometer Three Steps : Tactile Sensor One Step : Tactile Sensor
Figure 3-4: The comparative thickness of different thin films [P2]
From the analysis of Figure 3-3 and 3-4, the following information can be derived:
(1) The measuring result from tactile sensor is “thinner” than that from profilometer to
one same thin film. The possible reason is that the tactile sensor is not easy to
control and the needle may stick into the thin films during measurement, which
effect can be inforced by repeated measurement at the same place: the thickness
“became thinner” with the increase of measurement time.

Chapter 3 Biosensor Fabrication Shengbo Sang
57
(2) The thickness of undiluted PDMS thin film is thicker than that of the diluted thin
film. The thickness of undiluted PDMS thin film becomes thinner with the increase
of base component in the mixture. The thickness of diluted PDMS thin film also
becomes thinner with the increase of Hexane in the mixture.
(3) The PDMS thin film thickness is thicker than the reference [247], Figure 3-5, even
though the ratio is same, the potential reasons may be:
Figure 3-5: The reference thickness of PDMS thin film related to the ratio of Hexane in
mixture [287]
3.1) Cutting the PDMS around the place where the thickness was measured will
definitely influence the measuring results since the film may detach partially from
the substrate while cutting.
3.2) The spinning method or the process control is different between our
measurements and the reference [10], which are two important factors to affect
the thickness of PDMS thin film.
3.3) Evaporation of hexane from mixture is the most important reason. Hexane is
well known as a pretty volatile liquid. It takes long time from mixing the mixture,
removing the bubbles of mixture to spinning coat. The whole time may be too
long for the hexane to volatilize from the mixture and the viscosity of mixture
becomes higher.

Shengbo Sang Chapter 3 Biosensor Fabrication
58
Hence, the evaporation rate of hexane must be calculated, and the amount of
evaporation into the beginning mixture for getting the uniform 1 µm thickness PDMS
membrane must be added. An evaporation rate is the rate at which a material will
vaporize relative to the rate of vaporization of a specific known material.
The reference material must be stated whenever a relative evaporation rate is given.
Sometimes n-butyl acetate (commonly abbreviated BuAc) is chosen as the general
reference material for evaporation rates. When the relative evaporation rate of butyl
acetate is set to 1.0, other materials are then classified as Table 3-1 [W2] reports.
But such a number would presumably be relative to some variables, temperature,
atmospheric pressure, humidity, air flow, viscosity etc, for example.
Table 3-1: The evaporation rates of general reference material [W2]
Speed Evaporation Rate
(BuAc = 1.0) Examples
Fast > 3.0
Methyl Ethyl Ketone = 3.8
Acetone = 5.6
Hexane = 8.3
Medium 0.8 to 3.0 95% Ethyl Alcohol = 1.4
Naphtha = 1.4
Slow < 0.8
Xylene = 0.6
Isobutyl Alcohol = 0.6
Water = 0.3
Mineral Spirits = 0.1
The evaporation rate of any solvent can be calculated based on the following formula
[W3]:
solvent
watersolvent H
RR 26.2×= (1)
solventR : Evaporation rate of solvent (g/h)
waterR : Evaporation rate of water (g/h)
solventH : Heat of vaporization of solvent (J/g)

Chapter 3 Biosensor Fabrication Shengbo Sang
59
For example, when using a 20-liter Industrial Rotary Evaporator and if the vapor
pressure temperature is 40°C and the bath temperature is set to 60°C, the
evaporation rate of Hexane can be gotten [W3]:
hggJ
hgH
RRHexane
waterHexane /183.12
/37126.2/200026.2
=×
=×
= (2)
hcmcmg
hgRVHexane
Hexane /487.18/659.0
/183.12 33 ===
ρ (3)
Evaporation rate of water with (t = 20°C, rpm = 225) = 2.0 L/h or 2000 g/h
Heat of vaporization of hexane = 371 J/g
Density hexane = 0.659 g/cm3
In the fabrication, the process of removing bubbles of the mixture in the vacuum
glass vessel takes most time, so the evaporation speed in the vessel must be
evaluated too. First, 6 ml hexane was put into the vessel. ~4.2 ml and ~3.2 ml
hexane was left 20 min and 30 min later respectively. Hence, the evaporation speed
during the process is:
min09.0min20
2.46 mlml =−
=ν ~ 0.1 ml/min (4)
Considering these comprehensive factors, the relatively better PDMS thin films
(about 1 μm) were fabricated after adding the evaporated hexane into the first
mixture and improving the process control. Figure 3-6 illustrates the measuring
results of two PDMS thin films measured based on Profilometer (AMBIO Technology
XP-2, Ambios Technology, Inc., USA) and Tactile Sensor (Institute of PMS, TU-
Ilmenau, Ilmenau / Germany) respectivley. The thickness of PDMS thin film meets
the requirement.

Shengbo Sang Chapter 3 Biosensor Fabrication
60
(a) The measuring result from Profilometer (b) the measuring result from Tactile Sensor
Figure 3-6: The thickness measurement results of PDMS thin films fabricated based on the “improved method” [P2]
3.2.2 Sensor fabrication
The sensor layer can be fabricated after gaining the relatively better PDMS thin film.
Two chromium masks are required to finish the fabrication of sensor layer, one is
used to form the gold pattern, and the other is for the pattern to release the
membrane. The two mask layouts were designed using AutoCAD® software based
on the basic parameters designed in chapter 2. Figure 3-7 shows the mask layouts,
the blue layout is for the gold mask to form the gold pattern during the fabrication,
and the green layout is membrane mask for membrane pattern.

Chapter 3 Biosensor Fabrication Shengbo Sang
61
Figure 3-7: The masks to fabricate sensor: the blue is gold pattern and the green is membrane
pattern
Briefly, four key steps can be summarized to form the sensor layer based on the front
fabrication flow shown in Figure 3-1. It is illustrated in Figure 3-8: (1) deposit nitride
silicon (Si3N4); (2) 1 μm thickness PDMS thin film patterning; (3) 20 nm thickness
gold patterning (Edwards Auto 306); (4) membrane release (KOH etching and
reactive ion etching). Appendix II is the detailed process plan of the biosensor
fabrication. Two Si3N4 layers were firstly deposited on both sides of the silicon
substrate ([001] orientation). The layer on the back face was used as the mask to
KOH anisotropic etching of silicon, and the other layer was as the etch-stop layer to
protect the PDMS thin film. After the spin-coat of PDMS (~1 µm) thin film and the Au
pattern (390 µm × 390 µm × 20 nm), the PDMS micro membranes were last formed

Shengbo Sang Chapter 3 Biosensor Fabrication
62
by the removal of supporting Si3N4 with reactive ion etching (RIE) from the backside.
During the whole process, the PDMS thin film/membrane should be avoided
contacting with KOH and Acton long time to protect PDMS. The thin film/membrane
might swell if it contacts with KOH and Acton long time, especial for KOH. The
arrangement of fabrication flow and each fabrication step must be based on the basic
point.
Figure 3-8: Simple fabrication process sequence of sensor layer
The last wafer with sensor structures was gained after the whole fabrication, as
shown in Figure 3-9a, two membranes constitute one sensor unit. Figure 3-9b and
3-9c illustrates the optical micrograph of the front side and the back side of one
sensor unit respectively. Figure 3-10 shows the view of two kinds of sensor
compared with one Euro coin and the profile of dome shaped Au-PDMS membrane.
Figure 3-10b is the SEM (Scanning Electron Microscope) image of the PDMS
membrane. The 3D profile was measured to estimate the curvature characteristics of
the fabricated membrane utilizing the white light interferometer (Gesellschaft für Bild-
und Signalverarbeitung (GBS) mbH, Ilmenau Germany). The central curvature was
about 1 µm as illustrated in Figure 3-10c. The possible reason induced the curvature
is the weight of PDMS membrane and gold layer.

Chapter 3 Biosensor Fabrication Shengbo Sang
63
(a) Whole sensor wafer before dicing (b) Front side of one sensor (c) Back side of one sensor
Figure 3-9: The fabricated sensor structure
Figure 3-10: The photo of sensor and profiles of the dome shaped Au-PDMS membrane

Shengbo Sang Chapter 3 Biosensor Fabrication
64
3.2.3 Microfluidic fabrication Two kinds of microfluidic structures are planed to be fabricated based on the design
in chapter 2, as shown in Figure 3-11. One is made of two microfluidic systems; each
consists of inlet, mcirochannel and outlet for the input, transportation and output of
medium and analytes respectively, and a buffer for the clearing of biosensor system.
Another is composed of only two chambers; all the manipulations will be realized in
the vertical direction.
The microfluidic fabrication also needs two masks, one is used to fabricate the holes
as the inlets, outlets, buffers or chambers in the glass wafer, and the other is for the
fabrication of microchannels. The mask layout was designed using the AutoCAD®
software based on the parameters chosen in chapter 2. It is shown in Figure 3-12,
the pink layout is the structure for the fabrication of channels, and the wine layout is
for the fabrication of holes. The microfluidic masks must be consistent with the
sensor masks, especially for the positions of every structure. Figure 3-13 illustrates
the whole mask design of the biosensor, including sensor layer and microfluidic layer.
Figure 3-11: Two kinds of microfluidic structure

Chapter 3 Biosensor Fabrication Shengbo Sang
65
Figure 3-12: The masks for the microfluidic fabrication: the wine is the hole pattern, the pink is the
channel pattern

Shengbo Sang Chapter 3 Biosensor Fabrication
66
Figure 3-13: The assembled mask, blue: gold pattern, green: membrane pattern, wine: hole
pattern, pink: channel pattern 3.2.4 Bonding technique To build the later experimental biosensor structure, a bonding step is required to
assemble the microfluidic elements to the silicon wafer containing the sensor array.
The bonding technique plays a crucial role to the biosensor because it makes sure
that the microfluidic layer will not separate from the sensor layer during the dicing
process of fabrication and the later experimental process.
In general, bonding techniques can be briefly classified into two major categories –

Chapter 3 Biosensor Fabrication Shengbo Sang
67
direct bonding and bonding with an intermediate layer.
Fusion bonding [241], anodic bonding [242] and activated surface bonding [248, 249]
belong to direct bonding. Fusion bonding relies on the attractive forces existing
between flat surfaces to form a strong bond. The process of fusion bonding requires
extensive precleaning to the bonding surface, and bonding process is usually
performed under vacuum with external pressure to help form good contact. By
applying a high contact force the substrates are first forced into intimate contact. The
substrates hold together once in contact due to atomic attraction forces (van der
Waal) [241], which are strong enough to allow the bonded substrates to be handled.
After which a solid bond is formed between the substrates, the substrates are then
placed in a furnace and annealed at high temperature, the bonding strength is higher
by a thermal cycling process. Fusion bonding is special suitable for bonding silicon
wafers. For anodic bonding, also called electrostatic bonding, the wafers are cleaned
extensively, aligned and brought into pressure contact [242]. An irreversible bond can
be formed between the substrates by high voltage (> 1 kV) and high temperature
(> 400°C). The bonding technique is well suitable for bonding glass or glass coated
substrates with silicon and nitride substrates. In the case of surface activation
bonding, the substrates are pre-treated with oxygen plasma, hydration processes or
other chemicals to increase the reactivity, and then brought into contact to form an
irreversible bond with or without the condition of external pressure and high
temperature [248, 249]. The effect of surface treatment processes lasts only for a
small time interval and the bonding processes including alignment need to be
completed within this time window. Activation with oxygen plasma has been used
extensively for bonding PDMS devices with PDMS or glass [250], which are
commonly used materials in prototyping microfluidic devices. Liu et al. have bonded
PDMS to PDMS and glass by incubating the device with the two surfaces to be
bonded in contact at 80 °C [251].
Bonding with an intermediate layer includes adhesive bonding, eutectic bonding,
solder bonding and thermo-compression bonding and so on. Adhesive bonding [248,
249] does not require high temperatures or voltages, but requires a thin adhesive
layer between bonding structures, which is usually obtained by spin coating. This
process is very useful for bonding different materials that can not be welded. There

Shengbo Sang Chapter 3 Biosensor Fabrication
68
are many kinds of adhesives made from various natural and/or artificial compounds
to be used in bonding. A hindrance to this process is that it takes more time to finish
the adhesive bonds for curing, such as welding or nailing. Eutectic bonding uses a
thin gold layer as an adhesive to bond silicon wafers [252]. The reflow of the eutectic
material requires precise force delivery and uniform temperature. The wafers to be
bonded contact each other closely and the temperature is raised to gold-silicon
eutectic point, an irreversible bond can be formed last. Which bonding technique is
used in advanced MEMS packaging and 3D integration technologies [252]. Lin and
others [253-255] improved this process to bond locally using patterned gold lines and
in situ electrical heating. Localized bonding overcomes the high temperature problem
but requires one or more additional bonding layers (gold, silicon) by depositing and
patterning. Hence the bonding technique may not be suitable for some device
materials like polymers or with some fabrication processes. Solder bonding and
thermo-compression bonding again involve the deposition and patterning of
additional layers like solder or other soft metals and to form bonds between
substrates through either heat and/or pressure method. Detailed analyses of these
bonding processes and additional references can be read in the review paper by
Schmidt [252]. Recently, Noh et al. [283] demonstrated a conformal bonding process
where intermediate parylene layers, deposited on the wafers to be bonded, were
selectively heated using variable frequency microwave to form a bond. Parylene
deposition is conformal and it is also a biocompatible polymer, but additional
lithography steps are required to make sure the bonding on special selective regions
of the chip.
A room temperature bonding technique is used in our biosensor due to its special
characteristics. The bonding technique uses an intermediate adhesive layer like UV
curable polymer or uncured PDMS. UV curable adhesive was found to be more
suited for silicon, glass and nitride surfaces [6]. Alternatively, PDMS can also be used
as the adhesive layer; the technique is particularly practical for bonding PDMS
devices [6]. When the glass wafer with microfluidic devices is bonded with the sensor
layer in our design, the two contacted materials are glass and PDMS. Hence, the
uncured PDMS method is suitable for our biosensor.
One structure for testing the PDMS bonding process consists of two components: a

Chapter 3 Biosensor Fabrication Shengbo Sang
69
glass slide and a silicon wafer with the PDMS thin film. The glass slide was bonded
on the silicon substrate, which had been spun to a 1 μm PDMS thin film, by the
transfer bonding technique using uncured PDMS as the adhesive layer. It is shown in
Figure 3-14: (a) 3 ml of freshly mixed PDMS (10:1 ratio) was poured on another glass
slide, which was then spun at 8000 rpm for 8-9 minutes. This resulted in a thin layer
of uncured PDMS of thickness 1 μm - 1.5 μm [6]. (b, c) The glass slide which will be
bonding with the PDMS thin film was cleaned with isopropyl alcohol (IPA). It was then
placed on the glass slide (about 15 minutes after spinning) and lifted off, leaving a
layer of uncured PDMS on it. (d) The previously fabricated PDMS thin film was
prepared for bonding by cleaning with IPA. The glass slide with the thin layer of
uncured PDMS was then placed on the PDMS thin film and cured at room
temperature for 24 hours or 110 °C for 15 minutes to obtain the final testing structure.
Figure 3-14: Bonding process. (a) uniform uncured PDMS adhesive layer on a glass wafer by spinning, (b) the cover glass wafer brought into contact with the adhesive, (c) selective transfer of the adhesive to the cover glass wafer, (d) the cover wafer aligned with a cured PDMS thin film on the biosensor, brought into contact and bonded. [P2]
The whole bonding wafer was firstly diced to 10 × 10 mm2 chip for testing the bonding
strength between glass and PDMS thin film using the uncured PDMS method, as
shown in Figure 3-15, which is easy to assemble with test set, and to calculate the
bonding strength. And then the chips were glued onto Al-cylinders using epoxy resin
and cured 24 hour at room temperature to form an assembly, as shown in
Figure 3-16. Last, the assembly was fixed with a flexible mechanism into a

Shengbo Sang Chapter 3 Biosensor Fabrication
70
commercial pull tester (zwick GmbH & Co. KG) and pulled the sample under
controlled conditions, as shown in Figure 3-17.
Figure 3-15: The test bonding chip [P2]
Figure 3-16: The assembly of Al-Cylinder and chip for bonding test [P2]
Figure 3-17: Experimental set-up for the bonding test [P2]
Through several repeated test experiments, the devices could withstand the pulling
forces (tension) of 4 MPa to 5 MPa. One of the test results is presented in Figure 3-8,
the glass wafer was separated from the PDMS thin film on silicon wafer when the
pulling force is around 500 N. Based on the optical micrograph of separated
interfaces, Figure 3-19, it can be known that the PDMS tears instead of separating at
some places of the interface, which suggests that the bond strength is close to the

Chapter 3 Biosensor Fabrication Shengbo Sang
71
bulk PDMS. Hence, the bonding technique using an intermediate adhesive layer of
uncured PDMS is suitable for our biosensor fabrication.
17,5 18,0 18,5 19,0 19,5 20,0 20,5 21,0 21,5-50
0
50
100
150
200
250
300
350
400
450
500
550Separating point
Tear
ing
Forc
e / N
Time / s
Figure 3-18: The bonding strength between glass and PDMS thin film using uncured PDMS
method [P2]
Figure 3-19: The optical micrograph of separated interfaces (a) the PDMS thin film part, (b) the glass part. Note the piece of PDMS torn from one of the bonded components and stuck to the other indicating that the bond strength is comparable to that of bulk PDMS. [P2]

Shengbo Sang Chapter 3 Biosensor Fabrication
72
Summary The new biosensors with two relatively perfect thin PDMS micro membranes were
fabricated based on the surface and bulk microfabrication technology. Many
challenges in the fabrication, such as realization of PDMS processing based on
conventional microfabrication processes, fabrication of relatively perfect PDMS thin
film and release of PDMS membrane, were successfully overcome to form the
biosensor. The microfluidic fabrication layout with two different structures was also
designed using the AutoCAD® software. The bonding technique, uncured PDMS as
the intermediate layer, was tested and the bond strength is close to the bulk PDMS,
which is suitable for bonding the biosensor with the glass microfluidic devices or
components.
The fabrication work has been published under the title “Fabrication of a surface
stress-based PDMS micro-membrane biosensor” in Journal of Microsystem
Technologies (2010) 16:1001–1008 [P2].

Chapter 4 Biosensor Testing and Application Shengbo Sang
73
Chapter 4 Biosensor Testing and Application
In this chapter, the test and application of the surface stress-based PDMS micro
membrane biosensors is discussed. First, the experimental solution chambers were
designed and superimposed on the thin film surrounding the micro-membranes using
the uncured PDMS as intermediate layer introduced in chapter 3. Then, two
biosensor test systems were set up based on a smart white light interferometer
(smartWLI) and a fiber optic interferometer (FOI) respectively, and debugged for the
later test and application. Last, biosensors were functionalized using different
functional materials and testing experiments using Escherichia coli (E. coli) were
performed based on the biosensor test systems.
4.1 Design of the solution reservoirs
The small experimental solution reservoirs were created using a biochemical plastic
pipe with ~4 mm diameter and bonded together with biosensors using uncured
PDMS method according to the following program.
1. 2 ml of freshly mixed PDMS (10:1 ratio) was poured on glass slide, which was
then spun at 1200 rpm for 40 second.
2. The plastic reservoirs which will be bond with the PDMS thin film were cleaned
with isopropyl alcohol (IPA). They were then placed on the glass slide (about
15 minutes after spinning) and lifted off, leaving a layer of uncured PDMS on
it.
3. The surface of previously fabricated biosensor was prepared for bonding by
cleaning with IPA. The reservoirs with the thin layer of uncured PDMS was
then placed on it surrounding the micro-membranes and cured at 60 °C for
5 minutes to prevent the uncured PDMS moving on the PDMS membranes.
4. And then, structures are cured at room temperature for 24 hours to obtain the
final test structure, as shown in Figure 4-1.

Shengbo Sang Chapter 4 Biosensor Testing and Application
74
Figure 4-1: The biosensors with medium chamber surrounding the micro-membranes
4.2 Biosensor test system
4.2.1 SmartWLI-based biosensor test system
White-light interferometry (WLI) is an optical measurement technique for recording 3-
D topographies with depth resolution in the nanometre range. The height information
can be gathered over a large area in a very short time because the measurement
points are acquired and processed in parallel. Typical applications in research and in
quality management are to nanometer-accurately quantitate the surface roughness
values (wafer structures, membrabe, mirrors, glass, and metals) and to precisely
measure the curvatures of surfaces, such as microlenses, the deformation of micro
membranes or cantilevers. The smartWLI (Gesellschaft für Bild- und
Signalverarbeitung (GBS) mbH, Ilmenau Germany, as shown in Figure 4-2) was
employed to set up the experimental test system to measure the membrane
deflection of biosensor caused by surface stress.
Figure 4-3 illustrates the principle scheme and the real test system of the smartWLI-
based biosensor test system built by us. The test system has a better spatial
resolution (1 nm) and the membrane deflection information can be read nanometre-
accurately and directly, but its time resolution is relatively low (~1 min.).

Chapter 4 Biosensor Testing and Application Shengbo Sang
75
Computer software control
system
Piezoelectric control system
Biosensor
Camera system
Figure 4-2: The smartWLI system composed of light system, camera system, piezoelectric
control system and computer software control system (GBS mbH)
Channal 1
Channal 2
PC
Biosensor
Gold-SH
-COOHCells
Smart white light interferometer system
Lens
(a) The principle scheme of the SmartWLI-based biosensor test system
(b) Photograph of the test system
Figure 4-3: The smartWLI-based biosensor test system

Shengbo Sang Chapter 4 Biosensor Testing and Application
76
The system error of the smartWLI-based biosensor test system was firstly measured
to evaluate the system stability when nothing was imposed on the membranes of
biosensor. Figure 4-4 illustrates three test signals measured by the test system
corresponding to three biosensors. The maximal test error is about 4 nm for the
system during the whole test time (16 minutes), which is quite smaller than the the
deflection caused by the surface stress according to the theoretical simulation.
Hence, the error from environment and system itself is small and the smartWLI-
based biosensor test system is stable.
-2 0 2 4 6 8 10 12 14 16 18-10-9-8-7-6-5-4-3-2-10123456789
10
The
cent
er d
efle
ctio
n of
mem
bran
e / n
m
Test time / Min
biosensor 1 biosensor 2 biosensor 3
Figure 4-4: The test lines of smartWLI-based biosensor test system when nothing is on the
membrane
4.2.2 FOI-based biosensor test system
Fiber optic interferometer is a mature technology and has many advantages in
comparison to other methods for distance measurements, just like cited in the
introduction in chapter 1: better performance, low loss, safety and so on. In theory, a
deflection in the range of 10-11 to 10-13 m [161] can possibly be measured. The
analog fiber optic sensor system TETRA® (TETRA Gesellschaft für Sensorik, Robotik
und Automation mbH, Ilmenau Germany, Figure 4-5) was applied to build our
FOI-based biosensor test system. Light emitted from a transmitting fiber is reflected
by the surface under test. The reflected light is collected by the receiving fiber and is

Chapter 4 Biosensor Testing and Application Shengbo Sang
77
transformed to electrical signals by an optoelectronic converter. The variable
transmission of the light beam at the receiving fiber influences the receiving optical
fiber.
Figure 4-5: The fiber optic sensor system
The signal-distance characteristics, as shown in Figure 4-6, are governed by the
optical transmission behaviour and by the photometric distance law. It can work in
two measuring ranges. The first measuring range (MR1, near range) is a very strong
rise of voltage at a small displacement between the sensor tip and the target surface,
which has better resolution. In the second measuring range (MR2, far range) the
signal rise goes over a long distance. The signal maximum is described as a peak.
Vol
tage
/ V
MR
1
Figure 4-6: Signal distance characteristics
Figure 4-7 shows the principle scheme and the real test system of the FOI-based
biosensor test system built by us, where the average membrane deflection signal is
converted to an electric signal (voltage) through the fiber optic sensor system and
monitored by the computer using software. NI USB-6210 I/O (NATIONAL

Shengbo Sang Chapter 4 Biosensor Testing and Application
78
Fiber sensor tip
Computer software system
Biosensor
Steel plateAnalog fiber optic
sensor system
NI USB-6210
INSTRUMENTS®, National Instruments Corporation) is the adapter between
computer and interferometer system. The FOI-based biosensor test system has a
higher time resolution (< 0.5 sec.) than the smartWLI and can monitor signals
continuously.
(b) The real photo of the test system
Figure 4-7: The FOI-based biosensor test system
The test software was edited based on the LabVIEW® software. It was finished under
the help of Dipl.-Ing. Steffen Schneider in Department of Physical Chemistry and
Microreaction Technology, Faculty of Mathematics and Natural Sciences, TU
Ilmenau, Germany. Figure 4-8a shows the logic schematic diagram of test software,
which has the accuracy of five-digit number after the decimal point, for getting more
precise signals. Figure 4-8b illustrates the interface of the test software.

Chapter 4 Biosensor Testing and Application Shengbo Sang
79
Figure 4-8a: The logic schematic diagram of FOI-based biosensor test system software
Figure 4-8b: The software interface of FOI-based biosensor test system
After the assembly of the FOI-based biosensor test system, the system error was
evaluated when nothing was on the membranes. The maximal test error is about
0.003 V during the whole test time (about 2 hours), as shown in Figure 4-9, which is
quite smaller than the equivalent of deflection caused by the surface stress based on
the theoretical analyses. Hence, the error from environment and system itself is small
and the test system is quite stable.

Shengbo Sang Chapter 4 Biosensor Testing and Application
80
-1000 0 1000 2000 3000 4000 5000 6000 7000 80001,0150
1,0175
1,0200
1,0225
1,0250
1,0275
1,0300
1,0325
1,0350
1,0375
1,0400
Vol
tage
/ V
Time / Sec.
Figure 4-9: The test line of FOI-based biosensor test system when nothing is on the membrane
However, the main disadvantages of the test system are that: (1) Its spatial resolution
is relatively low (min. 20 nm) because the resolution is affected easily by some
factors, such as the topography of biosensor membranes, and the distance between
the fiber sensor tip and the membrane. (2) The sensor signal depends on the
reflection characteristic of the biosensor membranes, too. For example, the reflective
quantity of light depends on the micron structure of the color of the surface; and the
surface qualities have in restricted size an influence on the location of the peak
distance and on the quantity of the peak signal. Hence, the characteristic curve is
different if two biosensor membranes have some difference, as shown in Figure 4-10,
the different characteristic curves of two different biosensors.
0 100 200 300 400 500 600 700 800 900 1000 1100 1200 13000,4
0,5
0,6
0,7
0,8
0,9
1,0
1,1
1,2
1,3
1,4
1,5
Vol
tage
/ V
Distance / µm-100 0 100 200 300 400 500 600 700 800 900 10001100120013001400
-1
0
1
2
3
4
5
6
7
8
9
10
11
Volta
ge /
V
Distance / µm
Figure 4-10: Real characteristic curves to different biosensor membranes

Chapter 4 Biosensor Testing and Application Shengbo Sang
81
4.3 Functionalization
Three alkanethiol molecules with different functional end groups: 11 Mercapto 1
undecanoicacid (MUA: SH-(CH2)10-COOH), 11 Mercapto 1 undecanol (MUO: SH-
(CH2)11-OH) and Dodecane thiol (DOT: SH-(CH2)11-CH3) were selected as the
biosensor coating layers for the E. coli detection.
4.3.1 Introduction of the three functional end groups
Carboxyl group, as shown in Figure 4-11
Figure 4-11: Model of carboxyl group
A carboxyl group is a set of four atoms bonded together and has two functional
groups: carboxylic acids and amino acids (Bruce Alberts et al., Molecular Biology of the
Cell, 2008). In every carboxyl group there is a double bond between the carbon atom
and oxygen atom and a single bond between the carbon atom and hydroxyl group
(OH). In this way a carboxyl group is equivalent to a carbonyl group bound to a
hydroxyl group. The acidic nature of a carboxyl group arises from its H atom.
Specifically, in aqueous solution the H atom can be transferred as H+ to H2O
molecules, forming H3O+ and leaving behind a COO– group. The COOH group has
only a separate fleeting existence when not bound to a fifth atom. It is called the
carboxyl radical and symbolized as •COOH in such cases [257]. The reference can
be read in the study by Milligan and Jacox [257]. The acid dissociation constant of
•COOH has been measured using electron paramagnetic resonance spectroscopy
[258].
Hydroxyl group, as shown in Figure 4-12
Figure 4-12: Model of Hydroxyl group

Shengbo Sang Chapter 4 Biosensor Testing and Application
82
The functional group -OH is named as hydroxyl group, it is a substituent in an organic
compound. CnH2n+1-OH is the simple formula of alcohols which are molecules
containing in organic compound.
Hydroxyl group has the characteristic of hydroxyl radical. The hydroxyl radicals are
very reactive and so have a short-timed life. They are the important components of
radical chemistry.
Methyl group, as shown in Figure 4-13
Figure 4-13: Model of Methyl group
The methyl group is named based on methane (CH4) and it is a hydrophobic alkyl
functional group. There are many such hydrocarbon groups in organic compounds.
Due to the SN2 reaction on iodomethane or the reaction of methyl lithium or MeMgCl
with a carbon atom, the methyl groups can be incorporated into organic compounds.
The methyl groups as substituent of a compound usually have the characteristics of
increasing lipophilicity and reducing solubility. Hence it is easy to absorb into
biological membranes and difficult to release into aqueous surroundings.
Incorporating a methyl group into a molecule can have three effects:
by oxidizing the methyl group,
by demethylation
by reduction, reducing the analogue.
The reactivity of a methyl group is different when it attaches different substrates. The
methyl radical is induced by the unpaired electron on the substance CH3.
4.3.2 Functionalization of the biosensor membranes
The three functional materials were firstly deployed standard solution (concentration:
0.1mM) using ethanol as basic solution. The three standard functional solutions
(20 µl, 0.1mM) were then loaded into different biosensor reservoirs using

Chapter 4 Biosensor Testing and Application Shengbo Sang
83
micropipettes. The membranes were incubated in thiol solutions for the coating
formation of SAMs until evaporation of all solutions. The functionalization process
can be detected using the FOI-based biosensor test system due to its continuity, as
shown in Figure 4-14. Once the membranes were functionalized, the entire chips
were washed in ethanol to remove the non-specifically bound thiol molecules. The
last membranes consist of three layers: PDMS layer, gold layer and SAM, as shown
in Figure 4-15.
0 1000 2000 3000 4000 5000 6000 7000 8000 9000 10000
0,95
1,00
1,05
1,10
1,15
1,20
1,25
1,30Evaporation point
Evaporation point
Loading point
Vol
tage
/ V
Test time / Sec.
biosensor 1 biosensor 2 biosensor 3
Figure 4-14: The functional process to the membrane of biosensor, observed by fiber-optic
interferometer [P3]
Figure 4-15: The schematic diagram of last biosensor membranes

Shengbo Sang Chapter 4 Biosensor Testing and Application
84
Figure 4-14 shows the deflection characteristics of the membranes during the
functionalization process. At the first stage, the weight of functional solution was the
main factor for the membrane deflection, which made the membrane deflect in –Z
direction. The voltage also became small as a result of the reflex of functional
solution to laser. With the evaporation of functional solution, the surface stress
resulting from the bond between gold and thiol group became the main influence
factor. The surface stress to form a strong covalent bond between these sulphur
atoms with gold surface atoms is equivalent to around 185 kJ/mol, hence the voltage
became larger during the later stage until one stable level. It can also be concluded
that the direction of membrane deflection caused by the weight of solution was
opposite to the one caused by the surface stress, which is consistent with the
theoretical prediction.
4.3.3 Testing of the Functionalization
SAMs on gold substrates can be characterized by various analytical techniques
including Fourier transform infrared spectroscopy (FTIR) [259-261], X-ray
photoelectron spectroscopy (XPS) [260, 262], surface plasmon resonance (SPR)
[259, 261], ellipsometry [259], and quartz crystal microbalance (QCM) [263, 264].
Furthermore, the evaluation of functionalization can be tested by the alteration of the
induced surface stress before and after SAMs. The smartWLI-based biosensor test
system was employed in the test due to its advantage of nanometer resolution. First,
35 µl distilled water was loaded respectively on the no functionalized membranes and
functionalized membrabes to measure the basic line. After the recovery of
membranes, 35 µl E. coli medium (concentration: 1.7×10³ cells/µl, Institute of
Physics, TU Ilmenau, Germany) was loaded to measure the deflection caused by the
surface stress. Figure 4-16 illustrates one comparative result of the not functionalized
biosensor and the biosensor functionalized by MUA. The deflection has an obvious
alternation when the membrane is functionalized or not. The reason is that the
surface stress is different when the cells are absorbed on the not functionalized
membrane and on the functionalized membrane. These phenomena will be explained
in detail in the section 4.5.

Chapter 4 Biosensor Testing and Application Shengbo Sang
85
0 2 4 6 8-50
-40
-30
-20
-10
0
10
20
30
40
MUA (SH-(CH2)10-COOH)
No functionalization
Basic line
The
cent
er d
efle
ctio
n of
mem
bran
e / n
m
The time / Min.
Figure 4-16: The membrane deflection before and after functionalization
4.4 Repeatability of the biosensor and test system
The repeatability of the biosensor and the two test systems was measured to
evaluate the practicability of the biosensor and the test systems. In the experiment,
lots of biosensors were measured once each day during a continuous five day period
based on the two test system.
Figure 4-17 illustrates the test results of two biosensors based on the smartWLI-
based biosensor test system. One biosensor was loaded with 25 µl of distilled water
and the other was loaded with 35 µl for each measurement. Figure 4-18 shows the
difference values between the measurements of each day.

Shengbo Sang Chapter 4 Biosensor Testing and Application
86
1 2 3 4 50
5
10
15
20
25
30
35
40
45
50
55
60
The
cent
er d
efle
ctio
n of
mem
bran
e / n
m
The time / day
biosensor1: 25 µl biosensor2: 35 µl
Figure 4-17: The test results of two biosensors during five days based on smartWLI
2.-1. 3.-1. 3.-2. 4.-1. 4.-2. 4.-3. 5.-1. 5.-2. 5.-3. 5.-4.-30
-25
-20
-15
-10
-5
0
5
10
15
20
25
30
The
diffe
renc
e va
lue
/ nm
Day
biosensor1: 25 µl biosensor2: 35 µl
Figure 4-18: The difference values of biosensors during five days based on smartWLI
From Figure 4-17 and 4-18, it can be derived that the deflection has an obvious
change when the amount of solution is different. The deflection measured at each
day shows a little alteration. The maximal difference occured on fourth day, it is 7.39
nm for biosensor 1 and 11.01 nm for biosensor 2. After the system error (4 nm) is

Chapter 4 Biosensor Testing and Application Shengbo Sang
87
subtracted, the maximum is about 3.39 nm and 7.01 nm, which may be induced by
the environmental factor, such as the temperature or pressure. However, the
difference value is smaller than the membrane deflection caused by the surface
stress based on the theoretical simulation. Hence, biosensors and the test system
show good repeatability.
For the FOI-based biosensor test system, 35 µl distilled water was loaded on the
biosensor membranes for each day’s measurement. Figure 4-19 shows the test
results of two biosensors during a continuous five days period. The deflection curves
of biosensors show good repeatability. Figure 4-20 illustrates the difference values
between the measurements. The maximal difference value of biosensor 1 occured
between the first day and the fifth day, and between the second day and the fourth
day for biosensor 2, about 0.0075 V, 0.0045 V after subtracting the system test error,
which is also quite smaller than the membrane deflection caused by the surface
stress. Hence, the biosensor test system shows good repeatability. The bigger
difference at the loading point was mainly induced by the operation factor for the load
of distilled water.
0 50 100 150 200 250
2,1952,2002,2052,2102,2152,2202,225
Time / Sec.
2,1952,2002,2052,2102,2152,2202,225
2,1952,2002,2052,2102,2152,2202,225
2,2002,2052,2102,2152,2202,2252,2002,2052,2102,2152,2202,225 Loading Point
5. day
4. day
3. day
2. day
1. day
Biosensor 1
Vol
tage
/ V
Vol
tage
/ V
Volta
ge /
VVo
ltage
/ V
Vol
tage
/ V
0 50 100 150 200 2501,8351,8401,8451,8501,8551,8601,865
Time / Sec.
1,8351,8401,8451,8501,8551,8601,865
1,8351,8401,8451,8501,8551,8601,865
1,8451,8501,8551,8601,8651,870
Vol
tage
/ V
Volta
ge /
VV
olta
ge /
VV
olta
ge /
VV
olta
ge /
V
1,8401,8451,8501,8551,8601,865
Loading point
5. day
4. day
4. day
2. day
1. day
Biosensor 2
Figure 4-19: The test results of two biosensors during five days based on FOI
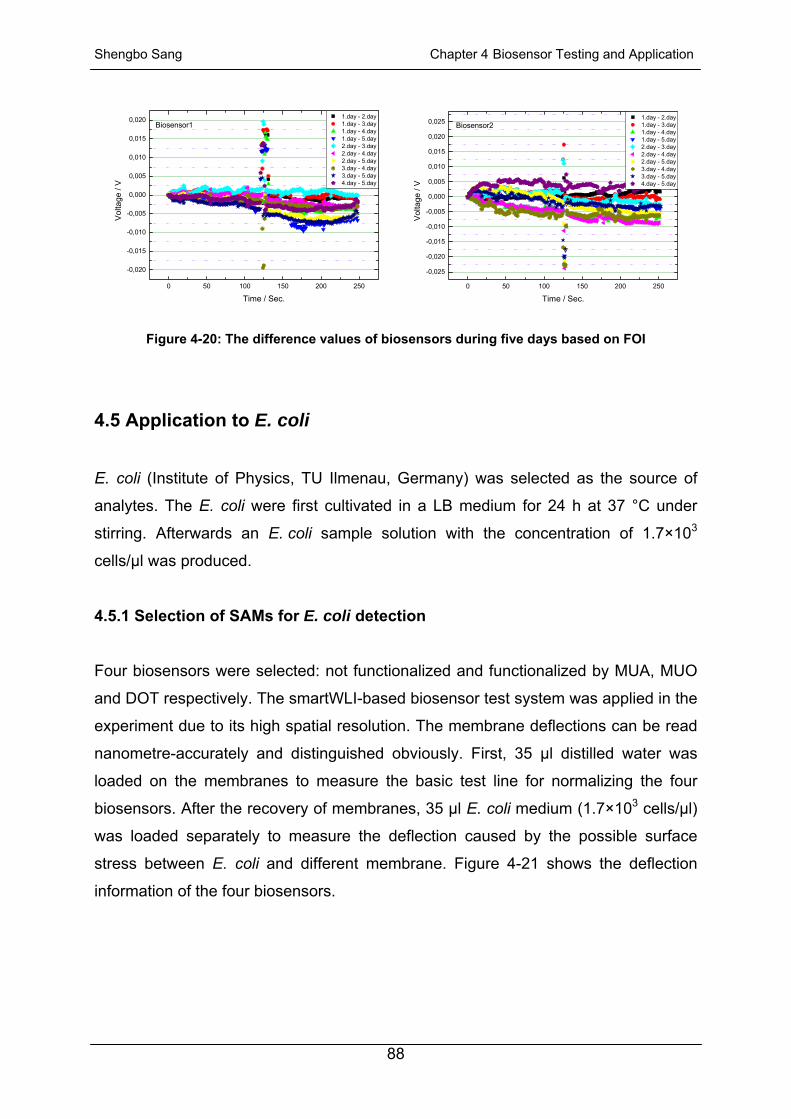
Shengbo Sang Chapter 4 Biosensor Testing and Application
88
0 50 100 150 200 250
-0,020
-0,015
-0,010
-0,005
0,000
0,005
0,010
0,015
0,020Biosensor1
Vol
tage
/ V
Time / Sec.
1.day - 2.day 1.day - 3.day 1.day - 4.day 1.day - 5.day 2.day - 3.day 2.day - 4.day 2.day - 5.day 3.day - 4.day 3.day - 5.day 4.day - 5.day
0 50 100 150 200 250
-0,025
-0,020
-0,015
-0,010
-0,005
0,000
0,005
0,010
0,015
0,020
0,025 Biosensor2 1.day - 2.day 1.day - 3.day 1.day - 4.day 1.day - 5.day 2.day - 3.day 2.day - 4.day 2.day - 5.day 3.day - 4.day 3.day - 5.day 4.day - 5.day
Vol
tage
/ V
Time / Sec.
Figure 4-20: The difference values of biosensors during five days based on FOI
4.5 Application to E. coli
E. coli (Institute of Physics, TU Ilmenau, Germany) was selected as the source of
analytes. The E. coli were first cultivated in a LB medium for 24 h at 37 °C under
stirring. Afterwards an E. coli sample solution with the concentration of 1.7×10³
cells/µl was produced.
4.5.1 Selection of SAMs for E. coli detection
Four biosensors were selected: not functionalized and functionalized by MUA, MUO
and DOT respectively. The smartWLI-based biosensor test system was applied in the
experiment due to its high spatial resolution. The membrane deflections can be read
nanometre-accurately and distinguished obviously. First, 35 µl distilled water was
loaded on the membranes to measure the basic test line for normalizing the four
biosensors. After the recovery of membranes, 35 µl E. coli medium (1.7×10³ cells/µl)
was loaded separately to measure the deflection caused by the possible surface
stress between E. coli and different membrane. Figure 4-21 shows the deflection
information of the four biosensors.

Chapter 4 Biosensor Testing and Application Shengbo Sang
89
0 2 4 6 8 10-120
-105
-90
-75
-60
-45
-30
-15
0
15
30
45
DOT (SH-(CH2)11-CH3)
MUO (SH-(CH2)11-OH)
MUA (SH-(CH2)10-COOH)
No functionalization
Basic line
The
cent
er d
efle
ctio
n of
mem
bran
e / n
m
The time / Min.
Figure 4-21: The normalization deflection of different functionalized membrane caused by
surface stress [P3]
The surface stress presented between E. coli and the membranes, and the direction
of membrane deflection induced by the surface stress was opposite to the one
induced by the weight of medium. The variations of membrane deflection were small
during the whole test period (10 minutes), since no big change of the medium and
the absorption quantity of E. coli on the membranes was observed for a short period.
However the values of surface stress differ for different functional membranes. It can
be explained based on the molecular biology of the cell [265] and biochemical
molecular reaction.
Phospholipids, amino acid and cholesterol are three major chemical structures of
main cell out layer component. Most phospholipids contain a diglyceride, a
phosphate group, and a simple organic molecule such as choline; sphingomyelin is
one exception to this rule because it is derived from sphingosine instead of glycerol.
They are a type of molecule and form a lipid bilayer within a cell membrane. =O is
one main biochemical bond of phospholipids [265]. An amino acid is a molecule that
contains two functional groups, an amine (-NH2) and a carboxylic acid (-COOH). The
variation of natural amino acids arises from differences in its side chain. This
structure may change so that a proton from the COOH transfers to the NH2 and a
zwitterion is formed in an aqueous solution. The alteration of structure is relative to

Shengbo Sang Chapter 4 Biosensor Testing and Application
90
the solution pH. Most physiological systems are with such a pH range that makes
amino acids as the zwitterion form, hence they are most stable in the human body.
One particularly important function of amino acid is as the building blocks of proteins.
Twenty common amino acids have been found in proteins. Amino acids can be
classified into three groups based on the different natural property of side chain.
Some side chains are nonpolar. and nine kinds of the amino acids have the side
chains. The second type is the amino acids that have polar side chains. Finally, a
group of five amino acids have not only polar but charged side chains. The amino
acids can link together to form proteins, which is one of their important
characteristics. The two ends of amino acids, COOH functional group and NH2
functional, can react with each other because the COOH functional group has the
acid characteristic and the NH2 functional group is a base [265]. There are -OH and
hydrogen bonds in the chemical structure of cholesterol [265].
Furthermore, E. coli is a Gram negative bacterium. The composition of a
Gram-negative bacterial membrane is shown in Figure 4-22 [266]: The inner or
cytoplasmic membrane surrounds the bacterial cell. The periplasm, which contains
peptidoglycan, is surrounded by the outer membrane. The outer leaflet of E. coli
outer membrane grows the Lipopolysaccharide (LPS) which consists of three distinct
components [266]: lipid A, oligosaccharide core, and O-antigen. The oligosaccharide
core contains an unique sugar, 2-keto-2-deoxyoctonate (KDO). Figure 4-23 and 4-24
illustrates the main molecular chemical structures contained in the membrane of E.
coli in addition to phospholipids, cholesterols and amino acids.
Figure 4-22: The composition of a Gram-negative bacterial membrane [266]

Chapter 4 Biosensor Testing and Application Shengbo Sang
91
Figure 4-23: Saccharolipid Kdo-Lipid A [W4] Figure 4-24: O antigen
(or O polysaccharide) [W5]
Based on the front analysis of biochemical structures, the out layer of E. coli contains
lots of -NH2, -COOH, -OH, -COH2, =O and -H chemical bonds. In addition, the four
different biosensor membranes have their own chemical structure as shown in
Figure 4-25.
Figure 4-25: The molecular structure diagram of different membrane surfaces
Therefore, some possible bonds between E. coli and different functionalized
membranes could happen based on the chemical molecular bonds and reactions: (1)
MUA: functional end group -COOH has the possible interaction with -NH2, -COOH,
-OH and =O and bond together, some examples are shown in Figure 4-26, which
induce the surface stress resulting in the deflection of membrane. In addition,
electrostatic effects and the Van der Waals force between molecules may also play
roles on the membrane. (2) MUO: functional end group -OH may have the interaction
with =O and bond together, such as the illustration in Figure 4-27. Furthermore, the
van der Waals force may be an acting force. All these factors result in the surface
stress and accordingly in the membrane deflection. (3) DOT: the main connections
between the functionalized membrane and E. coli were achieved by the van der
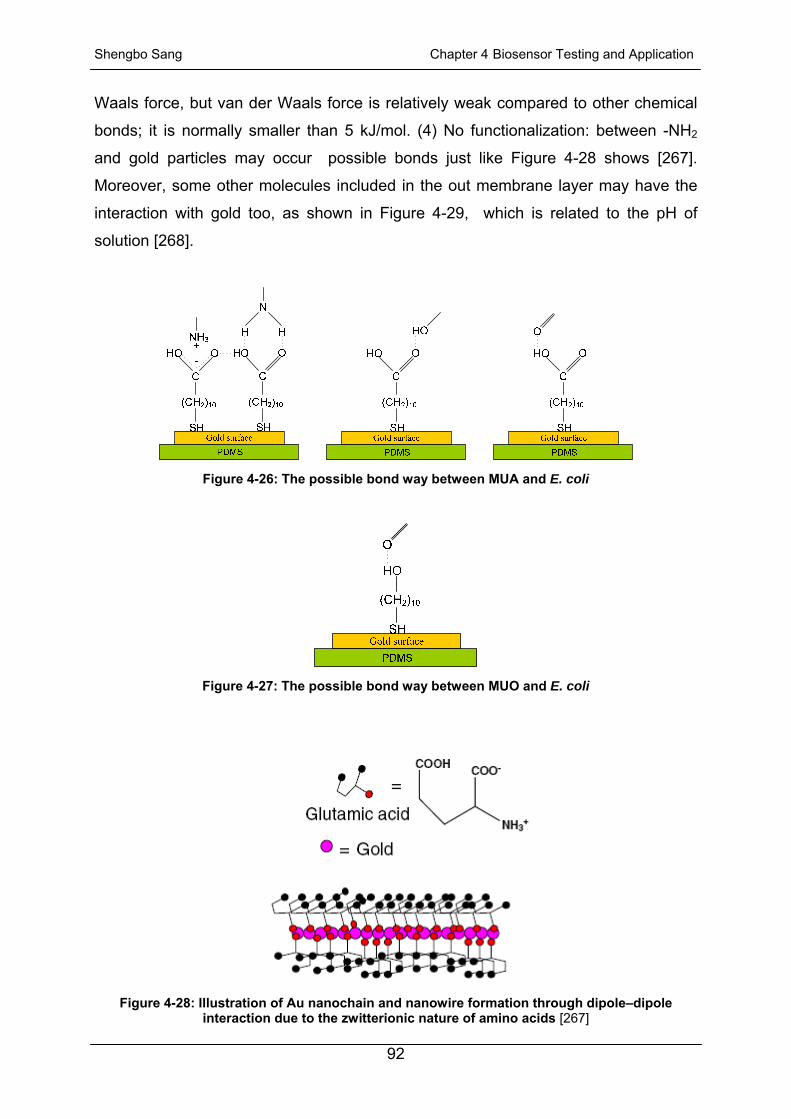
Shengbo Sang Chapter 4 Biosensor Testing and Application
92
Waals force, but van der Waals force is relatively weak compared to other chemical
bonds; it is normally smaller than 5 kJ/mol. (4) No functionalization: between -NH2
and gold particles may occur possible bonds just like Figure 4-28 shows [267].
Moreover, some other molecules included in the out membrane layer may have the
interaction with gold too, as shown in Figure 4-29, which is related to the pH of
solution [268].
Figure 4-26: The possible bond way between MUA and E. coli
Figure 4-27: The possible bond way between MUO and E. coli
Figure 4-28: Illustration of Au nanochain and nanowire formation through dipole–dipole
interaction due to the zwitterionic nature of amino acids [267]

Chapter 4 Biosensor Testing and Application Shengbo Sang
93
Figure 4-29a: Structure of Gly and the mechanism of its adsorption onthe gold colloid: (A) Gly with the positive charge; (B) Gly in theneutral state; (C) Gly with the negative charge [268]
Figure 4-29b: Structure of Lys and the mechanism of its adsorption onthe gold colloid: (A) Lys with the positive charge; (B) Lys in theneutral state; (C) Lys with the negative charge [268]
In conclusion, the possible amount of E. coli attached on different functionalized
membranes is: -COOH > -OH > -CH3. Similar conclusion has also be reported in the
reference [269], -OH > -CH3 for peptide, protein, and cellular interactions with
self-assembled monolayer model surfaces. But, it is not clear to the non
functionalized membrane.
Furthermore, the strength of surface stress (interaction stress or chemical bond
stress) is also one main factor to affect the membrane deflection. The strength of
bonds varies with different chemical bonding type. There are “strong bonds” and
“weak bonds” although there exist overlaps in strength within these bond classes.
Covalent bonds and ionic bonds are “strong bonds”, for example, and dipole-dipole
interactions, van der Waals' bonds, the London dispersion force and hydrogen
bonding belongs to the “weak bonds”. In general, if there is sharing or transfer of
electrons between the participating atoms, it is strong chemical bonding. Table 4-1
lists the categorization of chemical bond based on their strength.
To sum up, the possible strength between alive E. coli and different functionalized
membranes is -COOH > Au > -OH > -CH3, which is consistent with the experimental
result shown in Figure 4-21 and MUA is the best functionalized material in the three
functional materials for E. coli detection.

Shengbo Sang Chapter 4 Biosensor Testing and Application
94
Table 4-1: The categorization of chemical bonds [W6]
Chemical bonds
Covalent bonds & Antibonding
Sigma bonds: 3c-2e · bent bond · 3c-4e (Hydrogen bond, Dihydrogen bond, Agostic interaction) · 4c-2e
Pi bonds: π backbonding · Conjugation · Hyperconjugation · Aromaticity · Metal aromaticity Delta bond: Quadruple bond · Quintuple bond · Sextuple bond
Dipolar bond · Hapticity Ionic bonds Cation-pi interaction · Salt bridge
"Strong"
Metallic bonds Metal aromaticity
Hydrogen bond Dihydrogen bond · Dihydrogen complex · Low-barrier hydrogen bond · Symmetric hydrogen bond · Hydrophile
"Weak" Other noncovalent
van der Waals force · Mechanical bond · Halogen bond · Aurophilicity · Intercalation · Stacking · Entropic force · Chemical polarity
Other Disulfide bond · Peptide bond · Phosphodiester bond Note: the weakest strong bonds are not necessarily stronger than the strongest weak bonds
4.5.2 E. coli detection based on the smartWLI-based biosensor test system
The experimental biosensor membranes were functionalized using MUA. 35 µl
distilled water was firstly loaded in the solution reservoirs of the biosensors to
measure the basic deflection signals. After the recovery of membranes, 35 µl
medium with healthily living and with dead E. coli (1.7×10³ cells/µl) was loaded
respectively to measure the deflection caused by the possible surface stress
between E. coli and membranes. Figure 4-30 illustrates the results. The direction of
membrane deflection induced by surface stress is converse to that by water, which
indicates that the direction of surface stress is converse to the weigth direction and
this is consistent with the theoretical analysis. The deflection caused by living E. coli
was bigger than that caused by dead E. coli. The hypothetical reason is that the
surface stress resulting from living E. coli is bigger than that of dead E. coli, some
changes on the membrane of E. coli will happen after it dies, especially for the
outmost lipopolysaccharides (LPS). LPS is a major component of the E. coli outer
membrane, which has great importance for the structural integrity of E. coli. LPS can
protect the membrane from certain kinds of chemical attack. Further, it can help to
stabilize the overall membrane structure and increase the negative charge of the cell
membrane. It may induce the death of the E. coli if LPS is mutated or removed. For
example, the LPS collapses after death by heating, and different folding of the Braun
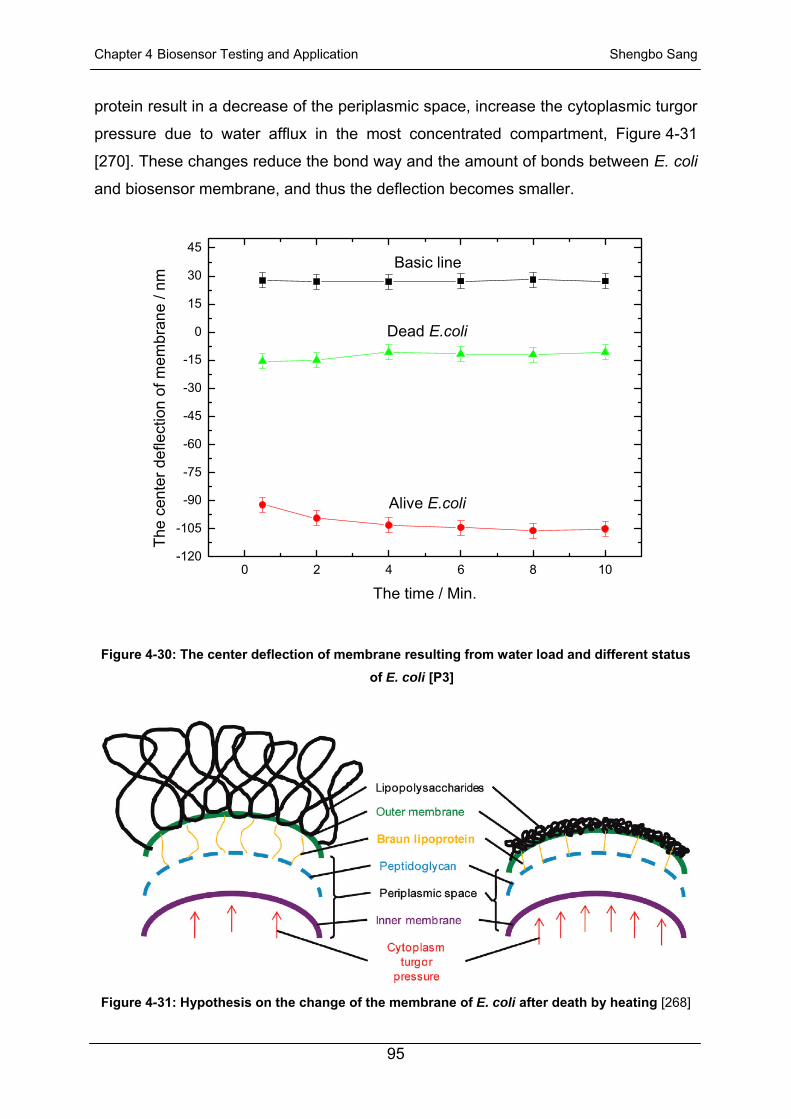
Chapter 4 Biosensor Testing and Application Shengbo Sang
95
protein result in a decrease of the periplasmic space, increase the cytoplasmic turgor
pressure due to water afflux in the most concentrated compartment, Figure 4-31
[270]. These changes reduce the bond way and the amount of bonds between E. coli
and biosensor membrane, and thus the deflection becomes smaller.
0 2 4 6 8 10-120
-105
-90
-75
-60
-45
-30
-15
0
15
30
45
Alive E.coli
Dead E.coli
Basic line
The
cent
er d
efle
ctio
n of
mem
bran
e / n
m
The time / Min.
Figure 4-30: The center deflection of membrane resulting from water load and different status
of E. coli [P3]
Figure 4-31: Hypothesis on the change of the membrane of E. coli after death by heating [268]

Shengbo Sang Chapter 4 Biosensor Testing and Application
96
One hypothesis can be proposed that the deflection of membrane caused by other
conditions of E. coli (between healthy living and death) may provoke the interval
values. The reason is that: Cells will have some changes when they are under
different conditions based on the basic cytopathology theory [271]. It is also well
known that the contents and structures of the cytoskeleton defining a cell’s shape
can be transformed by cancer [272, 273]. In addition to cancer, cytoskeleton
alterations have close relations with several diseases, including circulatory problems,
blood diseases (malaria, anemia, and hereditary spherocytosis), motor neuron
diseases (sclerosis), and aging related diseases (Alzheimer) [274-276]. Generally,
cancer cells exhibit lower elasticity and viscosity, and higher deformability than
normal cells. The differences that exist between cancerous and normal cells are due
to the changes in cytoskeletal content and structure. The cytoskeleton of cancer cells
shows fewer filamentous actin, intermediate filaments and microtubules, and appears
more irregular and compliant than that of normal cells [276, 277]. These changes
may alter the surface stress, which can be quantized through lots of experiments and
is useful for the medical test and analysis.
4.5.3 E. coli detection based on the FOI-based biosensor test system
In this experiment, the membrane deflection signals coming from healthily living
E. coli and dead E. coli were monitored by the FOI-based biosensor test system.
First, 20 µl pure medium (without E. coli) was loaded to measure the basic reference
signals, as shown by the lines 1 and 2 in Figure 4-32. After the recovery of
membranes, 20 µl medium with healthily living and with dead E. coli (concentration:
1.7 × 10³ cells/µl) was added respectively to measure the deflection signals caused
by the possible surface stress, lines 3 and 4 in Figure 4-32.
Lines 1 and 2 in Figure 4-32 represent the basic reference signals. The voltage had a
big change at the loading point because the membrane deflections were first mainly
caused by the medium weight; in addition, the reflex of medium to laser was another
reason to make the test voltage become small. With the evaporation of medium, the
influence factors of weight and reflex became smaller and the signals increased
again. The active signals are shown by line 3 and 4 in Figure 4-32. The primary
deflections also came from the weight and the reflex of E. coli medium, so at the

Chapter 4 Biosensor Testing and Application Shengbo Sang
97
loading point the active signals became smaller as well. However, the voltages of
active signals were bigger than the reference signals. The reason is the surface
stress resulting from the bonds of E. coli with the functionalized membranes, and the
direction of membrane deflection caused by the surface stress was converse to that
by the weight of medium, which was consistent with the theoretical analysis. The
active signals increased with the evaporation of medium. The last voltage may be
bigger than the origination point due to the lasting surface stress induced by the long
time physical absorption of E. coli on the membrane surface. However, the difference
of signals between living E. coli and dead E. coli is not so obvious as the results from
the smartWLI-based biosensor test system were. The reason is that the spatial
resolution of the current FOI-based biosensor test system is low, which can be
improved by using the “better” FOI system, with the negative aspect of getting a
signal representing “average” deflection in the ROI.
0 1000 2000 3000 4000 5000
1,71
1,72
1,73
1,74
1,75
1,76
1,77
1,78
1,79
Loading point
Loading point
Line 2: only medium
Line 4: with dead E. coli
Line1: only medium
Line 3: with living E. coli
Biosensor 2
Biosensor 1
Vol
tage
/ V
Time / Sec.
Figure 4-32: The comparison of FOI signals between pure medium and the medium with alive
resp. dead E. coli [P3]

Shengbo Sang Chapter 4 Biosensor Testing and Application
98
4.6 Other experiments
4.6.1 Detection of different solutions based on the biosensor
The FOI-based biosensor test system was applied in the experiment due to its high
time resolution (< 0.5 sec.) and can monitor signals continuously. First, the basic
signal was measured when nothing was loaded on the biosensor membrane. 20 µl
distilled water, ethanol and MUA solution were then added orderly and the active
signals were measured, the interval was about 1 hour to make sure the membranes
recovered completely. Figure 4-33 illustrates the signals corresponding to different
solutions. For water and ethanol, the weight and the reflection to laser are the main
influence factors to the membrane, so the detected voltages became small at the first
stage. With the evaporation of solutions, these influences decreased and the
voltages became large again; the membrane recovered little by little until the original
level. For MUA solution, the weight and the reflection to laser were also the main
influence factors to the membrane at the first stage, so the voltage became firstly
small, too. However, the change of voltage was smaller than with water and ethanol,
and the last voltage was larger than the original level. The possible reason also
arises from the surface stress, the effect of which has been explained in detail in
section 4.3.2.
-1000 0 1000 2000 3000 4000 5000 6000 7000 8000 9000 100001,005
1,010
1,015
1,020
1,025
1,030
1,035
1,040
1,045
1,050
1,055Evaporation point
Loading point
Vol
tage
/ V
Time / Sec.
only membrane water ethanol functional solution
Figure 4-33: The biosensor reaction to different solutions
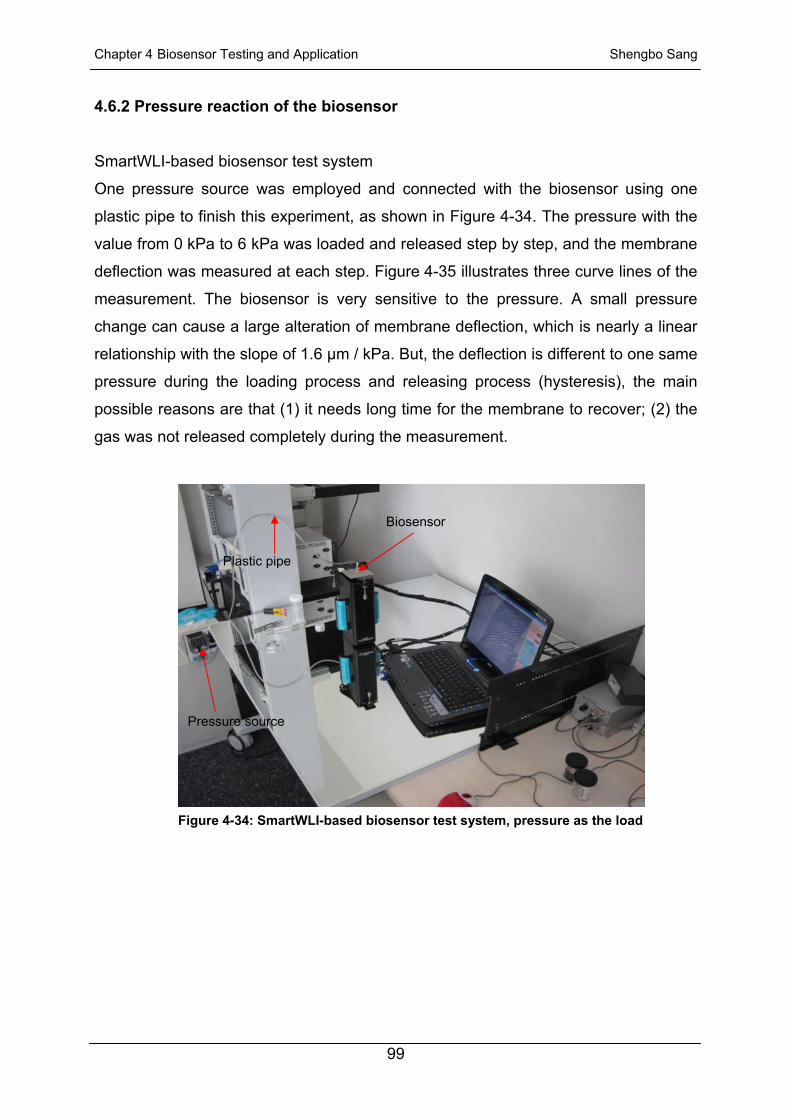
Chapter 4 Biosensor Testing and Application Shengbo Sang
99
4.6.2 Pressure reaction of the biosensor
SmartWLI-based biosensor test system
One pressure source was employed and connected with the biosensor using one
plastic pipe to finish this experiment, as shown in Figure 4-34. The pressure with the
value from 0 kPa to 6 kPa was loaded and released step by step, and the membrane
deflection was measured at each step. Figure 4-35 illustrates three curve lines of the
measurement. The biosensor is very sensitive to the pressure. A small pressure
change can cause a large alteration of membrane deflection, which is nearly a linear
relationship with the slope of 1.6 µm / kPa. But, the deflection is different to one same
pressure during the loading process and releasing process (hysteresis), the main
possible reasons are that (1) it needs long time for the membrane to recover; (2) the
gas was not released completely during the measurement.
Figure 4-34: SmartWLI-based biosensor test system, pressure as the load
Pressure source
Plastic pipe
Biosensor

Shengbo Sang Chapter 4 Biosensor Testing and Application
100
0 1 2 3 4 5 6 5 4 3 2 1 0-1
0
1
2
3
4
5
6
7
8
9
The
cent
er d
efle
ctio
n of
mem
bran
e / µ
m
The pressure / kPa
Figure 4-35: The biosensor’s responding to pressure measured by the smartWLI-based
biosensor test system
Figure 4-36: FOI-based biosensor test system, pressure as the basic load
Pressure source
Plastic pipe Biosensor

Chapter 4 Biosensor Testing and Application Shengbo Sang
101
-25 0 25 50 75 100 125 150 175 200 2251,32
1,33
1,34
1,35
1,36
1,37
1,38
1,39
1,40
1,41
1,42
12kPa
11kPa11kPa
10kPa10kPa9kPa9kPa
8kPa8kPa7kPa7kPa
6kPa6kPa
5kPa 5kPa4kPa4kPa
3kPa3kPa2kPa2kPa
1kPa1kPa0kPa0kPa
Time / S
Vol
tage
/ V
Figure 4-37: The biosensor’s responding to pressure measured by the FOI-based biosensor
test system
FOI-based biosensor test system
Figure 4-36 illustrates the whole test system when the pressure source was
connected with the FOI-based biosensor test system. The advantage of the test
system is that the signals of membrane deflection can be monitored continuously.
Four curve lines were measured when the pressure with the value from 0 kPa to
12 kPa was loaded and released step by step, as shown in Figure 4-37. The same
conclusion as the result of smartWLI-based biosensor test system was obtained: the
membrane is very sensitive to pressure, and a small pressure change can cause a
large alteration of membrane deflection. The relationship between membrane
deflection and pressure is nearly linear. However, the deflection is also different to
one same pressure during the loading process and the releasing process.
Conclusions: Experiments
The novel PDMS micro membrane biosensor based on the analysis of surface stress
was successfully realized and shows good repeatability and biocompatibility. The
proposed novel scheme by applying two membranes in parallel increases the

Shengbo Sang Chapter 4 Biosensor Testing and Application
102
sensitivity of biosensors. Two biosensor test systems have been built based on the
white light interferometer and the fiber optic interferometer respectively. The
smartWLI-based biosensor test system has a high spatial resolution (1 nm) and can
read deflection signal nanometre-accurately and directly. The FOI-based biosensor
test system has a better time resolution (< 0.5 sec.) and is able to monitor the
deflection signal continuously, but yields only average defelection values for the ROI.
For E. coli detection, the MUA is a better functional material than MUO and DOT to
functionalize membranes. The conditions of E. coli can be detected based on the
deflection tests. Furthermore the surface stress will change and result in the
alteration of membrane deflection when the cells have some changes due to
pathologies or other reasons based on the theory, hence the properties can be
analyzed based on the biosensor. For the biological and medical applications, other
kinds of cells or molecules can also be detected based on the biosensor test systems
by functionalizing the membranes with different functional materials. The analysis of
some pathological changes of cells or molecules can be carried out based on the
alteration of membrane deflection. This platform technology will enable various
protocols for disease diagnostic and drug research.
Some experimental work has been published under the title “A novel PDMS micro
membrane biosensor based on the analysis of surface stress” in Journal of
Biosensors and Bioelectronics (2010) 25:2420 –2424 [P3].

Chapter 5 Summary and Future Outlook Shengbo Sang
103
Chapter 5 Summary and Future Outlook
5.1 Summary
In this thesis, a PDMS micro membrane biosensor based on the analysis of surface
stress was designed, simulated, fabricated and tested for biological applications. The
room temperature adhesive transfer bonding process – uncured PDMS method was
tested to bond the biosensor with microfluidic devices or components.
First, the biosensor was proposed ground on lots of fundamental works. It is a
relatively new class of sensors using the universal concept of free energy reduction
occurring from binding reactions. This kind of biosensor allows the detection in
opaque media and the miniaturization of the sensor for point-of-use sensing. The
technique is advantageous since it does not require any labelling of bio-analytes or
the addition of redox probes. According to the biology and pathology theory, the
structures of bio-analytes, such as molecules and cells, will have some changes
when they are under different conditions, health, disease or death for example.
These changes will alter the amount of surface stress between bio-analytes and
biosensor membrane, which hence causes the alteration of membrane deflection.
Some important information can be obtained by detecting and analyzing the
alteration.
Finite element model was used for the selection of membrane material and the
optimization of biosensor geometry parameters. Two kinds of biosensor structure
have been designed, each structure contains two layers: microfluidic layer and
sensor layer. The sensor layer of the two biosensor structures is basically the same,
which consists of two membranes, one acts as the active membrane and the other as
reference. But the microfluidic structure is different, one is made of inlets, buffers,
microchannels and outlets, and the other has only chambers. The biosensors have
been fabricated based on surface and bulk microfabrication technology. Many
challenges in the fabrication, such as realization of PDMS processing based on
conventional microfabrication processes, fabrication of perfect PDMS thin film and
release of PDMS membrane, were successfully overcome to form the biosensor. The

Shengbo Sang Chapter 5 Summary and Future Outlook
104
bonding technique between mirofluidic layer and sensor layer, uncured PDMS as the
intermediate layer method, has been tested and utilized. The bond strength is close
to the strength of bulk PDMS, which works well for bonding glass microfluidic devices
and PDMS sensor layer.
This is the first demonstration of PDMS micro membrane sensor array based on the
surface stress analysis. The micro membrane sensor shows low elasticity, better
biological and chemical resistance and biocompatibility of PDMS when compared to
the silicon or nitride silicon-based materials used in traditional microfabrication. The
sensor array platform can be tuned for sensing many different bio-analytes by using
suitable sensor coatings, and these coatings play an important role in determining
the sensitivity and resolution. Alkanethiols with different functional end groups can be
chosen as sensor coating materials. Alkanethiol molecules have a strong affinity for
gold surface and this property was exploited for coating formation on the gold layer of
the membrane sensor. Furthermore, there is another advantage: the use of
alkanethiol coating requires minimal modification of the sensor microfabrication
process sequence. The properties of the coatings can also be easily tailored by
choosing alkanethiols with different functional end groups like COOH, OH, CH3 and
NH2. In this thesis, three alkanethiol molecules with different functional end groups:
11 Mercapto 1 undecanoicacid (MUA: SH-(CH2)10-COOH), 11 Mercapto 1 undecanol
(MUO: SH-(CH2)11-OH) and Dodecane thiol (DOT: SH-(CH2)11-CH3) have been
tested as the sensor coating layers for E. coli detection.
Based on the biosensor, two test systems have been set up with the white light
interferometer (smartWLI) and the fiber optic interferometer (FOI) respectively, as
shown in Figure 5-1 and 5-2. Non-contact, nanometer accuracy and dependable are
the advantages of smartWLI-based biosensor test system, the membrane deflection
resulting from the surface stress can be read directly and accurately. The FOI-based
biosensor test system can continuously monitor the deflection signal though the
resolution of current system is not best, but the optimal system could be gained by a
better fiber optic interferometer. Lots of experiments have been done successfully for
the biosensor testing and application based on the two test systems. The PDMS
micro membrane biosensor based on the analysis of surface stress is successful and
has good sensitivity, repeatability and biocompatibility. For the application to E. coli
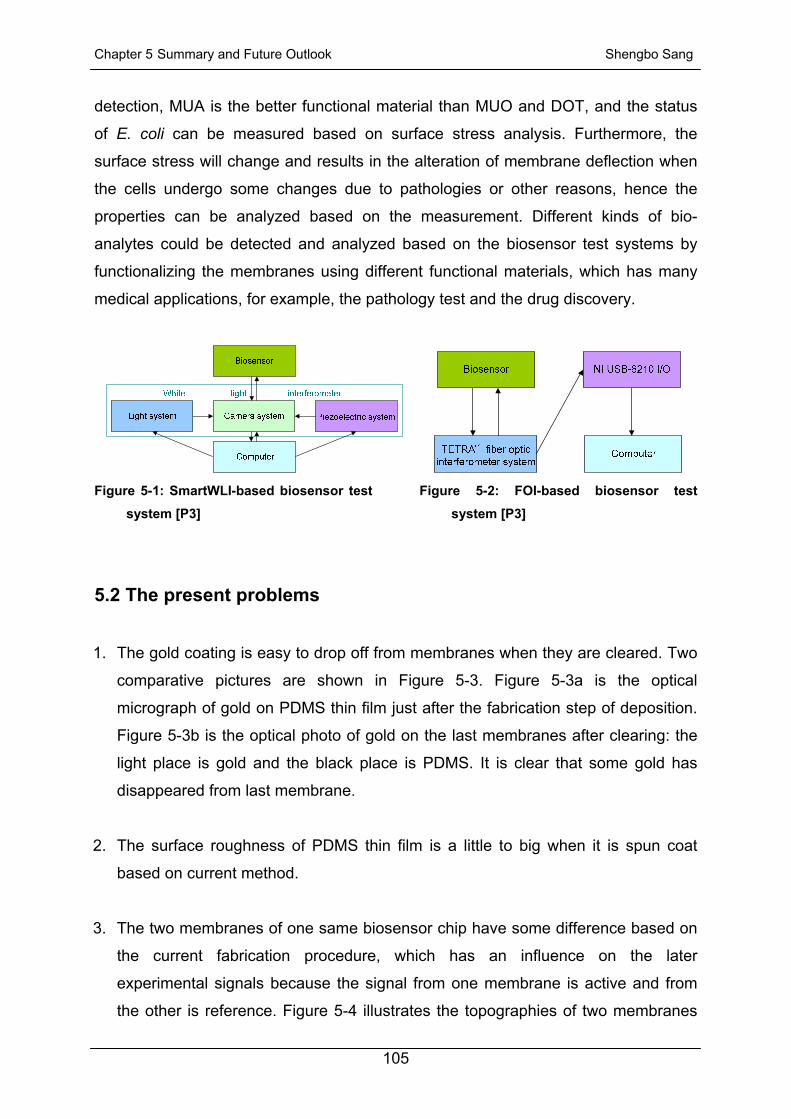
Chapter 5 Summary and Future Outlook Shengbo Sang
105
detection, MUA is the better functional material than MUO and DOT, and the status
of E. coli can be measured based on surface stress analysis. Furthermore, the
surface stress will change and results in the alteration of membrane deflection when
the cells undergo some changes due to pathologies or other reasons, hence the
properties can be analyzed based on the measurement. Different kinds of bio-
analytes could be detected and analyzed based on the biosensor test systems by
functionalizing the membranes using different functional materials, which has many
medical applications, for example, the pathology test and the drug discovery.
Figure 5-1: SmartWLI-based biosensor test
system [P3] Figure 5-2: FOI-based biosensor test
system [P3]
5.2 The present problems
1. The gold coating is easy to drop off from membranes when they are cleared. Two
comparative pictures are shown in Figure 5-3. Figure 5-3a is the optical
micrograph of gold on PDMS thin film just after the fabrication step of deposition.
Figure 5-3b is the optical photo of gold on the last membranes after clearing: the
light place is gold and the black place is PDMS. It is clear that some gold has
disappeared from last membrane.
2. The surface roughness of PDMS thin film is a little to big when it is spun coat
based on current method.
3. The two membranes of one same biosensor chip have some difference based on
the current fabrication procedure, which has an influence on the later
experimental signals because the signal from one membrane is active and from
the other is reference. Figure 5-4 illustrates the topographies of two membranes

Shengbo Sang Chapter 5 Summary and Future Outlook
106
of one the same biosensor chip, measured by the white light interferometer. The
difference is obvious.
4. It is not easy to load and unload the solution and bio-analytes, especially for the
cleaning of membranes based on current microfluidic components — only one
chamber.
(a) Just after the fabrication step of deposition (b) the last membrane after clearing
Figure 5-3: Optical images of gold on the membrane
Figure 5-4: The topographies of two membranes of one biosensor
5. During the experiments, we controlled as far as possible the temperature of
media, and tried to realize the same temperature on active membrane and
reference membrane by long time measurement under controlled, constant
temperature condition. Maybe it is not easy to assure the consistent temperature
on both the two membranes under routine conditions.

Chapter 5 Summary and Future Outlook Shengbo Sang
107
5.3 Future outlook
Obviously the surface stress-based PDMS micro membrane biosensor can measure
effects of bio-analytes, and analyze their properties based on the analysis of
membrane deflection change resulting from the alteration of surface stress. Surface
chemistry plays a key role in determining the sensitivity and selectivity of the
biosensor and also the amount of non-specific binding. Hence, surface chemistry
used for biosensor functionalization and passivation needs to be optimized for
improving the biosensor performance. In addition, more biological and medical
applications of the biosensor, such as molecular detection, drug research should be
developed and studied. The biosensor only can be commercialized in the medical
inspection field after driving some improvements in this field.
Other improvements may be done to make the biosensor better, more portable,
more miniaturized, for example:
1. The parameters of biosensor may be optimized further and more biosensors
with different parameters can be fabricated to allow more test.
2. The resolution and response time of the whole system can be optimized by
using better sensor surface coating materials, and thus designing more
reasonable test methods.
3. The spin-coating method should be improved to get more uniform and small
surface roughness of PDMS membranes. The fabrication process can also be
improved or revised to make sure the two membranes of one same biosensor
chip are basically equal for getting improved dual comparable signals.
4. The bond strength between gold and PDMS thin film should be improved in
order to decrease the drop of gold from membranes: for example, the wafer
with PDMS thin film can be first soaked in a 15 mM solution of
3-mercapto-propyltrimethoxysilane in IPA for 2 hours, assembling a monolayer
for effective PDMS-Au adhesion [278] before gold deposition.

Shengbo Sang Chapter 5 Summary and Future Outlook
108
5. An automated temperature control system has to be set up in future to
calibrate the temperature error of biosensors, especially for the error between
active membrane and reference membrane. The temperature compensation
system then should yield more accurate measurements.

Appendix I Shengbo Sang
AI - 1 -
Appendix І: FE Ansys simulation program of membrane (1/4 symmetry, Unit: µm)
/BATCH
/input,menust,tmp,'',,,,,,,,,,,,,,,,1
WPSTYLE,,,,,,,,0
/PREP7
/title, deformation
!DEFINE PARAMETERS
*SET,lpdms,200 !the length of submaterial layer of membrane
(µm) / variable parameter
*SET,wpdms,200 !the width of submaterial layer of membrane
(µm) / variable parameter
*SET,tpdms,5 !the thickness of submaterial layer of
membrane (µm) / variable parameter
*SET,lau,195 !the length of gold layer (µm) / variable
parameter
*SET,wau,195 !the width of gold layer (µm) / variable
parameter
*SET,tau,0.07 !the thickness of gold layer (µm) / variable
parameter
!SET ELEMENT TYPES AND CONSTANTS
ET,1,SOLID186 !the element type of submaterial of
membrane ET,2,SHELL93 !the element type of gold
mp,ex,1,7 !the young's modulus of submaterial of
membrane, here is PDMS (MPa)
mp,prxy,1,0.48 !the Poisson ratio of submaterial of
membrane, here is PDMS mp,ex,2,78000 !the young's modulus of gold (MPa)
mp,prxy,2,0.44 !the Poisson ratio of gold
r,1,tau !define the real constant (thickness) of gold

Shengbo Sang Appendix I
AI - 2 -
MPTEMP,,,,,,,, !set the coeffecient of thermal expension MPTEMP,1,0 UIMP,1,REFT,,,300.15 !reference temperature
MPDATA,ALPX,1,,0 !the coefficient of thermal expansion of
submaterial of membrane MPTEMP,,,,,,,,
MPTEMP,1,0 UIMP,2,REFT,,,300.15 !reference temperature
MPDATA,ALPX,2,,14.2e-6 !the coefficient of thermal expansion of gold
!GENERATE MODEL BLC4,0,0,wpdms,lpdms,tpdms !create the submaterial layer of membrane
BLC4,0,0,wau,lau !create the gold layer
!MESHING esize,2 !define the meshing size
VSEL,S, , , 1 !select the submaterial layer
type,1 !define the element type of submaterial mat,1 !define material model of submaterial vmesh,all !mesh
ASEL,S, , , 7 !select the gold layer type,2 !define the element type of gold mat,2 !define material model of gold real,1 !define the real constant (thickness) of gold
amesh,all amesh,all ALLSEL,ALL
!CONTACT VOLUME AND AREA ! define the contact between submaterial
layer and gold layer
CM,_TARGET,AREA
!* ! /COM, CONTACT PAIR CREATION -
START
CM,_NODECM,NODE
CM,_ELEMCM,ELEM

Appendix I Shengbo Sang
AI - 3 -
CM,_KPCM,KP
CM,_LINECM,LINE
CM,_AREACM,AREA
CM,_VOLUCM,VOLU
! /GSAV,cwz,gsav,,temp
MP,MU,1,
MAT,1
MP,EMIS,1,7.88860905221e-031
R,3
REAL,3
ET,3,170
ET,4,174
R,3,,,1.0,0.0001,0,
RMORE,,,1.0E20,0.0,1.0,
RMORE,0.0,0,1.0,,1.0,0.5
RMORE,0,1.0,1.0,0.0,,1.0
KEYOPT,4,4,0
KEYOPT,4,5,0
KEYOPT,4,7,0
KEYOPT,4,8,0
KEYOPT,4,9,0
KEYOPT,4,10,2
KEYOPT,4,11,0
KEYOPT,4,12,3
KEYOPT,4,2,0
KEYOPT,3,5,0
! Generate the target surface
ASEL,S,,,1
ASEL,A,,,2
ASEL,A,,,3
ASEL,A,,,4
ASEL,A,,,5
ASEL,A,,,6
CM,_TARGET,AREA
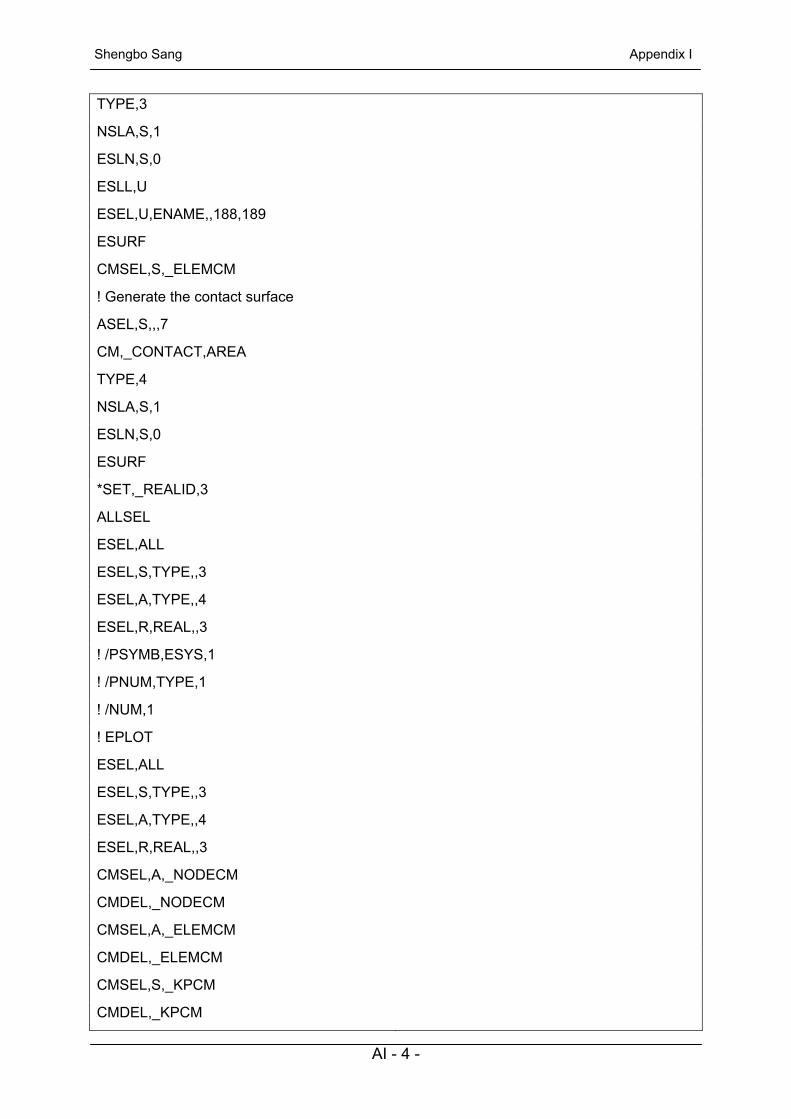
Shengbo Sang Appendix I
AI - 4 -
TYPE,3
NSLA,S,1
ESLN,S,0
ESLL,U
ESEL,U,ENAME,,188,189
ESURF
CMSEL,S,_ELEMCM
! Generate the contact surface
ASEL,S,,,7
CM,_CONTACT,AREA
TYPE,4
NSLA,S,1
ESLN,S,0
ESURF
*SET,_REALID,3
ALLSEL
ESEL,ALL
ESEL,S,TYPE,,3
ESEL,A,TYPE,,4
ESEL,R,REAL,,3
! /PSYMB,ESYS,1
! /PNUM,TYPE,1
! /NUM,1
! EPLOT
ESEL,ALL
ESEL,S,TYPE,,3
ESEL,A,TYPE,,4
ESEL,R,REAL,,3
CMSEL,A,_NODECM
CMDEL,_NODECM
CMSEL,A,_ELEMCM
CMDEL,_ELEMCM
CMSEL,S,_KPCM
CMDEL,_KPCM

Appendix I Shengbo Sang
AI - 5 -
CMSEL,S,_LINECM
CMDEL,_LINECM
CMSEL,S,_AREACM
CMDEL,_AREACM
CMSEL,S,_VOLUCM
CMDEL,_VOLUCM
! /GRES,cwz,gsav
CMDEL,_TARGET
CMDEL,_CONTACT
! /COM, CONTACT PAIR CREATION - END
!DEFINE THE BOUNDARY CONDITION FLST,5,2,5,ORDE,2 !fix the two sides of submaterial layer FITEM,5,4
FITEM,5,6
ASEL,S, , ,P51X
FINISH
/SOL
FINISH
/PREP7
FLST,2,2,5,ORDE,2
FITEM,2,4
FITEM,2,6
!*
/GO DA,P51X,ALL, !define the symmetry
ASEL,S, , , 3
NSLA,S,1
DSYM,SYMM,Y, ,
ASLL,S
ASEL,S, , , 5
NSLA,S,1
DSYM,SYMM,X, ,
LSEL,S, , , 13

Shengbo Sang Appendix I
AI - 6 -
NSLL,S,1
DSYM,SYMM,Y, ,
LSEL,S, , , 16
NSLL,S,1
DSYM,SYMM,X, ,
ASEL,S, , , 7
FLST,2,1,5,ORDE,1
FITEM,2,7
!* BFA,P51X,TEMP, X !load on the gold, the value is X ALLSEL,ALL
FINISH
! SOLVE
/SOL
! /STATUS,SOLU
SOLV
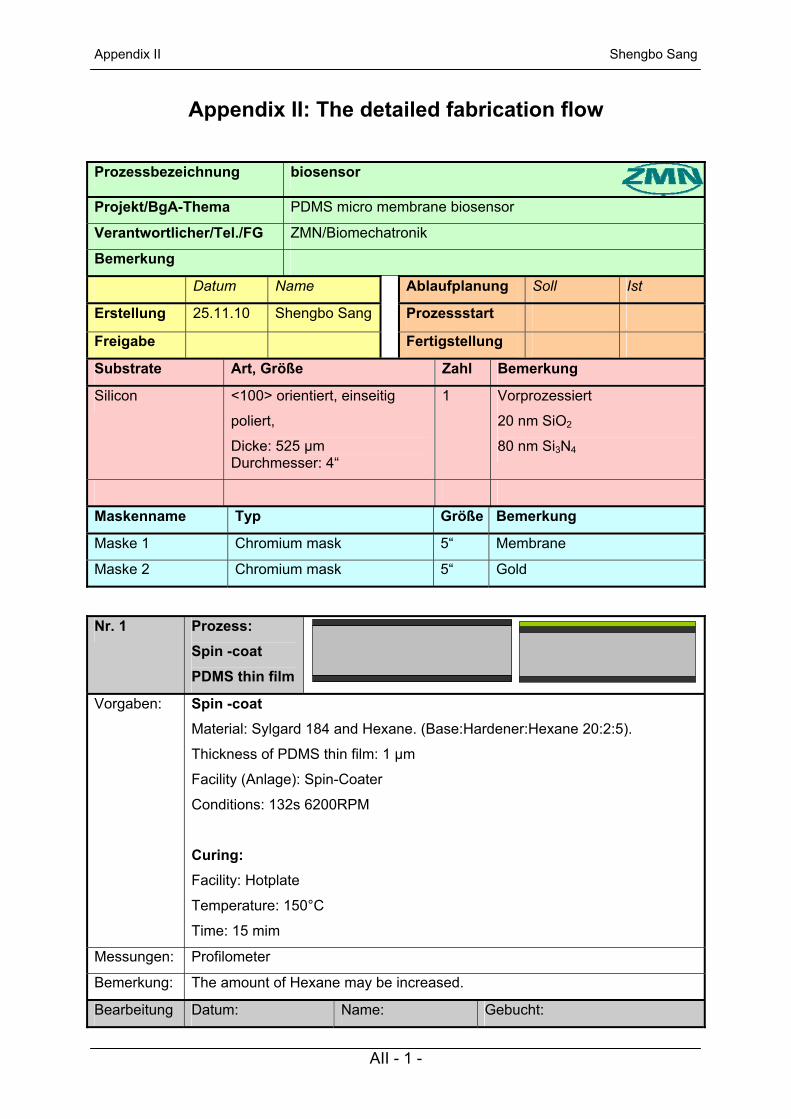
Appendix II Shengbo Sang
AII - 1 -
Appendix II: The detailed fabrication flow
Prozessbezeichnung biosensor
Projekt/BgA-Thema PDMS micro membrane biosensor
Verantwortlicher/Tel./FG ZMN/Biomechatronik
Bemerkung
Datum Name Ablaufplanung Soll Ist
Erstellung 25.11.10 Shengbo Sang Prozessstart
Freigabe Fertigstellung
Substrate Art, Größe Zahl Bemerkung
Silicon <100> orientiert, einseitig
poliert,
Dicke: 525 μm Durchmesser: 4“
1 Vorprozessiert
20 nm SiO2
80 nm Si3N4
Maskenname Typ Größe Bemerkung
Maske 1 Chromium mask 5“ Membrane
Maske 2 Chromium mask 5“ Gold
Nr. 1 Prozess: Spin -coat PDMS thin film
Vorgaben: Spin -coat Material: Sylgard 184 and Hexane. (Base:Hardener:Hexane 20:2:5).
Thickness of PDMS thin film: 1 µm
Facility (Anlage): Spin-Coater
Conditions: 132s 6200RPM
Curing: Facility: Hotplate
Temperature: 150°C
Time: 15 mim
Messungen: Profilometer
Bemerkung: The amount of Hexane may be increased.
Bearbeitung Datum: Name: Gebucht:

Shengbo Sang Appendix II
AII - 2 -
Nr. 2 Prozess: deposit and expose the photoresist
Vorgaben: Belackung Postive resist AZ 9260
Thickness: about 1.8 µm
Facility: Spin-Coater
Condition: 4000 rpm
Curing Facility: Hotplate
Temperature: 95°C
Time: 10min
Exposure Facility: EV 6/2
Gold Mask, (Fischer; A. 3.19.09)
Messungen:
Bemerkung:
Bearbeitung Datum: Name: Gebucht:
Nr. 3 Prozess: Deposit the gold
Vorgaben: Evaporation Material: Gold
Thickness: 20-70 nm
Facility: Edwards Auto 306
Messungen:
Bemerkung:
Bearbeitung: Datum: Name: Gebucht:

Appendix II Shengbo Sang
AII - 3 -
Nr. 4 Prozess: Lift – Off
Vorgaben: Condition
in Glasschale unter Abzug mit Aceton
Wash (spülen) In DI – Wasser (im spülbecken) über 60s
Dry in the room temperature
Messungen:
Bemerkung: It must be careful to protect the PDMS thin film.
Bearbeitung: Datum: Name: Gebucht:
Nr. 5 Prozess: deposit and expose the photoresist
Vorgaben: Belackung: Rüchseite (back side) Postive resist AZ 1518
Facility: Spin-Coater
Amount of positive resist: 3ml
Condition: 4000rpm
Curing Facility: Hotplate
Temperature: 105°C
Time: 30 min
Exposure Facility: EV 6/2
Membrane Mask (Fischer; A. 3.19.09)
Messungen:
Bemerkung:
Bearbeitung Datum: Name: Gebucht:

Shengbo Sang Appendix II
AII - 4 -
Nr. 6 Prozess: RIE back side
Vorgaben: Facility: RIE – Oxford The layer: 80 nm Si3N4, 20 nm SiO2
Messungen:
Bemerkung:
Bearbeitung: Datum: Name: Gebucht:
Nr. 7 Prozess: KOH – Etch (KOH - Ätzen)
Vorgaben: Etch Si - Etch
Anlage: Ätzbad KOH auf Nassbank
KOH: 25%
Temperature: 90°C
The etching speed in (100)-Si: about 1.84 µm/min
Wash (spülen) In DI – Wasser (im spülbecken)
Time: about 60 s
Messungen:
Bemerkung: The front side can not contact with KOH, must be protected.
Bearbeitung: Datum: Name: Gebucht:

Appendix II Shengbo Sang
AII - 5 -
Nr. 8 Prozess: RIE
Vorgaben: Facility: RIE – Oxford The layer: 80 nm Si3N4, 20 nm SiO2
Messungen:
Bemerkung: The step is same as Nr. 6 step. It must be careful to protect the PDMS thin
film.
Bearbeitung: Datum: Name: Gebucht:

Shengbo Sang Appendix II
AII - 6 -

References Shengbo Sang
R - 1 -
References [1] Wang, Wangjun and Soper, Steven A. (2007). Bio-MEMS: Technologies and
Applications. United States of America: CRC Press. ISBN 978-0-8493-3532-7. [2] Lee, Abraham P. and Lee, L. James (2006). BioMEMS and Biomedical
Nanotechnology Vol. 1 Biological and Biomedical Nanotechnology. United States of America: Springer. ISBN 978-0387-25563-7.
[3] Ozkan, Mihrimah and Heller, Michael J. (2006). BioMEMS and Biomedical
Nanotechnology Vol. 2 Micro Nano Technology for Genomics and Proteomics. United States of America: Springer. ISBN 978-0387-25843-0.
[4] Desai, Tejal and Bhatia, Sangeeta (2006). BioMEMS and Biomedical Nanotechnology
Vol. 3 Therapautic Micro Nano Technology. United States of America: Springer. ISBN 978-0387-25565-1.
[5] Bashir, Rashid and Wereley, Steve (2006). BioMEMS and Biomedical
Nanotechnology Vol. 4 Biomolecular Senging, Processing and Analysis. Springer. ISBN 978-0387-25845-4.
[6] Srinath Satyanarayana (2005). “Surface Stress and Capacitive MEMS Sensor Arrays
for Chemical and Biological Sensing”, University of California, Berkelery, Ph.D. dissertation.
[7] International Union of Pure and Applied Chemistry. "Biosensor". Compendium of
Chemical Terminology, Compiled by A. D. McNaught and A. Wilkinson [8] Vincent Tabard-Cossa (2005). “Microcantilever Actuation Generated by Redox-
induced Surface Stress”, Department of Physics McGill University, Canada, PH.D dissertation.
[9] Michel Godin (2004). “Surface Stress, Kinetics, and Structure of Alkanethiol Self-
Assembled Monolayers”, Department of Physics McGill University, Canada, Ph.D dissertation.
[10] A.S. Widge et al., (2007). “Self-assembled monolayers of polythiophene conductive
polymers improve biocompatibility and electrical impendance of neural electrodes”, Biosensors and Bioelectronics, 22, 1723-1732.
[11] Thundat, T., Oden, P. I. and Warmack, R. J. (1997). Microcantilever sensors,
Microscale Thermophysical Engineering, 1 (3), 185-199. [12] Lavrik, N. V., Sepaniak, M. J. and Datskos, P. G. (2004). Cantilever transducers as a
platform for chemical and biological sensors, Review of Scientific Instruments, 75 (7), 2229-2253.
[13] Lai, J.; Perazzo, T.; Shi, Z.; Majumdar, A. (1997). Sensors and Actuators A 58, 113-
119. [14] Gimzewski, J. K.; Gerber, C.; Meyer, E.; Schlittler, R. R., (1994). Chem. Phys. Lett.
217, 589-594. [15] Reid, S.; Cagnoli, G.; Crooks, D. R. M.; Hough, J.; Murray, P.; Rowan, S.; Fejer, M.

Shengbo Sang References
R - 2 -
M.; Route, R.; Zappe, S. (2006). Phys. Lett. A, AID 15103. [16] Marie, R.; Thaysen, J.; Christensen, C. B. V.; Boisen, A. (2003). Microelect. Eng. 67-
68, 893-898. [17] Yang, Z.; Li, X.; Wang, Y.; Bao, H.; Liu, M. (2004). Microelect. J. 35, 479-483. [18] Chua, D. H. C.; Tay, B. K.; Zhang, P.; Teo, E. H. T.; Lim, L. T. W.; O’Shea, S.; Miao,
J.; Milne, W. I., (2004). Diamond & Related Materials 13, 1980-1983. [19] Mertens, J.; Finot, E.; Thundat, T.; Fabre, A.; Nadal, M.-H.; Eyraud, V.; Bourillot, E.,
(2003). Ultramicroscopy 97, 119-126. [20] Ansorge, E.; Schimpf, S.; Hirsch, S.; Sauerwald, J.; Fritze, H.; Schmidt, B. (2006).
Sensors and Actuators A, SNA-5130. [21] Hiroya, T.; Inagaki, K.; Tanda, S.; Tsuneta, T.; Yamaya, K., (2003). Physica B 329-
33, 1635-1637. [22] Lai, J.; Perazzo, T.; Shi, Z.; Majumdar, A., (1996). Proceedings of ASME Conference
on Micro-electro-mechanical Systems (MEMS), 55-60. [23] Datskos, P. G.; Oden, P. I.; Thundat, T.; Wachter, E. A.; Hunter, S. R., (1996). Appl.
Phys. Lett. 69, 2986-2988. [24] Oden, I.; Datskos, P. G.; Thundat, T.; Wachter, E. A., (1996). Appl. Phys. Lett. 69,
3277-3279. [25] Wachter, E. A.; Thundat, T.; Oden, P. I.; Warmack, R. J.; Datskos, P. G.; Sharp, S. L.,
(1996). Rev. Sc. Instrum. 67, 3434-3439. [26] Markidou, A.; Shih, W. Y.; Shih, W.-H., (2005). Rev. Sci. Instrum. 76, 064302-6. [27] Rasmussen, P. A.; Thaysen, J.; Hansen, O.; Eriksen, S. C.; Boisen, A., (2003).
Ultramicroscopy 97, 371-376. [28] Lemoine, P.; Zhao, J. F.; Bell, A.; Maguire, P.; McLaughlin, J., (2001). Diamond and
Related Materials 10, 94-98. [29] Naik, T.; Longmire, E. K.; Mantell, S. C., (2003). Sensors and Actuators A 102, 240-
254. [30] Chen, G. Y.; Warlock, R. J.; Huang, A.; Thundat, T., (1995). J. Appl. Phys. 78, 1465-
1469. [31] Ahmed, N.; Nino, D. F.; Moy, V. T., (2001). Rev. Sci. Instrum. 72, 2731-2734. [32] Shih, W. Y.; Li, X.; Gu, H.; Shih, W.-H.; Aksay, I.A., (2001). J. Appl. Phys. 89, 1497-
1505. [33] Sader, J. E., (1998). J. Appl. Phys. 84, 64-76. [34] Chu, W.-H., (1963). Tech. Rep. No. 2, DTMB, Contact NObs-86396(X), Southwest
Reseacrh Institute, San Antonio, Texas. [35] Bergaud, C.; Nicu, L., (2000). Rev. Sci. Instrum. 71, 2487-2491.

References Shengbo Sang
R - 3 -
[36] Goedeke, S. M.; Allison, S. W.; Datskos, P. G., (2004). Sensors and Actuators A, doi:10.1016/j.sna.2003.12.002.
[37] Shibata, T.; Unno, K.; Makino, E.; Shimada, S., (2004). Sensors and Actuators A,
doi:10.1016/j.sna.2003.11.025. [38] Jeon, Y. B.; Sood, R.; Jeong, J.-H.; Kim, S.-G., (2005). Sensors and Actuators A 122,
16-22. [39] Kanno, I.; Kotera, H.; Wasa, K., (2003). Sensors and Actuators A 107, 68-74. [40] Zhang, Q. Q.; Gross, S. J.; Tadigadapa, S.; Jackson, T. N.; Djuth, F. T.; Trolier-
McKinstry, S., (2003). Sensors and Actuators A 105, 91-97. [41] Cattan, E.; Haccart, T.; Vélu, G.; Rémiens, D.; Bergaud, C.; Nicu, L., (1999). Sensors
and Actuators 74, 60-64. [42] Itoh, T.; Lee, C.; Chu, J.; Suga, T., (1997). IEEE, 78-83. [43] Brissaud, M.; Ledren, S.; Gonnard, P., (2003). J. Micromech. Microeng. 13, 832- 844. [44] Davis, Z. J.; Abadal, G.; Helbo, B.; Hansen, O.; Campabadal, F.; Pérez-Murano, F.;
Esteve, J.; Figueras, E.; Ruiz, R.; Barniol, N.; Boisen, A., (20019. High mass and spatial resolution mass sensor based on resonating nano-cantilevers integrated with CMOS. The 11th International Conference on Solid-State Sensors and Actuators, Munich, Germany, June 10-14.
[45] Zurn, S.; Hsieh, M.; Smith, G.; Markus, D.; Zang, M.; Hughes, G.; Nam, Y.; Arik, M.;
Polla, D., (2001). Smart Mater. Struct. 10, 252-263. [46] Elmer F.-J.; Dreier, M., (1997). J. Appl. Phys. 81, 7709-7711. [47] Yaman, M., (2004). Materials and Design doi:10.1016/j.matdes.2004.10.009. [48] Teva, J.; Abadal, G.; Davis, Z. J.; Verd, J.; Borrise, X.; Boisen, A.; Pérez- Murano, F.;
Barniol, N., (2004). Ultramicroscopy 100, 225-232. [49] Passian, A.; Muraligharan, G.; Mehta, A.; Simpson, H.; Ferrel, T. L.; Thaundat, T.,
(2003). Ultramicroscopy 97, 391-399. [50] Li, X.; Shih, W. Y.; Vartuli, J.; Millus, D. L.; Prud’homme, R.; Aksay, I. A., (2002). J.
Appl. Phys. 92, 1-6. [51] Fabian, J.-H.; Scandella, L.; Fuhrmann, H.; Berger, R.; Mezzacasa, T.; Musil, C. H.;
Gobrecht, J.; Meyer, E., (2000). Ultramicroscopy 82, 69-77. [52] Abadal, G.; Davis, Z. J.; Borrise, X.; Hansen, O.; Boisen, A.; Barniol, N.; Perez-
Murano, F.; Serra, F., (2003). Ultramicroscopy 97, 127-133. [53] Davis, Z. J.; Abadal, G.; Hansen, O.; Borise, X.; Barniol, N.; Perez-Murano, F.;
Boisen, A., (2003). Ultramicroscopy 97, 467-472. [54] Adams, J. D.; Rogers, B.; Manning, L.; Hu, Z.; Thundat, T.; Cavazos, H.; Minne, S.
C., (2005). Sensors and Actuators A 121, 457-461. [55] Britton Jr., C. L.; Jones, R. L.; Oden, P. I.; Hu, Z.; Warmack, R. J.; Smith, S. F.;

Shengbo Sang References
R - 4 -
Bryan, W. L.; Rochelle, J. M., (2000). Ultramicroscopy 82, 17-21. [56] Maute, M.; Raible, S.; Prins, F. E.; Kern, D. P.; Ulmer, H.; Weimar, U.; Gopel, W.,
(1999). Sensors and Actuators B 58, 505-511. [57] Fadel, L.; Lochon, F.; Dufour, I.; Francais, O., (2004). J. Micromech. Microeng. 14,
S23-S30. [58] Battiston, F. M.; Ramseyer, J.-P.; Lang, H. P.; Baller, M. K.; Gerber, Ch.; Gimzewski,
J. K.; Meyer, E.; Guntherodt, H.-J., (2001). Sensors and Actuators B 77, 122-131. [59] Kim. B. H.; Prins, F. E.; Kern, D. P.; Raible, S.; Weimar, U., (2001). Sensors and
Actuators B 78, 12-18. [60] Betts, T. A.; Tipple, C. A.; Sepaniak, M. J.; Datskos, P. G., (2000). Analytica Chimica
Acta 422, 89-99. [61] Porter, T. L.; Eastman, M. P.; Macomber, C.; Delinger, W. G.; Zhine, R., (2003).
Ultramicroscopy 97, 365-369. [62] Lang, H. P.; Baller, M. K.; Berger, R.; Gerber, Ch.; Gimzewski, Battison, F. M.;
Fornaro, P.; Ramseyer, J. P.; Meyer, E.; Güntherodt, H.-J., (1999). Analytica Chimica Acta 393, 59-65.
[63] Headrick, J. J.; Sepaniak, M. J.; Lavrik, N. V.; Datskos, P. G., (2003). Ultrmicroscopy
97, 417-424. [64] Kooser, A.; Gunter, R. L.; Delinger, W. D.; Porter, T. L.; Eastman, M. P., (2004).
Sensors and Actuators B, doi: 10.1016/j.snb.2003.12.057. [65] Fabre, A.; Finot, E.; Demoment, J.; Contreras, S., (2003). Ultramicroscopy 97, 425-
432. [66] Chen, G. Y.; Warmack, R. J.; Thundat, T.; Allison, D. P., (1994). Rev. Sci. Instrum.
65, 2532-2537. [67] Zhou, J.; Li, P.; Zhang, S.; Long, Y.; Zhou, F.; Huang, Y.; Yang, P.; Bao, M., 2003.
Sensors and Actuators B 94, 337-342. [68] Zhou, J.; Li, P.; Zhang, S.; Huang, Y.; Yang, P.; Bao, M.; Ruan, G., (2003).
Microelectronic Engineering 69, 37-46. [69] Zhao, Q.; Zhu, Q.; Shih, W. Y.; Shih, W.-H., (2005). Sensors and Actuators B, doi:
10.10116/jsna.2005.10.048. [70] Pinnaduwage, L. A.; Thundat, T.; Gehl, A.; Wilson, S. D.; Hedden, D. L.; Lareau, R.
T., (2004). Ultramicroscopy 100, 211-216. [71] Pinnaduwage, L. A.; Thundat, T.; Hawk, J. E.; Hedden, D. L.; Britt, P. F.; Houser, E.
J.; Stepnowski, S.; McGill, R. A.; Budd, D., (2004). Sensors and Actuators B 99, 223-229.
[72] Alvarez, M.; Calle, A.; Tamayo, J.; Lechuga, L. M.; Abad, A.; Montoya, A., (2003).
Biosensors and Bioelectronics 18, 649-653. [73] Vidic, A.; Then. D.; Ziegler, C. H., (2003). Ultramicroscopy 97, 407-416.
References Shengbo Sang
R - 5 -
[74] Tamayo, J.; Humphris, A. D. L.; Malloy, A. M.; Miles, M. J., (2001). Ultramicroscopy 86, 167-173.
[75] Fagan, B. C.; Tipple, C. A.; Xue, Z.; Sepaniak, M. J.; Datskos, P. G., (2000). Talanta
53, 599-608. [76] Xu, X.; Thundat, T. G.; Brown, G. M.; Ji, H.-F., (2002). Anal. Chem. 74, 3611- 3615. [77] Boiabjiev, V. I.; Brown, G. M.; Pinnaduwage, L. A.; Goretzki, G.; Bonnesen, P. V.;
Thundat, T., (2005).. Langmuir 21, 1139-1142. [78] Ji, H.-F.; Thundat, T., (2002). Biosensors and Bioelectronics 17, 337-343. [79] Ji, H.-F.; Hansen, K. M.; Hu, Z.; Thundat, T., (2001). Sensors and Actuators B 72,
233-238. [80] Berger, R., Delamarche, E., Lang, H. P., Gerber, C., Gimzewski, J. K., Meyer, E. and
Guntherodt, H. J., (1997). Surface stress in the self-assembly of alkanethiols on gold, Science, 276 (5321), 2021-2024.
[81] Wu, G. H., Ji, H. F., Hansen, K., Thundat, T., Datar, R., Cote, R., Hagan, M. F., Chakraborty, A. K. and Majumdar, A., (2001). Origin of nanomechanical cantilever motion generated from biomolecular interactions, Proceedings of the National Academy of Sciences of the United States of America, 98 (4), 1560-1564.
[82] Marie, R., Jensenius, H., Thaysen, J., Christensen, C. B. and Boisen, A., (2002).
Adsorption kinetics and mechanical properties of thiol-modified DNA-oligos on gold investigated by microcantilever sensors, Ultramicroscopy, 91 (1-4), 29-36.
[83] Hansen, K. M., Ji, H. F., Wu, G. H., Datar, R., Cote, R., Majumdar, A. and Thundat,
T., (2001). Cantilever-based optical deflection assay for discrimination of DNA single-nucleotide mismatches, Analytical Chemistry, 73 (7), 1567-1571.
[84] Fritz, J., Baller, M. K., Lang, H. P., Rothuizen, H., Vettiger, P., Meyer, E., Guntherodt,
H. J., Gerber, C. and Gimzewski, J. K., (2000). Translating biomolecular recognition into nanomechanics, Science, 288 (5464), 316-318.
[85] Wu, G. H., Datar, R. H., Hansen, K. M., Thundat, T., Cote, R. J. and Majumdar, A.,
(2001). Bioassay of prostate-specific antigen (PSA) using microcantilevers, Nature Biotechnology, 19 (9), 856-860.
[86] Pinnaduwage, L. A., Boiadjiev, V., Hawk, J. E. and Thundat, T., (2003). Sensitive
detection of plastic explosives with self-assembled monolayer-coated microcantilevers, Applied Physics Letters, 83 (7), 1471-1473.
[87] Liu, F.; Zhang, Y.; Ou-Yang, Z., (2003). Biosensors and Bioelectronics 18, 655-660. [88] Kwak, K. J.; Kudo, H.; Fujihira, M., (2003). Ultramicroscopy 97, 249-255. [89] Marie, R.; Jensenius, H.; Thaysen, J.; Christensen, C. A.; Boisen, A., (2002).
Ultramicroscopy 91, 29-36. [90] Hansen, K. M.; Thundat, T., (2005). Methods 37, 57-64. [91] Lee, H. J.; Hwang, K. S.; Park, J.; Yoon, K. H.; Yoon, D. S.; Kim, T. S., (2005).
Biosensors and Bioelectronics 20, 2157-2162.

Shengbo Sang References
R - 6 -
[92] Wee, K. W.; Kang, G. Y.; Park, J.; Kang, J. Y.; Yoon, D. S.; Park, J. H.; Kim, T. S., (2004). Biosensors and Bioelectronics, doi: 10.1016/j.bios.2004.09.023.
[93] Moulin, A. M.; O’Sea, S. J.; Welland, M. E., (2000). Ultramicroscopy 82, 23-31. [94] Kooser, A.; Manygoats, K.; Eastmann, M. P.; Porter, T, L., (2003). Biosensors and
Bioelectronics 19, 503-508. [95] Takahara, A.; Hara, Y.; Kojio, K.; Kajiyama, T., (2002). Colliods and Surface B:
Biointerfaces 23, 141-152. [96] Lee, J. H.; Yoon, K. H.; Hwang, K. S.; Park, J.; Ahn, S.; Kim, T. S., (2004).
Biosensors and Bioelectronics 20, 269-275. [97] Gad, M.; Itoh, A.; Ikai, A., (1997). Cell Biology International 21, 697-706. [98] Bowen, W.R.; Lovitt, R.W.; Wright, C.J., (2001). Journal of Colloid and Interface
Science 237, 54-61. [99] Ikai, A.; Idiris, A.; Sekiguchi, H.; Arakawa, H.; Nishida, S., (2002). Applied Surface
Science 188, 506-512. [100] Stuart, J. K.; Hlady, V., (1999). Colliods and Surfaces B: Biointerfaces 15, 37-55. [101] Kim, H.; Arakawa, H.; Osada, T.; Ikai, A., (2003). Ultramicroscopy 97, 359-363. [102] Calleja, M.; Tamayo, J.; Johansson, A.; Rasmussen, P.; Lechuga, L. M.; Boisen, A.,
(2003). Sensor Letters 1, 20-24. [103] Kim, H.; Arakawa, H.; Osada, T,; Ikai, A., 2002. Applied Surface Science 188, 493-
498. [104] Raiteri, R.; Grattarola, M.; Butt, H.-J.; Skladal, P., (2001). Sensors and Actuators B
79, 115-126. [105] Ghatnekar-Nilsson, S.; Lindahl, J.; Dahlin, A.; Stjernholm, T.; Jeppesen, S.; Hook, F.;
Montelius, L., (2005). Nanotechnology 16, 1512-1516. [106] Zhang, J.; H.-F., Ji, (2004). Analytical Sciences 20, 585-587. [107] Gfeller, K.Y.; Nugaeva, N.; Hegner, M., (2004). Biosensors and Bioelectronics, doi:
10.1016/j.bios.004.11.018. [108] Yi, J. W.; Shih, W. Y.; Mutharasan, R.; Shih, W.-H., (2003). Journal of Applied
Physics 93, 1-7. [109] Gossett A. Campbell (2006). Detection and Quantification of Pathogens, Proteins,
and Molecules Using Piezoelectric-Excited Millimeter-Sized Cantilever (PEMC) Sensors, Drexel University, PH.D dissertation.
[110] Yue, M., Lin, H., Dedrick, D. E., Satyanarayana, S., Majumdar, A., Bedekar, A. S.,
Jenkins, J. W. and Sundaram, S., (2004). A 2-D microcantilever array for multiplexed biomolecular analysis, Journal of Microelectromechanical Systems, 13 (2), 290-299.
[111] Yue, M., (2004). Multiplexed Label-free Bioassays Based on Nanomechanics and
Nanofluidics, Ph.D dissertation, University of California, Berkeley.

References Shengbo Sang
R - 7 -
[112] Berger, R.; Delamarche, E.; Lang, H. P.; Gerber, C.; Gimzewski, J. K.; Meyer, E.; Guntherodt, H. J., (1998). Appl. Phys. A 66, S55-S59.
[113] Chen, G. Y.; Thundat, T.; Wachter, E. A.; Warmack, R. J., (1995). J. Appl. Phys. 77,
3618-3622. [114] Lang, H. P.; Baller, M. K.; Berger, R.; Gerber, C.; Gimzewski, J. K.; Battiston, F. M.;
Fornaro, P., Ramseyer, J. P., Meyer, E.; Guntherodt, H. J., (1995). Anal. Chim. Acta. 393, 59-65.
[115] Thundat, T.; Warmack, R. J.; Chen, G. Y.; Allison, D. P., (1994). Appl. Phys. Lett. 64,
2894-2896. [116] Thundat, T.; Chen, G. Y.; Warmack, R. J. Allison, D. P.; Wachter, E. A., (1995). Anal.
Chem. 67, 519-521. [117] Preissing, F. J., (1989). J. Appl. Phys. 66, 4262. [118] Chatzandroulis, S., Tegou, E., Goustouridis, D., Polymenakos, S. and Tsoukalas, D.,
(2004). Capacitive-type chemical sensors using thin silicon/polymer bimorph membranes, Sensors and Actuators B-Chemical, 103 (1-2), 392-396.
[119] Heim S, Schnieder I, Binz D, Vogel A, Bilitewski U (1999). Biosensors &
Bioelectronics 14, 187–193 [120] Rawson DM, Willmer AJ, Turner PF (1989). Biosensors 4:299– 311 [121] Peter J, Hutter W, Stöllnberger W, Hample W (1996). Biosensors & Bioelectronics 11,
1215–1219 [122] Reshetilov AN, Iliasov PV, Donova MV, Dovbnya DV, Boronin AM, Leathers TD,
Greene RV (1997). Biosensors & Bioelectronics 12,241–247 [123] Corbisier P, van der Lelie D, Borremans B, Provoost A, de Lorenzo V, Brown NL,
Lloyd JR, Hobman JL, Csöregi E, Johansson G, Mattiasson B (1999). Anal Chim Acta 387, 235–244
[124] Christiane Ziegler, Cell-based biosensors, Fresenius J Anal Chem (2000). 366, 552–
559 [125] Bousse, L. (1996). “Whole cell biosensors,” Sensors and Actuators B (Chemical),
B34(1-3), 270-5. [126] Pancrazio, J.J., Whelan, J.P., Borkholder, D.A., Ma, W. and Stenger, D.A., (1999).
Development and application of cell-based biosensors, Annals of Biomedical Engineering, 27(6), 697-711.
[127] McConnell, H.M., Owicki, J.C., Parce, J.W., Miller, D.L., Baxter, G.T., Wada, H.G. and
Pitchford, S., (1992). The cytosensor microphysiometer: biological applications of silicon technology, Science, 257(5078), 1906-12.
[128] Zysk, J.R. and Baumbach, W.R., (1998). Homogeneous pharmacologic and cell-
based screens provide diverse strategies in drug discovery: somatostatin antagonists as a case study, Combinatorial Chemistry High Throughput Screening, 1, 171-183.
[129] Keese, C.R. and Giaever, I., (1994). A biosensor that monitors cell morphology with

Shengbo Sang References
R - 8 -
electric fields, IEEE Engineering in Medicine and Biology, 13(3), 402-8. [130] Borkholder, D.A. (1998). Cell based biosensors using microelectrodes, Doctoral
Dissertation, Electrical Engineering, Stanford University, Stanford, CA. [131] Gross, G.W., Rhoades, B.K., Azzazy, H.M.E. and Wu, M., (1995). The use of
neuronal networks on multielectrode arrays as biosensors,” Biosensors & Bioelectronics, 10(6-7), 553-67.
[132] Thomas, C.A.J., Springer, P.A., Loeb, G.E., Berwald Netter, Y. and Okun, L.M.,
(1972). A miniature micro electrode array to monitor the bio electric activity of cultured cells, Experimental Cell Research, 74(1), 61-66.
[133] Gross, G.W., (1979). Simultaneous single unit recording in vitro with a photoetched
laser deinsulated gold multimicroelectrode surface, IEEE Transactions on Biomedical Engineering, 26(5), 273-279.
[134] Israel, D.A., Barry, W.H., Edell, D.J. and Mark, R.G., (1984). An array of
microelectrodes to stimulate and record from cardiac cells in culture, American Journal of Physiology, 247(4), H669-H674.
[135] B. Derek DeBusschere (2002). Portable Cell-Based Biosensors, Department of
Electrical Engineering, Stanford University, PH.D dissertation. [136] M. Manimaran, F.E.H Tay, K.C. Chaw (2006). Cell Deformation in Cancer Metastasis:
a BioMEMS Based Approach, Journal of Physics: Conference Series 34, 1143–1147 [137] Manz, A., Graber, N., and Widmer, H.M., (1990). Miniaturized Total Chemical
Analysis Systems: A Novel Concept for Chemical Sensing, Sensors and Actuators B, 1, 244–248.
[138] Shoji, S. and Esashi, M., (1994). Microflow Devices and Systems, Journal of
Micromechanics and Microengineering, 4, 157–171. [139] Gravesen, P., Brandebjerg, J., and Jensen, O.S., (1993). Microfluidics—A Review,
Journal of Micromechanics and Microengineering 3, 168–182. [140] Caton, P.F. and White, R.M., (2001). MEMS Microfilter with Acoustic Cleaning,
Proceedings of the 14th IEEE International Workshop on Micro-Electromechanical Systems MEMS ’01, Interlaken Switzerland, January 21–25, 479–482. IEEE, Piscataway, NJ.
[141] Desai, T.A. et al., (1999). Nanopore Technology for Biomedical Applications,
Biomedical Microdevices 2(1), 11–40. [142] Nguyen, N.T. et al., (2000). Integrated Thermal Flow Sensor for In-Situ Measurement
and Control of Acoustic Streaming in Flexural-Plate-Wave Pumps, Sensors and Actuators A 79(2), 115–121.
[143] Deshmukh, A.A., Liepmann, D., and Pisano A.P. (2000). Continuous Micromixer with
Pusatile Micropumps, Proceedings 2000 Solid State Sensor and Actuator Workshop, Hilton Head, SC., June 4–8, 73–76. Transducers Research Foundation, San Diego, CA.
[144] Zahn, J.D. et al., (2004). Continuous on Chip Micropumping for Microneedle
Enhanced Drug Delivery, Biomedical Microdevices 6, 3, 183–190.

References Shengbo Sang
R - 9 -
[145] Luginbuhl, P. et al., (1999). Micromachined Injector for DNA Mass Spectrometry, Proceedings of Transducers ’99 The 10th International Conference on Solid-State Sensors and Actuators, Sendai Japan, June 7–10, 1130–1133. Institute of Physics Publ., Philadelphia, PA.
[146] Simpson, P.C., Woolley, A.T., and Mathies, R.T., (1998). Microfabrication Technology
for the Production of Capillary Array Electrophoresis Chips, Biomedical Microdevices 1, 7–25.
[147] Matthew A. Cooper (2002). NATURE REVIEWS: DRUG DISCOVERY, VOLUME 1,
515 [148] Liedberg, B., Nylander, C. and Lundstrom, I., (1983). Surface-Plasmon Resonance
for Gas-Detection and Biosensing, Sensors and Actuators, 4 (2), 299-304. [149] Nylander, C., Liedberg, B. and Lind, T., (1982). Gas-Detection by Means of Surface-
Plasmon Resonance, Sensors and Actuators, 3 (1), 79-88. [150] Matthew A. Cooper (2002). Optical biosensors in drug discovery, Nature Reviews
Drug Discovery 1, 515-528. [151] Aebersold, R. and Mann, M., (2003). Mass spectrometry-based proteomics, Nature,
422 (6928), 198-207. [152] H. Wohltjen et al. (1997). Acoustic Wave Sensor—Theory, Design, and Physico-
Chemical Applications, Academic Press, San Diego:39 [153] Suzuki, H., (2000). Advances in the microfabrication of electrochemical sensors and
systems, Electroanalysis, 12 (9), 703-715. [154] Hansen, K. M., Ji, H. F., Wu, G. H., Datar, R., Cote, R., Majumdar, A. and Thundat,
T., (2001). Cantilever-based optical deflection assay for discrimination of DNA single-nucleotide mismatches, Analytical Chemistry, 73 (7), 1567-1571.
[155] Binning, G.; Quate, C. F.; Gerver, Ch., (1986). Phys. Rev. Lett. 930-935. [156] M. Godin, O. Laroche, V. Tabard-Cossa, L. Y. Beaulieu, P. Grütter, and P. J.
Williams, (2003). Review of Scientific Instruments 74, 4902. [157] Fritz, J., Baller, M. K., Lang, H. P., Rothuizen, H., Vettiger, P., Meyer, E., Guntherodt,
H. J., Gerber, C. and Gimzewski, J. K., (2000). Translating biomolecular recognition into nanomechanics, Science, 288 (5464), 316-318.
[158] Baselt D. R., Lee G. U., Colton R. J., (1996). J. Vac. Sci. Technol. B 14, 798-803. [159] D. Rugar, H. J. Mamin, and P. Güthner; (1989). Applied Physics Letters 55, 2588. [160] A. Moser, H. J. Hug, Th. Jung, U. D. Schwarz, and H.-J. Güntherodt, (1993). Meas.
Sci. Technol. 4, 769-775. [161] R. Raiteri, H.-J. Butt and M. Grattarola (2000). Electrochem. Acta 46, 157–163. [162] Marie, R., Jensenius, H., Thaysen, J., Christensen, C. B. and Boisen, A. (2002).
Adsorption kinetics and mechanical properties of thiol-modified DNA-oligos on gold investigated by microcantilever sensors, Ultramicroscopy, 91 (1-4), 29-36.

Shengbo Sang References
R - 10 -
[163] R.G. Knobel and A.N. Cleland, (2003). Nature 424, 291. [164] Macbeath, G. and Schreiber, S. L., (2000). Printing proteins as microarrays for
highthroughput function determination, Science, 289 (5485), 1760-1763. [165] H. Masahiko, T. Kazuhiko, N. Riichiro, F. S. Norman and J. K. Gregory, (2000). J.
Chromatogr., A, 867, 271–279. [166] Y. Xu, F. G. Bessoth, J. C. T. Eijkel and A. Manz, (2000). Analyst, 125, 677–683. [167] X. J. Huang, Q. Pu and Z. L. Fang, (2001). Analyst, 126, 281–284. [168] K. Tsukagoshi, M. Hashimoto, R. Nakajima and A. Arai, (2000). Anal. Sci., 16, 1111–
1113. [169] Z. Zhang and W. Qin, (1996). Talanta, 43, 119–124. [170] B. Li and Z. Zhang, (2000). Sens. Actuators, B, 69, 70–74. [171] G. J. Zhou, G. Wang, J. J. Xu and H. Y. Chen, (2002). Sens. Actuators, B, 81, 334–
339. [172] M. C. Ramos, M. C. Torijas and A. Navas Diaz, (2001). Sens. Actuators, B, 73, 71–
75. [173] Y. Huang, C. Zhang and Z. Zhang, (1999). Anal. Sci., 15, 867–870. [174] B. Li, Z. Zhang and Y. Jin, (2001). Anal. Chem., 73, 1203–1206. [175] Schweitzer, B., Predki, P. and Snyder, M., (2003). Microarrays to characterize protein
interactions on a whole-proteome scale, Proteomics, 3 (11), 2190-2199. [176] Freshney, R.I., (1994). Culture of animal cells: a manual of basic technique, 3rd ed.,
Wiley-Liss, NewYork, NY. [177] Spier, R.E. and Griffiths, B., (1985). Animal Cell Biotechnology I, Academic Press,
London, England, UK. [178] Gross, G.W., (1979). Simultaneous single unit recording in vitro with a photoetched
laser deinsulated gold multimicroelectrode surface, IEEE Transactions on Biomedical Engineering, 26(5), 273-279.
[179] Pine, J., (1980). Recording action potentials from cultured neurons with extracellular
microcircuit electrodes, Journal of Neuroscience Methods, 2(1), 19-31. [180] Borkholder, D.A., (1998). Cell based biosensors using microelectrodes, Doctoral
Dissertation, Electrical Engineering, Stanford University, Stanford, CA. [181] Brewer, G.J. and Price, P.J., (1996). Viable cultured neurons in ambient carbon
dioxide and hibernation storage for a month, Neuroreport, 7(9),1509-1512. [182] Hornung, J., Muller, T. and Fuhr, G., (1996). Cryopreservation of anchorage-
dependent mammalian cells fixed to structured glass and silicon substrates, Cryobiology, 33(2), 260-270.

References Shengbo Sang
R - 11 -
[183] Israel, D.A., Barry, W.H., Edell, D.J. and Mark, R.G., (1984). An array of microelectrodes to stimulate and record from cardiac cells in culture, American Journal of Physiology, 247(4), H669-H674.
[184] Willmer, E.N., (1965). Cells and Tissues in Culture: Methods, Biology, and
Physiology, Academic Press, London, England, UK. [185] Flieschaker, R.J. and Sinskey, A.J., (1981). Oxygen demand and supply in cell
culture, European Journal of Applied Microbiology and Biotechnology, 12,193-197. [186] Vandor, A.J., Sherman, J.H. and Luciano, D.S., (1994). Human physiology, the
mechanisms of body function, McGraw-Hill, Inc., San Francisco, CA. [187] Spier, R.E. and Griffiths, B., (1982). An examination of the data and concepts
germane to the oxygenation of cultured animal cells, Developments in Biological Standardization, 55, 81-92.
[188] Browser, R.W., (1961). The effect of oxygen tension on the growth and metabolism of
a mammalian cell, Experimental Cell Research, 25,101-113. [189] H. Ibach, (1997). Surface Science Reports 29, 193. [190] W. Haiss (2001). Reports on Progress in Physics 64, 591. [191] R. Berger, E. Delamarche, H. P. Lang, Ch. Gerber, J. K. Gimzewski, E. Meyer, and
H.-J. Güntherodt, (1997). Science 276, 2021. [192] C. E. Bach, M. Giesen, and H. Ibach, (1997). Physical Review Letters 78, 4225. [193] U. Tartaglino, E. Tosatti, D. Passerone, and F. Ercolessi, (2002). Physical Review B
65, 241406. [194] R. M. Tromp, A. W. Denier van der Gon, and M. C. Reuter; (1992). Physical Review
Letters 68, 2313. [195] K. Pohl, M. C. Bartelt, J. de la Figuera, N. C. Bartelt, J. Hrbek, and R. Q. Hwang,
(1999). Nature 397, 238. [196] D. K. Schwartz, (2001). Annual Review of Physical Chemistry 52, 107. [197] F. Schreiber (2000). Progress in Surface Science 65, 151. [198] G. E. Poirier, (1997). Chemical Reviews 97, 1117. [199] K. L. Prime, and G. M. Whitesides, (1993). Journal of the American Chemicqal
Society 115, 10714. [200] P. A. DiMilla, J. P. Folkers, H. A. Biebuyck, R. Haerter, G. P. Lopez, G. M.
Whitesides, (1994). Journal of the American Chemical Society 116, 2225. [201] J. Fritz; M. K. Baller; H. P. Lang; H. Rothuizen; P. Vettiger; E. Meyer; H.-J.
Güntherodt (2000). Ch. Gerber; and J. K. Gimzewski; Science 288, 316. [202] J. Fritz; M. K. Baller; H. P. Lang; T. Strunz; E. Meyer; H.-J. Güntherodt; E.
Delamarche, (2000). Ch. Gerber; and J. K. Gimzewski; Langmuir 16, 9694.

Shengbo Sang References
R - 12 -
[203] F. Frederix, K. Bonroy, W. Laureyn, G. Reekmans, A. Campitelli, W. Dehaen, and G. Maes, (2003). Langmuir 19, 4351.
[204] M. Alvarez, A. Calle, J. Tamayo, L. M. Lechuga, A. Abad, and A. Montoya, (2003).
Biosensors and Bioelectronics 18, 649. [205] H. Kondoh; C. Kodama; H. Sumida; and H. Nozoye, (1999). Journal of Chemical
Physics 111, 1175. [206] Wendong Zhang et al, (2005). Micromachined Transducers Sourcebook, Science
Press, ISBN:7030105656. [207] V. A. Gridchin, V. V. Grichenko, and V. M. Lubimsky, (2005). Square-Membrane
Deflection and Stress: Identifying the Validity Range of a Calculation Procedure, Russian Microelectronics 34(3), 173–180.
[208] S. Satyanarayana, et al., (2006). Parylene micro membrane capacitive sensor array
for chemical and biological sensing, Sensors and Actuators B, 115(1), 494-502. [209] S.L. Peterson, A. McDonald, P.L. Gourley, D.Y. Sasaki, (2005). J. Biomed. Mater.
Res., Part A 72(1), 10–18. [210] E. Ostuni, R. Kane, C.S. Chen, D.E. Ingber, G.M. Whitesides, (2000). Langmuir 16,
7811–7819. [211] M.N. De Silva, R. Desai, D.J. Odde, (2004). Biomedical Devices 6(3), 219– 222. [212] J.L. Tan, J. Tien, D.M. Pirone, D.S. Gray, K. Bhadriraju, C.S. Chen, (2003). Proc.
Natl. Acad. Sci. U.S.A. 100(4), 1484–1489. [213] O. du Roure, A. Saez, A. Buguin, R.H. Austin, P. Chavrier, P. Siberzan, B. Ladoux,
(2005). Proc. Natl. Acad. Sci. U.S.A. 102(7), 2390–2395. [214] X.Q. Brown, K.Ookawa, J.Y.Wong, (2005). Biomaterials 26, 3123–3129. [215] Armani, D. et al., (1999). Re-configurable fluid circuits by PDMS elastomer
micromachining, Beckman Institute, University of Illinois. [216] Hughes, L., (1990). Handbook of Polymer Coatings for Electronics, Noyes
Publications, New Jersay. [217] Lötters, J.C. et al., (1997). The mechanical properties of the rubber elastic polymer,
polydimethylsiloxane for sensor applications, MESA Research Institute, Enschede. [218] Wilbur, J.L. et al., (1996). Microcontact printing of self-assembled monolayers:
applications in microfabrication, Department of Chemistry, Harvard University, Cambridge, USA.
[219] Mark, J., (1999). Polymer Data Handbook, Oxford University Press, New York. [220] Dow Corning Corporation, (2005). Material Safety Data Sheet SYLGARDr 184
Silicon, Elastomer Kit, Michigan. [221] J. Garra, T. Long, J. Currie, T. Schneider, R. White, M. Paranjape, (2002). Dry
Etching of Polydimethylsiloxane for Microfluidic Systems”, Journal of Vacuum Science and Technology, A20, pp 975-982.

References Shengbo Sang
R - 13 -
[222] Polymer Data Handbook; Belanger MC, Marois Y. (2001). Hemocompatibility, biocompatibility, inflammatory and in vivo studies of primary reference materials low-density polyethylene and polydimethylsiloxane: a review. J Biomed Mater Res, 58(5), 467–77.
[223] J. Cheng, M. A. Shoffner, K. R. Mitchelson, L. J. Kricka, and P. Wilding, (1996).
Analysis of ligase chain reaction products amplified in a silicon–glass chip using capillary electrophoresis, J. Chromatogr. A, 732(1), 151–158.
[224] M. A. Shoffner, J. Cheng, G. E. Hvichia, L. J. Kricka, and P. Wilding, (1996). Chip
PCR. I. Surface passivation of microfabricated silicon–glass chips for PCR, Nucleic Acids Res., 24(2), 375–379.
[225] J. Cheng, M. A. Shoffner, G. E. Hvichia, L. J. Kricka, and P. Wilding, (1996). Chip
PCR. II. Investigation of different PCR amplification systems in microfabricated silicon–glass chips,” Nucleic Acids Res., 24(2), 380–385.
[226] D. J. Harrison, A. Manz, Z. Fan, H. Luedi, and H. M. Widmer, (1992). Capillary
electrophoresis and sample injection systems integrated on a planar glass chip, Anal. Chem., 64(17), 1926–1932.
[227] C. S. Effenhauser, A. Manz, and H. M. Widmer, (1993). Glass chips for highspeed
capillary electrophoresis separations with submicrometer plate heights, Anal. Chem., 65(19), 2637–2642.
[228] K. Seiler, D. J. Harrison, and A. Manz, (1993). Planar glass chips for capillary
electrophoresis: Repetitive sample injection, quantitation, and separation efficiency, Anal. Chem., 65(10), 1481–1488.
[229] Z. H. Fan and D. J. Harrison, (1994). Micromachining of capillary electrophoresis
injectors and separators of glass chips and evaluation of flow at capillary intersections,” Anal. Chem., 66(1), 177–184.
[230] L. Rebenklau, K.-J. Wolter, and S. Howitz, (2000). Realization of hybrid microfluidic
systems using standard LTCCprocess,” in Proc. 50thElectr on. Compon. Technol. Conf., Las Vegas, NV, pp. 1696–1700.
[231] J. C. McDonald, D. C. Duffy, J. R. Anderson, D. T. Chiu, H. Wu, O. J. Schueller, and
G. M. Whitesides, (2000) Fabrication of microfluidic systems in poly(dimethylsiloxane), Electrophoresis, vol. 21, no. 1, pp. 27–40.
[232] H. Becker and C. Gartner, (2000). Polymer microfabrication methods for microfluidic
analytical applications, Electrophoresis, vol. 21, no. 1, pp. 12–26. [233] J. S. Ko, H. C. Yoon, H. Yang, H. B. Pyo, K. H. Chung, S. J. Kim, and Y. T. Kim,
(2003). A polymer-based microfluidic device for immunosensing biochips, Lab Chip, vol. 3, no. 2, pp. 106–113.
[234] J. Zhang, K. L. Tan, G. D. Hong, L. J. Yang, and H. Q. Gong, (2001). Polymerization
optimization of SU-8 photoresist and its applications in microfluidic systems and MEMS, J. Micromech. Microeng., vol. 11, no. 1, pp. 20–26.
[235] Freitag A, Vogel D, Scholz R, Dietrich TR, (2001). Microfluidic devices made of glass.
J Assoc Lab Autom 6(4):45–49.
Shengbo Sang References
R - 14 -
[236] Daridon A, Fascio V, Lichtenberg J, Wu¨ trig R, Langen H, Verpoorte E, de Rooij N, (2001). F Multi-layer microfluidic glass chips for microanalytical applications. Fresenius J Anal Chem 371:261–269.
[237] Petersen D, Mogensen KB, Klank H, (2004). Glass micromachining. In: Geschke O,
Klank H, Tellemann P (eds) Microsystem engineering of lab-on-a-chip devices, Chap 7. Wiley-VCH, New York, p 161.
[238] Petersen K E, (1982). Silicon as a mechanical material Proc. IEEE 70 420–57. [239] Kovacs G T A, (1998). Micromachined Transducers Sourcebook (Boston, MA:
McGraw-Hill). [240] Madou M, (1997). Fundamentals of Microfabrication (Boca Raton, FL: Chemical
Rubber Company). [241] Barth P, (1990). Silicon fusion bonding for fabrication of sensors, actuators, and
microstructures Sensors Actuators A 21–23, 919–26. [242] Wallis G and Pomerantz D I, (1969). Field assisted glass–metal sealing J. Appl. Phys.
40, 3946–9. [243] Cohn M B, Yiching Liang, Howe R T and Pisano A P, (1996). Wafer-to-wafer transfer
of microstructures for vacuum packaging Technical Digest Solid-State Sensor and Actuator Workshop (Hilton Head Island, SC, 1996) pp 32–5.
[244] Mass D, B¨ustgens B, Fehrenberg J, Keller W, Ruther P, Schomburg W K and Seidel
D, (1996). Fabrication of microcomponents using adhesive bonding techniques Proc. IEEE Int. Workshop on Microelectro-mechanical Systems (San Diego, CA, 1996) pp 331–6.
[245] Smith Emily, (2005). fabrication of picoliter microreator with multilayer elastomer
valves (Bachelor thesis), Massachusetts Institute of Technology, Dept. of Mechanical Engineering.
[246] J.C. Lotters y, W. Olthuis, P.H. Veltink, P. Bergveld, (1997). J. Micromechanics
Microengineering 7, 145–147. [247] Abel L. Thangawng, Rodney S. Ruoff, Melody A. Swartz, Matthew R. Glucksberg,
(2007). An ultra-thin PDMS membrane as a bio/micro–nanointerface: fabrication and characterization, Biomed Microdevices 9, 587–595.
[248] Schmidt, M. A., (1998). Wafer-to-Wafer Bonding for Microstructure Formation,
Proceedings of the IEEE. [249] Kovacs, G. T. A., (1998). Micromachined Transducers Sourcebook, ed.,The McGraw-
Hill Companies, Inc., New York. [250] Duffy, D. C., Mcdonald, J. C., Schueller, O. J. A. and Whitesides, G. M., (1998).
Rapid prototyping of microfluidic systems in poly(dimethylsiloxane), Analytical Chemistry, 70 (23), 4974-4984.
[251] Liu, J., Enzelberger, M. and Quake, S., (2002). A nanoliter rotary device for
polymerase chain reaction, Electrophoresis, 23(10), 1531-1536. [252] Wolffenbuttel, R. F. and Wise, K. D., (1994). Low-Temperature Silicon Wafer-to-

References Shengbo Sang
R - 15 -
Wafer Bonding Using Gold at Eutectic Temperature, Sensors and Actuators a-Physical, 43(1-3), 223-229.
[253] Lin, L. W., (2000). MEMS post-packaging by localized heating and bonding, Ieee
Transactions on Advanced Packaging, 23 (4), 608-616. [254] Lin, L. W., (2003). Thermal challenges in MEMS applications: phase change
phenomena and thermal bonding processes, Microelectronics Journal, 34(3), 179-185.
[255] Cheng, Y. T., Lin, L. W. and Najafi, K., (2000). Localized silicon fusion and eutectic
bonding for MEMS fabrication and packaging, Journal of Microelectromechanical Systems, 9(1), 3-8.
[256] Noh, H. S., Moon, K. S., Cannon, A., Hesketh, P. J. and Wong, C. P., (2004). Wafer
bonding using microwave heating of parylene intermediate layers, Journal of Micromechanics and Microengineering, 14(4), 625-631.
[257] Milligan, D. E.; Jacox, M. E. (1971), "Infrared Spectrum and Structure of
Intermediates in Reaction of OH with CO". Journal of Chemical Physics 54(3): 927 – 942.
[258] Jeevarajan, A. S.; Carmichael, I.; Fessenden, R. W. (1990) , "ESR Measurement of
the pKa of Carboxyl Radical and Ab Initio Calculation of the C-13 Hyperfine Constant". Journal of Physical Chemistry 94(4): 1372 – 1376.
[259] Vanderah, D. J.; Meuse, C. W.; Silin, V.; Plant, A. L., (1998). Langmuir 14, 6916-
6923. [260] Harder, P.; Grunze, M.; Dahint, R.; Whitesides, G. M.; Laibinis, P. E., (1998). J. Phys.
Chem. B 102, 426-436. [261] Frutos, A. G.; Brockman, J. M.; Corn, R. M., (2000). Langmuir 16, 2192-2197. [262] Pale-Grosdemange, C.; Simon, E. S.; Prime, K. L.; Whitesides, G. M., (1991). J. Am.
Chem. Soc. 113, 12-20. [263] Nakano, K.; Sato, T.; Tazaki, M.; Takagi, M., (2000). Langmuir 16, 2225-2229. [264] Kawaguchi, T.; Yasuda, H.; Shimazu, K.; Porter, M. D., (2000). Langmuir 16, 9830-
9840. [265] Bruce Alberts, Alexander Johnson, Julian Lewis, Martin Rafi Keith Roberts, and Peter
Walter, (2008). Book “Molecular Biology of the Cell”, Garland science, Taylor & Francis Group, LLC, USA.
[266] J. Amelia Feulner, (2003). Identification of Acyloxyacyl Hydrolase, a
Lipopolysaccharide-Detoxifying Enzyme, In the Murine Urinary Tract, PhD dissertation.
[267] Lakshminarayana Polavarapu and Qing-Hua Xu, (2008). A single-step synthesis of
gold nanochains using an amino acid as a capping agent and characterization of their optical properties, Nanotechnology 19, 075601 (6pp).
[268] Haiying Zhao, Bo Yuan and Xiaoming Dou, (2004). The effects of electrostatic
interaction between biological molecules and nano-metal colloid on near-infrared

Shengbo Sang References
R - 16 -
surface-enhanced Raman scattering, J. Opt. A: Pure Appl. Opt. 6, 900–905 [269] S. Margel, E. A. Vogler, L. Firment, T. Watt, S. Haynie, and D. Y.Sogah, (1993).
Peptide, protein, and cellular interactions with self-assembled monolayer model surfaces, Journal of Biomedical Materials Research, 27, 1463-1476.
[270] Aline Cerf, Jean-Christophe Cau, Christophe Vieu, and Etienne Dague, (2009).
Nanomechanical Properties of Dead or Alive Single-Patterned Bacteria, Langmuir 25(10), 5731–5736.
[271] Grace T McKee, (1997). Book:“Cytopathology”, Mosby-wolfge. [272] A. Raz and B. Geiger, (1982). Cancer Res., 42, 5183. [273] J. B. Wyckoff, J. G. Jones, J. S. Condeelis and J. E. Segall, (2000). Cancer Res., 60,
2504. [274] G. Y. H. Lee and C. T. Lim, (2004). Microbiol.Mol. Biol. Rev., 68, 538. [275] J. Guck, S. Schinkinger, B. Lincoln, F. Wottawah, S. Ebert, M. Romeyke, D. Lenz, H.
M. Erickson, R. Ananthakrishnan, D. Mitchell, J. Kas, S. Ulvick and C. Bilby, (2005). Biophys. J., 88, 3689.
[276] A. C. De Luca, G. Volpe, A. M. Drets, M. I. Geli, G. Pesce, G. Rusciano, A. Sasso
and D. Petrov, (2007). Opt. Express, 15, 7922. [277] S. Suresh, (2007). Acta Biomater., 3, 413. [278] Lee, K. J., Fosser, K. A., & Nuzzo, R. G. (2005). “Fabrication of stable metallic
patterns embedded in poly(dimethylsiloxane) and model applications in non-planar electronic and lab-on-a-chip device patterning.” Advanced Functional Materials, 15(4), 557-566.
Own publications cited in this dissertation thesis: [P1] Shengbo Sang and Hartmut Witte, (2009). Finite Element Analysis of the Membrane
Used in a Novel BioMEMS, Journal of Biomimetics, Biomaterials and Tissue Engineering, 3:51-57.
[P2] Shengbo Sang and Hartmut Witte, (2010). Fabrication of a surface stress-based PDMS
micro-membrane biosensor, Journal of Microsystem Technologies, 16:1001–1008. [P3] Shengbo Sang and Hartmut Witte, (2010). A novel PDMS micro membrane biosensor
based on the analysis of surface stress, Journal of Biosensors and Bioelectronics 25:2420 –2424.

References Shengbo Sang
R - 17 -
Web sources [W1] —— [W6]
are documented on the attached DVD in the version last read and cited.
[W1] http://www.biosensingusa.com/Application101.html (Citation is last updated in 2010.)
[W2] http://www.ilpi.com/msds/ref/evaporationrate.html (28 April 2010)
[W3] http://www.bio-medicine.org/biology-technology/Optimizing-B-26uuml-3Bchi-26reg-3B-
Rotary-Evaporator-Applications-481-0/ (2009)
[W4] http://en.wikipedia.org/wiki/Lipopolysaccharide (15 September 2010, 07:16)
[W5] http://employees.csbsju.edu/HJAKUBOWSKI/classes/ch331/cho/complexoligosacch.ht
m (26 August 2010)
[W6] http://en.wikipedia.org/wiki/Chemical_bond (30 September 2010, 09:27)

Shengbo Sang References
R - 18 -

- 1 -
Thesen zur Dissertation
1. The biosensor technologies are a heavily researched area, ranging from diagnostics of cells, DNA and protein, to novel materials for biosensors, tissue engineering, surface modification, systems for drug delivery. The biosensor platform technology will enable various protocols for disease diagnostic and drug research.
2. “Surface stress-based biosensors” are a relatively new class of biosensors, which
make use of the free energy change, the underlying concept in any binding reaction, and hence offer a universal platform for biological or chemical sensing.
3. The surface stress will change due to the alternation of cells structure based on
the theory of biochemistry. It is well known that the contents and structures of the cytoskeleton defining a cell’s shape can be transformed by cancer. In addition to cancer, cytoskeleton alterations have close relations with several diseases, including circulatory problems, blood diseases (malaria, anemia, and hereditary spherocytosis), motor neuron diseases (sclerosis), and aging related diseases (Alzheimer). Generally, cancer cells exhibit lower elasticity and viscosity, and higher deformability than normal cells. The cytoskeleton of cancer cells shows fewer filamentous actin, intermediate filaments and microtubules, and appears more irregular and compliant than that of normal cells. With surface stress-based biosensors, the properties of different kinds of bio-analytes (like cells, DNA and other molecules) can be analyzed according to the change of membrane deflection induced by the alternation of surface stress.
4. Polydimethylsiloxane (PDMS) material has lower stiffness than silicon, aluminium
nitride, silicon nitride and polymethylmethacrylate (PMMA) which are normal used as the membrane material. Furthermore, the Young’s modulus of bulk PDMS usually falls within 12 kPa – 2.5 MPa depending on the processing conditions. PDMS additionally owns the characteristic of biocompatibility and ease of processing.
5. By successfully conquering many challenges in design and fabrication, like
integration of PDMS processing with conventional microfabrication processes, fabrication of “perfect” PDMS thin films and release of PDMS membranes, the biosensors were fabricated. Furthermore, the bonding technology, uncured PDMS as the intermediate layer method for the bond between PDMS micro membrane biosensors and microfluidic devices or components, was studied and tested and the bond strength is close to that of bulk PDMS.
6. The biosensor consists of two micro membranes. One can act as active
membrane and the other as reference. The active membrane is sensitized to react to specific analytes, such as Escherichia coli (E. coli). Conditions analytes do not present on the reference membrane, it is only used to detect other environmental factors that can also provoke a deflection of the active membrane. This design allows very sensitive surface stress measurements associated with specific analytes interactions on the active membrane’s surface.

- 2 -
7. Interferometry is an important investigative technique in the fields of optical metrology, engineering metrology, fiber optics, remote sensing, and so on. A deflection in the range of 10-11 m to 10-13 m can theoretically be measured using interferometry. Two biosensor test systems were built based on a smart white light interferometer (smartWLI) and a fiber optic interferometer (FOI), respectively. The smartWLI-based biosensor test system has a high spatial resolution (1 nm) and can read deflection signal nanometer-accurately and directly. The FOI-based biosensor test system has a better time resolution (< 0.5 sec.) and is able to monitor the deflection signal continuously.
8. Three alkanethiol molecules with different functional end groups [11 Mercapto 1
undecanoicacid (MUA: SH-(CH2)10-COOH), 11 Mercapto 1 undecanol (MUO: SH- (CH2)11-OH) and Dodecane thiol (DOT: SH-(CH2)11-CH3)] were tested as the membrane coating layer for E. coli detection. The results of the experiments showed that the MUA is a better functional material to functionalize the biosensor membranes than MUO and DOT. Components of the status of E. coli can be measured based on the surface stress analysis.

- 3 -
Promotionsordnung – Allgemeine Bestimmungen –
Erklärung gemäß Anlage 1 der Promotionsordnung Ich versichere, dass ich die vorliegende Arbeit ohne unzulässige Hilfe Dritter und ohne Benutzung anderer als der angegebenen Hilfsmittel angefertigt habe. Die aus anderen Quellen direkt oder indirekt übernommenen Daten und Konzepte sind unter Angabe der Quelle gekennzeichnet. Bei der Auswahl und Auswertung folgenden Materials haben mir die nachstehend aufgeführten Personen in der jeweils beschriebenen Weise entgeltlich/unentgeltlich geholfen: 1. Dr. Arne Albrecht, Dipl.-Ing. Lars Dittrich and other colleagues in the Center for Micro- and Nanotechnologies (ZMN) provided me some technological help and support for the fabrication. 2. Prof. Dr. Michael Köhler, Dipl.- Ing. Jialan Cao and Dipl.-Ing. Steffen Schneider in the Department of Physical Chemistry and Microreaction Technology not only provided me free the functional chemical material and the media with E.coli, but also a lot of technological advices and support. 3. Dipl.-Ing. Daniel Kapusi and Dipl.-Ing. Torsten Machleidt in Department of Computer Sciences and Automation, and Gesellschaft für Bild- und Signalverarbeitung (GBS) mbH, Ilmenau Germany, provided me the free use of smart white light interferometer system and technological support. Weitere Personen waren an der inhaltlich-materiellen Erstellung der vorliegenden Arbeit nicht beteiligt. Insbesondere habe ich hierfür nicht die entgeltliche Hilfe von Vermittlungs- bzw. Beratungsdiensten ( Promotionsberater oder anderer Personen ) in Anspruch genommen. Niemand hat von mir unmittelbar oder mittelbar geldwerte Leistungen für Arbeiten erhalten, die im Zusammenhang mit dem Inhalte der vorgelegten Dissertation stehen. Die Arbeit wurde bisher weder im In- noch im Ausland in gleicher oder ähnlicher Form einer Prüfungsbehörde vorgelegt. Ich bin darauf hingewiesen worden, dass die Unrichtigkeit der vorstehenden Erklärung als Täuschungsversuch angesehen wird und den erfolglosen Abbruch des Promotionsverfahrens zu Folge hat. Ilmenau, den 15. Juni 2010
Sang Shengbo M. Eng.