an approach to a process intensification by combination of ... · microwave assisted heterogeneous...
TRANSCRIPT
An approach to a process intensification by combination of
microwave assisted heterogeneous catalysis and polymer/glass
monolithic microreactors
D i s s e r t a t i o n
zur Erlangung des Grades eines Doktors
der Ingenieurwissenschaften
vorgelegt von
Dipl.-Ing. Raúl Cecilia
aus
Valencia
genehmigt von der
Fakultät für Mathematik, Informatik und Maschinenbau
der Technischen Universität Clausthal,
Tag der mündlichen Prüfung
20.07.2007
Vorsitzende/Vorsitzender der Promotionskommission
Prof. Dr.-Ing. Volker Wesling
Hauptberichterstatterin/Hauptberichterstatter
Prof. Dr.-Ing. Ulrich Kunz
Berichterstatterin/Berichterstatter
Prof. Dr.-Ing. Thomas Turek

Una mision tiene un jedai en la vida: aceptar que lo vivido no es mas que la antesala
para aceptar lo próximo que venga
Ruleuan Kenobi
(esta odisea me la dedico a mi mismo)


Acknowledgements I
Acknowledgements First of all I would like to give my special thanks to Prof. Dr.-Ing. Ulrich Kunz. Thanks for relying on myself and giving me the opportunity to develop myself as a scientist and as a person. Without his personal and scientific support this work would have not been possible. As well I would like to gratefully acknowledge Prof. Dr.-Ing Thomas Turek for the fruitful scientific discussion especially in the field of mathematical modelling and of course for accepting the responsibility to be the second supervisor of my work. Here I would like to acknowledge the Deutschen Forschungsgemeinschaft (DFG) for the financial support of the project. My best wishes to all the institute colleagues with whom I have shared worries, happiness and a lot of analytical problems . Thanks for making my life at work more comfortable. A special mention is dedicated to Hagen Schönfeld, Diana Petre and Bernhard Pfeuffer (el palillero) just because of their patience to understand my ex-horrible german and because of the friendship I have always received from them. Many thanks as well to Hans Langer, Volker Lührig and Roland Schmidt for the time and effort invested in several tasks of this project. I cannot forget to send a great hug and my special thanks to all the students that have collaborated with me during the development of this project: Veronica, Manu, Hansi, Ibrahim, Lars, Nina, Anke and Carlos. Without them I would have needed to cut myself in hundred different pieces to be able to finish with the great amount of work done. I would need 200 pages to include all the people that have help me during these years in the adventure to feel like home even being so far away from there. Amongst all of them, I would like to express my deep gratitude to my new Spanish family (Veronica, Manu Bilbo, Manu Piedras, Maria, Sergio, Ponte, Santiago, Berta, Barthe, Arianna, Ameliqui) my Polish family (Izaaaa!!!!) and my german family (Matthias, JUW and Tilman). How could I forget the connection with my roots? Thanks Mel, pupino y pupina for being always there. Eriko I missU too mate. Especially I would like to express my sincere acknowledgement to two girls that have changed the course of my life. One did the first step (it is you Susanne) and the other one is on it (dziekuje lady Elzbi). Least but not last I would like to dedicate this work to my parents and my brother. You are the past, the present and the future in my life.
II Agradecimientos
Agradecimientos En primer lugar me gustaria agradecer de forma especial al Prof.Dr.Ing. Ulrich Kunz. Gracias por confiar en mi y darme la oportunidad de desarrollarme como persona y como cientifico.Sin su apoyo tanto personal como cientifico este trabajo no hubiera sido posible. De la misma manera me gustaria dar las gracias al Prof. Dr.-Ing Thomas Turek por la fructifera discusion y colaboracion especialmente en al area de modelado matematico ademas de por aceptar la co-supervision de mi trabajo. En este punto me gustaria tambien expresar mi agradecimiento al DFG por la financiacion del proyecto. Mis mejores deseos para todos los colegas de trabajo con los que he compartido preocupaciones, alegria y un monton de problemas analiticos . Gracias por haber hecho mi vida en el trabajo mucho mas comoda. De todos ellos me gustaria dar una mencion especial a Hagen Schönfeld, Diana Petre y Bernhard Pfeuffer (el palillero), solo por haber tenido la paciencia suficiente para aguantar mi horrible aleman y por toda la amistad que he recibido de vosotros. Al mismo tiempo me gustaria agradecer a Hans Langer, Volker Lürig and Roland Schmidt el esfuerzo y tiempo invertidos en ciertas tareas de este proyecto. No podria olvidarme de mandar un abrazo enorme a todos los estudiantes que han colaborado conmigo durante todos estos tres años: Veronica, Manu, Hansi, Ibrahim, Lars, Nina, Anke y Carlos. Sin su ayuda me habria tenido que dividir en cien pedazos para ser capaz de llevar hacia delante la gran cantidad de trabajo realizado. Necesitaria 200 paginas para incluir a toda la gente que me ha acompañado durante estos años en la aventura de sentirme como en casa aun estando lejos de alli. Entre todos ellos me gustaria expresar mi profunda gratitud a mi nueva familia española (Mana Vero, Manu Bilbo, Manu Piedras, Maria, Sergio, Ponte, Santiago, Berta, Barthe, Arianna y Ameliqui), a mi familia polaca (Izaaaa!!!!) y a mi familia alemana (Matthias, JUW y Tilman). Como podría olvidarme de mis raices? Gracias mel, pupino y pupina por estar siempre ahi. Eriko yo tambien te hecho de menos. Especialmente , me gustaria expresar mi mas sincero agradecimiento a dos mujeres que han cambiado el rumbo de mi vida. Una dio el primer paso (eres tu Susanne) y la otra esta en ello (dziekuje Lady Elzby). Por ultimo pero no menos importante me gustaria dedicar este trabajo a mis padres y a mi hermano. Sois el pasado, el presente y el futuro en mi vida.
Abstract III
Abstract
“An approach to a process intensification by combination of microwave assisted
heterogeneous catalysis and polymer/glass monolithic microreactors”
Microreaction technology is considered nowadays amongst one of the most promising new concepts in reaction engineering and process intensification. One of the main reasons is an improved mass transfer inside the channels of microreactors and an excellent control of the thermal reactor behaviour. At the same time the implementation of microwave radiation with the aim to accelerate the reaction rate of organic synthesis has gained from a spectacular development during the last years. From an industrial point of view the combination of this energy source with heterogeneous catalytic processes would be especially interesting. The synergic effect in the conversion of a chemical reaction caused by an appropriate catalyst and the microwave selective heating of the catalyst centres (formation of hot spots) would become an attractive alternative for the intensification of chemical reactors. A fundamental question arises in this scientific scene, can chemical reactions be enhanced inside catalytic microreactors if the reactor is heated with microwaves? To investigate this question a monolithic composite material consisting of a microwave transparent macroporous carrier with functionalized polymer particles filling the space inside the carrier pores was developed. Due to the composite structure and dimensions the system can be assumed as a monolithic microreactor. By the modification of different preparation parameters Pd metal nanoparticles with different particle sizes were dispersed in the polymer phase, acting as a catalyst for different chemical reactions. Kinetic studies of a Pd(0) catalysed transfer hydrogenation under two different heating methods (traditional and microwaves) and two different heat transfer mathematical models were developed in order to observe the effect of several catalyst parameters on the creation of hot spots under microwave heating. The experimental measurements of the temperature in the catalytic centre calculated on the base of the kinetic equation and the temperature profiles obtained from the models were in agreement. Under the actual working conditions and with the actual range of catalyst properties (Pd particle size, polymer particle size and Pd content) no special enhancement in the conversion can be reached by means of microwave heating instead of a conventional heating method. Nevertheless, using certain mathematical tools and a parameter sensitivity study based in the heat transfer models, some conclusions about the possible ways of catalyst modification towards the promotion of the hot spot effect were depicted. This thesis has been the first published work treating from a theoretical and practical point of view the question of possible microreactor process intensification via microwaves as an alternative energy source.

Index of contents V
Index of contents
1 Introduction..................................................................................................................... 1 2 State of the art ................................................................................................................. 3 2.1 Microreaction technology (MRT).................................................................................. 3
2.1.1 Basic concepts .................................................................................................... 3 2.1.2 Features, advantages and disadvantages.......................................................... 4 2.1.3 Classification of microdevices........................................................................... 6 2.1.4 Microreactors: types and applications. ............................................................. 7
2.2 Microwave Assisted Organic Synthesis (MAOS)....................................................... 10 2.2.1 Microwave dielectric heating theory ............................................................... 10
2.2.1.1 Dielectric polarisation ........................................................................... 10 2.2.1.2 Conduction losses................................................................................... 12 2.2.1.3 Interfacial polarisation or Maxwell-Wagner effect................................ 12
2.2.2 Microwave effects in chemistry ....................................................................... 14 2.2.2.1 Thermal effects ....................................................................................... 14 2.2.2.2 Specific or athermal effects .................................................................... 17
2.2.3 Application of microwaves in organic synthesis............................................. 20 2.2.3.1 Solvent-free reactions............................................................................. 20 2.2.3.2 Multicomponent reactions...................................................................... 20 2.2.3.3 Ionic liquids............................................................................................ 21 2.2.3.4 Combinatorial chemistry........................................................................ 21 2.2.3.5 Polymer chemistry.................................................................................. 22 2.2.3.6 Catalysis ................................................................................................. 22
3 Monolithic polymer-carrier microwave heated microreactors ................................ 26 3.1 Antecedents.................................................................................................................... 26
3.1.1 Description of polymer-carrier composites..................................................... 26 3.1.2 Monolithic microreactors: designs and applications ..................................... 27
3.2 Construction of monolithic microreactors for microwave heating .......................... 30 3.2.1 Ring Reactor .................................................................................................... 30 3.2.2 Glass reactor .................................................................................................... 35
4 Pd(0) doped composite materials................................................................................. 37 4.1 Introduction................................................................................................................... 37 4.2 Preparation method...................................................................................................... 38
4.2.1 Catalyst selection ............................................................................................. 38 4.2.2 General description of the preparation procedure ......................................... 39 4.2.3 Detailed protocol .............................................................................................. 42
4.2.3.1 Batch experiments .................................................................................. 42
Index of contents VI
4.2.3.2 Flow-through experiments ..................................................................... 43 4.3 Catalyst characterisation techniques .......................................................................... 44
4.3.1 Microscopy techniques. ................................................................................... 44 4.3.2 Spectroscopic methods..................................................................................... 46 4.3.3 Inverse steric exclusion chromatography (ISEC) .......................................... 48
4.4 Results and discussion. ................................................................................................. 48 4.4.1 Palladate anchoring mechanism..................................................................... 48 4.4.2 Polymer phase characterisation. ..................................................................... 51
4.4.2.1 Polymer content (PC)............................................................................. 51 4.4.2.2 Exchange capacity.................................................................................. 53 4.4.2.3 Ion exchange kinetics ............................................................................. 55 4.4.2.4 Polymer particle growth model. ............................................................. 62 4.4.2.5 Inverse steric exclusion chromatography (ISEC). ................................. 64
4.4.3 Governing factors in the generation of Pd nanoparticles. ............................. 65 4.4.3.1 Reduction rate ........................................................................................ 65 4.4.3.2 Polymer phase structure......................................................................... 68 4.4.3.3 Initial concentration of palladate........................................................... 74
4.5 Conclusions.................................................................................................................... 75 5 MAOS using Pd(0) doped monolithic microreactors ................................................ 76 5.1 Introduction................................................................................................................... 76 5.2 Interaction microwave-composites.............................................................................. 76 5.3 Traditional and microwave assisted ethyl cinnamate transfer hydrogenation....... 77
5.3.1 Experimental methods and equipment ........................................................... 78 5.3.1.1 Description and operation parameters of the test reaction. .................. 78 5.3.1.2 Laboratory plant for traditional heating experiments ........................... 79 5.3.1.3 Laboratory plant for microwave heating experiments ........................... 81 5.3.1.4 Operation procedure. ............................................................................. 83
5.3.2 Reaction microkinetics. ................................................................................... 83 5.3.3 Kinetic comparison between heating methods................................................ 85
5.3.3.1 Traditional to microwave heating experiments...................................... 86 5.3.3.2 Microwave to traditional heating experiments. ..................................... 88 5.3.3.3 Single laboratory plant experiments. ..................................................... 91
5.3.4 Catalyst effective temperature. ........................................................................ 92 5.3.5 Catalyst deactivation. ....................................................................................... 95
5.4 Heat Transfer models. ................................................................................................ 102 5.4.1 Nanoparticle model........................................................................................ 102
5.4.1.1 Model description................................................................................. 102 5.4.1.2 Computed results.................................................................................. 109
5.4.2 Packed bed microreactor model. ................................................................... 112 5.4.2.1 Model description................................................................................. 113
Index of contents VII
5.4.2.2 Computed results.................................................................................. 120 5.5 Conclusions.................................................................................................................. 129
6 Conclusions and outlook ............................................................................................ 130 7 List of symbols and abbreviations............................................................................. 133 8 References.................................................................................................................... 137 9 Appendix...................................................................................................................... 152 9.1 Technical Drawings .................................................................................................... 152
9.1.1 Ring Reactor .................................................................................................. 152 9.1.2 Glass reactor .................................................................................................. 154 9.1.3 Teflon stand ................................................................................................... 155
9.2 Swelling experiments and chemical resistance of silicone, VITON™ and KALREZ™ under different solvents................................................................................ 156
10 List of scientific contributions ................................................................................... 158 10.1 Congresses ................................................................................................................... 158 10.2 Journal publications ................................................................................................... 159


Chapter 1. Introduction 1
1 Introduction Process Intensification (PI) is a concept pioneered in the 80s by Ramshaw et al. /RAM83/ to identify a way of thinking inside the process engineering community dealing with the intention of the design of much smaller (intensified) plants that would be significantly cheaper and safer than the existing ones. This idea has developed nowadays in a much wider concept where engineering considerations (like the efficiency of chemical reactions, an energetic optimisation of the plant, the waste reduction or process security) are at the same level of significance as the economical aspects (like the reduction of the investment and operation costs, the plant flexibility to adequate the production to regional markets or fast changes in the market trend, etc) /HÜT05/. Such a wide concept makes necessary the combination of process and equipment engineering developments as well as new conceptions in the construction of the final plants. From a pure process engineering point of view an intensification approach is an effort to the enhancement of mass and energy transfer processes involved in all the plant operations. In this direction the well demonstrated improvements in the mass and heat transfer properties achieved by the miniaturisation of chemical reactors have thereby launched microreaction technology to top places in the list of possible PI tools. Higher conversion, higher selectivity and the possibility to handle toxic, explosive or highly exothermal reactions are well known benefits of the reduction in scale. At the same time, the application of alternative energy sources in order to improve the performance of a chemical reaction is a procedure that has been under study during the last years in macroscale devices, being considered by companies like Degussa in the list of future pathways in PI /HÜT05/. Among these sources, the application of microwave heating to chemical reactions has already demonstrated its feasibility to speed up throughput in chemical laboratories by the enhancement of reaction rates and selectivity /KAP04/. Although several authors have claimed the presence of specific or nonthermal microwave effects in order to explain the differences in rate observed under the same apparently bulk temperature /PER06/, most of the scientists agree that such enhancements have their origin in a pure thermal effect derived from the rapid and selective heating achieved by the strong interaction between microwaves and polar molecules /KAP04/. Among the thermal effects of microwave irradiation we will centre our attention in the so called hot-spot effect. This temperature gradient between different parts of the reactive system and the fluid where the reaction takes place is a common non-desired effect in state-of the art packed bed reactors under high exothermal reactions and is mainly considered as responsible of the rate enhancements produced in microwave assisted heterogeneous catalytic reactions /HAJ06/. A better understanding of these phenomena and the parameters influencing it is of prime importance in
2 1. Introduction
order to provide the market with catalytic processes which would really take advantage of the irradiation method as intensifier. During the last years several projects running at the Institute of Chemical Process Engineering at the Clausthal University of Technology dealt with the development of a polymer/carrier-composite material. This material is based on a glass porous carrier with channels filled with a copolymer derived from vinyl-benzyl chloride (VBC), styrene and divinyl benzene (DVB). Using different synthetic paths the polymer phase can be provided with different functionalities. These allow a diverse range of applications like as acid catalysts in reactive distillation processes /KÜN96/, /RAP98/, as a reactive absorber inside chromatographic reactors /ALT01/ or functionalized with diverse anionic groups or metal nanoparticles to perform diverse polymer catalysed organic syntheses /SCH05/. Due to the microscale dimensions of the carrier pores (50-300 microns), the fractal nature of the pore system, the small diameter of the polymer particles (1-10 microns) and the possibility of forced convective flow through the composites, it was demonstrated that these materials can be described as a parallel association of packed bed microreactors /SCH04/. In addition the presence of polar and/or metallic groups inside a non-absorbing matrix (polymer skeleton), supported in a radiation transparent glass carrier would lead to the selective heating of certain parts of the composite under microwave radiation. Both considerations, the microscaled character of the system and the possible selective heating of the catalyst under microwave irradiation are the keys which allow this material to be adopted as a reference system in the study of the microwave heating behaviour of catalytic microreactors. With this work it is intended to contribute to the investigation of the phenomena involved in the microwave heating of catalysts at the microscale. In this context, research about the production possibilities of Pd(0) doped polymer-glass composites was done. In a further step the different catalysts produced, once characterised, were tested in a certain organic synthesis under traditional and microwave heating procedures. The achievement of reaction rate enhancements caused by microwave heating was measured, identifying possible dependences with the composite properties. To perform kinetic experiments the design of a reactor suitable for flow-through catalytic organic synthesis under both heating methods was required. A kinetic approach was developed in order to calculate experimentally the presence of hot-spots caused by microwave irradiation. In addition, the experimental values and the results computed by different heat transfer models were compared with the objective of validating the mathematical description of the system. Once validated, the appropriate model was used to evaluate the possibility and the optimum conditions to combine the developed composite materials and microreaction technology towards an intensification of reactive processes.
Chapter 2. State of the art 3
2 State of the art The beginning of the 90s was the starting point for an accelerated development of microreaction technology as a new tool in chemical research and processing. In a parallel way the first experiments dealing with the use of microwave irradiation as an alternative heating source of chemical reactions performed by the groups of Gedye /GED86/ and Giguere /GIG86/ in 1986 marked the beginning of an increased interest of the scientific community to this electromagnetic field as a substitute of conventional heating sources like ovens or oil baths. Different features characterise any of the considered new technologies, especially in the field of heat transfer. As a result the motivation which moves an engineer to establish them as an alternative to a chemical engineering problem is quite different. Nevertheless both technological developments have demonstrated individually to improve the performance of certain chemical reactions being therefore feasible tools for the intensification of chemical processes. The question arises in this point; it is possible to combine both of them? As Professor Stankiewicz introduced during the IMRET 9 conference the answer is not an easy task and requires detailed research /STA06/.
2.1 Microreaction technology (MRT)
2.1.1 Basic concepts
Under the term MRT a group of novel chemical reactors and other process engineering components based on geometries defined by microscale internal dimensions are comprised /HES03-1/. This definition does not underline exactly the borders which would separate a microdevice from the traditional equipment. The industrial platform “Modular Microreaction Technology” of the DECHEMA has defined the term microreaction technology as “every process engineering using technical equipment with internal dimensions in the range of micrometers or millimetres”. Although this definition seems to contradict the “micro” character of this technology, several companies like Merck noticed that from an industrial point of view reactors in the range of millimetres are still able to provide improvements in a chemical process if compared with the standard big scale batch reactors used in pharmaceutical and fine chemicals industry /SCH06/. In order to give an overview of the different space and time scales involved in reaction engineering, as well as to introduce in which region of them microreactors are placed Figure 2.1 is presented. A traditional chemical plant can range from a small batch of a few meters used in many fine chemicals processes to an integrated plant complex of hundreds of them. To this category are subjected a wide range of operation times. Three orders of magnitude separates a one day campaign of special chemicals to a continuous operation of large scale plants (like in the petrochemicals industry) where the plant is stopped after some hundreds of days of operation

4 2. State of the art
for maintenance purposes. From the reactor point of view, variations between a microfabricated reactor in the millimetre scale and an extensive reactor-separator network can be noted. The residence time in a reactor varies from some hours in an organic chemistry batch operation to some milliseconds in continuous gas phase reactions. In the fluid-dynamics and transport scale a huge interval must be considered. A difference of 9 orders of magnitude ranged from the macromixing occurring in big stirred tank reactors (a few meters) to the diffusion of molecules inside catalyst pores (some nanometers). In this case the time scale diverges from some minutes in large flow devices to some milliseconds if the diffusion of molecules is considered. Finally the reaction length scale considers the length of some molecules and times ranging between wide limits /LER96/. In this scale universe, where are microreactors placed? A general characteristic length in the micrometer range can be considered, setting the upper limit in 10-1 m for static micromixers. Such small value produces a large reduction in the reactor volume. If this fact is added to the frequently shortened reaction times derived from the enhancement in the mass transfer then the decrease in the residence time scale compared with conventional reactors can be fully understood /HES03-1/. The final result is a great drop in the characteristic space-time scales of microdevice-based plants, from a meter in the case of laboratory plants and around some meters in the case of production plants /SCH06/. The original concept of process intensification is therefore fulfilled.
Figure 2.1. Time and length scales of different reaction engineering elements /SCH06/.
2.1.2 Features, advantages and disadvantages
An enhancement of mass and heat transfer is the most obvious feature of the scale reduction in chemical equipment. An increase in the surface to volume ratio, a reduction in the diffusion
Chapter 2. State of the art 5
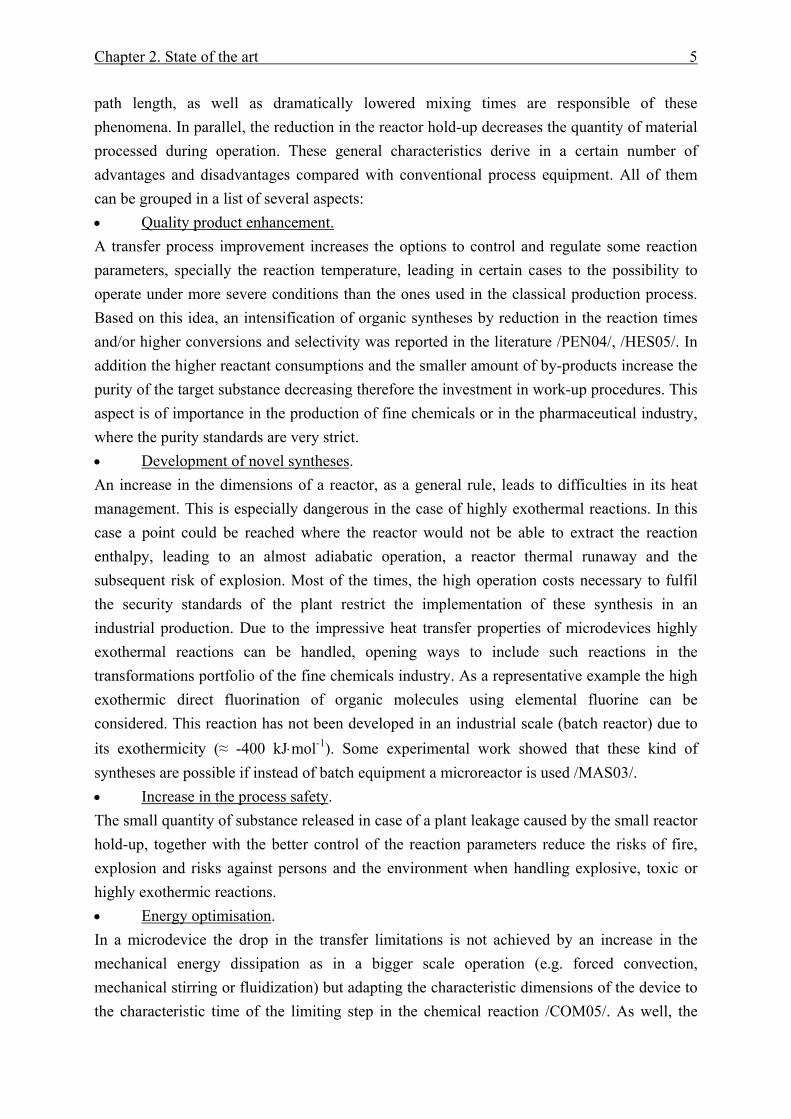
path length, as well as dramatically lowered mixing times are responsible of these phenomena. In parallel, the reduction in the reactor hold-up decreases the quantity of material processed during operation. These general characteristics derive in a certain number of advantages and disadvantages compared with conventional process equipment. All of them can be grouped in a list of several aspects: • Quality product enhancement. A transfer process improvement increases the options to control and regulate some reaction parameters, specially the reaction temperature, leading in certain cases to the possibility to operate under more severe conditions than the ones used in the classical production process. Based on this idea, an intensification of organic syntheses by reduction in the reaction times and/or higher conversions and selectivity was reported in the literature /PEN04/, /HES05/. In addition the higher reactant consumptions and the smaller amount of by-products increase the purity of the target substance decreasing therefore the investment in work-up procedures. This aspect is of importance in the production of fine chemicals or in the pharmaceutical industry, where the purity standards are very strict. • Development of novel syntheses. An increase in the dimensions of a reactor, as a general rule, leads to difficulties in its heat management. This is especially dangerous in the case of highly exothermal reactions. In this case a point could be reached where the reactor would not be able to extract the reaction enthalpy, leading to an almost adiabatic operation, a reactor thermal runaway and the subsequent risk of explosion. Most of the times, the high operation costs necessary to fulfil the security standards of the plant restrict the implementation of these synthesis in an industrial production. Due to the impressive heat transfer properties of microdevices highly exothermal reactions can be handled, opening ways to include such reactions in the transformations portfolio of the fine chemicals industry. As a representative example the high exothermic direct fluorination of organic molecules using elemental fluorine can be considered. This reaction has not been developed in an industrial scale (batch reactor) due to its exothermicity (≈ -400 kJ⋅mol-1). Some experimental work showed that these kind of syntheses are possible if instead of batch equipment a microreactor is used /MAS03/. • Increase in the process safety. The small quantity of substance released in case of a plant leakage caused by the small reactor hold-up, together with the better control of the reaction parameters reduce the risks of fire, explosion and risks against persons and the environment when handling explosive, toxic or highly exothermic reactions. • Energy optimisation. In a microdevice the drop in the transfer limitations is not achieved by an increase in the mechanical energy dissipation as in a bigger scale operation (e.g. forced convection, mechanical stirring or fluidization) but adapting the characteristic dimensions of the device to the characteristic time of the limiting step in the chemical reaction /COM05/. As well, the
6 2. State of the art
small volume of the plants and the high heat transfer coefficients achieved lead to a decrease in the amount of cooling or heating power to be installed. Both facts add an extra value to MRT, since another of the main pillars in the definition of process intensification (reduction and optimisation of the consumed energy) is fulfilled. • Economical aspects. The euphoria of a certain part of the scientific community with respect to the high expectations on MRT to be the new paradigm in modern reaction engineering has been replaced by a sober optimism after the appearance of some serious economical studies about the viability of the introduction of this technology in the process industry. Theoretical and practical studies demonstrated that a reduction up to 40% in the process development period is possible if traditional laboratory equipment is replaced by microreactors /SCH06/. A faster process development is a very valuable tool in the pharmaceutical and fine chemicals industry branch, subjected in the last years to a severe market pressure. Nevertheless from productive point of view an increase in the production to the range of tons/year is required by the industry in order to be able to run a profitable process. To reach this requirement a numbering-up approach using a number of interconnected single small unities based in microdevices was proposed as an alternative to the classical scaling-up strategies. An analysis of the real possibilities of a numbering-up using state-of-the-art technology showed that this kind of plant scheme does not solve the well known scaling up problem but they convert it in a problem of the connection of the different single unities, a problem still in its early stages of development. Also, the increase in the capital expenditure associated to the multiplication of the necessary process equipment in the plant (microreactors, sensors, controllers, etc) cannot compete at the moment with the batch processes normally used in pharmaceutical and fine chemicals industry. A sufficiently high increase in the process yield using this new technology would be necessary to justify the higher investment costs /ROB05/. An intermediate solution has been underlined in the last years by the so defined structured multiscale design, where several unities based in MRT are included into a larger scale scheme /BAY05/. Taking advantage of the better performance introduced by microdevices in certain points of the process it would be possible to increase the plant yield without a high increase in the capital expenditures. Such an approach has shown its feasibility in some industrial examples like the designed plant for the radical acrylate polymerization with a capacity of 2000 ton/year developed by Siemens Solution Process Industries /BAY05/ , the integration of a microreactor in an already existing plant performed by Microinnova /KIR07/ or the combination of a catalytic wall microreactor and a tubular rector for the partial oxidation of ethylene to ethylene oxide studied by Degussa /BEC07/.
2.1.3 Classification of microdevices
Nowadays the wide range of manufacturing techniques ranging from the well established microelectronics to novel ultra modern precision engineering and chemical erosion methods
Chapter 2. State of the art 7
provides the market with a huge number of microdevices, either coming from the research area or commercially available. A detailed compilation of different designs can be found in literature /HES03-1/, /HES03-2/, /HES03-3/. Nevertheless, a small resume of the most important group of microdevices is included straight afterwards: • Micromixers, contactors and separators. The reduction in the diffusion path inside microchannels provides a feasible tool to perform mixing of fluids in a straightforward way. Due to the multitude of tasks such as mixing, blending, emulsification and suspension, a subsequent huge amount of different mixer designs are required. Amongst the most recent designs multilaminar mixers, interdigital mixers, microcyclons and split-recombine techniques should be listed /HES03-1/. It is noteworthy to mention that at the moment the most important industrial applications of micromixers are related to its use as chemical reactors /HES03-1/. A processing area that is still in even earlier stages of development is the mixture of liquids and solids or the application to mixtures with a high precipitation risk. A high sensibility of the microchannels to clogging and fouling is a problem that can be circumvented using special mixer designs /HES03-3/. • Heat exchangers. Clearly motivated by the tremendous improvement in the heat exchange capacities when using microchannels the construction of micro heat exchangers was the starting point of MRT. For more than one decade the Forschungszentrum Karlsruhe (FZK) has been developing several microdevices using different cross and counter-flow microchanelled stacks. By means of this technique, exchangers with high internal transfer surface area up to 15.000 m2/m3, power capacities up to 200 kW and transfer coefficients up to 25 kW/m2 using extremely high flows up to 1000 l/h were constructed /HES03-2/. Taking the mentioned values as an example and comparing them with industrial multitubular exchangers (with heat transfer coefficients at least one order of magnitude smaller) it is possible to realise the high capability of these devices in the desired optimisation of the process energy transfer. • Microreactors. Even though it was already mentioned the application of micromixers as microreactors in researching and industrial applications, it should be considered that these devices were not designed for this purpose. Due to the special interest of this work in microreactors as devices especially designed for reactive processes, a single section is dedicated to this topic.
2.1.4 Microreactors: types and applications.
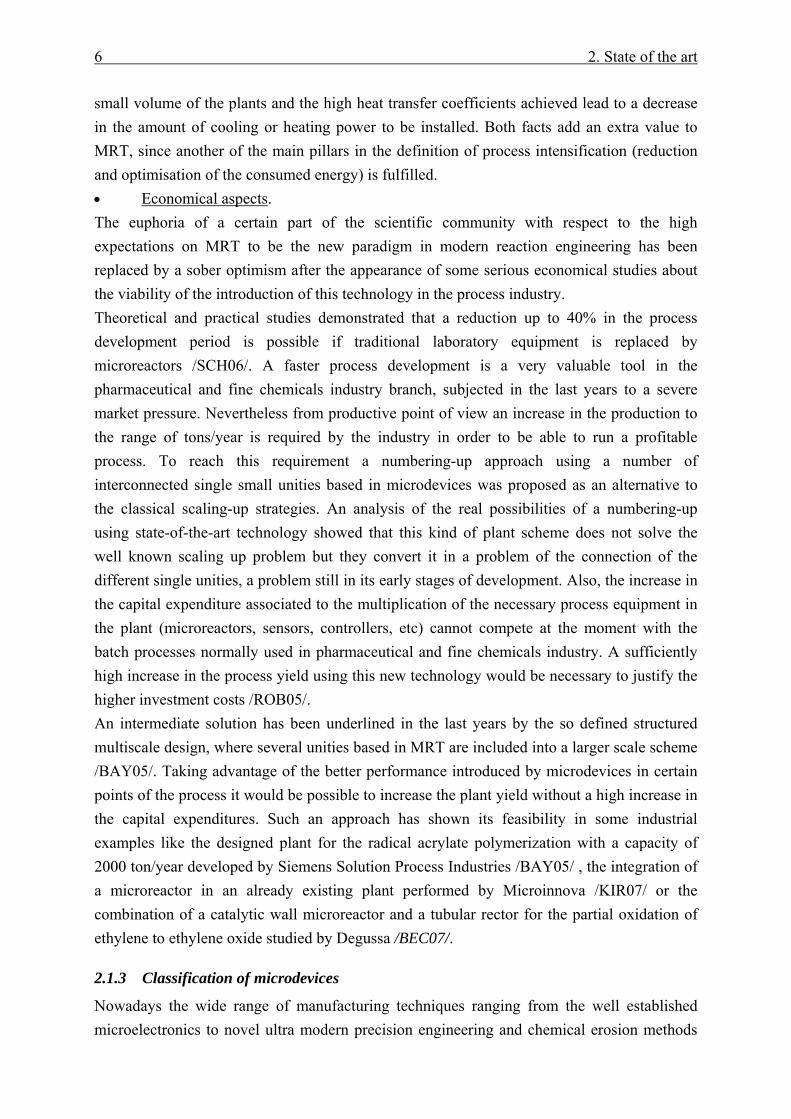
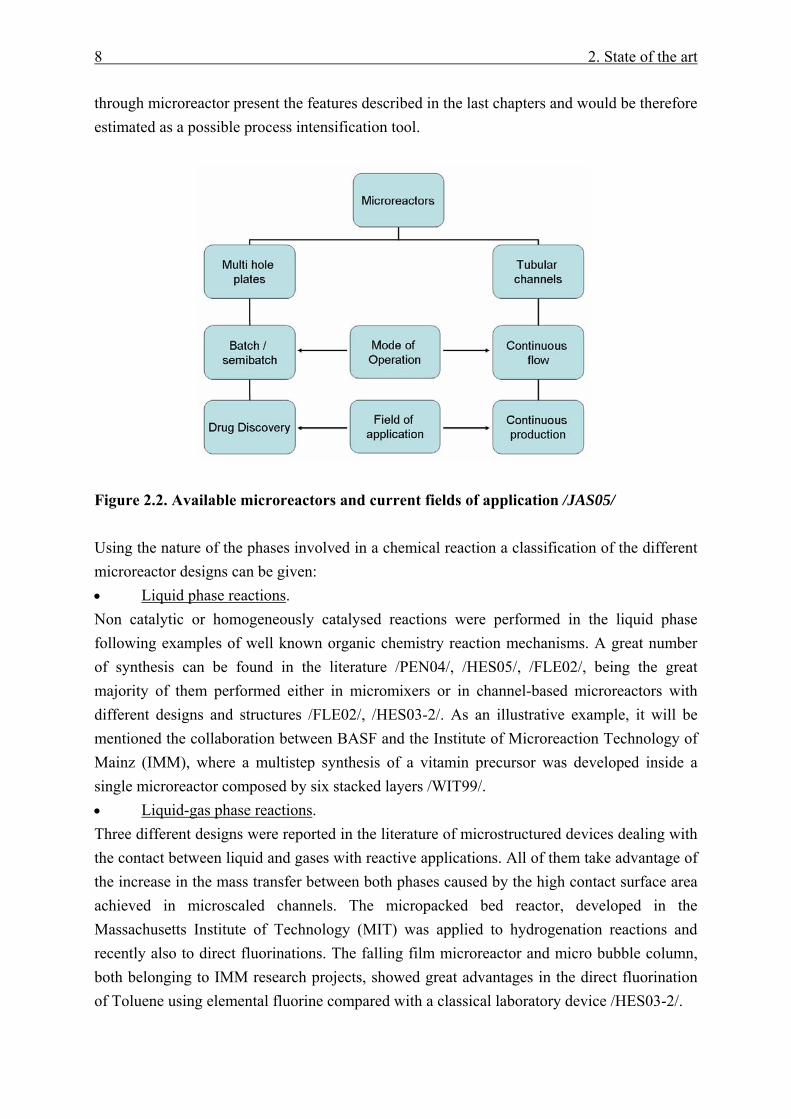
In a general manner a rough classification of microreactors can be achieved based in the mode of operation (Figure 2.2). Microplates with a large number of microcavities can be considered as microreactors operating in a batch-semibatch mode. These kinds of constructions are well known in the field of combinatorial chemistry as a tool for the development of libraries of different substances during the screening of target molecules (e.g. drug discovery research). Nevertheless from the process engineering point of view this kind of constructions do not present any kind of interest. Only a continuously operated flow-
8 2. State of the art
through microreactor present the features described in the last chapters and would be therefore estimated as a possible process intensification tool.
Figure 2.2. Available microreactors and current fields of application /JAS05/ Using the nature of the phases involved in a chemical reaction a classification of the different microreactor designs can be given: • Liquid phase reactions. Non catalytic or homogeneously catalysed reactions were performed in the liquid phase following examples of well known organic chemistry reaction mechanisms. A great number of synthesis can be found in the literature /PEN04/, /HES05/, /FLE02/, being the great majority of them performed either in micromixers or in channel-based microreactors with different designs and structures /FLE02/, /HES03-2/. As an illustrative example, it will be mentioned the collaboration between BASF and the Institute of Microreaction Technology of Mainz (IMM), where a multistep synthesis of a vitamin precursor was developed inside a single microreactor composed by six stacked layers /WIT99/. • Liquid-gas phase reactions. Three different designs were reported in the literature of microstructured devices dealing with the contact between liquid and gases with reactive applications. All of them take advantage of the increase in the mass transfer between both phases caused by the high contact surface area achieved in microscaled channels. The micropacked bed reactor, developed in the Massachusetts Institute of Technology (MIT) was applied to hydrogenation reactions and recently also to direct fluorinations. The falling film microreactor and micro bubble column, both belonging to IMM research projects, showed great advantages in the direct fluorination of Toluene using elemental fluorine compared with a classical laboratory device /HES03-2/.
Chapter 2. State of the art 9
• Heterogeneous catalysed reactions. In this field of MRT the discussion has been focused in the way to bring reactants and catalysts into contact more than in quite specific channel configurations. In a microstructured packed bed reactor the enhancement of the heat exchange areas diminishes the possibility of temperature gradients compared with large scale reactors but do not neglect them /NOR06/. In addition the well known problematic of the high pressure drops and heterogeneous space velocities distribution detected in industrial scale packed beds is still present in the microscaled channels. As a way to prevent these drawbacks the coating of the channel walls with catalytic active species is the alternative proposed by several authors /HAA02/, /SCH02/. Using this approach, theoretical and experimental comparisons proved the elimination of any possible thermal gradients and the diminution of the pressure drop /KAR05/. Hydrogenations of various substrates in coated microreactors, selective oxidations in the explosion regime using pure oxygen instead of air and even more dangerous processes like the catalytic hydrogen-oxygen reaction were performed in special microreactors, sometimes including in the same block another microdevices (like micro heat exchangers or micromixers) /HES03-2/. From the industrial point of view DuPont and BASF are the pioneers in microreaction technology. DuPont developed a reactor conformed by a stack of several silicon plates. Each of the plates was designed to fulfil a certain purpose, integrating therefore in the same device heat exchangers for the reactants and products as well as a mini packed bed catalytic reactor. Using this kind of microdevice comparable conversions with the industrial process were obtained in the production of methyl isocyanate from methyl formamide /HES03-2/. BASF has tested several microreactor strategies during the development stages of several processes. As an example it was possible to investigate the optimum reaction conditions (residence time especially) for the interesting reaction of dehydrogenation of derivated alcohols to yield the respective aldehydes /HES03-2/. Finally the case of the monolithic reactors must be specially mentioned. This structures formed by a single block of small (0.5 to 5 mm) parallel channels containing a catalytic coated wall are starting to be considered part of the MRT since the dimensions of the individual channels fit in the size range contained in the definition given at the beginning of the chapter. A high flexibility in the channel design /KRE06/ and the features related to its special configuration (homogeneous flow distribution, very low pressure drops and an increase in the mass transfer coefficients) have given yield to the interest of the scientific community in this kind of micro-meso structures as an alternative to traditional reactors specially in the field of gas-liquid-solid phase reactions (slurry tank, packed bed or trickle bed reactor) /ROY04/. The combination of the advantages derived from the reduction in the dimensions of the reaction room and a simple strategy of scaling up (the same kind of monolithic materials can be easily constructed in different sizes modulating the number of parallel channels) bring a perfect platform for process intensification. The traditional equipment could be replaced by novel, smaller and more efficient catalytic reactors based on this technology /STA00/. Pointing in the same direction an interesting and promising approach
10 2. State of the art
is the production of monoliths using irregular fractal channel geometries developed in the Institute of Chemical Process Engineering (ICVT) of the Clausthal University of Technology. This irregular channel structure, including a polymer phase able to support reagents and catalysts, promises to be a much cheaper alternative. In addition, comparable beneficial effects on mass transfer and pressure drop compared with polymer containing packed bed reactors were reported during the polymer supported catalysed transfer hydrogenation of cinnamaldehyde /SCH04/.
2.2 Microwave Assisted Organic Synthesis (MAOS)
2.2.1 Microwave dielectric heating theory
Microwaves are electromagnetic radiation lying in the spectrum between infrared and radio frequencies, what correspond to wavelengths of 1cm to 1m (a frequency ranging from 30 GHz to 300 MHz respectively). All domestic and industrial microwave generators are allowed to work only at two fixed frequencies, 2.45 GHz and 900 MHz, in order not to interfere with RADAR transmissions and telecommunications. The experimental observation of the increase in the temperature of different substances when subjected to microwaves has its origin in the ability of the electric field to exert a force in charged particles. If a certain substance is composed by polar species which can freely move, then the electric field will induce a current on the material matrix. Nevertheless, if the polar molecules (or groups) are bounded in a certain structure, they will try to move with the field until a certain counter force caused by the structure compensates the one exerted by the electric field, inducing in the material a dielectric polarisation. Both, conduction and dielectric polarisation are the sources of microwave heating.
2.2.1.1 Dielectric polarisation
A polarisation phenomenon is composed by several individual processes. Mathematically this fact can be described using the following expression:
daet PPPP ++=
(2.1) where Pe is the electronic polarisation (realignment of the atom electrons around the nuclei), Pa is the atomic polarisation (relative displacement of nuclei caused by the unequal distribution of charges inside the molecule) and Pd is the dipolar polarisation (orientation of permanent molecular dipoles). Under an oscillating electric field, the importance of each term in the general equation depends on the time scale of their polarisation-depolarisation cycles compared with the inverse of the radiation frequency. In the frequency range of microwaves, the electronic and atomic polarisations proceed in a time scale much smaller than the frequency and as a result can be neglected from the total polarisation. In contrast the polarisation of a permanent dipole posses a time scale value in a range comparable to the
Chapter 2. State of the art 11
microwave frequency, contributing therefore to the microwave heating effect. As a result, the discussion in this section will be focused on the latter particular mechanism. To align the permanent dipoles of a number of molecules with the electric field, a certain amount of energy must be provided by the radiation. This energy can be stored inside the irradiated material in the case of a total alignment or can be converted in a random motion of the molecules, that is to say, in a temperature rise if a phase lag between the electric field oscillation and the alignment of the dipoles takes place. Both kinds of phenomena are included in the Debye definition of the complex dielectric constant (equation 2.2).
ε ′′−ε′=ε j*
(2.2)
In this equation, the real part ε´, called the dielectric constant, describes the ability of materials to be polarised by an electric field and therefore its ability to store the energy of the radiation. The imaginary part of the complex constant ε´´, called dielectric loss, depicts the capability of the dipoles to follow the oscillations of the electric field and therefore is related to the capacity of a material to dissipate the energy of the electromagnetic radiation into heat. Debye´s formulation of the individual constants is included in eq. 2.3 and 2.4.
22S
1 τω+ε+ε
+ε=ε′ ∞∞
(2.3)
22S
1)(τω+ωτ⋅ε−ε
=ε ′′ ∞
(2.4)
Where εS and ε∞ are the dielectric constants at d.c. and very high frequencies respectively and τ is the relaxation time of the system which controls the build up and decay of the polarisation. An interpretation of the Debye equation in terms of the dependency of the complex dielectric constant with the frequency is shown in Figure 2.3. In the low frequency range, close to d.c., the time taken by the electric field to change its direction is much longer than the rotation time of the permanent dipoles. Consequently the dipoles have enough time to reach the total alignment with the field, the dielectric constant reaches its maximum value εS
and therefore all the energy provided by the external source is stored in the material. A gradual rise in the frequency leads to a situation where the dipoles are not able to follow anymore the rapid oscillation of the electric field. In this moment the dipolar polarisation lags behind the applied field and the dielectric constant decreases where the dielectric loss increases its value reaching a maximum. As a result almost all the energy provided by the external source is thermally dissipated. Macroscopically a severe rise of the material temperature during irradiation is observed. If the field reaches a very high oscillating frequency, the dipoles have no time to response to the field changes and therefore they do not
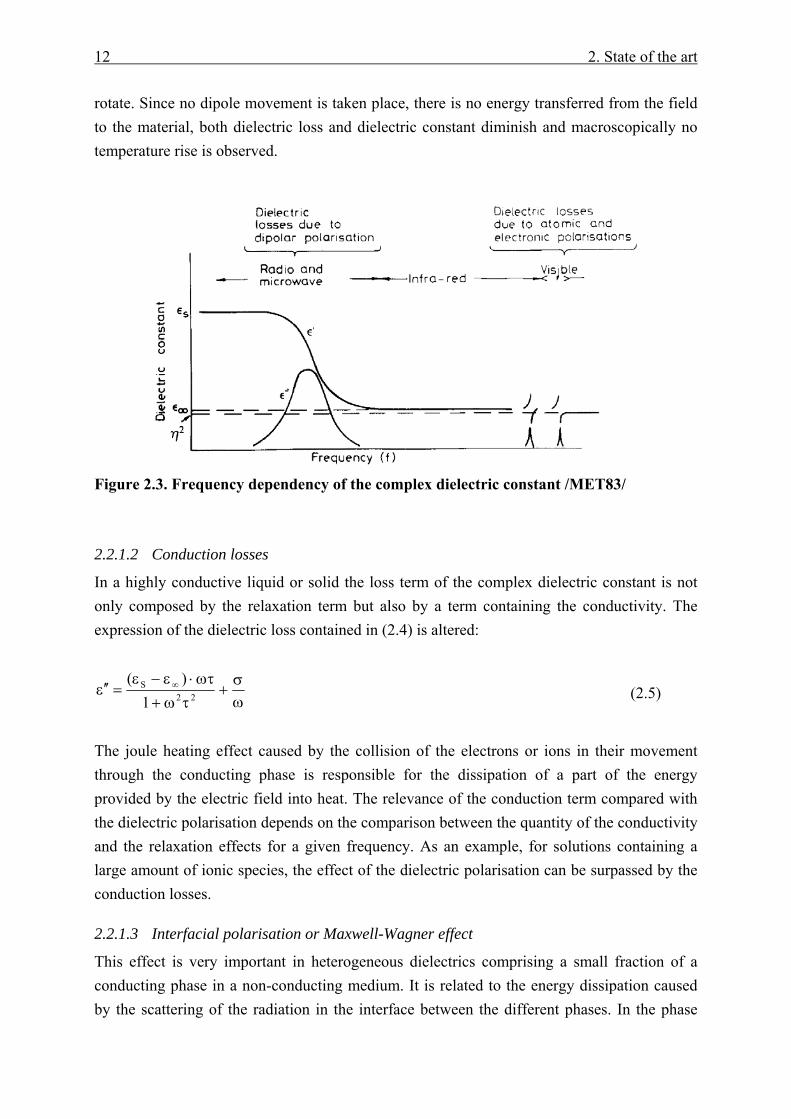
12 2. State of the art
rotate. Since no dipole movement is taken place, there is no energy transferred from the field to the material, both dielectric loss and dielectric constant diminish and macroscopically no temperature rise is observed.
Figure 2.3. Frequency dependency of the complex dielectric constant /MET83/
2.2.1.2 Conduction losses
In a highly conductive liquid or solid the loss term of the complex dielectric constant is not only composed by the relaxation term but also by a term containing the conductivity. The expression of the dielectric loss contained in (2.4) is altered:
ωσ
+τω+ωτ⋅ε−ε
=ε ′′ ∞22
S
1)(
(2.5)
The joule heating effect caused by the collision of the electrons or ions in their movement through the conducting phase is responsible for the dissipation of a part of the energy provided by the electric field into heat. The relevance of the conduction term compared with the dielectric polarisation depends on the comparison between the quantity of the conductivity and the relaxation effects for a given frequency. As an example, for solutions containing a large amount of ionic species, the effect of the dielectric polarisation can be surpassed by the conduction losses.
2.2.1.3 Interfacial polarisation or Maxwell-Wagner effect
This effect is very important in heterogeneous dielectrics comprising a small fraction of a conducting phase in a non-conducting medium. It is related to the energy dissipation caused by the scattering of the radiation in the interface between the different phases. In the phase
Chapter 2. State of the art 13
boundaries charges are created by the effect of the oscillating electric field and an extra conducting term appeared in the formulation of the dielectric loss constant /WAG14/. All the different phenomena already described, especially dipolar polarisation, have a clear interpretation if gases are considered. A substance in the gas phase presents negligible molecular interactions if compared with a condensed phase and therefore there is no need to consider the presence of special effects caused by the interaction of a molecule with its environment. The situation changes in case of considering liquids and solids. In the liquid phase several molecular interactions like hydrogen bonds or solvation processes are present in a multitude of practical systems distorting the dipolar moment of the single molecules. On the one hand, there are interactions with an enhancing effect over the dipolar moment of the system but without diminishing the mobility of the molecules. A good example is the chain like structure formed by substituted amines using hydrogen bonds. The orientation caused by this kind of association produces the rearrangement of the dipoles in a parallel way increasing the dipole moment of the system subjected to the electrical field. In this case, the dipole cancellation characteristic of a system under the influence of the Brownian motion caused by the temperature is overcome. On the other hand, there are interactions which either diminish the total dipolar moment or hinder the mobility of the dipoles, reducing therefore the response of the system to the oscillating electrical field. The antiparallel arrangement of carboxylic acids induced by the presence of hydrogen bonds or the immobilization of water molecules in the solvation sphere around an ion in solution are examples illustrating the reduction of the dielectric loss by intermolecular interactions /STU06/. The case of ions is nevertheless special, because the reduction reported is compensated by an increase in the conductive loss factor of the system. In the case of solids, where molecules are normally trapped in a lattice, a higher degree in the complexity of the intermolecular interactions is founded. Effects like the dipole relaxation of defects in crystal lattices or the creation of dipoles by the adsorption of molecules over the solid surface are just examples of the multitude of factors that could be considered /STU06/. Nevertheless as a general trend, the diminution in the dipole mobility caused in a solid matrix increases the relaxation time of the system placing the maximum value of ε´´ in smaller frequencies as the individual atoms (ice is almost transparent to microwave irradiation). Due to the special interest of this work in polymer phases, a short description of the main phenomena taking place in this kind of materials will be done. Non-polar polymers like polyethylene, polytetrafluorethylene or polysterene have a very low dielectric loss in the whole frequency range, whereas polar polymers like polyvinyl chlorides, polyvinyl acetates and polyacrylates present a certain relaxation at lower frequencies than for the monomers, as expected by the reduction in the molecular mobility. A special feature of the polar polymers is that they present different loss domains at different frequencies: α, β and γ. It is believed that the α domain is caused by the Brownian motion of the polymer chains whereas the β domain is because of oscillatory motion or intramolecular rotation of side groups. A special mention will be given to ion exchangers. In this kind of polymers apart from the already mentioned
14 2. State of the art
loss domains, the presence of ionic groups could contribute to the dielectric loss by a conduction mechanism where all counterions could jump from one ionic site to another, something already demonstrated in the case of glass materials /LEO04/.
2.2.2 Microwave effects in chemistry
Since the implementation of the first experiments using a microwave oven to heat the reaction media some microwave effects have been claimed by the different authors in order to explain the sometimes tremendous increase in the reaction rate when compared with the same reaction performed under comparable conditions but using convective heaters like oil baths, ovens, etc (called in the literature traditional or conventional heating methods). The clarification of the nature and the parameters which affect this effects are of a big importance since the optimization of the rate enhancements produced by microwaves are the key of the future role of this technology in the development of process intensification strategies. In order to bring an overview about the state of the art in the scientific knowledge, a classification of all the microwave effects reported is given here:
2.2.2.1 Thermal effects
Under this definition the effects derived from the different temperature regimes that can be obtained inside a reactor or a material by the substitution of a convective heating source by microwave irradiation are included. All the different observed and predicted microwave thermal effects can be summarised as follows: • Volumetric Heating. In the early stages of the development of microwave synthesis Bagnell et al discovered that a faster heating procedure and the avoidance of thermal gradients were the most important advantages derived from the irradiation of chemical reactors /BAG96/. The coupling of the microwave radiation to all polar substances contained in the reaction mixture produces an instantaneous transfer of the energy to the media, rising the temperature irrespective of its thermal conductivity value. In contrast a conventional heating method is always submitted to the ability of the system to transfer the heat from the outer source to the interior of the reactor, needing therefore considerations about the thermal resistances of the different materials and the implementation of additional tools (stirrers, baffles, etc) in order to increase the heat transfer coefficients. The ability of heating a reaction in a very short period of time using microwaves is denominated in the organic chemistry world as “microwave flash heating” /KAP06/. In addition, the utilisation of an outer heating source implies a gradient between the reactor wall and the reaction mixture. The presence of a higher wall temperature (denominated wall effect) can be a negative factor if thermally unstable catalysts or reagents are present in the reaction. Under microwave irradiation and using a microwave transparent reactor wall, this effect can be avoided. Some results obtained by Efskind et al. using unstable ruthenium catalysts in a domino ring-closing metathesis reaction /EFS03/ confirmed this idea.
Chapter 2. State of the art 15
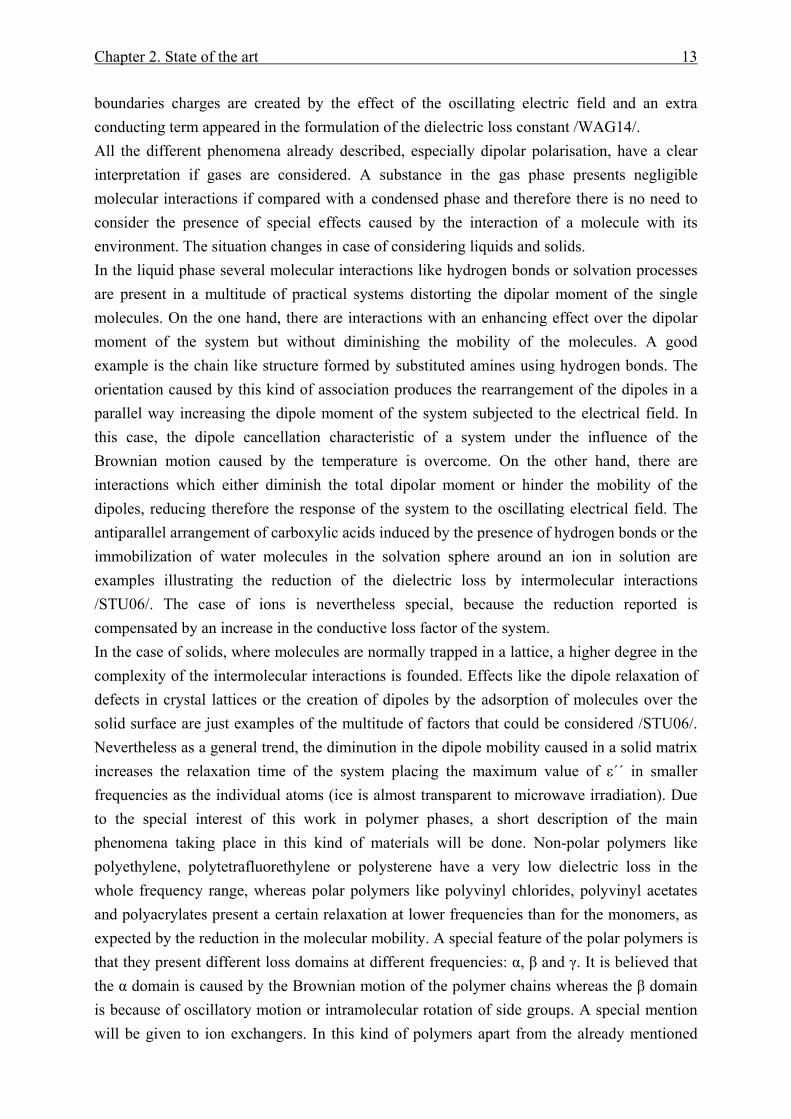
From another point of view, a direct coupling of the energy input with a rise in the temperature in the reaction media increases the energetic efficiency of the whole process. A diminution in the heat loss associated to the heating of the whole reactor system is saved in case of using the proper construction materials for the microwave reactor. Also, the modern microwave systems, able to regulate the power input to low levels once the working temperature has been reached, are a valuable tool towards the optimization of the energy consumed during microwave assisted reactions /NÜC04/. Some studies regarding the efficiency factor of microwave heated reactors when increasing the production scale from millilitres to litres showed an improvement in this value accompanying the increase of scale /NÜC03/. This effect is very interesting for the future possibilities of industrial microwave heating processes and in terms of the intensification of a reactive process. • Superheating of solvents. The high energy input achieved by irradiation of a strong microwave absorbing liquid provides a very steep heating rate. In the case that the energy provided by the radiation surpasses the energy dissipated by evaporation when reaching the boiling point, then a heat accumulation in the liquid phase will happen. In that case such accumulation will lead to an increase of the temperature above the boiling point. This effect disappears if a bubbling nucleation enhancer (like a boiling stone or agitation of the media) is present ( Figure 2.4). In this moment vaporization is triggered, the energy dissipated by this process equals the energy input of the microwaves and the temperature decreases again to the normal boiling point. This phenomenon was observed for a great majority of organic liquids reaching superheated temperature in the range of 4 to 40 K depending on factors like the power dissipation, reactor geometry, solvent properties, etc./CHE01/. The superheating effect was used specifically by Chemat et al. to enhance the reaction rate of homogeneous industrial reactions like esterifications and cyclisations /CHE01/.
Figure 2.4. Effect of germination of nuclei in the boiling point in methanol /CHE01/.
16 2. State of the art
• Enhancement of the transport properties. Several examples were reported regarding the advantages of microwaves to enhance the diffusion of polar molecules and anions through solid materials. In these examples disruption of hydrogen bonds and other kind of intermolecular interactions by the effect of the oscillating field were adduced /JAC95/. However, only one example has been found in the literature where a system composed by fluids was considered. The authors explained the reactivity enhancements in the catalytic transfer hydrogenation of soybean oil using microwave irradiation as an enhancement of the transport properties between the system oil-water-catalyst /LES94/. Nevertheless no experimental measurements of the mass transfer coefficients were done in order to confirm the hypothesis. • Hot Spots. A heterogeneous system is anisotropic if regarded to the dielectric loss of the medium. As a result a different dissipation of the electric field into heat in different domains is expected, leading theoretically to temperature gradients inside the system. Nevertheless, the presence of zones with a higher temperature than others (called hot spots) must be subjected to the heat transfer processes between domains. Under conditions where very high heat transfer coefficients were achieved a possible hot spot would be cancelled by the exchange of heat from the hot zones to the cold zones until reaching the thermal equilibrium. Only in a system where the heat transfer would be hindered, it would be possible to have the presence of a steady hot spot able to enhance the rate of the chemical reaction happening in its surrounding. Therefore, the presence of molecular hot spots by coupling of the radiation with certain reactants in a homogeneous liquid phase reported by some authors /BAG90/,/BER91/ seem to have no scientific fundament. The oscillations produced by the radiation in these target molecules would be instantaneously transferred by collisions with the adjacent molecules, reaching at the same moment the thermal equilibrium. Another kind of discussion is necessary if processes with solid phases are considered. In this case much higher resistances to the heat transfer are involved and the possibility of the stationary presence of hot-spots should be contemplated. A differentiation between two kinds of hot spots was done in literature /HAJ06/. Under the designation of macroscopic hot spots all large non-isothermalities which can be detected and measured by use of optical pyrometers (Optical fibre or IR) were considered. Some authors using these analytical techniques detected under microwave irradiation thermal gradients between a liquid and a submerged solid phase /LUK03/ or in different regions of an alumina-potassium acetate solid system /STU96-1/. Microscopic hot spots were considered the second category. They are non measurable non-isothermalities in the micro-nanoscale (e.g. supported metal nanoparticles inside a catalyst pellet) or in the molecular scale (e.g. a polar group on a catalyst structure). This kind of effect has been to date just postulated in several gas phase catalytic reactions (see chapter 2.2.3.6 from this work) since no direct experimental measurement is possible. Some theoretical and experimental approaches towards the clarification of the hot spot effect in heterogeneous catalysts have been published. Nevertheless, as one of the principal parts of this thesis, a deeper discussion
Chapter 2. State of the art 17
with a wider literature review about the fundamentals, possibilities and parameters affecting the presence of hot spots will be enclosed during the last chapter of this work.
2.2.2.2 Specific or athermal effects
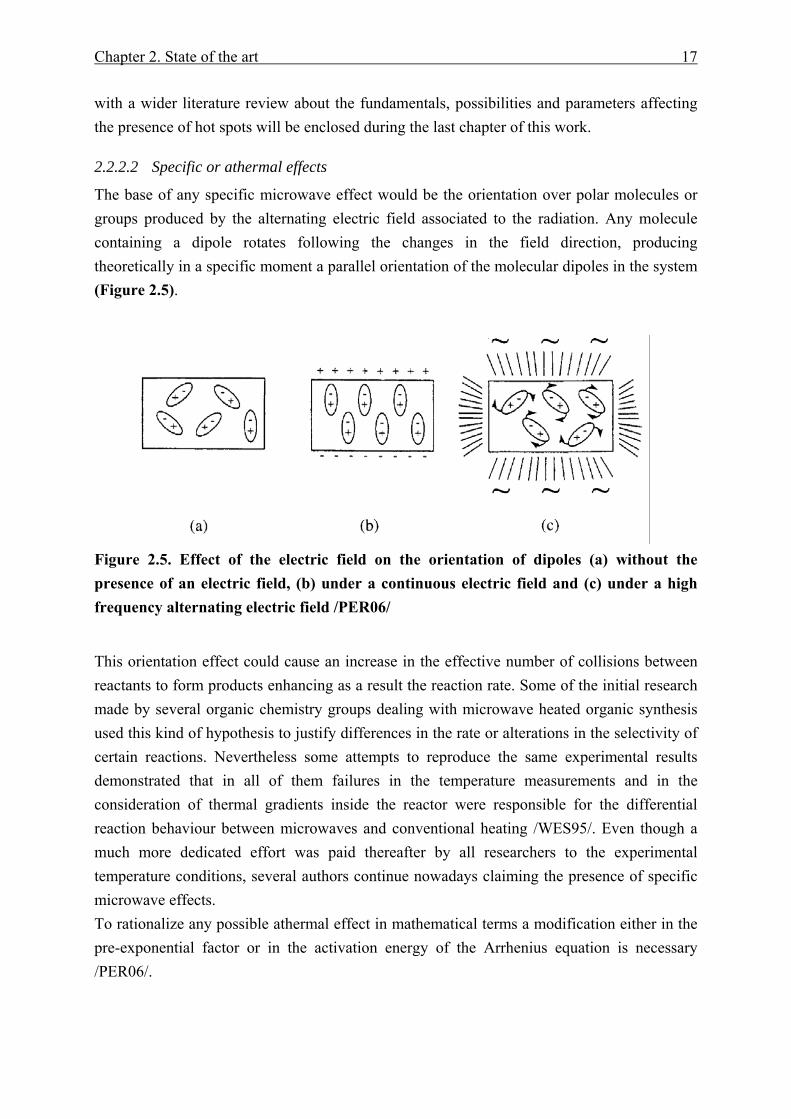
The base of any specific microwave effect would be the orientation over polar molecules or groups produced by the alternating electric field associated to the radiation. Any molecule containing a dipole rotates following the changes in the field direction, producing theoretically in a specific moment a parallel orientation of the molecular dipoles in the system (Figure 2.5).
Figure 2.5. Effect of the electric field on the orientation of dipoles (a) without the presence of an electric field, (b) under a continuous electric field and (c) under a high frequency alternating electric field /PER06/
This orientation effect could cause an increase in the effective number of collisions between reactants to form products enhancing as a result the reaction rate. Some of the initial research made by several organic chemistry groups dealing with microwave heated organic synthesis used this kind of hypothesis to justify differences in the rate or alterations in the selectivity of certain reactions. Nevertheless some attempts to reproduce the same experimental results demonstrated that in all of them failures in the temperature measurements and in the consideration of thermal gradients inside the reactor were responsible for the differential reaction behaviour between microwaves and conventional heating /WES95/. Even though a much more dedicated effort was paid thereafter by all researchers to the experimental temperature conditions, several authors continue nowadays claiming the presence of specific microwave effects. To rationalize any possible athermal effect in mathematical terms a modification either in the pre-exponential factor or in the activation energy of the Arrhenius equation is necessary /PER06/.
18 2. State of the art
⎟⎠⎞
⎜⎝⎛ −=
RTEaexpkk 0
(2.6)
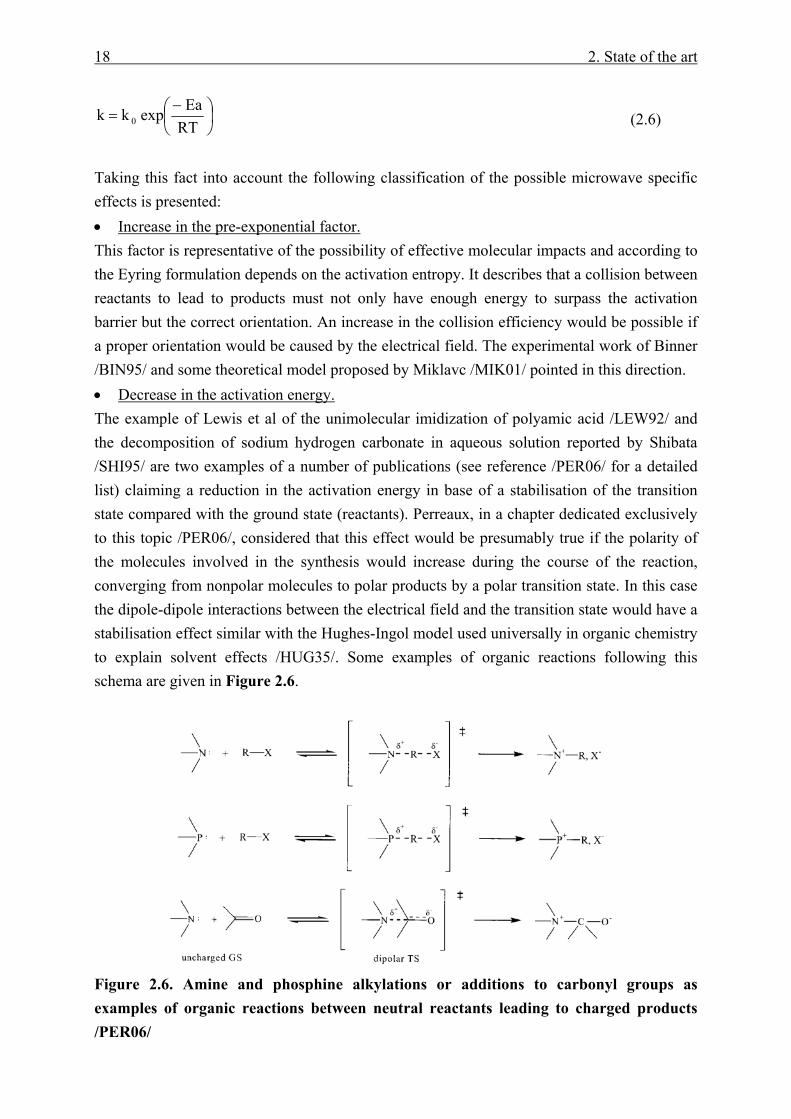
Taking this fact into account the following classification of the possible microwave specific effects is presented: • Increase in the pre-exponential factor. This factor is representative of the possibility of effective molecular impacts and according to the Eyring formulation depends on the activation entropy. It describes that a collision between reactants to lead to products must not only have enough energy to surpass the activation barrier but the correct orientation. An increase in the collision efficiency would be possible if a proper orientation would be caused by the electrical field. The experimental work of Binner /BIN95/ and some theoretical model proposed by Miklavc /MIK01/ pointed in this direction. • Decrease in the activation energy. The example of Lewis et al of the unimolecular imidization of polyamic acid /LEW92/ and the decomposition of sodium hydrogen carbonate in aqueous solution reported by Shibata /SHI95/ are two examples of a number of publications (see reference /PER06/ for a detailed list) claiming a reduction in the activation energy in base of a stabilisation of the transition state compared with the ground state (reactants). Perreaux, in a chapter dedicated exclusively to this topic /PER06/, considered that this effect would be presumably true if the polarity of the molecules involved in the synthesis would increase during the course of the reaction, converging from nonpolar molecules to polar products by a polar transition state. In this case the dipole-dipole interactions between the electrical field and the transition state would have a stabilisation effect similar with the Hughes-Ingol model used universally in organic chemistry to explain solvent effects /HUG35/. Some examples of organic reactions following this schema are given in Figure 2.6.
Figure 2.6. Amine and phosphine alkylations or additions to carbonyl groups as examples of organic reactions between neutral reactants leading to charged products /PER06/
Chapter 2. State of the art 19
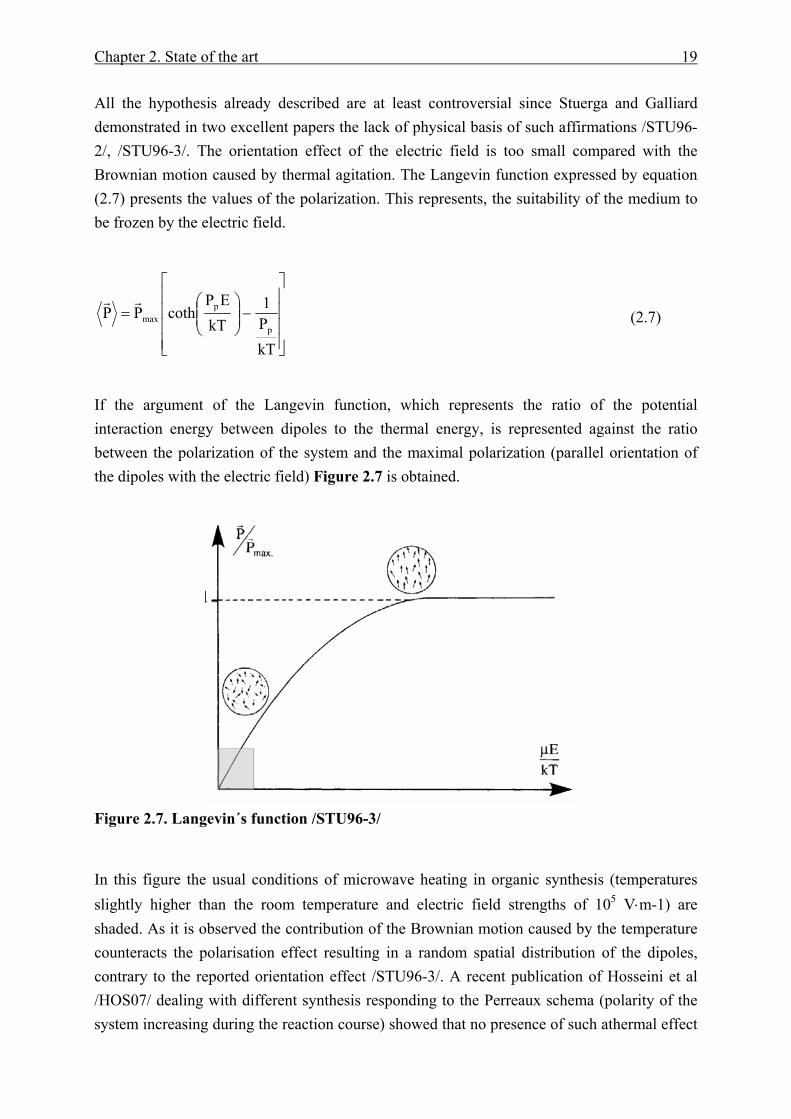
All the hypothesis already described are at least controversial since Stuerga and Galliard demonstrated in two excellent papers the lack of physical basis of such affirmations /STU96-2/, /STU96-3/. The orientation effect of the electric field is too small compared with the Brownian motion caused by thermal agitation. The Langevin function expressed by equation (2.7) presents the values of the polarization. This represents, the suitability of the medium to be frozen by the electric field.
If the argument of the Langevin function, which represents the ratio of the potential interaction energy between dipoles to the thermal energy, is represented against the ratio between the polarization of the system and the maximal polarization (parallel orientation of the dipoles with the electric field) Figure 2.7 is obtained.
Figure 2.7. Langevin´s function /STU96-3/
In this figure the usual conditions of microwave heating in organic synthesis (temperatures slightly higher than the room temperature and electric field strengths of 105 V⋅m-1) are shaded. As it is observed the contribution of the Brownian motion caused by the temperature counteracts the polarisation effect resulting in a random spatial distribution of the dipoles, contrary to the reported orientation effect /STU96-3/. A recent publication of Hosseini et al /HOS07/ dealing with different synthesis responding to the Perreaux schema (polarity of the system increasing during the reaction course) showed that no presence of such athermal effect
⎥⎥⎥⎥
⎦
⎤
⎢⎢⎢⎢
⎣
⎡
−⎟⎟⎠
⎞⎜⎜⎝
⎛=
kTP1
kTEP
cothPPp
pmax
rr
(2.7)
20 2. State of the art
could be measured. In the latter publication the use of the same optical fibre sensor to control the temperature in the conventional and microwave heated reactions proved to be a very precise, accurate and well documented way of measuring the experimental temperature. Again a possible failure in the temperature control and measurement of the reaction would be the responsible of the postulations of non-thermal microwave effects.
2.2.3 Application of microwaves in organic synthesis
The exploitation of microwave irradiation in organic chemistry has increased in the last 5 years dramatically. In almost all possible synthetic fields examples of better reaction performances under this heating method can be found. In this section however, only some of the most representative and interesting examples are included.
2.2.3.1 Solvent-free reactions
Eliminating a solvent from a reaction provides several advantages from different points of view. Less production of wastes, the reduction of the high time and resources consuming work-up procedures, a reduction in the energy consumption to heat the reaction and a reaction rate increase caused by the high concentration of the reactants. These kinds of organic synthesis are divided in: a) liquid phase reactions, where the pure reactants are mixed together with the catalyst (if it is necessary) and b) surface reactions, where the reactants are adsorbed on a solid phase that could act as a reaction support, as a catalyst if doped with active species or reagents and as a microwave energy sink in the case of microwave heated reactions. Some of the effects listed at the beginning of this paragraph provide an enhancement in the reaction performance independently of the heating method used. Thereby, an individual consideration of the microwave effects in these kind of synthesis is necessary. Only the enhancements derived from the flash heating achieved by microwaves could be expected in the liquid phase solvent-free reactions. Nevertheless, a high localised energy input can achieved in the surface reactions, even more if in some of the cases the support is microwave transparent (silica, alumina, zeolite or clay). As a result the reagents can reach much higher temperatures, accelerating the reaction to an extent not reached by the conventional methods. A wide compilation of cycloadditions and heterocyclic chemistry examples showing the advantages of solvent free reactions under microwaves was recently published /BAZ06/, /BOU06/. Moreover, some attempts of solvent free reactions scaling up were reported by Cléophax et al. /CLE00/.
2.2.3.2 Multicomponent reactions
A new challenge for the synthetic community is the multi-step single operation construction of complex molecules in which several bonds are formed in one sequence without isolating the intermediates. These processes called tandem (multicomponent or single pot) reactions
Chapter 2. State of the art 21
reduce the amount of residues produced and the amount of required work-up procedures enabling an ecologically and economically way of organic compounds production. This kind of synthetic processes is classified according with the order in which the different reactions occur: a) Tandem domino reactions are processes in which every reaction step provides the necessary structural change to begin the following synthetic step, b) tandem consecutive reactions in contrast require the modification of the reaction conditions or the addition of supplementary reagents after every step to continue with the synthetic sequence, and c) tandem sequential reactions require the addition of a supplementary reactant after finishing every step to follow with the synthetic changes. Normally, thermal instability of the starting materials often limits the reaction temperature, decreasing therefore the time efficiency of the synthesis. In order to circumvent this fact the utilisation of microwave heating to accelerate the heating rate and therefore to reduce the reaction times was adopted. Using this kind of heating method and frequently solvent-free conditions a number of nitrogen containing heterocycles (e.g imidazole synthesis) and oxygen containing heterocycles were synthesized in a time scale of several minutes /BOE06/.
2.2.3.3 Ionic liquids
An ionic liquid is not more than a liquid consisting of ions. In order not to include the molten salts in this definition some additional remarks must be done. While a molten salt is generally thought to refer to a high-melting, highly viscous and very corrosive medium, ionic liquids are already liquid at low temperatures (less than 100°C) and have relatively low viscosity. Due to their low toxicity, low vapour pressure, recyclability and good solvating properties, these compounds are included into the new strategies in green chemistry to substitute the traditional, toxic and high volatile organic solvents. As it can be easily discerned their ionic character let them be coupled with microwave irradiation in a straightforward way. As a result, ionic liquids seem to be a promising tool to be used either as solvents and reactants for microwave-promoted synthesis or as a sensitizer, helping in the action of heating non-polar mixtures under microwave irradiation. Leadbeater et al. reviewed recently several examples of both ionic liquid applications /LEA06/.
2.2.3.4 Combinatorial chemistry
Promoted by the necessity of a rapid scanning and testing of new lead molecules in drug research and medicinal chemistry, different strategies for the fast generation, working-up and testing of compound libraries have captured the attention of the organic chemistry community (research and industry). All these strategies grouped under the definition of combinatorial chemistry have adopted every different technology which could contribute to optimise these sometimes high time consuming techniques. The application of solid supported synthesis /DÖR02/ (the lead molecule is created in the surface of a solid phase being cleavaged and
22 2. State of the art
transferred to the liquid phase after its synthesis) and polymer supported reagents /KIR01/ (the reaction and purification of the molecule takes place in the liquid phase promoted by reactants, catalysts or scavengers supported in a polymer resin) have reduced to filtration and washing the tedious working-up procedures required in homogeneous reactions. Automation of the laboratory procedures is another of the recent fields of interest of combinatorial chemistry since a high reproducibility level and an optimised performance of all the preparatory and working up steps are possible by the use of robots and special devices. Obviously an improvement in the reaction times was the cornerstone missing in this technology. To fulfil this necessity the application of high-speed synthesis using microwave dielectric heating has been adopted. An increase number of examples dealing with the generation of compound libraries using microwave irradiation can be found in literature /KAP05/. The combination of all these technologies has lead to the creation of several commercial laboratory platforms (CEM ExplorerTM /CEM07/, SWAVETM /CHE07/) able to perform a high number of parallel microwave assisted synthesis including in the latter preparation, reaction and working-up procedures in an automated way.
2.2.3.5 Polymer chemistry
Polymer processing has been the field of chemistry taken more advantage of microwave dielectric heating as an alternative energy input source. Curing processes showed better performances under volumetric heat by elimination of the thermal gradients inside the material caused by conventional heating methods. In this way a homogeneous crosslinking distribution and therefore different material properties /THO99/ are reached. Taking advantage of the same concept, reactions of polymerization were performed successfully in short reaction times, decreasing the number of side reactions and as a result offering homogeneous distributions of molecular weight, polydispersity, etc, and affecting therefore the derived thermal and mechanical properties of the material /WIE04/.
2.2.3.6 Catalysis
• Homogeneous catalysis. A tremendous increase in the number of publications in the field of microwave assisted transition metal catalysed reactions in a homogeneous phase has been observed in the last years /NIL06/. With this palladium, copper and nickel catalysed reactions it is possible to form carbon-carbon and carbon-heteroatom bonds that previously were very difficult to create. Using conventional heating, very high time consuming procedures were necessary. In contrast, the utilisation of flash microwave heating procedures has solved this problem. The high coupling of the catalyst and/or the reaction media allows performing these synthesis at higher temperatures and therefore in reduced times. As an alternative to metal-ligand systems, the activity of certain researching groups has been focused in the use of small chiral molecules as catalysts, field denominated Organocatalysis /BER05/. Catalytic reactions under these conditions needed long processing times and a high
Chapter 2. State of the art 23
amount of catalyst if performed under conventional heating, being therefore a possible target of microwave chemistry. Only 4 examples of this kind of catalysis under microwave irradiation have been found in literature. The first three /WES05/, /ROD06/, /MOS06/ reported increases in the reaction rate under the presence of microwaves as well as the diminution of the amount of catalyst. Assuming the same measured temperature between oil heated reaction and microwave heated ones, the differences were attributed either to athermal effects or to the faster heating rate achieved under microwave heating. Nevertheless these suppositions seem unfounded. On the one hand, considering the small amount of reaction volume it was used it seems not reasonable to believe that a change in the heating rate from microwave to an oil bath could achieve a temperature lag able to decrease the reaction time from hours to minutes, as published. On the other hand the use of an external cooling device and an IR sensor, as described by the authors, is a corroborated failure source in the temperature measurements. Leadbeater et al., performing microwave heating experiments using always the same cavity and the same reactor, measured temperature differences up to 30°C between values recorded with a fibre optic placed in the bulk liquid and surface measurements by an IR-sensor if an outer reactor cooling was used /LEA05/. In a recent publication Hosseini et al., using an optic fibre sensor placed in the bulk liquid for conventional and microwave heated reactions with or without external cooling /HOS07/, reproduced similar reactions finding differences neither in the rate nor in the selectivity if the temperature of the bulk liquid was kept at the same value. • Heterogeneous catalysis Several attempts have been made in the world of synthetic chemistry to mix the action of a heterogeneous catalyst and dielectric heating. Nevertheless, most of this effort was based more in the working-up advantages provided by a catalyst in a solid phase and the principle “let’s try with microwaves and see what happens” than in a specific strategy towards the understanding and utilisation of them. The inclusion of new energy sources like microwaves in the list of possible tools in the intensification of industrial processes has attracted the focus of chemical engineers. A better understanding of the synergic effect of dielectric heating and heterogeneous catalysis is necessary to provide the process engineers with tools to optimise the construction and operation of chemical plants based in microwave heated reactors. As a result in this revision of the state of the art in microwave heterogeneous catalysed reactions, only publications with a focus in the insights of the interaction between microwave radiation and solid catalysts will be included. A long number of synthetic papers dealing more with the synthetic possibilities of using these kind of processes than with the fundaments of its operation have been excluded. - Liquid phase reactions. Chemat et al. developed during the late 90s several esterifications under conventional and microwave heating catalysed by homogeneous (sulphuric acid) and heterogeneous catalysts (Montmorillonite). Either in the reaction of Acetic acid with n-propanol /CHE96/ or in the esterification of stearic acid with 1-butanol /CHE97/ an
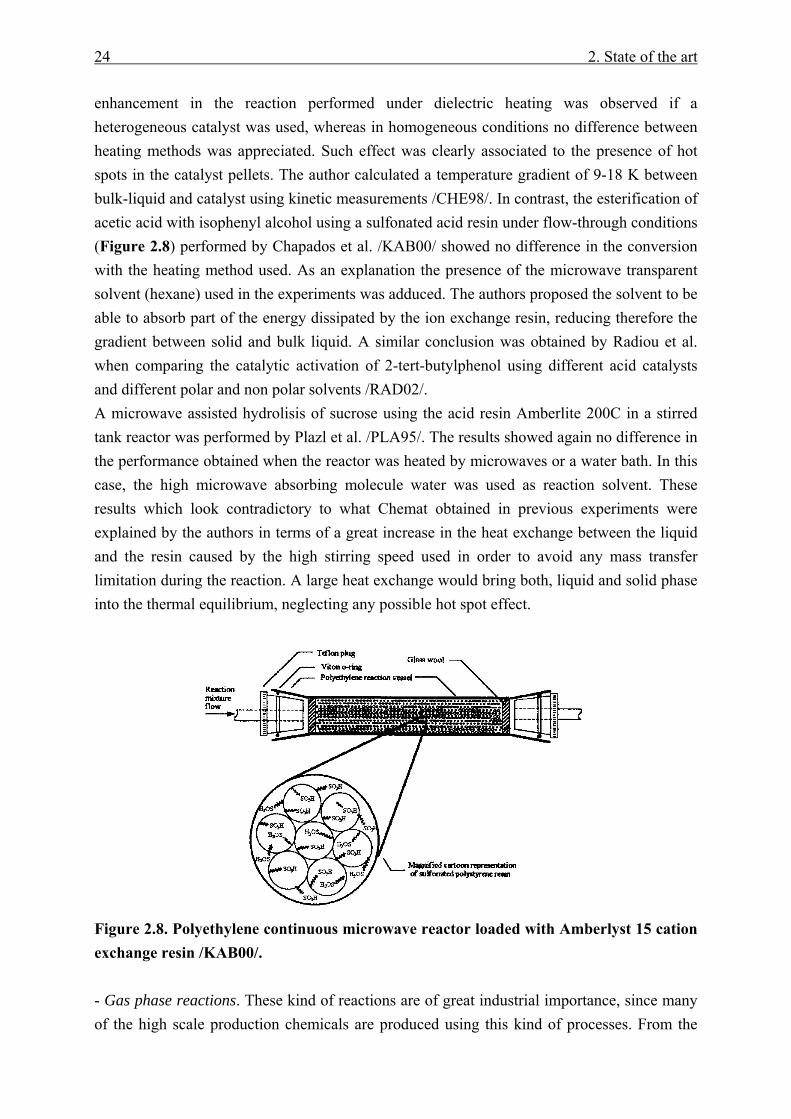
24 2. State of the art
enhancement in the reaction performed under dielectric heating was observed if a heterogeneous catalyst was used, whereas in homogeneous conditions no difference between heating methods was appreciated. Such effect was clearly associated to the presence of hot spots in the catalyst pellets. The author calculated a temperature gradient of 9-18 K between bulk-liquid and catalyst using kinetic measurements /CHE98/. In contrast, the esterification of acetic acid with isophenyl alcohol using a sulfonated acid resin under flow-through conditions (Figure 2.8) performed by Chapados et al. /KAB00/ showed no difference in the conversion with the heating method used. As an explanation the presence of the microwave transparent solvent (hexane) used in the experiments was adduced. The authors proposed the solvent to be able to absorb part of the energy dissipated by the ion exchange resin, reducing therefore the gradient between solid and bulk liquid. A similar conclusion was obtained by Radiou et al. when comparing the catalytic activation of 2-tert-butylphenol using different acid catalysts and different polar and non polar solvents /RAD02/. A microwave assisted hydrolisis of sucrose using the acid resin Amberlite 200C in a stirred tank reactor was performed by Plazl et al. /PLA95/. The results showed again no difference in the performance obtained when the reactor was heated by microwaves or a water bath. In this case, the high microwave absorbing molecule water was used as reaction solvent. These results which look contradictory to what Chemat obtained in previous experiments were explained by the authors in terms of a great increase in the heat exchange between the liquid and the resin caused by the high stirring speed used in order to avoid any mass transfer limitation during the reaction. A large heat exchange would bring both, liquid and solid phase into the thermal equilibrium, neglecting any possible hot spot effect.
Figure 2.8. Polyethylene continuous microwave reactor loaded with Amberlyst 15 cation exchange resin /KAB00/. - Gas phase reactions. These kind of reactions are of great industrial importance, since many of the high scale production chemicals are produced using this kind of processes. From the
Chapter 2. State of the art 25
first reports on microwave catalysis in gas phase reported by Roussy using different transformations like isomerizations of hexane, 2-methylpentane, 2-methyl-2-pentene and the hydrogenolisis of metyl cyclopentane /ROU95/ several authors focused their studies in this kind of transformations. The most widely studied reaction is without doubt the oxidative coupling of methane to yield C2 and higher hydrocarbons. For this reaction, some researching groups used several kinds of rare earth oxides-based catalysts under microwaves. They were able to reach under microwave heating similar conversion levels than in a conventional heated reaction but using lower operation temperatures /BON93/, /ZHA03-1/. All of them proposed the existence of thermal gradients between the gas phase and the solid catalyst as an explanation of the obtained results. The same effect, where similar yields or the appearance of the desired products was detected at a lower threshold temperature, was reported for several other authors for different microwave irradiated reactions. Among others the partial oxidation of methane to syngas over Ni and Co catalysts /JBI99/, the production of alcohols and other oxygenates using the catalytic reaction between carbon dioxide and water vapour /JBI99/ or the reaction of 2-propanol to propanone and propene over alkali-metal-doped catalysts /WAN91/ are worth to be mentioned. In all these cases, again the differences were associated to the presence of solid-gas temperature gradients as severe as some hundreds of Kelvin in the case of carbon dioxide-water vapour reaction. Zhang et al /ZHA03-2/ observed a shift in the equilibrium constant in the endothermic decomposition of H2S catalyzed by MoS2-Al2O3,
justifying such results again by the presence of hot-spots. Using the temperature dependence of the equilibrium constant, the author calculated a rough estimation of the temperature gradient to be in the order of 100-200 K. Finally it is noteworthy to remark that in most of the publications presented the presence of hot spots was only hypothesized but not measured. But also is necessary to remember that the high temperature reached by the solids in gas phase heterogeneous catalysed exothermic reactions and gas-solid reactions under conventional heating is a well known phenomenon supported by the lower heat transfer coefficients of the gases compared with liquids.
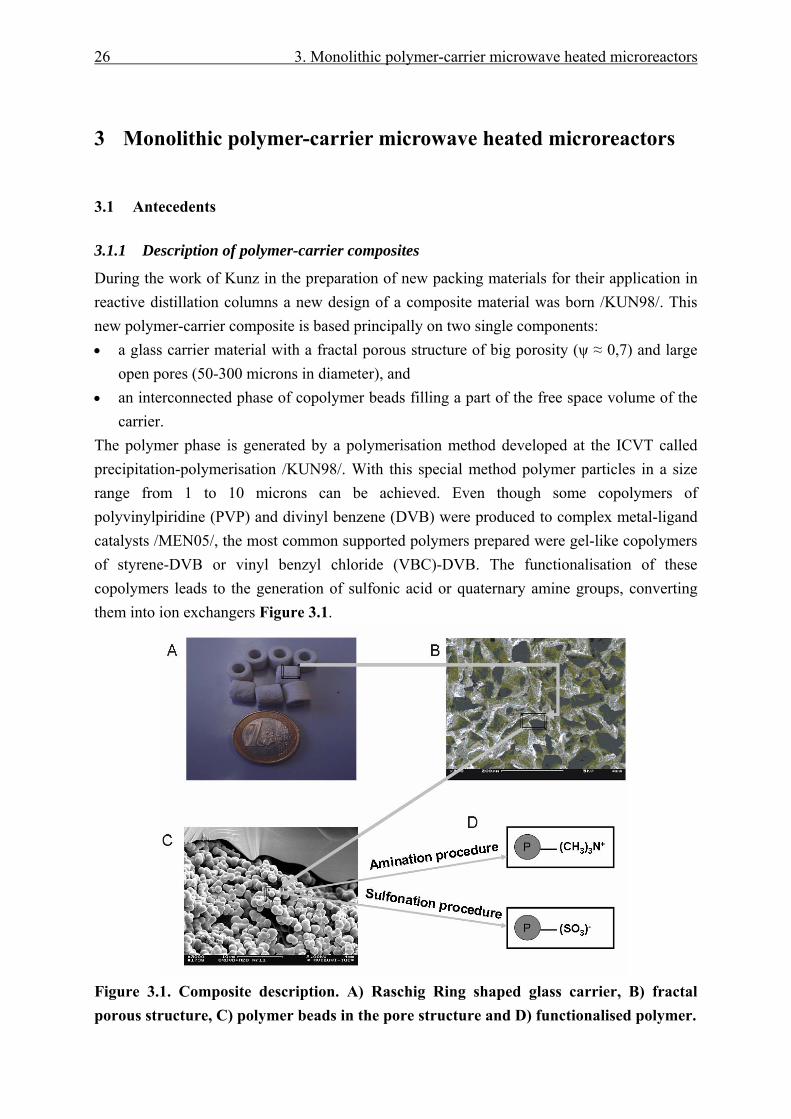
26 3. Monolithic polymer-carrier microwave heated microreactors
3 Monolithic polymer-carrier microwave heated microreactors
3.1 Antecedents
3.1.1 Description of polymer-carrier composites
During the work of Kunz in the preparation of new packing materials for their application in reactive distillation columns a new design of a composite material was born /KUN98/. This new polymer-carrier composite is based principally on two single components: • a glass carrier material with a fractal porous structure of big porosity (ψ ≈ 0,7) and large
open pores (50-300 microns in diameter), and • an interconnected phase of copolymer beads filling a part of the free space volume of the
carrier. The polymer phase is generated by a polymerisation method developed at the ICVT called precipitation-polymerisation /KUN98/. With this special method polymer particles in a size range from 1 to 10 microns can be achieved. Even though some copolymers of polyvinylpiridine (PVP) and divinyl benzene (DVB) were produced to complex metal-ligand catalysts /MEN05/, the most common supported polymers prepared were gel-like copolymers of styrene-DVB or vinyl benzyl chloride (VBC)-DVB. The functionalisation of these copolymers leads to the generation of sulfonic acid or quaternary amine groups, converting them into ion exchangers Figure 3.1.
Figure 3.1. Composite description. A) Raschig Ring shaped glass carrier, B) fractal porous structure, C) polymer beads in the pore structure and D) functionalised polymer.

Chapter 3. Monolithic polymer-carrier microwave heated microreactors 27
The possibility of anchoring polar substances by means of these ionic centres was used to prepare a wide number of reagent and catalyst loaded composites, applied to a large variety of organic syntheses /KUN05/ /KUN03/. Attending to the depicted material configuration, several interesting features from an engineering point of view can be remarked: • The presence of an inorganic glass carrier offers an enhanced mechanical stability
compared with pure polymeric monoliths designed by the group of Svec and Frechet for chromatographic purposes /SVE04/.
• A polymer phase can be easily modified using the knowledge of organic synthetic chemistry providing therefore a support material with the ability to accommodate a great number of functionalities.
• The megaporous structure allows a convective flow through the composite, offering as well space enough for a free polymer swelling. As a consequence it is possible to construct flow-trough reactors with smaller pressure drops than packed bed reactors filled with commercial resin beads of the same particle diameter.
• Due to the convective flow through the pores and the decrease in the polymer particle size an enhancement of the mass transfer processes if compared with commercial resin beads was observed /SCH04/.
• The polymerisation procedure tolerates the utilisation of different carrier shapes and dimensions. The produced composites provide therefore a wide range of reactor design solutions and the possibility to scale-up the material.
A well known advantage of structured reactors (monoliths in particular) compared with packed beds is the possibility to accommodate in structured channels a catalyst amount without increasing the pressure drop. As well, the reduction of the channel size to the micrometer scale is the necessary requirement for a system to be included inside the microreaction technology field. Thereby, considering all these features it seems appropriate to describe the developed composite material and the different reactor concepts based on it as monolithic microreactors.
3.1.2 Monolithic microreactors: designs and applications
The polymer/carrier composite concept was created to substitute the commercially available ion exchange beads sewed into glass fibre cloth or wire nets as filling in reactive distillation columns. The easy and fast generation of sulfonated composites in the shape of Raschig rings created a cheaper packing material alternative. In these applications the composites formed an unstructured packed bed inside the columns Figure 3.2. With this configuration, no convective flow through the rings was achieved. The diffusion of the reactants through the carrier pores and inside the polymer particles were the dominating mass transport phenomena.
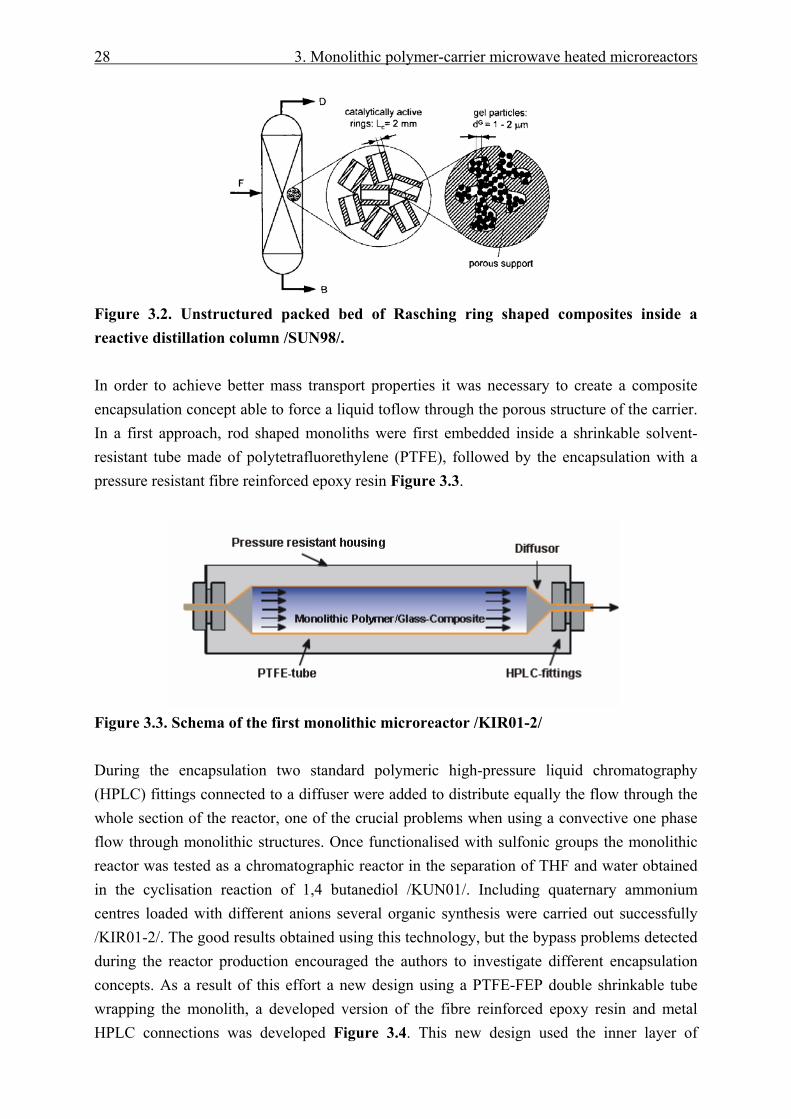
28 3. Monolithic polymer-carrier microwave heated microreactors
Figure 3.2. Unstructured packed bed of Rasching ring shaped composites inside a reactive distillation column /SUN98/. In order to achieve better mass transport properties it was necessary to create a composite encapsulation concept able to force a liquid toflow through the porous structure of the carrier. In a first approach, rod shaped monoliths were first embedded inside a shrinkable solvent-resistant tube made of polytetrafluorethylene (PTFE), followed by the encapsulation with a pressure resistant fibre reinforced epoxy resin Figure 3.3.
Figure 3.3. Schema of the first monolithic microreactor /KIR01-2/ During the encapsulation two standard polymeric high-pressure liquid chromatography (HPLC) fittings connected to a diffuser were added to distribute equally the flow through the whole section of the reactor, one of the crucial problems when using a convective one phase flow through monolithic structures. Once functionalised with sulfonic groups the monolithic reactor was tested as a chromatographic reactor in the separation of THF and water obtained in the cyclisation reaction of 1,4 butanediol /KUN01/. Including quaternary ammonium centres loaded with different anions several organic synthesis were carried out successfully /KIR01-2/. The good results obtained using this technology, but the bypass problems detected during the reactor production encouraged the authors to investigate different encapsulation concepts. As a result of this effort a new design using a PTFE-FEP double shrinkable tube wrapping the monolith, a developed version of the fibre reinforced epoxy resin and metal HPLC connections was developed Figure 3.4. This new design used the inner layer of
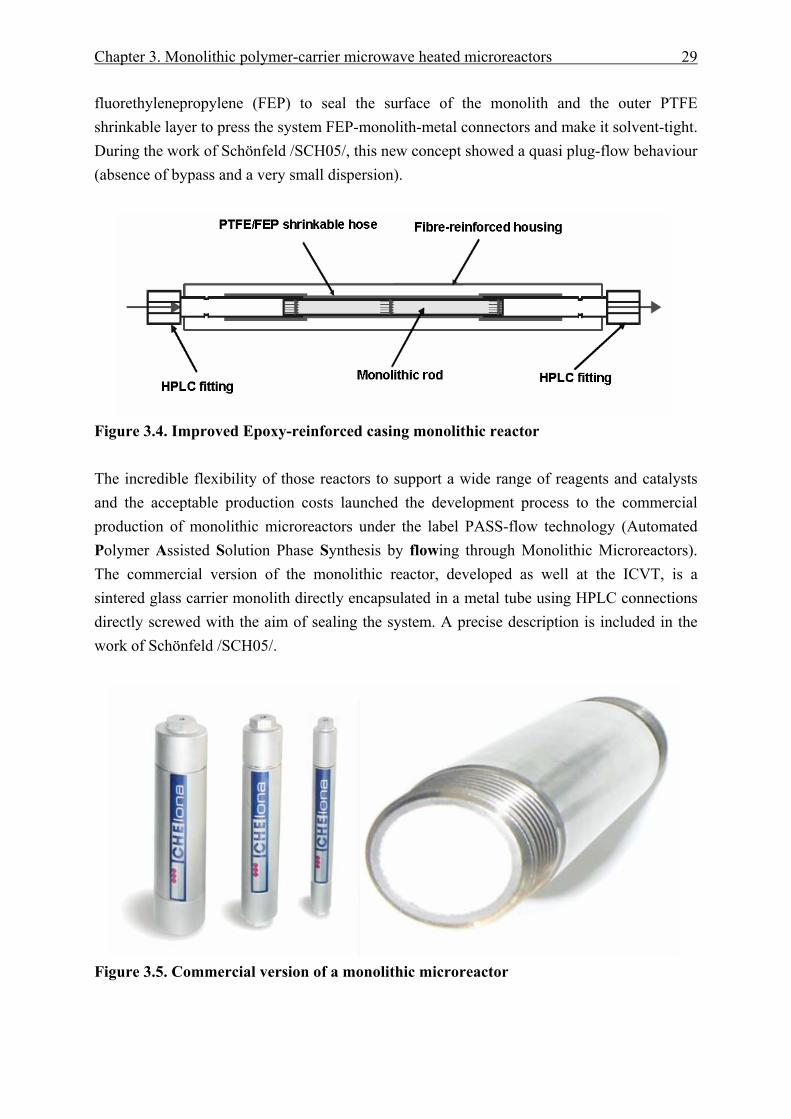
Chapter 3. Monolithic polymer-carrier microwave heated microreactors 29
fluorethylenepropylene (FEP) to seal the surface of the monolith and the outer PTFE shrinkable layer to press the system FEP-monolith-metal connectors and make it solvent-tight. During the work of Schönfeld /SCH05/, this new concept showed a quasi plug-flow behaviour (absence of bypass and a very small dispersion).
Figure 3.4. Improved Epoxy-reinforced casing monolithic reactor The incredible flexibility of those reactors to support a wide range of reagents and catalysts and the acceptable production costs launched the development process to the commercial production of monolithic microreactors under the label PASS-flow technology (Automated Polymer Assisted Solution Phase Synthesis by flowing through Monolithic Microreactors). The commercial version of the monolithic reactor, developed as well at the ICVT, is a sintered glass carrier monolith directly encapsulated in a metal tube using HPLC connections directly screwed with the aim of sealing the system. A precise description is included in the work of Schönfeld /SCH05/.
Figure 3.5. Commercial version of a monolithic microreactor
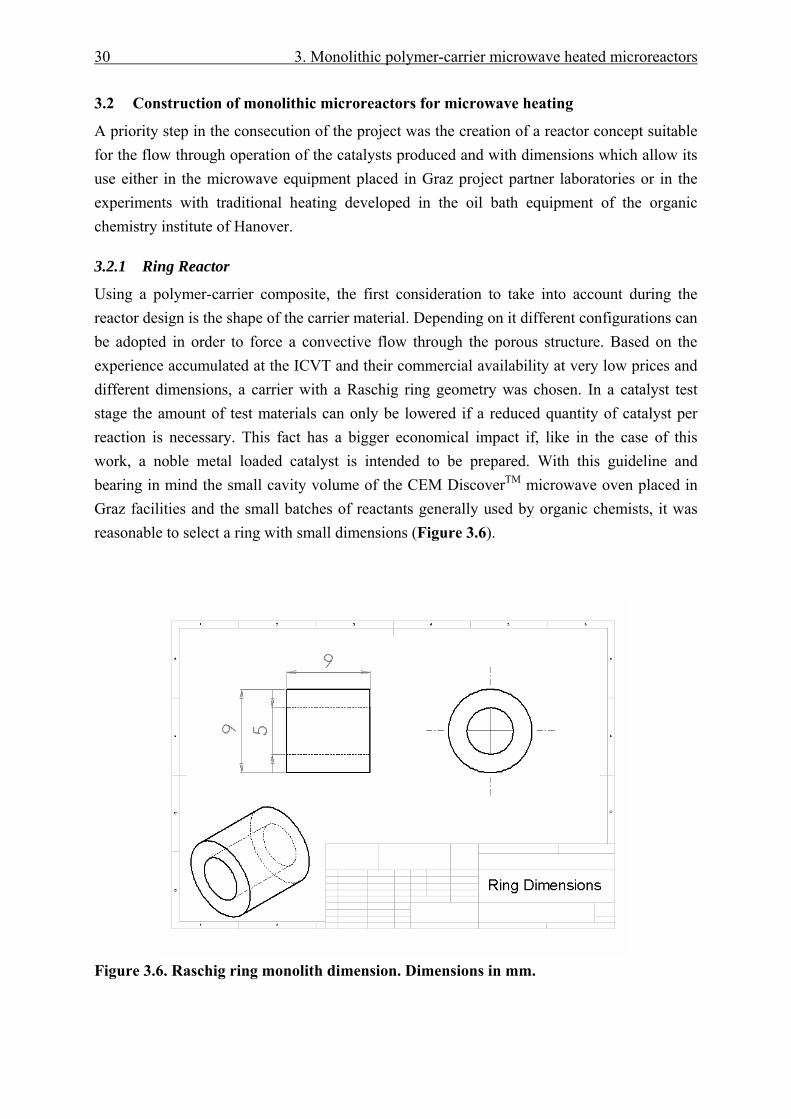
30 3. Monolithic polymer-carrier microwave heated microreactors
3.2 Construction of monolithic microreactors for microwave heating
A priority step in the consecution of the project was the creation of a reactor concept suitable for the flow through operation of the catalysts produced and with dimensions which allow its use either in the microwave equipment placed in Graz project partner laboratories or in the experiments with traditional heating developed in the oil bath equipment of the organic chemistry institute of Hanover.
3.2.1 Ring Reactor
Using a polymer-carrier composite, the first consideration to take into account during the reactor design is the shape of the carrier material. Depending on it different configurations can be adopted in order to force a convective flow through the porous structure. Based on the experience accumulated at the ICVT and their commercial availability at very low prices and different dimensions, a carrier with a Raschig ring geometry was chosen. In a catalyst test stage the amount of test materials can only be lowered if a reduced quantity of catalyst per reaction is necessary. This fact has a bigger economical impact if, like in the case of this work, a noble metal loaded catalyst is intended to be prepared. With this guideline and bearing in mind the small cavity volume of the CEM DiscoverTM microwave oven placed in Graz facilities and the small batches of reactants generally used by organic chemists, it was reasonable to select a ring with small dimensions (Figure 3.6).
Figure 3.6. Raschig ring monolith dimension. Dimensions in mm.
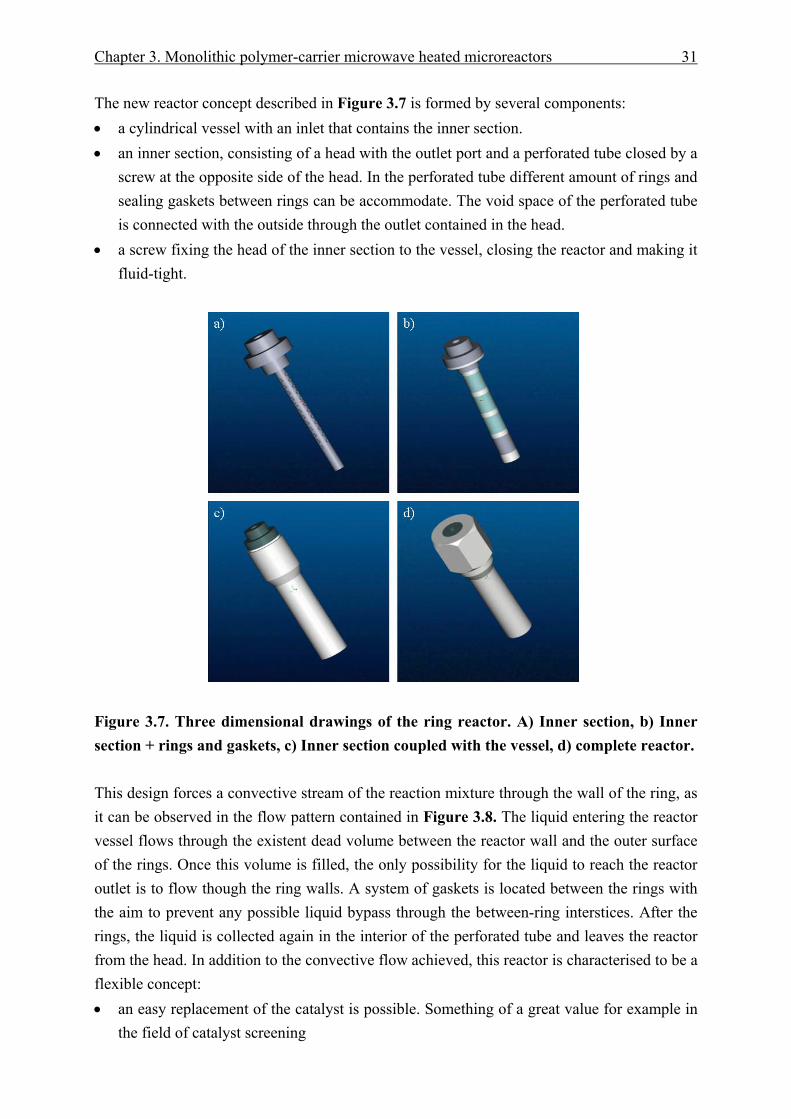
Chapter 3. Monolithic polymer-carrier microwave heated microreactors 31
The new reactor concept described in Figure 3.7 is formed by several components: • a cylindrical vessel with an inlet that contains the inner section. • an inner section, consisting of a head with the outlet port and a perforated tube closed by a
screw at the opposite side of the head. In the perforated tube different amount of rings and sealing gaskets between rings can be accommodate. The void space of the perforated tube is connected with the outside through the outlet contained in the head.
• a screw fixing the head of the inner section to the vessel, closing the reactor and making it fluid-tight.
Figure 3.7. Three dimensional drawings of the ring reactor. A) Inner section, b) Inner section + rings and gaskets, c) Inner section coupled with the vessel, d) complete reactor. This design forces a convective stream of the reaction mixture through the wall of the ring, as it can be observed in the flow pattern contained in Figure 3.8. The liquid entering the reactor vessel flows through the existent dead volume between the reactor wall and the outer surface of the rings. Once this volume is filled, the only possibility for the liquid to reach the reactor outlet is to flow though the ring walls. A system of gaskets is located between the rings with the aim to prevent any possible liquid bypass through the between-ring interstices. After the rings, the liquid is collected again in the interior of the perforated tube and leaves the reactor from the head. In addition to the convective flow achieved, this reactor is characterised to be a flexible concept: • an easy replacement of the catalyst is possible. Something of a great value for example in
the field of catalyst screening
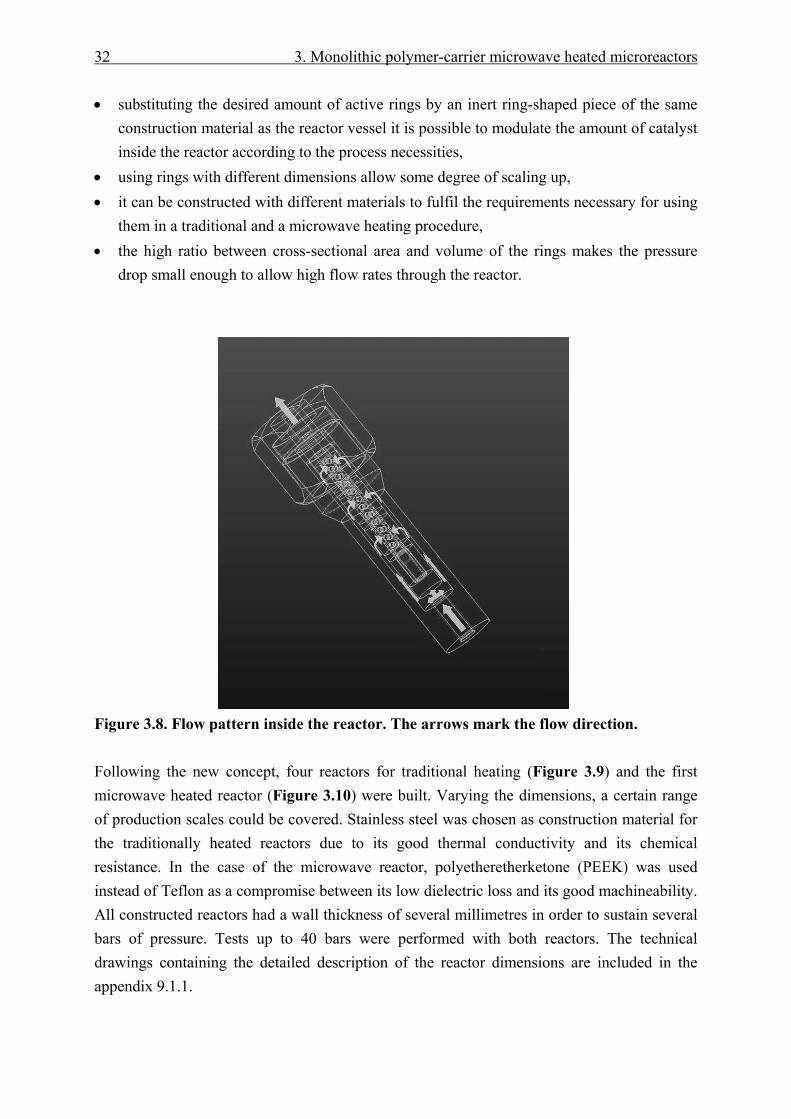
32 3. Monolithic polymer-carrier microwave heated microreactors
• substituting the desired amount of active rings by an inert ring-shaped piece of the same construction material as the reactor vessel it is possible to modulate the amount of catalyst inside the reactor according to the process necessities,
• using rings with different dimensions allow some degree of scaling up, • it can be constructed with different materials to fulfil the requirements necessary for using
them in a traditional and a microwave heating procedure, • the high ratio between cross-sectional area and volume of the rings makes the pressure
drop small enough to allow high flow rates through the reactor.
Figure 3.8. Flow pattern inside the reactor. The arrows mark the flow direction. Following the new concept, four reactors for traditional heating (Figure 3.9) and the first microwave heated reactor (Figure 3.10) were built. Varying the dimensions, a certain range of production scales could be covered. Stainless steel was chosen as construction material for the traditionally heated reactors due to its good thermal conductivity and its chemical resistance. In the case of the microwave reactor, polyetheretherketone (PEEK) was used instead of Teflon as a compromise between its low dielectric loss and its good machineability. All constructed reactors had a wall thickness of several millimetres in order to sustain several bars of pressure. Tests up to 40 bars were performed with both reactors. The technical drawings containing the detailed description of the reactor dimensions are included in the appendix 9.1.1.
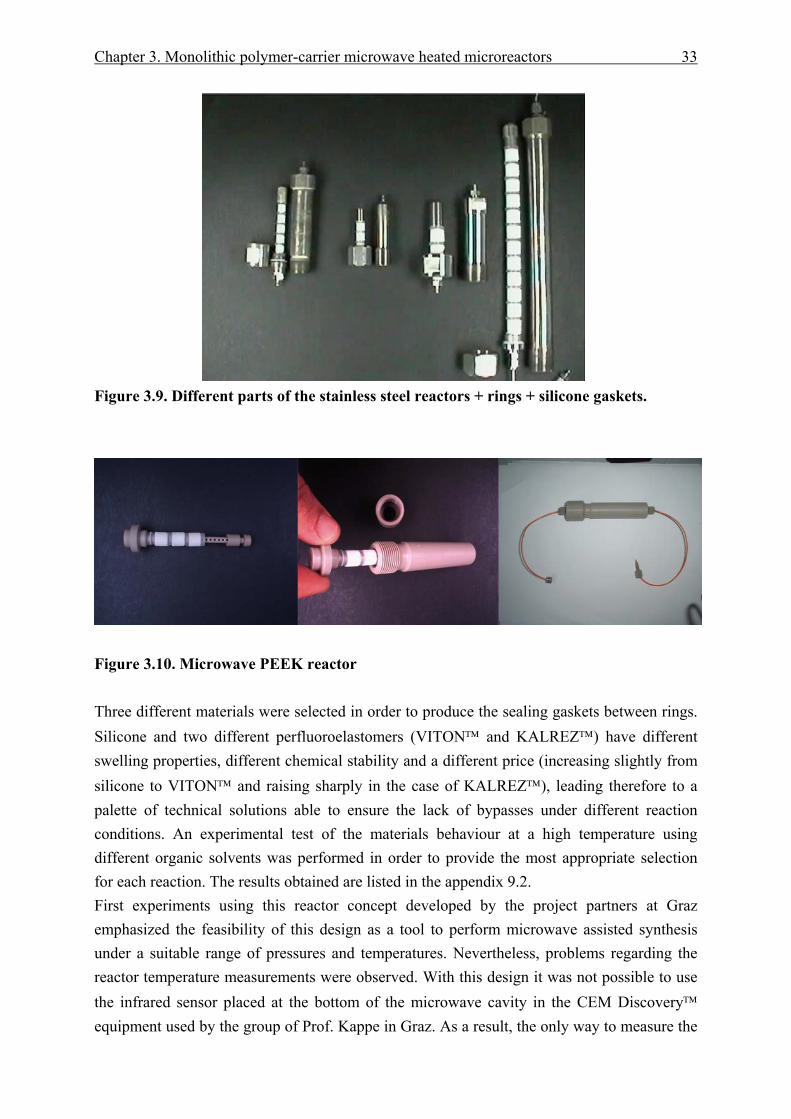
Chapter 3. Monolithic polymer-carrier microwave heated microreactors 33
Figure 3.9. Different parts of the stainless steel reactors + rings + silicone gaskets.
Figure 3.10. Microwave PEEK reactor Three different materials were selected in order to produce the sealing gaskets between rings. Silicone and two different perfluoroelastomers (VITON™ and KALREZ™) have different swelling properties, different chemical stability and a different price (increasing slightly from silicone to VITON™ and raising sharply in the case of KALREZ™), leading therefore to a palette of technical solutions able to ensure the lack of bypasses under different reaction conditions. An experimental test of the materials behaviour at a high temperature using different organic solvents was performed in order to provide the most appropriate selection for each reaction. The results obtained are listed in the appendix 9.2. First experiments using this reactor concept developed by the project partners at Graz emphasized the feasibility of this design as a tool to perform microwave assisted synthesis under a suitable range of pressures and temperatures. Nevertheless, problems regarding the reactor temperature measurements were observed. With this design it was not possible to use the infrared sensor placed at the bottom of the microwave cavity in the CEM Discovery™ equipment used by the group of Prof. Kappe in Graz. As a result, the only way to measure the
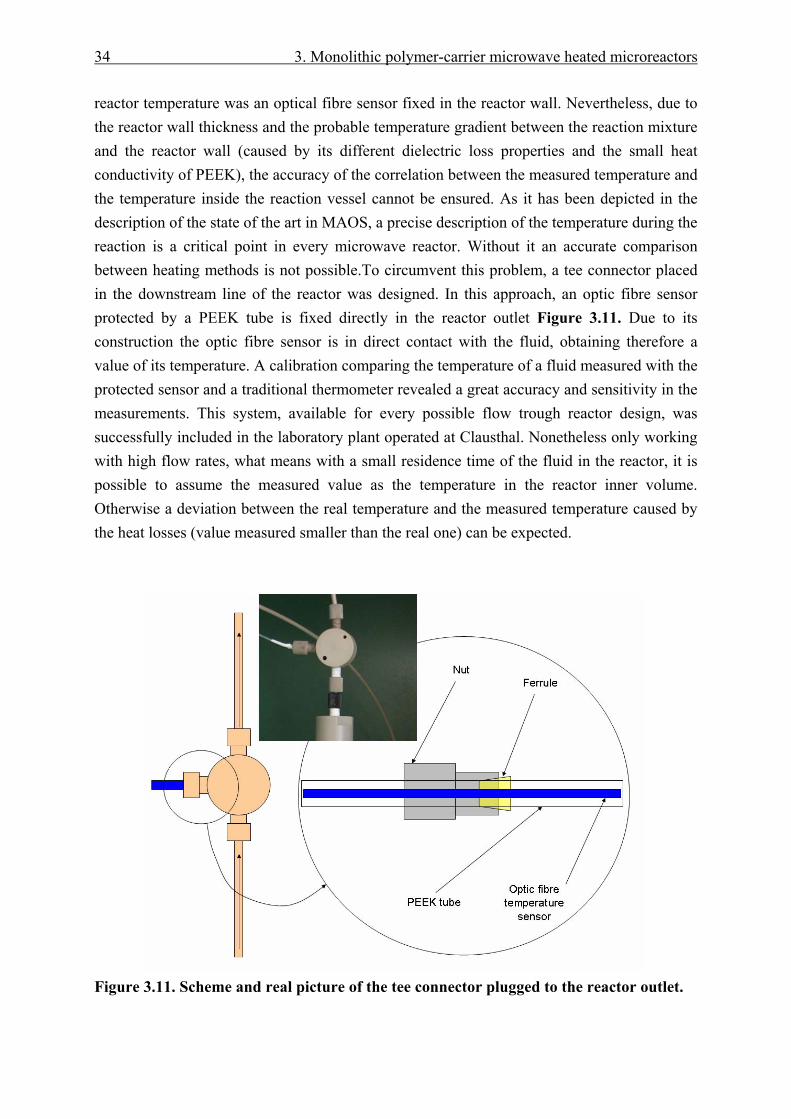
34 3. Monolithic polymer-carrier microwave heated microreactors
reactor temperature was an optical fibre sensor fixed in the reactor wall. Nevertheless, due to the reactor wall thickness and the probable temperature gradient between the reaction mixture and the reactor wall (caused by its different dielectric loss properties and the small heat conductivity of PEEK), the accuracy of the correlation between the measured temperature and the temperature inside the reaction vessel cannot be ensured. As it has been depicted in the description of the state of the art in MAOS, a precise description of the temperature during the reaction is a critical point in every microwave reactor. Without it an accurate comparison between heating methods is not possible.To circumvent this problem, a tee connector placed in the downstream line of the reactor was designed. In this approach, an optic fibre sensor protected by a PEEK tube is fixed directly in the reactor outlet Figure 3.11. Due to its construction the optic fibre sensor is in direct contact with the fluid, obtaining therefore a value of its temperature. A calibration comparing the temperature of a fluid measured with the protected sensor and a traditional thermometer revealed a great accuracy and sensitivity in the measurements. This system, available for every possible flow trough reactor design, was successfully included in the laboratory plant operated at Clausthal. Nonetheless only working with high flow rates, what means with a small residence time of the fluid in the reactor, it is possible to assume the measured value as the temperature in the reactor inner volume. Otherwise a deviation between the real temperature and the measured temperature caused by the heat losses (value measured smaller than the real one) can be expected.
Figure 3.11. Scheme and real picture of the tee connector plugged to the reactor outlet.
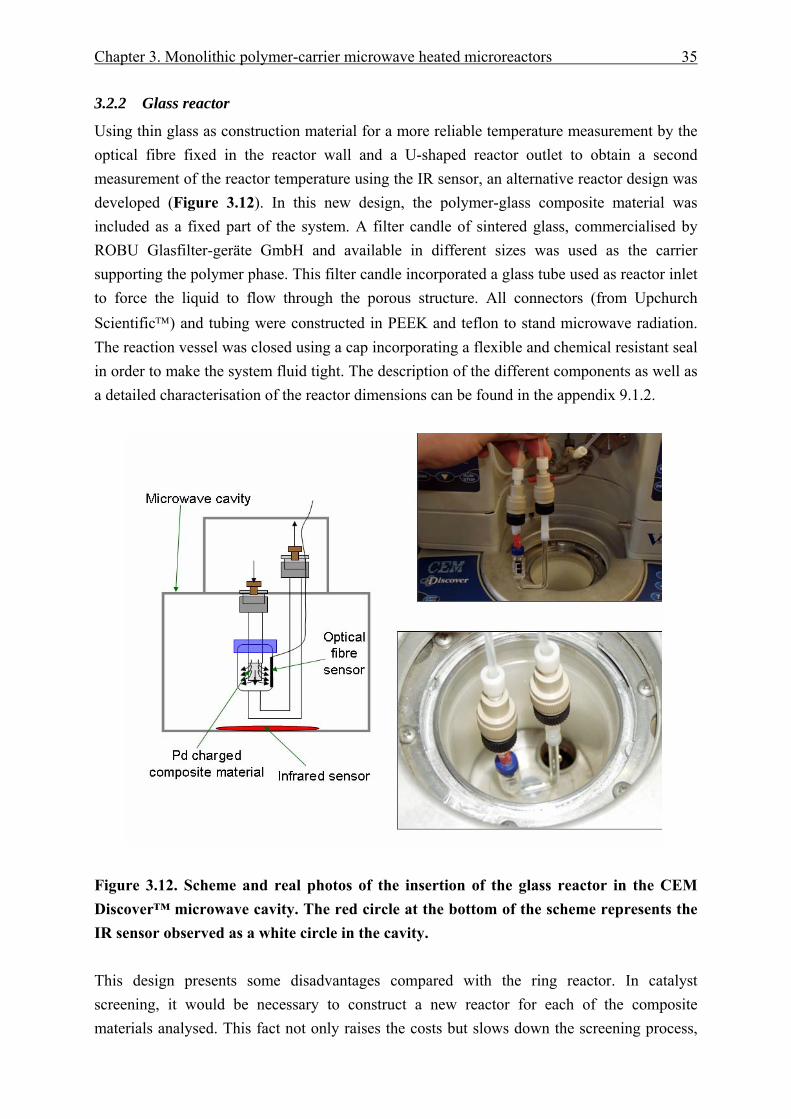
Chapter 3. Monolithic polymer-carrier microwave heated microreactors 35
3.2.2 Glass reactor
Using thin glass as construction material for a more reliable temperature measurement by the optical fibre fixed in the reactor wall and a U-shaped reactor outlet to obtain a second measurement of the reactor temperature using the IR sensor, an alternative reactor design was developed (Figure 3.12). In this new design, the polymer-glass composite material was included as a fixed part of the system. A filter candle of sintered glass, commercialised by ROBU Glasfilter-geräte GmbH and available in different sizes was used as the carrier supporting the polymer phase. This filter candle incorporated a glass tube used as reactor inlet to force the liquid to flow through the porous structure. All connectors (from Upchurch Scientific™) and tubing were constructed in PEEK and teflon to stand microwave radiation. The reaction vessel was closed using a cap incorporating a flexible and chemical resistant seal in order to make the system fluid tight. The description of the different components as well as a detailed characterisation of the reactor dimensions can be found in the appendix 9.1.2.
Figure 3.12. Scheme and real photos of the insertion of the glass reactor in the CEM Discover™ microwave cavity. The red circle at the bottom of the scheme represents the IR sensor observed as a white circle in the cavity. This design presents some disadvantages compared with the ring reactor. In catalyst screening, it would be necessary to construct a new reactor for each of the composite materials analysed. This fact not only raises the costs but slows down the screening process,

36 3. Monolithic polymer-carrier microwave heated microreactors
something completely undesired in combinatorial chemistry and drug research applications. In addition, this reactor does not stand severe pressure conditions, limiting the reactions to be performed to low temperatures when using volatile organic solvents. In contrast, the cheap laboratory glass vials used in the reactor construction allow the disposal after reaction, preventing contamination if different reactions are investigated.
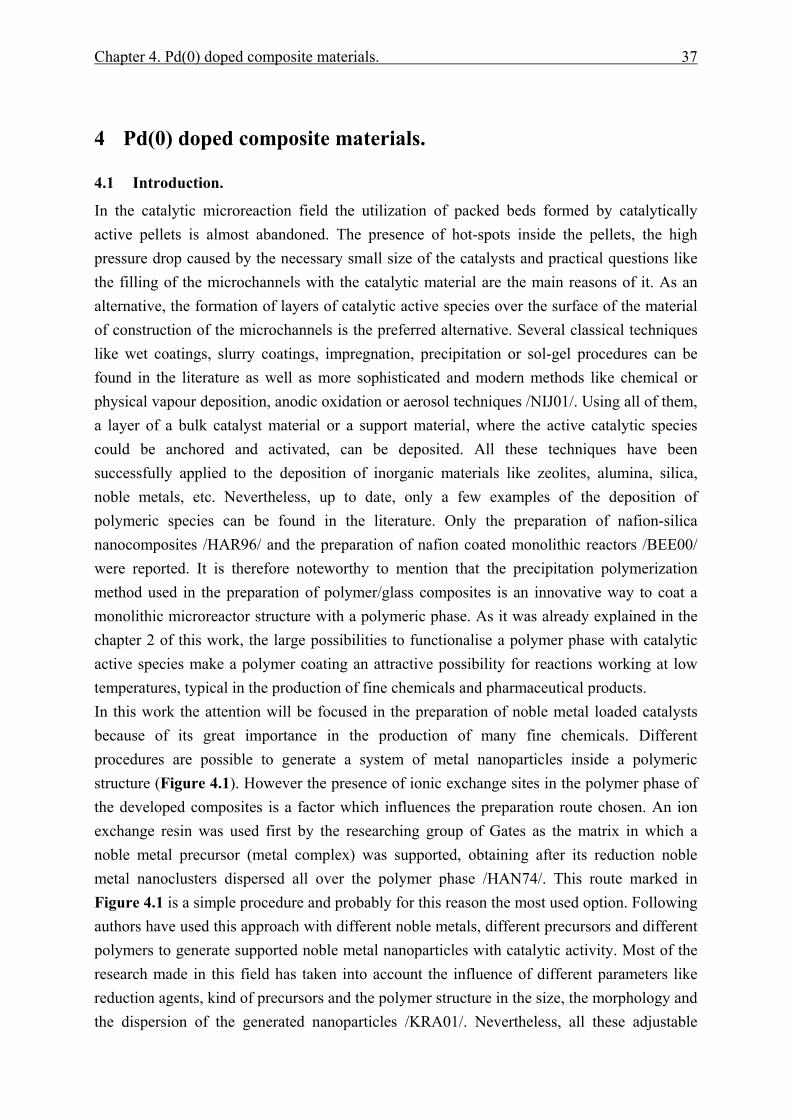
Chapter 4. Pd(0) doped composite materials. 37
4 Pd(0) doped composite materials.
4.1 Introduction.
In the catalytic microreaction field the utilization of packed beds formed by catalytically active pellets is almost abandoned. The presence of hot-spots inside the pellets, the high pressure drop caused by the necessary small size of the catalysts and practical questions like the filling of the microchannels with the catalytic material are the main reasons of it. As an alternative, the formation of layers of catalytic active species over the surface of the material of construction of the microchannels is the preferred alternative. Several classical techniques like wet coatings, slurry coatings, impregnation, precipitation or sol-gel procedures can be found in the literature as well as more sophisticated and modern methods like chemical or physical vapour deposition, anodic oxidation or aerosol techniques /NIJ01/. Using all of them, a layer of a bulk catalyst material or a support material, where the active catalytic species could be anchored and activated, can be deposited. All these techniques have been successfully applied to the deposition of inorganic materials like zeolites, alumina, silica, noble metals, etc. Nevertheless, up to date, only a few examples of the deposition of polymeric species can be found in the literature. Only the preparation of nafion-silica nanocomposites /HAR96/ and the preparation of nafion coated monolithic reactors /BEE00/ were reported. It is therefore noteworthy to mention that the precipitation polymerization method used in the preparation of polymer/glass composites is an innovative way to coat a monolithic microreactor structure with a polymeric phase. As it was already explained in the chapter 2 of this work, the large possibilities to functionalise a polymer phase with catalytic active species make a polymer coating an attractive possibility for reactions working at low temperatures, typical in the production of fine chemicals and pharmaceutical products. In this work the attention will be focused in the preparation of noble metal loaded catalysts because of its great importance in the production of many fine chemicals. Different procedures are possible to generate a system of metal nanoparticles inside a polymeric structure (Figure 4.1). However the presence of ionic exchange sites in the polymer phase of the developed composites is a factor which influences the preparation route chosen. An ion exchange resin was used first by the researching group of Gates as the matrix in which a noble metal precursor (metal complex) was supported, obtaining after its reduction noble metal nanoclusters dispersed all over the polymer phase /HAN74/. This route marked in Figure 4.1 is a simple procedure and probably for this reason the most used option. Following authors have used this approach with different noble metals, different precursors and different polymers to generate supported noble metal nanoparticles with catalytic activity. Most of the research made in this field has taken into account the influence of different parameters like reduction agents, kind of precursors and the polymer structure in the size, the morphology and the dispersion of the generated nanoparticles /KRA01/. Nevertheless, all these adjustable
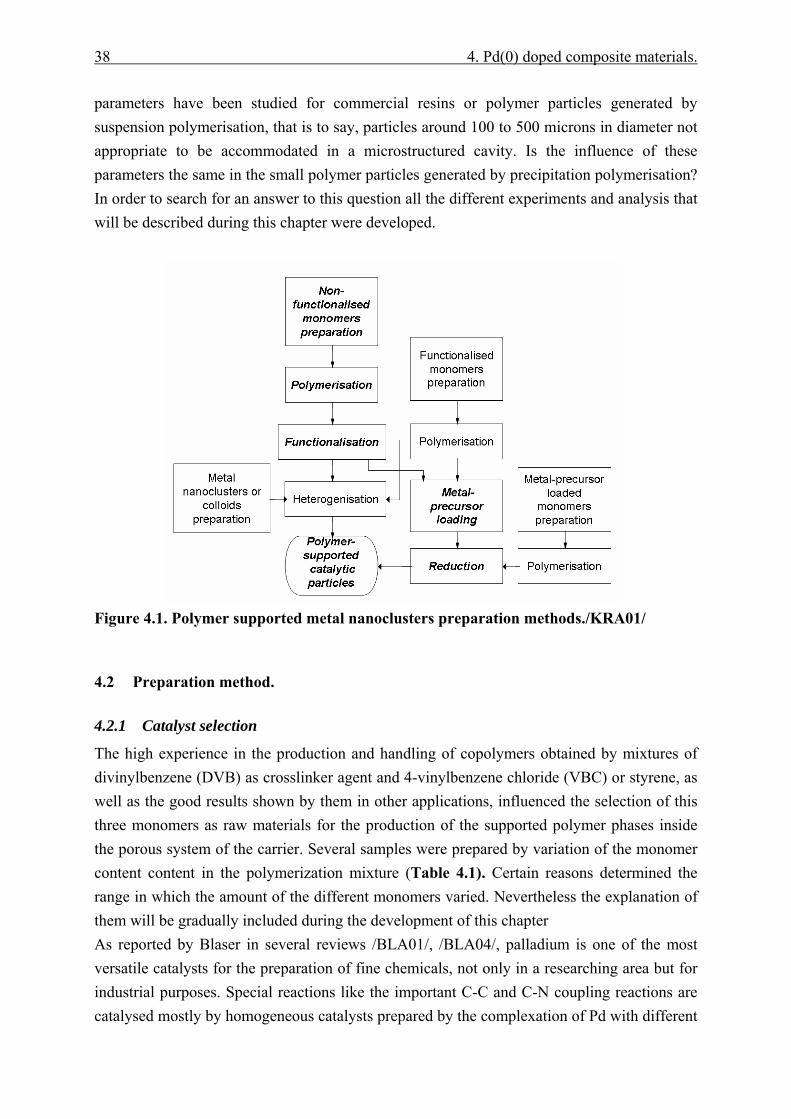
38 4. Pd(0) doped composite materials.
parameters have been studied for commercial resins or polymer particles generated by suspension polymerisation, that is to say, particles around 100 to 500 microns in diameter not appropriate to be accommodated in a microstructured cavity. Is the influence of these parameters the same in the small polymer particles generated by precipitation polymerisation? In order to search for an answer to this question all the different experiments and analysis that will be described during this chapter were developed.
Figure 4.1. Polymer supported metal nanoclusters preparation methods./KRA01/
4.2 Preparation method.
4.2.1 Catalyst selection
The high experience in the production and handling of copolymers obtained by mixtures of divinylbenzene (DVB) as crosslinker agent and 4-vinylbenzene chloride (VBC) or styrene, as well as the good results shown by them in other applications, influenced the selection of this three monomers as raw materials for the production of the supported polymer phases inside the porous system of the carrier. Several samples were prepared by variation of the monomer content content in the polymerization mixture (Table 4.1). Certain reasons determined the range in which the amount of the different monomers varied. Nevertheless the explanation of them will be gradually included during the development of this chapter As reported by Blaser in several reviews /BLA01/, /BLA04/, palladium is one of the most versatile catalysts for the preparation of fine chemicals, not only in a researching area but for industrial purposes. Special reactions like the important C-C and C-N coupling reactions are catalysed mostly by homogeneous catalysts prepared by the complexation of Pd with different
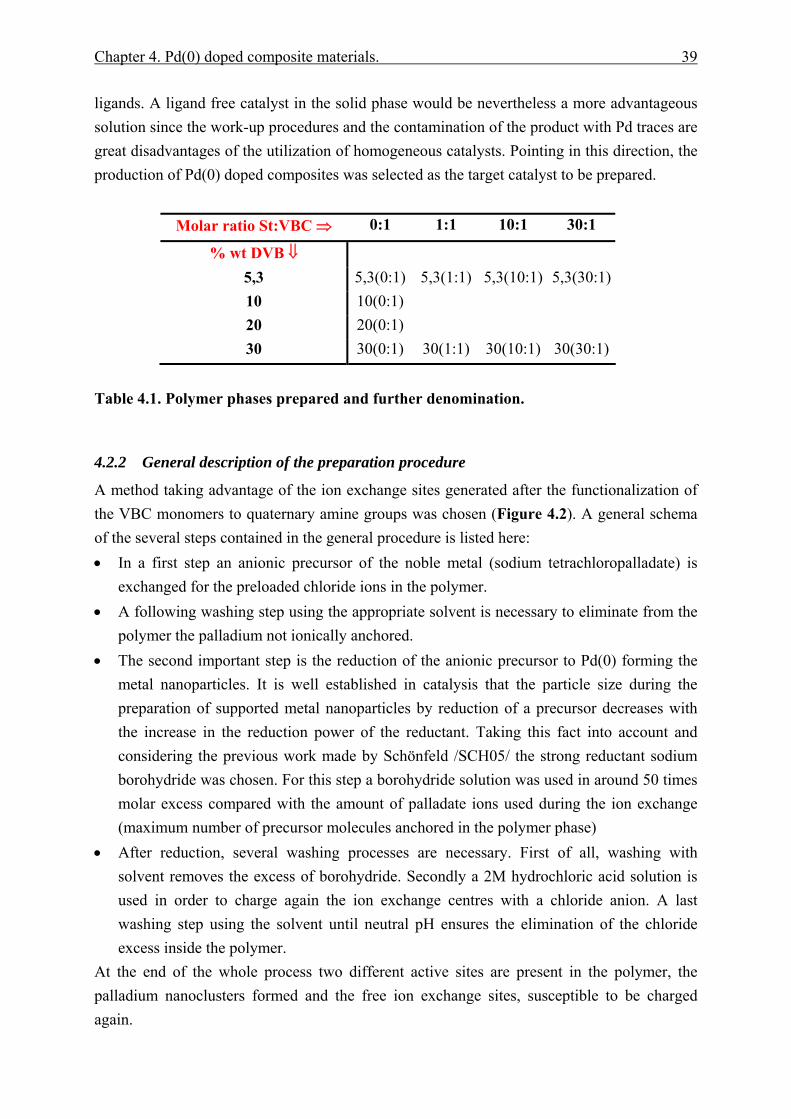
Chapter 4. Pd(0) doped composite materials. 39
ligands. A ligand free catalyst in the solid phase would be nevertheless a more advantageous solution since the work-up procedures and the contamination of the product with Pd traces are great disadvantages of the utilization of homogeneous catalysts. Pointing in this direction, the production of Pd(0) doped composites was selected as the target catalyst to be prepared.
Molar ratio St:VBC ⇒ 0:1 1:1 10:1 30:1
% wt DVB ⇓ 5,3 5,3(0:1) 5,3(1:1) 5,3(10:1) 5,3(30:1) 10 10(0:1) 20 20(0:1) 30 30(0:1) 30(1:1) 30(10:1) 30(30:1)
Table 4.1. Polymer phases prepared and further denomination.
4.2.2 General description of the preparation procedure
A method taking advantage of the ion exchange sites generated after the functionalization of the VBC monomers to quaternary amine groups was chosen (Figure 4.2). A general schema of the several steps contained in the general procedure is listed here: • In a first step an anionic precursor of the noble metal (sodium tetrachloropalladate) is
exchanged for the preloaded chloride ions in the polymer. • A following washing step using the appropriate solvent is necessary to eliminate from the
polymer the palladium not ionically anchored. • The second important step is the reduction of the anionic precursor to Pd(0) forming the
metal nanoparticles. It is well established in catalysis that the particle size during the preparation of supported metal nanoparticles by reduction of a precursor decreases with the increase in the reduction power of the reductant. Taking this fact into account and considering the previous work made by Schönfeld /SCH05/ the strong reductant sodium borohydride was chosen. For this step a borohydride solution was used in around 50 times molar excess compared with the amount of palladate ions used during the ion exchange (maximum number of precursor molecules anchored in the polymer phase)
• After reduction, several washing processes are necessary. First of all, washing with solvent removes the excess of borohydride. Secondly a 2M hydrochloric acid solution is used in order to charge again the ion exchange centres with a chloride anion. A last washing step using the solvent until neutral pH ensures the elimination of the chloride excess inside the polymer.
At the end of the whole process two different active sites are present in the polymer, the palladium nanoclusters formed and the free ion exchange sites, susceptible to be charged again.
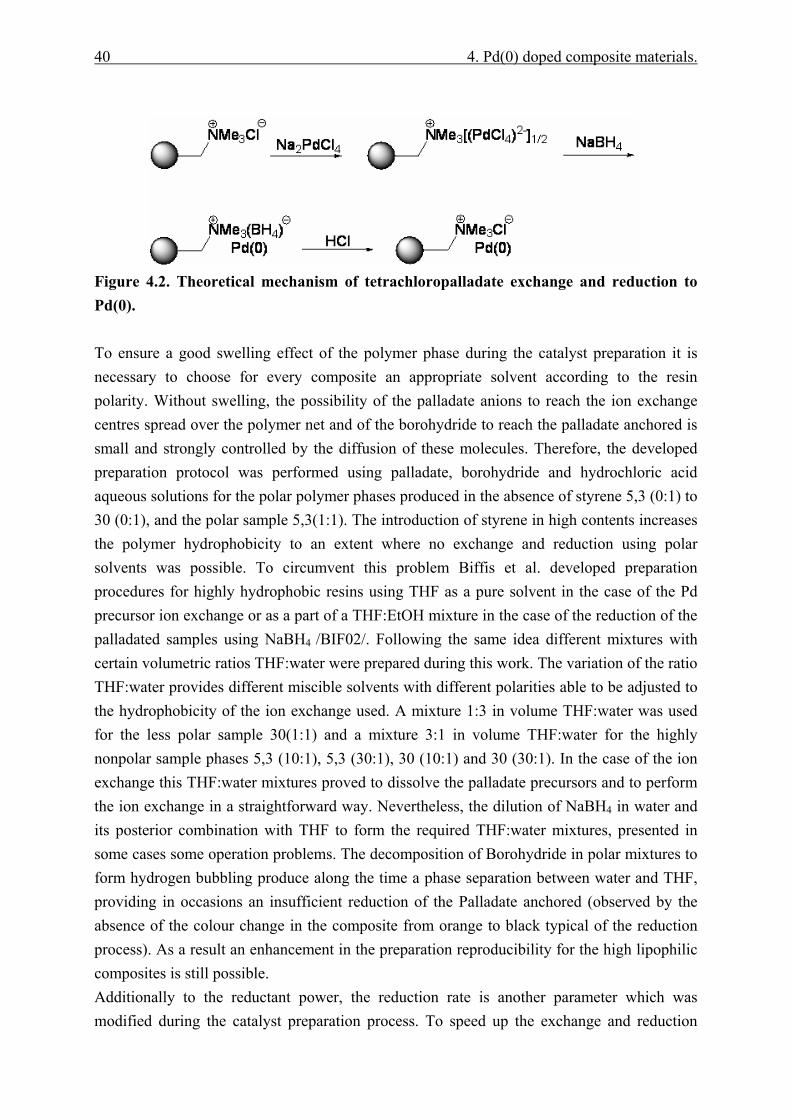
40 4. Pd(0) doped composite materials.
Figure 4.2. Theoretical mechanism of tetrachloropalladate exchange and reduction to Pd(0). To ensure a good swelling effect of the polymer phase during the catalyst preparation it is necessary to choose for every composite an appropriate solvent according to the resin polarity. Without swelling, the possibility of the palladate anions to reach the ion exchange centres spread over the polymer net and of the borohydride to reach the palladate anchored is small and strongly controlled by the diffusion of these molecules. Therefore, the developed preparation protocol was performed using palladate, borohydride and hydrochloric acid aqueous solutions for the polar polymer phases produced in the absence of styrene 5,3 (0:1) to 30 (0:1), and the polar sample 5,3(1:1). The introduction of styrene in high contents increases the polymer hydrophobicity to an extent where no exchange and reduction using polar solvents was possible. To circumvent this problem Biffis et al. developed preparation procedures for highly hydrophobic resins using THF as a pure solvent in the case of the Pd precursor ion exchange or as a part of a THF:EtOH mixture in the case of the reduction of the palladated samples using NaBH4 /BIF02/. Following the same idea different mixtures with certain volumetric ratios THF:water were prepared during this work. The variation of the ratio THF:water provides different miscible solvents with different polarities able to be adjusted to the hydrophobicity of the ion exchange used. A mixture 1:3 in volume THF:water was used for the less polar sample 30(1:1) and a mixture 3:1 in volume THF:water for the highly nonpolar sample phases 5,3 (10:1), 5,3 (30:1), 30 (10:1) and 30 (30:1). In the case of the ion exchange this THF:water mixtures proved to dissolve the palladate precursors and to perform the ion exchange in a straightforward way. Nevertheless, the dilution of NaBH4 in water and its posterior combination with THF to form the required THF:water mixtures, presented in some cases some operation problems. The decomposition of Borohydride in polar mixtures to form hydrogen bubbling produce along the time a phase separation between water and THF, providing in occasions an insufficient reduction of the Palladate anchored (observed by the absence of the colour change in the composite from orange to black typical of the reduction process). As a result an enhancement in the preparation reproducibility for the high lipophilic composites is still possible. Additionally to the reductant power, the reduction rate is another parameter which was modified during the catalyst preparation process. To speed up the exchange and reduction
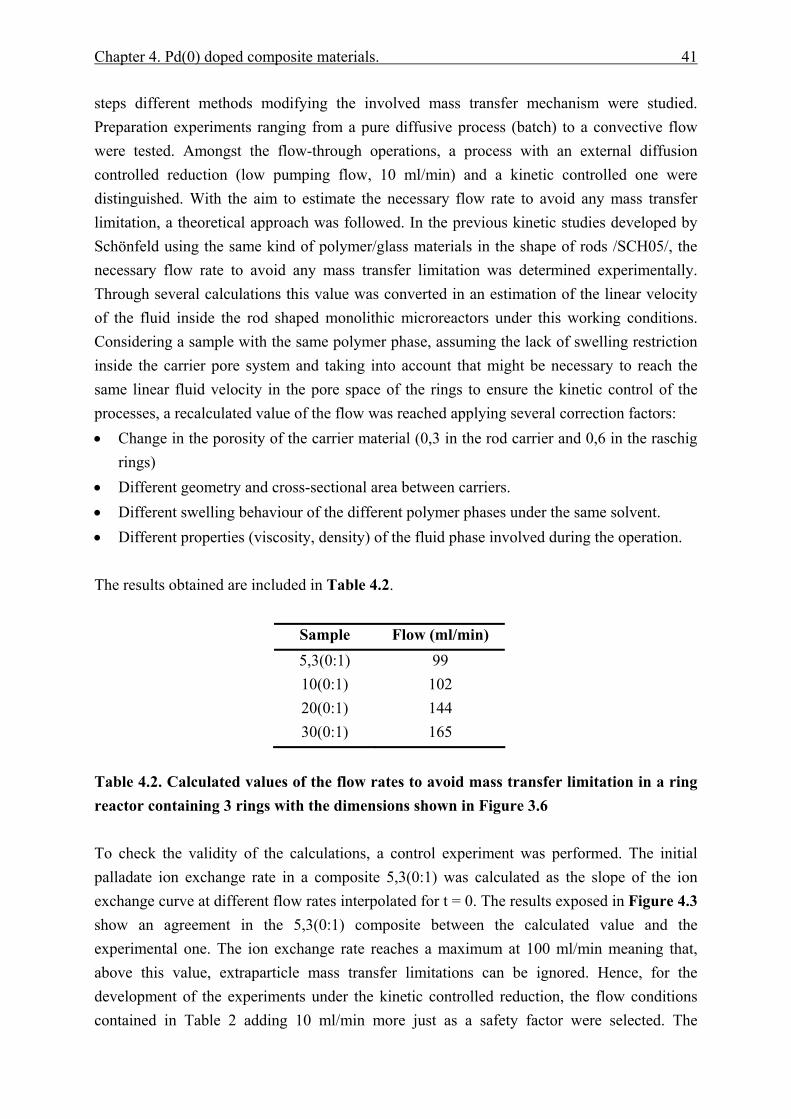
Chapter 4. Pd(0) doped composite materials. 41
steps different methods modifying the involved mass transfer mechanism were studied. Preparation experiments ranging from a pure diffusive process (batch) to a convective flow were tested. Amongst the flow-through operations, a process with an external diffusion controlled reduction (low pumping flow, 10 ml/min) and a kinetic controlled one were distinguished. With the aim to estimate the necessary flow rate to avoid any mass transfer limitation, a theoretical approach was followed. In the previous kinetic studies developed by Schönfeld using the same kind of polymer/glass materials in the shape of rods /SCH05/, the necessary flow rate to avoid any mass transfer limitation was determined experimentally. Through several calculations this value was converted in an estimation of the linear velocity of the fluid inside the rod shaped monolithic microreactors under this working conditions. Considering a sample with the same polymer phase, assuming the lack of swelling restriction inside the carrier pore system and taking into account that might be necessary to reach the same linear fluid velocity in the pore space of the rings to ensure the kinetic control of the processes, a recalculated value of the flow was reached applying several correction factors: • Change in the porosity of the carrier material (0,3 in the rod carrier and 0,6 in the raschig
rings) • Different geometry and cross-sectional area between carriers. • Different swelling behaviour of the different polymer phases under the same solvent. • Different properties (viscosity, density) of the fluid phase involved during the operation. The results obtained are included in Table 4.2.
Sample Flow (ml/min) 5,3(0:1) 99 10(0:1) 102 20(0:1) 144 30(0:1) 165
Table 4.2. Calculated values of the flow rates to avoid mass transfer limitation in a ring reactor containing 3 rings with the dimensions shown in Figure 3.6 To check the validity of the calculations, a control experiment was performed. The initial palladate ion exchange rate in a composite 5,3(0:1) was calculated as the slope of the ion exchange curve at different flow rates interpolated for t = 0. The results exposed in Figure 4.3 show an agreement in the 5,3(0:1) composite between the calculated value and the experimental one. The ion exchange rate reaches a maximum at 100 ml/min meaning that, above this value, extraparticle mass transfer limitations can be ignored. Hence, for the development of the experiments under the kinetic controlled reduction, the flow conditions contained in Table 2 adding 10 ml/min more just as a safety factor were selected. The
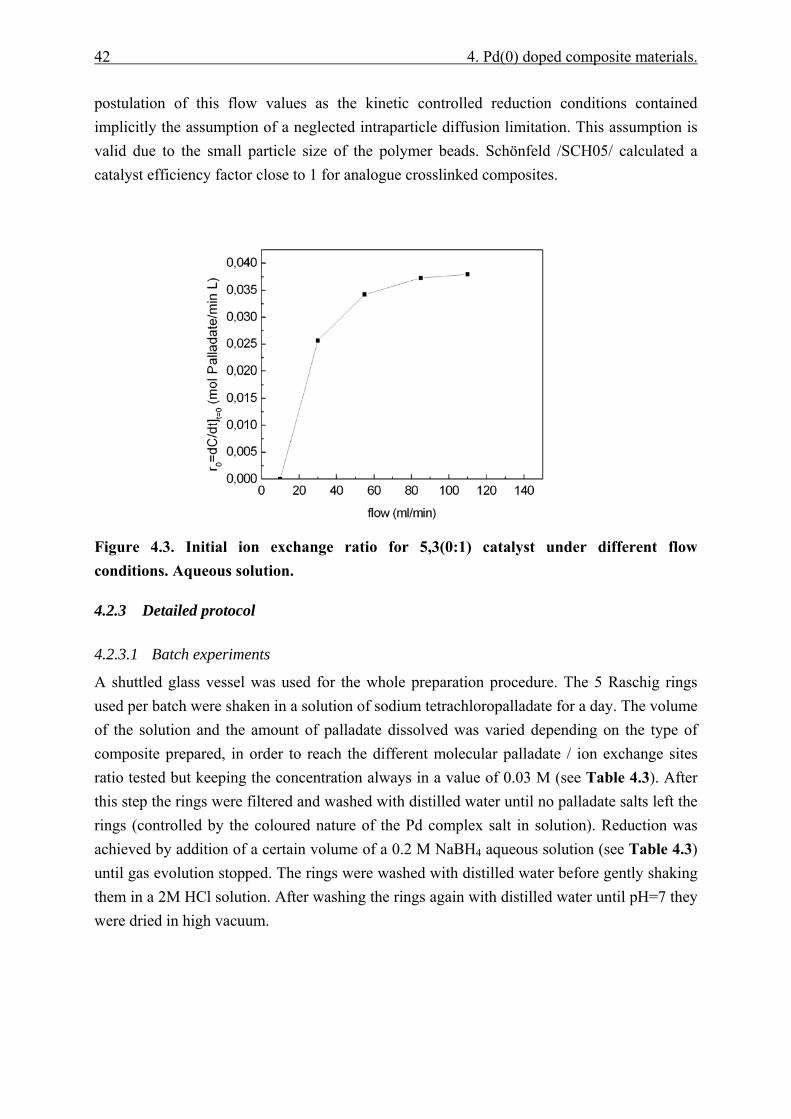
42 4. Pd(0) doped composite materials.
postulation of this flow values as the kinetic controlled reduction conditions contained implicitly the assumption of a neglected intraparticle diffusion limitation. This assumption is valid due to the small particle size of the polymer beads. Schönfeld /SCH05/ calculated a catalyst efficiency factor close to 1 for analogue crosslinked composites.
Figure 4.3. Initial ion exchange ratio for 5,3(0:1) catalyst under different flow conditions. Aqueous solution.
4.2.3 Detailed protocol
4.2.3.1 Batch experiments
A shuttled glass vessel was used for the whole preparation procedure. The 5 Raschig rings used per batch were shaken in a solution of sodium tetrachloropalladate for a day. The volume of the solution and the amount of palladate dissolved was varied depending on the type of composite prepared, in order to reach the different molecular palladate / ion exchange sites ratio tested but keeping the concentration always in a value of 0.03 M (see Table 4.3). After this step the rings were filtered and washed with distilled water until no palladate salts left the rings (controlled by the coloured nature of the Pd complex salt in solution). Reduction was achieved by addition of a certain volume of a 0.2 M NaBH4 aqueous solution (see Table 4.3) until gas evolution stopped. The rings were washed with distilled water before gently shaking them in a 2M HCl solution. After washing the rings again with distilled water until pH=7 they were dried in high vacuum.
Chapter 4. Pd(0) doped composite materials. 43
Table 4.3. Volumes and quantities of the different solutions and reagents depending on the composite. Non-styrene based composites
4.2.3.2 Flow-through experiments
In this case, a simple laboratory plant composed by a pump and a five rings stainless steel reactor was necessary for the preparation of the Pd loaded composite materials. Only a change between pumps with different pumping capacities was necessary in order to reach diverse fluid-dynamic regimes. The 5 Raschig rings used per batch were inserted in the reactor previously filled with the 0.03 M solution of sodium tetrachloropalladate, recirculating the whole amount of fluid in order to simulate a batch operation. For all the samples, ion exchange was achieved within 2h by circulating the appropriate solution of Na2Cl4Pd (see Table 4.3 and Table 4.4). Next, the reactor was flushed for one hour with the solvent at a flow rate of 5 mL/min before a certain volume of a 0.2M solution of borohydride (see Table 4.3 and Table 4.4) was pumped through the PASSflow reactor at different flow regimes. The loading was terminated by three washing steps: (a) solvent, 1h, 5 mL/min; (b) 100 mL of 2 M HCl, 9 mL/min and (c) solvent, 9 mL/min until the pH at the outlet was determined to be 7.
Table 4.4. Volumes and quantities of the different solutions and reagents depending on the composite. Styrene based composites
Composite Exchange centres /Pd2+
ratio Pd-Lösung
Palladate [g]/water[ml] BH4
- -Lösung BH4
-[g]/water [ml] 1:1 0.299 / 31
5,3(0:1) 2:1 0.149 / 15.2
1.515 / 215
1:1 0.262 / 27 10(0:1)
2:1 0.131 / 13.5 1.33 / 190
1:1 0.16 / 16.36 20(0:1)
2:1 0.08 / 8.16 0.815 / 115
1:1 0.095 / 9.66 30(0:1)
2:1 0.047 / 4.83 0.48 / 70
Composite Solvent composed by
THF /water ratio Pd-solution
Palladate [g]/solvent[ml] BH4
- -solution BH4
-[g]/solvent [ml] 5,3(1:1) 0:1 0,155 / 15,8 0,785 / 110 5,3(10:1) 3:1 0,036 / 20 1,57 / 200 5,3(30:1) 3:1 0,013 / 20 0,815 / 200 30(1:1) 1:1 0,108 / 17 1,09 / 150 30(10:1) 3:1 0,021 / 20 0,210 / 200 30(30:1) 3:1 0,008 / 20 0,210 / 200
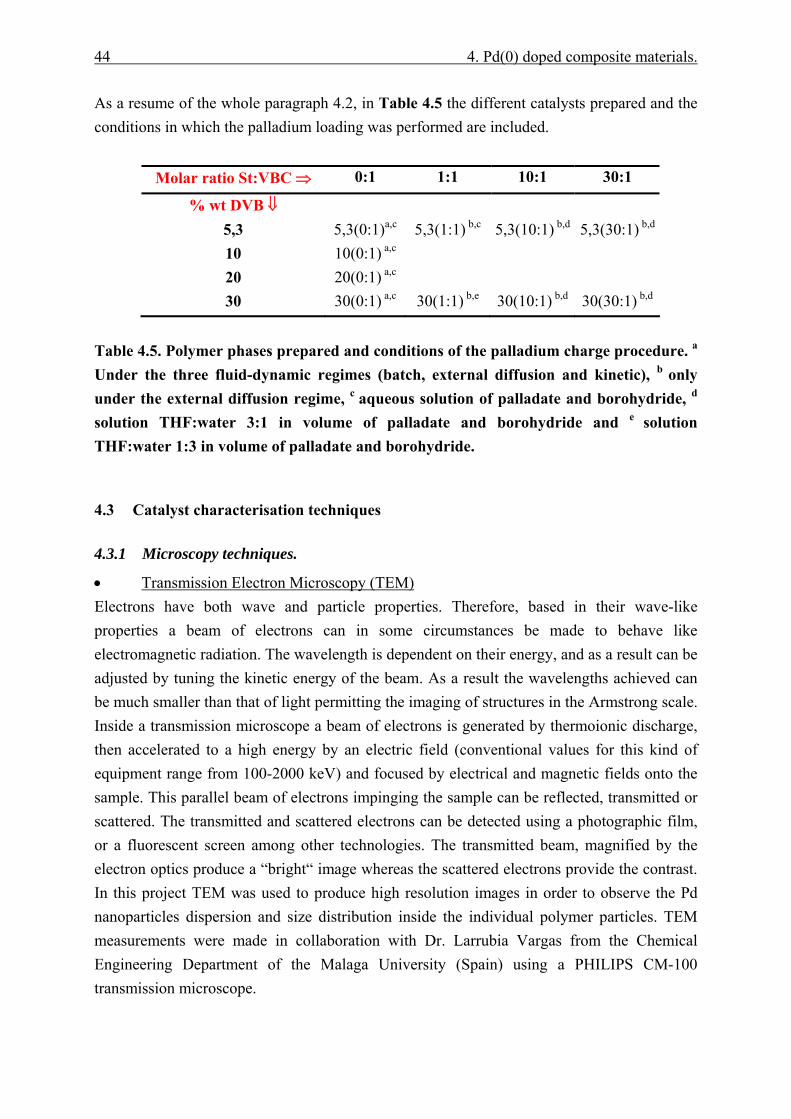
44 4. Pd(0) doped composite materials.
As a resume of the whole paragraph 4.2, in Table 4.5 the different catalysts prepared and the conditions in which the palladium loading was performed are included.
Molar ratio St:VBC ⇒ 0:1 1:1 10:1 30:1
% wt DVB ⇓ 5,3 5,3(0:1)a,c 5,3(1:1) b,c 5,3(10:1) b,d 5,3(30:1) b,d
10 10(0:1) a,c 20 20(0:1) a,c 30 30(0:1) a,c 30(1:1) b,e 30(10:1) b,d 30(30:1) b,d
Table 4.5. Polymer phases prepared and conditions of the palladium charge procedure. a
Under the three fluid-dynamic regimes (batch, external diffusion and kinetic), b only under the external diffusion regime, c aqueous solution of palladate and borohydride, d
solution THF:water 3:1 in volume of palladate and borohydride and e solution THF:water 1:3 in volume of palladate and borohydride.
4.3 Catalyst characterisation techniques
4.3.1 Microscopy techniques.
• Transmission Electron Microscopy (TEM) Electrons have both wave and particle properties. Therefore, based in their wave-like properties a beam of electrons can in some circumstances be made to behave like electromagnetic radiation. The wavelength is dependent on their energy, and as a result can be adjusted by tuning the kinetic energy of the beam. As a result the wavelengths achieved can be much smaller than that of light permitting the imaging of structures in the Armstrong scale. Inside a transmission microscope a beam of electrons is generated by thermoionic discharge, then accelerated to a high energy by an electric field (conventional values for this kind of equipment range from 100-2000 keV) and focused by electrical and magnetic fields onto the sample. This parallel beam of electrons impinging the sample can be reflected, transmitted or scattered. The transmitted and scattered electrons can be detected using a photographic film, or a fluorescent screen among other technologies. The transmitted beam, magnified by the electron optics produce a “bright“ image whereas the scattered electrons provide the contrast. In this project TEM was used to produce high resolution images in order to observe the Pd nanoparticles dispersion and size distribution inside the individual polymer particles. TEM measurements were made in collaboration with Dr. Larrubia Vargas from the Chemical Engineering Department of the Malaga University (Spain) using a PHILIPS CM-100 transmission microscope.
Chapter 4. Pd(0) doped composite materials. 45
• Electron Probe Microanalysis (EPMA) EPMA basically works by bombarding a micro-volume of a sample with a focused electron beam (typical energy = 5-30 keV) and collecting the X-ray photons thereby induced and emitted by the various elemental species. Because the wavelengths of these X-rays are characteristic of the emitting species, the sample composition can be easily identified by recording WDS spectra (Wavelength Dispersive Spectroscopy). WDS spectrometers are based on the Bragg’s law and use various moveable, shaped monocrystals as monochromators Figure 4.4.
Figure 4.4. Schema of the construction of the cameca SX100 EPMA device /CAM07/. This EPMA incorporates a colour CCD camera which is able to provide SEM images (Scanning Electron Microscopy) by detection of the secondary electrons produced by the electron beam when impinging to the probe surface. This analytical technique was intended to obtain a mapping image of the ion exchange sites and the Pd dispersion inside the polymer phase in the carrier material pore scale. EPMA measurements were performed at the Institute of Mineralogy and Mineral Raw Materials (TU Clausthal) using a Cameca SX100. The assistance provided by Herr Herrmann during the measurements is here gratefully acknowledged.
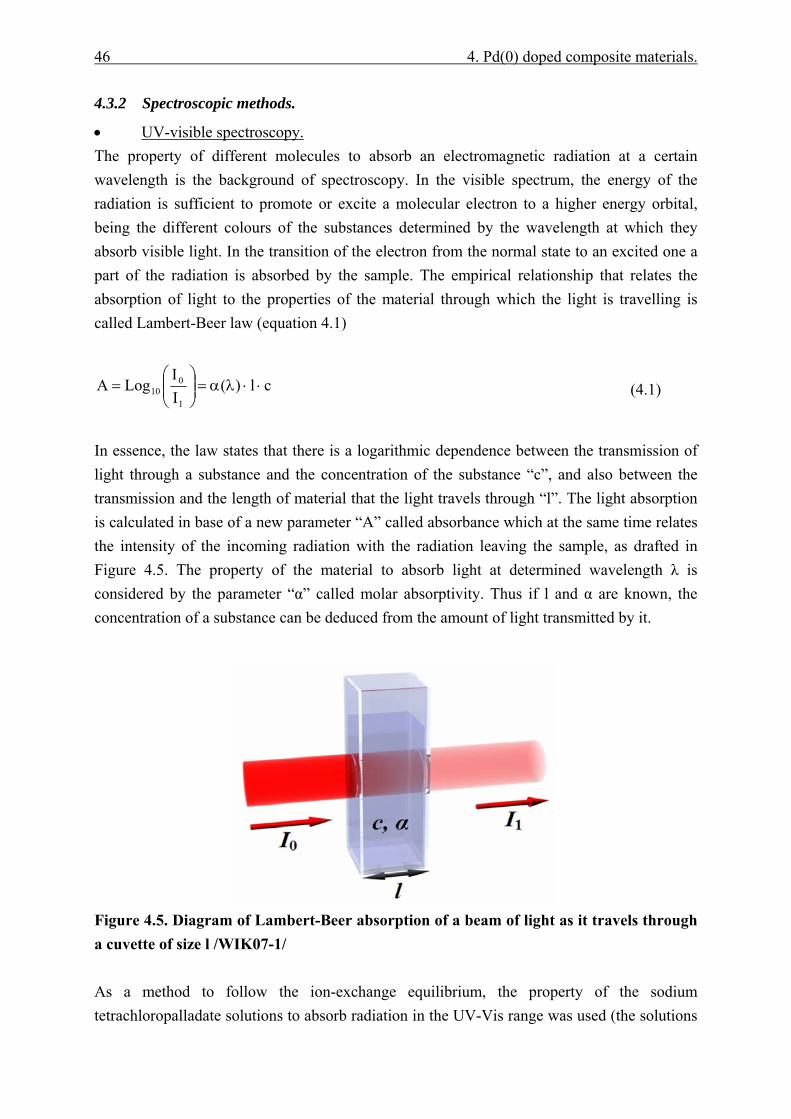
46 4. Pd(0) doped composite materials.
4.3.2 Spectroscopic methods.
• UV-visible spectroscopy. The property of different molecules to absorb an electromagnetic radiation at a certain wavelength is the background of spectroscopy. In the visible spectrum, the energy of the radiation is sufficient to promote or excite a molecular electron to a higher energy orbital, being the different colours of the substances determined by the wavelength at which they absorb visible light. In the transition of the electron from the normal state to an excited one a part of the radiation is absorbed by the sample. The empirical relationship that relates the absorption of light to the properties of the material through which the light is travelling is called Lambert-Beer law (equation 4.1)
cl)(II
LogA1
010 ⋅⋅λα=⎟⎟
⎠
⎞⎜⎜⎝
⎛=
(4.1)
In essence, the law states that there is a logarithmic dependence between the transmission of light through a substance and the concentration of the substance “c”, and also between the transmission and the length of material that the light travels through “l”. The light absorption is calculated in base of a new parameter “A” called absorbance which at the same time relates the intensity of the incoming radiation with the radiation leaving the sample, as drafted in Figure 4.5. The property of the material to absorb light at determined wavelength λ is considered by the parameter “α” called molar absorptivity. Thus if l and α are known, the concentration of a substance can be deduced from the amount of light transmitted by it.
Figure 4.5. Diagram of Lambert-Beer absorption of a beam of light as it travels through a cuvette of size l /WIK07-1/ As a method to follow the ion-exchange equilibrium, the property of the sodium tetrachloropalladate solutions to absorb radiation in the UV-Vis range was used (the solutions
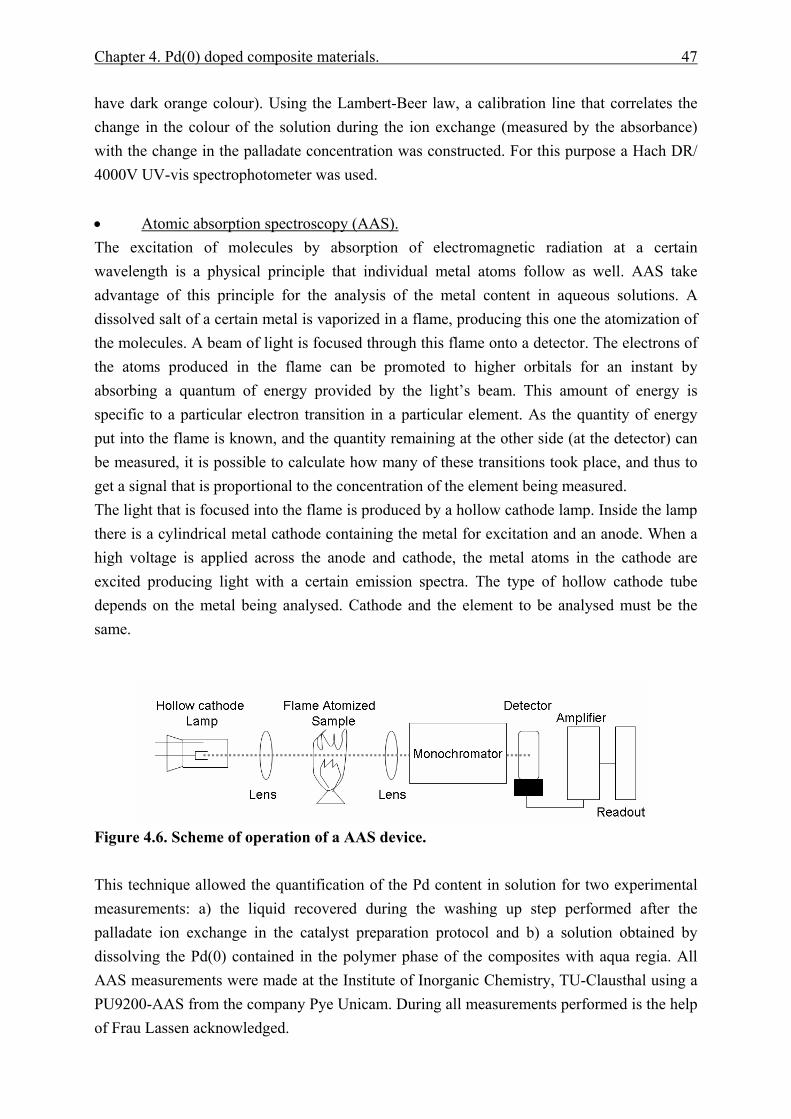
Chapter 4. Pd(0) doped composite materials. 47
have dark orange colour). Using the Lambert-Beer law, a calibration line that correlates the change in the colour of the solution during the ion exchange (measured by the absorbance) with the change in the palladate concentration was constructed. For this purpose a Hach DR/ 4000V UV-vis spectrophotometer was used. • Atomic absorption spectroscopy (AAS). The excitation of molecules by absorption of electromagnetic radiation at a certain wavelength is a physical principle that individual metal atoms follow as well. AAS take advantage of this principle for the analysis of the metal content in aqueous solutions. A dissolved salt of a certain metal is vaporized in a flame, producing this one the atomization of the molecules. A beam of light is focused through this flame onto a detector. The electrons of the atoms produced in the flame can be promoted to higher orbitals for an instant by absorbing a quantum of energy provided by the light’s beam. This amount of energy is specific to a particular electron transition in a particular element. As the quantity of energy put into the flame is known, and the quantity remaining at the other side (at the detector) can be measured, it is possible to calculate how many of these transitions took place, and thus to get a signal that is proportional to the concentration of the element being measured. The light that is focused into the flame is produced by a hollow cathode lamp. Inside the lamp there is a cylindrical metal cathode containing the metal for excitation and an anode. When a high voltage is applied across the anode and cathode, the metal atoms in the cathode are excited producing light with a certain emission spectra. The type of hollow cathode tube depends on the metal being analysed. Cathode and the element to be analysed must be the same.
Figure 4.6. Scheme of operation of a AAS device. This technique allowed the quantification of the Pd content in solution for two experimental measurements: a) the liquid recovered during the washing up step performed after the palladate ion exchange in the catalyst preparation protocol and b) a solution obtained by dissolving the Pd(0) contained in the polymer phase of the composites with aqua regia. All AAS measurements were made at the Institute of Inorganic Chemistry, TU-Clausthal using a PU9200-AAS from the company Pye Unicam. During all measurements performed is the help of Frau Lassen acknowledged.
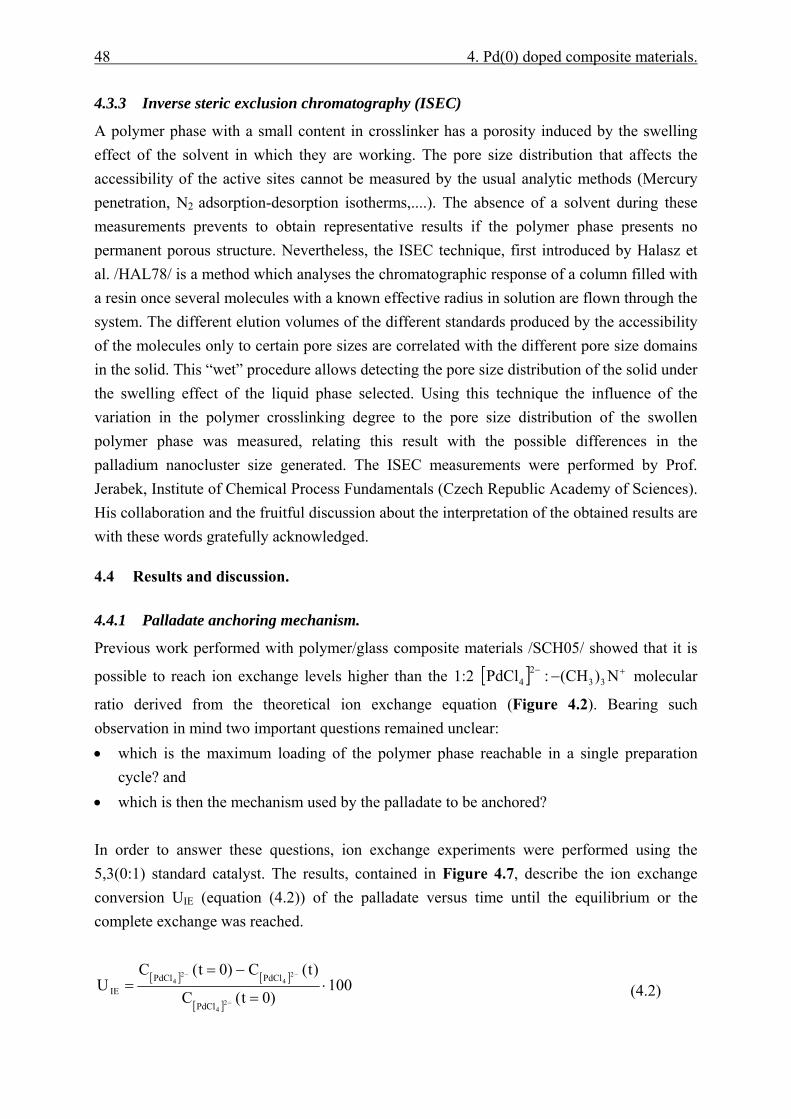
48 4. Pd(0) doped composite materials.
4.3.3 Inverse steric exclusion chromatography (ISEC)
A polymer phase with a small content in crosslinker has a porosity induced by the swelling effect of the solvent in which they are working. The pore size distribution that affects the accessibility of the active sites cannot be measured by the usual analytic methods (Mercury penetration, N2 adsorption-desorption isotherms,....). The absence of a solvent during these measurements prevents to obtain representative results if the polymer phase presents no permanent porous structure. Nevertheless, the ISEC technique, first introduced by Halasz et al. /HAL78/ is a method which analyses the chromatographic response of a column filled with a resin once several molecules with a known effective radius in solution are flown through the system. The different elution volumes of the different standards produced by the accessibility of the molecules only to certain pore sizes are correlated with the different pore size domains in the solid. This “wet” procedure allows detecting the pore size distribution of the solid under the swelling effect of the liquid phase selected. Using this technique the influence of the variation in the polymer crosslinking degree to the pore size distribution of the swollen polymer phase was measured, relating this result with the possible differences in the palladium nanocluster size generated. The ISEC measurements were performed by Prof. Jerabek, Institute of Chemical Process Fundamentals (Czech Republic Academy of Sciences). His collaboration and the fruitful discussion about the interpretation of the obtained results are with these words gratefully acknowledged.
4.4 Results and discussion.
4.4.1 Palladate anchoring mechanism.
Previous work performed with polymer/glass composite materials /SCH05/ showed that it is
possible to reach ion exchange levels higher than the 1:2 [ ] +− − N)(CH:PdCl 332
4 molecular
ratio derived from the theoretical ion exchange equation (Figure 4.2). Bearing such observation in mind two important questions remained unclear: • which is the maximum loading of the polymer phase reachable in a single preparation
cycle? and • which is then the mechanism used by the palladate to be anchored? In order to answer these questions, ion exchange experiments were performed using the 5,3(0:1) standard catalyst. The results, contained in Figure 4.7, describe the ion exchange conversion UIE (equation (4.2)) of the palladate versus time until the equilibrium or the complete exchange was reached.
[ ] [ ]
[ ]100
)0t(C
)t(C)0t(CU
24
24
24
PdCl
PdClPdClIE ⋅
=
−==
−
−−
(4.2)

Chapter 4. Pd(0) doped composite materials. 49
where [ ] −24PdCl
C represents the concentration of palladate in solution.
The curves obtained under the theoretical ratio and the equimolecular one present a 100 % of ion exchange conversion whereas the experiment with a 2:1 ratio reaches an equilibrium value of 50%. These results point evidently to an equimolecular mechanism of ion exchange, where one palladate anion per ion exchange centre would be anchored.
Figure 4.7. Palladate ion exchange conversion for different palladate ratios. Preparation under flow-through conditions (10 ml/min) in a 5,3(0:1) catalyst. Nonetheless in order to exclude additional sorption of palladium on the polymeric phase and therefore to ensure that equilibrium values are caused just by the anchoring of the ions inside the polymer, the solutions used for loading as well for washing during the catalyst preparation method were analyzed with respect to the Pd content by AAS. The results listed in Table 4.6 show the amount of palladium charged on the polymer phase per batch, calculated: a) from the amount of palladate left in solution after the ion exchange equilibrium is reached (nI) and b) from the amount of palladate in solution recovered after ion exchange and washing with two different washing times (nAAS). The sorption percentage was calculated using the following equation:
100n
)nn(sorpt
0
IAAS ⋅−
=
(4.3)
where n0 is the initial number of moles of palladate in solution.
50 4. Pd(0) doped composite materials.
Sample +
−
N)(CH]Cl[Pd
33
242
Washing time
n0
(mol/batch)nI
(mol/batch)nAAS
(mol/batch) sorpt. (%)
1h 0,0009 0.000670 0.0007 3,0 5.3(0:1) 1/1 24h 0,0009 0.000818 0.00084 2,4 1h 0,0008 0.000715 0.00075 4,0 10(0:1) 1/1 24h 0,0008 0.000712 0.00075 4.8 1h 0,00046 0.000448 0.00046 2,6 20(0:1) 1/1 24h 0,00046 0.000443 0.00046 3,7 1h 0,0003 0.000270 0.00027 0,0 30(0:1) 1/1 24h 0,0003 0.000261 0.00027 3,0
Table 4.6. Analysis of the palladate sorption inside the polymer phase. M0 is the initial amount of palladate in solution All measurements show less than 5% sorption in all cases. These small values indicate that the absorption processes are negligible and therefore that the supposition of an equimolecular mechanism is valid. A fundamental requirement for such anchoring mechanism is the formation of a palladium complex with only one negative charge. Two different possibilities of modification of the tetrachloropalladate anion were found in literature: 1. each palladate anion uses one of the co-ions belonging to the precursor salt (Na+ in this
case) to neutralize one of the negative charges /HEL62/, /TOS92/ 2. the formation of a new complex in water following the equilibrium:
[PdCl4] [PdCl3(H2O)] + Cl- /GME89/
A composite sample obtained after the ion exchange of tethrachloropalladate was analysed by EPMA, obtaining element mappings of Chlorine, Na and Pd in the polymer phase filling a carrier pore (Figure 4.8). Evidently, a bigger amount of Cl than Pd was observed. This result is associated to the presence of several chlorine molecules in the Pd precursor complex. In addition, Na was detected only as a constituent part of the glass carrier and no presence was detected inside the polymer phase. An ion exchange mechanism considering the inclusion of one Na+ cation in the Pd complex anchored would derive in the presence of this metal in the polymer phase. Consequently, no evidences confirming this theory were found and therefore the formation of a new Pd complex adding a water molecule was adopted as the most reasonable explanation of the anchoring mechanism.
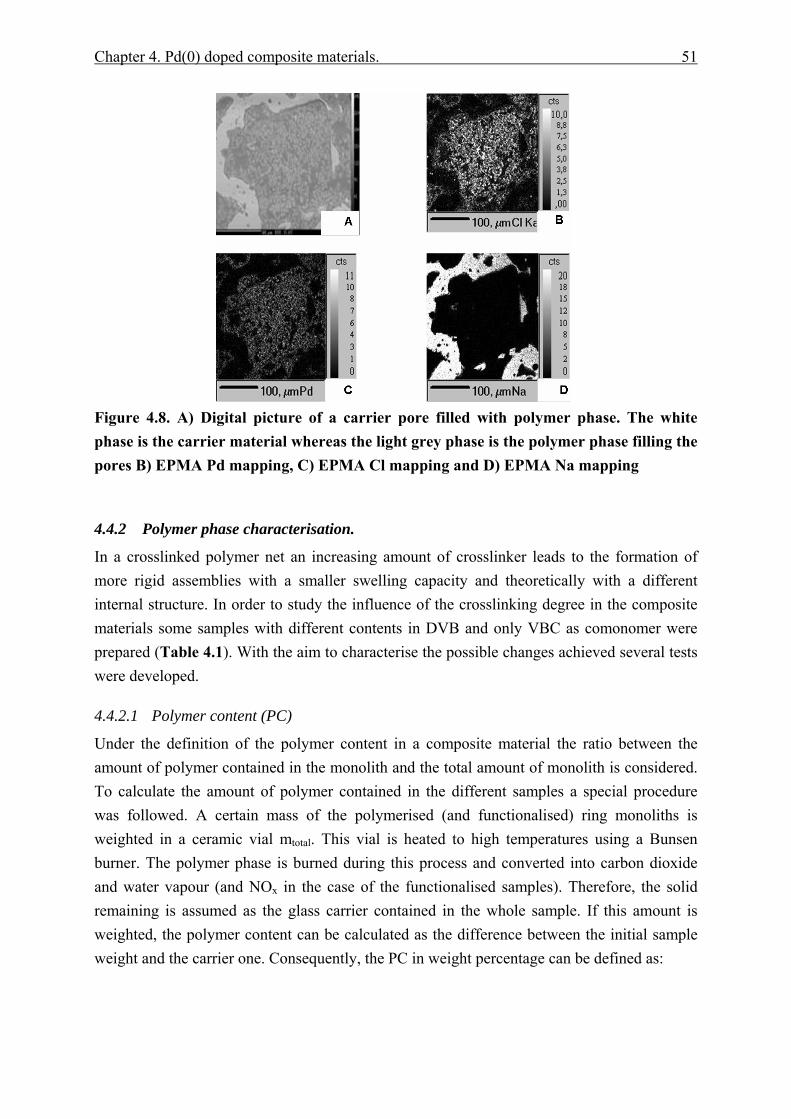
Chapter 4. Pd(0) doped composite materials. 51
Figure 4.8. A) Digital picture of a carrier pore filled with polymer phase. The white phase is the carrier material whereas the light grey phase is the polymer phase filling the pores B) EPMA Pd mapping, C) EPMA Cl mapping and D) EPMA Na mapping
4.4.2 Polymer phase characterisation.
In a crosslinked polymer net an increasing amount of crosslinker leads to the formation of more rigid assemblies with a smaller swelling capacity and theoretically with a different internal structure. In order to study the influence of the crosslinking degree in the composite materials some samples with different contents in DVB and only VBC as comonomer were prepared (Table 4.1). With the aim to characterise the possible changes achieved several tests were developed.
4.4.2.1 Polymer content (PC)
Under the definition of the polymer content in a composite material the ratio between the amount of polymer contained in the monolith and the total amount of monolith is considered. To calculate the amount of polymer contained in the different samples a special procedure was followed. A certain mass of the polymerised (and functionalised) ring monoliths is weighted in a ceramic vial mtotal. This vial is heated to high temperatures using a Bunsen burner. The polymer phase is burned during this process and converted into carbon dioxide and water vapour (and NOx in the case of the functionalised samples). Therefore, the solid remaining is assumed as the glass carrier contained in the whole sample. If this amount is weighted, the polymer content can be calculated as the difference between the initial sample weight and the carrier one. Consequently, the PC in weight percentage can be defined as:
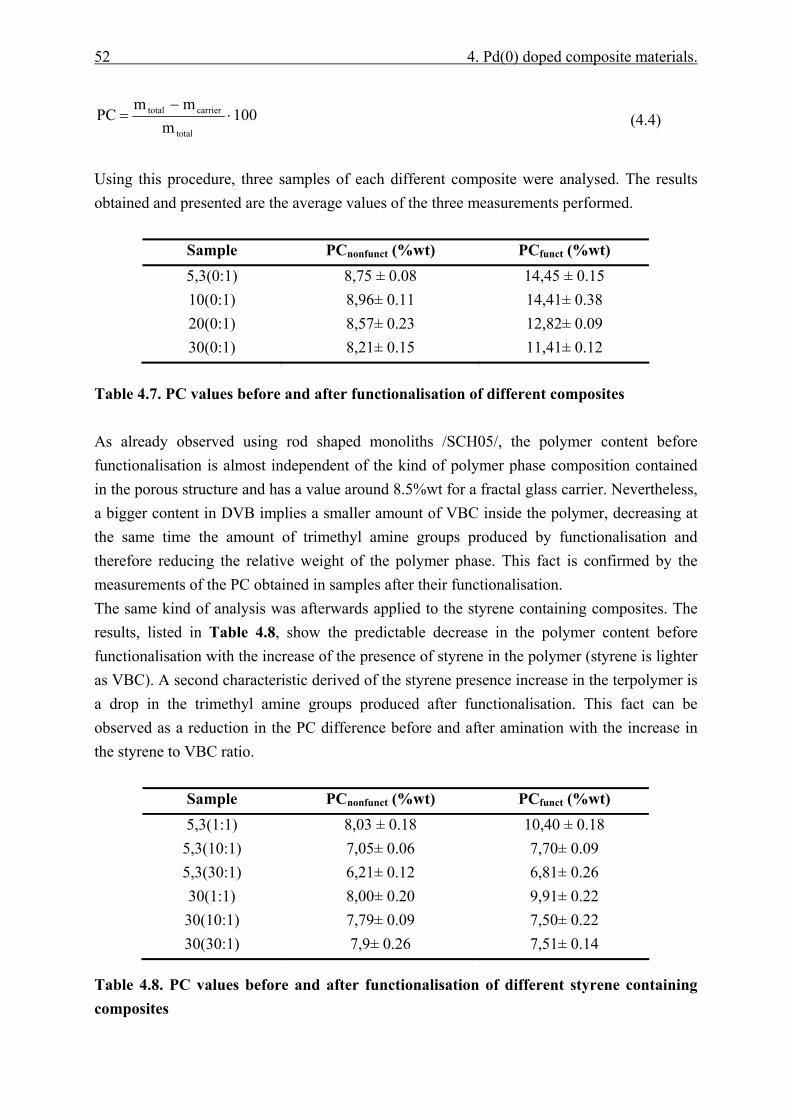
52 4. Pd(0) doped composite materials.
100m
mmPC
total
carriertotal ⋅−
=
(4.4)
Using this procedure, three samples of each different composite were analysed. The results obtained and presented are the average values of the three measurements performed. Table 4.7. PC values before and after functionalisation of different composites As already observed using rod shaped monoliths /SCH05/, the polymer content before functionalisation is almost independent of the kind of polymer phase composition contained in the porous structure and has a value around 8.5%wt for a fractal glass carrier. Nevertheless, a bigger content in DVB implies a smaller amount of VBC inside the polymer, decreasing at the same time the amount of trimethyl amine groups produced by functionalisation and therefore reducing the relative weight of the polymer phase. This fact is confirmed by the measurements of the PC obtained in samples after their functionalisation. The same kind of analysis was afterwards applied to the styrene containing composites. The results, listed in Table 4.8, show the predictable decrease in the polymer content before functionalisation with the increase of the presence of styrene in the polymer (styrene is lighter as VBC). A second characteristic derived of the styrene presence increase in the terpolymer is a drop in the trimethyl amine groups produced after functionalisation. This fact can be observed as a reduction in the PC difference before and after amination with the increase in the styrene to VBC ratio.
Table 4.8. PC values before and after functionalisation of different styrene containing composites
Sample PCnonfunct (%wt) PCfunct (%wt) 5,3(0:1) 8,75 ± 0.08 14,45 ± 0.15 10(0:1) 8,96± 0.11 14,41± 0.38 20(0:1) 8,57± 0.23 12,82± 0.09 30(0:1) 8,21± 0.15 11,41± 0.12
Sample PCnonfunct (%wt) PCfunct (%wt) 5,3(1:1) 8,03 ± 0.18 10,40 ± 0.18 5,3(10:1) 7,05± 0.06 7,70± 0.09 5,3(30:1) 6,21± 0.12 6,81± 0.26 30(1:1) 8,00± 0.20 9,91± 0.22 30(10:1) 7,79± 0.09 7,50± 0.22 30(30:1) 7,9± 0.26 7,51± 0.14
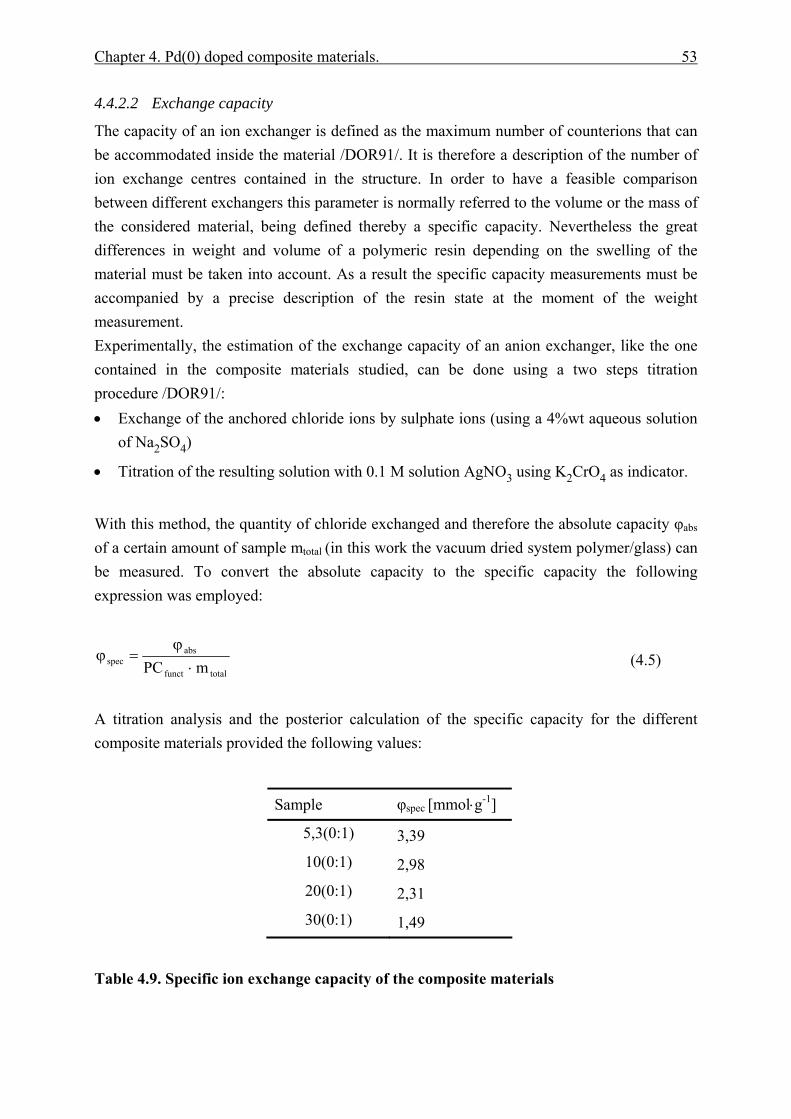
Chapter 4. Pd(0) doped composite materials. 53
4.4.2.2 Exchange capacity
The capacity of an ion exchanger is defined as the maximum number of counterions that can be accommodated inside the material /DOR91/. It is therefore a description of the number of ion exchange centres contained in the structure. In order to have a feasible comparison between different exchangers this parameter is normally referred to the volume or the mass of the considered material, being defined thereby a specific capacity. Nevertheless the great differences in weight and volume of a polymeric resin depending on the swelling of the material must be taken into account. As a result the specific capacity measurements must be accompanied by a precise description of the resin state at the moment of the weight measurement. Experimentally, the estimation of the exchange capacity of an anion exchanger, like the one contained in the composite materials studied, can be done using a two steps titration procedure /DOR91/: • Exchange of the anchored chloride ions by sulphate ions (using a 4%wt aqueous solution
of Na2SO4)
• Titration of the resulting solution with 0.1 M solution AgNO3 using K2CrO4 as indicator.
With this method, the quantity of chloride exchanged and therefore the absolute capacity φabs of a certain amount of sample mtotal (in this work the vacuum dried system polymer/glass) can be measured. To convert the absolute capacity to the specific capacity the following expression was employed:
totalfunct
absspec mPC ⋅
ϕ=ϕ
(4.5)
A titration analysis and the posterior calculation of the specific capacity for the different composite materials provided the following values:
Sample φspec [mmol⋅g-1]
5,3(0:1) 3,39 10(0:1) 2,98 20(0:1) 2,31 30(0:1) 1,49
Table 4.9. Specific ion exchange capacity of the composite materials
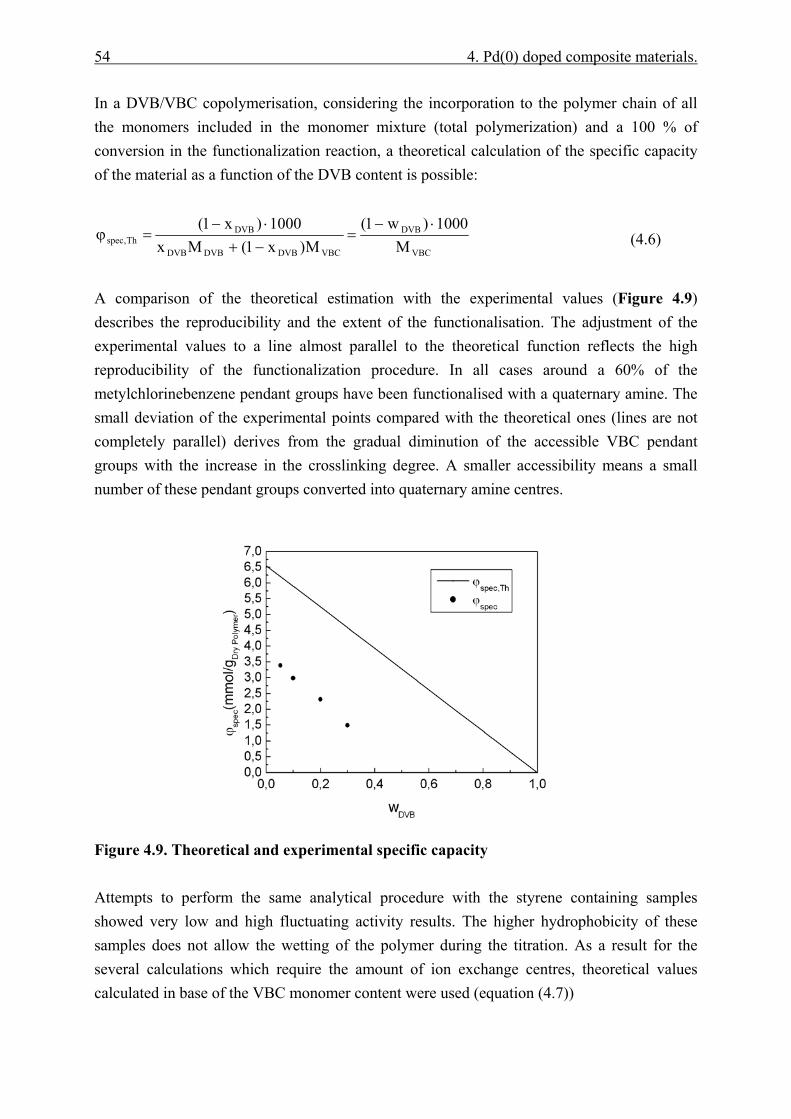
54 4. Pd(0) doped composite materials.
In a DVB/VBC copolymerisation, considering the incorporation to the polymer chain of all the monomers included in the monomer mixture (total polymerization) and a 100 % of conversion in the functionalization reaction, a theoretical calculation of the specific capacity of the material as a function of the DVB content is possible:
VBC
DVB
VBCDVBDVBDVB
DVBTh,spec M
1000)w1(M)x1(Mx
1000)x1( ⋅−=
−+⋅−
=ϕ
(4.6)
A comparison of the theoretical estimation with the experimental values (Figure 4.9) describes the reproducibility and the extent of the functionalisation. The adjustment of the experimental values to a line almost parallel to the theoretical function reflects the high reproducibility of the functionalization procedure. In all cases around a 60% of the metylchlorinebenzene pendant groups have been functionalised with a quaternary amine. The small deviation of the experimental points compared with the theoretical ones (lines are not completely parallel) derives from the gradual diminution of the accessible VBC pendant groups with the increase in the crosslinking degree. A smaller accessibility means a small number of these pendant groups converted into quaternary amine centres.
Figure 4.9. Theoretical and experimental specific capacity Attempts to perform the same analytical procedure with the styrene containing samples showed very low and high fluctuating activity results. The higher hydrophobicity of these samples does not allow the wetting of the polymer during the titration. As a result for the several calculations which require the amount of ion exchange centres, theoretical values calculated in base of the VBC monomer content were used (equation (4.7))
Chapter 4. Pd(0) doped composite materials. 55
VBC
styreneDVBTh,spec M
1000))ww(1( ⋅+−=ϕ
(4.7)
This method assumes a 100% conversion of the VBC to quaternary amino groups during the functionalisation procedure. This assumption, not valid in the case of the polar phases containing only VBC-DVB could be assumed with some more guaranties in the last case since the functionalisation procedure proceeds using the non polar toluene as a solvent. A better swelling of the non-styrene containing samples can be expected, as a result a better accessibility and therefore a higher extent of functionalisation.
4.4.2.3 Ion exchange kinetics
In an ion exchange process, the transient response of the system can give information about the mass transfer resistance of the ions to enter the the resin. If different polymer phases are used, such information leads to a qualitative characterisation of the accessibility of the polymer structure. For the interpretation of the kinetic ion exchange data different mathematical models were developed based in an ordinary film diffusion model /HEL62/. In this approach ion exchange is considered as a pure mass transfer controlled process governed by the Fick law. As a result, such a process can be influenced either by the external diffusion in a stagnant liquid layer of thickness δ or by the internal diffusion inside the swollen particle of radius RPol. This approach should be formally considered only in the case of isotopic exchange, nevertheless was found to be successful in representing kinetic data when the concentration of the ions was low /GLA63/, a condition, in fact, occurring during the palladate loading of the composites (palladate concentration = 0,03 M). To use the simplest theoretical model and considering the nature of the composite materials several assumptions were adopted: a) The intraparticle diffusion can be neglected based on the previous results obtained by
Limbeck and Schönfeld /LIM00/, /SCH05/ using composite materials with analogous polymer size as the one considered in this work.
b) Equimolecular palladate ion exchange takes place as concluded in paragraph 4.4.1 of this work..
A + B ⇔ A + B In this general equation “A” represents the Chloride anion and “B” the palladate.
c) Unidimensional problem. The stagnant liquid layer thickness where extraparticle diffusion takes place is thinner than the particle radius (δ<RPol). Only the diffusion in the radial direction is considered (Figure 4.10).
d) Diffusion across the film is faster than the concentration changes at the film boundaries and therefore no accumulation of ions on the film is considered.
e) Initial conditions: i) uniform initial concentration of A inside the ion exchange resin and B in the bulk liquid
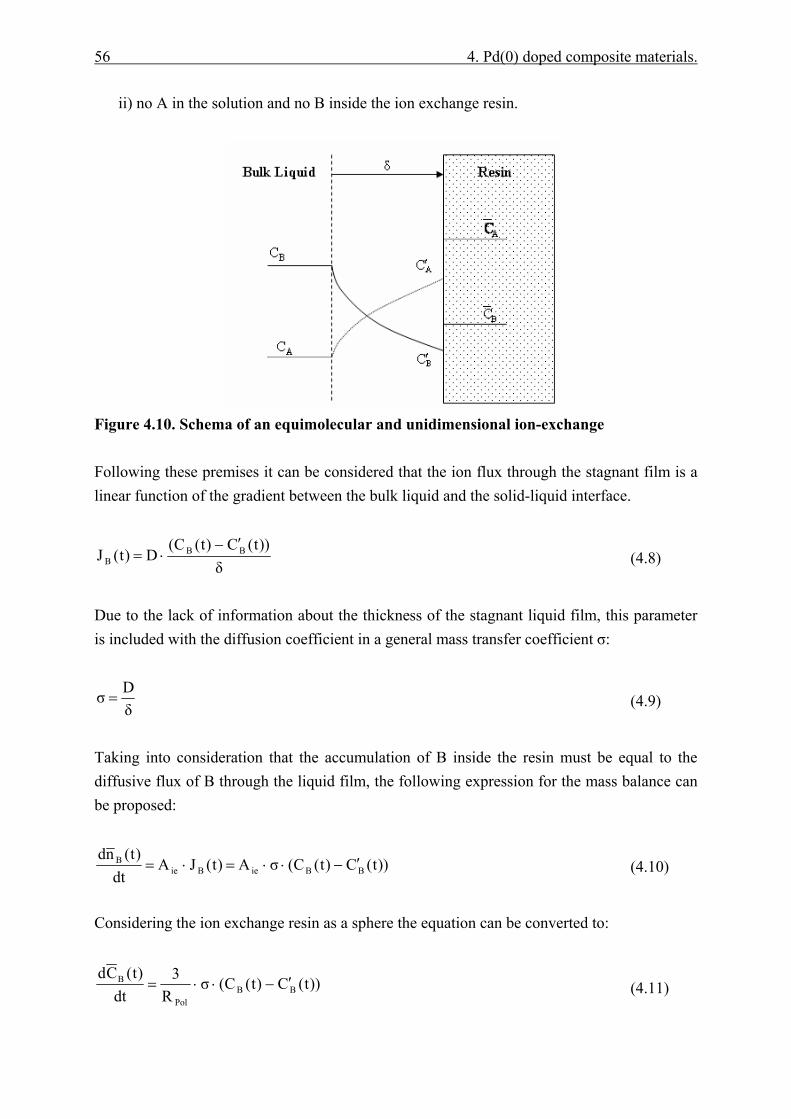
56 4. Pd(0) doped composite materials.
ii) no A in the solution and no B inside the ion exchange resin.
Figure 4.10. Schema of an equimolecular and unidimensional ion-exchange Following these premises it can be considered that the ion flux through the stagnant film is a linear function of the gradient between the bulk liquid and the solid-liquid interface.
δ))t(C)t(C(
D)t(J BBB
′−⋅=
(4.8)
Due to the lack of information about the thickness of the stagnant liquid film, this parameter is included with the diffusion coefficient in a general mass transfer coefficient σ:
δDσ =
(4.9)
Taking into consideration that the accumulation of B inside the resin must be equal to the diffusive flux of B through the liquid film, the following expression for the mass balance can be proposed:
))t(C)t(C(σA)t(JAdt
)t(ndBBieBie
B ′−⋅⋅=⋅=
(4.10)
Considering the ion exchange resin as a sphere the equation can be converted to:
))t(C)t(C(σR
3dt
)t(CdBB
Pol
B ′−⋅⋅=
(4.11)
Chapter 4. Pd(0) doped composite materials. 57
Before integrating this differential equation it is necessary to obtain an expression of )t(CB′
as a function of experimentally accessible parameters and an expression correlating )t(CB
with the concentration of B in the solid phase. For this purposes it is necessary to define several parameters. Ion exchangers prefer normally specific counter-ions than others. This selectivity can be characterized by a binary separation factor called selectivity coefficient α. For the equimolecular ion exchange considered the selectivity factor follows the expression:
BA
BAAB CC
CC⋅⋅
=α (4.12)
The equilibrium in the solid-liquid interface is commonly assumed since no resistance to mass transfer is expected in this area /HEL62/. As a result, the selectivity coefficient can be redefined including the concentration conditions in the interface:
BA
BAAB CC
CC⋅′
′⋅=α
(4.13)
Using the mass balance of the process (each of the B ions entering the solid are replaced by a A ion coming from the resin) and considering the equilibrium condition, the total concentration in the liquid phase Ct can be expressed using the concentration of the ions in the interface:
t t A B BC C C (t) C (t) C (t 0) 0,03M′ ′ ′= = + = = =
(4.14) As well, the total concentration of ions in the resin can be expressed as:
abst A B AC C (t) C (t) C (t 0)
Vϕ
= + = = =
(4.15)
Combining equations (4.14) and (4.15) and the condition of interface equilibrium reflected in equation (4.13) the following expression of the concentration of B in the interface is obtained:
AB t B
B At B B
C C (t)C (t)C C (t) (1 )
α ⋅ ⋅′ =− ⋅ − α
(4.16)
58 4. Pd(0) doped composite materials.
A palladate mass balance in the whole system considers that all the palladate being exchanged in the resin comes from the bulk liquid. Mathematically it can be expressed using the next equation:
BB dnnd −=
(4.17) The integration of this equation from the initial concentrations to a general condition brings the following result:
B t BVC (t) C C (t)V
= − ⋅
(4.18)
being V and V the volume of solution and the total ion exchange volume respectively. Further, using the expressions (4.16) and (4.18) an integrable alternative of the differential equation (4.11) is reached:
⎟⎟⎠
⎞⎜⎜⎝
⎛
−⋅−⋅⋅
−⋅−⋅=)α1()t(CC
)t(CCα)t(C
VVC
Rσ3
dt)t(Cd
ABBt
BtAB
BtPol
B
(4.19)
If a special ion exchange conversion based in the palladate anion inside the polymer phase is defined:
B B
t t
C nX(t)C C V
= =⋅
(4.20)
the equation (4.19) can be converted in the expression:
⎟⎟⎟⎟⎟
⎠
⎞
⎜⎜⎜⎜⎜
⎝
⎛
−⋅−
⋅−⋅−⋅=
)α1()t(XCC
)t(Xα)t(XVV1
Rσ3
dt)t(dX
AB
t
t
AB
Pol (4.21)
Depending on the value adopted by the selectivity coefficient two different possibilities were considered: a selective ion exchange process where the resin has a high affinity to keep the palladate ionically anchored (0<α<1) and a non-selective process (α=1).
Chapter 4. Pd(0) doped composite materials. 59
• Selective ion exchange (0<α<1)
During the integration process of the equation (4.21) two simplifications were done. The first one considers an ion exchange process where initially the number of palladate anions in the fluid phase equals the number of chloride anions inside the resin (equation (4.22)).
The second one is based on the experimental observation that all ion exchange sites are easily exchanged from the chloride form to the palladium form. Such great palladium selectivity implies that α<<1. With both simplifications, the following analytical solution was obtained:
( )atexpdd)t(X −−=
(4.23)
Where the parameters included in the equation represent:
PolRdσ6a⋅
=
(4.24)
t
t
CdC
=
(4.25)
• Non-selective exchange (α=1)
In this case, the differential equation is simplified to a linear first order differential equation:
⎟⎟⎠
⎞⎜⎜⎝
⎛⋅⎟⎟
⎠
⎞⎜⎜⎝
⎛+−⋅= )t(X
CC
VV1
Rσ3
dt)t(dX
t
t
Pol (4.26)
With the following analytical solution:
( )g
)ftexp1()t(X −−=
(4.27)
Where the new parameters represent:
PolRσ3gf =
(4.28)
t
t
V CgV C
= +
(4.29)
t tC V C V⋅ = ⋅ (4.22)
60 4. Pd(0) doped composite materials.
Several experiments measuring the palladate exchange kinetics in polymer phases containing different crosslinking degrees were performed. These experiments were developed using three fluid-dynamic regimes, each of them defined by an operation procedure already introduced in section 4.2.2. Experimentally the decrease in the palladium concentration was followed by UV-vis spectroscopy taking samples at definite times. As it was concluded during the studies of the palladate anchoring mechanism (section 4.4.1), palladate sorption processes can be neglected. Therefore it was assumed that molar amount of palladium not present in solution (difference between the initial concentration and the experimental measurement) would be anchored in the ion exchange centres ( Bn ). Including this value in equation (4.20) together
with concentration of palladate (equation (4.14)) and the volume of polymer ( V calculated using the number of rings, PCfunct and the density of the polymer phase ρPol= 1.1 g⋅cm-3), an experimental estimation of X(t) was calculated. By means of the Levenberg-Marquardt algorithm, these experimental data were fit to equations (4.23) and (4.27). In all ion exchange experiments, a conversion close to 100% was obtained (data not shown). Taking into account this experimental fact, only the selective ion exchange solution to the model should be considered appropriate to describe the behaviour of the composites. Nevertheless, only using the non-selective solution was possible to fit the data of the batch experiments. Using the selective resin model, the fitting did not converge. To explain it, it could be considered that under the strong mass transfer resistance achieved in a batch method, hindrances to the transport of the palladate from the bulk liquid to the polymer surface appear, avoiding the selective character of the process. All fitting lines obtained using the appropriate combination flow condition-mathematical model and the experimental points are shown in Figure 4.11. The fitting process provides as an output the values of the parameters included in the model (a, d, f and g). Introducing these values in the equations (4.24), (4.25), (4.28) and
(4.29), considering a medium value of RPol= 2.5μm, values of Ct and tC obtained from
equations (4.14) and (4.15) respectively and the estimation of V (Table 4.3) and V (calculated using the number of rings, PCfunct and the density of the polymer phase ρPol= 1.1 g⋅cm-3), a value of the mass transfer coefficient of the palladate during the ion exchange process for the different materials and fluid dynamic conditions was calculated.
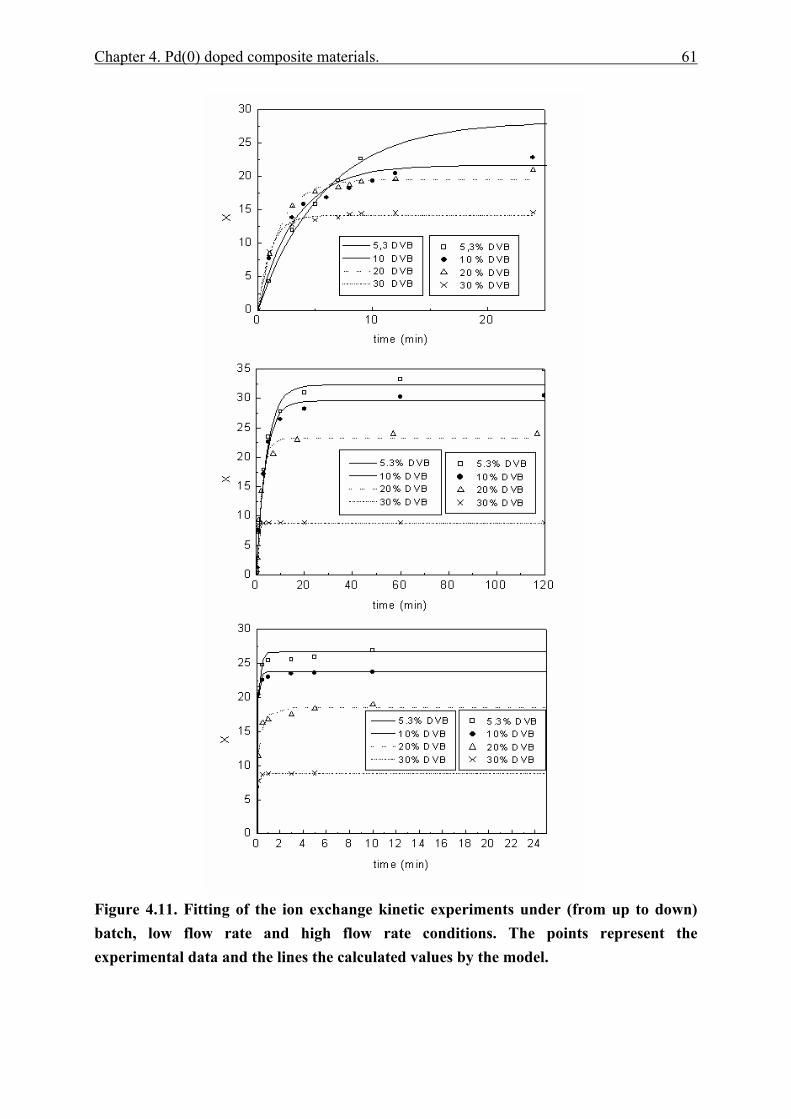
Chapter 4. Pd(0) doped composite materials. 61
Figure 4.11. Fitting of the ion exchange kinetic experiments under (from up to down) batch, low flow rate and high flow rate conditions. The points represent the experimental data and the lines the calculated values by the model.
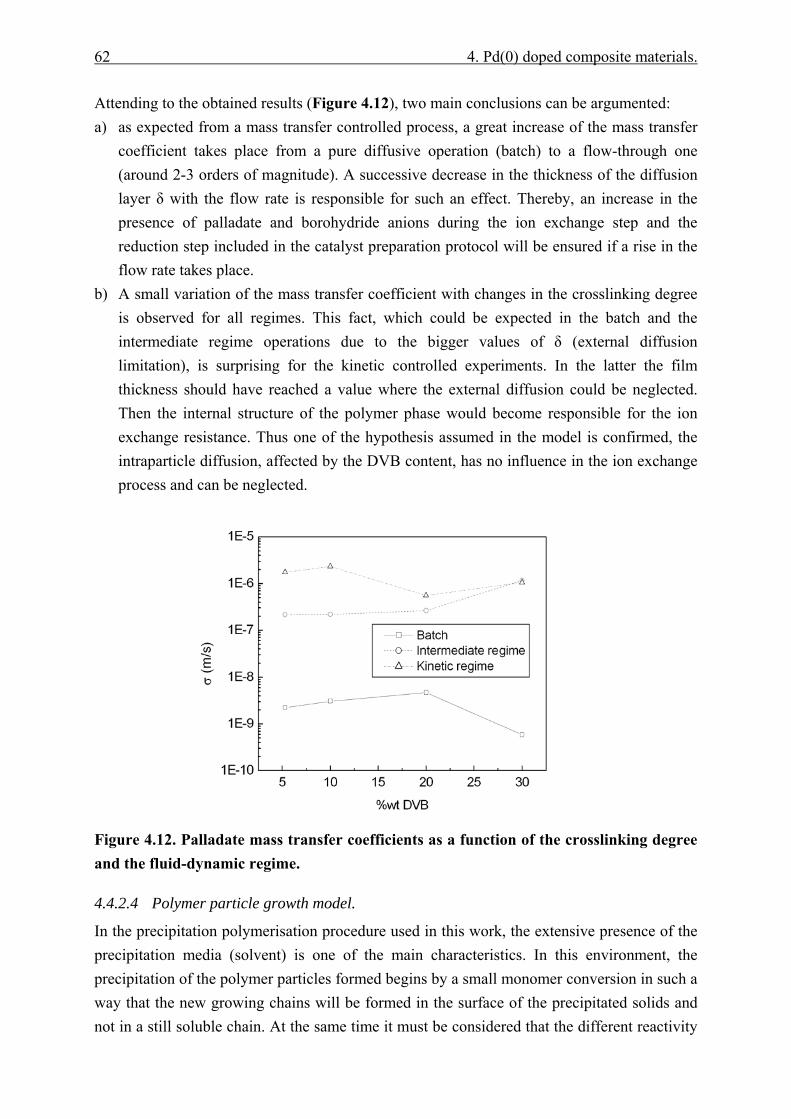
62 4. Pd(0) doped composite materials.
Attending to the obtained results (Figure 4.12), two main conclusions can be argumented: a) as expected from a mass transfer controlled process, a great increase of the mass transfer
coefficient takes place from a pure diffusive operation (batch) to a flow-through one (around 2-3 orders of magnitude). A successive decrease in the thickness of the diffusion layer δ with the flow rate is responsible for such an effect. Thereby, an increase in the presence of palladate and borohydride anions during the ion exchange step and the reduction step included in the catalyst preparation protocol will be ensured if a rise in the flow rate takes place.
b) A small variation of the mass transfer coefficient with changes in the crosslinking degree is observed for all regimes. This fact, which could be expected in the batch and the intermediate regime operations due to the bigger values of δ (external diffusion limitation), is surprising for the kinetic controlled experiments. In the latter the film thickness should have reached a value where the external diffusion could be neglected. Then the internal structure of the polymer phase would become responsible for the ion exchange resistance. Thus one of the hypothesis assumed in the model is confirmed, the intraparticle diffusion, affected by the DVB content, has no influence in the ion exchange process and can be neglected.
Figure 4.12. Palladate mass transfer coefficients as a function of the crosslinking degree and the fluid-dynamic regime.
4.4.2.4 Polymer particle growth model.
In the precipitation polymerisation procedure used in this work, the extensive presence of the precipitation media (solvent) is one of the main characteristics. In this environment, the precipitation of the polymer particles formed begins by a small monomer conversion in such a way that the new growing chains will be formed in the surface of the precipitated solids and not in a still soluble chain. At the same time it must be considered that the different reactivity

Chapter 4. Pd(0) doped composite materials. 63
of the monomers produce in consecutive polymerisation stages growing chains with different composition. According to this two statements it seems reasonable to think in a polymer growth model based on the assumption of an onion shell-like structure, with a core rich in the most reactive monomer and outer shells rich in the less reactive one Figure 4.13.
Figure 4.13. Description of the Polymer growth model. M1= VBC, M2=DVB Considering a polymer particle structure divided in 50 different layers, using molar ratios in mol% and based in the copolymerization equation /KUN98/, a distribution of the crosslinker content across a polymer particle for different initial concentrations of the monomer mixture was obtained. The DVB profiles obtained and presented in Figure 4.14 depict the expected polymer structure. Two definite regions can be observed, a very dense highly crosslinked core and a surface region with a very low level of crosslinking and therefore with a gel-like structure. This kind of arrangement is similar to the individual spheres forming a macroporous resin /JER85/. Independently of the amount of crosslinker the model shows how most of the outer layers of the polymer would present a comparable amount of DVB, therefore a comparable structure and as a result a comparable resistance to the diffusion of molecules through it. These conclusions agree with the mass transfer coefficients calculated by the ion exchange kinetic models. Probably only the polymer phase with a 30%DVB would present a different structure since almost all particle layers are above 30 %mol in DVB content, a reasonable limit to create rigid microporous structures. The same approach was not applied to the case of the terpolymers containing styrene as the third comonomer due to the level of complication which adopt the copolymerisation equation. Nevertheless a qualitative overview of the possible outcome is affordable just attending to the copolymerisation parameters of the individual comonomers with DVB. Both, styrene and VBC, have a quite smaller reactivity when reacting individually with the crosslinker. Thus a
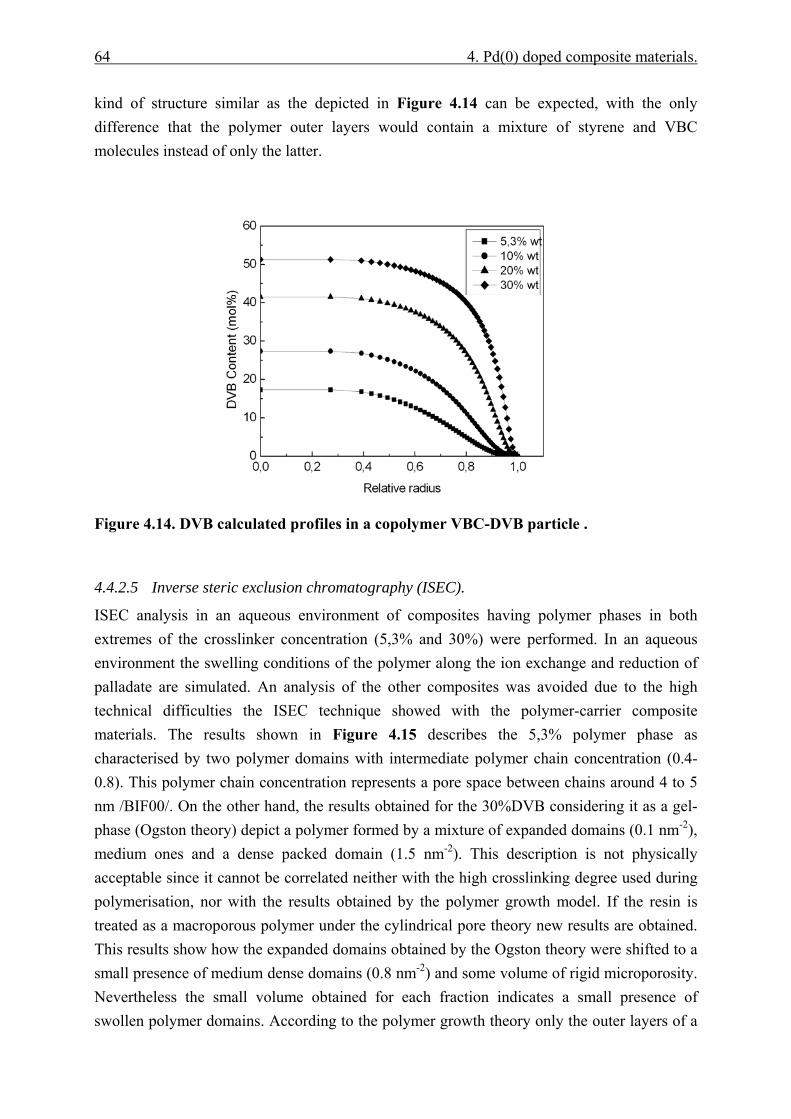
64 4. Pd(0) doped composite materials.
kind of structure similar as the depicted in Figure 4.14 can be expected, with the only difference that the polymer outer layers would contain a mixture of styrene and VBC molecules instead of only the latter.
Figure 4.14. DVB calculated profiles in a copolymer VBC-DVB particle .
4.4.2.5 Inverse steric exclusion chromatography (ISEC).
ISEC analysis in an aqueous environment of composites having polymer phases in both extremes of the crosslinker concentration (5,3% and 30%) were performed. In an aqueous environment the swelling conditions of the polymer along the ion exchange and reduction of palladate are simulated. An analysis of the other composites was avoided due to the high technical difficulties the ISEC technique showed with the polymer-carrier composite materials. The results shown in Figure 4.15 describes the 5,3% polymer phase as characterised by two polymer domains with intermediate polymer chain concentration (0.4-0.8). This polymer chain concentration represents a pore space between chains around 4 to 5 nm /BIF00/. On the other hand, the results obtained for the 30%DVB considering it as a gel-phase (Ogston theory) depict a polymer formed by a mixture of expanded domains (0.1 nm-2), medium ones and a dense packed domain (1.5 nm-2). This description is not physically acceptable since it cannot be correlated neither with the high crosslinking degree used during polymerisation, nor with the results obtained by the polymer growth model. If the resin is treated as a macroporous polymer under the cylindrical pore theory new results are obtained. This results show how the expanded domains obtained by the Ogston theory were shifted to a small presence of medium dense domains (0.8 nm-2) and some volume of rigid microporosity. Nevertheless the small volume obtained for each fraction indicates a small presence of swollen polymer domains. According to the polymer growth theory only the outer layers of a
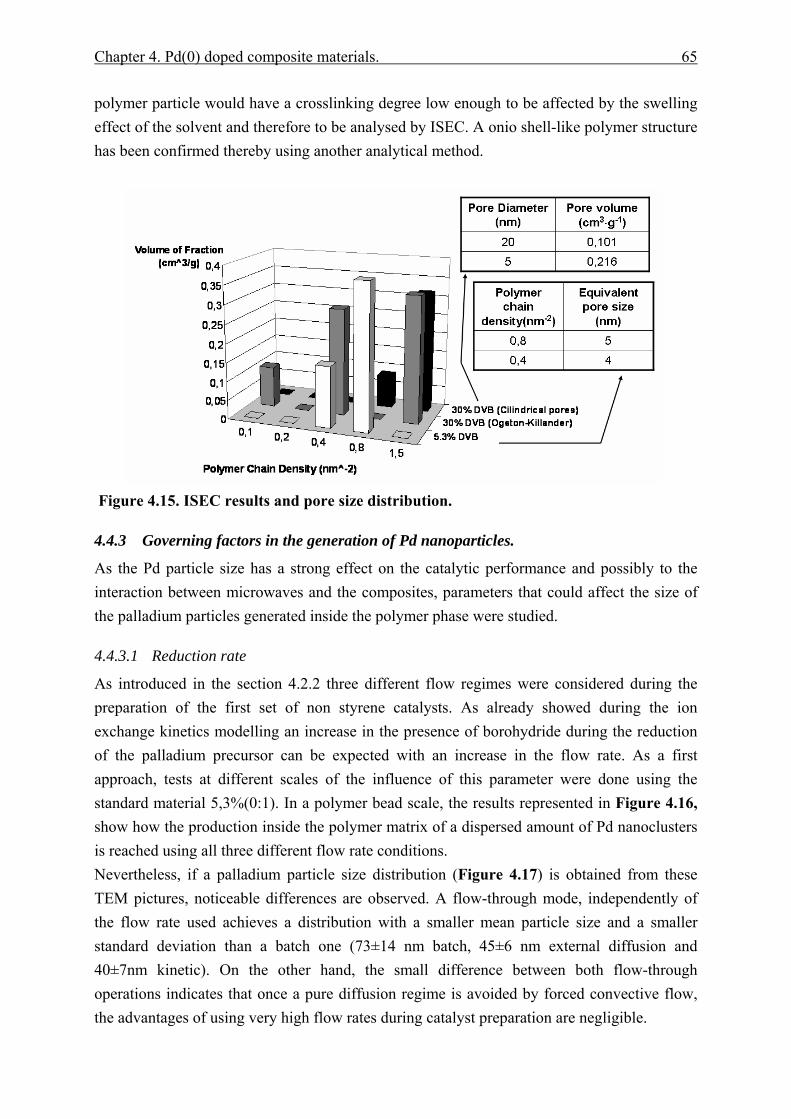
Chapter 4. Pd(0) doped composite materials. 65
polymer particle would have a crosslinking degree low enough to be affected by the swelling effect of the solvent and therefore to be analysed by ISEC. A onio shell-like polymer structure has been confirmed thereby using another analytical method.
Figure 4.15. ISEC results and pore size distribution.
4.4.3 Governing factors in the generation of Pd nanoparticles.
As the Pd particle size has a strong effect on the catalytic performance and possibly to the interaction between microwaves and the composites, parameters that could affect the size of the palladium particles generated inside the polymer phase were studied.
4.4.3.1 Reduction rate
As introduced in the section 4.2.2 three different flow regimes were considered during the preparation of the first set of non styrene catalysts. As already showed during the ion exchange kinetics modelling an increase in the presence of borohydride during the reduction of the palladium precursor can be expected with an increase in the flow rate. As a first approach, tests at different scales of the influence of this parameter were done using the standard material 5,3%(0:1). In a polymer bead scale, the results represented in Figure 4.16, show how the production inside the polymer matrix of a dispersed amount of Pd nanoclusters is reached using all three different flow rate conditions. Nevertheless, if a palladium particle size distribution (Figure 4.17) is obtained from these TEM pictures, noticeable differences are observed. A flow-through mode, independently of the flow rate used achieves a distribution with a smaller mean particle size and a smaller standard deviation than a batch one (73±14 nm batch, 45±6 nm external diffusion and 40±7nm kinetic). On the other hand, the small difference between both flow-through operations indicates that once a pure diffusion regime is avoided by forced convective flow, the advantages of using very high flow rates during catalyst preparation are negligible.
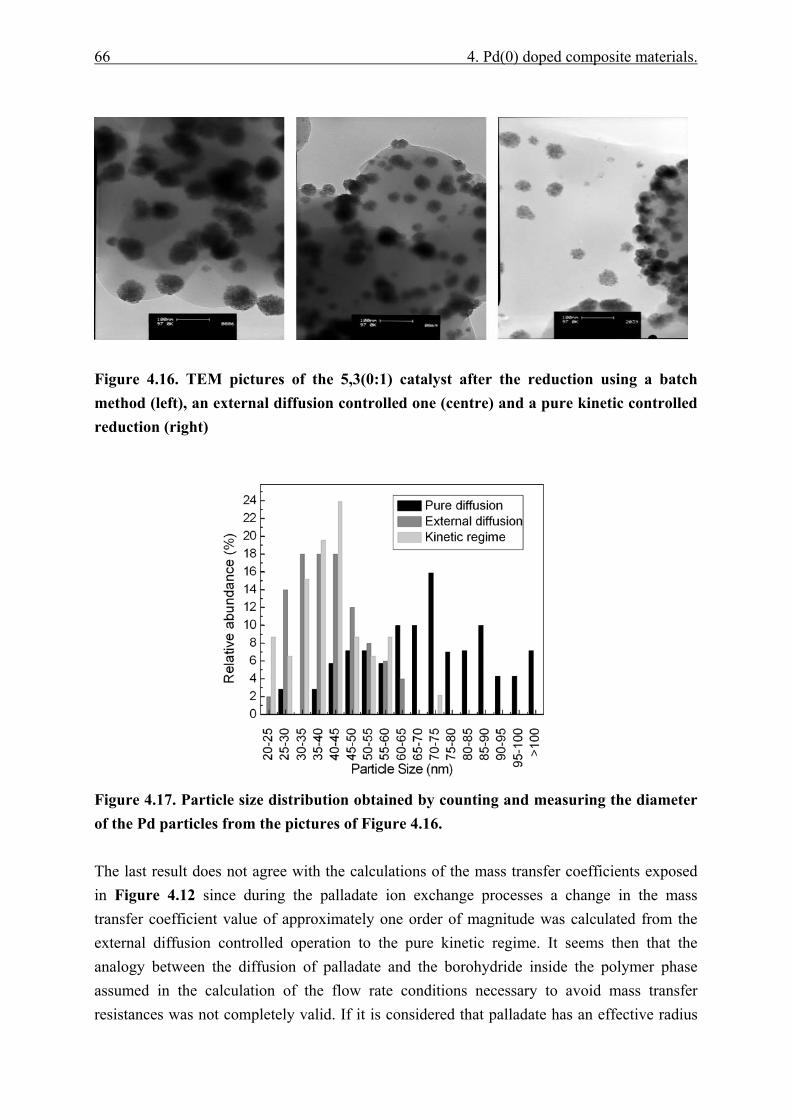
66 4. Pd(0) doped composite materials.
Figure 4.16. TEM pictures of the 5,3(0:1) catalyst after the reduction using a batch method (left), an external diffusion controlled one (centre) and a pure kinetic controlled reduction (right)
Figure 4.17. Particle size distribution obtained by counting and measuring the diameter of the Pd particles from the pictures of Figure 4.16. The last result does not agree with the calculations of the mass transfer coefficients exposed in Figure 4.12 since during the palladate ion exchange processes a change in the mass transfer coefficient value of approximately one order of magnitude was calculated from the external diffusion controlled operation to the pure kinetic regime. It seems then that the analogy between the diffusion of palladate and the borohydride inside the polymer phase assumed in the calculation of the flow rate conditions necessary to avoid mass transfer resistances was not completely valid. If it is considered that palladate has an effective radius
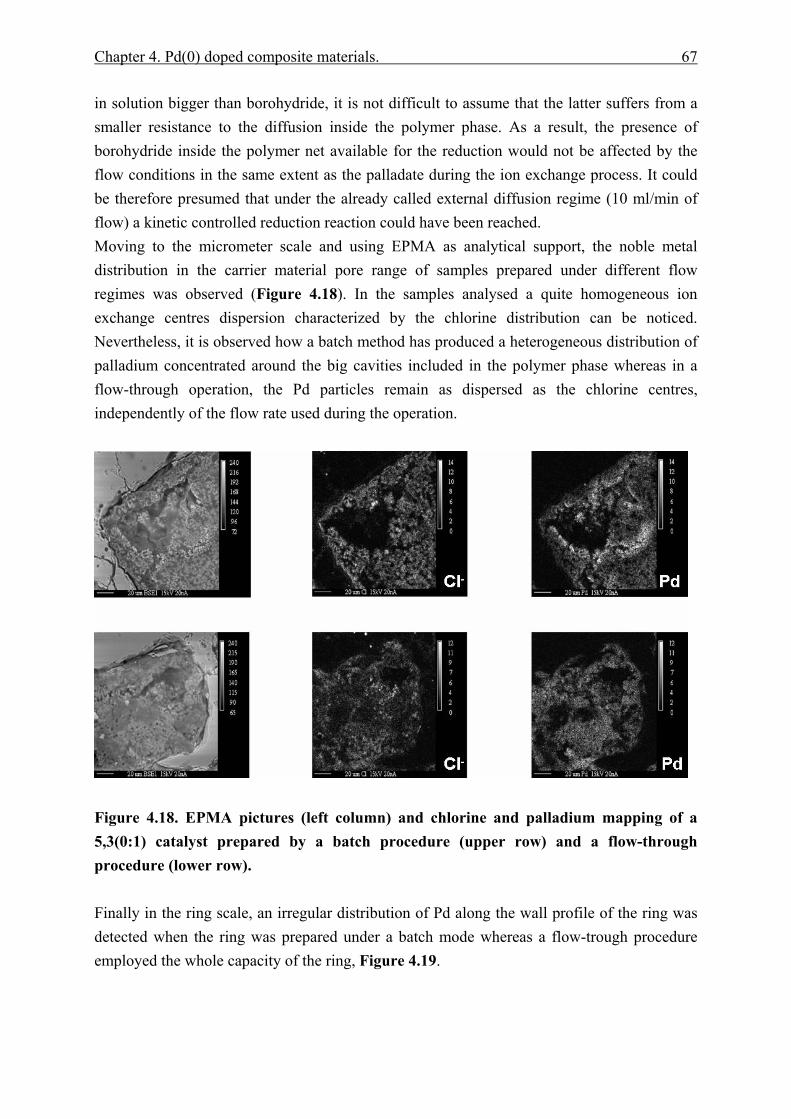
Chapter 4. Pd(0) doped composite materials. 67
in solution bigger than borohydride, it is not difficult to assume that the latter suffers from a smaller resistance to the diffusion inside the polymer phase. As a result, the presence of borohydride inside the polymer net available for the reduction would not be affected by the flow conditions in the same extent as the palladate during the ion exchange process. It could be therefore presumed that under the already called external diffusion regime (10 ml/min of flow) a kinetic controlled reduction reaction could have been reached. Moving to the micrometer scale and using EPMA as analytical support, the noble metal distribution in the carrier material pore range of samples prepared under different flow regimes was observed (Figure 4.18). In the samples analysed a quite homogeneous ion exchange centres dispersion characterized by the chlorine distribution can be noticed. Nevertheless, it is observed how a batch method has produced a heterogeneous distribution of palladium concentrated around the big cavities included in the polymer phase whereas in a flow-through operation, the Pd particles remain as dispersed as the chlorine centres, independently of the flow rate used during the operation.
Figure 4.18. EPMA pictures (left column) and chlorine and palladium mapping of a 5,3(0:1) catalyst prepared by a batch procedure (upper row) and a flow-through procedure (lower row). Finally in the ring scale, an irregular distribution of Pd along the wall profile of the ring was detected when the ring was prepared under a batch mode whereas a flow-trough procedure employed the whole capacity of the ring, Figure 4.19.
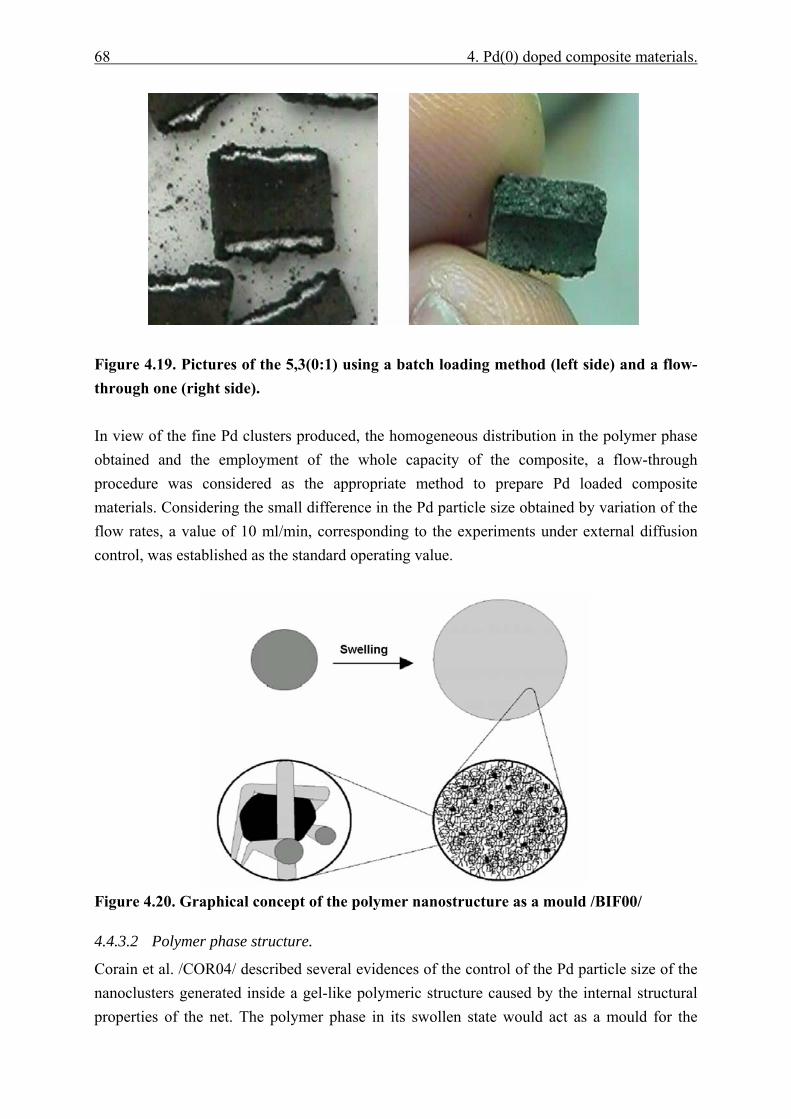
68 4. Pd(0) doped composite materials.
Figure 4.19. Pictures of the 5,3(0:1) using a batch loading method (left side) and a flow-through one (right side). In view of the fine Pd clusters produced, the homogeneous distribution in the polymer phase obtained and the employment of the whole capacity of the composite, a flow-through procedure was considered as the appropriate method to prepare Pd loaded composite materials. Considering the small difference in the Pd particle size obtained by variation of the flow rates, a value of 10 ml/min, corresponding to the experiments under external diffusion control, was established as the standard operating value.
Figure 4.20. Graphical concept of the polymer nanostructure as a mould /BIF00/
4.4.3.2 Polymer phase structure.
Corain et al. /COR04/ described several evidences of the control of the Pd particle size of the nanoclusters generated inside a gel-like polymeric structure caused by the internal structural properties of the net. The polymer phase in its swollen state would act as a mould for the
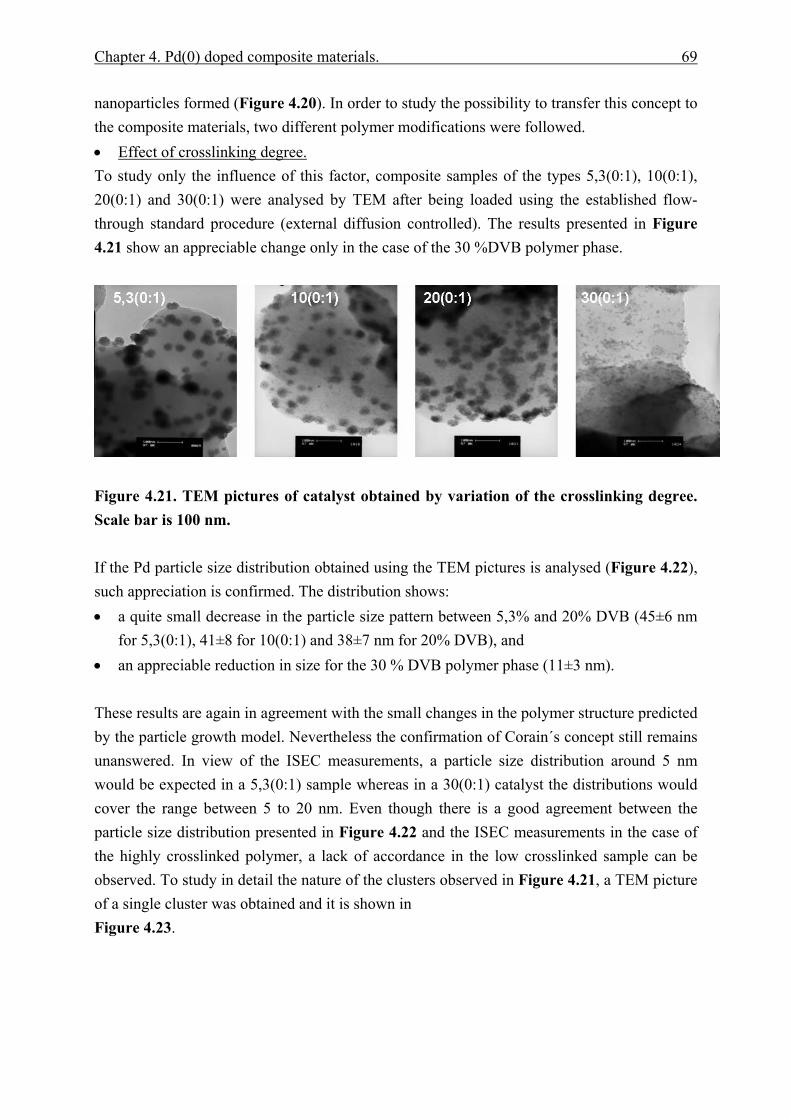
Chapter 4. Pd(0) doped composite materials. 69
nanoparticles formed (Figure 4.20). In order to study the possibility to transfer this concept to the composite materials, two different polymer modifications were followed. • Effect of crosslinking degree. To study only the influence of this factor, composite samples of the types 5,3(0:1), 10(0:1), 20(0:1) and 30(0:1) were analysed by TEM after being loaded using the established flow-through standard procedure (external diffusion controlled). The results presented in Figure 4.21 show an appreciable change only in the case of the 30 %DVB polymer phase.
Figure 4.21. TEM pictures of catalyst obtained by variation of the crosslinking degree. Scale bar is 100 nm. If the Pd particle size distribution obtained using the TEM pictures is analysed (Figure 4.22), such appreciation is confirmed. The distribution shows: • a quite small decrease in the particle size pattern between 5,3% and 20% DVB (45±6 nm
for 5,3(0:1), 41±8 for 10(0:1) and 38±7 nm for 20% DVB), and • an appreciable reduction in size for the 30 % DVB polymer phase (11±3 nm). These results are again in agreement with the small changes in the polymer structure predicted by the particle growth model. Nevertheless the confirmation of Corain´s concept still remains unanswered. In view of the ISEC measurements, a particle size distribution around 5 nm would be expected in a 5,3(0:1) sample whereas in a 30(0:1) catalyst the distributions would cover the range between 5 to 20 nm. Even though there is a good agreement between the particle size distribution presented in Figure 4.22 and the ISEC measurements in the case of the highly crosslinked polymer, a lack of accordance in the low crosslinked sample can be observed. To study in detail the nature of the clusters observed in Figure 4.21, a TEM picture of a single cluster was obtained and it is shown in Figure 4.23.
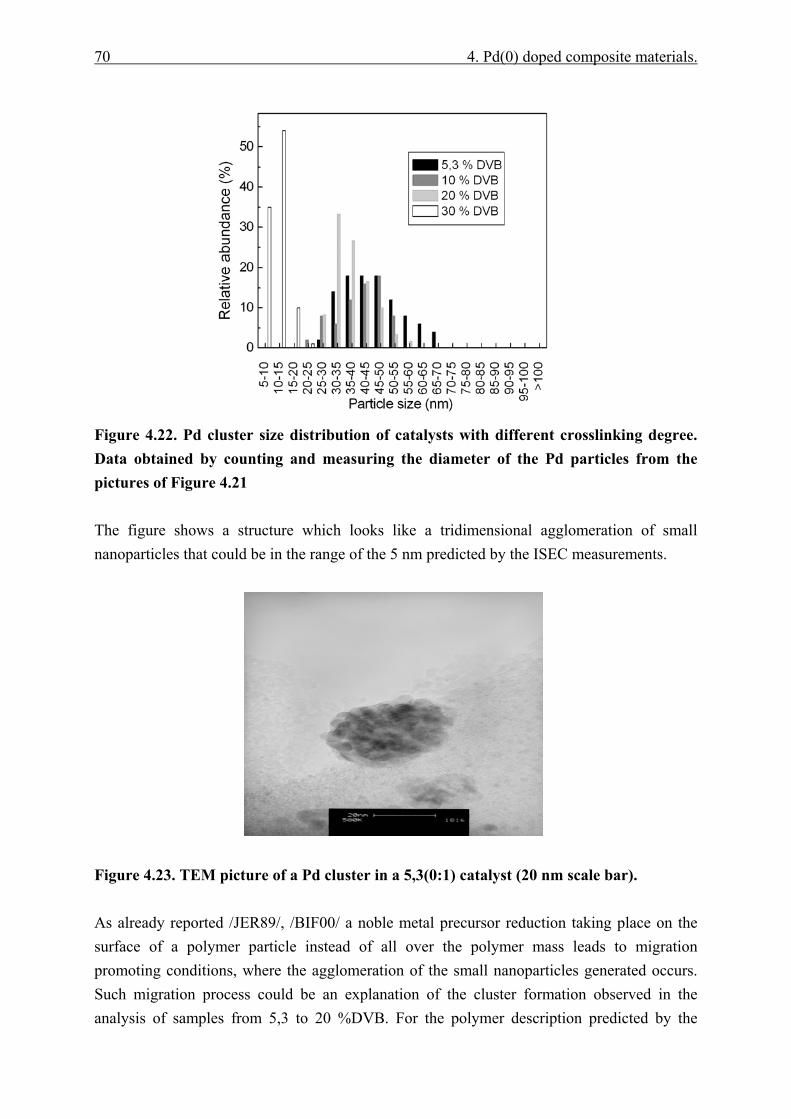
70 4. Pd(0) doped composite materials.
Figure 4.22. Pd cluster size distribution of catalysts with different crosslinking degree. Data obtained by counting and measuring the diameter of the Pd particles from the pictures of Figure 4.21 The figure shows a structure which looks like a tridimensional agglomeration of small nanoparticles that could be in the range of the 5 nm predicted by the ISEC measurements.
Figure 4.23. TEM picture of a Pd cluster in a 5,3(0:1) catalyst (20 nm scale bar). As already reported /JER89/, /BIF00/ a noble metal precursor reduction taking place on the surface of a polymer particle instead of all over the polymer mass leads to migration promoting conditions, where the agglomeration of the small nanoparticles generated occurs. Such migration process could be an explanation of the cluster formation observed in the analysis of samples from 5,3 to 20 %DVB. For the polymer description predicted by the
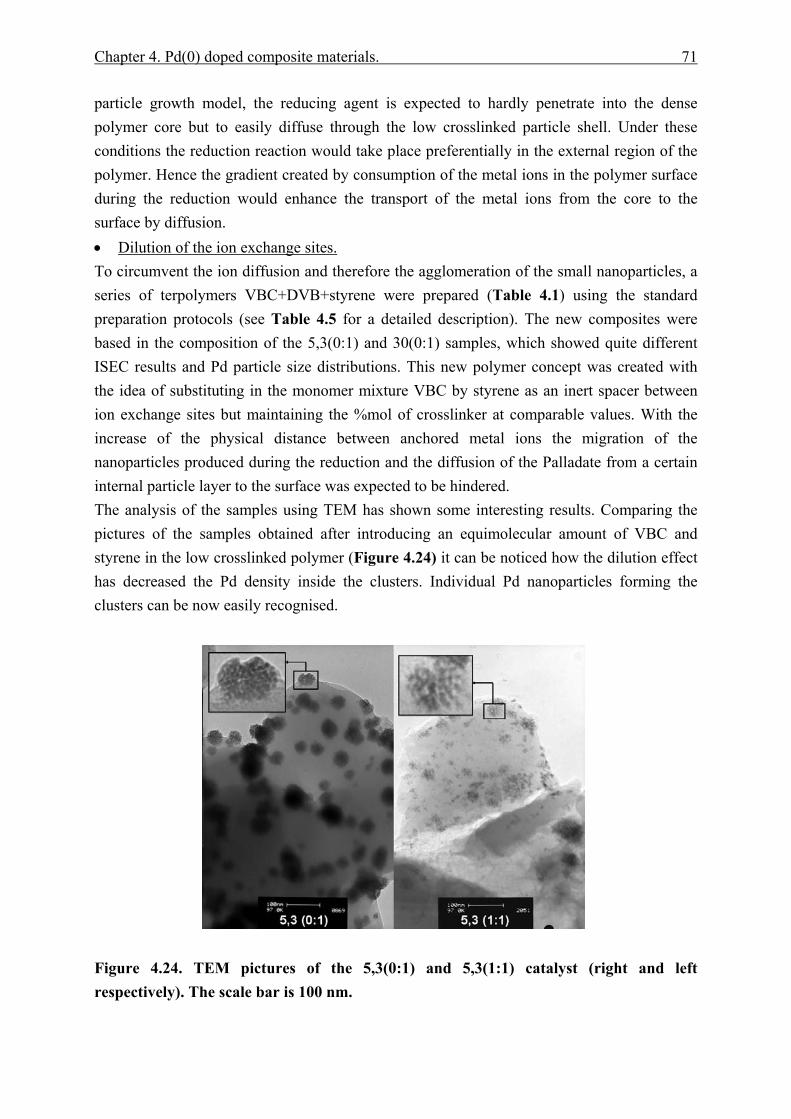
Chapter 4. Pd(0) doped composite materials. 71
particle growth model, the reducing agent is expected to hardly penetrate into the dense polymer core but to easily diffuse through the low crosslinked particle shell. Under these conditions the reduction reaction would take place preferentially in the external region of the polymer. Hence the gradient created by consumption of the metal ions in the polymer surface during the reduction would enhance the transport of the metal ions from the core to the surface by diffusion. • Dilution of the ion exchange sites. To circumvent the ion diffusion and therefore the agglomeration of the small nanoparticles, a series of terpolymers VBC+DVB+styrene were prepared (Table 4.1) using the standard preparation protocols (see Table 4.5 for a detailed description). The new composites were based in the composition of the 5,3(0:1) and 30(0:1) samples, which showed quite different ISEC results and Pd particle size distributions. This new polymer concept was created with the idea of substituting in the monomer mixture VBC by styrene as an inert spacer between ion exchange sites but maintaining the %mol of crosslinker at comparable values. With the increase of the physical distance between anchored metal ions the migration of the nanoparticles produced during the reduction and the diffusion of the Palladate from a certain internal particle layer to the surface was expected to be hindered. The analysis of the samples using TEM has shown some interesting results. Comparing the pictures of the samples obtained after introducing an equimolecular amount of VBC and styrene in the low crosslinked polymer (Figure 4.24) it can be noticed how the dilution effect has decreased the Pd density inside the clusters. Individual Pd nanoparticles forming the clusters can be now easily recognised.
Figure 4.24. TEM pictures of the 5,3(0:1) and 5,3(1:1) catalyst (right and left respectively). The scale bar is 100 nm.
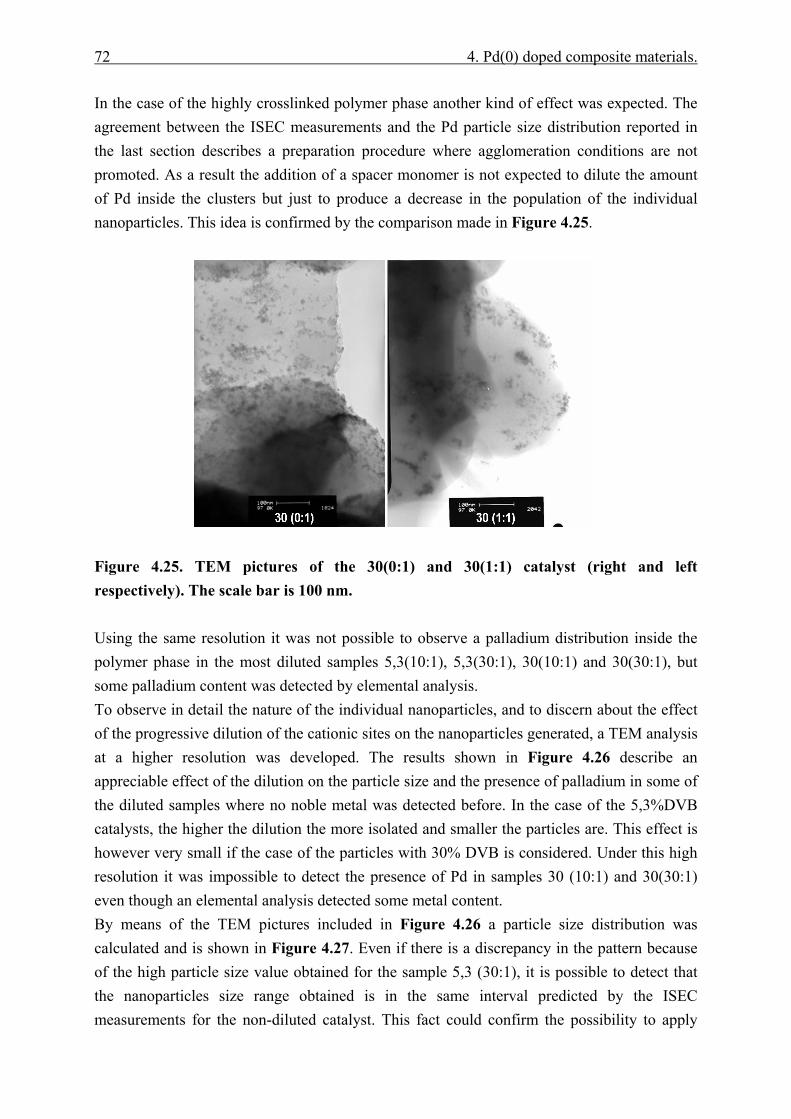
72 4. Pd(0) doped composite materials.
In the case of the highly crosslinked polymer phase another kind of effect was expected. The agreement between the ISEC measurements and the Pd particle size distribution reported in the last section describes a preparation procedure where agglomeration conditions are not promoted. As a result the addition of a spacer monomer is not expected to dilute the amount of Pd inside the clusters but just to produce a decrease in the population of the individual nanoparticles. This idea is confirmed by the comparison made in Figure 4.25.
Figure 4.25. TEM pictures of the 30(0:1) and 30(1:1) catalyst (right and left respectively). The scale bar is 100 nm. Using the same resolution it was not possible to observe a palladium distribution inside the polymer phase in the most diluted samples 5,3(10:1), 5,3(30:1), 30(10:1) and 30(30:1), but some palladium content was detected by elemental analysis. To observe in detail the nature of the individual nanoparticles, and to discern about the effect of the progressive dilution of the cationic sites on the nanoparticles generated, a TEM analysis at a higher resolution was developed. The results shown in Figure 4.26 describe an appreciable effect of the dilution on the particle size and the presence of palladium in some of the diluted samples where no noble metal was detected before. In the case of the 5,3%DVB catalysts, the higher the dilution the more isolated and smaller the particles are. This effect is however very small if the case of the particles with 30% DVB is considered. Under this high resolution it was impossible to detect the presence of Pd in samples 30 (10:1) and 30(30:1) even though an elemental analysis detected some metal content. By means of the TEM pictures included in Figure 4.26 a particle size distribution was calculated and is shown in Figure 4.27. Even if there is a discrepancy in the pattern because of the high particle size value obtained for the sample 5,3 (30:1), it is possible to detect that the nanoparticles size range obtained is in the same interval predicted by the ISEC measurements for the non-diluted catalyst. This fact could confirm the possibility to apply
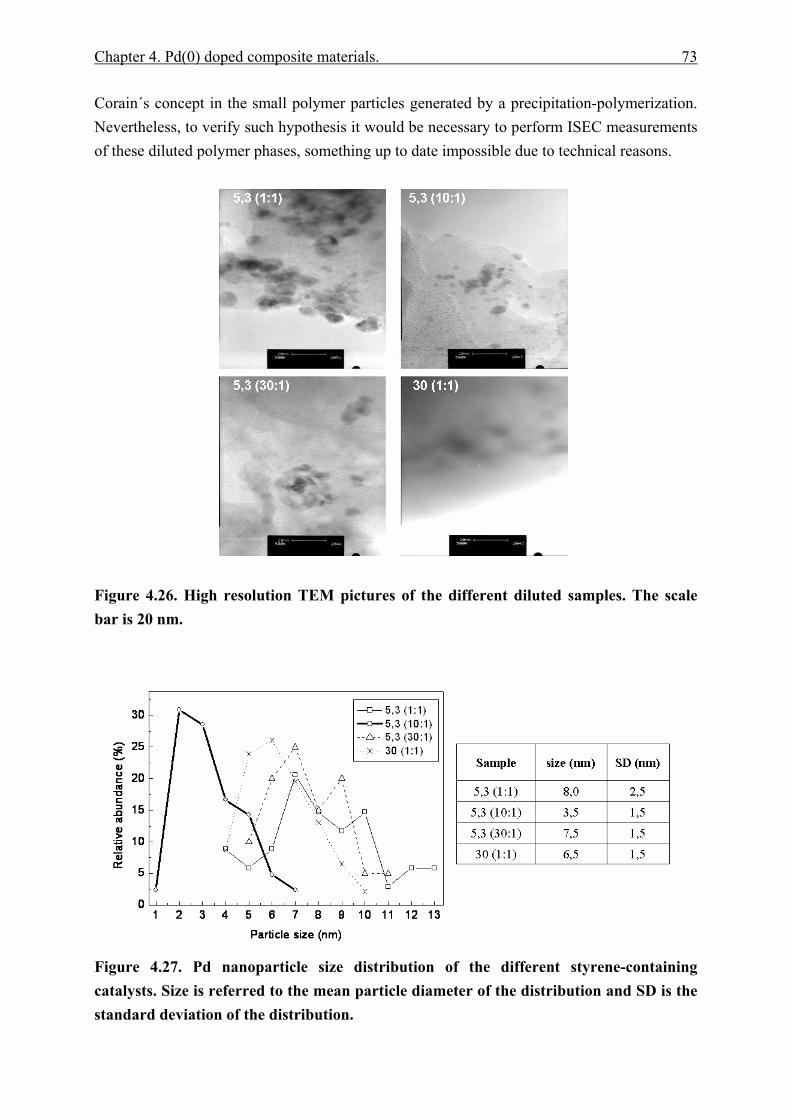
Chapter 4. Pd(0) doped composite materials. 73
Corain´s concept in the small polymer particles generated by a precipitation-polymerization. Nevertheless, to verify such hypothesis it would be necessary to perform ISEC measurements of these diluted polymer phases, something up to date impossible due to technical reasons.
Figure 4.26. High resolution TEM pictures of the different diluted samples. The scale bar is 20 nm.
Figure 4.27. Pd nanoparticle size distribution of the different styrene-containing catalysts. Size is referred to the mean particle diameter of the distribution and SD is the standard deviation of the distribution.
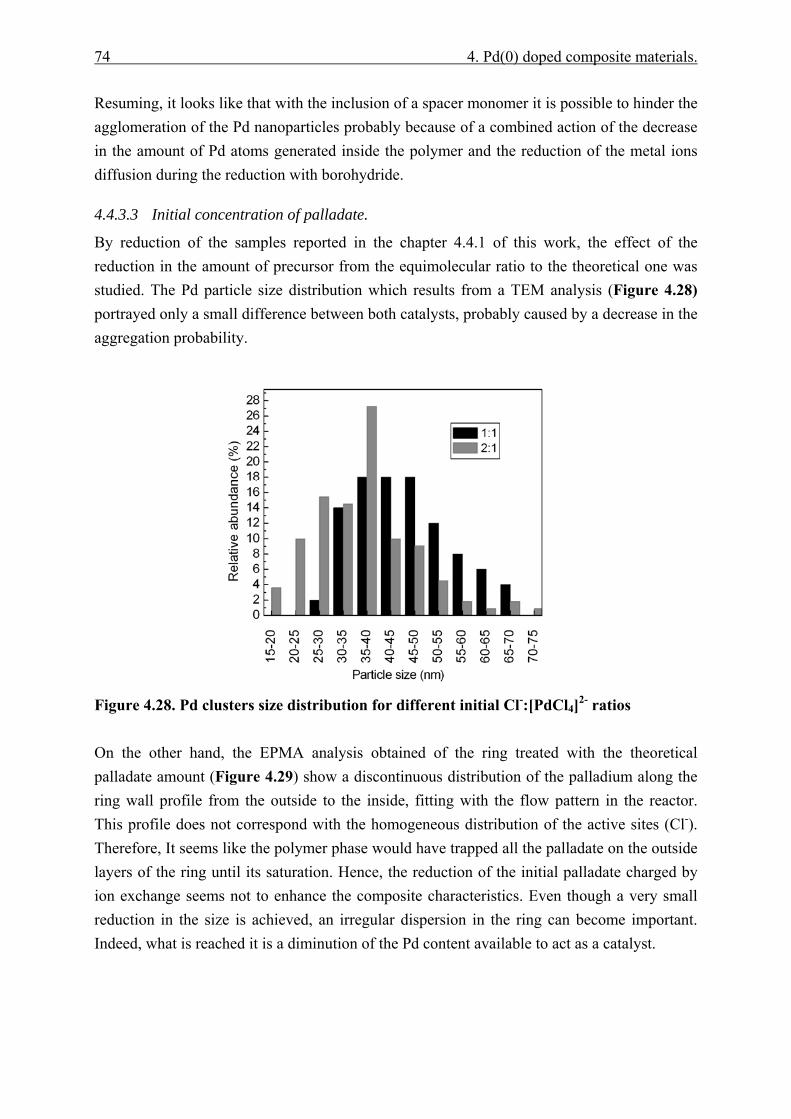
74 4. Pd(0) doped composite materials.
Resuming, it looks like that with the inclusion of a spacer monomer it is possible to hinder the agglomeration of the Pd nanoparticles probably because of a combined action of the decrease in the amount of Pd atoms generated inside the polymer and the reduction of the metal ions diffusion during the reduction with borohydride.
4.4.3.3 Initial concentration of palladate.
By reduction of the samples reported in the chapter 4.4.1 of this work, the effect of the reduction in the amount of precursor from the equimolecular ratio to the theoretical one was studied. The Pd particle size distribution which results from a TEM analysis (Figure 4.28) portrayed only a small difference between both catalysts, probably caused by a decrease in the aggregation probability.
Figure 4.28. Pd clusters size distribution for different initial Cl-:[PdCl4]2- ratios On the other hand, the EPMA analysis obtained of the ring treated with the theoretical palladate amount (Figure 4.29) show a discontinuous distribution of the palladium along the ring wall profile from the outside to the inside, fitting with the flow pattern in the reactor. This profile does not correspond with the homogeneous distribution of the active sites (Cl-). Therefore, It seems like the polymer phase would have trapped all the palladate on the outside layers of the ring until its saturation. Hence, the reduction of the initial palladate charged by ion exchange seems not to enhance the composite characteristics. Even though a very small reduction in the size is achieved, an irregular dispersion in the ring can become important. Indeed, what is reached it is a diminution of the Pd content available to act as a catalyst.
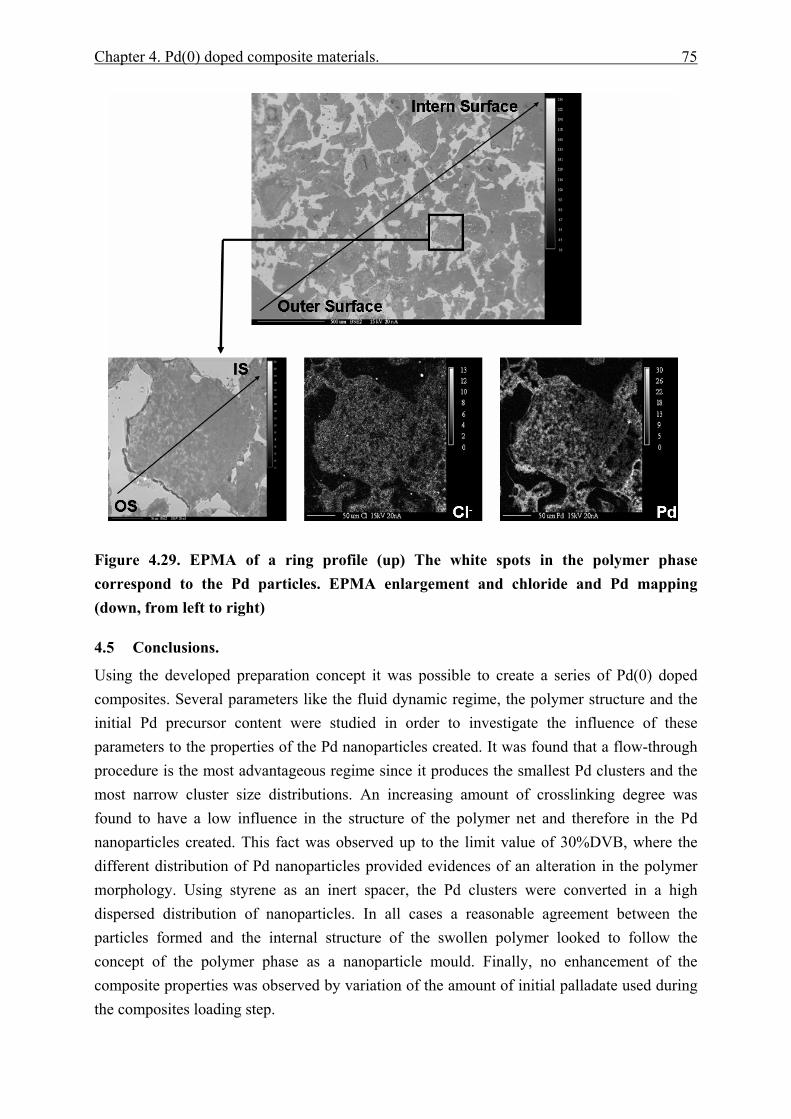
Chapter 4. Pd(0) doped composite materials. 75
Figure 4.29. EPMA of a ring profile (up) The white spots in the polymer phase correspond to the Pd particles. EPMA enlargement and chloride and Pd mapping (down, from left to right)
4.5 Conclusions.
Using the developed preparation concept it was possible to create a series of Pd(0) doped composites. Several parameters like the fluid dynamic regime, the polymer structure and the initial Pd precursor content were studied in order to investigate the influence of these parameters to the properties of the Pd nanoparticles created. It was found that a flow-through procedure is the most advantageous regime since it produces the smallest Pd clusters and the most narrow cluster size distributions. An increasing amount of crosslinking degree was found to have a low influence in the structure of the polymer net and therefore in the Pd nanoparticles created. This fact was observed up to the limit value of 30%DVB, where the different distribution of Pd nanoparticles provided evidences of an alteration in the polymer morphology. Using styrene as an inert spacer, the Pd clusters were converted in a high dispersed distribution of nanoparticles. In all cases a reasonable agreement between the particles formed and the internal structure of the swollen polymer looked to follow the concept of the polymer phase as a nanoparticle mould. Finally, no enhancement of the composite properties was observed by variation of the amount of initial palladate used during the composites loading step.
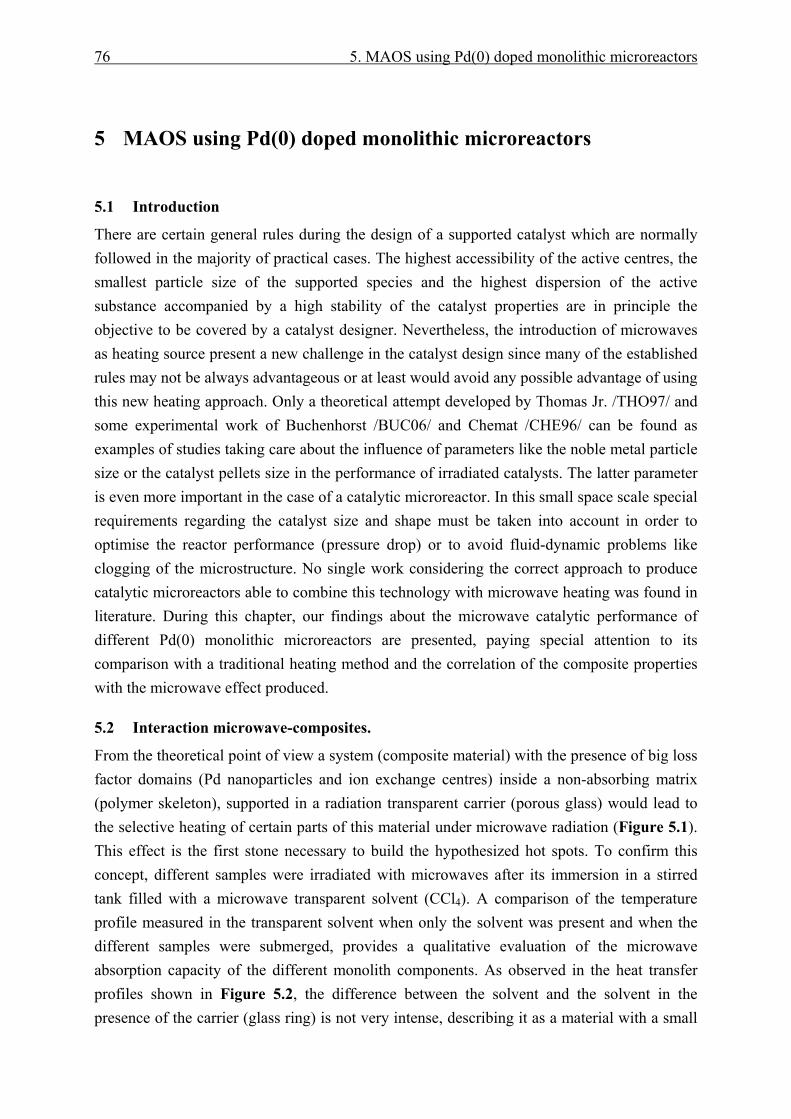
76 5. MAOS using Pd(0) doped monolithic microreactors
5 MAOS using Pd(0) doped monolithic microreactors
5.1 Introduction
There are certain general rules during the design of a supported catalyst which are normally followed in the majority of practical cases. The highest accessibility of the active centres, the smallest particle size of the supported species and the highest dispersion of the active substance accompanied by a high stability of the catalyst properties are in principle the objective to be covered by a catalyst designer. Nevertheless, the introduction of microwaves as heating source present a new challenge in the catalyst design since many of the established rules may not be always advantageous or at least would avoid any possible advantage of using this new heating approach. Only a theoretical attempt developed by Thomas Jr. /THO97/ and some experimental work of Buchenhorst /BUC06/ and Chemat /CHE96/ can be found as examples of studies taking care about the influence of parameters like the noble metal particle size or the catalyst pellets size in the performance of irradiated catalysts. The latter parameter is even more important in the case of a catalytic microreactor. In this small space scale special requirements regarding the catalyst size and shape must be taken into account in order to optimise the reactor performance (pressure drop) or to avoid fluid-dynamic problems like clogging of the microstructure. No single work considering the correct approach to produce catalytic microreactors able to combine this technology with microwave heating was found in literature. During this chapter, our findings about the microwave catalytic performance of different Pd(0) monolithic microreactors are presented, paying special attention to its comparison with a traditional heating method and the correlation of the composite properties with the microwave effect produced.
5.2 Interaction microwave-composites.
From the theoretical point of view a system (composite material) with the presence of big loss factor domains (Pd nanoparticles and ion exchange centres) inside a non-absorbing matrix (polymer skeleton), supported in a radiation transparent carrier (porous glass) would lead to the selective heating of certain parts of this material under microwave radiation (Figure 5.1). This effect is the first stone necessary to build the hypothesized hot spots. To confirm this concept, different samples were irradiated with microwaves after its immersion in a stirred tank filled with a microwave transparent solvent (CCl4). A comparison of the temperature profile measured in the transparent solvent when only the solvent was present and when the different samples were submerged, provides a qualitative evaluation of the microwave absorption capacity of the different monolith components. As observed in the heat transfer profiles shown in Figure 5.2, the difference between the solvent and the solvent in the presence of the carrier (glass ring) is not very intense, describing it as a material with a small
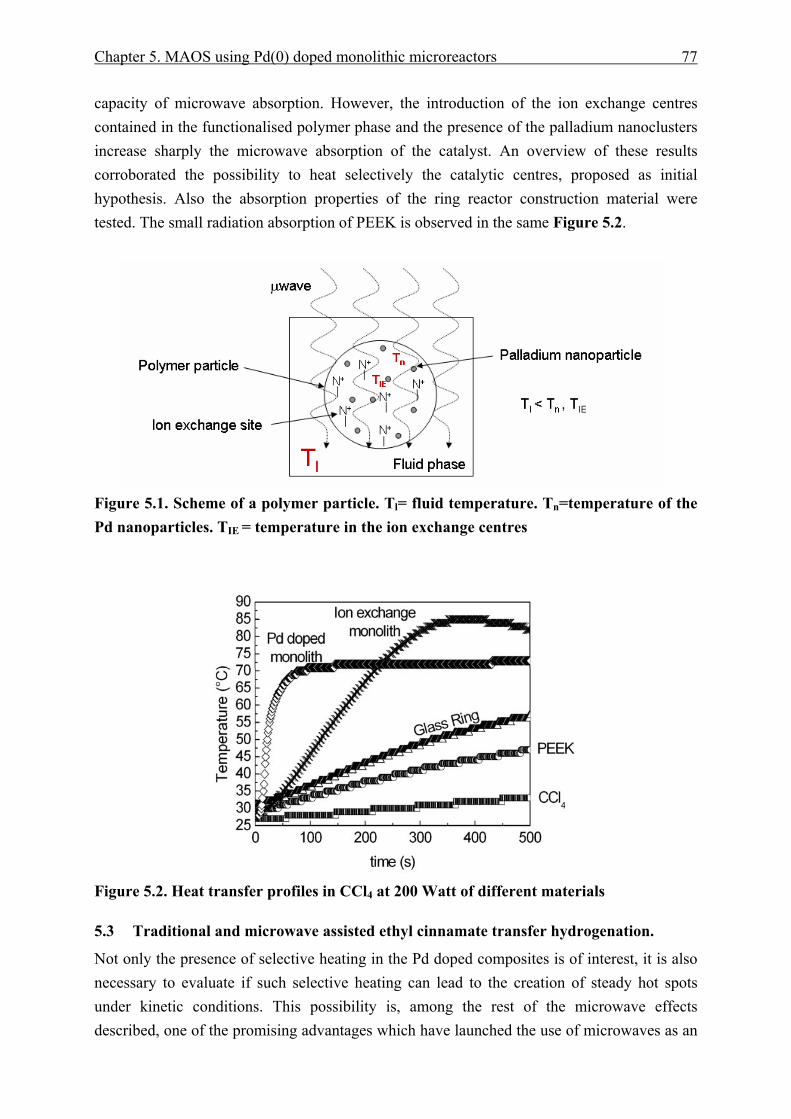
Chapter 5. MAOS using Pd(0) doped monolithic microreactors 77
capacity of microwave absorption. However, the introduction of the ion exchange centres contained in the functionalised polymer phase and the presence of the palladium nanoclusters increase sharply the microwave absorption of the catalyst. An overview of these results corroborated the possibility to heat selectively the catalytic centres, proposed as initial hypothesis. Also the absorption properties of the ring reactor construction material were tested. The small radiation absorption of PEEK is observed in the same Figure 5.2.
Figure 5.1. Scheme of a polymer particle. Tl= fluid temperature. Tn=temperature of the Pd nanoparticles. TIE = temperature in the ion exchange centres
Figure 5.2. Heat transfer profiles in CCl4 at 200 Watt of different materials
5.3 Traditional and microwave assisted ethyl cinnamate transfer hydrogenation.
Not only the presence of selective heating in the Pd doped composites is of interest, it is also necessary to evaluate if such selective heating can lead to the creation of steady hot spots under kinetic conditions. This possibility is, among the rest of the microwave effects described, one of the promising advantages which have launched the use of microwaves as an
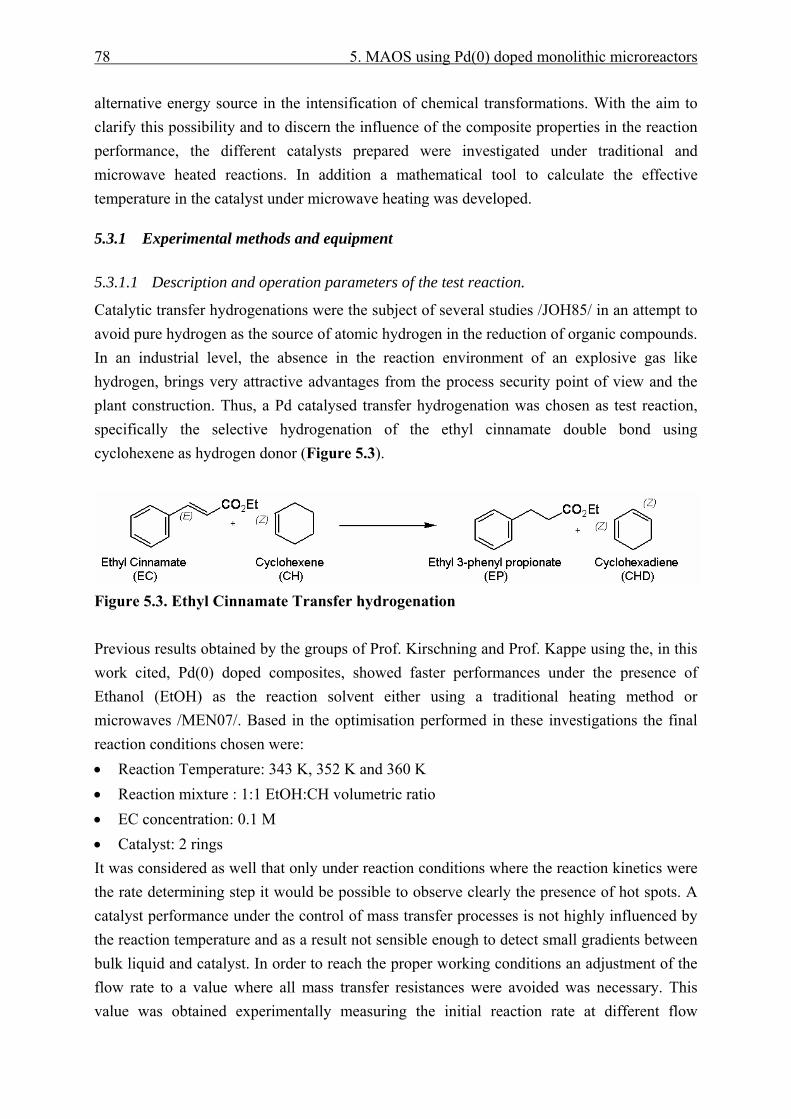
78 5. MAOS using Pd(0) doped monolithic microreactors
alternative energy source in the intensification of chemical transformations. With the aim to clarify this possibility and to discern the influence of the composite properties in the reaction performance, the different catalysts prepared were investigated under traditional and microwave heated reactions. In addition a mathematical tool to calculate the effective temperature in the catalyst under microwave heating was developed.
5.3.1 Experimental methods and equipment
5.3.1.1 Description and operation parameters of the test reaction.
Catalytic transfer hydrogenations were the subject of several studies /JOH85/ in an attempt to avoid pure hydrogen as the source of atomic hydrogen in the reduction of organic compounds. In an industrial level, the absence in the reaction environment of an explosive gas like hydrogen, brings very attractive advantages from the process security point of view and the plant construction. Thus, a Pd catalysed transfer hydrogenation was chosen as test reaction, specifically the selective hydrogenation of the ethyl cinnamate double bond using cyclohexene as hydrogen donor (Figure 5.3).
Figure 5.3. Ethyl Cinnamate Transfer hydrogenation Previous results obtained by the groups of Prof. Kirschning and Prof. Kappe using the, in this work cited, Pd(0) doped composites, showed faster performances under the presence of Ethanol (EtOH) as the reaction solvent either using a traditional heating method or microwaves /MEN07/. Based in the optimisation performed in these investigations the final reaction conditions chosen were: • Reaction Temperature: 343 K, 352 K and 360 K • Reaction mixture : 1:1 EtOH:CH volumetric ratio • EC concentration: 0.1 M • Catalyst: 2 rings It was considered as well that only under reaction conditions where the reaction kinetics were the rate determining step it would be possible to observe clearly the presence of hot spots. A catalyst performance under the control of mass transfer processes is not highly influenced by the reaction temperature and as a result not sensible enough to detect small gradients between bulk liquid and catalyst. In order to reach the proper working conditions an adjustment of the flow rate to a value where all mass transfer resistances were avoided was necessary. This value was obtained experimentally measuring the initial reaction rate at different flow

Chapter 5. MAOS using Pd(0) doped monolithic microreactors 79
conditions and a temperature of 343 K (Figure 5.4). In these kind of experiments a curve with an increase in the initial rate as long as the flow increases converging asymptotically to a rate maximum is the expected result. Working under flow rates in the domain of the maximum reaction rate ensures the elimination of the external mass transfer resistance. However the curve obtained shows a decrease in the reaction rate with increase in the flow passing through a maximum value. This anomalous behaviour was already detected by Rehfinger during the kinetic studies of the ion exchange resin catalysed MTBE synthesis /REH90/ and is associated to a negative order in the reaction rate in the case of a reactant in a great excess compared with the other and being the limiting reactant strongly absorpted in the resin. In our case, at least the first of the conditions is fulfilled.
Figure 5.4. Initial reaction rate versus flow. Under such conditions the selection of a flow rate in the region where the reaction rate remains constant seemed reasonable. A value of 180 ml/min was established as the operation condition, since this value is far away from the inflexion point where the curve begins to be constant.
5.3.1.2 Laboratory plant for traditional heating experiments
Taking advantage of the ring reactor design all kinetic experiments were performed using a flow-through operation with a complete recirculation of the reactor outlet current. In this way it is possible to simulate batch operations, well suited for the development of kinetic data. The small residence time of the reaction mixture inside the reactor (0.8 s) let the reactor to be considered differential during the kinetic calculations and as a result no mass transfer profiles inside the reactor were taken into account. In order to reach an optimal experiment performance, the laboratory plant had to fulfil several requirements: • Easiness in sample acquisition • Accurate control of the reaction temperature.
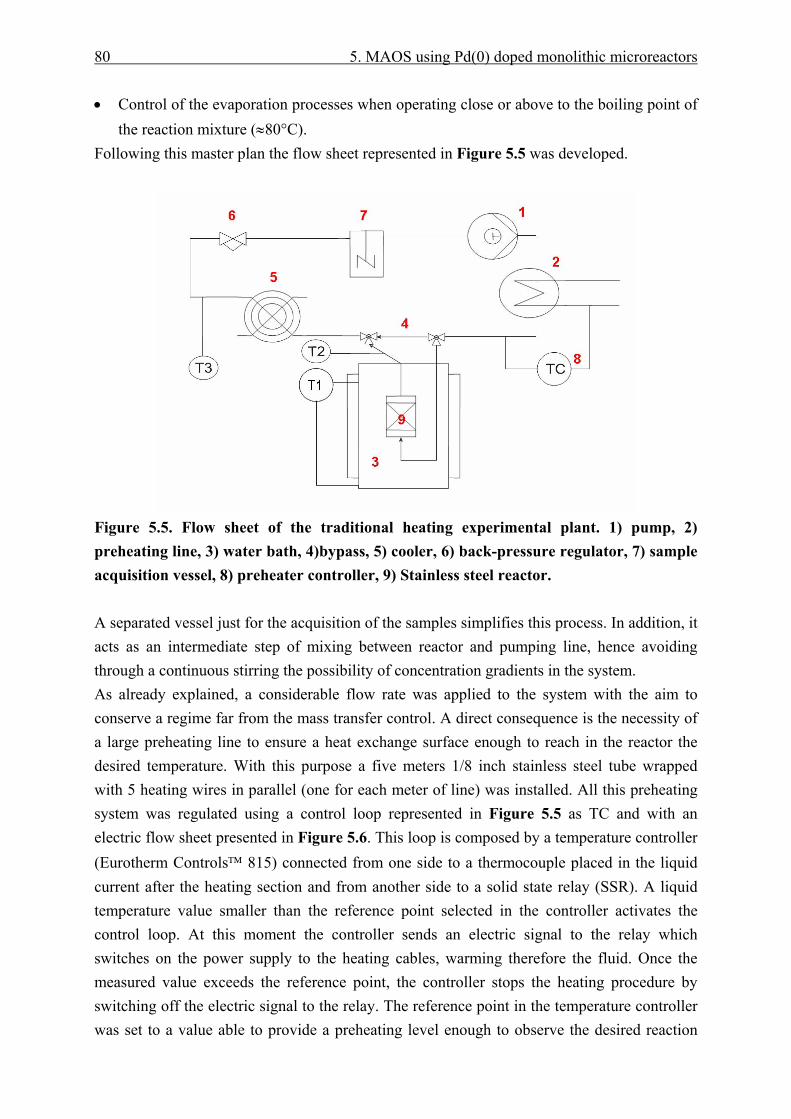
80 5. MAOS using Pd(0) doped monolithic microreactors
• Control of the evaporation processes when operating close or above to the boiling point of the reaction mixture (≈80°C).
Following this master plan the flow sheet represented in Figure 5.5 was developed.
Figure 5.5. Flow sheet of the traditional heating experimental plant. 1) pump, 2) preheating line, 3) water bath, 4)bypass, 5) cooler, 6) back-pressure regulator, 7) sample acquisition vessel, 8) preheater controller, 9) Stainless steel reactor. A separated vessel just for the acquisition of the samples simplifies this process. In addition, it acts as an intermediate step of mixing between reactor and pumping line, hence avoiding through a continuous stirring the possibility of concentration gradients in the system. As already explained, a considerable flow rate was applied to the system with the aim to conserve a regime far from the mass transfer control. A direct consequence is the necessity of a large preheating line to ensure a heat exchange surface enough to reach in the reactor the desired temperature. With this purpose a five meters 1/8 inch stainless steel tube wrapped with 5 heating wires in parallel (one for each meter of line) was installed. All this preheating system was regulated using a control loop represented in Figure 5.5 as TC and with an electric flow sheet presented in Figure 5.6. This loop is composed by a temperature controller (Eurotherm Controls™ 815) connected from one side to a thermocouple placed in the liquid current after the heating section and from another side to a solid state relay (SSR). A liquid temperature value smaller than the reference point selected in the controller activates the control loop. At this moment the controller sends an electric signal to the relay which switches on the power supply to the heating cables, warming therefore the fluid. Once the measured value exceeds the reference point, the controller stops the heating procedure by switching off the electric signal to the relay. The reference point in the temperature controller was set to a value able to provide a preheating level enough to observe the desired reaction
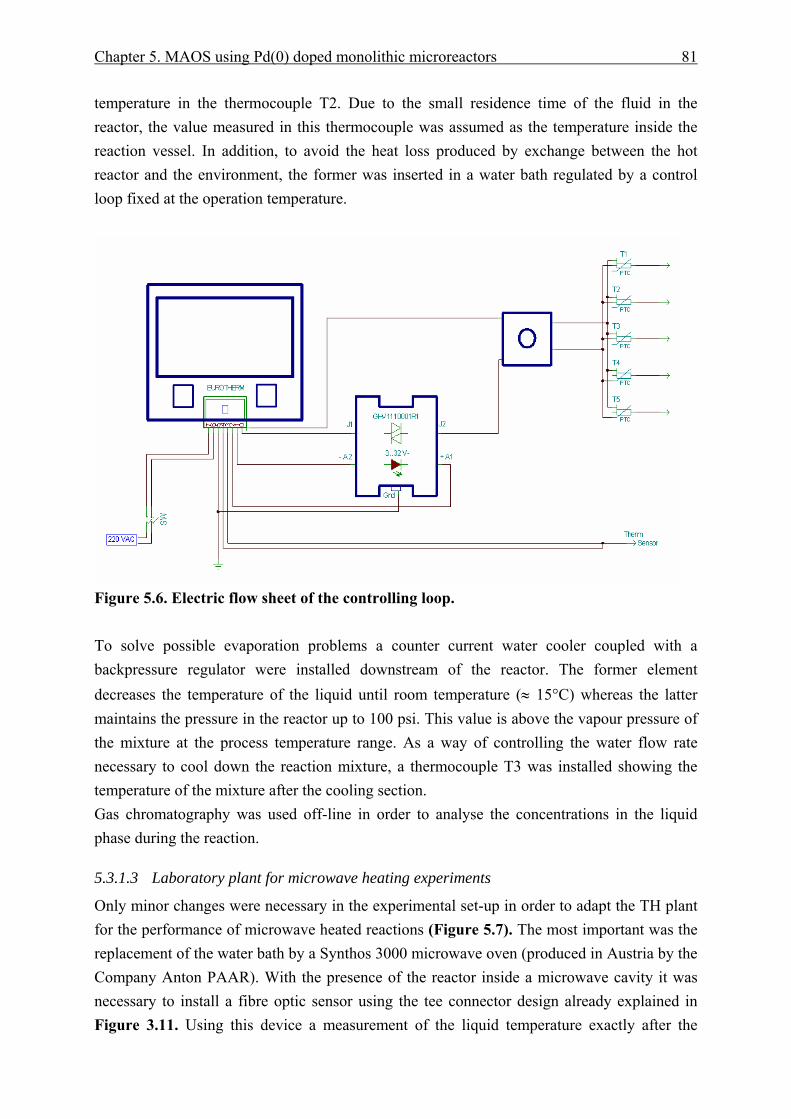
Chapter 5. MAOS using Pd(0) doped monolithic microreactors 81
temperature in the thermocouple T2. Due to the small residence time of the fluid in the reactor, the value measured in this thermocouple was assumed as the temperature inside the reaction vessel. In addition, to avoid the heat loss produced by exchange between the hot reactor and the environment, the former was inserted in a water bath regulated by a control loop fixed at the operation temperature.
Figure 5.6. Electric flow sheet of the controlling loop. To solve possible evaporation problems a counter current water cooler coupled with a backpressure regulator were installed downstream of the reactor. The former element decreases the temperature of the liquid until room temperature (≈ 15°C) whereas the latter maintains the pressure in the reactor up to 100 psi. This value is above the vapour pressure of the mixture at the process temperature range. As a way of controlling the water flow rate necessary to cool down the reaction mixture, a thermocouple T3 was installed showing the temperature of the mixture after the cooling section. Gas chromatography was used off-line in order to analyse the concentrations in the liquid phase during the reaction.
5.3.1.3 Laboratory plant for microwave heating experiments
Only minor changes were necessary in the experimental set-up in order to adapt the TH plant for the performance of microwave heated reactions (Figure 5.7). The most important was the replacement of the water bath by a Synthos 3000 microwave oven (produced in Austria by the Company Anton PAAR). With the presence of the reactor inside a microwave cavity it was necessary to install a fibre optic sensor using the tee connector design already explained in Figure 3.11. Using this device a measurement of the liquid temperature exactly after the
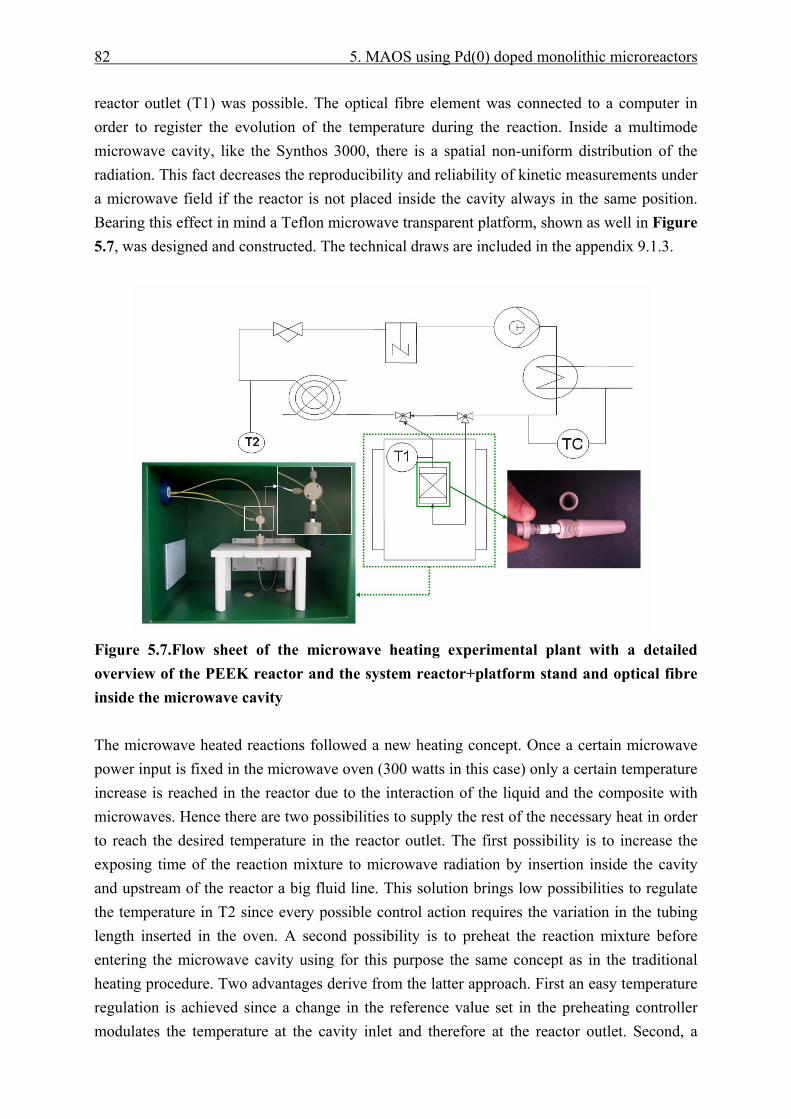
82 5. MAOS using Pd(0) doped monolithic microreactors
reactor outlet (T1) was possible. The optical fibre element was connected to a computer in order to register the evolution of the temperature during the reaction. Inside a multimode microwave cavity, like the Synthos 3000, there is a spatial non-uniform distribution of the radiation. This fact decreases the reproducibility and reliability of kinetic measurements under a microwave field if the reactor is not placed inside the cavity always in the same position. Bearing this effect in mind a Teflon microwave transparent platform, shown as well in Figure 5.7, was designed and constructed. The technical draws are included in the appendix 9.1.3.
Figure 5.7.Flow sheet of the microwave heating experimental plant with a detailed overview of the PEEK reactor and the system reactor+platform stand and optical fibre inside the microwave cavity The microwave heated reactions followed a new heating concept. Once a certain microwave power input is fixed in the microwave oven (300 watts in this case) only a certain temperature increase is reached in the reactor due to the interaction of the liquid and the composite with microwaves. Hence there are two possibilities to supply the rest of the necessary heat in order to reach the desired temperature in the reactor outlet. The first possibility is to increase the exposing time of the reaction mixture to microwave radiation by insertion inside the cavity and upstream of the reactor a big fluid line. This solution brings low possibilities to regulate the temperature in T2 since every possible control action requires the variation in the tubing length inserted in the oven. A second possibility is to preheat the reaction mixture before entering the microwave cavity using for this purpose the same concept as in the traditional heating procedure. Two advantages derive from the latter approach. First an easy temperature regulation is achieved since a change in the reference value set in the preheating controller modulates the temperature at the cavity inlet and therefore at the reactor outlet. Second, a
Chapter 5. MAOS using Pd(0) doped monolithic microreactors 83
preheating line outside the cavity provides a way to heat the liquid without the consumption of the energy provided by the microwave radiation. As a result all the power input would be available for the interaction with the catalyst, enhancing the possibilities of a hot-spot effect observation.
5.3.1.4 Operation procedure.
In order to perform reproducible experiments it was necessary to define a determined working protocol for each of the heating methods: • Charge of the Reaction mixture. The 1:1 volumetric ratio EtOH:CH used as reaction
mixture was pumped first through the bypass and soon afterwards through the reactor. • Charge of the limiting reactant. A certain part of the mixture was charged into the sample
vessel, as well as the amount of EC necessary to obtain a 0,1 M solution considering the whole dead volume of the plant.
• Premixing and preheating. The complete reaction mixture was pumped through the bypass and preheated to the reaction temperature for 10 minutes. In this way before the reaction beginning a homogeneous distribution of the reactants in the plant as well as a stable temperature of the whole piping system was ensured.
• Reaction. After the first steps the bypass was changed to the reactor cycle being then pumped the preheated solution through the reactor. This moment was defined as t=0 for the kinetic measurements.
• Cleaning of the plant. Before beginning a new reaction cycle, pure solvent was pumped through the reactor to rinse out the plant and eliminates the traces of the reaction mixture used in the previous reaction.
5.3.2 Reaction microkinetics.
In previous attempts, not reported here, it was tried to discern the kind of mechanism of the heterogeneous catalysed test reaction. The final objective was to obtain a kinetic equation to describe the evolution of the mixture composition during the reaction. In all the experiments performed an unquestionable linear time dependence of the concentration of the limiting reactant (EC) or the derived hydrogenated product (EP) was observed. Such behaviour is representative for zero order kinetics where the reaction is independent of the concentration of the reactants /LEV99/. Roberts and Satterfield /ROB66/ studying theoretically Langmuir-Hinshelwood kinetic expressions for bimolecular irreversible reactions in the gas phase found a case in which such reactions could follow zero order kinetics. Beginning from the following general stoichiometric equation:
a b x yA B X Yν ν ν ν+ → +
(5.1)
84 5. MAOS using Pd(0) doped monolithic microreactors
assuming a single kind of adsorption site, an isothermal pellet and the reaction between 2 adsorbed sites as the rate limiting step, the authors derived the following general kinetic equation as a function of the partial pressure in the gas phase of one of the reaction components:
( )A
A 2A
pr k p1 K p
χ+′= ⋅+ ⋅
(5.2)
This expression can be converted in a zero order kinetics if χ = 0 and K pA becomes very large relative to unity. K pA could fulfil this premise if CH is considered as the substance A contained in the general equation (5.1). A high concentration of CH in the reaction mixture (in a liquid phase reaction partial pressures can be substituted by the concentrations) and a high affinity of Pd to adsorb hydrogen rich molecules could provide a value of K pA surpassing the unity. On the other hand if the factor χ is defined by the equation:
s,AAB
s,BB pDνpD
χ −⋅
⋅−=
(5.3)
and the stoichiometric coefficient of a reactant is considered negative, the premise χ = 0 would be fulfilled if:
A A,s B B,sD p D p⋅ = ⋅
(5.4) The big excess of CH in the liquid phase can probably derive in a subsequent high concentration of this substance inside the polymer (CEC,s<<CCH,s). Under this conditions, a much bigger diffusion coefficient of EC through the polymer phase compared with the diffusion of CH (DEC>>DCH) must be fulfilled in order of equation (5.4) to be true. In the case of the hydrophilic polymer phases, the premise could be easily fulfilled since the low polarity of the CH molecule would hinder its diffusion through the structure. On the contrary another behaviour would be expected as the hydrophobicity of the polymer phase increases. In this case, the diffusion coefficient of the CH should also rise repealing the discussed premise. Nonetheless the same zero order kinetics was observed for all composites independent of the polymer phase polarity (see kinetic curves in next sections). From a practical point of view it is only reasonable to adopt the model which better adjusts the experimental data, even though not always it can be found a clear theoretical explanation for it. As a result, a zero order model with the reaction rate based in the Pd active surface area was assumed (equation (5.5)).
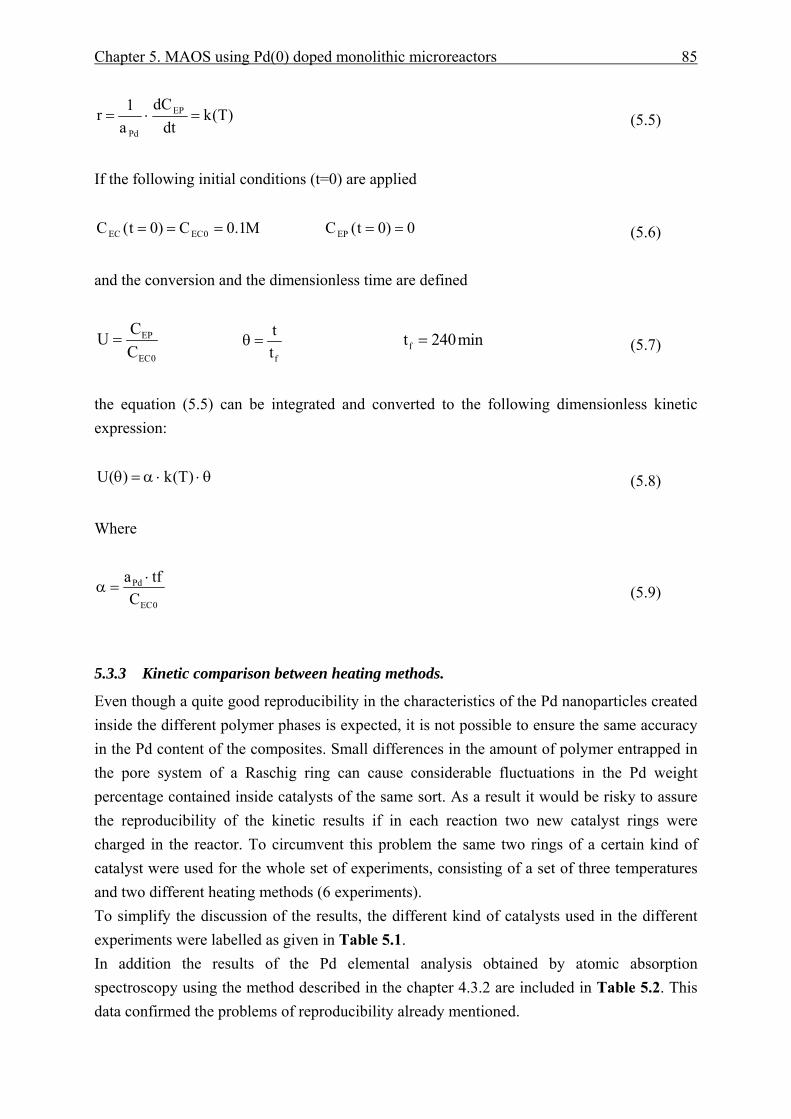
Chapter 5. MAOS using Pd(0) doped monolithic microreactors 85
)T(kdt
dCa1r EP
Pd
=⋅=
(5.5)
If the following initial conditions (t=0) are applied
M1.0C)0t(C 0ECEC ===
0)0t(CEP ==
(5.6) and the conversion and the dimensionless time are defined
EP
EC0
CUC
= f
tt
θ =
ft 240min=
(5.7)
the equation (5.5) can be integrated and converted to the following dimensionless kinetic expression:
θ⋅⋅α=θ )T(k)(U
(5.8) Where
0EC
Pd
Ctfa ⋅
=α
(5.9)
5.3.3 Kinetic comparison between heating methods.
Even though a quite good reproducibility in the characteristics of the Pd nanoparticles created inside the different polymer phases is expected, it is not possible to ensure the same accuracy in the Pd content of the composites. Small differences in the amount of polymer entrapped in the pore system of a Raschig ring can cause considerable fluctuations in the Pd weight percentage contained inside catalysts of the same sort. As a result it would be risky to assure the reproducibility of the kinetic results if in each reaction two new catalyst rings were charged in the reactor. To circumvent this problem the same two rings of a certain kind of catalyst were used for the whole set of experiments, consisting of a set of three temperatures and two different heating methods (6 experiments). To simplify the discussion of the results, the different kind of catalysts used in the different experiments were labelled as given in Table 5.1. In addition the results of the Pd elemental analysis obtained by atomic absorption spectroscopy using the method described in the chapter 4.3.2 are included in Table 5.2. This data confirmed the problems of reproducibility already mentioned.
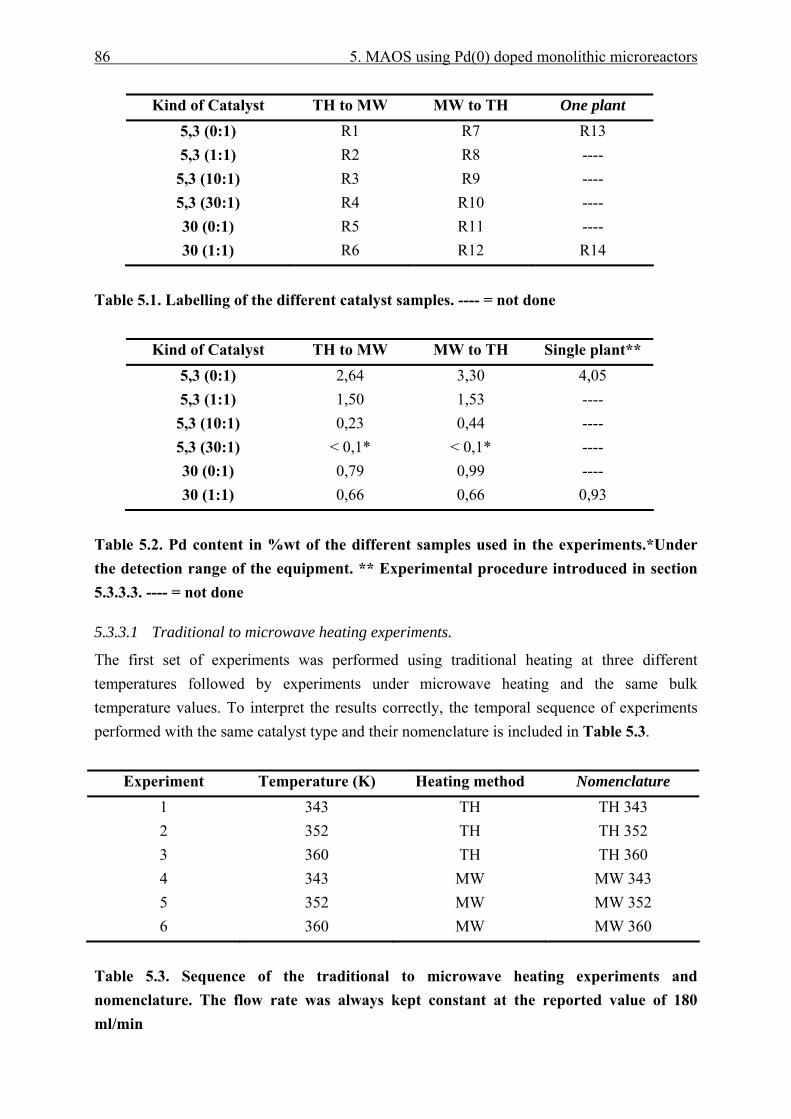
86 5. MAOS using Pd(0) doped monolithic microreactors
Kind of Catalyst TH to MW MW to TH One plant 5,3 (0:1) R1 R7 R13 5,3 (1:1) R2 R8 ---- 5,3 (10:1) R3 R9 ---- 5,3 (30:1) R4 R10 ---- 30 (0:1) R5 R11 ---- 30 (1:1) R6 R12 R14
Table 5.1. Labelling of the different catalyst samples. ---- = not done
Kind of Catalyst TH to MW MW to TH Single plant** 5,3 (0:1) 2,64 3,30 4,05 5,3 (1:1) 1,50 1,53 ---- 5,3 (10:1) 0,23 0,44 ---- 5,3 (30:1) < 0,1* < 0,1* ---- 30 (0:1) 0,79 0,99 ---- 30 (1:1) 0,66 0,66 0,93
Table 5.2. Pd content in %wt of the different samples used in the experiments.*Under the detection range of the equipment. ** Experimental procedure introduced in section 5.3.3.3. ---- = not done
5.3.3.1 Traditional to microwave heating experiments.
The first set of experiments was performed using traditional heating at three different temperatures followed by experiments under microwave heating and the same bulk temperature values. To interpret the results correctly, the temporal sequence of experiments performed with the same catalyst type and their nomenclature is included in Table 5.3.
Experiment Temperature (K) Heating method Nomenclature 1 343 TH TH 343 2 352 TH TH 352 3 360 TH TH 360 4 343 MW MW 343 5 352 MW MW 352 6 360 MW MW 360
Table 5.3. Sequence of the traditional to microwave heating experiments and nomenclature. The flow rate was always kept constant at the reported value of 180 ml/min
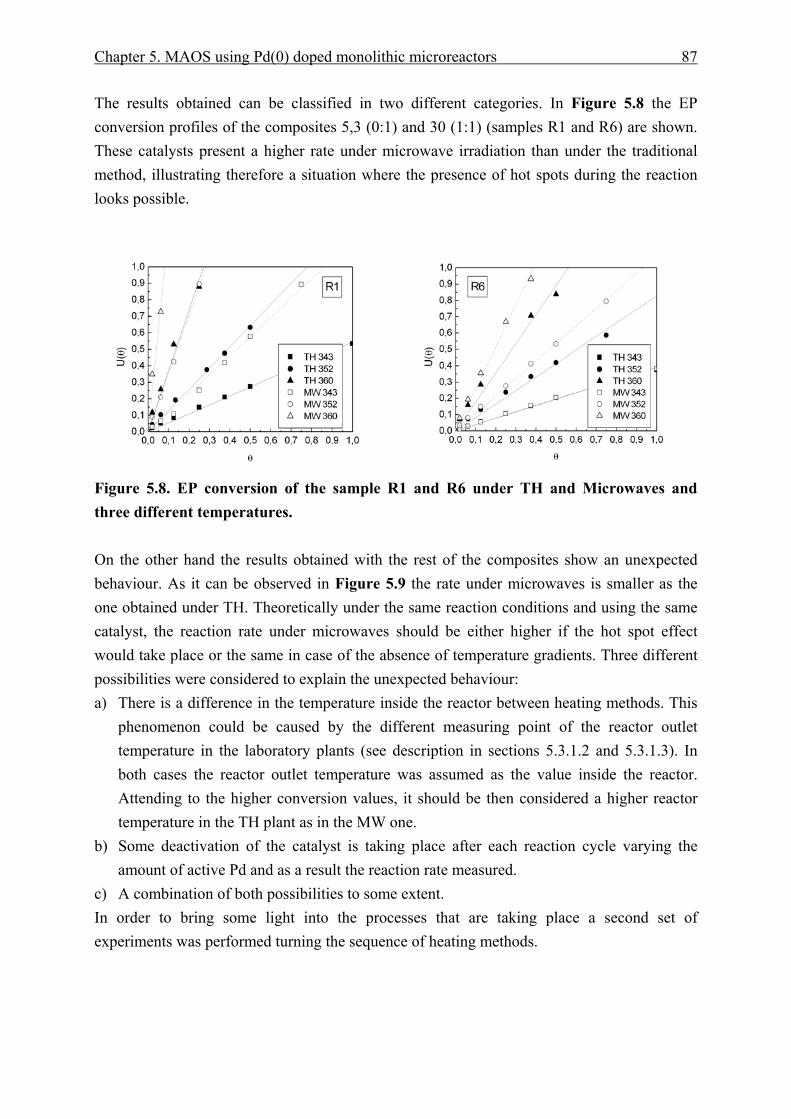
Chapter 5. MAOS using Pd(0) doped monolithic microreactors 87
The results obtained can be classified in two different categories. In Figure 5.8 the EP conversion profiles of the composites 5,3 (0:1) and 30 (1:1) (samples R1 and R6) are shown. These catalysts present a higher rate under microwave irradiation than under the traditional method, illustrating therefore a situation where the presence of hot spots during the reaction looks possible.
Figure 5.8. EP conversion of the sample R1 and R6 under TH and Microwaves and three different temperatures. On the other hand the results obtained with the rest of the composites show an unexpected behaviour. As it can be observed in Figure 5.9 the rate under microwaves is smaller as the one obtained under TH. Theoretically under the same reaction conditions and using the same catalyst, the reaction rate under microwaves should be either higher if the hot spot effect would take place or the same in case of the absence of temperature gradients. Three different possibilities were considered to explain the unexpected behaviour: a) There is a difference in the temperature inside the reactor between heating methods. This
phenomenon could be caused by the different measuring point of the reactor outlet temperature in the laboratory plants (see description in sections 5.3.1.2 and 5.3.1.3). In both cases the reactor outlet temperature was assumed as the value inside the reactor. Attending to the higher conversion values, it should be then considered a higher reactor temperature in the TH plant as in the MW one.
b) Some deactivation of the catalyst is taking place after each reaction cycle varying the amount of active Pd and as a result the reaction rate measured.
c) A combination of both possibilities to some extent. In order to bring some light into the processes that are taking place a second set of experiments was performed turning the sequence of heating methods.
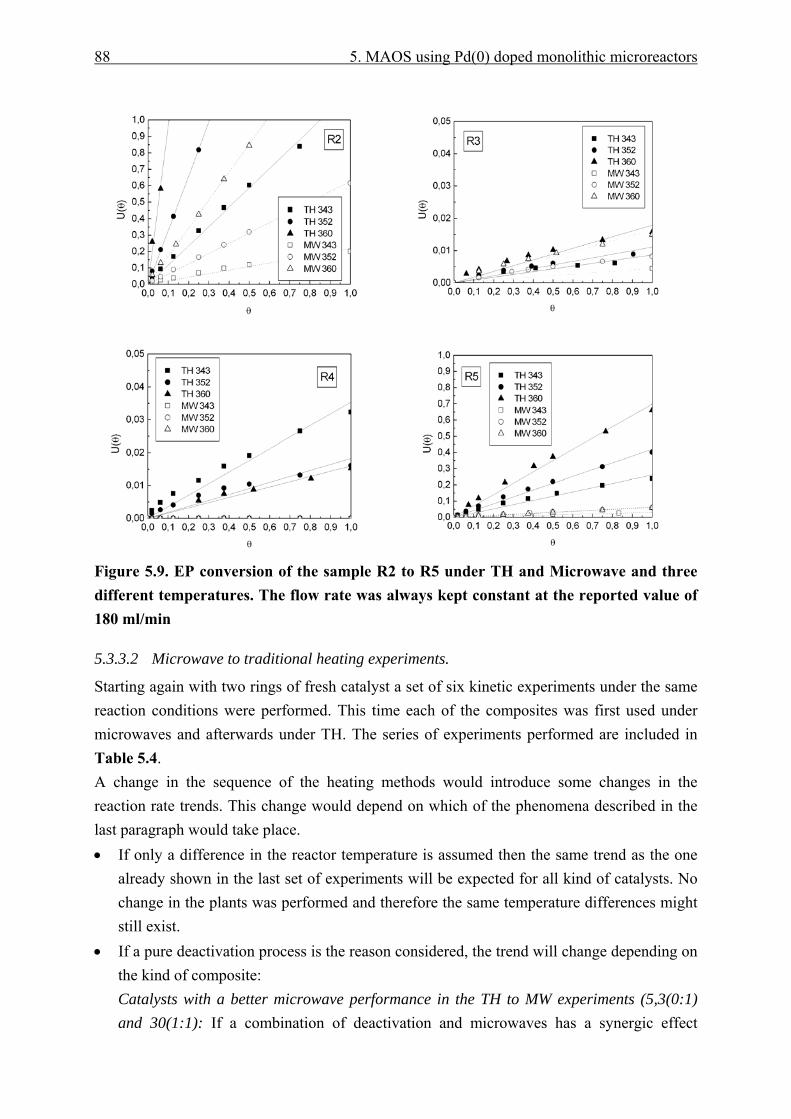
88 5. MAOS using Pd(0) doped monolithic microreactors
Figure 5.9. EP conversion of the sample R2 to R5 under TH and Microwave and three different temperatures. The flow rate was always kept constant at the reported value of 180 ml/min
5.3.3.2 Microwave to traditional heating experiments.
Starting again with two rings of fresh catalyst a set of six kinetic experiments under the same reaction conditions were performed. This time each of the composites was first used under microwaves and afterwards under TH. The series of experiments performed are included in Table 5.4. A change in the sequence of the heating methods would introduce some changes in the reaction rate trends. This change would depend on which of the phenomena described in the last paragraph would take place. • If only a difference in the reactor temperature is assumed then the same trend as the one
already shown in the last set of experiments will be expected for all kind of catalysts. No change in the plants was performed and therefore the same temperature differences might still exist.
• If a pure deactivation process is the reason considered, the trend will change depending on the kind of composite: Catalysts with a better microwave performance in the TH to MW experiments (5,3(0:1) and 30(1:1): If a combination of deactivation and microwaves has a synergic effect
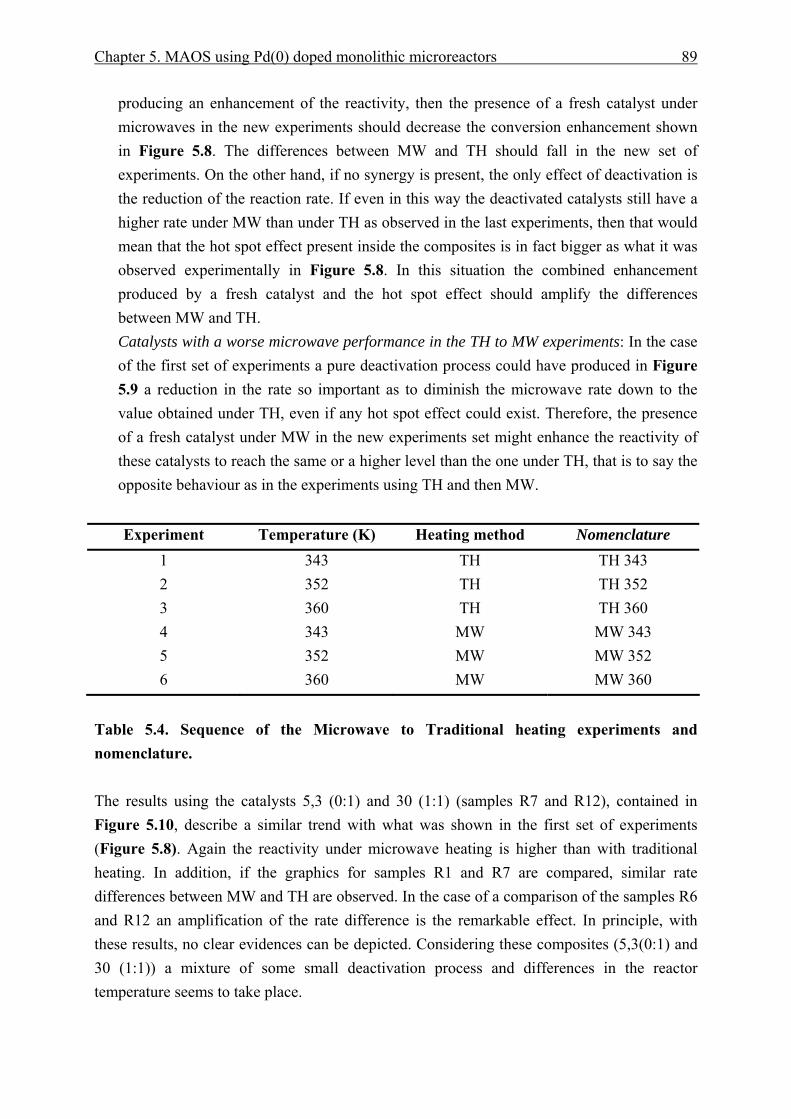
Chapter 5. MAOS using Pd(0) doped monolithic microreactors 89
producing an enhancement of the reactivity, then the presence of a fresh catalyst under microwaves in the new experiments should decrease the conversion enhancement shown in Figure 5.8. The differences between MW and TH should fall in the new set of experiments. On the other hand, if no synergy is present, the only effect of deactivation is the reduction of the reaction rate. If even in this way the deactivated catalysts still have a higher rate under MW than under TH as observed in the last experiments, then that would mean that the hot spot effect present inside the composites is in fact bigger as what it was observed experimentally in Figure 5.8. In this situation the combined enhancement produced by a fresh catalyst and the hot spot effect should amplify the differences between MW and TH. Catalysts with a worse microwave performance in the TH to MW experiments: In the case of the first set of experiments a pure deactivation process could have produced in Figure 5.9 a reduction in the rate so important as to diminish the microwave rate down to the value obtained under TH, even if any hot spot effect could exist. Therefore, the presence of a fresh catalyst under MW in the new experiments set might enhance the reactivity of these catalysts to reach the same or a higher level than the one under TH, that is to say the opposite behaviour as in the experiments using TH and then MW.
Experiment Temperature (K) Heating method Nomenclature
1 343 TH TH 343 2 352 TH TH 352 3 360 TH TH 360 4 343 MW MW 343 5 352 MW MW 352 6 360 MW MW 360
Table 5.4. Sequence of the Microwave to Traditional heating experiments and nomenclature. The results using the catalysts 5,3 (0:1) and 30 (1:1) (samples R7 and R12), contained in Figure 5.10, describe a similar trend with what was shown in the first set of experiments (Figure 5.8). Again the reactivity under microwave heating is higher than with traditional heating. In addition, if the graphics for samples R1 and R7 are compared, similar rate differences between MW and TH are observed. In the case of a comparison of the samples R6 and R12 an amplification of the rate difference is the remarkable effect. In principle, with these results, no clear evidences can be depicted. Considering these composites (5,3(0:1) and 30 (1:1)) a mixture of some small deactivation process and differences in the reactor temperature seems to take place.
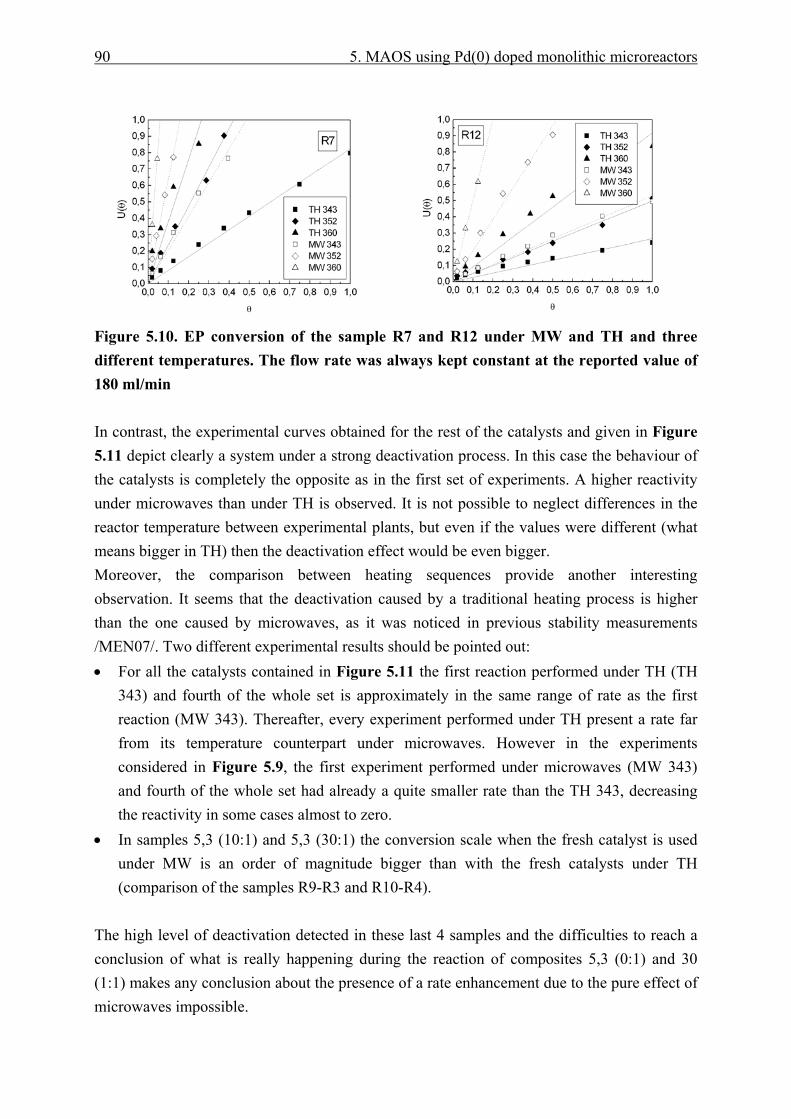
90 5. MAOS using Pd(0) doped monolithic microreactors
Figure 5.10. EP conversion of the sample R7 and R12 under MW and TH and three different temperatures. The flow rate was always kept constant at the reported value of 180 ml/min In contrast, the experimental curves obtained for the rest of the catalysts and given in Figure 5.11 depict clearly a system under a strong deactivation process. In this case the behaviour of the catalysts is completely the opposite as in the first set of experiments. A higher reactivity under microwaves than under TH is observed. It is not possible to neglect differences in the reactor temperature between experimental plants, but even if the values were different (what means bigger in TH) then the deactivation effect would be even bigger. Moreover, the comparison between heating sequences provide another interesting observation. It seems that the deactivation caused by a traditional heating process is higher than the one caused by microwaves, as it was noticed in previous stability measurements /MEN07/. Two different experimental results should be pointed out: • For all the catalysts contained in Figure 5.11 the first reaction performed under TH (TH
343) and fourth of the whole set is approximately in the same range of rate as the first reaction (MW 343). Thereafter, every experiment performed under TH present a rate far from its temperature counterpart under microwaves. However in the experiments considered in Figure 5.9, the first experiment performed under microwaves (MW 343) and fourth of the whole set had already a quite smaller rate than the TH 343, decreasing the reactivity in some cases almost to zero.
• In samples 5,3 (10:1) and 5,3 (30:1) the conversion scale when the fresh catalyst is used under MW is an order of magnitude bigger than with the fresh catalysts under TH (comparison of the samples R9-R3 and R10-R4).
The high level of deactivation detected in these last 4 samples and the difficulties to reach a conclusion of what is really happening during the reaction of composites 5,3 (0:1) and 30 (1:1) makes any conclusion about the presence of a rate enhancement due to the pure effect of microwaves impossible.
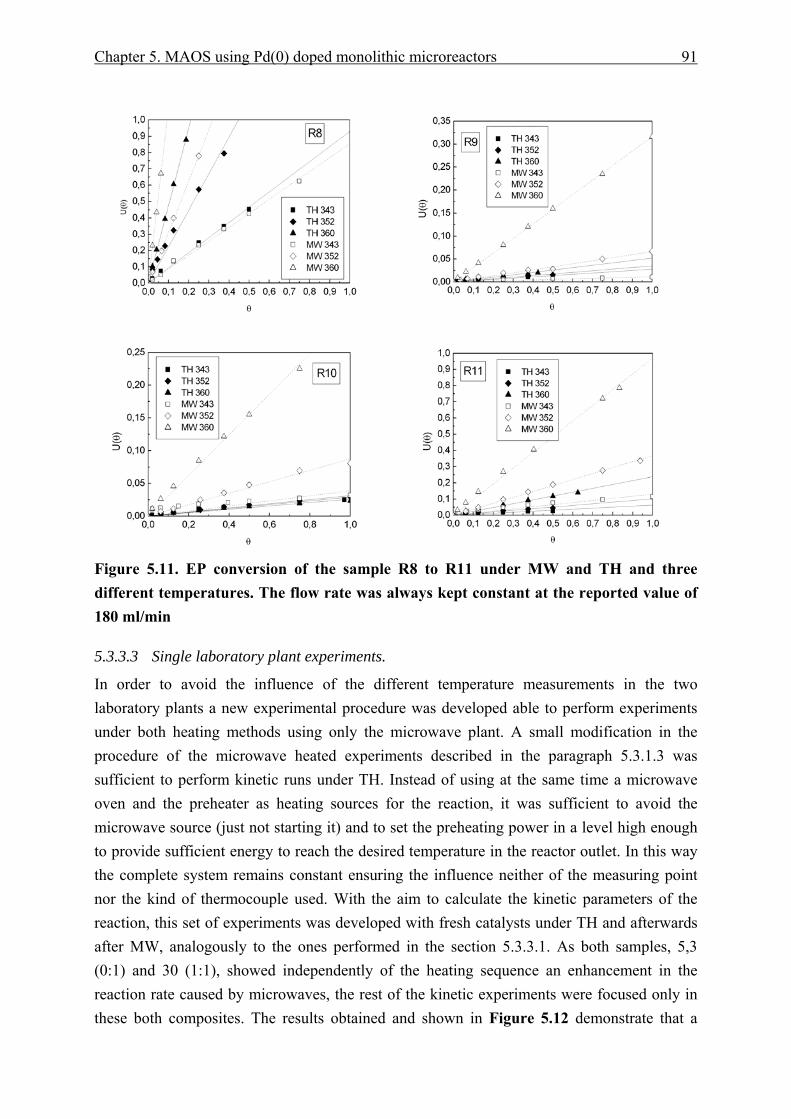
Chapter 5. MAOS using Pd(0) doped monolithic microreactors 91
Figure 5.11. EP conversion of the sample R8 to R11 under MW and TH and three different temperatures. The flow rate was always kept constant at the reported value of 180 ml/min
5.3.3.3 Single laboratory plant experiments.
In order to avoid the influence of the different temperature measurements in the two laboratory plants a new experimental procedure was developed able to perform experiments under both heating methods using only the microwave plant. A small modification in the procedure of the microwave heated experiments described in the paragraph 5.3.1.3 was sufficient to perform kinetic runs under TH. Instead of using at the same time a microwave oven and the preheater as heating sources for the reaction, it was sufficient to avoid the microwave source (just not starting it) and to set the preheating power in a level high enough to provide sufficient energy to reach the desired temperature in the reactor outlet. In this way the complete system remains constant ensuring the influence neither of the measuring point nor the kind of thermocouple used. With the aim to calculate the kinetic parameters of the reaction, this set of experiments was developed with fresh catalysts under TH and afterwards after MW, analogously to the ones performed in the section 5.3.3.1. As both samples, 5,3 (0:1) and 30 (1:1), showed independently of the heating sequence an enhancement in the reaction rate caused by microwaves, the rest of the kinetic experiments were focused only in these both composites. The results obtained and shown in Figure 5.12 demonstrate that a
92 5. MAOS using Pd(0) doped monolithic microreactors
significant influence of the difference in the reactor temperature between laboratory plants was present. Using a single plant, the difference between heating methods was very small when not insignificant for the 5,3 (0:1) catalyst and almost zero when the catalyst 30 (1:1) was measured.
Figure 5.12. EP conversion of the sample 5,3 (0:1) and 30 (1:1) under MW and TH and three different temperatures. In addition, it is noteworthy to mention the lack of sensibility to the relation microwaves-Pd particle size that the experimental results exhibited. The composites 5,3(0:1) and 30(1:1) presented in this single plant experiments the same insignificant differences in reactivity between heating methods even though quite different Pd particle size distributions characterise these composites (see Figure 4.22 and Figure 4.27). A 5,3 (0:1) catalysts exhibited a distribution centred in a cluster size around 50 nm of diameter whereas the highly crosslinked composite contained a narrow dispersion of smaller clusters centred on 7 nm. The great differences in the particle size and therefore in the Pd active surface area (see Table 5.5) derived only in a difference in the rate constant but not in the behaviour of the catalyst under microwaves if compared with traditional heating.
5.3.4 Catalyst effective temperature.
Through a linear regression of the traditional heating experimental points presented in Figure 5.12 the slope of the curves was obtained. Considering the kinetic equation (5.8) this slope represents the product between the rate constant and the α factor. As a result, to obtain the value of k it is necessary to calculate α, and to do it an estimation of the Pd active surface in each of the samples is necessary. Assuming a spherical particle, using the density of the Pd, the experimental measurements of the catalyst Pd content contained in Table 5.2 and the particle sizes reported in chapter 4, a value of the Pd surface area was approximated. In Table 5.5 the calculated values are included.
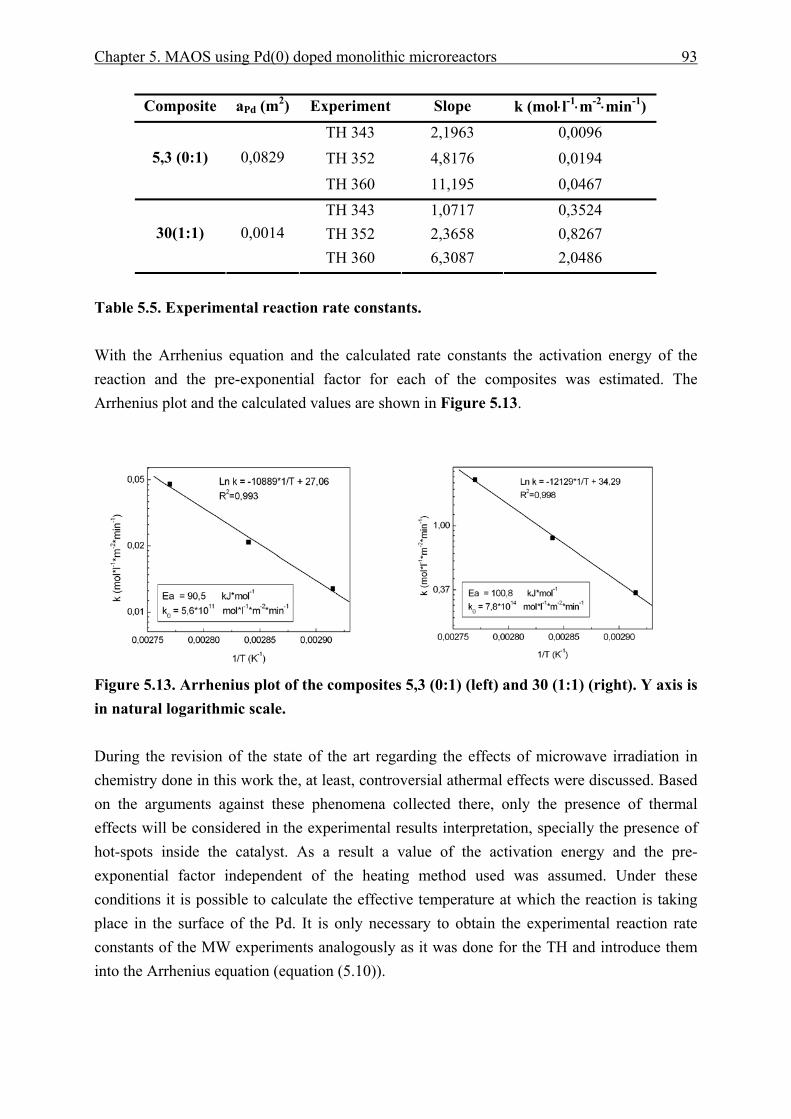
Chapter 5. MAOS using Pd(0) doped monolithic microreactors 93
Composite aPd (m2) Experiment Slope k (mol⋅l-1⋅m-2⋅min-1) TH 343 2,1963 0,0096 TH 352 4,8176 0,0194 5,3 (0:1) 0,0829
TH 360 11,195 0,0467 TH 343 1,0717 0,3524 TH 352 2,3658 0,8267 30(1:1) 0,0014 TH 360 6,3087 2,0486
Table 5.5. Experimental reaction rate constants. With the Arrhenius equation and the calculated rate constants the activation energy of the reaction and the pre-exponential factor for each of the composites was estimated. The Arrhenius plot and the calculated values are shown in Figure 5.13.
Figure 5.13. Arrhenius plot of the composites 5,3 (0:1) (left) and 30 (1:1) (right). Y axis is in natural logarithmic scale. During the revision of the state of the art regarding the effects of microwave irradiation in chemistry done in this work the, at least, controversial athermal effects were discussed. Based on the arguments against these phenomena collected there, only the presence of thermal effects will be considered in the experimental results interpretation, specially the presence of hot-spots inside the catalyst. As a result a value of the activation energy and the pre-exponential factor independent of the heating method used was assumed. Under these conditions it is possible to calculate the effective temperature at which the reaction is taking place in the surface of the Pd. It is only necessary to obtain the experimental reaction rate constants of the MW experiments analogously as it was done for the TH and introduce them into the Arrhenius equation (equation (5.10)).
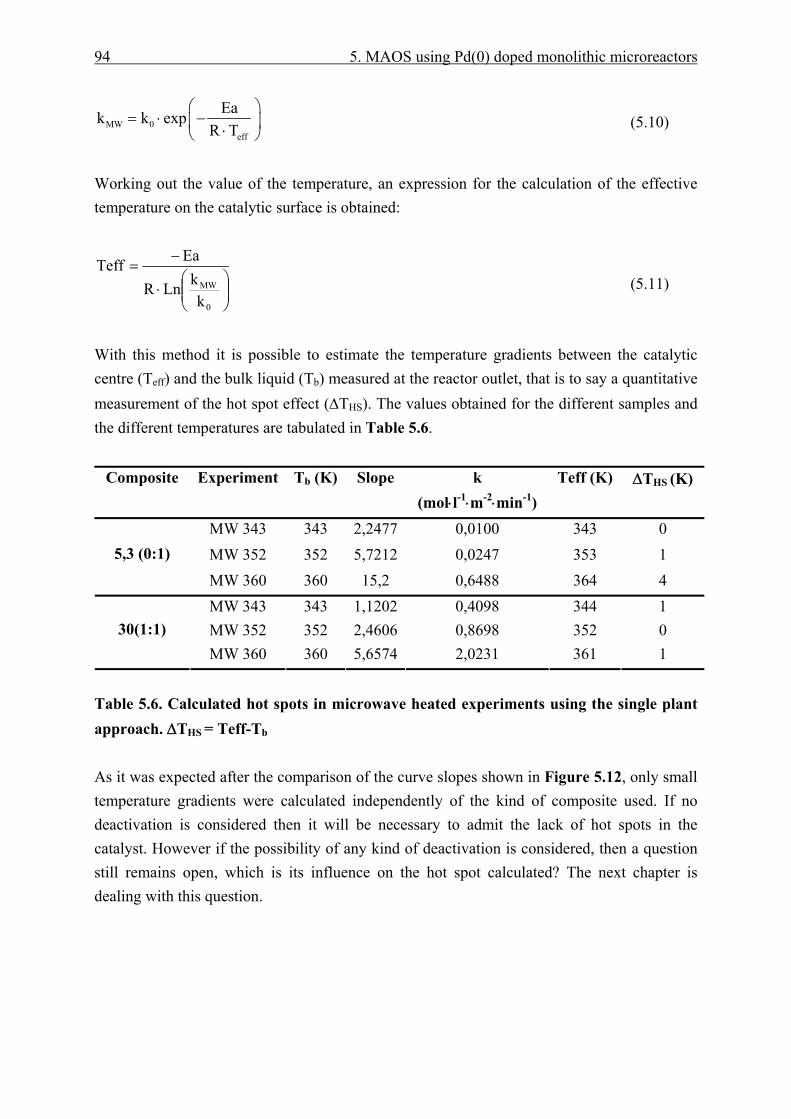
94 5. MAOS using Pd(0) doped monolithic microreactors
MW 0eff
Eak k expR T
⎛ ⎞= ⋅ −⎜ ⎟⋅⎝ ⎠
(5.10)
Working out the value of the temperature, an expression for the calculation of the effective temperature on the catalytic surface is obtained:
⎟⎟⎠
⎞⎜⎜⎝
⎛⋅
−=
0
MW
kkLnR
EaTeff (5.11)
With this method it is possible to estimate the temperature gradients between the catalytic centre (Teff) and the bulk liquid (Tb) measured at the reactor outlet, that is to say a quantitative measurement of the hot spot effect (ΔTHS). The values obtained for the different samples and the different temperatures are tabulated in Table 5.6.
Composite Experiment Tb (K) Slope k (mol⋅l-1⋅m-2⋅min-1)
Teff (K) ΔTHS (K)
MW 343 343 2,2477 0,0100 343 0 MW 352 352 5,7212 0,0247 353 1 5,3 (0:1)
MW 360 360 15,2 0,6488 364 4 MW 343 343 1,1202 0,4098 344 1 MW 352 352 2,4606 0,8698 352 0 30(1:1) MW 360 360 5,6574 2,0231 361 1
Table 5.6. Calculated hot spots in microwave heated experiments using the single plant approach. ΔTHS = Teff-Tb As it was expected after the comparison of the curve slopes shown in Figure 5.12, only small temperature gradients were calculated independently of the kind of composite used. If no deactivation is considered then it will be necessary to admit the lack of hot spots in the catalyst. However if the possibility of any kind of deactivation is considered, then a question still remains open, which is its influence on the hot spot calculated? The next chapter is dealing with this question.
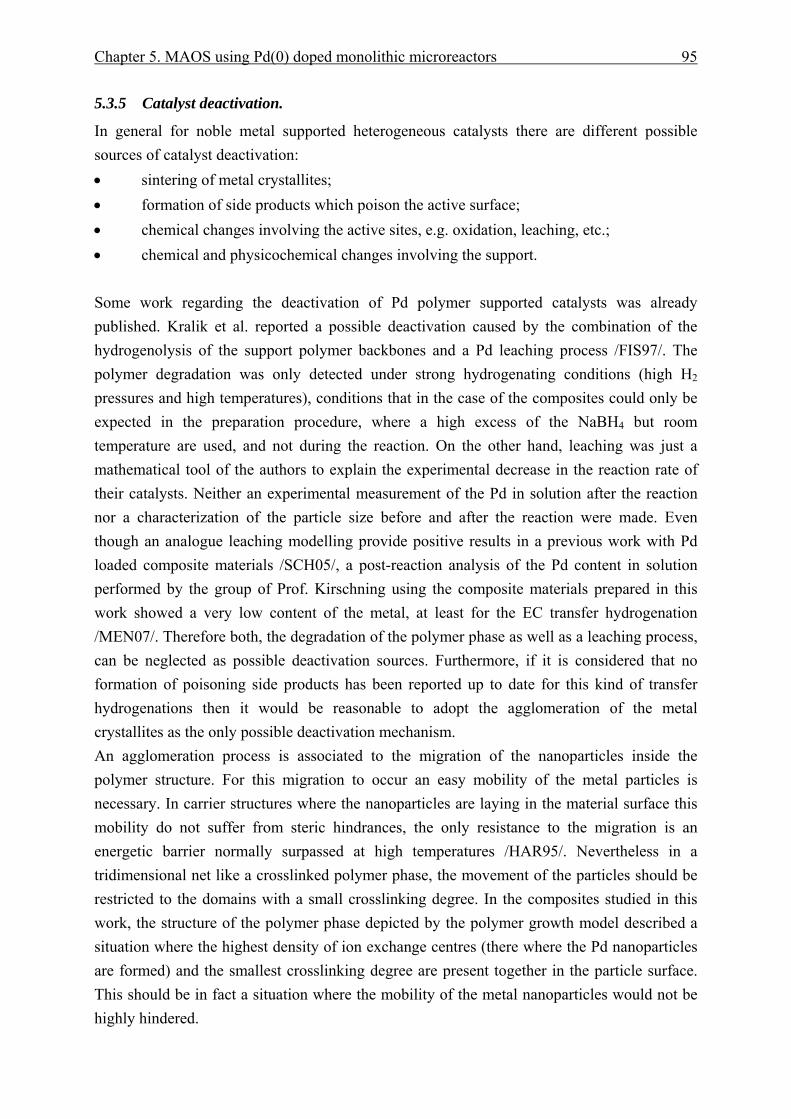
Chapter 5. MAOS using Pd(0) doped monolithic microreactors 95
5.3.5 Catalyst deactivation.
In general for noble metal supported heterogeneous catalysts there are different possible sources of catalyst deactivation: • sintering of metal crystallites; • formation of side products which poison the active surface; • chemical changes involving the active sites, e.g. oxidation, leaching, etc.; • chemical and physicochemical changes involving the support. Some work regarding the deactivation of Pd polymer supported catalysts was already published. Kralik et al. reported a possible deactivation caused by the combination of the hydrogenolysis of the support polymer backbones and a Pd leaching process /FIS97/. The polymer degradation was only detected under strong hydrogenating conditions (high H2 pressures and high temperatures), conditions that in the case of the composites could only be expected in the preparation procedure, where a high excess of the NaBH4 but room temperature are used, and not during the reaction. On the other hand, leaching was just a mathematical tool of the authors to explain the experimental decrease in the reaction rate of their catalysts. Neither an experimental measurement of the Pd in solution after the reaction nor a characterization of the particle size before and after the reaction were made. Even though an analogue leaching modelling provide positive results in a previous work with Pd loaded composite materials /SCH05/, a post-reaction analysis of the Pd content in solution performed by the group of Prof. Kirschning using the composite materials prepared in this work showed a very low content of the metal, at least for the EC transfer hydrogenation /MEN07/. Therefore both, the degradation of the polymer phase as well as a leaching process, can be neglected as possible deactivation sources. Furthermore, if it is considered that no formation of poisoning side products has been reported up to date for this kind of transfer hydrogenations then it would be reasonable to adopt the agglomeration of the metal crystallites as the only possible deactivation mechanism. An agglomeration process is associated to the migration of the nanoparticles inside the polymer structure. For this migration to occur an easy mobility of the metal particles is necessary. In carrier structures where the nanoparticles are laying in the material surface this mobility do not suffer from steric hindrances, the only resistance to the migration is an energetic barrier normally surpassed at high temperatures /HAR95/. Nevertheless in a tridimensional net like a crosslinked polymer phase, the movement of the particles should be restricted to the domains with a small crosslinking degree. In the composites studied in this work, the structure of the polymer phase depicted by the polymer growth model described a situation where the highest density of ion exchange centres (there where the Pd nanoparticles are formed) and the smallest crosslinking degree are present together in the particle surface. This should be in fact a situation where the mobility of the metal nanoparticles would not be highly hindered.
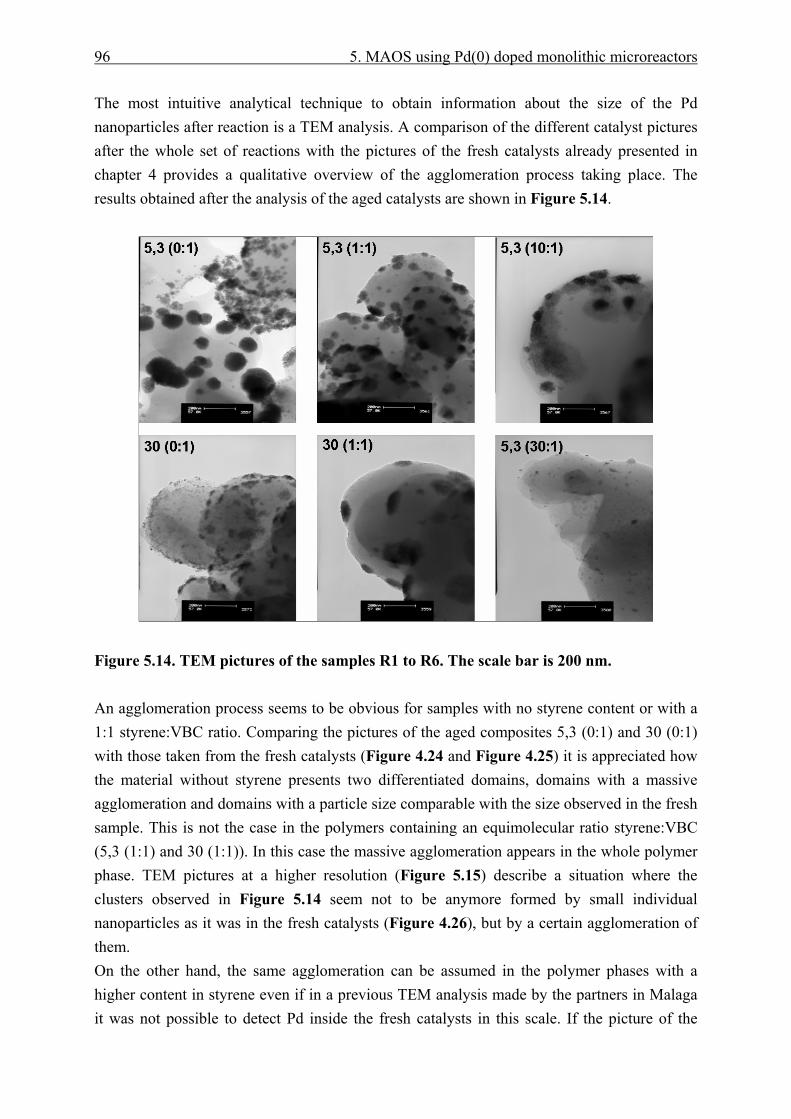
96 5. MAOS using Pd(0) doped monolithic microreactors
The most intuitive analytical technique to obtain information about the size of the Pd nanoparticles after reaction is a TEM analysis. A comparison of the different catalyst pictures after the whole set of reactions with the pictures of the fresh catalysts already presented in chapter 4 provides a qualitative overview of the agglomeration process taking place. The results obtained after the analysis of the aged catalysts are shown in Figure 5.14.
Figure 5.14. TEM pictures of the samples R1 to R6. The scale bar is 200 nm. An agglomeration process seems to be obvious for samples with no styrene content or with a 1:1 styrene:VBC ratio. Comparing the pictures of the aged composites 5,3 (0:1) and 30 (0:1) with those taken from the fresh catalysts (Figure 4.24 and Figure 4.25) it is appreciated how the material without styrene presents two differentiated domains, domains with a massive agglomeration and domains with a particle size comparable with the size observed in the fresh sample. This is not the case in the polymers containing an equimolecular ratio styrene:VBC (5,3 (1:1) and 30 (1:1)). In this case the massive agglomeration appears in the whole polymer phase. TEM pictures at a higher resolution (Figure 5.15) describe a situation where the clusters observed in Figure 5.14 seem not to be anymore formed by small individual nanoparticles as it was in the fresh catalysts (Figure 4.26), but by a certain agglomeration of them. On the other hand, the same agglomeration can be assumed in the polymer phases with a higher content in styrene even if in a previous TEM analysis made by the partners in Malaga it was not possible to detect Pd inside the fresh catalysts in this scale. If the picture of the

Chapter 5. MAOS using Pd(0) doped monolithic microreactors 97
sample 5,3 (10:1) in Figure 5.14 is observed a kind of “egg” structure, with a cloud of small nanoparticles similar to the particles observed in the fresh catalysts at a high resolution (Figure 4.26), surrounding a dark spot created by the agglomeration of these ones can be easily recognised. Also, it seems that agglomeration takes place in the composite 5,3 (30:1) even though the small Pd presence hinders a clear observation. For this last composite, this fact is confirmed having a look to the structure of the Pd spots using a higher resolution. The picture contained in Figure 5.15 present the same agglomeration of the individual particles already described for the rest of the samples.
Figure 5.15. high resolution TEM pictures of samples R2,R4, R5 and R6. The scale bar is 20 nm. These results would confirm the freedom of movement of the nanoparticles in the polymer net as well as they would explain in principle the great deactivation values observed by the reduction in the reaction rate in the group of kinetic tests performed with the composites 5,3 (1:1), 5,3 (10:1), 5,3 (30:1) and 30 (0:1). A strong agglomeration produces a decrease in the slope of the curves via the reduction in the α factor caused by the drop in the Pd active surface area. Nevertheless still remains an open question regarding the materials 5,3 (0:1) and 30 (1:1). If the slope of the single plant experiments (Figure 5.12) is observed it could be concluded that both composites shown no deactivation. This lack of deactivation would not match with the expectations generated after considering the agglomeration observed in the TEM pictures.
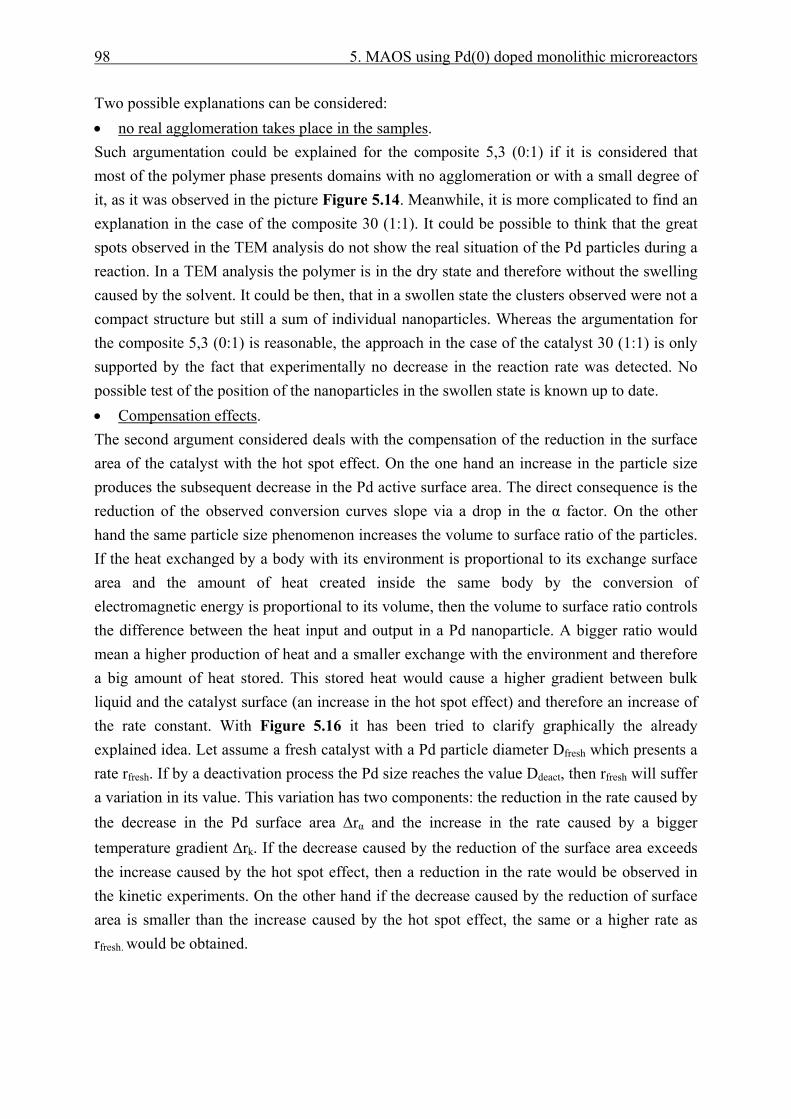
98 5. MAOS using Pd(0) doped monolithic microreactors
Two possible explanations can be considered: • no real agglomeration takes place in the samples. Such argumentation could be explained for the composite 5,3 (0:1) if it is considered that most of the polymer phase presents domains with no agglomeration or with a small degree of it, as it was observed in the picture Figure 5.14. Meanwhile, it is more complicated to find an explanation in the case of the composite 30 (1:1). It could be possible to think that the great spots observed in the TEM analysis do not show the real situation of the Pd particles during a reaction. In a TEM analysis the polymer is in the dry state and therefore without the swelling caused by the solvent. It could be then, that in a swollen state the clusters observed were not a compact structure but still a sum of individual nanoparticles. Whereas the argumentation for the composite 5,3 (0:1) is reasonable, the approach in the case of the catalyst 30 (1:1) is only supported by the fact that experimentally no decrease in the reaction rate was detected. No possible test of the position of the nanoparticles in the swollen state is known up to date. • Compensation effects. The second argument considered deals with the compensation of the reduction in the surface area of the catalyst with the hot spot effect. On the one hand an increase in the particle size produces the subsequent decrease in the Pd active surface area. The direct consequence is the reduction of the observed conversion curves slope via a drop in the α factor. On the other hand the same particle size phenomenon increases the volume to surface ratio of the particles. If the heat exchanged by a body with its environment is proportional to its exchange surface area and the amount of heat created inside the same body by the conversion of electromagnetic energy is proportional to its volume, then the volume to surface ratio controls the difference between the heat input and output in a Pd nanoparticle. A bigger ratio would mean a higher production of heat and a smaller exchange with the environment and therefore a big amount of heat stored. This stored heat would cause a higher gradient between bulk liquid and the catalyst surface (an increase in the hot spot effect) and therefore an increase of the rate constant. With Figure 5.16 it has been tried to clarify graphically the already explained idea. Let assume a fresh catalyst with a Pd particle diameter Dfresh which presents a rate rfresh. If by a deactivation process the Pd size reaches the value Ddeact, then rfresh will suffer a variation in its value. This variation has two components: the reduction in the rate caused by the decrease in the Pd surface area Δrα and the increase in the rate caused by a bigger temperature gradient Δrk. If the decrease caused by the reduction of the surface area exceeds the increase caused by the hot spot effect, then a reduction in the rate would be observed in the kinetic experiments. On the other hand if the decrease caused by the reduction of surface area is smaller than the increase caused by the hot spot effect, the same or a higher rate as rfresh. would be obtained.
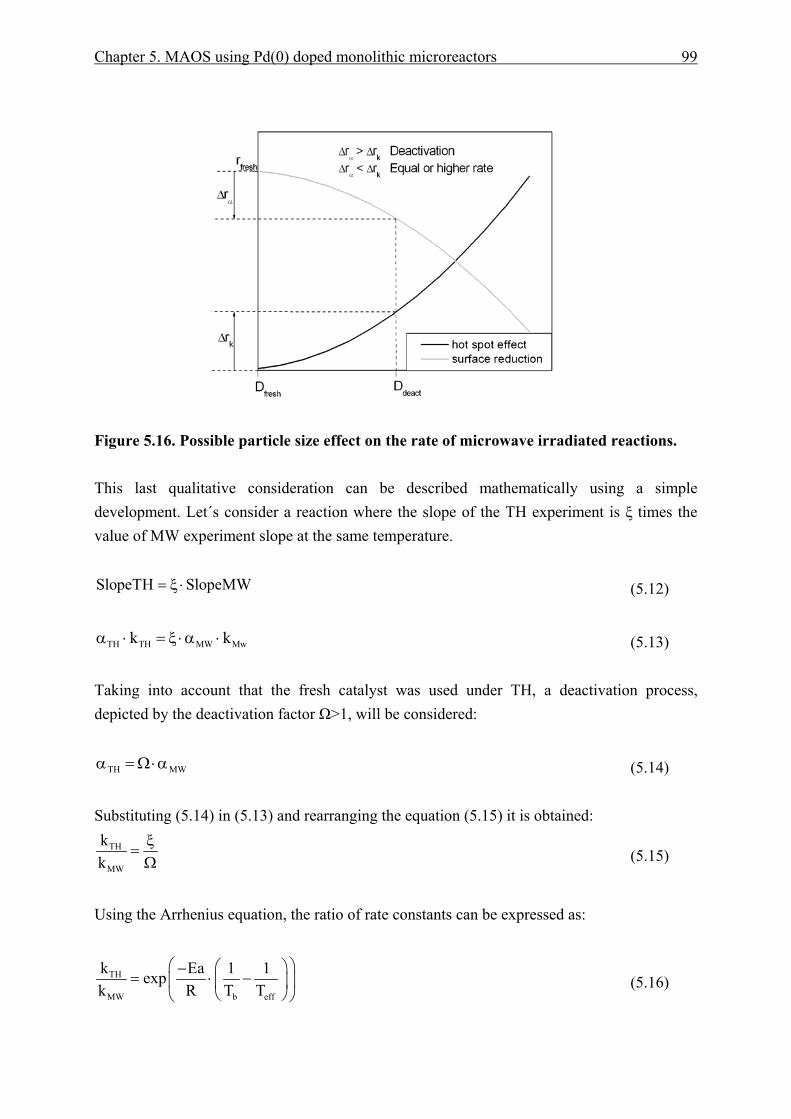
Chapter 5. MAOS using Pd(0) doped monolithic microreactors 99
Figure 5.16. Possible particle size effect on the rate of microwave irradiated reactions. This last qualitative consideration can be described mathematically using a simple development. Let´s consider a reaction where the slope of the TH experiment is ξ times the value of MW experiment slope at the same temperature. SlopeTH SlopeMW= ξ ⋅
(5.12)
TH TH MW Mwk kα ⋅ = ξ⋅α ⋅
(5.13) Taking into account that the fresh catalyst was used under TH, a deactivation process, depicted by the deactivation factor Ω>1, will be considered:
MWTH α⋅Ω=α
(5.14) Substituting (5.14) in (5.13) and rearranging the equation (5.15) it is obtained:
TH
MW
kk
ξ=Ω
(5.15)
Using the Arrhenius equation, the ratio of rate constants can be expressed as:
TH
MW b eff
k Ea 1 1expk R T T
⎛ ⎞⎛ ⎞−= ⋅ −⎜ ⎟⎜ ⎟
⎝ ⎠⎝ ⎠ (5.16)
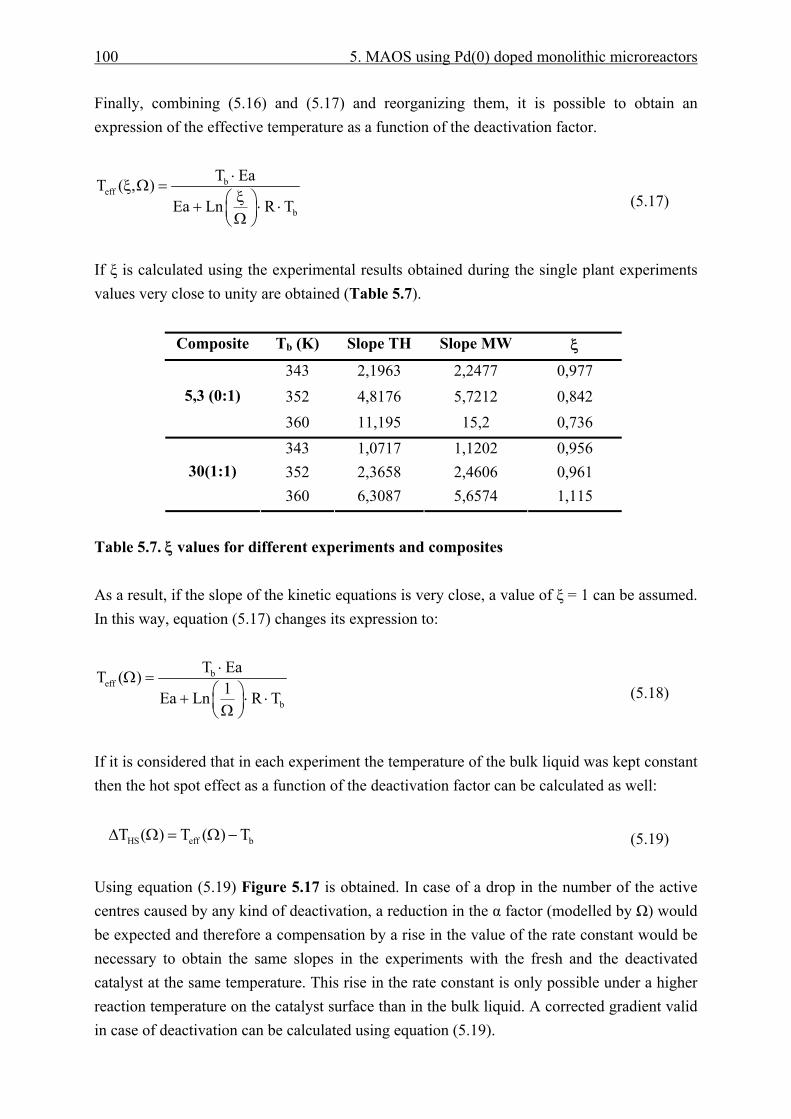
100 5. MAOS using Pd(0) doped monolithic microreactors
Finally, combining (5.16) and (5.17) and reorganizing them, it is possible to obtain an expression of the effective temperature as a function of the deactivation factor.
beff
b
T EaT ( , )Ea Ln R T
⋅ξ Ω =
ξ⎛ ⎞+ ⋅ ⋅⎜ ⎟Ω⎝ ⎠ (5.17)
If ξ is calculated using the experimental results obtained during the single plant experiments values very close to unity are obtained (Table 5.7).
Composite Tb (K) Slope TH Slope MW ξ 343 2,1963 2,2477 0,977 352 4,8176 5,7212 0,842 5,3 (0:1)
360 11,195 15,2 0,736 343 1,0717 1,1202 0,956 352 2,3658 2,4606 0,961 30(1:1) 360 6,3087 5,6574 1,115
Table 5.7. ξ values for different experiments and composites As a result, if the slope of the kinetic equations is very close, a value of ξ = 1 can be assumed. In this way, equation (5.17) changes its expression to:
beff
b
T EaT ( )1Ea Ln R T
⋅Ω =
⎛ ⎞+ ⋅ ⋅⎜ ⎟Ω⎝ ⎠ (5.18)
If it is considered that in each experiment the temperature of the bulk liquid was kept constant then the hot spot effect as a function of the deactivation factor can be calculated as well:
HS eff bT ( ) T ( ) TΔ Ω = Ω −
(5.19) Using equation (5.19) Figure 5.17 is obtained. In case of a drop in the number of the active centres caused by any kind of deactivation, a reduction in the α factor (modelled by Ω) would be expected and therefore a compensation by a rise in the value of the rate constant would be necessary to obtain the same slopes in the experiments with the fresh and the deactivated catalyst at the same temperature. This rise in the rate constant is only possible under a higher reaction temperature on the catalyst surface than in the bulk liquid. A corrected gradient valid in case of deactivation can be calculated using equation (5.19).
Chapter 5. MAOS using Pd(0) doped monolithic microreactors 101
Figure 5.17. Influence of the deactivation factor Ω in the hot spot effect Based on the particles shown in the aged catalyst pictures of Figure 5.14, a particle size distribution of the catalysts 5,3 (0:1) and 30 (1:1) was calculated. Using the mean particle size of the distribution the Pd active surface area of the aged catalysts was estimated. Finally a value of the deactivation factor Ω was obtained as the ratio between the already calculated surface area for the fresh catalysts and the surface area of the aged one. If Ω is introduced in the ordinate axis of Figure 5.17 a mathematical estimation of the corrected temperature gradient between bulk liquid and the catalysts is obtained. It is noteworthy to mention that all TEM pictures represent in principle the state of the catalyst during the last kinetic experience. It is not possible to assure if the agglomeration degree in the first two microwave runs was the same. Therefore the temperature gradients were only calculated at the bulk temperature of the last experiment (360 K). All evaluated values are included in Table 5.8
Composite aPd fresh (m2) aPd aged
(m2) Ω
ΔTHS(Ω) at 360K (K)
5,3 (0:1) 0,0829 0,0311 2,7 11,0 30 (1:1) 0,0014 0,0001 15,4 32,1
Table 5.8. Experimental deactivation factors and corrected temperature gradients. To sum up, if an agglomeration process is assumed in both composites, a corrected value of the hot spot ΔTHS(Ω) bigger than the calculated one using the rate constants is necessary to explain the fact that the slope of the kinetic curves before and after deactivation (what means traditional heating and microwave heating in the experimental procedure) have equal or
102 5. MAOS using Pd(0) doped monolithic microreactors
almost equal values. The calculated gradients show that under these assumptions a bigger hot spot effect as the one approached using the kinetic equation could be expected. In contrast if no agglomeration is assumed, the only temperature gradient present in the composite material would be the calculated value by the kinetic approach, a very small if not negligible hot spot effect. In order to discern which of the considered effects is the most reasonable one and to understand more about the parameters that affect the creation of hot spots, different mathematical models were developed.
5.4 Heat Transfer models.
Even though a selective microwave absorption is a necessary condition to create temperature gradients inside a heterogeneous catalyst under microwave radiation it is not the only fact to be taken into account. Even if a catalytic centre is able to absorb a big amount of radiation compared with its environment, the heat exchange process between the different parts of the reaction system will be the crucial factor which will determine the possibility of a permanent difference in temperature between the catalyst and the bulk liquid. With the aim of describing the different heat flows inside the composite materials developed in this work when microwave irradiation was applied, several heat transfer models were proposed.
5.4.1 Nanoparticle model.
Theoretical attempts were found in the literature dealing with the possibility of a temperature gradient between a noble metal nanoparticle supported in the pore of a microwave irradiated heterogeneous catalyst and the liquid contained in this pore. All of them reported the impossibility of the creation of such hot spots in the range of frequency where the normal microwave ovens work /PER97/or a very small gradient depending on the particle size of the noble metal /THO97/. However, both models do not consider several special circumstances which are present in the reaction system studied in this work: • the possibility of a microwave absorbing support. It was already experimentally
demonstrated that the aminated polymer phase used as a support of the Pd nanoparticles absorbs microwave energy. In addition, some examples of inorganic and organic polymers where it was detected a superheating of small polar groups or anions were reported in literature /BLA03/, /ZHO03/. This effect is especially well known in polymer curing processes.
• the possibility of using a microwave absorbing solvent. The reaction chosen to test the catalysts was performed using a microwave absorbing solvent like ethanol.
5.4.1.1 Model description
Both new features are included in the nanoscale model, a model which describes the heat exchange processes taking place in the interior of the swollen polymer phase of an irradiated composite material. A physical simplification of the system was adopted under the
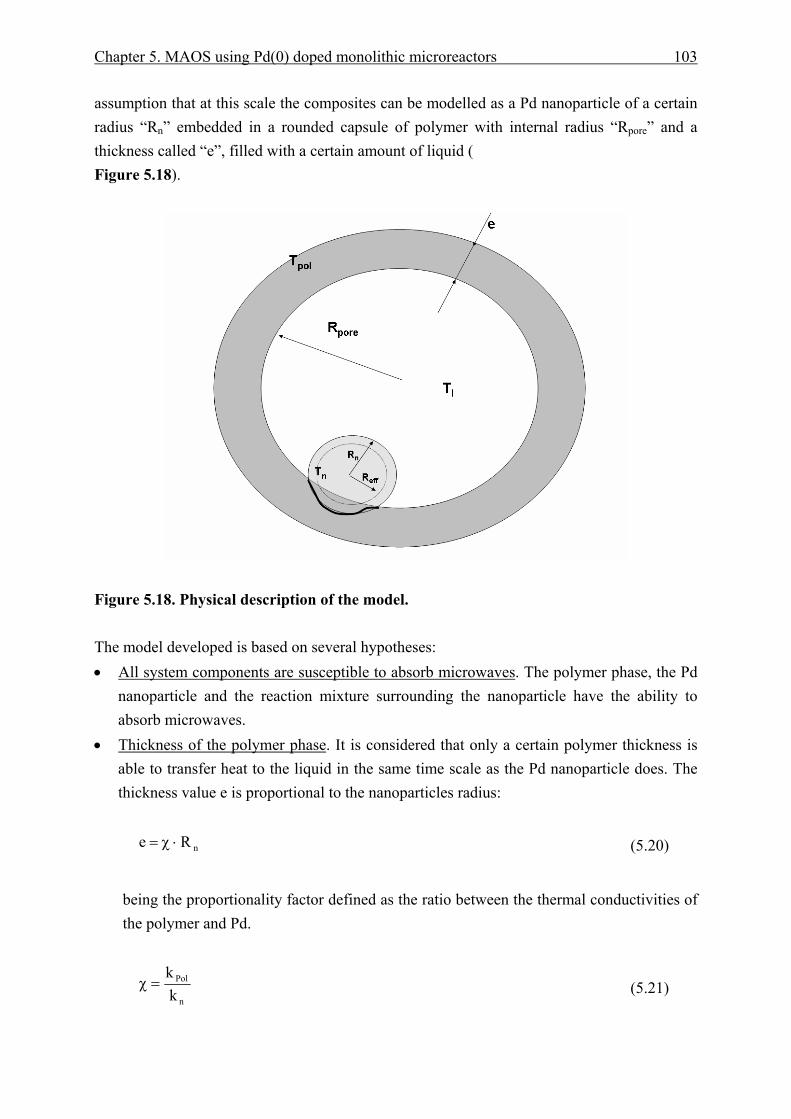
Chapter 5. MAOS using Pd(0) doped monolithic microreactors 103
assumption that at this scale the composites can be modelled as a Pd nanoparticle of a certain radius “Rn” embedded in a rounded capsule of polymer with internal radius “Rpore” and a thickness called “e”, filled with a certain amount of liquid ( Figure 5.18).
Figure 5.18. Physical description of the model. The model developed is based on several hypotheses: • All system components are susceptible to absorb microwaves. The polymer phase, the Pd
nanoparticle and the reaction mixture surrounding the nanoparticle have the ability to absorb microwaves.
• Thickness of the polymer phase. It is considered that only a certain polymer thickness is able to transfer heat to the liquid in the same time scale as the Pd nanoparticle does. The thickness value e is proportional to the nanoparticles radius:
nRe ⋅χ=
(5.20)
being the proportionality factor defined as the ratio between the thermal conductivities of the polymer and Pd.
n
Pol
kk
χ =
(5.21)
104 5. MAOS using Pd(0) doped monolithic microreactors
• Pd-polymer phase contact. The existence of a contact surface between the Pd particle and the polymer phase was assumed. Such a contact surface area will be available neither for the heat transfer between the nanoparticle and the liquid nor between the polymer and the liquid phase and is defined using a contact coefficient Θ.
contact
n
AA
Θ =
(5.22)
With this coefficient is possible to define the effective heat exchange surface area of the Pd particle and the polymer in the following way:
eff 2n nA R (1 )= π ⋅ ⋅ − Θ
(5.23)
eff 2 2Pol Pol nA (R R )= π ⋅ − ⋅Θ
(5.24)
In chapter 4 a polymer structure with a very low crosslinking degree in its outer layers was depicted, layers where almost all Pd particles must be embedded due to the high presence of VBC. A low crosslinking degree means a high mobility of the polymer chains, a high swellability and therefore a small polymer-nanoparticle contact surface area. Hence, in this model only small values of the contact coefficient (Θ = 0.1) were considered.
• Heat transfer between Pd and polymer is neglected. On a macroscale the assumption of contact between two solid phases and the temperature gradient between them caused by the different microwave absorption properties would cause the appearance of a conduction heat flux from one to the other. Nevertheless on the nanoscale it is considered that the phonon mean free path is much bigger than the particle diameter. Under such conditions the continuum model, based in a heat conduction following the Fourier law, suffers from disturbances. An extra heat resistance in the interface between solids is built decreasing in a big extent the heat transfer between materials /CHE96/. In addition the small contact coefficients assumed reduces even more a possible heat transfer process.
• Lumped capacitance model. Due to the nanometer scale of the model, the Biot number (Bi) of the nanoparticle and the polymer is much smaller than the unity. As a result, the heat conduction inside the solids is much faster than the convection of heat from the surface to the surroundings. Any temperature gradient inside the solids can be neglected and therefore a constant temperature in each of the mediums for each instant can be assumed. A direct consequence is the simplification of the temperature profiles to a time dependent function.
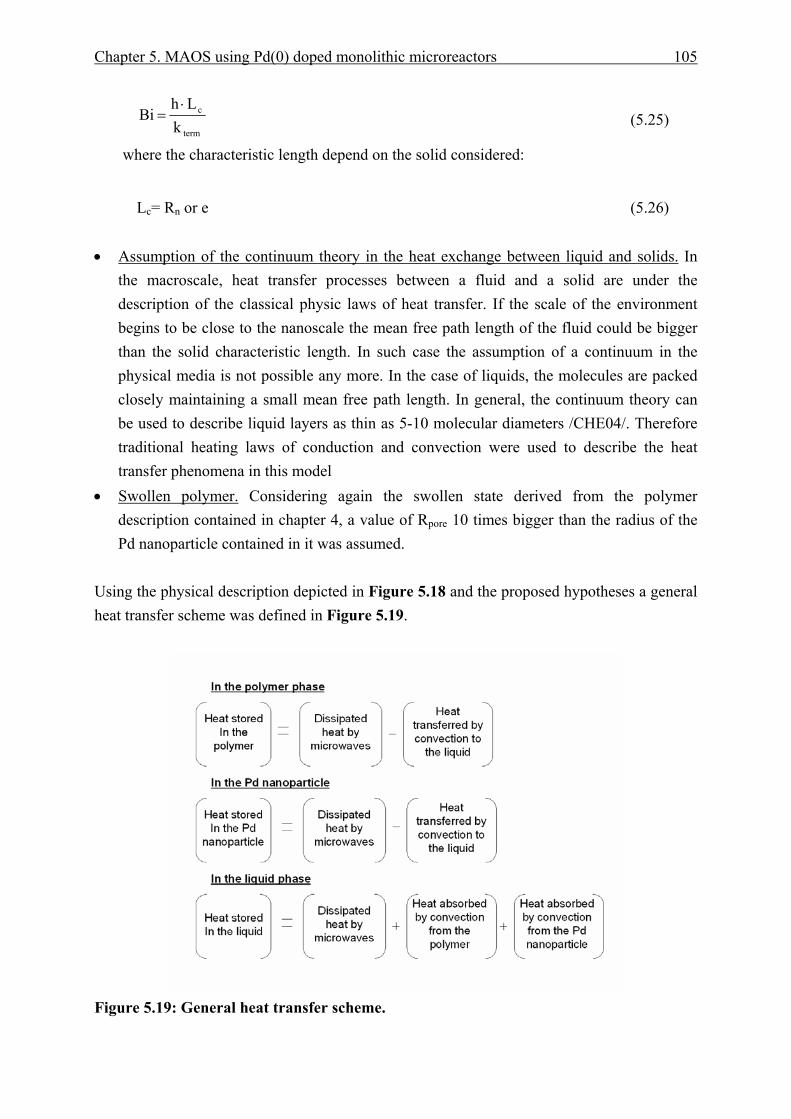
Chapter 5. MAOS using Pd(0) doped monolithic microreactors 105
term
c
kLh
Bi⋅
=
(5.25)
where the characteristic length depend on the solid considered:
Lc= Rn or e (5.26) • Assumption of the continuum theory in the heat exchange between liquid and solids. In
the macroscale, heat transfer processes between a fluid and a solid are under the description of the classical physic laws of heat transfer. If the scale of the environment begins to be close to the nanoscale the mean free path length of the fluid could be bigger than the solid characteristic length. In such case the assumption of a continuum in the physical media is not possible any more. In the case of liquids, the molecules are packed closely maintaining a small mean free path length. In general, the continuum theory can be used to describe liquid layers as thin as 5-10 molecular diameters /CHE04/. Therefore traditional heating laws of conduction and convection were used to describe the heat transfer phenomena in this model
• Swollen polymer. Considering again the swollen state derived from the polymer description contained in chapter 4, a value of Rpore 10 times bigger than the radius of the Pd nanoparticle contained in it was assumed.
Using the physical description depicted in Figure 5.18 and the proposed hypotheses a general heat transfer scheme was defined in Figure 5.19.
Figure 5.19: General heat transfer scheme.
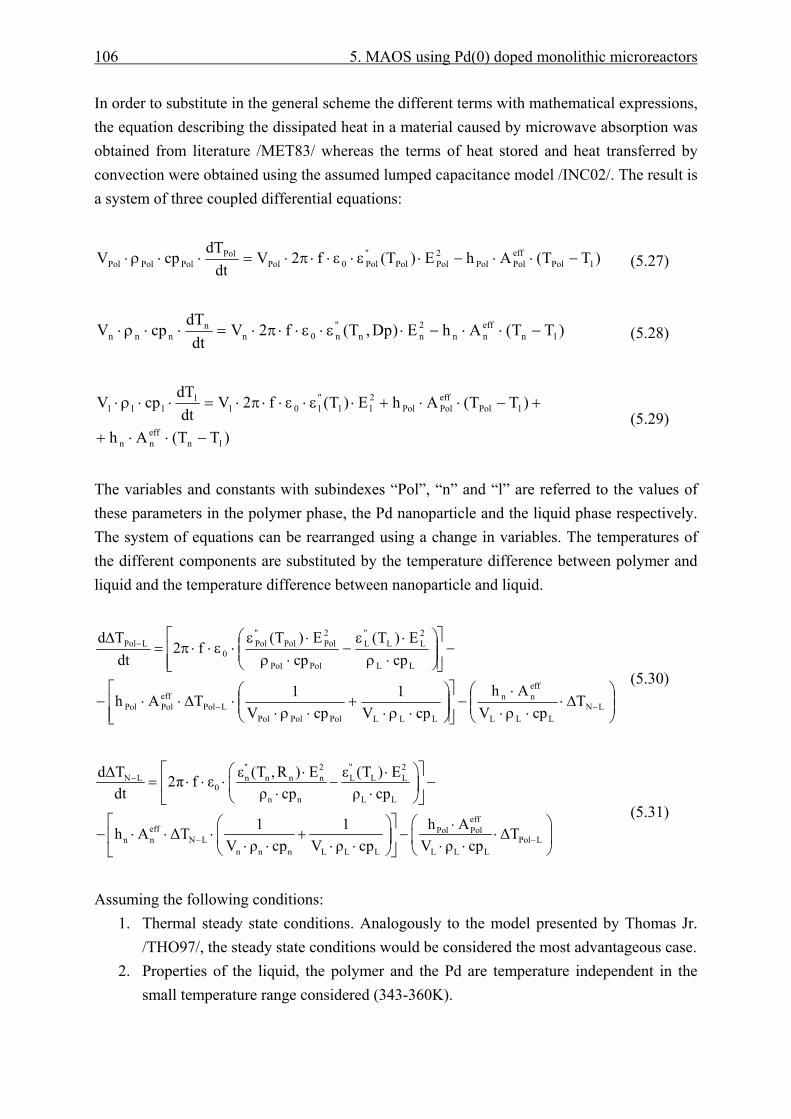
106 5. MAOS using Pd(0) doped monolithic microreactors
In order to substitute in the general scheme the different terms with mathematical expressions, the equation describing the dissipated heat in a material caused by microwave absorption was obtained from literature /MET83/ whereas the terms of heat stored and heat transferred by convection were obtained using the assumed lumped capacitance model /INC02/. The result is a system of three coupled differential equations:
)TT(AhE)T(f2Vdt
dTcpV lPol
effPolPol
2PolPol
"Pol0Pol
PolPolPolPol −⋅⋅−⋅ε⋅ε⋅⋅π⋅=⋅⋅ρ⋅
(5.27)
)TT(AhE)Dp,T(f2Vdt
dTcpV ln
effnn
2nn
"n0n
nnnn −⋅⋅−⋅ε⋅ε⋅⋅π⋅=⋅⋅ρ⋅
(5.28)
)TT(Ah
)TT(AhE)T(f2Vdt
dTcpV
lneffnn
lPoleffPolPol
2ll
"l0l
llll
−⋅⋅+
+−⋅⋅+⋅ε⋅ε⋅⋅π⋅=⋅⋅ρ⋅
(5.29)
The variables and constants with subindexes “Pol”, “n” and “l” are referred to the values of these parameters in the polymer phase, the Pd nanoparticle and the liquid phase respectively. The system of equations can be rearranged using a change in variables. The temperatures of the different components are substituted by the temperature difference between polymer and liquid and the temperature difference between nanoparticle and liquid.
⎟⎟⎠
⎞⎜⎜⎝
⎛Δ⋅
⋅ρ⋅⋅
−⎥⎥⎦
⎤
⎢⎢⎣
⎡⎟⎟⎠
⎞⎜⎜⎝
⎛⋅ρ⋅
+⋅ρ⋅
⋅Δ⋅⋅−
−⎥⎥⎦
⎤
⎢⎢⎣
⎡⎟⎟⎠
⎞⎜⎜⎝
⎛⋅ρ⋅ε
−⋅ρ
⋅ε⋅ε⋅⋅π=
Δ
−−
−
LNLLL
effnn
LLLPolPolPolLPol
effPolPol
LL
2LL
"L
PolPol
2PolPol
"Pol
0LPol
TcpV
AhcpV
1cpV
1TAh
cpE)T(
cpE)T(
f2dtTd
(5.30)
" 2 " 2
N L n n n n L L L0
n n L L
effeff Pol Pol
n n N L Pol Ln n n L L L L L L
dΔT ε (T , R ) E ε (T ) E2π f εdt ρ cp ρ cp
1 1 h Ah A ΔT ΔTV ρ cp V ρ cp V ρ cp
−
− −
⎡ ⎤⎛ ⎞⋅ ⋅= ⋅ ⋅ ⋅ − −⎢ ⎥⎜ ⎟⋅ ⋅⎝ ⎠⎣ ⎦
⎡ ⎤⎛ ⎞ ⎛ ⎞⋅− ⋅ ⋅ ⋅ + − ⋅⎢ ⎥⎜ ⎟ ⎜ ⎟⋅ ⋅ ⋅ ⋅ ⋅ ⋅⎝ ⎠ ⎝ ⎠⎣ ⎦
(5.31)
Assuming the following conditions:
1. Thermal steady state conditions. Analogously to the model presented by Thomas Jr. /THO97/, the steady state conditions would be considered the most advantageous case.
2. Properties of the liquid, the polymer and the Pd are temperature independent in the small temperature range considered (343-360K).
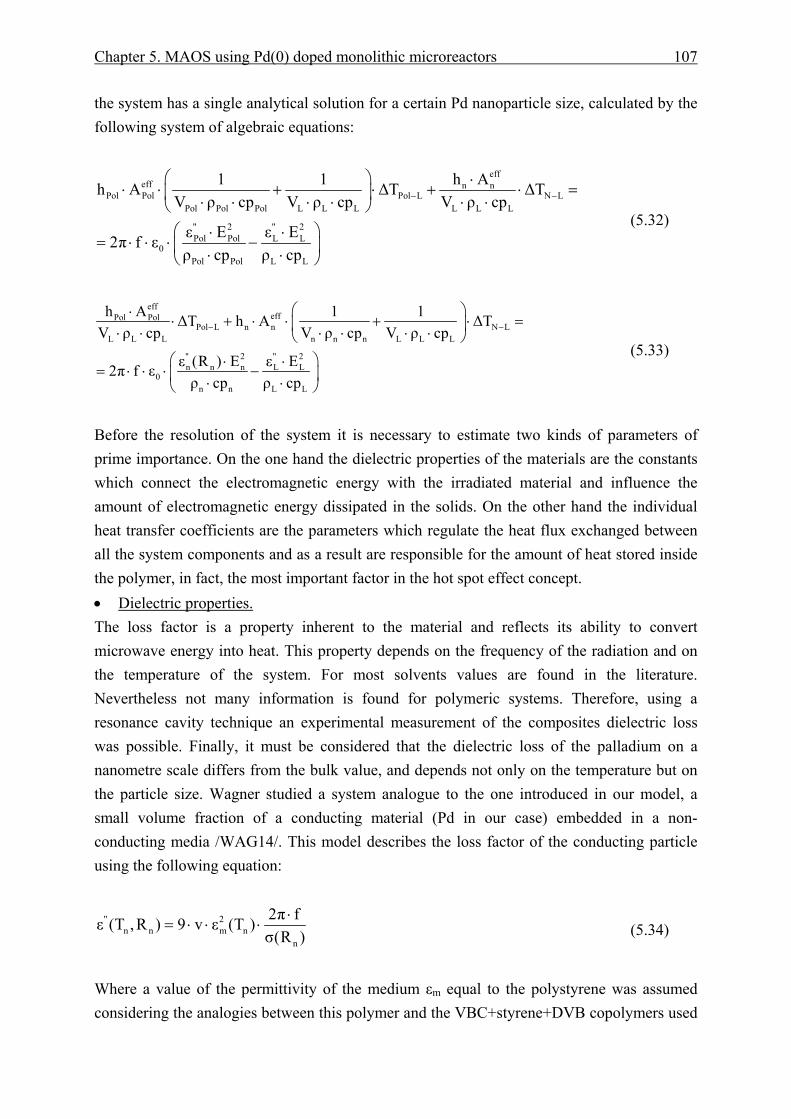
Chapter 5. MAOS using Pd(0) doped monolithic microreactors 107
the system has a single analytical solution for a certain Pd nanoparticle size, calculated by the following system of algebraic equations:
effeff n n
Pol Pol Pol L N LPol Pol Pol L L L L L L
" 2 " 2Pol Pol L L
0Pol Pol L L
1 1 h Ah A ΔT ΔTV ρ cp V ρ cp V ρ cp
ε E ε E2π f ερ cp ρ cp
− −
⎛ ⎞ ⋅⋅ ⋅ + ⋅ + ⋅ =⎜ ⎟⋅ ⋅ ⋅ ⋅ ⋅ ⋅⎝ ⎠
⎛ ⎞⋅ ⋅= ⋅ ⋅ ⋅ −⎜ ⎟⋅ ⋅⎝ ⎠
(5.32)
eff
effPol PolPol L n n N L
L L L n n n L L L
" 2 " 2n n n L L
0n n L L
h A 1 1ΔT h A ΔTV ρ cp V ρ cp V ρ cp
ε (R ) E ε E2π f ερ cp ρ cp
− −
⎛ ⎞⋅⋅ + ⋅ ⋅ + ⋅ =⎜ ⎟⋅ ⋅ ⋅ ⋅ ⋅ ⋅⎝ ⎠⎛ ⎞⋅ ⋅
= ⋅ ⋅ ⋅ −⎜ ⎟⋅ ⋅⎝ ⎠
(5.33)
Before the resolution of the system it is necessary to estimate two kinds of parameters of prime importance. On the one hand the dielectric properties of the materials are the constants which connect the electromagnetic energy with the irradiated material and influence the amount of electromagnetic energy dissipated in the solids. On the other hand the individual heat transfer coefficients are the parameters which regulate the heat flux exchanged between all the system components and as a result are responsible for the amount of heat stored inside the polymer, in fact, the most important factor in the hot spot effect concept. • Dielectric properties. The loss factor is a property inherent to the material and reflects its ability to convert microwave energy into heat. This property depends on the frequency of the radiation and on the temperature of the system. For most solvents values are found in the literature. Nevertheless not many information is found for polymeric systems. Therefore, using a resonance cavity technique an experimental measurement of the composites dielectric loss was possible. Finally, it must be considered that the dielectric loss of the palladium on a nanometre scale differs from the bulk value, and depends not only on the temperature but on the particle size. Wagner studied a system analogue to the one introduced in our model, a small volume fraction of a conducting material (Pd in our case) embedded in a non-conducting media /WAG14/. This model describes the loss factor of the conducting particle using the following equation:
" 2n n m n
n
2π fε (T , R ) 9 v ε (T )σ(R )
⋅= ⋅ ⋅ ⋅
(5.34)
Where a value of the permittivity of the medium εm equal to the polystyrene was assumed considering the analogies between this polymer and the VBC+styrene+DVB copolymers used
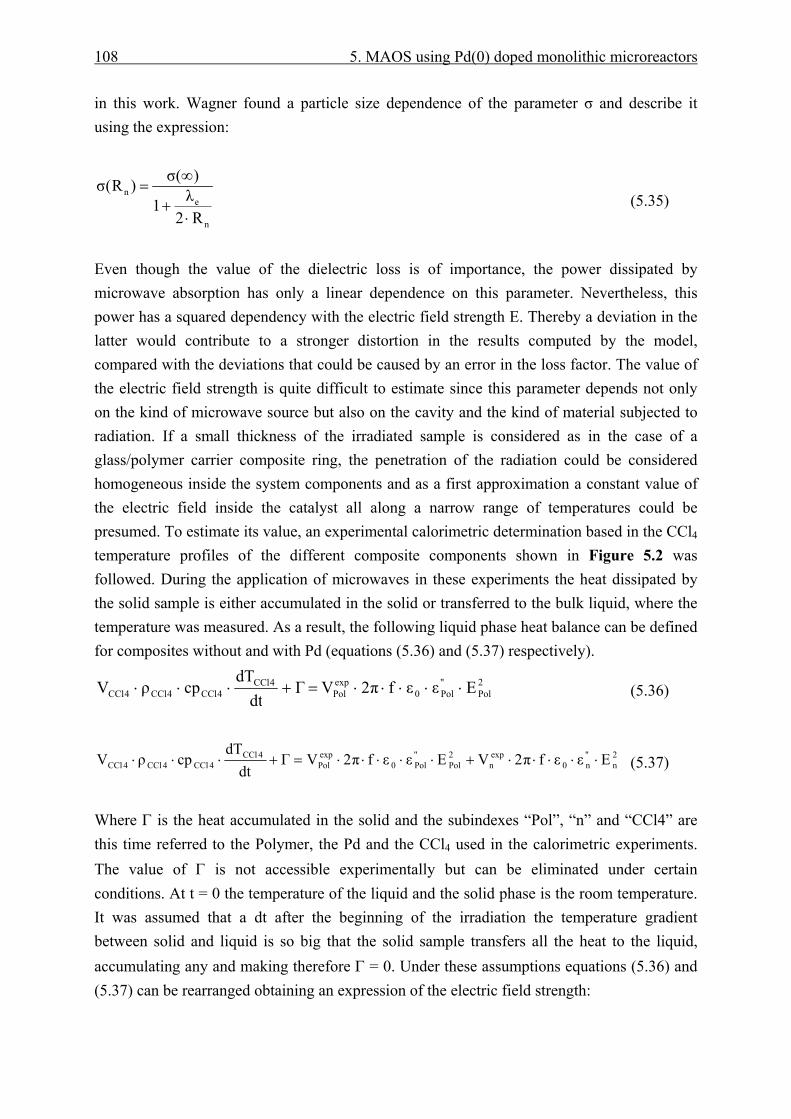
108 5. MAOS using Pd(0) doped monolithic microreactors
in this work. Wagner found a particle size dependence of the parameter σ and describe it using the expression:
ne
n
σ( )σ(R ) λ12 R
∞=
+⋅
(5.35)
Even though the value of the dielectric loss is of importance, the power dissipated by microwave absorption has only a linear dependence on this parameter. Nevertheless, this power has a squared dependency with the electric field strength E. Thereby a deviation in the latter would contribute to a stronger distortion in the results computed by the model, compared with the deviations that could be caused by an error in the loss factor. The value of the electric field strength is quite difficult to estimate since this parameter depends not only on the kind of microwave source but also on the cavity and the kind of material subjected to radiation. If a small thickness of the irradiated sample is considered as in the case of a glass/polymer carrier composite ring, the penetration of the radiation could be considered homogeneous inside the system components and as a first approximation a constant value of the electric field inside the catalyst all along a narrow range of temperatures could be presumed. To estimate its value, an experimental calorimetric determination based in the CCl4 temperature profiles of the different composite components shown in Figure 5.2 was followed. During the application of microwaves in these experiments the heat dissipated by the solid sample is either accumulated in the solid or transferred to the bulk liquid, where the temperature was measured. As a result, the following liquid phase heat balance can be defined for composites without and with Pd (equations (5.36) and (5.37) respectively).
2Pol
"Pol0
expPol
4CCl4CCl4CCl4CCl Eεεfπ2VΓ
dtdT
cpρV ⋅⋅⋅⋅⋅=+⋅⋅⋅
(5.36)
2n
"n0
expn
2Pol
"Pol0
expPol
4CCl4CCl4CCl4CCl Eεεfπ2VEεεfπ2VΓ
dtdT
cpρV ⋅⋅⋅⋅⋅+⋅⋅⋅⋅⋅=+⋅⋅⋅
(5.37)
Where Γ is the heat accumulated in the solid and the subindexes “Pol”, “n” and “CCl4” are this time referred to the Polymer, the Pd and the CCl4 used in the calorimetric experiments. The value of Γ is not accessible experimentally but can be eliminated under certain conditions. At t = 0 the temperature of the liquid and the solid phase is the room temperature. It was assumed that a dt after the beginning of the irradiation the temperature gradient between solid and liquid is so big that the solid sample transfers all the heat to the liquid, accumulating any and making therefore Γ = 0. Under these assumptions equations (5.36) and (5.37) can be rearranged obtaining an expression of the electric field strength:
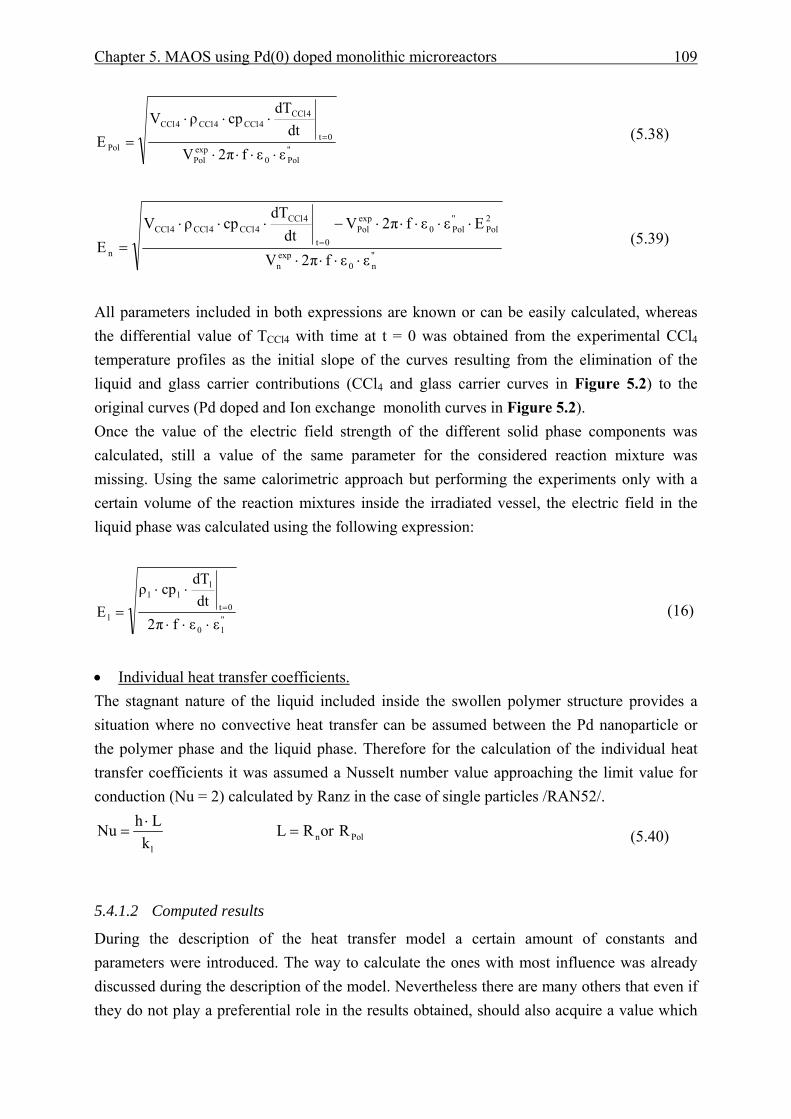
Chapter 5. MAOS using Pd(0) doped monolithic microreactors 109
"Pol0
expPol
0t
4CCl4CCl4CCl4CCl
Pol εεfπ2Vdt
dTcpρV
E⋅⋅⋅⋅
⋅⋅⋅
= =
(5.38)
"n0
expn
2Pol
"Pol0
expPol
0t
4CCl4CCl4CCl4CCl
n εεfπ2V
Eεεfπ2Vdt
dTcpρV
E⋅⋅⋅⋅
⋅⋅⋅⋅⋅−⋅⋅⋅= =
(5.39)
All parameters included in both expressions are known or can be easily calculated, whereas the differential value of TCCl4 with time at t = 0 was obtained from the experimental CCl4 temperature profiles as the initial slope of the curves resulting from the elimination of the liquid and glass carrier contributions (CCl4 and glass carrier curves in Figure 5.2) to the original curves (Pd doped and Ion exchange monolith curves in Figure 5.2). Once the value of the electric field strength of the different solid phase components was calculated, still a value of the same parameter for the considered reaction mixture was missing. Using the same calorimetric approach but performing the experiments only with a certain volume of the reaction mixtures inside the irradiated vessel, the electric field in the liquid phase was calculated using the following expression:
"l0
0t
lll
l εεfπ2dt
dTcpρ
E⋅⋅⋅
⋅⋅= = (16)
• Individual heat transfer coefficients. The stagnant nature of the liquid included inside the swollen polymer structure provides a situation where no convective heat transfer can be assumed between the Pd nanoparticle or the polymer phase and the liquid phase. Therefore for the calculation of the individual heat transfer coefficients it was assumed a Nusselt number value approaching the limit value for conduction (Nu = 2) calculated by Ranz in the case of single particles /RAN52/.
l
h LNuk⋅
=
nL R or= PolR
(5.40)
5.4.1.2 Computed results
During the description of the heat transfer model a certain amount of constants and parameters were introduced. The way to calculate the ones with most influence was already discussed during the description of the model. Nevertheless there are many others that even if they do not play a preferential role in the results obtained, should also acquire a value which
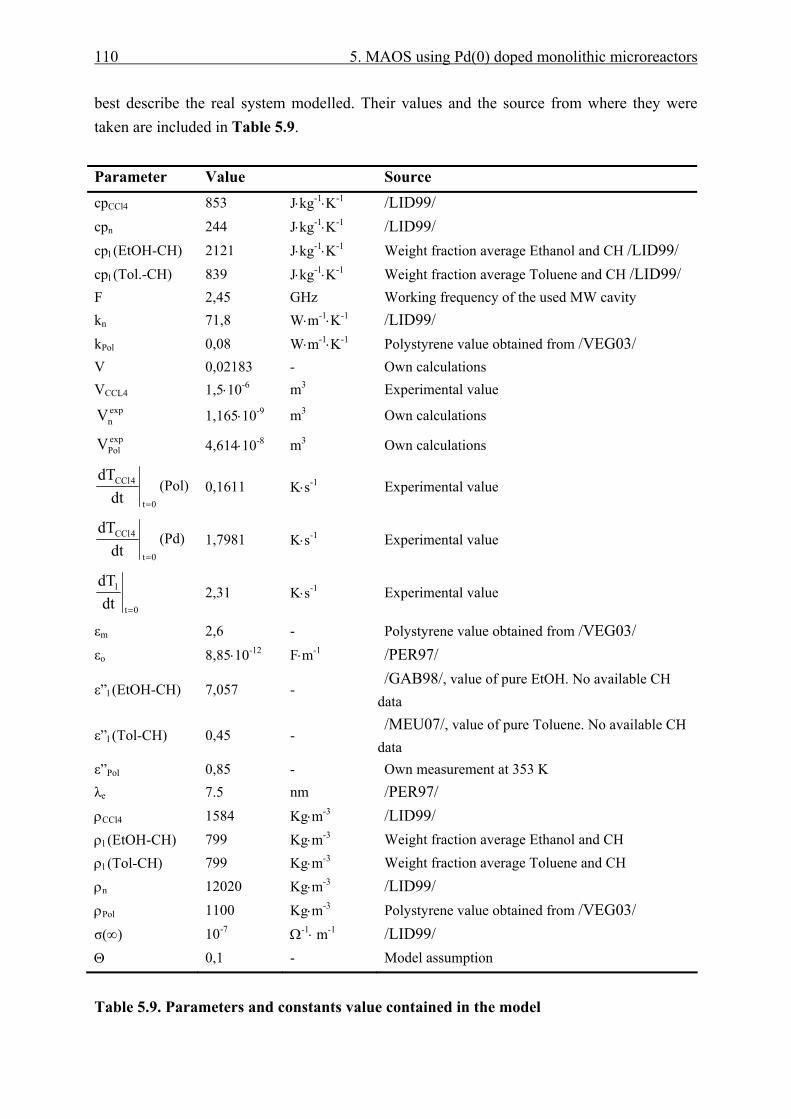
110 5. MAOS using Pd(0) doped monolithic microreactors
best describe the real system modelled. Their values and the source from where they were taken are included in Table 5.9. Parameter Value Source cpCCl4 853 J⋅kg-1⋅K-1 /LID99/ cpn 244 J⋅kg-1⋅K-1 /LID99/ cpl (EtOH-CH) 2121 J⋅kg-1⋅K-1 Weight fraction average Ethanol and CH /LID99/ cpl (Tol.-CH) 839 J⋅kg-1⋅K-1 Weight fraction average Toluene and CH /LID99/ F 2,45 GHz Working frequency of the used MW cavity kn 71,8 W⋅m-1⋅K-1 /LID99/ kPol 0,08 W⋅m-1⋅K-1 Polystyrene value obtained from /VEG03/ V 0,02183 - Own calculations VCCL4 1,5⋅10-6 m3 Experimental value
expnV 1,165⋅10-9 m3 Own calculations expPolV 4,614⋅10-8 m3 Own calculations
0t
4CCl
dtdT
=
(Pol) 0,1611 K⋅s-1 Experimental value
0t
4CCl
dtdT
=
(Pd) 1,7981 K⋅s-1 Experimental value
0t
l
dtdT
=
2,31 K⋅s-1 Experimental value
εm 2,6 - Polystyrene value obtained from /VEG03/ εo 8,85⋅10-12 F⋅m-1 /PER97/
ε”l (EtOH-CH) 7,057 - /GAB98/, value of pure EtOH. No available CH
data
ε”l (Tol-CH) 0,45 - /MEU07/, value of pure Toluene. No available CH
data ε”Pol 0,85 - Own measurement at 353 K λe 7.5 nm /PER97/ ρCCl4 1584 Kg⋅m-3 /LID99/ ρl (EtOH-CH) 799 Kg⋅m-3 Weight fraction average Ethanol and CH ρl (Tol-CH) 799 Kg⋅m-3 Weight fraction average Toluene and CH ρn 12020 Kg⋅m-3 /LID99/ ρPol 1100 Kg⋅m-3 Polystyrene value obtained from /VEG03/ σ(∞) 10-7 Ω-1⋅ m-1 /LID99/ Θ 0,1 - Model assumption
Table 5.9. Parameters and constants value contained in the model
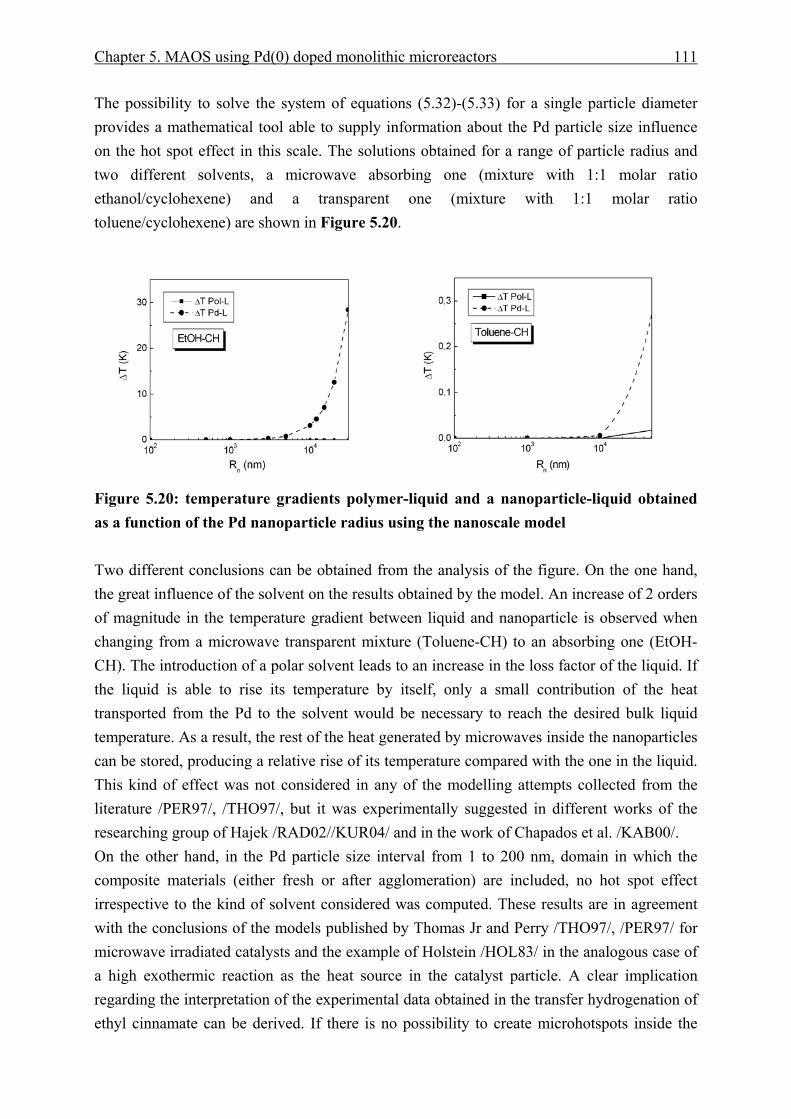
Chapter 5. MAOS using Pd(0) doped monolithic microreactors 111
The possibility to solve the system of equations (5.32)-(5.33) for a single particle diameter provides a mathematical tool able to supply information about the Pd particle size influence on the hot spot effect in this scale. The solutions obtained for a range of particle radius and two different solvents, a microwave absorbing one (mixture with 1:1 molar ratio ethanol/cyclohexene) and a transparent one (mixture with 1:1 molar ratio toluene/cyclohexene) are shown in Figure 5.20.
Figure 5.20: temperature gradients polymer-liquid and a nanoparticle-liquid obtained as a function of the Pd nanoparticle radius using the nanoscale model Two different conclusions can be obtained from the analysis of the figure. On the one hand, the great influence of the solvent on the results obtained by the model. An increase of 2 orders of magnitude in the temperature gradient between liquid and nanoparticle is observed when changing from a microwave transparent mixture (Toluene-CH) to an absorbing one (EtOH-CH). The introduction of a polar solvent leads to an increase in the loss factor of the liquid. If the liquid is able to rise its temperature by itself, only a small contribution of the heat transported from the Pd to the solvent would be necessary to reach the desired bulk liquid temperature. As a result, the rest of the heat generated by microwaves inside the nanoparticles can be stored, producing a relative rise of its temperature compared with the one in the liquid. This kind of effect was not considered in any of the modelling attempts collected from the literature /PER97/, /THO97/, but it was experimentally suggested in different works of the researching group of Hajek /RAD02//KUR04/ and in the work of Chapados et al. /KAB00/. On the other hand, in the Pd particle size interval from 1 to 200 nm, domain in which the composite materials (either fresh or after agglomeration) are included, no hot spot effect irrespective to the kind of solvent considered was computed. These results are in agreement with the conclusions of the models published by Thomas Jr and Perry /THO97/, /PER97/ for microwave irradiated catalysts and the example of Holstein /HOL83/ in the analogous case of a high exothermic reaction as the heat source in the catalyst particle. A clear implication regarding the interpretation of the experimental data obtained in the transfer hydrogenation of ethyl cinnamate can be derived. If there is no possibility to create microhotspots inside the
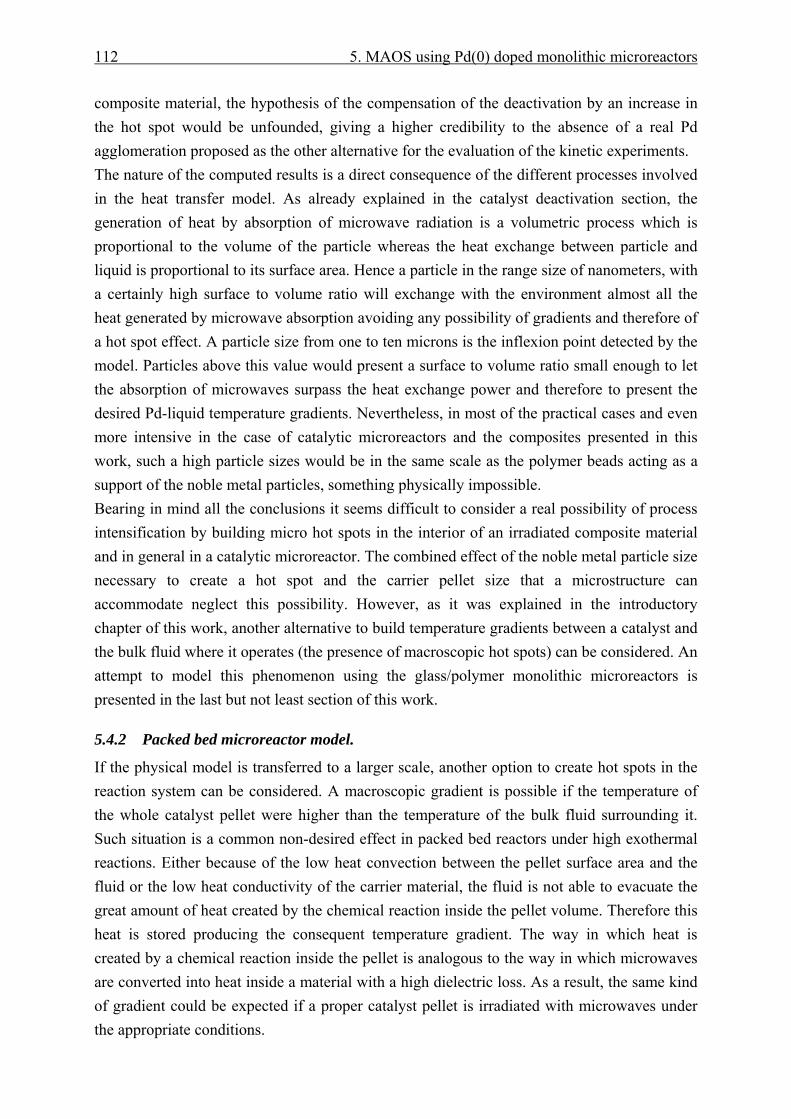
112 5. MAOS using Pd(0) doped monolithic microreactors
composite material, the hypothesis of the compensation of the deactivation by an increase in the hot spot would be unfounded, giving a higher credibility to the absence of a real Pd agglomeration proposed as the other alternative for the evaluation of the kinetic experiments. The nature of the computed results is a direct consequence of the different processes involved in the heat transfer model. As already explained in the catalyst deactivation section, the generation of heat by absorption of microwave radiation is a volumetric process which is proportional to the volume of the particle whereas the heat exchange between particle and liquid is proportional to its surface area. Hence a particle in the range size of nanometers, with a certainly high surface to volume ratio will exchange with the environment almost all the heat generated by microwave absorption avoiding any possibility of gradients and therefore of a hot spot effect. A particle size from one to ten microns is the inflexion point detected by the model. Particles above this value would present a surface to volume ratio small enough to let the absorption of microwaves surpass the heat exchange power and therefore to present the desired Pd-liquid temperature gradients. Nevertheless, in most of the practical cases and even more intensive in the case of catalytic microreactors and the composites presented in this work, such a high particle sizes would be in the same scale as the polymer beads acting as a support of the noble metal particles, something physically impossible. Bearing in mind all the conclusions it seems difficult to consider a real possibility of process intensification by building micro hot spots in the interior of an irradiated composite material and in general in a catalytic microreactor. The combined effect of the noble metal particle size necessary to create a hot spot and the carrier pellet size that a microstructure can accommodate neglect this possibility. However, as it was explained in the introductory chapter of this work, another alternative to build temperature gradients between a catalyst and the bulk fluid where it operates (the presence of macroscopic hot spots) can be considered. An attempt to model this phenomenon using the glass/polymer monolithic microreactors is presented in the last but not least section of this work.
5.4.2 Packed bed microreactor model.
If the physical model is transferred to a larger scale, another option to create hot spots in the reaction system can be considered. A macroscopic gradient is possible if the temperature of the whole catalyst pellet were higher than the temperature of the bulk fluid surrounding it. Such situation is a common non-desired effect in packed bed reactors under high exothermal reactions. Either because of the low heat convection between the pellet surface area and the fluid or the low heat conductivity of the carrier material, the fluid is not able to evacuate the great amount of heat created by the chemical reaction inside the pellet volume. Therefore this heat is stored producing the consequent temperature gradient. The way in which heat is created by a chemical reaction inside the pellet is analogous to the way in which microwaves are converted into heat inside a material with a high dielectric loss. As a result, the same kind of gradient could be expected if a proper catalyst pellet is irradiated with microwaves under the appropriate conditions.
Chapter 5. MAOS using Pd(0) doped monolithic microreactors 113
Several authors reported experimental reaction rate enhancements produced by the microwave irradiation of packed beds of different catalysts like noble metal supported catalysts /ZHA03-3/, /BUC06/, NaX zeolites /BUC06/ and montmorillonite KSF /CHE96/. All the examples reported have a common characteristic, the presence of groups inside the catalyst pellet with a high dielectric loss and a big pellet size (from some hundreds of microns to the millimetre range). In a big particle the conduction of the heat dissipated inside the pellet to the surface could be hindered, producing the storage of energy inside the particle and therefore a temperature gradient between the bulk liquid and the catalysts centres. This hot-spots are a common non-desired effect in state-of the art packed bed reactors under high exothermal reactions and as explained in the introductory chapter of this work, is mainly considered as responsible of the rate enhancements produced in microwave assisted heterogeneous catalytic reactions. The relation between the pellet size and the presence of a hot-spot effect in an irradiated catalyst were supported by experimental results showing how the same reaction enhancement previously measured under a microwave operation was avoided by the reduction in the pellet size /BUC06/ or by the substitution of the heterogeneous catalyst for a homogeneous one /CHE96/. If the last conclusions are assessed, it seems difficult again to imagine the possibility to combine the advantages of microreaction technology, a heterogeneous catalyst and microwave radiation as a way of reaction process intensification. The small particle size of the catalysts necessary to fit inside capillaries and microchannels would restrict the production of any temperature gradient. Nevertheless some authors have already reported experimental results which could prove the feasibility to combine the advantages of all these technologies /HEP04-01/, /HEP04-02/, /BAX06/. From the theoretical point of view, only Thomas Jr. /THO00/ modelled the behaviour of packed bed reactors under microwave irradiation. But again the approach followed considered reactors in the size scale of some centimetres and 3mm α-Al2O3 pellets containing dispersed Pd nanoparticles. Up to date no literature was found dealing with the modelling of an irradiated microreaction system. Two objectives were in the focus of this part of the work: 1. to obtain a first approach of a model able to describe the situation inside polymer/glass
composite materials under microwave irradiation. Using this tool the presence or not of hot spots in the materials produced in this work could be supported.
2. to revise which parameters influence in a higher extent the creation of gradients between the catalyst pellets and the bulk liquid in monolithic microreactors.
5.4.2.1 Model description
The fractal configuration with interconnected channels of the glass carrier use in the preparation of the composites produces an almost ideal plug flow behaviour if a liquid is forced to flow through its structure. Due to this conclusion, obtained by Schönfeld /SCH05/ after the experimental residence time distribution obtained using monolithic rod shaped microreactors, the comparison of the composite pores with a tubular reactor can be accepted.
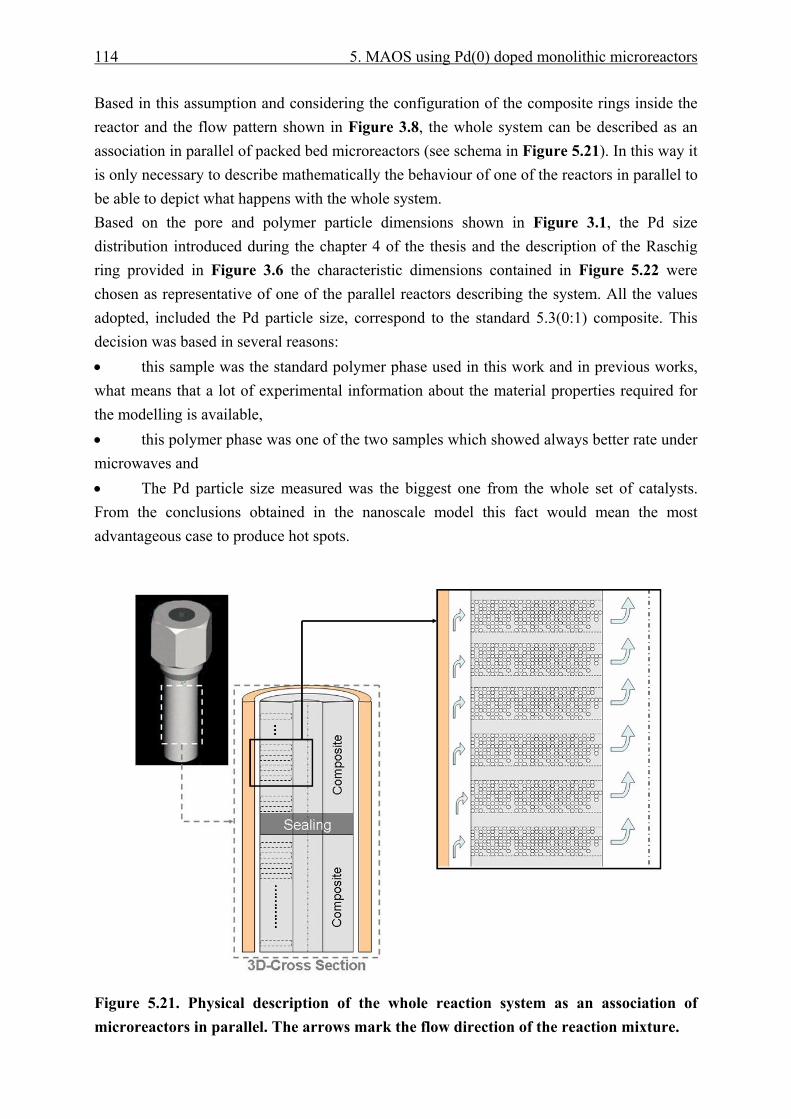
114 5. MAOS using Pd(0) doped monolithic microreactors
Based in this assumption and considering the configuration of the composite rings inside the reactor and the flow pattern shown in Figure 3.8, the whole system can be described as an association in parallel of packed bed microreactors (see schema in Figure 5.21). In this way it is only necessary to describe mathematically the behaviour of one of the reactors in parallel to be able to depict what happens with the whole system. Based on the pore and polymer particle dimensions shown in Figure 3.1, the Pd size distribution introduced during the chapter 4 of the thesis and the description of the Raschig ring provided in Figure 3.6 the characteristic dimensions contained in Figure 5.22 were chosen as representative of one of the parallel reactors describing the system. All the values adopted, included the Pd particle size, correspond to the standard 5.3(0:1) composite. This decision was based in several reasons: • this sample was the standard polymer phase used in this work and in previous works, what means that a lot of experimental information about the material properties required for the modelling is available, • this polymer phase was one of the two samples which showed always better rate under microwaves and • The Pd particle size measured was the biggest one from the whole set of catalysts. From the conclusions obtained in the nanoscale model this fact would mean the most advantageous case to produce hot spots.
Figure 5.21. Physical description of the whole reaction system as an association of microreactors in parallel. The arrows mark the flow direction of the reaction mixture.
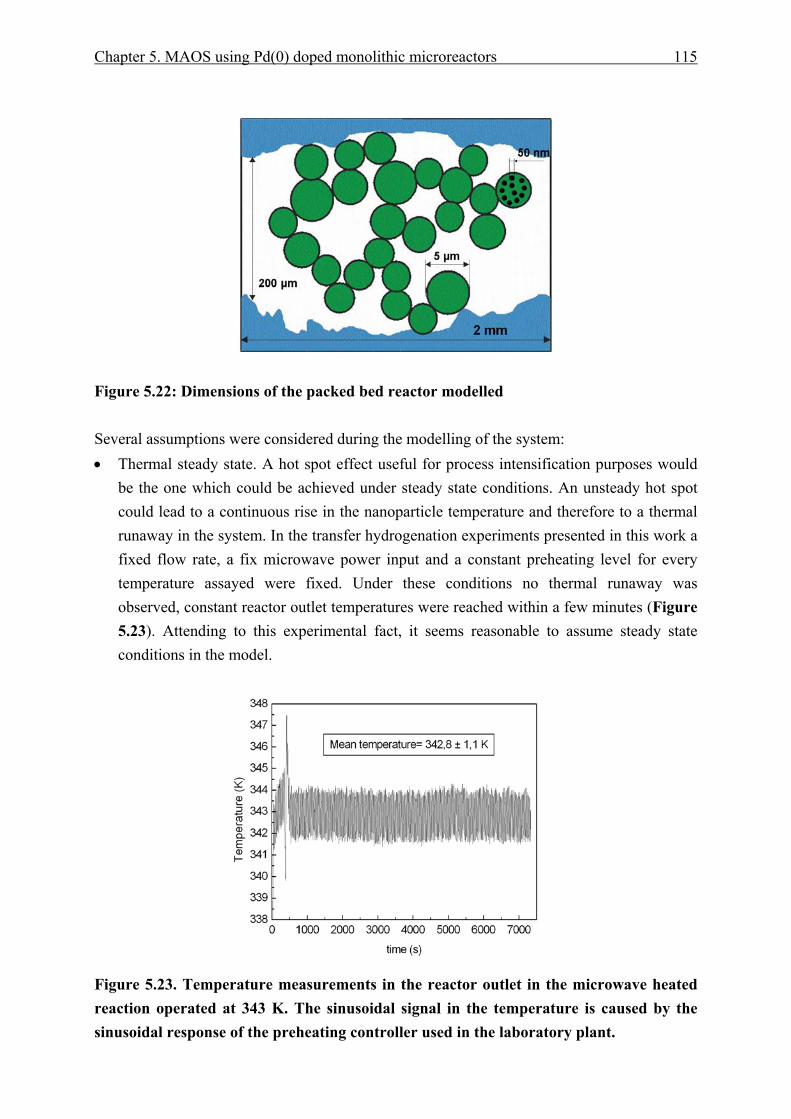
Chapter 5. MAOS using Pd(0) doped monolithic microreactors 115
Figure 5.22: Dimensions of the packed bed reactor modelled Several assumptions were considered during the modelling of the system: • Thermal steady state. A hot spot effect useful for process intensification purposes would
be the one which could be achieved under steady state conditions. An unsteady hot spot could lead to a continuous rise in the nanoparticle temperature and therefore to a thermal runaway in the system. In the transfer hydrogenation experiments presented in this work a fixed flow rate, a fix microwave power input and a constant preheating level for every temperature assayed were fixed. Under these conditions no thermal runaway was observed, constant reactor outlet temperatures were reached within a few minutes (Figure 5.23). Attending to this experimental fact, it seems reasonable to assume steady state conditions in the model.
Figure 5.23. Temperature measurements in the reactor outlet in the microwave heated reaction operated at 343 K. The sinusoidal signal in the temperature is caused by the sinusoidal response of the preheating controller used in the laboratory plant.

116 5. MAOS using Pd(0) doped monolithic microreactors
• No temperature gradients inside the polymer and the Pd particles. In both cases the Biot number is much smaller than unity. A direct consequence is the selection of the continuous solid phase model developed by Schlünder and Tsotsas /SCH88/.
• Adiabatic reactor. The hypothetical parallel reactors would operate at the same temperature being separated by a thin layer of the glass material composing the carrier. Therefore, no thermal gradients between them are considered and as a result the heat flow through the reactor wall was neglected. As a consequence the radial dispersion is not considered and the system is converted to an onedimensional model, varying with the axial coordinate.
• Axial dispersion is neglected. Even though the Pe number is small, this assumption is justified due to the small axial diffusion length of the reactor and the short experimental residence time used (0,8 s).
• The polymer is considered as a whole particle. From the point of view of the heat exchange between polymer and bulk liquid the sum of the polymer phase, the liquid contained in the particle by swelling and the Pd nanoparticles embedded on it are considered as an individual material.
• Isolation of the Pd particles from the bulk liquid. No contact between the isolated nanoparticles and the bulk liquid flowing through the interstices of the bed is considered since the metal particles are embedded inside the polymer phase. The thermal isolation does not mean that the reactants cannot come into contact with the active sites, the swollen polymer allows the diffusion of the reactants through its structure using the liquid contained in the crosslinked net as the transport media. As a result, the Pd particle only exchanges heat with the swollen polymer.
• No contribution of the reaction enthalpy to the heat balance is considered. Calculations of the adiabatic temperature difference reached in the experimental reactor showed a value in the range of 10-2 K.
• All physical properties are considered independent of the temperature if a small range is considered.
Based on the above assumptions adopted and following the description of a continuous solid phase model, a general energy balance can be defined for each component of the system (Figure 5.24). In order to convert this qualitative description into a mathematical one a control volume for each material must be defined. In Figure 5.25 the different control volumes for each of the system components (bulk liquid, polymer phase and Pd nanoparticles) are shown, including the mathematical expressions representing the different terms included in the general energy balance.
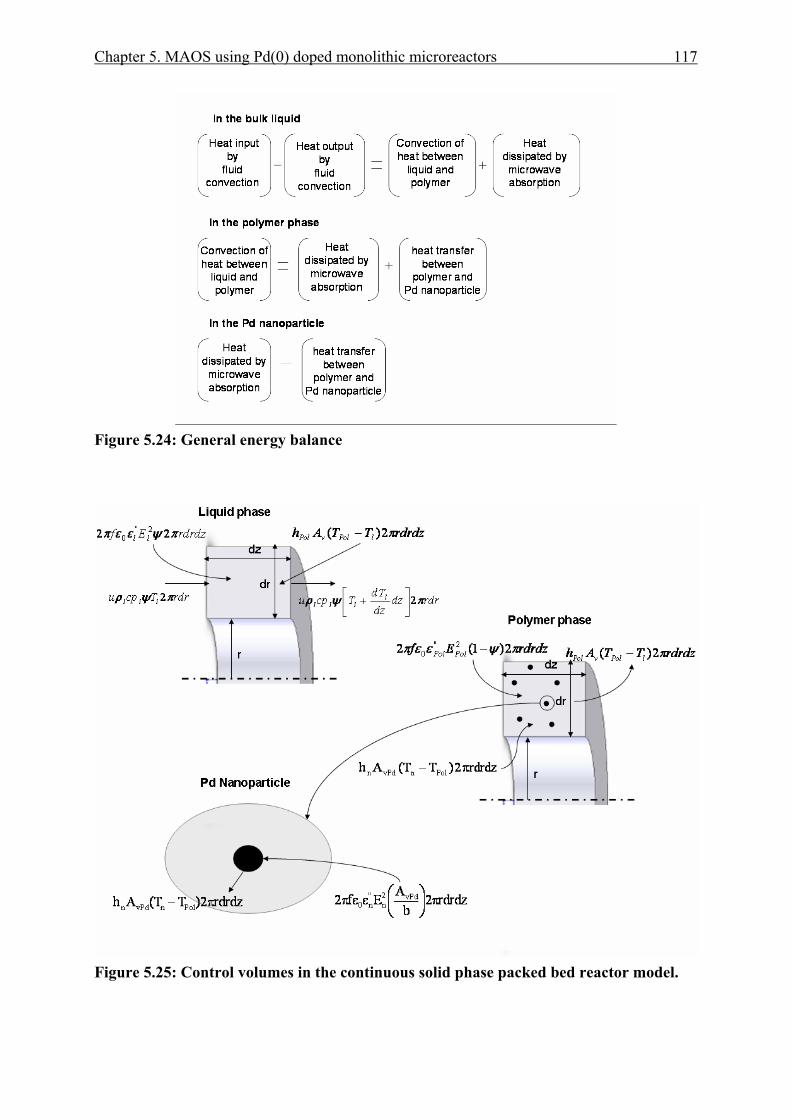
Chapter 5. MAOS using Pd(0) doped monolithic microreactors 117
Figure 5.24: General energy balance
Figure 5.25: Control volumes in the continuous solid phase packed bed reactor model.

118 5. MAOS using Pd(0) doped monolithic microreactors
If the different terms contained in Figure 5.25 are grouped following an energy balance for each of the components, a system of three equations can be defined:
)TT(Ah)1(Ef2)TT(Avh PolnvPdn2Pol
"Pol0lPolPol −⋅⋅+ψ−⋅⋅ε⋅ε⋅⋅π=−⋅⋅
(5.42)
These three equations are coupled by the terms of heat exchange between the polymer and the bulk liquid as well as by the exchange between polymer and palladium nanoparticles. To solve the only differential equation included in the system (5.41), boundary conditions have to be defined. In this case the temperature of the liquid at the reactor outlet (To) was fixed in order to have a reference value comparable with the only variable experimentally accessible (as already explained in the description of the microwave laboratory plant, the temperature T1 measured using the fibre optic sensor was assumed as the reactor outlet To). To obtain a comparison with the hot spot effect calculated using the deactivation factor a value of 360 K was set.
Z = 0 Tl(z)=To,exp
z = -Lreactor Tl(z)= Ti,mod (5.44)
Solving the differential equation for the liquid (5.41) and substituting the value of Tl obtained in the other two equations, three linear axial temperature profiles, one for each of the system components, were obtained.
z1AT)z(T Ol ⋅−=
(5.45)
2A)z(T)z(T lPol +=
(5.46)
3A)z(T)z(T Poln +=
(5.47) where
( ) ⎥⎦
⎤⎢⎣
⎡⎟⎠
⎞⎜⎝
⎛⋅⋅ε+ψ−⋅⋅ε+ψ⋅⋅ε⋅⋅ρ⋅ε⋅⋅π
=b
AE1EE
cpuf2
1A VPd2n
"n
2Pol
"Pol
2l
"l
ll0
0
(5.48)
)TT(AhEf2dzdTcpu lPolvPol
2l
"l0
lll −⋅⋅+ψ⋅⋅ε⋅ε⋅⋅π=⋅ψ⋅⋅ρ⋅ (5.41)
bA
Ef2)TT(Ah vPd2n
"n0PolnvPdn ⋅⋅ε⋅ε⋅⋅π=−⋅⋅ (5.43)
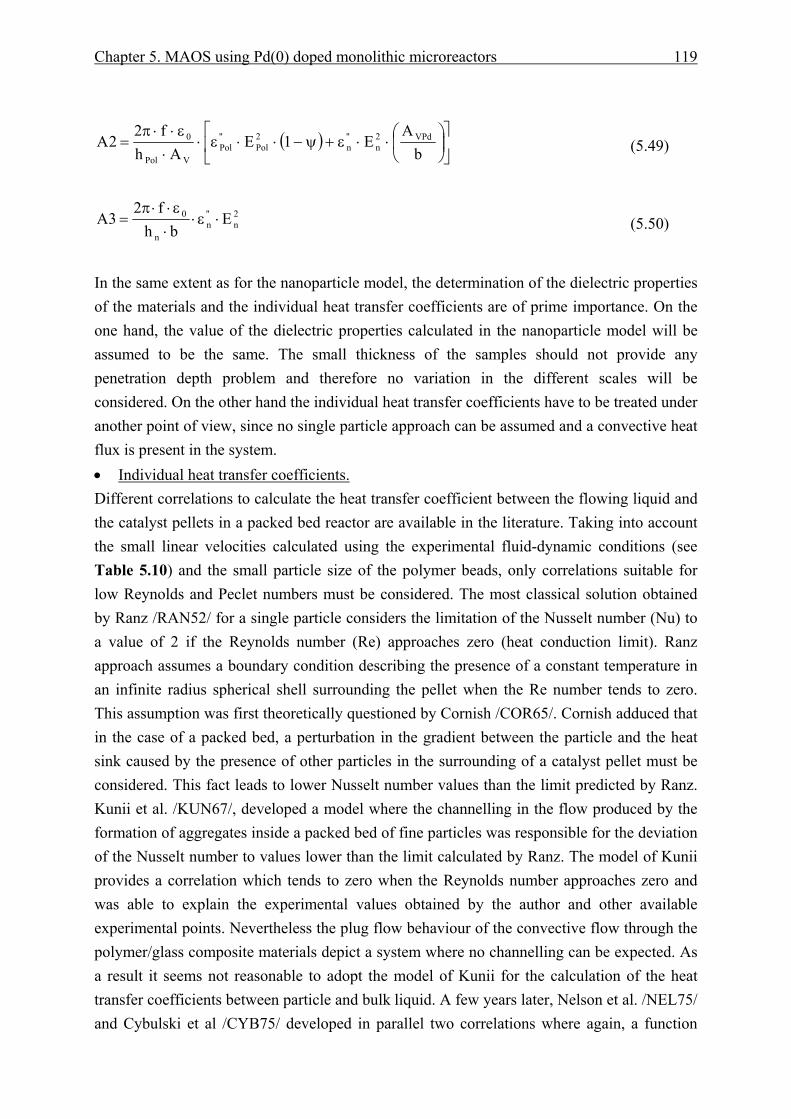
Chapter 5. MAOS using Pd(0) doped monolithic microreactors 119
( ) ⎥⎦
⎤⎢⎣
⎡⎟⎠
⎞⎜⎝
⎛⋅⋅ε+ψ−⋅⋅ε⋅⋅ε⋅⋅π
=b
AE1E
Ahf2
2A VPd2n
"n
2Pol
"Pol
VPol
0
(5.49)
2n
"n
n
0 Ebh
f23A ⋅ε⋅
⋅ε⋅⋅π
=
(5.50)
In the same extent as for the nanoparticle model, the determination of the dielectric properties of the materials and the individual heat transfer coefficients are of prime importance. On the one hand, the value of the dielectric properties calculated in the nanoparticle model will be assumed to be the same. The small thickness of the samples should not provide any penetration depth problem and therefore no variation in the different scales will be considered. On the other hand the individual heat transfer coefficients have to be treated under another point of view, since no single particle approach can be assumed and a convective heat flux is present in the system. • Individual heat transfer coefficients. Different correlations to calculate the heat transfer coefficient between the flowing liquid and the catalyst pellets in a packed bed reactor are available in the literature. Taking into account the small linear velocities calculated using the experimental fluid-dynamic conditions (see Table 5.10) and the small particle size of the polymer beads, only correlations suitable for low Reynolds and Peclet numbers must be considered. The most classical solution obtained by Ranz /RAN52/ for a single particle considers the limitation of the Nusselt number (Nu) to a value of 2 if the Reynolds number (Re) approaches zero (heat conduction limit). Ranz approach assumes a boundary condition describing the presence of a constant temperature in an infinite radius spherical shell surrounding the pellet when the Re number tends to zero. This assumption was first theoretically questioned by Cornish /COR65/. Cornish adduced that in the case of a packed bed, a perturbation in the gradient between the particle and the heat sink caused by the presence of other particles in the surrounding of a catalyst pellet must be considered. This fact leads to lower Nusselt number values than the limit predicted by Ranz. Kunii et al. /KUN67/, developed a model where the channelling in the flow produced by the formation of aggregates inside a packed bed of fine particles was responsible for the deviation of the Nusselt number to values lower than the limit calculated by Ranz. The model of Kunii provides a correlation which tends to zero when the Reynolds number approaches zero and was able to explain the experimental values obtained by the author and other available experimental points. Nevertheless the plug flow behaviour of the convective flow through the polymer/glass composite materials depict a system where no channelling can be expected. As a result it seems not reasonable to adopt the model of Kunii for the calculation of the heat transfer coefficients between particle and bulk liquid. A few years later, Nelson et al. /NEL75/ and Cybulski et al /CYB75/ developed in parallel two correlations where again, a function
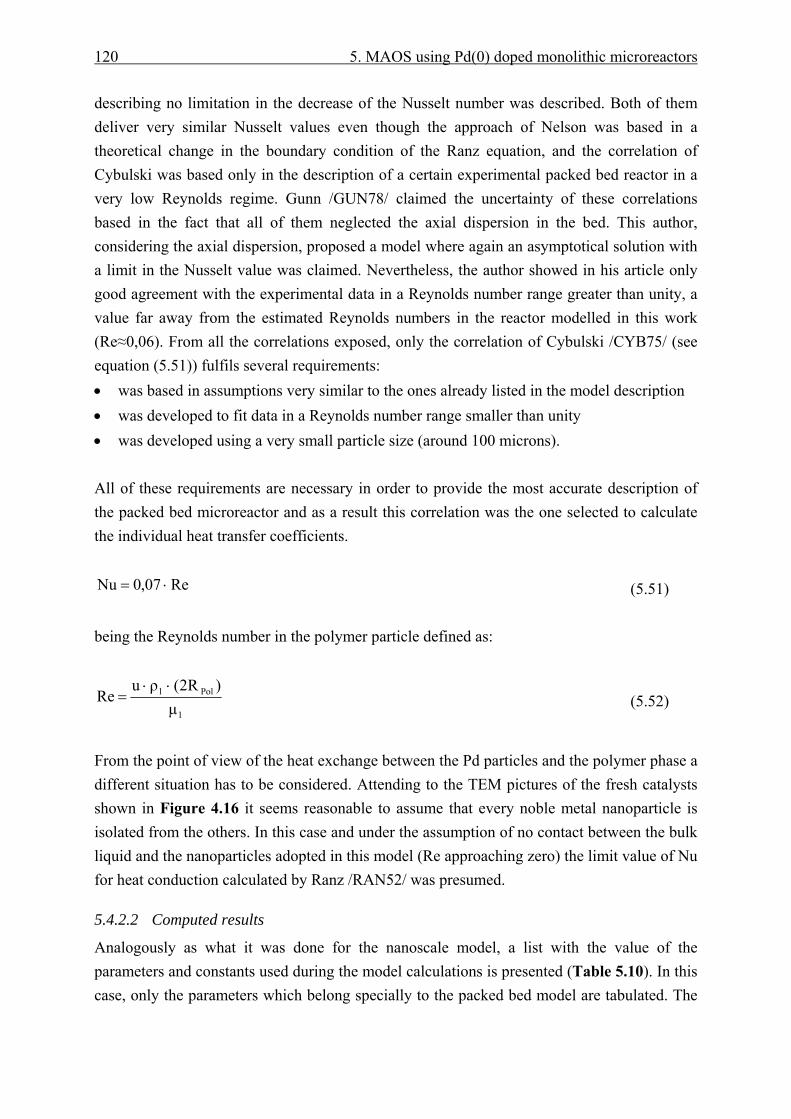
120 5. MAOS using Pd(0) doped monolithic microreactors
describing no limitation in the decrease of the Nusselt number was described. Both of them deliver very similar Nusselt values even though the approach of Nelson was based in a theoretical change in the boundary condition of the Ranz equation, and the correlation of Cybulski was based only in the description of a certain experimental packed bed reactor in a very low Reynolds regime. Gunn /GUN78/ claimed the uncertainty of these correlations based in the fact that all of them neglected the axial dispersion in the bed. This author, considering the axial dispersion, proposed a model where again an asymptotical solution with a limit in the Nusselt value was claimed. Nevertheless, the author showed in his article only good agreement with the experimental data in a Reynolds number range greater than unity, a value far away from the estimated Reynolds numbers in the reactor modelled in this work (Re≈0,06). From all the correlations exposed, only the correlation of Cybulski /CYB75/ (see equation (5.51)) fulfils several requirements: • was based in assumptions very similar to the ones already listed in the model description • was developed to fit data in a Reynolds number range smaller than unity • was developed using a very small particle size (around 100 microns). All of these requirements are necessary in order to provide the most accurate description of the packed bed microreactor and as a result this correlation was the one selected to calculate the individual heat transfer coefficients.
Re07,0Nu ⋅=
(5.51) being the Reynolds number in the polymer particle defined as:
l
Poll
μ)R2(ρu
Re⋅⋅
=
(5.52)
From the point of view of the heat exchange between the Pd particles and the polymer phase a different situation has to be considered. Attending to the TEM pictures of the fresh catalysts shown in Figure 4.16 it seems reasonable to assume that every noble metal nanoparticle is isolated from the others. In this case and under the assumption of no contact between the bulk liquid and the nanoparticles adopted in this model (Re approaching zero) the limit value of Nu for heat conduction calculated by Ranz /RAN52/ was presumed.
5.4.2.2 Computed results
Analogously as what it was done for the nanoscale model, a list with the value of the parameters and constants used during the model calculations is presented (Table 5.10). In this case, only the parameters which belong specially to the packed bed model are tabulated. The
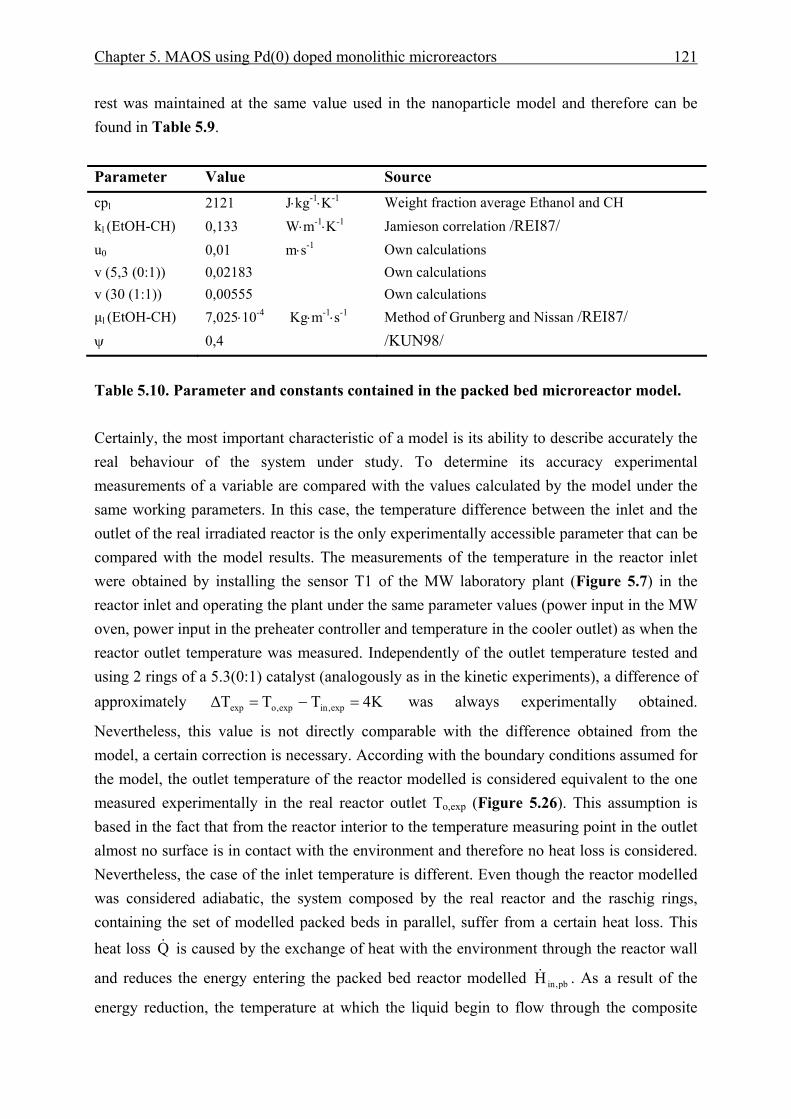
Chapter 5. MAOS using Pd(0) doped monolithic microreactors 121
rest was maintained at the same value used in the nanoparticle model and therefore can be found in Table 5.9. Parameter Value Source cpl 2121 J⋅kg-1⋅K-1 Weight fraction average Ethanol and CH kl (EtOH-CH) 0,133 W⋅m-1⋅K-1 Jamieson correlation /REI87/ u0 0,01 m⋅s-1 Own calculations v (5,3 (0:1)) 0,02183 Own calculations v (30 (1:1)) 0,00555 Own calculations μl (EtOH-CH) 7,025⋅10-4 Kg⋅m-1⋅s-1 Method of Grunberg and Nissan /REI87/ ψ 0,4 /KUN98/ Table 5.10. Parameter and constants contained in the packed bed microreactor model. Certainly, the most important characteristic of a model is its ability to describe accurately the real behaviour of the system under study. To determine its accuracy experimental measurements of a variable are compared with the values calculated by the model under the same working parameters. In this case, the temperature difference between the inlet and the outlet of the real irradiated reactor is the only experimentally accessible parameter that can be compared with the model results. The measurements of the temperature in the reactor inlet were obtained by installing the sensor T1 of the MW laboratory plant (Figure 5.7) in the reactor inlet and operating the plant under the same parameter values (power input in the MW oven, power input in the preheater controller and temperature in the cooler outlet) as when the reactor outlet temperature was measured. Independently of the outlet temperature tested and using 2 rings of a 5.3(0:1) catalyst (analogously as in the kinetic experiments), a difference of approximately K4TTTΔ exp,inexp,oexp =−= was always experimentally obtained.
Nevertheless, this value is not directly comparable with the difference obtained from the model, a certain correction is necessary. According with the boundary conditions assumed for the model, the outlet temperature of the reactor modelled is considered equivalent to the one measured experimentally in the real reactor outlet To,exp (Figure 5.26). This assumption is based in the fact that from the reactor interior to the temperature measuring point in the outlet almost no surface is in contact with the environment and therefore no heat loss is considered. Nevertheless, the case of the inlet temperature is different. Even though the reactor modelled was considered adiabatic, the system composed by the real reactor and the raschig rings, containing the set of modelled packed beds in parallel, suffer from a certain heat loss. This
heat loss Q& is caused by the exchange of heat with the environment through the reactor wall
and reduces the energy entering the packed bed reactor modelled pb,inH& . As a result of the
energy reduction, the temperature at which the liquid begin to flow through the composite
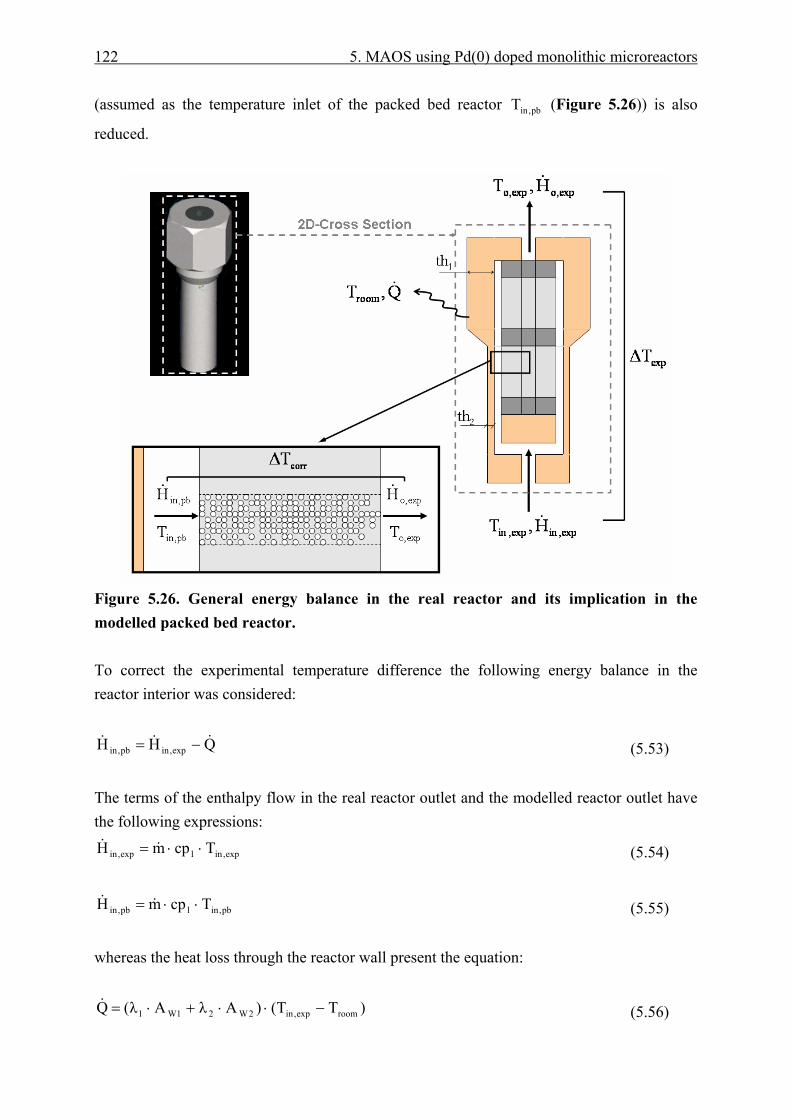
122 5. MAOS using Pd(0) doped monolithic microreactors
(assumed as the temperature inlet of the packed bed reactor pb,inT (Figure 5.26)) is also
reduced.
Figure 5.26. General energy balance in the real reactor and its implication in the modelled packed bed reactor. To correct the experimental temperature difference the following energy balance in the reactor interior was considered:
QHH exp,inpb,in&&& −=
(5.53)
The terms of the enthalpy flow in the real reactor outlet and the modelled reactor outlet have the following expressions:
exp,inlexp,in TcpmH ⋅⋅= &&
(5.54)
pb,inlpb,in TcpmH ⋅⋅= &&
(5.55)
whereas the heat loss through the reactor wall present the equation:
)TT()AλAλ(Q roomexp,in2W21W1 −⋅⋅+⋅=&
(5.56)
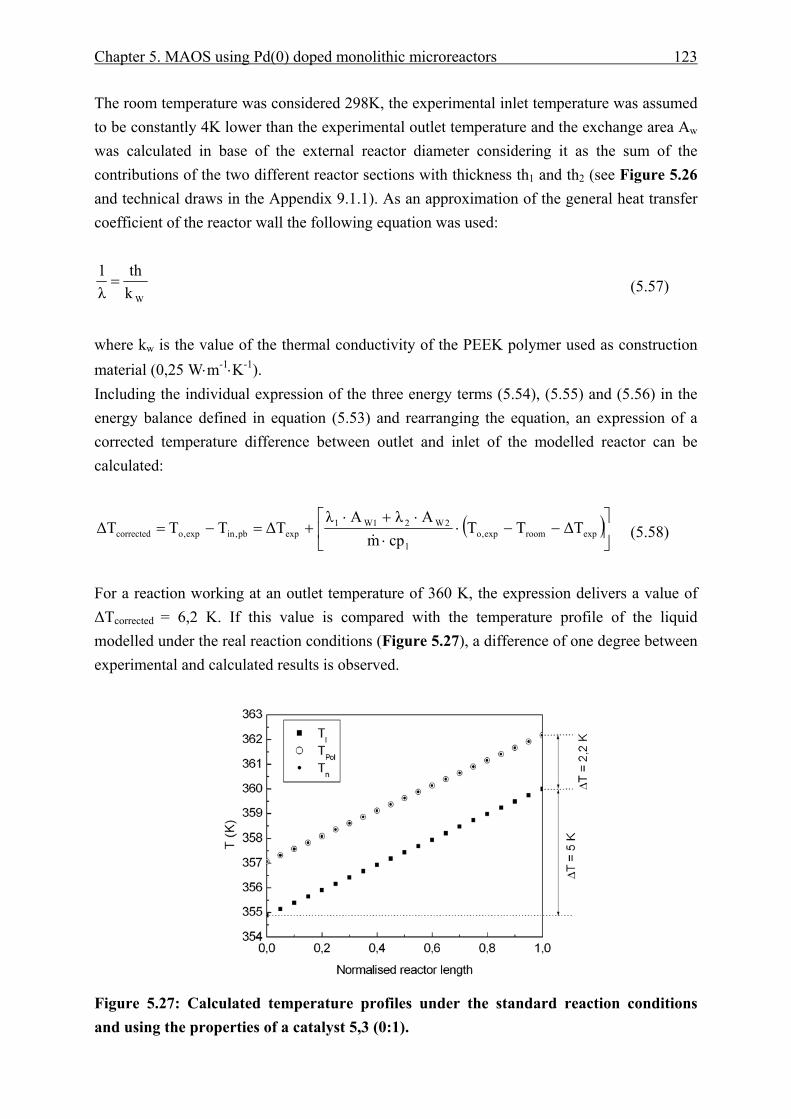
Chapter 5. MAOS using Pd(0) doped monolithic microreactors 123
The room temperature was considered 298K, the experimental inlet temperature was assumed to be constantly 4K lower than the experimental outlet temperature and the exchange area Aw was calculated in base of the external reactor diameter considering it as the sum of the contributions of the two different reactor sections with thickness th1 and th2 (see Figure 5.26 and technical draws in the Appendix 9.1.1). As an approximation of the general heat transfer coefficient of the reactor wall the following equation was used:
Wkth
λ1=
(5.57)
where kw is the value of the thermal conductivity of the PEEK polymer used as construction material (0,25 W⋅m-1⋅K-1). Including the individual expression of the three energy terms (5.54), (5.55) and (5.56) in the energy balance defined in equation (5.53) and rearranging the equation, an expression of a corrected temperature difference between outlet and inlet of the modelled reactor can be calculated:
( )⎥⎦
⎤⎢⎣
⎡−−⋅
⋅⋅+⋅
+=−= exproomexp,ol
2W21W1exppb,inexp,ocorrected TΔTT
cpmAλAλ
TΔTTTΔ&
(5.58)
For a reaction working at an outlet temperature of 360 K, the expression delivers a value of ΔTcorrected = 6,2 K. If this value is compared with the temperature profile of the liquid modelled under the real reaction conditions (Figure 5.27), a difference of one degree between experimental and calculated results is observed.
Figure 5.27: Calculated temperature profiles under the standard reaction conditions and using the properties of a catalyst 5,3 (0:1).
124 5. MAOS using Pd(0) doped monolithic microreactors
Taking into account the narrow range of temperatures differences achieved in the real reactor and the fluctuations introduced by the preheater controller in the temperature measurements (around 1K as exposed in Figure 5.23) it can be assumed that the model describes with a reasonable accuracy the thermal behaviour of the real reactor. Considering the computed models shown in Figure 5.27, two general conclusions are proposed. On the one hand no difference between the temperature profiles of the polymer phase and the Pd nanoparticles is observed (thwe temperature profiles of both materials are overlapped). Due to the high value of the heat transfer coefficient between polymer and nanoparticles (≈ 5⋅106 W⋅m-2⋅K-1) and the isolation of the Pd nanoparticles from the bulk liquid assumed in the model, the whole heat produced in the noble metal is transferred to the polymer phase until the thermal equilibrium is reached. On the other hand, the small value of the heat transfer coefficient between polymer and the bulk liquid (≈ 102 W⋅m-2⋅K-1) is the main responsible for the gradient observed between both of them. Only a part of the heat stored in the polymer (heat generated by self-microwave absorption and by exchange with the Pd nanoparticles embedded) is transferred to the liquid phase. A gradient of 2.2 K is the computed value from the model. This value is clearly closer to the hot spot obtained using the kinetic approach, which fluctuated between zero and 4 K, than to the calculated value using the deactivation factor (11 K). Moreover and in accordance with the nanoparticle model, no sensibility to the Pd particles size in a range of unities to hundreds of nanometers (range of particle size in the deactivated catalysts according to Figure 5.14) was shown by the model. Changes in this parameter delivered no variations of any of the gradients considered. As a result, an increase in the Pd size caused by an agglomeration would be only responsible of a decrease in the rate by a drop in the catalytic surface area and not of any improvement in the conversion caused by an enhancement of the hot spot effect. The black curve in Figure 5.16 would be actually flat and experimentally a smaller slope of the microwave heated experiments than the experiments under traditional heating in Figure 5.12 should have been measured. With the aim to verify if these conclusions are applicable to the composite 30 (1:1) the packed bed model was modified by including several changes in the material properties: • the amount of palladium was set to a new value according with Table 5.2 • the Pd particle size was set at 6,5 nm as it is reflected in the size distribution shown in
Figure 4.27. • In principle the polymer polarity changes with the DVB content but even more with the
presence of styrene in the polymer structure. As a result the value of the dielectric loss ε”Pol can be expected to be modified. However, during the testing phase of the model it was realised that the system is almost insensitive to changes in this variable. Thereby it seemed acceptable to keep this parameter constant.
• Due to the different crosslinking degree the polymer phase changes its swelling properties. A reduction in the swelling percentage from 100% to 5% was measured by Schönfeld
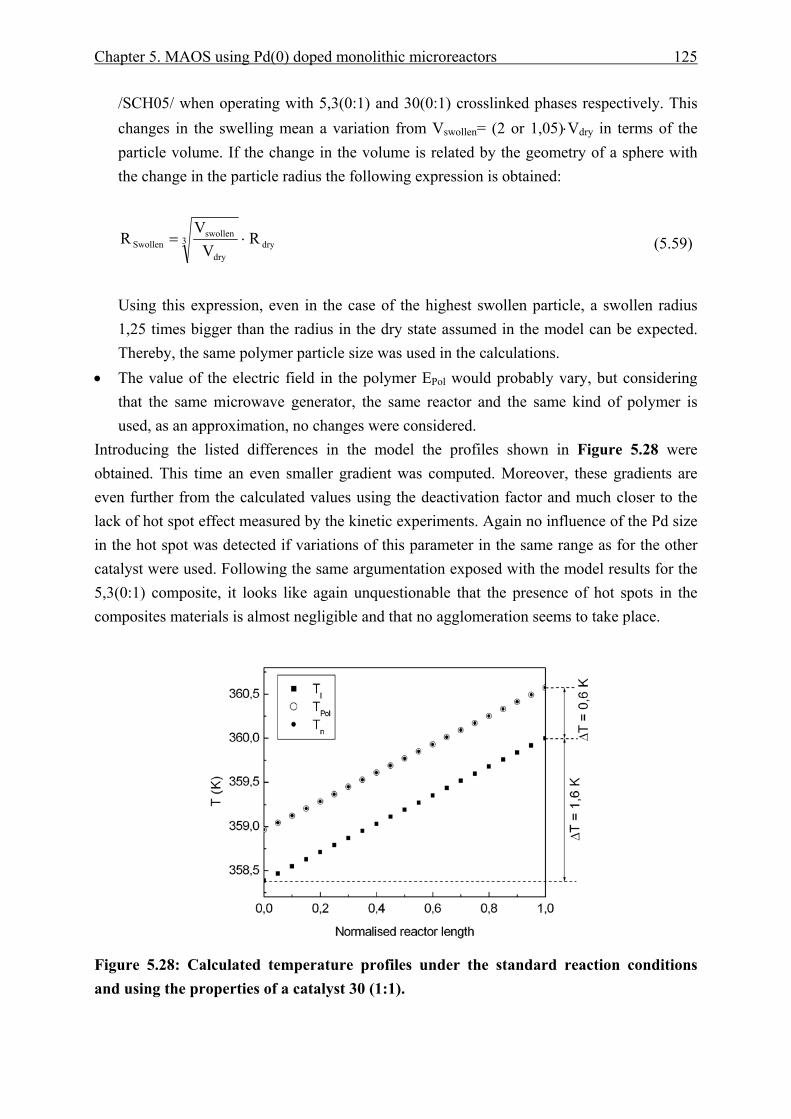
Chapter 5. MAOS using Pd(0) doped monolithic microreactors 125
/SCH05/ when operating with 5,3(0:1) and 30(0:1) crosslinked phases respectively. This changes in the swelling mean a variation from Vswollen= (2 or 1,05)⋅Vdry in terms of the particle volume. If the change in the volume is related by the geometry of a sphere with the change in the particle radius the following expression is obtained:
dry3
dry
swollenSwollen R
VV
R ⋅=
(5.59)
Using this expression, even in the case of the highest swollen particle, a swollen radius 1,25 times bigger than the radius in the dry state assumed in the model can be expected. Thereby, the same polymer particle size was used in the calculations.
• The value of the electric field in the polymer EPol would probably vary, but considering that the same microwave generator, the same reactor and the same kind of polymer is used, as an approximation, no changes were considered.
Introducing the listed differences in the model the profiles shown in Figure 5.28 were obtained. This time an even smaller gradient was computed. Moreover, these gradients are even further from the calculated values using the deactivation factor and much closer to the lack of hot spot effect measured by the kinetic experiments. Again no influence of the Pd size in the hot spot was detected if variations of this parameter in the same range as for the other catalyst were used. Following the same argumentation exposed with the model results for the 5,3(0:1) composite, it looks like again unquestionable that the presence of hot spots in the composites materials is almost negligible and that no agglomeration seems to take place.
Figure 5.28: Calculated temperature profiles under the standard reaction conditions and using the properties of a catalyst 30 (1:1).
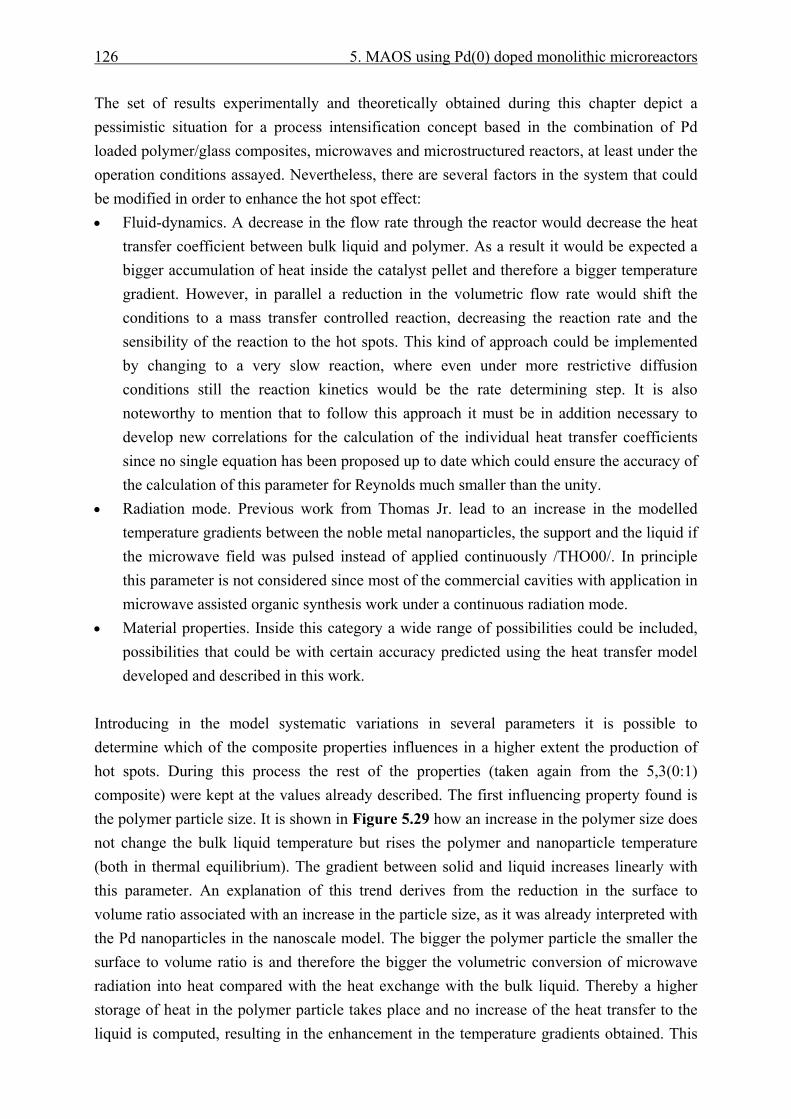
126 5. MAOS using Pd(0) doped monolithic microreactors
The set of results experimentally and theoretically obtained during this chapter depict a pessimistic situation for a process intensification concept based in the combination of Pd loaded polymer/glass composites, microwaves and microstructured reactors, at least under the operation conditions assayed. Nevertheless, there are several factors in the system that could be modified in order to enhance the hot spot effect: • Fluid-dynamics. A decrease in the flow rate through the reactor would decrease the heat
transfer coefficient between bulk liquid and polymer. As a result it would be expected a bigger accumulation of heat inside the catalyst pellet and therefore a bigger temperature gradient. However, in parallel a reduction in the volumetric flow rate would shift the conditions to a mass transfer controlled reaction, decreasing the reaction rate and the sensibility of the reaction to the hot spots. This kind of approach could be implemented by changing to a very slow reaction, where even under more restrictive diffusion conditions still the reaction kinetics would be the rate determining step. It is also noteworthy to mention that to follow this approach it must be in addition necessary to develop new correlations for the calculation of the individual heat transfer coefficients since no single equation has been proposed up to date which could ensure the accuracy of the calculation of this parameter for Reynolds much smaller than the unity.
• Radiation mode. Previous work from Thomas Jr. lead to an increase in the modelled temperature gradients between the noble metal nanoparticles, the support and the liquid if the microwave field was pulsed instead of applied continuously /THO00/. In principle this parameter is not considered since most of the commercial cavities with application in microwave assisted organic synthesis work under a continuous radiation mode.
• Material properties. Inside this category a wide range of possibilities could be included, possibilities that could be with certain accuracy predicted using the heat transfer model developed and described in this work.
Introducing in the model systematic variations in several parameters it is possible to determine which of the composite properties influences in a higher extent the production of hot spots. During this process the rest of the properties (taken again from the 5,3(0:1) composite) were kept at the values already described. The first influencing property found is the polymer particle size. It is shown in Figure 5.29 how an increase in the polymer size does not change the bulk liquid temperature but rises the polymer and nanoparticle temperature (both in thermal equilibrium). The gradient between solid and liquid increases linearly with this parameter. An explanation of this trend derives from the reduction in the surface to volume ratio associated with an increase in the particle size, as it was already interpreted with the Pd nanoparticles in the nanoscale model. The bigger the polymer particle the smaller the surface to volume ratio is and therefore the bigger the volumetric conversion of microwave radiation into heat compared with the heat exchange with the bulk liquid. Thereby a higher storage of heat in the polymer particle takes place and no increase of the heat transfer to the liquid is computed, resulting in the enhancement in the temperature gradients obtained. This
Chapter 5. MAOS using Pd(0) doped monolithic microreactors 127
result is in agreement with the interpretation of the experimental results using macroscopic reactors given by Chapados /BUC06/ and Chemat /CHE96/ and would be among others a possible explanation of the microwave rate enhancement using capillary reactors and some microdevices observed from other researching groups /HEP04-01/, /HEP04-02/ and /BAX06/. In all these works catalyst particles in a range of 50 to 400 microns were used. An increase in the polymer particle is not an easy task under the precipitation polymerisation method applied in the production of the polymer-glass composite materials. Some previous work tried several strategies to control the polymer size obtained. Either regulating the concentration of initiator or by addition of chain transfer agents in the polymerisation mixture it was possible to increase its value in some microns but loosing other properties like the connectivity between polymer particles which provide them with mechanical stability /KUN98/. In adittion, a quite bigger variation than some microns would be necessary to reach a considerable hot spot value due to the linear dependence between polymer size and hot spot effect. On the other it should be considered that only a limited size increase would be affordable without decreasing the efficiency factor of the catalyst by the increase in the intraparticle diffusion /SCH05/.
Figure 5.29: Variation of the computed temperature profiles at three different polymer particle sizes and a fixed Pd charge of 4%wt. The second parameter is the amount of Pd inside the polymer phase. In Figure 5.30 the model response obtained by variation of the Pd weight percentage is shown. The temperature difference between the reactor outlet and inlet in the liquid phase increases with the content of Pd in the polymer phase. Moreover, the temperature gradient between the solids and the liquid (Polymer and Pd are always in thermal equilibrium) increases linearly with the amount of Pd. This observation is a consequence of the already explained combination of the Pd nanoparticles isolation inside the polymer phase and the small heat transfer coefficient between polymer and liquid. With an increase of the amount of Pd the number of centres able
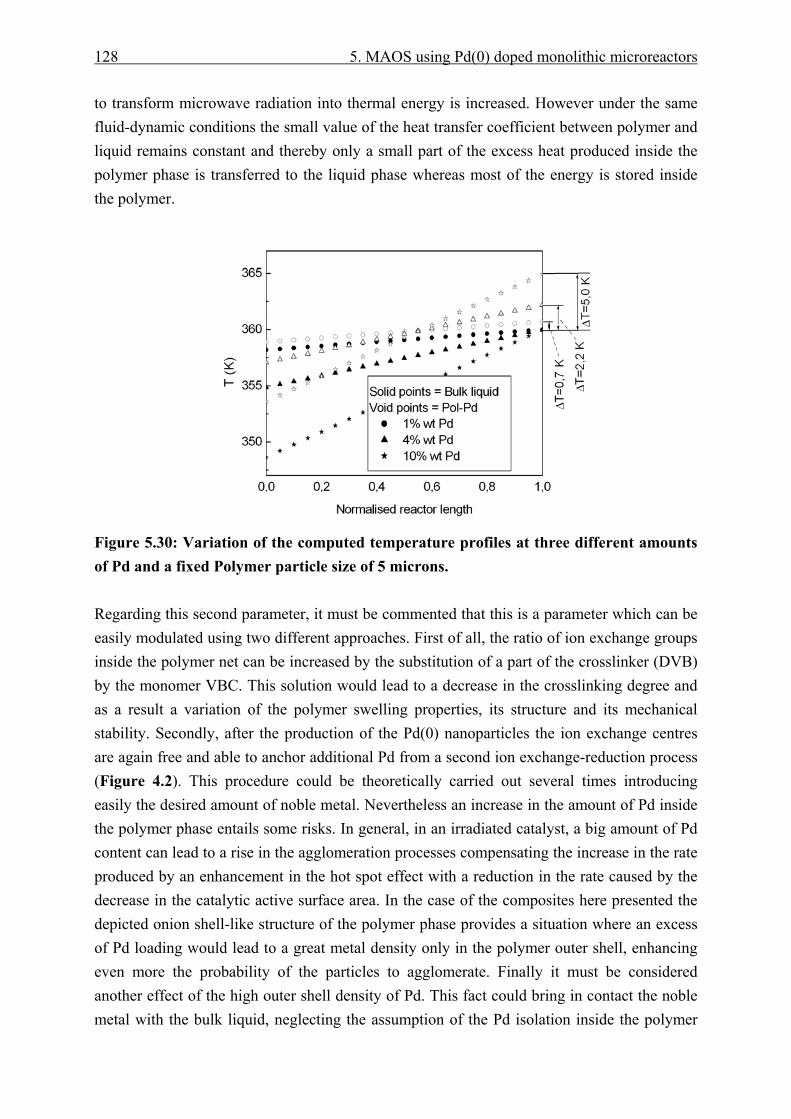
128 5. MAOS using Pd(0) doped monolithic microreactors
to transform microwave radiation into thermal energy is increased. However under the same fluid-dynamic conditions the small value of the heat transfer coefficient between polymer and liquid remains constant and thereby only a small part of the excess heat produced inside the polymer phase is transferred to the liquid phase whereas most of the energy is stored inside the polymer.
Figure 5.30: Variation of the computed temperature profiles at three different amounts of Pd and a fixed Polymer particle size of 5 microns. Regarding this second parameter, it must be commented that this is a parameter which can be easily modulated using two different approaches. First of all, the ratio of ion exchange groups inside the polymer net can be increased by the substitution of a part of the crosslinker (DVB) by the monomer VBC. This solution would lead to a decrease in the crosslinking degree and as a result a variation of the polymer swelling properties, its structure and its mechanical stability. Secondly, after the production of the Pd(0) nanoparticles the ion exchange centres are again free and able to anchor additional Pd from a second ion exchange-reduction process (Figure 4.2). This procedure could be theoretically carried out several times introducing easily the desired amount of noble metal. Nevertheless an increase in the amount of Pd inside the polymer phase entails some risks. In general, in an irradiated catalyst, a big amount of Pd content can lead to a rise in the agglomeration processes compensating the increase in the rate produced by an enhancement in the hot spot effect with a reduction in the rate caused by the decrease in the catalytic active surface area. In the case of the composites here presented the depicted onion shell-like structure of the polymer phase provides a situation where an excess of Pd loading would lead to a great metal density only in the polymer outer shell, enhancing even more the probability of the particles to agglomerate. Finally it must be considered another effect of the high outer shell density of Pd. This fact could bring in contact the noble metal with the bulk liquid, neglecting the assumption of the Pd isolation inside the polymer
Chapter 5. MAOS using Pd(0) doped monolithic microreactors 129
phase necessary to rely on the results obtained by the model. For both reasons, an approach considering an increase of the Pd content in polymer-glass composites must be accompanied for a development of a polymer phase able to isolate the nanoparticles generated by means of dispersion enhancement This goal could be reached using a mixture of monomer and crosslinker with similar copolymerisation parameters (see explanation in paragraph 4.4.2.4).
5.5 Conclusions
If : • equal or almost equal value of the slopes in the kinetic experiments using a single laboratory plant approach were obtained. • using both models either no hot-spot effect or a very small one was observed, • the modelled temperature gradient values were closer to the kinetic approach predictions than to the values calculated using the deactivation factor, • no influence of the Pd particle size in the temperature gradient was found either using the mathematical models or the kinetic experiments then it seems reasonable to accept that no deactivation is taking place in the composites 5,3(0:1) and 30(1:1) studied in depth, a fact that nevertheless cannot be assumed for the rest of the composites studied due to the clear deactivation signs shown in the experiments with two different laboratory plants. If no deactivation is assumed then two different conclusions can be discerned: a) An erroneous description of the Pd(0) doped composites would be obtained using TEM.
These pictures do not allow the observation of the Pd particles in the polymer swollen state. It could be possible that the agglomeration observed in these pictures was just the consequence of a migration of the individual nanoparticles observed in the fresh catalyst more than a real agglomeration process. In the swollen state this migrated particles could be still being isolated from each other.
b) The absence of any deactivation derives in the acceptance of the very small hot spot effect obtained following the kinetic approach and corroborated by the packed bed microreactor model.
Based in the almost negligible improvement in the conversion experimentally obtained it can be concluded that an intensification process involving polymer/glass monolithic reactors and microwaves is under the actual operation conditions far from an optimum. Nevertheless, during this researching process some factors like the utilisation of a polar solvent, the compromise between the enhancement of the hot spot and the mass transfer hindrances caused by an increase in the polymer particle size and the effect of a high noble metal loading were claimed towards a future successful combination of both technologies.
130 6. Conclusions and outlook
6 Conclusions and outlook Microreaction technology is considered nowadays amongst one of the most promising new concepts in reaction engineering and process intensification. A prominent sign of such affirmation is the increasing amount of examples of the application of this technology not only in research but in the industrial ambit. At the same time the implementation of microwave radiation with the aim to accelerate the reaction rate of organic synthesis received an spectacular development during the last years. From an industrial point of view is especially interesting the combination of this energy source with heterogeneous catalytic processes. The synergic effect of the conversion and selectivity enhancement provided by an appropriate catalyst and the possibility of an additional conversion increase caused by the microwave hot spot effect would become an attractive alternative for an intense use of chemical reactors. Nevertheless scientific work is missing towards the clarification of which the parameters affecting in a higher extent the creation of steady state hot spots during the irradiation of a catalytic reactor. Without a deep understanding of this heating process an optimisation of the materials and process parameters in order to promote such effect is impossible. This optimisation is of course a necessary step to raise microwave assisted catalysis to the top list of process intensification tools. The objective of this work was at the same time to answer two complementary questions. On the one hand, to investigate which can be the most important material properties affecting the generation of hot spots inside a heterogeneous catalyst. On the other hand to consider: if microreaction technology and microwave assisted catalysis are in principle feasible tools to intensify a reaction process separately, is it possible to combine both of them? Based on the polymer/glass composite concept developed during the last years at ICVT, different Pd(0) doped catalysts were prepared. Using these catalysts in a designed monolithic microreactor kinetic experiments under microwave heating and traditional heating were performed. The combination of the experimental results and some mathematical modelling were the keys to approach an answer to the proposed questions. In a first step, two different monolithic microreactor concepts allowing flow-trough operations using the polymer/glass composites were designed, constructed and operated. These reactors showed their feasibility to be used under microwave irradiation in a range of temperatures and pressures appropriated to develop organic synthesis. In a second stage of the project, a preparation protocol for the production of a series of Pd(0) doped composites was developed and optimised. Several parameters like the fluid-dynamic regime, the polymer structure and the initial Pd precursor content were studied in order to discern their influence on the properties of the Pd nanoparticles created. It was found that it seems possible to control the size of the Pd nanoparticles generated inside the composites and
Chapter 6. Conclusions and outlook 131
to relate this control with the different parameters applied during the preparation method. The structure of the polymer included in the composites, modified by different combinations of styrene, VBC and DVB as crosslinker, was found to be the most influencing parameter. In all cases a reasonable agreement between the particles formed and the internal structure of the swollen polymer was found. Finally, the kinetic experiments performed using the different Pd doped composite materials, the ring reactor and a developed laboratory plant demonstrated several important statements: • The important role of temperature measurements accuracy and the deactivation of the
catalysts in order to produce realistic interpretations of the enhancement in the reaction rate caused by the irradiation of heterogeneous catalytic reactions. Some mathematical treatment of the experimental results done in this work showed that in the presence of a reduction in the catalytic active surface area hot spots up to several Kelvin can underlie in experiments using different heating methods and showing similar reaction rates. The deactivation of the catalyst has not been considered up to date by the authors dealing with this kind of processes.
• Even though a migration of the Pd nanoparticles takes place during the performance of the reaction it seems that no reduction in the active surface area by a physical agglomeration is taking place. These results are supported by the computed predictions obtained by the mathematical models and are contradictory to the description given by the TEM pictures. A difference between the real arrangement of the Pd inside the swollen polymer particle and the one shown by the TEM pictures was postulated.
• Any of the material properties studied in this work showed a substantial influence in the microwave performance of the catalysts. Neither the variation in the Pd particle size nor the amount of Pd in the range studied in this work produced experimentally a considerable enhancement in the hot spot effect created. These results were corroborated by the mathematical modelling. Both models predict no influence or a very small influence if a Pd particle size from unities to hundreds of nanometers and a Pd content from 1 to 4 %wt were considered (experimental range)
• Under kinetic controlled conditions and using the composite materials produced in this work, at the moment it is not realistic to consider the possibility of an interesting enhancement of the reaction rate caused by the microwave creation of hot spots inside the monolithic reactors presented. Either by the indirect measurement of the catalyst effective temperature based in the kinetic equation or by the mathematical models developed, an insignificant temperature difference was obtained between the catalytic centre and the bulk liquid.
Even though the results do not depict an optimistic outlook for the intensification of a process involving polymer/glass monolith microreactors and microwaves, the modelling effort accomplished in this work open new researching paths towards the optimization of the
132 6. Conclusions and outlook
catalyst properties. The enhancement of the hot spot effect caused by an increase in the polymer particle size and a high noble metal loading that were predicted by the models must be corroborated experimentally, studying as well the different restrictions in the parameter values. In the case of an increase in the polymer particle size some aspects must be taken into account. On the one hand, the increase in the reaction rate caused by a rise in the hot spot effect would be compensated by the decrease associated to the rise in the intraparticle diffusion resistance. Only a slow reaction where the diffusion of the reactants is not the rate determining step could take advantage of the “superheating” produced in a big particle in a straightforward way. On the other hand, depending on the microreactor considered, only a certain particle size could be accommodated in the microstructure without producing hydrodynamic problems. From the point of view of an increase in the noble metal loading, strategies enhancing the noble metal dispersion and avoiding therefore the agglomeration probability have to be developed. An agglomeration would produce a drop in the catalytic active surface area (and therefore in the reactivity) counteracting the rate enhancements caused by the rise in the hot spots created. A modification of the polymer particle structure inside the composites in base of the copolymerisation parameters of the monomers was the suggested solution. Apart from the catalyst parameters already listed in this work, a number of other interesting system properties are waiting to be investigated. Different fluid dynamic regimes, different catalysts materials with a higher concentration of microwave absorbing species inside a thermally isolated pellet, the effect of the reaction kinetics or different irradiation methods are at least some examples here reported of the intensive effort that is still missing in order to one day be able to combine the action of a catalytic microreactor and microwave irradiation efficiently.
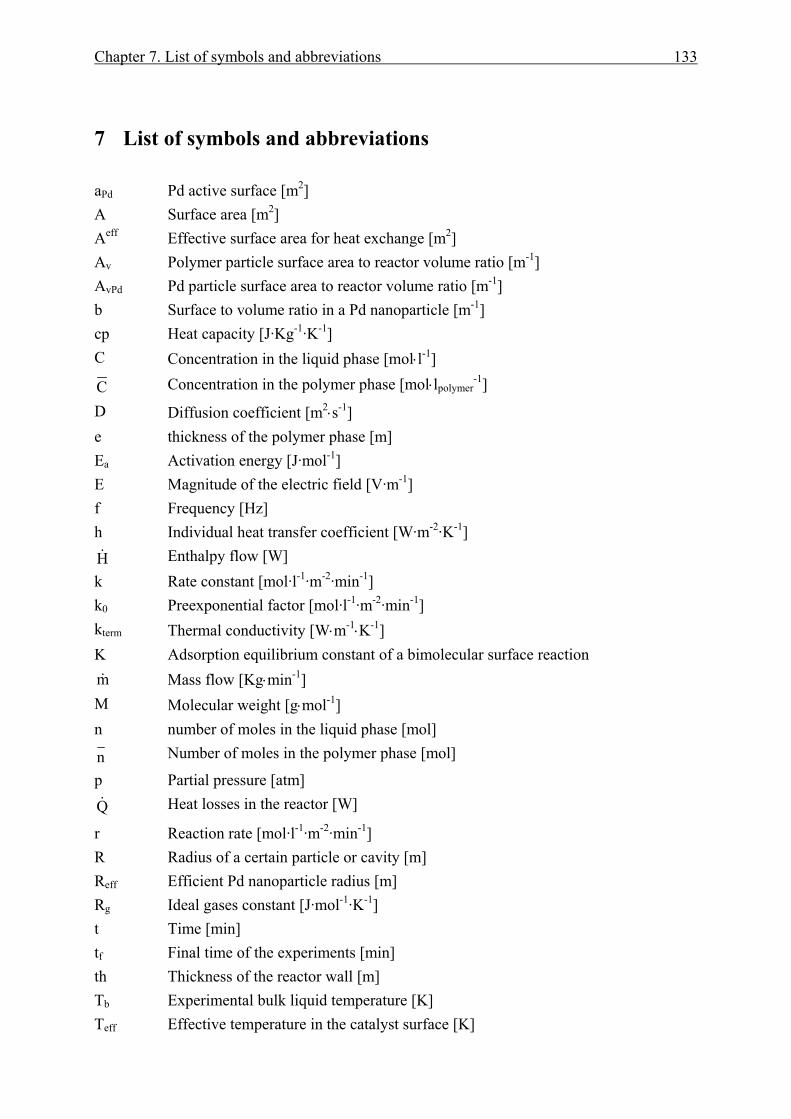
Chapter 7. List of symbols and abbreviations 133
7 List of symbols and abbreviations aPd Pd active surface [m2] A Surface area [m2] Aeff Effective surface area for heat exchange [m2] Av Polymer particle surface area to reactor volume ratio [m-1] AvPd Pd particle surface area to reactor volume ratio [m-1] b Surface to volume ratio in a Pd nanoparticle [m-1] cp Heat capacity [J·Kg-1·K-1] C Concentration in the liquid phase [mol⋅l-1]
C Concentration in the polymer phase [mol⋅lpolymer-1]
D Diffusion coefficient [m2⋅s-1] e thickness of the polymer phase [m] Ea Activation energy [J·mol-1] E Magnitude of the electric field [V·m-1] f Frequency [Hz] h Individual heat transfer coefficient [W·m-2·K-1]
H& Enthalpy flow [W] k Rate constant [mol·l-1·m-2·min-1] k0 Preexponential factor [mol·l-1·m-2·min-1] kterm Thermal conductivity [W⋅m-1⋅K-1] K Adsorption equilibrium constant of a bimolecular surface reaction m& Mass flow [Kg⋅min-1] M Molecular weight [g⋅mol-1] n number of moles in the liquid phase [mol]
n Number of moles in the polymer phase [mol]
p Partial pressure [atm]
Q& Heat losses in the reactor [W]
r Reaction rate [mol·l-1·m-2·min-1] R Radius of a certain particle or cavity [m] Reff Efficient Pd nanoparticle radius [m] Rg Ideal gases constant [J·mol-1·K-1] t Time [min] tf Final time of the experiments [min] th Thickness of the reactor wall [m] Tb Experimental bulk liquid temperature [K] Teff Effective temperature in the catalyst surface [K]
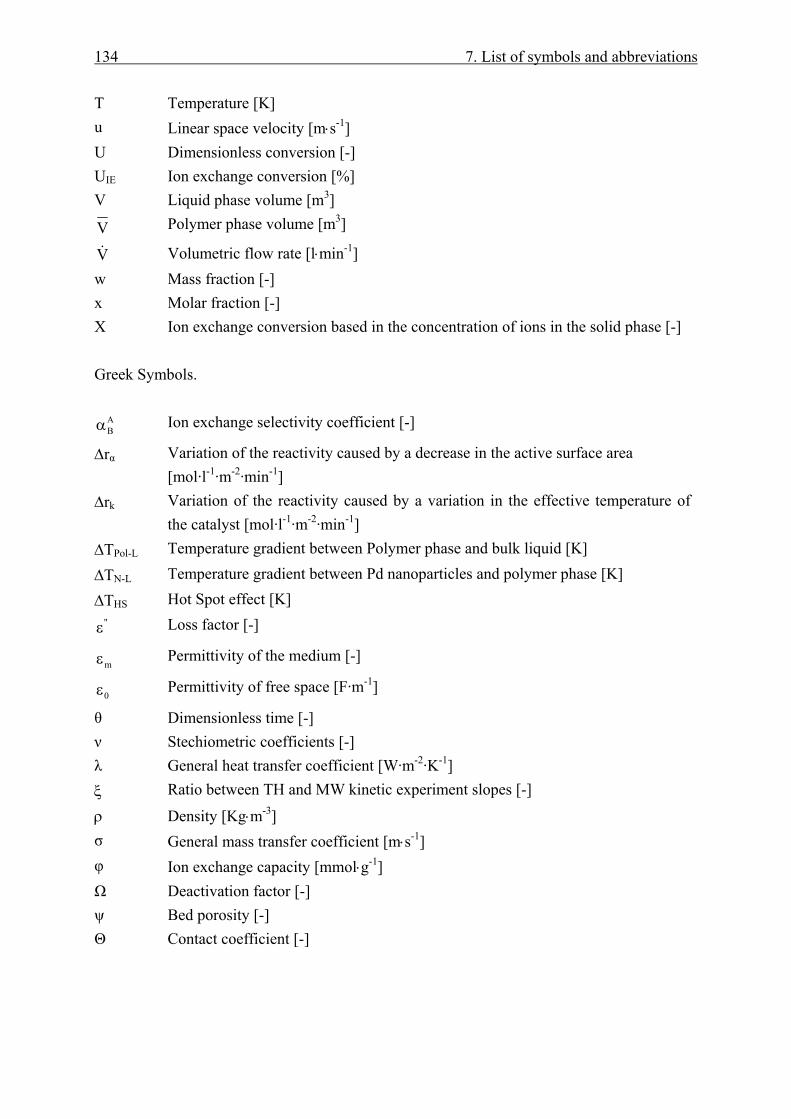
134 7. List of symbols and abbreviations
T Temperature [K] u Linear space velocity [m⋅s-1] U Dimensionless conversion [-] UIE Ion exchange conversion [%] V Liquid phase volume [m3]
V Polymer phase volume [m3]
V& Volumetric flow rate [l⋅min-1] w Mass fraction [-] x Molar fraction [-] X Ion exchange conversion based in the concentration of ions in the solid phase [-] Greek Symbols.
ABα Ion exchange selectivity coefficient [-]
Δrα Variation of the reactivity caused by a decrease in the active surface area [mol·l-1·m-2·min-1]
Δrk Variation of the reactivity caused by a variation in the effective temperature of the catalyst [mol·l-1·m-2·min-1]
ΔTPol-L Temperature gradient between Polymer phase and bulk liquid [K]
ΔTN-L Temperature gradient between Pd nanoparticles and polymer phase [K]
ΔTHS Hot Spot effect [K] "ε Loss factor [-]
mε Permittivity of the medium [-]
0ε Permittivity of free space [F·m-1]
θ Dimensionless time [-] ν Stechiometric coefficients [-] λ General heat transfer coefficient [W·m-2·K-1] ξ Ratio between TH and MW kinetic experiment slopes [-]
ρ Density [Kg⋅m-3] σ General mass transfer coefficient [m⋅s-1] φ Ion exchange capacity [mmol⋅g-1] Ω Deactivation factor [-] ψ Bed porosity [-] Θ Contact coefficient [-]
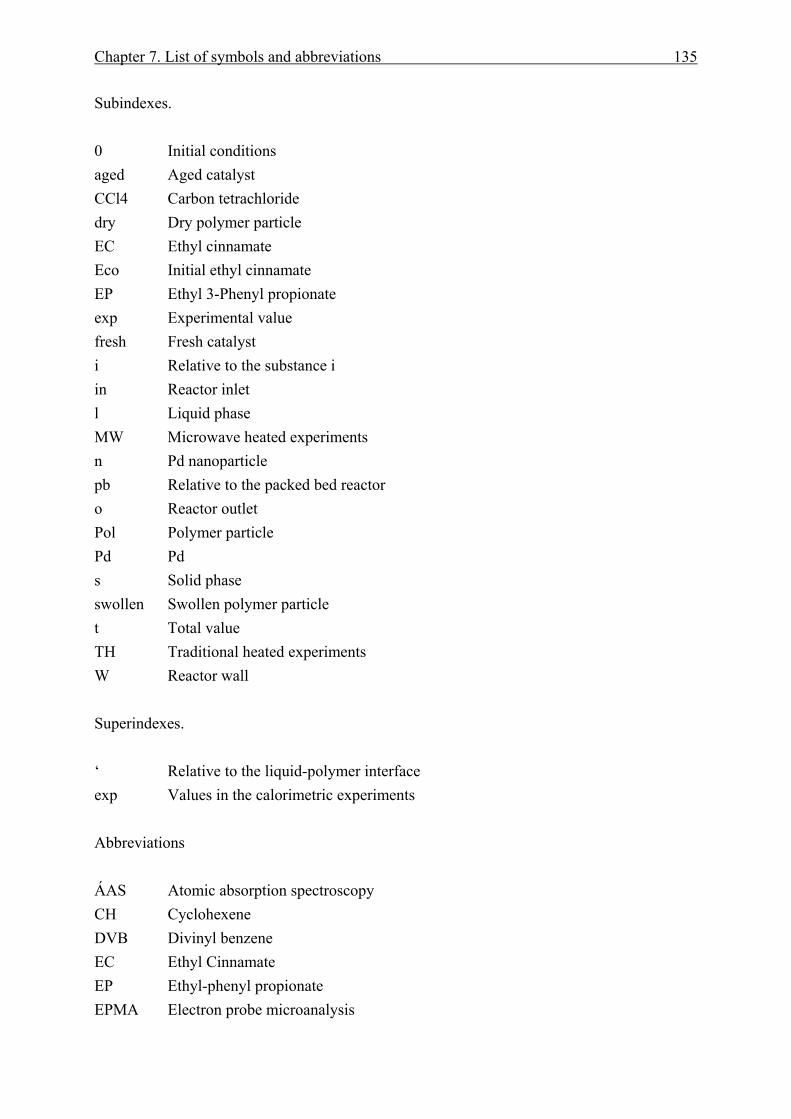
Chapter 7. List of symbols and abbreviations 135
Subindexes. 0 Initial conditions aged Aged catalyst CCl4 Carbon tetrachloride dry Dry polymer particle EC Ethyl cinnamate Eco Initial ethyl cinnamate EP Ethyl 3-Phenyl propionate exp Experimental value fresh Fresh catalyst i Relative to the substance i in Reactor inlet l Liquid phase MW Microwave heated experiments n Pd nanoparticle pb Relative to the packed bed reactor o Reactor outlet Pol Polymer particle Pd Pd s Solid phase swollen Swollen polymer particle t Total value TH Traditional heated experiments W Reactor wall Superindexes. ‘ Relative to the liquid-polymer interface exp Values in the calorimetric experiments Abbreviations ÁAS Atomic absorption spectroscopy CH Cyclohexene DVB Divinyl benzene EC Ethyl Cinnamate EP Ethyl-phenyl propionate EPMA Electron probe microanalysis

136 7. List of symbols and abbreviations
EtOH Ethanol ISEC Inverse steric exclusion chromatography MAOS Microwave assisted organic synthesis MRT Microreaction technology MW Microwave heated experiments PC Polymer content PI Process intensification SEM Scanning electron microscopy TEM Transmission electron microscopy TH Traditional heated experiments VBC Vinyl benzyl chloride
Chapter 8. References. 137
8 References. /ALT01/ Altwicker, C.:
Entwicklung und Charakterisierung einer monolithischen Säule für schnelle chromatographische Applikationen und die polymerphasengebundene Katalyse und Synthese. Dissertation TU Clausthal, Clausthal-Zellerfeld, 2001.
/BAG90/ Baghurst, D.R., Mingos, D.M.P.: Design and application of a reflux modification for the synthesis of organometallic compounds using microwave dielectric loss heating effects Journal of Organometallic Chemistry 384 (1990) pp C57-C60
/BAG96/ Bagnell, L., Cablewski, T., Strauss, C.R., Trainor, R.W.: Reactions of allyl phenyl ether in high-temperature water with conventional and microwave heating. Journal of Organic Chemistry 61 (1996) pp 7355-7359
/BAX06/ Baxendale, I. R. Griffiths- Jones, C.M., Ley, S.V., Tranmer, G.K. Chem.: Microwave assisted Suzuki coupling reactions with an encapsulated palladium catalyst for a batch and continuous-flow transformations Chemistry, an European Journal 12 (2006) pp 4407-4416
/BAY05/ Bayer, T., Jenck, J., Matlosz, M.: IMPULSE- A new approach to process design Chemical Engineering and Technology 28 (2005) pp 431-438
/BAZ06/ Bazureau, J.P., Hamelin, J., Mongin, F., Texier-Boullet, F.: Microwaves in heterocyclic chemistry in Loupy, A. (Editor) Microwaves in organic synthesis, Vol 1. Wiley-VCH, Weinheim, 2006, pp 456-523.
/BEC07/ Becht, S., Franke, R., Geißelmahn, A., Hahn, H.: Micro-process technology as a means of process intensification. Chemical Engineering and Technology 30 (2007) pp 295-299.
/BEE00/ Beers, A.E.W., Hoek, I., Nijhuis, T.A., Downing, R.S., Kapteijn, F., Moulijn, J.A.: Structured catalysts for the acylation of aromatics Topics in Catalysis 13 (2000) pp 275-280
/BER05/ Berkessel, A., Gröger, H.: Asymmetric organocatalysis Wiley-VCH, Weinheim, 2005
138 8. References.
/BER91/ Berlan, J., Giboreau, P., Lefeuvre, S., Marchand,C. : Synthèse organique sous champ microondes : premier exemple d’activation spécifique en phase homogène Tetrahedron Letters 32 (1991) pp 2363-2366
/BIF00/ Biffis, A., D’Archivio, A.A., Jerabek, K. Schmid,G., Corain, B. : The generation of size-controlled palladium nanoclusters inside gel-type functional resins: arguments and preliminary results Advanced Materials 12 (2000) pp 1909-1912.
/BIF02/ Biffis, A., Ricoveri, R., Campestrini, S. Kralik, M., Jerabek, Corain, B.: Highly chemoselective hydrogenation of 2-ethylantraquinone to 2-ethylanthrahydroquinone catalyzed by palladium metal dispersed inside highly lipophilic functional resins Chemistry, a European Journal 8 (2002) pp 2962-2967
/BIN95/ Binner, J.G.P., Hassine, N.A., Cross, T.E.: The possible role of the pre-exponential factor in explaining the increased reaction rates observed during the microwave synthesis of titanium carbide. Journal of Materials Science 30 (1995) pp 5389-5393
/BLA01/ Blaser, H.U., Indolese, A., Schynder, A., Steiner, H., Struder, M.: Supported palladium catalysts for fine chemical synthesis Journal of Molecular Catalysis A: Chemical 173 (2001) pp 3-18
/BLA03/ Blanco, C., Auerbach, S.M.: Nonequilibrium molecular dynamics of microwave-driven zeolite-guest systems: loading dependence of athermal effects Journal of Physical Chemistry B. 107 (2003) pp 2490-2499
/BLA04/ Blaser, H.U., Indolese, A., Naud, F., Nettekoven, U.: Industrial R&D on catalytic C-C and C-N coupling reactions: a personal account on goals, approaches and results Advanced Syntheses and Catalysis 346 (2004) pp 1583-1598
/BOE06/ de Boer, T., Amore, A., Orru, R.V.A.: Multicomponent reactions under microwave irradiation conditions in Loupy, A. (Editor) Microwaves in organic synthesis, Vol 2. Wiley-VCH, Weinheim, 2006, pp 788-819.
/BON93/ Bond, , G., Moyes, R.B., Whan, D.A.: Recent applications of microwave heating in catalysis Catalysis Today 17 (1993) pp 427-437
/BON94/ Bond, , G., Moyes, R.B., Theaker,I, Whan, D.A.: The effect of microwave heating on the reaction of propan-2-ol over alkalised carbon catalysts Topics in Catalysis 1 (1994) pp 177-182
Chapter 8. References. 139
/BOU06/ Bougrin, K., Soufiaoui, M., Bashiardes, G. : Microwaves in cycloadditions in Loupy, A. (Editor) Microwaves in organic synthesis, Vol 2. Wiley-VCH, Weinheim, 2006, pp 524-578.
/BUC06/ Buchenhorst, D., Kopinke, F.D., Roland, U.: Radiowellenerwärmung von Adsorbenzien und Katalysatoren- Teil 2: Untersuchungen zur selektiven Erwärmung von Katalysatoren. Chemie Ingenieur Technik. 78 (2006) pp 548-554.
/CAM07/ http://www.cameca.com/html/epma_technique.html /CEM07/ www.cem.com/synthesis/automated.asp /CHE01/ Chemadt, F., Esveld, E.:
Microwave super-heated boiling of organic liquids: origin, effect and application Chemical Engineering and Technology 24 (2001) pp 735-744
/CHE04/ Chen, G., Borca-Tasciuc, D., Yang, R.G.: Nanoscale heat transfer in Nalwa, H.S. (Editor) Encyclopaedia of Nanoscience and Nanotechnology American Scientific Publishers, Stevenson Ranch (CA), 2004, pp 1-30
/CHE07/ www.chemspeed.com/index.php?path=markets_products/static&detailpage=4 /CHE96/ Chemat, F., Poux, M., Martino, J.L., Berlan, J.:
A new continuous flow recycle microwave reactor for homogeneous and heterogeneous chemical reactions Chemical Engineering and Technology 19 (1996) pp 420-424
/CHE96/ Chen, G. J.: Nonlocal and nonequilibrium heat conduction in the vicinity of nanoparticles Heat Transfer. 118 (1996) pp 539-545.
/CHE97/ Chemat, F., Poux, M., Galema, A.S.: Esterification of stearic acid by isomeric forms of butanol in a microwave oven under homogeneous and heterogeneous reaction conditions Journal of the Chemical Society, Perkin Transmissions 2 11 (1997) pp 2371-2374
/CHE98/ Chemat, F., Esveld, D.C., Poux, M., Di-Martino, J.L.: The role of selective heating in the microwave activation of heterogeneous catalysis reactions using a continuous microwave reactor Journal of Microwave Power and Electromagnetic Energy 33 (1998) pp 88-94
/CLE00/ Cléophax, J., Liagre, M., Loupy, A., Petit, A. : Application of focused microwaves to the scale-up of solvent-free organic reactions Organic Process Research and Development 4 (2000) pp 498-504
140 8. References.
/COM05/ Commenge, J.M., Falk, L., Corriou, J.P., Matlosz, M.: Analysis of microstructured reactor characteristics for process miniaturization and intensification. Chemical Engineering and Technology 28 (2005) pp 446-458.
/COR04/ Corain, B., Jerabek, K., Centomo, P. Canton, P.: Generation of size-controlled Pd(0) nanoclusters inside nanoporous domains of gel-type resins: diverse and convergent evidence that supports a strategy of template-controlled synthesis Angewandte Chemie International Edition 43 (2004) pp 959-962.
/COR65/ Cornish, A.H.D.: Note on the minimum possible rate of heat transfer from a sphere when other spheres are adjacent to it Transaction of the Institution of Chemical Engineers 43 (1965) pp T332-T333
/CYB75/ Cybulski, A., van Dalen, M.J., Verkerk, J.W., van der Berg, P.J.: Gas-particle heat transfer coefficients in packed beds at low Reynolds numbers Chemical Engineering and Science 30 (1975) pp 1015-1018
/DÖR02/ Dörwald, F.Z.: Organic synthesis on solid phase Wiley-VCH, Weinheim, 2002
/DOR91/ Dorfner, K.: Ion Exchangers De Gruyter-Verlag, Berlin, 1991
/EFS03/ Efskind, J., Undheim, K.: High temperature microwave–accelerated ruthenium-catalysed domino RCM reactions Tetrahedron Letters 44 (2003) pp 2837-2839
/EHR00/ Ehrfeld, W., Hessel, V., Löwe, H.: Microreactors. New technology for modern chemistry Wiley-VCH, Weinheim, 2000, pp 173-227
/FIS97/ Fisera, R., Kralik, M., Annus, J., Kratky, V., Zecca, M., Hronec, M.: Deactivation of polymer-supported palladium catalysts in the hydrogenation of 4 nitrotoluene Collection of Czechoslovak Chemical Communications 62 (1997) pp 1763-1765
/FLE02/ Fletcher, P.I.D., Haswell, S.J., Pombo-Villar, E., Warringtong, B.H., Watts, P., Wong, S.Y.F., Zhang, X.: Microreactors: principles and applications in organic synthesis Tetrahedron 58 (2002) pp 4735-4757
Chapter 8. References. 141
/GAB98/ Gabriel,C., Gabriel, S., Grant,E.H., Halstead B.S.J., Mingos, M.P. Dielectric parameters relevant to microwave dielectric heating Chemical Society Reviews 27 (1998) pp 213-223.
/GED86/ Gedye, R., Smith, F., Westaway, K., Ali, H., Baldisera, L., Laberge, L., Rousell, J.: The use of microwave-ovens for rapid organic synthesis. Tetrahedron Letters 27 (1986) pp 279-282.
/GIG86/ Giguere, R.J., Bray, T.L., Duncan, S.M., Majetich, G.: Application of commercial microwave-ovens to organic-synthesis. Tetrahedron Letters 27 (1986) pp 4945-4958.
/GLA63/ Glaski, F.A., Dranoff, J.S.: Ion exchange kinetics: a comparison of models AIChE Journal 9 (1963) pp 426-431
/GME89/ Gmelin Handbook of Inorganic Chemistry Pd supplement, volume B2, Springer Verlag, 1989.
/GUN78/ Gunn, D.J.: Transfer of heat or mass to particles in fixed and fluidised beds International Journal of Heat and Mass Transfer 21 (1978) pp 467-476
/HAA02/ Haas-Santo, K., Gorke, O., Pfeifer, P., Schubert, K., Catalyst coatings for microstructure reactors Chimia 56 (2002) 605-610
/HAJ06/ Hajek,M.: Microwave catalysis in organic synthesis in Loupy, A. (Editor) Microwaves in organic synthesis, Vol 2. Wiley-VCH, Weinheim, 2006, pp 615-652.
/HAL78/ Halasz, I., Martin, K.: Pore sizes of solids Angewandte Chemie International Edition 17 (1978) pp 901-908.
/HAN74/ Hanson, D.L., Katzer, J.R., Gates, B.C. and Schuit, G.C.A.: Supported metal catalysts from cation exchange resins Journal of Catalysis. 32 (1974) pp 204-215.
/HAR95/ Harris, P.J.F.: Growth and structure of supported metal catalyst particles International Material Reviews 40 (1995) pp 97-115
/HAR96/ Harmer, M.A., Farneth, W.E., Sun, Q.: High surface area nafion resin/silica nanocomposites: a new class of solid acid catalyst Journal of the American Chemical Society 118 (1996) pp 7708-7715
142 8. References.
/HEL62/ Helfferich, F.: Ion Exchange Mc-Graw Hill, New York, 1962.
/HEP04-01/ He, P., Haswell, S.J., Fletcher. P. D. I.: Microwave heating of heterogeneously catalysed Suzuki reactions in a microreactor Lab on a Chip (2004) pp 38-41.
/HEP04-02/ He, P., Haswell, S.J., Fletcher. P. D. I.: Microwave-assisted Suzuki reactions in a continuous flow capillary reactor Applied Catalysis A 274 (2004) pp 111-114.
/HES03-1/ Hessel, V. Löwe, H.: Microchemical engineering: components, plant concepts user acceptance-Part I. Chemical Engineering and Technology 26 (2003) pp 13-24
/HES03-2/ Hessel, V. Löwe, H.: Microchemical Engineering: components, plant concepts user acceptance-Part II. Chemical Engineering and Technology 26 (2003) pp 391-408
/HES03-3/ Hessel, V. Löwe, H.: Microchemical Engineering: components, plant concepts user acceptance-Part III. Chemical Engineering and Technology 26 (2003) pp 531-544
/HES05/ Hessel, V., Löwe, H.: Organic synthesis with microstructured reactors Chemical Engineering and Technology 28 (2005) pp 267-284
/HOL83/ Holstein, W.L., Boudart, M.: The temperature difference between a supported catalyst particle and its support during exothermic and endothermic catalytic reactions. Latinoamerican Journal of Chemical Engineering and Applied Chemistry 13 (1983) pp 107-119
/HOS07/ Hosseini, M., Stiasni, N., Barbieri, V., Kappe, C.O.: Microwave assisted organic organocatalysis. A probe for nonthermal microwave effects and the concept of simultaneous cooling Journal of Organic Chemistry 72 (2007) pp 1417-1424
/HUG35/ Hughes, E.D., Ingold, C.K.: Mechanism of substitution at a saturated carbon atom. Part IV. A discussion of constitutional and solvent effects on the mechanism, kinetics and velocity and orientation of substitution Journal of the Chemical Society 23 (1935) pp 244-255
/HÜT05/ Hüther, A., Geißelmahn, A., Hahn, H.: Prozessintensivierung – Eine strategische Option für die Chemische Industrie. Chemie Ingenieur Technik 77 (2005) pp 1829-1837
Chapter 8. References. 143
/INC02/ Incropera, F.P. and DeWitt D.P.: Fundamentals of Heat and Mass Transfer Wiley, New York, 2002.
/JAC95/ Jacob, J., Chia, L.H.L., Boey, F.Y.C.: Thermal and non-thermal interaction of microwave radiation with materials Journal of Materials Science 30 (1995) pp 5321-5327
/JAS05/ Jas, G., Kunz, U., Schmalz, D.: Microreactor technology for Organic synthesis in Afonso, C.A.M., Crespo, J.G. (Editors) Green separation processes Wiley-VCH, Weinheim, 2005, pp 35-51.
/JBI99/ Bi, X.J., Hong, P.J., Xie, X.G., Dai, S.S.: Microwave effect on partial oxidation of methane to syngas Reaction Kinetics and Catalysis Letters 66 (1999) pp 381-386
/JER85/ Jerabek, K.: Characterization of swollen polymer gels using size exclusion chromatography Analytical Chemistry 57 (1985) pp 1598-1602.
/JER89/ Jerabek, K.: Palladium hydrogenation catalysts supported on ion-exchange resins Journal of Molecular Catalysis 55 (1989) pp 247-255.
/JOH85/ Johnstone, R.A.W., Wilby, A.H., Entwistle, I.D.: Heterogeneous catalytic transfer hydrogenation and its relation to other methods for reduction of organic compounds Chemical Reviews 85 (1985) pp 129-170
/KAB00/ Kabza, K.G., Chapados, B.R., Gestwicki, J.E., McGrath, J.L.: Microwave-induced esterification using heterogeneous acid catalyst in a low dielectric constant medium Journal of Organic Chemistry 65 (2000) pp 1210-1214
/KAP04/ Kappe, C. O.,: Controlled microwave chemistry in modern organic chemistry. Angewandte Chemie International Edition 43 (2004) pp 6250-6284
/KAP05/ Kappe, C.O., Stadler, A.: Microwaves in organic and medicinal chemistry Wiley-VCH, Weinheim, 2005
/KAP06/ Kappe, C.O.: The use of microwave irradiation in organic synthesis. From laboratory curiosity to standard practice in twenty years Chimia 60 (2006) pp 308-312
144 8. References.
/KAR05/ Karim, A., Bravo, J., Gorm, D., Conant, T., Datye, A.: Comparison of a wall-coated and packed bed reactor for steam reforming of Methanol. Catalysis Today 110 (2005) 86-91
/KHA74/ Khashimova, S.M., Dzhalilov, A.T., Askarov, M.A.: Copolymerization of vinylbenzyl chloride with divinylbenzene and m-diisoprpylbenzene Vysokomolekulyarnye Soedineniya Seriya B, 16 (1974) pp 53-55
/KIR01/ Kirschning, A., Monenschein, H., Wittenberg, R.: Functionalized polymers- emerging versatile tools for solution-phase chemistry and automated parallel synthesis Angewandte Chemie International Edition 40 (2001) pp 650-679
/KIR01-2/ Kirschning, A., Altwicker, C., Dräger, G., Harders, J., Hoffmann, N., Hoffmann, U., Schönfeld, H., Solodenko, W., Kunz, U.: PASSflow syntheses using functionalized monolithic polymer/glass composites in flow-through microreactors Angewandte Chemie International Edition 40 (2001) pp 3995-3998
/KIR07/ Kirschnek, D, Tekautz, G. Integration of a microreactor in an existing production plant Chemical Engineering and Technology 30 (2007) pp 305-308
/KRA01/ Králik, M., Biffis, A.: Catalysis by metal nanoparticles supported on functional organic polymers Journal of Molecular Catalysis A: Chemical 177 (2001) pp 113-138
/KRE06/ Kreutzer, M.T., Kapteijn, F., Moulijn, J.A.: Shouldn´t catalysts shape up? Structured reactors in general and gas-liquid monolith reactors in particular. Catalysis Today 111 (2006) 111-118
/KUN01/ Kunz, U.; Altwicker, C.; Limbeck, U.; Hoffmann, U.: Improvement of active site accessibility of resin catalysts by polymer/carrier composites: Development and characterisation of monolithic catalytic chromatographic reactors Journal of Molecular Catalysis A: Chemical 177 (2001) pp 21-32.
/KUN03/ Kunz, U., Schönfeld, H., Kirschning, A., Solodenko, W.: Polymer/carrier composites as materials and reactors for organic synthesis Journal of Chromatography A 1006 (2003) pp 241-249
Chapter 8. References. 145
/KUN05/ Kunz, U., Kirschning, A., Wen, H.L., Solodenko, W., Cecilia,R., Kappe, C.O, Turek, T.: Monolithic polymer/carrier materials: versatile composites for fine chemical synthesis Catalysis Today 105 (2005) pp 318-324.
/KUN67/ Kunii, D., Suzuki, M. Particle-to-fluid heat and mass transfer in packed beds of fine particles International Journal of Heat and Mass Transfer 10 (1967) pp 845-852
/KÜN96/ Künne, H.: Reaktionstechnische Untersuchungen für einen neuen Katalysatortyp zur Flüssigphasensynthese des Antiklopfmittels MTBE. Dissertation TU Clausthal, Clausthal-Zellerfeld, 1996
/KUN98/ Kunz, U.: Entwicklung neuartiger Polymer/Träger-Ionenaustauscher als Katalysatoren für chemische Reaktionen in Füllkörperkolonnen Habilitationsschrift. CUTEC-Schriftenreihe Nr. 34, Clausthal-Zellerfeld, 1998
/KUR04/ Kurfürstova, J., Hajek, M.: Microwave induced catalytic transformation of 2-tert-butylphenol at low temperatures Research on Chemical Intermediates 30 (2004) pp 673-681.
/LEA05/ Leadbeater, N.E., Pillsbury, S.J., Shanahan,E., Williams,V.A.: An assessment of the technique of simultaneous cooling in the conjunction with microwave heating for organic synthesis Tetrahedron 61 (2005) pp 3565-3585
/LEA06/ Leadbeater, N.E., Torenius, H.M. Microwaves and ionic liquids in Loupy, A. (Editor) Microwaves in organic synthesis, Vol 1. Wiley-VCH, Weinheim, 2006, pp 327-361.
/LEO04/ Leonelli, C., Siligardi, C., Veronesi, P.: Microwave processing of glass Glass Science and Technology 77 Suppl. C7 (2004) pp 261-266
/LER96/ Lerou J.J., Ka, M.N.G.: Chemical reaction engineering: a multiscale approach to a multiobjective task Chemical engineering science 51 (1996) pp 1595-1614
/LES94/ Leskovsek, S., Smidovnik, A., Koloini, T.: Kinetics of catalytic transfer hydrogenation of soybean oil in microwave and thermal field Journal of Organic Chemistry 59 (1994) pp 7433-7436
146 8. References.
/LEV99/ Levenspiel O.: Chemical Reaction Engineering Wiley, New York, 3rd ed, 1999.
/LEW92/ Lewis, D.A., Summers, J.D., Ward, T.C., McGrath, J.E.: Accelerated imidization reactions using microwave-radiation Journal of Polymer Science A: Chemistry 30 (1992) pp 1647-1653
/LID99/ Lide, D.R.: CRC Handbook of chemistry and physics CRC Press, Florida, 79th ed, 1999
/LIM00/ Limbeck, U.: Einsatzmöglichkeiten einer Polymermembran bei der Cyclisierung von 1,4-Butandiol zu Tetrahydrofuran und Wasser Dissertation TU Clausthal, Clausthal-Zellerfeld, 2000.
/LUK03/ Lukasiewicz, M., Bogdal, D., Pielichowski, J.: Microwave assisted oxidation of side chain arenas by MagtrieveTM
Advances in Synthesis and Catalysis 345 (2003) pp 1269-1272 /MAS03/ de Mas, N., Gunther, A., Schmidt, M.A., Jensen, K.F.:
Microfabricated multiphase reactors for the selective fluorination of aromatics Industrial and Engineering Chemistry Research 42 (2003) pp 698-710
/MEN05/ Mennecke, K., Grela, K., Kunz, U., Kirschning, A.: Inmobilisation of the Grubs III olefin methatesis catalyst with polyvinyl pyridine (PVP) Synlett 19 (2005) pp 2948-2952
/MEN07/ Mennecke, K., Cecilia, R., Glasnov, T.N., Gruhl, S., Vogt, C., Feldhoff, A., Larrubia Vargas. M.A., Kappe, C.O., Kunz, U., Kirschning, A.: Pd(0) Nanoparticles on glass-polymer composite materials as recyclable catalysts: a comparison study on their use in batch and continuous flow processes. Journal of the American Chemical Society. Submitted for publication.
/MET83/ Metaxas, A.C., Meredith, R.J.: Industrial Microwave Heating IEE Power Engineering Series Vol. 4., London, 1983.
/MEU07/ http://www.me.utexas.edu/~prep/dpm.html /MIK01/ Miklavc, A.:
Strong acceleration of chemical reactions through the effects of rotational excitation on collision geometry ChemPhysChem 8-9 (2001) pp 552-555
/MOS06/ Mosse, S., Alexakis, A.: Organocatalyzed asymmetric reactions via microwave activation Organic Letters 8 (2006) pp 3577-3580
Chapter 8. References. 147
/NEL75/ Nelson, P.A., Galloway, T.R.: Particle-to-fluid heat and mass transfer in dense systems of fine particles Chemical Engineering and Science 30 (1975) pp 1-6
/NIJ01/ Nijhuis, T.A., Beers, A.E.W., Vergunst, T., Hoek, I., Kapteijn, F., Moulijn, J.A.: Preparation of monolithic catalysts Catalysis Reviews. Science and Engineering 43 (2001) pp 345-380
/NIL06/ Nilsson, P., Olofsson, K., Larhed, M.: Microwave-assisted and metal-catalyzed coupling reactions Topics in Current Chemistry 266 (2006) pp 103-144
/NOR06/ Norton, D.G., Wetzel, E.D., Vlachos, D.G.: Thermal management in catalytic microreactors Industrial and Engineering Chemistry Research 45 (2006) 76-84
/NÜC03/ Nüchter, M., Müller, U., Ondruschka, B., Tied, A., Lautenschläger, W.: Microwave-assisted chemical reactions Chemical Engineering and Technology 26 (2003) pp 1207-1216
/NÜC04/ Nüchter, M., Ondruschka, B., Bonrath, W., Gum, A.: Microwave-assisted synthesis-a critical technology overview Green Chemistry 6 (2004) pp 128-141
/PEN04/ Pennemann, H., Watts, P., Haswell, S.J., Hessel. V., Löwe, H.: Benchmarking of microreactor applications Organic Process Research and Development 8 (2004) pp 422-439
/PER06/ Perreux, L., Loupy, A. : Nonthermal effects of microwaves in organic synthesis in Loupy, A. (Editor) Microwaves in organic synthesis, Vol 1. Wiley-VCH, Weinheim, 2006, pp 134-218.
/PER97/ Perry, W.L., Cooke, D.W., Katz, J.D., Datye A. K.: On the possibility of a significant temperature gradient in supported metal catalysts subjected to microwave heating Catalysis Letters 47 (1997) pp 1-4.
/PLA95/ Plazl, I., Leskovsek, S., Koloini, T.: Hydrolysis of sucrose by conventional and microwave heating in stirred tank reactor The chemical Engineering Journal 59 (1995) 253-257
/RAD02/ Radiou, M.T., Hajek, M.: Effect of solvent, catalyst type and catalyst activation on the microwave transformation of 2-tert-butylphenol Journal of Molecular Catalysis A: Chemical 186 (2002) pp 121-126
148 8. References.
/RAM83/ Ramshaw, C., Arley, K.: Process intensification by miniature mass-transfer. Process Engineering 64 (1983) p 29
/RAN52/ Ranz, W.E.: Friction and transfer coefficients for single particles and packed beds Chemical Engineering Progress 48 (1952) pp 247-253
/RAP98/ Rapmund, P.: Heterogen katalysierte Synthese des Kraftstoffethers TAME in einer reaktiven Destillationskolonne. Dissertation TU Clausthal, Clausthal-Zellerfeld, 1998
/REH90/ Rehfinger, A., Hoffmann, U.: Kinetics of methyl tertiary butyl ether liquid phase synthesis catalyzed by ion exchange resin-I. Intrinsic rate expression in liquid phase activities Chemical Engineering and Science 45 (1990) pp 1605-1617.
/REI87/ Reid, R.C., Prausnitz, J.M. and Poling, B.E.: The properties of gases and liquids Mc-Graw Hill, New York , 4th edition, 1987
/ROB05/ Roberge, D.M., Ducry,L., Bieler, N., Cretton, P., Zimmermann,B.: Microreactor technology: a revolution for the fine chemical an pharmaceutical industries? Chemical Engineering and Technology 28 (2005) pp 318-323
/ROB66/ Roberts, G.W., Satterfield, C.N.: Effectiveness factor for porous catalysts. Langmuir-Hinshelwood kinetic expressions for bimolecular surface reactions Industrial and Engineering Chemistry. Fundamentals 5 (1966) pp 317-325
/ROD06/ Rodriguez, B., Bolm, C.: Thermal effects in the organocatalysis asymmetric Mannich reaction Journal of Organic Chemistry 71 (2006) pp 2888-2891
/ROU95/ Roussy, G., Pearce, J.A.: Foundations and industrial applications of microwave and radiofrequency fields John Wiley and Sons, New York, 1995 pp 445-466
/ROY04/ Roy, S., Bauer, T., Al-Dahhan, M., Lehner, P., Turek, T.: Monoliths as multiphase reactors: a review AIChE Journal 50 (2004) 2918-2938
/SCH02/ Schouten, J.C., Rebrov, E.V., de Croon, H.J.M.: Miniaturization of heterogeneous catalytic reactors: prospects for new developments in catalysis and process engineering Chimia 56 (2002) 627-635
Chapter 8. References. 149
/SCH04/ Schönfeld, H., Hunger, K, Cecilia, R., Kunz,U.: Enhanced mass transfer using a novel polymer/carrier microreactor. Chemical Engineering Journal 101 (2004) pp 455-463.
/SCH05/ Schönfeld, H.: Entwicklung und verfahrentechnische Optimierung von Polymer/Träger-Mikroreaktoren für die polymerphasenunterstüzte Edelmetallkatalyse und organische Synthese. Dissertation TU Clausthal, Clausthal-Zellerfeld, 2005.
/SCH06/ Schmalz, D.: Eine systematische Potential-Bewertung für die Einführung neuer Technologien in der Prozessindustrie am Beispiel der Mikroreaktionstechnik. Dissertation TU Clausthal, Shaker Verlag, Aachen, 2006.
/SCH88/ Schlünder, E.U., Tsotsas, E.: Wärmeübertragung in Festbetten, durchmischten Schüttgütern und Wirbelschichten Georg Thieme Verlag, Stuttgart, 1988, pp 235-237.
/SHI95/ Shibata, C., Hashima, T., Ohuchi, K.: Nonthermal influence of microwave power in chemical reactions Japanese Journal of Applied Physics. Part 1 35 (1995) pp 316-319
/STA00/ Stankiewicz, A, Moulijn, J.A..: Process intensification: transforming chemical engineering. Chemical Engineering Progress 96 (2000) 22-33
/STA06/ Stankiewicz, A.: Can Microreactors be intensified? Alternative sources and forms of energy for process intensification. Book of Abstracts, 9th international conference on microreaction technology (IMRET 9). Potsdam, 2006.
/STU06/ Stuerga, D.: Microwave-Material interactions and dielectric properties, key ingredients for mastery of chemical microwave processes in Loupy, A. (Editor) Microwaves in organic synthesis, Vol 1. Wiley-VCH, Weinheim, 2006, pp 1-61.
/STU96-1/ Stuerga, D, Gaillard, P. : Microwave heating as a new way to induce localized enhancements of reaction rate. Non isothermal and heterogeneous kinetics. Tetrahedron 52 (1996) pp 5505-5510
150 8. References.
/STU96-2/ Stuerga, D.A.C., Gaillard, P. J.: Microwave athermal effects in chemistry: a myth’s autopsy. Part I: historical background and fundamentals of wave-matter interaction Journal of Microwave Power and Electromagnetic Energy. 31 (1996) 87-100.
/STU96-3/ Stuerga, D.A.C., Gaillard, P. J.: Microwave athermal effects in chemistry: a myth’s autopsy. Part II: orienting effects and thermodynamic consequences of electric field Journal of Microwave Power and Electromagnetic Energy. 31 (1996) 101-113.
/SUN98/ Sundmacher, K., Künne, H., Kunz, U. Contribution of gel phase diffusion to mass transfer in supported ion exchange catalysts Chemical Engineering and Technology 21 (1998) pp 494-498.
/SVE04/ Svec, F.: Organic polymer monoliths as stationary phases for capillary HPLC Journal of Separation Science 27 (2004) pp 1419-1430
/THO00/ Thomas Jr. J.R., Faucher, F. J.: Thermal modelling of Microwave Heated Packed Fluidized Bed Catalytic Reactors Journal of Microwave Power and Electromagnetic Energy. 35 (2000) pp 165-174.
/THO97/ Thomas Jr. J.R.: Particle size effects in microwave-enhanced catalysis Catalysis Letters 49 (1997) pp 137-141
/THO99/ Thostenson, E.T., Chou, T.W.: Microwave processing: fundamentals and applications Composites: Part A 30 (1999) pp 1055-1071
/TOS92/ Toshima, N.; Teranishi, T.; Saito, Y.: Palladium cluster catalysts supported on chelate resin-metal complexes Makromoleculare Chemie, Macromolecules Symposium 59 (1992) pp 327-341
/VEG03/ Van der Vegt, A.K., Govaert, L.E.: Polymeren, van keten tot kuntstof Delft University Press, Delft, 2003
/WAG14/ Wagner, K.W.: Erklärung der dielektrischen Nachwirkungsvorgänge auf Grund maxwellscher Vorstellungen Archiv für Elektrotechnik 2 (1914) pp 371-387.
/WAN91/ Wan, J.K.S., Bamwenda,G., Depew, M.C.: Microwave induced catalytic reactions of carbon dioxide and water- mimicry of photosynthesis Research on Chemical Intermediates 16 (1991) pp 241-255
Chapter 8. References. 151
/WES05/ Westermann, B., Neuhaus, C.: Dihydroxyacetone in amino acid catalyzed Mannich-type reactions Angewandte Chemie International Edition 44 (2005) pp 4077-4079
/WES95/ Westaway, K.C., Gedye, R.N.: The question of specific activation of organic reactions by microwaves Journal of Microwave Power and Electromagnetic Energy 30 (1995) pp 219-230
/WIE04/ Wiesbrock, F., Hoogenboom, R., Schubert, U.S.: Microwave-assisted polymer synthesis: state-of-the-art and future perspectives Macromolecular rapid communications 25 (2004) pp 1739-1764
/WIK07-1/ http://en.wikipedia.org/wiki/Beer-Lambert_law /WIT99/ De Witt, S.H.
Microreactors for chemical synthesis Current opinion in chemical biology 3 (1999) pp 350-356
/ZHA03-1/ Zhang, X., Lee, C.S.M., Mingos, D.M.P., Hayward, D.O.: Oxidative coupling of methane using microwave dielectric heating Applied Catalysis A: General 249 (2003) pp 151-164
/ZHA03-2/ Zhang, X., Hayward, D.O, Mingos, D.P.M.: Effects of microwave dielectric heating on heterogeneous catalysis Catalysis Letters 88, (2003) pp 33-38
/ZHA03-3/ Zhang, X., Lee, C., Mingos, D.P.M., Hayward, D.O. : Carbon dioxide reforming of methane with Pt Catalysts using microwave dielectric heating Catalysis Letters 88 (2003) pp 129-139
/ZHO03/ Zhou, S., Hawley, M.C.: A study of microwave reaction rate enhancement effect in adhesive bonding of polymers and composites Composite structures 61 (2003) pp 303-309
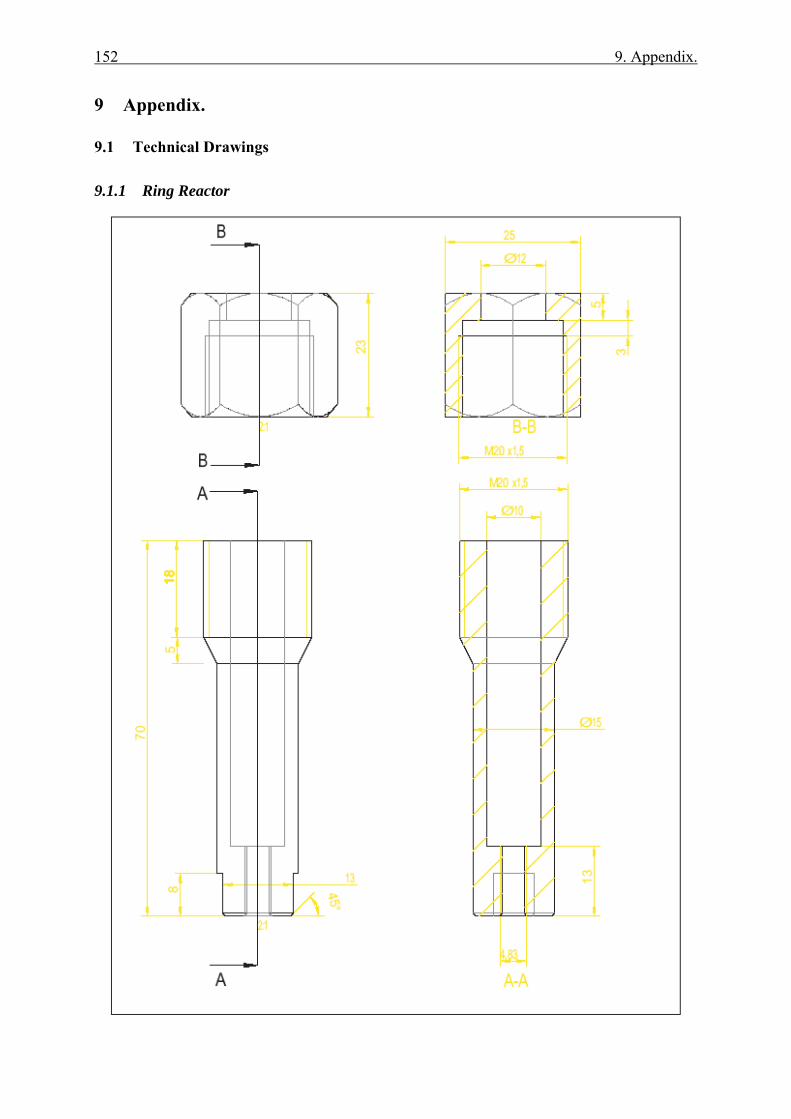
152 9. Appendix.
9 Appendix.
9.1 Technical Drawings
9.1.1 Ring Reactor
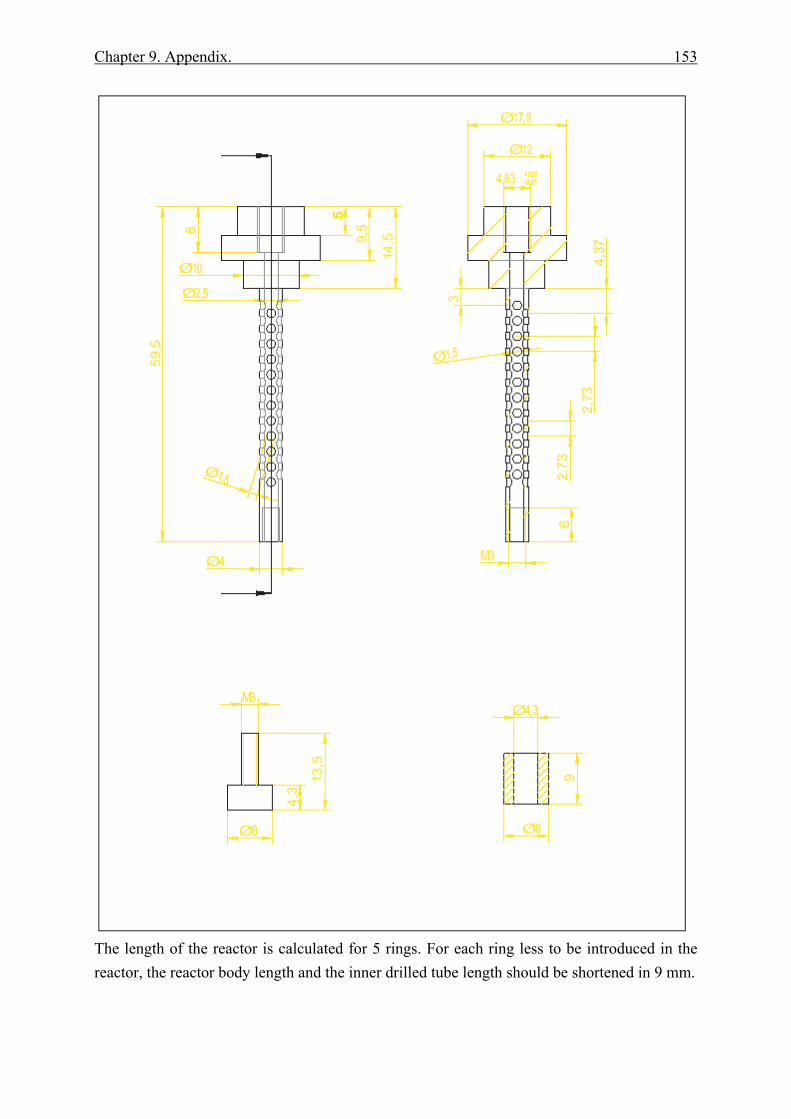
Chapter 9. Appendix. 153
The length of the reactor is calculated for 5 rings. For each ring less to be introduced in the reactor, the reactor body length and the inner drilled tube length should be shortened in 9 mm.
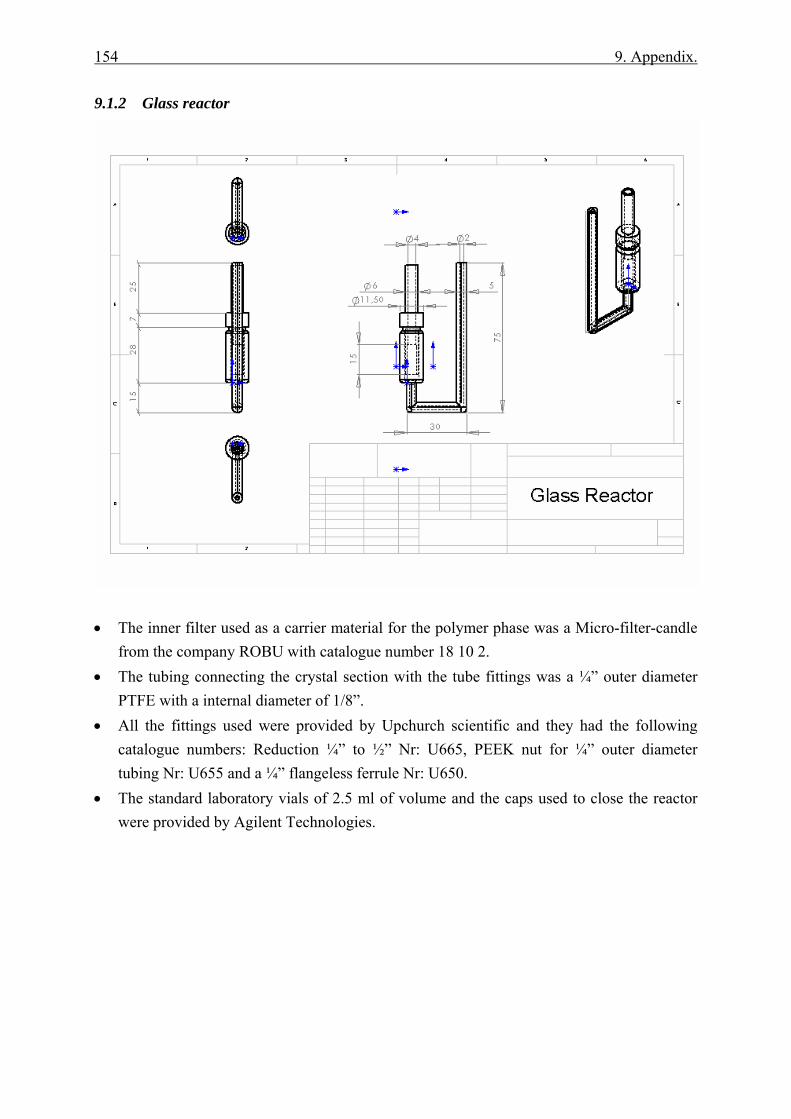
154 9. Appendix.
9.1.2 Glass reactor
• The inner filter used as a carrier material for the polymer phase was a Micro-filter-candle
from the company ROBU with catalogue number 18 10 2. • The tubing connecting the crystal section with the tube fittings was a ¼” outer diameter
PTFE with a internal diameter of 1/8”. • All the fittings used were provided by Upchurch scientific and they had the following
catalogue numbers: Reduction ¼” to ½” Nr: U665, PEEK nut for ¼” outer diameter tubing Nr: U655 and a ¼” flangeless ferrule Nr: U650.
• The standard laboratory vials of 2.5 ml of volume and the caps used to close the reactor were provided by Agilent Technologies.
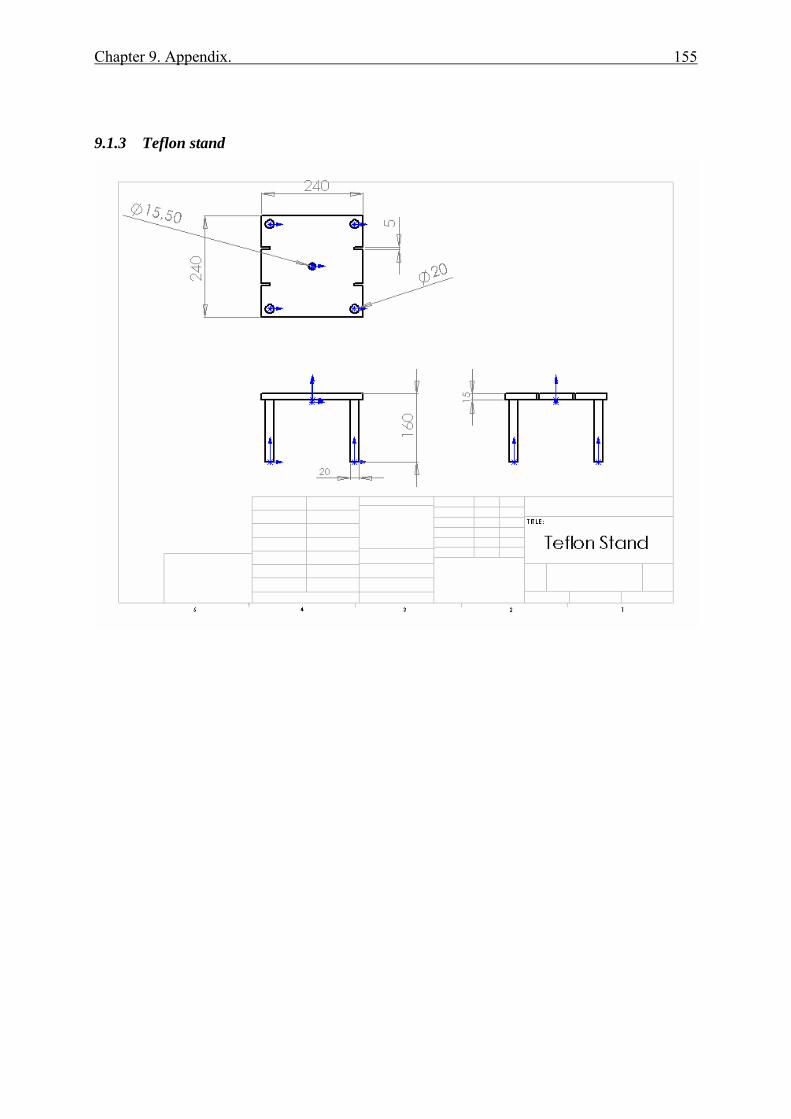
Chapter 9. Appendix. 155
9.1.3 Teflon stand
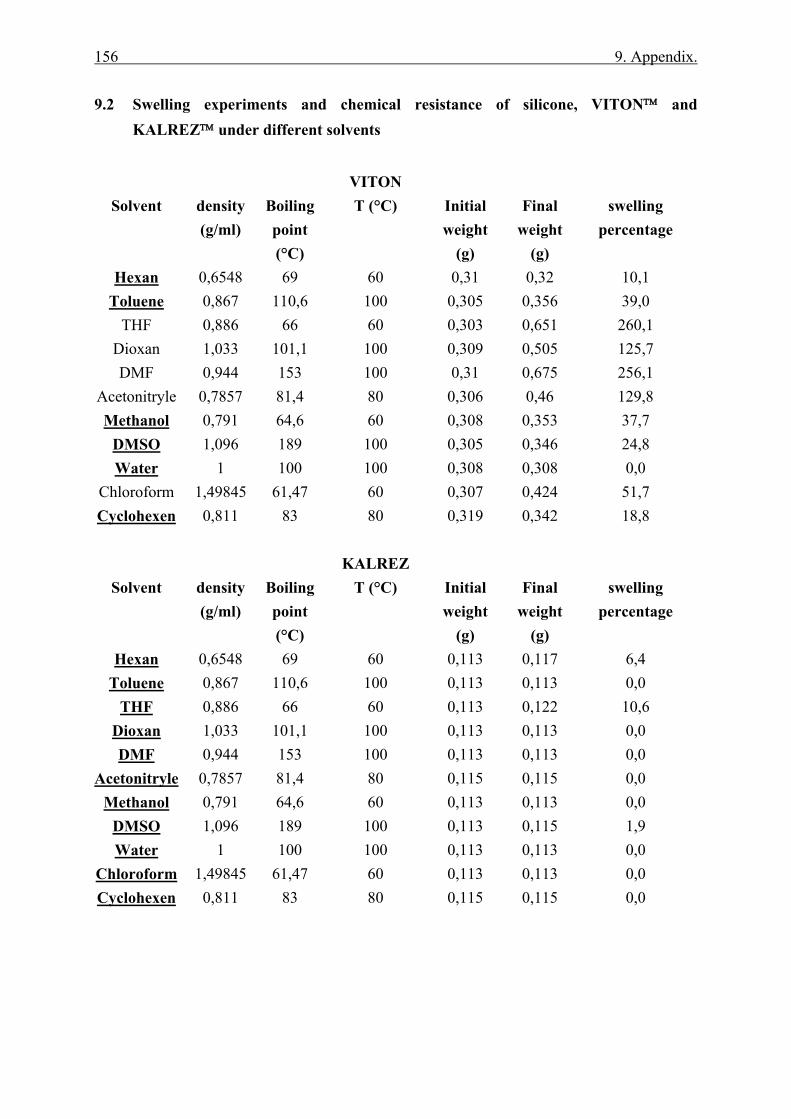
156 9. Appendix.
9.2 Swelling experiments and chemical resistance of silicone, VITON™ and KALREZ™ under different solvents
VITON
Solvent density (g/ml)
Boiling point (°C)
T (°C) Initial weight
(g)
Final weight
(g)
swelling percentage
Hexan 0,6548 69 60 0,31 0,32 10,1 Toluene 0,867 110,6 100 0,305 0,356 39,0
THF 0,886 66 60 0,303 0,651 260,1 Dioxan 1,033 101,1 100 0,309 0,505 125,7 DMF 0,944 153 100 0,31 0,675 256,1
Acetonitryle 0,7857 81,4 80 0,306 0,46 129,8 Methanol 0,791 64,6 60 0,308 0,353 37,7
DMSO 1,096 189 100 0,305 0,346 24,8 Water 1 100 100 0,308 0,308 0,0
Chloroform 1,49845 61,47 60 0,307 0,424 51,7 Cyclohexen 0,811 83 80 0,319 0,342 18,8
KALREZ
Solvent density (g/ml)
Boiling point (°C)
T (°C) Initial weight
(g)
Final weight
(g)
swelling percentage
Hexan 0,6548 69 60 0,113 0,117 6,4 Toluene 0,867 110,6 100 0,113 0,113 0,0
THF 0,886 66 60 0,113 0,122 10,6 Dioxan 1,033 101,1 100 0,113 0,113 0,0 DMF 0,944 153 100 0,113 0,113 0,0
Acetonitryle 0,7857 81,4 80 0,115 0,115 0,0 Methanol 0,791 64,6 60 0,113 0,113 0,0
DMSO 1,096 189 100 0,113 0,115 1,9 Water 1 100 100 0,113 0,113 0,0
Chloroform 1,49845 61,47 60 0,113 0,113 0,0 Cyclohexen 0,811 83 80 0,115 0,115 0,0
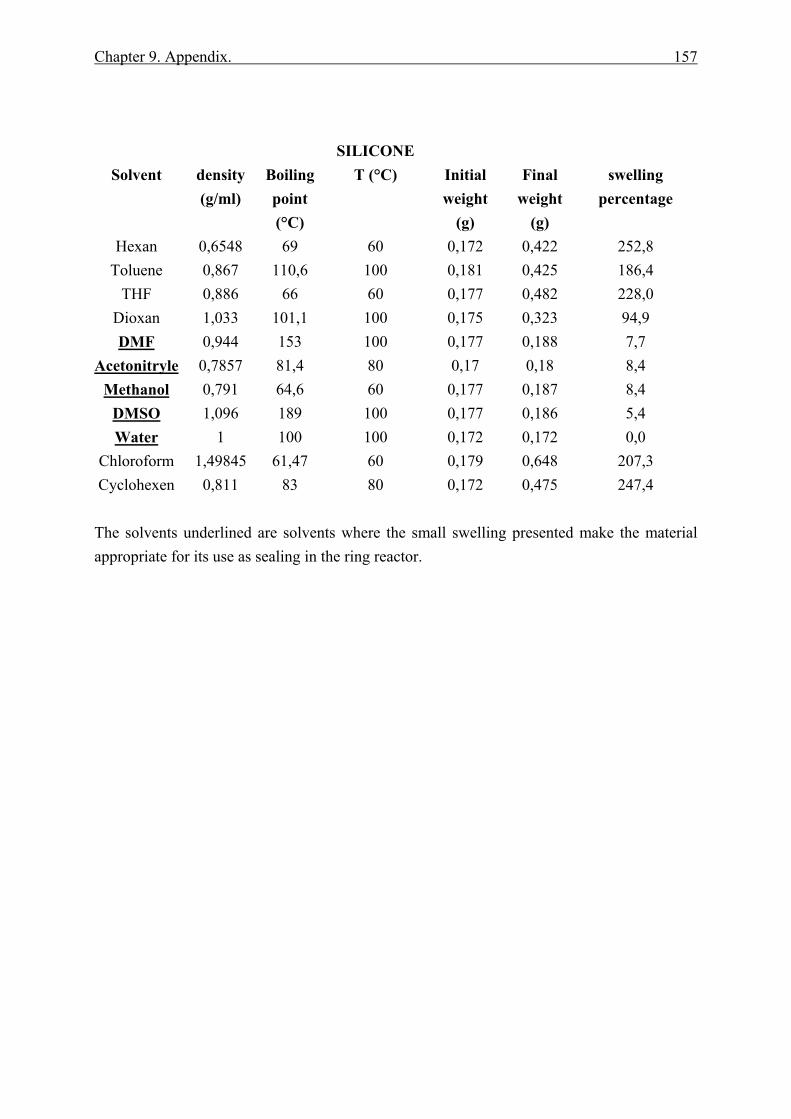
Chapter 9. Appendix. 157
SILICONE Solvent density
(g/ml) Boiling point (°C)
T (°C) Initial weight
(g)
Final weight
(g)
swelling percentage
Hexan 0,6548 69 60 0,172 0,422 252,8 Toluene 0,867 110,6 100 0,181 0,425 186,4
THF 0,886 66 60 0,177 0,482 228,0 Dioxan 1,033 101,1 100 0,175 0,323 94,9 DMF 0,944 153 100 0,177 0,188 7,7
Acetonitryle 0,7857 81,4 80 0,17 0,18 8,4 Methanol 0,791 64,6 60 0,177 0,187 8,4
DMSO 1,096 189 100 0,177 0,186 5,4 Water 1 100 100 0,172 0,172 0,0
Chloroform 1,49845 61,47 60 0,179 0,648 207,3 Cyclohexen 0,811 83 80 0,172 0,475 247,4 The solvents underlined are solvents where the small swelling presented make the material appropriate for its use as sealing in the ring reactor.
158 10. List of scientific contributions
10 List of scientific contributions
10.1 Congresses
[1] Cecilia,R., Kunz, U., Mennecke, K., Kirschning, A., Glasnov, T., Kappe, O.:
Particle size control in Pd polymer supported Catalysts and their application to microwave assisted synthesis Oral contribution in the 5th Congress of the Spanish Catalysis Society (SECAT ´05). June 2005, Madrid, Spain.
[2] Cecilia,R., Kunz, U., Mennecke, K., Kirschning, A., Glasnov, T., Kappe, C.O.: Microwave-Assisted Heterogeneous Catalysis in Flow-Through Reactors. Poster contribution in the Symposium on Microwave Accelerated Synthesis (MAS´05). September 2005, Düsseldorf, Germany.
[3] Kunz, U., Kirschning, A., Wen, H.L., Solodenko, W., Cecilia,R., Kappe, C.O, Turek.T.: Monolithic polymer/carrier materials: versatile composites for fine chemical synthesis Plenary lecture at the 2nd International Conference on Structured Catalysts and Reactors (ICOSCAR-2). October 2005, Delft, Netherlands.
[4] Cecilia,R., Kunz, U., Turek.T., Mennecke, K., Kirschning, A., Glasnov, T., Kappe, C.O.: Catalytic flow-through microreactors for microwave assisted organic syntheses Oral contribution in ACHEMA 2006. May 2006, Frankfurt am Mainz, Germany.
[5] Glasnov, T.N., Mennecke, K., Cecillia, R., Kunz, U., Kirschning, A., Kappe, C.O.: Microwave-Accelerated heterogeneous catalysis - flow-trough reactor concept and application Poster contribution in Advances in Microwave-Assisted Organic Synthesis (MAOS-06), August 2006, Budapest, Hungary.
[6] Cecilia,R., Kunz, U., Turek.T., Mennecke, K., Kirschning, A., Glasnov, T., Kappe, C.O.: A comparison of traditional and Microwave heating methods for a new Catalytic Flow-Through Microreactor applied to Organic Syntheses” Poster contribution in the International meeting on Microreaction technology (IMRET´09). September 2006, Potsdam, Germany.
Chapter 10. List of scientific contributions 159
[7] Cecilia,R., Kunz, U., Turek.T., Mennecke, K., Kirschning, A., Glasnov, T., Kappe, C.O.: Studies of a possible hot spot effect in microwave assisted heterogeneous catalysis.
Poster contribution in the 40th Jahrestreffen Deutscher Katalytiker. March 2007, Weimar, Germany.
[8] Glasnov, T.N., Mennecke, K., Cecillia, R., Kunz, U., Kirschning, A., Kappe, C.O.: Microwave-Accelerated heterogeneous catalysis Involving Palladium Nanoparticles in Flow-Through Reactors Poster contribution in the 5th Microwave in Chemistry Conference , April 2007, London, UK
[9] Cecilia,R., Kunz, U., Turek.T., Mennecke, K., Kirschning, A., Glasnov, T. and Kappe, C.O.: Possibilities of process intensification using microwaves applied to catalytic microreactors Poster contribution in the first European process intensification conference (EPIC). September 2007, Copenhagen, Denmark.
10.2 Journal publications
[1] Kunz, U., Kirschning, A., Wen, H.-L., Solodenko, W., Cecilia,R.., Kappe, C.O.,
Turek, T.: Monolithic polymer/carrier materials: versatile composites for fine chemical synthesis Catalysis Today 105 (2005) pp 318-324
[2] Cecilia, R., Kunz, U, Turek.T.: Possibilities of process intensification using microwaves applied to catalytic microreactors.Chemical Engineering and Processing 46 (2007)pp 870-881
[3] Mennecke, K., Cecilia, R., Glasnov, T.N., Gruhl, S., Vogt, C., Feldhoff, A., Larrubia Vargas. M.A., Kappe, C.O., Kunz, U., Kirschning, A.: Pd(0) Nanoparticles on glass-polymer composite materials as recyclable catalysts: A comparison study on their use in batch and continuous flow processes. Advanced Synthesis and Catalysis. Submitted for publication.

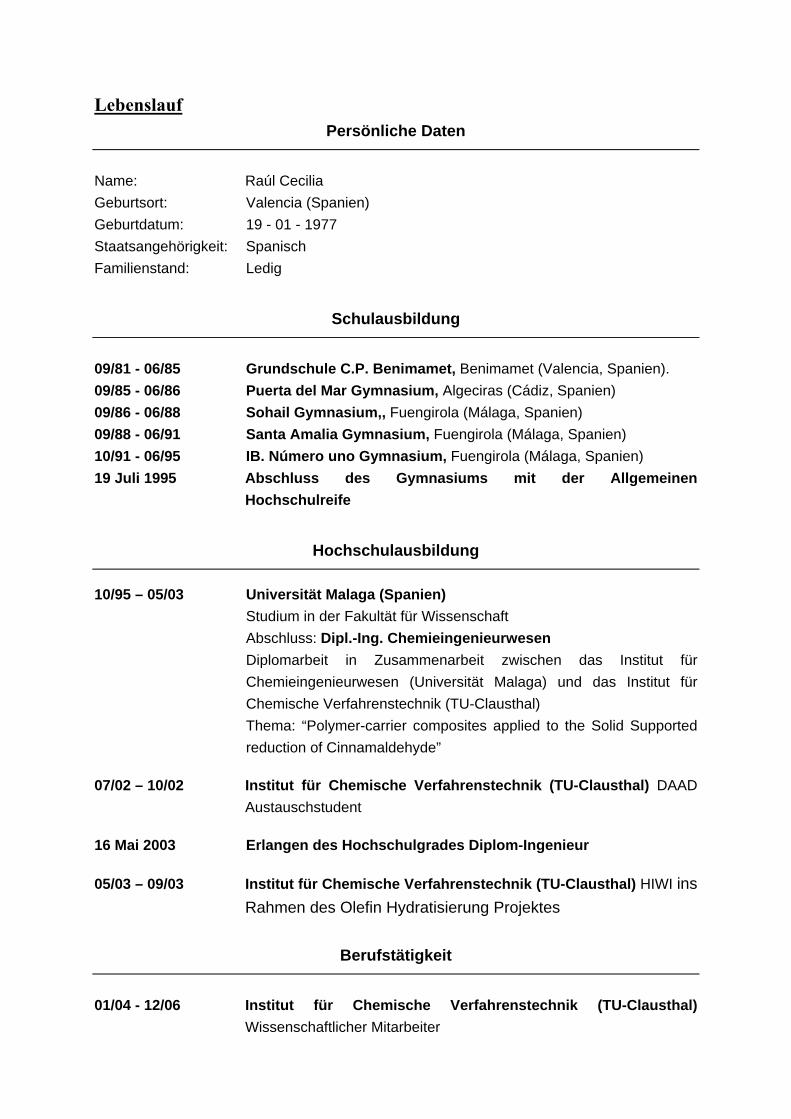
Lebenslauf Persönliche Daten
Name: Raúl Cecilia Geburtsort: Valencia (Spanien) Geburtdatum: 19 - 01 - 1977 Staatsangehörigkeit: Spanisch Familienstand: Ledig
Schulausbildung
09/81 - 06/85 Grundschule C.P. Benimamet, Benimamet (Valencia, Spanien). 09/85 - 06/86 Puerta del Mar Gymnasium, Algeciras (Cádiz, Spanien) 09/86 - 06/88 Sohail Gymnasium,, Fuengirola (Málaga, Spanien) 09/88 - 06/91 Santa Amalia Gymnasium, Fuengirola (Málaga, Spanien) 10/91 - 06/95 IB. Número uno Gymnasium, Fuengirola (Málaga, Spanien) 19 Juli 1995 Abschluss des Gymnasiums mit der Allgemeinen
Hochschulreife
Hochschulausbildung
10/95 – 05/03 Universität Malaga (Spanien) Studium in der Fakultät für Wissenschaft Abschluss: Dipl.-Ing. Chemieingenieurwesen Diplomarbeit in Zusammenarbeit zwischen das Institut für
Chemieingenieurwesen (Universität Malaga) und das Institut für Chemische Verfahrenstechnik (TU-Clausthal)
Thema: “Polymer-carrier composites applied to the Solid Supported reduction of Cinnamaldehyde”
07/02 – 10/02 Institut für Chemische Verfahrenstechnik (TU-Clausthal) DAAD Austauschstudent
16 Mai 2003 Erlangen des Hochschulgrades Diplom-Ingenieur
05/03 – 09/03 Institut für Chemische Verfahrenstechnik (TU-Clausthal) HIWI ins Rahmen des Olefin Hydratisierung Projektes
Berufstätigkeit
01/04 - 12/06 Institut für Chemische Verfahrenstechnik (TU-Clausthal)
Wissenschaftlicher Mitarbeiter