an approach for design of noise barriers on flyovers in urban … · basis of different land use....
TRANSCRIPT

158
AN APPROACH FOR DESIGN OF NOISE BARRIERS ON FLYOVERS IN URBAN AREAS IN INDIA
Arvind Kumar Shukla1
Civil Engineering Department, Institute of Engineering and Technology, Sitapur Road, Lucknow -226016, India
Received 26 May 2011; accepted 9 August 2011
Abstract: Transport is a significant, often major source of environmental pollution consisting of noise and air. Noise pollution has become a major concern for communities living in the vicinity of urban roads and major highway corridors. In view of increasing noise levels along highways it has become essential to reduce the intensity of noise to acceptable limit by constructing noise barrier. To study the existing noise levels in the urban areas due to movement of vehicles, the entire city of Lucknow has been divided in different zones on the basis of different land use. Effect of other factors like type of terrain, speed of traffic, cross section of roads and traffic composition has also been considered during noise data analysis. In this paper noise levels on the fly over in front of Engineering College (IET Lucknow UP India) has been taken for study and a noise barrier for this location has been designed for predicted noise levels worked out using modified FHWA model. This model makes use of traffic data like volume, speed composition, slope, ground cover etc. A program in EXCEL was developed to work out barrier height using traffic and road geometry data. The height of noise barrier to reduce the noise level from 63.79 db to 55 db was found as 4.2 meters above the floor level of flyover.
Key words: noise barrier, FHWA model.
1 Corresponding author: [email protected]
1. Introduction
Due to increase in number of vehicles and rapid urbanization of cities, noise level exceeds the permissible value. For many years noise barriers have been erected along major arterials to screen residential areas from high levels of traffic noise. Noise barriers for reduction of noise levels could be warranted for certain portion of road network (Mohan et al., 2002). Noise barriers can have a substantial effect on the visual environment of a highway and its surrounding environment. They are long continuous structures, often more than 15
feet high, made of various materials. They can significantly change the view of the road by blocking view of the roadside and creating a monolithic uniformity of walls instead changing urban scenery. Nonetheless, noise barrier may be highly sought after by neighborhoods as a means to reduce roads noise level. There are several models available to predict nose levels due to moving vehicles, however in earlier studies conducted for Indian environment FHWA model had shown good results (Shukla et al., 2008). The noise levels used for designing were the predicted levels using FHWA model (Shukla et al., 2009).
International Journal for Traffic and Transport Engineering, 2011, 1(3): 158 – 167 UDC: 534.836.2:614.872.4(540)

159
1.1. Noise Standards
The ambient noise standards being followed in India for different types of zones are given in Table 1 (CPCB, 1991), similarly the noise level standards for residential areas in India given in Table 2 (CPCB, 1991).Table 1 Ambient Noise Standards (India)
Sl. No Area Leq dB (A)
Day Time Night Time
1. Industrial Area 75 70
2. Commercial Areas 65 55
3. Residential Area 55 45
4. Silence Zone 50 40
Table 2 Noise Level Standards for Residential Area in India
Sl. No LocationAcceptable
Noise Level in dB (A)
1. Rural 25-35
2. Suburban 30-40
3. Residential 35-45
4. Urban (Residential and Business) 40-45
5. City 45-50
1.2. Factors Affecting Traffic Noise
The level of traffic noise depends mainly on the following factors (Attenborough, 1982):
• The Volume of the traffic;• The speed of the traffic;• The number of heavy vehicles in the
traffic stream.
Generally, the loudness of traffic noise is increased by heavier traffic volume, higher speeds and greater numbers of heavy
vehicles. Vehicle noise is a combination of the noises produced by the engine, exhaust, and tyres. The loudness of traffic noise is also increased by defective mufflers or other faulty equipment on vehicles. Any condition (such as a steep incline) that causes heavy laboring of motor vehicle engines also increases traffic noise levels. Traffic noise levels are affected by distance, terrain, vegetation, natural and manmade obstacles. Traffic noise is not usually a serious problem for people who live more than 150 m away from heavily traveled freeways or more than 30 to 60 m from lightly traveled roads. The most common traffic noise descriptors are L10, L50, L90 and Leq. L10 gives indication of the top end of the level range although it can be substantially less than the occasional peak. L90 corresponds to the background noise level in the absence of nearby noise sources. Leq is the equivalent continuous sound level, which contains the same quantity of sound energy over a definite time period as the actual time varying sound level (Harris, 1979).
2. Issues Related to Barrier
Issues which need to be addressed in the noise barrier design include:
• Aesthetic: To provide an attractive noise barrier that is complementary to and enhances the surrounding community and provides an improved urban image;
• Cost: To provide a barrier that has a reasonable cost to build as well as to maintain;
• Effectiveness: To estimate acoustic effectiveness of noise barrier in reducing sound level;
• Maintenance: To minimize maintenance cost of the barrier and plant materials and to minimize graffiti and potential legal/liability problem;
Shukla A. K. An Approach for Design of Noise Barriers on Flyovers in Urban Areas in India

160
• Acceptability: To create a barrier system that can gain the enthusiastic support of the surrounding community as well as various political decision making groups.
2.1. Design Aspects of Noise Barriers
Noise barriers are normally designed to provide the reduction in noise levels to the tune of 15-dBA at the receptor. To produce an effective sound shadow, a noise barrier should be dense and close to the road. Such kind of barriers can be adopted for flyover located in residential/silence zone in different metropolitan cities in the country.
2.2. Acoustical Design of Noise Barrier Height
Barrier attenuation is predicted as a function of Fresnel number, Eq. (1):
(1)
Where:
N - Fresnel numberA+B - Path length over the barrierC - Path length through the barrierl - the wavelength of the sound radiated by the source given by Eq. (2):
(2)
where,
c - speed of sound propagation in m/s and T - time period in sec given as 1/f , where f is frequency in Hz.
It is possible to compute Fresnel number and barrier attenuation for each frequency band. The parameters A, B and C are shown in Fig. 1.
However to save time, an effective frequency of 550 Hz is used for all vehicles. At temperature 20 ºC, the speed of sound C is given by Eq. (3):
Fig. 1. Geometry of Source, Barrier and Receiver to Establish the Barrier Attenuation
(3)
International Journal for Traffic and Transport Engineering, 2011, 1(3): 158 – 167
161
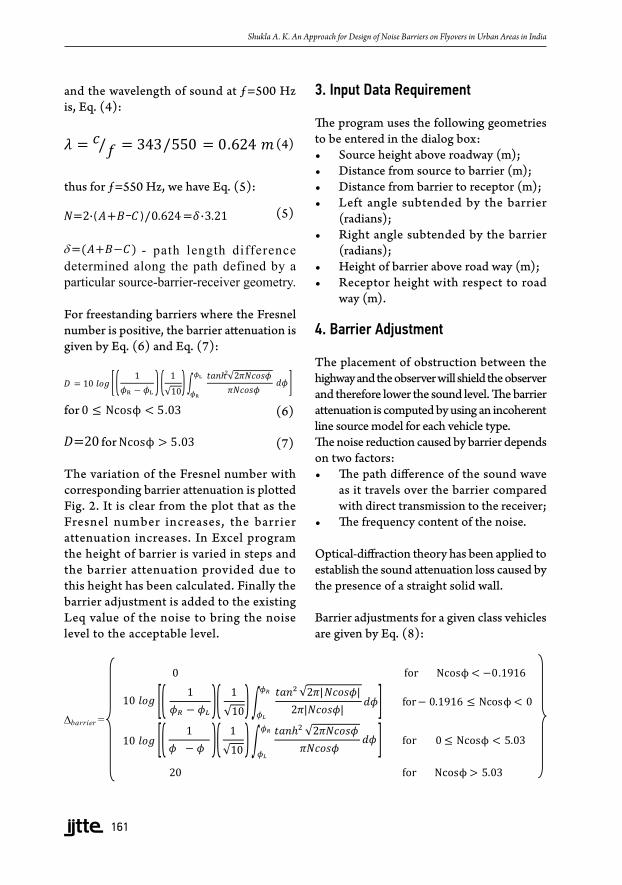
and the wavelength of sound at ƒ=500 Hz is, Eq. (4):
(4)
thus for ƒ=550 Hz, we have Eq. (5):
(5)
- path length difference determined along the path defined by a particular source-barrier-receiver geometry.
For freestanding barriers where the Fresnel number is positive, the barrier attenuation is given by Eq. (6) and Eq. (7):
for (6)
for (7)
The variation of the Fresnel number with corresponding barrier attenuation is plotted Fig. 2. It is clear from the plot that as the Fresnel number increases, the barrier attenuation increases. In Excel program the height of barrier is varied in steps and the barrier attenuation provided due to this height has been calculated. Finally the barrier adjustment is added to the existing Leq value of the noise to bring the noise level to the acceptable level.
3. Input Data Requirement
The program uses the following geometries to be entered in the dialog box:• Source height above roadway (m);• Distance from source to barrier (m);• Distance from barrier to receptor (m);• Left angle subtended by the barrier
(radians);• Right angle subtended by the barrier
(radians);• Height of barrier above road way (m);• Receptor height with respect to road
way (m).
4. Barrier Adjustment
The placement of obstruction between the highway and the observer will shield the observer and therefore lower the sound level. The barrier attenuation is computed by using an incoherent line source model for each vehicle type.The noise reduction caused by barrier depends on two factors: • The path difference of the sound wave
as it travels over the barrier compared with direct transmission to the receiver;
• The frequency content of the noise.
Optical-diffraction theory has been applied to establish the sound attenuation loss caused by the presence of a straight solid wall.
Barrier adjustments for a given class vehicles are given by Eq. (8):
Shukla A. K. An Approach for Design of Noise Barriers on Flyovers in Urban Areas in India

162
where,
Δbarrier - Barrier AdjustmentΦL - Angle measured from the perpendicular to the left ends of the barrier in radians;ΦR - Angle measured from the perpendicular to the right ends of the barrier in radians.
5. Design of Barrier for Location at Engineering College (IET Lucknow)
5.1. Site Details
A f lyover on a rai lway crossing was constructed in the year 2006 connecting NH 24 (Lucknow Sitapur road) to NH 28 (Lucknow Faizabad road) on ring road (now named as NH 24 A). Institute of Engineering & Technology (IET) is located close to this bridge. The site is without any traffic control device. At the end of this bridge there is a four legged intersection distributing traffic towards NH 28 and residential areas of Aliganj and Jankipuram carrying heavy traffic. A field study regarding the land
use, traffic volume, traffic speed and other features around the bridge was carried out to determine the height of proposed noise barrier for construction in future to bring down the noise levels under the permissible limits. The traffic volume study was done categorizing the vehicles in seven different classes as under given in Table 3 below. Table 3 Identified Vehicle Categories for Study at Engineering College (IET Lucknow) Flyover
Sl. No Vehicle Categories
1. Car/Jeep/Van
2. Mini Bus/Mini truck
3. Bus
4. 2-Wheeler
5. Truck
6. Tractor/Trailor
7. 3-Wheeler
Traffic volume count data collected for both directions as given in Table 4 and 5, similarly classified traffic speed count data collected for both directions is given in Table 6 and 7.
Fig. 2. Barrier Height and Noise Attenuation for Receiver at Different Heights
International Journal for Traffic and Transport Engineering, 2011, 1(3): 158 – 167

163
Table 4 Traffic Volume (veh/h) at Engineering College (IET) Flyover Direction 1
Time Car/Jeep 2-Wheeler Mini Bus/Mini Truck Bus Truck 3-Wheeler Tractor/
Trailor
8.00-9.00 85 210 23 2 56 45 10
9.00-10.00 87 275 20 1 62 56 11
10.00-11.00 111 199 19 4 66 54 9
11.00-12.00 151 205 22 3 67 65 12
12.00-13.00 170 188 23 8 81 34 12
13.00-14.00 159 199 29 3 75 76 10
14.00-15.00 110 201 30 3 77 78 12
15.00-16.00 150 212 18 6 72 98 6
16.00-17.00 177 245 24 8 70 102 11
17.00-18.00 200 269 28 5 78 65 3
18.00-19.00 234 254 42 8 120 145 10
19.00-20.00 240 301 45 3 186 56 12
Table 5 Traffic Volume (veh/h) at Engineering College (IET) Flyover Direction 2
Time Car/Jeep 2-Wheeler Mini Bus/ Mini Truck Bus Truck 3-Wheeler Tractor/
Trailor
8.00-9.00 112 117 23 4 48 88 8
9.00-10.00 120 200 30 5 54 46 6
10.00-11.00 145 211 24 12 53 34 10
11.00-12.00 140 345 85 12 158 48 8
12.00-13.00 155 345 74 24 90 71 7
13.00-14.00 95 212 33 9 51 67 13
14.00-15.00 110 300 67 14 39 89 9
15.00-16.00 95 234 78 23 30 45 13
16.00-17.00 70 212 63 30 87 34 13
17.00-18.00 50 212 91 9 78 54 1
18.00-19.00 85 213 83 18 40 67 11
19.00-20.00 191 256 122 30 94 45 13
Shukla A. K. An Approach for Design of Noise Barriers on Flyovers in Urban Areas in India

164
Table 6 Traffic Speed (km/h) at Engineering College (IET) Flyover Direction 1
Time Car/Jeep Mini bus Truck Bus 2-Wheeler 3-Wheeler Tractor/Trailor
8.00-9.00 43.23 37.5 32.63 40.6 33.63 31.32 19.5
9.00-10.00 40.81 36.75 30.13 38 30.56 27.33 18.7
10.00-11.00 41.62 30.41 34.52 40.12 31.6 29.46 20.53
11.00-12.00 40.51 33.16 32.21 33.77 31.76 32.56 19.76
12.00-13.00 44.85 32.53 30.21 35.46 32.89 28.26 18.53
13.00-14.00 44.89 40.5 32.6 43.5 33.73 29.23 21.74
14.00-15.00 45.53 40.41 30.1 40.6 30.15 24.25 22.3
15.00-16.00 40.46 34.75 33.12 31.25 32.26 33.55 23.5
16.00-17.00 40.61 31.6 32.45 32.43 36.55 33.7 20.7
17.00-18.00 41.7 32.7 33.45 32.3 32.2 30.96 21.37
18.00-19.00 42.5 31.7 30.6 31.6 32.9 31.16 22.65
19.00-20.00 50.0 33.6 32.6 40.1 29.9 30.33 23.67
Table 7 Traffic Speed (km/h) at Engineering College (IET) Flyover Direction 2
Time Car/Jeep 2-Wheeler Mini Bus/ Mini Truck Bus Truck 3-Wheeler Tractor/
Trailor
8.00-9.00 43.23 41.23 32.45 33.43 40.21 31.24 18.23
9.00-10.00 41.22 33.56 37.23 32.53 34.59 31.36 20.5
10.00-11.00 35.78 32.7 28.00 25.25 33.5 30.73 22.32
11.00-12.00 31.21 3152 32.4 31.22 31.62 30.32 16.7
12.00-13.00 39.13 34.27 30.67 31.00 30.17 31.15 21.51
13.00-14.00 37.52 32.58 30.59 43.66 31.26 30.35 19-67
14.00-15.00 32.6 33.44 43.8 33.5 30.82 31.45 18.72
15.00-16.00 34.42 33.42 32.81 32.23 30.66 20.4 21.57
16.00-17.00 36.25 31.00 30.00 30.25 30.75 26.88 22.1
17.00-18.00 35.23 36.64 34.42 29.62 32.46 28.42 18.93
18.00-19.00 41.38 33.93 31.00 34.3 30.1 27.5 17.81
19.00-20.00 38.56 36.23 31.2 34.89 32.56 31.56 22.53
International Journal for Traffic and Transport Engineering, 2011, 1(3): 158 – 167

165
5.2. Land Use
This location is in residential zone.
5.3. Site Geometry
Geometric data collected from site and its layout with the proposed flyover is presented in Fig. 3.
For calculating the height of noise barrier input data was entered in designed Excel sheet and hourly Leq for 12 hr data was calculated. Leq values calculated at Engineering College (IET) at both the receptors are shown in Table 8.
Knowing hourly Leq values the appropriate height of barrier was determined by trial and error method.
From the program developed the height of barrier above the pavement is calculated as 4.2 m.
6. Conclusion
The paper analyzed the existing noise levels in the urban areas due to movement of vehicles. Therefore, the entire city of Lucknow has been divided in different zones on the basis of different land use. Effect of other factors like type of terrain, speed of traffic, cross section of roads and traffic composition has also been considered during noise data analysis. In this paper noise levels on the fly over in front of Engineering college (IET Lucknow UP India) has been taken for study and a noise barrier for this location has been designed for predicted noise levels worked
Fig. 3. Existing Flyover Geometry
Shukla A. K. An Approach for Design of Noise Barriers on Flyovers in Urban Areas in India

166
out using modified FHWA model. This model makes use of traffic data like volume, speed composition, slope, ground cover etc. A program in EXCEL was developed to work out barrier height using traffic and road geometry data. The height of noise barrier to reduce the noise level from 63.79 db to 55 db was found as 4.2 meters above the floor level of flyover.
References
Agent, K. R . 1981. Evaluation of Federal Highway Administration procedure for highway noise prediction. Washington, DC: Transportation Research Board. 5p.
Attenborough, K. 1982. Predicted ground effect for highway noise, Journal of Sound and Vibration 81(3): 413-423.
CPCB. 1991. Noise Levels in Metropolitan Cities, Part-1: Delhi. Delhi: Central Pollution Control Board. 26 p.
Harris, C. M. 1979. Handbook of noise control. New York: McGraw Hill 738 p.
Johnson, D. R.; Saunders, E. G. 1968. The Evaluation of Noise from Freely Flowing Road Traffic, Journal of Sound and Vibration 7(2): 287-309.
Mohan, S.; Dutta, N.; Sarin, S. M. 2002. Need for construction of noise barrier in India, Indian Highways 30(12): 27-40.
Shukla, A. K.; Jain, S. S.; Parida, M.; Srivastava, J. B. 2009. Performance of FHWA model for predicting traffic noise: A case study of metropolitan city, Lucknow (India), Transport 24(3): 234-240.
Shukla, A. K.; Jain, S. S.; Parida, M.; Srivastava, J. B. 2008. Performance of Traffic noise models for metropolitan cities, Environmental Engineering & Management Journal 7(4): 447-452.
International Journal for Traffic and Transport Engineering, 2011, 1(3): 158 – 167
Table 8 Calculated Values of Leq for Design of Barrier at Engineering College (IET Lucknow)
Time (Hrs.) Noise Level (Leq) dB (A)
Direction 1 Direction 2
7:00-8:00 AM 75.47 73.8
8:00-9:00 76.27 72.99
9:00-10:00 77.68 69.88
10:00-11:00 76.97 72.52
11:00-12:00 77.12 74.19
12:00-1:00 PM 76.62 72.44
1:00-2:00 76.75 72.45
2:00-3:00 76.14 73.66
3:00-4:00 76.19 75.69
4:00-5:00 75.68 74.58
5:00-6:00 75.16 75.31
6:00-7:00 76.23 76.05
7:00-8:00 75.45 75.8

167
PRISTUP PROJEKTOVANJU OGRADA ZA ZAŠTITU OD BUKE NA NADVOŽNJACIMA U GRADSKIM SREDINAMA U INDIJI
Arvind Kumar Shukla
Sažetak: Saobraćaj je značajan, često glavni uzročnik komunalne buke i zagađenja vazduha. Pitanje komunalne buke je od velike važnosti za zajednice koje žive u blizini gradskih saobraćajnica i glavnih koridora. S obzirom na porast nivoa buke duž auto-puteva od suštinskog značaja je smanjenje intenziteta buke na prihvatljiv nivo izgradnjom ograda za zaštitu od buke. Za potrebe ispitivanja postojećeg nivoa buke koju generišu vozila u gradskim sredinama, grad Laknau je podeljen na više zona prema prostornom planu grada. U radu su analizirani i drugi faktori: tip terena, brzina saobraćaja na deonicama, poprečni presek
puteva i tip vozila u saobraćaju. U ovom radu, predmet proučavanja je stepen buke na nadvožnjaku ispred Engineering College u Lankau, a ograda za zaštitu od buke na ovoj lokaciji projektovana je u odnosu na predviđene nivoe buke ustanovljene primenom modifikovanog FHWA modela. Ovaj model koristi saobraćajne podatke kao što su intenzitet, slaganje brzina, nagib, pokrivenost terena niskim rastućim biljem, itd. Razvijen je program u Excel-u kojim se definiše visina ograde na osnovu ulaznih saobraćajnih parametara, kao i geometrijskih karakteristika drumske saobraćajnice. Na osnovu dobijenih rezultata, utvrđeno je da visina ograde na kojoj bi se stepen buke smanjio sa 63,79db na 55db iznosi 4,2m iznad podnog nivoa nadvožnjaka.
Ključne reči: ograda za zaštitu od buke, FHWA model.
Shukla A. K. An Approach for Design of Noise Barriers on Flyovers in Urban Areas in India