an analytics-aware conceptual model for evolving graphs · an analytics-aware conceptual model for...
TRANSCRIPT
An Analytics-Aware Conceptual Model ForEvolving Graphs
Amine Ghrab1,2, Sabri Skhiri1, Salim Jouili1, and Esteban Zimanyi2
1 Eura Nova R&D, Mont-Saint-Guibert, [email protected]
2 Universite Libre de Bruxelles, [email protected]
Abstract. Graphs are ubiquitous data structures commonly used torepresent highly connected data. Many real-world applications, such associal and biological networks, are modeled as graphs. To answer thesurge for graph data management, many graph database solutions weredeveloped. These databases are commonly classified as NoSQL graphdatabases, and they provide better support for graph data managementthan their relational counterparts. However, each of these databases im-plement their own operational graph data model, which differ amongthe products. Further, there is no commonly agreed conceptual modelfor graph databases.In this paper, we introduce a novel conceptual model for graph databases.The aim of our model is to provide analysts with a set of simple, well-defined, and adaptable conceptual components to perform rich analysistasks. These components take into account the evolving aspect of thegraph. Our model is analytics-oriented, flexible and incremental, enablinganalysis over evolving graph data. The proposed model provides a typingmechanism for the underlying graph, and formally defines the minimalset of data structures and operators needed to analyze the graph.
1 Introduction
The relational model was considered for several decades as the default choicefor data modeling and management applications. However, with the rise of BigData, relational databases fell short of complex applications expectations. BigData refers to data generated at unpredictable speed, scale, and size from hetero-geneous sources, such as web logs and social networks. The distribution and va-riety of data makes ensuring ACID properties, required by the relational model,a very challenging task. This situation has lead to the development of new datamodels and tools, known as the NoSQL movement. NoSQL models are based ontrading consistency for performance according to the CAP theorem, in contrastto relational ACID properties.
NoSQL databases can be divided into four families, namely key/value stores,column stores, document databases, and graph databases. Of particular rele-vance to this paper is the analysis of graph databases. Graphs have the benefit
of revealing valuable insights from both the network structure and the dataembedded within the structure [1]. Complex real-world problems, such as in-telligent transportation as well as social and biological network analysis, couldbe abstracted and solved using graphs structures and algorithms. In this paperwe introduce a new graph modeling approach for effective analysis of evolvinggraphs. By evolving we mean the variation of the values of an attribute across adiscrete domain. Evolution could be over time, quantity, region, etc. In the cor-responding non-evolving graph, the information would be discarded when theattributes or the topology changes.
The model introduces a typing system that entails explicit labeling of thegraph elements. This might introduce a redundancy in the graph, since partof the facts could be discovered while traversing the data. However, we toleratethis redundancy in favor of richer and smoother analysis. Trading redundancy forthe sake of better performance is a frequent choice when it comes to designinganalytics-oriented data stores such as data warehouses. Within the proposedmodel, we define a set of operators to manipulate analytics-oriented evolvinggraphs. The goal is to help analysts navigate and extract relevant portions ofthe graph. Here, we provide the minimal set of operators. Nevertheless, richeranalysis scenarios could be achieved by combining these operators.
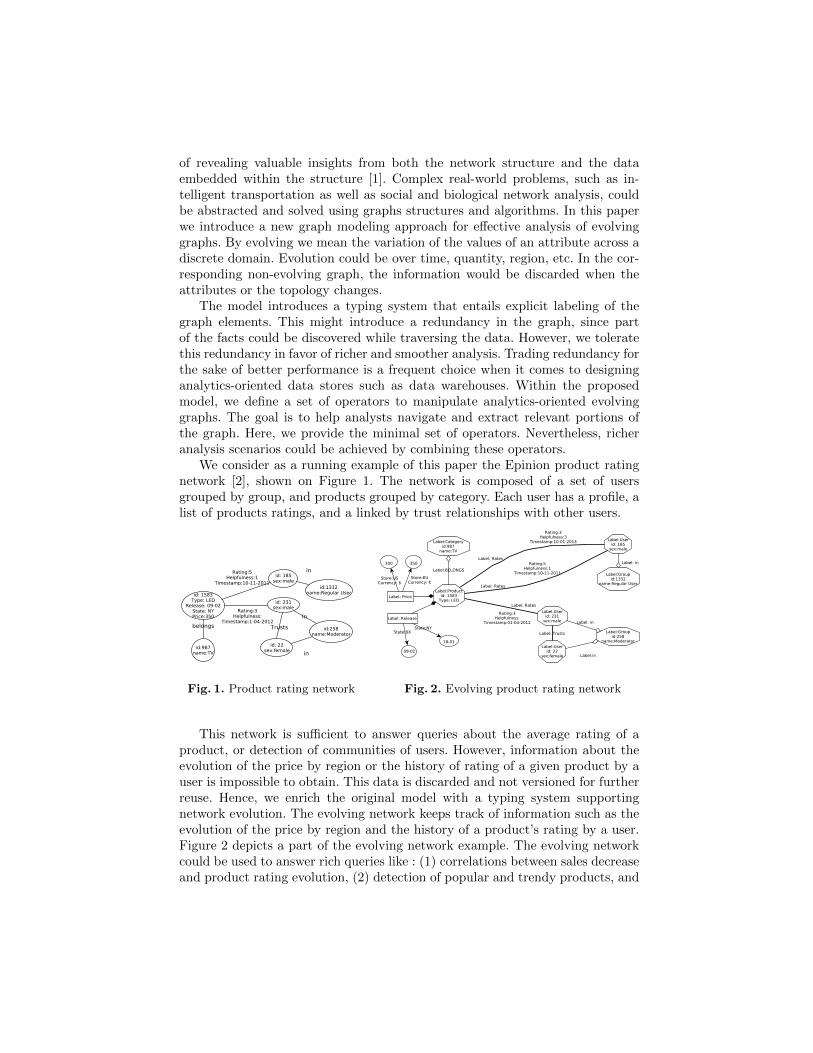
We consider as a running example of this paper the Epinion product ratingnetwork [2], shown on Figure 1. The network is composed of a set of usersgrouped by group, and products grouped by category. Each user has a profile, alist of products ratings, and a linked by trust relationships with other users.
Fig. 1. Product rating network Fig. 2. Evolving product rating network
This network is sufficient to answer queries about the average rating of aproduct, or detection of communities of users. However, information about theevolution of the price by region or the history of rating of a given product by auser is impossible to obtain. This data is discarded and not versioned for furtherreuse. Hence, we enrich the original model with a typing system supportingnetwork evolution. The evolving network keeps track of information such as theevolution of the price by region and the history of a product’s rating by a user.Figure 2 depicts a part of the evolving network example. The evolving networkcould be used to answer rich queries like : (1) correlations between sales decreaseand product rating evolution, (2) detection of popular and trendy products, and
(3) discovery of active and passive users. The previous queries could be thenreused in richer scenarios such as (4) recommendation of new products, and (5)targeted advertising for influential people in the network.
The contributions of our work are summarized as follows:
– We define of a conceptual model for evolving graphs. The model is designedto handle analytics over large graphs by means of a novel typing mechanism.
– We propose a comprehensive set of querying operators to perform interactivegraph querying through subgraph extraction functionalities.
– We describe a detailed use case of the model by reusing it as the ground formultidimensional analysis of evolving graphs.
The remainder of the paper is organized as follows. In Section 2, we developa conceptual model to represent analytics-oriented evolving graphs. Section 3defines the fundamental, general-purpose operators for querying the model. Sec-tion 4 demonstrates the usefulness of the proposed model for complex analyticsby using it as the basis for multidimensional analysis. Section 5 discusses relatedwork and compares it to our proposed model. Finally, Section 6 sketches futureworks and concludes the paper.
2 Evolving Graph Model
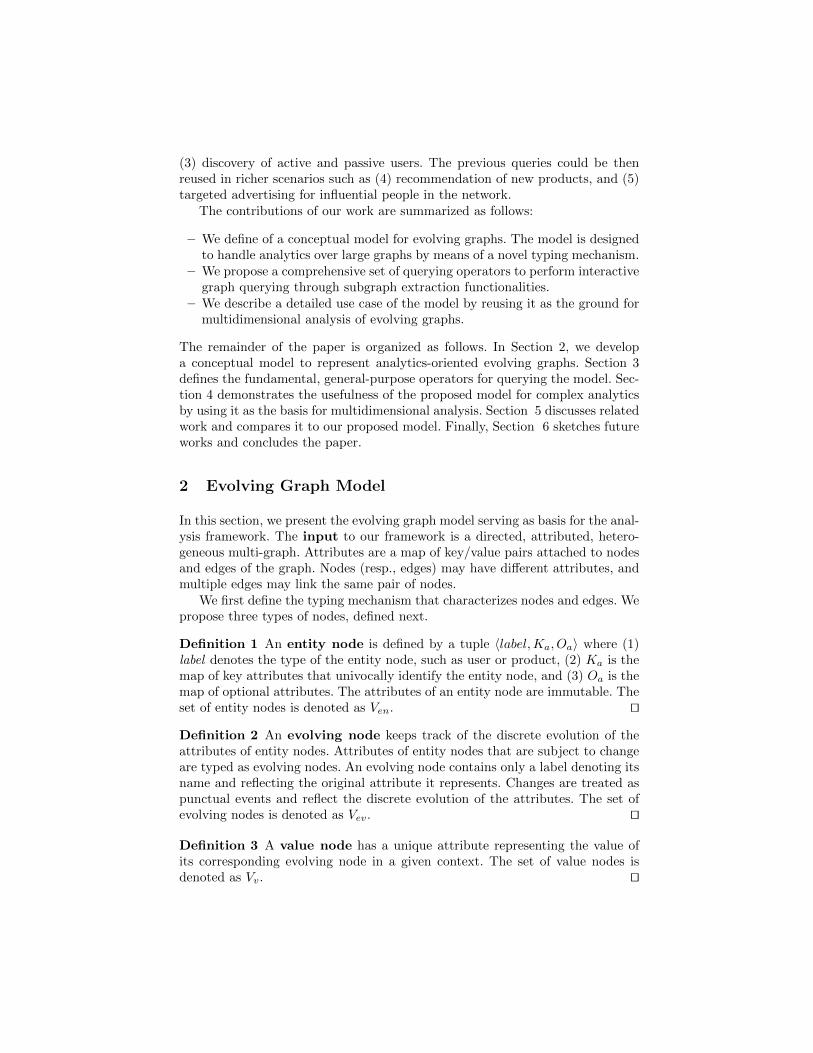
In this section, we present the evolving graph model serving as basis for the anal-ysis framework. The input to our framework is a directed, attributed, hetero-geneous multi-graph. Attributes are a map of key/value pairs attached to nodesand edges of the graph. Nodes (resp., edges) may have different attributes, andmultiple edges may link the same pair of nodes.
We first define the typing mechanism that characterizes nodes and edges. Wepropose three types of nodes, defined next.
Definition 1 An entity node is defined by a tuple 〈label,Ka, Oa〉 where (1)label denotes the type of the entity node, such as user or product, (2) Ka is themap of key attributes that univocally identify the entity node, and (3) Oa is themap of optional attributes. The attributes of an entity node are immutable. Theset of entity nodes is denoted as Ven. ut
Definition 2 An evolving node keeps track of the discrete evolution of theattributes of entity nodes. Attributes of entity nodes that are subject to changeare typed as evolving nodes. An evolving node contains only a label denoting itsname and reflecting the original attribute it represents. Changes are treated aspunctual events and reflect the discrete evolution of the attributes. The set ofevolving nodes is denoted as Vev. ut
Definition 3 A value node has a unique attribute representing the value ofits corresponding evolving node in a given context. The set of value nodes isdenoted as Vv. ut
We adopt the UML notation for relationships to represent the edges of thegraph. With regards to the nodes they link, we classify the edges as follows.Edges linking entity nodes are of two types:
Definition 4 An entity edge (denoted by ) describes the associationbetween two entity nodes. The set of entity edges is denoted as Een (Een ⊆Ven × Ven). ut
Definition 5 A hierarchical edge (denoted by ) depicts an aggrega-tion (i.e., part-of) relationship between two entity nodes. The set of hierarchicaledges is denoted as Eh (Eh ⊆ Ven × Ven). ut
Both of the above edge types have attributes and labels. If an edge between twoentity nodes evolves, it is replicated, and the new one is filled with the new value.We denote an entity (resp. hierarchical) edge as a tuple 〈label, Atts〉, where labelis the type of the relationship and Atts is the set of its attributes.
Definition 6 An evolving edge (denoted by ) represents a compo-sition relationship, i.e. a life-cycle dependency between nodes. It keeps track ofthe changing attributes extracted as new nodes. The set of evolving edges isdenoted as Eev (Eev ⊆ Ven × Vev). ut
Definition 7 A versioning edge (denoted by ) denotes a directedassociation between an evolving node and a value node. Evolving edges areattributed, where each attribute is a key/value pair describing the context forthe value node. The set of versioning edges is denoted as Ev (Ev ⊆ Vev × Vv). ut
We introduce now two new data entities oriented for analytics queries.
Definition 8 An analytics hypernode is an induced subgraph3,4 groupingan entity node, all its evolving and value nodes, and all edges between them.An analytics hypernode whose entity node is v is denoted as Γv = (V,E), whereV ⊆ (Ven ∪ Vev ∪ Vv) and E ⊆ (Eev ∪ Ev). Each node (resp., edge) is part ofonly one hypernode: ∀u ∈ V (resp., e ∈ E), ∃!Γv | u ∈ Γv (resp., e ∈ Γv). ut
Definition 9 A class is a label-based grouping. A class denotes a set of ana-lytics hypernodes whose underlying entity nodes share the same label. ut
With the input graph clearly defined, we introduce the graph model as follows.
Definition 10 An analytics-oriented evolving graph is a single graphG = (V, E , α, β, Λ, λ), where:
– V = {Ven, Vev, Vv} is the set of nodes.– E = {Een, Eh, Eev, Ev} is the set of edges.– α : (Ven ∪ Vev) −→ LV is the function that returns the label for each entity
or evolving node, where LV is the set of labels of entity and evolving nodes.
3 G2 = (V2, E2) is a subgraph of G1 = (V1, E1) if V2 ⊆ V1 and E2 ⊆ E14 G2 is an induced subgraph of G1 if all edges between V2 present in E1 are in E2
– β : (Een ∪ Eh) −→ LE is the function that returns the label for each entityor hierarchical edge. LE is the set of labels of entity and hierarchical edges.
– Λkey : (Ven ∪ Vv) −→ Dom(value) is the function that returns the valueof an attribute given its key. Λ is applied only to entity and value nodes.Dom(value) denotes the domain of value.
– λkey : (Een ∪ Eh) −→ Dom(value) is the function that returns the value ofan attribute given its key. λ is applied only to entity and hierarchical edges.Dom(value) denotes the domain of value. ut
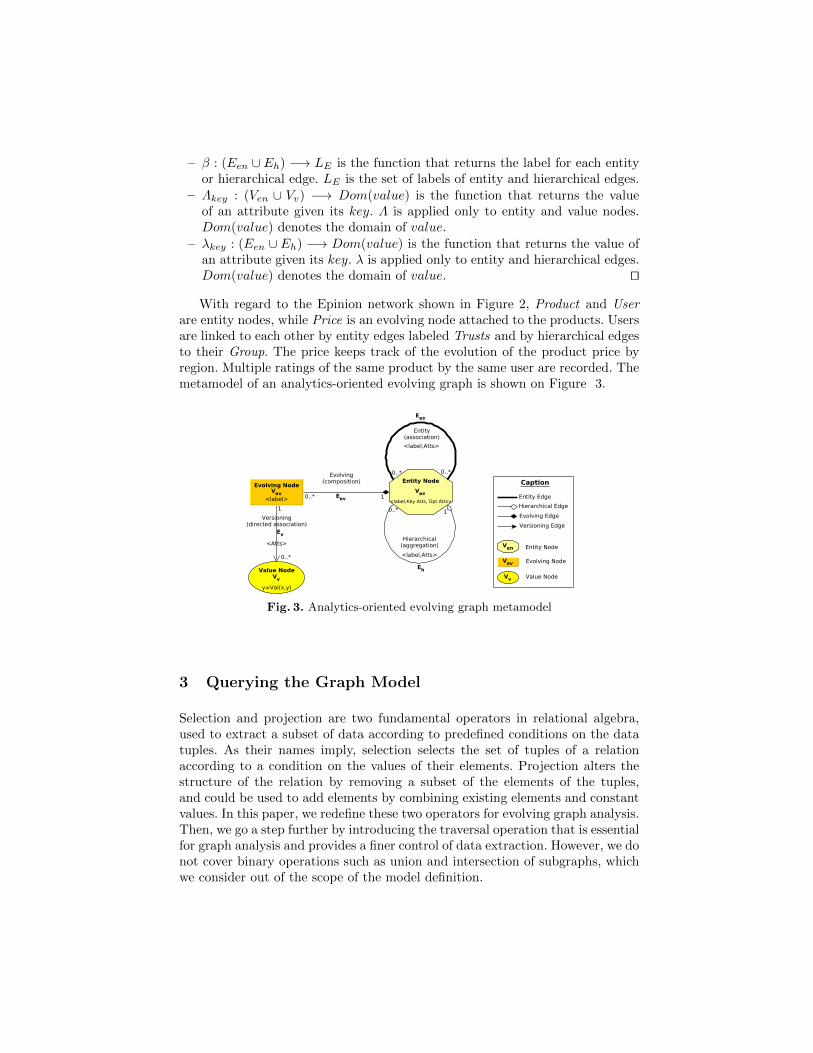
With regard to the Epinion network shown in Figure 2, Product and Userare entity nodes, while Price is an evolving node attached to the products. Usersare linked to each other by entity edges labeled Trusts and by hierarchical edgesto their Group. The price keeps track of the evolution of the product price byregion. Multiple ratings of the same product by the same user are recorded. Themetamodel of an analytics-oriented evolving graph is shown on Figure 3.
Fig. 3. Analytics-oriented evolving graph metamodel
3 Querying the Graph Model
Selection and projection are two fundamental operators in relational algebra,used to extract a subset of data according to predefined conditions on the datatuples. As their names imply, selection selects the set of tuples of a relationaccording to a condition on the values of their elements. Projection alters thestructure of the relation by removing a subset of the elements of the tuples,and could be used to add elements by combining existing elements and constantvalues. In this paper, we redefine these two operators for evolving graph analysis.Then, we go a step further by introducing the traversal operation that is essentialfor graph analysis and provides a finer control of data extraction. However, we donot cover binary operations such as union and intersection of subgraphs, whichwe consider out of the scope of the model definition.
All the proposed operators perform subgraph extraction operations. Givenan input graph G = (V, E , α1, β1, Λ1, λ1), we denote the produced subgraph asG′ = (V ′, E ′, α2, β2, Λ2, λ2) where:
– V ′ ⊆ V, and E ′ ⊆ E– α2(u) = α1(u),∀u ∈ V ′– β2(e) = β1(e),∀e ∈ E ′– Λ2(u) = Λ1(u), ∀u ∈ V ′en ∪ V ′v– λ2(u) = λ1(u), ∀e ∈ E′en ∪ E′h– Γv ⊆ G′, iff v ∈ V ′en.
These conditions are valid for the three following operators. For the remainderof the paper, asterisk (∗) denotes an optional parameter that could be suppliedmany times and |S| denotes the cardinality of a set S. We start by examiningthe selection.
Definition 11 A selection σ([NLabel,AttVals]*; [ELabel,AttVals]*)(G) is a partial5
subgraph extraction operation. It is applied on analytics hypernodes and theedges linking their entity nodes. It takes as input a list of the labels (NLabel)of the entity nodes Ven, underlying the targeted analytics hypernodes, (resp., alist of labels (ELabel) of their edges Een and Eh) and the corresponding valuesof their targeted attributes AttV als. A selection returns a partial subgraph G′of G where :
– α2(u) ∈ NLabel,∀u ∈ V ′en– β2(e) ∈ ELabel, ∀e ∈ (E′en ∪ E′h)– u ∈ V ′en iff α1(u) ∈ NLabel and ∃(ki, vi) ∈ AttV als|Λ1key
(u) = Vi, ∀key = ki– e ∈ E′en ∪ E′h iff β1(e) ∈ ELabel and ∃(ki, vi) ∈ AttV als | λ1key
(e) = vi,∀key = ki
– u ∈ V ′, iff ∃Γv ⊆ G′ | u ∈ Γv. ut
In the example of Figure 2, σ(User; Trusts)(Gepinion) detects the communi-ties of users trusting each other. This is accomplished by selecting all analyt-ics hypernodes whose entity nodes are labeled as User and linked by the en-tity edges labeled Trusts. The operation presented above is useful for modelspresenting intra-class relationships, i.e. relationships between analytics hypern-odes with the same label. A further step is to perform inter-class selections. Inthis case, selection applies on an heterogeneous set of entity nodes and edges.σ(Product; User; Rates)(Gepinion) is an inter-class selection. It selects the networkcomprised of Rates relationships, Product and User analytics hypernodes.
Definition 12 A projectionπ(EvLabel, {ValSet}){G, NLabel} is an induced sub-graph extraction operation. It is applied on a single class of analytics hypernodes,selected through NLabel. Other analytics hypernodes remain untouched by thisoperation. Evolving nodes whose label is not in EvLabel are removed from thetargeted analytics hypernodes. It further narrows the range of values in the re-sulting subgraph by specifying for each versioning edge a key/value map of therequested values, {V alSet}. A projection returns an induced subgraph G′ where:
5 G2 is a partial subgraph of G1 if a subset of the edges between V2 from E1 is in E2
– E ′ = E ∩ (V ′ × V ′)– u ∈ V ′en iff α1(v) ∈ NLabel– u ∈ V ′ev iff :α1(u) ∈ EvLabel and ∃Γv ⊆ G′ | u ∈ Γv
– u ∈ V ′v iff: ∃Γv ⊆ G′ | u ∈ Γv and ∃ e = (u, ue), e ∈ E′v | ue ∈ Γv and∃(ki, vi) ∈ V alSet|λ1key
(e) = vi, ∀key = ki. ut
For the network of Figure 2, π(Price, (Store,{EU,ME}))(Gepinion, P roduct) actsonly on Product hypernodes. It extracts the subgraph containing as evolvingnodes only the Price. And for the Price Value nodes, only those representing EUand ME stores are kept, i.e, the US store is dropped from the resulting graph inall Product analytics hypernodes.
Definition 13 A traversal τ(Start,Pattern) is a subgraph extraction operation.A traversal starts from an entity node and follows a guided navigation on thegraph according to given rules. Traversal only navigates between entity nodes.However, the navigation rules could be applied at any node or edge to decidewhether to include the current entity node, i.e., rules are applied to entity nodesattributes as well as any of their analytics hypernode internal edges and nodes.We refer to these navigation rules as patterns, and hence the subgraph extrac-tion becomes a pattern matching operation. A pattern is a finite sequence ofconditions dictating the navigation steps. At each node (u ∈ Ven) and edge(e ∈ Een ∪ Eh), the next step is defined by an expression applied on the labelsor the attributes of the current element. For a step i, a pattern dictates the nextelements to visit, and could be a combination of the following statements:
– u ∈ Ven|α(u) = labeli, dictates the next nodes based on the supplied label– e ∈ (Een ∪ Eh)|β(e) = labeli, dictates the next edges based on the label– u ∈ Ven|Λkey(u) = vali, dictates the next nodes based on the supplied
attribute value– e ∈ (Een ∪Eh)|λkey(e) = vali, dictates the next edges based on the supplied
attribute value
τ is applied as follows: τ(Start,Pattern)(G) and returns a partial subgraph of theinput graph. Steps are separated by dashes (−). ut
A typical traversal scenario is the following query, applied on the exampleshown in Figure 2: for a user A, return all products she didn’t rate, and whosetrusted contacts have already rated above four. Such a query is useful in a rec-ommendation engine. This operation is expressed as follows:τ(UserA,Pattern)(Gepinion), where Pattern = [e ∈ Een | β(e) = Trust]− [∗]− [e ∈Een | β(e) = Rates & λRating(e) ≥ 4]− [u ∈ Ven | (u, UserA) /∈ E ].
In relational databases, the join operation introduces a heavy workload espe-cially for highly connected tables [3]. In graphs, data is embedded within nodesconnected through edges. The cost of running traversals within graphs is muchlower than the equivalent joins in relational tables [4]. This makes graphs moresuitable for highly connected data compared to relational tables. Moreover, asexplained in Section 5, many of current graph databases provide partial or fullsupport ACID properties.
The data structure and operations defined above yield the ground for definingan algebra for evolving graph data. However, this should be further investigatedand enriched for the sake of completeness.
4 Multidimensional Graph Analysis
Data warehousing provides a particularly interesting use case for the implemen-tation of our model. The subject-oriented and integrated view of data, providedby the data warehouse, makes it a suitable backbone for common analysis tech-niques such as reporting, complex querying, and data mining algorithms. Weassume that the input graph is designed according to the metamodel definedabove. The identification, versioning and insertion of the incoming nodes andedges in the studied graph is done through the ETL phase. The evolving aspectof the graph brings new challenges to the design of the ETL process. Such issuesinclude, but are not limited to, the definition of new entity nodes and labels,the detection of new evolving attributes and the attachment of new values toevolving attributes. Due to space limitations, we have chosen to limit the ap-plication of our model to OLAP analysis. In this section, we briefly describemultidimensional concepts using the graph model proposed in the Section 2.
We limit the study to the structures and a subset of the operators definedin the reference algebra described in [5]. However, further research is needed todevice new operators uniquely useful in evolving graphs. OLAP analysis enablesus to discover hidden facts and relationships between users and products, suchas user satisfaction, evolution of trendy categories, and influential groups.
Figure 4 illustrates the proposed multidimensional modeling stack. The phys-ical level switches the focus from elementary nodes and edges to class and inter-class relationships. The logical level encapsulates classes into dimensions andaggregates their relationships. The logical level is similar to ROLAP star schemain that it organizes the studied domain into dimensions and prepares the cubeconstruction. The conceptual level abstracts the graph data using cubes, andproposes user-friendly operations. Physical level has been described in detail inSection 2, and serves as the ground for various analysis techniques. We focusnow on the logical and conceptual level, relevant to multidimensional analysis.
4.1 Data Structures
Dimensions Within our model, a dimension is a tree of classes. A dimensionD is defined by a tuple 〈name, Tree〉, where name denotes the name of thedimension and Tree is the tree of classes. The root of the tree is the highestclass in the dimension hierarchy. A class could be involved in only one dimension.Each level is identified by the class label.
In our product rating network example, the Item dimension DItem is denotedas 〈Item, ILevels〉, where ILevels = [Product→ Category] and → denotes thehierarchical relationship between classes. The shift from class to dimension isdepicted on Figure 4, where the classes Product and Category are grouped inthe same dimension, Item.
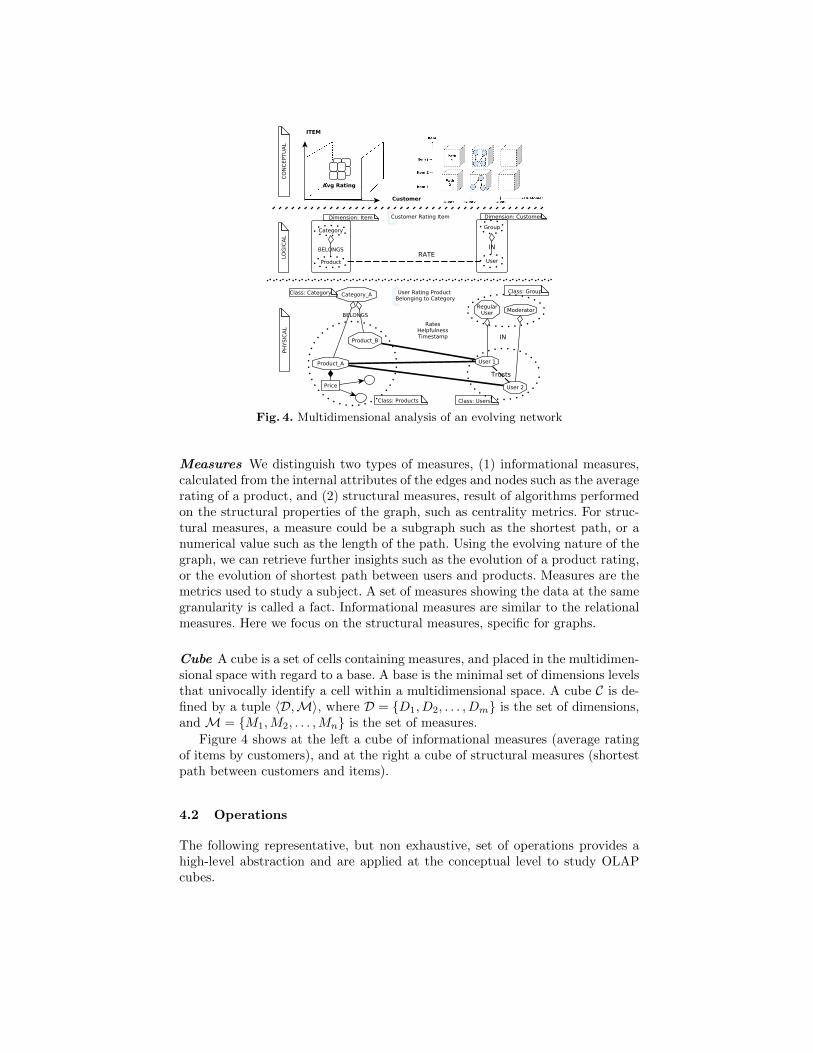
Fig. 4. Multidimensional analysis of an evolving network
Measures We distinguish two types of measures, (1) informational measures,calculated from the internal attributes of the edges and nodes such as the averagerating of a product, and (2) structural measures, result of algorithms performedon the structural properties of the graph, such as centrality metrics. For struc-tural measures, a measure could be a subgraph such as the shortest path, or anumerical value such as the length of the path. Using the evolving nature of thegraph, we can retrieve further insights such as the evolution of a product rating,or the evolution of shortest path between users and products. Measures are themetrics used to study a subject. A set of measures showing the data at the samegranularity is called a fact. Informational measures are similar to the relationalmeasures. Here we focus on the structural measures, specific for graphs.
Cube A cube is a set of cells containing measures, and placed in the multidimen-sional space with regard to a base. A base is the minimal set of dimensions levelsthat univocally identify a cell within a multidimensional space. A cube C is de-fined by a tuple 〈D,M〉, where D = {D1, D2, . . . , Dm} is the set of dimensions,and M = {M1,M2, . . . ,Mn} is the set of measures.
Figure 4 shows at the left a cube of informational measures (average ratingof items by customers), and at the right a cube of structural measures (shortestpath between customers and items).
4.2 Operations
The following representative, but non exhaustive, set of operations provides ahigh-level abstraction and are applied at the conceptual level to study OLAPcubes.
Slice Removes a dimension from a cube. Slice[D,V alue](C) operates on the cubeC, and returns the subset of cells for which the value of dimension D is set toV alue. In the cube of shortest path evolution of Figure 4, Slice[Item,id=10](C) lim-its the set of studied items to one item whose id=10. This cube is computed afterextracting the subgraph of the specific item from the graph of all items, throughthe selection operator of Section 3, σ([Product, (id,10)]; User; Rates)(Gepinion)
Dice Selects a subset of measures from the cube using a set of conditionson multiple dimensions. This operation is similar to slice, but operates on arange of values of a dimension, and on multiple dimensions at the same time.Dice[User,id=10..30;Item,id=1..15](C), returns a subcube for which users and itemsidentifiers are limited to the specified ranges.
Roll-Up Aggregates classes sharing a common hierarchy using the hierarchicaledges. This produces a summary graph with new nodes and edges that are notnecessarily present in the original graph. Aggregations could be asynchronous.We could for example study relationships between Category and User ratherthan Category and Group. The roll-up operators performs structural changes tothe graph. If the attributes of the elements involved in the aggregation are addi-tive, an overlay is performed and the attributes values are simply incremented.Otherwise, graph summarization techniques such as those discussed on [6–8]could be used to implement the roll-up operation.
5 Related Work
Graph analytics are gaining a lot of momentum in the data management commu-nity in recent years. A survey of graph database models according to their datamodel, data manipulation operators, and integrity constraints is given in [1]. Cur-rent graph databases implement different general purpose data models, withouta commonly agreed conceptual modeling approach. Neo4j6 is a centralized graphdatabase implementing the property graph7 model and guaranteeing ACID con-straints. Titan8 is a distributed graph database implementing property graphsand supporting ACID and partial consistency. Graph querying is made eitherusing traversal-oriented languages such as Gremlin9, SQL-like languages such asCypher, or through the database core API. Our model could be implementedusing any graph database that supports the input graph described on Section 2.RDF is a widespread data model in the Web community, and could be an imple-mentation candidate for our conceptual model. Pregel [9], and its open sourceimplementation Giraph10, are BSP graph processing frameworks designed to ex-ecute efficiently graph algorithms. Ren et al. [10] proposed an approach to com-pute graph-specific measures such as shortest path and centrality within a graph
6 http://neo4j.org/7 https://github.com/tinkerpop/blueprints/wikiproperty-graph-model8 http://thinkaurelius.github.com/titan/9 https://github.com/tinkerpop/gremlin/wiki
10 http://giraph.apache.org/
with gradually changing edge sets. In [11], the authors present a distributedgraph database system for storing and retrieving the state of the graph at spe-cific time points. Both of these two papers are based on the redundancy offeredby historical graphs trace. The analysis tasks are limited to graphs specific mea-sures and indices with no querying or multidimensional view of data. Moreover,we consider the historical variation as a specific case of graph evolution scenarios.Related research on versioning was done by the database community. In [12], theauthors suggested a conceptual model for evolving object-oriented databases bystudying the evolution of objects values, schema and relationships between theobjects. Although some concepts are similar, modeling the versioning dependson the data structures specific for each data model. Multidimensional analysis ofgraphs data has been first proposed in [8]. The authors introduce informationaland topological dimensions. Informational aggregations consist of edge-centricsnapshot overlaying and topological aggregations consist of merging nodes andedges by navigating through the nodes hierarchy. However, the analysis is lim-ited to homogeneous graphs. GraphCube [7] is applied in single large centralizedweighted graph and do not address different edges attributes. Yin et al. [13]introduced a data warehousing model for heterogeneous graphs. They enrichedthe informational and topological dimensions with the Entity dimension and theRotate and Stretch operations along with the notion of metapath to extract sub-graphs based on edges traversals. However, HMGraph did not provide semanticsof OLAP operations on the proposed graph data model. Distributed processingframeworks such as Hive [14] propose data warehousing on top of large volumeof data. However, they are considering only the relational model.
6 Conclusions and Future Work
In this paper, we designed a conceptual model for evolving graphs. A plethora ofgraph database tools is currently developed with multiple management features.However, they do not address the management of evolving networks. Moreover,no common conceptual model for efficient analysis of large evolving networksis agreed. We have proposed our contribution to evolving graph analysis by in-troducing a well defined conceptual model. We illustrated the model with anapplication on the multidimensional analysis. However, large networks analysisrequires more work to build a complete stack of analysis framework. As futurework we plan to proceed in warehousing the evolving graphs. Further funda-mental operations such as graph aggregations should be investigated for theevolving graphs. A framework for graph data warehousing should integrate anETL module, which takes care of matching and merging tasks and provides agraph compliant to the proposed model. An exhaustive study of new OLAP op-erators in evolving graphs is needed. Current graph querying languages such asCypher should be extended to support multidimensional queries in an MDX-likefashion. Moreover, distributed processing frameworks should be integrated forlarge graphs processing.
Acknowledgment
This work has been partially funded by the Wallonia Region in Belgium (GrantFIRST-ENTERPRISES N◦ 6850).
References
1. Angles, R., Gutierrez, C.: Survey of graph database models. ACM Comput. Surv.40(1) (2008) 1:1–1:39
2. Tang, J., Liu, H., Gao, H., Das Sarmas, A.: eTrust: understanding trust evolu-tion in an online world. In: Proceedings of the 18th ACM SIGKDD internationalconference on Knowledge discovery and data mining, ACM (2012) 253–261
3. Vicknair, C., Macias, M., Zhao, Z., Nan, X., Chen, Y., Wilkins, D.: A comparisonof a graph database and a relational database: a data provenance perspective.In: Proceedings of the 48th Annual Southeast Regional Conference, ACM (2010)42:1–42:6
4. Sadalage, P.J., Fowler, M.: NoSQL Distilled: A Brief Guide to the Emerging Worldof Polyglot Persistence. Addison-Wesley Professional (2012)
5. Romero, O., Abello, A.: On the need of a reference algebra for OLAP. In: Pro-ceedings of the 9th International Conference on Data Warehousing and KnowledgeDiscovery, Springer (2007) 99–110
6. Tian, Y., Hankins, R.A., Patel, J.M.: Efficient aggregation for graph summa-rization. In: Proceedings of the 2008 ACM SIGMOD international conference onManagement of data, ACM (2008) 567–580
7. Zhao, P., Li, X., Xin, D., Han, J.: Graph cube: on warehousing and OLAP mul-tidimensional networks. In: Proceedings of the 2011 ACM SIGMOD InternationalConference on Management of data, ACM (2011) 853–864
8. Chen, C., Yan, X., Zhu, F., Han, J., Yu, P.S.: Graph OLAP: a multi-dimensionalframework for graph data analysis. Knowl. Inf. Syst. 21(1) (2009) 41–63
9. Malewicz, G., Austern, M.H., Bik, A.J., Dehnert, J.C., Horn, I., Leiser, N., Cza-jkowski, G.: Pregel: a system for large-scale graph processing. In: Proceedings ofthe 2010 ACM SIGMOD International Conference on Management of data, ACM(2010) 135–146
10. Ren, C., Lo, E., Kao, B., Zhu, X., Cheng, R.: On querying historical evolvinggraph sequences. Proceedings of the VLDB Endowment 4(11) (2011) 726–737
11. Khurana, U., Deshpande, A.: Efficient snapshot retrieval over historical graphdata. arXiv preprint arXiv:1207.5777 (2012)
12. Andonoff, E., Hubert, G., Parc, A., Zurfluh, G.: Modelling inheritance, composi-tion and relationship links between objects, object versions and class versions. InIivari, J., Lyytinen, K., Rossi, M., eds.: Advanced Information Systems Engineer-ing. Volume 932 of Lecture Notes in Computer Science. Springer Berlin Heidelberg(1995) 96–111
13. Yin, M., Wu, B., Zeng, Z.: HMGraph OLAP: a novel framework for multi-dimensional heterogeneous network analysis. In: Proceedings of the 15th inter-national workshop on Data warehousing and OLAP, ACM (2012) 137–144
14. Thusoo, A., Sarma, J.S., Jain, N., Shao, Z., Chakka, P., Anthony, S., Liu, H., Wyck-off, P., Murthy, R.: Hive: a warehousing solution over a map-reduce framework.Proceedings of the VLDB Endowment 2(2) (2009) 1626–1629