an analysis of tritium releases - digital library/67531/metadc868001/m2/1/high... · an analysis of...
TRANSCRIPT


AN ANALYSIS OF TRITIUM RELEASES TO THE ATMOSPHERE BY A CTR
David S. RennGi., William F. Sandusky-t, and M. Te r ry Dana*
?Applied Meteorology Sec t i on and "Atmospheric Dynamics and Chemistry Sec t i on
Atmospheric Sc iences Department
October 1975
B a t t e l l e , P a c i f i c Northwest Labo ra to r i e s Richland, Washington 99352

ACKNOWLEDGEMENTS
This report summarizes a study conducted by Battelle, Pacific
Northwest Laboratories (Battelle-Northwest) for the Division of Controlled
Thermonuclear Research of the Energy Research and Development Administra-
tion under Contract No. AT(45-1)-lS30. The authors wish to thank Mssrs.
J. L. Heffter and G. J. Ferber of the National Oceanic and Atmospheric
Administration's Environmental Research Laboratories, Silver Spring,
Maryland, for providing the computer analysis of local and regional ground
level normalized concentrations. Mr. R. K. Woodruff of the Atmospheric
Sciences Department, Battelle-Northwest, provided many helpful comments
and suggestions.

LIST OF FIGURES
TABLE OF CONTENTS
Page
i i i
LIST OF TABLES i. v
NOMENCLATURE v
ABSTRACT 1
1. INTRODUCTION 3
2. THE BEHAVIOR OF TRITIUM IN THE ENVIRONMENT
2.1 Emissions from Controlled Thermonuclear Reactors 5
2.2 Transformation Processes in the Atmosphere 6
2.3 Global Transport of Tritium and the Hydrometeorological Cycle 7
3. SCAVENGING OF TRITIUM BY PRECIPITATION 9
3.1 Theory of Scavenging
3.2 Below-Cloud Equilibrium Scavenging
3.3 In-Cloud Scavenging
3.4 Alternatives and Limitations on Models
4. ANALYSIS OF TRITIUM CONCENTRATIONS IN THE HYDROSPHERE 2 1
4.1 Phase 1: Estimated Average Ground-level Concentrations Near the Plant 2 1
4.2 Phase 2: Estimated Average Ground-level Concentrations in the Eastern Half of United States 24
4.3 Average Surface Water Concentrations near a CTR Plant 2 4
4.4 Phase 3: Estimated Latitudinal and Global Average Atmospheric and Surface Water Tritium Concentrations 3 0
4.5 Summary of Normal Operation Impacts 4 2
4.6 Accidental Releases of Tritium 4 4
5. CONCLUSIONS AND FUTURE RESEARCH NEEDS 4 9
6. REFERENCES 5 1

LIST OF FIGURES
Figure
Figure 3.1
Figure 3.2
Figure 3.3
Figure 4.1
Figure 4.2
Figure 4.3
I Figure 4.4
Figure 4.5
Figure 4.6
Figure 4.7
Title Page
Amount of Tritium in Rainwater for Equilibrium 13 and Non-Equilibrium Conditions as a Function of Distance.
Q(x)/Qo as a Function of Release Height (h), 14 Rainfall Rate (J), and Downwind Distance (x).
Henry's Constant (H*) as a Function of Temperature. 18
Ground-Level Air Concentration Values of Tritium 2 3 for an Area Near Morris, Illinois.
Ground-Level Air Concentration Values of Tritium 2 5 for the Eastern United States.
Normalized Surface Water Concentration (xg/Q) 2 9 as a Function of Distance (x).
Schematic of the Box Model Approach to Computing 3 1 Atmospheric and Surface Water Tritium Concentra- tions by Latitude Belt.
Mean Meridional Transport of Water Vapor and 3 5 Surface Water Based on Values Published in Sellers (1965).
Variation of Normalized Tritiated Water Concen- 4 1 tration Per Unit Area.
The Effect of Rainfall Rate on Normalized Surface 4 8 Water Concentration.

LIST OF TABLES
TABLE 3.1
TABLE 3.2
TABLE 4.1
TABLE 4.2
TABLE 4 . 3
TABLE 4 . 4
TABLE 4 . 5
TABLE 4.6
Input Conditions Used in EPAEC Linear Model
Values of Ratio and Fraction of Raindrop Concentrations of HTO Contributed by Cloud- Drop Scavenging
Surface Water Tritium Concentration (X ) for Various Distances from the Source. g
Parameters Used for Computation of Atmospheric and Surface Water Tritium Concentrations by Latitude Belt (From, Sellers, 1965)
Average Ground-Level Atmospheric and Surface Water Concentrations by Latitude Belt for Land Masses (W = 0 . 5 m) and Oceans (W = 75 m) Assuming a 1 ~i-year-] Release in Latitude 30" - 50" N .
Page
12
Average Ground-Level Atmospheric and Surface 4 0 Water Concentrations by Latitude Belt for Land and Ocean Areas Incorporating Global "Background".
Summary of Maximum Allowable Emissions (MAE) of 4 3 Tritium to the Atmosphere by a Normal CTR Operation Based on Atmospheric (xa) and Surface Water (xg) Concentrations.
Surface Water Concentrations of Tritium During 4 7 Occurrence of Maximum Rainfall Rates Following a CTR Accident.

NOMENCLATURE
Symbo 1
A
C
D
E
H ' He
HT
HTO
J
k
K
L
MAE
Mev
MPC
Definition
area of precipitation, m 2
- 3 raindrop concentration, mass-cm
deuterium 3 -1
annual areal evaporation, m -yr - 3
Henry's Law solubility factor, mass-cm
he 1 ium
tritium gas
tritiated water vapor - 1 - 1 - 1
rainfall rate, m-sec , m-hour or m-year - 1
effective scavenging coefficient, sec
mass transfer coefficient
effective thickness of a polluted layer, m
maximum allowable emission
million electron volts
maximum permissible concentration 3 -1 annual areal precipitation, m -yr
- 1 tritium point source emission rate to the atmosphere, Ci-yr
- 1 tritium area source emission rate to the atmosphere, Ci-yr - 1
tritium area source emission rate to surface water, Ci-yr
accidental tritium release, Ci
raindrop radius, cm - 2 - 1 rain flux, mass-cm -sec
time
tritium - 1
mean wind speed, m-sec - 1
terminal velocity of fall of a raindrop, cm-sec
depth of atmospheric precipitable water, m
depth of the groundwater mixing layer, m - 1 - 1
scavenging rate (cross-plume integrated flux) mass-m -sec
distance downwind, m
distance crosswind, m

collection efficiency - 1
constant scavenging coefficient , sec neutron
3 3 -1 absolute humidity (m H 0 - m air ) 2 3
density of water, gm-liter-l
standard deviation of plume parameter, m - 3 atmospheric pollutant concentration, Ci-m
surface water pollutant concentration, ~i-liter-'
Subscripts
atmospheric
cent erl ine
equilibrium
surface water
ground-level
water
horizontal
vertical

AN ANALYSIS OF TRITIUM RELEASES TO THE ATMOSPHERE BY A CTR
David S. ~enn ; , William F. Sandusky, and M. Terry Dana
ATMOSPHERIC SCIENCES DEPARTMENT B a t t e l l e , P a c i f i c Northwest Labora tor ies
Richland, Washington 99352
ABSTRACT
Removal by atmospheric processes of r o u t i n e l y and a c c i d e n t a l l y
r e l ea sed t r i t i u m from a c o n t r o l l e d thermonuclear r e a c t o r (CTR) has been
i n v e s t i g a t e d . Based on prev ious s t u d i e s , t h e assumed form of t h e t r i t i u m
f o r t h i s a n a l y s i s was HT0, o r t r i t i a t e d water vapor. Assuming a CTR
opera t ion i n Morris, I l l i n o i s , s u r f a c e water and ground-level a i r concen-
t r a t i o n va lues o f tritium were computed f o r t h r e e space (or t ime) s c a l e s :
l o c a l (50 Km o f a p l a n t ) , r eg iona l (up t o 1000 Km o f t h e p l a n t ) , and g loba l .
Resu l t s of t h i s a n a l y s i s show t h a t wi th in 50 Km of t h e p l a n t atmos-
p h e r i c concent ra t ions o f t r i t i u m w i l l be t h e l i m i t i n g f a c t o r f o r r o u t i n e
r e l e a s e s . On t h e r eg iona l and g loba l s c a l e , s u r f a c e water concent ra t ions
tend t o become t h e l i m i t i n g f a c t o r . However, both a i r and s u r f a c e water
tritium concent ra t ions a r e es t imated t o be below e x i s t i n g s tandards dur ing
normal commercial CTR ope ra t i ons .
An a n a l y s i s f o r an acc iden ta l r e l e a s e o f t r i t i u m shows s u r f a c e water
concent ra t ions i n t h e v i c i n i t y o f t h e p l a n t t o be q u i t e high a f t e r a r a in -
f a l l . Concentrat ions could be 1 o r 2 o rde r s o f magnitude above accepted
s tandards i f t h e amount o f a c c i d e n t a l l y r e l ea sed t r i t i u m now pos tu l a t ed
(10 Kgms) occurred.

Future work should b e d i r e c t e d toward b e t t e r unders tand ing o f t h e
a tmospher ic scavenging p r o c e s s e s o f t r i t i a t e d g a s e s , t h e r e g i o n a l and g l o b a l
t r a n s p o r t o f tritium i n t h e hydrometeorologic c y c l e , and b e t t e r d e f i n i t i o n
o f t h e p r o b a b i l i t y and magnitude o f extreme c l i m a t i c e v e n t s t h a t would
r e s u l t i n e x c e s s i v e c o n c e n t r a t i o n s o f t r i t i u m i n t h e atmosphere and s u r f a c e
wa te r s u p p l i e s .

1. INTRODUCTION
The C o n t r o l l e d Thermonuclear Reac to r (CTR) is a new technology i n
e l e c t r i c a l power p r o d u c t i o n t h a t cou ld p rov ide f u t u r e g e n e r a t i o n s wi th an
a lmost u n l i m i t e d s o u r c e o f e l e c t r i c i t y and a t t h e same t ime produce on ly a
minimum o f environmental impact. With o u r p r e s e n t s u p p l i e s o f f u e l s used
i n power g e n e r a t i o n dwindl ing a t a r a p i d r a t e , t h i s new technology, which
c o n t r o l s t h e f u s i o n p r o c e s s and u s e s f u e l s t h a t a r e i n abundant supp ly ,
w a r r a n t s i n t e n s i v e i n v e s t i g a t i o n and development. Never the less t h e environ-
mental r i s k s a s s o c i a t e d wi th t h i s technology a r e p o o r l y unders tood , and
t h e s e must b e s t u d i e d a long w i t h t h e development o f t h e technology. T h i s
paper p r e s e n t s an a n a l y s i s o f t h e e s t i m a t e d c o n c e n t r a t i o n s i n t h e env i ron-
ment o f t h e main e f f l u e n t expected t o b e e m i t t e d from t h e CTR's -- t r i t i u m .
T h i s i s o t o p e o f hydrogen was f i r s t d i s c o v e r e d by D r . Luis Alvarez and h i s
c o l l e a g u e s i n t h e l a t e 1 9 3 0 1 s , and h a s s i n c e found wide a p p l i c a t i o n by
many s c i e n t i s t s i n t r a c i n g components o f t h e h y d r o l o g i c c y c l e . The i s o t o p e
undergoes a r e a c t i o n f a v o r i n g t h e format ion o f t r i t i a t e d wate r vapor once
r e l e a s e d i n t o t h e environment, and t h e n behaves e s s e n t i a l l y a s any o t h e r
wa te r vapor molecule .
The a n a l y s i s o f t r i t i u m c o n c e n t r a t i o n s i n t h e hydrosphere expected
from CTR power p l a n t s f o l l o w s t h r e e phases , o r t i m e and space f rames, based
on an a n a l y s i s by Machta, e t a l . (1973), o f r a d i o a c t i v e e f f l u e n t s r e l e a s e d
t o t h e atmosphere from a proposed Liquid Metal Fas t Breeder Reac to r l o c a t e d
i n Morr i s , I l l i n o i s . Phase 1 s t u d i e s g round- leve l a tmospher ic and s u r f a c e
wa te r t r i t i u m c o n c e n t r a t i o n s w i t h i n 50 Krn o f t h e proposed CTR under normal

operating conditions. Phase 2 studies regional ground-level atmospheric
concentrations (up to lGOO Km) at any given time during the normal operation
of the plant. Phase 3 examines the expected long term concentrations in
the air and surface water supply throughout the northern hemisphere and
globally during the normal operation of the plant. In addition, an
analysis of surface water concentrations near the plant after an accidental
large release of tritium during a rainfall episode is presented. Before
this analysis is presented, however, it is appropriate to present a qualita-
tive discussion of the behavior of tritium when released to the environment
to set the stage for the rationale used in the computational procedures.

2. THE BEHAVIOR OF TRITIUM IN THE ENVIRONMENT
2.1 Emissions from Controlled Thermonuclear Reactors
Several CTR technologies have been proposed, and each differs
slightly in the fuel cycle, plasma confinement, and overall powerplant
design. A summary of each design has been published by Young, et al.
(1975). It is expected that, due to stringent plasma conditions, the
fuels used in the initial plants will be deuterium and tritium. The
reaction equation is given by:
D + T -t 4 ~ e + q + 17.6 Mev (1)
The tritium fuel used in this reaction will need to be fabricated
since adequate natural supplies do not exist. Tritium can be produced
by bombarding lithium with neutrons, and indications are that blankets
can be designed for D-T fusion reactors which will breed tritium
(Young, et a1 . , 1975) .
The major effluent from virtually all CTR designs will be tritium.
Most designs use a liquid metal cooling blanket, which is expected to
contain large quantities of tritium. Although many techniques have
been proposed to contain the tritium, it is expected that large amounts
will permeate through the heat exchanger and on through the heat trans-
fer system. One proposed design uses a gas cooling system, and here
large quantities of tritium are expected to penetrate the heat
exchanger and enter the steam system, and from there be released into
the environment through steam blowdowns. Although many tritium con-

t a inment sys tems a r e proposed f o r t h e r e a c t o r , t h e y become economical ly
u n f e a s i b l e f o r t h e powerplant steam t u r b i n e sys tem. Thus it i s
assumed t h a t a l l t r i t i u m e n t e r i n g t h e steam g e n e r a t i o n sys tem w i l l be
r e l e a s e d i n t o t h e environment th rough steam wastewater s t r eams and
v e n t i l a t i o n a i r . These emiss ions a r e expec ted t o be s e v e r a l o r d e r s
of magnitude g r e a t e r t h a n wi th f i s s i o n powerp lan t s d u r i n g normal
o p e r a t i o n , and can c o n s t i t u t e a p o s s i b l e environmental haza rd i n an
a c c i d e n t s i t u a t i o n , p a r t i c u l a r l y i f a l i q u i d meta l f i r e b r e e c h e s t h e
r e a c t o r conta inment w a l l s .
T r i t i u m r e l e a s e s i n t o t h e environment from n u c l e a r power p l a n t s
a r e expec ted t o exceed t h e n a t u r a l r a t e o f t r i t i u m p r o d u c t i o n by 1990
A p r e s s u r e wa te r r e a c t o r can r e l e a s e up t o 20 c u r i e s p e r y e a r o f
t r i t i u m (9600 c u r i e s e q u a l s 1 gram o f t r i t i u m ) , and it i s expec ted
t h a t CTR's w i l l emi t s e v e r a l o r d e r s o f magnitude more t h a n t h i s i n t o
t h e a tmosphere and s u r f a c e w a t e r .
2 .2 Trans fo rmat ion P r o c e s s e s i n t h e Atmosphere
T r i t i u m can b e r e l e a s e d from a CTR e i t h e r i n i t s e l e m e n t a l form,
such a s HT, o r a s t r i t i a t e d wa te r vapor , HTO. The mass a c t i o n
e q u i l i b r i u m c o e f f i c i e n t f o r t h e r e a c t i o n :
HT + H20 2 HTO + H2
i s approx imate ly s i x , t h u s f a v o r i n g t h e fo rmat ion o f t r i t i a t e d wa te r
vapor . Jacobs (1968) c i t e s many r e f e r e n c e s which show t h a t t h e
predominant form o f t r i t i u m i n t h e atmosphere i s i n t r i t i a t e d wa te r

v a p o r , and t h a t t r i t i u m r e l e a s e d t o t h e atmosphere i n i t s e lementa l
form i s q u i c k l y conver ted t o t r i t i a t e d wa te r vapor . There fo re i n t h i s
s t u d y it i s assumed t h a t a l l t r i t i u m r e l e a s e d from a CTR i n t o t h e
environment i s i n t h e form o f t r i t i a t e d wa te r vapor , HTO.
2 . 3 Global T r a n s p o r t o f T r i t i u m and t h e Hydrometeorologic Cycle
Once t r i t i u m i s r e l e a s e d i n t o t h e environment and becomes
t r i t i a t e d w a t e r vapor i t s p r o p e r t i e s a r e e s s e n t i a l l y t h e same a s t h o s e
o f a tmospher ic w a t e r vapor . Thus t r i t i u m becomes a component o f
t h e h y d r o l o g i c c y c l e , and behaves t h e same a s wa te r vapor i n t h e
h y d r o l o g i c c y c l e . J a c o b s (1968) n o t e s through s e v e r a l r e f e r e n c e s t h a t
t h e m a j o r i t y o f t r i t i u m r e l e a s e d i n t h e t r o p o s p h e r e i s l i m i t e d t o t h e
g e n e r a l l a t i t u d e o f r e l e a s e , a l though some l a t e r a l mixing i s t o be
expec ted . Almost h a l f o f a l l t h e t r i t i u m r e l e a s e d i n t o t h e s t r a t o -
s p h e r e d u r i n g t h e n u c l e a r bomb t e s t s was d e p o s i t e d i n t h e n o r t h e r n
hemispher ica l m i d - l a t i t u d e b e l t s , and s i n c e t h e s e a r e t h e l a t i t u d e s
i n which most o f t h e CTR a c t i v i t y i s expec ted t o t a k e p l a c e , t h e s e
a r e t h e l a t i t u d e s i n which t h e h i g h e s t a i r and s u r f a c e wa te r concen-
t r a t i o n s o f t r i t i u m a r e expec ted t o o c c u r .
The removal o f t r i t i u m from t h e a tmosphere , a s no ted i n t h e
f o l l o w i n g s e c t i o n , o c c u r s p r i m a r i l y through t h e p r e c i p i t a t i o n p r o c e s s ,
a l t h o u g h n e a r t h e p o i n t o f r e l e a s e some t r i t i a t e d wa te r vapor can be
d i f f u s e d t o t h e ground and t a k e n up d i r e c t l y by v e g e t a t i o n . Once
d e p o s i t e d t h e t r i t i u m can i n f i l t r a t e i n t o t h e groundwater , remain
a s p a r t o f t h e s u r f a c e r u n o f f and s t o r a g e , a s s i m i l a t e d i n t o p l a n t s ,

o r t r a n s p i r e d and evapora ted back i n t o t h e a tmosphere . Because o f
i t s c l o s e a s s o c i a t i o n w i t h t h e h y d r o l o g i c c y c l e it h a s s e r v e d a s a
u s e f u l i s o t o p e i n d e t e r m i n i n g t h e c h a r a c t e r i s t i c s o f v a r i o u s w a t e r -
s h e d s .

3 . SCAVENGING OF TRITIUM BY PRECIPITATION
3.1 Theory of Scavenging
The process of removal of mater ia l emitted t o t h e atmosphere by
p r e c i p i t a t i o n i s t r a d i t i o n a l l y inves t iga t ed i n terms of below-cloud
scavenging i n t h e form,
where :
Q(t) = amount of emitted source ma te r i a l remaining
a f t e r some time t ( c i / y r )
Qo = source term ( c i / y r )
A = constant scavenging c o e f f i c i e n t f o r t h e
emitted ma te r i a l (sec - I )
t = t ime period (sec)
This approach has been used f o r t r a c e q u a n t i t i e s of gases assuming
t h a t t h e gases a r e p e r f e c t l y so lub le (Engelmann, 1965). However it
has been shown t h a t t h e s o l u b i l i t y of gases - i s important (Hales, 1972a).
Since A i s not necessa r i ly constant and can vary considerably i n
time (Dana, e t a l . , 1972; Hales, 1972a) it i s not u se fu l t o u t i l i z e
t h i s d e f i n i t i o n of washout f o r gases. Assuming a s teady s t a t e
condi t ion with non- in terac t ing drops and no chemical r eac t ions , t h e
r a t e of change of l iquid-phase concentrat ion with height z can be
expressed a s

where :
K = o v e r a l l mass t r a n s f e r c o e f f i c i e n t Y - 2
(mass-cm -set-l)
Vt = t e rminal v e l o c i t y of f a l l of t h e raindrop
of r ad ius R , where downward i s negat ive (cm-sec-l)
x = l oca l atmospheric gas-phase p o l l u t a n t concen- - 3
t r a t i o n (mass-cm )
H ' = s o l u b i l i t y (Henry's law) f a c t o r ( in u n i t s
appropr ia te t o those of C and X)
C = gas-phase concent ra t ion i n t h e raindrop - 3
(mass-cm )
r = raindrop r ad ius (cm)
I f p e r f e c t s o l u b i l i t y of t h e ma te r i a l emitted t o t h e atmosphere i s
assumed (HI = 0) , it can be shown t h a t t h e i n t e g r a t i o n of equat ion (4)
leads t o t r a d i t i o n a l forms f o r A .
For gases i n general H' # 0 , and t h e r e i s a r e luc tance t o being
scavenged; i n regions where t h e second term of equat ion (4) predoninates ,
t h e gas can desorb from t h e drop. Equation (4) can be in t eg ra t ed
a n a l y t i c a l l y f o r t h e case where H 1 = cons tant and t h e r a i n f a l l i s
v e r t i c a l (Hales, 1972a, 1972b) o r numerically f o r H ' = H1 (C,x)
(Dana, e t a l . , 1973).

Computer programs have been developed t o perform t h i s c a l c u l a t i o n .
These programs f a l l under two c a t e g o r i e s - l i n e a r and non- l inear models.
The l i n e a r model can be e f f e c t i v e l y used f o r KT0 due t o t h e n a t u r e of
t h e s o l u b i l i t y o f HTO, which l i k e H 0 i s a f unc t i on o f t empera ture 2
on ly (Hales, 1972b). I n t e g r a t i o n o f equa t i on (4) f o r mO l e a d s t o
ground-level concen t r a t i ons i n t h e r a i n f a l l which depend on s e v e r a l
v a r i a b l e s : plume paramete rs , downwind d i s t a n c e x ( i . e . , t ime f o r a
cons t an t wind speed u = x / t ) , t empera ture , mass t r a n s f e r , d i f f u s i o n
c o e f f i c i e n t s f o r ga s phase t r a n s f e r , and H I f o r l i q u i d phase t r a n s f e r .
Using d i f f e r e n t v a r i a b l e v a l u e s , plume c e n t e r l i n e concen t r a t i ons
o f t h e r a ind rops , Cc l , e f f e c t i v e scavenging c o e f f i c i e n t s k , and source
s t r e n g t h s Q(x) have been ob ta ined (F igures 3.1 and 3 . 2 ) . The inpu t
cond i t i ons a r e l i s t e d i n Table 3 .1 .
The v a l u e s o f k were computed by t a k i n g advantage of t h e f a c t
t h a t f o r l i n e a r l y s o l u b l e ga se s , t h e c o n c e n t r a t i o n i n t h e r a ind rops
o f f t h e c e n t e r l i n e C(y) is
where a i s t h e h o r i z o n t a l d i s p e r s i o n parameter and y i s t h e d i s t a n c e Y
from t h e c e n t e r l i n e . The cross-plume i n t e g r a t e d f l u x , o r "scavenging
- r a t e " , W, i s :

TABLE 3.1
I n ~ u t C o n d i t i o n s Used i n EPAEC L i n e a r Model
Temperature
Source Height
R a i n f a l l Ra te 1 , 5 mm/hr
\ f ind Speed 500 cm/sec
Plume P a s q u i l l - G i f f o r d w i t h a p p r o p r i a t e sigmas (Smith, e t a l . , 1966)
Mass T r a n s f e r Regime Gas-Phase C o n t r o l l e d (He1 1 blixed Drop) *
Raindrop Spectrum Lognornial ( t y p i c a l f r o n t a l r a i n )
*There i s n o t much d i f f e r e n c e between gas -phase c o n t r o l l e d and
s t a g n a n t d r o p t r a n s f e r f o r HI'O ( s t a g n a n t d r o p l e s s i.n magni tude) .
Exper imenta l work (Friedman, e t a l . , 1962; Booker, 1965) h a s
shown HI'O t o behave p r i m a r i l y i n accordance w i t h ga.s-phase
c o n t r o l l e d b e h a v i o r .

. .
Y31V/'b\ N I V Y N I O l H (EW3/ S310W13
Figure 3.1 Amount of Tritium in Rainwater for Equilibrium and Non-equilibrium Conditions as a Function of Distance.
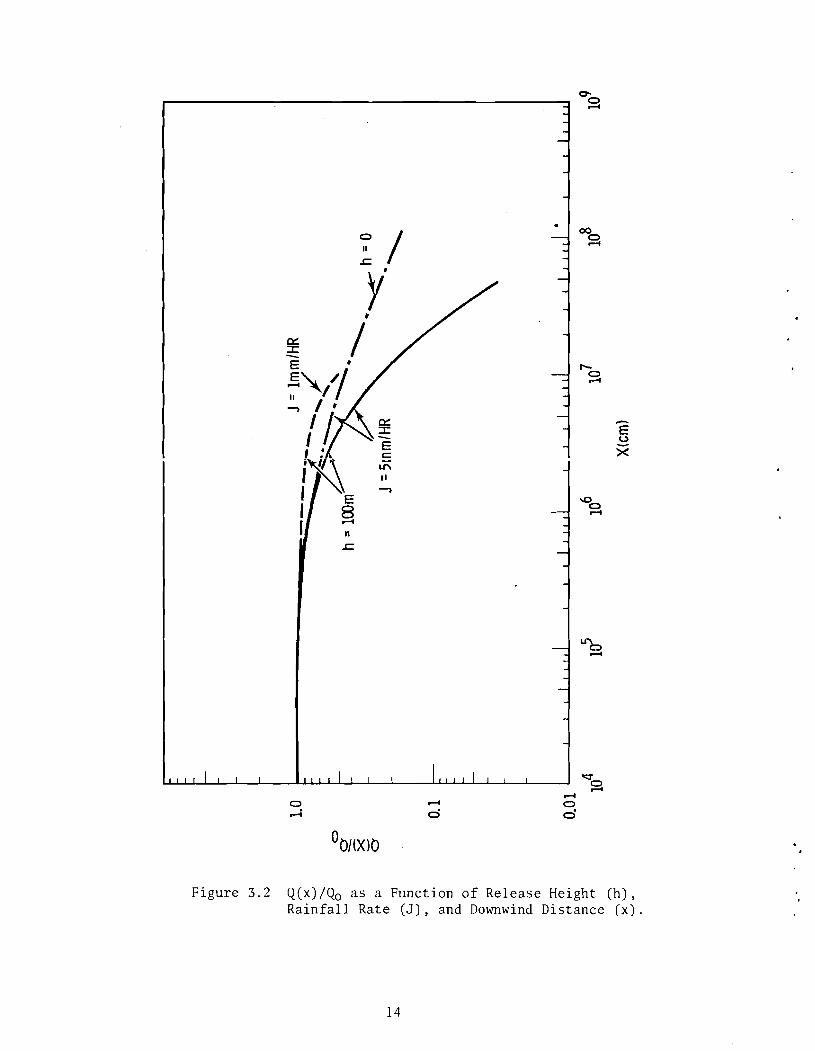
Figure 3 .2 Q(x)/Qo a s a Funct ion o f Release Height ( h ) , R a i n f a l l Rate (J) , and Downwind Dis tance (x) .

where J i s t h e r a i n f a l l r a t e . The e f f e c t i v e scavenging c o e f f i c i e n t ,
k, i s then
Since t h e ca l cu la t ed values of k a t each x were s u f f i c i e n t l y high t o
dep le t e t h e plume s i g n i f i c a n t l y during moderate downwind t r a v e l t imes,
Q was reduced numerically by
where k' i s t h e average value of k ca l cu la t ed a t t h e loca t ion x and
t h e previous loca t ion , and i s t h e mean wind speed. The curves f o r
Q(x) i n Figure 3.2 a r e approximate due t o neglec t of t h e near-source
region. However, it i s evident t h a t dep le t ion of HTO by r a i n f a l l
within about 10 s t ack he igh t s downwind i s neg l ig ib l e .
3.2 BeloG-Cloud Equilibrium Scavenging
In Figure 3.1, C represents t h e ra indrop concentrat ion which e q
would r e s u l t i f t h e HTO i n t h e r a i n i s i n equil ibr ium with ground-
l eve l a i r concent ra t ion:
Since 11' i s a constant f o r a given T, C (x) exac t ly follows t h e well- e q
known Gaussian behavior of X. I t i s c l e a r from Figure 3.1 t h a t
C C beyond x = 10 km, f o r a l l reasonable values of h. The e f f e c t i v e e q
equil ibr ium scavenging c o e f f i c i e n t i s

where 11* i s a Henry's law f a c t o r f o r x and C i s w r i t t e n i n u n i t s o f
3 mass/cm . The e x p o n e n t i a l t e rm i s e f f e c t i v e l y u n i t y f o r r e a s o n a b l e
v a l u e s o f h and plume paramete rs beyond x - 10 km.
An a l t e r n a t e e x p r e s s i o n f o r k a t g r e a t d i s t a n c e s from t h e e q
source can be o b t a i n e d by assuming t h a t
where x i s a c o n s t a n t and L i s a n e f f e c t i v e t h i c k n e s s o f t h e g 1
p o l l u t e d l a y e r i n t h e z d i r e c t i o n . I t i s a l s o assumed t h a t x = x k2 1
a t a l l l e v e l s . With t h e s e assumptions k i s equa l t o J / ( M * L ) . I f eq
it i s f u r t h e r assumed t h a t H* = p / p where p i s t h e a b s o l u t e a w' a
humidi ty o f H 2 0 and pw t h e d e n s i t y o f w a t e r , and H i s t h e r a i n f l u x
- 2 - 1 i n grams >cm -sec , t h e n
- - R k = - R and J = -
e q paL O w
T h i s form of k r e p o r t e d by and Dickerson and Crauford, ( 1 9 7 2 ) , i s eq'
s i m i l a r t o e q u a t i o n (10) f o r g round- leve l r e l e a s e s a s long a s d i s t a n c e s
from t h e s o u r c e a r e c o n s i d e r a b l e .

The assumption o f H*mO = H* i s probab ly q u i t e good, H2°
except t h a t it must be recognized t h a t t h e a b s o l u t e humidi ty p f o r a
wate r vapor and HTO i s a f u n c t i o n o f t empera ture . A p l o t of H* a s a
f u n c t i o n o f t empera ture i s given i n F igure 3 . 3 .
3 . 3 In-Cloud Scavenging
Due t o t h e low f a l l speeds and smal l s i z e o f c loud d r o p l e t s it
can be assumed t h a t t h e s e which e x i s t i n a plume w i l l have HTO con-
c e n t r a t i o n s which a r e i n equ i l i b r i um wi th t h e l o c a l a i r concen t r a t i on
o f HTO. There fore , in-c loud scavenging is c h a r a c t e r i z e d p r i m a r i l y
by t h e pickup o f c loud d r o p l e t s by r a ind rops . Thus, an a d d i t i o n a l
term t o equa t i on (4) i s added:
;loud drops W
where (LWC) i s t h e l i q u i d wate r con t en t of t h e fog and E is a
c o l l e c t i o n e f f i c i e n c y which d e f i n e s t h e mass t r a n s f e r o f c loud drops
t o r a i nd rops . By comparison o f t h e c loud d r o p l e t term t o t h e gas
scavenging term, a c r i t e r i o n f o r t h e importance o f c loud drop
scavenging can be developed. For t h e c loud drop component t o b e
i n s i g n i f i c a n t :
4K H t p w R a t i o = >>1 .
E (LWC)Vt
For HTO, assuming gas-phase t r a n s f e r , Vt = 500 cm/sec, T = 2 8 3 ' ~ , and
E = 1, t h e v a l u e s of t h e r a t i o and t h e f r a c t i o n o f t h e concen t r a t i on

270 275 280 285 290 295 300 3 10
TEMPERATURE, OK
Figure 3 . 3 Henry's Constant ( H * ) a s a Function o f Temperature.

c o n t r i b u t e d by c loud drop scavenging can be e s t ima t ed . Some a r e l i s t e d
i n Tab le 3.2.
TABLE 3.2
Values o f Ra t i o and F rac t i on o f Raindrop Concent ra t ion o f HTO Cont r ibu ted bv Cloud-Dro~ Scaveneine
(LWC)
0.1 g/m 3
Ra t i o F r a c t i o n
For r a i n which forms from t r i t i a t e d wate r vapor by condensat ion,
it i s probab ly s a f e t o assume t h a t C = C because o f t h e t ime e q
involved i n t h e p roce s s , a s long a s x > 10 km o r so. For t h e c a s e
o f t h e convec t ive shower a c t i n g r i g h t a t t h e source p o i n t , it i s
probably s a f e t o assume t h a t t h e e f f i c i e n c y wi th which t h e shower
removes water w i l l a l s o apply t o tlTO. A ve ry heavy r a i n f a l l r a t e
w i l l a l s o d e p l e t e t h e plume q u i t e e f f e c t i v e l y by washout a lone , a s
F igure 3.2 i n d i c a t e s .
3 . 4 A l t e r n a t i v e s and L imi t a t i ons on Models
The l i n e a r model i s no t very a c c u r a t e f o r d i s t a n c e s l e s s t han
about one s t a c k he igh t downwind, due t o t h e n e g l e c t of t h e a n g l e o f
r a i nd rop t r a j e c t o r i e s . The d e p l e t i o n w i t h i n t h i s r e g i o n w i l l be ve ry
s l i g h t , a l though t h e va lue o f k may be q u i t e h igh i n a small space

between where desorpt ion predominates ( i . e . , with t h e plume well above
t h e ground, so t h a t C a t ground-level i s very low) and where t h e e
concent ra t ion begins t o decrease toward C eq
The curves of Figures 3.1 and 3 . 2 can be used t o es t imate r a i n -
water concent ra t ions o r scavenging c o e f f i c i e n t s f o r o the r input v a r i -
ab les . The concent ra t ion Ccl i s d i r e c t l y propor t ional t o Q(x) and
inve r se ly propor t ional t o u ; k i s d i r e c t l y propor t ional t o J . There-
f o r e , concent ra t ions f o r any and a l l va lues of Q(x), J and u can be
predic ted from one curve. To account f o r dep le t ion , however, Q(x)
must be ca l cu la t ed f o r each point x based on t h e scavenging "history"
of t h e plume. The scavenging c o e f f i c i e n t may be determined a t any x
s ince it i s not a furlction of t h e source term.

4. ANALYSIS OF TRITIUM CONCENTRATIONS IN THE HYDROSPHERE
4.1 Phase 1: Estimated Average Ground-Level Concentrations Near the Plant
The technique for computing average annual ground-level concen-
trations of tritium within 50 km of a CTR power plant involves evalua-
tion of the relation:
where :
- 3 'a
= atmospheric tritium concentration (Ci-m )
- 1 Q = source term to the atmosphere (ci-year )
a = 0.5t = horizontal standard deviation of the Y
plume (meters)
- 1/2 a = 2KZ(x/u) = vertical standard deviation of the
z plume (meters)
t = plume travel time (sec)
2 K = vertical diffusion coefficient = 5 m -set-' z - u = mean wind speed through the layer 300m to 2000m
above ground
k = equilibrium scavenging coefficient e
x = downwind distance from the source (meters)
y = plume crosswind distance (meters)
The term in the curly brackets in equation (15) was evaluated by
Heffter, et al., (1975) for the LMFBR environmental analysis using a

climatology of wind trajectories near Morris, Illinois. In this
analysis it is also assumed that the CTR will be located near Morris,
Illinois.
The second exponential term in equation (15) represents the
depletion of the plume due to scavenging of tritium by precipitation.
Under equilibrium conditions, where the in-cloud and below-cloud
tritium concentrations are equal, and where the height of the release
is at ground-level, the equilibrium scavenging coefficient, k is eq '
obtained from equation (10) :
where
o = Smith-Singer dispersion coefficient = 0 . 6 3 a ~ . ~ ~ , E 4 . 4 km z
= 859 m, x > 4.4 km
By assuming equilibrium conditions below the precipitating cloud,
the values of k are within 10% of the k values determined by e q e q
Dickerson and Crawford (1972) for use in the LMFBR analysis at
Morris, Illinois.
The results of the ground-level atmospheric tritium concentration
estimates are shown in Figure 4.1 for Phase 1. The concentrations in
- 1 this figure have been normalized to a 1 ci-year release. To
determine estimated concentration for any source rate the normalized
concentrations in the figure must be multiplied by that source rate.

PEORIA
Figure 4.1 Ground-Level Air Concentration Values of Tritium for an Area Near Morris, Illinois.

4.2 Phase 2: Estimated Average Ground-Level Concentrations in the Eastern Half of the United States
This phase of the analysis deals with plume trajectories from
the proposed CTR plant over a travel time of several days, or distances
up to 1000 kilometers. Heffter, et al., (1975) treat this problem in
the same fashion as in Phase 1, utilizing a climatology of air trajec-
tories over the eastern United States and then applying equation (15).
The results of the regional ground-level tritium concentration
estimates are shown in Figure 4.2.
4.3 Average Surface Water Tritium Concentrations near a CTR Plant
The average annual surface water tritium concentrations, Xg '
are determined from:
where :
W = average annual depth of the surface or groundwater - 1 mixing layer, (m-year )
2 A = area of precipitation (m )
Since this analysis is intended to provide conservative estimates
of tritium concentrations that would show the maximum expected impacts
for normal operation and accidental releases, the value of W was
assumed to be determined from the mean annual net rainfall:

Figure 4 . 2 Ground-Level A i r Concentrat ion Values of Tr i t ium f o r t h e Eastern United S t a t e s .

- - A' - p - E y e a r
where :
3 - 1 P = amount o f p r e c i p i t a t i o n (m - y e a r )
3 - 1 E = amount o f e v a p o r a t i o n (m - y e a r )
In o t h e r words, t h e r e i s no groundwater r e s e r v o i r i n t o which
t r i t i u m would be mixed a f t e r t r i t i a t e d r a i n f a l l p e r c o l a t e s th rough
t h e ground. For M o r r i s , I l l i n o i s t h e annua l r a i n f a l l a v e r a g e s 3 . 9 3
0 . 9 3 m - y r - l , and e v a p o r a t i o n (determined from S e l l e r s , 1965) i s
- 1 - 1 0 . 5 6 m-year . Thus t h e mean annua l r u n o f f i s 0 . 3 7 m-year , and
W = 0 .37 m e t e r s .
Equat ion (17) shows t h a t e s t i m a t e s o f s u r f a c e wa te r c o n c e n t r a t i o n s
o f t r i t i u m a r e made by d e t e r m i n i n g t h e amount o f t h e s o u r c e term t h a t
i s d e p l e t e d by washout p r o c e s s e s . Thus, e s t i m a t e s of s u r f a c e w a t e r
c o n c e n t r a t i o n s were made f o r each c o n c e n t r i c a r e a l r i n g around a
CTR l o c a t e d i n M o r r i s , I l l i n o i s from t h e r e l a t i o n :
where :
f- = exp
i = r a d i a l d i s t a n c e t o i n n e r c i rcumference o f a
c o n c e n t r i c a r e a l r i n g
j = r a d i a l d i s t a n c e t o o u t e r c i r cumference o f a
c o n c e n t r i c a r e a l r i n g

This technique has t h e disadvantage of assuming t h a t a l l p r e c i p i -
t a t i o n systems a r e d i s t r i b u t e d equa l ly around a CTR, a long with t h e
d i s t r i b u t i o n of HTO. This assumption obviously becomes poorer a t
g r e a t e r d i s t ances from t h e source . In p a r t i c u l a r , it i s obvious
t h a t t h e t r i t i u m washed out by p r e c i p i t a t i o n systems w i l l always be
downwind of t h e CTR, which i n Morris, I l l i n o i s w i l l always be i n a
p re f e r ed s e c t i o n , and no t uniformly d i s t r i b u t e d around t h e p l a n t .
For t h i s reason t h e a n a l y s i s i s l im i t ed t o d i s t a n c e s up t o 1000 krn,
us ing t h e hydro logica l cond i t i ons f o r Morr is .
The r e s u l t o f t h e su r f ace water t r i t i u m concent ra t ions using an
i t e r a t i o n of equa t ion (19) and (17) a r e shown i n Table 4 .1 . The
r e s u l t s provided a r e normalized concen t r a t i ons . Figure 4 . 3 shows
t h e v a r i a t i o n of s u r f a c e water concent . ra t ions with d i s t a n c e from
t h e source us ing t h e hydrologic condi t ions a t Morris. The va lue
o f o Z 1 during p r e c i p i t a t i o n episodes were ob ta ined from t h e LMFBR
a n a l y s i s . For Morris, t h e va lue o f a ' i nc reases t o a d i s t a n c e of z
4 .4 km, and i s cons tan t beyond t h a t p o i n t . Figure 4 . 3 r e f l e c t s
t h i s change i n t h e v e r t i c a l d i s p e r s i o n . I t i s ev ident t h a t t h e
sma l l e r d i spe r s ion nea r t h e p l a n t a c t s t o i nc rease su r f ace water
concen t r a t i ons by a s much a s two o rde r s o f magnitude above what
would have been es t imated from a cons tan t d i s p e r s i o n .

TABLE 4.1
Radial Distance
(Km)
Surface Water Tritium Concentrations (X,) -
For Various Distances from the Source
- Area
(m2
*Note: Af = (1-f . - 1 - f ) (See equation (19)) x= I

Figure 4.3 Normalized Surface Water Concentration ( x g / Q ) as a Function of Distance (x) .

4.4 Phase 3: Estimated Latitudinal and Global Average Atmospheric and Surface Water Tritium Concentrations
A technique was developed to analyze the estimated concentrations
of tritium in the atmosphere and surface water supplies in the north-
ern hemisphere based on a continuous normal operation of CTR plants
distributed throughout the 30" - 50" N latitude belt. The analysis
technique is based on the procedure presented by Libby (1963) with
modifications to account for sources near ground-level and for the
transport of hydrologic components across latitude belts. The
technique is essentially a "box model" approach which assumes that
the tritium follows the hydrologic cycle, and represents the simul-
taneous solution of atmospheric and surface water tritium concentra-
tions to establish the maximum values.
The balance equation for atmospheric tritium in any latitude
belt can be developed from an examination of Figure 4.4 and is
written
where :
Qa = source of tritium to the atmosphere, distributed
throughout the latitude belt (~i-~r-')
a = concentration of atmospheric tritium entering the
0 latitudinal boundary ( ~ i - m - ~ )
3 -1 P = latitude-averaged precipitation (m -yr 1

LATITUDE BELT
' IN%
-) R ~ ~ ~ X g - W118 / / / / / / / / / / / / / / / / / / / / / / / / / / / / / / / / / / / / / / / / / / / / / / / / / / / / / / / / /
\
-)
TR 0 POS P HER E + d(w9$)
dt
) w (= PREC I P l TAB LE WATER)
< ~ ( w X
) W SURFACE WATER^ dt
CTR > Qs

5 E = lat itude-averaged evaporation (m -yr-l)
w = depth of atmospheric water (i.e., precipitable water), m
(w/18) x a = average radioactive life of tritium in atmosphere - 5
a = absolute humidity m Air
2 A = area of the latitude belt (m )
I in = influx of water vapor across the latitudinal boundary 3 - 1 (m -year )
Iout = outflux of water vapor acorss the latitudinal boundary 3 - 1 (m -year )
Likewise, the balance equation for surface water tritium is written
where :
Qs = source of tritium to the surface water, distributed -3 -1 throughout the latitude belt (ci-m -yr )
x = concentration of surface water tritium entering the go latitudinal boundary
W = depth of readily-mixed zroundwater, meters
(W/18) x g = average radioactive life of tritium in the surface water
3 -1 Rin = surface run-off into the latitudinal "box" (m -yr )
3 -1 R = surface run-off out of the latitudinal "box" (m -yr ) out
Over a long period of time (for the atmosphere a period of several
weeks and for the groundwater a period of several years) each of these
balance equations has the solution:

a Qa + E x g + Iin Xa max - 0
'a + Iout + Aw/18
X - - U
gmax E + R + AW/18 out
I f it i s now assumed t h a t :
Rout = R + (P-E)
i n
- - I out I i n
- (P-E)
then equat ions 2 2 and 2 3 have t h e simultaneous so lu t ion :
The so lu t ion of t hese equat ions f o r each l a t i t u d e b e l t becomes
q u i t e complex, s ince , due t o t h e evaporat ion and p r e c i p i t a t i o n processes,
an inflow of t r i t i a t e d su r face water i n t o a l a t i t u d e b e l t a l s o repre-
s e n t s a source of t r i t i a t e d water vapor t o t h e atmosphere. Thus t h e
equat ions would have t o be solved simultaneously f o r each l a t i t u d e
b e l t by e s t a b l i s h i n g the values of x and x from adjacent l a t i t u d e 0
go

b e l t s . A s seen from Figure 4 .5 ob t a ined from va lue s pub l i shed i n
S e l l e r s (1965), t h e r e i s a mean northward t r a n s p o r t o f water vapor ,
and consequent ly (based on t h e above assumptions) a mean southward
t r a n s p o r t o f s u r f a c e water throughout t h e mid - l a t i t udes o f t h e n o r t h e r n
hemisphere. The r e v e r s e i s t r u e o f t h e t r o p i c a l l a t i t u d e s , and t h e
s u b t r o p i c s r e p r e s e n t a major sou rce o f water vapor and s i n k o f s u r f a c e
wa t e r . To avo id t h e complexity o f t h e s e s o l u t i o n s it i s assumed f o r
t h i s a n a l y s i s t h a t
A t l a t i t u d e 30" - 50°N: 'a
= 0 0
A l l o t h e r l a t i t u d e b e l t s : Q = 0 a
This a n a l y s i s assumes i n a d d i t i o n t h a t t r i t i u m concen t r a t i ons a r e spread
uniformly throughout t h e 30" - 50" b e l t , t h e l a t i t u d e b e l t i n which
a l l t h e sou rce s occu r , due t o t h e no r th - sou th eddy mer id iona l t r a n s p o r t
p r o p e r t i e s o f t h e t r a v e l i n g cyc lones , but t h a t o u t s i d e t h i s b e l t t h e
t r a n s p o r t o f t r i t i a t e d water vapor and l i q u i d water i s performed
e n t i r e l y by t h e mean mer id iona l t r a n s p o r t o f water vapor and l i q u i d
wate r . To avo id one a d d i t i o n a l computat ional d i f f i c u l t y , a southward
eddy water vapor t r a n s p o r t term a c r o s s t h e 30" meridian was used t o
de te rmine x f o r t h e 20" - 30" b e l t . Values o f t h e parameters a
0
needed t o s o l v e equa t i ons (28) and (29) a r e shown i n Table 4 . 2 .
Tab le 4 . 3 g i v e s t h e r e s u l t s o f t h e computation f o r two cho i ce s o f
W : W = 0 . 5 m ( l and a r e a s ) and W = 75 m (oceans) .

LATITUDE ON

a,' Z ai

t-. t-.
Ln N

The assumptions noted above which are needed to simplify the
complexity of the solution result in an underestimate of tritium
concentrations. This is a result of a failure to reestablish new
values of x and x as concentrations for each latitudinal belt a 0 go
are made. Thus a "background" estimate of tritium concentrations
was established by solving equations (28) and (29) globally. Under
this condition I, 'a
, and R must equal zero and P = E . Thus: 0
14 3 -1 Globally, E = 1.47~10 m -yr . Again, using the extreme values
for W of 0.5 m (land) and 75 m (oceans) the global tritium concentra-
tions can be summarized as follows:
Since these background concentrations are much larger than the
estimates shown for each latitude belt, it becomes evident that, based
on this technique, the gradients of tritium concentrations across the

l a t i t u d e b e l t s a r e q u i t e sma l l , d e s p i t e t h e t o t a l sou rce occu r r i ng
i n on ly one o f t h e b e l t s . Thus, Table 4 .4 summarizes t h e es t imated
a tmospher ic and s u r f a c e water c o n c e n t r a t i o n s i n c o r p o r a t i n g t h i s
"background" va lue .
I t can be seen from Table 4 . 3 and 4 .4 t h a t t h e s e l e c t i o n of W ,
t h e r e a d i l y mixed depth o f groundwater, i s q u i t e c r i t i c a l t o t h e
computations i n t h e range o f 0 . 5 t o 75 mete rs . Th is i s p a r t i c u l a r l y
t r u e o f t h e s u r f a c e water computat ions . F igure 4 . 6 shows a p l o t o f
t h e v a r i a t i o n o f normalized t r i t i a t e d wate r concen t r a t i on p e r u n i t a r e a
wi th W f o r t h e va lue s o f P , E , I and R i n t h e 30"-50" l a t i t u d e b e l t .
The v a r i a t i o n occurs most ly i n t h e O . l m t o l O O m range . Libby (1963)
used a va lue o f W = 0.5m f o r t h e North American land mass, but
Begemann and Libby (1957) determined W t o be 8 meters f o r t h e
M i s s i s s i p p i watershed. The va lue o f 0 . 5 meters over land was
s e l e c t e d f o r t h i s phase of t h e s t udy t o o b t a i n t h e most conse rva t i ve
e s t i m a t e s o f s u r f a c e wate r c o n c e n t r a t i o n s . Jacobs (1968) shows t h a t
t h e va lue o f 75 meters f o r t h e oceans i s a c c e p t a b l e .
A s imple box model c a l c u l a t i o n over t h e 30"-50" l a t i t u d e b e l t
was made t o p rov ide a check on t h e va lue s g iven i n Table 4 . 3 . By
assuming mass inf low o f c l e an a i r through t h e t o p h a l f o f a v e r t i c a l
column bounded by t h e 30" l a t i t u d e on one s i d e and 50" l a t i t u d e on t h e
o t h e r , and ex tend ing t o t h e t o p o f t h e atmosphere, and mass outf low
o f t r i t i a t e d a i r from t h e bottom h a l f o f t h e column, a tmospher ic
concen t r a t i ons o f t r i t i u m throughout t h e column can be determined from:

TABLE 4 . 4
Average Ground-Level Atmospheric and S u r f a c e Water C o n c e n t r a t i o n s by L a t i t u d e B e l t f o r Land and Ocean
Areas Incoruorat incr t h e Global "Backeround"
L a t i t u d e (ON)
0-10
10-20
20-30
30-50"
50-60
60 - 70
70-80
80-90
Global**
LAND OCEANS - 3 p ~ i - m p c i - 1 - I
* Source l a t i t u d e b e l t
* * "Background"

Figure 4.6 Variation of Normalized Tritiated Water Concentration Per Unit Area.

where :
C = average wind vector normal to the latitude belt n
for the outflow
L = length of the latitude boundary
H = height of column
The value of C was determined from palm& and Newton (1969) to n
- 1 4 7 be 0.5 m-sec . Using H = 10 m and L = 3.07 x 10 m (40"~):
which is in close agreement with the value shown for the 30"-50" belt
in Table 4.3 (no tlbackgroundtt), particularly for W = 0.5m.
4.5 Summary of Normal Operation Impacts
The information in Figure 4.1 and 4.2 and in Tables 4.1 and 4.4
allow computations of the maximum allowable emissions (MAE) of a CTR
based on the analysis procedure used here and the maximum permissible
concentrations (MPC) that have been developed for HTO. For atmospheric
- 6 - 3 tritium the MPC is 5 x 10 Ci-m , and for tritium in the drinking
- 4 water supply the MPC is 1 x 10 Ci-liter. Thus a value for the
maximum allowable emission for a CTR is the ratio of the MPC to the
normalized atmospheric or surface water concentration estimate

MAE = MPC
xa/Q or xg/Q
A summary of maximum allowable emissions based on atmospheric
and surface water estimates is given in Table 4.5. It is evident
from this table that atmospheric concentrations represent the limiting
factors for a CTR operation near the plant, while surface water concen-
trations represent the limiting factors at great distances from the
plant. However, it is also evident that large quantities of tritium
releases could be tolerated according to this analysis - quantities
that far exceed the emission currently expected by a CTR technology.
TABLE 4.5
Summary of Maximum Allowable Emissions (MAE) of Tritium to the Atmosphere by a Normal CTR
Operation Based on Atmospheric (xa) and Surface Water (x,) Concentrations
a g - 1 - 1 Phase (Ci-yr ) (Ci-yr )
1 6 . 2 x 10 9 9.2 x 10
9
2 5.0 x 10 10
2.8 x 10 10
3 1.6 x 10 12 3.7 x 10 11

4.6 Accidental Releases of Tritium
One of the major concerns in a CTR accident situation is that
large quantities of tritium will be released into the environment due
to a liquid metal fire burning through the containment vessel. The
impact of such an accident on the atmosphere and surface water environ-
ment can be analyzed in two ways - - by describing the worse (i.e., most
stable) meteorological conditions and thereby maximizing the ground-
level atmospheric tritium concentration calculations, or by describing
a situation where a large portion of the accidental release will be
scavenged by a precipitation system and mixed in with the surface
water supply almost immediately. Since surface water concentrations
could ultimately affect a large part of the general population, this
aspect of an accidental release will be analyzed here.
The analysis procedure involves the same basic approach that was
used to estimate surface water concentrations during routine operations.
This approach, assuming equilibrium conditions, will produce conserva-
tive results for distances near the emission source (See Figure 3.1).
The relation for determining surface water tritium concentrations, Xg '
is given by
Qt is the total amount of tritium released in the
accident (grams or Ci)
k is defined by equation (16) e q
J is the rainfall rate during the accidental release
W=Jt (no mixing with surface or groundwater systems)
t is the length of the storm period
The value of J was determined from rainfall frequency curves
published in Linsley, et al., (1958). For Phase 1 the maximum
expected rainfall rate within a 100-year period in the vicinity of
- 1 Morris, Illinois is 75 mm-hour . For Phase 2 the maximum daily
rainfall expected within a 50-year period near Morris, Illinois is
- 1 - 5 125 mm-day . For this analysis, H* = 1.05 x 10 (T=286.7 O K ) ,
- 1 o ' = 859 meters, TI = 4.05 m-sec , and t = 3600 sec for Phase 1
z 5
and 8.64 x 10 sec for Phase 2.
Results of the Phase 1 and 2 accident analyses are given in
Table 4.6. Based on these rainfall rates any accidental release of
tritium would be scavenged almost immediately within a distance of 10
kilometers for Phase 1, and within a distance of 150 kilometers for
Phase 2. Assuming the values of x /Q in Table 4.4 are representative g a
of normalized concentrations that would be found in the drinking water
in the plant vicinity after an accident, the maximum permissible
concentrations would be exceeded if an accidental release of greater
than 68 grams under Phase 1 conditions, and 128 kilograms under Phase 2

conditions. Thus a postulated 10 kgm accidental release of tritium
could result in severe environmental impacts, particularly in the
immediate vicinity of the plant, under these meteorologic conditions.
The effect of rainfall rate on surface water concentrations at
various distances from the site is shown in Figure 4.7. Since no
groundwater mixing is assumed a large rainfall rate actually represents
greater dilution, with highest concentrations occurring for light
rainfalls. However many other factors enter into these computations
including the manner in which the scavenging coefficient is computed
(See Section 3), and the depth of surface water available for mixing
with rainwater. The figure also shows the concentration estimated
for a postulated 10 kgm release of tritium.
Although the results of an analysis such as this emphasize the
need to develop every possible safeguard against a CTR accident, there
is also a need to develop estimates on the probability of such
accidents occurring under the conditions described above. In addition
there is a need to investigate further environmental conditions that
might exist which could result in even greater impacts from a CTR
accident. These investigations require a detailed statistical
evaluation of climatological data, as well as a complete analysis of
potential CTR accident situations.

TABLE 4.6
Surface Water Concentrations of Tritium During Occurrence of Maximum Rainfall Rates Following a CTR Accident
Phase 1 (5.75 mm-hr-l) Phase 2 (5.125 mm-day-')
* See Table 4.1 for explanation

100-YEAR RETURN VALUE
-
-
-
-
-
-
-
Figure 4.7 The Effect of Rainfall Rate on Normalized Surface Water Concentration.

CONCLUSIONS AND FUTURE RESEARCH NEEDS
Th i s a n a l y s i s has shown t h a t t h e normal ope ra t i on of a commercial CTR
i n t h e v i c i n i t y o f Morr i s , I l l i n o i s should have a smal l impact on t h e
environment i n terms o f i nc r ea sed t r i t i u m concen t r a t i ons i n t h e a i r and
s u r f a c e wate r . Th i s , o f cou r se , assumes t h a t CTR o p e r a t i o n s do no t emit
q u a n t i t i e s o f t r i t i u m exceeding l o 3 kgm p e r y e a r . In a d d i t i o n , t h e limits
t o t h e s e normal t r i t i u m r e l e a s e s t o t h e atmosphere appear t o be c o n t r o l l e d
by a tmospher ic c o n c e n t r a t i o n s i n t h e v i c i n i t y o f t h e p l a n t (Phases 1 and 2 ) .
However, a s t r i t i u m becomes an i n t e g r a l p a r t of t h e hydro log ic c y c l e (Phase
3) s u r f a c e water concen t r a t i ons become t h e l i m i t i n g f a c t o r . Although t h e
t o t a l body dose i s determined bo th from atmospher ic exposure and i n g e s t i o n ,
t h e maximum pe rmi s s ib l e c o n c e n t r a t i o n s i n d r i nk ing water a r e much more
s t r i n g e n t than i n t h e atmosphere. Furthermore, t h e assumption t h a t a l l
t r i t i u m r e l e a s e s w i l l be i n t h e form o f t r i t i a t e d wate r vapor p l a c e s a
h ighe r c o n s t r a i n t on t h e a l lowable emiss ions , s i n c e t h e ICRP-recommended
occupa t iona l maximum p e r m i s s i b l e concen t r a t i on f o r e lemental t r i t i u m i n a i r
is 400 t imes h ighe r than f o r t r i t i u m oxide i n a i r (Young, e t a l . , 1 9 7 5 ) .
The a n a l y s i s a l s o cons idered a c c i d e n t a l r e l e a s e s o f t r i t i a t e d wate r
vapor i n t o t h e atmosphere co inc id ing wi th an unusua l l y s eve re p r e c i p i t a t i o n
even t . Assuming no mixing wi th groundwater, t h i s a n a l y s i s showed t h a t
maximum a l lowable concen t r a t i on s t a n d a r d s o f t r i t i u m i n t h e s u r f a c e wate r
(and t h u s d r i n k i n g wate r ) s u p p l i e s would be exceeded by 1 t o 2 o r d e r s o f
magnitude i f t h e e s t ima t ed a c c i d e n t a l r e l e a s e o f 10 kgm o f t r i t i u m is
p o s t u l a t e d .
Several topics requiring additional research have been identified
during the completion of this analysis. More sophisticated modeling
techniques for transport over several hundreds of kilometers are required,
particularly if complex terrain and land-sea contrasts are to be included.
For example, some success has been obtained using numerical boundary layer
models to estimate tritium concentrations in the vicinity of the Savannah
River Laboratory (Kern, 1974). The manner in which HTO enters into the
hydrologic cycle, and the similarities between HTO and H 0 need further 2
quantification. This becomes particularly important when examining the
scavenging process of HTO by precipitation, and the subsequent return to
the atmosphere via the evapotranspiration process. Research into the
probabilities of large accidental releases during unfavorable meteorological
episodes needs to be undertaken.
Despite the fact that this initial analysis showed normal releases of
tritium due to a commercial CTR technology to have a relatively small
impact on the environment, the need for stringent control of CTR tritium
releases must be emphasized. In addition, developing a CTR technology
could produce large and perhaps serious secondary impacts on the atmosphere
due to massive construction programs, industrial development, and large
influxes of population into unpopulated regions. In addition, considerations
must be made to avoid serious emissions of tritium when a commercial CTR
facility is finally decommissioned. Above all, stringent controls must be
pursued to avoid large releases of tritium during an accident situation.

6. REFERENCES
Begemann, F. and W. F. Libby, 1957: Continental Water Balance, Ground Water Inventory and Storage Times, Surface Ocean Mixing Rates and World- Wide Water Circulation Patterns from Cosmic Ray and Bomb Tritium. Ce0chi.m. Cosmochim. Acta 12 (4) : 277-296.
Booker, D. V., 1965: Exchange Between Water Droplets and Tritiated Water Vapor. Quart. J. Roy. Met. Soc. 91: 73-79.
Dana, M. Terry, J. M. Hales and M. A. Wolf, 1972: Natural Precipitation Washout by Sulfur Dioxide. BNWL-383, Battelle, Pacific Northwest Laboratories, Richland, Washington.
Dana, M. Terry, J. M. Hales, W.G.N. Slinn, and M. A. Wolf, 1973: Natural Precipitation Washout of Sulfur Compounds from Plumes. EPA-R3-73-047, Battelle, Pacific Northwest Laboratories, Richland, Washington.
Dickerson, M. H. and T. V. Crawford, 1972: In-cloud Precipitation Scavenging of Tritiated Water Vapor. UCRL-51283, Lawrence Livermore Laboratory, Livermore, California.
Engelmann, R. S., 1965: The Calculation of Precipitation Scavenging. BNWL-77, Battelle, Pacific Northwest Laboratories, Richland, Washington.
Friedman, Irving, Lester Machta and Ralph Soller, 1962: Water-vapor Exchange Between a Water Droplet and Its Environment. J. Geophys. Res. 67(7) : 2761-2766.
Hales, J. M., 1972a: Fundamentals of the Theory of Gas Scavenging by Rain. Atmospheric Environment 6: 635-659.
Hales, J. M., 1972b: Scavenging of Gaseous Tritium Compounds by Rain. BNWL-1659, Battelle, Pacific Northwest Laboratories, Richland, Washington.
Heffter, Jerome L., Albion D. Taylor and Gilbert J. Ferber, 1975: A Regional-continental Scale Transport, Diffusion, and Deposition Model. NOAA Technical Memorandum ERL ARL-50, Air Resources Laboratory, Silver Spring, Maryland.
Jacobs, D. G., 1968: Sources of Tritium and Its Behavior Upon Release to the Environment. U.S. Atomic Energy Commission, Division of Technical Information, 90 pp.
Kern, C. D., 1974: A Simple Model to Determine Mesoscale Transport of ~irborne Pollutants. ~Eoceedin~s of the Symposium on ~tmos~hkric Diffusion and Air Pollution, Santa Barbara, California, September 9-13, 1974.

Libby, W. F., 1963: Moratorium Tritium Geophysics. J. Geophys. Res. 68 (15) : 4485-4494.
Linsley, Ray K., Max A. Kohler and Joseph L.H. Paulhus, 1958: Hydrology for Engineers. McGraw-Hill Book Company, Inc., New York. 340 pp.
Machta, Lester, Gilbert J. Ferber and Jerome L. Heffter, 1973: Local and World-wide Pollutant Concentrations and Population Exposures from a Continuous Point Source. Air Resources ~aboratories ,- National Oceanic and Atmospheric Administration, Silver Spring, Maryland, 20910.
~almeA, E. and C. W. Newton, 1969: Atmospheric Circulation Systems. Academic Press, New York. 603 pp.
Sellers, William D., 1965: Physical Climatology. The University of Chicago Press, Chicago. 272 pp.
Smith, M. E. and I. A. Singer, 1966: An Improved Method of Estimating Concentrations and Related Phenomena from a Point Source Emission. J. ADD^. Meteorl. 5: 631-639.
Young, J. R., et al., 1975: Information Requirements for Controlled Thermonuclear Reactor Environmental Impact Statements. BNWL-1883, Battelle, Pacific Northwest Laboratories, Richland, Washington.

DISTRIBUTION
No. o f Copies
OFFSITE
1 ERDA Chicago Pa t en t Group 9800 South Cass Avenue Argonne, I l l i n o i s 60439
At tn : A . A . Churm
5 ERDA Cont ro l led Thermonuclear Research Div i s ion ERDA - GMTN Washington, D . C . 20545
Attn: L. Bogart F . E . Coffman G . K . Hess R . L . Hirsch J . M . Williams
189 ERDA Techni-cal Informat ion Center
2 A i r Resources Laboratory NOAA 8060 13 th S t r e e t S i l v e r Spr ing , Maryland 20910
A t tn : L . Machta J . H e f f t e r
ONS ITE
2 ERDA-Richland Operat ions Of f i c e
A t tn : B . J . Melton P . F . X . Dunigan
1 ERDA/RL Pa t en t At torney
A t tn : R . M . Po t ea t

No. of C o ~ i e s
ONSITE
4 8 Battelle-Northwest
Attn: W. J. Bair D. A. Baker R. G. Clark M. T . Dana (2) D. L. Elliott J. M. Hales A. B. Johnson D. S. ~enn; (25) W. F. Sandusky (5) L. C. Schmid C. L. Simpson E. C. Watson L. L. Wendell R. K. Woodruff J. R. Young Technical Information (3) Technical Publications