an analysis of the paddy/rice value chains in sri lanka · and efficient particularly by...
TRANSCRIPT

ASARC Working Paper 2016/04
1 | P a g e
An Analysis of the Paddy/Rice Value Chains in Sri Lanka
By
S.M.P.Senanayake
and
S.P. Premaratne
University of Colombo,
Sri Lanka
Abstract
This paper examines whether the structure of the paddy / rice market in Sri Lanka is competitive
and efficient particularly by undertaking two tracer surveys. From these surveys it was revealed
that the profit margins accruing to almost all the players involved in the paddy/rice value chains
of both Nadu and Samba varieties are not excessive when compared with the average bank
lending rate of 15 percent. The results of the tracer surveys also show that both the Nadu and
Samba paddy/ rice value chains are economically efficient. There are concerns however, about
the poor quality of rice milled by most small and medium scale traditional rice mills in the
country. It was also disclosed that there is no hard and fast evidence to prove the allegation that
the rice millers and wholesalers exploit both the rice producers and consumers by using
oligopsonic oligopolistic practices in both the producer and consumer markets such as ‘cornering
of the market’
Key Words: paddy/rice value chain, profit margins of paddy/tice, market structure, Sri Lanka
JEL Code: O53, Q12, Q13, Q18

ASARC Working Paper 2016/04
2 | P a g e
An Analysis of the Paddy/Rice Value Chains in Sri Lanka1*
S.M.P.Senanayake and S.P. Premaratne2
Introduction
Rice is the staple diet of the people in Sri Lanka and is the single most important crop occupying
34 percent (0.77 /million ha) of the total cultivated area. On average 560,000 ha are cultivated
during the main season and 310,000 ha during the second season making the average annual
extent sown with rice to about 870,000 ha. About 1.8 million farm families are engaged in paddy
cultivation island-wide. Sri Lanka currently produces 2.45 million MT of rough rice annually
and is virtually self-sufficient in rice. Rice provides 45% total calorie and 40% total protein
requirement of an average Sri Lankan. The per capita consumption of rice fluctuates around 114
kg per year (including rice and rice based products) depending on the price of rice, bread and
wheat flour.
.
It is projected that the demand for rice will increase at 1.1% per year and to meet this rice
production should grow at the rate of 2.9% per year. Increasing the cropping intensity and
national average yield are the options available to achieve these production targets.
Since rice is the staple diet and its cultivation is the main occupation of millions of small scale
producers the prices of both paddy and rice significantly affects the welfare of the people in the
country. Although these prices are fixed by the government there effectiveness is limited. It is
contended that both the producers and consumers are exploited by the players, particularly by
rice millers and wholesalers, involved in the value chain due to the oligopolistic/oligopsonic
structure in the market. These people are blamed for manipulating both paddy and rice prices
1 S.M.P. Senanayahke: Visiting Fellow, Faculty of Graduate Studies, University of Colombo, Sri Lanka; Email: [email protected]. S.P. Premarate: Senior Lecturer in Economics, University of Colombo, Sri Lanka. Email: [email protected] We are grateful to Prof. Jeevika Weerahewa and Dr. Rupasena Liyanapathirana for valuable comments made on an earlier vesion of this paper.

ASARC Working Paper 2016/04
3 | P a g e
particularly by private rice millers and who are allegedly cornering the markets of both paddy
and rice.
Therefore, the main objective of this paper is to find out the level of competition prevailing in the
paddy /rice market in Sri Lanka and to evaluate its efficiency by undertaking a value chain
analysis. The specific objectives are 1) to identify the roles played by the key value chain actors
in the paddy sector; 2) to discover the strengths and weaknesses of each value chain actors; and
finally 3) to suggest the measures that are needed to be adopted in order to improve the
performance of the paddy / rice value chain.
Theoretical Framework of Value Chain
A value chain is the full range of activities (including design, production, marketing and
distribution) businesses go through to bring a product or service from conception to delivery. For
companies that produce goods, the value chain starts with the raw materials used to make their
products, and consists of everything that is added to it before it is sold to consumers.
Harvard Business School's Michael E. Porter was the first to introduce the concept of a value
chain (Porter: 1985). Porter first discussed the value chain concept in his book “Competitive
Advantage: Creating and Sustaining Superior Performance”. He wrote “Competitive advantage
cannot be understood by looking at a firm as a whole. It stems from the many discrete activities a
firm performs in designing, producing, marketing, delivering and supporting its product. Each of
these activities can contribute to a firm's relative cost position and create a basis for
differentiation”. Porter suggests that activities within an organization add value to the service and
products that the company produces, and that all of these activities should be run at optimum
level if the organization is to gain any real competitive advantage. If they are run efficiently, the
value obtained should exceed the costs of running them (for example, customers should return to
the company and transact freely and willingly).
Thus, a value chain is a set of activities that a firm operating in a specific industry performs in
order to deliver a valuable product or service for the market. The idea of the value chain is based
on the process view of organizations, the idea of seeing a manufacturing (or service)
organization as a system, made up of subsystems each with inputs, transformation processes and
outputs. Inputs, transformation processes, and outputs involve the acquisition and consumption

ASARC Working Paper 2016/04
4 | P a g e
of resources - money, labour, materials, equipment, buildings, land, administration and
management. How value chain activities are carried out determines costs and affects profit.
Definitions of a "supply chain" virtually universally encompass the following three functions: i.
supply of materials to a manufacturer; ii. the manufacturing process; and, iii the distribution of
finished goods through a network of distributors and retailers to a final customer Companies
involved in various stages of this process are linked to each other through a supply chain.
To facilitate the flow of products, information is shared up and down the supply chain, i.e. with
suppliers and clients. This sharing of information enables all parties to plan appropriately to meet
current and future needs. Numerous goals such as inventory minimization, cost reduction,
marketing improvement, time management, quality and flexibility can be achieved through
successful supply chain management.
Supply chain management encompasses the planning and management of all activities involved
in sourcing and procurement, conversion, and all logistics management activities (Blanchard,
2010). Importantly, it also includes coordination and collaboration with channel partners, which
can be suppliers, intermediaries, third-party service providers, and customers. In essence, supply
chain management integrates supply and demand management within and across companies.
Supply chain management is an integrating function with primary responsibility for linking
major business functions and business processes within and across companies into a cohesive
and high-performing business model. It includes all of the logistics management activities noted
above, as well as manufacturing operations, and it drives coordination of processes and activities
with and across marketing, sales, product design, and finance and information technology.
The difference between a value chain and a supply chain is that a supply chain is the process of
all parties involved in fulfilling a customer request, while a value chain is a set of interrelated
activities a company uses to create a competitive advantage
In the literature on value chain analyses, it is well documented that integration into value chain
particularly global value chain helps the firms, particularly small firms to improve their
competitiveness. Integrating into value chain is one of the key concepts in modern industrial
development theory of networking. The value chain concept provides theoretical understanding
for the network paradigm of firm development. Various value chain conceptualizations can be

ASARC Working Paper 2016/04
5 | P a g e
found in the literature apart from that of Porter’s They include fiiliere approach (Raikes et al.
2000); linkage approach (Hirschman, 1958), Upassala approach (Håkansson, 1992; Håkansson
and Johanson, 1992), commodity chain (Gereffi and Korzeniewicz, 1994), and global value
chain (Gereffi, 1999).
The filiere approach focuses on flows, activities and actors within chain (filiere) and deals with
vertical integration. Porter’s value chain, the most popular one, uses all of the activities that a
firm performs to design, produce, and market, deliver and support its product. The model uses to
analyze firm’s competitive advantage within an industry. Linkage approach by Hirschman
mainly deals with backward linkages. Upassala approach focuses on marketing links, which
deals with networks of actors, activities and resources. Global commodity chain or global value
chain, which is an extension of commodity chain, is defined as a set of transnational inter-
organizational linkages that consists of the production, distribution and consumption of a
commodity. This is modification of the filiere approach. The global value chain provides new
practical insights on governance structures and upgrading opportunities of the firms in the value
chains of many industries, and is widely used as a tool for integrating small firms into global
value chain and as a tool for small enterprise development
Methodology
This paper is built on the information and data gathered from five sources namely, i). a desk
review of existing data, documents and reports, ii) Key Informant interviews (KIIs) and Focus
Group Discussions (FGDs) with farmers, traders ,millers ,transporters and officials of govt.
ministries / and organization, iii) a small questionnaire survey on the marketing flow and the
value chain which was carried out in both production and consumption areas, covering the
paddy/rice sector, iv) a structured questionnaire survey of the value chain players v) two tracer
surveys; one from a producer at Hambantota to a consumer at Kirulapona and the other from a
producer at Anuradhapura to a consumer at Gampaha. The study was based on the value chain
approach, which focuses on all the activities, players and relationships between and among

ASARC Working Paper 2016/04
6 | P a g e
players from input supply to consumption. The paper is based on both quantitative and
qualitative data. Qualitative data was collected as mentioned from interactions with the
stakeholders. The quantitative information on the characteristics and activities of the value chain
players were gathered from a structured questionnaire survey. The survey was carried out in 5
districts, namely Anuradhapura, Hambantota, Kurunegala, Ampara and Kilinochchi. From each
district one Divisional Secretary (DS) division was chosen where highest marketable production
was recorded, to select the traders and then one Grama Niladari (GN) division was chosen to
select paddy producers. The selection process was purposive and included a series of discussions
with Government officials involved in agricultural activities at National and provincial levels,
the representatives of trader and farmer associations, and individual traders and farmers. The
total sample sizes in the production areas was76.and in consumption areas it was 20.In the
production areas 16 producers, 29 collectors, 10 wholesalers, and 10 transporters and in the
consumption area, 8 wholesalers and 12 retailers were selected. The sample was chosen
purposively and the survey was conducted in August to September, 2012.
In calculating the marketing costs and margins of the players in the value chains of paddy / rice
two tracer surveys were conducted using the lot method suggested by Abbot .(Abbott,
1958).Under the Abbot’s lot method margins are computed by selecting specific lots or truck
loads of a commodity, in this case paddy, sold by a producer and tracing them through the value
chain up to the point it reaches the final consumer To ensure that these transactions were
representative of the procedure customary in the trade preliminary investigations were carried
out before the implementation of these tracer surveys. To ascertain the information on marketing
costs and margins of the players involved in the value chains two tracer surveys were conducted
as mentioned earlier. The first tracer survey covered the value chain of Long Grain paddy / rice
variety while the second one covered the Round Grain variety.
The small sample sizes of the value chain surveys and the tracer surveys are the major
constraints of this study. Therefore the results have to be generalized with care. However an
attempt was made to rectify this limitation to some extent through the information gathered from
the KIIs and FGSs conducted. Also some telephone interviews had to be made to collect
additional information

ASARC Working Paper 2016/04
7 | P a g e
The paddy/rice marketing system in Sri Lanka consists of both public sector and private sector
value chains (Figure 1). From the total paddy / rice trade about 90 per cent is handled by the
private sector value chain players while public sector accounts for only about 10 per cent (JICA
and SSC, 2013). The public sector value chain aims at delivering a service to both the producers
and consumers while the private sector is motivated by profit. However, in this paper only
private sector value chains are examined when calculating the marketing costs and margins and
the efficiency of the value chains due to the non- availability of data from the Paddy Marketing
Board (PMB) and Cooperative mills.
. The efficiency of a marketing system is measured in terms of the level and/or costs to the
system of the inputs, to achieve a given level and/or quality of output. Such inputs are generally
in the form of land, finance, time, manpower and materials. Typical outputs include the
movement of a given amount of a product to markets at specific distances, the supply of a
particular level of service to target market segments and the supply of products at a target price.
Hence resources are the costs and utilities are the benefits that comprise the marketing efficiency
ratio. Efficient marketing optimizes the ratio between inputs and outputs.
Paddy /Rice Market in Sri Lanka: Empirical Evidence:
As mentioned earlier, it is a common allegation that farmers do not get a fair price for their
paddy and consumers do not get rice at reasonable prices. This could be due to various structural
and operational deficiencies existing in the value chain, particularly lack of competition among
traders. It is found that there is an increasing gap between the farm gate and retail price of rice
and hence some authors have recommended that appropriate state interventions are needed to
address the issue. By conducting a value chain analysis of paddy / rice sector in the Kilinochchi
district in Sri Lanka Achchunathan and Kajana (2012) conclude that the small farmers in
Kilinochchi receive only a small fraction of the ultimate value of their output, even if, in theory,
risk and rewards should be shared down the chain.
Prasanna, Bulankulama and Kuruppuge (2012) examined and identified the likelihood factors
affecting on farmers’ higher gain from paddy marketing in the North Central Province of Sri
Lanka, where the main paddy cultivation area of the country. The study found that imperfections
of existing paddy marketing system in the area due to concentrated market power among few

ASARC Working Paper 2016/04
8 | P a g e
oligopolistic buyers. Furthermore, land size, land ownership, poor accessibility in formal sector
credit market and farmers involvement in informal sector credit sources are critical to farmers’
decisions to gain higher returns from paddy marketing. The results further showed the need of
reviewing the roles and functions of government extension services and farmer organizations
with regard to the paddy marketing
Rafeek and Samaratunge (2003) examined the market integration at farm and retail level in rice
trading in Hambantota and Kandy markets in Sri Lanka. Monthly producer, wholesale and retail
prices of different quality rice (Long Grain and round grain) during the period 1997 – 2000 was
used for the analysis. The results showed a low degree of market integration between farm and
wholesale markets while the wholesale and retail markets exhibit a greater degree of market
connection. The study pointed out that the changes in wholesale prices poorly transmitted to
farm gate prices and consequently leading to widening of the farm-wholesale margin.
Hathurusinghe and Ravichandran (2004) analyzed the price of rice in Sri Lanka for the period
1985 to 2002 using percentages, averages and ratios. This analysis showed declining trend in real
prices, lower absolute margins in lean supply period due to availability of imported rice at
cheaper rates, higher margins during the harvest time and declined farmer’s share due to increase
in marketing costs. The study also found that rice markets were well integrated and inter-
dependent. The study suggested the need of changing traditional inward looking policy of
achieving self-sufficiency in major food commodities towards the strategy of competitive
production for the domestic market and for the export market in the context of an open economy.
The regression estimates arrived at by Gunawardena and Quilkey (1993) indicated that higher
guaranteed price, larger quantities of domestic paddy output and higher levels of purchases of
rice by the consumers in concession market resulted in larger quantities of paddy sold by the
farmers to the government, while higher open market prices resulted in lower quantities of paddy
sold to the government. The study concluded that the guaranteed price of paddy and the sales of
rice in the concession market are key policy variables that can be manipulated to influence the
farmers’ supply of paddy in the official market
Wijesooriya and Priyadarshana (2013)conducted a study on the structure conduct and
performance of the rice milling industry in Polonnaruwa and Hambantota districts in Sri Lanka
They concluded that the rice milling industry in Polonnaruwa can be characterized as slightly
ASARC Working Paper 2016/04
9 | P a g e
concentrated while in Hambantota the industry is highly competitive. They also found that a high
degree of credit affordability, large quantity of paddy storage ability during the harvesting
season, and their established brand loyalty, provide major rice millers an opportunity to exercise
market power during the off season. With regard to the performance of the industry, they found
that the farmer’s share in consumer price of rice shown a volatile trend. They have also
calculated the concentration ratio of the rice milling industry in the two districts covered by their
study. The value of the concentration ratio of the top four rice mills in Polonnaruwa is 37 per
cent which means a slightly concentrated milling industry in Polonnaruwa. In Hambantota
this value is 25 per cent which reflects a highly competitive market structure. The calculated
value of the Herfindalh- Hirshman Index (HHI) was equal to0.04 in
Polonnaruwa and was 0.01 in Hambantota which means that the industry is un-concentrated in
Polonnaruwa and is highly competitive in Hambantota.
In a study specifically to look at the differences between pre and post-liberalization periods in Sri
Lanka Rupasena et al (2008) conclude that the seasonal price variation has declined during the
post-liberalization period but this variation of producer markets was much higher than the retail
markets3. In the long run, the paddy retail price stability has increased with economic
liberalization. The study further concludes by stressing the need for public-private partnerships
to develop an efficient marketing system for rice. In addition to the direct purchases by the
government, the policies should focus on supply management through storage at the farm level
to reduce the seasonal price variation at the producer level. In an effort to stabilize the rice
prices at the consumer level, care should be given to the level of stabilization which should go
with the change of the general price level. The derived demand elasticity for paddy also shows
that paddy is still an inelastic commodity (Marawila et al 2008) and therefore the .responses to
price changes are small.
Rupasena and Vijayakumar (2006) examined the structural changes in rice marketing after
economic liberalization in 1977 to compare the performance between pre and post liberalization
period. Since marketing links with the production, efficiency in rice cultivation and profitability
3 However, an interesting finding is that, while both the guaranteed price and the retail price influenced in the determination of the producer price in the pre‐liberalization era but only the retail price had an impact in the post‐liberalization era and that the terms of trade has increased in the pre‐liberalization period but decreased sharply in the post liberalization (Rupasena et al (2008)).

ASARC Working Paper 2016/04
10 | P a g e
via competing crops were also studied during post liberalization era. Major policy changes on
marketing during post liberalization period were closing down of the Paddy Marketing Board
along with guaranteed price scheme, replacement of rice rationing scheme by the food stamp
scheme, liberalization of rice imports, price stabilization through variable tariff and
establishment of a food supply monitoring system. The growth analysis showed that the area
under rice showed a positive growth before liberalization and no growth after liberalization.
Nevertheless, yield registered a positive growth in both periods but the growth rate lowered in
the post liberalization period. Production function analysis depicted that rice faming was
technically and allocatively inefficient in post liberalization period; labour and fertilizer were
over used and seed was under used. The Benefit Cost ratios were less than one for rice in all the
districts studied indicating un-profitability in production but over unity for all alternative crops
studied. Producer and retail price of rice increased in real terms during pre-liberalization era and
declined in post liberalization period. Seasonal price fluctuation reduced during post
liberalization regime over pre liberalization regime due to deregulation of rice trade. Rice
wholesale markets were well integrated during the post liberalization period indicating a positive
role played by market liberalization policies. The value of Nominal Protection coefficient
suggests that Sri Lankan rice is uncompetitive in the international trade. The study stressed the
need for a paradigm shift towards increasing farm income rather than increasing production to
sustain rice farming in the open economy. The policies governing rice economy should focus on
developing forward and backward linkages with private sector.
Weerahewa (2006) examined the economy-wide impacts of various policy packages on rice and
related markets, which consist of liberal as well as protectionist elements. A general equilibrium
model developed for the Sri Lankan economy using the input-output table for 2000 was used for
the analysis. The model consists of 5 sectors, 2 factors of production and households in 8
representative provinces. The key results of the analysis indicate that removal of the import tariff
on rice along with removals of the import tariff on fertilizer and/or subsidy payments on other
agricultural sectors could improve economic efficiency and household welfare across provinces.
Contrary to the general belief that protectionism is pro-poor, an import ban on rice reduces
household income and welfare even in agricultural provinces, including Uva and Sabaragamuwa.
Further her analysis indicates that broad-brush approaches may not yield expected outcomes, as
the policy packages generate second best outcomes due to existence of other distortions in the

ASARC Working Paper 2016/04
11 | P a g e
economy. The key channel of transmission of trade shock to households appears to be through
government transfer payments that are influenced by changes in government expenditures on
subsidy payments.
When reviewing this literature it became apparent that there is a dearth of studies which examine
the efficiency and the costs and margins of the players in the paddy / rice value chain in Sri
Lanka. Hence this paper attempts to bridge this important gap in the literature.
Paddy /Rice Value Chains in Sri Lanka
Figure 1 depicts the marketing flow of paddy into rice millers and rice from millers to
consumers. Farmers mainly sell to the village collectors and selling to PMB is insignificant.
Similarly millers mainly sell rice to wholesalers.
FIGURE 1: VALUE CHAINS FOR PADDY/RICE IN SRI LANKA
I N P U T SUPPLIERS
Fertilizer
Seed
Ag
Machinery
FARMERS
Own Consumption
MPCS
PMB
Collect
—or
Mobile
Trader
Seeds
Co‐
operative
Mills
PMB
Mills
Co‐
operative
Societies
CONSUMERS
RETAILERS
WHOLE SALERS
CWE
Outlets
S A L E S
Private
Mills
Agrochem Institution
s
Extension
Tech.
Services
Hotels /
Restaurants Payments in
Kind
Storage
Credit
ASARC Working Paper 2016/04
12 | P a g e
Source: Prepared by the Authors
Value Chain Players
Value chain includes intermediaries from input supply to consumption. Characteristics and the
roles and the problems faced by the major players in the paddy /rice value chain are described in
this section which is based on the findings of the questionnaire survey, key informant interviews
and focus group discussions. The method of selection of the sample of this questionnaire survey
was purposive and the details of which are given in the methodology section of this paper.
Input Suppliers
Seeds, fertilizer, agrochemicals and machinery (ploughing and harvesting machines) are major
inputs used in paddy farming. . As far as seeds are concerned, 50 percent of the sample farmers
used their own seeds. Only four percent of the famers in the sample purchased seeds from the
government sources namely, Agrarian Service Centers (ASC). However, provincial results vary.
In the Northern Province, ASC is the dominant supplier who supplies 68 percent, in the Eastern
province seed purchases had been mainly from other farmers and shops. In the Southern
province, none of the famers purchased from ASC and 50 percent of the farmers used their own
seeds and the rest was purchased from other farmers and shops. After promotion of the use of
organic fertilizer, farmers apply both organic and inorganic fertilizer. In the survey, nearly 95
percent of the farmers had applied organic fertilizer mainly purchased from manufacturers. None
of the farmers in the sample had used their own organic production. In the case of the North
Western province, farmers had purchased organic fertilizer from local councils such as
Municipal councils and Pradeshiya Sabhas. Since subsidized chemical fertilizer is distributed
through the ASCs, farmers are compelled to patronize them. However there are farmers who
purchase from the private shops when they cultivate more land and where the given quantity of
fertilizer is inadequate. In this survey, such farmers were only 12 percent of the total farmers.

ASARC Working Paper 2016/04
13 | P a g e
The majority of the farmers (75%) depend on private shops, either fertilizer shops or other retail
shops for purchase of agrochemicals. ASCs are not popular for the supply of agrochemicals.
Purchases from ASCs were reported only from the Southern province where 25 percent of the
farmers purchased from ASC’s. In the case of machinery, 50 percent of the farmers hired their
machinery, 44 percent used their own machinery and only 6 percent hired machines from ASCs
and this was reported mainly from the Southern province. Except for fertilizer, high cost of other
inputs is the major problem reported by over 80 percent of the farmers. Regarding chemical
fertilizer, unnecessary paper work and the non- availability of time are the two reasons reported
by over 60 percent of the farmers in the sample.
Farmers
According to the data obtained from the survey the majority of the Sri Lankan paddy farmers are
small scale producers who own less than 2 ha of land and therefore they have very small lots for
sale. Thus the problem of collecting paddy from producers poses problems. 31 % of the sampled
farmers are tenant cultivators while 50 % are owner cultivators. 62% of them are members of
farmers organizations, however, only 56% of them answered that their organizations were
effective. The average amount of marketable surplus of paddy is around 91% of the harvest.
Almost all the farmers sold their paddy to collectors in the villages and in close by towns except
in the Southern province where 75% farmers sold their paddy to the private rice millers. Farmers
only from the Eastern and North Central provinces sold to the Paddy Marketing Board (PMB) as
reported by 33 and 67% respectively. Since the PMB purchased only a limited quantity, bulk of
their marketed surplus was also sold to the collectors. Major problems reported in selling paddy
to PMB were long queuing time (46%), inability to meet the quality requirements (36%) and
cumbersome procedures (18%).
Collectors
The buyers who visit the farmers and purchase paddy from their threshing floors or homes are
called collectors. There are two categories of collectors of paddy: village collectors and town
collectors. Farmers have sold to both groups except for in the North Central province where all
the famers sold their paddy to town collectors. In the Southern province 25 percent of the
framers sold their paddy to the village collectors and the rest was sold to millers. High price
(50%), close proximity (31%) and credibility (31%) are the three major factors affecting the

ASARC Working Paper 2016/04
14 | P a g e
selection of buyers by farmers. None of the farmers reported provision of credit as a selection
criteria.
The town collectors purchase paddy at their business premises located in the small towns of the
production areas. Usually collectors go to the threshing floor and purchase paddy at discounted
prices. Major reasons given for choosing this business by the collectors are good income (24%),
spare time activity (24%) and being a family business (20%). On average, a collector has 65
regular farmers. 41% of the collectors provided credit to the farmers. About 25% of the
collectors are involved in paddy farming. 41% of the collectors borrowed money from banks.
54% of the quantity purchased by collectors was sold to the millers in the town followed by 27%
to the millers in the village and 19% to the millers outside the district.
As far as the ease of entry into the business of paddy collecting is concerned, the analysis of the
year of entering the business found that 59 percent of collectors have entered into the business
after 1996 and out of them 40 percent reported that their year of commencement of business as
after 2006. Analysis clearly indicates an increase of collectors over time except for the Southern
province where no new comers were reported after 1995. Only 23 percent of collectors in the
overall sample have commenced business before 1990. In the Southern province, reason for the
prevalence of few collectors is direct selling to millers by farmers as there were sufficient mills
in close proximity in surplus paddy producing areas. It was found that business in the Northern
Province is recovering after the end of the civil war. The number of collectors there has doubled
after 2006.
61% of the collectors get price information from other collectors and millers while 38%
collectors reported that they get prices and production information from farmers. With regard to
Trade Associations, 47% of the collectors, who were reported from all the provinces concerned,
are aware of such Associations and 31% of them are members of these associations. The
performance of Trade Associations is not satisfactory as reported by 84% of the collectors.
Major marketing problems reported by the collectors are limited investment capacity (52%), lack
of regular supply (31%), poor roads (15%), poor quality of paddy (15%) and irregular imports
(15%).
Paddy millers

ASARC Working Paper 2016/04
15 | P a g e
Mill owners who purchase paddy from the farmers and collectors are involved in de- husking the
paddy and sell the rice to the wholesalers at the mill; Sometimes retailers also purchase rice
directly from millers. Usually millers deliver the rice to the business premises of the retailers.
An analysis of the organization structure of the paddy milling industry found that 71 percent of
the rice mills belonged to the category of sole proprietor and 19 percent were partnership mills.
Only 5 percent of rice mills were owned by private (Ltd) companies and this was reported from
the North Western province only. Nearly 50 percent of the mills were set up before 1990 and
only 14 percent of rice mills were established after 2006.This implies the ease of entry into the
paddy rice milling industry. The entering of new paddy / rice mills into the industry was reported
from the Eastern and the North Western provinces only. According to the survey, 83 percent of
the employed population in paddy /rice milling industry is casual workers. On average, two
permanents and 11 casuals work at a rice mill.
71% of the rice mills belonged to the category of sole proprietor and 19% were partnership mills.
Average milling capacity of the mills included in the sample is 11 MT/day .88 % of the millers
paid famers at the time of purchasing paddy. All the millers in the sample have borrowed money
both from state banks (76%) and private banks (24%). Average amount borrowed per miller
amounted to Rs. 12.8 million. 58 % of the quantity of rice was sold at mills and the rest by
delivery.
Major problems cited by millers are low quality of paddy (65%), high electricity cost (20%) and
unstable prices (15%)
Supply side wholesalers
Supply side wholesalers are the wholesalers in the production areas who visit the mills and
purchase rice, transport to a market and selling to wholesalers and retailers in the consumption
areas.
None of the wholesalers are involved in farming. No one in the sample stored rice and only 20 %
of wholesalers transported rice. In other words, 80% of the wholesalers purchased rice delivered
to them either by the millers or the large-scale wholesalers. 60% of the wholesalers purchased
rice at their own business place. Payment was made on the spot as reported by 80% of the
wholesalers. Regarding borrowing of money for engage in business 70% answered “no”.

ASARC Working Paper 2016/04
16 | P a g e
30% of the supply side wholesalers were members of traders associations. These trade
associations are not effective as reported by 90 % of the wholesalers.
Major marketing problems reported were poor quality of rice (37%), irregular imports (37%) and
inadequacy of market facilities (12%).
Demand side wholesalers
Demand side wholesalers are the wholesalers doing business in the consumption areas that visit
the mills in the production areas, purchase and transport rice to the markets in the consumption
areas and sell to the retailers.
75 % of the demand side wholesalers purchased rice from millers and the rest (25%) from
wholesalers at Marandagahamula.
Problems faced by them are lack of storage facilities (37%), inadequacy of market facilities’
(27%) and government regulation such as price controls and taxes (27%).
Demand side retailers
These are the retailers doing business in the consumption areas. The rice is delivered to their
shops either by the mill owners (62%) or wholesalers (38 %).
Problems faced by them are government regulation such as price controls and taxes (75%)
inadequacy of market facilities (50%) and lack of storage facilities (25%).
Purchasing system and marketing of Paddy /Rice
Marketable surplus of paddy (un-milled paddy) is the quantity of paddy left after deducting the
quantities set aside for home consumption, payments in kind and seeds. There are five types of
first hand marketing outlets for paddy. They are private collectors, mobile traders, private
millers, the Paddy Marketing Board (PMB) and the Multi-purpose Cooperative Societies
(MPCSs,) see Figure 1). The value chain for paddy / rice consists of following players. The
buyers who visit the farms and collect the paddy from the producers are known as collectors. The
Private Collectors include village boutique keepers and purchasers in the nearby town. Mobile
traders are the traders who come in Lorries or trucks to the producing areas from distant places to
purchase paddy. The mobile traders purchase paddy directly from farmers as well as from the
collectors in the villages and nearby towns. At times private millers also visit producing areas in

ASARC Working Paper 2016/04
17 | P a g e
their trucks to purchase paddy directly from the producers or collectors. Mobile traders and
private millers go to the threshing floor of the producers to purchase paddy This induces social
heterogeneity among buyers which leads to increased competition and resulting in relatively
higher prices. Hence the farmers do not have to incur costs for transporting paddy in this case.
These three groups purchase more than 90 % of the marketable surplus of paddy of the farmers
in a given season. They usually purchase paddy immediately after harvest when the prices are
low. Some of the collectors, mobile traders and millers provide credit facilities for the farmers
for financing their cultivation operations. They also provide inputs in kind (such as chemicals)
and hire their land preparing (tractors) and threshing machines on credit basis and later get back
the monies due to them in the form of paddy. The farmers sell their paddy to these buyers for
several reasons. They include repayment of loans, mutual trust, and long patronage. These
buyers often purchase paddy with higher moisture contents (at a discounted price), and the
institutional buyers (PMB and MPCS) purchase only a limited quantity. When the harvest is
bountiful the paddy prices in the open market go down severely and these buyers purchase paddy
much below the floor price set by the government. However in the lean seasons paddy prices in
the open market rise above the floor price and there is severe competition among the millers to
purchase paddy.
The two types of institutional first hand marketing outlets are the purchasing centers (paddy
stores) of the PMB and the MPCSs. They purchase paddy at these purchasing points and the
farmers are required to transport their paddy to these purchasing points. Paddy is purchased at
the prices fixed by the government. In 2012 when this survey was conducted, the PMB
purchasing prices were Rs 35 per kg of round grain variety and Rs 32 per kg of long grain
variety. The 2015 prices were Rs. 50 for round grain and Rs. 45 for Long Grain varaiety. 4
These two institutions are purchasing paddy subjected to the pre-specified quality criteria in
respect of moisture content, extraneous matter and sand etc. But these institutions purchase only
a limited quantity of the marketable surplus of paddy available with the farmers (roughly about
10%).
The paddy purchased by the collectors and mobile traders are sold to the private millers. In
addition these millers also purchase paddy directly from producers. The financial strength of the
4 After the 2016 Budget the present the PMB prices were revised as Rs. 41 for Samba and Rs. 38 for Nadu

ASARC Working Paper 2016/04
18 | P a g e
millers places them in a very advantageous position to purchase and hold stocks of paddy (un-
husked rice). Often rice millers are blamed for market manipulation to lower the purchase price
of paddy and increase the price of rice, an allegation which is examined in this paper.
When the need arises the PMB also obtain the services of the private millers to get milled part of
the paddy collected by the PMB. The PMB mills process the balance. The MPCSs usually have
their own rice mills to process the paddy collected by them.
Some of the private mill owners have their own sales outlets and they also distribute the rice
through their own fleets of vehicles to the door-steps of the wholesalers or retailers. Consumers
purchase rice from retailers. The rice milled by the PMB by its own mills or through the
cooperative or private mills are supplied to the institutional buyers (armed forces, hospitals, etc.)
and sold through the MPCS, and private retailers. The rice milled by the MPCS mills is sold
through the MPCS branch network.
Overall Issues in Paddy / Rice Marketing5
At present the main objective of the PMB is to stabilize prices both in the paddy (producers) and
rice (consumers) markets. PMB offers guaranteed prices for producers. The round grain variety
is purchased at Rs. 41 and the long grain variety at Rs. 38 a kg after the 2016 budget. Since the
cost of production of paddy was estimated. at Rs.30.48 a kg in Maha 2014, (Socio- Economic
and Planning Center, 2014) farmers are getting a reasonable profit margin by producing paddy if
they are able to sell at the guaranteed prices. However, in the recent past the PMB was grappling
with problems of purchasing paddy. The PMB was able to purchase only a small proportion of
paddy offered for sale due mainly to the problems of storage and shortages of working capital. In
July 2015 the farmers were compelled to sell paddy in the open market where prices ranged
between Rs39 a kg for the round grain variety and Rs. 28.47 for long grain variety, both were
much below the guaranteed prices of Rs.50 a kg for round grain and Rs.45 for long grain . In
July 2012 when this survey was undertaken the producer prices were Rs.34.29 a kg for round
grain and Rs.27.61 for long grain. The low prices were due to excess supply in the recent past. At
an estimated per capita consumption of 114 kg of rice and rice based products the total
requirement of rice in the country is estimated at 2376,000 MT, but production was 2800,000 5Much of the statistics given in this section were provided by the Marketing Food Policy and Agri‐business Division of the Hector Kobbekaduwa Agrarian and Research Institute, Colombo Sri Lanka Support extended by Mr. Duminda Priyadharshana, Head of the Division is gratefully acknowledged.

ASARC Working Paper 2016/04
19 | P a g e
MT in 2015. Also another 1 million MT of special varieties of rice such as Basmati was
imported. On the other hand, round grain rice price to the consumers was fixed at Rs. 70.00 and
long grain rice at Rs. 60.00 a kg.
Although it is alleged that certain mill owners corner both the paddy and rice markets due to
their oligopsonic and oligopolistic powers as well as large scale operations there is no hard and
fast evidence to substantiate such allegations made against them Producer prices have been low
due to the excess supply prevailed in the market as was explained above. According to the
information gathered through KIIs and FGDs revealed that it is not monopolistic or oligopolistic
as often thought. The situation is more or less the same in the rice market. This is because there
are a large number of rice mills in major producing areas, and according to Wijesooriya and
Priyadarshana (2013) who calculated the concentration ratios of the rice mills have found that the
concentration ratios were 37 percent and 25 percent in the Polonnaruwa and Hambantota districts
respectively. This implies a slightly concentrated market power of the millers in the Polonnaruwa
district and a highly competitive market structure in the Hambantota district. They also found
that a high degree of credit affordability, large quantity of paddy storage ability during the
harvesting season, and their established brand loyalty, provide major rice millers an opportunity
to hold market power during the off season. Large scales of operations, use of modern
technology which result in a high milling outturn and better quality of rice place these millers in
an advantageous position in the milling industry .Most of the other millers cannot afford to have
the modern technology due to high costs involved, and their inability to obtain such large sized
loans, amounting to about Rs.50 million, due to lack of proper securities. .Although in the
Polonnaruwa district, the market power is slightly concentrated it is hard to find firm evidence of
collusion among these top millers. For example, according to the data available from PMB6, in
2012, Polonnaruwa district alone had 246 large rice mills which can produce good quality rice.
In the same year, Anuradhapura district too had 280 rice mills, which produced good quality rice.
In 2012 in the country there were 721 large rice mills, which can process 5,000- 7,000 mi. per
day which implies a low concentration ratio in the rice milling industry in the country as a whole,
thus making it difficult for the rice millers to collude.
66 Personal communication with the former Chairman PMB

ASARC Working Paper 2016/04
20 | P a g e
The biggest problem faced by the paddy producers during harvest time is the very low prices
prevailing in the market during those periods. During the harvesting time prices fall much below
the minimum floor price due mainly to the excess supply of paddy prevailing in those periods
The PMB and MPCSs are unable to purchase the entire stocks of paddy offered for sale during
such periods, due to insufficiency of working capital and lack of other resources such as storage
facilities and packaging materials. The PMB owned only 180 stores in 2012 and they were also
very old and badly needing repairs. Many stores were damaged by terrorist activity during 1988/
1989 and during the conflict in the North and East. The government has sought foreign
assistance to repair these stores and the mills but so far the response has been very poor. The
situation is very serious in the Northern and Eastern provinces of the country. Special programs
have been launched by the PMB in these areas but such measures are inadequate to solve the
problems.
Another concern is the low quality of rice produced by the traditional rice mills. About 60
percent of the paddy in the country is processed by these traditional mills (Palipane. Undated)
Under the prevailing free trade policies, with increased purchases of rice in the open market at
competitive prices, there has been a growing awareness and an increased demand for better
market quality among consumers. Rice quality improvement will become even more important
in the future with Sri Lanka, like most other countries, entering into international as well as
regional trade agreements and thereby opening its market to the outside world. This would create
a situation where the country will have to compete with other rice producing countries in the sale
of locally produced rice. In this context, reducing production costs for sale of rice at competitive
prices and improvement of the rice quality to international standards assumes importance.
At present the price of locally produced rice is approximately 25% higher than imported rice.
Also, a recent survey conducted by the Institute of Post-Harvest Technology (IPHT) on quality
of locally produced rice available in the open market has revealed that the rice quality is below
the requirements of international standards.
The low productivity of the existing rice mills has significantly contributed to high production
costs. For instance, even though the achievable rice milling recovery is 69%, in most rice mills
the rice outturn is around 62 to 65%. The main factors contributing to reduction in rice quality

ASARC Working Paper 2016/04
21 | P a g e
are presence of high amounts of broken grains, paddy seeds, type admixture, impurities,
damaged and discolored grains and non-uniformity in bran removal
Although there is a demand for high quality premium rice in Sri Lanka, the country is not in a
position to produce such rice due to the poor quality of the rice mills. Sri Lankan millers have
realized that with the current equipment and machinery they are unable to produce quality rice
and have started upgrading their mills by adding new machinery on an ad-hoc basis. These
measures have not brought successful results so far.
Marketing Costs and Margins of Paddy / Rice Value Chain
By performing certain functions and services, various marketing organizations and agencies
make it possible for commodities, produce and products to move from producers to consumers.
However, these functions incur costs, often of considerable magnitude. Discussions on margins
and costs usually include the topic of marketing efficiency. An efficient marketing system is one
capable of moving goods from producer to customer at the lowest cost consistent with the
provision of the services that customers demand. Once the costs involved in marketing have been
identified then means can be devised to make the system more efficient. Increases in efficiency
can be achieved in a variety of ways: by increasing the volume of business using improved
handling methods, investing in modern technology, locating the business in the most appropriate
place, implementing better layouts and working practices in production, improving managerial
planning and control and/or by making changes in marketing arrangements (e.g. through
horizontal or vertical integration). Increased efficiency is in the best interests of farmers, traders,
processors, wholesalers, retailers, consumers and society as a whole.
Marketing costs and margins of paddy / rice (long grain variety) from the farmer at Hambantota
to the consumer at Kirulapona in the year 2012 are given in table 1. It is seen that the price paid
by the Kirulapona consumer was Rs. 56 in 2012. Then the costs and margins are presented as a
percentage of the consumer price. Accordingly price received by the producer in July 2012 in
Hambantota has been Rs.30/kg. The average producer price for long grain paddy as given by
HARTI for that month has been Rs. 27.61 per kilo. Since 1.6 kg of paddy are required to

ASARC Working Paper 2016/04
22 | P a g e
produce 1kg of rice, price received by the producer for that quantity has been Rs.46.41.This is
82.88 percent of the price paid by the consumer for 1 kg of rice. Hence the total marketing costs
and margins in the entire value chain has been 17.12 percent. This is suggestive of a very thin
margin and an efficient value chain. However, it is difficult to generalize this assertion due to the
smallness of the sample.
It has also to be noted that out of this 17.12 percent margin the bulk consists of miller’s costs and
margins that is 13.60 percent. From the millers costs the cost of paddy (in this case the raw
material) equivalent works out to 82.88 percent of the price of a 1kg of rice.
Table 1 Marketing Costs and Margins of Paddy / Rice (Long Grain) from the Farmer at
Hambantota to Consumer at Kirulapona in 2012
Item Rs. /kg %
Price Paid by the Consumer
Retailer’s Costs and Margins
Price Paid by retailer to the wholesaler at 4th Cross Street
Transport
Labor
Wholesalers Margin
Price Paid to the Miller by Wholesaler /Commission
Agent
Cost of Rice to the Miller at Hambantota
Millers Costs and Margins
Costs of Paddy Equivalent
Costs of Processing
Transport
Labor
56.00
3.26
52.74
1.00
0.40
2.34
49.84
48.40
7.60
46.41
4.00
0.75
0.10
100.00
1.82
94.18
1.79
0.71
1.16
89.00
86.43
13.60
82.88
7.14
1.34
0.18

ASARC Working Paper 2016/04
23 | P a g e
Packing
Millers Margin
Price Received by Farmer at Hambantota (Rs.30/kg)
Transport
Labor
0.58
2.00
46.41
0.50
0.44
1.04
3.57
82.88
0.89
0.79
* Conversion Rate 1.61 kg of Paddy is required to produce 1 kg of Rice
Source: Prepared by the authors on information available from JICA and SSC (2013)
However miller’s profit margin according to the tracer survey was only 3.57 percent. According
to this finding the accusation that the millers exploit the farmer and the consumer by cornering
the market is questionable. It is true that profits of the millers are large but this may be due to the
fact that the transacted volumes are large. Observed profit margin per unit of rice is very low in
this case. If this is true, it can be discerned that the profit margins accruing to almost all the
players involved in Long Grain paddy / rice value chain are not excessive when compared with
the Bank Rate which was 15 percent in 2012. Low profit margins may be due to the fact that
there is a guaranteed price scheme for paddy on one hand and existence of a control price for
consumer price of rice. The profit margins of retailer’s (including marketing costs), wholesaler’s,
and millers worked out to be 1.82, 1.16, and 3.57 percent respectively as was revealed from the
tracer survey. This implies of an efficient paddy / rice value chain in Sri Lanka in the case of
Long Grain variety.
The situation is more or less similr in the case of the value chain of the round grain variety of
paddy / rice as revealed in table 2. In table 2 marketing costs and margins of the paddy / rice of
the round grain variety from farmers at Anuradhapura to consumer in Gampaha as existed in
2012 are given. Accordingly the consumer price / retail price of 1 kg of round grain rice has been
Rs. 70 a kilo. The marketing costs and margins of round grain rice are calculated on the basis of
this price. In the case of round grain variety 1.5 kg of paddy7 is required to produce 1 kg of rice.
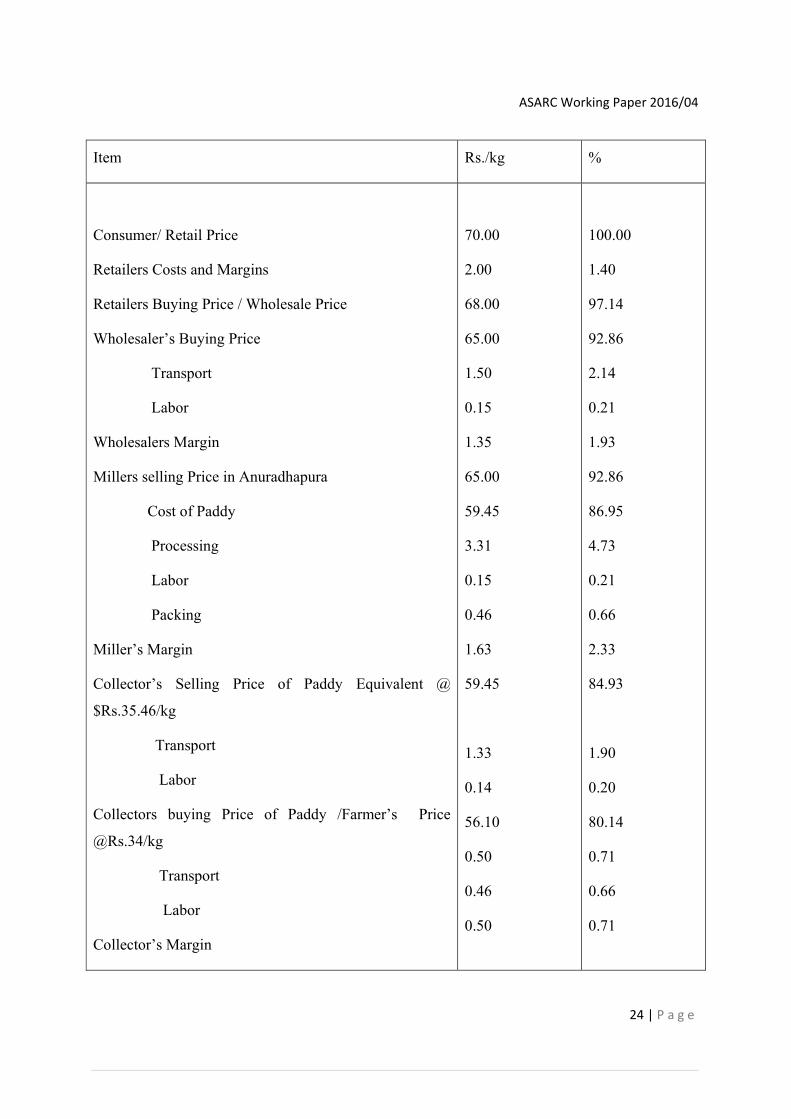
Table 2 Marketing Costs and Margins of Paddy / Rice (Round Grain) from Farmers at
Anuradhapura to Consumer in Gampaha in-2012
7 Conversion rate given by the Central Bank of Sri Lanka is 0.6
ASARC Working Paper 2016/04
24 | P a g e
Item Rs./kg %
Consumer/ Retail Price
Retailers Costs and Margins
Retailers Buying Price / Wholesale Price
Wholesaler’s Buying Price
Transport
Labor
Wholesalers Margin
Millers selling Price in Anuradhapura
Cost of Paddy
Processing
Labor
Packing
Miller’s Margin
Collector’s Selling Price of Paddy Equivalent @
$Rs.35.46/kg
Transport
Labor
Collectors buying Price of Paddy /Farmer’s Price
@Rs.34/kg
Transport
Labor
Collector’s Margin
70.00
2.00
68.00
65.00
1.50
0.15
1.35
65.00
59.45
3.31
0.15
0.46
1.63
59.45
1.33
0.14
56.10
0.50
0.46
0.50
100.00
1.40
97.14
92.86
2.14
0.21
1.93
92.86
86.95
4.73
0.21
0.66
2.33
84.93
1.90
0.20
80.14
0.71
0.66
0.71

ASARC Working Paper 2016/04
25 | P a g e
*1.5 kg of Paddy is required to produce 1 kg of Rice
Source: Prepared by the authors on information available from JICA and SSC (2013)
The paddy price received by the farmers in Anuradhapura has been Rs.34 per kg in July 2012.
The average producer price given by HARTI in that month was Rs. 34.29 a kilo .Since 1.5 kg of
round grain paddy is required to produce 1 kg of rice the farmer had received Rs.56.10 for that
quantity. This was 80.14 percent of the consumer price. Hence the farmer’s share in the
consumer rupee is somewhat lower in the round grain variety when compared with the long grain
variety. This is because the price of rice in the consumer market is higher by Rs.14 in the case of
round grain variety, and also a lesser quantity of paddy (the raw material) is required to produce I
kg of rice. The involvement of an additional player called collector in between the producer and
miller is also a contributory factor. The millers purchase this quantity of paddy at Rs.59.45 or
84.93 percent of the price of 1 kg of rice. The miller’s purchasing price of 1 kg of paddy was
Rs.35.46. The marketing costs and margins accruing to the players in the entire value chain
works out to 20.86 percent. This suggests that the margins are thin and the value chain for round
grain variety also efficient. The marketing margins of the retailers, wholesalers, millers and
collectors are calculated as 1.40, 1.93, 2.33 and 0.71 percent respectively. As in the case of the
value chain of the long grain variety, in this case also marketing margins are very small.
Conclusions
This paper examined whether the structure of the paddy / rice market in Sri Lanka is competitive
and efficient by using a value chain approach. It was observed that the profit margins accruing to
almost all the players involved in the paddy / rice value chains of both long grain and round grain
varieties are not excessive when compared for example with the Bank Rate. From the evidence
available from the tracer surveys it was also found that both the value chains are economically
efficient. Although it is alleged that certain mill owners corner the market due to their
oligopsonic and oligopolistic power in both the producers’ and consumers’ markets as well as

ASARC Working Paper 2016/04
26 | P a g e
large scale operations there is no hard and fast evidence to prove the validity of such allegations
made against the rice market It is not monopolistic or oligopolistic as often thought according to
the evidence presented in this paper. Also, as there are a large number of rice mills in major
producing areas, making it difficult for mill owners or wholesalers to collude due to the
seemingly low concentration of market power. But, it is difficult to arrive at firm conclusions
due to the limitations of the samples.
However, despite there is a demand for high quality premium rice in Sri Lanka, the country is
not in a position to produce such rice due to the poor quality of the rice mills. Sri Lankan millers
have realized that with the current equipment and machinery they are unable to produce quality
rice and have started upgrading their mills by adding new machinery on an ad-hoc basis. These
measures have so far not been very successful and therefore Sri Lanka’s rice milling industry is
not technologically efficient.
Rice/paddy sector is one of the largest sectors in Sri Lanka, in which many players, activities and
resources are involved. It is well established that the value chains, provide opportunities for them
in improving their competitiveness. Several models of integration have emerged. In most cases
the small producers within value chains work together and form producer groups. In some cases,
large firms take a leading role for such integration. These types of integration models can be
developed in paddy/ rice sector in Sri Lanka as well. Small farmers will be able to benefit from
such integration.
The evidence presented in this paper cannot be considered as conclusive due mainly to the
smallness of the sample and due to the inherent unsophisticated nature of the tracer surveys
undertaken Also the concentration ratios calculated by Wijesooriya and Priyadarshana relates to
the year 2012, and this ratio might have been increased afterwards. Further that this study was
limited to two districts only Therefore it is proposed that a fresh survey involving a large and
representative sample be conducted to arrive at firm conclusions about the paddy / rice value
chains in Sri Lanka.

ASARC Working Paper 2016/04
27 | P a g e
References
Abbott, J.C (1958) Marketing Problems and Improvement Programmes FAO, Rome
Blanchard, David (2010), Supply Chain Management Best Practices 2nd Edition, John Wiley &
Sons,
Gereffi, G., (1999), International Trade and Industrial Upgrading in the Apparel Commodity
Chain, Journal of International Economics, Vol. 48 (1) 37-70
Gereffi, G, and Korzeniewicz, M. (1994), Commodity Chains and Global Capitalism, Praeger,
Westport
Gunawardana, P. J. and Quilkey J. J. (1993) Determinants of Paddy Sales by Farmers on the
Official Market in Sri Lanka: 1953-1989. Indian Journal of Agricultural Economics, Vol.
48, No. 4, pp.649-657
Håkansson, H., (1992), ‘Evolution Processes in Industrial Networks’, in Axelsson, B., and
Easton, G., (eds.), Industrial Networks: A New View of Reality, London: Routledge
Håkansson, H and Johanson, J, (1992), ‘A Model of Industrial Networks’, in (eds.) B. Axelsson
and G. Easton, Industrial Networks: A New View of Reality, London: Routledge
Hathurusinghe, C. P., and Ravichandran, T. (2002) Review of Food Prices in Sri Lanka Report,
Hector Kobbekaduwa Agrarian Research and Training Institute, Colombo
Hirschman A., (1958), The Strategy of Economic Development, Yale University Press, New
Haven.
Marawila, T.D. Krishanthi D. P. M. Jayasinghe- Mudalige, U. K. (2008) Self Sufficiency in Rice
vs Inefficiencies in Price: An Econometric Approach for Paddy Sector in SL., Proceedings
of the 8th Agriculture Research Symposium, Wayamba University
Palipane, K.B (Undated) Milling and Quality Improvement in Rice, Institute of Post- Harvest
Technology, Anuradhapura
Porter, Michael E. (1985) Competitive Advantage: Creating and Sustaining Superior
Performance. The Free Press, Simon and Schuster: New York
ASARC Working Paper 2016/04
28 | P a g e
Prasanna, Bulankulama and Kuruppuge R., (2012) Factors Affecting Farmers’ Higher Gain from
Paddy Marketing: A Case Study on Paddy Farmers in North Central Province, Sri Lanka.
International Journal of Agricultural Management & Development (IJAMAD), Vol. 2 (1)
57-69.
Rafeek, M.I.M., and Samaratunge, P. A. (2002) Trade Liberalization and Its Impact on the Rice
Sector of Sri Lanka, Sri Lankan Journal of Agricultural Economics, Vol. 3 (1) 143-154.
Raikes, P. Jensen, F.M., and Ponte S., (2000), Global Commodity Chain Analysis and the French
Filiere Approach: Comparison and Critique, CDR Working Paper No. 3, Centre for
Development Research, Copenhagen.
Rupasena, L. P., and Vijayakumar, H. S. (2006) Comparative Analysis of Rice Marketing System
in Sri Lanka: Pre and Post Liberalization Period. Department of Agricultural Marketing
Co-operation and Agribusiness Management, University of Agricultural Sciences,
Dharwad
Rupasena, L., P. Kerur, N., M. and Naik, A. D. (2008) A Review of Price Behaviour of Rice: Pre
and Post Liberalization Periods Sri Lanka Journal of Agrarian Studies, Vol 12(1) 123-45
Sivapalan Achchuthan and Rajendran Kajana (2012) A Study on Value Chain Analysis in Paddy
Sector: Special Reference to Kilinochchi District, Sri Lanka in Global Journal of
Management and Business Research Vol.12 (18) 65-87
Socio-Economic Planning Center, (2014) Cost of Cultivation of Paddy 2013 /2014 Maha, Dept.
of Agriculture, Peradeniya
Weerahewa, J. (2006). Rice Market Liberalization and Household Welfare in Sri Lanka: A
General Equilibrium Analysis. Canadian Agricultural Trade Policy Research Network
(CATPRN) Working Paper 2006-1, pp.1-25
Wijesooriya, W.A.N, and W.H.D. Priyadarshana (2013) Structure, Conduct and Performance of
Rice Milling Industry in Polonnaruwa and Hambantota Districts of Sri Lanka, Research
Report no.163, Hector Kobbekaduwa Agrarian Research & Training Institute, Colombo