an analysis of the housing needs in nunavut
TRANSCRIPT

1
An analysis of the housing needs in Nunavut:
Nunavut Housing Needs Survey 2009/2010
A working paper prepared by Income Statistics Division, Statistics Canada for
the Nunavut Housing Corporation
October 29, 2010

2
Contents 1.0 Highlights ................................................................................................................................................ 3
2.0 Introduction ............................................................................................................................................ 4
3.0 Housing stock .......................................................................................................................................... 4
3.1 Housing tenure .................................................................................................................................... 4
3.2 State of housing .................................................................................................................................. 6
3.2.1 Adequacy...................................................................................................................................... 6
3.2.2 Suitability ..................................................................................................................................... 8
3.2.3 Adequacy and suitability together ............................................................................................. 10
3.3 Summary of housing stock ................................................................................................................ 10
4.0 Need for housing ................................................................................................................................... 11
4.1 Groups that would be formed if additional housing was available .................................................. 12
4.2 Summary of need for housing ........................................................................................................... 13
5.0 People in immediate need of housing .................................................................................................. 14
6.0 Conclusion ............................................................................................................................................. 15
Appendix A—Tables .................................................................................................................................... 16
Appendix B—Survey Methodology ............................................................................................................. 22
Appendix C—Definitions ............................................................................................................................. 24

3
1.0 Highlights The Nunavut Housing Needs Survey (NHNS) is a survey of households in 25 communities in Nunavut,
conducted from November 2009 to June 2010. The survey’s primary objective was to collect data on the
housing needs of Nunavummiut to assist the Government of Nunavut in planning and providing housing.
Housing stock consists mostly of public housing
The 25 communities surveyed contained 9,400 dwellings, of which 8,550 were occupied by usual
residents. Most of the housing occupied by Nunavummiut was public housing, which made up slightly
more than one-half of the occupied dwellings. The second most common type of housing was owner-
occupied dwellings, comprising about 20%.
About one-half of households lived in dwellings that were crowded and/or in need of major repair
The proportion of occupied dwellings that were crowded and/or in need of major repair in the 25
Nunavut communities was 49%. Of all the occupied dwellings, 35% were crowded dwellings, 23%
required major repair, and 9% were both crowded and in need of major repair. Of the owner-occupied
dwellings, 47% were either crowded and/or in need of major repair (29% crowded, 28% in need of major
repair, and 10% both crowded and in need of major repair). Of the public housing dwellings, 63% were
either crowded and/or in need of major repair (49% crowded, 26% in need of major repair, and 12%
both crowded and in need of major repair). Other types of housing had a lower prevalence of dwellings
that were either crowded and/or in need of major repair (22% of government-staff housing and 26% of
other types including non-government staff housing, private market rental housing, and other types).
However, the number of owner-occupied dwellings and public housing dwellings far outnumbered the
other housing types.
If more housing were available, 3,580 groups would move out of dwellings below housing standards
If more housing were made available to people in dwellings below housing standards, 3,580 groups
would want to move. Most of the groups would comprise a small number of people: 1,420 would be
one-person groups, 490 two-person groups, 510 three-person groups, 430 four-person groups, 310 five-
person groups, and 420 six or more-person groups.
Of the 4,030 dwellings below housing standards, 1,270 had residents who did not want to move out; in
another 1,480 dwellings, the entire household would move out.
About 1,220 Nunavummiut did not have a usual home and were living temporarily in another person’s
dwelling
These temporary residents without a usual home elsewhere accounted for 4% of Nunavut’s population,
or about 1,220 persons at the time of the survey. During the 12 months prior to the time of the survey,
2,730 households helped house temporary residents by allowing them to stay temporarily at their
dwelling.

4
2.0 Introduction This report presents an analysis of housing needs in Nunavut based on the 2009/2010 Nunavut Housing
Needs Survey (NHNS).1 The NHNS is a survey of households in 25 communities in Nunavut. It was
conducted from November 2009 to June 2010 using interviewers hired from Nunavut communities. The
survey’s primary objective was to collect detailed data on the housing needs of Nunavummiut to assist
the Government of Nunavut in planning and providing housing. The survey included questions on the
people living in the dwelling and their characteristics, the intent of people to move out of a dwelling if
more housing were available, and the physical characteristics of the dwelling. The survey and this report
were commissioned by the Nunavut Housing Corporation (NHC).
This report analyses the survey results and presents: a picture of the current housing stock using
standard housing indicators (Section 3); an examination of the need for additional housing (Section 4);
and a profile of people in need of housing (Section 5).
3.0 Housing stock In the survey, the housing stock2 was measured by interviewers. They visited each dwelling to determine
if it should be part of the housing stock. There were 9,400 dwellings in Nunavut, of which 8,550 were
occupied by usual residents.3 The remaining 850 dwellings were unoccupied or occupied temporarily by
persons who considered their usual residence elsewhere.4 Table A1 shows the housing stock for each
community in Nunavut.
Important factors that help describe the housing stock include how people pay for their dwelling
(whether they own or rent), the physical condition of the dwelling, and the space available for the
people who live in the dwelling. This section will examine each of these factors and what they say about
the housing stock in Nunavut.
3.1 Housing tenure Housing tenure refers to whether some members of the household own or rent the dwelling. This
directly affects housing costs, rights, and obligations. Because of the different benefits and costs for
each type of housing tenure, the characteristics of the people living in the various types of dwellings can
be quite different. As a result, housing assistance programs must often be tailored to specific housing
tenures, since housing needs will differ for occupants of different characteristics. Thus, understanding
the specific types of housing tenure is necessary to address each group’s unique housing challenges.
1. See Appendix B for a description of the survey methodology. 2 .The housing stock consists of all dwellings used for habitation regardless of whether they are occupied or not. See Appendix C for a full definition. 3. A dwelling occupied by usual residents refers to a dwelling in which a person or a group of persons is
permanently residing. See Appendix C for a full definition.
4. A dwelling occupied solely by temporary and/or foreign residents refers to a dwelling in which all residents
reside there at the time of the survey, but have a usual place of residence elsewhere. An unoccupied dwelling
refers to a dwelling in which no usual, temporary or foreign resident is living at the time of the survey. See
Appendix C for a full definition.
5
In Nunavut, among the renter-occupied dwellings there are three distinct categories of rental units:
public housing, government-staff housing, and other types of rental housing (including non-government
staff housing and private market rentals). Public housing dwellings are subsidized rented dwellings
managed by the Nunavut Housing Corporation available to Nunavummiut who meet certain eligibility
requirements. Government-staff housing dwellings are Government of Nunavut- and Government of
Canada-managed or -leased dwellings provided to employees, often with a subsidy. Other types of
rental housing include non-government-staff housing, private market rentals, and respondents who
indicated an ‘other’ type of rental. Although the characteristics of people in the ‘other’ type of housing
may be different, they were grouped together for analysis, as they each make up only a small portion of
the housing types.
Public housing made up the majority—51%—of the housing stock in Nunavut. Of the 8,550 occupied
dwellings, 4,400 were public housing, 1,880 were owner-occupied, 1,350 were government-staff
housing, 350 were non-government-staff housing, 340 were private market rentals, and 240 were
specified as ‘other type of rental’ or an unspecified housing tenure (Table A2).
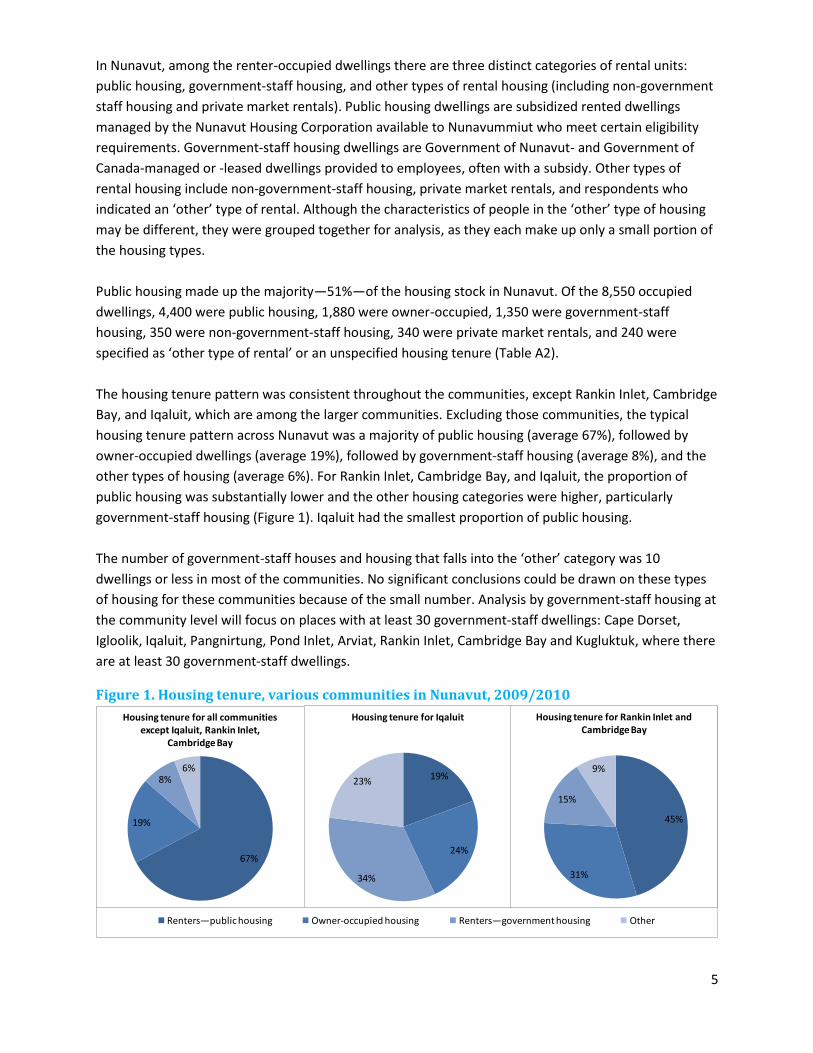
The housing tenure pattern was consistent throughout the communities, except Rankin Inlet, Cambridge
Bay, and Iqaluit, which are among the larger communities. Excluding those communities, the typical
housing tenure pattern across Nunavut was a majority of public housing (average 67%), followed by
owner-occupied dwellings (average 19%), followed by government-staff housing (average 8%), and the
other types of housing (average 6%). For Rankin Inlet, Cambridge Bay, and Iqaluit, the proportion of
public housing was substantially lower and the other housing categories were higher, particularly
government-staff housing (Figure 1). Iqaluit had the smallest proportion of public housing.
The number of government-staff houses and housing that falls into the ‘other’ category was 10
dwellings or less in most of the communities. No significant conclusions could be drawn on these types
of housing for these communities because of the small number. Analysis by government-staff housing at
the community level will focus on places with at least 30 government-staff dwellings: Cape Dorset,
Igloolik, Iqaluit, Pangnirtung, Pond Inlet, Arviat, Rankin Inlet, Cambridge Bay and Kugluktuk, where there
are at least 30 government-staff dwellings.
Figure 1. Housing tenure, various communities in Nunavut, 2009/2010
19%
24%
34%
23%
Renters—public housing Owner-occupied housing Renters—government housing Other
67%
19%
8%6%
Housing tenure for all communities except Iqaluit, Rankin Inlet,
Cambridge Bay
19%
24%
34%
23%
Housing tenure for Iqaluit
45%
31%
15%
9%
Housing tenure for Rankin Inlet and Cambridge Bay

6
The socio-demographic profiles of Nunavummiut who live in each type of housing varied. People with
less formal education tended to live in public housing. In public housing, 23% of people 15 years or older
had a postsecondary degree. In owner-occupied housing, 41% of people had a postsecondary degree. In
government-staff housing, 70% had a postsecondary degree. In other types of housing, most of which
are non-government-staff housing, 51% of people had a postsecondary degree.
People who were not employed in the week prior to the survey tended to live in public housing. In
public housing, 35% of people 15 years or older were employed in the week prior to the survey. In
owner-occupied housing, 58% of people were employed in the week prior to the survey. In government-
staff housing, 82% of people were employed in the week prior to the survey. In other types of housing,
64% were employed in the week prior to the survey.
Inuit people tended to living in public housing and owner-occupied housing. In public housing, 97% were
Inuit; in owner-occupied housing, 84% were Inuit; in government-staff housing, 44%; in other types of
housing, 53%.
Overall, the survey demonstrates the dominance of public housing in the housing stock—the 51%—
however, owner-occupied housing and government-staff housing also made up an important 38% share
of the housing stock. Because the occupants of each type of housing showed different socio-
demographic profiles, various housing indicators are examined by housing tenure for a more detailed
picture of the housing stock.
3.2 State of housing Adequacy, suitability, and affordability are common concepts used to gauge the quality of housing in
which people live. An adequacy indicator identifies whether a dwelling has properly functioning basic
housing services such as heat, water, electricity, and shelter from the elements. A suitability indicator
identifies whether a dwelling is crowded based on the space available and the people in the dwelling. An
affordability indicator identifies whether household payments are an unmanageable financial burden for
the household. The proportion of dwellings that fails on each of these indicators is a measure of the
prevalence of housing issues in the area.
These indicators are calculated based on the answers provided by respondents. Thus, this section
applies only to dwellings occupied by usual residents. People in dwellings that were unoccupied, or
occupied temporarily by people with a usual home elsewhere, did not answer the survey questions.
Thus, these unoccupied dwellings were not reflected in the indicator levels for the communities,
regions, or Nunavut.
3.2.1 Adequacy
The goal of an adequacy indicator is to determine if a dwelling has properly functioning basic services.
The standard approach to measuring adequacy in most surveys is to ask respondents if the dwelling
requires major repairs.5 A dwelling needing major repairs is a sign that some of the basic housing
services are not functioning properly: the dwelling is thus said to be ‘inadequate.’
5. The need for major repair is based on the opinion of the respondent and not a professional assessment. See
Appendix C for a full definition.

7
Using this standard adequacy measure, the survey found that 23% of dwellings in Nunavut were
classified as inadequate (Table A3). This is slightly higher than observations found in other sources. The
2006 Census of Population showed 20% of dwellings in Nunavut were inadequate in 2006. Statistics
Canada’s Survey of Household Spending also showed 20% of dwellings in Nunavut were inadequate in
2007. However, regardless of the data source, the proportion of inadequate dwellings is higher in
Nunavut than in Canada. The 2006 Census showed 7% of dwellings in Canada were inadequate in 2006;
the Survey of Household Spending showed 10% of dwellings in Canada were inadequate in 2007.
Some factors contributing to the difference:
1) The examples used in the NHNS to illustrate the need for major repairs were different: the
intention was to make the question specific to Nunavut. Examples of major repairs included in
the NHNS, but excluded from the Census or the Survey of Household Spending, are a leaking oil
or sewage tank and broken hot water boiler.
2) The NHNS was specifically focused on housing needs, and respondents were told that the results
would be used to provide a picture of their housing conditions; the Census and the Survey of
Household Spending have broader focuses.
3) Each data source reflects a different year.
Notwithstanding the higher rate of inadequate dwellings in the NHNS compared with other sources, the
results identified differences between communities and between different housing tenures. In Nunavut,
communities with an above-average prevalence of inadequate dwellings were Hall Beach, 62%;
Chesterfield Inlet, 43%; Clyde River, 40%; Cape Dorset, 35%; Gjoa Haven, 35%; Grise Fiord, 32%; Whale
Cove, 31%; Kugaaruk, 31%; Arctic Bay, 30%; Taloyoak, 28%; and Arviat, 27%. Communities with a below-
average prevalence of inadequate dwellings were Iqaluit, 12%; Kimmirut, 16%; Pangnirtung, 17%;
Kugluktuk, 18%; and Pond Inlet, 20%.
The prevalence of inadequate dwellings also differed by housing type. At the Nunavut level, owner-
occupied dwellings and public housing had a similar proportion of inadequate dwellings—28% and 26%,
respectively. Government-staff housing and the other types of housing had a lower proportion of
dwellings that residents deemed inadequate—11% and 13%, respectively.
At the community level, Cape Dorset, Hall Beach, Igloolik, Kimmirut, Pangnirtung, Qikiqtarjuaq, Resolute
Bay, and Coral Harbour had higher prevalences of inadequate dwellings in owner-occupied housing
compared with public housing. Grise Fiord had a lower prevalence of inadequate dwellings among
owner-occupied housing than among public housing. In the other communities, there was no statistical
difference in the proportion of inadequate dwellings between owner-occupied and public housing. For
government-staff housing, the communities with at least 30 such dwellings all showed a relatively low
proportion of inadequate dwellings, ranging from 6% in Igloolik to 13% in both Cape Dorset and Pond
Inlet.

8
3.2.2 Suitability
The goal of a housing suitability indicator is to determine if the living space is appropriate for the size of
the household, or if there is crowding. There are two standard measures for suitability. One identifies a
dwelling as crowded if there is more than one person per room.6 The second identifies a dwelling as
crowded if there is a shortfall of bedrooms based on the National Occupancy Standard (NOS). 7 A
dwelling that is deemed crowded based on the indicator would be considered unsuitable. The Canada
Mortgage and Housing Corporation uses the NOS crowding measure: thus, this report will use the NOS
measure.
NHNS respondents were asked to provide the number of people who usually live in the dwelling, the age
and marital status of each, and the number of bedrooms in the dwelling. These responses were used to
calculate the suitability indicator based on the NOS for each dwelling.
In the NHNS, the proportion of unsuitable dwellings in Nunavut, according to the NOS crowding
measure, was 35% (Table A3); this is slightly higher than the 2006 Census observation of 31%.
Regardless of the data source, the proportion of unsuitable housing was higher in Nunavut than in
Canada. The 2006 Census reported 6% of dwellings across Canada were unsuitable in 2006.
The communities with an above-average prevalence of unsuitable dwellings based on the NOS crowding
measure were Repulse Bay, 58%; Gjoa Haven, 57%; Arctic Bay, 45%; Taloyoak, 56%; Clyde River, 50%;
Hall Beach, 50%; Arviat, 50%; Kugaaruk, 50%; Igloolik, 48%; Pond Inlet, 47%; Coral Harbour, 46%; Baker
Lake, 41%; and Sanikiluaq, 40%. The communities with a below-average prevalence were Grise Fiord,
15%; Iqaluit, 20%; Resolute Bay, 21%; Chesterfield Inlet, 24%; Kimmirut, 24%; Pangnirtung, 29%; and
Qikiqtarjuaq, 30%.
In the crowded dwellings, the median8 household size was 6; for uncrowded dwellings, the median was
3. Sixty-two percent of crowded dwellings had a one-bedroom shortfall, 25% had a two-bedroom
shortfall, and 13% had a three-or-more-bedroom shortfall (Figure 2).
About half—53%—of respondents in crowded dwellings indicated that the living room was used for
sleeping. A small proportion of respondents indicated that other rooms beyond the bedroom and living
room, such as kitchen, dining room, or hallways, were used for sleeping.
6. Rooms included are kitchens, bedrooms, living rooms and other finished rooms. Excluded are bathrooms, halls, attached sheds, porches or sealift rooms. See Appendix C for a full definition. 7. The National Occupancy Standard (NOS) determines the number of bedrooms needed, taking into consideration the relationships of persons in the household, and compares bedrooms needed to the actual number of bedrooms in a dwelling. See Appendix C for a full definition. 8. If the households are ordered by the size of the household, the median household size corresponds to the middle observation in that ordered list.

9
Figure 2. Percentage of dwellings which are “unsuitable” by size of bedroom shortfall,
Nunavut, 2009/2010
0%
10%
20%
30%
40%
50%
60%
70%
80%
90%
100%P
erc
en
tage
of
all
ho
use
ho
lds
Household size
Three-or-more-bedroom shortfall
Two-bedroom shortfall
One-bedroom shortfall
Not crowded
Note: 3% of households did not respond to all questions required to calculate the crowding measure
In Nunavut, crowding was more prevalent among public housing than owner-occupied housing (49% for
public housing versus 29% for owner-occupied dwellings). Government-staff housing and other types of
housing across Nunavut had a relatively low incidence of crowding at 12% and 15%, respectively.
In most communities, the prevalence of crowding was highest in public housing. Qikiqtarjuaq was the
only community where the prevalence of crowding was higher for owner-occupied housing. Clyde River,
Iqaluit, Chesterfield Inlet, Whale Cove, Cambridge Bay, and Taloyoak had no statistically significant
differences in the prevalence of crowded dwellings between owner-occupied housing and public
housing. For government-staff housing, in the communities with at least 30 such units, the prevalence of
crowded dwellings ranged from 7% in Cape Dorset to 18% in Pond Inlet and was lower than both public
housing and owner-occupied housing.

10
A note on measuring “affordability”
A third indicator often used to assess the state of housing is the amount a household spends on shelter.
This can indicate if a household is burdened financially. The Canada Mortgage and Housing Corporation
considers a household to be in an unaffordable housing situation if 30% or more of the household
income is spent on shelter.
The proportion of households in Nunavut spending 30% or more of household income on shelter costs
was 5.9%, according to the 2006 Census. This is lower than the 6.9% for Canada overall. However, this is
in large part owing to the public sector’s extensive role in providing housing. In the NHNS, 51% of
households were living in public housing and 16% were living in government-staff housing. Public
housing and government-staff housing in Nunavut is subsidized by determining rent based on income
and other types of subsidies, which keeps shelter costs affordable. In the remaining housing types,
housing affordability may be an issue if no subsidies are received.
In the NHNS, housing affordability was not measured. The reason is that shelter costs fluctuate highly,
owing to seasonal effects on utilities and government programs gearing rent to income, and are difficult
to accurately measure. Thus, housing affordability is not considered in this analysis.
3.2.3 Adequacy and suitability together
Some dwellings failed to meet the suitability standard, according to the NOS crowding measure, while
others failed to meet the adequacy standard, based on need of major repairs. If a dwelling is either
unsuitable or inadequate—or both—it is said to be ‘below housing standards’. Forty-nine percent of
Nunavut dwellings were below housing standards: 35% were unsuitable, 23% were inadequate, and 9%
were both unsuitable and inadequate (Table A3). The 2006 Census reported 43% of dwellings in
Nunavut were below housing standards.
The communities with above-average proportions of dwellings that did not meet housing standards
were Hall Beach, 79%; Repulse Bay, 76%; Clyde River, 69%; Gjoa Haven, 69%; Taloyoak, 69%; Kugaaruk,
67%; Arviat, 64%; Arctic Bay, 63%; Whale Cove, 61%; Igloolik, 60%; Coral Harbour, 60%; Cape Dorset,
57%; and Pond Inlet, 57%. Hall Beach, at 33%, Gjoa Haven, 23%, and Clyde River, 21%, were the
communities with the highest shares of dwellings that were both unsuitable and inadequate. The
communities with below-average proportions of dwellings that did not meet housing standards were
Iqaluit, 30%; Resolute Bay, 32%; Kimmirut, 36%; and Pangnirtung, 42%.
Among types of housing, public housing had the highest proportion of dwellings below housing
standards, 63%, followed by owner-occupied dwellings, 47%. Government-staff housing and other
housing tenures had the lowest proportion—22% and 26%, respectively.
3.3 Summary of housing stock In Nunavut, 49% of dwellings were below housing standards—they were either inadequate and/or
crowded. Crowded dwellings, at 35%, were more prevalent than inadequate dwellings, at 23%.
Owner-occupied dwellings and public housing had the highest proportion of dwellings that did not meet
housing standards—47% and 63%, respectively. Government-staff housing and other types of housing
had a lower prevalence—22% and 26%, respectively; however, the number of owner-occupied dwellings
and public housing far outnumbered the other housing types.

11
Communities with the highest prevalence of housing issues were Hall Beach and Repulse Bay, with
three-quarters of households in dwellings below housing standards. The communities with the lowest
prevalence of housing issues were Resolute Bay, Iqaluit, and Kimmirut, with about one-third of
households in dwellings below housing standards (Figure 3).
Figure 3. Summary of housing issues, various communities in Nunavut, 2009/2010
27%
14%
9%
51%
Nunavut
Crowded only Major repair only
Crowded AND requires major repair Neither crowded NOR major repair
33%
21%20%
26%
Three communities with the highest percentages of
dwellings with housing issues
(540 dwellings;Hall Beach, Repulse Bay, Clyde River)
17%
10%
3%70%
Three communities with the lowest percentages of
dwellings with housing issues
(2,450 dwellings;
Iqaluit, Resolute Bay, Kimmirut)
27%
14%
9%
51%
Nunavut
4.0 Need for housing Determining the need for housing in Nunavut is greatly helped by analysing dwelling adequacy and
suitability in previous sections. Another useful input to determining housing need is residents’ desire to
move out. For each person in a household, the respondent was asked if that person would move out if
additional housing were available. If the respondent indicated that the person would move out, then the
respondent had to indicate with whom that person would move out. Each group that is formed
represents a potential new household if more housing was made available.
To aid in analysis, people in a household were put into groups based on the following rules:
1. Groups identified by the respondent each formed a group that would move out.
2. People who were temporary residents without a usual home elsewhere had to be in a group
that would move out. If the respondent did not indicate that the temporary resident wanted to
move out, it was assumed that the temporary resident would move out on his/her own.
3. People who would choose to stay in the dwelling were put into a group that would not move
out.
4. People in a household who were not assigned to a group based on the rules above (individuals
who did not respond to the relevant questions) formed one separated group in the household.
For this group, the desire to move out was not stated.

12
To illustrate, the following describes the groups that would be formed under likely scenarios.
1. A household is content with their current dwelling, and no one would move out. In this scenario,
one group consisting of all persons in the household would exist. This group would not want to
move out.
2. A dwelling consisting of two families is crowded, and the household would like to alleviate the
situation by having one family move out. In this scenario, two groups would be formed. One
group would remain in the current dwelling and consists of the people who would not move
out. The other group would move out and consists of the people in the family that would move
out.
3. A dwelling with several adults is crowded, and the household would like to alleviate the
situation by having some of them move out into their own separate homes. In this scenario,
several groups would be formed. One group would remain in the current dwelling and consist of
the people who would not move out. Several other groups would move out, and each group
would consist of an adult that wants to move out into separate homes.
4. A dwelling requires major repair and the household would like to move out of the dwelling
together. In this scenario, one group would be formed and would consist of everyone in the
household. Unlike Situation 1, the group would want to move out.
Thus, the NHNS measures the potential number of households that would exist if additional housing was
available.
4.1 Groups that would be formed if additional housing was available When looking to alleviate the current housing situation, one possibility is to give higher priority for
additional housing to the population already living in dwellings below housing standards as defined by
this survey. The intent is to examine only those who want to move out because of a housing issue, not
just a desire for another house. For example, a dwelling may be in good condition and have ample space
for the household; however, respondents may indicate that their adult son or daughter would want to
move out.
This section focuses only on groups that want to move out of dwellings that are below housing
standards. There were 4,030 dwellings that were below housing standards based on the standards used
in this survey. These are the dwellings that are examined in this section.
Out of the 4,030 households living in dwellings that did not meet housing standards, respondents gave
one of three possible answers, or outcomes, when asked what they would do if more housing was
available. The three outcomes were (Table A4)
1. the household had no desire to move out—32% (1,270 households) of the households below
housing standards;
2. everyone would move out of the dwelling, leaving the dwelling empty—37% (1,480
households);
3. some household members would stay in the dwelling; others would move out—25% (990
households).9
9. There were also 290 households who did not respond to the section that indicated whether they would move out.

13
These three outcomes occurred in different proportions for each community. In Igloolik, Kimmirut,
Qikiqtarjuaq, and Coral Harbour, 50% or more of households expressed no desire to move out. In Cape
Dorset, Grise Fiord, Hall Beach, Pangnirtung, Sanikiluaq, and Kugaaruk, 50% or more of households
reported that everyone would move out of the dwelling. In no communities did the majority of
households desire the third outcome—some staying, some moving out of the dwelling.
When respondents reported that some or all household members would move out of the dwelling, they
indicated the number of groups that would be formed. For example, a two-family household may want
to move out into two separate dwellings. From the 1,480 dwellings where everyone would move out
and from the 990 dwellings where only some of the household members would move out, a total of
3,580 groups would move out into separate dwellings if additional housing was available. This
represents the number of dwellings that would be needed to house the groups moving out of dwellings
below housing standards.
The size of the 3,580 groups that would move out would generally be small. There were 1,420 one-
person groups, 490 two-person groups, 510 three-person groups, 430 four-person groups, 310 five-
person groups, and 420 groups of six or more persons.
By community, Gjoa Haven and Clyde River reported the largest proportions of groups that would move
out relative to the existing housing stock in the community. In these two communities, if a new dwelling
was required for each group that would move out, the housing stock would have to grow by about 70%.
However, existing unoccupied dwellings could be used to accommodate some of the groups that would
move out.
4.2 Summary of need for housing If more housing were made available to people in dwellings below housing standards, 3,580 groups
across Nunavut would want to move. Most of the groups would have a small number of people. There
would be 1,420 one-person groups, 490 two-person groups, 510 three-person groups, 430 four-person
groups, 310 five-person groups, and 420 groups of six or more persons.
Some households living in dwellings below housing standards did not want to move out. Out of the
4,030 dwellings below housing standards, 1,270 had no desire to move out. However, in 1,480
dwellings, the entire household would move out, leaving the dwelling unoccupied.
This measurement of need for additional housing based on respondents’ opinions provides information
in addition to the traditional housing indicators (adequacy and suitability) to help decide on the number
of new dwellings required.

14
5.0 People in immediate need of housing About one-half of Nunavummiut indicated a desire to move out of their current dwelling. Within the
group of people who wanted to move, a unique subgroup faced an immediate housing need. This
unique subgroup was people who temporarily resided at a dwelling but did not have a home elsewhere.
This group is the focus of this section.
In the NHNS, respondents were asked to list everyone living in the dwelling who did not have a usual
home elsewhere at the time of the survey. Respondents were then asked to identify each of the
individuals as a usual resident of the dwelling, or as a temporary resident. The latter group included
homeless people who were being temporarily sheltered at the dwellings. It also included friends and
relatives who were in transition between dwellings, or who were waiting for a dwelling to become
available. The temporary status of the residents was decided by the respondent.
The temporary residents without a usual home elsewhere made up 4% of the population in Nunavut, or
about 1,220 persons (Table A5). Most of these residents were in the same dwelling over the entire two-
week period before the survey. Also, about 40% of these residents were at the same dwelling six months
prior to the survey, and about one-third were at the same dwelling one year prior to the survey. Thus,
only a fraction of this group had been living at the dwelling on a short-term basis. Despite being
identified by the respondent as a temporary resident, only about 40% (385 out of 970 who were 15
years or older)10 were on the waiting list for public housing.
The communities with the highest proportion of temporary residents without a home elsewhere are
Whale Cove, 10%; Resolute Bay, 7%; and Pond Inlet, 6%.
Respondents were also asked to report whether any temporary residents without a usual home
elsewhere had stayed in their dwelling in the previous 12 months. About one-third of households
(2,730) in Nunavut had housed at least one temporary resident over the 12 months prior to the time of
the survey. Of these households, 660 were housing at least one temporary resident at the time of the
survey.
Of the 2,730 dwellings that housed temporary residents in the 12 months prior to the survey, 1,590
were considered below housing standards, 1,210 were unsuitable, and 750 were inadequate (370 were
below both housing standards).
10. People younger than 15 years old were not asked if they were on the waiting list for public housing.

15
6.0 Conclusion The goal of this analysis was to help assess the current housing stock in Nunavut using standard housing
indicators; measure people’s desire to move if more housing were available, to help decide the number
of new dwellings that need to be built; and measure the number of people living temporarily at a
dwelling who did not have a usual home elsewhere.
Using standard housing indicators, the NHNS found that the dwellings occupied by Nunavummiut had a
high incidence of inadequate dwellings, 23%, and an even higher incidence of crowding, 35%. Combining
the two housing issues, one-half of the dwellings in Nunavut faced at least one housing issue.
The NHNS measured the need for housing based on the respondents’ opinions of who would move out if
more housing was available. This information, in conjunction with standard housing indicators,
identified where the housing issues occurred and where there was potential demand for new housing.
There were 4,230 dwellings (49%) that were below housing standards—i.e., that either required major
repair and/or were crowded.11 If more housing were made available to people in dwellings below
housing standards, 3,580 groups would choose to move out. Among the groups that would choose to
move out of dwellings below housing standards, 40% consisted of one person only.
The communities faced with the largest housing issues were Hall Beach and Repulse Bay, where three-
quarters of the households were in dwellings below housing standards. The communities with the
largest numbers of groups that would move out as a proportion of the existing housing stock were Clyde
River and Gjoa Haven.
The NHNS found that 1,220 Nunavummiut, 4% of the population, did not have a usual home. These
people resided temporarily at other people’s dwellings at the time of the survey. There were 2,730
households that helped house temporary residents without a usual home elsewhere over the 12 months
prior to the survey.
11. The count of dwellings below housing standards is adjusted from the survey counts to account for non-response dwellings.

16
Appendix A—Tables Table A1. Number of dwellings by occupancy status by Nunavut community, 2009/2010
Total2
Public
housing3
Government
staff housing3
Non-
government
staff housing3
Private
housing3
Nunavut 9,400 8,550 850 180 220 120 80
Qikiqtaaluk 5,340 4,800 550 100 140 50E 40
Arctic Bay 210 180 30 10 0 0E
0E
Cape Dorset 390 350 30 10 10 10 10
Clyde River 220 210 0 F 0 0 F
Grise Fiord 60 50 10 0 0 0 0E
Hall Beach 170 150 20 10 10 0 0
Igloolik 390 350 40 10 20 0 10
Iqaluit42,560 2,260 300 F 50E F F
Kimmirut 130 120 10 0 0 F 0
Pangnirtung 430 380 50 10 30 10 10
Pond Inlet 350 320 30 10 10 10 0E
Qikiqtarjuaq 170 150 10 10 0E
0 F
Resolute Bay 70 70 10 0 0E 0E 0E
Sanikiluaq 200 190 10 0 0E 0E 0E
Kivalliq 2,460 2,310 150 20 40 50 20
Arviat 530 490 40 0E 20 10 10
Baker Lake 550 530 20 0E 0 10E F
Chesterfield Inlet 110 100 10 F F F F
Coral Harbour 190 180 10 10 0 0 0E
Rankin Inlet 800 740 60 F 20E 30E 10E
Repulse Bay 180 170 10 0 0 0 0
Whale Cove 100 90 10 F 0 0E
0
Kitikmeot 1,600 1,450 150 70 40 20E F
Cambridge Bay 540 480 60 F 20E F F
Gjoa Haven 230 230 10 0 0 0 0
Kugaaruk 170 150 20 10 0 10 0
Kugluktuk 430 400 30 10E 10E F F
Taloyoak 220 190 40 30 0 0 0
Dwellings occupied solely by temporary residents with a
usual home elsewhere, or unoccupied dwellings1
3. Housing category for dwellings occupied solely by temporary residents with a usual home elsewhere, or unoccupied dwellings
were not reported by the respondent as they were not surveyed. The housing category for these dwellings are obtained from the
administrative files used to create the dwelling lists.
1. A dwelling occupied solely by temporary and/or foreign resident(s) is a dwelling in which all residents live at the time of the
survey, but have a usual place of residence elsewhere. An unoccupied dwelling is a dwelling in which no usual, temporary or
foreign resident is living at the time of the survey. Unoccupied dwellings may include secondary residences in which no person
was present at the residence at the time of the survey. If the person was present at the secondary residence at the time of the
survey, the dwelling was classified as solely occupied by temporary residents with a usual home elsewhere. The classification of a
dwelling as unoccupied or occupied solely by temporary residents will depend highly on whether a person chose to reside at the
secondary residence at the time of the survey.
Total
dwellings
Dwellings
occupied by
usual residents
number
Note: Values have been rounded. Values may not add to totals due to rounding.
2. Includes 240 dwellings where the housing category was not known.
E Use with caution. The coefficient of variation is between 16.6% and 33.3%.
F Too unreliable to be published. The coefficient of variation is higher than 33.3%.
4. A sample survey was conducted in Iqaluit; a census was conducted in the other communities. See Appendix B for the survey
methodology.

17
Table A2. Number of dwellings by housing tenure by Nunavut community, 2009/2010
Total number
of dwellings
occupied by
usual residents Owners
Renters—
public
housing
Renters—
government
staff housing
Renters—
non-
government
staff housing
Renters—
private Others1
Nunavut 8,550 1,880 4,400 1,350 350 340 240
Qikiqtaaluk 4,800 980 2,150 1,010 250E 250E 150E
Arctic Bay 180 30 120 10 0E
0E
0E
Cape Dorset 350 50 250 50 0 0 0E
Clyde River 210 40 130 F F F 20E
Grise Fiord 50 20 30 10 0E
0 0E
Hall Beach 150 20 120 10 0 0E 0E
Igloolik 350 60 230 40 10 0E
0E
Iqaluit22,260 540 440 770 190E 210E 120E
Kimmirut 120 20 80 0E 10E F 0E
Pangnirtung 380 70 240 40 10 20 0E
Pond Inlet 320 60 200 50 0E
10 0E
Qikiqtarjuaq 150 20 110 10 10E 0 0
Resolute Bay 70 20 40 10 0E 0E 0
Sanikiluaq 190 30 150 10 0 0 0E
Kivalliq 2,310 580 1,360 210 50 60 50
Arviat 490 130 290 50 10 0 10
Baker Lake 530 120 360 20E F 20E F
Chesterfield Inlet 100 20 70 0E
0E
0 0
Coral Harbour 180 40 120 0 0E 10 10
Rankin Inlet 740 230 320 110 20E 30E 30E
Repulse Bay 170 20 120 10 10 10 0E
Whale Cove 90 20 60 10E 0E 0E 0
Kitikmeot 1,450 330 900 120 40E
F 30E
Cambridge Bay 480 140 230 70E
F F F
Gjoa Haven 230 40 170 10 10 0 10
Kugaaruk 150 30 100 0 10 0 0
Kugluktuk 400 90 250 30 10E
10E
F
Taloyoak 190 20 140 10 0 0 10
number
1. Others include renters who indicated "Other" and non-response dwellings.
Note: Values have been rounded. Values may not add to totals due to rounding.
E. Use with caution. The coefficient of variation is between 16.6% and 33.3%.
F. Too unreliable to be published. The coefficient of variation is higher than 33.3%.
2. A sample survey was conducted in Iqaluit; a census was conducated in the other communities. See Appendix B for the survey
methodology.

18
Table A3-1. Number of dwellings that are crowded or require major repairs by housing tenure by Nunavut community, 2009/2010
Total number of
dwellings occupied
by usual residents,
2009/2010 Crowded
Require
major repair1
Crowded
and/or
Require
major repair1
Total number of
dwellings occupied
by usual residents Crowded
Require
major repair1
Crowded
and/or
Require
major repair1
Total number of
dwellings occupied
by usual residents Crowded
Require
major repair1
Crowded
and/or
Require
major repair1
number number numberNunavut 8,550 35 23 49 1,880 29 28 47 4,400 49 26 63
Qikiqtaaluk 4,800 30 20 44 980 25 28 45 2,150 45 25 59
Arctic Bay 180 45 30 63 30 36 32 54 120 52 33 72
Cape Dorset 350 36 35 57 50 15 58 65 250 48 35 63
Clyde River 210 50 40 69 40 56 41E
68 130 48 37 69
Grise Fiord 50 15 32 43 20 F 17E 25E30 24 40 56
Hall Beach 150 50 62 79 20 37 79 85 120 56 61 82
Igloolik 350 48 22 60 60 49 56 78 230 56 15 65
Iqaluit32,260 20 12E
30 540 20E 19E 35E440 40E 19E
52
Kimmirut 120 24 16 36 20 11E
39 44 80 31 10 36
Pangnirtung 380 29 17 42 70 18 25 37 240 36 17 49
Pond Inlet 320 47 20 57 60 31 23 45 200 61 21 69
Qikiqtarjuaq 150 30 20 46 20 47 41 82 110 31 13 39
Resolute Bay 70 21 19 32 20 F 38 38 40 31 18 39
Sanikiluaq 190 40 24 52 30 24 29 33 150 47 24 58
Kivalliq 2,310 41 25 56 580 31 28 49 1,360 52 26 65
Arviat 490 50 27 64 130 39 31 58 290 62 27 74
Baker Lake 530 41 22 53 120 28 24 45 360 48 24 58
Chesterfield Inlet 100 24 43 54 20 33E 50 61 70 24 42 54
Coral Harbour 180 46 24 60 40 26 36 54 120 57 18 67
Rankin Inlet 740 32 23 46 230 24 27 42 320 48 28 61
Repulse Bay 170 58 24 76 20 51 31 71 120 69 23 84
Whale Cove 90 42 31 61 20 53 18E
59 60 45 32 65
Kitikmeot 1,450 43 27 58 330 37 25 52 900 52 30 68
Cambridge Bay 480 35 31 57 140 36E F 51E230 48 41 75
Gjoa Haven 230 57 35 69 40 53 34 63 170 61 39 75
Kugaaruk 150 50 31 67 30 48 31 67 100 55 29 68
Kugluktuk 400 34 18 46 90 21E 21E 38 250 45 18 54
Taloyoak 190 56 28 69 20 57 29 76 140 61 28 73
% % %
Note: Values have been rounded. Values may not add to totals due to rounding.
Total public housing rentersTotal dwellings Total owners
3. A sample survey was conducted in Iqaluit; a census was conducated in the other communities. See Appendix B for the survey methodology.
1. The need for major repair is based on the opinion of the respondent.
2. Other housing tenure includes non-government staff housing, private market rental housing, all other types of rental housing, and unstated tenures.
Note: Percentage of dwellings crowded/requiring major repair is based on those who responded to all of the relevant questions in the survey used to calculate the indicators.
F. Too unreliable to be published. The coefficient of variation is higher than 33.3%.
E. Use with caution. The coefficient of variation is between 16.6% and 33.3%.
x. Suppressed for confidentiality.

19
Table A3-2. Number of dwellings that are crowded or require major repairs by housing tenure by Nunavut community, 2009/2010
Total number of
dwellings occupied
by usual residents Crowded
Require
major repair1
Crowded
and/or
Require
major repair1
Total number of
dwellings occupied
by usual residents Crowded
Require
major repair1
Crowded
and/or
require major
repair1
Total number of
dwellings occupied
by usual residents Crowded
Require
major repair1
Crowded
and/or
Require
major repair1
number number number
Nunavut 8,550 35 23 49 1350 12E 11E 22 930 15E 13 26
Qikiqtaaluk 4,800 30 20 44 1010 13E 11E 22 660 14E 9E 23E
Arctic Bay 180 45 30 63 10 40 29 51 10 x x x
Cape Dorset 350 36 35 57 50 7 13 20 10 x x x
Clyde River 210 50 40 69 F x x x 40 40E 48E 61E
Grise Fiord 50 15 32 43 10 x x x 0 x x x
Hall Beach 150 50 62 79 10 x x x 0 x x x
Igloolik 350 48 22 60 40 12 6E 15 10 0 27 27
Iqaluit32,260 20 12E
30 770 12E F 21E 520 F F F
Kimmirut 120 24 16 36 0E x x x 10 x x x
Pangnirtung 380 29 17 42 40 12 9E 20 30 16 11E 26
Pond Inlet 320 47 20 57 50 18 13 28 10 18E 21E 42
Qikiqtarjuaq 150 30 20 46 10 x x x 10E x x x
Resolute Bay 70 21 19 32 10 x x x 0 x x x
Sanikiluaq 190 40 24 52 10 x x x 10 x x x
Kivalliq 2,310 41 25 56 210 14E 12E 25 160 18 22 33
Arviat 490 50 27 64 50 16 10 27 20 26 42 57
Baker Lake 530 41 22 53 20E x x x 30E 26E F 31E
Chesterfield Inlet 100 24 43 54 0E x x x 0E x x x
Coral Harbour 180 46 24 60 0 x x x 10 14 21 21
Rankin Inlet 740 32 23 46 110 17E F 26E 80 F F 23E
Repulse Bay 170 58 24 76 10 x x x 10 23 32 55
Whale Cove 90 42 31 61 10E x x x 0E x x x
Kitikmeot 1,450 43 27 58 120 F F F 100 14 27E 37E
Cambridge Bay 480 35 31 57 70E F F F F 0 F F
Gjoa Haven 230 57 35 69 10 x x x 10 40 11E 40
Kugaaruk 150 50 31 67 0 x x x 10 25 33 50
Kugluktuk 400 34 18 46 30 F F F 20E 0 F F
Taloyoak 190 56 28 69 10 x x x 20 37 38 63
Total dwellings Total government staff housing renters Total other2
1. The need for major repair is based on the opinion of the respondent.
% % %
Note: Values have been rounded. Values may not add to totals due to rounding.
E. Use with caution. The coefficient of variation is between 16.6% and 33.3%.
F. Too unreliable to be published. The coefficient of variation is higher than 33.3%.
2. Other housing tenure includes non-government staff housing, private market rental housing, all other types of rental housing, and unstated tenures.
3. A sample survey was conducted in Iqaluit; a census was conducted in the other communities. See Appendix B for the survey methodology.
Note: Percentage of dwellings crowded/requiring major repair is based on those who responded to all the relevant questions in the survey used to calculate the indicators.
x. Suppressed for confidentiality.

20
Table A4. Number of dwellings below housing standards by groups moving out by Nunavut community, 2009/2010
Nunavut 4,030 1270 1480 990 290 3580
Qikiqtaaluk 1,970 610 790 420 140 1760
Arctic Bay 110 40 50 20 10E 110
Cape Dorset 200 40 130 20 10 200
Clyde River 150 30 80 30 10E
150
Grise Fiord 20 0 20 0 0E 20
Hall Beach 120 20 70 20 10 110
Igloolik 210 110 20 50 30 80
Iqaluit3
600 190E
210E
150E
F 610E
Kimmirut 40 20 0E 10 0E 20
Pangnirtung 160 50 90 20 0E 150
Pond Inlet 180 40 70 60 10 200
Qikiqtarjuaq 70 50 0 20 F 20
Resolute Bay 20 0E 10 10 0 30
Sanikiluaq 100 20 60 10 10 80
Kivalliq 1,240 430 380 330 90 1030
Arviat 310 90 120 90 10 310
Baker Lake 270 100 80 60 30 220
Chesterfield Inlet 60 10E 30 10E 10E 50
Coral Harbour 110 60 20 30 0E
70
Rankin Inlet 330 140 70 90 20E 220
Repulse Bay 120 30 40 30 10 100
Whale Cove 50 20 20 20 10E 50
Kitikmeot 820 220 310 240 50E 790
Cambridge Bay 260 60E 100E 80E F 270E
Gjoa Haven 150 20 80 40 10 170
Kugaaruk 100 20 60 20 0 110
Kugluktuk 180 60 40 60 20E 140
Taloyoak 130 60 30 40 0 110
number
F. Too unreliable to be published. The coefficient of variation is higher than 33.3%.
E. Use with caution. The coefficient of variation is between 16.6% and 33.3%.
3. A sample survey was conducted in Iqaluit; a census was conducted in the other communities. See Appendix B for the survey
methodology.
Note: Values have been rounded. Values may not add to totals due to rounding.
1. The need for major repair is based on the opinion of the respondent.
2. Refers to groups that would move out of the dwelling if more housing was available to those in unsuitable or inadequate housing.
These groups include situations where no one remains in the current dwelling, and where the groups move out but others remains in the
current dwelling.
Crowded and/or requiring major repair1
Number of
dwellings
occupied by
usual residents Not stated
Number of groups
that would move
from dwellings
that are crowded
and/or require
major repair2
Number of
dwellings
where
everyone
moves out
Number of
dwellings
where some
stays but others
move out
Number of
dwellings
where no
one moves
out

21
Table A5. Number of persons and dwellings with temporary residents without a usual home elsewhere by Nunavut community, 2009/2010
Total population in
occupied private
dwellings
Persons that are
temporary residents
without a home
elsewhere
Total number of
dwellings occupied
by usual residents
Dwellings with a
temporary resident
without a home
elsewhere
Dwellings without temporary
residents without a usual home
elsewhere but had some in the
last 12 months
Dwellings without any temporary
residents without a usual home
elsewhere in the last 12 months
number % number
Nunavut 33,980 4 8,550 8 24 68
Qikiqtaaluk 17,720 3 4,800 7 25 68
Arctic Bay 890 4 180 11 26 63
Cape Dorset 1,400 1 350 3 36 61
Clyde River 1,060 4E
210 8E
31 61
Grise Fiord 140 F 50 F 23 75
Hall Beach 750 0E
150 1E
30 69
Igloolik 1,700 2 350 6 40 55
Iqaluit1 6,740 5E2,260 9E 23 69
Kimmirut 430 1E120 2E 13 85
Pangnirtung 1,440 1 380 2 17 81
Pond Inlet 1,570 6 320 17 34 49
Qikiqtarjuaq 560 3E150 6 12 82
Resolute Bay 230 7 70 12 16 72
Sanikiluaq 820 1 190 3 15 82
Kivalliq 10,040 4 2,310 8 22 70
Arviat 2,310 4 490 7 13 79
Baker Lake 2,300 3E530 6 18 76
Chesterfield Inlet 360 2E
100 6E
25 69
Coral Harbour 860 5 180 8 26 66
Rankin Inlet 2,870 4E740 8 29 64
Repulse Bay 950 3 170 8 23 68
Whale Cove 380 10 90 20 23 56
Kitikmeot 6,220 4E1,450 9 26 66
Cambridge Bay 1,890 F 480 11E 26E64
Gjoa Haven 1,150 3 230 9 25 66
Kugaaruk 770 2 150 4 18 78
Kugluktuk 1,510 4 400 10 28 62
Taloyoak 900 2 190 4 28 68
%
Note: Values have been rounded. Values may not add to totals due to rounding.
1. A sample survey was conducted in Iqaluit; a census was conducted in the other communities. See Appendix B for the survey methodology.
Note: Percentages are based on those who responded to all of the relevant questions used to calculate the indicator.
E. Use with caution. The coefficient of variation is between 16.6% and 33.3%.
F. Too unreliable to be published. The coefficient of variation is higher than 33.3%.

22
Appendix B—Survey Methodology
Background
In 2009, the Nunavut Housing Corporation (NHC) commissioned the Nunavut Bureau of Statistics (NBS)
and Statistics Canada to undertake a Nunavut-wide housing needs survey. Statistics Canada and the NBS
formed a partnership: the NBS would collect the data under the Nunavut Statistics Act and manage
data-collection activities, including the hiring and training of survey interviewers and collection
monitoring, from a northern base. Statistics Canada’s role was to provide technical assistance to the NBS
throughout the survey-development and collection-processes, and to process and analyse the survey
results.
Objectives
The objectives of the Nunavut Housing Needs Survey are to collect detailed data on the housing needs
of Nunavummiut, quantify and identify the factors related to Nunavut’s housing shortage, provide
communities with information on their housing conditions, and help the Government of Nunavut plan
and provide for the housing needs of Nunavummiut.
Target population
The target population consisted of all residential dwellings in the 25 communities in Nunavut (excluding
small settlements and isolated outpost camps). Dwellings housing only temporary residents who had a
usual home elsewhere and unoccupied dwellings at the time of the interview were not surveyed.
Collective dwellings (e.g., jails, group homes, shelters) were also excluded from the survey.
The survey was conducted in person, using a paper questionnaire. One adult in each dwelling responded
to the survey on behalf of all household members.
Survey design
The original plan had been to conduct a census in all 25 communities. Mid-way through collection,
however, the decision was made to select a sample in Iqaluit because of difficulties in hiring interviewers
and because a low response rate was causing concerns about the ability to complete the survey in that
community within the available time. The sampling fraction in Iqaluit was 36%.
Response rate
The final response rate (the number of responding dwellings as a fraction of all dwellings occupied by
usual residents in Nunavut) was 79%. Response rates were lower in larger communities such as Iqaluit,
Rankin Inlet and Cambridge Bay. Excluding those communities, the final overall response rate for the
remaining communities was 87%.

23
Response Rates for the 2009/2010 Nunavut Housing Needs Survey by Nunavut community
Response rate (%)
Nunavut 79
Qikiqtaaluk 85
Arctic Bay 86
Cape Dorset 94
Clyde River 73
Grise Fiord 88
Hall Beach 96
Igloolik 94
Iqaluit 69
Kimmirut 87
Pangnirtung 91
Pond Inlet 90
Qikiqtarjuaq 87
Resolute Bay 89
Sanikiluaq 91
Kivalliq 76
Arviat 90
Baker Lake 72
Chesterfield Inlet 79
Coral Harbour 95
Rankin Inlet 61
Repulse Bay 92
Whale Cove 83
Kitikmeot 71
Cambridge Bay 44
Gjoa Haven 93
Kugaaruk 99
Kugluktuk 69
Taloyoak 97
Nunavut not including Iqaluit, Rankin Inlet and Cambridge Bay 87
Notes
In the NHNS, a dwelling is considered as a respondent when it has been identified as a dwelling occupied by usual residents and
a questionnaire has been completed for that dwelling. Dwellings occupied only by temporary residents with a usual home
elsewhere were not included in the response rate, since a full questionnaire was not suppose to be completed.
The total number of dwellings is taken from the NHNS dwelling list ,which was based on administrative residential files and
updated in the field by interviewers.
The response rate is determined by calculating the number of responding dwellings as a fraction of all dwellings occupied by usual
residents in Nunavut. This response rate is calculated using only the dwellings occupied by usual residents. Vacant dwellings and
dwellings occupied only by temporary/foreign residents are excluded from this calculation.
24
Appendix C—Definitions This section outlines concepts and definitions used in the analysis.
Adequacy: Whether a dwelling adequately provides basic housing services such as water, heat,
electricity and shelter. The standard approach used in surveys to measure adequacy is to ask if the
dwelling requires major repair. A dwelling that requires major repair does not meet the adequacy
standard. The need for major repair refers to problems such as defective plumbing or electrical wiring,
leaking oil or sewage tank, or broken hot water boiler.
The need for major repair is solely based on the opinion of the respondent. Thus, the adequacy indicator
reflects respondents’ perceptions. A 1988 study, entitled “Need for repair: An evaluation of alternative
question phrasing,” discussed the data quality of respondent-provided assessment of the need for major
repair. The study showed a correlation between the respondent indication of need for major repair and
an actual need for major repair. For the misclassifications, respondents tended more to indicate major
repairs when it was only minor.
Below housing standards: Dwellings that do not meet suitability standards and/or adequacy standards.
Dwelling: A set of living quarters designed for or converted for human habitation, in which a person or
group of persons reside or could reside. A dwelling must have a source of heat or power, and must be an
enclosed space that provides shelter from the elements, as evidenced by complete and enclosed walls
and roof and by doors and windows that provide protection from wind, rain and snow.
Dwelling occupancy: The occupancy of a dwelling may be classified as unoccupied, occupied solely by
temporary and/or foreign residents, and occupied by usual residents.
An unoccupied/vacant dwelling is a dwelling in which no usual, temporary or foreign resident is
living at the time of the survey. Unoccupied dwellings may include secondary residences in
which no person was present at the residence at the time of the survey. If the person was
present at the secondary residence at the time of the survey, the dwelling was classified as
solely occupied by temporary residents with a usual home elsewhere. The classification of a
dwelling as unoccupied or occupied solely by temporary residents will depend highly on
whether a person chose to reside at the secondary residence at the time of the survey.
A dwelling occupied solely by temporary and/or foreign residents with a usual home
elsewhere is a dwelling in which all occupants have a usual place of residence elsewhere. A
foreign resident is a person whose usual place of residence is outside Canada.
Dwelling occupied by usual residents is a dwelling in which a person or a group of persons is
permanently residing, or a dwelling in which the residents have no usual home elsewhere. Also
included are dwellings whose usual residents are temporarily absent but expect to return to the
dwelling. Questionnaires were completed only for dwellings occupied by usual residents, rather
than for unoccupied dwellings or dwellings occupied solely by foreign and/or temporary
residents with a usual home elsewhere.
Group in a household: A group of one or more persons in the household that would move together into
another dwelling if more housing were available, or a group that would stay together in their current
dwelling. These groups can represent a potential new household if more housing becomes available. The

25
number of such groups is an indicator for the potential housing demand. Survey respondents were
asked to identify groups of people in the household who would want to move out if more housing was
available.
Household: A household is a person or a group of persons (other than foreign residents or temporary
residents) who occupy a dwelling and do not have a usual place of residence elsewhere.
Housing stock: All dwellings used for habitation, whether they are occupied or not. Collective dwellings,
such as hotels, are not part of the survey, and are not counted in the housing stock.
Housing tenure: Refers to whether some member of the household owns or rents the dwelling. Housing
tenure falls into two categories, owned and rented. Among the rented dwellings, there are several
distinct subgroups. Rented dwellings can be classified as public housing rental units, which are
subsidized rented dwellings managed by the Nunavut Housing Corporation and available to
Nunavummiut that meet certain eligibility requirements. It can be Government of Nunavut staff
housing, Government of Canada staff housing, or another employer-provided housing unit that is
provided to employees, often with a subsidy. There can be private market rental units.
National Occupancy Standard (NOS): Determines the number of bedrooms needed taking into
consideration the relationships of persons in the household, and compares that to the actual number of
bedrooms in a dwelling. Dwellings where there is a shortfall of bedrooms are considered crowded. The
bedroom requirements are determined using the following criteria: there can be no more than two
persons per bedroom; parents are eligible for a bedroom separate from their children; household
members aged 18 or over are eligible for a separate bedroom unless married or common-law; and
dependants aged five or more of the opposite sex do not share a bedroom.
The NHNS did not identify to whom a person was married or with whom the person was in a common-
law relationship, unless that person or the spouse was the respondent to the questionnaire. Thus, to
calculate the NOS based suitability measure, it was necessary to assume that, in a household containing
an even number of spouses, the spouses were in a relationship with someone in the household. If the
number of spouses was not even, it was assumed that all except one were in a relationship with
someone else in the household.
Rooms: Enclosed areas in a dwelling that are finished and suitable for year-round living. Rooms include
the kitchen, bedrooms, living room and other finished rooms. Not included as rooms are bathrooms,
halls, attached sheds, porches or sealift room.
If a room is partly divided by a fixed or movable partition, or has two distinct parts used for different
purposes, such as an L-shaped kitchen and living room, respondents were instructed to count it as two
separate rooms.
Suitability: Whether sufficient space is available for the people in the dwelling so that the dwelling is not
crowded. There are two standard measure of crowding: one identifies a dwelling as crowded if there is
more than one person per room. Another measure identifies a dwelling as crowded if there is a shortfall
of bedrooms where the required number of bedrooms is based on the National Occupancy Standard
(NOS). This analysis uses the NOS-based measure.

26
Temporary resident without a usual home: A person that is not a permanent resident of dwelling but
has no other dwelling in which they may be counted. Temporary residents without a usual home
elsewhere were counted at the dwelling in which they were found at the time of the survey. These
should not be confused with temporary residents with a usual home elsewhere, such as visiting guests,
who are not counted at the dwelling but are counted at their usual residence.