an analysis of mathematical tasks used at second-level in...
TRANSCRIPT

An Analysis of Mathematical Tasks Used
at Second-Level in Ireland
Brendan O’Sullivan B.A (Hons), M.A., M.Ed., H.Dip.Ed.
Thesis submitted to Dublin City University for the degree of Doctor of Philosophy
School of Mathematical Sciences, Dublin City
University
September 2017
Research Supervisors
Dr. Sinéad Breen
Dr. Ann O’Shea (Maynooth University)

ii

iii
Declaration
I hereby certify that this material, which I now submit for assessment on the
programme of study leading to the award of Doctor of Philosophy is entirely my
own work, that I have exercised reasonable care to ensure that the work is
original, and does not to the best of my knowledge breach any law of copyright,
and has not been taken from the work of others save and to the extent that
such work has been cited and acknowledged within the text of my work.
Signed:
ID No: _ Date:
iv
Acknowledgements
To begin, I would like to thank my supervisors, Sinéad Breen and Ann O’Shea, for
their constant encouragement and support. Over the six years of this journey,
they always showed patience and understanding for a part-time student while
challenging me to produce the best research possible. I was extremely lucky to
work with such a formidable team!
Special thanks to Siún Nic Mhuirí who offered thoughtful insights in relation to
my work. I would also like to thank Elizabeth Oldham, always offering good
advice when I needed a wise ear. In addition to Elizabeth, I must express
gratitude to Ailish Hannigan, Catherine Kiely, Laura O’Dwyer and Maurice
OReilly; each of whom gave time and assistance despite busy schedules.
Majella Dempsey is also deserving of mention for facilitating the workshop in
Maynooth, along with the many Pre-Service Teachers that participated so
willingly. The assistance of the researchers who took part in the Novelty
framework is also appreciated. I must also mention the students that I have been
privileged to teach over the years and I am very thankful for how the experience
has moulded me as a teacher.
All my friends deserve thanks for their encouraging words; I would like to
acknowledge those that gave me old mathematics textbooks at the beginning of
the analysis. Such generosity saved me precious time and ended a frustrating
search. Many thanks to Elisabet Mellroth for providing me with material from
Sweden when I visited her family. I would also like to dedicate this work to the
memory of Maureen Clarke. Her contribution to mathematics education in Cork
should never be forgotten.
Finally, and most importantly, thank you to both of my parents: Dan and Marian
who have been with me every step of the way and always showed confidence in
my ability to finish this work.

v
Contents Declaration ................................................................................................................................. iii
Acknowledgements.................................................................................................................... iv
List of Abbreviations .................................................................................................................. ix
Table of Figures ........................................................................................................................... x
Table of Tables ......................................................................................................................... xiii
Abstract ..................................................................................................................................... xv
Chapter 1 Introduction .............................................................................................................. 1
1.1 Research Rationale .......................................................................................................... 2
1.2 Textbook Analysis as a Research Method ........................................................................ 3
1.3 Recent Textbook Analysis in Ireland ................................................................................ 5
1.4 Outline of the Research Undertaken ............................................................................... 6
1.5 Research Questions ......................................................................................................... 7
1.6 Overview of the Thesis ..................................................................................................... 8
Chapter 2 Literature Review .................................................................................................... 11
2.1 Curriculum Change ......................................................................................................... 11
2.2 Role of the Textbook ...................................................................................................... 20
2.3 Textbook Studies in Ireland ........................................................................................... 22
2.4 Importance of Tasks and a Wise Choice of Tasks .......................................................... 27
2.5 International Studies on Textbook Tasks ....................................................................... 32
2.6 Task Design .................................................................................................................... 40
2.7 Teacher Professional Development in the Creation and Use of Tasks .......................... 44
Chapter 3 Theoretical Frameworks ......................................................................................... 47
3.1 Introduction ................................................................................................................... 47
3.2 The Instructional Triangle .............................................................................................. 47
3.3 Description of Frameworks ............................................................................................ 52
3.3.1 Levels of Cognitive Demand .................................................................................... 52
3.3.2 Creative and Imitative Mathematical Reasoning .................................................... 56
3.3.3 Project Maths Syllabus Objectives .......................................................................... 58
3.3.4 Multidimensional Model of Mathematical Understanding .................................... 60
3.4 Existing Frameworks: ..................................................................................................... 61
3.4.1 Level of Cognitive Demand ..................................................................................... 62
3.4.2 Imitative/Creative Reasoning ................................................................................. 63
3.4.3 Multidimensional Model of Mathematical Understanding .................................... 63
3.4.4 Project Maths Problem-Solving Syllabus Objectives............................................... 64

vi
3.5 Task and Solver ............................................................................................................... 64
3.6 Creation of Novelty Framework ..................................................................................... 66
3.7 Description of Framework for Measuring Novelty ......................................................... 68
Chapter 4 Methodology ........................................................................................................... 71
4.1 Introduction .................................................................................................................... 71
4.2 Definition of a Task ......................................................................................................... 71
4.3 Choice of Topics .............................................................................................................. 71
4.4 Selecting Tasks ................................................................................................................ 72
4.5 Coding ............................................................................................................................. 73
4.6 Inter-rater Reliability ...................................................................................................... 74
4.7 Examples of Classification of Tasks using Frameworks .................................................. 75
4.7.1 Pattern, Sequences and Series ................................................................................ 75
4.7.2 Differential Calculus ................................................................................................ 85
4.8 Validation of the Novelty Framework ............................................................................ 89
4.8.1 Format of the Workshop ......................................................................................... 90
4.8.2 Codebook ................................................................................................................. 90
4.8.3 The Coders .............................................................................................................. 91
4.8.4 Outline of the Workshop ........................................................................................ 92
4.8.5 Presentation on the Novelty Framework Criteria ................................................... 93
4.8.6 Working with Practice Tasks ................................................................................... 94
4.8.7 Choice of Tasks ........................................................................................................ 95
4.9 Coding Results ................................................................................................................ 96
4.10 Inter-rater Reliability .................................................................................................. 100
4.11 Questionnaire ............................................................................................................. 105
4.12 Group Discussion ........................................................................................................ 107
4.13 Conclusion .................................................................................................................. 107
Chapter 5 Results .................................................................................................................... 110
5.1 Introduction .................................................................................................................. 110
5.2 Level of Cognitive Demand ........................................................................................... 111
5.2.1 Active Maths .......................................................................................................... 111
5.2.2 Text and Tests ........................................................................................................ 115
5.2.3 Concise Maths ....................................................................................................... 120
5.2.4 Comparing the Textbook Series ............................................................................ 124
5.3 Creative/Imitative Reasoning ....................................................................................... 126
5.3.1 Active Maths .......................................................................................................... 126

vii
5.3.2 Text and Tests ....................................................................................................... 128
5.3.3 Concise Maths ....................................................................................................... 131
5.3.4 Comparing the Textbook Series ............................................................................ 134
5.4 Novelty ......................................................................................................................... 136
5.4.1 Active Maths ......................................................................................................... 136
5.4.2 Text and Tests ....................................................................................................... 139
5.4.3 Concise Maths ....................................................................................................... 143
5.4.4 Comparing Textbook Series .................................................................................. 145
5.5 Project Maths Syllabus Problem-solving Objectives .................................................... 147
5.5.1 Active Maths ......................................................................................................... 147
5.5.2 Text and Tests ....................................................................................................... 154
5.5.3 Concise Maths ....................................................................................................... 159
5.5.4 Comparison of Textbook Series ............................................................................ 164
5.6 Usiskin’s Multidimensional Model of Mathematical Understanding .......................... 167
5.6.1 Active Maths ......................................................................................................... 167
5.6.2 Text and Tests ....................................................................................................... 171
5.6.3 Concise Maths ....................................................................................................... 174
5.6.4 Comparison of Textbook Series ........................................................................... 178
Chapter 6 Task Design ............................................................................................................ 181
6.1 Introduction ................................................................................................................. 181
6.2 Designed Tasks ............................................................................................................. 181
6.2.1 Original Designed Tasks ........................................................................................ 184
6.3 The Tasks Workshop .................................................................................................... 192
6.4 Preparation for the Workshop ..................................................................................... 193
6.5 The Workshop .............................................................................................................. 195
6.6 Results .......................................................................................................................... 197
6.7 Questionnaire .............................................................................................................. 203
6.8 Conclusion .................................................................................................................... 206
6.9 Summary ...................................................................................................................... 208
Chapter 7 Discussion .............................................................................................................. 210
7.1 Research Questions ..................................................................................................... 210
7.1.1 RQ 1 (a) Are These Tasks Fulfilling the Expectations of Project Maths in Terms of its
Problem-Solving Objectives? ......................................................................................... 210
7.1.2 RQ 1 (b) What Degree of Novelty is Incorporated in the Tasks? .......................... 213

viii
7.1.3 RQ 1(c): What is the Level of Cognitive Demand of the Tasks Analysed on the
Topics Contained in the Textbook Chapters? ................................................................. 215
7.1.4 RQ 1(d) What Kind of Reasoning do Students Need to Use when Completing These
Tasks? ............................................................................................................................. 216
7.1.5 RQ 1 (e) What Kind of Understanding (Using Usiskin’s Dimensions) is Being
Promoted in These Textbook Tasks? .............................................................................. 218
7.1.6 RQ 2 Is There a Difference Between Textbook Series? ......................................... 220
7.1.7 RQ3 Is There a Difference between the Pre-Project Maths and Post-Project Maths
Textbook Series? ............................................................................................................ 222
7.1.8 RQ4 Can Textbook Tasks be Designed to Better Meet the Goals of Project Maths?
........................................................................................................................................ 223
7.2 Limitations .................................................................................................................... 225
7.2.1 Textbook Task Analysis .......................................................................................... 225
7.2.2 Time Constraints .................................................................................................... 226
7.2.3 Choice of Topics .................................................................................................... 227
Chapter 8 Recommendations ................................................................................................. 228
8.1 Providing More Balance in Sets of Tasks ...................................................................... 228
8.2 Making Greater Use of Unfamiliar Contexts and Novel Tasks ..................................... 229
8.3 Giving More Attention to Reasoning-And-Proving ....................................................... 230
8.4 Increasing the Level of Cognitive Demand in Tasks ..................................................... 231
8.5 Availing of Greater Expertise When Designing Textbook Tasks ................................... 232
8.6 Establishing Professional Development to Support Teachers in Analysing/Creating
Tasks ................................................................................................................................... 234
8.7 Advice for Individual Teachers ..................................................................................... 235
8.8 Advice for Researchers ................................................................................................. 236
8.9 Future Research ................................................................................................................ 237
8.10 Other Work ................................................................................................................. 238
Bibliography ............................................................................................................................ 240
Appendices ............................................................................................................................. 258
Appendix A Documents for Novelty Workshop……………………………………………………………..…..259
Appendix B Chi-square Tests Tables…………………………………………………….…………………………….276
Appendix C Task Design Material………………………………………….……………………………………………284

ix
List of Abbreviations
HL = Higher Level
OL = Ordinary Level
LL = Lower Level
HLD = Higher Level Demand
LLD = Lower Level Demand
LCD = Level of Cognitive Demand
PM = Project Maths
CR = Creative Reasoning
IR = Imitative Reasoning
PMO = Project Maths syllabus problem-solving Objectives
DM = Doing Mathematics
HP = Procedures with connections to meaning
LP = Procedures without connections to meaning
LM = Memorization

x
Table of Figures Figure 1.1: Textbooks viewed as an intermediate variable in the context of education (Fan,
2013, p. 771) .............................................................................................................................. 4
Figure 3.1 Instructional triangle from Cohen et al. (2003, p. 124) .......................................... 48
Figure 3.2 Elaboration of the instructional triangle (Herbz and Chazan, 2012, pg. 609) ....... 50
Figure 3.3 Lower-level cognitive demand (Smith and Stein, 1998, p.348) .............................. 54
Figure 3.4 Higher-level cognitive demand (Smith and Stein, 1998, p.348) ............................. 55
Figure 3.5 An overview of reasoning types (Lithner, 2006, p.5) ............................................. 57
Figure 3.6 List of Project Maths learning objectives in the Leaving Certificate syllabus ........ 58
Figure 3.7 List of synthesis and problem-solving objectives in the Leaving Certificate syllabus.
................................................................................................................................................. 59
Figure 3.8: Original/Amended list of Project Maths problem-solving syllabus Objectives ..... 60
Figure 3.9: Framework for classification of novelty in tasks encountered in textbooks......... 68
Figure 4.1: Exemplar material 1 from Text and Tests 6 (HL) pg. 145 ...................................... 76
Figure 4.2: Exemplar material 2 from Text and Tests 6 (HL) pg. 145 ...................................... 76
Figure 4.3: Text and Tests 6 (HL) Exercise 4.3 Q 1 pg. 149 ...................................................... 77
Figure 4.4: Exemplar material 3 from Text and Tests 6 (HL) pg. 146 ...................................... 78
Figure 4.5: Exemplar material 4 from Text and Tests 6 (HL) pg. 146-147 ............................... 79
Figure 4.6: Text and Tests 6 (HL) Exercise 4.3 Question 15 pg. 150 ........................................ 80
Figure 4.7: Exemplar material 5 from Text and Tests 6 (HL) pg. 148 ...................................... 81
Figure 4.8: Text and Tests 6 (HL) Exercise 4.3 Question 7 pg. 149 .......................................... 82
Figure 4.9: Text and Tests 6 (HL) Exercise 4.3 Question 10 pg. 149 ........................................ 83
Figure 4.10: Text and Tests 6 (HL) Exercise 4.2 Question 5 pg 142-143.................................. 84
Figure 4.11: Exemplar material 6 from New Concise Project Maths 4 (HL) pg. 416 ............... 85
Figure 4.12: New Concise Project Maths 4 (HL) Exercise 15.2 Question 2 (ii) pg. 416 ........... 86
Figure 4.13: New Concise Project Maths 4 (HL) Exercise 15.2 Question 8 pg. 417 ................. 87
Figure 4.14: New Concise Project Maths 4 (HL) Exercise 15.2 Question 7 pg. 417 ................. 88
Figure 5.1: Comparison of LCD category proportions in HL and OL Active Maths textbooks for
both pre and post-PM eras.................................................................................................... 114
Figure 5.2: Comparison of LCD category proportions per topic in HL Active Maths textbooks
for both pre and post-PM eras .............................................................................................. 115
Figure 5.3: Comparison of LCD category proportions for Higher and Ordinary Level Text and
Tests textbooks for both pre and post-PM eras .................................................................... 119
Figure 5.4 Comparison of LCD category proportions per topic in the HL Text and Tests
textbooks for both pre and post-PM eras ............................................................................ 120
Figure 5.5: Comparison of LCD category proportions for HL and OL Concise Maths textbooks
for both pre and post-PM eras ............................................................................................. 123
Figure 5.6: Comparison of LCD category proportions per topic in the Concise Maths HL
textbooks for both pre and post-PM eras ............................................................................. 124
Figure 5.7: Comparison of LCD category proportions per textbook series for the post-PM era
............................................................................................................................................... 125
Figure 5.8: Comparison of reasoning proportions for HL and OL Active Maths textbooks for
both pre and post-PM eras.................................................................................................... 127
Figure 5.9: Comparison of reasoning per topic for OL Active Maths textbooks for both pre
and post-PM eras .................................................................................................................. 128

xi
Figure 5.10: Comparison of reasoning proportions for HL and OL Text and Tests textbooks for
both pre and post-PM eras .................................................................................................... 130
Figure 5.11: Comparison of reasoning proportions per topic for HL Text and Tests textbooks
for both pre and post-PM eras .............................................................................................. 131
Figure 5.12: Comparison of reasoning proportions for HL and OL Concise Maths textbooks for
both pre and post-PM eras .................................................................................................... 133
Figure 5.13: Comparison of reasoning proportions per topic for Higher Level Concise Maths
textbooks for both pre and post-Project Maths eras ............................................................ 134
Figure 5.14: Comparison of reasoning proportions for HL post-PM textbook series ............ 135
Figure 5.15: Comparison of reasoning proportions for OL post-PM textbook series ............ 135
Figure 5.16: Comparison of reasoning proportions for pre-PM textbook series .................. 136
Figure 5.17: Comparison of novelty proportions in HL and OL Active Maths textbooks per PM
era .......................................................................................................................................... 138
Figure 5.18: Comparison of proportion of novelty categories per topic in the OL Active Maths
pre- and post-PM textbooks .................................................................................................. 139
Figure 5.19: Comparison of the proportions of novelty in HL and OL Text and Tests textbooks
per PM era ............................................................................................................................. 141
Figure 5.20: Comparison of novelty proportions per topic in the Text and Tests Higher Level
textbooks per Project Maths era ........................................................................................... 142
Figure 5.21: Comparison of the proportions of novelty in HL and OL Concise Maths textbooks
per PM era ............................................................................................................................ 144
Figure 5.22: Comparison of the proportion of novelty per topic in the OL Concise Maths
textbook series ....................................................................................................................... 145
Figure 5.23: Percentage of PMO in the HL and OL pre-PM Active Maths textbook series ... 150
Figure 5.24: Percentage of PMO in the HL and OL post-PM Active Maths textbook series . 150
Figure 5.25: Active Maths (HL) comparison of topic and PM era .......................................... 153
Figure 5.26: Active Maths (OL) comparison of topic and PM era .......................................... 153
Figure 5.27: Text and Tests (HL) comparison of topic and PM era ........................................ 157
Figure 5.28: Text and Tests (OL) comparison of topic and PM era ........................................ 158
Figure 5.29: Concise Maths (HL) comparison of topic and PM era ....................................... 162
Figure 5.30: Concise Maths (OL) comparison of topic and PM era ....................................... 163
Figure 5.31: Comparison of PMO (percentages) post-PM HL textbook series ...................... 164
Figure 5.32: Comparison of post-PM PMO (percentages) OL textbook series ...................... 164
Figure 5.33: Comparison of pre-PM PMO (percentages) HL textbook series ........................ 165
Figure 5.34: Comparison of pre-PM PMO (percentages) OL textbook series........................ 166
Figure 5.35: Usiskin’s Multidimensional Model for HL Active Maths comparing topic and
textbook era. .......................................................................................................................... 170
Figure 5.36: Usiskin’s Multidimensional Model for OL Active Maths comparing topic and
textbook era. .......................................................................................................................... 170
Figure 5.37: Usiskin’s Multidimensional Model for HL Active Maths comparing topic and
textbook era. .......................................................................................................................... 173
Figure 5.38: Usiskin’s Multidimensional Model for HL Active Maths comparing topic and
textbook era. ......................................................................................................................... 174
Figure 5.39: Usiskin’s Multidimensional Model for HL Concise Maths comparing topic and
textbook era. .......................................................................................................................... 177

xii
Figure 5.40 Usiskin’s Multidimensional Model for OL Concise Maths comparing topic and
textbook era. ......................................................................................................................... 178
Figure 5.41: Comparison of Usiskin’s dimensions (percentages) in post-PM HL textbook
series...................................................................................................................................... 178
Figure 5.42: Comparison of Usiskin’s dimensions (percentages) in post-PM OL textbooks . 179
Figure 5.43: Comparison of Usiskin’s dimensions (percentages) for pre-PM HL textbook series
............................................................................................................................................... 179
Figure 5.44: Comparison of Usiskin’s dimensions (percentages) for pre-PM OL textbook series
............................................................................................................................................... 180

xiii
Table of Tables
Table 1: Classifications of coders from Novelty framework validation workshop .................. 97
Table 2: percentage of the 30 tasks in each of the three categories for each coder .............. 98
Table 3: Average Pairwise Percent Agreement ..................................................................... 102
Table 4: Pre-PM Number of tasks per topic, level and textbook series ................................ 110
Table 5: Post-PM Number of tasks per topic, level and textbook series ............................... 110
Table 6: Active Maths Textbook Series (Higher Level) Levels of Cognitive Demand ............. 112
Table 7: Active Maths Textbook Series (Ordinary Level) Levels of Cognitive Demand ......... 113
Table 8: Text and Tests Textbook Series (HL) Levels of Cognitive Demand ........................... 116
Table 9: Text and Tests Textbook Series (OL) Levels of Cognitive Demand .......................... 118
Table 10: Concise Maths Textbook Series (HL) LCD ............................................................... 121
Table 11: Concise Maths Textbook Series (OL) LCD ............................................................... 122
Table 12: Active Maths Textbook Series (HL) Types of Reasoning ........................................ 126
Table 13: Active Maths Textbook Series (OL) Types of Reasoning ........................................ 127
Table 14: Text and Tests Textbook Series (HL) Types of Reasoning ...................................... 129
Table 15: Text and Tests Textbook Series (OL) Types of Reasoning ...................................... 129
Table 16: Concise Maths Textbook Series (HL) Types of Reasoning ...................................... 132
Table 17: Concise Maths Textbook Series (OL) Types of Reasoning ...................................... 132
Table 18: Active Maths Textbook Series (HL) Types of Novelty ............................................ 137
Table 19: Active Maths Textbook Series (OL) Types of Novelty ............................................ 137
Table 20: Text and Tests Textbook Series (HL) Types of Novelty .......................................... 140
Table 21: Text and Tests Textbook Series (OL) Types of Novelty .......................................... 141
Table 22: Concise Maths Textbook Series (HL) Types of Novelty .......................................... 143
Table 23: Concise Maths Textbook Series (OL) Types of Novelty .......................................... 144
Table 24: Classification of PMO for HL Active Maths series .................................................. 149
Table 25: Classification of PMO for OL Active Maths series .................................................. 151
Table 26: Classification of PMO for HL Text and Tests .......................................................... 155
Table 27: Classification of PMO for OL Text and Tests .......................................................... 156
Table 28: Classification of PMO for HL Concise Maths .......................................................... 160
Table 29: Classification of PMO for OL Concise Maths .......................................................... 161
Table 30: Classification of Usiskin’s Multidimensional Model for HL Active Maths .............. 168
Table 31: Classification of Usiskin’s Multidimensional Model for OL Active Maths .............. 169
Table 32: Classification of Usiskin’s Multidimensional Model for HL Text and Tests ............ 171
Table 33: Classification of Usiskin’s Multidimensional Model for OL Text and Tests ............ 172
Table 34: Classification of Usiskin’s Multidimensional Model for HL Concise Maths ........... 175
Table 35: Classification of Usiskin’s Multidimensional Model for OL Concise Maths ........... 176
Table 36: Classifications of example 1 ................................................................................... 184
Table 37: Classifications of example 2 ................................................................................... 186
Table 38: Classifications of example 3 ................................................................................... 186
Table 39: Classifications of example 4 ................................................................................... 187
Table 40: Classifications of example 5 ................................................................................... 188
Table 41: Classifications of example 6 ................................................................................... 189
Table 42: Classifications of example 7 ................................................................................... 190
Table 43: Classifications of example 8 ................................................................................... 191
Table 44: Classifications of example 9 ................................................................................... 192
Table 45: Classifications for the LCD framework from the Tasks Workshop ......................... 197

xiv
Table 46: Analysis of workshop task classifications for the LCD framework ......................... 198
Table 47: Analysis of workshop task classifications for the PMO framework W1 (i) – W2 (iv)
................................................................................................................................................ 200
Table 48: Analysis of workshop task classifications for the PMO framework W3 (i) – W4 (iii)
................................................................................................................................................ 201
Table 49: Analysis of workshop task classifications for the PMO framework W5 (i) – W6 (iv)
................................................................................................................................................ 202
Table 50: Chi-square test results for Active Maths textbook series and LCD ........................ 276
Table 51: Chi-square test results for Text and Tests textbook series and LCD ...................... 277
Table 52: Chi-square test results for Concise Maths textbook series and LCD ...................... 278
Table 53: Chi-square test results for Textbook Series and LCD .............................................. 278
Table 54: Chi-square test results for Active Maths textbook series and Reasoning .............. 279
Table 55: Chi-square test results for Text and Tests textbook series and Reasoning ............ 280
Table 56: Chi-square test results for Concise Maths textbook series and Reasoning............ 281
Table 57: Chi-square test results for Textbook series and Reasoning ................................... 281
Table 58: Chi-square test results for Active Maths textbook series and Novelty .................. 282
Table 59: Chi-square test results for Text and Tests textbook series and Novelty ................ 282
Table 60: Chi-square test results for Concise Maths textbook series and Novelty ................ 283
Table 61: Chi-square test results for Textbook series and Novelty ........................................ 283
Table 62: Individual Coder Classifications for LCD framework ............................................... 302
Table 63: Individual Coder Classifications for PMO – Coders 1 – 5 ........................................ 303
Table 64: Individual Coder Classifications for PMO Coders 6 – 8 ........................................... 304
Table 65: Individual Coder Classifications for PMO Coders 9-12 ........................................... 305
Table 66: Individual Coder Classifications for PMO Coders 13-17 ......................................... 306
Table 67: Individual Coder Classifications for PMO Coders 18-19 ......................................... 307

xv
Abstract
An Analysis of Mathematical Tasks at Second-Level in Ireland
by Brendan O’Sullivan
This thesis is concerned with the analysis of mathematical textbook tasks at second-level in Ireland, in the context of the introduction of the revised curriculum entitled ‘Project Maths’. This work aims to gain greater insight into the mathematical tasks that students and teachers encounter on a daily basis, to attain some understanding of the teaching and learning taking place in Irish classrooms. A total of 7635 tasks on the topics of Pattern, Sequences and Series and Differential Calculus contained in three textbook series for senior cycle, in editions available before and those available after the curriculum change were analysed. The analysis was informed by the use of five frameworks: an amended version of the Project Maths problem-solving objectives, a novelty framework designed during the course of this research, Levels of Cognitive Demand (Smith and Stein, 1998), Lithner’s reasoning framework (Lithner, 2008) and Usiskin’s model of mathematical understanding (Usiskin, 2012). My findings suggest that the post-Project Maths textbook tasks offer greater opportunities in all five areas when compared to those in the older textbooks, but that there is still scope for further development. Based on my analysis, it would appear that all three textbook series have neglected important objectives of the Project Maths curriculum such as justifying conclusions and communicating mathematically. Furthermore, the findings indicate that there is a need for more attention to be paid to fostering novelty in textbook tasks, increasing the level of cognitive demand, and more opportunities should be provided for creative reasoning. Greater effort should also be made to diversify the dimensions of student understanding offered by tasks. Following this analysis, some sample tasks were designed, paying particular attention to the areas my findings indicate are in need of improvement. This was achieved by building on existing textbook tasks as well as creating completely new ones.

xvi
Chapter 1 Introduction
My research is concerned with the analysis of mathematical tasks at second level in
Ireland, during a period of significant reform of post-primary mathematics. The
importance of the textbook, as a source of tasks, in Irish mathematics classrooms has
been noted; very often it is the only resource which students have access to during the
lesson aside from the teacher, while most of the tasks assigned for classwork and
homework come directly from the textbook (Project Maths, 2017). The aim of this
research is to gain greater insight into the nature of tasks that students and teachers
work with in Irish classrooms. With this goal in mind, my work has centred on analysing
tasks contained in three textbook series (at Higher and Ordinary Level) currently used in
Ireland (O’Sullivan, Breen and O’Shea 2013, O’Sullivan 2014).
In Ireland, secondary education is divided into two parts – a junior cycle and a senior
cycle. The former spans three years, building on the education received at primary level
while preparing students for the sitting of the Junior Certificate examination. The senior
cycle involves two years of study and leads to the Leaving Certificate examination;
students typically study seven subjects and entrance to higher education is decided
using the results of this set of examinations. At junior cycle, subjects are normally
studied at either Ordinary or Higher Level, although three subjects, Irish, English and
mathematics, can also be studied at Foundation Level (DES/NCCA, 2000). At senior cycle
the subjects of Irish and mathematics can also be pursued at Foundation Level. The
Higher course is aimed at the more able students with a special interest in the subject,
the Ordinary course provides knowledge and techniques that will be necessary for the
study of scientific, economic, business and technical subjects at third level, while the
Foundation course provides students with the mathematical tools needed in their daily
life and work (DES/NCCA, 2000). In the junior cycle, the study of mathematics is
mandatory and thus there is a high participation rate.. While mathematics is not
compulsory in the senior cycle, the number sitting for examination in the subject
remains high. All of the courses are assessed by means of a terminal examination. In
2017, 93% of students sitting the Leaving Certificate took the subject of mathematics for

2
examination. The majority of these candidates, 59%, sat the ordinary level, 30% sat the
higher level papers while 12% took the foundation level (SEC, 2017).
1.1 Research Rationale
Prior to the introduction of the curricular reform, the seemingly low problem-solving
ability of Irish school children was noted as being a major area of concern in a number of
publications (OECD 2007, 2010; Forfás 2009; EGFSN 2008, Shiel, Surgenor, Close and
Millar 2006). It was also noted that Ireland had ‘comparatively few very high achievers’
(NCCA 2005, pg. 188). A growing perception existed that students were being prepared
to pass examinations in mathematics but were not given an understanding of the
subject or of how to apply its concepts (Elwood and Carlisle, 2003). Lyons, Lynch, Close,
Boland and Sheerin (2003) observed an over-riding preoccupation with examinations in
second-level mathematics classrooms and identified the teaching of mathematics in
Ireland as encouraging procedural learning, rather than promoting the ability to problem
solve. Leaving Certificate examiners commented that there was a ‘noticeable decline in
the capacity of candidates to engage with problems that were not of a routine and well-
rehearsed type’ (SEC, 2005, p. 72). Similarly examiners at Junior Certificate called for a
change of approach in the hopes of ‘developing a deeper understanding’ (SEC, 2006, p.
53). Concerns about the lack of application of mathematics in real-world contexts were
also expressed across the educational sphere (NCCA 2006).
Against this background, the curricular revision of second-level Mathematics in Ireland,
an initiative known as ‘Project Maths’, aims to place a greater emphasis on student
understanding of mathematical concepts, together with increased use of contexts and
applications that should enable students to relate mathematics to everyday experience.
It also hopes to create a classroom environment where a greater amount of the teaching
and learning taking place is done through problem-solving (Project Maths, 2009). Given
that Project Maths was designed to help address the issues described in this section, an
analysis of mathematical tasks in textbooks designed for the new syllabus will give some
insight as to whether such concerns are indeed being addressed.

3
1.2 Textbook Analysis as a Research Method
Robitaille and Travers (1992) have made the point that a dependence upon textbooks is
‘perhaps more characteristic of the teaching of mathematics than of any other subject’
(p. 706). Fan and Kaeley (2000) argued that teachers using different types of textbooks
made use of different styles of teaching strategies. Fan (2011) defined mathematics
textbook research ‘as disciplined inquiry into issues about mathematics textbook and
the relationships between mathematics textbooks and other factors in mathematics
education’ (p.9). Having conducted a survey of mathematics textbook literature
published over the previous six decades, Fan, Zhu and Miao (2013) concluded that the
most popular area of research is to be found on textbook analysis and comparison.
Textbook analysis, as described by Fan et al. (2013), is a broad term including ‘analysis of
a single textbook or a series of textbooks, which often focuses on how a topic or topics
are treated or how a particular idea or aspect of interest is reflected in textbooks’
(p.636). Fan et al. (2013) point out that textbook analysis can also involve the analysis of
different series of textbooks, often with a focus on identifying their similarities and
differences.
Fan (2013) conceptualises textbooks as a variable, specifically an intermediate variable
in the context of education, such a variable ‘causes variation in the dependent variable
and is itself caused to vary by the independent variable’ (p. 771). An intermediate
variable can cause variation in dependent variables such as student learning or the
promotion of problem-solving. The textbook, as an intermediate variable, is also caused
to vary by independent variables such as the integration of information technology or
the composition of textbook writing teams. Put simply, the independent variables in this
case are the factors affecting the development of textbooks. Overall, the textbook is
affected by independent variables but can also influence dependent variables of its own.
Using this conceptual framework, textbook research can be viewed as consisting of
three broad areas as shown in Figure 1.1 below: 1) textbooks as the subject of research
(textbooks as an intermediate variable); 2) how different factors affect the development
or production of textbooks (textbooks as a dependent variable) and 3) how other factors
are affected by the textbook (textbooks as an independent variable).

4
Figure 1.1: Textbooks viewed as an intermediate variable in the context of education
(Fan, 2013, p. 771)
As will be seen in chapter 3 on Theoretical Frameworks, another theoretical framework
known as the instructional triangle (Cohen, Raudenbush and Ball, 2003) looks at the
relationship between teachers, students and the knowledge or specifically mathematical
content that makes up instruction. The textbook as a source of tasks concerned with
mathematical content is again an intermediate variable within this framework. Different
textbooks offer different material for mathematical instruction and assignment by
teachers and these in turn can affect the opportunities for learning offered to students.
The instructional triangle and its extension will be discussed in greater detail in chapter
3, however it complements Fan’s conceptualisation of textbooks and underlines their
importance as a focus of research.
Fan (2011, p.8) points out that a large majority of the literature in relation to
mathematics textbooks is not based on empirical methods or experimental methods.
Most research publications are based on document analysis, which Fan (2013) describes
as ‘relatively well-established and accepted as a research method’ (p.773). Fan (2013)
also points out that this practice of document analysis and coding has a long tradition,
citing Pingel commenting on general textbook research that ‘during the early years of
textbook studies, textbooks were often regarded as quasi-independent entities. The
examination focused almost exclusively on the content and the written text’ (Pingel,
2010, p.42) in Fan (2013, p. 774). The research presented in this study views the
textbook, containing mathematical tasks, as an intermediate variable and presents an
analysis and comparison of two topics in three textbook series that were in use both
before and after the reform of the curriculum. It does not make use of empirical
methods such as classroom observations, interviews or field surveys as it does not

5
attempt to draw conclusions on how textbooks are being used in Irish post-primary
classrooms. Instead it analyses the nature of the mathematical tasks that are contained
in popular Irish mathematics textbooks.
1.3 Recent Textbook Analysis in Ireland
The following is a short overview of the recent textbook analysis that has been
conducted in Ireland. More details will be given in chapter 2, the Literature Review. Over
75 per cent of Irish second-level teachers use a textbook on a daily basis (O’Keeffe, 2011,
p.262). There is very little published work in relation to the classification of textbook
tasks in Ireland before the implementation of Project Maths. Moreover, much of the
other work involving textbook analysis that has been undertaken since Project Maths
has also had a different focus looking at different aspects of the textbooks available.
O’Keeffe and O’Donoghue (2009) analysed four series of textbooks used in Irish junior
cycle classrooms using Rivers’ framework which focuses on motivational factors,
comprehension cues, technical aids and philosophical position.
A later study - O’Keeffe and O’Donoghue (2011) analysed a number of textbooks in the
area of fractions. This focused on content, structure, expectation and language. The
findings of this study were then used to create a ‘model chapter’ for teaching the topic
of fraction addition. O’Keeffe and O’Donoghue (2012) conducted a larger study of the
textbooks published in response to Project Maths that were available at the time (ten in
all), consisting of textbooks used at both junior and senior cycle. The TIMSS mathematics
curriculum framework, was used and adapted for this analysis. This conceptual
framework looks at the textbook as a whole, under three broad headings: intended
curriculum, implemented curriculum and attained curriculum. The conclusion of the
analysis was that the textbooks display a genuine attempt to match Project Maths
expectations but no one textbook meets all of these.
Davis (2013) examined the prevalence of reasoning-and-proving in the topic of complex
numbers in six Irish textbooks and one teaching and learning plan produced for teachers
during the introduction of Project Maths. The results from Davis’ study suggest that
there is a ‘misalignment between the six textbook units and the Leaving Certificate

6
syllabus’ (Davis, 2013, p. 54). Given the amount of change that accompanied Project
Maths, I identified the scope for further research in the area of Irish mathematical
textbooks. It would be expected that the tasks contained in the new texts produced to
meet the needs of the new curriculum would be more conducive to intrinsic learning
and problem-solving than the publications that they were replacing. It would also be
necessary to identify any deficiencies if present. I also set out to design a small number
of tasks in order to address any shortcomings identified. The research contained in this
thesis goes some way towards adding insight into this area.
1.4 Outline of the Research Undertaken
This study is concerned with analysing mathematical textbook tasks from two topics
studied at Higher and Ordinary Level at senior cycle in use from the pre- and post-
Project Maths eras. To complete this analysis effectively and to gather as much useful
information as possible, it was necessary to consider how the analysis would be
conducted and what immediate use would be made of the analysis findings.
Having considered these issues, the following emerged as the primary stages of the
study:
To review the literature in relation to the background issues that prompted the
introduction of the new Project Maths curriculum and what concerns it aimed to
address. Another activity undertaken was to review the literature on the
classification of tasks in textbooks and how the findings of such studies prove to
be useful, also giving consideration in such literature to the role of the textbook
in classrooms internationally and in Ireland.
To identify suitable frameworks that could be used for the analysis of textbook
tasks, adapting existing frameworks where necessary to make them fit for the
purpose of the analysis. Emerging from work completed on two existing
frameworks; the Levels of Cognitive Demand and Lithner’s reasoning framework,
it was decided to create a new framework to identify ‘novel’ tasks and to enable
differentiation between the degrees of novelty based on students’ prior
experience and exposure to exemplary material in a textbook chapter.

7
To gather quantitative data on tasks in the topics of Pattern, Sequences and
Series, and Differential Calculus, by conducting analyses using five frameworks,
on textbooks available both before and after the introduction of the Project
Maths curriculum.
To design some sample tasks, informed by the textbook analysis, to address any
deficiencies identified by the five frameworks in order to better realise the goals
of the Project Maths curriculum. This was informed by looking at material giving
guidelines on the design of mathematical tasks and the benefits available to
teachers when engaged in designing their own tasks.
1.5 Research Questions
In the past, mathematics textbooks in Ireland have been accused of being too
procedural and dependent on the use of algorithms when students are solving tasks
(NCCA, 2012b, p. 18). This analysis aims to give some indication as to whether this
situation persists and whether the Project Maths problem-solving syllabus objectives are
being realised. Four main research questions have emerged with the first (what is the
nature of the mathematical tasks that are being used in Irish classrooms?) consisting of
five parts:
RQ 1 (a) Are these tasks fulfilling the expectations of Project Maths in terms of its
problem-solving objectives?
RQ 1 (b) What degree of novelty is incorporated in these tasks?
RQ 1 (c) What is the level of cognitive demand of the tasks analysed on the topics
contained in the textbook chapters?
RQ 1(d) What kind of reasoning do students need to use when completing these tasks?
RQ 1 (e) What kind of understanding (using Usiskin’s dimensions) is being promoted in
these textbook tasks?
Another research question (RQ 2) that is investigated relates to the textbook series and
whether differences exist between them.
RQ 2 Is there a difference between textbook series?

8
Similarly, given that tasks from textbooks in use from both before and after the
introduction of the Project Maths curriculum were analysed, a third question (RQ 3)
relates to whether there are changes between these sets of textbook series.
RQ 3 Is there a difference between the pre-Project Maths and post-Project Maths
textbook series?
Finally my last research question (RQ 4) considers whether textbook tasks can be
created in order to better address the intentions of the Project Maths curriculum than
those tasks currently available.
RQ 4 Can textbook tasks be designed to better meet the goals of Project Maths?
1.6 Overview of the Thesis
Subsequent to the introduction to the research outlined in this chapter, the work
undertaken is discussed in greater detail over the next seven chapters.
Chapter 2 provides some background information about mathematics education in
Ireland including the recent revision of the second-level syllabus and the
implementation of curriculum reforms. The chapter then focuses on the importance of
the classification of tasks in textbooks, which is central to this thesis. Consideration is
given to the role of the textbook in classrooms internationally and in Ireland. Specific
textbook studies are examined, discussing how they were conducted as well as the
findings for each study. Literature on task design is also considered and how it can prove
to be beneficial to teacher development.
Chapter 3 outlines the theoretical frameworks that are utilised in this study. Herbst and
Chazan’s (2012) extension of the instructional triangle (Cohen et al., 2003) is discussed in
relation to the importance of analysing mathematical tasks. Mathematical content, in
the form of tasks, is an important aspect of the study of the teaching and learning. The
type of tasks that are offered to students by teachers allows us to gain some insight into
the opportunities available for the learning of mathematics. The Levels of Cognitive
Demand (as described in Smith and Stein, 1998) and mathematical reasoning (Lithner,
2008) frameworks are outlined. The Project Maths syllabus problem-solving objectives
are described to give some insight into the goals that the syllabus aspires to. An

9
explanation is provided of how these objectives are adapted for use as a framework for
the analysis of tasks in this study. Usiskin’s (2012) multidimensional model of
mathematical understanding is described. After examining the criteria for task analysis
using each of these four frameworks, the kind of data that each framework offers to
researchers is outlined. A framework to classify the ‘novelty’ of tasks has been designed
as part of this thesis and is presented in this chapter; this framework can assist with
distinguishing between certain categories in the Project Maths objectives, Levels of
Cognitive Demand and reasoning frameworks.
Chapter 4 describes the methodology used for the classification of tasks using the
frameworks described in chapter 3. Once the methodology employed in the textbook
tasks analysis is explained, examples of classifications using the above frameworks are
provided. This chapter also describes a workshop used to gain external validation for the
Novelty framework outlined in chapter 3.
Chapter 5 provides the results of the classification of 7635 textbook tasks on two topics
from a number of textbooks in use before and after the introduction of the Project
Maths curriculum. The textbooks are from three textbook series, namely Active Maths,
Text and Tests, and Concise Maths. Tasks are analysed from the areas of Pattern,
Sequences and Series, and Differential Calculus using the methodology described in
chapter 4.
Chapter 6 gives examples of the types of tasks that I have designed, informed by the
results of the classification of textbook tasks in chapter 5. The tasks designed are
accompanied by a classification of these tasks using four of the frameworks described in
chapter 3; the Levels of Cognitive Demand framework, Lithner’s reasoning framework,
Usiskin’s mathematical understanding framework and the Project Maths problem-
solving objectives framework. A workshop at which the tasks designed for this study
were independently evaluated with respect to the Levels of Cognitive Demand
framework and the Project Maths problem-solving Objectives framework is also
described. Amendments to the workshop tasks are then provided arising from how the

10
workshop participants classified the tasks. Classifications for these amended tasks are
also given.
Chapter 7 discusses the findings from the analysis and design of tasks in order to answer
the research questions posed in section 1.5. The limitations of the research described in
this thesis are examined at the end of the chapter.
Chapter 8 concludes the thesis by making a number of recommendations arising from
the research completed. Directions for future research are also outlined in this section.

11
Chapter 2 Literature Review
This chapter will give some background information about mathematics education in
Ireland including the recent revision of the second-level syllabus and the
implementation of curriculum reforms. The importance attached to the classification of
tasks in textbooks is then examined. Consideration is given to the role of the textbook in
classrooms internationally and in Ireland. Specific textbook studies are outlined with
attention given to how they were conducted and what each one found. Task design is
also considered and how it can be beneficial to teacher development.
2.1 Curriculum Change
Project Maths is an initiative, led by the National Council for Curriculum and Assessment
(NCCA), to bring about positive change in the teaching and learning of mathematics at
second-level in Ireland. Its inception came about as a result of a number of concerns
raised about the state of mathematics education in the Irish system. One major worry
for policy-makers was the level of performance of students in an international context.
PISA 2003 rated Ireland 20th out of 40 for mathematical literacy (Cosgrove, Shiel,
Sofroniou, Zastrutzki and Shortt, 2005), and it brought attention to the relatively low
performance of higher achieving students in mathematics in Ireland. Cosgrove et al.
(2005, p. 223) pointed out that there was a weak match between PISA mathematics and
the existing syllabus in Ireland and suggested that any future review of mathematics
education should consider whether important mathematical content was absent from
the syllabus. There was a growing perception that students were being prepared to pass
examinations in mathematics but were not being given an understanding of the subject
or of how to apply its concepts (Lyons et al., 2003, p. 6). In 2005, a discussion paper
outlining some of the pressing issues was published by the NCCA (NCCA, 2005). The
concerns raised included an emphasis on procedural skills rather than understanding,
poor application of mathematics to real-world contexts, low uptake of Higher Level
mathematics, low grades achieved at Ordinary Level, gender differences in uptake and
achievement, and difficulties experienced by some students in third-level courses. A
subsequent questionnaire sought the views of students, teachers, principals, parents,
lecturers and employers. Following this consultation, worries were expressed by many

12
of these stakeholders about the lack of application of mathematics in real-world
contexts (NCCA, 2006). Teaching and learning practices were cited in the consultation
report as having the greatest influence on students’ understanding of mathematics.
While the report acknowledged the need for change in the syllabus and the assessment
of same to take into account the need for more use of contexts and more applications,
there was broad agreement that a deeper understanding of mathematical concepts
would be achieved if more time was given to the teaching and learning of the ‘why’,
‘what if’ and ‘how’ of mathematics. Over 90% of those consulted felt that an improved
textbook could play a strong role in improving students’ performance on mathematics
examinations.
Following this review, the NCCA began the process of revising the curriculum and the
new curriculum that emerged was named Project Maths. The new curriculum
emphasised the development of student problem-solving skills (NCCA, 2012a, p. 1). One
of the key aims of Project Maths is to encourage students to think about their strategies,
to explore possible approaches and evaluate these, and so build up a body of knowledge
and skills that they can apply in both familiar and unfamiliar situations. The new
syllabuses were introduced on a gradual basis. There are five strands in total: 1)
Statistics and Probability, 2) Geometry and Trigonometry, 3) Number, 4) Algebra and 5)
Functions. Strands 1 and 2 were introduced in 24 Pilot Schools in 2008 and in all other
schools in 2010. Strands 3 and 4 followed in 2009 for the pilot schools and in 2011 for
the remaining cohort, while the final strand was introduced in 2010 and 2012
respectively.
Change was not limited to syllabus content; Project Maths also advocated different
learning and teaching practices. A series of workshops, to which all mathematics
teachers in the pilot schools were invited, looked at specific topics from the different
syllabus strands to demonstrate a more investigative approach to teaching and learning.
Looking at the experiences of teachers in the pilot schools, it has been noted that
teachers have observed a change in their teaching practices, with a move away from
didactic approaches to more active methodologies (NCCA, 2012a, p. 20). As the Project
Maths curriculum becomes more embedded in Irish classrooms, it has been necessary
13
for some teachers to adopt different methodologies in order to attain the learning
outcomes outlined by the syllabus (Department of Education and Skills, 2010). These
include the use of ICT to enable greater exploration of mathematical ideas within the
classroom. Teachers have also been encouraged to engage in class discussion through
the brainstorming of mathematical problems and to consider alternative solutions to
similar questions. Similar to the pilot schools, an extensive programme of in-service
workshops encouraging different approaches to teaching and learning has been made
available to mathematics teachers.
A number of reports have been published in relation to Project Maths and its impact.
The NCCA (2012b) in its response to the debate on Project Maths notes that textbooks
have traditionally supported practising routine questions with solutions based on
illustrative examples. The report calls for more emphasis to be given to students
engaging in problem-solving approaches and justifying or explaining their solutions
(NCCA, 2012b, p. 18). It does not make explicit reference to how textbooks can be used
to support this; however it concludes that teachers in the initial schools reported that
their classroom practice now relies less heavily on the textbook as the sole teaching
resource. The implication is that teachers should use the textbook less in the Project
Maths classroom.
The NCCA also commissioned two reports (interim and final) (Jeffes, Jones, Cunningham,
Dawson, Cooper, Straw, Sturman and O’Kane, 2012; Jeffes, Jones, Wilson, Lamont,
Straw, Wheater and Dawson, 2013) exploring the impact of Project Maths on student
learning and achievement in the initial pilot schools (called phase one in this report) that
introduced the syllabus in 2008 and the remaining schools in the country (called non-
phase one schools) that introduced it in 2010. As the revised mathematics syllabuses
were introduced incrementally in schools, a cohort of phase one Junior Certificate
students in 2010 had studied Strands 1-4 of the revised mathematics syllabus, while the
same cohort of students in non-phase one schools had followed the previous
mathematics syllabus introduced in 2000. The latter group was therefore included as a
comparison group for this research. Similarly, Leaving Certificate students in phase one
schools had studied all five strands of the revised mathematics syllabus, while students

14
in non-phase one schools had followed revised syllabuses for Strands 1 and 2 only.
Research was carried out into students’ performance on different mathematical topics
using assessment booklets, and attitude surveys were conducted to gain insight into
how students felt about mathematics.
Key findings of the first (interim) report (Jeffes et al., 2012) show that students following
the revised syllabus were performing well in many aspects of the Project Maths syllabus,
and there were many parallels between students’ achievement and their attitudes. It
was suggested that phase one students were more reflective about their experiences of
learning mathematics, and were now more able to identify their own areas of strengths
and weaknesses. The research presented in the interim report did not identify any real
differences between the skills of students following the Project Maths syllabus and
those following the previous syllabus, but students following the Project Maths
syllabuses reported that they were regularly engaging with a broader range of teaching
techniques and experiences than their counterparts following the older curriculum. Such
activities included: the application of mathematics to real-life situations; making
connections and links between mathematics topics; using mathematical language and
verbal reasoning to convey ideas; and planning and conducting investigations. The
interim report (Jeffes et al., 2012, p. 132) found that both Junior Certificate and Leaving
Certificate students following the new curriculum were performing particularly well in
relation to Strand 1 (Statistics and Probability), for example, which was accompanied by
a high degree of confidence reported in relation to this strand. Students who had
followed the revised syllabus appeared to find Strand 4 (Algebra) more difficult and this
was identified as an area in which students lack confidence.
The final report (Jeffes et al., 2013, p. 5) found that schools having greater experience of
teaching the revised syllabuses did not appear to be associated with any improvement in
students’ achievement and confidence. Achievement was highest in Strand 1 (Statistics
and Probability) and lowest in Strand 5 (Functions), confidence was highest in both of
these strands and lowest in Strand 3 (Number) and Strand 4 (Algebra) for all schools
(both phase one and non-phase one). It was observed that confidence in mathematics
did not always correspond to achievement. Although students who participated in the

15
research towards the end of the academic year performed better than those tested at
the start of the school year, higher levels of confidence were not associated with
students who had almost completed their Leaving Certificate studies.
One of the main findings of the second (final) report (Jeffes et al., 2013, p. 3) is that
while students are frequently undertaking activities like applying mathematics to real-
life situations and making connections between topics as described in the interim
report, more traditional approaches like using textbooks and copying from the
whiteboard continue to be widespread. The report notes that while some processes of
the revised mathematics syllabuses are visible in the work reviewed, there does not
appear to have been a substantial change in what teachers are asking students to do,
and it recorded few differences between the phase one and non-phase one students. It
is suggested that teachers were, at that time, emphasising the content of the revised
syllabuses rather than the processes promoted within it. The research suggests that
students are building up mastery of mathematical procedures and, to a slightly lesser
extent, are problem-solving and making mathematical representations. However, there
is very little evidence in the work reviewed that students are engaging in reasoning and
proof, communicating mathematically, or making connections between mathematics
topics. It would appear that the students’ reports on their experience do not necessarily
match what was observed in the students’ actual work. The report suggests that
students need to be regularly given high quality tasks that require them to engage with
the processes promoted by Project Maths, including: problem-solving; drawing out
connections between mathematics topics; communicating more effectively in written
form; and justifying and providing evidence for their answers.
Research on Project Maths has not been confined to the experience of students; the
opinions of teachers have also been sought. Questionnaires were given to mathematics
teachers and mathematics department co-ordinators in Ireland as part of PISA 2012
(Cosgrove, Perkins, Shiel, Fish and McGuinness, 2012). This survey aimed to obtain
empirical and qualitative information on the views of a nationally representative sample
of teachers on the implementation of Project Maths, and to compare this information
across teachers in pilot schools and non-pilot schools. Close to half of the teachers

16
(47.5%) indicated that they did not know if Project Maths was having a positive impact
at junior cycle. One interpretation of this is that it is still too early in the implementation
of the syllabus for teachers to have formed an opinion. Overall teachers at this level
indicated a high level of confidence in teaching aspects of the Project Maths syllabus.
However they also identified a number of challenges: time pressures (time to become
familiar with coursework, to prepare classes, for group work and investigations); the
staggered implementation of Project Maths; and the literacy demands of the new
courses. Teachers expressed the opinion that there had been positive changes in a
number of aspects in students’ learning, in particular, their understanding of key
concepts in probability and statistics and, in geometry and trigonometry. It was also
reported that teachers felt that students have improved in their ability to solve real-life
problems and their ability to work collaboratively with one another.
In 2013, the NCCA made contact with the two post primary teacher unions (the
Association of Secondary Teachers, Ireland and Teachers Union of Ireland), the Irish
Mathematics Teachers’ Association (IMTA) and the Project Maths Development Team
(PMDT) with a view to establishing a group to engage in discussions around the new
syllabus and how teachers could be supported in its implementation. To this end, a
Maths in Practice group was convened, comprising nominees from these organisations
as well as representation from the Department of Education and Science and the State
Examinations Commission. A series of meetings were held between September 2013
and January 2014, culminating in the publication of a report (NCCA, 2014). This
document contains a number of recommendations, in particular that the Leaving
Certificate syllabus should be reviewed following its complete implementation and the
final syllabus revisions that were introduced. It was noted that teachers were still in
need of support with the development and use of tasks that involve working with
connections between topics. (NCCA, 2014) It also called for the exploration of design-
based research, whereby teachers would design and enact interventions in the
classroom, as a focus of continuing professional development for mathematics teachers
in Ireland. It suggested that such research would not only be beneficial to individual
teachers but would also contribute to improving mathematics pedagogy in a wider
sense. The NCCA promised that recommendations of the report would also be taken into

17
account when considering the new mathematics curriculum specification for junior
cycle, which is due to be published in 2017 and introduced to schools in 2018.
The IMTA produced a policy document in 2013 that outlined problems experienced by
teachers implementing the revised syllabuses and suggested possible solutions. Under
the heading of resources, the IMTA (2013, p. 7) reported that teachers are still quite
dependent on textbooks, and that these are used as a means to interpret the syllabi. A
key problem identified with the textbooks was that the examples often provided proved
to be poor or there was an insufficient quantity provided. The report also suggested
that the textbook tasks had poor gradation, with the level of challenge progressing from
easy to very demanding while neglecting moderately difficult tasks. It also called for
more guidance from the NCCA to be given to publishers and textbook authors when
preparing the textbooks.
A Chief Examiner’s Report (SEC, 2016) in Leaving Certificate mathematics was published
in 2016, the first of its kind published after the introduction of the Project Maths
syllabus. It reviewed candidates’ performance in the 2015 examinations and set itself
the goal of identifying strengths and challenges in order to provide guidance for teachers
and students in the future (SEC, 2016). It found that at Higher Level, the numbers
achieving a grade C or below has shown a marked increase when compared with
examinations before the introduction of the Project Maths curriculum and for Ordinary
Level, the proportion of students securing a grade B or above has declined. Those that
might have studied Ordinary Level in the old syllabus are now staying at Higher Level
instead (SEC, 2016). It also noted that the syllabus expectations are more ambitious than
previously and are not always easy to achieve; the authors commented that there has
been a deliberate attempt to emphasise higher order thinking skills but acknowledged
that this presents difficulties for both students and teachers alike (SEC, 2016, p. 8). The
report recommended that students should become more familiar with describing,
explaining, justifying and providing examples. It noted that these skills assist with
improving understanding (SEC, 2016, p. 9). It also cautioned that teachers need to
provide students with the opportunity to develop strategies for working with unfamiliar
problems (SEC, 2016, p. 30). Teachers were also reminded to encourage students to

18
practise solving problems involving real-life applications of mathematics. As part of this
process, students should be asked to model these situations by constructing algebraic
expressions or equations and/or representing them differently by drawing diagrams
(SEC, 2016, p. 30).
Lubienski (2011, p. 46) noted that the absence of a textbook specifically designed for the
new syllabus was problematic at the introduction of the new syllabus as it was very time
consuming for teachers to plan lessons. Also students were having difficulty keeping the
amount of paperwork organised due to the teachers’ dependency on the use of
photocopied material to substitute for the lack of a textbook. The publishers of
mathematics textbooks have gradually produced new texts in response to the changed
needs of the classroom. However, it has also been reported that teachers are not fully
satisfied with the textbooks that have been produced, 45.3% of teachers surveyed in a
study on schools that participated in the Programme for International Student
Assessment (PISA) 2012 felt that the textbooks produced did not support the approach
required by the curriculum appropriately (Cosgrove et al., 2012, p. 49). In addition, it
was found that 31.6% of teachers in this cohort feel that the content and range of
textbooks available are a major challenge. The teachers complained that there was no
textbook available for students studying at Foundation Level and that the content did
not satisfactorily address what was needed for students following the Junior Certificate
Higher Level course. Cosgrove et al. (2012) also state that some teachers in their study
felt that the style of the material covered by the new textbooks differed to what was
covered during the professional development workshops for Project Maths. But, despite
the changes, value was still being placed on the textbook by students with teachers in
the pilot schools feeling pressurised to use the textbooks in the classroom (NCCA, 2012a,
p. 8).
The Educational Research Centre (ERC) produced a report in 2016, intended for teachers
of mathematics in post-primary schools, focussing on the PISA 2012 outcomes for
students in Ireland and their implications for teaching and learning (Perkins and Shiel,
2016). In the outcomes from PISA 2012, students in Ireland were found to have
performed significantly better than their OECD peers, although Ireland’s average

19
performance has not changed considerably since 2003. Instead, there has been a
decrease in the OECD average between 2003 and 2012, leaving Ireland ranked 13th of
the 34 OECD countries that participated. It must be noted that many of the Irish
students participating in the PISA 2012 assessment had not yet encountered the Project
Maths curriculum due to its phased implementation. Aside from the initial schools,
those sitting the Junior Certificate mathematics examination in 2012 had not been
exposed to Project Maths material. The report noted that there are several themes that
have emerged from the PISA 2012 mathematics findings that are particularly important
for improving performance for students in Ireland: 1) the relatively poor performance of
girls, 2) high levels of mathematics anxiety among students, 3) addressing the needs of
lower performing students, 4) the relative underperformance of higher-achieving
students, 5) opportunity to learn mathematics and 6) the use of Information and
Communication Technologies (ICTs) in the teaching and learning of mathematics.
A number of recommendations and practical suggestions are contained in the report.
These include encouraging higher achieving girls, to engage with more demanding and
complex tasks and to explore problem-solving in novel ways (Perkins and Shiel, 2016, p.
4). To support students, it is suggested that teachers could raise ‘students’ cognitive
engagement in mathematics by 1) allowing students to decide on their own procedures
when solving problems, 2) assigning problems that can be solved in different ways, 3)
presenting problems in different contexts, 4) giving problems with no immediate
solution, and 5) asking students to explain how they solved a problem’ (Perkins and
Shiel, 2016, p. 8). For lower-achieving students, it is recommended that more
opportunities would be presented to solve more complex problems so that they can
develop flexibility in applying what they have learned. Strategies suggested to assist
higher-achieving students include providing opportunities to engage with problems in
novel contexts and to explore different solutions to problems, including through the use
of technology. This would ensure that, where students are assigned procedural
mathematical tasks, they fully understand the underlying concepts. Students are also
encouraged to reflect on problems, asking them to explain their answers, and
supporting them in learning from their mistakes (Perkins and Shiel, 2016, p. 12).

20
The OECD produced a broader report to offer advice to teachers in relation to the
findings from PISA 2012 and strategies for teaching and learning. It found that Ireland
ranked 2nd out of 65 participating countries in relation to the reliance on memorisation
strategies for learning mathematics, this assessment was based on students’ self-
reports. The use of memorisation is cautioned against as students dependent on
committing material to memory are less likely to solve more challenging problems
(OECD, 2016). In relation to the most difficult question on the 2012 PISA examination,
students who were identified as being the most reliant on memorisation when studying
mathematics were found to be four times less likely to solve this problem correctly than
the cohort of students who reported using memorisation the least (OECD, 2016, p. 38).
The report recommends that teachers should encourage students to think more deeply
about what has been learned and encourage the establishment of connections with real-
world problems (OECD, 2016, p. 38).
2.2 Role of the Textbook
Textbooks are widely accepted as a commonly used resource in mathematical
classrooms. According to Jones, Fujita, Clarke and Lu (2008, p. 142) over 60 per cent of
teachers, on average, internationally, identify the use of a textbook as the primary basis
of their lessons-with a further 30 per cent or more using a textbook as a supplementary
resource. Robitaille and Travers (1992, p. 706) suggest that the dependency on
textbooks is more characteristic of mathematics teaching than any other subject.
Historically, there has not been a lot of research carried out on the nature of post
primary mathematics textbooks in Ireland (Conway and Sloane, 2005). However, there is
some evidence that textbooks play an important role in Irish classrooms. Even in early-
childhood mathematics classrooms, it was found that teachers use the textbook for
guidance and giving structure to the programme of work (Dunphy, 2009, p. 118).
Harbison (2009, p. 131) points out that textbooks have a role in proposing potential
pathways for navigating through the strands of the primary Mathematics curriculum);
and O’Keeffe and O’Donoghue (2009) found that over 75 per cent of Irish second level
mathematics teachers use a textbook on a daily basis. It has also been reported that a
lot of the time in the classroom appears to be related to the use of a textbook and very
often it is the only resource which students have access to during the lesson aside from

21
the teacher, with most of the problems assigned for classwork and homework coming
from the textbook (Project Maths, 2017).
However, Moffet (2009, p. 265) acknowledges that different textbooks lend themselves
to varying types of instruction and these ultimately result in differing learning outcomes.
The latter may explain why the use of textbooks can prove to be problematic. Fan and
Kaeley (2000) conducted a study investigating the influence of textbooks on teaching
strategies. Their findings show that textbooks can impact not only on the content of
teachers’ lessons but also how teachers actually teach. They concluded that it would be
difficult to reform teachers’ teaching methods without corresponding reform of the
textbooks being used due to the important role that textbooks play in affecting teaching
strategies. Indeed, Valverde, Bianchi, Wolfe, Schmidt and Houang (2002, p. 2) have
suggested that textbooks act as mediators between the teacher in the classroom and
those who design curriculum policy. Howson (1995) suggests that textbooks are closer
to the reality of the classroom than a national curriculum. As the textbook remains as a
popular resource with teachers in Irish classrooms, it is important to see what kind of
teaching and learning is promoted through the use of particular textbooks. As well as
revising the curriculum, the Project Maths Development Team (Project Maths, 2017) has
cautioned teachers in their choice of textbook: the PMDT points out that there is no
single textbook which can suit the learning needs of all students and it has advised
schools, when choosing a textbook, to take into accounts the abilities, needs and
interests of their students, as well as the quality of the book. It had been noted, before
the implementation of Project Maths, that mathematics textbooks in the Irish system
promoted retention and practice as opposed to active learning (O’Keeffe and
O’Donoghue, 2009, p.290).
Similarly classroom inspections in Ireland, before the introduction of Project Maths,
have shown that teaching was highly dependent on the class textbook which had a
tendency to reinforce this drill and practice style (NCCA, 2006). Ireland was not unique in
this, and similar inspections in Swedish lower secondary schools found that the teaching
of mathematics relied on the use of textbooks more than was the case for any other
subject (Johansson, 2006). Johansson (2006) also reported that, in her study of Swedish
22
classrooms, students were working individually with textbook tasks for more than half of
each lesson observed, and the students’ homework was also assigned from the
textbook. Swedish teachers in the study were also found to take examples and
definitions directly from the textbook. Viholainen, Partanen, Piiroinen, Asikainen and
Hirvonen (2015) indicated that textbooks are used by teachers as mediators of the
curriculum in upper secondary mathematics in the Finnish classrooms that they
observed. The teachers involved in their study tended to use the textbook as the main
source in planning their teaching. Teachers reported strong confidence in the
pedagogical solutions offered by the textbooks, particularly the selection of content, the
order of topics and exercises. Students viewed the textbook primarily as a source of
exercises. (Viholainen et al., 2015, p. 174). Lepik (2015), when surveying Estonian
teachers, found that textbooks exerted a strong influence on the content that is taught
and learned. However, the teachers claimed that their teaching approaches were not
driven by the instructional approaches of the textbook; rather they reported using the
textbook only as a source of exercises within the classroom.
2.3 Textbook Studies in Ireland
Up until recently there has not been a lot of research conducted on mathematics
textbooks in Ireland, especially at post-primary level. This situation has now changed
with the introduction of Project Maths. This section will further consider the work that
has been carried out on textbook analysis involving Irish mathematics textbooks at both
primary and post-primary level.
Dunphy (2009) looked at how successful it was to teach mathematics for understanding
to lower primary school students in Ireland by relying on textbooks as the main method
of pedagogy. Her evidence of the use of mathematics textbooks was obtained from
questionnaires about practice, completed by 48 classroom teachers across four class
levels in primary school. The research showed that textbooks were used by these
teachers in the lower primary years as one of the main resources in teaching the
curriculum. Teachers in her study perceived textbooks as a means of consolidating and
extending learning. They also used them to structure the programme of learning and as
an aide to classroom management. Dunphy advises that future textbooks should have

23
more meaningful tasks; this would help the motivation of students as they would view
the tasks as relevant and worthwhile.
Studying textbooks used in different countries can reveal similarities and differences in
the teaching and learning of mathematics. Such analyses can reveal differences in the
performance expected of students in different countries, the extent to which a selected
textbook series from a country prioritizes conceptual understanding or procedural
fluency, and how the treatment of the mathematical content differs among certain
countries. Charalambous, Delaney, Hsu and Mesa, (2010) report on a comparison of the
treatment of addition and subtraction of fractions in primary mathematics textbooks
used in Cyprus, Ireland, and Taiwan. Their research looks at what similarities and
differences can be seen in the presentation of addition and subtraction of fractions in
primary mathematics textbooks in these three countries. It also examines what
expectations of student performance on these topics are embedded in the primary
textbook tasks on this topic. When considering what was required of students, they
focussed on the potential cognitive demands of textbook tasks and the type of response
asked for using the Levels of Cognitive Demand framework. Their textbook analysis
drew heavily on the work of the QUASAR (Quantitative Understanding: Amplifying
Student Attainment and Reasoning) project team as outlined in Smith and Stein (1998).
Each of the tasks was classified into one of the four levels of cognitive demand (LCD):
lower level demands of memorization and procedures without connections to meaning,
and higher level demands of procedures with connections to meaning and doing
mathematics. This framework will be examined in more detail later in chapter 3.
In their analysis, they looked at one textbook from Cyprus, two textbooks from Ireland
and two textbooks from Taiwan. It was found that tasks in both Irish textbooks appeared
to be organized on a continuum, from tasks with lower demands at the start of a section
to tasks with higher demands at the end, whereas in the Cypriot and Taiwanese
textbooks tasks of lower and higher demands were interspersed throughout the
relevant sections. They found that more than 85% of tasks in the Cypriot and the Irish
textbooks represented low cognitive demand (procedures without connections to
meaning), while they classified 71% of the tasks in the first Taiwanese textbook and 81%

24
in the second Taiwanese textbook as having high cognitive demands (procedures with
connections to meaning or doing mathematics).
Only one textbook out of the five analysed, a Taiwanese textbook, had tasks that
required students to explain their solutions. Tasks in the Irish and Cypriot textbooks
required students to simply supply the answer. Both Taiwanese textbooks placed a
higher expectation on students than the other textbooks, specifically requesting the
writing of a mathematical sentence as part of the solution to a problem. The authors
point out that writing such sentences or providing explanations is important for helping
students clarify their thinking and solution processes.
O’Keeffe and O’Donoghue (2009) looked at the effect of the textbook content structure
on student comprehension and motivation. Eight Irish textbooks, two each from four
different textbook series, used at junior cycle were looked at in total for the study. In
order to analyse the effectiveness of these textbooks for pupil motivation and
comprehension, the Rivers Matrix was applied. This framework looks at a number of
factors: motivational factors historical notes, scientist and mathematician biographies,
career information, applications and photographs; comprehension cues colour and
graphics; technical aids inclusion of material related to calculators and computers;
philosophical position emphasis and predominant philosophy. The TIMSS framework
outlined earlier in section 1.3 was also used as a framework for the analysis of these
textbooks.
The presence of historical notes, biographies, career information and photographs was
found to be almost non-existent across most of the textbooks. The percentage of tasks
which were viewed as problems, where a problem was defined as a situation where a
direct route to a desired goal is blocked (O’Keeffe and O’Donoghue, 2009, p. 285) was
particularly low in each case. The use of attractive colours, which is important for
student comprehension, was found to be limited throughout all the textbooks. Concern
was expressed about the low number of graphics employed to assist with the
visualisation of real-life problems and the lack of real-life graphics throughout the
textbooks. The use of technical aids was not evident in any of the textbook series

25
analysed. It was noted that all the textbooks highlighted retention and practice, with
little focus on active learning. It is pointed out that none of the textbooks fostered an
environment of understanding. All the textbooks were found to have an emphasis on
proficiency and logic. This means that the books focussed on students being able to
complete a number of questions. Thus understanding was not given the same
importance as procedure and method in each of these textbooks.
According to this study’s findings, the most popular textbook series being used by
teachers at the time for teaching and planning was not the most beneficial available to
aid learning. The authors advocated a need for standards and/or a checklist for
textbooks in order to enhance learning at junior cycle. At the time of this study it was
noted that the failure of textbooks to include motivational material and comprehension
cues highlighted a need for improved textbooks. Further research of this kind was called
for in the hopes of developing standards in mathematics textbook design at junior cycle
which would lead to better teaching and learning resources, and would contribute to an
increase in the uptake of Higher Level Mathematics at junior cycle.
In 2011, O’Keeffe and O’Donoghue (2012) conducted a larger study of the textbooks
published in response to Project Maths that were available at the time (ten in all). The
TIMSS mathematics curriculum framework, was used and adapted for this analysis. The
Third International Mathematical and Science Study (TIMSS) was a cross-national survey
of student achievement in mathematics and science in which forty-five countries took
part. Valverde et al. (2002) reported on the TIMSS study which analysed six hundred and
thirty science and mathematics textbooks. It remains one of the only studies to examine
the textbook as a whole, even considering the number of pages in each textbook. The
conceptual framework for TIMSS focussed on curriculum as a broad explanatory factor
underlying student achievement (Beaton, Martin and Mullis, 1997), considering three
parts in its model, namely intended curriculum, implemented curriculum and attained
curriculum. For TIMSS the textbook was viewed as the potential implemented
curriculum.

26
The study found that all textbooks analysed fell short of the standard needed to support
the Project Maths (intended) curriculum effectively, as outlined in the Project Maths
Syllabus documents for junior cycle (including the Common Introductory Course (CIC)),
and senior cycle. However, the study acknowledged that some of the new textbooks are
better aligned to Project Maths expectations than others. The individual profiles of
textbooks as developed in this study demonstrate different strengths and weaknesses.
Topic omissions were observed even though the Project Maths syllabus treats all topics
as compulsory. One example given was ‘Exponents, Roots and Radicals’ which was
excluded from one textbook’s treatment of strand 2. Project Maths expectations in
relation to teaching for understanding, problem-solving, using real life applications, and
integration of ICT were found to be addressed to varying degrees within the textbooks.
Some textbooks showed greater consideration for teaching for understanding in terms
of narration and related narration; while no one textbook series was found to address
problem-solving satisfactorily. The conclusion of the analysis was that the textbooks
display a genuine attempt to match Project Maths expectations but no one textbook
meets all the Project Maths expectations.
It is clear that the most significant finding of the report is the mismatch between the
textbook expectations and the Project Maths expectations. The report recommends that
an exemplar textbook series for Project Maths should be produced by a specially
selected writing team appointed and funded by the Department of Education and
Science. All commercially produced textbooks for Project Maths should then be
reviewed against this exemplar textbook series. Such a review procedure would lead to
a list of mathematics textbooks for Project Maths approved by the DoES.
Davis (2013) examined the prevalence of reasoning-and-proving in the topic of complex
numbers in six Irish textbooks and one teaching and learning plan produced for teachers
during the introduction of Project Maths. His study uses a framework consisting of five
main components: namely pattern identification, conjecture development, argument
construction, technological tools, and reasoning-and-proving objects. Only 1.4% of tasks
in Ordinary Level textbooks and 1.3% of tasks in Higher Level textbooks involved pattern
identification or conjecture development. There were no opportunities to test

27
conjectures, construct counterexamples or develop proof subcomponents in any of the
materials examined. The results from Davis’ study suggest that the six textbook units do
not align with the Project Maths syllabus (Davis, 2013, p. 54). The Project Maths Leaving
Certificate syllabus requires students to explore patterns and formulate conjectures,
explain findings, and justify conclusions. However, it would appear that the textbooks
are not meeting this aspect of the Project Maths syllabus and it will fall to the teacher to
supplement this shortfall with suitable activities.
2.4 Importance of Tasks and a Wise Choice of Tasks
This section outlines the importance of tasks and how classifying tasks can highlight their
role in the teaching and learning of mathematics. There are many different definitions of
problems and exercises. For this study, a task is considered to be an activity where a
student interacts with a mathematical topic by attempting to solve a textbook exercise
or problem either as homework or within the classroom. An exercise is treated as
something that can be solved using a familiar method and a problem involves the finding
of a solution where the solution method is not immediately obvious. Mason and
Johnston-Wilder (2006, p. 4) define a task to be what learners are asked to do in the
mathematics classroom. Mathematics classroom instruction is generally organised
around and delivered through students’ activities on mathematical tasks (Doyle, 1988, p.
168). In all of the seven countries that participated in the TIMSS 1999 Video Study,
eighth-grade mathematics was most commonly taught by spending at least 80% of
lesson time in mathematics classrooms working on mathematical tasks (Hiebert,
Gallimore, Garnier, Givvin, Hollingsworth, Jacobs, Chui, Wearne, Smith, Kersting,
Manaster, Tseng, Etterbeek, Manaster, Gonzales and Stigler, 2003, p. 42). Doyle (1983,
p. 161) makes the case that what students learn is largely defined by the tasks they are
given. He believes that tasks specify ways of processing information and influence
learners by directing their attention to particular aspects of content. Sullivan, Clarke and
Clarke (2012, p. 14) give great importance to mathematical tasks by saying that
mathematical thinking stems from students’ engagement with problem like tasks as
opposed to following a series of detailed instructions from the teacher.

28
Henningsen and Stein (1997, p. 525) point out that tasks by their nature have the
potential to influence and structure the way students think and this can either limit or
broaden their views on the subject matter being studied. Shimizu, Kaur, Huang and
Clarke (2010, p. 1) describe the role of mathematical tasks as being an important aspect
of study when attempting to understand teaching and learning for those researching
classroom practices. Marx and Walsh (1988, p. 208) also affirm the advantages of
analysing tasks due to their link between teaching and learning. Teachers choose the
tasks that they will use in the classroom with specific learning objectives in mind.
Through the use of different pedagogical methods the same task can be used to achieve
different learning outcomes (Marx and Walsh, 1988, p. 211). It is not possible to
determine exactly how a teacher will use a task from its structure alone. However Marx
and Walsh believe that it is important that tasks should be of a sufficiently high quality
so as to allow teachers to achieve their desired learning objectives when the tasks are
given to students. If the tasks are too narrow in their scope, then teachers, seeking to
enrich their students’ mathematical experience, will have to augment them or look
elsewhere to meet the needs of their classroom (Marx and Walsh, 1988, p. 211).
There is evidence to suggest that tasks convey information to students on the nature of
the subject of mathematics. Examples and selected tasks influence how students
ultimately perceive and use mathematics (Anthony and Walshaw, 2009, p. 155). Through
engagement with tasks, students not only gain mathematical competence but also
develop ideas about the nature of mathematics. By working with tasks, students get an
opportunity to develop their own mathematical interests (Hodge, Zhao, Visnovska and
Cobb, 2007). Henningsen and Stein (1997) argue that effective teachers carefully choose
tasks so that all students are given assistance in making progress with their cumulative
understanding in a mathematical topic and are also encouraged to engage in high-level
mathematical thinking.
Several frameworks have been suggested to examine tasks in relation to their use in the
classroom as well as the implementation of the curriculum. Cohen et al. (2003)
developed a framework which places teachers, students and content as three elements
situated at the vertices of a triangle where each element interacts with the others and

29
the environments (including parents, textbook publishers, examination bodies and state
agencies) in which they are immersed. Herbst (2008, p. 125) views the tasks in the
mathematics classroom as common ground that links each of the vertices of the
instructional triangle. In terms of content, the task is a representation of mathematical
ideas. For the students, the task is an opportunity to learn more or to think differently.
The teacher manages the task as a representation of the content to be learned and the
teacher is also responsible for using the task as an opportunity for students to study and
learn mathematics. Each element in the instructional triangle is important as is the
relationship and interplay between them; the task is at the centre of the activity that
permeates these relationships and is worthy of study when considering the quality of
instruction.
Pepin, Xu, Trouche and Wang (2016) examined the resource systems, including tasks, of
three Chinese mathematics ‘expert’ teachers. This was completed using the
Documentational Approach to Didactics, which is a framework that acknowledges the
important and central role of resources for the work of teachers. Teachers’ resources
are defined as the curriculum/textbook and personal resources that teachers make use
of as part of their teaching routine, as well as the material used when preparing for
teaching in the classroom. Pepin et al. (2016, p. 15) describe the influence of resources
on teachers’ instructional practice and identity as crucial. They argue that viewing
resources as a lens enables the researcher to examine mathematics teaching expertise
and to identify different aspects of such expertise by examining the link between
teaching and the materials that teachers interact with on a daily basis (Pepin et al., 2016,
p. 16).
Jones and Pepin (2016, p. 106) point out that teachers’ selection of tasks are very often
linked to their perceptions of teaching and learning. They believe that tasks are often
interpreted as influencing or even determining the kind of opportunities afforded to
students for learning. Haggarty and Pepin (2002) examined mathematics textbooks in
England, France and Germany and observed how a small sample of teachers from each
country used the textbooks to teach the concept of ‘angle’. They also interviewed the
teachers in relation to their use of tasks. It was found that the students were offered

30
very different learning opportunities which were influenced by both the teacher and
textbooks and the culture in which they were situated. They suggest that not only tasks
but also their use shaped what students could learn and how they could access and use
mathematical content.
Remillard (1996, 1999) identified three arenas of curriculum development activity that
teachers engaged in through a study of two fourth-grade teachers’ use of a textbook
published after curriculum reform. The term ‘curriculum development’ originated from
Ben-Peretz’s (1990) description of the role of the teacher in interpreting and adapting
resources for use in the classroom. Remillard (1999, p. 328) refers to the design,
construction and mapping arenas. The design arena involves selecting and designing
mathematical tasks, the construction arena involves enacting these tasks in the
classroom and responding to students’ interactions with such tasks. In the study, it was
found that no matter how teachers selected tasks from the textbook, teachers would
make improvised adaptations to tasks in response to students’ interactions with the
tasks. This is described as adapting and adjusting tasks, in an unrehearsed manner, so as
to facilitate students’ work with these tasks (Remillard, 1999, p. 328). The final arena,
mapping, involves making decisions and/or choices that ultimately determine the
content of the mathematics curriculum for the academic year.
Remillard (2005) offers a framework for characterising and studying teachers’
interactions with curriculum materials, specifically resources and guides. Gehrke, Knapp
and Sirotnik (1992) is used by Remillard (2005) to distinguish between the ‘formal
curriculum’, ‘intended curriculum’ and ‘enacted curriculum’. The formal curriculum
referring to the goals and activities espoused by national policies, school policies or
formulated in textbooks. The intended curriculum makes reference to teachers’ aims
while the enacted curriculum describes what actually takes place in the classroom. The
framework of Gehrke et. al (1992) uses terminology differently from that found in many
other publications, notably ones for cross-national studies such as TIMSS. For TIMSS, the
‘intended curriculum’ is that prescribed by the state, while that taking place at
classroom level is called the ‘implemented curriculum’. The U.S.A. does not have a
national intended curriculum and this had led to different usages of these terms when
considering the American context. Remillard (2005, p. 238) provides a new framework

31
that adds another dimension when considering the implementation of the curriculum
referred to as the ‘planned curriculum’. In effect it suggests that the curriculum enacted
is the result of the interactions between the teacher and the curriculum. It is different
from the intended curriculum as it goes beyond just the aims for instruction held by the
teacher. The framework acknowledges that the planned curriculum can shape what the
teacher seeks and draws on when interacting with resources. The enacted curriculum
then results from how these plans manifest in certain contexts with students Using this
framework, Remillard (2005, p. 239) cautions that the process involving the use of a
mathematics curriculum guide is both dynamic and complex, affected by teachers’
beliefs, knowledge and dispositions. She also points out that the decision to adopt a
single curriculum does not necessarily result in uniform mathematics instruction.
Tasks that require different cognitive processes are likely to induce different kinds of
learning. Ainley, Pratt and Hansen (2006) suggest that by providing tasks and learning
experiences that allow students to think, in an original fashion, about mathematical
concepts and relationships, teachers help learners to develop efficient ways of learning
about mathematics. Watson and De Geest (2005) caution that tasks should involve more
than practicing taught algorithms. Effective tasks should provide opportunities for
students to question their reasoning activity and to struggle with mathematical ideas.
Posing tasks with a high level of mathematical challenge enables students to employ an
increasingly sophisticated range of mathematical thinking. Jonsson, Kulaksiz and Lithner
(2016) point out that practising tasks requiring creative reasoning is superior to
practising those necessitating algorithmic reasoning in terms of later memory retrieval.
Results from Stein and Lane (1996) suggest the importance of incorporating high-level,
complex tasks if teachers wish to promote students’ capacity to think, reason and
problem solve. Their research found that the greatest improvement on performance
assessments were recorded when students had been exposed to instructional tasks that
involved students ‘doing mathematics’ or using ‘procedures with connections to
meaning’ as opposed to more traditional tasks. In particular, students’ performance
gains were greater when tasks were set up to encourage the use of explanations,
multiple solution strategies and different types of representation.

32
Hiebert and Wearne (1993) analysed teaching approaches and tasks in six classrooms.
Four of the teachers used a conventional approach dependent mainly on the solving of
routine exercises and rarely employing problem situations; two teachers used fewer
tasks but explored them at a greater depth allowing for more exploration and
discussion. It was found that students in the classrooms using the alternative approach
fared better than those taught in the conventional classrooms when given mathematical
assessments. They concluded that tasks designed to encourage higher-order thinking are
more likely to foster such thinking rather than tasks that promote the practice of skills.
Xin (2007) conducted a study to examine the learning opportunities for problem-solving
provided in 1 U.S. and 1 Chinese mathematics textbook series. It found that there was
an unbalanced word problem distribution in the U.S. textbook in comparison to the
Chinese one and this resulted in the American students being able to solve certain word
problems more easily than the Chinese due to the textbook coverage. Guven, Aydin-Guc
and Ozmen (2016) conducted a study to examine the relationship between the tasks
that teachers preferred to use in mathematics lessons and student achievement when
solving different types of tasks. Nine mathematics teachers were interviewed, and
corresponding tasks were prepared and administered to 225 eighth-grade students. It
was found that teachers preferred tasks that matched the goals of the curriculum and
were routine in nature. Students were found to be more successful with solving tasks
that involve missing data in contrast to tasks with irrelevant data, tasks that are visual
and do not require the use of different strategies. They were found to be less successful
with tasks that require the use of different strategies. It was found that the type of tasks
at which students were successful and which teachers preferred were related. From
these studies, it would appear that tasks can impact on teaching and affect the learning
opportunities offered to students.
2.5 International Studies on Textbook Tasks
As seen in section 2.2, it has been reported that textbook tasks can influence teachers’
pedagogy and can either encourage or discourage the use of different teaching
strategies. A number of studies analysing mathematics textbooks in different ways have
taken place internationally. For instance, as will be seen in this section, attention has

33
been given to the cognitive skills that textbook tasks require. Similarly, work has been
completed on the type of reasoning that is necessary for solving textbook tasks.
Researchers have investigated the relationship between textbooks and the curriculum,
investigating if the textbook actually reflects the intended curriculum. Work has also
been completed on the mathematical topics covered in textbooks and how well tasks
promote its learning. This section will look at some key international textbook studies in
each of these areas.
Jones and Tarr (2007) looked at the cognitive level of tasks in a number of American
middle grade textbooks. They looked at twelve textbook series which were published
over a fifty year period. Their analysis made use of the LCD framework mentioned
earlier. The findings of Jones and Tarr suggested the majority of tasks over the fifty year
span required a low level of cognitive demand, in particular involving procedures
without connections to meaning. Just one textbook series proved to be an exception
where the majority of its tasks required a high level of cognitive demand. They found
that there were a greater number of tasks, but not necessarily a greater percentage of
tasks, that required higher levels of cognitive demand in the more recently published
textbooks. The analysis revealed a greater percentage of tasks requiring a high level of
cognitive demand in the 1970s than those published between 1994 and 2004 (Jones and
Tarr, 2007, p. 18).
Bayazit (2013) analysed three Turkish elementary school textbooks in relation to the
quality of tasks promoting students’ proportional reasoning. Some of the tasks were
classroom activities while others were intended as homework. The analysis was carried
out at both a macro and micro level and included examining the level of cognitive
demand of the tasks. Like Jones and Tarr (2007) above, the analysis was based on the
level of cognitive demand that textbooks tasks present using the four categories of
memorization, procedures without connections to meaning, procedures with
connections to meaning and doing mathematics. It was found that the majority of tasks
(75%) had a high level of cognitive demand (LCD) and most of the tasks were presented
in multiple representations and made use of non-mathematical contexts.

34
Kim (2014) conducted a study in order to examine how Korean post primary textbooks
support students’ mathematical thinking and learning. For the analysis, the topics of
functions and geometry were selected from 5 textbooks aimed at grades 7-9 and the
entire contents from 2 textbooks used for grade 10. Kim’s study used the LCD
framework suggested by Smith and Stein (1998). The findings suggested that 94% of the
tasks analysed in the selected textbooks were at a low level of cognitive demand, with a
limited number of tasks requiring ‘procedures with connections to meaning’ (5%) and
very few tasks involving ‘doing mathematics’ (1%). Kim (2014, p. 285) concluded that
students are not given many opportunities to think non-algorithmically and are not
offered sufficiently many tasks in order for them to develop an understanding of
mathematical processes and relationships.
Yang and Lin (2014) examined the topic of functions in mathematics textbooks used in
Finland, Singapore and Taiwan for grades 7-9. The most popular textbook series from
each country was selected. Using the LCD framework, it was found that the Taiwanese
series had the greatest number of HLD tasks (63.9%), the Singaporean series had less
(53.7%) while the Finnish series had the least (37.3%). The main difference being that a
lot of Finnish textbook tasks were placed in the ‘memorization’ category (14.1%)
compared to the Singaporean series (0%) and Taiwanese series (1.9%). Yang and Lin
(2014, p. 509) suggest that the Finnish textbooks could increase the complexity of their
tasks.
Son and Hu (2016) completed a similar analysis investigating the treatment of the
concept of function in selected post-primary school textbooks from the U.S. and China.
For the study, 1 U.S. reform curriculum textbook, 2 U.S. traditional curriculum textbooks
and 1 Chinese reform curriculum textbook were used. They found that the U.S. curricula
examined as part of their study introduce the concept of function one year earlier than
the Chinese curriculum. The U.S. textbooks also provide far more problems for students
to work on than is the case with the Chinese textbooks. In contrast, the Chinese
curriculum emphasises developing both procedures and concepts and it also includes
more problems that necessitate visual representations, explanations and problem-
solving. The Chinese textbooks contain several worked out examples that encourage

35
students to design multiple methods of solution. The U.S. reform curriculum textbook
had the highest percentage of problems set in an illustrative context with 93.2% while
the 7th grade U.S. traditional curriculum textbook had the highest proportion of
problems set in a pure mathematics context with 88.2%. The Chinese textbook was
more balanced with 51.5% of problems set in a pure mathematics context and the
remainder in a real-life context. Son and Hu, (2016, p. 18) suggest that the students
using the U.S. reform curriculum textbook are given more opportunities to connect
function concepts to real-life than those using the other textbooks. In relation to
cognitive expectation, it was found that the two U.S. traditional curriculum textbooks
(7th grade: 10%, 8th grade: 21.9%) and the Chinese textbook (36.3%) had a smaller
proportion of tasks requiring problem-solving or mathematical reasoning compared to
the reformed curriculum textbook (51%). Another finding of this study was that students
using the U.S. curriculum reform textbook would be offered better learning
opportunities than those relying on traditional texts.
Bergqvist, Lithner and Sumpter (2008) looked at tasks intended for upper secondary
school students in Sweden, similar to the ones encountered in textbooks. The students’
reasoning while solving tasks was analysed, with a focus on the use of different strategy
choices and how they were implemented. The reasoning framework developed by
Lithner, will be outlined in more detail in chapter 3. Fifteen students were videotaped
solving tasks, showing their written work while thinking aloud. The results from
Bergqvist et al.’s study indicate that mathematically well-founded considerations were
rare. The dominating reasoning types observed were algorithmic reasoning (where
students tried to remember a suitable algorithm) and guided reasoning (where progress
was possible only when essentially all important strategy choices were made by the
interviewer).
Sidenvall, Lithner and Jader (2015) completed an analysis of students’ textbook task-
solving in Swedish upper secondary school, focussing on the types of mathematical
reasoning required and the rate of correct task solutions. The data was gathered by
studying video-recordings, transcripts and students’ notebooks taken from normal
classwork. As part of the study, 15 students broken into 7 groups drawn from four

36
different classes attempted 86 textbook tasks. A typical lesson commenced with a
teacher’s presentation followed by student work with textbook tasks. Students were
free to work on their own or collaboratively. Sidenvall et al. (2015, p. 533) warn that rote
learning is a cause for concern because it relates to the tendency for students to use
imitative strategies, which are mathematical superficial, instead of creating their own
solution methods through reasoning. They found that rote learning and superficial
reasoning was a common feature, and 80% of all attempted tasks were correctly solved
using imitative reasoning strategies. In the few cases where mathematically founded
reasoning was used, all tasks were correctly solved. One feature of the study suggests
that student collaboration and dialogue does not necessarily lead to mathematically
founded reasoning or deeper learning. Students were found to copy solutions from
each other without receiving or seeking mathematical justification. They concluded that
collaboration of such a nature could actually be a disadvantage to learning. It was also
evident that the worked examples and theory sections from the textbook were not used
as an aid by the students when solving tasks.
Boesen, Lithner and Palm (2010) compared tasks in a Swedish upper secondary school
national test to those that students would have encountered previously when using
textbooks. Their results show that when confronted with tasks similar to those in the
textbooks, they mostly used imitative reasoning by trying to recall facts or algorithms.
When using this imitative reasoning, they were successful in completing the tasks.
However, using this type of reasoning did not require the consideration of intrinsic
mathematical properties. When solving test tasks that were wholly different to those
contained in the textbooks, successful solutions were based on the use of creative
reasoning and they tended to be connected to the relevant mathematical foundations.
Jader, Lithner and Sidenvall (2015), in an unpublished manuscript, completed an analysis
of school mathematics textbooks from 12 countries (including the Active Maths
textbook series from Ireland), looking at the reasoning that selected tasks matching the
descriptions “equations and formulas” and “perimeter, area and volume” from algebra
and geometry topics required. This study considered whether solutions could be
modelled on worked examples provided in the textbooks or if it was necessary to

37
construct a method of solution. The results show that an average of 79 % of the tasks
examined required imitative reasoning. It was found that the percentage of tasks
requiring creative reasoning was higher among geometry tasks than algebra tasks in all
textbooks. It was also discovered that 13 % of the tasks could be solved by mimicking
solution methods provided but required some minor modification, and the remaining 9
% of the tasks require that the main part of the solution is created without the guidance
of a modelled solution. In the case of Ireland, 86% of tasks were found to require
imitative reasoning, 10% followed a modelled solution with some alteration and 4%
necessitated creative reasoning.
The 1999 TIMSS Video study (Givvin, Hiebert, Jacobs, Hollingsworth and Gallimore,
2005) analysed teaching patterns in seven different countries, including Australia.
Mathematics lessons were examined from several viewpoints, including the types of
problems that students solved. It was found that Australia had the second highest
proportion of real-life contexts in the lessons observed but that three quarters of the
tasks were repetitions of preceding similar problems in the lesson. Australian lessons
also had the highest proportion of problems with low procedural complexity and had
virtually no use of proof or reasoning. Since then researchers have been keen to see if
changes implemented in Australia have had the desired effect on pedagogy and
textbook content.
Vincent and Stacey (2008) examined whether tasks presented in textbooks in 2006 were
still broadly aligned with the results of the 1999 study for Australia. They looked at three
topics (addition and subtraction of fractions, solving linear equations and plane
geometry concerning triangles and quadrilaterals) in nine eight grade textbooks in
Australia.
Each of the textbook tasks was classified according to five of the TIMSS Video Study
criteria: procedural complexity, type of solving processes, degree of repetition,
proportion of application tasks and the proportion of tasks requiring deductive
reasoning. Procedural complexity was classified as either low, medium or high according
to the number of decisions required by the student when solving the task. The type of
solving processes used in problems involved categories such as using procedures, stating

38
concepts or making connections. A task was classified as repetition if it was the same or
mostly the same as a previous problem in the lesson. Vincent and Stacey (2008)
classified ‘exercises’ as practising procedures on a set of similar tasks while ‘application’
involved students applying procedures learned in one context to solve problems
involving a different context. The majority of tasks in all textbooks analysed were of low
procedural complexity. For fractions, the percentage of tasks of low procedural
complexity ranged from 56% to 83%, for equations there was a similar range from 58%
to 83% for equations. It was much higher for geometry, with the proportion of tasks of
low procedural complexity ranging from 73% to 96%. They found that there was a broad
similarity between the textbook tasks analysed and the lessons presented in the TIMSS
Video Study. However, their findings point towards there being too much emphasis on
repetitive tasks of low procedural complexity and they call for students to be exposed to
the full range of task types in textbooks.
Nie, Freedman, Hwang, Wang, Moyer and Cai (2013) studied teachers’ intentions for and
reflections on their use of Standards based Connected Mathematics Programme (CMP)
textbooks and traditional textbooks to guide instruction at 6th grade in 14 U.S. middle
schools. They report that even when teachers make serious attempts to teach in ways
aligned with the Standards based curriculum, teachers often keep many practices
inconsistent with reform due to the influence of tradition. For the analysis, they
focussed on learning goals, instructional tasks, teachers’ anticipation of students’
difficulties and perceptions of students’ achievement in relation to learning goals. Their
study found that the CMP textbooks provided more high cognitive level tasks to
implement than the traditional textbooks. Having observed 305 CMP lessons using a
corresponding textbook and 274 traditional lessons with a non-CMP textbook, it was
found that many more of the former lessons were executed with a high level of
cognitive demand, meaning that it incorporated at least one instructional task classified
as procedures connected to meanings or doing mathematics. By comparing the
teachers’ intended learning goals to the implemented learning goals as perceived by
observers, they found that the percentage of standards based lessons that were actually
implemented while maintaining a high level cognitive demand for students was lower
than originally planned. Nie et al. (2013, p. 707) suggest that while the textbook

39
emphasis may shape instructional goals, this influence is affected by the realities of
implementation. They also found that the CMP teachers were more likely to follow the
guidance of their textbooks when selecting instructional tasks for a lesson than their
non-CMP contemporaries.
Herbel-Eisenmann (2007) analysed a U.S. middle school 6th grade mathematics textbook
to see if it achieved the ideological goal of the intended curriculum to move the
authority away from the teacher and the textbook and to promote student reasoning
and justification. It was found that there was a mismatch between the textbook and this
goal. Thompson and Senk (2014) explored the treatment of U.S. high school geometry
in 12 teachers’ classrooms using the same textbook. Their analysis suggests that factors,
other than the textbook, such as the planned curriculum of the teacher, account for
differences in the enacted curriculum in terms of the material taught or skipped, the
nature in which the topic is taught, the tasks that are assigned to students for
homework, and the use of instructional technology applied in the classroom. Tran (2016)
examined the alignment of three selected U.S. high school textbooks series with the
Common Core State Standards for Mathematics (CCSSM) regarding the treatment of the
topic of statistical association. The textbook content was compared with the CCSSM
learning expectations (LEs). All 22 CCSSM LEs were covered by two of the three series.
However 4 CCSSM LEs were addressed with only 1 task, while 6 CCSSM LEs were
addressed by 2 tasks in a particular textbook series. Seeley (2003) is cited as warning
that publishers, in order to maximize sales and profits, fill textbooks with content to
meet as many state requirements as possible with little consideration as to how topics
are treated.
Stylianides (2009) examined a popular American textbook series used in middle grades
(6 to 8) in terms of opportunities offered to students to engage in reasoning-and-proving
in the topic areas of algebra, geometry and number theory. He found that more than
half of the tasks analysed gave no opportunity for students to engage in reasoning-and-
proving. For the tasks that were classified as requiring reasoning-and-proving, the
number that were designed to engage students in empirical arguments or conjectures
was quite low, while there was a high proportion of such tasks encouraging students to

40
use rationales (that is, use an argument which does not make explicit reference to key
accepted truths that it uses).
ZDM, the International Journal on Mathematics Education (Fan, Jones, Wang and Xu,
2013), produced a special edition on the theme of textbook research in mathematics
education. Fan, Zhu and Miao (2013, p. 633), in the edition’s lead article, reviewed
relevant research pertaining to mathematics textbooks. They conducted a survey of the
literature published over the last six decades and classified the focus of this literature
using four different categories: 1) role of textbooks in teaching and learning, 2) textbook
analysis and comparison, 3) textbook use and 4) other areas. The survey found that the
majority (63%) of empirical studies on mathematics textbooks focussed on textbook
analysis and comparison. It highlights that there has been an imbalance in different
areas in relation to the development of research on mathematics textbooks. They call
for the existence of textbooks to be viewed from a broader perspective instead of being
treated as an isolated identity, for more research about the relationship of the textbook
and students’ learning outcomes to be completed, and for more work to be completed
on issues related to the development and production of textbooks. Researchers are also
urged to use more advanced methodology in textbook research and to complete more
work in the area of electronic textbooks.
2.6 Task Design
This section will look at some key texts on the design of tasks. Then in the next section,
more recent developments in relation to task design having a role in teacher
development will be discussed. Jones and Pepin (2016, p. 107) define task design as
referring ‘to mathematical tasks (including tasks in the form of digital resources and
tools) that are developed and designed in, or for, mathematics teaching, or in, or for,
mathematics teacher education. Hence, task design could include designing tasks for
teaching specific mathematical topics to specific learners, designing tasks for textbooks
(including digital platforms and e-books), designing learning sequences, and designing
tasks for the professional learning of mathematics teachers.’

41
In recent times, there has been a repeated call for more work to be completed in
relation to task design. Brown (2009, p. 23) views the idea of teacher as designer as
useful because it brings attention to the constructive interaction between agent
(teachers) and tools (curriculum materials) that ensues during the process of instruction.
Schoenfeld (2009) noted that there was a need for increased communication between
educational designers and researchers. De Araujo and Singletary (2011, p. 1207) made
the observation that there was a lack of teachers’ perspectives on tasks. Similarly,
Geiger, Goos, Dole, Forgasz and Bennison (2014, p. 240) note that there is a potential for
improving teaching and learning practices through partnerships between teachers and
researchers. This can occur where principles of task design are explored, refined and
documented. Also this process should be accompanied by an examination of how to
effectively integrate tasks with pedagogical approaches. Watson and Ohtani (2015, p.
11) comment that although task design and teaching are often viewed as separate
activities conducted by separate groups, the communities involved in task design are
diverse in composition and naturally overlap.
There is substantial research providing lists of design principles for mathematical tasks
(e.g. Ahmed (1987), Hamilton, Lesh, Lester and Brilleslyper (2008) and Foster (2015)).
Foster (2015), as an example of such lists, advises that tasks should be 1) enticing, 2)
accessible yet challenging and 3) naturally extendable. Swan (2008) working with
teachers developed five task types that encourage concept formation. It should be
noted that the tasks to which he refers are intended as classroom activities rather than
for completion as homework. He envisions students working collaboratively to solve
tasks and verbalise their thinking. The five task types are classifying mathematical
objects, interpreting multiple representations, evaluating mathematical statements,
creating problems and analysing reasoning and solutions. The mathematical objects
referred to can range from shapes to quadratic equations. By classifying mathematical
objects, Swan suggests that students learn to distinguish and identify the properties of
these objects. Swan asserts that these types of tasks assist students to develop
mathematical language and retain definitions. He suggests that by encountering
different representations of the same mathematical idea, students can draw links
between representations and develop new mental images for concepts. When
evaluating mathematical statements, students are encouraged to develop mathematical

42
arguments, justify their viewpoint and devise relevant examples and counterexamples to
defend their reasoning. In his view, requiring students to create problems reveals the
processes behind mathematics rather than just focussing on solving exercises. Swan
believes that the analysis of reasoning and solutions encourages students to recognise
that there are several ways to approach and solve a mathematical problem. Swan (2005,
p. 21) also calls for students to be asked to convince, explain and prove when engaged in
mathematical activity.
In their book, Mason and Johnston-Wilder (2004, p. 109) provide a list of words they
believe denote processes and actions that mathematicians employ when they are
working with mathematical problems: “exemplifying, specializing, completing, deleting,
correcting, comparing, sorting, organizing, changing, varying, reversing, altering,
generalizing, conjecturing, explaining, justifying, verifying, convincing, refuting”. It is
suggested that the use of these words would enable students to gain a richer experience
of the aspects of mathematical thinking. For designing tasks, language is important and
it is important to encourage students to verbalise their mathematical thinking using
terms like ‘justify’, ‘explain’ or ‘verify’. Furthermore, Mason and Johnston-Wilder (2004,
p. 6) recommend the use of a ‘mixed economy’ of tasks as no single strategy or task
type has proved to be universally successful in developing mathematical thinking.
Swan and Burkhardt (2012) have suggested principles for mathematical task design
suitable for use as assessment. They suggest that tasks should reflect the curriculum in a
balanced way, meaning that students would ideally be given the opportunity to
encounter all types of performance that the curriculum goals espouse. It is also
recommended that tasks have ‘face validity’ and are fit for purpose; students should
view them as problems which are worthy of solving due to being interesting or having a
potential use. They also believe that tasks should be accessible yet challenging, thus
enabling students of all different abilities to be able to demonstrate what they can do.
Their principles call for reasoning to be rewarded rather than results, in other words that
students should be encouraged to engage in a process of reasoning when considering
how to solve a task. Designers are also advised to use authentic contexts, encouraging
students to make connections within mathematics and other subjects. Interacting with

43
such contexts ensures that students would better understand life and the world around
them as a result. They also believe that students should be encouraged to select and
choose their own methods with tasks that provide opportunities for making decisions.
Finally they recommend that tasks should be transparent in their demands, so that
students are clear as to what kind of response is expected and valued.
Watson and Thompson (2015) focus on design issues related to written tasks, typically
found in textbooks. Three interrelated aspects are considered: 1) nature and structure of
tasks, 2) pedagogic purpose of their design and 3) intended mathematical activity as
embedded in tasks. In textbooks, the topic sequence is suggested by the authors and
consideration must be given to necessary prerequisites and how tasks might build on
each other. Watson and Thompson (2015, p. 150) point out that text-based tasks rarely
support learners to develop the skill of self-checking through the use of mathematics to
verify solutions. Very often the textbook authors retain the mathematical authority by
providing an answer book. Watson and Thompson suggest that by creating tasks that
encourage learners to self-check or incorporate multiple approaches, students are
facilitated to gain some mathematical authority. They also recommend that tasks should
lend themselves to conjecture and exploration so that the student can establish
relationships and connections and engage in the dynamic world of mathematics.
Watson and Thompson believe that pedagogic purpose can influence how a designer
creates a sequence of tasks. However, the designer must concentrate on introducing
learners to new ideas and be aware of how tasks can convey a view of what is valued in
mathematics. In relation to intended mathematical activity, Watson and Thompson
(2015, p. 170) call on designers to create tasks which allow for the key idea to be varied
and learners are able to see this along with the effects of such variation in subsequent
activity. They also observe that tasks can introduce teachers and learners to new ways of
engaging with mathematics even if such opportunities are not availed of.
Sullivan, Clarke and Clarke (2013, p. 135) found that a teacher’s choice and use of tasks
are very important for effective mathematics teaching, and a task’s characteristics can
influence its potential for learning. They identified a number of key characteristics of
tasks that should be incorporated in the design of tasks. In their view, students should

44
be engaged in fostering meaning-making and establishing connections to other aspects
of mathematics, when solving tasks. They recommend that tasks are challenging for
most of the class, with the pathway to the solution not being clear to the students. Tasks
should require students to think, make decisions and communicate. Additionally the
authors recommend that contexts or situations should be relevant to the students so
that the tasks are seen as potentially useful or connected to their lives. If a task is
appropriately designed it will promote students’ conceptual understanding of
mathematics while catching and maintaining their interest and it will optimize their
learning (Chapman, 2013 cited in Jonsson, Norqvist, Liljekvist and Lithner 2014).
2.7 Teacher Professional Development in the Creation and Use of Tasks
Task design has traditionally been viewed as curriculum developers creating
mathematical tasks that ultimately get implemented by teachers as part of their
classroom instruction (Jones and Pepin, 2016, p. 108). Pepin, Gueudet and Trouche
(2013, p. 934) suggest that there may be several processes at work when teachers
interact with curriculum resources such as tasks, these can be summarised as adoption,
genesis and transformation. They state that the potential integration/inclusion into a
teacher’s ‘normal’ practice is an essential condition for the adoption of a textbook or
piece of software. This view of an individual teacher’s autonomy is shared by Ball and
Cohen (1996, p. 6), they outline that teachers’ understanding of material, their personal
beliefs as to what is important, and their thoughts about students and the role of the
teacher all influence and shape their practice. Silver, Ghousseini, Charamlambous and
Mills (2009) suggest that a given text resource portrays mathematics in a particular way,
which in turn can be rejected by a teacher if this does not correspond to his/her own
views. However, Remillard, Herbel-Eisenmann and Lloyd (2011) believe that features of
the curriculum resources can contribute to teacher development, and this in turn can
bring about an evolution in the teacher’s beliefs. Transformation refers to how tasks can
promote teacher learning. Davis and Krajcik (2005, p. 5) suggest that tasks have the
potential to promote a teacher’s pedagogical design capacity, or his ability to use
personal or curricular resources in order to adapt the curriculum so as to achieve
productive instructional results.

45
Mathematical tasks have also been used as a focus of teacher professional development.
Sullivan and Mousley (2001) have made the case that there should be more focus on
supporting teachers in gaining an understanding of the complexity surrounding decision-
making about classroom tasks. Clarke, Grevholm and Millman (2009) took up the cause
in relation to primary mathematics teacher education, while Zaslavsky and Sullivan
(2011) have taken a similar approach with post-primary teacher education. Arbaugh and
Brown (2005) believed that classifying exercises in terms of their cognitive demand
would enable teachers to examine their own practice. It was found that teachers
amended their classifications of tasks over time to better reflect levels of cognitive
demand. Stein, Smith, Henningsen and Silver (2009) prepared a case book for use in
professional development that included a number of exemplary tasks, criteria for
analyzing task properties, and several protocols to facilitate the discussion of tasks
among teachers. Further work completed using such an approach (Boston and Smith
2009; Boston 2013) has identified changes in teachers’ choice of task after completing
professional development in relation to classifying tasks in terms of their level of
cognitive demand. It also found that some teachers sustained such choice after a period
of time had elapsed (Boston and Smith 2011).
Swan (2007) designed professional development which put emphasis on a number of
task types that allowed participating post-primary mathematics teachers to examine
their beliefs in relation to teaching. In several cases, it facilitated a transition towards a
more student-centred approach to teaching. It also encouraged some teachers to
establish more connections between mathematical concepts when teaching the subject.
These studies demonstrate the transformative nature of tasks when used in a
professional development situation.
Askew and Canty (2013) examined how primary school teachers, in collaboration with a
task designer, worked with, and developed, classroom tasks as starting points for
promoting students’ reasoning in mathematics. They concluded that the introduction of
a framework for working on, and with these tasks, and the treatment of this work as a
joint venture, promoted teachers’ professional practice and also fostered greater
collegiality and stronger ties amongst the staff within a school. Knott, Olson, Adams and

46
Ely (2013) examined the characteristics of task design to which teachers needed to give
attention when adjusting or modifying their existing lessons in order to engage students
in learning new forms of generalisation and justification. It was found that once teachers
were supported appropriately, in the context of professional development, the teachers
could then independently create rich tasks which facilitated students gaining confidence
in the areas of justifying and generalising. Even and Olsher (2014) studied teachers as
participants in textbook task development and they found that teachers had divergent
views on the preparation of a textbook. Most teachers that they worked with would
happily take on the role of writing a textbook, mainly informed by the knowledge that
they had built up from their own teaching experience. In contrast, they found that some
of the teachers were cautious and uncomfortable with making changes to a textbook
written by expert curriculum developers due to deference to the expertise of the
textbook authors. Coles and Brown (2016), working in a teacher–researcher partnership,
recommended particular design principles based around ‘the making of distinctions’
accompanied by an explicit language of mathematical thinking in task design. Their aim
was to bridge the persistent gap that exists between teachers’ intentions and students’
activity. Johnson, Severance, Penuel and Leary (2016, p. 169) pointed out that when
teachers engage in task analysis, it becomes apparent that designers and participating
teachers have different goals in terms of professional development. Through working
together on mathematical tasks, teachers and researchers participated as stakeholders
in a co-design process. They noted that tensions were evident due to a lack of design
consensus and such tensions affected participation and learning. In particular, Johnson
et al. (2016, p. 182) highlight that the reality of a teacher’s instructional situation can
make the implementation of tasks difficult. In order to understand tasks in the
institutional context, an approach that goes beyond simple delivery of professional
development from researchers to teachers is necessary However, they viewed these
tensions as healthy and recommended that the successful confrontation of design
tensions as part of a collaborative design process could yield new task adaptation and
implementation practices that could prove to be sustainable across an educational
system.

47
Chapter 3 Theoretical Frameworks
3.1 Introduction
This chapter will outline the theoretical frameworks that are employed in this study. I
will begin by establishing the importance of mathematical tasks within instruction by
looking at Herbst and Chazan’s (2012) extension of the instructional triangle (Cohen et
al., 2003), based on the concepts of didactical contract and milieu (Brousseau, 1997)
which are used to describe the relationship between teachers, students and knowledge
at stake through instruction. It is this theoretical framework that motivates my overall
study of mathematical tasks at second level in Ireland. Five frameworks used in this PhD
study’s analysis of tasks and their sub classifications are also outlined in this chapter. The
Levels of Cognitive Demand (as described in Smith and Stein, 1998) and mathematical
reasoning (Lithner, 2008) frameworks are described first. The Project Maths syllabus
problem-solving objectives are then described to give some insight into the goals of the
syllabus, followed by an outline of how these objectives were adapted for use as a
framework for the analysis of tasks. An account of Usiskin’s (2012) multidimensional
model of mathematical understanding is also provided. After examining the criteria for
each of these four frameworks, the kind of insight that each framework offers to the
researcher is discussed. Consideration is given to the similarities and differences
between these frameworks. The need for the ‘novelty’ of tasks to be given special
consideration becomes apparent and thus a framework to classify the novelty of tasks
has been designed.
3.2 The Instructional Triangle
Herbst and Chazan (2012, p.601) argue that by looking at the nature of instruction, it is
possible to justify actions that are taken in mathematics teaching. Cohen et al. (2003, p.
122) describe instruction as the ‘interactions among teachers and students around
content in environments’. This definition puts the focus, when examining instruction, on
how resources are used rather than identifying whether resources are present or not.
Predating this definition, according to Herbst and Chazan (2012, p.601), instruction was
traditionally conceptualised as the set of resources that could be found in the
environment where learning was intended to take place, such resources could include
features like student characteristics, teacher quality or materials used in the classroom.

48
The presence or lack of these resources could then be used to account for any perceived
differences in learning. Accompanying Cohen et al.’s definition of instruction is a
diagram, shown below in Figure 3.1, that has become popularly known as the
‘instructional triangle’.
Figure 3.1 Instructional triangle from Cohen et al. (2003, p. 124)
As can be seen from the diagram, teachers, students and mathematical content are
situated at the three vertices of this instructional triangle. However, they are also
influenced by and interacting with the environments in which they are immersed.
The instructional triangle can be situated within a distinct tradition of mathematics
education. Herbst and Chazan (2012, p. 602) describe how ‘Didactique des
Mathematiques’ is a French theory of mathematical education which is used to refer to
the study of the dissemination of mathematical knowledge, with a particular emphasis
on the study of teaching. The term also encompasses the study of the transformations
produced on mathematical knowledge by those learning it in an institutional setting.
Brousseau (1997) put forward a theory of didactical situations, which studies the
complexity inherent in any situation involving the interaction of teacher, student and
content. This is in effect a three way schema. Brousseau’s theory aims to single out
relationships that emerge in the interaction between learners, mathematical knowledge
to be learned and the milieu. Sriraman and English (2010, p. 22) describe these milieu as
typically including ‘other learners, the concepts (previously) learned by students as well

49
as prior conceptual machinery present in the student’s repertoire and available for use’.
Brousseau (1999), as cited in Sriraman and English (2010, p. 23), described his theory as
a ‘means not only of understanding what teachers and students are doing, but also of
producing problems or exercises adapted to knowledge and to students, and finally a
means of communication between researchers and with teachers.’
Tasks have a special role within this theoretical model. The didactical contract, as
described by Brosseau (1997, p.32) and cited in Herbst and Chazan (2012, p. 602), views
the teacher as creating ‘sufficient conditions for the appropriation of knowledge’ and
this appropriation must be recognised when it occurs. The student is meant to satisfy
these conditions and learn the intended material. Successful instruction is thought to
occur when all aspects of the contract work together. For Herbst and Chazan (2012),
tasks are viewed as the means by which student interact and work with mathematical
content. They define a mathematical task ‘as the engagement of students in actions with
and against a milieu’ (2012, p. 607). The milieu in this conceptualization includes the
goal that students are working toward and the resources (including tasks) with which
students are operating. They add that as students work on mathematical tasks, the role
of the teacher includes supporting that work by ‘ensuring that the milieu functions as
expected’ (Herbst and Chazan, 2012, p. 607). Teachers’ actions in this regard can be
judged according to the norms of the task. They provide the example of a calculator to
illustrate this point. If a task requires the students to use a calculator then it may be
necessary for the teacher to ensure that the calculator has batteries and the keypad is
functional. In this sense, the teacher performs actions to support the function of the
milieu. Such actions can then be justified or critiqued based on the norms of a task.
Herbst and Chazan (2012) modify the instructional triangle to demonstrate how a
mathematical task and its norms may justify a teacher’s action.
The instructional triangle shows the importance attached to tasks in the form of
mathematical work that must be completed by students. Herbst and Chazan further
developed the concept when considering the exchange between students’ mathematical
work and the knowledge at stake and how this exchange is managed. They suggest that
teachers must not only sustain students’ work but also design or choose the

50
mathematical task that students will work on. This also includes observing the work,
gathering evidence that students have studied and ultimately learned a specific item of
knowledge. The norms of an instructional situation serve to justify a teacher’s
preference for one action over another. An example of such norms would be when a
teacher encourages a student’s efforts by inserting an extra step into the solution
method when solving an equation, yet cautions against oversimplification. Figure 3.2
represents this kind of intervention by introducing the norms of an instructional
situation into the existing instructional triangle model.
Figure 3.2 Elaboration of the instructional triangle (Herbz and Chazan, 2012, pg. 609)
This theoretical framework brings particular attention to new instructional situations¸
that are developed through teacher and students’ negotiation of how to deal with the
breaches that a novel task creates in an existing instructional situation. One of the main
recommendations of Herbst and Chazan’s elaboration of the instructional triangle is that
attempts to improve instruction could be operationalised in terms of engaging students
in novel tasks. For them, a novel task is a means for encountering new ideas and
operating with them within the milieu. They suggest that novel tasks would both build
‘on existing instructional situations and breaching with some of their norms’ (p. 611).
The novelty of tasks is an important consideration in this study and a framework I
developed for the identification of novelty will be described later in this chapter.

51
Ellis, Hanson, Nunez and Rasmussen (2015), influenced by the adapted instructional
triangle of Herbst and Chazan, studied universities with calculus programmes perceived
to be successful and considered the role of homework systems within these
programmes. They compared these programmes with other universities outside of their
study in an effort to identify differences in their homework systems. They situated the
system of giving and completing homework within the broader context of the
instructional environment. This enabled them to consider how relationships between
students, the calculus course instructor, and the mathematical content interact with the
homework system, and how all of these interactions are governed by the didactical
contract between the instructor and students.
Their findings indicated that homework and group projects were assigned more
frequently in the universities that they selected compared to those that were not chosen
for the study. Also their study suggested that online homework systems were availed of
more commonly in the selected institutions, such homework was graded more
frequently and returned with feedback from instructors thus creating more interaction
between teacher and students and allowing for instruction outside the classroom, and
the content assigned tended to focus on material that involved more novel, cognitively
demanding tasks. Ellis et al. (2015, pg. 285) suggested that allowing students to attempt
homework tasks multiple times, helped students to gain confidence as it demonstrated
that they could persist and eventually find the correct solution. Students were able to
experience heightened success through the completion of homework, something that
might not have been possible within the classroom due to time constraints. Instructors
also valued homework because it not only gave further opportunities for engagement
with mathematical concepts and applications, but it also allowed students opportunities
to explain their thinking when solving tasks. Ellis et al. point out that at second-level in
the United States, the majority of the interactions between student, teacher, and
content occur within the classroom. However they suggest that at university, many of
these interactions take place outside of the lecture hall. ‘Thus, the homework system
plays a heightened role in undergraduate mathematics because it acts as the milieu for
these interactions to occur both inside and outside the classroom’ (Ellis et al., 2015,
p.286).

52
In the context of my PhD study, it is assumed that Irish second level teachers generally
guide students through the development of knowledge with tasks mainly completed in
class but some are also assigned for homework. Given the findings of Ellis et al. (2015)
above, tasks are worthy of analysis because they are an important part of the milieu of
mathematics instruction that takes place both inside and outside the classroom.
However unlike Ellis et al., the analysis here will focus on the nature of mathematical
tasks as opposed to how they are used or assigned by teachers.
Taking the instructional triangle adapted by Herbst and Chazan (2012) as a conceptual
framework, this study is concerned with the importance of mathematical tasks and their
role in supporting the construction of knowledge. At this level, tasks are used by
teachers to provide students with opportunities to develop understanding and/or skills
and the responsibility for the construction of knowledge mainly rests with the teacher.
The relationships that exist between the tasks, the teacher and the knowledge at stake
all function within the larger environment of the school. Teachers use the tasks to plan
class activity and set homework. It is the teacher who decides what aspects of content
to emphasise through the tasks assigned and what content will be covered. Studying the
nature of mathematical tasks readily available at second level in Ireland is important
because it gives some insight into how students are expected to construct their
knowledge and the interactions that might take place between the teacher, the student
and the content.
3.3 Description of Frameworks
3.3.1 Levels of Cognitive Demand
It has been argued that it is important to examine the cognitive demand required by
tasks because of their influence on student learning as it determines ‘how they come to
think about, develop, use and make sense of mathematics’ (Stein, Grover and
Henningsen, 1996, p. 459). The framework used by Stein et al. describes four levels of
cognitive demand for tasks: lower level demands of ‘memorization’ and ‘procedures
without connection to meaning’, and higher level demands of ‘procedures with
connection to meaning’ and ‘doing mathematics’. A description of each level of the

53
framework has been taken from Smith and Stein (1998) and is outlined in Figures 3.3
and 3.4. These descriptions were carefully adhered to when looking at the tasks selected
from each textbook.
3.3.1.1 Lower-level demands
Tasks of lower-level cognitive demand can fall into one of two categories; those of
‘memorization’ and ‘procedures without connection to meaning’. Tasks involving
‘memorization’ require the reproduction of previously learned facts or definitions or
committing rules and formulae to memory. They cannot be solved using procedures
either because a procedure does not exist or because the timeframe is too short in order
to employ one. Such tasks involve the exact reproduction of previously seen material
and there is often a clear unambiguous direct statement as to what should be
reproduced. A distinctive feature of this category is that there is no connection to the
concepts or meaning that underlies the facts, rules or definitions reproduced in
response to that task.

54
Figure 3.3 Lower-level cognitive demand (Smith and Stein, 1998, p.348)
Levels of Demands
Lower-level demands (memorization)
Involve either reproducing previously learned facts, rules, formulas, or definitions
or committing facts, rules, formulas or definitions to memory.
Cannot be solved using procedures because a procedure does not exist or
because the time frame in which the task is being completed is too short to use a
procedure.
Are not ambiguous. Such tasks involve the exact reproduction of previously seen
material, and what is to be reproduced is clearly and directly stated.
Have no connections to the concepts or meaning that underlie the facts, rules,
formulas, or definitions being learned or reproduced.
Lower-level demands (procedures without connections to meaning)
Are algorithmic. Use of the procedure either is specifically called for or is evident
from prior instruction, experience or placement of the task.
Require limited cognitive demand for successful completion. Little ambiguity
exists about what needs to be done and how to do it.
Have no connection to the concepts or meaning that underlies the procedure
being used.
Are focused on producing correct answers instead of developing mathematical
understanding.
Require no explanations or explanations that focus solely on describing the
procedure that was used.

55
Figure 3.4 Higher-level cognitive demand (Smith and Stein, 1998, p.348)
Higher-level demands (Procedures with connections to meaning)
Focus students’ attention on the use of procedures for the purposes of developing
deeper levels of understanding of mathematical concepts and ideas.
Suggest explicitly or implicitly pathways to follow that are broad general
procedures that have close connections to underlying conceptual ideas as opposed
to narrow algorithms that are opaque with respect to underlying concepts.
Usually are represented in multiple ways, such as visual diagrams, manipulatives,
symbols and problem situations. Making connections among multiple
representations helps develop meaning.
Require some degree of cognitive effort. Although general procedures may be
followed, they cannot be followed mindlessly. Students need to engage with
conceptual ideas that underlie the procedures to complete the task successfully
and develop understanding.
Higher-level demands (Doing Mathematics)
Require complex and nonalgorithmic thinking – a predictable, well-rehearsed
approach or pathway is not explicitly suggested by the task, task instruction, or a
worked-out example.
Require students to explore and understand the nature of mathematical concepts,
processes or relationships.
Demand self-monitoring or self-regulation of one’s own cognitive processes.
Require students to access relevant knowledge and experience and make
appropriate use of them in working through the task.
Require students to analyse the task and actively examine task constraints that may
limit possible solution strategies and solutions.
Require considerable cognitive effort and may involve some level of anxiety for the
student because of the unpredictable nature of the solution process required.

56
The second category ‘procedures without connection to meaning’ may request the use
of a particular procedure or such use is evident from prior experience or the phrasing of
the task. There is limited cognitive demand required and little ambiguity surrounds what
the task entails and how it should be completed. There is no connection to the
mathematical concepts involved and the meaning underlying a procedure is not drawn
out. Such procedural tasks are more focused on producing correct answers than on
developing mathematical understanding. Explanations, if asked for, focus only on the
procedure being used and not the thinking behind it.
3.3.1.2 Higher-level demands
Higher-level demands are also divided into two different areas; ‘procedures with
connections to meaning’ and ‘doing mathematics’. Again the focus is on the level of
cognitive engagement that the task demands. Such tasks cannot be completed without a
degree of cognitive effort, and the underlying conceptual ideas must be engaged with. A
task described by the framework as involving procedures with connections to meaning
tends to focus the users’ attention on using procedures in such a way as to develop
deeper understanding of mathematical concepts. Multiple representations could be
required, including the use of visual diagrams, manipulatives, symbols and situations
involving the solving of problems. The development of meaning is or may be made
possible by making connections between several representations of the same concept.
‘Doing mathematics’ is the most demanding of the levels identified in this framework. A
task requires the doing of mathematics when complex thinking is required. A predictable
well-rehearsed approach is not suggested by the task; rather the exploration and
understanding of mathematical concepts are encouraged. The solution process can be
unpredictable and very often requires further analysis of the task and its constraints.
Such constraints could limit the possible approaches to finding a solution.
3.3.2 Creative and Imitative Mathematical Reasoning
Lithner (2008) characterises key aspects of reasoning. His work provides a dichotomy
between what is termed as imitative reasoning and creative reasoning as outlined in
Figure 3.5. Creative reasoning must fulfil some of the following requirements – namely
novelty, flexibility, plausibility and being fixed in appropriate mathematical foundations.
Imitative reasoning instead relies on using well-rehearsed methods or the memorisation

57
of procedures. This type of reasoning is further broken down into three subcategories:
familiar memorized or algorithmic reasoning, delimiting algorithmic reasoning, and
guided algorithmic reasoning.
Figure 3.5 An overview of reasoning types (Lithner, 2006, p.5)
3.3.2.1 Creative Reasoning
For a task to be deemed to require creative reasoning for its successful completion, it
should display at least one of these four criteria: novel, flexible, plausible and
mathematical foundation. It can be seen that creative reasoning shares certain
similarities with the higher-level demands of the LCD framework. In Lithner’s framework,
when a task is novel, it requires complex thinking in order to come up with an approach
or suitable method to find a solution. A flexible approach is required when unexpected
constraints are encountered or different approaches to its solution must be
incorporated. Reasoning is plausible when it is supported by arguments in favour of a
particular solution strategy choice and the conclusions drawn from the solution of a task
are based on mathematical foundation. The term ‘mathematical foundation’ refers to a
connection being made to the concepts or ideas underlying a task.
3.3.2.2 Imitative Reasoning
If a task does not require any of the four criteria for creative reasoning, then it is said to
necessitate the use of imitative reasoning. The framework provides further
classifications for imitative reasoning. The first of these categories is named memorised
reasoning, where the task requires the recollection of an answer. The second category is
termed algorithmic reasoning and these two categories have a common subcategory
known as familiar memorised reasoning/familiar algorithmic reasoning. When the task is
seen as familiar, there is little thought put into how to attempt to find the solution, a

58
well-rehearsed procedure or algorithm is evident for familiar algorithmic reasoning
while a common answer or fact that has been committed to memory is given for familiar
memorised reasoning. Algorithmic reasoning has two further subcategories, namely
delimiting algorithmic reasoning and guided algorithmic reasoning. Delimiting
algorithmic reasoning is used when an algorithm has a surface connection to the task
and is used once the required link is established. Guided algorithmic reasoning is used if
the task has an approach guided by a particular source. For example there is a hint
provided on how to approach the task or the first line of the solution has been provided.
Thus, this framework allows tasks to be categorised in terms of the type of reasoning
that is required when seeking a solution.
3.3.3 Project Maths Syllabus Objectives
The National Council for Curriculum and Assessment has set out seven overarching
objectives for students of Leaving Certificate mathematics (NCCA, 2012, p. 6). Figure 3.6
lists these and it identifies what learners are meant to attain having studied the syllabus.
Figure 3.6 List of Project Maths learning objectives in the Leaving Certificate syllabus.
Given the aspirational nature of these learning objectives, it is difficult to quantify a
response to these objectives or use them as a framework. However, the development of
Project Maths Syllabus Objectives
O. 1 The ability to recall relevant mathematical facts.
O.2 Instrumental understanding (“knowing how”) and necessary psychomotor
skills (skills of physical coordination).
O.3 Relational understanding (“knowing why”).
O.4 The ability to apply their mathematical knowledge and skills to solve problems
in familiar and unfamiliar contexts.
O.5 Analytical and creative powers in mathematics.
O.6 An appreciation of mathematics and its uses.
O.7 A positive disposition towards mathematics.

59
synthesis and problem-solving skills is outlined in every content strand of the syllabus
through the list shown in Figure 3.7 below (NCCA, 2012, p. 20). This lends itself more
easily to the classification of mathematical tasks.
1) Explore patterns and formulate conjectures.
2) Explain findings.
3) Justify conclusions.
4) Communicate mathematics verbally and in written form.
5) Apply their knowledge and skills to solve problems in familiar and unfamiliar
contexts.
6) Analyse information presented verbally and translate it into mathematical form.
7) Devise, select and use appropriate mathematical models, formulae or techniques
to process information and to draw relevant conclusions.
Figure 3.7 List of synthesis and problem-solving objectives in the Leaving Certificate
syllabus.
Information presented by textbook tasks is generally encountered using the written
form and so the sixth objective shown in Figure 3.7 is modified by changing “verbally” to
‘in written form’ before using it for classification. To classify the tasks as precisely as
possible, it is also necessary to break some of the other objectives down further,
especially those which cover multiple situations. In particular with reference to contexts,
it is more useful to make the division between familiar and unfamiliar as it allows one to
see if students are working with familiar or unfamiliar material and/or settings rather
than just identifying that the task is set in a context.
One of the goals of the revised curriculum was to introduce more unfamiliar contexts
into the teaching and learning of mathematics. An important separation also has to be
made between the very different actions of devise, select and use. Again, this would give
more insight into the composition of a set of tasks rather than just working with one
general heading. An amended set of objectives is outlined in Figure 3.8.

60
Using the amended list allows one to classify what kind of learning opportunities are
offered to the student when completing tasks. It is possible for a task to meet more than
one of these objectives and completing analysis using the amended list gives a clear
picture of whether tasks are meeting the Project Maths curricular goals in relation to
synthesis and problem-solving.
Original List Amended List
1) Explore patterns and formulate conjectures.
1) Explore patterns and formulate conjectures.
2) Explain findings. 2) Explain findings.
3) Justify conclusions 3) Justify conclusions.
4) Communicate mathematics verbally and in written form.
4) Communicate mathematics in written form.
5) Apply their knowledge and skills to solve problems in familiar and unfamiliar contexts.
5) Apply knowledge and skills to solve problems in familiar contexts.
6) Apply knowledge and skills to solve problems in unfamiliar contexts.
6) Analyse information presented verbally and translate it into mathematical form.
7) Analyse information and translate it into mathematical form.
7) Devise, select and use appropriate mathematical models, formulae or techniques to process information and to draw relevant conclusions.
8) Devise appropriate mathematical models, formulae or techniques to process information and to draw relevant conclusions.
9) Select appropriate mathematical models, formulae or techniques to process information and to draw relevant conclusions
10) Use appropriate mathematical models, formulae or techniques to process information and to draw relevant conclusions
Figure 3.8: Original/Amended list of Project Maths problem-solving syllabus
Objectives
3.3.4 Multidimensional Model of Mathematical Understanding
Usiskin (2012) deals with the understanding of a concept in mathematics from the
standpoint of the learner. Five dimensions of this understanding are outlined in his
framework: the Skill-Algorithm dimension, the Property-Proof dimension, the Use-
Application (modelling) dimension, the Representation-Metaphor dimension, and the

61
History-Culture dimension. These dimensions are not presented in a hierarchy and one
aspect is not meant to precede another.
The first dimension Skill-Algorithm looks at the algorithms that are required in learning a
concept and the choice of a particular algorithm because it is more efficient than other
algorithms known. This dimension acknowledges that there is more to procedural
understanding than just applying an algorithm. Usiskin argues that ‘the understanding of
procedures is not so lower-level at all’ (Usiskin, 2012, p.5). While skill and procedural
understanding are often thought of as lower order forms of thinking, this framework
recognises the deeper level of understanding required to choose a particular algorithm
when many are known, due to it being more efficient than others. Property-Proof
understanding identifies the mathematical properties that underlie a concept. This
aspect of learning looks beyond arbitrary rules and considers the mathematical theory
behind them. The Use-Application understanding focuses on how a concept can be used
in some way or its applications. The Representation-Metaphor dimension encourages
the representation of a concept in some way. Finally History-Culture understanding
concerns itself with the how and why of the development of a mathematical concept
over time. The History-Culture dimension is an aspect that is identified as necessary for
the ‘real true’ understanding. The premise being that those who study the history of
mathematics or cross-cultural mathematics obtain an understanding of mathematical
concepts that is different from the other dimensions.
3.4 Existing Frameworks:
It is useful to consider each individual framework and the kind of information that it
provides to the researcher. A better understanding of the information gathered through
the frameworks gives an insight into the results that are produced. It should be noted
that Usiskin’s model and the Project Maths problem-solving objectives were not
originally intended to be used as a classification scheme but were adapted for the
purposes of this PhD study. In contrast, the LCD and reasoning frameworks are
established frameworks which have been used elsewhere. As outlined in chapter 2, the
LCD framework has been used to analyse textbooks in the US (Jones and Tarr, 2007),
Turkey (Bayazit, 2013) and Korea (Kim, 2014). Lithner’s reasoning framework has been

62
confined mainly to Sweden, where Bergvist et al. (2008), Boesen et al. (2010) and
Sidenvall et al. (2015) have made use of it to analyse upper secondary school tasks or
their equivalent. Although Jader et al. (2015) conducted an analysis of tasks taken from
textbooks in 12 different countries. While there are many similarities between the
frameworks, they often approach ideas in different ways depending on the particular
focus or interest of the specific framework. The benefit of using several frameworks is
that the researcher gets a much richer account of the demands set and opportunities
provided by a particular task.
3.4.1 Level of Cognitive Demand
The LCD framework has two advantages in terms of the information that it provides. It
shows the level of cognitive demand that an exercise has, and it encourages the
researcher to determine why an exercise is lower or higher level specifically. For
example a student could be using procedures in any exercise but the framework allows
you to specify whether the procedure requires the student to actively engage in
mathematics or if the procedure employed is simply manipulating something to produce
an answer without a true meaning for the student.
The aspects of tasks that justify their categorisation into lower or higher level are also
identified. For example, in order to settle on a classification it is necessary to determine
whether an explanation of thought processes in finding a solution is required, if multiple
representations are employed or whether a task can be completed easily without great
effort or not. However, the LCD framework does not give enough insight into the
experience of the user when solving a task. It makes reference to previously learned
facts and previous instruction or experience but is not explicit on how this should be
determined. It focuses on the structure of the task and what it demands of the user, and
thus allows the classification of tasks on their own merits. If a task is looked at in
isolation, it can appear to be very demanding but if a user has completed several such
tasks previously, then the true level of cognitive demand must be diminished to some
degree and this is not taken into account in the framework. A measure of familiarity or
novelty is needed so as to determine the previous experience that the user brings to a
task.

63
3.4.2 Imitative/Creative Reasoning
While Lithner’s reasoning framework considers the type of reasoning that a task
promotes, it does not take into account the experience that is brought to the task. While
it speaks about a task being novel, it does not provide much detail in terms of how a task
is categorised as such. Similar to the LCD framework, the use of the reasoning
framework in classifying textbook tasks does not address the impact that other material
such as examples or previous exercises in a textbook can have on the classification in
terms of the user’s experience and how these may influence the reasoning applied to a
task. Again, a measure of novelty or familiarity is needed to ensure that the solver’s
prior experience is taken into account.
3.4.3 Multidimensional Model of Mathematical Understanding
Applying Usiskin’s framework considers the understanding of the learner as opposed to
simply the structure of the task. In practice it is more informative to use this framework
in terms of all tasks on a topic rather than a specific task. The framework can be very
narrow when looked at in terms of one task while more of an overview is possible when
it is used in connection with a whole set of tasks. As each of the dimensions looks at a
different aspect of understanding, it is important to look at an entire set of tasks as a
single one does not give an accurate account of the kind of understanding that is being
created. The first two dimensions of the framework match well with categories of the
LCD and IR/CR frameworks. The Skill-Algorithm dimension ties in with the lower-level
demand of ‘procedures without connections to meaning’ and is broadly in line with
imitative reasoning. The Property-Proof dimension is most closely aligned to the higher
level demands of the LCD framework and brings the student to the mathematical
properties that underpin a task. It is useful to consider the different ways that a question
can be approached using procedures and algorithms and whether the user actually
requires or develops an understanding of the mathematics that underpins a topic.
Usiskin’s multi-dimensional framework goes beyond the how and why of understanding.
It is not limited to a consideration of instrumental and relational understanding. A
number of other dimensions are introduced to achieve this. The Use-Application
dimension involves identifying the use of concepts or the understanding that
accompanies knowing when to use or apply a particular concept. It is clear within the
framework that applications involve a different kind of thinking, not necessarily a higher
64
order one. The use of such modelling is not something that is explicitly identified in the
LCD or reasoning frameworks. The LCD framework makes reference to problem
situations but it is not clear if this refers to applications or real-world contexts.
The other two dimensions, Representation-Metaphor and History-Culture, look at the
different ways that students gain understanding. Using this framework it is necessary to
consider whether the student makes a connection between existing representations and
using a different kind of representation or metaphor such as a graph or diagram and
whether he/she is given historical background or cultural reference for the material
covered. Usiskin’s framework puts the learner’s experience specifically into the spotlight
and also looks at more aspects than simply the divide of higher versus lower cognitive
demand.
The History-Culture dimension is not identified in any way in either the LCD or creative
reasoning frameworks. However, it could be seen to contribute to one of the Project
Maths overarching objectives of the development of ‘a positive disposition towards
mathematics’ (see Figure 3.6).
3.4.4 Project Maths Problem-Solving Syllabus Objectives
The learning objectives of the Project Maths problem-solving syllabus allow the
researcher to see which aspects of the syllabus goals are being addressed by tasks. It
would be reasonable to expect that all problem-solving objectives would be attended to
adequately by a textbook. It would be useful to have a method to distinguish between
familiar and unfamiliar contexts. For the problem-solving syllabus objectives, this would
allow easier classification between the objectives of ‘Apply knowledge and skills to solve
problems in familiar contexts’ and ‘Apply knowledge and skills to solve problems in
unfamiliar contexts’. Similarly when distinguishing between the three objectives use,
select or devise ‘appropriate mathematical models, formulae or techniques to process
information and to draw relevant conclusions’, it would be useful to have some measure
of familiarity. ‘Devise’ would be associated with novel scenarios while ‘select’ and ‘use’
would be used with more familiar tasks.
3.5 Task and Solver
The majority of the frameworks described are very much concerned with the structure
of tasks; it would be useful to give more consideration to the experience of the user

65
when classifying tasks. Berry, Johnson, Maull and Monaghan (1999, p. 109) encounter an
interesting issue when attempting to characterize routine questions. In their words, they
see the implication that routineness is ‘located in a question rather than being a
psychological construct of the relation between an individual, or group and a question’
as problematic and conclude that the psychological relation is likely to be a socio-
psychological one. In other words what is routine for one individual is not necessarily so
for another. Selden, Mason and Selden (1989, p. 45) go some way towards
acknowledging this aspect of human experience by identifying two components in a
problem namely task and solver. A problem is defined by Selden et al. as a non-routine
or novel task if completing it requires finding a method of solution and carrying out such
a method. Selden et al. (1989, p.45) describe a solver as ‘usually a person, but possibly a
group of persons or a machine’. Selden, Selden and Mason (1994, p.67) take the view
that while some problem-solving studies do not explicitly mention the solver, it is
essential to consider the solver and the skills and information that is brought to a task
when examining a mathematical task. They point out that ‘tasks cannot be classified as
problems independent of knowledge of the solver’s background’ (p. 67).
They also make a distinction between problems and exercises, stating that exercises are
typically found at the end of sections in textbooks and claim that traditional calculus
courses contain few cognitively nontrivial problems. The implication is that exercises test
routine skills while problems examine the ability to cope with non-routine material. The
term ‘cognitively nontrivial’ is given to tasks where the solver does not begin knowing a
method of solution. Selden et al. (1989, p. 46) note that the solving of such cognitively
nontrivial tasks or problems, as opposed to exercises, necessitate the use of skills and
they identify that there is a tendency when such tasks are presented in textbooks for the
problems to be divided into smaller parts whenever possible. These smaller parts are
accompanied by the use of algorithms, sample solutions and examples wherever
possible. The use of these devices results in problems, that were intended to be novel
and challenging, becoming routine. Selden et al. describe solving a problem as finding a
method of solution, possibly an algorithm, and carrying it out. Most importantly, Selden
et al. (1989, p.45) highlight the fact that the solver ‘comes equipped with information
and skills, perhaps misconceptions, for attempting the task.’ The result being that novel

66
problems cannot be solved twice by the same person without a loss of novelty, as the
solver would possess a method for solution the second time.
Berry et al.’s (1999) and Selden et al.’s (1989) work suggests that a solver’s previous
experience is worthy of attention. It is clear that this is something that should be
considered when attempting to classify tasks using various frameworks. The Levels of
Cognitive Demand framework acknowledges the notion of the solver’s familiarity with a
task by making reference to ‘prior experience’ but does not provide explicit criteria for
judging how such experience can be gauged. Similarly, Lithner’s characterisation of
imitative and creative reasoning refers to the presence of novelty and tasks being seen
as familiar by the solver. However an explicit measure of familiarity is not provided.
When looking at the Project Maths Objectives, it is useful to have an insight into the
novelty of a task when determining whether it is a problem or not. The objective ‘apply
knowledge and skills to solve problems presented in familiar/unfamiliar contexts’ has
been divided into two objectives as to whether the contexts involved are familiar or
unfamiliar. A measure of novelty would facilitate making such a distinction as to
whether contexts are considered familiar or unfamiliar. At the start of this chapter, I
identified one of the main recommendations of Herbst and Chazan’s (2012) elaboration
of the instructional triangle is that improvement in instruction could be brought about
by engaging students in novel tasks. Given the importance attached to the solver’s
previous experience by Selden et al. and the use of novel tasks by Herbst and Chazan, it
appears that there is a need for greater consideration of novelty and its measurement in
terms of what experience the solver brings to a task.
3.6 Creation of Novelty Framework
The motivation to design a framework which allows for the novelty in a task to be
measured, based on the experience built up by the solver, has been described above. I
searched for a framework to measure novelty that could be used to classify textbook
tasks but could find no evidence of one in existence at that time. Prior to this, I
constructed a simpler index for familiarity of questions on Mathematics state
examinations, using the number of times a topic had occurred in preceding years
(O’Sullivan, Breen and O’Shea, 2012).This experience was then built upon to create a

67
novelty framework. In doing so, it was necessary to consider a number of elements
before finalising the criteria for classifying tasks.
To start a pilot set of tasks from each of the textbooks was considered. For each task in
this set, the features of the task were identified clearly. These included whether the
response to a task involved using a procedure or formula, proving a mathematical
statement, constructing or interpreting a diagram, using a definition, investigating
mathematical properties and so on. Having considered these features of the tasks and
examined the skills necessary for solution, the experience gained by the solver from
expository material, the preceding examples, and previous exercises within the same
textbook chapter was considered. Definitions, explanation of key words provided,
exemplars demonstrating key concepts and illustration of methods of solution for
problems were all examined. Previous chapters were not inspected as, anecdotally, it is
not usual in Irish schools for the teacher to follow the order of the textbook in a linear
fashion and thus it is not possible for us to say which chapters a student would already
have encountered. Also for practical reasons, a limitation had to be placed on the
amount of material that was to be examined. In all three textbook series studied here,
the topic of Pattern, Sequences and Series is covered in a single chapter while
Differential Calculus was spread over several chapters. Of course, students could have
other experiences but the taxonomy presented here is confined to the material
contained in one textbook chapter only. My two supervisors and I classified the pilot
tasks independently. Then the three sets of individual classifications were compared and
elements influencing the choice of classifications were discussed. This analysis was
carried out repeatedly using other sample sets of tasks on various topics, and in
different chapters of each textbook in order to consider all scenarios that could be
encountered when classifying tasks for novelty. The criteria for classification were
revised as necessary to account for all new aspects of novelty observed. In this way, the
three classifications of ‘novel’, ‘somewhat novel’ and ‘not novel’ as presented in Figure
3.9 were eventually agreed upon. It was decided that individual questions which were
presented as multiple parts of a textbook task would be considered as stand-alone tasks.
Only preceding tasks and exemplary material are to be considered when looking at the
impact of earlier material on tasks that make up multiple parts of a single question.

68
3.7 Description of Framework for Measuring Novelty
For this framework, skills are taken to refer to the methods and techniques used in the
solutions to tasks.
Novel
(i) Skills involved in finding the solution are not familiar from preceding
exercises or from any previous point in the chapter being analysed.
(ii) The mathematical concept involved is not familiar from previous exercises or
examples.
(iii) Significant adaption of the method outlined in examples and exercises must
be made in order to get the required solution.
Somewhat Novel
(i) The presentation of the task makes the question appear unfamiliar. However
its solution requires the use of familiar skills.
(ii) The context (perhaps the use of an unfamiliar real-world situation) makes the
task appear unfamiliar but familiar skills are used in its solution.
(iii) A new feature or aspect of a concept is encountered but the solution to the
task only involves the use of familiar skills.
(iv) A minor adaption of the method outlined in the examples has to be made in
order to get the required solution. The skills required are familiar but the use
or application of such skill is slightly modified.
Not Novel
(i) The presentation, context and concepts of the task are familiar.
(ii) The solution to the exercise or problem has been modelled in preceding
exercises or has been encountered earlier in the same chapter.
(iii) The skills required are very familiar to the user and the method of solution is
clear due to the similarity between the exercise and preceding examples and
exercises.
Figure 3.9: Framework for classification of novelty in tasks encountered in textbooks.
Please note it is not necessary for all characteristics in the description of the categories
to apply in order for a task to be classified under a particular label. However as many

69
characteristics as possible should be identified before settling on a particular
classification and there should be sufficient evidence to justify the placement of the task
in one category rather than another.
The following is an outline of each of the three terms used in the novelty framework and
described briefly in Figure 3.9. It gives a description of how the researcher can
differentiate between the different categories.
Novel
A task is said to be ‘novel’ when, to find its solution, the solver requires skills or
mathematical concepts that have not been covered in preceding tasks or at any previous
point in the chapter being analysed. There cannot be any substantial similarity between
the given task and the previous examples or tasks in this case.
A ‘novel’ task should be original and essentially demand a new form of thinking from the
solver that has not been encountered before within that chapter. This includes a
situation where a task requires a different method of solution to the one the solver is
familiar with from the contents of the chapter, or when the solver has to make a
significant change or alteration to the method that is familiar in order to find the
required solution.
Once a ‘novel’ question has been encountered, it diminishes the novelty of any similar
question that follows it. While a task may be ‘novel’ when first encountered, any similar
task that follows it or which requires a similar approach can no longer be classified as
‘novel’.
Somewhat Novel
If there is only a superficial difference between preceding examples and the task in
hand, then it is labelled as ‘somewhat novel’. For instance, the presentation of the
question may be different to preceding examples but when the solver goes about
solving the task, it is apparent that the skills required are quite familiar from the
preceding exposition, examples or earlier tasks in the chapter. Such differences can
occur when a task is presented in a different context, such as a real-world scenario,
which can serve to render the task unfamiliar to the solver initially. There can be some
difficulty for the solver when first encountering the task but this is diminished once the
familiar material is identified. Such variation necessitates the creation of an
70
intermediate category to acknowledge that a task can have unfamiliar aspects but relies
on skills that are actually quite familiar at that point in the student’s experience.
Not Novel
An exercise or task is ‘not novel’ if its solution has been dealt with in preceding exercises
or other examples in previous parts of the chapter. The task could be a direct repetition
of material covered in examples or very similar to it. If the material is not covered in the
examples immediately preceding a set of exercises, but yet the solver has experience of
it from an earlier part of the chapter, then the task would be classified as ‘not novel’.
By using these criteria, it is suggested that it is possible for the researcher to get a
clearer picture of what a solver has been exposed to in terms of the textbook examples
and previous tasks. This gives an insight into the degree of novelty present when
completing tasks. Such data complements the information provided by the other
frameworks as it allows one to look not only at a task but also at the background against
which it is set. This framework allows one to consider the previous experiences of the
solver within a mathematics textbook chapter and how this impacts upon the solver
when solving a task. A workshop was conducted for the validation of the novelty
framework described here, it will be reported on in chapter 4.

71
Chapter 4 Methodology
4.1 Introduction
This chapter will outline the methodology used for the classification of tasks using the
frameworks described in chapter 3. It will also describe a workshop that was used to
gain external validation for the Novelty framework. I will define the term ‘task’ as used
in this study, explain the choice of mathematical topics and textbook series, discuss the
coding and the efforts made to ensure consistency and reliability of results. Once the
methodology employed in the task analysis has been explained, examples of
classifications using the five frameworks will be provided.
4.2 Definition of a Task
For this work, a task is considered to be an activity where a student interacts with a
mathematical topic by attempting to solve a question either as homework or within the
classroom. This is in keeping with Mason and Johnston-Wilder’s definition (2006, p.4). In
this analysis of tasks, particular attention will be paid to the structure and presentation
of tasks and the skills that students utilise in their interaction with concepts and topics
when attempting to derive a solution. This builds up a picture of the kind of learning that
is promoted by these tasks. Polya (1957, p. 171) and Henningsen and Stein (1997, p.525)
both acknowledge that students’ sense of mathematics develops from their experiences
with the tasks with which they are asked to engage. For the purposes of this study, tasks
are not seen as not being confined to the classroom but are also interacted with when
students complete homework.
4.3 Choice of Topics
This study looks at the topics of Pattern, Sequences and Series, and Differential Calculus:
these two topics were chosen because they are present on both Higher and Ordinary
Level Leaving Certificate Mathematics syllabuses. Also these topics were both present
on the old syllabus and this allows for further comparison between the Pre- and Post-
Project Maths eras. As they are present at both levels, this gives several options for
comparison. It is possible to compare the treatment of the topics in different ways:
across syllabus levels within a textbook series or between different series. The tasks
from this topic are analysed from three textbooks series available on the Irish market:
‘New Concise Maths’, ‘Text and Tests’ and ‘Active Maths’. These three textbook series

72
were selected because they were the first to be published in response to the new
curriculum, while they have also traditionally been the most popular in Irish classrooms.
Publishers declined to release any data in relation to textbook choice and/or usage as it
was judged to be sensitive in a competitive market. Two of these textbooks series have
the same author(s) as before the introduction of Project Maths and for the third
textbook series the pre-Project Maths author was retained as an advisor. This allows for
comparison between the older textbooks and the textbooks introduced in response to
Project Maths. One other textbook entitled ‘Numbers’ was available but it appears that
very few schools opted to use it, judging from a small sample of school book lists
available online, and it is only available for Ordinary level which would limit the options
for comparison. Also it was new to the market which would not allow for comparison
with an older edition. Since the choice of textbooks was made, two textbook series
called ‘Effective Maths’ and ‘Power of Maths’ have been published. The ‘Effective
Maths’ series is only available at Higher Level with no Ordinary Level edition. The ‘Power
of Maths’ series is a recent entry to the market and does offer Higher and Ordinary Level
editions. However the three textbook series analysed in this study have become
established popular choices in Irish classrooms. Although each series of textbooks has
been introduced at both junior and senior cycle, it was decided to focus on the senior
cycle material in particular because of the high-stakes (Leaving Certificate) examination
that accompanies it.
4.4 Selecting Tasks
From the six Pre-Project Maths and six Post-Project Maths textbooks, each chapter
relating to Patterns, Sequences and Series and Differential Calculus was analysed. A total
of 7635 tasks (3584 Pre-Project Maths and 4051 Post-Project Maths) were classified
from the chapters chosen. Tasks from revision sections at the end of chapters were
excluded as anecdotal evidence suggests that teachers tend to focus on the material
within a chapter and use these sections for revising after returning to a topic after some
time. Once the revision sections were excluded, the tasks from all other exercise
sections were analysed. These questions would normally be assigned as classwork or
given to students for homework (Hourigan and O’Donoghue, 2007, p. 471), thus these
tasks provide an insight into the teaching and learning taking place in Irish classrooms. It

73
was necessary to discard some tasks when ambiguity was encountered, for example
where a misprint made it difficult to interpret what a task required. A task was also
omitted from the analysis if the wording led to the possibility of the task being
interpreted in more than one way and such readings led to different solutions. In all, 16
tasks were excluded from classification due to these kinds of ambiguity. Questions
sometimes consisted of several parts and it was necessary to break these up and treat
them as multiple tasks. Several checks were made over time to ensure that what was
treated as a task in one textbook was consistent with the other five textbooks regardless
of how exercises were structured or presented.
4.5 Coding
Each of the 7635 tasks were classified using each of the five frameworks outlined earlier.
Each individual task was examined separately. This involved carefully considering the
features (symbols, wording, context etc.) of a task relevant to a particular framework
and determining the likely solution methods that students would employ. As each
framework focuses on different aspects of a task, it was necessary to conduct each
classification separately to ensure that the tasks were interpreted without any
confusion. The criteria for each framework were applied separately to each task. For the
Novelty framework, each task was placed in one of the three categories: ‘novel’,
‘somewhat novel’ or ‘not novel’ using the criteria described in Figure 3.9 from section
3.7; these classifications were made only after taking into account the preceding
examples and exercises that the student would have encountered in the chapter before
attempting the task. When classifying tasks using the LCD framework, decisions were
made using the list of criteria from figures 3.3 and 3.4 outlined in section 3.3.1, dividing
tasks into four categories HP (procedures with connections to meaning) or DM (doing
mathematics) for Higher Level Demand (HLD) and LP (procedures without connections to
meaning) or LM (memorization) for Lower Level Demand (LLD). With the mathematical
reasoning framework, tasks were labelled as CR (Creative Reasoning) or IR (Imitative
Reasoning). These classifications were determined using the characteristics given in
Figure 3.5 and which were expanded on in section 3.3.2. The tasks were examined very
carefully as to which Project Maths objectives they addressed using Figure 3.8 from
section 3.3.3, as it was important to take into account that more than one objective

74
could be in evidence. Similar care was taken with the dimensions of mathematical
understanding framework, taking note of the experience that the student was gaining
from completing the task. For this latter framework, it was also important to observe
that a task could be placed in more than one category as described in section 3.3.4. Each
task was given a unique code and all classifications and reasons for such classifications
were entered into an SPSS file. The data generated from these classifications were
analysed using SPSS.
The process of coding began during the first year of this study, with the topic of Pattern,
Sequences and Series in the post-Project Maths textbooks using the LCD and reasoning
frameworks. Chapters were broken into manageable sections and the classifications
were reviewed and revised over this time. It took some time to calibrate and establish a
consistent satisfactory understanding of the coding system with these two frameworks.
The key was not to classify too many tasks in a short space of time so that discussion on
the classifications could be facilitated and also ensuring that all relevant aspects of a task
were noted. The experience of working with these two frameworks assisted with the
development of the Novelty framework. Usiskin’s multidimensional model and the
Project Maths problem-solving Objectives frameworks were also introduced during the
second year. By the end of the third year, 1838 post-Project Maths tasks from Pattern,
Sequences and Series taken from the three textbooks series at both Higher and Ordinary
Level had been coded using the five frameworks. During the fourth year, the 1568 pre-
Project Maths tasks on Pattern, Sequences and Series were classified. The topic of
Differential Calculus was then examined towards the end of the fourth year in both the
pre- and post-Project Maths textbooks. This accounted for 2016 and 2217 tasks
respectively, each analysed using the five frameworks. At the end of the fifth year, 7635
tasks had been analysed.
4.6 Inter-rater Reliability
After I had coded the textbook tasks, at least one of my two supervisors also looked at
each task separately and we compared our classifications after each framework analysis
was complete. We then discussed any of the classifications that we had differences on
and gave our perspective on why we analysed them as we did, coming to agreement on

75
how the coding should be applied. Having clarified and resolved our coding, we made
any necessary revisions and reviewed the existing classifications of previous tasks in light
of these revisions, in order to ensure consistency throughout the analysis. This led to a
final set of classifications. This form of internal refinement and quality control is
common practice for this kind of work (Alafaleq and Fan 2014, Edwards 2011).
4.7 Examples of Classification of Tasks using Frameworks
The following provides examples of how the tasks were classified using the five different
frameworks described earlier. Key information justifying why each classification was
chosen is provided after listing the decision that was reached for each framework. The
exemplar material that was provided in the textbooks before each task is listed, as this
can be informative as to the kind of procedures and algorithms that the student has
been exposed to. Moreover, it is necessary to be aware of this material when
considering how the degree of novelty is determined. The formulae available in the
mathematical tables were not considered relevant as any formula encountered by the
students was treated as familiar if it was provided in the exemplar material. I am
presenting examples of tasks from both topic areas. The material for Pattern, Sequences
and Series is taken from Text and Tests and the Differential Calculus examples are taken
from Concise Maths.
4.7.1 Pattern, Sequences and Series
Before classifying any of the tasks in a textbook, it is necessary to consider all of the
previous exercises completed and any expository material that is available. For each of
the sample tasks that follow, the preceding exemplar material is provided.

76
Figure 4.1: Exemplar material 1 from Text and Tests 6 (Higher Level) pg. 145
Figure 4.2: Exemplar material 2 from Text and Tests 6 (Higher Level) pg. 145

77
4.7.1.1 Classification Example 1:
20Find S and of the following arithmetic sequence:
1 5 9 13 ...
n S
Figure 4.3: Text and Tests 6 Exercise 4.3 Q 1 pg. 149
Project Maths Objectives:
There is one of the Project Maths learning objectives in evidence here.
Use appropriate mathematical models, formulae or techniques to process
information and to draw relevant conclusions: the student can use the relevant
formula in order to get the required solution.
Novelty:
‘Not Novel’: This task is ‘not novel’ as it is very similar to example 2 in figure 4.2
in terms of finding the nth sum and example 1 in figure 4.1 for evaluating the
sum. These examples outline the algorithm for finding the sum of terms in an
arithmetic series. This question could be answered using the same algorithm.
Levels of Cognitive Demand:
Lower level demand: (‘Procedures without connections to meaning’) This could
involve the use of an algorithm. The student might substitute in the values in
order to get the required solution.
Imitative v Creative Reasoning:
Imitative Reasoning: The student has an algorithm that could be used to find the
required solution.
Dimensions of Mathematical Understanding:
This exercise makes use of one of Usiskin’s dimensions, which is Skill-Algorithm.
Skill-Algorithm: The user could replace the terms in the formula with the values
observed for a, d and n. To get the second part of the answer, the value of n
could also be substituted.

78
Figure 4.4: Exemplar material 3 from Text and Tests 6 (Higher Level) pg. 146

79
Figure 4.5: Exemplar material 4 from Text and Tests 6 (Higher Level) pg. 146-147
Note that the exemplar material (examples 1 and 2) shown in figures 4.1 and 4.2
occurred before the following exercise also.

80
4.7.1.2 Classification Example 2:
Figure 4.6: Text and Tests 6 (Higher Level) Exercise 4.3 Question 15 pg. 150
Project Maths Objectives:
There are two Project Maths learning objectives relevant here.
Apply knowledge and skills to solve problems in unfamiliar contexts: The
mathematical context might not be familiar to the student and further
investigation might be necessary to determine how to solve it.
Devise appropriate mathematical models, formulae or techniques to process
information and to draw relevant conclusions: The student might find it
necessary to think carefully and devise a suitable approach to the question.
Novelty:
‘Novel’. This exercise does not draw on anything specific from the examples or
the preceding exercises. It may be unfamiliar to the user and require a high
degree of investigation and experimentation before solving the task in the
manner required.
Levels of Cognitive Demand:
Higher level demand (‘doing mathematics’): Complex thought may be required
on the part of the user in terms of how to approach the exercise and find the
necessary expression.
Creative vs. Imitative Reasoning:
Creative Reasoning: The user might look at the terms of a series in terms of a and
d. The link between l and a+ (n-1) d could be established by the student after
investigation. The task is novel as the user does not have a clear way into the
question. It is flexible as the user chooses how to approach the question. There is

81
also a mathematical foundation present as the user might explore the properties
of a series and how the sum of a series is found.
Dimensions of Mathematical Understanding:
Two of Usiskin’s dimensions are relevant here, namely Skill-Algorithm and Property-
Proof.
Skill-Algorithm: the user might write out each term of the arithmetic series in
terms of a and d.
Property-Proof: The user could look at the arithmetic series in terms of a and d
and include the nth terms. It may be necessary for the user to think about the
last term and how it would be expressed in terms of a, d and n.
Figure 4.7: Exemplar material 5 from Text and Tests 6 (Higher Level) pg. 148

82
4.7.1.3 Classification Example 3
Write the following sequence in sigma notation
4+8+12+16+…+124
Figure 4.8: Text and Tests 6 (Higher Level) Exercise 4.3 Question 7 pg. 149
Project Maths Objectives:
Use appropriate mathematical models, formulae or techniques to process
information and to draw relevant conclusions: A model is used to rewrite the
series in sigma notation
Novelty:
‘Not Novel’: This task is ‘not novel’ as it is very similar to example 5 in figure 4.7.
The example outlines an algorithm for using sigma notation to represent a
sequence. This question could be answered by using the same algorithm.
Levels of Cognitive Demand:
Lower level demand (‘Procedures without connections to meaning’): Student
could use an algorithm to write the sequence in the required format.
Creative vs. Imitative Reasoning:
Imitative Reasoning: The user can use an algorithm to write the sequence as
requested.
Dimensions of Mathematical Understanding:
One of Usiskin’s dimensions is relevant here, namely Skill-Algorithm.
Skill-Algorithm: As above, the user can use an algorithm demonstrated in the text
to write the sequence as requested.

83
4.7.1.4 Classification Example 4
Figure 4.9: Text and Tests 6 (Higher Level) Exercise 4.3 Question 10 pg. 149
This is the classification for part (i) How many rings will he need for design 10?
Project Maths Objectives:
There are three Project Maths learning objectives relevant here.
Select appropriate mathematical models, formulae or techniques to process
information and to draw relevant conclusions: The student might find it
necessary to choose between different available models. The user could use a
formula or continue to draw designs to find the required number of rings.
Analyse information and translate it into mathematical form: The information
given in the question is read and it is interpreted mathematically so that the
required solution can be found.
Explore patterns and formulate conjectures: The student could explore the given
designs and identify the pattern in order to determine the number of rings in
later designs.

84
Novelty:
‘Not Novel’. The student is reliant on familiar skills established from solving tasks
involving patterns in the preceding exercise set 4.2. At face value, the context
could be viewed as unfamiliar but given the previous exposure to this type of
task, the novelty is diminished. An example of this kind of similar task, which
would have been solved by the student previously, is given below in figure 4.10.
(i) How many red and orange tiles will she need for design 8?
Figure 4.10: Text and Tests 6 (Higher Level) Exercise 4.2 Question 5 pg 142-143
Levels of Cognitive Demand:
Lower level demand (‘procedures without connections to meaning’): The student
could complete this by counting the number of rings and then using an algorithm
to find the value of the tenth term without considering the underlying
mathematical foundations.
Creative vs. Imitative Reasoning:
Imitative Reasoning: The user might complete this without giving due
consideration to the mathematics involved by imitating the previous exercises
that were solved in the tasks for exercise set 4.2, here the student identifies the
numerical value of the first three terms and then calculates the value of the
tenth term using a formula.
Dimensions of Mathematical Understanding:
Three of Usiskin’s dimensions are relevant here, namely Skill-Algorithm, Use-Application
and Representation-Metaphor.

85
Skill-Algorithm: the student might use the formula for an arithmetic sequence to
find the rings needed for the tenth design.
Use-Application: The dreamcatcher and its design are set in a real life situation.
Representation-Metaphor: The question is presented using pictures of designs 1-
3 rather than a numerical sequence. The student might draw more of the designs
to explore the pattern and determine how many rings are needed for the tenth
design.
4.7.2 Differential Calculus
2
2
2
2
2
Example
2If , show that 0 for all 1.
1
Solution:
2y =
1
(1 )(2) (2 )( 1) (quotient rule)
(1 )
2 2 2=
(1 )
2
(1 )
2Since 2 > 0 and (1 ) 0 for all 1, it follows that 0
(1 )
f
x dyy x
x dx
x
x
dy x x
dx x
x x
x
x
x xx
2
2
or all 1.
0 for all 1.
Note: any real number will always be a positive number unless the
number is zero. (1 ) 0 for all 1.
x
dyx
dx
x x
Figure 4.11: Exemplar material 6 from New Concise Project Maths 4 (Higher Level) pg.
416

86
4.7.2.1 Classification Example 5 3Let ( ) 4 2
Explain why this function is bijective.
f x x x
Figure 4.12: New Concise Project Maths 4 (Higher Level) Exercise 15.2 Question 2 (ii)
pg. 416
Project Maths Objectives:
Select appropriate mathematical models, formulae or techniques to process
information and to draw relevant conclusions: The student has several models to
choose from when establishing that the function is bijective. The property could
be established by examining the derivative or drawing a graph of the function.
Explain findings: An explanation is requested
Apply knowledge and skills to solve problems in familiar contexts: It is not
immediately obvious as to how to determine that the function is bijective.
However the student has built up knowledge of derivatives and how to use them
to establish that functions are increasing so this can be applied to explain why
f(x) is bijective.
Novelty:
‘Novel’: The task has not been modelled in the chapter.
Levels of Cognitive Demand:
Higher level demand (‘Procedures with connections to meaning’): Student could
decide to use a procedure like finding the derivative to show that the function is
always increasing or the ‘Horizontal Line Test’ to show that it is both injective
and surjective.
Creative vs. Imitative Reasoning:
Creative Reasoning: The student may have to draw on creative reasoning to
establish the properties of the function. The student may find the derivative of
the function and establish that it is always increasing. This will then have to be
linked to the criteria for a bijective function.

87
Dimensions of Mathematical Understanding:
Two of Usiskin’s dimensions are relevant here, namely Skill-Algorithm and Property-
Proof.
Skill-Algorithm: The student might possibly find the derivative and establish that
the function is always increasing using the skills developed earlier in the chapter.
Property-proof: The student will have to establish some property to show it is
bijective, this could be done without drawing the graph of the function
4.7.2.2 Classification Example 6
2 3
An artificial ski slope is described by the function
165 120 60 10
where is the horizontal distance and is the height of
the slope. Show that the ski slope never rises.
h s s s
s h
Figure 4.13: New Concise Project Maths 4 (Higher Level) Exercise 15.2 Question 8 pg.
417
Project Maths Objectives:
Use appropriate mathematical models, formulae or techniques to process
information and to draw relevant conclusions: A model could be used to find the
required derivative and obtain the required form.
Apply knowledge and skills to solve problems in unfamiliar contexts: The student
has experience working with this kind of function but has not encountered this
kind of real life context before.
Novelty:
‘Somewhat Novel’: The skills required are similar to a previous question in this
exercise set whereby the student was asked to show that
2 30 for all where y = 10 3 3 .dy
x R x x xdx
The unfamiliar presentation comes from the task being set in a real life context.

88
Levels of Cognitive Demand:
Higher level demand (‘Procedures with connections to meaning’): Student can
use an algorithm to find the required derivative and get the negative square form
but must link it to the function’s decreasing. By establishing that the function is
always decreasing, they are interacting with the mathematical foundations.
Creative vs. Imitative Reasoning:
Creative Reasoning: An algorithm can be used to differentiate and factorise the
expression, however to use this is not immediately obvious as the context
requires creative thought. The student has not encountered the idea of ‘never
rises’ previously and must consider how to establish this mathematically.
Creative reasoning is required to resolve the requirements of the task and then
answer it.
Dimensions of Mathematical Understanding:
Three of Usiskin’s dimensions are evident here.
Skill-Algorithm: the student can use a model to find the derivative and to prove
that the function is always decreasing.
Property-Proof: Proving that the ski slope never rises. (Function always
decreasing).
Use-Application: The ski slope is a real life situation.
4.7.2.3 Classification Example 7
Let ( ) sin . Show that '( ) 0 for 0 .2
f x x x f x x
Figure 4.14: New Concise Project Maths 4 (Higher Level) Exercise 15.2 Question 7 pg.
417
Project Maths Objectives:
Use appropriate mathematical models, formulae or techniques to process
information and to draw relevant conclusions: A model can be used to get the
required derivative. Students then need to consider when a particular inequality
is satisfied.

89
Apply knowledge and skills to solve problems in familiar contexts: The student
knows how to differentiate the function. However, it is necessary to link
knowledge of derivative to that of the behaviour of the trigonometric function
cos (x) in order to determine whether the inequality holds or not for the given
domain.
Novelty:
‘Somewhat Novel’: Differentiating and solving is familiar but deciding where the
inequality holds is a new aspect of the solution method.
Levels of Cognitive Demand:
Higher level demand (‘Procedures with connections to meaning’): Student would
need to connect their knowledge of derivatives to their knowledge of the
behaviour of certain functions. Although it is possible to find the derivative by
rule, it is still necessary to consider the behaviour of the cosine function.
Creative vs. Imitative Reasoning:
Creative Reasoning: Creative reasoning could be needed to check the extent of
the solution set of the inequality; this could require creative reasoning especially
when no prior experience of this type of analysis has been established.
Dimensions of Mathematical Understanding:
Two of Usiskin’s dimensions is relevant here, namely Skill-Algorithm and Property-Proof.
Skill-Algorithm: the student uses a model to find the derivative.
Property-Proof: the student proves that the derivative is increasing within a
certain domain.
In this section, I have outlined the methodology used in the analysis of tasks from the
textbook series, and given some examples of the type of analysis carried out. In the next
chapter, I will present the results of this analysis.
4.8 Validation of the Novelty Framework
This section outlines a workshop that was conducted to validate the Novelty framework.
The framework was designed to assist with addressing the research question: what

90
degree of novelty is incorporated into the textbook tasks? The validation workshop was
held to determine whether the Novelty framework was clearly described and could be
used effectively and reliably. In the workshop, five researchers with an interest in
mathematics education independently classified tasks drawn from two textbook
chapters used in the main study. They were then invited to complete a questionnaire in
relation to their experience of using the framework. Participants were asked if the
framework was easy to use and they were invited to describe any difficulties
encountered in its use. The questionnaire also asked if they agreed with the descriptions
of ‘novel’, ‘somewhat novel’ and ‘not novel’ used in the framework. This was followed
by a group discussion where participants expanded on their views and gave a more
detailed account of using the Novelty framework.
4.8.1 Format of the Workshop
4.8.2 Codebook
Codes are defined as ‘‘tags or labels for assigning units of meaning to the descriptive or
inferential information compiled during a study’’ (Miles and Huberman, 1994, pg. 56).
Prasad (2008, pg. 187) informs us that ‘coding the unit of analysis into a content
category is called coding. Individuals who do coding are called coders.’ A codebook is a
set of codes, definitions, and examples used as a guide to help analyse data (DeCuir-
Gunby, Marshall and McCulloch, 2011, pg. 138). Lin and Jeng (2015, pg. 91) emphasise
that the researcher conducting a coding session with a group ‘will have to create a
procedure instruction and guide book for the participating coders’. A codebook provides
not only a guide for coding responses but it also serves as documentation for the layout
and code definitions of a data file (Lavrakas, 1988, p.100). DeCuir-Gunby, Marshall and
McCulloch (2011, pg. 138) advise that the ‘more specificity in a codebook, the easier it is
for coders to distinguish between codes and to determine examples from nonexamples
of individual codes’. They also recommend that the more detailed the codebook, the
more consistency there will be among coders when using it to code data.
The codebook that I created described the three different levels of novelty in my
framework and provided a guide as to how to distinguish between each category (see
Appendix A). Definitions of the terms to be used during the coding were provided. The

91
units of data collection were identified as a textbook exercise or a smaller part of a
multi-part exercise. The codebook also outlined how each task or unit of data was
identified. It was important to have two identifiers for the tasks involved. One was a
chronological list of the tasks to be used within the workshop so that it would be easy to
locate a particular task. The original exercise numbers were also retained, to easily
compare the classifications of the workshop participants with earlier classifications by
the author. The codebook also contained expository material and worked examples on
one topic from one of the textbooks. I decided to use the topic of Pattern, Sequences
and Series in the codebook because it was more compact than Differentiation in terms
of expository material and thus deemed more suitable for a workshop in which time was
limited. Five sample tasks were included, accompanied by worked solutions and
suggested classifications. A sample coding form was also included which demonstrated
how the classification for each sample task could be recorded.
4.8.3 The Coders
In order to identify a suitable number of independent coders, I reviewed relevant
literature in relation to coding. Alafaleq and Fan (2014) investigated how the national
middle school mathematics textbooks in Saudi Arabia represent problem-solving
heuristics and they established a framework for coding heuristics into different
categories relating to how students would be encouraged to solve the textbook
problems. The reliability of their coding was checked with a single external coder who
also coded all the problems. The coding result by the independent coder was compared
with that obtained by the researchers. Inter-rater agreement was measured using the
Intra-class Correlation Coefficient (ICC), a statistic of 0.98 was achieved on heuristics and
0.97 was recorded on heuristics existence in each book, indicating a high agreement in
coding. Similarly, Mailizar and Fan (2014) also made use of one external coder when
examining how mathematics textbooks in Indonesia reflect authentic learning. They
designed a framework that classified tasks into categories such as authentic, semi-
authentic, real-authentic or non-authentic. Again the coder was invited to code all the
problems, in an effort to establish the reliability of the original coding. Like the previous
study, the ICC was used to get some indication of the inter-rater agreement. For
authentic tasks, an ICC of 0.789 was recorded, an ICC of 0.771 was found for semi-

92
authentic tasks while real-authentic tasks had an ICC of 0.702. As the ICC between the
researchers and the coder, for each type of task, was higher than 0.7, this suggested that
the results were reasonably reliable. Neither of these two studies, unlike the Novelty
framework workshop, made use of a questionnaire or discussion, instead focusing solely
on the reliability of the original coding.
Edwards (2011) in his unpublished PhD thesis examined how successful students are at
accurately generating examples of sequences satisfying certain combinations of
properties, while also investigating the qualitative variation in students' experiences of
sequence generation. To address these research questions, he designed a coding
scheme. Two of his colleagues were asked to independently code interview data in order
to validate his coding scheme. As part of his validation exercise, the two mathematics
education researchers were presented with new data to code within the framework, and
were then asked to reflect on their chosen classifications and the validity of the
framework. Both researchers provided feedback on the structure and content of the
dimensions presented in the scheme and expressed opinions as to how appropriate the
coding was to the data and whether it succeeded in providing insight into the data.
Unlike the two previous studies, he did not calculate a reliability coefficient.
Seven researchers with a background in mathematics education were invited to
participate in a Novelty framework validation workshop. This was to ensure as many
different perspectives as possible were incorporated. Five were able to attend on the
selected day, each of whom had some level of exposure to post-primary mathematics
education in Ireland. Four of the participants had taught mathematics at second level in
Ireland and would have some familiarity with mathematics textbooks at second level.
None of the coders had previous experience of working with the Novelty framework.
Each coder was sent a copy of the codebook in advance of the workshop. The coders will
be known individually hereafter as Coder 1, Coder 2 … Coder 5 when discussing findings
from the workshop.
4.8.4 Outline of the Workshop
The face-to-face workshop lasted for three hours, with all participants present at the
same time. It was broken into five stages - namely, a presentation on the Novelty

93
framework criteria, working with practice tasks, the coding of tasks using the Novelty
framework, the completion of a questionnaire and a discussion on participants’
experience of using the framework. There was a short break between stages. The
presentation lasted forty five minutes, twenty minutes was spent working with practice
tasks while ninety minutes was given to the remaining stages. The coding of tasks and
completion of the questionnaire was completed within seventy minutes while twenty
minutes was given to the discussion.
The presentation on the Novelty framework provided the opportunity for coder training,
whereby each participant in the workshop was informed of the framework’s coding
scheme and how it should be applied. Working with practice tasks was also considered a
critical stage in the workshop as it acted as a pilot test. This provided an important
opportunity to ensure consistency before coders were asked to apply the framework to
the full data. The result of pilot testing helps to identify inconsistencies between coders
or to discover other inadequacies in terms of category construction or its description
(Prasad, 2008). Triangulation lends credibility to the findings by incorporating multiple
sources of data, methods, investigators, or theories (Erlandson, Harris, Skipper and
Allen, 1993). Aside from the coding of tasks by the five participants, the questionnaire
and group discussion also provided valuable insight into the description of the Novelty
framework and how easy it was to apply.
4.8.5 Presentation on the Novelty Framework Criteria
The workshop began with a presentation where I explained the criteria necessary for
classification using the Novelty framework. I outlined a number of issues that coders
should be conscious of when classifying tasks. In particular I emphasised that the term
‘skills’, in the framework, is taken to refer to the methods and techniques used in the
solutions to tasks. I made it clear that it was not necessary for all characteristics in the
description of a category to apply when deciding on a classification. Each coder was
encouraged to establish sufficient evidence so as to distinguish between the different
categories, by finding as many relevant characteristics as possible before settling on a
particular classification. Attention was also brought to the fact that when classifying with

94
the framework, commonly used skills like calculating slope or finding area with a formula
are taken to be familiar from junior cycle.
The five sample tasks were then presented to participants in order to demonstrate how
the author had applied the Novelty framework to classify these tasks. A method of
solution appropriate for sample task 1 (see appendix A.2) had been modelled in a
previous example in the expository material and so the skills were very familiar, thus the
suggested coding was ‘not novel’. Sample task 2 was very similar to the previous task
and the presentation, context and concepts of the task were familiar, which would
suggest that it should be coded as ‘not novel’. Sample task 3 was used to show how the
presentation of a task could provide an unfamiliar appearance yet the solution was
reliant on familiar skills once a slight modification was made to the solution method
already demonstrated in the text. According to the framework, this would place the task
in the ‘somewhat novel’ category. A new aspect of the concept (the presence of powers)
was present in sample task 4. As the solution required the use of familiar skills, this task
was classified as ‘somewhat novel’. The final example, sample task 5, required the use of
unknown values and simultaneous equations which necessitated a significant adaption
of the method given in the examples. Using the framework, I recommended that the
task be classified as ‘novel’. The coders were invited to ask questions at this point in
order to clarify any confusion or discuss any of the five suggested classifications in more
detail.
4.8.6 Working with Practice Tasks
The coders were then given the opportunity to code four practice tasks and record their
classifications on a coding form. The expository material was taken from the Ordinary
Level textbook in the Concise Maths series. These four tasks were chosen to be
representative of what the coders would encounter in the actual coding exercise in the
next phase of the workshop. I had previously coded each of these four tasks in the main
study. The first was intended to be regarded as not novel, with the second being
interpreted as somewhat novel. The third task in this set was an important inclusion
because, had it appeared before the second task, it would have been expected to be
labelled as ‘somewhat novel’ but given its similarity to the second task and the

95
experience garnered in completing that task, the novelty would be diminished. The
coders were expected to recognise this and opt for a lower level of novelty. It was
important to bring coders’ attention to this explicitly because it demonstrates the
impact of the experience of completing previous tasks and how this is accounted for in
the framework. Finally the last task provided was one which had been classified by the
author as ‘novel’.
After the coders had completed their analysis of the practice tasks, the group shared
their classifications and discussed what features of the skills, presentation and concept
influenced their coding. This was in effect our pilot coding, in the sense that the coders
were allowed to interact and share their experiences and highlight any ambiguities in
the descriptions of the framework categories. It also allowed the opportunity to
emphasise that the three categories were intended to be mutually exclusive and coders
should strive to distinguish between neighbouring categories such as ‘novel’ and
‘somewhat novel’ or ‘somewhat novel’ and ‘not novel’ as much as possible.
4.8.7 Choice of Tasks
To choose the final set of tasks which would be used for the validation of the
framework, I conducted an overview of the novelty of the two topics over the three
textbook series. It was important to choose tasks that would be readily accessible to
new coders and allow them to identify skills quickly without feeling overburdened or
encountering confusion when identifying skills in the worked examples.
When selecting the tasks, I observed that an early section on Differential Calculus of the
Higher Level Text and Tests textbook contained a representative mixture of the three
novelty categories, according to my own results, for coding. To balance this I chose the
Ordinary Level Concise Maths textbook on the topic of Patterns, Sequences and Series.
This featured tasks that were predominantly ‘not novel’ but also contained tasks that I
had previously classified as ‘somewhat novel’. Having chosen expository material and
worked examples, I had to decide on the number of tasks that the coders would be
asked to work on. If too many were chosen, it would risk coder fatigue and if an
insufficient number was selected it would be unrepresentative. I opted for 30 tasks. I

96
made the decision to abridge the section from Text and Tests by removing three tasks.
This gave a total of fifteen tasks on differential calculus. I limited the tasks from Concise
Maths to fifteen on patterns, sequences and series. The final subsample contained tasks
whose classifications were expected to span the three categories in the Novelty
framework; from the coding of these thirty tasks with my supervisors originally, we had
agreed that 20 were Not Novel, 8 were Somewhat Novel and 2 were Novel. This
suggested that the coders in the workshop would have the opportunity to classify tasks
from each of the three categories of novelty as well as classifying tasks from both Higher
and Ordinary Level. The 30 tasks that were coded on the day of the workshop, along
with the relevant expository material can be found in Appendix A.
4.9 Coding Results
Table 1 indicates the classification that each coder gave to the specified task.
1= Novel, 2 = Somewhat Novel, 3 = Not Novel, NC = Not Classified

97
Task Original
Coding by
author and
supervisors
Coder
1
Coder
2
Coder
3
Coder
4
Coder 5 Levels of
Agreement
amongst
coders
1 3 3 3 2 3 3 4 out of 5
2 2 2 2 2 2 2 5 out of 5
3 2 2 2 2 2 2 5 out of 5
4 3 3 3 3 3 3 5 out of 5
5 2 2 2 2 2 2 5 out of 5
6 3 3 3 3 3 3 5 out of 5
7 3 3 2 2 3 3 3 out of 5
8 3 3 3 3 2 3 4 out of 5
9 3 2 3 3 3 3 4 out of 5
10 3 3 3 3 3 3 5 out of 5
11 3 2 2 3 2 3 3 out of 5
12 3 3 3 3 3 3 5 out of 5
13 2 2 2 3 2 2 4 out of 5
14 3 3 3 3 3 3 5 out of 5
15 3 3 3 3 3 2 4 out of 5
16 2 3 3 2 2 3 3 out of 5
17 3 3 3 3 3 3 5 out of 5
18 3 2 2 3 3 2 3 out of 5
19 3 2 3 3 3 3 4 out of 5
20 3 3 3 2 3 3 4 out of 5
21 3 3 3 2 3 3 4 out of 5
22 2 2 2 2 3 3 3 out of 5
23 1 1 1 2 1 1 4 out of 5
24 2 3 3 2 1 2 Split
25 3 3 2 NC 2 2 3 out of 5
26 2 2 2 2 3 2 4 out of 5
27 3 3 3 3 3 3 5 out of 5
28 3 3 2 3 2 3 3 out of 5
29 3 3 3 3 2 3 4 out of 5
30 1 1 1 2 1 1 4 out of 5
Table 1: Classifications of coders from Novelty framework validation workshop

98
Coder Novel Somewhat Novel Not Novel
Author and
Supervisors
2 Tasks (6.66%) 8 Tasks (26.66%) 20 Tasks (66.66%)
Coder 1 2 Tasks (6.66%) 10 Tasks (33.33%) 18 Tasks (60%)
Coder 2 2 Tasks (6.66%) 11 Tasks (36.66%) 17 Tasks (56.66%)
Coder 3 0 Tasks (0%) 13 Tasks (43.33%) 16 Tasks (53.33%)
Coder 4 3 Tasks (10%) 8 Tasks (26.66%) 19 Tasks (63.33%)
Coder 5 2 Tasks (6.66%) 9 Tasks (30%) 19 Tasks (63.33%)
Table 2: percentage of the 30 tasks in each of the three categories for each coder
The coders were unanimous on 10 tasks out of the total 30, 8 of these were taken from
the Ordinary Level textbook on Pattern, Sequences and Series while 2 belonged to the
differential calculus section taken from the Higher Level textbook. Of the remaining
tasks, 4 coders out of the 5 agreed on 12 of the tasks with 3 agreeing on 7 tasks. This
meant that a majority of coders classified 29 tasks in the same way. Task 24 was unusual
in that it was the only one that was classified with all three of the novelty categories and
it was the only task not to achieve a majority consensus in its classification. Coder 3 did
not classify any tasks as ‘novel’, this resulted in the ‘novel’ category not receiving a
unanimous classification for any task unlike the other two categories. The most common
disagreement in the coding was between labelling tasks as ‘somewhat novel’ or ‘not
novel’. Coder 5 deviated from the majority the least with a differing code just twice,
coder 1 was in the minority four times and Coder 2 had a differing classification to the
majority three times. In contrast Coder 4 was in the minority ten times while coder 3
disagreed with the majority’s classification nine times.
When comparing the coders’ classifications with my original classification completed in
conjunction with my two supervisors, 10 tasks had absolute agreement between the
coders and ourselves. It was found that 4 coders agreed with our classification on
another 12 tasks. For 3 tasks, 3 coders agreed with our original analysis. This meant that
a majority of the coders agreed with our original classification on 25 of the 30 tasks.
There was much less agreement on tasks 11, 16, 18, 24 and 25. Each of these will be
discussed individually.

99
We originally classified task 11 (see exercise 11, section 9.1, appendix A.5) as ‘not novel’,
only two coders agreed with this and the majority coded it as ‘somewhat novel’. In our
classification, we felt that the concept, skills and method of solution had been modelled
in the worked example provided. The coders appeared to feel that the requirement for
subtraction involved the introduction of a new concept.
With task 16 (see exercise 1(i), section 2.1, appendix A.5) only 2 coders agreed with our
classification that it was ‘somewhat novel’, with the majority of 3 coders regarding it as
‘not novel’. When originally classifying this task, we felt that the presentation of the task
made the task appear unfamiliar yet its solution was dependent on the use of familiar
skills. A new feature or aspect of a concept is encountered in the sense that the student
has to find the points on the curves given which is not modelled in the examples, but the
solution to the task then only involves the use of familiar skills. A minor adaptation of
the method outlined in the examples has to be made in order to get the required
solution. The skills required are familiar but the use or application of such skills is slightly
modified. It is likely that the majority of coders felt that it was closely aligned to the
worked examples and the skills were familiar.
The majority of coders also disagreed with our classification of task 18 (see exercise 1
(iii), section 2.1, appendix A.5) as ‘not novel’, 3 coders classified it instead as ‘somewhat
novel’. In the original analysis, we felt that the experience garnered from the two
previous tasks (16, 17) (see exercises 1 (i) and 1 (ii), section 2.1, appendix A.5) meant
that the presentation, context and concepts of the task were now quite familiar. Its
solution had been modelled and the skills required were also familiar. It is likely that the
coders focused on the negative rate of change involved, interpreting it as the
introduction of a new aspect of the concept here.
In the original analysis, task 24 (see exercise 5 (ii), section 2.1, appendix A.5) was
labelled as ‘somewhat novel’. 2 coders felt that it was ‘not novel’ and 1 felt that it was
‘novel’, showing a lot of disagreement. When we classified the task originally, we felt
that the skills required were familiar from preceding exercises but the requirement to
give an estimate of the average rate of growth involved the introduction of a new aspect

100
of the concept, which had not been modelled previously. It is likely that the 2 coders
labelling it as ‘not novel’ did not view the requirement for an estimate in the same way,
while the coder labelling it as ‘novel’ did not consider the skills involved in finding the
estimate as familiar.
Task 25 (see exercise 6 (i), appendix A.5) which was based on material familiar from
Junior Cycle brought the greatest disagreement with our classification. Only 1 coder
agreed with our label of ‘not novel’ due to the skills and solution being very familiar
from Junior Cycle. 3 coders felt that it should be classified as ‘somewhat novel’ most
likely due to the introduction of a formula not modelled in the examples and 1 did not
classify it on the grounds that the skills were not familiar from the chapter.
4.10 Inter-rater Reliability
Generalisability, in the sense that results can be replicated and reproduced by others, is
important when seeking to establish that the ratings found are not the idiosyncratic
results of any one individual’s subjective judgement (Mosmery and Barzegar, 2015,
Tinsley and Weiss, 1975). To establish generality, it is necessary to have knowledge of
both inter-rater agreement and inter-rater reliability (Tinsley and Weiss, 1975). Inter-
rater agreement represents the extent to which the different coders tend to make the
exact same judgements about the subject being rated. Inter-rater reliability relates to
the extent of variability and error inherent in a measurement (Gisev, Bell and Chen,
2013, Tinsley and Weiss, 2000).
Recall that the data from the validity workshop is ordinal because there is a natural
order to the terms ‘novel’, ‘somewhat novel’ and ‘not novel’, and that five coders
participated in the validation exercise. The choice of inter-rater agreement and inter-
rater reliability indices to be used here was influenced by the nature of the data and the
number of coders involved. For instance, some indices like Cohen’s Kappa are only
suitable for exactly 2 raters, while the Intraclass Correlation Coefficient (ICC) requires
interval or continuous data and is not suitable for categorical data or where a rating has
been omitted. Cohen’s Kappa is suitable only for the analysis of nominal ratings. With
nominal ratings, raters classify subjects into response categories that have no order

101
structure. That is, two consecutive nominal categories are considered as being as
different as the first and last categories. If categories can be ordered or ranked, then the
Kappa coefficient could dramatically understate the extent of agreement among raters
as it treats any disagreement as total disagreement. Because it does not account for
partial agreement, Kappa as proposed by Cohen (1960) is inefficient for analysing ordinal
ratings. Cohen (1968) proposed the weighted version of Kappa to fix this problem but
this only applies to the case of two raters and not multiple ones. Fleiss (1971) and
Janson and Olsson (2001) extended Cohen’s Kappa so that it could be used with multiple
raters, but this is not suitable for ordinal data. Hence, I decided to use average pairwise
percent agreement to examine inter-rater agreement and Krippendorff’s alpha to
examine inter-rater reliability. Hripcsak and Heitjan (p.108, 2002) recommend that
pairwise agreement should be reported as descriptive agreement measures but not as a
formal reliability measure. Hayes and Krippendorff (p. 82, 2007) outline several
advantages in using Krippendorff’s alpha: it can be used for any number of coders; it can
be used for different kinds of variables including nominal and ordinal ones; it can be
used for large or small sample sizes (with no minimum), with the advantage that it can
also be used for incomplete or missing data.
Average pairwise percent agreement is easily calculated and gives some indication as to
how well the coders agreed on the data coded. To calculate pairwise agreement, the
agreement between a pair of coders is calculated. When working with multiple coders, it
is necessary to find the average pairwise agreement among all possible coder pairs. For
example, Coder 1 and 2 agreed on 25 cases out of 30 giving 83.33%. Table 3 summarises
the percent agreement for each pair.

102
Pair Percent %
Coders Original and 1 80
Coders Original and 2 76.667
Coders Original and 3 73.333
Coders Original and 4 73.333
Coders Original and 5 83.333
Coders 1 and 2 83.333
Coders 1 and 3 53.333
Coders 1 and 4 63.333
Coders 1 and 5 76.667
Coders 2 and 3 60
Coders 2 and 4 73.333
Coders 2 and 5 80
Coders 3 and 4 50
Coders 3 and 5 60
Coders 4 and 5 70
Table 3: Average Pairwise Percent Agreement
To calculate the overall average pairwise agreement, each of the above values was
totalled and divided by the number of pairs:
1056 0.70444 or 70.444%
15
. Neuendorf
(p.145, 2002) indicates that such a statistic would suggest that there was some
agreement amongst the coders but this calculation would not be sufficient to draw
conclusions on its own. We can see from the table that the greatest agreement between
the original coding and the external coders was with coder 5 while the least was with
coders 3 and 4.
Calculating percent agreement has some drawbacks. For example, there is no
comparative reference point to indicate whether the rate of agreement is higher or
lower than chance. As percent agreement is an average, it can neglect to highlight
significant disagreement such as that seen in task 24. Krippendorff (2004, p.426) warns
that it is possible to ‘hide unreliable categories behind reliable ones’ due to the lack of

103
attention given to significant disagreement. Lombard, Snyder-Duch and Bracken (2002
p.601) also recommend that researchers do not recommend solely on percent
agreement due to this weakness.
Krippendorff’s statistic measures both observed and expected disagreement, unlike
Cohen’s Kappa which only looks at expected agreement. The basic definition of alpha is
given by 1 o
e
D
D , where oD is the observed disagreement among values assigned to
the units of analysis and eD is the disagreement that would be expected when the
coding of units is attributable to chance rather than to the properties of these units
(Krippendorff, 2011, p.1). The values range between = 0 which would indicate no
agreement and =1 indicating perfect agreement. Krippendorff (2011, p.1) explains
that when ‘observers agree perfectly, observed disagreement oD = 0 and =1, which
indicates perfect reliability. When observers agree as if chance had produced the results,
o eD D and = 0, which indicates the absence of reliability.
Gwet (2011) developed a piece of software known as AgreeStat 2011, which allows for
the calculation of inter-rater reliability coefficients including Krippendorff’s alpha using
Excel. Using this program, the result for Krippendorff’s alpha for the tasks analysed
during the workshop was given as 0.45, which would suggest that there was a moderate
level of reliability between the coders. This value of 0.45 is unweighted and does not
take into account the nature of the data, which is ordinal. Krippendorff (2011) gives an
account of a weighting scheme which takes into account the metric difference for
ordinal data as opposed to other types of data. Antoine, Villaneau and Lefeuvre (2014, p.
8) point out the advantages of using such weighting as it allows a more accurate
reliability calculation without being affected by the influence ‘of both the number of
categories and the number of coders’. Using Gwet’s program to calculate Krippendorff’s
alpha with ordinal weightings, a value of 0.56 was obtained still indicating moderate
reliability.

104
Landis and Koch (1977) provide guidelines for interpreting such coefficients with values
from 0.0 to 0.2 indicating slight agreement, 0.21 to 0.40 indicating fair agreement, 0.41
to 0.60 indicating moderate agreement, 0.61 to 0.80 indicating substantial agreement,
and 0.81 to 1.0 indicating almost perfect agreement. The use of these values is debated
however, and Krippendorff (1980) provides a more conservative interpretation
suggesting that conclusions should be discounted for variables with inter-rater values
less than 0.67, conclusions cautiously be made for values between 0.67 and 0.80, and
definite conclusions be made for values above 0.80. ‘In practice, however, coefficients
below Krippendorff’s conservative values are often retained in research studies, and
Krippendorff offers these cutoffs based on his own work in content analysis while
recognizing that acceptable inter-rater reliability estimates will vary depending on the
study methods and the research question’ (Hallgren, 2012). The literature makes use of
both Krippendorff’s and Landis and Koch’s interpretation when looking at Krippendorff’s
alpha. Arstein and Poesio (2008) complain that the lack of consensus on how to
interpret the values of agreement and reliability coefficients is a serious problem with
current practice in reliability testing and they doubt that a single cutoff point is
appropriate for all purposes.
To explain the relatively low Krippendorff’s alpha in relation to the higher pairwise
percentage agreement, it is necessary to consider prevalence. Hripcsak and Heitjan
(2002) caution that an ‘unbalanced’ sample can have an adverse effect on reliability
coefficient like kappa and Krippendorff’s alpha. As explained previously, the coders were
given 30 tasks with 2 intended as ‘novel’, 8 as ‘somewhat novel’ and 20 as ‘not novel’.
This particular selection for the coding sample was made to mirror the larger study of
the textbook analysis that had been completed using the Novelty framework. It would
not have been as representative if an equal 10 tasks from each category had been
selected. The coders were given sections from actual textbooks being used in Irish
classrooms and 10 ‘novel’ tasks were not encountered in close proximity. This resulted
in a low prevalence of ‘novel’ tasks and a high prevalence of ‘not novel’ tasks. Byrt,
Bishop and Carlin (1993), along with Cicchetti and Feinstein (1990) acknowledge that a
balanced sample is not always possible, which is the case with my sample used for the
validation exercise. Viera and Garrett (2005) and Gwet (2008) point out that agreement

105
measures can be affected by the prevalence of the finding under consideration. Very low
values of alpha may not necessarily reflect low rates of overall agreement. As can be
seen in table 1, only coder 3 failed to class any task as ‘novel’ and 3 coders were in
complete agreement with the classification originally given by myself and my two
supervisors which would point to high agreement as supported by the pairwise
percentage calculation. It would appear that two of the coders encountered some
difficulty in relation to distinguishing between the categories of ‘somewhat novel’ and
‘not novel’.
However I believe that there is a high level of agreement evident despite the statistic
obtained by Krippendorf’s alpha, which is sensitive to an unbalanced sample and the
high prevalence of certain categories (Feng, 2012, Byrt et al., 1993). Cichetti and
Feinstein (1990), in addition to Feinstein and Cichetti (1990), discuss having a high level
of agreement but an apparently lower level of reliability as a paradox. Gwet (2008) has
developed a different coefficient known as 1AC intended to be a ‘paradox-robust
alternative’ (Gwet, 2011, p. 9), by using new variance estimators that, according to
Gwet, give a more realistic measure for agreement by chance and thus solve the issue of
the apparent paradox. This coefficient has been further refined to take into account
various weightings, including those needed for ordinal data. This is known as 2AC and it
has the added advantage in that it can also handle missing ratings. Using the AgreeStat
program, I found the unweighted 1AC = 0.61 and the weighted 2AC = 0.8 which would
indicate substantial agreement. It should be noted that the weighted ordinal percent
agreement was found to be 0.9 using this program. The differences in the classifications
assigned by the five coders will be discussed using their responses to the questionnaire
and the discussion that ensued after the classification was complete.
4.11 Questionnaire
The questionnaire consisted of three open ended questions and was designed to gain
insight into the opinions and experiences of the workshop participants in terms of using
the Novelty framework. The three questions were as follows:
Did you find the Novelty framework easy to use? Please outline any difficulties
you encountered.

106
Do you agree with the descriptions (novel, somewhat novel, not novel) used in
this framework?
Any other comments?
The feedback in relation to the Novelty framework was very positive. All five
respondents indicated that the framework was easy to use, noting that the framework
was clearly laid out and that it was easy to identify the features within each category.
Given that it was their first time using the framework, several reported that it was easy
to follow and offered both useful and interesting insights. However, there was some
difficulty reported in aspects of its application. Coder 3 found it challenging to
distinguish between context and presentation when using the framework. Coders 1 and
4 felt that it was difficult to distinguish between ‘not novel’ and ‘somewhat novel’ when
there is just a slight difference in the presentation of a task. They also reported difficulty
at times with identifying a new feature or aspect of a mathematical concept when
considering the ‘somewhat novel’ category. Coder 2 suggested that an extra criterion for
the ‘novel’ category could be added for the case when the task requires a connection
between different mathematical topics or strands of the syllabus. Coder 5 commented
on the use of the word ‘method’, that its meaning or intention could be made more
explicit: ‘I usually think of method as meaning a procedure of some sort to be
implemented, rather than (for example) an idea or an observation or a decision.’
All five respondents agreed with the three descriptions of ‘novel’, ‘somewhat novel’ and
‘not novel’ as presented. They did not suggest that the Novelty framework should be
seriously modified, which suggests that the participants were able to follow the
descriptions offered and use the criteria as intended.
Coder 1 felt that the framework would be useful for Pre-Service Teachers (PSTs) who
often believe that ‘textbooks are infallible’. Coder 2 also felt that the framework had a
lot to offer not only PSTs but also practicing teachers, textbook authors and educational
researchers. Coder 3 felt that the framework offered a great opportunity to ‘sit and
analyse the construction of tasks in textbooks and to critique the choice and order of
tasks.’ Coders 4 and 5 felt that the framework was interesting and could see potential
for its extension to other work. Coder 5 was particularly interested in identifying a
relationship between ‘novel’ tasks and difficulty.

107
4.12 Group Discussion
The discussion was intended to allow for the expansion of ideas raised in the
questionnaire and to allow for comments that might not have been expressed in the
questionnaire. At the beginning of the discussion, the group looked at the number of
categories in the Novelty framework and felt that three was sufficient. Those who spoke
on this felt that extending the number of categories to four would be excessive and
would bring added difficulty in applying it, and that the existing three allowed for clearer
distinctions between the categories.
Coder 1 discussed a potential difficulty in trying to abandon personal experience when
using the framework and getting into the mind-set of the student adequately: ‘I was kind
of thinking – Oh to me they look all the same but maybe to a fifteen or sixteen year old
they mightn’t you know. I might say it’s not novel but to them it might be. I found that
difficult.’ Coder 5 agreed that it was important to put oneself into the perspective of the
student rather than the experienced mathematician. The group concluded that the post
primary teacher’s perspective can be very valuable when considering, for example, the
impact of the appearance of negative numbers rather than positive numbers in an
exercise. This is because researchers at third level could be far removed from the
students’ experience. It could be difficult for someone outside the second level
classroom to judge how a student would react to such material.
The merits of the framework were also noted by the group. They felt that aside from
textbook authors and educational researchers, it could be beneficial to teachers and
teacher educators in particular. Coder 1 felt that it would be useful for PSTs to assist
with the selection of tasks for the classroom and to also consider their potential
strengths or weaknesses. Coder 3 added that it could be used as an empowering tool for
teachers when looking at tasks.
4.13 Conclusion
From the Novelty framework validation workshop, it appears that the participants felt
that the framework is clearly described and the results show that it can be used
reasonably effectively and reliably. It must be noted that this workshop was held after
the classifications (which will be presented in the next chapter) had been completed and
108
so the recommendations made by participants have not yet been taken into account.
However, the experience has given some indications for modification in the future.
Although a value of 0.8 for Gwet’s 2AC indicates substantial agreement, consideration
must still be given to possible improvements that might be made to the framework to
attain greater reliability in coding.
From the feedback provided, I would implement the following changes to the Novelty
framework. I would add an additional criterion to the ‘novel’ category and provide an
extra example in the ‘somewhat novel’ classification. A more explicit exploration of
earlier syllabus coverage would also be beneficial, especially for coders not familiar with
the content area being analysed with the framework.
It would be useful to add an extra criterion for when a task requires a connection
between different mathematical topics or strands of the syllabus in the ‘novel’
classification. For example: ‘The user must independently make a connection between
different syllabus strands or different mathematical concepts or topics’. This is
something that the student would not have encountered within the current chapter and
it would benefit the Novelty framework to anticipate such a scenario.
Distinguishing between the categories of ‘somewhat novel’ and ‘not novel’ is a key
concern. The difference between these two classifications can be subtle and it is
important that coders are able to identify features and apply the relevant classifications
consistently. It appears that the participants were content with the criteria but needed
further examples of how it is applied. Some coders were uncertain as to how to deal
with ‘presentation’ and ‘context’ consistently. Currently an example for ‘context’ has
been provided in the criteria with ‘perhaps the use of an unfamiliar real-world situation’.
It would be beneficial to provide a similar example for ‘presentation’ like ‘different
phrasing being used from what was encountered before so that it is not immediately
obvious that the question involves the same mathematical solution method as previous
questions’. This would assist coders with coming to terms with the ‘somewhat novel’
category and how to distinguish it from ‘not novel’.

109
In future, when illustrating how I intend the framework is to be applied, it would be
important not only to show how examples and preceding exercises offer modelled
solutions for exercises but also to emphasise how a new aspect of a concept can be
introduced and how a subtle adaption of the solution method can come about. It would
be helpful to highlight when a task is essentially familiar but a new aspect of the concept
has been introduced. Building this into the framework description would assist with
identifying tasks that should be classified as ‘somewhat novel’.
I think it would be beneficial to encourage future researchers using the framework to
record their understanding of terminology when working with practice tasks so that the
definition of ‘skills’ as provided in the criteria is not forgotten when coding and allow
initial users to have greater certainty when applying the framework’s criteria. It would
also be important to remind this cohort to become familiar with material that students
would encounter on a regular basis in their earlier mathematical experiences so as to
inform their coding. This could be done encouraging researchers to obtain a list of
relevant syllabus coverage from preceding years rather than assuming that users will be
familiar with this kind of material. Steps such as these should help ensure greater
reliability in coding in future. It must also be noted that there may be a flaw in the way
Krippendorff’s alpha works with data that is not evenly distributed over categories. I
think it would be useful for future researchers to ensure that the sample of tasks given
to coders is structured so that there are roughly equal numbers of tasks in each equal of
the three categories of ‘novel’, ‘somewhat novel’ and ‘not novel’ so that the effects of
prevalence are not felt.

110
Chapter 5 Results
5.1 Introduction
For this thesis a total of 7635 tasks on two topics from a number of textbooks were
analysed. The textbooks were from three textbook series Active Maths, Text and Tests,
and Concise Maths. Tasks were analysed from the areas of Pattern, Sequences and
Series, and Differential Calculus. At HL, there are more tasks in the area of Differential
Calculus than Pattern, Sequences and Series. The reverse is true at OL, with the
exception of the Text and Tests Pre-PM textbook, where a greater number of tasks are
assigned in the Pattern, Sequences and Series topic. The number of tasks generally
increased between the Pre-PM and Post-PM eras with the exception of the Text and
Tests HL textbook recording a decrease in the amount of tasks for both topics and the
Concise Maths textbook experiencing a slight decrease in the number of Differential
Calculus tasks at OL.
Active Maths Text and Tests Concise Maths
Higher Ordinary Higher Ordinary Higher Ordinary
Pattern,
Sequences and
Series
316 317 199 175 298 263
Differential
Calculus
536
219 445 211 387 218
Table 4: Pre-PM Number of tasks per topic, level and textbook series
Active Maths Text and Tests Concise Maths
Higher Ordinary Higher Ordinary Higher Ordinary
Pattern,
Sequences and
Series
325 351 194 236 360 368
Differential
Calculus
566
296 437 235 471 212
Table 5: Post-PM Number of tasks per topic, level and textbook series

111
In this chapter, the results for each framework will now be presented for each of the
textbook series, both before and after the introduction of the Project Maths syllabus.
Each of the frameworks used in this thesis has a specific purpose when it comes to
analysing tasks. Recall that the LCD framework gives insight into how much cognitive
engagement a particular task demands. It allows for the classification of the cognitive
load that is required for the successful completion of a task. The reasoning framework
facilitates an examination of the thought employed by students in relation to the
arguments used in the solving of tasks, characterizing such reasoning as either imitative
or creative reasoning. The Novelty framework looks at the notion of novelty and
measures it in terms of the experience the solver brings to a task. The use of the PM
syllabus problem-solving objectives when classifying tasks sheds light on what qualities
the textbooks are trying to develop in relation to the goals of the new syllabus. Finally
Usiskin’s model looks at the type of understanding that a task promotes in terms of the
learning of a mathematical concept.
5.2 Level of Cognitive Demand
In this section, tasks on Differential Calculus and Patterns, Sequences and Series from
each of the textbook series (Active Maths, Text and Tests, and Concise Maths) are
classified using the Level of Cognitive Demand framework. It should be noted that the
Active Maths textbook series was known as Discovering Maths before the new syllabus
was introduced. The other two series retained their original names, to avoid confusion
the Discovering Maths series will be referred to under the Active Maths headings.
5.2.1 Active Maths
5.2.1.1 Higher Level
A total of 852 tasks were analysed from the pre-Project Maths textbook Discovering
Maths 4 (Higher Level). The analysis found that 69 (8.1%) were HLD tasks and the
remaining 783 (91.9%) were LLD tasks. For the post-PM textbook Active Maths 4 Book 1
(Higher Level), a total of 891 tasks were examined. The analysis categorised these tasks
into 197 (22.1%) HLD tasks and 694 (77.9%) LLD tasks. Table 6 shows the results of the
classification.

112
LCD
Classification
Active Maths
Textbook Series
(HL)
Pattern,
Sequences
and Series
(Pre-PM)
Differential
Calculus
(Pre-PM)
Pre-PM
Total
Pattern,
Sequences
and Series
(Post-PM)
Differential
Calculus
(Post-PM)
Post-PM
Total
HL Demand 35
(11.1%)
34
(6.3%)
69
(8.1%)
97
(29.8%)
100
(17.7%)
197
(22.1%)
HL Subcategory:
Doing
Mathematics
4
(1.3%)
2
(0.4%)
6
(0.7%)
3
(0.9%)
21
(3.7%)
24
(2.7%)
HL Subcategory:
Procedures with
connections to
meaning
31
(9.8%)
32
(5.9%)
63
(7.4%)
94
(28.9%)
79
(14%)
173
(19.4%)
Lower Level (LL)
Demand 281 (88.9%)
502
(93.7%)
783
(91.9%) 228 (70.2%)
466
(82.3%)
694
(77.9%)
LL Subcategory:
Procedures
without
connections to
meaning
281 (88.9%) 502
(93.7%)
783
(91.9%) 226 (69.5%)
466
(82.3%)
692
(77.7%)
LL Subcategory:
Memorization
0
(0%) 0(0%) 0 (0%) 2(0.7%) 0 (0%) 2 (0.2%)
Total 316 536 852 325 566 891
Table 6: Active Maths Textbook Series (Higher Level) Levels of Cognitive Demand
A number of chi-square tests of independence were completed with 0.05 in order
to examine relationships between variables. For instance in the Active Maths HL
textbook series, there is no significant difference between the old and new textbooks in
relation to the proportions of tasks on each topic, the proportion of tasks is independent
of topic 2 (1, 1743) 0.07, 0.79X N p . Results of all chi-square tests of independence
are shown in tables 50-61 in Appendix B. Only those for which results were of particular
interest will be commented on throughout this chapter.
As the proportions of tasks on the two topics were not significantly different in the pre-
and post-PM textbooks, I combined the tasks from the two topics and tested to see if

113
there was a difference in the proportion of HLD tasks in the old and new textbooks. The
post-PM textbook has a higher incidence of HLD tasks than the pre-PM textbook and this
difference has been found to be statistically significant. (see table 50, appendix B).
5.2.1.2 Ordinary Level
For the pre-PM textbook Discovering Maths 3 (Ordinary Level), 536 tasks were analysed.
Of these tasks, 23 (4.3%) were categorised as HLD and 513 (95.7%) were labelled as LLD.
For the Post-PM OL textbook Active Maths 3 Book 1, 109 tasks (16.8%) were found to be
HLD with 538 (83.2%) labelled as LLD.
LCD
Classification
Active Maths
Textbook Series
(OL)
Pattern,
Sequences
and Series
(Pre-PM)
Differential
Calculus
(Pre-PM)
Pre-PM
Total
Pattern,
Sequences
and Series
(Post-PM)
Differential
Calculus
(Post-PM)
Post-
PM
Total
HLD 6 (1.9%) 17 (7.8%) 23
(4.3%)
62 (17.7%) 47 (15.9%) 109
(16.8%)
HL Subcategory:
Doing
Mathematics
0 (0%) 0 (0%) 0 (0%) 0 (0%) 7 (2.4%) 7
(1.1%)
HL Subcategory:
Procedures with
connections to
meaning
6 (1.9%) 17 (7.8%) 23
(4.3%)
62 (17.7%) 40 (13.5%) 102
(15.7%)
LLD 311 (98.1%) 202 (92.2%) 513
(95.7%)
289 (82.3%) 249 (84.1%) 538
(83.2%)
LL Subcategory:
Procedures
without
connections to
meaning
311 (98.1%) 202 (92.2%) 513
(95.7%)
289 (82.3%) 249 (84.1%) 538
(83.2%)
LL Subcategory:
Memorization
0
(0%)
0
(0%)
0
(0%)
0
(0%)
0
(0%)
0
(0%)
Total 317 219 536 351 296 647
Table 7: Active Maths Textbook Series (Ordinary Level) Levels of Cognitive Demand

114
Similar to the Higher Level series, the proportion of HLD tasks is greater in the post-
Project Maths textbook.
5.2.1.3 Comparison of Higher Level and Ordinary Level
Figure 5.1 below compares the proportion of tasks at each LCD across syllabus levels for
both pre and post-PM textbooks. There is a statistically significant higher proportion of
HLD tasks in the HL textbook than in the OL textbook for the post-PM Active Maths
textbook series (see table 50, appendix B). Similar results were found for the pre-PM
Active Maths textbook.
Figure 5.1: Comparison of LCD category proportions in HL and OL Active Maths
textbooks for both pre and post-PM eras
5.2.1.4 Comparison of two topics
There is a statistically significant higher proportion of HLD tasks in the topic of Pattern,
Sequences and Series than the topic of Differential Calculus in the HL post-PM
textbooks.

115
Figure 5.2: Comparison of LCD category proportions per topic in HL Active Maths
textbooks for both pre and post-PM eras
Similar results were found in the pre-PM HL textbook. However the higher proportion of
HLD tasks in Pattern, Sequences and Series is not statistically significant in the OL post-
PM textbooks. For the OL pre-PM textbook there was actually a statistically significant
higher proportion of HLD tasks on the topic of differential calculus (see table 50,
appendix B for details). Figure 5.2 illustrates the proportions of tasks on each topic in the
HL books at the various levels defined in the LCD framework.
5.2.2 Text and Tests
5.2.2.1 Higher Level
For the pre-PM era, the topic of Pattern, Sequences and Series was contained in Text
and Tests 5 (HL). Differential Calculus was covered in Text and Tests 4 (HL). A total of 199
tasks were classified in Pattern, Sequences and Series with 445 tasks analysed in the
topic Differential Calculus. Of these 27 (4.2%) were classified as ‘procedures with
connections to meaning’ and the remaining 617 (95.8%) were placed in the category of
‘procedures without connections to meaning’. I found tasks in all four LCD categories in
the post-PM textbooks. A total of 194 tasks on Pattern, Sequences and Series were
classified from Text and Tests 6 (HL). In Text and Tests 7 (HL), 437 tasks were analysed

116
on the topic of Differential Calculus. Of these 22 (3.5%) were classified as ‘doing
mathematics’, 125 (19.8%) were found to require ‘procedures with connections to
meaning’, 482 (76.4%) tasks were classified as ‘procedures without connections to
meaning’ and the remaining 2 (0.3%) necessitated the use of ‘memorization’.
The two topics were combined and tested to see if there was a difference in the
proportion of HLD tasks in the old and new textbooks. As can be seen in table 51,
appendix B the post-PM textbook has a statistically significant higher incidence of HLD
tasks than the pre-PM textbook.
LCD
Classification
Text and Tests
Textbook Series
(HL)
Pattern,
Sequences
and Series
(Pre-PM)
Differential
Calculus
(Pre-PM)
Pre-PM
Total
Pattern,
Sequences
and Series
(Post-PM)
Differential
Calculus
(Post-PM)
Post-
PM
Total
HLD 14
(7%)
13
(2.9%)
27
(4.2%)
75
(38.7%)
72
(16.5%)
147
(23.3%)
HL Subcategory:
Doing
Mathematics
0
(0%)
0
(0%)
0
(0%)
19
(9.8%)
3
(0.7%)
22
(3.5%)
HL Subcategory:
Procedures with
connections to
meaning
14
(7%)
13
(2.9%)
27
(4.2%)
56
(28.9%)
69
(15.8%)
125
(19.8%)
LLD 185
(93%)
432
(97.1%)
617
(95.8%) 119 (61.3%)
365
(83.5%)
484
(76.7%)
LL Subcategory:
Procedures
without
connections to
meaning
185
(93%)
432
(97.1%)
617
(95.8%) 119 (61.3%)
363
(83.1%)
482
(76.4%)
LL Subcategory:
Memorization
0
(0%)
0
(0%)
0
(0%)
0
(0%)
2
(0.4%)
2
(0.3%)
Total 199 445 644 194 437 631
Table 8: Text and Tests Textbook Series (HL) Levels of Cognitive Demand

117
5.2.2.2 Ordinary Level
In the pre-Project Maths textbook, Text and Tests 3 (Ordinary Level), 386 tasks were
analysed. Of these tasks, 8 (2.1%) of the tasks were categorised as HLD and 378 (97.9%)
of the tasks were labelled as LLD. None of the tasks were categorised as ‘doing
mathematics’. The dominant sub-category applied was ‘procedures without connections
to meaning’ with 378 tasks and just 8 tasks involved the use of ‘procedures with
connections to meaning’. After the introduction of PM, in the OL textbook Text and
Tests 3, it was found that 37 tasks (7.8%) were categorised as HLD with ‘procedures with
connections to meaning’ and 434 (92.2%) were classified as LLD with ‘procedures
without connections to meaning’.
The proportion of tasks on each topic in the Text and Tests series has not changed
significantly over time. For the Text and Tests OL textbooks, similar to the HL series, the
post-PM textbook has a statistically significant higher proportion of HLD tasks than the
pre-PM textbook (table 51, appendix B).

118
LCD
Classification
Text and Tests
Textbook Series
(OL)
Pattern,
Sequences
and Series
(Pre-PM)
Differential
Calculus
(Pre-PM)
Pre-PM
Total
Pattern,
Sequences
and Series
(Post-PM)
Differential
Calculus
(Post-PM)
Post-
PM
Total
HLD 8 (4.6%) 0 (0%)
8
(2.1%) 13 (5.5%) 0 (0%)
37
(7.8%)
HL Subcategory:
Doing
Mathematics
0 (0%) 0 (0%) 0 (0%) 0 (0%) 0 (0%) 0 (0%)
HL Subcategory:
Procedures with
connections to
meaning
8 (4.6%) 0 (0%) 8
(2.1%) 13 (5.5%) 24 (10.2%)
37
(7.8%)
LLD 167 (95.4%) 211 (100%)
378
(97.9%) 223 (94.5%) 211 (89.8%)
434
(92.2%)
LL Subcategory:
Procedures
without
connections to
meaning
167 (95.4%) 211 (100%) 378
(97.9%) 223 (94.5%) 211 (89.8%)
434
(92.2%)
LL Subcategory:
Memorization 0 (0%) 0 (0%) 0 (0%) 0 (0%) 0 (0%) 0 (0%)
Total 175 211 386 236 235 471
Table 9: Text and Tests Textbook Series (OL) Levels of Cognitive Demand

119
5.2.2.3 Comparison of Higher and Ordinary Level
Figure 5.3: Comparison of LCD category proportions for Higher and Ordinary Level
Text and Tests textbooks for both pre and post-PM eras
I found a statistically significant higher proportion of HLD tasks in the HL textbook than
in the OL textbook for the post-PM Text and Tests textbook series. The pre-PM Text and
Tests textbook yielded different results; no significant difference was apparent in the
proportion of HLD tasks between the HL and OL of the pre-Project Maths textbooks (for
details see table 51, appendix B), in both cases the percentage of HLD tasks was very
low. Figure 5.3 compares the pre and post-PM textbooks in relation to the different
categories of the LCD framework broken down by syllabus level.

120
5.2.2.4 Comparison of two topics
Figure 5.4 Comparison of LCD category proportions per topic in the HL Text and Tests
textbooks for both pre and post-PM eras
There is a statistically significant higher proportion of HLD tasks in the topic of Pattern,
Sequences and Series than the topic of Differential Calculus in the HL post-PM textbook.
Similarly, there is a statistically significant higher proportion of HLD tasks in the topic of
Pattern, Sequences and Series than the topic of Differential Calculus in the HL pre-
Project textbook. In contrast to the post-PM textbooks, there is a statistically significant
higher proportion of HLD tasks in the topic of Pattern, Sequences and Series than the
topic of Differential Calculus in the OL pre-PM textbook (see table 51, appendix B).
Figure 5.4 displays data for the HL textbooks.
5.2.3 Concise Maths
5.2.3.1 Higher Level
A total number of 685 tasks were examined from the Concise Maths series in use before
the syllabus change. Out of these tasks, 1 (0.1%) was categorised as ‘doing
mathematics’. The remaining 24 (3.5%) HLD were classified as ‘procedures with

121
connections to meaning’ and all of the 660 (96.4%) LLD tasks were placed in the
category of ‘procedures without connections to meaning’. A total of 831 tasks were
classified from the post-Project Maths textbooks. The ‘doing mathematics’ classification
had the lowest incidence with 3 (0.4%) tasks, the remaining 109 (13.1%) HLD tasks were
classified as ‘procedures with connections to meaning’. The majority of the tasks were
LLD and 719 (86.5%) tasks were classified as ‘procedures without connections to
meaning’.
LCD
Classification
Concise Maths
Textbook Series
(HL)
Pattern,
Sequences
and Series
(Pre-PM)
Differentia
l Calculus
(Pre-PM)
Pre-PM
Total
Pattern,
Sequences
and Series
(Post-PM)
Differential
Calculus
(Post-PM)
Post-PM
Total
HLD 17 (5.7%) 8 (2.1%) 25 (3.6%) 37 (10.3%) 75 (15.9%) 112 (13.5%)
HL Subcategory:
Doing
Mathematics
1 (0.3%) 0 (0%) 1 (0.1%) 0(0%) 3 (0.6%) 3 (0.4%)
HL Subcategory:
Procedures with
connections to
meaning
16 (5.4%) 8 (2.1%) 24 (3.5%) 37 (10.3%) 72 (15.3%) 109 (13.1%)
LLD 281
(94.3%)
379
(97.9%) 660 (96.4%)
323
(89.7%) 396 (84.1%) 719 (86.5%)
LL Subcategory:
Procedures
without
connections to
meaning
281
(94.3%)
379
(97.9%) 660 (96.4%)
323
(89.7%) 396 (84.1%) 719 (86.5%)
LL Subcategory:
Memorization 0(0%) 0(0%) 0 (0%) 0 (0%) 0 (0%) 0 (0%)
Total 298 387 685 360 471 831
Table 10: Concise Maths Textbook Series (HL) LCD

122
The post-PM textbook has a statistically significant higher incidence of HLD tasks than
the pre-PM textbook (see table 52, appendix B).
5.2.3.2 Ordinary Level
From the pre-PM textbook, 481 tasks were analysed. Of these, 22 (4.6%) were classified
as HLD and the remaining 459 (95.4%) were categorised as LLD. For the post-Project
Maths textbook, a greater number of tasks were analysed with 68 (11.7%) labelled as
HLD and 512 (88.3%) were found to be LLD.
LCD
Classification
Concise Maths
Textbook Series
(OL)
Pattern,
Sequences
and Series
(Pre-PM)
Differentia
l Calculus
(Pre-PM)
Pre-PM
Total
Pattern,
Sequences
and Series
(Post-PM)
Differential
Calculus
(Post-PM)
Post-PM
Total
HLD 15 (5.7%) 7 (3.2%) 22 (4.6%) 22 (6%) 46 (21.7%) 68 (11.7%)
HL Subcategory:
Doing
Mathematics
0 (0%) 1 (0.4%) 1 (0.2%) 0 (0%) 2 (0.9%) 2(0.3%)
HL Subcategory:
Procedures with
connections to
meaning
15 (5.7%) 6 (2.8%) 21 (4.4%) 22 (6%) 44 (20.8%) 66 (11.4%)
LLD 248
(94.3%)
211
(96.8%) 459 (95.4%) 346 (94%) 166 (78.3%) 512 (88.3%)
LL Subcategory:
Procedures
without
connections to
meaning
248
(94.3%)
211
(96.8%) 459 (95.4%) 346 (94%) 165 (77.8%) 511 (88.1%)
LL Subcategory:
Memorization 0 (0%) 0 (0%) 0 (0%) 0 (0%) 1 (0.5%) 1 (0.2%)
Total 263 218 481 368 212 580
Table 11: Concise Maths Textbook Series (OL) LCD
In the Concise Maths textbook OL series, the proportions of tasks per topic is not
independent of the textbook era. Also, the post-PM textbook has a statistically higher

123
incidence of HLD tasks than the pre-PM textbook (see table 52, appendix B). The same is
true at HL.
Figure 5.5: Comparison of LCD category proportions for HL and OL Concise Maths
textbooks for both pre and post-PM eras
5.2.3.3 Comparison of Higher and Ordinary Level
There is no statistically significant difference between the proportion of HLD tasks in the
HL and OL textbooks for the post-PM Concise Maths textbook series (see table 52,
appendix B) or for the pre-PM series. Figure 5.5 shows that 3.6% of the HL tasks and
4.6% of the OL tasks were classified as HLD for the pre-PM textbook. This is in contrast
to 13.5% of HL tasks and 11.7% of OL tasks for the post-PM textbook.
5.2.3.4 Comparison of two topics
A statistically significant higher proportion of HLD tasks in the topic of Differential
Calculus than the topic of Pattern, Sequences and Series was found in the HL post-PM
textbook. Similar results were found for the OL post-PM textbooks. In contrast, a
statistically significant higher proportion of HLD tasks in the topic of Pattern, Sequences
and Series than the topic of Differential Calculus was found in the HL pre-PM textbook.
However the higher proportion of HLD tasks in Pattern, Sequences and Series is not

124
statistically significant in the OL post-PM textbooks (see table 52, appendix B). Figure 5.6
compares the pre and post-PM textbooks at HL.
Figure 5.6: Comparison of LCD category proportions per topic in the Concise Maths HL
textbooks for both pre and post-PM eras
5.2.4 Comparing the Textbook Series
For all three series, more tasks were labelled as HLD in the post-PM textbooks than the
pre-PM textbooks for both syllabus levels. While there has been an increase in the
cognitive demand of the tasks offered by post-PM textbooks compared to their pre-PM
counterparts, particularly in the number of tasks available that involve the use of
‘procedures with connections to meaning’, the results presented here also suggest that
teachers will have to look elsewhere or develop their own tasks in order to expose
students to experiences which would correspond to the classification of ‘doing
mathematics’.
For all three series, a higher proportion of tasks were labelled as HLD in the HL textbooks
than in the OL textbooks for both textbook eras. However the majority of tasks in all

125
three post-PM textbooks series at both HL and OL were still classified as LLD as shown in
figure 5.7, with almost all LLD tasks being in the category ‘procedures without
connections to meaning’. Five out of six of these textbooks had no memorisation tasks.
For the HL books, a statistically significant relationship was found between the
proportion of HLD tasks and the post-PM textbook series to which the book belonged. A
similar result was found for the OL textbooks (see table 53, appendix B). Here, the Active
Maths series has the greatest proportion of HLD tasks with 16.8%, the Concise Maths
series has 11.7% while the Text and Tests series has just 7.8% at this level. There are
very few tasks classified as ‘doing mathematics’, the greatest proportion was found in
Text and Tests HL with 3.5% and the lowest in Text and Tests OL with 0%.
.
Figure 5.7: Comparison of LCD category proportions per textbook series for the post-PM era
For the HL pre-PM series, Active Maths had the highest proportion of HLD tasks with
8.1%. In the OL pre-PM textbooks, the Concise Maths series had the greatest proportion
of HLD tasks with 4.6%. In the case of the pre-PM HL textbooks, the relationship
between the textbook series and the proportion of HLD tasks was statistically significant.
However, for the OL textbooks the connection between the textbook series and

126
proportion of HLD tasks was not found to be statistically significant (see table 53,
appendix B).
5.3 Creative/Imitative Reasoning
5.3.1 Active Maths
5.3.1.1 Higher Level
In Discovering Maths 4 (HL) a total of 852 tasks were analysed. A total of 56 (6.6%) tasks
were classified as CR and 794 (93.4%) as IR. For the textbook in use after the
introduction of Project Maths, 891 tasks were examined with 135 (15.2%) classified as
CR and 756 (84.8%) as IR (table 12).
Reasoning
Classification
Active Maths
Textbook
Series (HL)
Pattern,
Sequence
s and
Series
(Pre-PM)
Differenti
al
Calculus
(Pre-PM)
Pre-PM
Total
Pattern,
Sequence
s and
Series
(Post-PM)
Differential
Calculus
(Post-PM)
Post-PM
Total
Creative
Reasoning (CR)
22 (7%) 34 (6.3%) 56 (6.6%) 52 (16%) 83 (14.7%) 135
(15.2%)
Imitative
Reasoning (IR)
294 (93%) 502
(93.7%)
796
(93.4%)
273 (84%) 483
(85.3%)
756
(84.8%)
Total 316 536 852 325 566 891
Table 12: Active Maths Textbook Series (HL) Types of Reasoning
In the Active Maths HL textbook series, (as shown in table 54, appendix B), there is a
statistically significant higher incidence of CR tasks in the post-Project Maths textbook
when compared to the pre-PM textbook.
5.3.1.2 Ordinary Level
For the textbooks in use before the introduction of PM, a total of 536 tasks were
analysed. From these a total of 23 (4.3%) were categorised as CR with 513 (95.7%) as IR.
For the Ordinary Level edition published after the introduction of Project Maths, a total

127
of 647 tasks were analysed. From this total, 76 (11.7%) tasks were found to involve CR
and 571 (88.3%) tasks were labelled as IR (table 13).
Reasoning
Classification
Active Maths
Textbook
Series (OL)
Pattern,
Sequences
and Series
(Pre-PM)
Differential
Calculus
(Pre-PM)
Pre-PM
Total
Pattern,
Sequences
and Series
(Post-PM)
Differential
Calculus
(Post-PM)
Post-
PM
Total
CR 6
(1.9%)
17
(7.8%)
23
(4.3%)
45
(12.8%)
31
(10.5%)
76
(11.7%)
IR 311
(98.1%)
202
(92.2%)
513
(95.7%)
306
(87.2%)
265
(89.5%)
571
(88.3%)
Total 317 219 536 351 296 647
Table 13: Active Maths Textbook Series (OL) Types of Reasoning
For the Active Maths OL textbook series, similar to the HL series, the post-PM textbook
has a statistically significant higher incidence of CR tasks than the pre-PM textbook (see
table 54, appendix B).
Figure 5.8: Comparison of reasoning proportions for HL and OL Active Maths
textbooks for both pre and post-PM eras
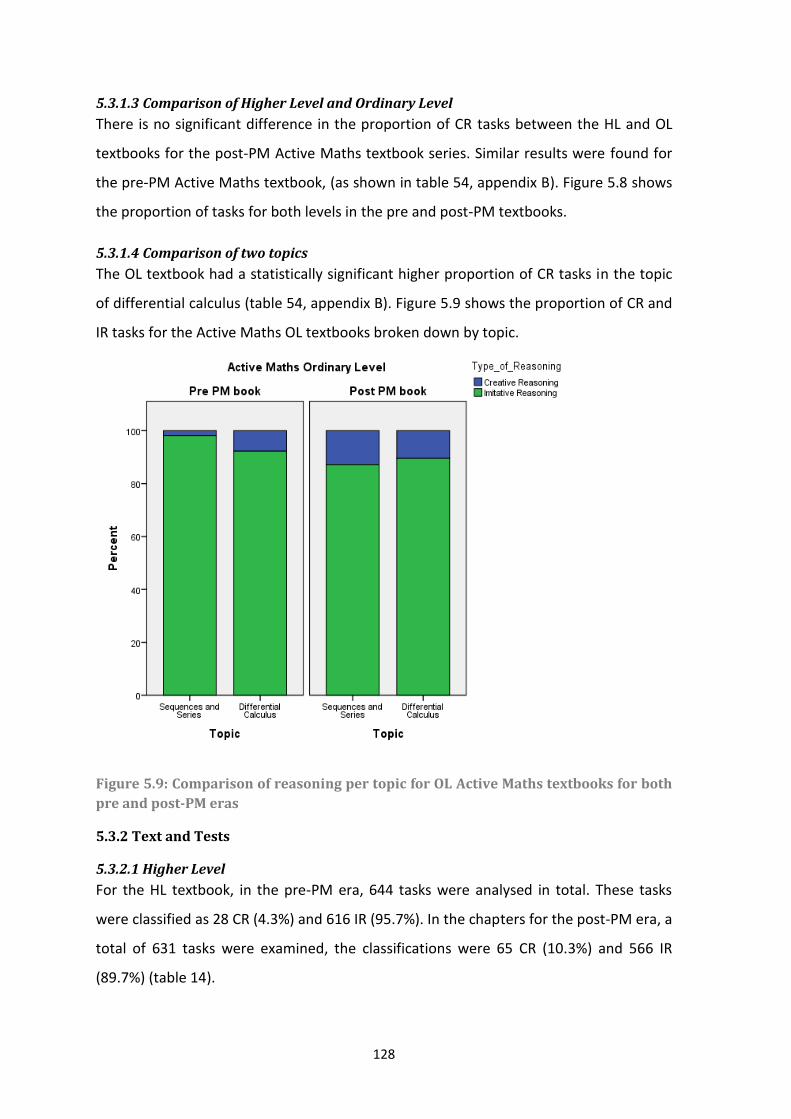
128
5.3.1.3 Comparison of Higher Level and Ordinary Level
There is no significant difference in the proportion of CR tasks between the HL and OL
textbooks for the post-PM Active Maths textbook series. Similar results were found for
the pre-PM Active Maths textbook, (as shown in table 54, appendix B). Figure 5.8 shows
the proportion of tasks for both levels in the pre and post-PM textbooks.
5.3.1.4 Comparison of two topics
The OL textbook had a statistically significant higher proportion of CR tasks in the topic
of differential calculus (table 54, appendix B). Figure 5.9 shows the proportion of CR and
IR tasks for the Active Maths OL textbooks broken down by topic.
Figure 5.9: Comparison of reasoning per topic for OL Active Maths textbooks for both
pre and post-PM eras
5.3.2 Text and Tests
5.3.2.1 Higher Level
For the HL textbook, in the pre-PM era, 644 tasks were analysed in total. These tasks
were classified as 28 CR (4.3%) and 616 IR (95.7%). In the chapters for the post-PM era, a
total of 631 tasks were examined, the classifications were 65 CR (10.3%) and 566 IR
(89.7%) (table 14).

129
Reasoning
Classification
Text and Tests
Textbook
Series (HL)
Pattern,
Sequences
and Series
(Pre-PM)
Differential
Calculus
(Pre-PM)
Pre-PM
Total
Pattern,
Sequences
and Series
(Post-PM)
Differential
Calculus
(Post-PM)
Post-
PM
Total
CR 15 (7.5%) 13 (2.9%) 28
(4.3%) 42 (21.6%) 23 (5.3%)
65
(10.3%)
IR 184 (92.5%) 432 (97.1%) 616
(95.7%) 152 (78.4%) 414 (94.7%)
566
(89.7%)
Total 199 445 644 194 437 631
Table 14: Text and Tests Textbook Series (HL) Types of Reasoning
The post-PM textbook has a statistically significant higher incidence of CR tasks than the
pre-PM textbook (table 55, appendix B).
5.3.2.2 Ordinary Level
In relation to the OL series, when material from the post-PM period was examined, 471
tasks were subdivided into 23 CR (4.9%) and 448 (95.1%) IR. The pre-PM textbooks had
386 tasks analysed, just 8 (2.1%) were classified as CR and 378 (97.9%) as IR (table 15).
Reasoning
Classification
Text and Tests
Textbook
Series (OL)
Pattern,
Sequences
and Series
(Pre-PM)
Differential
Calculus
(Pre-PM)
Pre-PM
Total
Pattern,
Sequences
and Series
(Post-PM)
Differential
Calculus
(Post-PM)
Post-
PM
Total
CR 8 (4.6%) 0 (0%) 8
(2.1%) 7 (3%) 16 (6.8%)
23
(4.9%)
IR 167 (95.4%) 211 (100%) 378
(97.9%) 229 (97%) 219 (93.2%)
448
(95.1%)
Total 175 211 386 236 235 471
Table 15: Text and Tests Textbook Series (OL) Types of Reasoning
In the Text and Tests OL textbook series, the post-PM textbook has a higher incidence of
CR tasks than the pre-PM textbook and this was statistically significant (see table 55,
appendix B).

130
Figure 5.10: Comparison of reasoning proportions for HL and OL Text and Tests
textbooks for both pre and post-PM eras
5.3.2.3 Comparison of Higher Level and Ordinary Level
There is a statistically significant higher proportion of CR tasks in the HL textbook than in
the OL textbook for the post-PM Text and Tests textbook series (table 55, appendix B).
Figure 5.10 shows the proportion of CR and IR tasks for each level and era in the Text
and Tests textbook series.
5.3.2.4 Comparison of two topics
There is a statistically significant higher proportion of CR tasks in the topic of Pattern,
Sequences and Series than the topic of differential calculus in the HL post-Project Maths
textbooks. Similar results were found in the pre-PM textbooks in both the HL and OL
texts (see table 55, appendix B). Figure 5.11 outlines the proportions of CR and IR for
each topic in the HL Text and Tests textbook series for both the pre and post-PM eras.

131
Figure 5.11: Comparison of reasoning proportions per topic for HL Text and Tests
textbooks for both pre and post-PM eras
5.3.3 Concise Maths
5.3.3.1 Higher Level
For the HL (Pre-PM) textbook series, 685 tasks were divided into 25 (3.6%) CR and 660
(96.4%) IR. As for the post-PM textbook series, the total number of tasks analysed came
to 831, which were further classified as 84 (10.1%) CR and 747 (89.9%) IR (table 16).

132
Reasoning
Classification
Concise Maths
Textbook
Series (HL)
Pattern,
Sequences
and Series
(Pre-PM)
Differential
Calculus
(Pre-PM)
Pre-PM
Total
Pattern,
Sequences
and Series
(Post-PM)
Differential
Calculus
(Post-PM)
Post-
PM
Total
CR 17 (5.7%) 8 (2.1%) 25
(3.6%) 24 (6.7%) 60 (12.7%)
84
(10.1%)
IR 281 (94.3%) 379 (97.9%) 660
(96.4%) 336 (93.3%) 411 (87.3%)
747
(89.9%)
Total 298 387 685 360 471 831
Table 16: Concise Maths Textbook Series (HL) Types of Reasoning
The post-PM textbook has a higher incidence of CR tasks than the pre-PM textbook
(table 56, appendix B).
5.3.3.2 Ordinary Level
When considering the pre-PM era, 481 tasks from OL textbook chapters were subdivided
into 22 CR (4.6%) and 459 IR (95.4%). In the post-PM edition, a total of 580 tasks, were
subdivided into 62 (10.7%) CR and 518 (89.3%) IR (table 17).
Reasoning
Classification
Concise Maths
Textbook
Series (OL)
Pattern,
Sequences
and Series
(Pre-PM)
Differential
Calculus
(Pre-PM)
Pre-PM
Total
Pattern,
Sequences
and Series
(Post-PM)
Differential
Calculus
(Post-PM)
Post-
PM
Total
CR 15 (5.7%) 7 (3.2%) 22
(4.6%) 22 (6%) 40 (18.9%)
62
(10.7%)
IR 248 (94.3%) 211 (96.8%) 459
(95.4%) 346 (94%) 172 (81.1%)
518
(89.3%)
Total 263 218 481 368 212 580
Table 17: Concise Maths Textbook Series (OL) Types of Reasoning
In the Concise Maths OL textbook series, the post-PM textbook has a statistically
significant higher incident of CR tasks than the pre-PM textbook (see table 56, appendix
B).

133
Figure 5.12: Comparison of reasoning proportions for HL and OL Concise Maths
textbooks for both pre and post-PM eras
5.3.3.3 Comparison of Higher Level and Ordinary Level
There is no statistically significant difference in the proportion of CR tasks between the
Higher Level and Ordinary Level textbooks for the post-Project Maths Concise Maths
textbook series. Similar results were found for the pre-Project Maths Concise Maths
textbook, (table 56, appendix B). Figure 5.12 shows the proportion of creative and
imitative reasoning for the pre and post Project Maths Concise Maths textbooks at each
level.
5.3.3.4 Comparison of two topics
There is a statistically significant higher proportion of CR tasks in the topic of Differential
Calculus than the topic of Pattern, Sequences and Series in the HL post-PM textbook. A
similar result was found for the OL post-PM textbook. In relation to the pre-PM HL
textbooks a statistically higher proportion of CR tasks in the topic of Pattern, Sequences
and Series than the topic of Differential Calculus was found (see table 56, appendix B for
details). Figure 5.13 shows the proportion of different reasoning types for each topic in
both eras of the Concise Maths HL textbook series.

134
Figure 5.13: Comparison of reasoning proportions per topic for Higher Level Concise
Maths textbooks for both pre and post-Project Maths eras
5.3.4 Comparing the Textbook Series
For the HL post-Project Maths textbooks, as shown in figure 5.14, the Active Maths
textbook series had the highest proportion of CR. Concise Maths had the least and this
difference was found to be statistically significant (table 57, appendix B).

135
Figure 5.14: Comparison of reasoning proportions for HL post-PM textbook series
A similar result, (as shown in table 57, appendix B) and figure 5.15, was found for the OL
textbooks.
Figure 5.15: Comparison of reasoning proportions for OL post-PM textbook series

136
For the pre-PM HL textbooks, the greatest proportion of CR tasks was found in the
Active Maths series, the lowest incidence of CR tasks was found in the Concise Maths
series - again this difference across textbooks was found to be statistically significant
(table 57, appendix B).
Figure 5.16: Comparison of reasoning proportions for pre-PM textbook series
The greatest proportion of CR tasks in the OL pre-PM textbook series was found in
Concise Maths with 4.6%. The proportion of tasks requiring CR has increased since the
introduction of the PM syllabus, rising from an average over the three textbook series of
4.5% to 11%.
5.4 Novelty
5.4.1 Active Maths
5.4.1.1 Higher Level
The Active Maths series which was in use for HL before the introduction of PM had a
large number of tasks classified as ‘not novel’ with 77.5%. The other two categories of
‘somewhat novel’ and ‘novel’ had an incidence of 19% and 3.5% respectively. The new
textbooks recorded a marked increase in the proportion of ‘novel’ tasks at 8.8% (table
18): the relationship between the ‘novelty’ of tasks and the textbook era is statistically
significant (table 58, appendix B).

137
Novelty
Classification
Active Maths
Textbook
Series (HL)
Pattern,
Sequences
and Series
(Pre-PM)
Differential
Calculus
(Pre-PM)
Pre-PM
Total
Pattern,
Sequences
and Series
(Post-PM)
Differential
Calculus
(Post-PM)
Post-
PM
Total
Novel 9 (2.8%) 21 (3.9%) 30
(3.5%) 23 (7.1%) 55 (9.7%)
78
(8.8%)
Somewhat
Novel 59 (18.7%) 103 (19.2%)
162
(19%) 73 (22.5%) 97 (17.1%)
170
(19.1%)
Not Novel 248 (78.5%) 412 (76.9%) 660
(77.5%) 229 (70.4%) 414 (73.2%)
643
(72.1%)
Total 316 536 852 325 566 891
Table 18: Active Maths Textbook Series (HL) Types of Novelty
5.4.1.2 Ordinary Level
For OL, a similar situation to the HL was observed (table 19). The proportions for ‘not
novel’, ‘somewhat novel’ and ‘novel’ were 88.4%, 10.1% and 1.5% respectively. For the
textbooks introduced to meet the needs of the new syllabus, the incidence of ‘novel’
tasks increased to 4% and the ‘somewhat novel’ tasks increased to 17.2%, this was
accompanied by a fall in the ‘not novel’ tasks to 78.8%.
Novelty
Classification
Active Maths
Textbook Series
(HL)
Pattern,
Sequences
and Series
(Pre-PM)
Differential
Calculus (Pre-
PM)
Pre-PM
Total
Pattern,
Sequences
and Series
(Post-PM)
Differential
Calculus
(Post-PM)
Post-
PM
Total
Novel 1 (0.3%) 7 (3.2%) 8 (1.5%) 14 (4.0%) 12 (4.1%) 26
(4.0%)
Somewhat
Novel 29 (9.2%) 25 (11.4%)
54
(10.1%) 41 (11.7%) 70 (23.6%)
111
(17.2%)
Not Novel 287 (90.5%) 187 (85.4%) 474
(88.4%) 296 (84.3%) 214 (72.3%)
510
(78.8%)
Total 317 219 536 351 296 647
Table 19: Active Maths Textbook Series (OL) Types of Novelty

138
For the Active Maths OL textbook series (as seen in table 58, appendix B), the textbook
series has a statistically significant relationship between the ‘novelty’ of tasks and the
era of the textbook.
Figure 5.17: Comparison of novelty proportions in HL and OL Active Maths textbooks
per PM era
5.4.1.3 Comparison of Higher Level and Ordinary Level
The proportion of tasks across the ‘novelty’ categories in the post-PM Active Maths
textbooks is not independent of the textbook level. Similar results were found for the
pre-PM Active Maths textbooks, (see table 58, appendix B). Figure 5.17 shows a
comparison of the novelty proportions at HL and OL per PM era.
5.4.1.4 Comparison of two topics
For the OL post-PM textbooks, it was found that the proportion of tasks at different
levels of ‘novelty’ was not independent of the topic with fewer differential calculus tasks
classified as ‘not novel’. The result for the OL pre-PM textbook was similar (see table 58,
appendix B). Figure 5.18 gives a comparison of the proportion of tasks at different levels
of ‘novelty’ in the two topics in the Active Maths OL textbook series.

139
Figure 5.18: Comparison of proportion of novelty categories per topic in the OL Active
Maths pre- and post-PM textbooks
5.4.2 Text and Tests
5.4.2.1 Higher Level
For the HL Text and Tests series, there was a large increase in the proportion of
‘somewhat novel’ tasks, rising from 17.5% in the Pre-PM series to 28.5% in the
textbooks in use after the implementation of the new syllabus. This corresponded to a
similar decrease in the ‘not novel’ classification, falling from 80.9% to 67.7%, while the
proportion of ‘novel’ tasks did not change significantly.
In the Text and Tests HL textbook series, there is a statistically significant relationship
between the novelty of tasks and the textbook era (table 59, appendix B). This is a
similar result to the Active Maths series.

140
Novelty
Classification
Text and Tests
Textbook
Series (HL)
Pattern,
Sequences
and Series
(Pre-PM)
Differential
Calculus
(Pre-PM)
Pre-PM
Total
Pattern,
Sequences
and Series
(Post-PM)
Differential
Calculus
(Post-PM)
Post-
PM
Total
Novel 12 (6.0%) 11 (2.5%) 23
(3.6%) 8 (4.1%) 16 (3.7%)
24
(3.8%)
Somewhat
Novel 39 (19.6%) 74 (16.6%)
113
(17.5%) 54 (27.8%) 126 (28.8%)
180
(28.5%)
Not Novel 148 (74.4%) 360 (80.9%) 508
(78.9%) 132 (68.1%) 295 (67.5%)
427
(67.7%)
Total 199 445 644 194 437 631
Table 20: Text and Tests Textbook Series (HL) Types of Novelty
5.4.2.2 Ordinary Level
For the OL series, the difference between the two editions was much more modest. The
‘novel’ category increased from 0.3% to 3.2% and the ‘somewhat novel’ classification
increased from 13% to 13.6%. There was a corresponding small decrease in the ‘not
novel’ category, falling from 86.7% to 83.2%. However, the relationship between
‘novelty’ and the textbook era was still statistically significant for these OL textbooks
(table 59, appendix B).

141
Novelty
Classification
Text and Tests
Textbook
Series (OL)
Pattern,
Sequences
and Series
(Pre-PM)
Differential
Calculus
(Pre-PM)
Pre-PM
Total
Pattern,
Sequences
and Series
(Post-PM)
Differential
Calculus
(Post-PM)
Post-
PM
Total
Novel 1 (0.6%) 0 (0%) 1
(0.3%) 1 (0.4%) 14 (6.0%)
15
(3.2%)
Somewhat
Novel 35 (20%) 15 (7.1%)
50
(13.0%) 25 (10.6%) 39 (16.6%)
64
(13.6%)
Not Novel 139 (79.4%) 196 (92.9%) 335
(86.7%) 210 (89%) 182 (77.4%)
392
(83.2%)
Total 175 211 386 236 235 471
Table 21: Text and Tests Textbook Series (OL) Types of Novelty
Figure 5.19: Comparison of the proportions of novelty in HL and OL Text and Tests
textbooks per PM era

142
5.4.2.3 Comparison of Higher Level and Ordinary Level
The distribution of tasks across the ‘novelty’ categories is not independent of the
textbook level for the Text and Tests post-PM textbook series. Similar results were found
for the pre-PM Text and Tests textbooks, (see table 59, appendix B). Figure 5.19 gives a
comparison of the proportions of ‘novelty’ in the Higher and Ordinary Level textbooks
per PM era.
5.4.2.4 Comparison of two topics
For the OL post-PM textbooks, it was found that the proportion of tasks at different
levels of ‘novelty’ was not independent of the topic with fewer differential calculus tasks
classified as ‘not novel’. In the case of the pre-PM textbooks: for the HL textbook, the
different levels of ‘novelty’ were found not to be independent of the topic with more
tasks from Pattern, Sequences and Series classified as ‘novel’ and ‘somewhat novel’, a
similar statistically significant result was found for the OL pre-Project Maths textbook,
(see table 59, appendix B for details). Figure 5.20 below compares the proportions of
‘novelty’ in the Text and Tests Higher Level textbooks for both the pre and post-PM
periods.
Figure 5.20: Comparison of novelty proportions per topic in the Text and Tests Higher
Level textbooks per Project Maths era

143
5.4.3 Concise Maths
5.4.3.1 Higher Level
For the HL textbook series, the ‘somewhat novel’ category showed the greatest
difference between the tasks used before (17.4%) and after (22.7%) the syllabus was
introduced. As with the other series, there was a small increase in the ‘novel’ tasks and a
small decrease in the ‘not novel’ classifications.
Novelty
Classification
Concise Maths
Textbook
Series (HL)
Pattern,
Sequences
and Series
(Pre-PM)
Differential
Calculus
(Pre-PM)
Pre-PM
Total
Pattern,
Sequences
and Series
(Post-PM)
Differential
Calculus
(Post-PM)
Post-
PM
Total
Novel 9 (3%) 8 (2.1%) 17
(2.5%) 16 (4.4%) 31 (6.6%)
47
(5.7%)
Somewhat
Novel 61 (20.5%) 58 (15.0%)
119
(17.4%) 79 (22.0%) 110 (23.3%)
189
(22.7%)
Not Novel 228 (76.5%) 321 (82.9%) 549
(80.1%) 265 (73.6%) 330 (70.1%)
595
(71.6%)
Total 298 387 685 360 471 831
Table 22: Concise Maths Textbook Series (HL) Types of Novelty
In the Concise Maths Higher Level textbook series, there is a statistically significant
relationship between the ‘novelty’ of tasks and textbook era (table 60, appendix B).
5.4.3.2 Ordinary Level
For the OL textbook series, the increase in classifications for the ‘novel’ category was
slightly greater than the HL textbook going from 2.9% to 6.7%. The ‘somewhat novel’
category also increased going from 14.8% to 19.3%. The proportion of ‘not novel’ tasks
fell from 82.3% to 74%.

144
Novelty
Classification
Concise Maths
Textbook
Series (OL)
Pattern,
Sequences
and Series
(Pre-PM)
Differential
Calculus
(Pre-PM)
Pre-PM
Total
Pattern,
Sequences
and Series
(Post-PM)
Differential
Calculus
(Post-PM)
Post-
PM
Total
Novel 7 (2.7%) 7 (3.2%) 14
(2.9%) 19 (5.2%) 20 (9.4%)
39
(6.7%)
Somewhat
Novel 34 (12.9%) 37 (17.0%)
71
(14.8%) 63 (17.1%) 49 (23.1%)
112
(19.3%)
Not Novel 222 (84.4%) 174 (79.8%) 396
(82.3%) 286 (77.7%) 143 (67.5%)
429
(74%)
Total 263 218 481 368 212 580
Table 23: Concise Maths Textbook Series (OL) Types of Novelty
For the Concise Maths OL textbook series, there is a statistically significant relationship
between the ‘novelty’ of tasks and the textbook era (table 60, appendix B).
Figure 5.21: Comparison of the proportions of novelty in HL and OL Concise Maths
textbooks per PM era
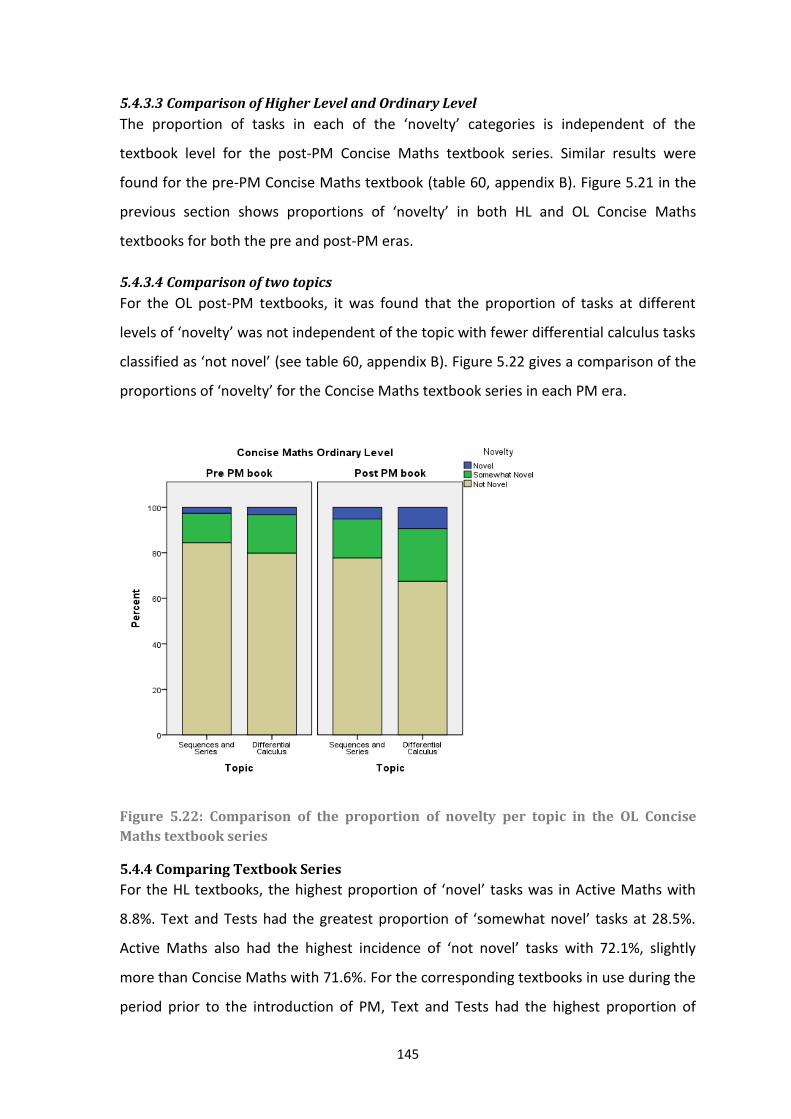
145
5.4.3.3 Comparison of Higher Level and Ordinary Level
The proportion of tasks in each of the ‘novelty’ categories is independent of the
textbook level for the post-PM Concise Maths textbook series. Similar results were
found for the pre-PM Concise Maths textbook (table 60, appendix B). Figure 5.21 in the
previous section shows proportions of ‘novelty’ in both HL and OL Concise Maths
textbooks for both the pre and post-PM eras.
5.4.3.4 Comparison of two topics
For the OL post-PM textbooks, it was found that the proportion of tasks at different
levels of ‘novelty’ was not independent of the topic with fewer differential calculus tasks
classified as ‘not novel’ (see table 60, appendix B). Figure 5.22 gives a comparison of the
proportions of ‘novelty’ for the Concise Maths textbook series in each PM era.
Figure 5.22: Comparison of the proportion of novelty per topic in the OL Concise
Maths textbook series
5.4.4 Comparing Textbook Series
For the HL textbooks, the highest proportion of ‘novel’ tasks was in Active Maths with
8.8%. Text and Tests had the greatest proportion of ‘somewhat novel’ tasks at 28.5%.
Active Maths also had the highest incidence of ‘not novel’ tasks with 72.1%, slightly
more than Concise Maths with 71.6%. For the corresponding textbooks in use during the
period prior to the introduction of PM, Text and Tests had the highest proportion of

146
‘novel’ tasks with 3.6%. The Active Maths series had the highest proportion of
‘somewhat novel’ tasks at this time with 19.2%. The Concise Maths series had the
greatest percentage of tasks labelled ‘not novel’ with 80.1%.
Every textbook analysed showed an increase in the ‘novel’ and ‘somewhat novel’
categories between the pre-PM textbooks and those introduced for the PM syllabus.
This corresponded to a decrease in the ‘not novel’ classification. The greatest increase
for ‘novel’ tasks at Higher Level was recorded in Active Maths which rose from 3.5% to
8.8%, while Text and Tests had the largest difference in both the ‘somewhat novel’ and
‘not novel’ categories. Rising from 10.1% to 17.2% for ‘somewhat novel’ and falling from
78.9% to 67.7% in the classification of ‘not novel’. For the HL books, a statistically
significant relationship was found between the proportion of tasks in each of the three
‘novelty’ categories and the three post-PM textbook series. A similar result was found
for the OL textbooks (see table 61, appendix B).
For OL, the Concise Maths textbook had the highest share of ‘novel’ tasks with 6.7% and
the greatest quantity placed in the ‘somewhat novel’ category with 19.3%. The Text and
Tests textbook had the most tasks classified as ‘not novel’ with 83.2%. As with the HL
textbook series, each of the ‘novel’ and ‘somewhat novel’ classifications increased in the
PM textbooks when compared to those used previous to the introduction of the
syllabus. Correspondingly the number of tasks assigned to the ‘not novel’ category fell.
The Concise Maths textbook showed the greatest improvement in the ‘novel’
classification, rising from 2.9% to 6.7%. The Active Maths series showed the biggest
increase in the ‘somewhat novel’ category going from 10.1% to 17.2%. It also had the
largest reduction in the ‘not novel’ classification, falling from 85.4% to 78.8%. The post-
PM textbook series were found to have 229 tasks (5.7%) in the ‘novel’ category, 826
(20.4%) in the ‘somewhat novel’ category and 2996 tasks (74%) in the ‘not novel’
category. It would appear that there was some increase in the ‘novel’ and ‘somewhat
novel’ categories, accompanied by a decline in the ‘not novel’ classification.
For the pre-PM textbook series, 93 tasks (2.6%) were found to be ‘novel’, 569 tasks
(15.9%) were classified as ‘somewhat novel’ and the remaining 2922 tasks (81.5%) were

147
categorised as ‘not novel’. For the HL books, no relationship was found between the
‘novelty’ of tasks and the three pre-PM textbook series. A statistically significant
relationship was found between the proportion of tasks placed in each of the three
‘novelty’ classifications and the pre-PM OL textbook series, (table 61, appendix B).
5.5 Project Maths Syllabus Problem-solving Objectives
It should be noted that since the PMO categories are not mutually exclusive and thus
tasks could be classified in more than one category the percentages in tables in this
section will not total to 100%.
5.5.1 Active Maths
For the pre-PM Active Maths textbooks, none of the tasks addressed the objectives
Explain findings or Communicate mathematics in written form. The most common
objective was Use mathematical models, formulae or techniques to process information
and to draw relevant conclusions with 93.5% of tasks classified in this category. The
other objectives had a much lower incidence with Explore patterns and formulate
conjectures at 8.3% and Apply knowledge and skills to solve problems in familiar contexts
at 6.8%.
For the post-PM textbook series, all objectives were represented in the set of tasks
classified. There was an increase in the incidence of all of the objectives except for two;
Explore patterns and formulate conjectures fell to 7.4% and the Use of mathematical
models decreased to 84.7%. The objective Apply knowledge and skills to solve problems
in unfamiliar contexts experienced the greatest increase going from 0.8% to 8.1%. The
objective Communicate mathematics in written form was still quite low at 3.1%, similarly
Explain findings was required by just 3.9% of the tasks. Aside from the Use of
mathematical models to draw relevant conclusions, none of the Project Maths problem-
solving objectives that were identified exceeded 10%. (See table 24).
For convenience, each of the objectives will be assigned a number for ease of
representation in the tables as follows:

148
Objective 1 = Explore patterns and formulate conjectures
Objective 2 = Explain findings
Objective 3 = Justify conclusions
Objective 4 = Communicate mathematics in written form
Objective 5 = Apply knowledge and skills to solve problems in familiar contexts,
Objective 6 = Apply knowledge and skills to solve problems in unfamiliar
contexts,
Objective 7 = Analyse information and translate it into mathematical form,
Objective 8 = Devise appropriate mathematical models, formulae or techniques
to process information and to draw relevant conclusions,
Objective 9 = Select appropriate mathematical models, formulae or techniques
to process information and to draw relevant conclusions
Objective 10 = Use appropriate mathematical models, formulae or techniques to
process information and to draw relevant conclusions.
To distinguish between objectives 2 and 3 for classification: explain findings was chosen
if a task asked students to interpret their solutions, while tasks that required students to
provide some proof or evidence were classified in the category justify conclusions. For
objectives 5 and 6, a ‘problem’ is viewed as something that contains an element of non-
routine material and requires some engagement on the part of the student in order to
solve it. In relation to the solution method, it involves the use of skills in a new or at
least different way.

149
Active Maths
(HL)
Problem-
Solving
Objectives
Pattern,
sequences
and series
(Pre-PM)
Differential
Calculus
(Pre-PM)
Pre-PM
Total
Pattern,
sequences
and series
(Post-PM)
Differential
Calculus
(Post-PM)
Post-
PM
Total
Objective 1 30
(9.5%)
41
(7.6%)
71
(8.3%)
57
(17.5%)
9
(1.6%)
66
(7.4%)
Objective 2 0
(0%)
0
(0%)
0
(0%)
9
(2.8%)
26
(4.6%)
35
(3.9%)
Objective 3 1
(0.3%)
5
(0.9%)
6
(0.7%)
5
(1.5%)
18
(3.2%)
23
(2.6%)
Objective 4 0
(0%)
0
(0%)
0
(0%)
7
(2.2%)
21
(3.7%)
28
(3.1%)
Objective 5 29
(9.2%)
29
(5.4%)
58
(6.8%)
21
(6.5%)
44
(7.8%)
65
(7.3%)
Objective 6 7
(2.2%)
0
(0%)
7
(0.8%)
37
(11.4%)
35
(6.2%)
72
(8.1%)
Objective 7 5
(1.6%)
0
(0%)
5
(0.6%)
16
(4.9%)
14
(2.5%)
30
(3.4%)
Objective 8 21
(6.6%)
30
(5.6%)
51
(6.0%)
25
(7.7%)
39
(6.9%)
64
(7.2%)
Objective 9 0
(0%)
4
(0.7%)
4
(0.5%)
12
(3.7%)
34
(6.0%)
46
(5.2%)
Objective 10
295
(93.4%)
502
(93.7%)
797
(93.5%)
282
(86.8%)
473
(83.6%)
755
(84.7%)
Table 24: Classification of PMO for HL Active Maths series
In the pre-PM OL textbook (see table 25) only 5 objectives were addressed by the set of
tasks analysed. In particular, there was no evidence of the following: Explain findings,
Justify conclusion, Communicate mathematics in written form, Apply knowledge and
skills to solve problems in unfamiliar contexts, Analyse information and translate it into
mathematical form. Explore patterns and formulate conjectures was the most common
objective in evidence at 17.2%. This can be seen in figure 5.23. Note that in this figure
and in the later figures in this section, Objective 10 Use appropriate mathematical

150
models, formulae or techniques to process information and to draw relevant conclusions
has been omitted. This is to ensure that the scale allows the other nine objectives to be
compared adequately.
Figure 5.23: Percentage of PMO in the HL and OL pre-PM Active Maths textbook series
For the post-PM OL textbook series all 10 objectives were observed and the incidence of
each of these increased except for the following three objectives: Explore patterns and
formulate conjectures and the two objectives Devise/Use appropriate mathematical
models, formulae or techniques to process information and to draw relevant conclusions.
The most common objective was the Use of appropriate mathematical models at 94%
and the objective that was encountered the least was Select appropriate mathematical
models with 1.2%.
Figure 5.24: Percentage of PMO in the HL and OL post-PM Active Maths textbook
series
0
5
10
15
20
Obj1 Obj2 Obj3 Obj4 Obj5 Obj6 Obj7 Obj8 Obj9
HL
OL
Active Maths Pre-PM
0
2
4
6
8
10
12
14
16
18
20
Obj1 Obj2 Obj3 Obj4 Obj5 Obj6 Obj7 Obj8 Obj9
HL
OL
Active Maths Post-PM

151
Several objectives had a low incidence (less than 5%), these were: Explain findings,
Justify conclusions, Communicate mathematics in written form, Analyse information and
translate it into mathematical form, Devise and Select mathematical models, formulae or
techniques to process information and to draw relevant conclusions.
Active Maths
(OL) Problem-
Solving
Objectives
Pattern,(Pre
PM)
Differential
Calculus (Pre
PM)
Pre PM
Total
Pattern,
(Post
PM)
Differential
Calculus (Post
PM)
Post PM
Total
Objective 1 92
(29.0%)
0
(0%)
92
(17.2%)
64
(18.2%)
4
(1.4%)
68
(10.5%)
Objective 2 0
(0%)
0
(0%)
0
(0%) 14 (4.0%)
15
(5.1%)
29
(4.5%)
Objective 3 0
(0%)
0
(0%)
0
(0%)
1
(0.3%)
9
(3.0%)
10
(1.5%)
Objective 4 0
(0%)
0
(0%)
0
(0%)
8
(2.3%)
11
(3.7%)
19
(2.9%)
Objective 5 6
(1.9%)
9
(4.1%)
15
(2.8%)
5
(1.4%)
30
(10.1%)
35
(5.4%)
Objective 6 0
(0%)
0
(0%)
0
(0%) 25 (7.1%)
14
(4.7%)
39
(6.0%)
Objective 7 0
(0%)
0
(0%)
0
(0%)
9
(2.6%)
13
(4.4%)
22
(3.4%)
Objective 8
6
(1.9%)
11
(5.0%)
17
(3.2%)
8
(2.3%)
4
(1.4%)
12
(1.9%)
Objective 9 0
(0%)
3
(1.4%) 3 (0.6%)
4
(1.1%)
4
(1.4%)
8
(1.2%)
Objective 10
311
(98.1%)
205
(93.6%)
516
(96.3%)
332
(94.6%)
276
(93.2%)
608
(94.0%)
Table 25: Classification of PMO for OL Active Maths series

152
5.5.1.1 Comparison of era
For Active Maths HL, an increase in the incidence of all objectives was recorded between
the pre- and post-PM eras save for Explore patterns and formulate conjectures (which
decreased from 8.3% to 7.4%) and Use appropriate mathematical models, formulae or
techniques to process information and to draw relevant conclusions (which decreased
from 93.5% to 84.7%). Figure 5.25 on the next page compares the topic and PM era for
the Active Maths HL textbook.
At OL, an increase was noted in the classification of all objectives with the exception of
three: there was a sizeable decrease in Explore patterns and formulate conjectures
(17.2% to 10.5%) and very small decreases in the other two objectives Use appropriate
mathematical models, formulae or techniques to process information and to draw
relevant conclusions and Devise appropriate mathematical models, formulae or
techniques to process information and to draw relevant conclusions. It would appear
that the new Active Maths textbooks have moved towards embracing the problem-
solving objectives but a decline has been noted in Explore patterns and formulate
conjectures at both levels. The decline at Ordinary Level in Devise appropriate
mathematical models, formulae or techniques to process information and to draw
relevant conclusions is of note, suggesting that more tasks meeting this objective will be
required. The decline in Use appropriate mathematical models, formulae or techniques
to process information and to draw relevant conclusions could be explained by the
increased diversity of the objectives present in the post-PM era.
5.5.1.2 Comparison of topic
At HL, in the post-PM era, the incidence of five objectives Explain findings, Justify
conclusions, Communicate mathematics in written form, Apply knowledge and skills to
solve problems in familiar contexts and Select appropriate mathematical models,
formulae or techniques to process information and to draw relevant conclusions was
higher in the topic of Differential Calculus than in Pattern, Sequences and Series. In the
OL textbook of the same era, the same five objectives with the addition of the objective
Analyse information and translate it into mathematical form was found to be more

153
common in the topic of Differential Calculus. Figure 5.26 below compares the topic and
PM era for the Active Maths OL textbooks.
Figure 5.25: Active Maths (HL) comparison of topic and PM era
Figure 5.26: Active Maths (OL) comparison of topic and PM era
At HL, the greatest difference between topics was found in the objective Explore
patterns and formulate conjectures with 17.5% in Pattern, Sequences and Series and
1.6% in Differential Calculus. Similarly at OL the greatest difference was also to be found
in Explore patterns and formulate conjectures with 18.2% in Pattern, Sequences and
Series and 1.4% in Differential Calculus. Given the subject matter of Pattern, Sequences
0
5
10
15
20
25
30
Obj1 Obj2 Obj3 Obj4 Obj5 Obj6 Obj7 Obj8 Obj9
PSS Pre-PM
DC Pre-PM
PSS Post-PM
DC Post-PM
Active Maths HL Topic & Era
0
5
10
15
20
25
30
Obj1 Obj2 Obj3 Obj4 Obj5 Obj6 Obj7 Obj8 Obj9
PSS Pre-PM
DC Pre-PM
PSS Post-PM
DC Post-PM
Active Maths OL Topic & Era

154
and Series, it is to be expected that there would be a greater incidence of this objective.
In contrast, the objective Apply knowledge and skills to solve problems in familiar
contexts was much more common at OL in the topic of Differential Calculus (10.1%)
when compared to Pattern, Sequences and Series (1.4%).
5.5.1.3 Higher Level vs Ordinary Level
All the objectives in the post-PM textbook era were more common at HL than OL with
the exception of three; Explore patterns and formulate conjectures (10.5% compared to
7.4%), Explain findings (4.5% compared to 3.9%) and Use appropriate mathematical
models, formulae or techniques to process information and to draw relevant conclusions
(94% compared to 84.7%). It is surprising that the OL textbook offers more opportunities
for the exploration of patterns, the formulation of conjectures and the explanation of
findings when compared to the HL textbook. Again the difference in the objective Use
appropriate mathematical models, formulae or techniques to process information and to
draw relevant conclusions could be accounted for by the increased diversity of the other
problem-solving objectives in the HL textbook.
5.5.2 Text and Tests
For the Text and Tests HL textbooks (see table 26), all 10 objectives were found to be
present in the material examined from the post-PM era. The objective involving the use
of mathematical models was the most commonly encountered at 89.2%. Explore
patterns and formulate conjectures was recorded at 13% and the proportion of tasks
involving the objective Apply knowledge and skills to solve problems in familiar contexts
was 7.6%. Three of the objectives had incidences of less than 1% in the tasks examined.
Within the tasks analysed, 0.8% required the explanation of findings, 0.3% needed the
justification of conclusions while 0.5% involved the communication of mathematics in
written form. The incidence of the objective Devise mathematical models was 3.5%
while that of Select mathematical models was 4.8%.

155
Text and Tests
(HL) Problem-
Solving
Objectives
Pattern,
(Pre-PM)
Differential
Calculus (Pre-
PM)
Pre-PM
Total
Pattern,
(Post-
PM)
Differential
Calculus
(Post-PM)
Post-PM
Total
Objective 1 5
(2.5%)
0
(0%)
5
(0.8%)
56
(28.9%)
26
(5.9%)
82
(13.0%)
Objective 2 0
(0%)
1
(0.2%)
1
(0.2%)
3
(1.5%)
2
(0.5%)
5
(0.8%)
Objective 3 0
(0%)
0
(0%)
0
(0%)
0
(0%)
2
(0.5%)
2
(0.3%)
Objective 4 0
(0%)
0
(0%)
0
(0%)
1
(0.5%)
2
(0.5%)
3
(0.5%)
Objective 5 15
(7.5%)
11
(2.5%)
26
(4.0%)
28
(14.4%)
20
(4.6%)
48
(7.6%)
Objective 6 0
(0%)
0
(0%)
0
(0%)
6
(3.1%)
14
(3.2%)
20
(3.2%)
Objective 7 0
(0%)
4
(0.9%)
4
(0.6%)
10
(5.2%)
4
(0.9%)
14
(2.2%)
Objective 8
15
(7.5%)
11
(2.5%)
26
(4.0%)
21
(10.8%)
1
(0.2%)
22
(3.5%)
Objective 9 1
(0.5%)
3
(0.7%)
4
(0.6%)
14
(7.2%)
16
(3.7%)
30
(4.8%)
Objective 10
183
(92.0%)
431
(96.9%)
614
(95.3%)
148
(76.3%)
415
(95.0%)
563
(89.2%)
Table 26: Classification of PMO for HL Text and Tests
For the post-PM OL Text and Tests textbook (see table 27), all 10 objectives were found
in the tasks analysed. As with the Higher Level textbooks the Use mathematical models
objective was the most common at 90.2%, while Justify Conclusions was the least at
0.2%. However, Explain findings had a higher incidence at 6.4%.

156
Text and Tests
(OL) Problem-
Solving
Objectives
Pattern,
(Pre-
PM)
Differential
Calculus (Pre-
PM)
Pre-PM
Total
Pattern,
(Post-PM)
Differential
Calculus (Post-
PM)
Post-PM
Total
Objective 1 18
(10.3%)
0
(0%)
18
(4.7%)
64
(27.1%)
16
(6.8%)
80
(17.0%)
Objective 2 1
(0.6%)
0
(0%)
1
(0.3%)
20
(8.5%)
10
(4.3%)
30
(6.4%)
Objective 3 0
(0%)
0
(0%)
0
(0%)
0
(0%)
1
(0.4%)
1
(0.2%)
Objective 4 0
(0%)
0
(0%)
0
(0%)
0
(0%)
12
(5.1%)
12
(2.5%)
Objective 5 1
(0.6%)
0
(0%)
1
(0.3%)
5
(2.1%)
14
(6.0%)
19
(4.0%)
Objective 6 0
(0%)
0
(0%)
0
(0%)
0
(0%)
3
(1.3%)
3
(0.6%)
Objective 7 0
(0%)
0
(0%)
0
(0%)
0
(0%)
4
(1.7%)
4
(0.8%)
Objective 8
8
(4.6%)
0
(0%)
8
(2.1%)
3
(1.3%)
2
(0.9%)
5
(1.1%)
Objective 9 0
(0%)
0
(0%)
0
(0%)
1
(0.4%)
17
(7.2%)
18
(3.8%)
Objective 10
167
(95.4%)
211
(100%)
378
(97.9%)
223
(94.5%)
202
(86.0%)
425
(90.2%)
Table 27: Classification of PMO for OL Text and Tests
5.5.2.1 Comparison of era
For Text and Tests HL, an increase in the incidence of all objectives was recorded
between the pre- and post-Project Maths eras save for Devise appropriate mathematical
models, formulae or techniques to process information and to draw relevant conclusions
(which decreased from 4% to 3.5%) and Use appropriate mathematical models, formulae
or techniques to process information and to draw relevant conclusions (which decreased
from 95.3% to 89.2%).

157
At OL, a similar situation was noted with a decrease in the incidence of Devise
appropriate mathematical models, formulae or techniques to process information and to
draw relevant conclusions from 2.1% to 1.1%. The lower incidence of this objective in
both the HL and OL Text and Tests textbooks is of concern as it might offer students less
opportunities to experiment and create their own solution methods.
5.5.2.2 Comparison of topic
At HL, in the post-PM era, the incidence of six objectives Explore patterns and formulate
conjectures, Explain findings, Apply knowledge and skills to solve problems in familiar
contexts, Analyse information and translate it into mathematical form, Devise
appropriate mathematical models, formulae or techniques to process information and to
draw relevant conclusions and Select appropriate mathematical models, formulae or
techniques to process information and to draw relevant conclusions was more common
in the topic of Pattern, Sequences and Series than Differential Calculus. Figure 5.27
below compares the topic and PM era for the Text and Tests Higher Level textbook.
Figure 5.27: Text and Tests (HL) comparison of topic and PM era
In the post-PM OL textbook, four of these objectives (Explore patterns and formulate
conjectures, Explain findings, Devise appropriate mathematical models, formulae or
techniques to process information and to draw relevant conclusions and Use appropriate
0
5
10
15
20
25
30
Obj1 Obj2 Obj3 Obj4 Obj5 Obj6 Obj7 Obj8 Obj9
PSS Pre-PM
DC Pre-PM
PSS Post-PM
DC Post-PM
Text & Tests HL Topic & Era

158
mathematical models, formulae or techniques to process information and to draw
relevant conclusions) were also found to be more common in the topic of Pattern,
Sequences and Series. Figure 5.28 below compares the topic and PM era for the Active
Maths OL textbooks.
Figure 5.28: Text and Tests (OL) comparison of topic and PM era
At both HL and OL, the greatest difference between topics was found in the objective
Explore patterns and formulate conjectures (Higher Level: 28.9% in Pattern, Sequences
and Series, 5.9% in Differential Calculus; Ordinary Level: 27.1% in Pattern, Sequences
and Series, 6.8% in Differential Calculus). This may be due to the material contained in
the topic.
5.5.2.3 Higher Level vs Ordinary Level
Five of the objectives in the post-PM textbook era were more common at HL than OL;
Justify conclusions (0.3% compared to 0.2%), Apply knowledge and skills to solve
problems in unfamiliar contexts (3.2% compared to 0.6%), Analyse information and
translate it into mathematical form (2.2% compared to 0.8%) Devise appropriate
mathematical models, formulae or techniques to process information and to draw
relevant conclusions (3.5% compared to 1.1%) and Select appropriate mathematical
models, formulae or techniques to process information and to draw relevant conclusions
(4.8% compared to 3.8%). It is surprising that the OL textbook appears to better
embrace the problem-solving objectives of Explore patterns and formulate conjectures,
0
5
10
15
20
25
30
Obj1 Obj2 Obj3 Obj4 Obj5 Obj6 Obj7 Obj8 Obj9
PSS Pre-PM
DC Pre-PM
PSS Post-PM
DC Post-PM
Text & Tests OL Topic & Era

159
Explain findings, Communicate mathematics in written form, Apply knowledge and skills
to solve problems in familiar contexts and Use appropriate mathematical models,
formulae or techniques to process information and to draw relevant conclusions.
5.5.3 Concise Maths
All 10 objectives were present in the material analysed from the Concise Maths Higher
Level textbooks in use after the introduction of PM. The objective with the highest
incidence was Use appropriate mathematical models, formulae or techniques to process
information and to draw relevant conclusions at 92.8%. The next most common was
Apply knowledge and skills to solve problems in familiar contexts with 6.7%.
Communicate mathematics in written form was the least common with 0.7%.
The material analysed from the OL textbooks, in use after the syllabus change, had all 10
objectives present (see table 29). Use appropriate mathematical models was the most
common at 86.6% and the next most common was Explore patterns and formulate
conjectures at 14%. The objective Communicate mathematics in written form was the
least common with 0.3%.

160
Concise Maths
(HL) Problem-
Solving
Objectives
Pattern
(Pre-PM)
Differential
Calculus (Pre-
PM)
Pre-PM
Total
Pattern,
(Post-
PM)
Differential
Calculus (Post-
PM)
Post-PM
Total
Objective 1 0
(0%)
0
(0%)
0
(0%)
7
(1.9%)
9
(1.9%)
16
(1.9%)
Objective 2 2
(0.7%)
2
(0.5%)
4
(0.6%)
0
(0%)
11
(2.3%)
11
(1.3%)
Objective 3 1
(0.3%)
0
(0%)
1
(0.1%)
2
(0.6%)
6
(1.3%)
8
(1.0%)
Objective 4 0
(0%)
0
(0%)
0
(0%)
0
(0%)
6
(1.3%)
6
(0.7%)
Objective 5 15
(5.0%)
6
(1.6%)
21
(3.1%)
21
(5.8%)
35
(7.4%)
56
(6.7%)
Objective 6 2
(0.7%)
2
(0.5%)
4
(0.6%)
14
(3.9%)
23
(4.9%)
37
(4.5%)
Objective 7 2
(0.7%)
0
(0%)
2
(0.3%)
13
(3.6%)
8
(1.7%)
21
(2.5%)
Objective 8
17
(5.7%)
8
(2.1%)
25
(3.6%)
5
(1.4%)
4
(0.8%)
9
(1.1%)
Objective 9 0
(0%)
4
(1.0%)
4
(0.6%)
2
(0.6%)
33
(7.0%)
35
(4.2%)
Objective 10
281
(94.3%)
375
(96.9%)
656
(95.8%)
344
(95.6%)
427
(90.7%)
771
(92.8%)
Table 28: Classification of PMO for HL Concise Maths

161
Concise Maths
(OL) Problem-
solving
Objectives
Pattern,(Pre-
PM)
Differential
Calculus
(Pre-PM)
Pre-PM
Total
Pattern,
(Post-
PM)
Differential
Calculus
(Post-PM)
Post-
PM
Total
Objective 1 15
(5.7%)
1
(0.5%)
16
(3.3%)
71
(19.3%)
10
(4.7%)
81
(14.0%)
Objective 2 0
(0%)
0
(0%)
0
(0%)
8
(2.2%)
6
(2.8%)
14
(2.4%)
Objective 3 0
(0%)
0
(0%)
0
(0%) 10 (2.7%)
3
(1.4%)
13
(2.2%)
Objective 4 0
(0%)
0
(0%)
0
(0%)
1
(0.3%)
1
(0.5%)
2
(0.3%)
Objective 5 15
(5.7%)
6
(2.8%)
21
(4.4%) 16 (4.3%)
29
(13.7%)
45
(7.8%)
Objective 6 0
(0%)
1
(0.5%)
1
(0.2%) 22 (6.0%)
11
(5.2%)
33
(5.7%)
Objective 7 1
(0.4%)
0
(0%)
1
(0.2%) 16 (4.3%)
8
(1.7%)
24
(4.1%)
Objective 8
15
(5.7%)
7
(3.2%)
22
(4.6%) 12 (3.3%)
3
(1.4%)
15
(2.6%)
Objective 9 0
(0%)
0
(0%)
0
(0%)
6
(1.6%)
25
(11.8%)
31
(5.3%)
Objective 10
248
(94.3%)
211
(96.8%)
459
(95.4%)
324
(88%)
178
(84.0%)
502
(86.6%)
Table 29: Classification of PMO for OL Concise Maths
5.5.3.1 Comparison of era
In the Concise Maths HL textbooks, all objectives were found to have increased between
the two eras with the exception of Devise appropriate mathematical models, formulae
or techniques to process information and to draw relevant conclusions (which decreased
from 3.6% to 1.1%) and Use appropriate mathematical models, formulae or techniques
to process information and to draw relevant conclusions (which decreased from 95.8% to
92.8%).

162
At OL, an increase in all objectives was noted except for the two objectives Devise and
Use appropriate mathematical models, formulae or techniques to process information
and to draw relevant conclusions (decrease from 4.6% to 2.6% and 95.4% to 86.6%
respectively). The lower incidence of the Devise appropriate mathematical models,
formulae or techniques to process information and to draw relevant conclusions
objective in both the HL and OL Concise Maths textbooks is of concern as it might make
students more dependent on the selection and use of solution methods rather than
experimenting to construct their own.
5.5.3.2 Comparison of topic
At HL, in the post-PM era, the incidence of three objectives Analyse information and
translate it into mathematical form, Devise appropriate mathematical models, formulae
or techniques to process information and to draw relevant conclusions and Use
appropriate mathematical models, formulae or techniques to process information and to
draw relevant conclusions were more common in the topic of Pattern, Sequences and
Series than Differential Calculus. Figure 5.29 below compares the topic and PM era for
the Text and Tests HL textbook.
Figure 5.29: Concise Maths (HL) comparison of topic and PM era
In the post-PM OL textbook; six objectives Explore patterns and formulate conjectures,
Justify conclusions, Apply knowledge and skills to solve problems in unfamiliar contexts,
Analyse information and translate it into mathematical form, Devise appropriate
0
5
10
15
20
25
30
Obj1 Obj2 Obj3 Obj4 Obj5 Obj6 Obj7 Obj8 Obj9
PSS Pre-PM
DC Pre-PM
PSS Post-PM
DC Post-PM
Concise Maths HL Topic & Era

163
mathematical models, formulae or techniques to process information and to draw
relevant conclusions and Use appropriate mathematical models, formulae or techniques
to process information and to draw relevant conclusions were found to be more
common in the topic of Pattern, Sequences and Series. Figure 5.30 below compares the
topic and PM era for the Active Maths OL textbooks.
Figure 5.30: Concise Maths (OL) comparison of topic and PM era
At HL, the greatest difference between topics was found in the objective Select
appropriate mathematical models, formulae or techniques to process information and to
draw relevant conclusions with 0.6% in Pattern, Sequences and Series and 7% in
Differential Calculus. At OL the greatest difference was found in the objective Explore
patterns and formulate conjectures with 19.3% in Pattern, Sequences and Series and
4.7% in Differential Calculus. As observed with the other textbook series, this may be
due to the material contained in the topic.
5.5.3.3 Higher Level vs Ordinary Level
Just two of the objectives in the post-PM textbook era were more common at HL than
OL; Communicate mathematics in written form (0.7% compared to 0.3%) and Use
appropriate mathematical models, formulae or techniques to process information and to
draw relevant conclusions (92.8% compared to 86.5%). Overall, it would appear that the
OL textbook appears to better embrace the problem-solving objectives than the HL
textbook.
0
5
10
15
20
25
30
Obj1 Obj2 Obj3 Obj4 Obj5 Obj6 Obj7 Obj8 Obj9
PSS Pre-PM
DC Pre-PM
PSS Post-PM
DC Post-PM
Concise Maths OL Topic & Era

164
5.5.4 Comparison of Textbook Series
Figure 5.31: Comparison of PMO (percentages) post-PM HL textbook series
Figure 5.31 above gives a comparison of the PMO for the post-PM HL textbook series.
The HL Active Maths textbook had the greatest incidence of 7 of the objectives, Text and
Tests HL had 2 and Concise Maths Higher Level had the highest percentage of one
objective Use appropriate mathematical models, formulae or techniques to process
information and to draw relevant conclusion which is not displayed in the figure. This
would suggest that out of the three textbook series, Active Maths is the most rounded in
terms of problem-solving objectives at Higher Level.
Figure 5.32: Comparison of post-PM PMO (percentages) OL textbook series
Figure 5.32 gives a comparison of the PMO for the post-PM OL textbook series.
It would appear that Concise Maths OL has the greatest blend of problem-solving
objectives.
0
2
4
6
8
10
12
14
16
18
20
Obj1 Obj2 Obj3 Obj4 Obj5 Obj6 Obj7 Obj8 Obj9
Active Maths
Text & Tests
Concise Maths
Post-PM HL
0
5
10
15
20
Obj1 Obj2 Obj3 Obj4 Obj5 Obj6 Obj7 Obj8 Obj9
Active Maths
Text & Tests
Concise Maths
Post-PM OL

165
Figure 5.33: Comparison of pre-PM PMO (percentages) HL textbook series
Figure 5.33 gives a comparison of the PMO for the pre-PM HL textbook series. In the
pre-PM HL textbook series, Active Maths had the greatest percentages in five objectives
while Concise Maths had the greatest in two. The classification Communicate
mathematics in written form was not recorded in any of the series. In this era, the Active
Maths textbook was the most rounded in terms of problem-solving objectives.
Figure 5.34 gives a comparison of the PMO for the pre-PM OL textbook series. The
objectives Justify conclusions and Communicate mathematics in written form were not
recorded in any of the OL textbooks. Concise Maths OL had the greatest percentages in
four objectives, Active Maths OL and Text and Tests OL had the greatest in two
objectives each. It would suggest that the Concise Maths OL textbook was the most
rounded in terms of PMO at this time.
0
2
4
6
8
10
12
14
16
18
20
Obj1 Obj2 Obj3 Obj4 Obj5 Obj6 Obj7 Obj8 Obj9
Active Maths
Text & Tests
Concise Maths
Pre-PM Higher Level

166
Figure 5.34: Comparison of pre-PM PMO (percentages) OL textbook series
For the three textbook series, all of the material analysed experienced an increase in the
percentage of tasks for seven of the problem-solving objectives between the pre- and
post-PM eras. In contrast a percentage decrease was found in three objectives. The
objective Explore patterns and formulate conjectures was found to have decreased for
both the HL and OL textbooks in the Active Maths series, while increasing in the Text and
Tests and Concise Maths series. With the exception of the Active Maths HL textbook, a
decrease in the objective Devise appropriate mathematical models, formulae or
techniques to process information and to draw relevant conclusions was found. Finally a
decrease in the objective Use appropriate mathematical models, formulae or techniques
to process information and to draw relevant conclusions was noted in all textbooks.
These results would suggest that the textbook series have all improved in terms of
embracing the problem-solving objectives. The decrease in Use appropriate
mathematical models, formulae or techniques to process information and to draw
relevant conclusions suggests that the objectives have become more diverse and a
greater proportion of tasks require students to select appropriate solution methods
rather than just using given techniques. However, it is a cause for concern that Devise
appropriate mathematical models, formulae or techniques to process information and to
draw relevant conclusions has not been given more attention. It is likely that those using
the material from the Active Maths OL textbook or any of the textbooks from the Text
0
2
4
6
8
10
12
14
16
18
20
Obj1 Obj2 Obj3 Obj4 Obj5 Obj6 Obj7 Obj8 Obj9
Active Maths
Text & Tests
Concise Maths
Pre-PM OL

167
and Tests and Concise Maths series will need to develop the ability to create their own
solution methods and techniques in some other way.
5.6 Usiskin’s Multidimensional Model of Mathematical Understanding
I did not find any tasks in any of the textbook series, either pre-PM or post-PM editions,
which addressed the History-Culture dimension. For completion, the dimension has
been included in all of the tables that follow even though its incidence is 0%. As was the
case with the PMO framework, it is possible for tasks to be classified in more than one
category here and so the percentages in the tables that follow do not add to 100%.
5.6.1 Active Maths
For the HL Pre-PM textbooks, the proportion of tasks classified in the Skill-Algorithm
dimension was quite high (98%) while the proportions of tasks in the Property-Proof
(8.2%), Use-Application (9%) and Representation-Metaphor (7.4%) dimensions were
much lower. After the introduction of the new syllabus, the proportion of tasks in the
Skill-Algorithm dimension fell slightly to 95%. The greatest increase was seen in the
Representation-Metaphor dimension which rose to 21%. The Property-Proof and Use-
Application dimensions recorded a more modest increase by rising to 13.1% and 14.9%
respectively (see table 30). For these two dimensions, the result is surprising: given the
focus of PM, it might be expected that a greater increase should be noted.

168
Usiskin
Multidimensional
model
Classification
Active Maths
Textbook Series
(HL)
Pattern,
Sequences
and Series
(Pre-PM)
Differential
Calculus
(Pre-PM)
Pre-PM
Total
Pattern,
Sequences
and Series
(Post-PM)
Differential
Calculus
(Post-PM)
Post-
PM
Total
Skill-Algorithm 302
(95.6%) 533 (99.4%)
835
(98.0%)
316
(97.2%) 530 (93.6%)
846
(95.0%)
Property-Proof 38
(12%)
32
(6%)
70
(8.2%)
75
(23.1%)
42
(7.4%)
117
(13.1%)
Use-Application 9
(2.8%)
68
(12.7%)
77
(9.0%)
31
(9.5%)
102
(18%)
133
(14.9%)
Representation-
Metaphor
0
(0%)
63
(11.8%)
63
(7.4%)
55
(16.9%) 132 (23.3%)
187
(21%)
History-Culture 0
(0%)
0
(0%)
0
(0%)
0
(0%)
0
(0%)
0
(0%)
Total Tasks 316 536 852 325 566 891
Table 30: Classification of Usiskin’s Multidimensional Model for HL Active Maths
The situation was very similar with the OL textbooks. Again the Skill-Algorithm
dimension fell slightly in the post-PM editions. The biggest increase was recorded with
the Representation-Metaphor dimension rising to 27.8% from 1.3%, while more modest
increases were noted in the Property-Proof and Use-Application dimensions (see table
31). It would appear that the Skill-Algorithm is still the dominant dimension in the post-
PM textbooks while a strong increase is evident in the Representation-Metaphor
dimension.

169
Usiskin
Multidimensional
model
Classification
Active Maths
Textbook Series
(OL)
Pattern,
Sequences
and Series
(Pre-PM)
Differential
Calculus
(Pre-PM)
Pre-PM
Total
Pattern,
Sequences
and Series
(Post-PM)
Differential
Calculus
(Post-PM)
Post-
PM
Total
Skill-Algorithm 317 (100%) 216 (98.6%) 533
(99.4%)
348
(99.1%) 282 (95.3%)
630
(97.4%)
Property-Proof 20
(6.3%)
9
(4.1%)
29
(5.4%)
49
(14%)
18
(6.1%)
67
(10.4%)
Use-Application 0
(0%)
47
(21.5%)
47
(8.8%)
21
(6%)
82
(27.7%)
103
(15.9%)
Representation-
Metaphor
0
(0%)
7
(3.2%)
7
(1.3%)
95
(27.1%)
85
(28.7%)
180
(27.8%)
History-Culture 0
(0%)
0
(0%)
0
(0%)
0
(0%)
0
(0%)
0
(0%)
Total Tasks 317 219 536 351 296 647
Table 31: Classification of Usiskin’s Multidimensional Model for OL Active Maths
5.6.1.1 Higher Level vs Ordinary Level
The HL post-PM textbook had a greater percentage in just one dimension Property-
Proof. The OL post-PM textbook had a greater proportion of tasks categorised in the
Skill-Algorithm, Use-Application and Representation-Metaphor dimensions.
5.6.1.2 Comparison of topic
For the pre-PM Active Maths HL textbook series, only the Property-Proof dimension had
a higher incidence in the topic of Pattern, Sequences and Series when compared to
Differential Calculus. In the post-PM textbook, the Skill-Algorithm and Property Proof
dimensions had a greater percentage in the Pattern, Sequences and Series topic than
Differential Calculus. All the dimensions in each topic recorded an increase in
percentages with the exception of Skill-Algorithm which decreased slightly in Differential
Calculus. Figure 5.35 compares the classification of Usiskin’s Multidimensional Model for
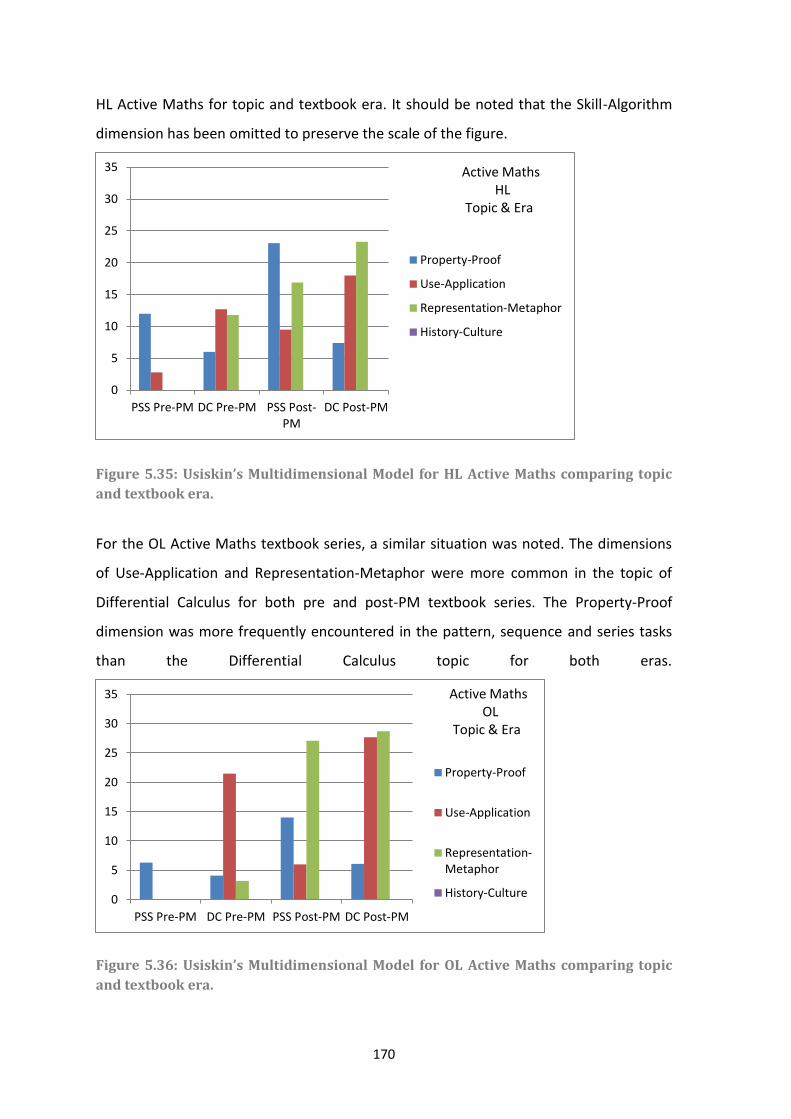
170
HL Active Maths for topic and textbook era. It should be noted that the Skill-Algorithm
dimension has been omitted to preserve the scale of the figure.
Figure 5.35: Usiskin’s Multidimensional Model for HL Active Maths comparing topic
and textbook era.
For the OL Active Maths textbook series, a similar situation was noted. The dimensions
of Use-Application and Representation-Metaphor were more common in the topic of
Differential Calculus for both pre and post-PM textbook series. The Property-Proof
dimension was more frequently encountered in the pattern, sequence and series tasks
than the Differential Calculus topic for both eras.
Figure 5.36: Usiskin’s Multidimensional Model for OL Active Maths comparing topic
and textbook era.
0
5
10
15
20
25
30
35
PSS Pre-PM DC Pre-PM PSS Post-PM
DC Post-PM
Property-Proof
Use-Application
Representation-Metaphor
History-Culture
Active Maths HL Topic & Era
0
5
10
15
20
25
30
35
PSS Pre-PM DC Pre-PM PSS Post-PM DC Post-PM
Property-Proof
Use-Application
Representation-Metaphor
History-Culture
Active Maths OL Topic & Era

171
5.6.2 Text and Tests
For the post-PM HL Text and Tests textbooks the most common dimension encountered
was Skill-Algorithm with 95.9% (see table 32). The Representation-Metaphor dimension
is much less common at 12.8% while the Use-Application and Property-Proof dimensions
are similar with 10.5% and 8.7% respectively.
Usiskin
Multidimensional
model
Classification
Text and Tests
Textbook Series
(HL)
Pattern,
Sequences
and Series
(Pre-PM)
Differential
Calculus
(Pre-PM)
Pre-PM
Total
Pattern,
Sequences
and Series
(Post-PM)
Differential
Calculus
(Post-PM)
Post-
PM
Total
Skill-Algorithm 192
(96.5%)
445
(100%)
637
(98.9%)
173
(89.2%) 432 (98.9%)
605
(95.9%)
Property-Proof 16
(8%)
6
(1.3%)
22
(3.4%)
44
(22.7%)
11
(2.5%)
55
(8.7%)
Use-Application 0
(0%)
0
(0%)
0
(0%)
24
(12.4%)
42
(9.6%)
66
(10.5%)
Representation-
Metaphor
0
(0%)
26
(5.8%)
26
(4.0%)
26
(13.4%)
55
(12.6%)
81
(12.8%)
History-Culture 0
(0%)
0
(0%)
0
(0%)
0
(0%)
0
(0%)
0
(0%)
Total Tasks 199 445 644 194 437 631
Table 32: Classification of Usiskin’s Multidimensional Model for HL Text and Tests
At OL, the post-PM textbook had the presence of the Skill-Algorithm dimension in
almost every task with 97% (see table 33). The Use-Application dimension was found in
19.3% of the analysed tasks. The presence of the Representation-Metaphor and
Property-Proof dimensions were lower at 17.8% and 7.4% respectively.

172
Usiskin
Multidimensiona
l model
Classification
Text and Tests
Textbook Series
(OL)
Pattern,
Sequences
and Series
(Pre-PM)
Differentia
l Calculus
(Pre-PM)
Pre-PM
Total
Pattern,
Sequences
and Series
(Post-PM)
Differential
Calculus
(Post-PM)
Post-PM
Total
Skill-Algorithm 175
(100%)
211
(100%)
386
(100%)
236
(100%) 221 (94.0%) 457 (97.0%)
Property-Proof 11 (6.3%) 0 (0%) 11 (2.8%) 19 (8.1%) 16 (6.8%) 35 (7.4%)
Use-Application 0
(0%) 40 (19.0%)
40
(10.4%)
13
(5.5%)
78
(33.2%)
91
(19.3%)
Representation-
Metaphor
0
(0%)
1
(0.5%)
1
(0.3%) 51 (21.6%)
33
(14%)
84
(17.8%)
History-Culture 0 (0%) 0 (0%) 0 (0%) 0 (0%) 0 (0%) 0 (0%)
Total Tasks 175 211 386 236 235 471
Table 33: Classification of Usiskin’s Multidimensional Model for OL Text and Tests
5.6.2.1 Higher vs Ordinary
The percentages for the Skill-Algorithm, Use-Application and Representation-Metaphor
dimensions were greater in the OL post-PM Text and Tests textbook than the HL
textbooks of the same era. The Property-Proof dimension percentage was greater in the
HL Text and Tests textbooks.
5.6.2.2 Comparison of topic
For the Text and Tests pre-PM HL textbook series, the proportion of tasks classified in
the Skill-Algorithm and Representation-Metaphor dimensions were more common in
the topic of Differential Calculus, while the percentage for the Property-Proof dimension
was greater in the topic of Pattern, Sequences and Series. In the post-PM era, the
Property-Proof, Use-Application and Representation-Metaphor dimensions had greater
percentages in the topic of Pattern, Sequences and Series. The Skill-Algorithm dimension
was greater in Differential Calculus. Figure 5.37 compares the topic and era for the
Multidimensional Model for the HL Text and Tests textbook series.

173
Figure 5.37: Usiskin’s Multidimensional Model for HL Active Maths comparing topic
and textbook era.
The dimensions Use-Application and Representation-Metaphor dimensions had a
greater incidence in the topic of Differential Calculus for the pre-PM Text and Tests OL
textbook. The Property Proof dimension was the only dimension which had a higher
percentage in the topic of Pattern, Sequences and Series. A much higher incidence of
Use-Application in Differential Calculus (33.2%) was found in the post-PM Text and Tests
OL textbook when compared to that of Pattern, Sequences and Series (5.5%). However
for the other three dimensions, a higher percentage was recorded in the topic of
Pattern, Sequences and Series. Figure 5.38 compares the topic and era for the
Multidimensional Model for the OL Text and Tests textbook series.
0
5
10
15
20
25
30
35
PSS Pre-PM DC Pre-PM PSS Post-PM
DC Post-PM
Property-Proof
Use-Application
Representation-Metaphor
History-Culture
Text & Tests HL Topic & Era

174
Figure 5.38: Usiskin’s Multidimensional Model for HL Active Maths comparing topic
and textbook era.
5.6.3 Concise Maths
Just as with the other two HL post-PM textbook series, the proportion of Skill-Algorithm
tasks was quite high for Concise Maths with 98.9% (see table 34). The Use-Application
dimension was much lower with 16.4%. The two remaining dimensions were much
lower with Property-Proof at 7% and Representation-Metaphor at 6.4%.
0
5
10
15
20
25
30
35
PSS Pre-PM DC Pre-PM PSS Post-PM
DC Post-PM
Property-Proof
Use-Application
Representation-Metaphor
History-Culture
Text & Tests OL Topic & Era

175
Usiskin
Multidimensional
model
Classification
Concise Maths
Textbook Series
(HL)
Pattern,
Sequences
and Series
(Pre-PM)
Differential
Calculus
(Pre-PM)
Pre-PM
Total
Pattern,
Sequences
and Series
(Post-PM)
Differential
Calculus
(Post-PM)
Post-
PM
Total
Skill-Algorithm 297
(99.7%)
387
(100%)
684
(99.9%)
358
(99.4%) 464 (98.5%)
822
(98.9%)
Property-Proof 12
(4%)
0
(0%)
12
(1.8%)
26
(7.2%)
32
(6.8%)
58
(7.0%)
Use-Application 2
(0.7%)
29
(7.5%)
31
(4.5%)
18
(5%) 118 (25.1%)
136
(16.4%)
Representation-
Metaphor
1
(0.3%)
7
(1.8%)
8
(1.2%)
7
(1.9%)
46
(9.8%)
53
(6.4%)
History-Culture 0
(0%)
0
(0%)
0
(0%)
0
(0%)
0
(0%)
0
(0%)
Total Tasks 298 387 685 360 471 831
Table 34: Classification of Usiskin’s Multidimensional Model for HL Concise Maths
Similar to the pre-PM OL Text and Tests textbooks, the corresponding Concise Maths
textbooks were all found to involve the Skill-Algorithm dimension. The remaining
dimensions were distributed as followed: Property-Proof with 7.7%, Use-Application
with 8.9% and Representation-Metaphor at 4.2%. As with the other post-PM textbook
series, the proportion of Skill-Algorithm fell and the other three dimensions rose. The
Skill-Algorithm dimension decreased to 94.7%. A slight increase in the Property-Proof
dimension was recorded, rising from 7.7% to 8.6%. The other two dimensions showed
much larger increases: Use-Application rose to 21.7% from 8.9% and Representation-
Metaphor climbed to 20.9% from 4.2% (see table 35).

176
Usiskin
Multidimensional
model
Classification
Concise Maths
Textbook Series
(OL)
Pattern,
Sequences
and Series
(Pre-PM)
Differential
Calculus
(Pre-PM)
Pre-
PM
Total
Pattern,
Sequences
and Series
(Post-PM)
Differential
Calculus
(Post-PM)
Post-
PM
Total
Skill-Algorithm 263 (100%) 218
(100%)
481
(100%) 355 (96.5%) 194 (91.5%)
549
(94.7%)
Property-Proof 33
(12.5%)
4
(1.8%)
37
(7.7%)
22
(6%)
28
(13.2%)
50
(8.6%)
Use-Application 0
(0%)
43
(19.7%)
43
(8.9%)
69
(18.8%)
57
(26.9%)
126
(21.7%)
Representation-
Metaphor
0
(0%)
2
(0.9%)
2
(4.2%)
85
(23.1%)
36
(17%)
121
(20.9%)
History-Culture 0
(0%)
0
(0%)
0
(0%)
0
(0%)
0
(0%)
0
(0%)
Total Tasks 263 218 481 368 212 580
Table 35: Classification of Usiskin’s Multidimensional Model for OL Concise Maths
5.6.3.1 Higher Level vs Ordinary Level
For the post-PM HL Concise Maths textbooks, only the Skill-Algorithm dimension had the
greatest incidence when compared to the OL textbooks. The OL textbooks appear to
offer a greater range of learning dimensions than the HL ones.
5.6.3.2 Comparison of topic
In the HL Pre-PM Concise Maths textbook series, the Property-Proof dimension was the
only one with a greater percentage in the topic of Pattern, Sequences and Series. The
dimension of Use-Application was much more evident in the topic of Differential
Calculus (25.1%) when compared to that of Pattern, Sequences and Series (5%) for the
post-PM Concise Maths Higher Level textbook series. Similarly the Representation-
Metaphor dimension had a greater percentage in Differential Calculus for the same era.

177
Figure 5.39 compares the topic and era for the Multidimensional Model for the HL
Concise Maths textbook series.
Figure 5.39: Usiskin’s Multidimensional Model for HL Concise Maths comparing topic
and textbook era.
A similar situation exists for the OL Concise Maths post-PM textbook series. The
percentage of tasks classified in the Use-Application dimension was greater in the
Differential Calculus topic (26.9%) when compared to the Pattern, Sequences and Series
topic (18.8%). The Property-Proof dimension was also more evident in Differential
Calculus. In the pre-PM Concise Maths textbook series, the percentage of Use-
Application dimension was relatively high at 19.7% and was much greater than the
corresponding proportion of tasks on the topic of Pattern, Sequences and Series at 0%.
Figure 5.40 compares the topic and era for the Multidimensional Model for the OL
Concise Maths textbook series.
0
5
10
15
20
25
30
35
PSS Pre-PM DC Pre-PM PSS Post-PM
DC Post-PM
Property-Proof
Use-Application
Representation-Metaphor
History-Culture
Concise Maths HL Topic & Era

178
Figure 5.40 Usiskin’s Multidimensional Model for OL Concise Maths comparing topic
and textbook era.
5.6.4 Comparison of Textbook Series
Figure 5.41: Comparison of Usiskin’s dimensions (percentages) in post-PM HL
textbook series
Figure 5.41 compares the incidence of Usiskin’s dimensions in the three HL textbook
series for the post-PM era. The Skill-Algorithm dimension had the greatest incidence in
Concise Maths, the Property-Proof dimension was encountered most often in Active
Maths, the greatest proportion of tasks involving the Use-Application dimension was
found in Concise Maths.
0
5
10
15
20
25
30
35
PSS Pre-PM DC Pre-PM PSS Post-PM
DC Post-PM
Property-Proof
Use-Application
Representation-Metaphor
History-Culture
Concise Maths OL Topic & Era
0
5
10
15
20
25
30
Active Maths
Text & Tests
Concise Maths
Post-PM HL

179
Figure 5.42: Comparison of Usiskin’s dimensions (percentages) in post-PM OL
textbooks
Figure 5.42 gives a comparison of Usiskin’s dimensions in the post-PM OL textbooks.
Active Maths had the greatest proportion of the Skill-Algorithm, Property-Proof and
Representation-Metaphor dimensions. The Concise Maths series had the greatest
percentage of tasks classified in the Use-Application dimension.
Figure 5.43: Comparison of Usiskin’s dimensions (percentages) for pre-PM HL
textbook series
Figure 5.43 above gives a comparison of Usiskin’s dimensions for the pre-PM HL
textbook series. In the pre-PM HL textbook series, Active Maths had the greatest
0
5
10
15
20
25
30
Active Maths
Text & Tests
Concise Maths
Post-PM OL
0
5
10
15
20
25
30
Active Maths
Text & Tests
Concise Maths
Pre-PM HL

180
incidence of the Property-Proof, Use-Application and Representation-Metaphor
dimensions, while Concise Maths had the greatest incidence of the Skill-Algorithm
dimension. Figure 5.44 gives a comparison of Usiskin’s dimensions for the pre-PM OL
textbook series. The greatest percentage of tasks classified as Property-Proof and
Representation-Metaphor were to be found in the Concise Maths textbook series. The
highest proportion of the Skill-Algorithm dimension was to be found in the Text and
Tests pre-PM OL textbook series.
Figure 5.44: Comparison of Usiskin’s dimensions (percentages) for pre-PM OL
textbook series
Each of the post-PM textbook series, regardless of level, recorded a decrease in the
proportion of the Skill-Algorithm dimension when the tasks from the post-Project Maths
series were compared to those from the pre- Project Maths series. None of the tasks in
any of the textbook series examined were found to incorporate the History-Culture
dimension.
In this chapter, I have given the results of my analysis of textbook tasks using the five
frameworks outlined in Chapter 3. In chapter 7, I will discuss these results.
0
5
10
15
20
25
30
Active Maths
Text & Tests
Concise Maths
Pre-PM OL

181
Chapter 6 Task Design
6.1 Introduction
In this chapter, I will provide examples of the types of tasks that I have designed in
response to my findings on current textbook tasks, accompanied by a classification of
these tasks using the Levels of Cognitive Demand framework, Lithner’s reasoning
framework, Usiskin’s mathematical understanding framework and the Project Maths
problem-solving Objectives framework. I will describe a workshop at which a selection of
the tasks designed for this project was independently evaluated with respect to the
Levels of Cognitive Demand framework and the Project Maths problem-solving
Objectives framework. Preparations for the workshop and how the workshop was
conducted are described. The results of the workshop participants’ task classifications
are presented and analysed. Amendments to the workshop tasks are also outlined in
light of feedback from the participants along with rationales for the changes.
Classifications for these amended tasks are also provided.
When contemplating the design of tasks, I considered the results of the classification of
textbook tasks. As can be seen in the previous chapter, my analysis suggests that there is
a need for greater opportunities to engage in creative reasoning, to do mathematics and
work with procedures connected to underlying mathematical meaning. Students need
more opportunities to work with proofs and consider the history and/or culture of
mathematics. My classification of tasks in textbooks currently available showed that
several Project Maths objectives are neglected in the textbook tasks and more tasks
need to encourage students to justify their conclusions, explain their findings and
communicate mathematically. Similarly tasks need to engage students with analysing
information in written form and to ask them to translate this into mathematical form. It
is also important that students are required to select and devise mathematical models
rather than just using very familiar models.
6.2 Designed Tasks
Modifications of existing Textbook Tasks
I began by augmenting existing textbook tasks in order to address neglected areas.
Before re-designing the tasks being attended to, I identified the areas that I wanted to

182
target in each such as increasing the level of cognitive demand, incorporating creative
reasoning, involving the Property-Proof or History-Culture dimensions, or placing a
greater emphasis on explaining findings and justifying conclusions. Often, in order to
scaffold tasks or to introduce the student to a concept, it was necessary to begin with
more straightforward procedural parts before increasing the complexity of the later
parts. The design effort was an iterative process where I repeatedly considered whether
the new tasks actually achieved what was intended and whether further alterations
would lead to greater opportunities to address the deficiencies that were identified in
the textbook tasks.
The example that follows (to which I added four newly designed sub-tasks) is drawn
from the topic of Pattern, Sequences and Series. The original exercise is given and a
description of how it has been adapted is provided. My classifications for the designed
tasks are provided in a table directly after the given task.

183
Example 1 (Workshop Task 2) Question 10 Text and Tests 6 Exercise 4.1 pg. 138
The first terms of the Fibonacci sequence are given below.
0, 1, 1, 2, 3, 5, 8, 13, 21, … .
(i) Describe in words how the sequence is formed.
Hence write out the next four terms in the sequence
I extended this task by adding on four new parts (ii)-(v).
(ii) Choose any four consecutive Fibonacci numbers. Add the first and last terms from
your selection, then divide by 2. Repeat the process again with four other consecutive
Fibonacci numbers, and then another four.
(iii) What do you notice in part (ii)?
(iv) Can you justify your observation mathematically?
(v) In nature, the head of certain flowers and vegetables can also involve
Fibonacci numbers, this involves counting the number of seed heads in the
plant that form a spiralling pattern. Using the internet, find the name of some
such flowers/vegetables and complete the table below.
Flower/Vegetable Name
Number of seed heads in spiral
Task
Label
LCD Reasoning Usiskin’s
Model
PMO
1 (ii) Procedures without Imitative Skill- Use Model

184
Table 36: Classifications of example 1
6.2.1 Original Designed Tasks
I designed eight original tasks, four from the topic of Pattern, Sequences and Series and
four from Differential Calculus. My aim was to provide greater opportunities for
students to engage in tasks requiring the categories ‘doing mathematics’ and
‘procedures with connections to meaning’ (LCD framework). I also wanted to address
less frequently observed categories of Usiskin’s framework such as Property-Proof and
History-Culture, as well as those categories of the PMO framework that appeared to be
neglected such as Explain findings, Justify conclusions and Communicate mathematics in
written form. It should be noted that it would be very difficult for one task to meet all
such criteria, so very often a certain category was targeted when designing a particular
task. To augment the task in section 6.2 and also to design new tasks, I made use of
Swan and Burkhardt’s (2012) principles as described in section 2.6, giving particular
attention to making the tasks of interest to students. This feature of task design has also
been recommended by Chapman (2013). For my tasks I encouraged students to use the
internet, observe patterns in nature and write a line of poetry. These features not only
incorporate authentic contexts but are intended to show students how the mathematics
involved can be of use in the world around them and the tasks are linked to other
subjects that might be of interest. Another concern was to take into account the
different abilities of students that would be attempting the tasks and to ensure that the
material in the tasks would be accessible. I was influenced by Watson and Thompson’s
(2015) advice here to structure the tasks ‘so that the desired key idea is varied and
learners can see this and the effects of such variation’ (pg. 170). I varied the activity
connections to meaning Reasoning Algorithm
1 (iii) Procedures with
connections to meaning
Creative
Reasoning
Property-
Proof
Communicate
Mathematics
Explore Patterns
1 (iv) Doing Mathematics Creative
Reasoning
Property-
Proof
Justify Conclusions
Apply Knowledge
Devise Model
1 (v) No classification No
classification
History-
Culture
No classification

185
across the set of tasks so that it did not become repetitive yet it was not overly difficult
while encouraging the use and application of mathematical thought. This often required
careful scaffolding so that students could be guided towards the appropriate
investigation of concepts, for example beginning a set of tasks with imitative reasoning
before introducing the requirement for creative reasoning. Mason and Johnston-Wilder
(2004, p. 6) recommend to use a ‘mixed economy’ of tasks in order to realise as many
goals as possible. I found this to be true; for example, when designing tasks to address
the lack of the History-Culture dimension, often it was not possible to meet the
deficiencies from the other frameworks, thus it was necessary to include other material
in preceding parts of the task to promote creative reasoning and provide opportunities
to meet a greater variety of Project Maths problem-solving objectives as can be seen in
example 1. However, as can be observed in example 2, it was not always possible to
achieve this and targeting the History-Culture dimension here did not allow for an
extensive inclusion of other framework categories.
Example 2
Line 1
Line 2 Now
Line 3 Here,
Line 4 Always,
Line 5 Powerful,
Line 6 Growing gracefully:
Line 7 Maths nurturing the poetry
(i) Count the number of syllables in each line of the above poem, write them as a
sequence.
(ii) What type of sequence is this?
(iii) Create a suitable line for the poem so as to continue the sequence.
Task
Label
LCD Reasoning Usiskin’s
Model
PMO

186
2 (i) Procedures without
connections to meaning
Imitative
Reasoning
Skill-
Algorithm
Use Model
2(ii) Memorization Imitative
Reasoning
History-
Culture
Explore
Patterns
2 (iii) Procedures without
connections to meaning
Imitative
Reasoning
Skill-
Algorithm
History-
Culture
Use Model
Table 37: Classifications of example 2
Example 3 (Workshop task 1)
A display of cans on a supermarket shelf consists of 15 cans on the bottom, 13 cans in
the next row, and so on in an arithmetic sequence until the top row has 9 cans.
(i) Can you suggest two other arithmetic sequences for arranging the
cans on the shelf?
(ii) Explain how you found the sequence
Task
Label
LCD Reasoning Usiskin’s
Model
PMO
3 (i) Doing
Mathematics
Creative
Reasoning
Property-
Proof
Use-
Application
Apply knowledge
Analyse Information
Explore patterns
Devise Model
3 (ii) Doing
Mathematics
Creative
Reasoning
Property-
Proof
Explain Findings
Communicate
Mathematics
Table 38: Classifications of example 3
Example 4

187
The first and fourth terms of an arithmetic series are a and b respectively. The sum of the
first n terms of this series is denoted by nS . Find 6S in terms of a and b.
Task
Label
Level of Cognitive Demand Reasoning Usiskin’s
Model
PMO
4 Procedures with connections to
meaning
Creative
Reasoning
Skill-
Algorithm
Devise
Model
Table 39: Classifications of example 4
Example 5 (Workshop task 3)
A ball is thrown upwards from ground level and rises to a height of 15 metres. Once it
reaches this height, it falls and strikes the ground and bounces to 60% of its previous
height. It repeats the process, each time bouncing to 60% of the previous height.
(i) Find the total distance travelled by the ball by the time it bounces for the fifth
time. Give your answer to two decimal places.
(ii) Rewrite the question above so that the ball’s height is INCREASING each time
instead of decreasing. What would be the total height after five bounces in
this situation? (Give your answer to two decimal places)
(iii) If the ball from part (i) was caught on the third bounce, how high would the
ball have to rise to on the first bounce in order for the total distance travelled
to be 98 metres after three bounces?
Task LCD Reasoning Usiskin’s PMO

188
Label Model
5 (i) Procedures with connections to
meaning
Imitative
Reasoning
Skill-Algorithm
Use-
Application
Apply Knowledge
Analyse
Information
Select Model
5 (ii) Procedures with connections to
meaning
Imitative
Reasoning
Skill-Algorithm
Use-
Application
Apply Knowledge
Analyse
Information
Select Model
5 (iii) Procedures with connections to
meaning
Creative
Reasoning
Skill-Algorithm
Use-
Application
Apply Knowledge
Analyse
Information
Select Model
Table 40: Classifications of example 5
Example 6
Let f be the function f(x) = 2 2 3x x and g be the function g(x) = 2x-2
(i) Using the same axes and scales, draw the graph of f and the graph of g, for
4 5x .
(ii) You now have a graph of a function and its derivative. Identify which is the
function and which is the derivative, giving at least two reasons to support
your choice.
(iii) Describe the behaviour of the curve y=f(x) when:
g > 0
g < 0
g = 0

189
Task
Label
LCD Reasoning Usiskin’s Model PMO
6 (i) Procedures without
connections to
meaning
Imitative
Reasoning
Representation-
Metaphor
Skill-Algorithm
Use Model
6 (ii) Procedures with
connections to
meaning
Creative
Reasoning
Representation-
Metaphor
Property-Proof
Communicate
Mathematics
Justify
Conclusions
6 (iii) Procedures with
connections to
meaning
Creative
Reasoning
Representation-
Metaphor
Devise Model
Explore
Patterns
Table 41: Classifications of example 6
Example 7 (Workshop task 4)
(i) You are given the graph of f ″(x) above, use your knowledge of derivatives to
draw three possible graphs of f’(x).
(ii) Use your knowledge of derivatives to draw three possible graphs of f(x).
(iii) Justify why you have drawn the graphs in this way.

190
Task
Label
LCD Reasoning Usiskin’s Model PMO
7 (i) Doing
Mathematics
Creative
Reasoning
Representation-
Metaphor
Explore Patterns
Apply Knowledge
Devise Model
7 (ii) Doing
Mathematics
Creative
Reasoning
Representation-
Metaphor
Explore Patterns
Apply Knowledge
Devise Model
7 (iii) Doing
Mathematics
Creative
Reasoning
Property-Proof Justify Conclusions
Communicate
Mathematics
Table 42: Classifications of example 7
Example 8 (Workshop task 5)
The function ( ) is defined for all .
Graphs of '( ) [the curve] and ''( ) [the line] are shown.
f x x R
f x f x
(i) Using the diagram above, find the stationary points of f (x)
(ii) Identify them as maximum or minimum points.
(iii) Justify your answer.

191
Task
Label
LCD Reasoning Usiskin’s Model PMO
8 (i) Doing Mathematics
[Students could find the x co-ordinates
of the stationary points from the
graph of the derivative and where it
cuts the x axis. Students most likely do
not have an algorithm or procedure
for this ]
Creative
Reasoning
Representation-
Metaphor
Apply
Knowledge
Devise
Model
8 (ii) Doing Mathematics
[Students could investigate the sign of
the second derivative here by looking
at the behaviour of its graph.]
Creative
Reasoning
Property-Proof
Representation-
Metaphor
Apply
Knowledge
Devise
Model
8 (iii) Doing Mathematics
[Students must provide a sufficient
justification for what they have found,
based on their discoveries with the
graphs, in the previous two parts.]
Creative
Reasoning
Property-Proof Justify
Conclusions
Table 43: Classifications of example 8
Example 9 (Workshop task 6)
(i) Show that 1
( )f x xx
does not have any points of inflection.
(ii) What can be altered in the given function in order to ensure that the function has
a point or points of inflection?
(iii) Give an example of another function which does not have any points of inflection.
(iv) Examine the following statement: ‘If (𝑥, 𝑓(𝑥)) is a point of inflection, then
𝑓′′(𝑥) = 0 or 𝑓′′(𝑥) does not exist.’

192
Write down the converse of this statement. Is it true? Justify your conclusion using a
relevant example showing that points of inflection either exist or do not exist.
Task
Label
LCD Reasoning Usiskin’s
Model
PMO
9 (i) Procedures without
connections to meaning
Imitative
Reasoning
Skill-
Algorithm
Use Model
9 (ii) Doing Mathematics Creative
Reasoning
Property-
Proof
Apply Knowledge
9 (iii) Doing Mathematics Creative
Reasoning
Property-
Proof
Apply Knowledge
9 (iv) Doing Mathematics Creative
Reasoning
Property-
Proof
Communicate
Mathematics
Justify Conclusions
Table 44: Classifications of example 9
6.3 The Tasks Workshop
It was decided to hold a workshop with Pre-Service Teachers (PSTs) in order to allow
newly designed tasks to be evaluated using the Levels of Cognitive Demand framework
and the Project Maths Objectives framework. This would allow me to gather
independent evidence as to whether the tasks achieved my aims or not. I chose these
two frameworks as I felt that they would be the most beneficial for future teachers’ to
develop a familiarity with.
Participation in the workshop was voluntary and it was made clear from the outset that
the surveys and classifications completed during the course of the workshop would be
kept anonymous. The group that agreed to participate was drawn from second and
third year PSTs at Maynooth University enrolled either on the BSc in Mathematics
Education, or on the BSc in Science Education who have chosen Mathematics as one of
their subjects. In terms of teaching experience, the second year students had observed

193
teachers in the classroom and the third year students had one year’s experience which
consisted of teaching one day per week. The PSTs were invited to attend the workshop
and were sent a copy of a plain language statement, which described the purpose of the
workshop and my project, in advance.
A number of decisions had to be made in advance of the tasks workshop in relation to
which of the designed tasks would be chosen for classification. The tasks that were
designed addressed several concerns such as giving greater attention to the Property-
Proof and History-Culture dimensions of Usiskin’s framework. It is difficult for one task
to meet several criteria so priority was given to selecting tasks which addressed the
Project Maths problem-solving Objectives most infrequently observed in current
textbooks and which exhibited a high level of cognitive demand. There was also a limit
on the time available for the workshop so the tasks could not be overly long. It was
decided to use tasks that would be suitable not only for completion in classrooms but
also for assignment as homework to students and could be classified using the two
frameworks within the time available. The parts that were to be classified were marked
with the term ‘classify’. The PSTs participating in the workshop were presented with six
tasks, consisting of sixteen parts in total, to classify. These can be found in appendix C,
where the tasks are labelled from W1 (i) to W6 (iv).
6.4 Preparation for the Workshop
Several documents had to be prepared for the workshop. A codebook was created to
contain all the essential information required by the participants during the coding
process (see appendix C). The first section provided a list of criteria for classification with
the Levels of Cognitive Demand framework. This was followed by six sample tasks. Each
of these sample tasks was accompanied by an outline of the likely method of solution,
some commentary discussing how the task might be classified and the actual
classification assigned to it by me. Each sample task was selected from the textbook
series that were analysed earlier in this study. In the next section of the codebook, the
same six sample tasks were then analysed, in a similar manner, using the Project Maths
Objectives framework. The final part of the codebook was created to assist coders when

194
attempting to classify the practice tasks and the tasks designed for the workshop. This
section gave an account of the material that students would have been likely to have
been exposed to in school before attempting such tasks. It was important to provide the
coders with this information as it would impact on their decisions in relation to the
possible use of procedures in the Levels of Cognitive Demand framework. In relation to
the Project Maths Objectives framework, it is necessary to be aware of what kind of
mathematical models students have been exposed to when considering whether
students are using, selecting or devising a model when solving a task. The codebook was
the main point of reference for the coders when classifying both the practice and
workshop tasks.
Two coding forms were created so that participants could record their classifications
(see appendix C). This was to not only ensure consistency when collecting the data but
to also assist the coders with choosing the classification in an efficient manner. The
coding forms allowed the coders to see clearly the different options for the two
frameworks and to tick which classifications they felt were applicable to the task under
consideration. The coding forms also made it easier for data analysis as each coder
recorded their classification in a similar manner.
A questionnaire consisting of two parts was also prepared in order to elicit the workshop
participants’ views in relation to the two frameworks and the tasks that were designed
for the workshop. The framework consisted of ten questions; four pertaining to the
frameworks and six examining the pre-service teachers’ experience with the designed
tasks. The first question sought to determine whether participants felt that the LCD
framework was useful to teachers in their work. They were then invited to outline any
difficulties that they might have experienced when using the LCD framework. For the
third question, the PSTs were asked if they felt that it was important to classify tasks
using the Project Maths Objectives framework. Again the participants were invited to
outline any difficulties that they might have encountered when using the PMO
framework. The second half of the questionnaire focused on the designed tasks that the
PSTs classified. The first three questions in this section looked for information on the
tasks and the PSTs’ experience of classifying these tasks using the two frameworks.
Specifically the participants were asked if they felt that the tasks were clearly described

195
and if they found it easy to identify the LCD and PMO of the designed tasks. Finally the
PSTs were asked if they felt that the tasks were suitable for the use in the classroom and
if they would be suitable for assignment as homework. The final question in the
questionnaire invited the participants to add any further comments that they might
have on the tasks.
6.5 The Workshop
The workshop was divided into two parts. The first session lasted for an hour and it was
attended by 19 PSTs. A presentation was given providing an introduction to the project
and it also gave an outline of the two frameworks to be used. The Levels of Cognitive
Demand framework was explained with examples of classification chosen from the topic
of pattern, sequences and series. To ensure consistency in classifying tasks, when
considering the Project Maths Objectives framework, care was taken to differentiate
between ‘explain findings’ and ‘justify conclusions’: the participants were informed that
the ‘justify conclusions’ objective is similar to providing a proof, while the ‘explain
findings’ objective would be used where those solving a task were asked to interpret
their solution. Attention was also given to the ‘apply their knowledge and skills to solve
problems in familiar and unfamiliar contexts’ objective as different interpretations are
possible for the terms ‘problem’ and ‘contexts’. For classification in the workshop,
problems were to be treated as something containing an element of non-routine
material with a requirement for some engagement on the part of the student in order to
solve it and the context could be mathematical rather than a real-life scenario or
application. The participants were also advised of the need to make a clear distinction
between ‘Use’, ‘Select’ and ‘Devise’. It was advised that the objective ‘Use’ should be
interpreted as involving the implementation of a well-known procedure or algorithm.
‘Select’ was described as making a choice from an existing repertoire of models and
techniques known by the student solving the task, in order to determine how best to
approach the exercise. Finally, it was recommended that the objective ‘Devise’ should
be applied if the workshop participants felt that a student solving a task had to
experiment in terms of finding a method of solution and effectively created their own
model when answering the exercise. For the remaining part of the session, candidates
were given the opportunity to practice classifying textbook tasks on pattern, sequences

196
and series using the two frameworks and the group discussed how the classifications
were made.
The second session lasted for ninety minutes and it took place on the same day as the
first session. There was a break of one hour between the two sessions as the PSTs had to
attend a lecture in their timetable. For the second session, 18 participants from the
original 19 were present and they were again given a brief outline of this PhD project
and its study of textbook tasks. The PSTs were reminded of key aspects of the two
frameworks and how classifications should be applied. Examples of classifications were
provided, this time taken from the topic of differential calculus. Participants were given
the opportunity to classify practice textbook tasks from the topic of differential calculus
using the two frameworks. The PSTs were then given time to discuss the classifications
as a group before being given the first half of the questionnaire relating to the
frameworks. Once the questionnaire was completed, participants were given a short
break. After the break, candidates were given some of the tasks I designed as part of this
project (those labelled Workshop Tasks 1-6 in Appendix C) and asked to classify them. As
each participant finished classifying the tasks, the last part of the questionnaire was
administered. An opportunity was given at the end for a discussion in relation to the two
frameworks and the designed tasks.

197
6.6 Results
Individual results for each coder using the LCD framework can be found in appendix C.
Classification Frequency Percent
Higher Level Doing Mathematics 74 25.7
Higher Level Procedures with Connections 157 54.5
Lower Level Procedures without Connections 49 17.0
Lower Level Memorised 8 2.8
Table 45: Classifications for the LCD framework from the Tasks Workshop
Using the Levels of Cognitive Demand framework, the majority of the 18 participants
agreed that 14 of 16 of the designed tasks were of high cognitive demand. However, the
majority only agreed with the intended category classification 4 times. It was intended
that 12 of the tasks would involve doing mathematics while 4 would involve the use of
procedures with connection to meaning. This would have resulted in 75% of the tasks
being classified as doing mathematics and 25% as procedures with connection to
meaning. As can be seen in table 45, 25.7% of all tasks classified by all participants were
classified as doing mathematics, 54.5% as procedures with connection to meaning,
17.8% were classified as procedures without connection to meaning and 2.8% as
memorisation.The LCD of tasks W2 (iii) and W2 (iv) were classified as intended with the
majority classifying W2 (iii) as procedures with connection to meaning and W2 (iv) as
doing mathematics. The majority also classified W3 (i) and W6 (iv) with the classification
intended. Five participants classified W3 (ii) as doing mathematics rather than the
expected procedures with connection to meaning. It is possible that these coders did not
consider there to be any procedure that could be used in its solution. The workshop
participants consistently classified W5 (i), W5 (ii) (and to a lesser extent W6 (iii)) as
having a low level cognitive demand. At second-level, I expected that finding the
stationary points of a function and identifying them as maximum and minimum points
from just the graph would be quite demanding for students. The workshop participants
disagreed with this and mainly labelled the finding of the stationary points as using a
procedure without connection to meaning.

198
Table 46: Analysis of workshop task classifications for the LCD framework
Identifying the maximum and minimum points was largely classified as procedure
without connection to meaning with some regarding it as memorisation. Despite there
not being any procedure identified in the codebook for this, the majority of participants
felt that such a task would be routine or memorised material for students at this level.
With W6 (iii), several participants felt that students would have memorised an example
of a function which does not have any points of inflection. This was not something that
was outlined in the textbooks or regarded as normal practice in the codebook but
participants may have felt that a teacher would ask students to commit this kind of
material to memory.
Label
Original
Classific
ation
Workshop
Classification:
Doing
Mathematics
Workshop
Classification
:
Procedures
with
connection
to meaning
Workshop
Classification
: Procedures
without
connection
to meaning
Workshop
Classification:
Memorisation
Majority
agreed with
original
classification
Majorit
y
agreed
with
Higher
Level
W1 (i) DM 4 (22.2%) 13 (72.2%) 1 (5.6%) 0 No Yes
W1 (ii) DM 3 (16.7%) 15 (83.3%) 0 0 No Yes
W2 (iii) HP 2 (11.1%) 13 (72.2%) 3 (16.7%) 0 Yes Yes
W2 (iv) DM 11 (61.1%) 7 (38.8%) 0 0 Yes Yes
W3 (i) HP 2 (11.1%) 9 (50%) 7 (38.9%) 0 Yes Yes
W3 (ii) HP 5 (27.8%) 8 (44%) 5 (27.8%) 0 No Yes
W3 (iii) HP 15 (83.3%) 3 (16.7%) 0 0 No Yes
W4 (i) DM 2 (11.1%) 14 (77.8%) 2 (11.1%) 0 No Yes
W4 (ii) DM 3 (16.7%) 12 (66.7%) 3 (16.7%) 0 No Yes
W4 (iii) DM 3 (16.7%) 14 (77.8%) 1 (5.6%) 0 No Yes
W5 (i) DM 1 (5.6%) 5 (27.8%) 12 (66.7%) 0 No No
W5 (ii) DM 1 (5.6%) 4 (22.2%) 10 (55.6%) 3 (16.7%) No No
W5 (iii) DM 5 (27.8%) 12 (66.7%) 0 1 (5.6%) No Yes
W6 (ii) DM 3 (16.7%) 12 (66.7%) 3 (16.7%) 0 No Yes
W6 (iii) DM 3 (16.7%) 10 (55.6%) 4 (22.2%) 1 (5.6%) No Yes
W6 (iv) DM 11 (61.1%) 7 (38.8%) 0 0 Yes Yes

199
It was hoped to provide a greater variety of Project Maths Objectives within the
designed tasks than was available in the textbook exercises. Looking at the objectives
individually, the majority of workshop participants agreed that explore patterns and
formulate conjectures was present in tasks W1 (i) and W2 (iii) but did not feel the same
about W4 (i) and W4 (ii). Participants may have felt that it was not necessary to explore
patterns in order to complete this task. Interestingly, the majority of coders felt that
explore patterns and formulate conjectures was also present in W1 (ii), W2 (iv), W3 (i),
W3 (ii), W3 (iii) and W4 (iii) despite this not being planned for when designing the tasks.
One task (W1 (ii)) aimed to address the objective of explain findings and all but one of
the students agreed that this had been achieved. The tasks W2 (iv), W4 (iii), W5 (iii) and
W6 (iv) were designed to include the objective justify conclusions, and the majority of
coders felt that these tasks addressed it successfully.
The inclusion of the objective communicate mathematics was less successful and yielded
more mixed results, 50% felt that it was present in W1 (ii), 44.4% thought it was in W2
(iii), 55.6% felt it was in W4 (iii) and 33.3% used the classification for W6 (iv). It may have
been that the PSTs thought that asking students to give the converse of a statement
does not involve the communicating mathematics objective.

200
Table 47: Analysis of workshop task classifications for the PMO framework W1 (i) – W2
(iv)
The objective apply knowledge and skills to solve problems in familiar/unfamiliar
contexts was judged to be included successfully in all intended tasks except for W2 (iv)
where students were asked to justify their observations mathematically. It is possible
that the PSTs might not have regarded this as a problem; instead viewing it as a yes/no
question. The tasks designed to meet the objective analyse information presented
verbally and translate it in mathematical form were classified by most
coders as hoped with 83.3% for W1 (i), 94.4% for W3 (i), 88.9% for W3 (ii) and 88.9% for W3 (iii)
also.
Project Maths
Objective W1 (i) W1 (ii) W2 (iii) W2 (iv)
Explore
Patterns
18
100% (Intended)
9
50%
16
88.9% (Intended)
9
50%
Explain
Findings
- 17
94.4%
(Intended)
11
61.1%
6
33.3%
Justify
Conclusions
- 5
27.8%
4
22.2%
14
77.8% (Intended)
Communicate
Mathematics
3
16.7%
9
50%
(Intended)
8
44.4% (Intended)
6
33.3%
Apply
Knowledge
12
66.7% (Intended)
3
16.7%
5
27.8%
6
33.3% (Intended)
Analyse
Information
15
83.3%
(Intended)
3
16.7%
5
27.8%
8
44.4%
Devise Model
5
27.8%
(Intended)
- - 10
55.6% (Intended)
Select Model 5
27.8%
- - 2
11.1%

201
Table 48: Analysis of workshop task classifications for the PMO framework W3 (i) – W4
(iii)
Project
Maths
Objective
W3 (i) W3 (ii) W3 (iii) W4 (i) W4 (ii) W4 (iii)
Explore
Patterns
12 66.7%
10 55.6%
11 61.1%
2 11.1% (Intended)
2 11.1% (Intended)
11 61.1%
Explain
Findings
- 1 5.6%
2 11.1%
- - -
Justify
Conclusions
- - - - - 16 88.9% (Intended)
Communicat
e
Mathematics
1 5.6%
6 33.3%
- - - 10 55.6% (Intended)
Apply
Knowledge
12 66.7% (Intended)
12 66.7% (Intended)
18 100% (Intended)
15 83.3% (Intended)
15 83.3% (Intended)
5 27.8%
Analyse
Information
17 94.4% (Intended)
16 88.9% (Intended)
16 88.9% (Intended)
5 27.8%
4 22.2%
2 11.1%
Devise Model 4 22.2%
7 38.9%
13 72.2%
1 5.6% (Intended)
2 11.1%% (Intended)
1 5.6%
Select Model 7 38.9% (Intended)
4 22.2% (Intended)
4 22.2% (Intended)
7 38.9%
7 38.9%
3 16.7%

202
Table 49: Analysis of workshop task classifications for the PMO framework W5 (i) – W6
(iv)
There was less consistency with the three objectives devise, select and use: appropriate
mathematical models, formulae or techniques to process information and to draw
relevant conclusions. To apply these classifications correctly, it is necessary to know
what methods or techniques the students are familiar with and the classification
crucially depends on when in the teaching sequence the tasks are used. Tasks W1 (i), W2
Project Maths
Objective
W5
(i)
W5
(ii)
W5
(iii)
W6
(ii)
W6
(iii)
W6
(iv)
Explore
Patterns
2
11.1%
1
5.6%
- 3
16.7%
2
11.1%
3
16.7%
Explain Findings - 1
5.6%
7
38.9%
2
11.1%
2
11.1%
5
27.8%
Justify Conclusions - 2
11.1%
14
77.8%
(Intended)
3
16.7%
2
11.1%
13
72.2%
(Intended)
Communicate
Mathematics
- 1
5.6%
5
27.8%
5
27.8%
1
5.6%
6
33.3%
(Intended)
Apply Knowledge 10
55.6%
(Intended)
11
61.1%
(Intended)
6
33.3%
14
77.8%
(Intended)
14
77.8%
(Intended)
16
88.9%
Analyse
Information
5
27.8%
3
16.7%
1
5.6%
4
22.2%
4
22.2%
8
44.4%
Devise Model 1
5.6%
(Intended)
1
5.6%
(Intended)
3
16.7%
4
22.2%
5
27.8%
10
55.6%
Select Model 7
38.9%
3
16.7%
4
22.2%
4
22.2%
1
5.6%
1
5.6%

203
(iv), W4 (i), W4 (ii), W5 (i) and W5 (ii) were designed with the objective devise model in
mind. In the classification, 55.6% felt that W2 (iv) achieved this goal. W1 (i) received the
intended classification 27.8% of the time, W4 (i) 5.6%, W4 (ii) 11.1%, W5 (i) and W5 (ii)
5.6% each. As discussed earlier, the participants had different solution methods in mind
for tasks W4 (i), W4 (ii), W5 (i) and W5 (ii) than what was intended when designing the
tasks. Select model was identified more frequently than devise but again the workshop
participants were slow to classify tasks using this objective. Tasks W3 (i), W3 (ii) and W3
(iii) were intended to address this objective with W3 (i) gaining 38.9%, W3 (ii) getting
22.2% and W3 (iii) receiving 22.2%. Overall, it would appear that the participants
considered that the tasks were successfully designed in order to provide a greater
variety of Project Maths objectives. However, in any future design process I would strive
to include more tasks relating to the three objectives of communicate mathematics,
devise model and select model.
In terms of levels of cognitive demand, it would appear that the tasks succeeded in
providing more opportunities for higher-level engagement but students viewed the
tasks as being more procedural than what was intended. Similarly a wider variety of
Project Maths Objectives were addressed than was the case, relatively speaking, for the
existing textbook tasks but some objectives would still require greater representation.
6.7 Questionnaire
All 18 coders felt that the Levels of Cognitive Demand framework would be useful to
teachers in their work. Several reported that it would help avoid teaching in such a way
that would prioritise memorising formulae and practicing procedures. Coder 1 stated
that ‘it could prevent teaching such a way that students do not think about solving
questions and just memorise formulae and methods.’ Many also felt that it would help
to determine how suitable an exercise would be for a group of students and how tasks
could challenge the more able students and expand their mathematical knowledge.
Coder 3 said that ‘it allows them to see how challenging the questions are to students. It
will allow them to see what questions will push the Higher Levelled students and what
questions will most likely trouble the weaker student.’ Two felt that it would help

204
structure the class for a mixed ability group by ensuring that there was an appropriate
mix of tasks that would enable differentiated learning to take place. Coder 14 felt that
teachers ‘can ensure that they are providing their class with all types of questions under
this framework. This would be particularly important in mixed ability classes.’
Overall, none of the participants felt that the Level of Cognitive Demand framework was
difficult to use. However, some qualified this by saying that it was difficult at times to
distinguish between the classifications for higher level cognitive demand. Coder 8
explained that it was ‘just between distinguishing the higher order demands as they
appear quite similar’. Several added that they found the framework straightforward
once they were certain of what kind of material the students had covered before
completing the tasks. Coder 14 stated that ‘it is essential to know what knowledge the
students already have’.
All the coders felt that it was important to classify tasks using the Project Maths syllabus
framework. The main reason being offered was that it ensured that teachers were
covering the prescribed material properly and it would help teachers to avoid serious
omissions in relation to students’ problem-solving skills. Coder 4 felt that it was
important ‘so that students will cover all types of questions in the PMO. If tasks were
not classified perhaps some categories may not be covered.’ Another reason offered
was that it enabled students to receive a more rounded mathematical education by
exposure to several different types of questions and this would help them to be better
prepared for working with mathematics later in life. According to coder 3, ‘It allows the
teacher to implement the Project Maths syllabus to the best level it can be at. It also
allows for a wider scope of questions/activities to be implemented.’
Four expressed the opinion that the Project Maths syllabus framework was more
difficult to apply than the Level of Cognitive Demands framework in general. This was
because there were so many different objectives and it involved making several choices
in comparison to just one with the LCD framework. Two felt that this framework
required more time and this would make it more arduous. Coder 9 pointed out that ‘due
to the extended choice this framework would be more time consuming.’ One coder

205
reported that more teaching experience would be required in order to apply the
framework effectively. Two participants stated that they had difficulty distinguishing
between the devise, select and use objectives. Coder 7 felt that ‘sometimes it was
difficult to decide between devise, select and use.’ This is something that was borne out
in the task classifications.
In relation to the designed tasks¸ all 18 coders indicated that the tasks were clearly
described. Several added that they were clear and concise with the layout of the tasks
being well presented. Two students felt that identifying the level of cognitive demand
required some thought in order to go back to the frame of mind of a Leaving Certificate
student. Coder 5 pointed out that ‘it’s hard to remember that something we think might
be easier, they might find hard.’ Six participants, four that expressed concerns about
the framework initially and an additional two after the process of classification was
complete; felt that identifying the Project Maths Objectives of the designed tasks was
more difficult than determining the Levels of Cognitive Demand. They reported that it
was more challenging to use for classification due to the number of objectives and it
took more thought in order to determine which applied and which did not.
All respondents felt that the tasks were suitable for use in the classroom, particularly at
the end of a topic or later on when revising material. Three participants felt that the
designed tasks would be very beneficial as part of a group problem-solving session.
Twelve pre-service teachers felt that the tasks would be suitable for homework,
especially as a challenge. Coder 3 stated that ‘it will allow students extra time to sit
down and work through the questions and would be a good challenge to them.’ Six
coders felt that the tasks were suitable for use in the classroom but not for homework as
the tasks were quite difficult and could be disheartening for weaker students if they
were attempting them on their own. They felt that such students would benefit from
assistance from a teacher in order to make further progress with the tasks. Coder 19
expressed the view that ‘a teacher’s help would encourage students to go a step beyond
their prior knowledge with the tasks.’

206
6.8 Conclusion
As was seen earlier, the majority of PSTs only agreed with the intended category
classification for the LCD framework 4 times. The results for the tasks classified using the
PMO framework were more consistent in comparison but issues were encountered
particularly in relation to the three categories: Devise, Select or Use mathematical
models, formulae or techniques to process information and to draw relevant conclusions.
It should be acknowledged that the workshop involved a lot of technical detailed work
over a short space of time for the PSTs. This might have resulted in it being difficult to
apply the classifications as intended. It would have been beneficial if they had more time
to work on examples and were able to avail of more opportunities to discuss their
classifications. Another issue is that the PSTs had to work with two different frameworks
at the same time, whereas when my supervisors and I were coding, we usually only
worked with one. Also the PMO framework has 10 categories and this can be very
demanding to apply with limited experience. The classification process for both
frameworks involves knowing what material students have seen before. When working
with tasks from a textbook, this is a straightforward process but the PSTs were given the
workshop tasks in isolation with only a list of topics that the intended students may have
seen previously. It is likely that these factors may have had some impact on the results
that were found.
Looking at the 16 tasks that were classified I felt that W5 (i), W5 (ii) and W6 (iii) would
benefit from some modification.
In relation to W5, this time I would not provide a graph of the derivative but instead
provide the second derivative in an effort to avoid any familiar procedure being applied.
I would also make the graph more difficult to interpret so that the student would have
to make a greater effort in order to determine the derivative. I would also avoid asking
for a determination of the stationary points using the wording ‘the maximum and
minimum points’ as this appears to have become procedural for students.

207
Modified Task 5
The function ( ) is defined for all .
Graphs of ( ) [the cubic] and ''( ) [the line] are shown.
The line intercepts the y-axis at the point (0,6) and also contains the point (1,8)
M5 Find an expr
f x x R
f x f x
ession for f'(x). Determine the stationary points of f(x).
Expected Classification for M5:
Procedures with connections to meaning.
Apply knowledge to solve problems presented in familiar/unfamiliar contexts.
Select appropriate mathematical models, formulae or techniques to process information
and to draw relevant conclusions.
Modified Task 6
M6 (i) Show that 4 ( ) f x x does not have any points of inflection.
M6 (ii) State and draw a sketch of another function which does not have any points of
inflection.
M6 (iii) (a) Next draw a graph of a function with:
One point of inflection
Two points of inflection.

208
M6 (iii) (b) Describe what a point of inflection is using your graphs.
The original function in W6 (i) had no points of inflection because it was not defined at 0.
This modified task M 6 (i) would be more beneficial to the student in terms of preparing
them for the examination of graphs that follows in the subsequent tasks. For M6 (ii) if
the students have memorised a function which does not have any points of inflection,
they will still have to do some mathematics in order to draw a graph of the function.
Similarly they will have to engage with the mathematics in order to produce graphs with
one point of inflection or two points of inflection.
Expected Classification for M6 (ii)
Determining the sketch of the graphs even if the functions have been memorised would
still involve the use of procedures with connections to meaning.
Select appropriate mathematical models, formulae or techniques to process information
and to draw relevant conclusions. People can go about sketching graphs in different
ways. Some might determine the roots first and draw from there. Others might sub in
values to the shape of the graph.
Expected Classification for M6 (iii) (a)
Determining the sketch of the graphs even if the functions have been memorised would
still involve the use of procedures with connections to meaning.
Select appropriate mathematical models, formulae or techniques to process information
and to draw relevant conclusions.
M6 (iii) (b)
Doing Mathematics
Apply knowledge to solve problems in familiar/unfamiliar context.
Communicate mathematics in written form.
6.9 Summary
Following efforts to design tasks that would demand more of students cognitively, offer
more opportunities for creative reasoning, incorporate neglected dimensions of
mathematical understanding and provide more diversity in terms of the Project Maths
problem-solving objectives addressed, I have presented 9 examples consisting of 30

209
tasks. One of these examples was an extension of an existing textbook task, ameliorating
the deficiencies identified using the four frameworks. A workshop was prepared to gain
independent verification from PSTs as to whether 16 of these tasks did indeed provide
greater opportunities for higher level cognitive engagement and meet an increased
number of Project Maths problem-solving objectives. The results from the workshop
indicate that the tasks were successful overall in requiring a high level of cognitive
demand, although the PSTs felt that the tasks were more procedural than what was
intended. Their classifications affirmed that a greater number of Project Maths
Objectives were addressed proportionally in the tasks that I had designed than the
existing textbook tasks that were analysed. I also outlined amendments to the workshop
tasks in light of how the tasks were classified in the workshop, in order to make the tasks
as effective as possible.

210
Chapter 7 Discussion This dissertation examines the nature of mathematical tasks from textbooks that are
being used in Irish second-level classrooms. To facilitate the analysis, four frameworks
were used while a fifth was designed to measure the phenomenon of novelty. Due to
the established role of the textbook as a source of tasks (Project Maths, 2017, O’Keeffe
and O’Donoghue, 2009, Jones, Fujita, Clarke and Lu, 2008, p. 142), the three most
popular textbook series were classified using the frameworks. The results from this
classification informed the design of tasks that might be used in the classroom or
assigned as homework.
It will be recalled from chapter 3 that Cohen et al.’s Instructional Triangle provides the
overarching conceptual framework in which this study of mathematical tasks is situated
Teachers, students and mathematical content are positioned at the three vertices of this
instructional triangle. Herbst and Chazan (2012) have extended this conceptualization
and point to tasks as a means through which students interact with the mathematical
content They further describe the teacher’s role as including supporting students’ work
with tasks (Herbst and Chazan, 2012). My findings offer insights into how teachers could
provide such support – for example, by choosing textbook tasks carefully, searching for
tasks from other sources to supplement these when necessary and possibly augmenting
these tasks and/or designing new tasks to achieve the goals of the Project Maths
classroom. When discussing the results in the following sections, I am concentrating on
the post-Project Maths textbook series as these give some indication of the tasks that
are available for use in post-primary classrooms currently.
7.1 Research Questions
7.1.1 RQ 1 (a) Are These Tasks Fulfilling the Expectations of Project
Maths in Terms of its Problem-Solving Objectives?
The most common Project Maths problem-solving objective encountered in all three
textbook series at both levels involves the use of appropriate mathematical models,
formulae or techniques to process information and to draw relevant conclusions. For
Higher Level, its greatest frequency is in the Concise Maths series and at Ordinary Level,
it is greatest in the Active Maths series. As described in chapter 3, I divided the Project

211
Maths Objective devise, select and use appropriate mathematical models, formulae or
techniques to process information and to draw relevant conclusions into three separate
parts. This was necessary to identify the difference between using and devising
techniques and provide greater detail for the analysis. As seen earlier, the use and
selection of models, formulae or techniques is aligned to algorithmic reasoning while
devising is a key feature of creative reasoning (Lithner, 2008, p.266).
The objective explore patterns and formulate conjectures is also relatively common
across the three series and it is likely that this is influenced by the particular topic of
Pattern, Sequences and Series. It is to be expected given the subject matter, that this
objective should have a strong presence within the chapters analysed. The objectives of
justify conclusions and communicate mathematics in written form, in particular, are
rarely addressed. It would appear that the textbooks have yet to fully embrace the goals
of Project Maths and there is still a tendency for exercises to emphasise the practice of
skills and algorithms rather than asking students to devise new techniques or apply their
knowledge in unfamiliar contexts. This supports Davis’ (2013) view that there is a
misalignment between these textbooks and the Project Maths syllabus. However, my
analysis looks at all of the Project Maths Objectives while Davis’ study focused
exclusively on the area of reasoning-and-proving. In Davis’ study, he found that there
was little opportunity for students to engage in reasoning-and-proving and very little
evidence of tasks requiring the explanation of findings or the justification of conclusions.
This shows the difficulty that Irish teachers have in finding a textbook to effectively
support their teaching of the revised curriculum.
Cosgrove et al. (2012) found that 31.6% of teachers found the availability of teaching
materials (like textbooks) to support the Project Maths curriculum to be a major
challenge, while 45.8% of teachers described it as a challenge (p.54). O’Keeffe and
O’Donoghue (2011) found that all the textbooks included in their study fell short of the
standard needed to support Project Maths effectively, even though some are better
aligned to the syllabus expectations than others. Their work makes use of a modified
version of the TIMSS mathematics curriculum framework known as the TIMSS+
instrument, which is applied to a number of mathematics textbooks or series of

212
textbooks by dividing textbooks into chunks of curricula or strands identified as units
called specially constructed curricula (SCC). Their report presents data from 10
textbooks and 6 SCC. My analysis focusses on two topics (Pattern, Sequences and Series
and Differential Calculus) at senior cycle but it analyses the chapters relating to those
topics in six textbooks using five different frameworks. The findings of my analysis would
support the views expressed by O’Keeffe and O’Donoghue (2011).
There has been some attempt to meet the Project Maths objectives in the textbooks
considered here but my results indicate that more attention needs to be given to the
design of tasks that meet the goals of Project Maths. If not, the more traditional
mathematics classroom where the emphasis is on the development of procedural skills
rather than applying mathematics in real-life contexts or considering properties of
mathematical concepts and how they interconnect might persist if the teacher does not
supplement these tasks (NCCA, 2006, p.7). The Chief Examiner’s Report cautioned that
teachers need to provide students with the opportunity to ‘solve unfamiliar problems
and to develop strategies to deal with questions for which a productive approach is not
immediately apparent’ (SEC, 2016, p.30). This will be a challenge for teachers to
incorporate sufficient tasks to achieve this in their classrooms. It must be recalled that
‘an important feature of Project Maths is the reduction in emphasis on practising routine
or procedural questions and solutions based on illustrative examples, with more
emphasis being given to students engaging in problem-solving approaches and justifying
or explaining their solutions’ (NCCA, 2012b, p.18). The Project Maths curriculum
designers want students to be encouraged to think about their strategies, to explore
possible approaches and evaluate these. This would allow them to build up a body of
knowledge and appropriate skills that they can apply in both familiar and unfamiliar
situations. However my findings suggest that the current textbooks being used in Irish
classrooms do not facilitate this because the tasks do not incorporate sufficient ‘novel’
tasks which in turn lead to a reliance on the use of algorithms and procedures that are
not linked to the mathematical meaning. It will fall to the teacher to find or create
suitable tasks outside of the textbook series in order to make sure that the Project
Maths curriculum is implemented fully.

213
On textbooks and curricular goals more generally Houang and Schmidt (2008) have
cautioned that textbooks can have varying interpretations of curricular intentions. These
findings are similar to Herbel-Eisenmann (2007) who analysed a mathematics textbook
to see if it achieved the ideological goal of the enacted curriculum to move the authority
away from the teacher and the textbook and to promote student reasoning and
justification. It was found in their study that the textbook fell short of this goal. Also Tran
(2016) examined the alignment of a U.S. high school textbook with the Common Core
curriculum and found that there were limitations in terms of reaching the learning
outcomes expected.
Fan and Kaeley (2000) have shown that textbooks can impact on how teachers teach.
They hold the view that it would be challenging to bring about change in teachers’
teaching methods without corresponding reform of the textbooks being used in the
classroom. This is due to the important role that textbooks play in affecting teaching
strategies. It would appear that it will be difficult for the Project Maths curriculum to be
realised effectively until further development takes place in these textbooks in light of
the deficiencies highlighted by the research presented in this thesis.
7.1.2 RQ 1 (b) What Degree of Novelty is Incorporated in the Tasks?
It appears that all the textbook series have a tendency to reinforce material presented in
the exemplary sections: there does not appear to be a great degree of novelty across the
exercises that were analysed. Of all the textbook tasks analysed, 5.7% were classified as
‘novel’, 20.4% as ‘somewhat novel’ and 74% as ‘not novel’. The comparison of Higher
and Ordinary level textbooks suggests that there is a greater proportion of tasks in the
Higher Level textbooks classified as ‘somewhat novel’ when compared to Ordinary Level.
It also appears that fewer tasks at Higher Level are classified as ‘not novel’ when
compared to the Ordinary Level textbooks. At Higher Level, the Active Maths series has
the greatest proportion of both ‘novel’ and ‘not novel’ exercises, the Text and Tests
series has the highest overall number of ‘somewhat novel’ tasks. At Ordinary Level,
Concise Maths has the greatest proportion of tasks in both the ‘novel’ and ‘somewhat
novel’ categories, while Active Maths has the most ‘not novel’ at this level. Overall these

214
findings for novelty would indicate that students are not getting sufficient exposure to
non-routine situations when applying their skills. O’Keeffe and O’Donoghue (2012), in
their review of Project Maths textbooks, classified 71.4% of textbook tasks analysed at
senior cycle as routine and 28.6% as non-routine. It would appear that the results for the
‘not novel’ category are similar to those for the routine classification. These results
appear to support the earlier view outlined in O’Keeffe and O’Donoghue (2009) that
mathematics textbooks in the Irish system promote “retention and practice” (p. 290). If
teachers are to remain dependent on such textbooks as a source of classroom tasks then
it is likely that the much criticized ‘drill and practice’ style of teaching will continue to be
a feature of Irish mathematics classrooms. It is important to avoid the solution process
becoming too routine and the over use of familiar tasks deprives students of
opportunities to explore concepts or develop the skills necessary for solving non-routine
problems. Lithner (p. 273, 2008) reminds us that while it is possible to get far with these
algorithmic reasoning strategies, it leads to a search for algorithms becoming
‘mathematics instead of being a part of it’. The ERC in its report on the results of PISA
2012 calls on teachers to incorporate more novel tasks for higher-achieving students to
solve, in particular to provide students with ‘opportunities to engage with problems in
novel contexts and to explore different solutions to problems (Perkins and Shiel, 2016, p.
12).
It would not be possible or indeed desirable for all tasks to be novel as students would
not get the opportunity to develop necessary procedural skills. In 2001, an expert U.S.
committee reviewed and synthesised relevant research on mathematics education from
pre-kindergarten through grade 8 and published a report named ‘Adding It Up’ on how
teaching, curricula, and teacher education should change to improve mathematics
learning during these critical years. Kilpatrick, Swafford and Findell (2001) in this report
view pitting skill against understanding as a ‘false dichotomy’ and instead see the two as
interwoven and state that procedural fluency is necessary for ‘learning many
mathematical concepts with understanding and using procedures can help to
strengthen and develop that understanding’ (p. 112). However a greater degree of
novelty in the textbooks would be beneficial for promoting greater conceptual
understanding.

215
7.1.3 RQ 1(c): What is the Level of Cognitive Demand of the Tasks Analysed on the
Topics Contained in the Textbook Chapters?
In the textbook chapters analysed, a much greater proportion of exercises were
classified as having a Lower Level of cognitive demand than having a Higher Level of
cognitive demand, with most tasks involving the use of procedures without connection
to meaning. The Concise Maths series has the greatest proportion of such exercises at
Higher Level, this is mirrored by the Text and Tests series at Ordinary Level. There is a
greater share of Higher Level demand exercises to be found in the Higher Level
textbooks when compared with the Ordinary Level textbooks within each respective
textbook series. Of the Higher Level demand exercises, ‘procedures with connection to
meaning’ were far more common than the category of ‘doing mathematics’. When
comparing pre-Project Maths textbook series with post-Project Maths textbook series, a
significant increase in the proportion of Higher Level demand tasks can be observed
between eras. The NCCA (2005) raised concerns about an emphasis on developing
procedural skills in Irish mathematics classrooms and that this was reinforced by the
teaching taking place. It would appear that these textbooks will perpetuate the issue to
some degree, should teachers remain dependent on the textbook as the primary source
of tasks. More recently, when commenting on the implications of the PISA 2016 findings
for teaching and learning in Ireland, Perkins and Shiel (2016) recommended that
teachers could raise students’ cognitive engagement in mathematics by allowing
students to decide on their own procedures when solving problems. Moreover they
suggest that when teachers assign procedural tasks to students, it should be ensured
that students understand the underlying concepts. The textbook tasks analysed in the
study reported here would not offer a wide selection for teachers to choose from as
83.3% of tasks were classified as requiring a low cognitive demand.
The situation is not confined to second level; Charalambous et al. (2010) undertook a
study of the topic of addition of fractions in primary textbooks and found that the
majority of tasks (85%) in two Irish primary school mathematics textbooks required a
low level of cognitive demand. The predominance of textbook tasks requiring a low level
of cognitive demand is similar to the findings of Jones and Tarr (2007) for American
Middle school textbooks (83% LLD for the most recent popular textbook series

216
analysed), Kim (2014) for Korean post primary textbooks (94% LLD) and unlike Bayazit
(2013) (25% LLD) for Turkish elementary school textbooks. My results are similar to that
of Jones and Tarr (2007) and Charalambous et al. (2010) but the Irish textbooks on
average have a higher proportion of tasks requiring a high level of cognitive demand
than Kim (2014). Bayazit (2013) has a substantially higher proportion of HLD tasks than
all other textbooks analysed using the LCD framework contained in this study.
The results of my research in relation to the levels of cognitive demand required for task
completion are disappointing because they suggest that students are not being
sufficiently challenged when completing textbook tasks. It could be argued that teachers
may use these tasks as a starting point and adjust them in such a way that they are more
demanding cognitively. However, it has been found that when teachers are
implementing tasks in the classroom, they are more likely to maintain or reduce the
cognitive demand of a task rather than increase it (Stein, Smith, Henningsen, & Silver,
2009; Charalambous et al., 2010). Similarly Nie et al. (2013) caution that lessons, that
were intended to have a high level cognitive demand, can often be implemented with a
much lower level than originally planned. Their study also points out that teachers are
more likely to follow the textbook when implementing a reformed curriculum than
colleagues following an older more traditional one. This would suggest that Irish
teachers coming to terms with the Project Maths curriculum may be quite dependent on
textbooks and thus would likely struggle to find tasks for students with a high level of
cognitive demand.
7.1.4 RQ 1(d) What Kind of Reasoning do Students Need to Use when Completing
These Tasks?
Another question addressed by the analysis refers to the type of reasoning that students
need to use when completing tasks. The vast majority of the exercises classified in terms
of mathematical reasoning were found to require the use of imitative and algorithmic
reasoning. Out of the three textbook series at Higher Level, Concise Maths has the
greatest proportion of such tasks and the Active Maths series has the greatest
percentage of tasks requiring creative reasoning. At Ordinary level, the Active Maths
series again offers the greatest opportunity to engage in tasks requiring creative

217
reasoning while the Text and Tests series has the least. The ratio of creative reasoning to
imitative reasoning tasks differs between the Higher and Ordinary Level textbooks with a
greater occurrence of opportunities for creative reasoning in the Higher Level textbooks.
These findings, showing the high number of tasks classified as requiring algorithmic
reasoning, would suggest that students are not getting sufficient exposure to tasks that
would help them attain the skills necessary for solving non-routine problems. Such an
emphasis on algorithmic reasoning is also unlikely to encourage the development of
conceptual understanding. Boesen, Lithner and Palm (2010, p. 89) remarked, when
looking at assessment tasks that the dependency they observed on imitative reasoning
‘seems insufficient for enhancing the learning of more mathematically founded
reasoning , for problem-solving and for the attainment of conceptual understanding’.
Moreover, as students move through the material on the syllabus, the number of
algorithms required for solving tasks grows unwieldy and might prove unmanageable.
This view is shared by Bergqvist et al. (2008) who point out that as a student moves
through ‘secondary and perhaps into tertiary mathematics, the mere number of
algorithms may at some stage be insurmountable’ (p. 11). The OECD has called on
teachers to avoid this situation and recommended that they should encourage their
students to ‘think more deeply about what they have learned and make connections
with real-world problems’ (OECD, 2016, p. 38).
The results of my analysis indicate that 89% of the tasks from the three Irish
mathematics textbook series could be solved using imitative reasoning, this suggests
that it is important to design tasks that would promote creative reasoning so as to move
beyond surface considerations and get a better grasp of the concepts involved. Jader et
al. (2015), using the Lithner framework, analysed post-primary mathematics textbooks
from 12 different countries including Ireland. Their results show that an average of 79 %
of tasks analysed in total required imitative reasoning. The Irish tasks came from two
Ordinary Level Active Maths textbooks, and were on the topics of geometry and algebra;
Jader et al. (2015) found that just 4% of these tasks necessitated creative reasoning. Of
the tasks taken from Irish textbooks in their study which were classified as necessitating
imitative reasoning, 10% were found to require memorised reasoning and 86%

218
algorithmic reasoning. The results of my analysis for the same textbook series on the
topics of Differential Calculus and Pattern, Sequences and Series had 11.7% of tasks
classified as requiring creative reasoning, along with 88.3% categorised as algorithmic
reasoning, and no tasks were found to require memorised reasoning. Although the
proportion of CR tasks is still relatively low, these topics appear to offer more
opportunities for engagement with creative reasoning than those studied by Jader et al.
(2015).
My results are similar to Lithner’s (2004) findings on undergraduate exercises (10% CR)
although lower than Bergqvist et al.’s (2008) findings on upper secondary school tasks
(30% CR), which show that mathematically well-founded reasoning is not common.
Sidenvall et al. (2015), echoing the results of Jader et al. (2015), in their analysis of
students’ textbook task-solving in Swedish upper secondary school, found that 80% of all
attempted tasks could be correctly solved using imitative reasoning strategies. The
dominant reasoning type in the Swedish textbook tasks that they analysed is algorithmic
reasoning, where students need to remember a suitable algorithm. The results of my
classification using the reasoning framework are in agreement with those discussed
previously in section 2.5 in relation to Lithner’s framework.
7.1.5 RQ 1 (e) What Kind of Understanding (Using Usiskin’s Dimensions) is Being
Promoted in These Textbook Tasks?
Usiskin’s model of mathematical understanding framework describes the kind of
understanding that students encounter when learning mathematics. As a framework for
this analysis, it is used to consider the understanding that is encountered when
completing textbook tasks. The skill-algorithm dimension dominates the tasks which
were analysed for all of the textbooks. I found that the proof-property dimension was
the least common in tasks from all Ordinary Level textbooks and two of the Higher Level
textbooks. Slightly more importance appears to have been placed on proof in the Higher
Level textbooks than in the Ordinary Level textbooks for the Active Maths and Text and
Tests textbook series although the proportion of the tasks in the proof-property
dimension was still quite low overall at both levels. This is similar to the results of
Stylianides’ (2009) study using American textbooks and Davis’ (2013) findings in the Irish
context. None of the textbooks analysed had any exercises corresponding to the history-

219
culture dimension, which is similar to the findings of O’Keeffe and O’Donoghue’s (2009)
study of Irish junior cycle textbooks which was carried out before the introduction of
Project Maths. Ju, Moon and Song (2016) argue for the importance of including the
history of mathematics in textbooks and lessons. They point out that exposing students
to the history of mathematics, emphasising its role in the development of civilisation,
both humanises and demystifies the discipline. This may serve to motivate students’
learning and improve their attitudes toward the subject. Jankvist (2009) suggests that
teachers use history as a means to establish the connection between the cultural life of
a certain period of time and mathematics, the benefits of this would be to show to
students the rich dynamic culture that accompanies mathematics. Given the results of
the analysis reported in this thesis, it would appear that the textbooks have neglected
this aspect of tasks and teachers, interested in promoting this type of understanding,
will have to look elsewhere to expose students to this aspect of mathematics. The
representation-metaphor category is much more frequent at Ordinary Level when
compared to Higher Level. It would also appear that the textbooks do not give enough
attention to real life applications (through the use-application dimension), preferring the
practising of skills and the use of algorithms.
The predominance of the skill-algorithm dimension indicates that there is a need to
include tasks which involve other kinds of understanding. As mentioned previously,
reasoning and proving appears to be neglected in the current textbooks and requires
more attention if students are to establish proper mathematical foundations. The Chief
Examiner’s Report recommends that students should become more familiar with
describing, explaining, justifying and providing examples. It noted that ‘these are skills
that are worth practising, as they will improve understanding’ (SEC, 2016, p.
30).Kilpatrick et al. (2001) view reasoning and proving as an important aspect of
adaptive reasoning, the capacity to think logically about the relationship between
concepts and situations. They call for students to be able to ‘justify and explain their
ideas in order to make their reasoning clear, hone their reasoning skills and improve
their conceptual understanding’ (p. 129). Swan (2005, p. 21) also calls for students to be
asked to ‘explain, convince and prove’ when engaged in mathematical activity, while
Mason and Johnston-Wilder (2006, p. 76) point out that it is important to establish the
status of assertions in mathematics as to whether they are ‘always true, sometimes true,

220
never true or are they still just conjectures?’. The low proportion of the representation-
metaphor and use-application dimensions indicates that students are not currently
encouraged to consider mathematical concepts in different ways and establish
relationships between these concepts. The Chief Examiner’s Report encourages teachers
to give students opportunities to practise solving problems involving real-life
applications of mathematics. As part of this process, students should be asked ‘to
construct algebraic expressions or equations to model these situations, and/or to draw
diagrams to represent them’ (SEC. 2016, p.30). In a broader context, the OECD’s report
on PISA 2012, recommends that teachers should encourage students to ‘think more
deeply about what they have learned and make connections with real-world problems’
(OECD, 2016, p. 38). Furthermore, real life applications are an important consideration
within the new curriculum (NCCA, 2012a, p.6) and more of such tasks need to be
included, especially given the concerns that were raised in the consultation document,
that predated the introduction of the Project Maths curriculum, published by the NCCA
(2005) that there was ‘a poor application of mathematics in real-world contexts’ in post-
primary mathematics education (p.7). A similar call is made in O’Keeffe and
O’Donoghue (2011) when they identify real life applications as one of the areas in need
of development so as to meet the expectations of the Project Maths syllabus. The final
report on the impact of Project Maths on student learning in the initial pilot schools
found that students ‘enjoy applying mathematics to real-life contexts and find this
beneficial for their learning’ (Jeffes et al., 2013, p.25). O’Keeffe and O’Donoghue (2009)
found that none of the textbooks in their study of Junior Cycle textbooks fostered an
environment of understanding, emphasising instead mathematical skills proficiency. It
would appear that this situation persists in the senior cycle textbooks that were
analysed as part of this study. Overall it is necessary to move away from tasks reliant on
algorithms and familiar procedures and promote tasks that give a more rounded
understanding.
7.1.6 RQ 2 Is There a Difference Between Textbook Series?
The Active Maths series appears to have the greatest proportion of creative reasoning
tasks at both Higher and Ordinary Level. This series also has the greatest proportion of

221
tasks at higher levels of cognitive demand at Ordinary Level. At Higher Level, Active
Maths has the greatest percentage of tasks classified as ‘novel’ and ‘not novel’, while
Text and Tests has the highest number of tasks classified as ‘somewhat novel’. All three
series have a high incidence of the skill-algorithm dimension at both Higher and Ordinary
level in Usiskin’s dimensions of mathematical understanding. Of the remaining
dimensions, the Active Maths series has the greatest incidence of the property-proof
and representation-metaphor dimensions at Higher and Ordinary level. The Concise
Maths series has the greatest amount of tasks corresponding to the use-application
category at both Higher and Ordinary level. The Active Maths series at Higher Level
appears to have the closest alignment to the Project Maths problem-solving curriculum,
having the greatest proportion of tasks for 8 of the 10 objectives. At Ordinary Level, the
picture is much more mixed with Concise Maths having the greatest proportion for 5
Project Maths problem-solving objectives.
Based on these results, the Active Maths series appears to be the better choice of
textbook for Higher Level in terms of the opportunities it offers for creative reasoning
and developing different dimensions of mathematical understanding, and meeting the
expectations of the Project Maths problem-solving syllabus. At Ordinary Level, the
Active Maths series also has more opportunities for creative reasoning and HLD tasks. It
also gives more exposure to the mathematical understanding dimensions with the
exception of use-application, but it does not align with the Project Maths problem-
solving curriculum as well as the Concise Maths textbook. In comparison the Concise
Maths series ranks lowest for level of cognitive demand and creative reasoning in its
textbook tasks at Higher Level, while the same was found for the Text and Tests
textbook series at Ordinary Level. The Ordinary Level Text and Tests textbook has a
greater proportion of exercises classified as ‘not novel’, accompanied by the lowest
incidence of the proof-property and representation-metaphor dimensions. It appears to
be least aligned to the Project Maths problem-solving curriculum as judged by having
the greatest incidence in just two objectives. Based on these findings, use of the Higher
Level Concise Maths textbook and the Ordinary Level Text and Tests textbook would
present the greatest challenges for supporting teaching, promoting learning and
reaching the problem-solving goals. The other textbooks offer tasks that are more

222
helpful but there is room for improvement in all areas. This supports the view of
O’Keeffe and O’Donoghue (2011) that some of the textbooks are ‘better aligned to
Project Maths expectations than others’ (p.21). They also point out that all the
textbooks fall short of the standard required to support the expectations of the Project
Maths syllabus.
The website belonging to the Project Maths Development Team cautions that ‘there is
no single textbook which can suit the learning needs of all students’ (Project Maths,
2017). One of the challenges for teachers, in using textbooks currently, is to determine
the extent to which tasks need to be supplemented by additional material. The Maths in
Practice report noted that ‘teachers still need support in developing and using
appropriate tasks that exploit the connections between topics rather than planning for
individual lessons that focus on isolated areas of mathematics in a linear fashion’ (NCCA,
2014, p.8).
7.1.7 RQ3 Is There a Difference between the Pre-Project Maths and Post-Project
Maths Textbook Series?
My analysis looked at textbook tasks in use both before and after the introduction of the
Project Maths syllabus. For each of the frameworks, there was an improvement noted in
the post-Project Maths textbooks. The proportion of tasks requiring creative reasoning
and a high level of cognitive demand has increased since the introduction of the Project
Maths syllabus. However, the number of tasks in the textbooks dependent on the use of
familiar algorithms is still quite high. There was some increase in the proportion of tasks
classified as ‘novel’ and ‘somewhat novel’, accompanied by a decline in the ‘not novel’
classification for the post-Project Maths textbooks. As might be expected a greater
incidence of tasks addressing the Project Maths Syllabus problem-solving objectives was
recorded in the post-Project Maths textbook with the exception of the two objectives
involving using and devising ‘appropriate mathematical models formulae or techniques
to process information and to draw relevant conclusions’, however the presence of tasks
more closely aligned to the Project Maths Syllabus problem-solving objectives still
remains low overall.

223
With Usiskin’s multidimensional model, an increase was recorded in the three
dimensions of Representation-Metaphor, Property-Proof and Use-Application yet a
much greater incidence would be desirable. Despite modest improvements, it would
appear that students would benefit from greater exposure to more varied tasks. The
Chief Examiner’s Report has recommended that students should become more familiar
with the processes of description, explanation, justification and the provision of
examples. It noted that ‘these are skills that are worth practising, as they will improve
understanding’ (SEC, 2016, p. 30). The NCCA in its report responding to the debate on
the Project Maths curriculum and its introduction called for more emphasis to be given
to students engaging in problem-solving approaches and justifying or explaining their
solutions (NCCA, 2012b, p. 18). Similarly the final report on the impact of Project Maths
in pilot schools (Jeffes et al., 2013) observed that students are building up expertise with
the use of procedures. The report also noted that students are problem-solving and
making mathematical representations but to a lesser extent than the use of procedures.
An absence of engagement with reasoning and proof, communicating mathematically,
or making connections between mathematics topics was also observed. It would appear
that the textbooks do not support this goal adequately and teachers will need to
augment existing tasks to achieve it. The Chief Examiner’s Report has acknowledged that
the syllabus expectations are more ambitious than previously and that they are not
necessarily easy to achieve; ‘there has been a deliberate attempt to increase the
emphasis on higher-order thinking skills. These are skills that students find difficult to
master and teachers may find difficult to instil’ (SEC, 2016, p. 9).
7.1.8 RQ4 Can Textbook Tasks be Designed to Better Meet the Goals of Project Maths?
In chapter 6, I reported on the design of a sample of 17 textbook tasks that could
address the deficiencies identified by the results of my analysis. Of these, 3 were existing
textbook tasks on the topic of Pattern, Sequences and Series that were augmented to
increase the level of cognitive demand, to require more creative reasoning when solving
the tasks and to also give more varied exposure to the different learning dimensions and
Project Maths problem-solving objectives. The other 14 were original tasks that I

224
designed with 6 on the topic of Pattern, Sequences and Series and the remaining 8 on
Differential Calculus.
When the designed tasks were evaluated in the workshop, the participants agreed that
the tasks presented were closely aligned to the Project Maths problem-solving
objectives as intended and on the whole, looking at their classifications, the tasks did
succeed in providing greater cognitive demand for those solving them. Given the results
of my textbook analysis, teachers may have to look elsewhere when considering
resources for the classroom. One option may be to augment existing textbook tasks or
design new ones as I have done in chapter 6. This is something that would be
encouraged by both Remillard, Herbel-Eisenmann and Lloyd (2011) and Davis and Krajcik
(2005) as something that would be beneficial to teachers and their development. Knott,
Olson, Adams and Ely (2013) have also demonstrated that once teachers are supported
appropriately in the context of professional development, teachers can successfully
create their own rich tasks for use in the classroom. This could in turn encourage
teachers to reflect on their teaching practice and bring about changes to their
methodologies in the classroom such as establishing more connections between
mathematical concepts as experienced by Swan (2007). I have demonstrated that tasks
can be both augmented and new ones designed to meet the needs of the reformed
curriculum classroom, informed by the findings of my analysis. This is something that
could be facilitated as part of the Maths in Practice group’s (NCCA, 2014)
recommendation that opportunities for exploration of design-based research as part of
professional development for mathematics teachers should be explored.
From this experience, I learned that no single task can meet every criterion that is
aspired to. For example, while it is possible to create a task that has a high level of
cognitive demand and requires creative reasoning in the required solution method it is
not possible to incorporate every learning dimension or problem-solving objective in
one task. Thus it is important to take heed of Mason and Johnston-Wilder’s (2004, p. 6)
recommendation to use a ‘mixed economy’ of tasks in order to realise as many goals as
possible.
Given the findings by Davis (2013) in relation to reasoning and proving, as well as my
findings from the multidimensional learning framework and the Project Maths problem -
solving objectives framework, I gave attention to designing tasks that required students

225
to explore patterns, form conjectures, explain their observations and attempt to justify
them mathematically. A lot of these were to mirror the actions of a mathematician, as
described by Mason and Johnston-Wilder (2004). I also made use of Swan and
Burkhardt’s (2012) principles, especially to make the tasks of interest to students. This
feature of task design was also recommended by Chapman (2013). I linked the tasks to
using the internet, observations in nature, researching history and writing poetry in
order to incorporate authentic contexts and encourage students to make them feel that
they were useful and linked to other subjects that might be of interest to them. It was
also important to try and vary the activity in the tasks while encouraging as much
mathematical thought as possible. This often required careful scaffolding so that
students could be guided towards the appropriate investigation of concepts. I was
influenced by Watson and Thompson’s advice here to structure the tasks ‘so that the
desired key idea is varied and learners can see this and the effects of such variation’ (pg.
170) . Another concern was to take into account the different abilities of students that
would be attempting the tasks and to ensure that all students could engage with the
material presented.
7.2 Limitations
7.2.1 Textbook Task Analysis
Remillard (1999) places great importance on the textbook when teachers are deciding
how to teach the curriculum. ‘Textbooks offer a curriculum map that organizes
mathematical topics into sections, each including specific concepts or skills. Teachers
map the curriculum when they decide how or whether to use these structures’
(Remillard, 1999, p. 334). However we are also reminded that no two classrooms are
alike; Remillard (2005, p. 239) cautions that the ‘process of using a mathematics
curriculum guide is complex and dynamic and is mediated by teachers’ knowledge,
beliefs, and dispositions suggests that the decision to adopt a single curriculum in a
school or district will not alone result in uniform mathematics instruction’.
Thompson and Senk (2014) explored the treatment of high school geometry in 12
teachers’ classrooms using the same textbook. Their analysis suggests that there are
several different factors that can impact on the material that is actually enacted in the

226
classroom. Teachers make decisions on what material is covered or skipped based on
personal circumstances. It is important to acknowledge that tasks available in a textbook
are just one aspect of what is taking place in terms of teaching and learning; teachers
can adapt and use them in different ways.
Hence, one limitation of the research reported here is that it cannot definitively
comment on what is taking place in Irish mathematics classrooms. My research does not
claim nor imply that textbooks are the only source of tasks that teachers use in the
classroom, however such tasks do give some insight into what is available to teachers
and what is commonly used in the Irish classroom. The Project Maths Development
Team reminds us that most of the time in classrooms tends to be related to textbooks in
some way. ‘Most problems for student’s classwork and homework are taken from them’
(Project Maths, 2017). Even without observation of classrooms, my research
complements the analysis by Jeffes et al. (p.5, 2013) which states that students have ‘a
good mastery of mathematical procedures and, to a slightly lesser extent, problem-
solving and making mathematical representations’. The textbook tasks analysed
certainly support the development of proficiency with mathematical procedures but do
not offer the same opportunity for supporting problem-solving or using different
representations. Students interviewed for the report state they are getting exposure in
the classroom to making connections between mathematics topics, as well as applying
mathematics to real-life situations, something which is not discernible from an analysis
of textbook tasks. This demonstrates a limitation of my study in that it is not possible to
get a full picture of classroom activity based solely on the analysis of textbooks.
Students may be given different tasks by the teacher or exposed to different activities
not covered by the textbooks.
7.2.2 Time Constraints
Two workshops were conducted as part of this thesis. It is possible that more exposure,
for the participants, to the frameworks involved would have proved advantageous. The
availability of time had an impact on the conduct of the workshops. For the validation of
the Novelty framework, (see chapter 4 for a full description) researchers with an interest
in post-primary mathematics education were assembled and such a cohort is only

227
available at certain times of the year due to their busy schedules. In the case of the tasks
workshop, pre-service teachers volunteered time in the middle of their timetable. For
both groups, this meant that there was a limited opportunity to introduce them to the
frameworks involved and provide adequate training for conducting the classifications. It
is likely that both groups would have benefitted from additional time and greater
experience in using the frameworks but this was not possible given the workplace
pressures involved.
7.2.3 Choice of Topics
The topics of pattern, sequences and series and differential calculus were selected for
study. Every task from both the pre-Project Maths and the post-Project Maths eras for
these three textbook series at both Higher and Ordinary Level were analysed. It could be
argued that alternative topics may give different results, however these are the topics
chosen are taught at both levels and involve the use of a number of different skills by
the student. The Project Maths curriculum was introduced incrementally through three
phases with pattern, sequences and series introduced in the first phase and differential
calculus introduced in the last phase. The choice of these two topics is representative of
the material that students and teachers encounter in the Irish mathematics classroom. It
should also be noted that my results are similar to the findings of other studies yet
different to others. My results are similar to Charalambous et al. (2010) and Jones and
Tarr (2007) in relation to the level of cognitive demand. My results are different to Jader
et al. (2015) in relation to the kind of reasoning that students employ when solving
textbook tasks, whereby I found a greater requirement for creative reasoning and no
tasks necessitating memorised reasoning. Also, my results from the novelty framework
on my two chosen topics are similar to O’Keeffe and O’Donoghue’s results on
routine/non-routine problems and my results support their contention that the textbook
tasks fall short of the standard required to realise the expectations of the Project Maths
syllabus. Finally, Davis (2013) looked at the topic of complex numbers and found that
there is a misalignment between the textbook tasks in relation to the opportunities
afforded for reasoning-and-proving and the Project Maths syllabus, something that my
textbook analysis also asserts.

228
Chapter 8 Recommendations
It must be acknowledged from the outset that the task analysis is unable to take into
account how a teacher or student might use the textbook tasks. The recommendations
that follow are being made on the assumption that the tasks will be used at ‘face value’,
in the sense that they are assigned and completed as given in the original textbook.
8.1 Providing More Balance in Sets of Tasks
A key concern arising from my analysis is the lack of balance in the textbook tasks
analysed. Swan and Burkhardt (2012) have suggested principles for task design suitable
for use as assessment. These principles could also be used when designing tasks suitable
for use in the classroom and/or for homework. They suggest that a balanced series of
tasks should meet all the different goals and objectives that the curriculum aspires to.
This is something that the textbook tasks do not currently achieve in relation to the
Project Maths curriculum according to my analysis. It is also recommended that tasks
should be viewed by students as something interesting or having a potential use outside
of the classroom. The lack of Usiskin’s History-Culture dimension and the relatively low
incidence of the Use-Application dimension in my analysis would suggest that the Irish
textbook tasks do not currently achieve this. Swan and Burkhardt also believe that tasks
should be accessible to every student yet simultaneously challenging, thus enabling
students of all different abilities to be able to demonstrate some level of understanding
in relation to the task. Their principles call for reasoning to be rewarded rather than
results, meaning that students should be encouraged to engage in a process of
reasoning and understanding rather than just advance towards a final result. Designers
are also advised to use authentic contexts as well as mathematical contexts,
encouraging students to make connections within mathematics and other subjects. In
the analysis reported here, the dominance of tasks requiring the use of procedures
without connections to meaning and the dependence on algorithms would suggest that
the sets of tasks in each textbook require more balance. Similarly, the results from the
analysis using the Project Maths framework and Usiskin’s multidimensional model point
towards the need for the employment of more authentic contexts in order for students

229
to appreciate the mathematics that can be found in other subjects and the surrounding
world.
Watson and Thompson (2015) also recommend the inclusion of more authentic contexts
for the study of mathematics. In their chapter on design issues related to text-based
tasks, they discuss mathematical authority and empowering students by allowing them
to self-check their work through the processes of making observations, justifying
conjectures or verifying solutions. The results of my analysis for the Project Maths
problem-solving framework, in conjunction with the LCD and Lithner’s reasoning
frameworks suggest that the textbook tasks do not offer students enough opportunities
to engage in such activity. In particular, the tasks analysed appear to be deficient of
processes involving the explanation of findings, the justification of conclusions and the
formulation of conjectures.
Based on the findings of my analysis, the tasks available in the textbooks appear to be
unbalanced as explained on the previous page and the tasks would benefit students
more by giving a broader, more engaging and dynamic experience of mathematics as a
discipline. I would recommend that tasks be designed that incorporate the history of
mathematics as well as other subject areas that would be of interest to students. Real
life applications should relate to the world of students as much as possible in an effort to
be as authentic as possible to their experience. It is also important that all students,
despite individual ability, are able to engage with the tasks presented in the textbooks.
To achieve this, it will be necessary to have a good mixture of tasks, in order to appeal to
the different interests and abilities that may be present in classrooms and facilitate
differentiated learning.
8.2 Making Greater Use of Unfamiliar Contexts and Novel Tasks
Given my findings using the ‘novelty’ framework and the Project Maths problem-solving
objectives framework, more attention needs to be paid to solving problems in unfamiliar
contexts and to avoid the overuse of repetitive well-rehearsed task types. My results
show that the majority of tasks are ‘not novel’ and I observed a greater proportion of
tasks involving the ‘application of knowledge and skills to solve problems’ in familiar
contexts rather than unfamiliar ones. A task can be initially complex and require a

230
process of creative reasoning when considering its solution. However if several similar
such tasks are encountered, then the novelty is diminished and the reasoning employed
moves from being creative towards imitative. If a context is overused, then it is no
longer unfamiliar. I would recommend that teachers currently using the textbooks
analysed in this study, or considering their use, to supplement tasks with a greater
number of unfamiliar contexts in order to achieve the desired variety. Furthermore, it
would be beneficial to students if teachers ensured that a greater proportion of both
‘novel’ and ‘somewhat novel’ tasks were included in classwork and homework.
8.3 Giving More Attention to Reasoning-And-Proving
The area of reasoning-and-proving is worthy of attention, particularly considering the
results of the analysis presented here using the LCD framework, Lithner’s reasoning
framework, the Project Maths objectives and Usiskin’s model of mathematical
understanding. Reasoning-and-proving can be found in the category of ‘doing
mathematics’ in the LCD framework, in creative reasoning for Lithner’s reasoning
framework, in the property-proof dimension for Usiskin’s model and in the explain
findings and justify conclusions for the Project Maths problem-solving objectives. The
incidence of such tasks in the analysis was low. Lithner (2008, p.273) points out that
‘conceptual understanding, creative reasoning, and insights into the central roles of
mathematics in our society are not enhanced by rote learning’. An overreliance on
imitative reasoning leads to students becoming dependent on algorithms and
memorisation and this leads to a consequent inability to solve unfamiliar problems or to
transfer mathematical knowledge to other areas competently and appropriately.
Without being encouraged to use creative reasoning more regularly, for example by
being required to find different methods of solution on their own, students might build
up the incorrect impression that there is only one possible method of solution when
approaching mathematical tasks. This could deprive them of the opportunity to become
more flexible in their approach to solving tasks.
Another result of neglecting creative reasoning opportunities in favour of imitative
reasoning is that students will not gain an appreciation of mathematics and the potential
for its application in different areas. I found that there was a low incidence of tasks
classified in the property-proof dimension of Usiskin’s framework and in general, very

231
few of the tasks classified required the explanation of findings or the justification of
conclusions. These results are also supported by both Jader et al.’s (2015) and Davis’
(2013) analyses. It appears that more tasks are required in order to encourage students
to engage in creative reasoning, explain findings, justify conclusions and communicate
their mathematical thoughts. Jeffes et al. (2013) also highlight this when they call for
tasks that involve students in ‘communicating more effectively in written form; and
justifying and providing evidence for their answers’. In fact, they called for high quality
tasks ‘to engage with the processes promoted by the revised syllabuses, including:
problem-solving; drawing out connections between mathematics topics’ (p.32).
Teachers will have to take care in the classroom, if not doing so already, to encourage
students to verify their solutions, solve tasks using several methods and to explain their
mathematical thinking when completing tasks.
8.4 Increasing the Level of Cognitive Demand in Tasks
Based on my findings, I believe that there is a need for the inclusion of more cognitively
demanding tasks in textbooks in order to stimulate students’ thinking. My findings
suggest that there is a dependency on procedures in the current textbooks, which
provide very little connection to the underlying concepts. This gives cause for concern.
Given the emphasis placed on conceptual understanding in the revised curriculum, it is
important that more tasks which establish a connection to the meaning behind
procedures are provided in textbooks and employed by teachers in the classroom.
Similarly, if students are to be able to problem solve effectively then they need more
exposure to tasks which correspond to the ‘doing mathematics’ category. This category
is not dependent on procedures and encourages complex mathematical thought,
including reasoning activities such as forming and verifying conjectures, searching for
patterns and investigating the parameters of problems.
Henningsen and Stein (1997, p. 525) have cautioned that ‘the nature of tasks can
potentially influence and structure the way students think and can serve to limit or
broaden their views on the subject matter with which they are engaged’. If a student
works predominantly with tasks that have a low level of cognitive demand then several
issues arise. Students without exposure to tasks with a high level of cognitive demand
risk being unable to transfer their mathematical skills to other subject areas and being

232
unable to problem solve. Also, it is likely that they will suffer with confidence about the
subject and only be comfortable with familiar material. Any learning that takes place is
likely to be reliant on memorising operations, that will ultimately be forgotten over time
and students will gain little understanding of the underlying meanings.
Jeffes et al. (2013, p. 32) suggest that ‘students need to be regularly given high quality
tasks that require them to engage with the processes promoted by the revised
syllabuses’. The results of my analysis suggest that the textbooks examined do not
currently promote enough complex and non-algorithmic thinking. This in turn makes
students dependent on a predictable solution process and they are unable to discover
relationships between concepts. Teachers in Irish classrooms should be made aware of
such pitfalls when choosing a textbook to support teaching and learning. A higher
proportion of textbook tasks with a higher level of cognitive demand would encourage
students to explore the nature of mathematical concepts and provide opportunities to
become more confident at analysing problems, identifying potential constraints and
discovering different approaches to their solution. If teachers do not expose students to
tasks requiring more complex thought then difficulties may persist with problem-solving
and students will be deprived of opportunities to broaden their understanding of
mathematics. It would be beneficial to have textbooks with a greater number of tasks
that require a higher level of cognitive engagement. I would recommend that tasks such
as those that I designed in chapter 6 could be included in textbooks or classroom
activities as a means to address this deficit. Very often, existing textbook tasks can be
extended or adjusted in order to raise the level of cognitive demand required. If
teachers could augment existing tasks to increase the level of cognitive demand then
they would be less dependent on using tasks directly from the textbook. Augmenting
tasks could involve requiring students to examine patterns, formulate conjectures,
expound on their observations and justify such observations mathematically.
8.5 Availing of Greater Expertise When Designing Textbook Tasks
From my experience, I would recommend that publishers and authors should give more
attention to the design of textbook tasks in Ireland. This echoes Lubienski’s (2011, p. 47)
concern as to ‘how a teacher can focus on both teaching full time and authoring a

233
textbook, particularly one that needs to be completed within a year’. From my
experience with textbook analysis and the designing of tasks, it is clear that the process
of creating a textbook would benefit from the input of researchers in mathematics
education. Lubienski (2011, p. 47) suggests that ‘both mathematics education scholars
and mathematicians have a greater role to play in at least reviewing books, if not
actually co-authoring them’. Not only would this build in an element of quality
assurance, but it would also assist with the creation of tasks that encourage students to
think mathematically. I would also recommend that there should be some input from
the primary sector. Greater contributions from primary and tertiary practitioners could
ensure that the textbook tasks build on the experience of students garnered before
entering post-primary school and assist with greater preparation for the demands of
third level. Geiger et al. (2014) note that partnerships between teachers and researchers
hold potential for improving teaching and learning practices in mathematics, especially
through the design of tasks for use in the classroom. I believe that this could also apply
to designing tasks for inclusion in mathematics textbooks.
One of the main recommendations in the report by O’Keeffe and O’Donoghue (p.21,
2012) is that an exemplar textbook series for Project Maths be produced by ‘a specially
selected and constituted writing team’ appointed and funded by the Department of
Education and Skills. They suggest that this exemplar textbook series would then be
used as a model for all commercially produced textbooks and any new textbook should
be reviewed by the DoES against this series leading to an approved list of mathematics
textbooks for the Project Maths classroom. Lubienski has noted that the issue of
textbooks in Ireland appears to be politically sensitive. She adds that Project Maths
leaders appear to be unwilling to comment on the suitability of textbooks and appear to
be ‘circumventing textbooks as opposed to leveraging them’ (Lubienski, p.45). I believe
that the current situation of practicing teachers writing textbooks could be extended or
supported by the involvement of people with additional expertise. Valverde et al. (p, 2,
2002) have suggested that textbooks act as ‘mediators between the intentions of the
designers of curriculum policy and the teachers that provide instruction in classrooms’.
Houang and Schmidt (p. 3, 2008) point out that in many countries students may not be
aware of the existence of curriculum guides and teachers may not make regular use of
234
them. Yet, evidence from TIMSS suggests that textbooks were present in almost every
classroom in the countries that participated and were regularly used in instruction. As a
result, while textbooks were often not officially national in character, they were a
common element in most classrooms. This shows the importance of the textbook in
terms of implementing a curriculum. Thus, I think that more engagement with textbook
publishers and authors is required in light of the issues that have been highlighted in my
analysis and elsewhere.
The creation of an expert team to write a textbook series could certainly further the
aims of implementation of the Project Maths curriculum and support teachers in their
efforts to change their practices. It must be acknowledged that the textbooks analysed
here were produced to meet an extremely tight deadline while the new curriculum was
being introduced on a phased basis. Now that Project Maths has had an opportunity to
become more embedded, it is possible to consider how best textbook tasks should be
produced in the future.
8.6 Establishing Professional Development to Support Teachers in
Analysing/Creating Tasks
Swan (2007) has shown that a programme of professional development employing
carefully designed tasks and supported by relevant guidance could enable teachers to
re-examine their beliefs in relation to the teaching and learning of mathematics. Over
time a general shift by participating teachers away from transmission practices and
towards a more student centred model was reported in his study. This was not due to
the tasks alone but the fact that the tasks used allowed for such things as sustained
collaborative work or the use of more challenging examples. Teachers, in this study, also
importantly moved away from emphasising the completion of tasks and instead focused
on ‘comprehending’ tasks by appreciating what opportunities such tasks offered to
students and how they could be beneficial for their learning and building an
appreciation of mathematics (Swan, 2007). Arbaugh and Brown (2005) believed that
classifying exercises in terms of their cognitive demand would enable teachers to
examine their own practice. Stein et al. (2009) prepared a case book for use in
professional development that included a number of exemplary tasks, criteria for
analyzing task properties, and several protocols to facilitate the discussion of tasks

235
among teachers. Further work completed using such an approach (Boston and Smith
2009; Boston 2013) has identified changes in teachers’ choice of task for use in the
classroom after completing professional development in relation to classifying tasks in
terms of their level of cognitive demand. It also found that some teachers maintained
this change after a period of time had elapsed (Boston and Smith 2011).
Given my experience with the workshop to evaluate the designed textbook tasks, I
believe that a programme of professional development whereby teachers were made
familiar with the Levels of Cognitive Demand framework would be useful in Ireland.
Teachers could be exposed to tasks with varying levels of cognitive demand. The
participants at the workshop, detailed in chapter 6, described the potential benefits of
such an exercise in terms of reflection and planning. However, such a programme could
possibly empower teachers to adjust existing tasks or even design tasks in order to offer
students more challenging opportunities. This would have to be supported by exposure
to the principles and frameworks of task design, so that appropriate tasks were
constructed. Over time, this could be extended to the other frameworks used in this
analysis. Such professional development, if successful, could be used to build up a bank
of tasks that could be shared with teachers across the country.
The report of the ‘Maths in Practice’ group (NCCA, 2014) recommended the exploration
of opportunities for design-based research for Irish mathematics teachers. They
suggested a model of professional development where teachers would design and
conduct interventions in the classroom. If teachers were provided with such
opportunities for professional development in the future, I would recommend the
design of tasks as described in chapter 6 as a possibility that could prove beneficial to
teachers.
8.7 Advice for Individual Teachers
Given the results of the textbook analysis reported here, consideration should be given
to what an individual teacher might do in order to support the teaching and learning
taking place in his/her classroom. It would appear that no one textbook studied here
meets all the needs of the students and I am mindful of the fact that to augment or

236
design tasks can take a substantial amount of time. The Project Maths Development
Team has made resources available on its website but these are limited and might not
always address the topic area that the teacher is about to teach. Similarly looking for
resources online might not always yield fruitful results.
My analysis of the three textbook series has found that there are deficiencies in each
individual textbook. I would recommend that teachers build up their own bank of tasks
by choosing the best tasks from a variety of textbooks. In this way, it will be possible to
give the student an array of good quality tasks quickly. This is important to retain the
engagement of students who wish to be challenged or may wish to work ahead
independently. Given that the supply of textbook tasks in any single textbook
necessitating novel creative reasoning and/or requiring a high level of cognitive demand
can be exhausted quickly, it would be wise to combine such tasks from as many
textbooks as possible to ensure rich learning opportunities for students. Attention
should also be given to ensuring that a mixture of tasks is assigned to students so that
several learning dimensions are encountered and the desired problem-solving objectives
are met in the course of solving tasks. It is important that teachers are conscious that
while attaining mastery of procedural skills is beneficial, it must also be accompanied by
tasks that require creative mathematical thinking that encourage students to solve
problems in unfamiliar contexts.
8.8 Advice for Researchers
Five frameworks were used in this thesis. The Levels of Cognitive Demand framework
has been readily used internationally as part of textbook content analysis. Lithner’s
reasoning framework is less common outside of Sweden but has also been used for
textbook analysis. The other three frameworks are unique to my research currently.
Usiskin’s multidimensional model of mathematical understanding was not intended for
analysing textbook tasks but has provided valuable data. Similarly, the Project Maths
problem-solving objectives framework was not intended for such analysis as it was
adapted from Irish syllabus documents. Finally, the ‘novelty’ framework was created
given my experiences with the LCD and Lithner’s reasoning frameworks and a desire to
measure students’ familiarity with tasks. Having gathered considerable experience

237
working with frameworks, I would recommend that researchers engaged in the
classification of tasks build in opportunities for reflection and certainly ensure that they
work with others before finalising classifications. It is important that researchers realise
that they carry ‘baggage’ in the sense that they hold views which might influence their
decisions on classifications. It is important that they reflect deeply on their decisions and
when deciding on classifications, they do so consistently and apply the criteria as
accurately as possible. As a failsafe, I would recommend having at least one other
researcher classify a sample of the tasks independently so that you can compare
classifications and discuss decisions in order to reach consensus on how the framework
is used.
Each of the frameworks gives a different insight into the textbook tasks that were
analysed. Of the five, I believe that the Level of Cognitive Demand framework is the
easiest to use for someone wishing to begin textbook task analysis. Unlike some of the
other frameworks, the categories are mutually exclusive and this would lend itself to
being more straightforward in terms of application. Gaining an understanding of the
categories of ‘doing mathematics’, ‘procedures with connection to meaning’,
‘procedures without connection to meaning’ and ‘memorization’ should not be overly
challenging for someone embarking on this type of research while building up expertise
in distinguishing between the categories would be established over time.
8.9 Future Research
The analysis of tasks looked at the three textbook series that were widely used in Irish
post-primary schools at Higher and Ordinary Level. Another series named Effective
Maths was published in 2014 but it is only available at Higher Level; the series was in use
during the pre-Project Maths era under the name Maths. In 2016, a further series
entitled Power of Maths was launched at Higher and Ordinary Level. This series was not
in use before the introduction of the Project Maths syllabus. It would be interesting to
analyse tasks from these two textbook series using the five frameworks to examine
whether any difference exists between the current analysis and these newer series.

238
Teachers often use past examination questions as a source of tasks. It would be
worthwhile to use the frameworks to establish whether the findings for the assessment
tasks are similar to the textbook tasks. Given the nature of the examination tasks, it
would be necessary for some adaption to be completed in order to use the frameworks
effectively. For instance, the Novelty framework would not have exemplary material or
modelled solutions but instead would look at the amount of repetition of previous
material. The degree of ‘novelty’ would be determined by the occurrence of assessment
tasks and how similar they are to the preceding years. Decisions would also have to be
made as to what constitutes familiar and unfamiliar contexts when considering the
Project Maths problem-solving objectives. As with the textbooks, the examination
papers in use during the pre-Project Maths years could be compared to the post-Project
Maths era.
8.10 Other Work
The use of the five frameworks enables the gathering of very specific details as to the
nature of mathematical tasks and the understanding that students gain from their
completion. Teachers could benefit from exposure to these frameworks as a means to
reflect upon their practice in the classroom. I would prepare workshops that would
introduce them to the classification of tasks using a particular framework and then
follow up by outlining the principles of task design so that they would be empowered to
design tasks for use in the classroom. By making teachers aware of perceived areas of
deficiency and familiarising them with methods to address such shortcomings, teachers
would be able to produce high quality tasks without being dependent on others. I would
also research the effects of these interventions and what kind of impact that they had
on the practice of teachers, as well as examining the nature of the tasks that they would
produce.
In the area of task design, I would like to undertake to extend the work completed on
the sample tasks into the creation of a model textbook chapter. This would allow the
perceived deficiencies identified by the task analysis presented here to be addressed
directly. My aim would be to develop tasks which move away from the current focus on
procedural, well-practised exercises and instead provide more opportunities for creative

239
reasoning and engagement with unfamiliar problems. Such a chapter could be used as
an exemplar for textbook publishers when considering what kind of tasks would be
beneficial in future publications.

240
Bibliography
Ahmed, A. (1987). Better mathematics: A curriculum development study. London: HMSO.
Ainley, J., Pratt, D., & Hansen, A. (2006). Connecting engagement and focus in pedagogic
task design. British Educational Research Journal, 32(1), 23-38.
Alafaleq, M., & Fan, L. (2014). Problem solving heuristics in middle school mathematics
textbooks in Saudi Arabia. In Jones, K., Bokhove, C., Howson, G., & Fan, L (Eds).
Proceedings of the International Conference on Mathematics Textbook Research and
Development (ICMT-2014). (pp. 121-126): University of Southampton.
Anthony, G., & Walshaw, M. (2009). Characteristics of effective teaching of
mathematics: A view from the West. Journal of Mathematics Education, 2(2), 147-164.
Antoine, J. Y., Villaneau, J., & Lefeuvre, A. (2014). Weighted Krippendorff's alpha is a
more reliable metrics for multi-coders ordinal annotations: experimental studies on
emotion, opinion and coreference annotation. In The 14th Conference of the European
Chapter of the Association for Computational Linguistics (EACL 2014).
Arbaugh, F., & Brown, C. A. (2005). Analyzing mathematical tasks: a catalyst for change?
Journal of Mathematics Teacher Education, 8(6), 499-536.
Artstein, R., & Poesio, M. (2008). Inter-coder agreement for computational
linguistics. Computational Linguistics, 34(4), 555-596.
Askew, M., & Canty, L. (2013). Teachers and researchers collaborating to develop
teaching through problem solving in primary mathematics. In C. Margolinas (Ed.), Task
design in mathematics education: Proceedings of ICMI Study 22, (pp. 531–540): Oxford.
Ball, D. L., & Cohen, D. K. (1996). Reform by the book: What is: Or might be: The role of
curriculum materials in teacher learning and instructional reform? Educational
researcher, 25(9), 6-14.
Bayazit, I. (2013). Quality of the Tasks in the New Turkish Elementary Mathematics
Textbooks: the Case of Proportional Reasoning. International Journal of Science and
Mathematics Education, 11 (3), 651-682.
Beaton, A. E., Martin, M. O., Mullis, I. V. (1997). Providing data for educational policy in
an international context: The third international mathematics and science study (TIMSS).
European Journal of Psychological Assessment, 13(1), 49- 58.

241
Ben-Peretz, M. (1990). The teacher-curriculum encounter: freeing teachers from the
tyranny of texts. Albany: State University of New York Press.
Bergqvist, T., Lithner, J., & Sumpter, L. (2008). Upper secondary students' task
reasoning. International journal of mathematical education in science and
technology, 39(1), 1-12.
Berry, J., Johnson, P., Maull, W. & Monaghan J. (1999). Routine questions and
examination performance. In Proceedings of the 23rd Conference of the International
Group for the Psychology of Mathematics Education, ed. O Zaslavsky, 23(2), 105-112.
Israel Institute of Technology
Boesen, J., Lithner, J., & Palm, T. (2010). The relation between types of assessment tasks
and the mathematical reasoning students use. Educational studies in
mathematics, 75(1), 89-105.
Boston, M. D. (2013). Connecting changes in secondary mathematics teachers’
knowledge to their experiences in a professional development workshop. Journal of
Mathematics Teacher Education, 16(1), 7-31.
Boston, M. D., & Smith, M. S. (2009). Transforming secondary mathematics teaching:
Increasing the cognitive demands of instructional tasks used in teachers'
classrooms. Journal for Research in Mathematics Education, 119-156.
Boston, M. D., & Smith, M. S. (2011). A ‘task-centric approach’to professional
development: Enhancing and sustaining mathematics teachers’ ability to implement
cognitively challenging mathematical tasks. ZDM, 43(6-7), 965-977.
Brousseau, G. (2006). Theory of didactical situations in mathematics: Didactique des
mathématiques, 1970–1990 (Vol. 19). Springer Science & Business Media.
Brown, M. W. (2009). The teacher-tool relationship. Mathematics teachers at work:
Connecting curriculum materials and classroom instruction, 17-36.
Byrt, T., Bishop, J., & Carlin, J. B. (1993). Bias, prevalence and kappa. Journal of clinical
epidemiology, 46(5), 423-429.
Carley-Baxter, L.R. (2008). Codebook. In Lavrakas, P.J. (Ed.), Encyclopedia of Survey
Research Methods . Thousand Oaks, CA: Sage Publications, Inc.
Chapman, O. (2013). Investigating teachers’ knowledge for teaching
mathematics. Journal of Mathematics Teacher Education, 16(4), 237-243.

242
Charalambous, C. Y., Delaney, S., Hsu, H. Y., & Mesa, V. (2010). A comparative analysis of
the addition and subtraction of fractions in textbooks from three
countries. Mathematical Thinking and Learning, 12(2), 117-151.
Cicchetti, D. V., & Feinstein, A. R. (1990). High agreement but low kappa: II. Resolving
the paradoxes. Journal of clinical epidemiology, 43(6), 551-558.
Clarke, B., Grevholm, B., & Millman, R. (2009). Tasks in primary mathematics teacher
education. New York: Springer.
Cohen, J. (1960). A coefficient of agreement for nominal scales. Educational and
Psychological Measurement, 20, 37–46.
Cohen, J. (1968). Weighted kappa: Nominal scale agreement with provision for scaled
disagreement of partial credit. Psychological Bulletin, 70, 213–220.
Cohen, D. K., Raudenbush, S. W., & Ball, D. L. (2003). Resources, instruction, and
research. Educational evaluation and policy analysis, 25(2), 119-142.
Coles, A., & Brown, L. (2016). Task design for ways of working: making distinctions in
teaching and learning mathematics. Journal of Mathematics Teacher Education, 19(2-3),
149-168.
Conway, P. & Sloane, F. (2005). International Trends in Post Primary Maths Education:
Perspectives on Learning, Teaching and Assessment, NCCA, Dublin.
Cooke, P., Morris, O.D. & O’Regan, F. (2012). Text and Tests 6, The Celtic Press, Dublin.
Cosgrove, J., Shiel, G., Sofroniou, N., Zastrutzki, S. & Shortt, F. (2005). Education for Life:
The achievements of 15-year-olds in Ireland in the Second Cycle of PISA, Dublin:
Educational Research Centre.
Cosgrove, J., Perkins, R., Shiel, G., Fish, R., & McGuinness, L. (2012). Teaching and
learning in Project Maths: Insights from teachers who participated in PISA 2012, Dublin:
Educational Research Centre.
Davis, E. A., & Krajcik, J. S. (2005). Designing educative curriculum materials to promote
teacher learning. Educational researcher, 34(3), 3-14.
Davis, J. D. (2013). Examining reasoning-and-proving in the treatment of complex
numbers in Irish secondary Mathematics textbooks. Bulletin of the Irish Mathematical
Society, 71, 41-57.
De Araujo, Z., & Singletary, L. M. (2011). Secondary mathematics teachers’ conceptions
of worthwhile tasks. In Proceedings of the 33rd annual meeting of the North American

243
chapter of the international group for the psychology of mathematics education, (pp.
1207-1215).
DeCuir-Gunby, J. T., Marshall, P. L., & McCulloch, A. W. (2011). Developing and using a
codebook for the analysis of interview data: An example from a professional
development research project. Field methods, 23(2), 136-155.
Department of Education and Science and National Council for Curriculum and
Assessment. 2000. Mathematics Syllabus: Higher, Ordinary and Foundation Level.
Dublin: Stationery Office.
Department of Education and Skills (2010). Report of the Project Maths Implementation
Support Group. Dublin: Department of Education and Skills.
Doyle, W. (1983). Academic work. Review of educational research, 53(2), 159-199.
Doyle, W. (1988). Work in mathematics classes: The context of students' thinking during
instruction. Educational Psychologist, 23(2), 167-180.
Dunphy, E. (2009). Do mathematics textbooks or workbooks enhance the teaching of
mathematics in early childhood? : Views of teachers of four and-five-year old children in
primary schools in Ireland. In D. Corcoran, T. Dooley, S. Close, R. Ward (Eds.),
Proceedings of Third National Conference on Research in Mathematics Education, 114-
122, Dublin: St. Patrick’s College.
Edwards, A. (2011) Using example generation to explore undergraduates’ conceptions of
real sequences: a phenomenographic study. Ph.D. Thesis.
EGFSN (2008). Statement on Raising National Mathematical Achievement
Retrieved May 19, 2017, from
http://www.skillsireland.ie/media/egfsn081215_raising_mathematical_achievement.pdf
Ellis, J., Hanson, K., Nuñez, G., & Rasmussen, C. (2015). Beyond plug and chug: An
analysis of calculus I homework. International Journal of Research in Undergraduate
Mathematics Education, 1(2), 268-287.
Elwood, J. & Carlisle, K. (2003). Examining gender: Gender and achievement in the Junior
and Leaving Certificate Examinations 2000/2001. Dublin: National Council for Curriculum
and Assessment.
Erlandson, D. A., Harris, E. L., Skipper, B. L., & Allen, S. D. (1993). Doing naturalistic
inquiry: a guide to methods. Newbury Park, CA: Sage Publications, Inc.

244
Even, R., & Olsher, S. (2014). Teachers as participants in textbook development: the
integrated mathematics wiki-book project. In Mathematics curriculum in school
education (pp. 333-350). Springer Netherlands.
Fan, L. (2011). Textbook research as scientific research: Towards a common ground for
research on mathematics textbooks. Paper presented at the 2011 International
Conference on School Mathematics Textbooks, Shanghai.
Fan, L. (2013). Textbook research as scientific research: towards a common ground on
issues and methods of research on mathematics textbooks. ZDM, 45(5), 765-777.
Fan, L., Jones, K., Wang, J., Xu, B. (Eds.)(2013). Textbook research in mathematics
education [special issue] ZDM, 45(5), 633-777.
Fan, L., & Kaeley, G. S. (2000). The influence of textbooks on teaching strategies: An
empirical study. Mid-Western Educational Researcher, 13(4), 2-9.
Fan, L., Zhu, Y., & Miao, Z. (2013). Textbook research in mathematics education:
development status and directions. International Journal of Science and Mathematics
Education, 45(5), 633-646.
Feinstein, A. R., & Cicchetti, D. V. (1990). High agreement but low kappa: I. The problems
of two paradoxes. Journal of clinical epidemiology, 43(6), 543-549.
Feng, G. C. (2013). Factors affecting intercoder reliability: A Monte Carlo
experiment. Quality & Quantity, 1-24.
Fleiss, J. L. (1971). Measuring nominal scale agreement among many raters.
Psychological Bulletin, 76, 378–382.
Forfás (2009). Expert Report on Future Skills Needs Statement of Activity 2008
Retrieved May 19, 2017, from
http://www.skillsireland.ie/media/egfsn090616_statement_on_activity.pdf
Foster, C. (2015). The Convergent–Divergent Model: an opportunity for teacher–learner
development through principled task design. Educational Designer, 2(8), 1-25.
Gehrke, N. J., Knapp, M. S., & Sirotnik, K. A. (1992). In search of the school
curriculum. Review of research in education, 18, 51-110.
Geiger, V., Goos, M., Dole, S., Forgasz, H., & Bennison, A. (2014). Devising principles of
design for numeracy tasks. In Curriculum in focus: Research-guided practice: Proceedings
of the 37th annual conference of the Mathematics Education Research Group of
Australasia (pp. 239-246).

245
Gisev, N., Bell, J. S., & Chen, T. F. (2013). Interrater agreement and interrater reliability:
key concepts, approaches, and applications. Research in Social and Administrative
Pharmacy, 9(3), 330-338.
Givvin, K. B., Hiebert, J., Jacobs, J. K., Hollingsworth, H., & Gallimore, R. (2005). Are there
national patterns of teaching? Evidence from the TIMSS 1999 video study. Comparative
Education Review, 49(3), 311-343.
Gueudet, G., & Trouche, L. (2009). Towards new documentation systems for
mathematics teachers? Educational Studies in Mathematics, 71(3), 199-218.
Gueudet, G., Pepin, B., & Trouche, L. (2012). From text to ‘lived resources’: curriculum
material and mathematics teacher development. New York: Springer.
Guven, B., Aydin-Guc, F., & Ozmen, Z. M. (2016). Problem types used in math lessons:
the relationship between student achievement and teacher preferences. International
Journal of Mathematical Education in Science and Technology, 1-14.
Gwet, K. L. (2008). Computing inter‐rater reliability and its variance in the presence of
high agreement. British Journal of Mathematical and Statistical Psychology, 61(1), 29-48.
Gwet, K. L. (2011). On the Krippendorff’s Alpha Coefficient Retrived on May 16, 2017
from http://www.agreestat.com/research_papers/onkrippendorffalpha_old.pdf
Haggarty, L., & Pepin, B. (2002). An investigation of mathematics textbooks and their use
in English, French and German classrooms: Who gets an opportunity to learn
what?. British Educational Research Journal, 28(4), 567-590.
Hallgren, K. A. (2012). Computing inter-rater reliability for observational data: an
overview and tutorial. Tutorials in quantitative methods for psychology,8(1), 23-34.
Hamilton, E., Lesh, R., Lester, F. R. A. N. K., & Brilleslyper, M. (2008). Model-eliciting
activities (MEAs) as a bridge between engineering education research and mathematics
education research. Advances in Engineering Education, 1(2), 1-25.
Harbison L. (2009). The use of Mathematics Textbooks to promote understanding in the
lower primary years. In D. Corcoran, T. Dooley, S. Close, R. Ward (Eds.), Proceedings of
Third National Conference on Research in Mathematics Education, 123-132: St. Patrick’s
College, Dublin.
Hayes, A. F., & Krippendorff, K. (2007). Answering the call for a standard reliability
measure for coding data. Communication methods and measures, 1(1), 77-89.

246
Henningsen M. and Stein M. (1997). Mathematical Tasks and Student Cognition:
Classroom-Based Factors That Support and Inhibit High-Level Mathematical Thinking and
Reasoning, Journal for Research in Mathematics Education, 28 (5), 524-549.
Herbel-Eisenmann, B. A. (2007). From intended curriculum to written curriculum:
Examining the" voice" of a mathematics textbook. Journal for Research in Mathematics
Education, 344-369.
Herbst, P. (2008). The teacher and the task. In Proceedings of the 32nd Conference of the
International Group for the Psychology of Mathematics Education (Vol. 1, pp. 125-131).
Herbst, P., & Chazan, D. (2012). On the instructional triangle and sources of justification
for actions in mathematics teaching. ZDM, 44(5), 601-612.
Hiebert, J., Gallimore, R., Garnier, H., Bogard Givvin, K., Hollingsworth, H., Jacobs, J.,
Chui, A.M.Y., Wearne, D., Smith, M., Kersting, N., Manaster, A., Tseng, E., Etterbeek, W.,
Manaster, C., Gonzales, P. & Stigler, J (2003). Teaching mathematics in seven countries:
Results from the TIMSS 1999 Video Study, Washington, DC: National Centre for
Education Statistics.
Hiebert, J., & Wearne, D. (1993). Instructional tasks, classroom discourse, and students’
learning in second-grade arithmetic. American educational research journal, 30(2), 393-
425.
Hodge, L. L., Visnovska, J., Zhao, Q., & Cobb, P. (2007). What does it mean for an
instructional task to be effective? In Proceedings of the 30th annual meeting of the
MERGA (Vol. 1, pp. 392-401).
Houang, R. T. and Schmidt, W. H. (2008). TIMSS international curriculum analysis and
measuring educational opportunities. Paper presented at the 3rd IEA International
Research Conference. Retrieved February 8th, 2014 from
http://www.iea.nl/fileadmin/user_upload/IRC/IRC_2008/Papers/IRC2008_Houang_Sch
midt.pdf
Hourigan, M., & O’Donoghue, J. (2007). Mathematical under-preparedness: the
influence of the pre-tertiary mathematics experience on students’ ability to make a
successful transition to tertiary level mathematics courses in Ireland. International
Journal of Mathematical Education in Science and Technology, 38(4), 461-476.
Howson, G. (1995). Mathematics Textbooks: A Comprehensive Study of Grade 8 Texts
Vancouver: Pacific Educational Press.
247
Hripcsak, G., & Heitjan, D. F. (2002). Measuring agreement in medical informatics
reliability studies. Journal of biomedical informatics, 35(2), 99-110.
Humphrey, G. (2003). New concise Project Maths 3 for leaving cert ordinary level Dublin:
Gill and Macmillan Press.
Humphrey, G. (2003). New concise Project Maths 4 for leaving cert higher level part one
Dublin: Gill and Macmillan Press.
Humphrey, G. (2004). New concise Project Maths 4 for leaving cert higher level part two
Dublin: Gill and Macmillan Press.
Humphrey, G., Guildea, B., Reeves, G. & Boylan, L. (2012). New concise Project Maths 4
for leaving cert higher level Dublin: Gill and Macmillan Press.
Humphrey, G., Guildea, B., Reeves, G. & Boylan, L. (2012). New concise Project Maths 5
for leaving cert higher level Dublin: Gill and Macmillan Press.
Huntley, M. A., & Terrell, M. S. (2014). One-step and multi-step linear equations: a
content analysis of five textbook series. ZDM, 46(5), 751-766.
Irish Mathematics Teachers’ Association (IMTA) (2013). Project Maths and the Irish
Maths Teachers Association Retrieved 19th May 2017 from http://www.imta.ie/wp-
content/uploads/2016/02/PM-IMTA-doc.pdf
Jäder, J., Lithner, J., & Sidenvall, J. (2015). A cross-national textbook analysis with a focus
on mathematical reasoning–The opportunities to learn. Unpublished manuscript.
Jankvist, U. T. (2009). A categorization of the “whys” and “hows” of using history in
mathematics education. Educational Studies in Mathematics, 71(3), 235-261.
Janson, H., & Olsson, U. (2001). A measure of agreement for interval or nominal
multivariate observations. Educational and Psychological Measurement, 61(2), 277-289.
Jeffes, J., Jones, E., Cunningham, R., Dawson, A., Cooper, L., Straw, S., Sturman, L. &
O’Kane, M. (2012). Research into the impact of Project Maths on student achievement,
learning and motivation: first interim report. Slough: National Foundation for Education
Research.
Jeffes, J., Jones, E., Wilson, M., Lamont, E., Straw, S., Wheater, R. & Dawson, A. (2013).
Research into the impact of Project Maths on student achievement, learning and
motivation: final report. Slough: National Foundation for Educational Research.
Johansson, M. (2006). Textbooks as instruments. Three teachers’ way to organize their
mathematics lessons. Nordic Studies in Mathematics Education, 11(3), 5–30.

248
Johnson, R., Severance, S., Penuel, W. R., & Leary, H. (2016). Teachers, tasks, and
tensions: lessons from a research–practice partnership. Journal of Mathematics Teacher
Education, 19(2-3), 169-185.
Jones, D. L., & Tarr, J. E. (2007). An examination of the levels of cognitive demand
required by probability tasks in middle grades mathematics textbooks. Statistics
Education Research Journal, 6(2), 4-27.
Jones K., Fujita T., Clarke N. & Lu Y. (2008). BSRLM Geometry working group: proof and
proving in current classroom materials. In Joubert, M. (Ed.) Proceedings of the British
Society for Research into Learning Mathematics 28(3), 142-146.
Jones, K., & Fujita, T. (2013). Interpretations of National Curricula: the case of geometry
in textbooks from England and Japan. ZDM, 45(5), 671-683.
Jones, K., & Pepin, B. (2016). Research on mathematics teachers as partners in task
design. Journal of Mathematics Teacher Education, 19(2-3), 105-121.
Jonsson, B., Kulaksiz, Y. C., & Lithner, J. (2016). Creative and algorithmic mathematical
reasoning: effects of transfer-appropriate processing and effortful struggle. International
Journal of Mathematical Education in Science and Technology, 1-20.
Jonsson, B., Norqvist, M., Liljekvist, Y., & Lithner, J. (2014). Learning mathematics
through algorithmic and creative reasoning. The Journal of Mathematical Behavior, 36,
20-32.
Ju, M. K., Moon, J. E., & Song, R. J. (2016). History of Mathematics in Korean
Mathematics Textbooks: Implication for Using Ethnomathematics in Culturally Diverse
School. International Journal of Science and Mathematics Education, 14(7), 1321-1338.
Kapur, M. (2008). Productive failure. Cognition and instruction, 26(3), 379-424.
Kapur, M. (2011). A further study of productive failure in mathematical problem solving:
Unpacking the design components. Instructional Science, 39(4), 561-579.
Keating, M., Mulvany, D. & O’Loughlin, J. (2012). Active Maths 3: Book 1: Leaving
certificate ordinary level, Dublin: Folens.
Keating, M., Mulvany, D. & O’Loughlin, J. (2012). Active Maths 4: Book 1: Leaving
certificate higher level, Dublin: Folens.
Kilpatrick, J., Swafford, J., & Findell, B. (Eds.). (2001). Adding it up: Helping children learn
mathematics. Washington, DC: National Academies Press.

249
Kim, G. (2014). Textbook analysis: examining how Korean secondary mathematics
textbooks support students’ mathematical thinking. In Jones, K., Bokhove, C., Howson,
G., & Fan, L (Eds). Proceedings of the International Conference on Mathematics Textbook
Research and Development (ICMT-2014). (pp. 283-286): University of Southampton.
Knott, L., Olson, J., Adams, A., & Ely, R. (2013). Task design: Supporting teachers to
independently create rich tasks. Task design in mathematics education, 599-608.
Krippendorff, K. (1980). Content Analysis: An Introduction to Its Methodology. Newbury
Park, CA: Sage.
Krippendorff, K. (2004). Reliability in content analysis. Human Communication
Research, 30(3), 411-433.
Krippendorff, K. (2011). Computing Krippendorff's Alpha-Reliability. Retrieved on May
16, 2017 from http://repository.upenn.edu/asc_papers/43
Landis, J. R., & Koch, G. G. (1977). The measurement of observer agreement for
categorical data. Biometrics, 159-174.
Lavrakas, P. J. (2008). Encyclopedia of Survey Research Methods: AM (Vol. 1). Sage.
Lepik, M. (2015). Analyzing the use of textbook in mathematics education: the case of
Estonia. Acta Paedagogica Vilnensia, 35(35), 90-102.
Lin, C. S., & Jeng, W. (2015). Using Content Analysis in LIS Research: Experiences with
Coding Schemes Construction and Reliability Measures. Qualitative & Quantitative
Methods in Libraries, 4, 87-95.
Lithner, J. (2004). Mathematical reasoning in calculus textbook exercises. The Journal of
Mathematical Behavior, 23(4), 405-427.
Lithner, J. (2008). A research framework for creative and imitative reasoning,
Educational Studies in Mathematics, 67(3), 255-276.
Lombard, M., Snyder‐Duch, J., & Bracken, C. C. (2002). Content analysis in mass
communication: Assessment and reporting of intercoder reliability. Human
communication research, 28(4), 587-604.
Lubienski, S. (2011). Mathematics Education and Reform in Ireland: An Outsider's
Analysis of Project Maths, Bulletin of the Irish Mathematical Society, 67, 27-55.
Lyons, M., Lynch, K., Close, S., Boland, S. & Sheerin E. (2003). Inside Classrooms: a study
of teaching and learning in Irish second-level schools, Dublin: IPA.

250
Mailizar, M., & Fan, L. (2014). Assessing a new Indonesian secondary mathematics
textbook: how does it promote authentic learning? In Jones, K., Bokhove, C., Howson,
G., & Fan, L (Eds). Proceedings of the International Conference on Mathematics Textbook
Research and Development (ICMT-2014). (pp. 319-326): University of Southampton.
Mason, J., & Johnston-Wilder, S. (2006). Designing and using mathematical tasks. St.
Albans: Tarquin Publications.
Marx, R. W., & Walsh, J. (1988). Learning from academic tasks. The Elementary School
Journal, 207-219.
Miles, M. B., & Huberman, A. M. (1994). Qualitative data analysis: An expanded
sourcebook. Beverly Hills: Sage Publications.
Moffett, P. (2009). Reform via textbooks: Lessons from a cross-national collaboration. In
D. Corcoran, T. Dooley, S. Close, R. Ward (Eds.), Proceedings of Third National
Conference on Research in Mathematics Education, 262-272, Dublin: St. Patrick’s
College.
Morris, O.D. (2003). Text and Tests 4, Dublin: The Celtic Press.
Morris, O.D. (2004). Text and Tests 3, Dublin: The Celtic Press.
Morris, O.D. (2004). Text and Tests 5, Dublin: The Celtic Press.
Morris, O.D., & Cooke, P. (2013). Text and Tests 7, Dublin: The Celtic Press.
Morris, O.D., Cooke, P. & Behan, P. (2012). Text and Tests 3, Dublin: The Celtic Press.
Mosmery, P., & Barzegar, R. (2015). The effects of using peer, self and teacher-
assessment on Iranian EFL learners' writing ability at three levels of task
complexity. International Journal of Research Studies in Language Learning, 4(4), 15-27.
Murphy, O. (2001). Discovering Maths 3, Dublin: Folens Publishers.
Murphy, O. (2002). Discovering Maths 4, Dublin: Folens Publishers.
The National Council for Curriculum and Assessment (NCCA) (2005). Review of
Mathematics in Post-Primary Education a discussion paper Retrieved October 16, 2011,
from http://www.ncca.ie/uploadedfiles/MathsReview/MathsDiscusPaperEng.pdf
NCCA (2006). Review of Mathematics in Post-Primary Education, Report on the
Consultation
Retrieved October 16, 2012, from
http://www.ncca.ie/uploadedfiles/mathsreview/Maths_Consult_Report.pdf
NCCA (2012). Leaving Certificate Mathematics Syllabus Retrieved October 16, 2012 from

251
http://www.ncca.ie/en/Curriculum_and_Assessment/Post-
Primary_Education/Project_Maths/Syllabuses_and_Assessment/Leaving_Cert_Maths_sy
llabus_for_examination_in_2013.pdf
NCCA (2012a). Project Maths: Reviewing the project in the initial group of 24 schools –
report on school visits Retrieved November 18, 2012 from
http://www.ncca.ie/en/Curriculum_and_Assessment/Post-
Primary_Education/Project_Maths/Resources/Experiences_of_teachers.pdf
NCCA (2012b). Project Maths Responding to current debate Retrieved May 19, 2017
from http://www.ncca.ie/en/Publications/Other_Publications/Project-Maths-
Responding-to-Current-Debate.pdf
NCCA (2014). Maths in Practice. Report and Recommendations Retrieved June 21, 2016
from http://ncca.ie/en/Curriculum_and_Assessment/Post-
Primary_Education/Project_Maths/Information/Reports/Maths-in-Practice-Report-.pdf
Neuendorf, K. A. (2002). The content analysis guidebook. Thousand Oaks, CA: Sage.
Nie, B., Freedman, T., Hwang, S., Wang, N., Moyer, J. C., & Cai, J. (2013). An investigation
of teachers’ intentions and reflections about using Standards-based and traditional
textbooks in the classroom. ZDM, 45(5), 699-711.
OECD PISA (2007). PISA 2006: Science Competencies for Tomorrows World Executive
Summary Retrieved October 16, 2012, from
http://www.oecd.org/pisa/pisaproducts/39725224.pdf
OECD PISA (2010). PISA 2009: What Students Know and Can Do Executive Summary
Retrieved May 19, 2017, from http://www.oecd.org/pisa/pisaproducts/46619703.pdf
OECD (2016). Ten Questions for Mathematics Teachers ... and how PISA can help answer
them, PISA, OECD Publishing, Paris.
O'Keeffe, L., (2011). An Investigation into the Nature of Mathematics Textbooks at Junior
Cycle and their Role in Mathematics Education, Unpublished Dissertation, University of
Limerick.
O’Keeffe, L., & O’Donoghue, J. (2009). Assessing the effect of mathematics textbook
content structure on student comprehension and motivation. In D. Corcoran, T. Dooley,
S. Close, R. Ward (Eds.), Proceedings of Third National Conference on Research in
Mathematics Education, 284-295, Dublin: St. Patrick’s College.

252
O’Keefe, L., & O’Donoghue, J. (2011). The use of evidence based research on
mathematics textbooks to increase student conceptual understanding. International
Journal for Cross-Disciplinary Subjects in Education, 2(1), 304-311.
O’Keeffe, L., & O’Donoghue, J. (2012). A Review of School Textbooks for Project Maths.
National Centre for Excellence in Mathematics and Science Teaching and Learning (NCE-
MSTL), Limerick.
O’Sullivan, B., Breen, S., & O’Shea, A. (2012). A consideration of familiarity in Irish
mathematics examinations. In Smith, C. (Ed.) Proceedings of the British Society for
Research into Learning Mathematics 32(2): 70-75.
O’Sullivan, B., Breen, S., & O’Shea, A. (2013). We never did this: A framework for
measuring novelty of tasks in Mathematics textbooks In T. Dooley, S. Nic Mhuirí, M.
O’Reilly, R. Ward (Eds.), Proceedings of Fifth National Conference on Research in
Mathematics Education, 284-295, Dublin: St. Patrick’s College.
O’Sullivan, B. (2014). Change comes slowly: Using textbook tasks to measure curriculum
implementation in Ireland. In Jones, K., Bokhove, C., Howson, G., & Fan, L (Eds).
Proceedings of the International Conference on Mathematics Textbook Research and
Development (ICMT-2014). (pp 371-376): University of Southampton.
Pepin, B., Gueudet, G., & Trouche, L. (2013). Re-sourcing teachers’ work and
interactions: a collective perspective on resources, their use and
transformation. ZDM, 45(7), 929-943.
Pepin, B., Xu, B., Trouche, L., & Wang, C. (2016). Developing a deeper understanding of
mathematics teaching expertise: an examination of three Chinese mathematics
teachers’ resource systems as windows into their work and expertise. Educational
Studies in Mathematics, 1-18.
Perkins, R., Moran, G., Cosgrove, J., Shiel, G. (2009). PISA 2009: The performance and
progress of 15-year-olds in Ireland. Dublin: Education Research Centre.
Perkins, R., & Shiel, G. (2016). Implications for the teaching and learning of mathematics
in Ireland. Retrieved May 19, 2017 from http://www.erc.ie/wp/wp-
content/uploads/2016/10/PISA-in-ClassroomsWeb.pdf
Pingel, F. (2010). UNESCO guidebook on textbook research and textbook revision (2nd
revised and updated edition). Retrieved May 19, 2017 from
http://unesdoc.unesco.org/images/0011/001171/117188E.pdf

253
Polya, G. (1957). How to Solve it: A New Aspect of Mathematical Method. 2d Ed.
Doubleday.
Prasad, B. D. (2008). Content analysis. A method in Social Science Research. Teoksessa:
Lal Das, DK and Bhaskaran, V (toim.).(2008): Research methods for Social Work. New
Delhi: Rawat, 173-193.
Project Maths (2009). Retrieved April 9, 2011 from http://www.projectmaths.ie/for-
teachers/junior-certificate/problem-solving-at-junior-cycle/
Project Maths (2017). Retrieved May 16, 2017, from http://www.projectmaths.ie/for-
teachers/explanation-of-resources/textbooks/
Project Maths Implementation Support Committee (2010). Report of the Project Maths
Support Group. Retrieved June 21, 2016 from
https://www.education.ie/en/Publications/Policy-Reports/Report-of-the-Project-Maths-
Implementation-Group.pdf
Rabardel, Pierre. "Les hommes et les technologies; approche cognitive des instruments
contemporains." (1995): 239. Retrieved June 21, 2016 from https://hal.archives-
ouvertes.fr/file/index/docid/1017462/filename/Hommes_et_technologie_Rabardel1995
Remillard, J. T. (1996). Changing texts, teachers, and teaching: The role of curriculum
materials in mathematics education reform. Ph.D. Thesis.
Remillard, J. T. (1999). Curriculum materials in mathematics education reform:
A framework for examining teachers' curriculum development. Curriculum
Inquiry, 29(3), 315-342.
Remillard, J. T. (2005). Examining key concepts in research on teachers’ use of
mathematics curricula. Review of Educational Research, 75(2), 211-246.
Remillard, J. T., Herbel-Eisenmann, B. A., & Lloyd, G. M. (Eds.). (2011).Mathematics
teachers at work: Connecting curriculum materials and classroom instruction. London:
Routledge.
Rezat, S., & Sträßer, R. (2012). From the didactical triangle to the socio-didactical
tetrahedron: artifacts as fundamental constituents of the didactical
situation. ZDM, 44(5), 641-651.

254
Robitaille, D.F., & Travers, K. J. (1992). International studies of achievement in
mathematics. In D. A. Grouws (Ed.), Handbook of research on mathematics teaching and
learning (pp. 687-709). New York: Macmillan.
Schmidt, W. H., McKnight, C. C., Valverde, G. A., Houang, R. T., & Wiley, D. E. (1997).
Many visions, many aims (Vol. 1). Dordrecht: Kluwer.
Schoenfeld, A. H. (2009). Working with schools: The story of a mathematics education
collaboration. American Mathematical Monthly, 116(3), 197-217.
Seeley, C. L. (2003). Mathematics textbook adoption in the United States. In G. Stanic &
J. Kilpatrick (Eds.), A history of school mathematics (pp. 957–988). Reston, VA: National
Council of Teachers of Mathematics.
Selden, J., Mason A., and Selden A. (1989). Can average calculus students solve
nonroutine problems? Journal of Mathematical Behaviour, 8 (1), 45-50.
Selden, J., Selden, A., & Mason, A. (1994). Even good calculus students can't solve
nonroutine problems. MAA Notes, 19-28.
Shiel, G., Surgenor, P., Close, S., & Millar, D. (2006). The 2004 National Assessment of
Mathematics Achievement. Dublin: Educational Research Centre.
Shimizu, Y., Kaur, B., Huang, R., & Clarke, D. (Eds.). (2010). Mathematical tasks in
classrooms around the world. Rotterdam: Sense Publishers.
Sidenvall, J., Lithner, J., & Jäder, J. (2015). Students’ reasoning in mathematics textbook
task-solving. International journal of mathematical education in science and
technology, 46(4), 533-552.
Silver, E. A., Ghousseini, H., Charalambous, C. Y., & Mills, V. (2009). Exploring the
curriculum implementation plateau: An instructional perspective. Mathematics teachers
at work: Connecting curriculum materials and classroom instruction, 245-265.
Smith, M. S., & Stein, M. K. (1998). Selecting and creating mathematical tasks: From
research to practice. Mathematics Teaching in the Middle School, 3(4): 268-275.
Son, J. W., & Hu, Q. (2016). The initial treatment of the concept of function in the
selected secondary school mathematics textbooks in the US and China. International
Journal of Mathematical Education in Science and Technology, 47(4), 505-530.
Sriraman, B., & English, L. (2010). Surveying theories and philosophies of mathematics
education. In Theories of mathematics education (pp. 7-32). Berlin Heidelberg: Springer.

255
Stacey, K. & Vincent, J. (2009). Modes of reasoning in explanations in Australian eight-
grade mathematics textbooks. Educational Studies in Mathematics, 72 (3), 271-288.
State Examinations Commission (2005). Leaving Certificate Examination 2005
Mathematics Chief Examiner’s Report for Higher, Ordinary and Foundation Levels.
Retrieved May 19, 2017, from
http://www.examinations.ie/archive/examiners_reports/cer_2005/LCMathematics.pdf
State Examinations Commission (2006) Junior Certificate Examination 2006 Mathematics
Chief Examiner’s Report for Higher, Ordinary and Foundation levels. Retrieved May 19,
2017, from
http://www.examinations.ie/archive/examiners_reports/cer_2006/JC_Maths_2006.pdf
State Examinations Commission (2016). Leaving Certificate Examination 2015
Mathematics. Chief Examiner’s Report Retrieved June 21, 2016 from
https://www.examinations.ie/misc-doc/EN-EN-53913274.pdf
State Examinations Commission (2017). Percentage breakdown of candidates by grade
awarded in each subject Retrieved August 26, 2017 from
https://www.examinations.ie/misc-doc/BI-ST-30831573.pdf
Stein, M. K., Grover, M. & Henningsen, M. (1996). Building student capacity for
mathematical thinking and reasoning: An analysis of mathematical tasks used in reform
classrooms. American Educational Research Journal, 33(2), 489-509.
Stein, M. K. & Lane, S. (1996). Instructional tasks and the development of student
capacity to think and reason: An analysis of the relationship between teaching and
learning in a reform mathematics project. Educational Research and Evaluation, 2(1), 50-
80.
Stein, M. K., Smith, M. S., Henningsen, M., & Silver, E. A. (2009). Implementing
standards-based mathematics instruction. New York: Teachers College Press.
Stylianides, G. J. (2009). Reasoning-and-proving in school mathematics textbooks.
Mathematical Thinking and Learning, 11(4), 258-288.
Sullivan, P., Clarke, D., & Clarke, B. (2012). Teaching with tasks for effective mathematics
learning (Vol. 9). Berlin: Springer Science & Business Media.
Sullivan, P., & Mousley, J. (2001). Thinking teaching: Seeing mathematics teachers as
active decision makers. In Making sense of mathematics teacher education (pp. 147-
163). Springer Netherlands.

256
Swan, M. (2005). Standards Unit-Improving learning in mathematics: challenges and
strategies. London: Department for Education and Skills Standards Unit.
Swan, M. (2007). The impact of task-based professional development on teachers’
practices and beliefs: A design research study. Journal of Mathematics Teacher
Education, 10(4-6): 217-237.
Swan, M. (2008). Designing a multiple representation learning experience in secondary
algebra. Educational Designer, 1(1), 1-17.
Swan, M., & Burkhardt, H. (2012). Designing assessment of performance in
mathematics. Educational Designer, 2(5).
Thompson, D. R., & Senk, S. L. (2014). The same geometry textbook does not mean the
same classroom enactment. ZDM, 46(5), 781-795.
Tinsley, H. E., & Weiss, D. J. (1975). Interrater reliability and agreement of subjective
judgments. Journal of Counseling Psychology, 22(4), 358-376.
Tinsley, H. E., & Weiss, D. J. (2000). Interrater reliability and agreement. In H. E. A.
Tinsley & S. D. Brown (Eds.), Handbook of applied multivariate statistics and
mathematical modelling. San Diego, CA: Academic Press, 95-124.
Törnroos, J. (2005). Mathematics textbooks, opportunity to learn and student
achievement. Studies in Educational Evaluation, 31(4), 315-327.
Tran, D. (2016). Statistical Association: Alignment of Current US High School Textbooks
with the Common Core State Standards for Mathematics. School Science and
Mathematics, 116(5), 286-296.
Usiskin, Z. (2012). What does it mean to understand some mathematics? Retrieved
October 16 2012 from
http://www.icme12.org/data/ICME%2012%20Usiskin%20Regular%20lecture%20print%2
0final.doc
Valverde, G. A,. Bianchi, L. J., Wolfe, R. G., Schmidt, W. H. & Houang, R. T. (2002).
According to the book: Using TIMSS to investigate the transition of policy into practice
through the world of textbooks. Dordrecht, Netherlands: Kluwer.
Viera, A. J., & Garrett, J. M. (2005). Understanding interobserver agreement: the kappa
statistic. Fam Med, 37(5), 360-363.

257
Viholainen, A., Partanen, M., Piiroinen, J., Asikainen, M. & Hirvonen, P. (2015). The role
of textbooks in Finnish upper secondary school mathematics: theory, examples and
exercises. Nordic Studies in Mathematics Education, 20(3-4), 157-178.
Vincent, J., & Stacey, K. (2008). Do mathematics textbooks cultivate shallow teaching?
Applying the TIMSS video study criteria to Australian eighth-grade mathematics
textbooks. Mathematics Education Research Journal, 20(1): 82-107.
Watson, A., & De Geest, E. (2005). Principled teaching for deep progress: Improving
mathematical learning beyond methods and materials. Educational Studies in
Mathematics, 58(2), 209-234.
Watson, A., & Ohtani, M. (2015). Themes and Issues in Mathematics Education
Concerning Task Design: Editorial Introduction. In Task Design In Mathematics
Education (pp. 3-15). Springer International Publishing.
Watson, A., & Thompson, D. R. (2015). Design Issues Related to Text-Based Tasks.
In Task Design In Mathematics Education (pp. 143-190). Springer International
Publishing.
Xin, Y. P. (2007). Word problem solving tasks in textbooks and their relation to student
performance. The Journal of Educational Research, 100(6), 347-360.
Yang, D. C., & Lin, Y. C. (2014). A comparison of functions in middle school textbooks
among Finland, Singapore and Taiwan. In Jones, K., Bokhove, C., Howson, G., & Fan, L
(Eds). Proceedings of the International Conference on Mathematics Textbook Research
and Development (ICMT-2014). (pp. 505 – 510): University of Southampton.
Zaslavsky, O., & Sullivan, P. (Eds.). (2011). Constructing knowledge for teaching
secondary mathematics: Tasks to enhance prospective and practicing teacher
learning (Vol. 6). Springer Science & Business Media.

258
Appendices


259
Appendix A Documents for Novelty Workshop
A.1 Codebook – Information for Textbook Tasks Analysis in Relation to
Novelty
The table given below describes three levels of Novelty: Novel, Somewhat Novel and Not
Novel. In order to classify textbook tasks as Novel, Somewhat Novel or Not Novel,
expository material and examples shown prior to a task within a single chapter are
examined and the key skills required for deriving a solution to each task are identified.
Skills are taken to refer to the methods and techniques used in the solutions to tasks.
Please note that it is not necessary for all characteristics in the description of the
categories of novelty shown in the table to apply in order for a task to be classified in
that category. However there should be sufficient evidence in order to distinguish
between the different categories and as many characteristics as possible should be
identified before settling on a particular classification. Common skills like, for example,
factorising or calculating slope are taken to be familiar from junior cycle.
Novel (iv) Skills involved in finding the solution are not familiar from preceding
exercises or from any previous point in the chapter being analysed.
(v) The mathematical concept involved is not familiar from previous
exercises or examples.
(vi) Significant adaption of the method outlined in examples and
exercises must be made in order to get the required solution.
Somewhat
Novel
(v) The presentation of the task makes the question appear unfamiliar.
However its solution requires the use of familiar skills.
(vi) The context (perhaps the use of an unfamiliar real-world situation)
makes the task appear unfamiliar but familiar skills are used in its
solution.
(vii) A new feature or aspect of a concept is encountered but the solution
to the task only involves the use of familiar skills.
(viii) A minor adaption of the method outlined in the examples has to be
made in order to get the required solution. The skills required are
familiar but the use or application of such skill is slightly modified.
Not Novel (vi) The presentation, context and concepts of the task are familiar.
(vii) The solution to the exercise or problem has been modelled in
preceding exercises or has been encountered earlier in the same
chapter.
(viii) The skills required are very familiar to the user and the method of
solution is clear due to the similarity between the exercise and
preceding examples and exercises.

260
A.2 Definitions of Terms Used in Coding and on Coding Forms:
Unit of Data Collection: Each textbook exercise or parts that make up such an exercise
set like (a), (b), (c) or (i), (ii), (iii).
Task number: For identification purposes, each task or unit of data is given a unique
number.
Exercise ID: Each task is identified by its original exercise number from the textbook.
Classification: Indication of whether the task is novel, somewhat novel or not novel
including an indication of which criterion or criteria led to the decision such as ‘(i)’ in the
Novel column, or '(ii) and (iii)’ in the Not Novel column.
The textbooks being coded are Ordinary Level and Higher Level versions of Active Maths,
Text and Tests and Concise Maths, which have been labelled Texts A, B and C in some
order.
Examples of coding undertaken using this framework:
Expository material and worked examples from Text C (H)

261

262
Exercise Set 4.2 from Text C (H)
Sample Task 1:
2 2
1 2
2 2 2
1
Solution: (1) 3 2, (2) 3 1
( 1) 3 2 1 3 2 2
Classification:
Not novel (ii) and ( he solution has been modelled in example 1.
The skills required are very familiar from th
iii), t
is
n
u u
u n n n n n
example.
Sample Task 2:
1 2
The present
Solution
at
: 3(1) 2 5,
ion, conte
3(2) 2 8
Not Novel
xt and concepts
(i), (ii) and (iii), solution
of the task are famili
familiar from task 1.
The skills required and the solution me
a
t
r.
u u
hod are similar to example 1 part (i).
Sample Task 3:
1
1
Classification:
Somewhat Novel (i), (iv) and (iii)– The
Solution:
3( 1) 2 3 3 2 3 5
3 2
(3 5) (
presentation of the task makes the question appear
3 2) 3 5 3 2
unfamiliar.
A mino a
3
r
n
n
n n
u n n n
u n
u u n n n n
daption of the method outlined in the examples has to be made in order
to get the required solution.
However its solution requires the use of familiar skills, encountered in example 2.

263
Sample Task 4:
1
1
1
1
5 (ii) If 2 1 show that
Solution:
2 1 2.2 1
2 1
2.2 1 2 1
2.2 2
2 1 true
Classification:
Somewhat novel (iii) and (i), a new aspect of the concept is encountered here d
n
n n n
n n
n
n
n
n n
n n
n n
T T T
T
T
T T
ue to the
presence of powers. The solution is based on familiar skills from example 2.
Sample Task 5:
2
1 2
2
1
2
2
Ex. 4 (i) , where , . If 7 and 20, find the value of and .
Solution:
(1) (1) 7 7
(2) (2) 20 4 2 20
Simultaneous equations solved to get 3 and 4
Classification:
No
nT an bn a b R T T a b
T a b a b
T a b a b
a b
vel (i), (ii) and (iii), the skills involved in finding the solution are not familiar from the
preceding exercises or the two examples due to the presence of the unknown values and
the simultaneous equations.
Significant adaption of the method outlined in examples and exercises must be made.

264
A.3 Coding Form
Sample Task Exercise
Number
Novel Somewhat
Novel
Not Novel
1 4.2-2(i) (ii), (iii)
2 4.2-1(i) (i), (ii), (iii)
3 4.2-1(ii) (i), (iii),(iv)
4 4.2-5(ii) (i), (iii)
5 4.2-4(i) (i), (ii), (iii)

265
A.4 Practice Coding Material
Example Text C (O)

266
3 5
Practice Task 1
Ex. 3 In an arithmetic sequence, the third term, , is 7 and the fifth term, , is 11.
Find the first term, a, and the common difference, d.
Practice Task 2
Ex. 7 In an arithmetic sequen
T T
3 7
6
ce, the sum of the third term and the seventh term , is 38.
The sixth term, T , is 23
Find the first term, a, and the commond difference, d.
Practice Task 3
Ex. 8 In an arithmetic sequence, the sum o
T T
3 7
5
f the third term and the seventh term , is 22.
The fifth term, T , is 11
Find the first term, a, and the commond difference, d.
Practice Task 4
Ex. 10 , and are three numbers in an arithmetic se
T T
p q r
2 2 2
quence.
Prove that 2p r q
Coding Form
Practice Task Number
Exercise Number
Novel Somewhat Novel
Not Novel
1 3
2 7 (i)
3 8
4 10

267
A.5 Coding Material
Expository Material from Text C (O)

268

269

270
Expository material from Text B (H)

271

272

273

274
A.6 Patterns, Sequences and Series - Coding Form
Coder ID
Task Number Exercise Number Novel Somewhat Novel Not Novel
1 9.1-1
2 9.1-2
3 9.1-3
4 9.1-4
5 9.1-5
6 9.1-6
7 9.1-7
8 9.1-8
9 9.1-9
10 9.1-10
11 9.1-11
12 9.1-12
13 9.1-13
14 9.1-14
15 9.1-15
A.7 Differential Calculus - Coding Form
Coder ID
Task Number Exercise Number Novel Somewhat Novel Not Novel
16 2.1-1(i)
17 2.1-1(ii)
18 2.1-1(iii)
19 2.1-2
20 2.1-3(i)
21 2.1-3(ii)
22 2.1-4
23 2.1-5(i)
24 2.1-5(ii)
25 2.1-6(i)
26 2.1-6(ii)
27 2.1-7(i)
28 2.1-7(ii)
29 2.1-7(iii)
30 2.1-7(iv)

275
A.8 Questionnaire
1. Did you find the Novelty framework easy to use? Please outline any difficulties you
encountered.
2. Do you agree with the descriptions (novel, somewhat novel, not novel) used in this
framework?
3. Any other comments?

276
Appendix B Chi-square Tests Tables
The following are the Chi-square test tables that are referred to in Chapter 5. Any
significant p values are highlighted in bold.
Subset of Data Variables for independence test N Degree of freedom
ᵡ2 p
Active Maths Higher Level
Textbook era
Topics 1743 1 0.07 0.79
Active Maths Higher Level
Textbook era
LCD [Higher Level Demand, Lower Level Demand]
1743 1 66.12 <0.001
Active Maths Ordinary Level
Textbook era
Topic 1183 1 2.85 0.91
Active Maths Ordinary Level
Textbook era
LCD [Higher Level Demand, Lower Level Demand]
1183 1 44.62 <0.001
Active Maths Post-Project Maths
Syllabus level
LCD [Higher Level Demand, Lower Level Demand]
1538 1 6.51 0.01
Active Maths Pre-Project Maths
Syllabus level
LCD [Higher Level Demand, Lower Level Demand]
1388 1 7.71 0.01
Active Maths Post-Project Maths Higher Level
Topic LCD [Higher Level Demand, Lower Level Demand]
871 1 37 <0.001
Active Maths Post-Project Maths Ordinary Level
Topic LCD [Higher Level Demand, Lower Level Demand]
647 1 3.6 0.06
Active Maths Pre-Project Maths Higher Level
Topic LCD [Higher Level Demand, Lower Level Demand]
852 1 5.98 0.01
Active Maths Pre-Project Maths Ordinary Level
Topic LCD [Higher Level Demand, Lower Level Demand]
536 1 10.87 <0.001
Table 50: Chi-square test results for Active Maths textbook series and LCD

277
Subset of Data Variables for independence test N Degree of freedom
ᵡ2 p
Text and Tests Higher Level
Textbook era
Topic 1275 1 0.004 0.95
Text and Tests Higher Level
Textbook era
LCD [Higher Level Demand, Lower Level Demand]
1275 1 98.7 <0.001
Text and Tests Ordinary Level
Textbook era
Topic 857 1 1.93 0.16
Text and Tests Ordinary Level
Textbook era
LCD [Higher Level Demand, Lower Level Demand]
857 1 14.26 <0.001
Text and Tests Post-Project Maths
Syllabus level
LCD [Higher Level Demand, Lower Level Demand]
1102 1 46.23 <0.001
Text and Tests Pre-Project Maths
Syllabus level
LCD [Higher Level Demand, Lower Level Demand]
1030 1 3.3 0.07
Text and Tests Post- Project Maths Higher Level
Topic LCD [Higher Level Demand, Lower Level Demand]
631 1 37 <0.001
TT Post –Project Maths Ordinary Level
Topic LCD [Higher Level Demand, Lower Level Demand]
471 1 3.6 0.06
Text and Tests Post-Project Maths Higher Level
Topic LCD [Higher Level Demand, Lower Level Demand]
644 1 5.79 0.02
Text and Tests pre-Project Maths Ordinary Level
Topic LCD [Higher Level Demand, Lower Level Demand]
386 1 9.85 0.01
Table 51: Chi-square test results for Text and Tests textbook series and LCD

278
Subset of Data Variables for independence test N Degree of freedom
ᵡ2 p
Concise Maths Higher Level
Textbook era
Topic 1516 1 0.01 0.94
Concise Maths Higher Level
Textbook era
LCD [Higher Level Demand, Lower Level Demand]
1516 1 44.12 <0.001
Concise Maths Ordinary Level
Textbook era
Topic 1061 1 8.39 0.01
Concise Maths Ordinary Level
Textbook era
LCD [Higher Level Demand, Lower Level Demand]
1061 1 17.32 <0.001
Concise Maths Post-Project Maths
Syllabus level
LCD [Higher Level Demand, Lower Level Demand]
1411 1 0.94 0.33
Concise Maths Pre-Project Maths
Syllabus level
LCD [Higher Level Demand, Lower Level Demand]
1166 1 0.62 0.43
Concise Maths Post-Project Maths Higher Level
Topic LCD [Higher Level Demand, Lower Level Demand]
831 1 5.58 0.02
Concise Maths Post-Project Maths Ordinary Level
Topic LCD [Higher Level Demand, Lower Level Demand]
580 1 32.12 <0.001
Concise Maths Pre-Project Maths Higher Level
Topic LCD [Higher Level Demand, Lower Level Demand]
685 1 6.34 0.01
Concise Maths Pre-Project Maths Ordinary Level
Topic LCD [Higher Level Demand, Lower Level Demand]
481 1 1.7 0.19
Table 52: Chi-square test results for Concise Maths textbook series and LCD
Subset of Data Variables for independence test N Degree of freedom
ᵡ2 p
Post-Project Maths Higher Level
LCD [Higher Level Demand, Lower Level Demand]
Textbook series
2353 2 28.97 <0.001
Post-Project Maths Ordinary Level
LCD [Higher Level Demand, Lower Level Demand]
Textbook series
1698 2 20.62 <0.001
Pre-Project Maths Higher Level
LCD [Higher Level Demand, Lower Level Demand]
Textbook series
2181 2 17.55 <0.001
Pre-Project Maths Ordinary Level
LCD [Higher Level Demand, Lower Level Demand]
Textbook series
1403 2 4.31 0.12
Table 53: Chi-square test results for Textbook Series and LCD

279
Subset of Data Variables for independence test N Degree of freedom
ᵡ2 p
Active Maths Higher Level
Textbook era
Reasoning [Creative Reasoning, Imitative Reasoning]
1743 1 32.85 <0.001
Active Maths Ordinary Level
Textbook era
Reasoning [Creative Reasoning, Imitative Reasoning]
1183 1 21.25 <0.001
Active Maths Post-Project Maths
Syllabus level
Reasoning [Creative Reasoning, Imitative Reasoning]
1538 1 3.67 0.06
Active Maths Pre-Project Maths
Syllabus level
Reasoning [Creative Reasoning, Imitative Reasoning]
1388 1 3.19 0.07
Active Maths Post-Project Maths Higher Level
Topic Reasoning [Creative Reasoning, Imitative Reasoning]
891 1 0.29 0.59
Active Maths Post-Project Maths Ordinary Level
Topic Reasoning [Creative Reasoning, Imitative Reasoning]
647 1 0.85 0.36
Active Maths Pre-Project Maths Higher Level
Topic Reasoning [Creative Reasoning, Imitative Reasoning]
852 1 0.12 0.72
Active Maths Pre-Project Maths Ordinary Level
Topic Reasoning [Creative Reasoning, Imitative Reasoning]
536 1 10.87 <0.001
Table 54: Chi-square test results for Active Maths textbook series and Reasoning

280
Subset of Data Variables for independence test N Degree of freedom
ᵡ2 p
Text and Tests Higher Level
Textbook era
Reasoning [Creative Reasoning, Imitative Reasoning]
1275 1 16.7 <0.001
Text and Tests Ordinary Level
Textbook era
Reasoning [Creative Reasoning, Imitative Reasoning]
857 1 4.81 0.03
Text and Tests Post-Project Maths
Syllabus level
Reasoning [Creative Reasoning, Imitative Reasoning]
1102 1 10.77 0.01
Text and Tests Pre-Project Maths
Syllabus level
Reasoning [Creative Reasoning, Imitative Reasoning]
1030 1 3.7 0.06
Text and Tests Post-Project Maths Higher Level
Topic Reasoning [Creative Reasoning, Imitative Reasoning]
631 1 39.04 <0.001
Text and Tests Post-Project Maths Ordinary Level
Topic Reasoning [Creative Reasoning, Imitative Reasoning]
471 1 3.74 0.06
Text and Tests Pre-Project Maths Higher Level
Topic Reasoning [Creative Reasoning, Imitative Reasoning]
644 1 7.05 0.01
Text and Tests Pre-Project Maths Ordinary Level
Topic Reasoning [Creative Reasoning, Imitative Reasoning]
386 1 9.85 0.01
Table 55: Chi-square test results for Text and Tests textbook series and Reasoning

281
Subset of Data Variables for independence test N Degree of freedom
ᵡ2 p
Concise Maths Higher Level
Textbook era
Reasoning [Creative Reasoning, Imitative Reasoning]
1516 1 23.47 <0.001
Concise Maths Ordinary Level
Textbook era
Reasoning [Creative Reasoning, Imitative Reasoning]
1061 1 13.49 <0.001
Concise Maths Post-Project Maths
Syllabus level
Reasoning [Creative Reasoning, Imitative Reasoning]
1411 1 0.12 0.72
Concise Maths Pre-Project Maths
Syllabus level
Reasoning [Creative Reasoning, Imitative Reasoning]
1166 1 0.62 0.43
Concise Maths Post-Project Maths Higher Level
Topic Reasoning [Creative Reasoning, Imitative Reasoning]
831 1 8.28 0.01
Concise Maths Post-Project Maths Ordinary Level
Topic Reasoning [Creative Reasoning, Imitative Reasoning]
580 1 23.41 <0.001
Concise Maths Pre-Project Maths Higher Level
Topic Reasoning [Creative Reasoning, Imitative Reasoning]
685 1 6.34 0.01
Concise Maths Pre-Project Maths Ordinary Level
Topic Reasoning [Creative Reasoning, Imitative Reasoning]
481 1 1.7 0.19
Table 56: Chi-square test results for Concise Maths textbook series and Reasoning
Subset of Data Variables for independence test
N Degree of freedom
ᵡ2 p
Post-Project Maths Higher Level
Reasoning Textbook series
2353 2 12.85 0.01
Post-Project Maths Ordinary Level
Reasoning Textbook series
1698 2 16.48 <0.001
Pre-Project Maths Higher Level
Reasoning Textbook series
2181 2 7.65 0.02
Pre-Project Maths Ordinary Level
Reasoning Textbook series
1403 2 4.31 0.12
Table 57: Chi-square test results for Textbook series and Reasoning

282
Subset of Data Variables for independence test
N Degree of freedom
ᵡ2 p
Active Maths Higher Level Textbook era Novelty 1743 2 20.89 <0.001
Active Maths Ordinary Level
Textbook era Novelty 1183 2 20.3 <0.001
Active Maths Post-Project Maths
Syllabus level Novelty 1538 2 15.41 <0.001
Active Maths Pre-Project Maths
Syllabus level Novelty 1388 2 26.69 <0.001
Active Maths Post-Project Maths Higher Level
Topic Novelty 891 2 4.92 0.09
Active Maths Post-Project Maths Ordinary Level
Topic Novelty 647 2 16.36 <0.001
Active Maths Pre-Project Maths Higher Level
Topic Novelty 852 2 0.74 0.69
Active Maths Pre-Project Maths Ordinary Level
Topic Novelty 536 2 8.25 0.02
Table 58: Chi-square test results for Active Maths textbook series and Novelty
Subset of Data Variables for independence test
N Degree of freedom
ᵡ2 p
Text and Tests Higher Level Textbook era Novelty 1275 2 22.23 <0.001
Text and Tests Ordinary Level
Textbook era Novelty 857 2 10.11 0.01
Text and Tests Post-Project Maths
Syllabus level Novelty 1102 2 36.25 <0.001
Text and Tests Pre-Project Maths
Syllabus level Novelty 1030 2 16.43 <0.001
Text and Tests Post-Project Maths Higher Level
Topic Novelty 631 2 0.13 0.94
Text and Tests Post-Project Maths Ordinary Level
Topic Novelty 471 2 16.33 <0.001
Text and Tests Pre-Project Maths Higher Level
Topic Novelty 644 2 6.31 0.04
Text and Tests Pre-Project Maths Ordinary Level
Topic Novelty 386 2 15.48 <0.001
Table 59: Chi-square test results for Text and Tests textbook series and Novelty

283
Subset of Data Variables for independence test
N Degree of freedom
ᵡ2 p
Concise Maths Higher Level Textbook era Novelty 1516 2 17.93 <0.001
Concise Maths Ordinary Level
Textbook era Novelty 1061 2 13.18 0.01
Concise Maths Post-Project Maths
Syllabus level Novelty 1411 2 2.79 0.25
Concise Maths Pre-Project Maths
Syllabus level Novelty 1166 2 1.54 0.46
Concise Maths Post-Project Maths Higher Level
Topic Novelty 831 2 2.19 0.34
Concise Maths Post-Project Maths Ordinary Level
Topic Novelty 580 2 8.07 0.02
Concise Maths Pre-Project Maths Higher Level
Topic Novelty 685 2 4.4 0.11
Concise Maths Post-Project Maths Ordinary Level
Topic Novelty 481 2 1.75 0.42
Table 60: Chi-square test results for Concise Maths textbook series and Novelty
Subset of Data Variables for independence test
N Degree of freedom
ᵡ2 p
Post-Project Maths Higher Level
Novelty Textbook Series 2353 4 30.81 <0.001
Post-Project Maths Ordinary Level
Novelty Textbook Series 1698 4 15.92 0.01
Pre-Project Maths Higher Level
Novelty Textbook Series 2181 4 2.7 0.61
Pre-Project Maths Ordinary Level
Novelty Textbook Series 1403 4 15.01 0.01
Table 61: Chi-square test results for Textbook series and Novelty

284
Appendix C Task Design Material
Code Book
You will be classifying tasks using two frameworks: the first is the Level of Cognitive Demand
Framework and the second is a framework based on the objectives of the Project Maths
syllabus.
Level of Cognitive Demand framework: There are four possible classifications here. Lower-level:
Memorization, Lower-level: procedures without connections to meaning, Higher-level:
procedures with connections to meaning, Higher-level: Doing Mathematics.
Outline of the Levels of Cognitive Demand Framework
List of criteria for lower-level classifications using the LCD framework
Levels of Demands
Lower-level demands (memorization)
Involve either reproducing previously learned facts, rules, formulas, or definitions or
committing facts, rules, formulas or definitions to memory.
Cannot be solved using procedures because a procedure does not exist or because the
time frame in which the task is being completed is too short to use a procedure.
Are not ambiguous. Such tasks involve the exact reproduction of previously seen
material, and what is to be reproduced is clearly and directly stated.
Have no connections to the concepts or meaning that underlie the facts, rules, formulas,
or definitions being learned or reproduced.
Lower-level demands (procedures without connections to meaning)
Are algorithmic. Use of the procedure either is specifically called for or is evident from
prior instruction, experience or placement of the task.
Require limited cognitive demand for successful completion. Little ambiguity exists about
what needs to be done and how to do it.
Have no connection to the concepts or meaning that underlies the procedure being used.
Are focused on producing correct answers instead of developing mathematical
understanding.
Require no explanations or explanations that focus solely on describing the procedure
that was used.

285
List of criteria for higher-level classifications using the LCD framework
Higher-level demands (Procedures with connections to meaning)
Focus students’ attention on the use of procedures for the purposes of developing
deeper levels of understanding of mathematical concepts and ideas.
Suggest explicitly or implicitly pathways to follow that are broad general procedures
that have close connections to underlying conceptual ideas as opposed to narrow
algorithms that are opaque with respect to underlying concepts.
Usually are represented in multiple ways, such as visual diagrams, manipulatives,
symbols and problem situations. Making connections among multiple representations
helps develop meaning.
Require some degree of cognitive effort. Although general procedures may be
followed, they cannot be followed mindlessly. Students need to engage with
conceptual ideas that underlie the procedures to complete the task successfully and
develop understanding.
Higher-level demands (Doing Mathematics)
Require complex and nonalgorithmic thinking – a predictable, well-rehearsed approach
or pathway is not explicitly suggested by the task, task instruction, or a worked-out
example.
Require students to explore and understand the nature of mathematical concepts,
processes or relationships.
Demand self-monitoring or self-regulation of one’s own cognitive processes.
Require students to access relevant knowledge and experience and make appropriate
use of them in working through the task.
Require students to analyse the task and actively examine task constraints that may
limit possible solution strategies and solutions.
Require considerable cognitive effort and may involve some level of anxiety for the
student because of the unpredictable nature of the solution process required.

286
LCD Sample Task 1 Find Tn, the nth term of the following arithmetic sequence.
8, 13, 18, 23, …
Likely method of solution: Let the first term a = 8, the common difference (13-8) d = 5. Then
Tn = a+(n-1)d = 8+(n-1)5 = 8+5n-5 = 5n+3
Commentary: The student has been shown a formula a + (n-1)d to use in this situation. Finding
the nth term in this way does not require any great thought or consideration.
Classification LCD: Lower Level: Procedure without connection to meaning.
Algorithmic. Limited cognitive demand. No explanation needed. Focused on getting correct
answer.
LCD Sample Task 2 Anna saves money each week to buy a printer which costs €190. Her plan is
to start with €10 and to put aside €2 more each week (ie €12, €14, etc.) until she has enough
money to buy the printer. At this rate, how many weeks will it take Anna to save for the printer?
Likely method of solution: Note there are two ways to do this:
10+12+14+16+18+20+22+24+26+28=190 (10 weeks)
OR
n
2{2a+(n‐1)d}=190
n
2{2(10)+(n‐1)(2)}=190 which leads to n = 10
Commentary: The student has more than one method of solution so must consider approach
that they think best.
Classification LCD: Higher Level: Procedure with connection to meaning.
Not narrow algorithm, some cognitive effort required as the student must consider how to
approach the task. A procedure is being used but it is not being used mindlessly.
LCD sample task 3 Show that 𝑆𝑛 =𝑛(𝑎+𝑙)
2 is the sum to n terms of an arithmetic sequence where
l is the last term.
Likely method of solution: Student will have to experiment in order to determine how to deal
with the last term l and incorporate it into the sum to n terms.
Commentary: The student has the formula n
2{2a+(n-1)d} to use for Sn but this task is not
procedural. Student has to consider the terms a, a+d, a+2d, …, l-d, l in order to get the required
sum.
Classification LCD: Higher Level: ‘Doing Mathematics’.
It requires complex and nonalgorithmic thinking. Student must analyse task and its constraints.

287
LCD sample task 4 Find the coordinates of the turning point of the given function and determine
if the turning point is a local maximum or local minimum.
𝑦 = 𝑥2 − 2𝑥 + 5
Likely method of solution: Differentiate to get the derivative. Solve it by letting equal to zero.
This gives x =1, this is subbed into the function to get y = 4. So turning point is (1,4). Second
derivative test is most likely used to show that it is a local minimum.
Commentary: The student has been shown a procedure to use in this situation. It does not
involve any great thought or consideration.
Classification LCD: Lower Level: Procedure without connection to meaning. Following an
algorithm, can be completed mindlessly.
LCD sample task 5 Given that the curve 𝑦 = 𝑎𝑥2 + 12𝑥 + 1 has a turning point at x =2,
calculate the value of a.
Likely method of solution: To get the turning point, the familiar procedure involves
differentiating and letting the derivative equal to zero. In this case, the student would find the
derivative to be 2ax+12. Given x =2, this is subbed into 2ax+12=0.
2a(2)+12=0
4a+12=0
4a=-12
a=-3
Commentary: A procedure is used but the presence of a means that it cannot be followed
blindly. They must consider how to find the value of a.
Classification LCD: Higher Level: Procedure with connection to meaning.
The use of the procedure is for the purposes of developing deeper levels of understanding of
mathematical concepts. It requires some use of cognitive effort.

288
LCD sample task 6
Likely method of solution: It is necessary here to look at the behaviour of the original graph.
Where does it cross the x-axis? Where does it cross the y-axis. Which derivative graph would
result from a graph like this?
Commentary: The student must use mathematical thinking to analyse the graphs and
corresponding constraints. It is necessary to use some cognitive effort to come up with the
graph that represents the derivative.
Classification LCD: Higher Level – ‘Doing Mathematics’.
The student does not use an algorithm here and is instead considering the behaviour of the
functions and their graphs.

289
Project Maths Objectives Framework:
The development of synthesis and problem-solving skills is a key goal of the Project Maths
syllabus. The second framework that you will use is an amended list of Project Maths objectives
in relation to synthesis and problem-solving. Amending it in this way allows one to classify what
kind of learning is experienced by the student when completing tasks. It is possible for a task to
display more than one of these objectives and it gives a clear picture of whether tasks are
meeting the Project Maths curricular goals in relation to synthesis and problem-solving.
O1 Explore patterns and formulate conjectures.
O2 Explain findings.
O3 Justify conclusions.
O4 Communicate mathematics in written form.
O5 Apply their knowledge and skills to solve problems in familiar/unfamiliar contexts.
O6 Analyse information presented in written form/words and translate it into
mathematical form.
O7 (a) Devise appropriate mathematical models, formulae or techniques to process
information and to draw relevant conclusions.
O7 (b) Select appropriate mathematical models, formulae or techniques to process
information and to draw relevant conclusions.
O7 (c) Use appropriate mathematical models, formulae or techniques to process
information and to draw relevant conclusions.
Amended synthesis and problem-solving objectives in the Leaving Certificate syllabus

290
PMO Sample task 1 Find Tn, the nth term of the following arithmetic sequence.
8, 13, 18, 23, …
Likely method of solution: Let the first term a = 8, the common difference (13-8) d = 5. Then
Tn = a+(n-1)d = 8+(n-1)5 = 8+5n-5 = 5n+3
Commentary: The student has been shown a formula a + (n-1)d to use in this situation. Finding
the nth term in this way does not require any great thought or consideration.
Classification PMO: Use Model – student has a familiar formula to work with.
PMO Sample Task 2 Anna saves money each week to buy a printer which costs €190. Her plan is
to start with €10 and to put aside €2 more each week (ie €12, €14, etc.) until she has enough
money to buy the printer. At this rate, how many weeks will it take Anna to save for the printer?
Likely method of solution: Recall that there are two ways to do this:
10+12+14+16+18+20+22+24+26+28=190 (10 weeks)
OR
n
2{2a+(n‐1)d}=190
n
2{2(10)+(n‐1)(2)}=190 which leads to n = 10
Commentary: You will recall that the student is likely to have more than one method in order to
solve this task. The student has to select which one to complete the task with.
Classification PMO: Select Model
Classification PMO: Analyse information presented in written form and translate it into
mathematical form.
PMO Sample Task 3 Show that 𝑆𝑛 =𝑛(𝑎+𝑙)
2 is the sum to n terms of an arithmetic sequence
where l is the last term.
Likely method of solution: Student will have to experiment in order to determine how to deal
with the last term l and incorporate it into the sum to n terms.
Commentary: The student has the formula n
2{2a+(n-1)d} to use for Sn but this task is not
procedural. Student has to consider the terms a, a+d, a+2d, …, l-d, l in order to get the required
sum.
Classification PMO: Devise Model: The student has not been shown a method for doing this,
they must find their own way of solving it. The formula for Sn is not sufficient here as a model to
use.
Classification PMO: Apply knowledge and skills to solve problems in familiar/unfamiliar
contexts: It is important here to realise that the student has experience of working with finding
the sum of the arithmetic sequence but the task is a problem in the sense that it is novel,
meaning that it is not as straight forward as might have been encountered previously.

291
PMO Sample Task 4 Find the coordinates of the turning point of the given function and
determine if the turning point is a local maximum or local minimum.
𝑦 = 𝑥2 − 2𝑥 + 5
Likely method of solution: Differentiate to get the derivative. Solve it by letting equal to zero.
This gives x =1, this is subbed into the function to get y = 4. So turning point is (1,4). Second
derivative test is most likely used to show that it is a local minimum.
Commentary: The student has been shown a procedure to use in this situation.
Classification PMO: Use Model: As seen earlier, the student uses a very familiar model to get
the required answer.
PMO Sample Task 5 Given that the curve 𝑦 = 𝑎𝑥2 + 12𝑥 + 1 has a turning point at x =2,
calculate the value of a.
Likely method of solution: To get the turning point, the familiar procedure involves
differentiating and letting the derivative equal to zero. In this case, the student would find the
derivative to be 2ax+12. Given x =2, this is subbed into 2ax+12=0.
2a(2)+12=0
4a+12=0
4a=-12
a=-3
Commentary: A procedure is used but the presence of a means that it cannot be followed
blindly. They must consider how to find the value of a but this does not involve devising a
completely new model.
Classification PMO: Use Model: The student has a model for finding a turning point, the
unknown a is a new feature which must be incorporated with the known procedure.
Classification PMO: Apply knowledge and skills to solve problems in familiar/unfamiliar
contexts. Again the context is familiar but it is a problem because the student is not overly
familiar with how to approach the task in order to solve it.

292
PMO Sample Task 6
Likely method of solution: It is necessary here to look at the behaviour of the original graph.
Where does it cross the x-axis? Where does it cross the y-axis? Which derivative graph would
result from a graph like this?
Commentary: The student must analyse the graphs and corresponding constraints. It is
necessary to use some mathematical thinking to come up with the graph that represents the
derivative.
Classification PMO: Devise Model – student must look at the graphs and consider their patterns
and constraints. It is also necessary to link their knowledge of the derivative with the graphs.
Classification PMO: Explore patterns and formulate conjectures. Student must look at the
behaviour of the graphs.
Classification PMO: Apply knowledge and skills to solve problems in familiar/unfamiliar
contexts.
Classification PMO: Justify conclusions -the student must make a case for excluding certain
graphs and give a valid reason behind the choice of graph that is eventually chosen.
Sequences and Series
Students’ material exposure for Practice Task 1
1. Definition of a number sequence.
2. Finding the next term or finding the next two terms of a sequence e.g 2, 5, 8, 11, …
Students’ material exposure for Practice Tasks 2, 3 and 4
1. Definition of a number sequence.
2. Finding the next term or finding the next two terms of a sequence e.g 2, 5, 8, 11, …
3. Writing out the first few terms of a sequence from a given Tn
e.g. Tn = 3n-2 gives the sequence 1, 4, 7, 10 (when asked for the first four terms).

293
Differential Calculus
Students’ material exposure for Practice Tasks 1, 2 and 3
1. Differentiation from First Principles
2. Differentiation by Rule 1( ) '( )n nf x x f x nx
3. Product Rule dy dv du
y uv u vdx dx dx
4. Quotient Rule 2
du dvv u
u dy dx dxyv dx v
5. The Chain Rule
6. A curve is increasing where 0. A curve is decreasing where 0.dy dy
dx dx
7. Stationary Points: a stationary point of a curve is a point on the curve at which the curve
is differentiable, and the tangent is horizontal / the tangent has a slope of zero /
0. dy
dx
To find the stationary points of the curve y = f(x):
(i) Find dy
dx
(ii) Put 0 dy
dx and solve for x.
(iii) Find the y co-ordinates of the stationary points.
8. There are several types of stationary points. Two of these are called turning points, as
the curve turns around at these points. The third is not a turning point, but is a point at
which the tangent has slope 0 but the sign of the derivative does not change.
A Local Maximum Point: This is the highest point on the curve in a specified locality. It may not
be the highest point overall. At a local ma point, the curve goes from increasing on the left to
decreasing on the right. In other words, dy
dxgoes from positive, through zero, to negative.
B Local Minimum Point: This is the lowest point on the curve in a specified locality. It may not be
the lowest point overall. At a local min, the curve goes from decreasing on the left to increasing
on the right. In other words dy
dxgoes from negative, through zero, to positive.
9. The sign of the second derivative tells us about the curvature of the curve. (Which way
the curve is facing). If 2
20
d y
dx then the curve is concave upwards. If
2
20
d y
dx then the
curve is concave downwards.

294
10. Second Derivative Test for Turning Points
If 2
20
d y
dx at a stationary point, then the point is a local max
If 2
20
d y
dx at a stationary point, then the point is a local min
11. Point of Inflection
A point of inflection is a point on a curve at which the curve goes from being concave upwards to
concave downwards, or the other way round.
The curve ( )y f x has a point of inflection at
2 2
1 1 2 2( , ) if (i) 0 at C and (ii) changes sign at C.
d y d yC x y
dx dx
Note: Can assume that students do not have a procedure for showing a function is injective,
surjective or bijective.
Students’ material exposure for Workshop Tasks 1, 2 and 3
1. Definition of a number sequence.
2. Finding the next term or finding the next two terms of a sequence e.g 2, 5, 8, 11, …
3. Writing out the first few terms of a sequence from a given Tn
e.g. Tn = 3n-2 gives the sequence 1, 4, 7, 10 (when asked for the first four terms).
4. Finding the nth term of an arithmetic sequence. Model used Tn = a + (n-1)d
5. Finding the sum of arithmetic series manually ie The terms of 1+3+5+7 are added
manually to get 16.
6. Finding the sum of an arithmetic series using a formula 2 ( 1)2
n
nS a n d
Note: No models or formulas beyond this. Student has no experience of working with general
cases or justifying things mathematically.

295
Students’ material exposure for tasks 4, 5 and 6
1. Differentiation from First Principles
2. Differentiation by Rule 1( ) '( )n nf x x f x nx
3. Product Rule dy dv du
y uv u vdx dx dx
4. Quotient Rule 2
du dvv u
u dy dx dxyv dx v
5. The Chain Rule
6. A curve is increasing where 0. A curve is decreasing where 0.dy dy
dx dx
7. Stationary Points: a stationary point of a curve is a point on the curve at which the curve is differentiable, and the tangent is horizontal / the tangent has a slope of zero /
0. dy
dx
To find the stationary points of the curve y = f(x):
(i) Find
dy
dx
(ii) Put 0 dy
dx and solve for x.
(iii) Find the y co-ordinates of the stationary points.
(iv) There are several types of stationary points. Two of these are called turning
points, as the curve turns around at these points. The third is not a turning
point, but is a point at which the tangent has slope 0 but the sign of the
derivative does not change.
A Local Maximum Point: This is the highest point on the curve in a specified locality. It may not
be the highest point overall. At a local ma point, the curve goes from increasing on the left to
decreasing on the right. In other words, dy
dxgoes from positive, through zero, to negative.
B Local Minimum Point: This is the lowest point on the curve in a specified locality. It may not be
the lowest point overall. At a local min, the curve goes from decreasing on the left to increasing
on the right. In other words dy
dxgoes from negative, through zero, to positive.
(v) The sign of the second derivative tells us about the curvature of the curve.
(Which way the curve is facing). If 2
20
d y
dx then the curve is concave upwards.
If 2
20
d y
dx then the curve is concave downwards.

296
(vi) Second Derivative Test for Turning Points
If 2
20
d y
dx at a stationary point, then the point is a local max
If 2
20
d y
dx at a stationary point, then the point is a local min
(vii) Point of Inflection
A point of inflection is a point on a curve at which the curve goes from being concave upwards to
concave downwards, or the other way round.
The curve ( )y f x has a point of inflection at
2 2
1 1 2 2( , ) if (i) 0 at C and (ii) changes sign at C.
d y d yC x y
dx dx

297
Workshop Tasks
W1. A display of cans on a supermarket shelf consists of 15 cans on the bottom, 13 cans
in the next row, and so on in an arithmetic sequence until the top row has 9 cans.
The manager would like to see a different number of rows in the same display using the
same number of cans.
(iii) CLASSIFY Can you suggest two other arithmetic sequences for
arranging the cans on the shelf?
(iv) CLASSIFY Explain how you found the sequence.
W2. The first terms of the Fibonacci sequence are given below.
0, 1, 1, 2, 3, 5, 8, 13, 21, … .
(i) Describe in words how the sequence is formed.
Hence write out the next four terms in the sequence.
(ii) Choose any four consecutive Fibonacci numbers. Add the first and last terms
from your selection, then divide by 2. Repeat the process again with four other
consecutive Fibonacci numbers, and then another four.
(iii) CLASSIFY What do you notice in part (ii)?
(iv) CLASSIFY Can you justify your observation mathematically?

298
W3. A ball is thrown upwards from ground level and rises to a height of 15 metres.
Once it reaches this height, it falls and strikes the ground and bounces to 60% of its
previous height. It repeats the process, each time bouncing to 60% of the previous height.
(iv) CLASSIFY Find the total distance travelled by the ball by the time it bounces
for the fifth time. Give your answer to two decimal places.
(v) CLASSIFY Rewrite the question above so that the ball’s height is
INCREASING each time instead of decreasing. What would be the total
height after five bounces in this situation? (Give your answer to two decimal
places)
(vi) CLASSIFY If the ball from part (i) was caught on the third bounce, how high
would the ball have to rise to on the first bounce in order for the total distance
travelled to be 98 metres after three bounces?
W4.
(iv) CLASSIFY You are given the graph of 𝑓′′(𝑥) above, use your knowledge of
derivatives to draw three possible graphs of 𝑓′(𝑥).
(v) CLASSIFY Use your knowledge of derivatives to draw three possible graphs
of f (x).
(vi) CLASSIFY Justify why you have drawn the graphs in this way.

299
W5.
The function ( ) is defined for all .
Graphs of '( ) [the curve] and ''( ) [the line] are shown.
f x x R
f x f x
(i) CLASSIFY Using the diagram above, find the stationary points of f (x)
(ii) CLASSIFY Identify them as maximum or minimum points.
(iii) CLASSIFY Justify your answer.
W6.
(i) Show that1
( ) f x xx
does not have any points of inflection.
(ii) CLASSIFY What can be altered in the given function in order to ensure that
the function has a point or points of inflection?
(iii) CLASSIFY Give an example of another function which does not have any
points of inflection.
(iv) CLASSIFY Examine the following statement: ‘If (𝑥, 𝑓(𝑥)) is a point of
inflection, then 𝑓′′(𝑥) = 0 or 𝑓′′(𝑥) does not exist.’
Write down the converse of this statement. Is it true? Justify your conclusion using a
relevant example showing that points of inflection either exist or do not exist.

300
Questionnaire
Coder ID:
Frameworks
1. Do you feel that the Levels of Cognitive Demand framework is useful to teachers in their
work? Please comment.
2. Did you have any difficulties applying the Levels of Cognitive Demand framework?
Please comment.
3. Do you feel it is important to classify tasks using the Project Maths syllabus framework?
Please comment.
4. Did you have any difficulties applying the Project Maths syllabus framework? Please comment.
Tasks
Please consider the tasks you classified or coded in the final part of the workshop:
5. Was each task clearly described? Please comment.
6. Was it easy to identify the level of cognitive demand of each task? Please comment.
7. Was it easy to identify Project Maths objectives addressed by each task? Please
comment.
8. Do you think these tasks are suitable for use in the classroom? If so, please comment on
how you would use them.
9. Do you think these tasks are suitable for assignment as homework? Please comment.
10. Have you any further comments to make on this set of tasks?

301
Participants were asked to complete the same table as below for each part of each workshop
task.
Coding Form
Coder ID:
Workshop Task
Levels of Cognitive Demand Tick ONE clearly if
present
Higher Level Demand: Doing Mathematics
Higher Level Demand: Procedures with connections to meaning
Lower Level Demand: Procedures without connections to meaning
Lower Level Demand: Memorization
Workshop Task
Project Maths Syllabus Objective Tick as many as you
feel are applicable.
O1 Explore patterns and formulate conjectures
02 Explain findings
O3 Justify conclusions
O4 Communicate mathematics in written form
O5 Apply knowledge and skills to solve problems in familiar/unfamiliar contexts
O6 Analyse information presented in written form and translate it into mathematical form
O7a Devise appropriate mathematical models, formulae or techniques to process information and to draw relevant conclusions.
O7b Select appropriate mathematical models, formulae or techniques to process information and to draw relevant conclusions.
O7c Use appropriate mathematical models, formulae or techniques to process information and to draw relevant conclusions.

302
Guide - DM: Doing Mathematics, HP: Procedures with connections to meaning, LP: Procedures without connections to meaning, LM: Memorization
ID W1 (i) W1 (ii) W2 (iii) W2 (iv) W3 (i) W3 (ii) W3 (iii) W4 (i) W4 (ii) W4 (iii) W5 (i) W5 (ii) W5 (iii) W6 (ii) W6 (iii) W6 (iv)
1 HP HP HP DM LP HP DM HP HP HP HP LP LM HP LM HP
3 DM HP DM DM HP HP DM HP HP HP LP LM HP HP HP DM
4 HP HP LP DM HP HP DM HP HP HP LP LP HP HP LP DM
5 LP HP HP HP LP HP DM HP HP HP LP LP HP HP HP HP
6 HP HP HP HP LP LP HP HP LP HP LP LP HP HP HP HP
7 HP HP HP HP LP LP HP HP LP LP LP LP HP HP HP HP
8 DM HP DM DM HP DM DM HP HP HP LP LP HP DM DM HP
9 HP DM HP DM HP DM DM HP HP DM LP LM DM HP LM DM
10 DM HP HP HP DM DM DM HP HP HP LP HP HP HP HP HP
11 HP HP HP HP HP HP DM HP HP HP LP LP HP DM HP DM
12 HP HP HP DM HP HP DM LP LP HP HP DM DM DM HP DM
13 HP HP HP DM LP LP DM HP DM HP LP LP HP HP LM DM
14 HP HP LP DM LP LP DM HP HP DM HP HP DM HP DM DM
15 DM DM HP DM HP DM DM DM DM DM LP LP DM LP HP DM
16 HP HP HP DM DM HP DM LP HP HP DM LP HP LM DM HP
17 HP DM LP HP LP HP HP HP HP LP LM DM HP HP HP DM
18 HP HP HP HP HP DM DM DM HP DM LP LP HP HP HP DM
19 HP HP HP DM HP HP DM HP HP HP HP HP HP LP LM DM
Table 62: Individual Coder Classifications for LCD framework

303
Table 63: Individual Coder Classifications for PMO – Coders 1 – 5
ID
W1 (i) W1 (ii) W2 (iii) W2 (iv) W3 (i) W3 (ii) W3 (iii) W4 (i) W4 (ii) W4 (iii) W5 (i) W5 (ii) W5 (iii) W6 (ii) W6 (iii) W6 (iv)
1 O1
O4
O5
O6
O7b
O1
O2
O3
O4
O5
O1
O2
O4
O1
O3
O5
O7a
O1
O5
O7c
O1
O5
O7c
O1
O5
O6
O7a
O1
O5
O6
O7b
O1
O5
O6
O7b
O2
O3
O1
O7c
O5
O7c
O5
O7c
O5
O6
O7c
O5 O6
O7c
3 O1
O5
O6
O7a
O2
O5
O2
O5
O5
O6
O7a
O1
O5
O6
O7b
O5
O6
O7b
O5
O6
O7a
O5 O5 O2
O3
O5
O5
O7b
O5 O2
O3
O5 O5 O3
O5
O6
O7b
4 O1
O5
O6
O1
O2
O4
O1
O2
O6
O1
O3
O5
O6
O5
O6
O7a
O4
O5
O6
O7a
O5
O6
O7a
O5
O6
O7b
O5
O6
O7b
O3
O4
O6
O7c
O6
O7c
O3 O5
O6
O7a
O6
O7c
O3
O5
O6
O7a
5 O1
O6
O2
O3
O1
O2
O5
O6
O7a
O6
O7c
O5
O6
O7a
O5
O6
O7a
O7c O5
O7c
O2
O3
O7c O7c O2
O3
O2
O3
O5
O7a O2
O3
O5
O7c

304
Table 64: Individual Coder Classifications for PMO Coders 6 – 8
ID W1 (i) W1 (ii) W2 (iii) W2 (iv) W3 (i) W3 (ii) W3 (iii) W4 (i)
W4
(ii) W4 (iii) W5 (i) W5 (ii) W5 (iii) W6 (ii) W6 (iii) W6 (iv)
6 O1
O5
O6
O7c
O1
O2
O3
O6
O1
O2
O3
O5
O6
O7c
O1
O2
O3
O4
O1
O5
O6
O7b
O1
O6
O7b
O1
O5
O6
O7b
O5
O7c
O5
O7b
O3
O7c
O5
O7b
O3
O5
O3
O5
O3
O5
O3
O5
O3
O5
O7c
7 O1
O5
O6
O7c
O1
O2
O3
O6
O1
O2
O3
O5
O6
O7c
O1
O2
O3
O1
O5
O6
O7a
O1
O6
O1
O5
O6
O7b
O5
O7b
O5
O7b
O5
O6
O7b
O5
O7b
O3
O5
O3
O5
O4
O6
O3
O5
O3
O5
O7c
8 O1 O2
O4
O1
O2
O2
O3
O6
O7a
O1
O6
O7a
O6
O7a
O1
O5
O7b
O5
O7b
O7a O3
O4
O5
O7c
O5
O7c
O2
O3
O5
O5
O7a
O5
O7a
O1
O5
O7a

305
Table 65: Individual Coder Classifications for PMO Coders 9-12
ID
W1 (i) W1 (ii) W2 (iii) W2 (iv) W3 (i) W3 (ii) W3 (iii) W4 (i) W4 (ii) W4 (iii) W5 (i) W5 (ii) W5 (iii) W6 (ii) W6 (iii) W6 (iv)
9 O1
O6
O7c
O2
O4
O1
O4
O6
O7c
O1
O3
O6
O7c
O1
O5
O6
O7b
O1
O4
O5
O6
O7b
O5
O6
O7a
O5
O7b
O5
O7b
O2
O3
O5
O7a
O7b O7b O2
O3
O7b
O5
O7b
O5 O3
O5
O6
O7a
10 O1
O4
O5
O6
O2
O4
O1
O2
O4
O1O
O7a
O1
O5
O6
O7b
O1
O5
O6
O7b
O1
O5
O6
O7a
O5
O7c
O5
O7c
O3
O4
O6
O7c
O4
O7b
O3
O4
O7b
O2
O4
O7c
O2
O5
O2
O3
O4
O7c
11 O1
O5
O6
O7b
O2 O1
O5
O7c
O3 O5
O6
O7c
O5
O6
O7c
O5
O6
O7a
O5
O7b
O5
O7c
O3 O5
O7c
O5 O2 O1
O4
O5
O7c O3
O4
O5
O7a
12 O1
O5
O6
O2
O4
O1 O3
O5
O7a
O1
O6
O7b
O5
O6
O7a
O2
O5
O7a
O5
O6
O7c
O5
O7c
O3
O4
O7b
O5
O6
O7b
O2
O5
O7a
O5
O6
O7a
O1
O4
O5
O7a
O5
O7b
O4
O5
O7a

306
Table 66: Individual Coder Classifications for PMO Coders 13-17
ID W1 (i) W1 (ii) W2 (iii) W2 (iv) W3 (i) W3 (ii) W3 (iii) W4 (i) W4 (ii) W4 (iii) W5 (i) W5 (ii) W5 (iii) W6 (ii) W6 (iii) W6 (iv) 13 O1
O5
O6
O7a
O1
O2
O1
O2
O5
O3
O4
O7a
O5
O6
O7c
O5
O6
O7c
O1
O5
O6
O7a
O5
O7c
O5
O7c
O2
O3
O4
O5
O7c
O5
O7c
O3
O7b
O5
O7c
O4
O5
O1
O2
O3
O4
O5
O7a
14 O1 O5 O6 O7b
O1 O2
O1 O4 O7c
O1 O3 O4 O7a
O1 O6 O7b
O1 O4 O6 O7b
O1 O5 O6 O7c
O7c O7c O2 O4
O5 O7c
O5 O7c
O3 O4 O7b
O5 O7b
O5 O7a
O3 O4 O5 O7a
15 O1 O6 O7a
O1 O2 O4
O1 O4
O2 O3 O4 O6
O1 O6 O7b
O1 O4 O6
O1 O5 O6 O7b
O5 O7b
O5 O7b
O2 O3
O7c O7c O3 O7c O1 O5
O3 O5
16 O1 O6 O7a
O2 O3 O4
O1 O2 O3 O4
O3 O4 O7a
O5 O6 O7a
O1 O5 O6 O7a
O1 O5 O6 O7a
O7c O7a O7c
O2 O3 O4
O5 O7a
O7b O2 O3 O4
O5 O7c
O1 O5 O7a
O2 O3 O5 O6 O7a
17 O1 O6 O7b
O1 O2 O4 O7c
O1 O2 O4 O6 O7c
O1 O3 O7c
O1 O6 O7c
O1 O6 O7c
O1 O5 O6 O7a
O5 O6 O7c
O5 O6 O7c
O2 O3 O4 O5 O7b
O6 O7b
O6 O7c
O2 O3 O4 O7a
O3 O6 O7a
O2 O6 O7a
O2 O5 O6 O7a

307
Table 67: Individual Coder Classifications for PMO Coders 18-19
ID W1 (i)
W1 (ii)
W2 (iii)
W2 (iv)
W3 (i)
W3 (ii)
W3 (iii)
W4 (i)
W4 (ii)
W4 (iii)
W5 (i)
W5 (ii)
W5 (iii)
W6 (ii)
W6 (iii)
W6 (iv)
18 O1 O4 O5 O7a
O2 O6
O1 O1 O2 O4 O5 O6 O7b
O4 O5 O6
O4 O5 O6
O5 O6 O7a
O5 O7a
O5 O2 O3 O4 O6
O6 O5 O6
O5 O7a
O5 O5 O6
O5 O6 O7a
19 O1 O5 O7b
O1 O5 O7c
O3 O4
O2 O3 O6 O7b
O1 O5 O6
O1 O2 O4 O5 O7a
O1 O2 O5 O6 O7a
O1 O5 O6 O7c
O1 O5 O6 O7b
O2 O3 O4 O5
O1 O5 O7b
O1 O5 O7c
O3 O4
O1 O4 O5 O7b
O5 O6 O7c
O1 O3 O4 O5 O6