an analysis of harmonic heating in smart buildings and
TRANSCRIPT

Technological University Dublin Technological University Dublin
ARROW@TU Dublin ARROW@TU Dublin
Articles School of Electrical and Electronic Engineering
2017
An Analysis of Harmonic Heating in Smart Buildings and An Analysis of Harmonic Heating in Smart Buildings and
Distribution Network Implications with Increasing Non-linear Distribution Network Implications with Increasing Non-linear
(Domestic) Load and Embedded Generation (Domestic) Load and Embedded Generation
Chittesth Veni Chandran Technological University Dublin
Keith Sunderland Technological University Dublin, [email protected]
Malabika Basu Technological University Dublin, [email protected]
Follow this and additional works at: https://arrow.tudublin.ie/engscheleart2
Part of the Electrical and Computer Engineering Commons
Recommended Citation Recommended Citation Chandran, C., Sunderland, K. & Basu, M. (2018). An analysis of harmonic heating in smart buildings and distribution network implications with increasing non-linear (domestic) load and embedded generation. Renewable Energy, vol. 126, pg. 524-536. doi:10.1016/j.renene.2018.03.081
This Article is brought to you for free and open access by the School of Electrical and Electronic Engineering at ARROW@TU Dublin. It has been accepted for inclusion in Articles by an authorized administrator of ARROW@TU Dublin. For more information, please contact [email protected], [email protected].
This work is licensed under a Creative Commons Attribution-Noncommercial-Share Alike 4.0 License
1
An analysis of harmonic heating in smart buildings and distribution network
implications with increasing non-linear (domestic) load and embedded generation
Chittesh Veni Chandrana*, Keith Sunderlanda, Malabika Basua
a Dublin Institute of Technology, Ireland
Abstract: Harmonic distortion is generally not taken into account within domestic installations
and the associated wiring systems, as its potential is considered sufficiently small to be neglected.
Standards to limit harmonic manifestations in the low voltage (LV) network are available, but
these can be breached as a consequence of advancements in power electronics in some modern
household devices contributing higher levels of harmonic distortion than permitted.While these
devices individually might not be considered serious in terms of system level harmonic distortion
manifestations, electrical equipment failures and insulation failures - increasingly being derived
from harmonic cable heating - suggest a different story. A 10% increase in THD in a circuit will
result in an increase of 10% in cable heat. Recently, attempts have been made to offer harmonic
derating factors for building electrical circuit design in BS7671, but this approach currently
prioritizes large power devices. This article explores the need for harmonic considerations during
the design stage of electrical services engineering projects. Best practice suggestions, in the context
of the dissemination of heat caused by harmonics related to household load
deployments/configurations, are also provided based on the analysis conducted with real
household data. This is further extended to a practical distribution network where the effect of
harmonic heating at the network level is explored. The results suggest that the harmonics in the
distribution network can amass to cause a cumulative effect on the network. Furthermore, it can
be observed from the results that in a distribution network containing (domestic) solar photo
voltaic (PV) systems, the harmonic heating issue can be reduced. This benefit is not without
consequence however, as increasing PV penetration does not reduce the harmonic content of the
overall system and therefore presents a further concern that may need to be addressed in due time.
Keywords:
Harmonic Distortion (THD), Distribution network analysis; Photovoltaic systems; Non-linear
load; Harmonic load flow; Cable heating;
Corresponding author. Dr. Keith Sunderland
e-mail address: [email protected]

2
Nomenclature
THD – Total harmonic distortion
𝑇𝐻𝐷𝑖/𝑣 – Total harmonic distortion of current or voltage
𝐼, 𝑖 – RMS current
𝐼1 – Fundamental current
𝐼𝑛 – Harmonic current (n=2,3,4,…)
𝑅𝐴𝐶 , 𝑟𝐴𝐶 – AC resistance
𝑅𝐷𝐶 , 𝑟𝐷𝐶 – DC resistance
𝜎 – Conductivity
𝑃𝐿 – Power loss
𝑃𝐿_𝑛𝑜𝑟𝑚𝑎𝑙 – Normal power loss (loss with out considering harmonics)
Introduction
The distribution network maintenance of standard operating voltage and current profiles is
addressed as a power quality (PQ) problem that is complicated by the variation of load type
connections and the associated demand intermittencies. The PQ problem is further exasperated
with the introduction of smart devices or smart loads in the distribution network most of which
being non-linear in nature. In this regard, the presence of harmonics in the electrical network may
be the cause of increased losses within transformers, overloading in neutral conductors,
disturbances in the torque of motors, etc. [1]. A detailed review on harmonics in the distribution
network, modelling of harmonic load and harmonic mitigation in the context of increased
penetration is discussed in [2]. “Smart distribution-grids” or distribution networks with smart
devices claim the potential to improve the performance of the electric power system, as well as
offering the same performance as existing technologies, but in a more cost-effective way.
However, these smart devices also require a proper harmonics mitigation technology, otherwise
these also have some adverse consequences on PQ [3]. To add further to the problem, the inclusion
of distributed energy resources, which employ power electronic converters/inverters, are also
affecting power quality in the system [4]. The interaction between distributed generators and
electrical vehicles with the grid is discussed by Gil-de-Castro, Rönnberg and Bollen [5]. Their
work suggests that the harmonics from individual domestic devices can flow to the grid and can
cause an impact on other grid-connected devices. However, that study was limited to the harmonic
interactions between grid connected devices and domestic devices and did not consider the
interaction between individual appliances in the (domestic) household environment. The
interactions between grid connected devices at harmonic frequencies can also introduce a
harmonic resonance mode in the system [1]. Inverters associated with distributed generation (DG),
are becoming one of the major sources of non-linearity in a building environment. Furthermore,
inaccurate filter design could also lead to voltage distortion which can severely affect the consumer

3
appliances. A harmonic resistance damping method was developed by Munir, Li and Tian to
dampen the DG inverter harmonics in this regard [6]. The harmonic environment across the
distribution network will severely affect the synchronization algorithm in the grid connected
inverters as discussed in [7], where the authors propose an improved algorithm for synchronising
under such conditions. The harmonic impact of a residential PV system using recorded data is
presented in [8] where the non-linear loads are also considered in the analysis. The harmonic
voltage profile is considered here as the manifestation of the harmonic distortion occurring in the
network. The results indicate a considerable distortion of voltage at the point of common coupling
(PCC) under various PV penetration scenarios. However, the effect of current distortion was not
afforded a similar focus in the analysis. The combined effects of solar PVs and plugged in electric
vehicles (PEVs) on the feeder and transformer loads and how they affect the network voltage
profiles and derive harmonic distortions in an urban area distribution system, are investigated in
[9]. The authors present changes in the characteristic daily load and voltage profiles as well as
changes in the total harmonic distortion of the system voltage (THDv) caused by the simultaneous
operation of PVs and PEVs. Furthermore, the results suggest that an optimised engagement ratio
(PV/PEV) can impact load reduction and produce a reduction in voltage variations, while
potentially resulting in an increase THDv. This is also evident in the analyses presented later in
this paper.
Harmonic heating effects are examined by Palmer et al. [10] where pipe type cable modelling is
employed through finite element analysis that utilizes the Nehar McGrath harmonic heating model.
Cable heating effects in the presence of harmonic distortion are analysed and experimentally
verified by Blackledge et al. [11]. The authors briefly explain a cable heat transfer method and
also discuss the harmonic rating factor introduced in BS 7671 [12]: the national standard in the
United Kingdom for electrical installations. The paper also contains a comprehensive discussion
about the harmonic heating effect caused by harmonics in a building. In [13], the authors
considered the losses in audio visual devices. The paper utilized time of use survey data concerning
the audio-visual device to quantify the amount of power that can be saved. It was observed that
THD reduction (by a factor of 10) could reduce the energy loss significantly and inculcate a saving
of seven million of euros. Basically, the ampacity of power cables is limited or determined by the
maximum operating temperature within which the insulation can maintain its optimal
performance. For example, the cables constructed with a cross-linked polyethylene (XLPE)
dielectric are typically restricted to a maximum temperature of 90°C [14]. An increase in
temperature will lead to faster deterioration of the conductor and significantly lowers the operating
life. Harmonics cause increased heating of the conductor while the current carried may be less than
the rated current.
Currently, (ET 101:2008, the Irish electrical installation standard) for installations <1kV) [15]
recommends a neutral overcurrent relay connection to protect against excessive harmonics in a 3
phase system. Such a relay facilitates automatic disconnection when excess current contributed by
harmonics is detected in the neutral. However, this method only accounts for triple-n harmonics
and does not sufficiently address the other orders of harmonics that can arise in such environments.
But again, THD cannot solely be considered as the measure of harmonic content in the system.
Instead, for power efficient operation, device manufactures obligations to follow strict regulations
to limit actual harmonic content of their equipment should be prioritised.
The contribution to the wider discussion presented in this paper lies in an efficient extrapolation
of harmonic heating analysis from the building environment to the distribution network
environment where the heating effect of harmonic current is currently overlooked. The analysis

4
will suggest to distribution network operators (DNOs) that caution is required if sustained
increases in non-linear load penetration are to be facilitated without means of active mitigation as
they may adversely limit the maximum operating capability of the network. This issue could be
further exasperated with the influence of embedded generation such as domestically connected
solar PV and this paper will present analysis in this regard.
The work also intends to offer a guide for consumer awareness and safe/best operating practices
to safeguard their home and equipment against the destructive impact of harmonics. The authors
contend that there is insufficient literature available in published materials pointing to the harmonic
heating characteristics in electrical networks and almost none in distribution network. In this
regard, the studies presented here will assist as a reference for researchers and operation and
planning engineers.
In summary, the objective of this paper is
To conduct harmonic heating analysis in a building energy circuit.
To extrapolate the harmonic heating analysis to a network model from the Building energy
system analysis methodology
To provide DNOs a simple and straight forward analysis and interpretation methodology
to perform harmonic analysis
To provide DNOs an insight to the magnitude of harmonics and its possible adverse effect
in a distribution network.
To visualise the change in harmonic propagation with solar PV integration.
To provide recommendations to consumers to reduce the impact of nonlinear loads to the
building energy system based on the analysis and result.
The paper is sectioned in to 4 parts, where section 2 discusses the load modelling and network
modelling. The subsequent section discuss harmonic power flow and methodology of the paper.
The results and conclusion follows later in section 4.

5
Load and Network Modelling
A typical residential environment contains a variety of electrical equipment, most of which can be
classified as non-linear load. The proliferation of non-linear load in the residential sector is due to
the application of electronic switching devices commonly known as switch mode power supplies
contained within power supplies. The first step in performing harmonic analysis is to obtain the
magnitude of current consumed by these non-linear harmonic loads in the domestic household.
Various literatures discuss the PQ issues of the energy efficient harmonic loads but the
performance during the operating conditions of said load is often neglected. Furthermore, the PQ
studies for the most common and often highest power consuming appliances such as washing
machines and vacuum cleaners are not widely conducted. During the power quality analysis of the
energy efficient appliances of a building, it is often found that some of the harmonic loads change
their active and reactive power consumption or harmonic current injection characteristics
depending on their operating mode from the pre-specified values. Non-linear devices such smart
multi-media devices, desktop PCs, laptops, etc. are representative of the most typical single phase
converter based loads, with similar current and voltage characteristics.
Modelling of these nonlinear loads is achievable in any simulation platform such as MATLABTM.
For instance, non-linear load design based on single phase diode-bridge converter using a Norton
equivalent circuit are considered in [13]. These models are developed for single phase loads, and
performance has been tested with single load representations only. Mazin et al. [16] describe the
harmonic contribution of residential loads by studying the characteristics of load side and source
side harmonic impedances. It is also common knowledge that in residential buildings individual
loads always consume reactive current and consume harmonic currents at the same phase angle
with respect to its supply voltage in the same operating condition. Therefore Salles et al. [17], in
this regard, suggest that typical spectra can be used to model a harmonic-producing load. In this
paper, the linear and non-linear harmonic load models have been developed by controlled current
sources in Simulink power system (SPS), based on available harmonic information (% of THD,
harmonic current spectrum and phase angle) domestic load data. A Simulink-developed load
model was subsequently verified with experimentally collected data based on measurements from
more than 200 harmonic producing appliances in a residential building where the variation of
voltage THD is found to be in range of 1.2 to 1.7% [18]. In most readings considered, the
magnitude of the harmonic current order above 21st order is found to be less than 5% of the
fundamental. The measurements were performed using an instrument power quality analyser
C.A.8230 Ampflex, from Chauvin Arnoux [19]. General household equipments/devices are
considered. In Ireland, the use of electricity in the home accounts for approximately one third of
the total electricity produced [20]. Table 1 illustrates a sample of (measured) power ratings
associated with common appliances found in Irish homes [21]. A Simulink model of the appliances
is utilized to develop harmonic profiles that are employed in the network analyses.

6
Table 1: Power consumption capacity of the electrical appliances of a building in Dublin
Table 1:Harmonic Devices different combinations and their resultant THD percentage
Electrical Appliances Active
Power (P) Reactive
Power (Q) Harmonic
Power (H) Apparent
Power (S)
(W) (VAR) (VAR) (VA) Non Linear Harmonic Load
Static
Compact Fluorescent
Lamp (CFL) 14 5.5 19 25
Microwave oven 1250 220 300 1304
Refrigerator 110 120 15 163
Smart TV (26") 55 16 78 97
Dynamic Washing Machine 600 - 1930 410 200 1983
Vacuum Cleaner 335 - 1100 100 – 500 170 - 510 730 -1120
Laptop 85 38 190 212 Linear Load
Static Heater (bedroom) 2000 0 0 0
Electric Cooker (Oven) 1200 0 0 0
The network, illustrated in Figure 1, is modelled using OpenDSS (Open Source Distribution
System Simulator) software, which has harmonic analysis capability. This urban distribution
network is representative of an actual suburban low voltage distribution network in Dublin city,
Ireland and contains a supply transformer and a radial distribution system. The network contains
nine 3 phase radial distribution lines delivering power to 74 household loads through the associated
distribution lines. The rating of the loads vary depending on the dwelling size, demographic and
number of occupants. The network lines are modelled as overhead lines and the sub-feeders cables
are 120 mm2 and 70mm2, with copper and/or aluminium conductors and cross-linked polyethylene
(XLPE) and/or polyvinyl chloride (PVC) insulation material. The consumer distribution
conductors are 25mm2 concentric neutral cable. The network configuration model is consistent
with that presented in [22]. The OpenDSS network model incorporates the harmonic profile for
the individual loads as defined using the recorded data and simulation. The loads are modelled as
the lumped constant PQ load i.e. constant active and reactive power consumption and represented
by current injection model to incorporate harmonics [13]. Random distribution of solar PV is
considered across the network with the individual PV power ratings of 5.25kW. That is the
maximum power that can be delivered by a single solar PV system is 5.25Kw. The domestic loads
and PV generators utilised in the network harmonic analyses are based on the allocations employed
in [23]. The network model utilized is modelled in OpenDSS using [22] and the hosting capacity
of the network and the PV connection position/location is based on [23]. The network model is a
section of urban distribution feeder from Dublin. It has 9 section connecting 10 nodes (mini pillars)
of distribution 3 phase feeders starting from the distribution transformer (10/0.4kV) and denoted
in red and blue colour as AB,BC, CD and so on. It consist of 74 households (numbered 1 to 74)
supplied by these 10 mini-pillar connections. Each household is connected by single phase supply
provided by the closest mini pillar. Further detailed modelling aspect of the network is discussed

7
in reference [22]. The same network and parameters are utilized by authors in [23] and has
performed hosting capacity analysis with solar PV system in the network. The connected node and
rating of solar PV, and maximum hosting capacity is adopted from this paper. The hosting capacity
is defined as the ratio of total amount of PV power generated in the network to the KVA rating of
transformer connected to the feeder. In this analysis it is 36.9%. The structure of network and the
location of PV modules are given in Figure 1.
n Node (customer) identifier
Load profile (scaled peak demand)
25/16sq, (Concentric Neutral) L3
25/16sq, (Concentric Neutral) L2
25/16sq, (Concentric Neutral) L1
4xcore 185sq, XLPE
4xcore 70sq, XLPE
4xcore 70sq, Al
0-1 1-2 2-3 3-4 4-5 5-6 6-7 7-8
Consumer (peak) load range [kW]
-
-
-
DpvG installation
Figure 1 Urban Distribution Network model [22] incorporating the domestic load/PV
profiles in [23].
Harmonic Power flow Analysis
The OpenDSS simulation software was utilized to perform power flow and harmonic power flow
on the network model developed in the previous section. The software is especially applicable for
distribution network analysis (with high R/X ratios) and has a well modelled simulation engine for
the harmonic power flow [24]. The harmonic power flow is performed for the specified number of
harmonic orders which in this case was up to 29. The harmonic order is referring to the integer
multiple of fundamental frequency, that is, 2,3,4,5…n (n is the harmonic order). Usually even
order harmonics are ignored as the electrical quantities exhibits half wave symmetry. The higher
order harmonics are also ignored as their magnitude are negligible and their associated effects are
significantly low when compared to the lower order harmonics. The results of harmonic power
flow will depend on the harmonic phase angle as harmonic cancellation is incurred [25]. However,
8
for the presented analysis the extreme operation limit is considered and the harmonic phase angles
are ignored so that the power flow depends only on the individual harmonic components.
The PV system considered in the analysis is obtained from Electric Power Research Institute
(EPRI) technical update [26] which deals with the stochastic analysis for finding PV hosting
capacity in the distribution network. The harmonic distortion in the PV module is abiding to the
IEEE 519 standards and the power factor at the front end of the inverter is set to 0.95. The data
from [26] is used to specify the harmonic spectrum of PV module modelled in the OpenDSS.
Linear scaling is also applied here to match the power rating of the module employed.
Network Load and Harmonic Scaling
The individual load model of the network is created from the average load consumption data
obtained. The harmonic profile was however extrapolated and scaled from the household harmonic
model simulated in the first part of this work. The scaling factor was linear, which was a reasonable
assumption as individual house THD was assumed to be same to have a consistent and comparable
result. This is also due to the additive nature of harmonic current[27]. The mathematical
justification of linear scaling is presented below.
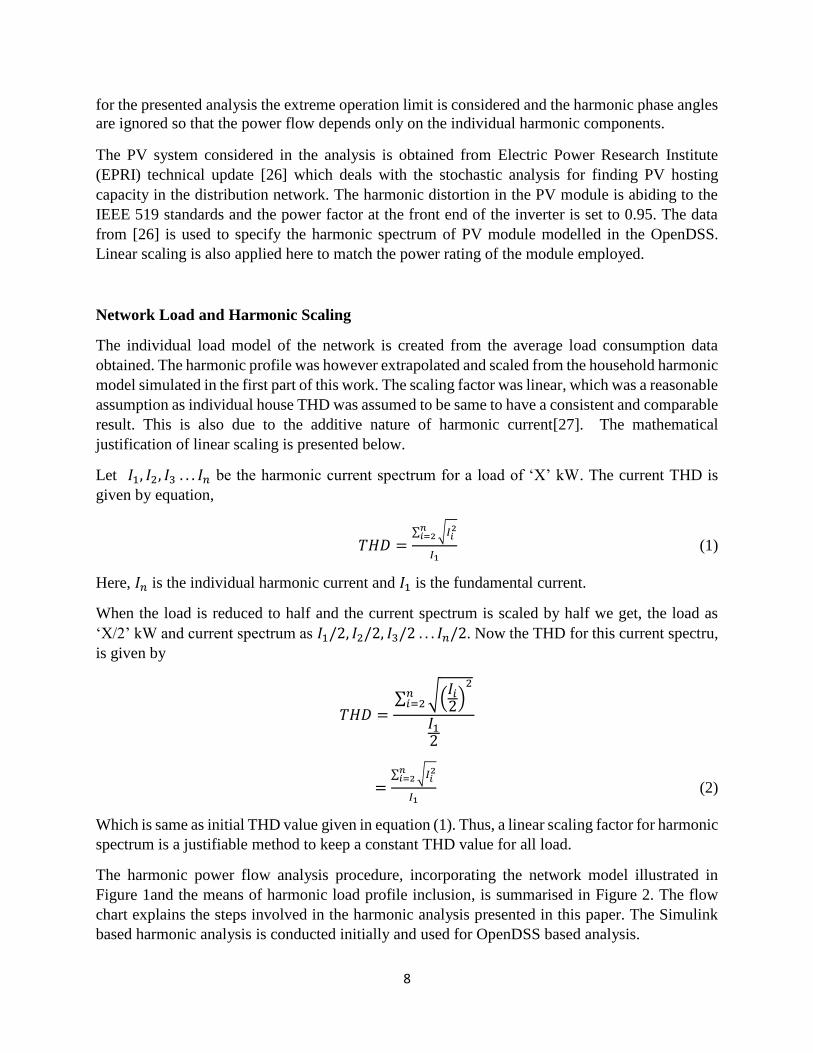
Let 𝐼1, 𝐼2, 𝐼3 . . . 𝐼𝑛 be the harmonic current spectrum for a load of ‘X’ kW. The current THD is
given by equation,
𝑇𝐻𝐷 =∑ √𝐼𝑖
2𝑛𝑖=2
𝐼1 (1)
Here, 𝐼𝑛 is the individual harmonic current and 𝐼1 is the fundamental current.
When the load is reduced to half and the current spectrum is scaled by half we get, the load as
‘X/2’ kW and current spectrum as 𝐼1/2, 𝐼2/2, 𝐼3/2 . . . 𝐼𝑛/2. Now the THD for this current spectru,
is given by
𝑇𝐻𝐷 =∑ √(
𝐼𝑖
2)2
𝑛𝑖=2
𝐼1
2
=∑ √𝐼𝑖
2𝑛𝑖=2
𝐼1 (2)
Which is same as initial THD value given in equation (1). Thus, a linear scaling factor for harmonic
spectrum is a justifiable method to keep a constant THD value for all load.
The harmonic power flow analysis procedure, incorporating the network model illustrated in
Figure 1and the means of harmonic load profile inclusion, is summarised in Figure 2. The flow
chart explains the steps involved in the harmonic analysis presented in this paper. The Simulink
based harmonic analysis is conducted initially and used for OpenDSS based analysis.

9
Figure 2 Flow chart of Harmonic Analysis Conducted
Harmonics and Loss(es) due to harmonic manifested heat in Household system
The analysis is conducted in two parts. In the first part, the focus is on the household network and
analysis of the thermal heating effect of harmonics. In the second part, the focus is on the
propagation of harmonics and harmonic heating on the network cables in a distribution network
which encompasses houses similar to the one in the first section. An additional objective of this
consideration is to introduce the effect of distributed (domestic) PV generation.
In order to analyse the effect of harmonics in a building energy systems (BES), simple methods
are utilised to represent the harmonic heating. The BES implies to all the circuit in the building
environment, which is a household environment referring to this paper. In any conductor when
sinusoidal currents are introduced the geometry associated with the conductors introduces a
complex electromagnetics problem. The sinusoidal varying magnetic flux induces a time varying
magnetic flux density which induces eddy currents and as a consequence of the skin effect, higher
losses relatively, in comparison to a DC context, are created. The ratio of AC to DC resistance is
the parameter that varies for each harmonic frequency. The inductive element of the cable is not
considered here as the associated value is sufficiently small and it does not cause an active power
loss contribution to heat. However, the same is not true if the voltage waveform is considered, but
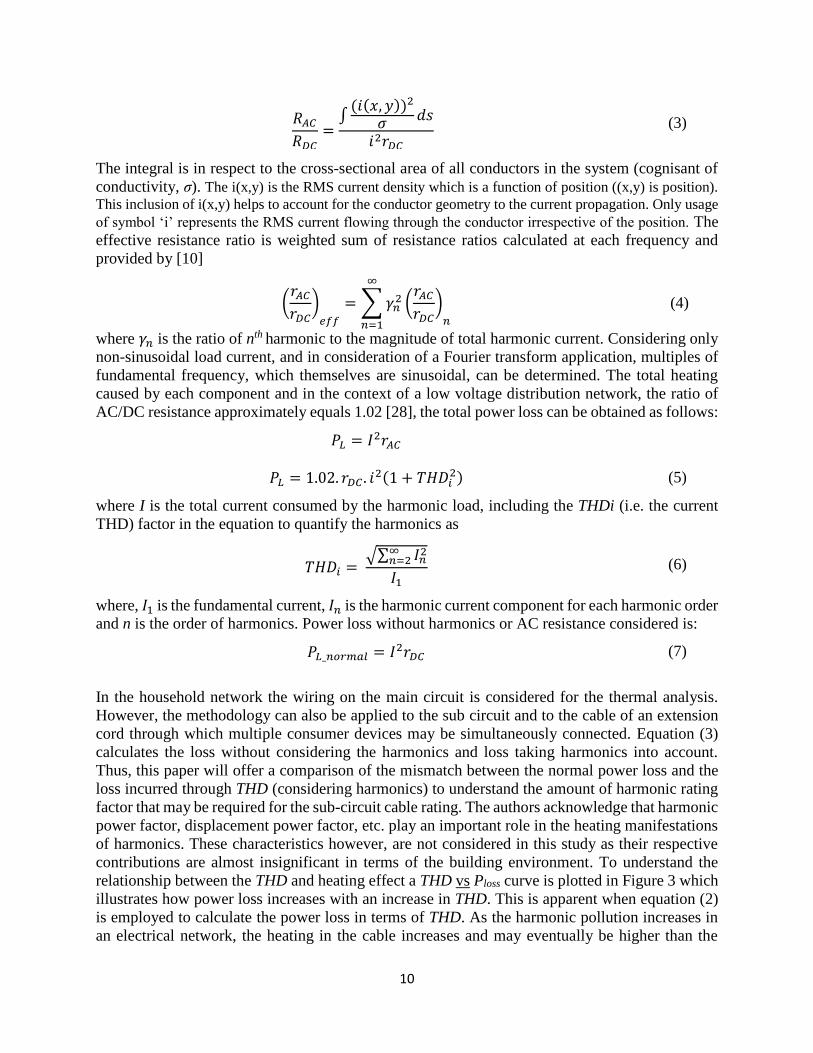
this does not feature in this study. The ratio of AC to DC resistance is described generally in (3),
10
𝑅𝐴𝐶
𝑅𝐷𝐶=
∫(𝑖(𝑥, 𝑦))2
𝜎 𝑑𝑠
𝑖2𝑟𝐷𝐶 (3)
The integral is in respect to the cross-sectional area of all conductors in the system (cognisant of
conductivity, σ). The i(x,y) is the RMS current density which is a function of position ((x,y) is position).
This inclusion of i(x,y) helps to account for the conductor geometry to the current propagation. Only usage
of symbol ‘i’ represents the RMS current flowing through the conductor irrespective of the position. The
effective resistance ratio is weighted sum of resistance ratios calculated at each frequency and
provided by [10]
(𝑟𝐴𝐶
𝑟𝐷𝐶)
𝑒𝑓𝑓
= ∑ 𝛾𝑛2 (
𝑟𝐴𝐶
𝑟𝐷𝐶)
𝑛
∞
𝑛=1
(4)
where 𝛾𝑛 is the ratio of nth harmonic to the magnitude of total harmonic current. Considering only
non-sinusoidal load current, and in consideration of a Fourier transform application, multiples of
fundamental frequency, which themselves are sinusoidal, can be determined. The total heating
caused by each component and in the context of a low voltage distribution network, the ratio of
AC/DC resistance approximately equals 1.02 [28], the total power loss can be obtained as follows:
𝑃𝐿 = 𝐼2𝑟𝐴𝐶
𝑃𝐿 = 1.02. 𝑟𝐷𝐶 . 𝑖2(1 + 𝑇𝐻𝐷𝑖2) (5)
where I is the total current consumed by the harmonic load, including the THDi (i.e. the current
THD) factor in the equation to quantify the harmonics as
𝑇𝐻𝐷𝑖 = √∑ 𝐼𝑛
2∞𝑛=2
𝐼1 (6)
where, 𝐼1 is the fundamental current, 𝐼𝑛 is the harmonic current component for each harmonic order
and n is the order of harmonics. Power loss without harmonics or AC resistance considered is:
𝑃𝐿_𝑛𝑜𝑟𝑚𝑎𝑙 = 𝐼2𝑟𝐷𝐶 (7)
In the household network the wiring on the main circuit is considered for the thermal analysis.
However, the methodology can also be applied to the sub circuit and to the cable of an extension
cord through which multiple consumer devices may be simultaneously connected. Equation (3)
calculates the loss without considering the harmonics and loss taking harmonics into account.
Thus, this paper will offer a comparison of the mismatch between the normal power loss and the
loss incurred through THD (considering harmonics) to understand the amount of harmonic rating
factor that may be required for the sub-circuit cable rating. The authors acknowledge that harmonic
power factor, displacement power factor, etc. play an important role in the heating manifestations
of harmonics. These characteristics however, are not considered in this study as their respective
contributions are almost insignificant in terms of the building environment. To understand the
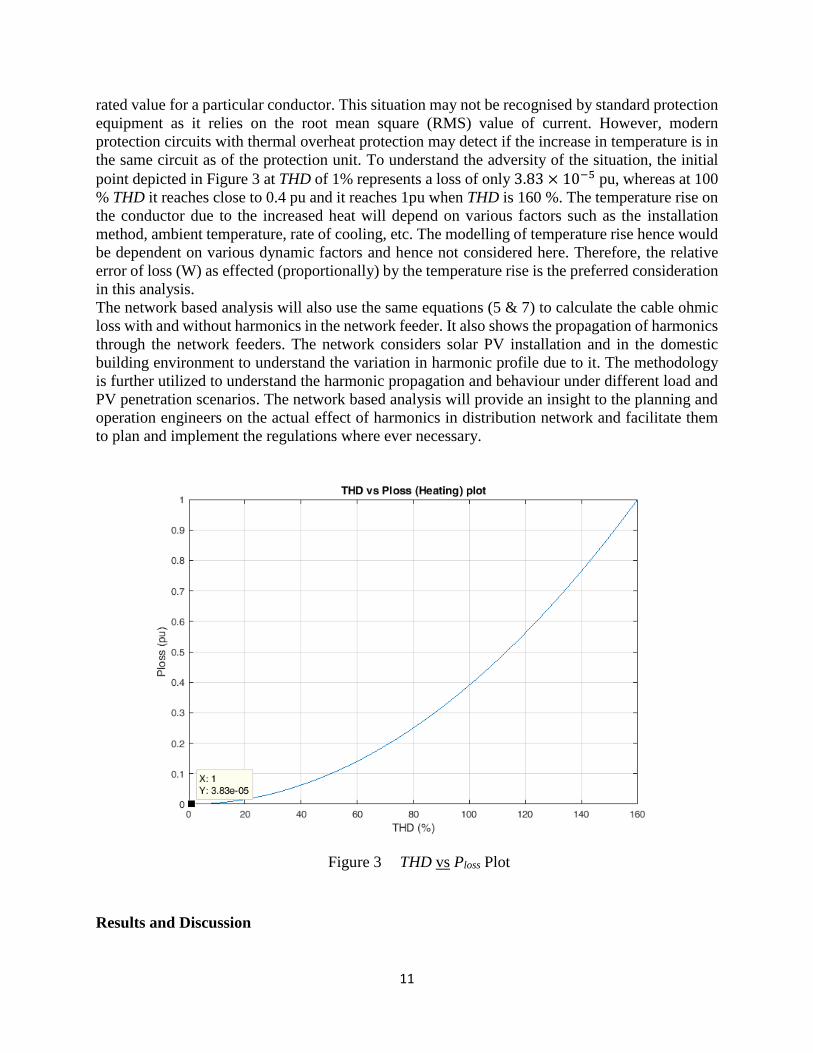
relationship between the THD and heating effect a THD vs Ploss curve is plotted in Figure 3 which
illustrates how power loss increases with an increase in THD. This is apparent when equation (2)
is employed to calculate the power loss in terms of THD. As the harmonic pollution increases in
an electrical network, the heating in the cable increases and may eventually be higher than the
11
rated value for a particular conductor. This situation may not be recognised by standard protection
equipment as it relies on the root mean square (RMS) value of current. However, modern
protection circuits with thermal overheat protection may detect if the increase in temperature is in
the same circuit as of the protection unit. To understand the adversity of the situation, the initial
point depicted in Figure 3 at THD of 1% represents a loss of only 3.83 × 10⁻⁵ pu, whereas at 100
% THD it reaches close to 0.4 pu and it reaches 1pu when THD is 160 %. The temperature rise on
the conductor due to the increased heat will depend on various factors such as the installation
method, ambient temperature, rate of cooling, etc. The modelling of temperature rise hence would
be dependent on various dynamic factors and hence not considered here. Therefore, the relative
error of loss (W) as effected (proportionally) by the temperature rise is the preferred consideration
in this analysis.
The network based analysis will also use the same equations (5 & 7) to calculate the cable ohmic
loss with and without harmonics in the network feeder. It also shows the propagation of harmonics
through the network feeders. The network considers solar PV installation and in the domestic
building environment to understand the variation in harmonic profile due to it. The methodology
is further utilized to understand the harmonic propagation and behaviour under different load and
PV penetration scenarios. The network based analysis will provide an insight to the planning and
operation engineers on the actual effect of harmonics in distribution network and facilitate them
to plan and implement the regulations where ever necessary.
Figure 3 THD vs Ploss Plot
Results and Discussion

12
The results of the analysis are presented in two parts. The harmonic heating in a household circuit
is initially considered and thereafter extrapolated for a distribution network analysis; as presented
in Figure 1.
To analyse the combined effect of the harmonic loads (devices), a household network wiring is
considered which is in accordance with the British wiring standards, BS7671 (IEE/BSI. 2008),
Power is distributed through radial circuits, with varying current carrying capacities (Iz). In a
domestic context, lighting circuits are facilitated through a 1.5 mm2 (Iz = 6A capacity) wiring
system with general services (socket) circuits are facilitated through a 2.5 mm2 wiring system (Iz
= 20A capacity). The daily power consumption of lighting/general service load may vary
depending on various factors. In this study, the power quality analysis of the appliances during
their operation mode is considered and hence does not relay on the manufacture pre-specified
values of power quality.
The worst case harmonic scenarios in a domestic environment occur when multiple
harmonic loads are connected to a single sub circuit as the harmonics are generally cumulative in
nature. Hence to understand this environment, various probable combinations of harmonic loads
are combined together to form different case studies. A total of six harmonic loads were considered
along with two linear heating loads forming 255 combinations the details of these loads are given
in Table 1. Exemplar cases are provided in Table 2 with their corresponding current THD
calculated. While the harmonics are generally cumulative, in some cases, they tend to cancel out
depending upon the harmonic phase angle and hence in the practical consideration the THD may
reduce with certain combinations. But as discussed before the current study focuses on worst
possible scenarios of harmonics, the harmonic phase angles are ignored and harmonic cancellation
is not expected. Hence, to understand the worst possible scenario in a domestic environment, five
combinations that accumulated the highest losses are considered and presented in Table 2 and
Figure 4. In this regard, the exemplar scenarios are analysed for the harmonic power loss and then
compared with standard power loss calculated by the RMS value of current. It is evident that the
actual power loss occurring in the conductor is much more than the loss during the normal
operating condition. To put it in perspective, a 2.5 mm2 cable, with maximum rated current
carrying capacity, the loss is 3.8 W/unit length but in case 2 the loss is close to 5 W/unit length
even when the RMS current is much less than the rated current. This therefore implies, that
relatively speaking, a circuit operating at near to its rated current would incur enhanced
deterioration in the cable, which could eventually lead to cable failure or in the worst case a fire
incident.

13
Table 2: Harmonic Devices different combinations
and their resultant THD percentage
Ligh
t
Mic
row
ave
Ove
n
Frid
ge
Vac
uu
m
Cle
ane
r
Was
hin
g
Mac
hin
e
Lap
top
Cu
rre
nt
THD
(%
)
Ratings (in
Watt) 40 1350 160 1400 1200 250
CASE 1 ON ON OFF OFF ON ON 44.64
CASE 2 ON ON ON OFF ON ON 42.12
CASE 3 ON ON ON OFF ON OFF 41.31
CASE 4 OFF ON ON OFF ON ON 40.73
CASE 5 OFF ON ON OFF ON OFF 39.74
Figure 4 Loss with and without
Harmonic consideration
It is normal practice in the domestic environment for consumers to employ extension cords
to connect multiple devices and may not have such type of thermal protection locally. Such
possibilities in the domestic environment are the primary motivation for this study with consumer
awareness and best practice awareness in respect to harmonic loads as the goal.
Figure 5 illustrates that in consideration of the harmonic profile associated with compact
fluorescent lamp (CFL) (Case A) and CFL with resistive load (Case B), that the THD is not always
the optimal measure of harmonic content in the system, or to even understand the harmonic
pollution in a system. Since the THD is a ratio of fundamental to the vector sum of harmonics,
when a purely resistive load like a heater is connected to a circuit containing harmonic load, the
THD may appear to be lower; even though the harmonic profile does not change. Hence the
harmonic pollution will be still observed in the system, which is evident from the harmonic spectra
illustrated in Case A and Case B of Figure 5. This scenario could be intolerable for many sensitive
consumer equipment and could eventually lead to premature failure of such devices. This is
because, sensitive consumer equipment containing electronic circuitry could form a lower
impedance in the context of certain harmonic frequencies. Reliability studies such as mean time
failure (MTF) studies need to be conducted to completely understand and quantify the direct effect
of harmonics in the context of consumer equipment. Such study is not considered in the scope of
this paper.

14
Figure 5 Harmonic spectrum of different cases considered
Solar PV penetration is increasing in a distribution network throughout the world. A grid connected
solar PV system has an inverter at its front end that employs power electronic switches. Even
though filters are employed at the connection point, the output power still contains harmonics and
contributes to the associated non-linearity to the grid. Since the solar PV’s are usually connected
in conjunction to a building network, a harmonic analysis without considering PV would never do
justices to the motive of this work. To understand the effect of non-linearity imposed by a grid
connected solar PV, the household network consisting of harmonic load, facilitated by an
independent PV source and the voltage THDv is measured. Generally a stiff source such as the
electrical grid, which may still provide a close to the sinusoidal voltage input even with significant
harmonic pollution from a building energy system is found in the distribution network and was
used to conduct the previous analysis. However, with a source like solar PV generator or a battery
storage system, the situation is entirely different. The source voltage may not be exactly sinusoidal
with the harmonics present and even with filters installed in the inverter system. This will further
lead to distortion in the power quality and adversely impact on equipment operation in a building.
With impure power, the performance and expected life time of equipment is further affected.
Figure 6 illustrates a voltage waveform without a stiff source where the harmonic pollution causing
voltage distortion is clearly visible. The voltage THD (THDv) is approximately 12.74 percent in
Figure 6. However, the regulation states of 8% [29] harmonic voltage connected to the electrical
system depending on the power rating. Even though, the model was made in accordance with
regulations, the increase in THDv is due to high demand of harmonic current and hence the source
voltage gets distorted to provide it. Practically, it is highly unlikely to operate all loads in the
household simultaneously and hence the THDv value would still be close to/less than the
regulation(s) specified. That said however, a 2 % increase in the context of a high power

15
consuming piece of equipment (PV/EV) would itself represent a high value when compared to low
power consuming equipment and could lead to consumer equipment damage. Furthermore, in the
context of power loss in cables with non-linear loads connected to distorted voltage, the losses
incurable due to harmonics will increase in this regard.
Figure 6 (A) Voltage waveform distortion due to harmonics with an isolated source and its
(B) harmonic spectrum
Now, with the same methodology is applied on the distribution network. The total load on the
distribution network is 196.9 kW from 74 individual household load distributed in at different
section of network as given in figure 1. In the first scenario harmonic power flow analysis is
conducted without any PV and linearly scaled harmonic profile from the previous analysis to
match the power of individual loads. All loads in the network are assumed to be operating at a
power factor of 0.9 which is reasonable owing to the low nature of inductive load in the domestic
environment. The resistance of XLPE cable is taken as 0.2613 x 10⁻³Ohm/m. The values for
individual harmonic current component is obtained for each node represented A, B, C etc. in Figure

16
1. The section numbering in the proceeding figures is consistently labelled with Figure 1. The
harmonic heating on each phase conductor is calculated along with the heating caused due to the
RMS component of the (phase) current and the error is depicted in the loss deviation plot in Figure
7. In this figure (7), the heating caused due to normal heating is illustrated via the data points
connected by the trace line. The additional loss (per section) caused due to harmonics is
subsequently illustrated in each data point for each section of the network. The normal heating loss
is calculated by equation (7) and heating loss with harmonics by equation (5). The heating loss in
all the figures is provided in watt per meter. The first observation from Figure 7 is that harmonic
heating is much more in line 2 (L2) which is the result of high loading in L2 and a high THD in
L2 as shown in Figure 8. Furthermore, it can be observed that the harmonic heating increases as it
moves from last section to first due to cumulative effect of harmonic propagation at the main
feeder. The difference in error at certain sections is almost twice the RMS heat calculated which
forms the strong evidence to the proposed problem of major effect of harmonic heating on
conductors. The load on line 3 (L3) is considerably lower and hence the difference in harmonic
heating is much less, which leads to the conclusion that the harmonic heating issue not only
depends on the harmonic content in the system but is also a major threat when the system is
operating around its maximum loading limits. Interestingly, distribution systems seldom operate
at maximum loading limits and hence the effects may not be obvious. However, power system
engineers are increasingly being challenged to push system loading to higher levels day by day
and hence the effects may soon become readily visible in the system.

17
Figure 7 : Loss deviation plot for harmonic heating in individual phase without solar PV
Figure 8 THD in each phase for every section without PV
The second part of analysis presented in this work considers the inclusion of solar PV generators.
In this regard, the distribution network model supports a hosting capacity of 36.7%, where the
contribution by PV to the total load is 184.5kW. This is in accordance with the work presented in
[23] where the authors suggest the 36.7 % as an optimal hosting capacity for the network if network
control mechanisms are to be avoided. With this scenario 98% of the total load connected to the
network is supplied by solar PV. PV systems are arbitrarily placed throughout the network in such
a way that the nodal voltage will not raise above the regulations (1.10 pu). Now, harmonic power
flow is executed and harmonic heating calculations are conducted. Consideration of Figure 9
suggests that the heat produced in the individual sections of main feeder has reduced considerably
owing to the fact that, at each node the majority of load is supplied by the local PV and hence the
power transmitted through the main feeder is very small. However, it is apparent that while
sufficiently smaller in magnitude, the associated loss deviation plot shows a considerable loss ratio
when the loss due to harmonics are compared to the normal (RMS) heating loss. These facts
conclude that, even though the PV is a harmonic source it helps to reduce the heating by reducing
the line loading and in effect reduces the harmonic heating as well. Figure 10 however, shows
significant THD values and especially at node 7. This occurs as the PV supplies on the fundamental
component of loads and hence all harmonic current requirements are met by main grid which leads
to low value of fundamental current in main feeder section and high value of THD in the same.
Figure 11 shows a scatter plot of fundamental current in either scenario. The electrical losses, with

18
or with our PV, is proportional to current flow with and without harmonics (equations (5) and (7)
respectively). In Figure 11 at section 1, the fundamental current before having PV in the network
was just over 350 A and with introduction of PV the fundamental current has decreased to be close
to 90 A. This is the cause for reduction in heat in Figure 9 and increase in THD in Figure 10. This
scenario may not seem to be a problem as the heating in the cable is much less, but, the power
factor at the substation transformer would be so low to have economic operation and may further
cause saturation of transformer cores. This points to the need for a balance in PV penetration from
a harmonic perspective to have a safe stable and economic operation of the distribution network.
Different combinations of PV hosting capacity, loads and harmonic profiles could be considered
for analysis. For example, preliminary analysis considering non-linear loads with varying THD at
the end of this network (pillar J) indicated significant implications for percentage THDv
manifestation at that part of the network; increasing by a factor of 4 when load THD increases
from 17% to 35%. However, and in the context of serving as a reference, the emphasis in this work
is to present extreme (practical) scenarios across the entirety of the network; as illustrated in
Figures 9-11.
A set of recommendations and best practices in a building environment is followed which would
help to create consumer awareness and help them to regulate the harmonics in their environment
to protect and safeguard their equipment’s and life.
Figure 9 Error plot for harmonic heating in individual phase with solar PV

19
Figure 10 THD in each phase for every section with PV

20
Figure 11 Scatter plot of fundamental current at all phase at each node with and without PV
Recommendations and Best Practices for reducing effect of harmonics in Domestic Envt.
The following are the recommendations based on the analysis and observation in this work,
which can be followed in domestic/building environments to safeguard the equipment involved
and reduce the harmful effects of harmonics. These are only simple solutions to the much-
understated problem and would need further detailed study and theoretical explanations based on
field data to prepare for future penetration of harmonic load.
1. Separate circuit supplying harmonic loads
based on the power rating
2. Anticipate for potential load growth during
electrical circuit design phase
3. Consider a harmonic rating factor while
deciding conductor size
4. Install a generous number of general
service outlets,; mitigate against the use of
extension cords/leads
5. Use loads with harmonic filters facilitated 6. Prioritize a DC supply, in the context of
DG, for loads in the house would help to
bypass the issues with harmonics
7. Implement strict regulation for limiting
harmonics in the domestic environment.
8. Consider tariffs that incentivise consumers
against higher harmonic pollutants
9. Create consumer awareness of the harmful
effects of harmonics and sensitive
equipment
10. Create a harmonic tolerance rating to
understand the withstand capability of
devices to a harmonic environment.

21
Conclusion
Harmonic distortion and its associated problems is not a new concept. However, the issue
has heretofore not been afforded sufficient importance within the domestic environment. The
analysis presented in this paper indicates the need to consider the same in a building system to
preserve and maintain the stable long term operation of building electrical services in the context
of modern smart environment scenario. The cable heating effect associated with harmonic current
should be carried out during the design phase of the building itself. This calls for much more
accurate anticipation of loads and consumer behaviour as well. The BS7671 wiring standards have
provided a harmonic derating factor which should be considered at the design phase with 3 phase
systems. However, in the context of single phase, the presented analysis may also be used to de-
rate the associated conductors. While this could lead to a prevalence of potentially oversized cable,
assurances in the context of enhanced safety provisions for equipment and human/appliance
engagement are justifiable outcomes in this regard.
The initial analysis of a domestic wiring circuit, indicated that there is a significant deviation
in respect to expected power loss and actual power loss in cables as a consequence of harmonic
distortion. The impact of such deviation may pose a threat only when accumulation of harmonics
occur at main circuits which is rare under present circumstance. But with increased penetration of
non-linear loads and the use of extension/multipin leads may end up with scenarios which threaten
the safety of consumer and equipment.
The harmonic heating analysis conducted on the distribution network reveals that the
situation is much worse than anticipated previously and a worst case scenario consideration
suggests catastrophic implications for the network. While such a ‘worst case scenario’ is highly
unlikely, it offers better insight (as a reference) rather than a consideration of variable non-linear
load integration and network connection positioning. That notwithstanding, more work is required
to understand optimisation in the context of voltage regulation, harmonic heating effects and
THDv with increasing non-linear load (and generation).
The results of the analyses presented with the renewable energy source integration (solar
PV) suggest that with increases in PV penetration the active element of power may be reduced,
but the THD can increase even though the harmonic content in the network may not have varied
significantly. The increased THD may not cause dangerous level of heating, but the essence of this
analysis is on the fact that THD may not be used as an implication of harmonic pollution in the
network. Another interesting finding from this scenario was the increase in voltage distortion with
utilization of PV generators. In a particular case it has been observed that when THD of the load
increases from 17% to 35%, the harmonic voltage distortion increases by a factor of 4. This is
however not a concern to harmonic heating as seen in the results but it could severely affect
distribution transformers and economic operation of distribution network. The interesting fact in
the presented study is that, the largest harmonic/non-linear load of distribution network for the
modern era ‘Electric Vehicle (EV)’ is not considered. So with increased EV penetration the worst
case scenario may not be as farfetched as it might seem.
The investigation and the insight obtained along with previous knowledge leads to the
formulation of recommendations and best practice suggestions for consumers to safeguard
themselves and their equipment from the ill effects of harmonics and harmonic heating.
Harmonics is like an inexorable demon in certain cases, however, by being aware of it, using
best practices and by abiding to the regulations would allow us to keep the demon at bay.

22
REFERENCES
[1] N. Watson and J. Arrillaga, Power systems electromagnetic transients simulation. 2003.
[2] A. Kalair, N. Abas, A. R. Kalair, Z. Saleem, and N. Khan, “Review of harmonic analysis,
modeling and mitigation techniques,” 2017.
[3] M. Farhoodnea, A. Mohamed, H. Shareef, and H. Zayandehroodi, “Power quality impacts
of high-penetration electric vehicle stations and renewable energy-based generators on
power distribution systems,” 2013.
[4] S. K. Khadem, M. Basu, and M. F. Conlon, “Power quality in grid connected renewable
energy systems: role of custom power devices,” 2010.
[5] A. Gil-de-Castro, S. K. Ronnberg, and M. H. J. Bollen, “A study about harmonic
interaction between devices,” in 2014 16th International Conference on Harmonics and
Quality of Power (ICHQP), 2014, pp. 728–732.
[6] M. S. Munir, Y. W. Li, and H. Tian, “Improved Residential Distribution System
Harmonic Compensation Scheme Using Power Electronics Interfaced DGs,” IEEE Trans.
Smart Grid, vol. 7, no. 3, pp. 1191–1203, May 2016.
[7] N. F. Guerrero-Rodríguez, A. B. Rey-Bou E, L. C. Herrero-De Lucas, and F. Martinez-
Rodrigo, “Control and synchronization algorithms for a grid-connected photovoltaic
system under harmonic distortions, frequency variations and unbalances,” 2015.
[8] K. Fekete, Z. Klaic, and L. Majdandzic, “Expansion of the residential photovoltaic
systems and its harmonic impact on the distribution grid,” Renew. Energy, 2012.
[9] D. Sko, M. Tovilovi, and N. L. Rajakovi, “The simultaneous impact of photovoltaic
systems and plug-in electric vehicles on the daily load and voltage profiles and the
harmonic voltage distortions in urban distribution systems,” Renew. Energy, vol. 76, pp.
454–464, 2015.
[10] J. A. Palmer, R. C. Degeneff, T. M. McKernan, and T. M. Halleran, “Determination of the
effect of harmonics on pipe-type power cable AC/DC resistance ratios,” IEEE Trans.
Magn., vol. 29, no. 2, pp. 1427–1433, Mar. 1993.
[11] J. Blackledge, K. O ’connell, M. Barrett, and A. Sung, “Cable Heating Effects due to
Harmonic Distortion in Electrical Installations,” 2012.
[12] I. Regulations and S. Edition, “Requirements for Electrical Installations,” BS7671-2008,
2008.
[13] J. Yong, L. Chen, and S. Chen, “Modeling of Home Appliances for Power Distribution
System Harmonic Analysis,” IEEE Trans. Power Deliv., vol. 25, no. 4, pp. 3147–3155,
Oct. 2010.
[14] F. Waite, D. Payne, J. Pilgrim, P. Lewin, and A. Gorwadia, “Quantifying possible
transmission network benefits from higher cable conductor temperatures,” IET Gener.

23
Transm. Distrib., vol. 7, no. 6, pp. 636–644, Jun. 2013.
[15] E. 2004- ETCI, “NATIONAL RULES FOR ELECTRICAL INSTALLATIONS,” 2004.
[16] H. E. Mazin, E. E. Nino, W. Xu, and J. Yong, “A Study on the Harmonic Contributions of
Residential Loads,” IEEE Trans. Power Deliv., vol. 26, no. 3, pp. 1592–1599, Jul. 2011.
[17] D. Salles, C. Jiang, W. Xu, W. Freitas, and H. E. Mazin, “Assessing the Collective
Harmonic Impact of Modern Residential Loads—Part I: Methodology,” IEEE Trans.
Power Deliv., vol. 27, no. 4, pp. 1937–1946, Oct. 2012.
[18] S. Khadem, R. Kerrigan, M. Basu, and B. Basu, “A Study on the Power Quality of DG
Integrated Building Energy System in Virtual Environment,” Conf. Pap., Jan. 2013.
[19] Chauvin-Arnoux, “Single phase power quality analyser, C.A 8230.” [Online]. Available:
http://www.chauvin-arnoux.com/sites/default/files/D00QPA50_4.PDF. [Accessed: 24-Jul-
2017].
[20] SEAI, “Your Guide to Electricity in the Home,” Wilton place, Dublin, Ireland, , 2008.
[21] S. K. Khadem, R. Kerrigan, M. Basu, B. Basu, S. K. Khadem Member IEEE, M. Basu
Member IEEE, and B. Basu Member IEEE, “A Study on the Power Quality of DG
Integrated Building Energy System in Virtual Environment Recommended Citation
"A study on the power quality of DG integrated building energy system in Virtual
Environment A Study on the Power Quality of DG Integrated Building Energy System in
Virtual Environment,” vol. 15, pp. 2–5, 2013.
[22] K. Sunderland, M. Coppo, M. Conlon, and R. Turri, “A correction current injection
method for power flow analysis of unbalanced multiple-grounded 4-wire distribution
networks,” Electr. Power Syst. Res., vol. 132, pp. 30–38, 2016.
[23] S. Pukhrem, M. Basu, M. F. Conlon, and K. Sunderland, “Enhanced Network Voltage
Management Techniques Under the Proliferation of Rooftop Solar PV Installation in Low-
Voltage Distribution Network,” IEEE J. Emerg. Sel. Top. Power Electron., vol. 5, no. 2,
pp. 681–694, Jun. 2017.
[24] R. C. Dugan, “Reference Guide The Open Distribution System Simulator(OpenDSS),”
2016.
[25] A. Mansoor, “Lower order harmonic cancellation: impact of low-voltage network
topology,” in IEEE Power Engineering Society. 1999 Winter Meeting (Cat.
No.99CH36233), 1999, pp. 1106–1109 vol.2.
[26] M. Rylander and J. Smith, “Stochastic Analysis to Determine Feeder Hosting Capacity for
Distributed Solar PV,” EPRI Tech. Updat. 1026640, 2012.
[27] T. M. Gruzs, “A Survey of Neutral Currents in Three-Phase Computer Power Systems,”
IEEE Trans. Ind. Appl., vol. 26, no. 4, pp. 719–725, 1990.
[28] anexo 2 Gobeirna De Espana, Guía técnica de aplicación en BT, “Cálculo DE Caídas De

24
Tensión, (Technical Guide for application to the Low Voltage Electrotechnical
Regulation),” 2003.
[29] I. E. C. "61000-3-6. . Standard, “IEC TR 61000-3-6:2008 Electromagnetic compatibility
(EMC) - Part 3-6: Limits - Assessment of emission limits for the connection of distorting
installations to MV, HV and EHV power systems.”