an analysis of florida's title insurance market
TRANSCRIPT

The Florida Office of Insurance Regulation
An Analysis of Florida's Title Insurance Market
Three Studies that Provide a Comprehensive, Multi-Faceted Review of the Florida Title Insurance Industry
July 2006
This document was produced pursuant to Section 627.782, Florida Statutes.

Executive Summary
Pursuant to the statutory requirements to regulate title insurers and to adopt rates
for title insurance, the Office of Insurance Regulation (the “Office”) has sponsored three
(3) studies of the title insurance business in Florida. The three (3) studies should be read
together as a comprehensive, multi-faceted review of the Florida title insurance industry.
The first study is by G. Stacy Sirmans, who is the Kenneth G. Bacheller Professor
of Real Estate at Florida State University. The Sirmans study examines the regulatory
treatment of title insurance premiums and title insurance, in order to place Florida title
insurers in a national context. The Sirmans study notes that the Florida title insurance
industry appears to be dominated by five (5) title insurance groups who account for
ninety-three percent (93%) of total Florida premiums. The Sirmans study provides an
initial comparative analysis of total title insurance costs between Florida and three “all-
inclusive rate” states, where reported title insurance costs include the charges for
premium and other title services. Comparisons are also made of the rate structure in
Florida relative to several “non-inclusive” states.
The second study is by Randy E. Dumm, who is an Associate Professor of Risk
Management and Insurance at the Florida State University College of Business, and
David A. Macpherson, who is the Rod and Hope Brim Eminent Scholar in Economics at
the Florida State University. The Dumm-Macpherson study is a financial analysis of the
Florida title insurance industry. The Dumm-Macpherson study concludes that Florida
title insurers have experienced dramatic premium revenue growth, while also exhibiting a
loss ratio which is low relative to title insurers in other Southeastern states. The “loss
ratio” is commonly understood to be the ratio of loss costs to premium revenue. The
relatively low loss ratio and relatively high profitability of the title industry suggest a
relatively high pricing structure for Florida title insurers. Based on a relatively small data
sample, the Dumm-Macpherson study suggests the need for a more detailed examination
of the specific cost and revenue components of premium, primary title services and
related title services for all Florida title insurers.
i
The final study is by a credentialed actuary now employed in the Department of
Financial Services’ Office of the Consumer Advocate, Stephen A. Alexander. The
Alexander report is a comparison of what a Florida consumer pays for title insurance and
related title services in contrast to what is paid by consumers in other states. The report is
based on publicly available statistics, a data submission by Florida title insurers
representing virtually the entire industry, and the small sample of actual closing
statements utilized by the Dumm-Macpherson study. As in the Dumm-Macpherson
study, the loss ratio experienced by Florida title insurers is found to be relatively low.
The study suggests tying the premium rates to loss ratio, thereby rendering the rates more
likely to mirror the actuarial risk incurred by the title insurer. Alexander notes that his
conclusions are consistent with the conclusions of the prior 1997 study of the title
industry performed for the Department of Insurance, statutory predecessor to the Office
for the regulation of title insurers, by actuary David Cox.
All three studies note that the Florida market for title insurance is dominated by
five (5) firms who sell most of their coverage through agents and agencies. The authors
draw both economic and political consequences from this concentration. In all three
studies the authors conclude that most Florida consumers of title insurance services
appear to be paying more for comparable title insurance than consumers in other states.
As a result of these studies and in accord with its statutory mandate, the Office will
shortly commence an exhaustive analysis of title insurance premiums and related charges.
The Office is currently promulgating a rule to accomplish this analysis and to provide the
basis for setting premium and limiting related title services charges.
ii

The Florida Office of Insurance Regulation
A Preliminary Examination of Title Insurance Regulation, Pricing and Costs Structures
July 2006
This preliminary report was produced pursuant to Section 627.782, Florida Statutes.

ACKNOWLEDGMENT This report was produced by: G. Stacy Sirmans, PhD Kenneth G. Bacheller Professor of Real Estate Department of Risk Management/Insurance, Real Estate and Business Law College of Business Florida State University Tallahassee, FL 32306-1110 Email: [email protected] Phone: 850-644-8214 NOTE: This report is a preliminary overview of the state of the title insurance in Florida. The 2006 Florida Legislature provided in Specific Appropriation 2614, $150,000 to the Office of Insurance Regulation to gather title insurance data in accordance with section 624.501(27)(e)(2), Florida Statutes. The data shall be collected from licensed agents, agencies, and insurers. The information collected shall be sufficient to give due consideration to the factors set forth in section 627.782, Florida Statutes. To assist with its data collection and analysis, the office shall retain the services of an independent actuary with experience and expertise in the title insurance industry.

1
A Preliminary Examination of Title Insurance Regulation, Pricing and Costs Structures
Executive Summary Assurance of good title is critical in real estate transactions. The typical way that this assurance
is provided is with the issuance of a title insurance policy. This study provides a preliminary analysis
of title insurance costs in Florida. The cost of title insurance in Florida is compared to costs in all-
inclusive states and non-inclusive states.
The cost of title insurance in Florida is determined by examining HUD-1 settlements forms. A
sample of 48 Florida HUD-1 forms is used to perform a preliminary analysis of the premium costs and
related services charges. Along with the premium, consumers also pay related charges such as title
search, settlement fees, and document preparation. The total cost of title insurance in Florida averaged
about 14 percent of total settlement costs.
Florida title insurance premium costs are compared to premiums across different price ranges
and across states. The First American web site is used to calculate premiums by price range for
Florida and other states. Since First American is one of the largest writers of title insurance, the quoted
rates should be somewhat representative of typical rates. Rates are calculated assuming prior coverage
and no prior coverage.
The cost of title insurance in Florida is compared directly to the all-inclusive states of
California, Texas, and Pennsylvania. All-inclusive states are those in which the quoted rate for title
insurance includes costs other than just the premium. However, the definition of “all-inclusive” may
vary slightly across state. For example, California’s quoted cost includes the title insurance premium
plus title search and examination costs but does not include other settlement or closing charges. On the
other hand, quoted rates in other all-inclusive states include not only the title premium and title
search/examination costs but other settlement and closing costs as well. Comparisons are made based
on prior and no prior coverage. A comparison is made of the average title cost for the all-inclusive
states to the Florida premium (which does not include related charges) in order to get an estimate of the

2
breakeven point for related charges. This breakeven amount is then compared to the actual related
charges from the Florida HUD-1 forms.
The First American web site is also used to compare Florida title insurance costs relative to
non-inclusive states. The quoted rates should allow a direct comparison of the premium only
(excluding related charges). Comparisons are made for prior and no prior coverage.
Some conclusions from the analysis are:
• Title insurance premiums in 2004 totaled $15.5 billion and exceeded the premiums
collected for medical malpractice and many other types of insurance;
• The title insurance industry is concentrated with two insurance groups accounting for 50
percent of total premiums in 2004 and six groups accounting for 99 percent of total
premiums in Florida;
• Using the total cost for the all-inclusive states and the Florida premium to calculate an
estimated breakeven amount for related services charges in Florida shows that the
estimated breakeven charges are less than the average actual charges from the Florida
HUD-1 forms in all coverage ranges with no prior purchase. For example, in the
$151,000 to $200,000 coverage range, the estimated breakeven charges are $160
compared to the actual charges of $465;
• With no prior coverage and simultaneous policies, Florida’s premium is about 45
percent higher than the average premium for non-inclusive states at lower coverage
levels;
• With no prior coverage and simultaneous policies, Florida’s premium is about 115
percent higher than the average premium for non-inclusive states at $500,000 of
coverage;
3
• With prior coverage and simultaneous policies, Florida’s premium at $500,000 of
coverage is about 40 percent greater than the average premium for non-inclusive states;
• With no prior coverage and purchase of lender or owner policy only, Florida’s premium
at $500,000 of coverage is 136 percent greater than the average premium for non-
inclusive states;
• With prior coverage and purchase of lender or owner policy only, Florida’s premium at
$500,000 of coverage is 100 percent greater than the average premium for non-inclusive
states;
• Over the period 1995 to 2004 total direct premiums written increased about 280 percent
to $15.5 billion nationwide countrywide;
• Over the period 1995 to 2004 total direct premiums in Florida increased about 310
percent to $1.8 billion;
• Over the period 1995 to 2004 the Florida share of title insurance premiums relative to
the total has remained relatively constant at about 10 percent;
• Although total title insurance premiums in the U.S. declined in 2004, the total premiums
in Florida increased likely due in large part to a continued Florida housing boom and
rapidly rising home prices;
• From 1995 to 2004 the method of delivery of title insurance services in Florida did not
change appreciably: About 85 percent of title insurance is written by non-affiliated
agencies, five percent is written by affiliated agencies, and ten percent is written
directly by the title company;
• From a sample of 48 Florida HUD-1 forms over the period 2000 to 2005, the average
total cost of title insurance (premium and related services charges) was $2,048 and
averaged about 14 percent of total settlement costs. Title insurance premiums comprise
4
a substantial part of total title insurance costs with title insurance premiums
representing, on average, about 66 percent of total title insurance costs;
• The average total cost of title insurance (premium and related services charges) was
1.05 percent of the contract price and the cost as a percentage of the contract price
decreases as the contract price increases. This should be the result of two factors: title
insurers’ underwriting costs in the form of title research are somewhat consistent across
transactions and the insurance rate structure;
• Examining the cost of title insurance in Florida using the First American web site shows
that the cost per unit of coverage decreases as the coverage increases (as expected) and
is less when prior coverage exists, i.e., an owner’s policy had been purchased within the
last three years. Given that the time period to qualify for reissue rates is longer in most
states (i.e., 5 or 10 years versus 3 years) and the average length of time between sales is
likely greater than three years, it could be easier for consumers in other states to qualify
for reissue rates than for consumers in Florida;
• With simultaneous policies and increasing coverage from $50,000 to $500,000, the cost
per thousand decreases about 17 percent with no prior coverage and about 18 percent
with prior coverage;
• With separate lender or owner policies and increasing coverage from $50,000 to
$500,000, the cost per thousand decreases about 20 percent with no prior coverage and
about 15 percent with prior coverage;
• With no prior coverage, it is interesting to note that the Florida premium excluding any
related services charges is greater than the average total cost of the all-inclusive states in
the upper coverage ranges;

5
• With prior coverage, however, the Florida premium excluding any related services
charges is less than the average total cost of the all-inclusive states for all coverage
ranges;
• With no prior coverage, Florida’s premium is higher than the average premium for non-
inclusive states at every coverage level for both simultaneous policies and a single
policy purchase ;
• With prior coverage and simultaneous policies, Florida’s premium is greater than the
average for non-inclusive states for all coverage ranges except $50,000; and
• With prior coverage and purchase of lender or owner policy only, Florida’s premium is
greater than the average premium for non-inclusive states for all coverage ranges.
This preliminary study could provide the basis for a more comprehensive integrated
comparative cost and financial analysis of the title insurance industry in Florida. This could include a
larger sample of HUD-1 forms and a data call to all title insurers for premium rate quotes and related
services charges. A more sophisticated statistical analysis could be performed relating the cost of title
insurance to state characteristics such as rate setting requirements (promulgated, unregulated, etc.),
total title charges (all-inclusive, risk rate, etc.), loss ratios, and distribution methods. The data call
could also require Florida insurers to provide measures for premiums earned and losses incurred by
size of risk over some historical period such as the last five years. The loss data could be developed to
ultimate using standard actuarial techniques. The data could then be analyzed to determine whether
the current rates by layer of coverage are appropriate.

6
A Preliminary Examination of Title Insurance Regulation, Pricing and Costs Structures
I. Introduction
Assurance of good title is a critical component of a real estate transaction. The typical methods
of title assurance are a title search, title abstract, attorney’s letter of opinion, title certificate, and title
insurance. Title insurance is designed to provide assurance to the homeowner and/or the lender that
ownership can be transferred clear of encumbrances. Title insurance also provides a signal to the
national capital markets of the quality of local title searches. Since real estate can be subject to claims
by a number of market participants including lenders, heirs, taxing jurisdictions, etc., title insurance
has value by certifying that no prior liens or claims exist. Title insurance is present in 85 percent of
residential sales transactions in the U.S. (Arrunada, 2001).
Title insurance insures good title and provides protection to the buyer and/or lender against
such problems as unknown recorded liens, defects in public records, forgeries, improperly delivered
deeds, etc. As Malloy and Klapow (2000) discuss, problems with title can result from both on and off
record risks. Off record risks include not recording a document and mistakes by the recording office.
On record risks include forged documents and fraudulent conveyances. Title insurance generally
excludes from coverage any known defects and risks such as zoning and environmental regulations,
eminent domain, defects causing no loss or damage, and defects subsequent to the date of the policy.
Title insurance policies generally contain a clause that obligates the title company to defend the
insured to the extent that the dispute involves a defect covered by the policy.
There are two main types of title insurance policies: an owner’s policy and a lender’s policy.
The owner’s policy generally covers an amount equal to the purchase price while the lender’s policy
covers the amount of the mortgage. The demand for title insurance is derived from the demand for real
estate and/or real estate financing. The demand for real estate and real estate financing is a function of
mortgage interest rates and other factors. As a result of the continued housing boom in the U.S., the
title industry reported near-record performance in 2004, following a record year in 2003. Operating
7
revenues in 2004 declined slightly from the historically high 2003 level (Best’s Report, October 11,
2005). In 2004 the size of the title insurance industry was $15.5 billion for direct premiums written.
This is up from $11 billion in 2003. Unlike property and casualty insurers who average an 87 percent
loss payout ratio, title insurers average about 5 percent (Asaro, October 31, 2005). Title insurers paid
approximately $661.7 million in claims in 2003 and $582 million in 2002. Because of the nature of the
business, the title industry spends ten times what it pays in claims to perform title searches and cure
title problems (ALTA Press Release, November 28, 2005).
As of 2004, there were 24 title insurance companies operating in Florida with total direct
premiums written of $1.81 billion. The fact that some title companies are under common ownership
reduces the effective number of independent, competitive firms. As of 2004, there were twelve
insurance groups in Florida.
The Florida Office of Insurance Regulation (OIR) was created in 2003 and seeks to ensure that
insurance companies in Florida are financially viable while providing insurance products to Florida
consumers at a fair price. The Florida OIR is charged with administering state laws governing insurers
relative to licensing, premium rates, solvency, and other factors. To fulfill its statutory responsibility
of overseeing the financial viability and solvency of insurance companies, the OIR has developed
performance measures and standards to evaluate performance. In addition to the OIR, the Florida
Commissioner of Insurance Regulation serves as a member of the National Association of Insurance
Commissioners (NAIC). The NAIC serves to protect the public interest and promote competitive
insurance markets.
Given the importance of title insurance in providing guarantees to purchasers of real property and
considering the cost that this insurance adds to the real estate transaction, title insurance continues to
be an insurance product that demands regulatory oversight and scrutiny. Section 627.782 of the
Florida Code regulates title insurance rates and charges for related title services. In accordance with
Section 627.782, title insurance premiums in Florida are promulgated by the Office of Insurance

8
Regulation (OIR). Charges for related title services (provided for in Section 627.7711) are permitted,
can be no less than actual cost, and are not currently regulated by the OIR, except that they can be no
less than actual cost. However, Section 627.782 permits limitations to be placed by rule on related title
service charges. The Code also (1) requires that the insurer retain no less than 30 percent of the risk
premium, (2) requires uniform policy forms, and (3) provides preemption of Federal anti-trust laws.
Subsection 627.782(7) of the Florida Statute reads: “The commission shall, in accordance with
the standards provided in subsection (2), review the premium as needed, but not less frequently than
once every 3 years, and shall, based upon the review required by the subsection, revise the premium if
the results of the review so warrant.” Per this requirement, this project provides an updated
examination of title insurance rates in Florida by providing to the Office of Insurance Regulation
(OIR):
(1) current information regarding the structure and regulatory treatment of the title insurance
industry across states;
(2) current title insurance pricing behavior and costs within the State of Florida; and
(3) comparison pricing and cost results with states that use all inclusive title insurance rates.
The cost of title insurance in Florida is determined by examining HUD-1 settlements forms. A
sample of 48 Florida HUD-1 forms is used to perform a preliminary analysis of the premium costs and
related services charges for title insurance. Along with the premium, consumers also pay related
charges such as title search, settlement fees, and document preparation. The total cost of title
insurance in Florida averaged about 14 percent of total settlement costs.
Florida title insurance premium costs are compared to premiums across different price ranges
and across states. The First American web site is used to calculate premiums by price range for
Florida and other states. Since First American is one of the largest writers of title insurance, the quoted
rates should be somewhat representative of typical rates. Rates are calculated assuming prior coverage
and no prior coverage.

9
The report also compares the cost of title insurance in Florida to the all-inclusive states of
California, Texas, and Pennsylvania. All-inclusive states are those in which the title costs include
charges other than just the premium. However, the definition of “all-inclusive” may vary slightly
across states. For example, California’s quoted cost includes the title insurance premium plus title
search and examination fees but does not include other settlement or closing costs. On the other hand,
quoted rates in other all-inclusive states include the title premium and search/examination fees plus
other closing and settlement costs. Comparisons are made based on prior and no prior coverage. A
comparison is made of the average title cost for the all-inclusive states to the Florida premium (which
does not include related charges) in order to get some idea of the breakeven point for related charges.
This breakeven amount is then compared to the actual related charges from the Florida HUD-1 forms.
The First American web site is used to compare Florida title insurance costs relative to non-
inclusive states. The quoted rates should allow a direct comparison of the premium only (excluding
related charges). Comparisons are made for prior and no prior coverage.
II. The Evolution of Title Insurance
Title insurance lore says that title insurance started with the 1868 Pennsylvania Supreme Court
decision of Watson vs. Muirhead. A conveyancer had examined a title and issued an opinion of clear
title. However, there was an outstanding prior lien that caused Muirhead to lose his property at a
sheriff’s sale. Muirhead sued the conveyancer and lost. The Court held that the conveyancer did not
guarantee title and therefore could not be held liable for erroneous opinions if the conveyancer acted
within professional standards. This decision resulted in a dramatic increase in demand for the most
reputable conveyancers. In 1874 Pennsylvania enacted legislation permitting the issuance of title
insurance. In 1876 a group of conveyancers incorporated and formed the Real Estate Title Insurance
Company. Title insurance became more prominent after World War I and then became the norm with
the real estate boom that followed World War II. Since the secondary mortgage market requires title

10
insurance on newly originated loans, a large part of the recent growth in title insurance has been a
result of it being required by institutional lenders.
Title insurance has always differed from other insurance in several ways: (1) the premium is a
one-time charge and is primarily a service fee to cover the expense of searching the public record,
(2) the title company retains liability into perpetuity, i.e., there is no fixed term of coverage, (3) the
policy insures past occurrences and not future events, (4) title companies have substantial expense in
maintaining title plants, (5) the policy cannot be cancelled by the company or the insured, and (6) only
a small portion of the premium is paid out in claims.
Since the title industry’s risk exposure is based on events that have already occurred, the title
industry has specialized in loss mitigation. The title insurance approach is to identify risk and
eliminate it from coverage. This way, the insurer does not assume a known risk. Because of this risk
elimination, the number of claims is relatively few. Title insurance exempts from coverage liens and
defects in the title search and generally provides protection for errors and omissions in the conveyance
and against hidden defects that escape discovery. Because incurred losses account for a very small
part of the title insurance premium dollar, the level of title insurance losses have little relationship to
the level of premiums written each year.
Along with loss avoidance, another component of insuring title is information gathering. Some
title companies maintain title plants that duplicate public records. Historically, maintaining title plants
and performing title searches has been very labor and capital intensive. However, as Baen and Guttery
discuss (1997), technology is impacting courthouses, ad valorem tax offices, and title insurance
companies. Technological innovations now allow electronic filing and more efficient merging of data.
For example, technological advances allowing laser disc to replace microfilm should produce instant
chains of title. They conclude that the increased competition resulting from these innovations should
result more competitive pricing in title insurance.
11
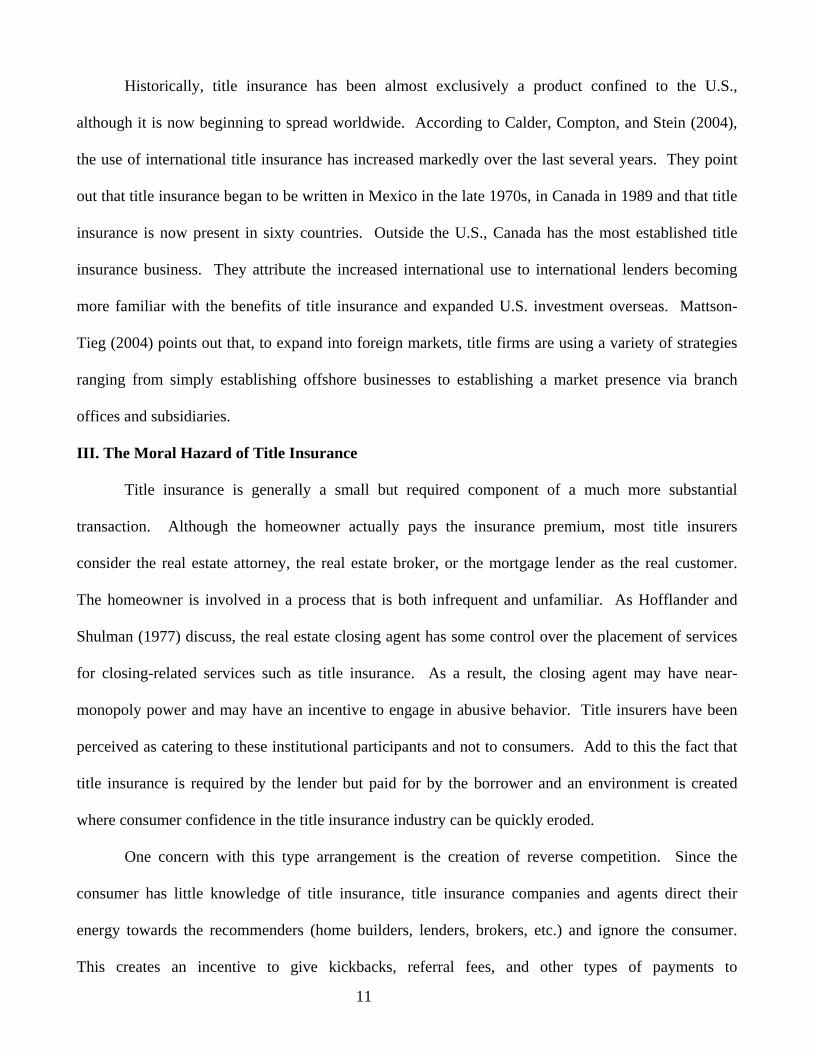
Historically, title insurance has been almost exclusively a product confined to the U.S.,
although it is now beginning to spread worldwide. According to Calder, Compton, and Stein (2004),
the use of international title insurance has increased markedly over the last several years. They point
out that title insurance began to be written in Mexico in the late 1970s, in Canada in 1989 and that title
insurance is now present in sixty countries. Outside the U.S., Canada has the most established title
insurance business. They attribute the increased international use to international lenders becoming
more familiar with the benefits of title insurance and expanded U.S. investment overseas. Mattson-
Tieg (2004) points out that, to expand into foreign markets, title firms are using a variety of strategies
ranging from simply establishing offshore businesses to establishing a market presence via branch
offices and subsidiaries.
III. The Moral Hazard of Title Insurance
Title insurance is generally a small but required component of a much more substantial
transaction. Although the homeowner actually pays the insurance premium, most title insurers
consider the real estate attorney, the real estate broker, or the mortgage lender as the real customer.
The homeowner is involved in a process that is both infrequent and unfamiliar. As Hofflander and
Shulman (1977) discuss, the real estate closing agent has some control over the placement of services
for closing-related services such as title insurance. As a result, the closing agent may have near-
monopoly power and may have an incentive to engage in abusive behavior. Title insurers have been
perceived as catering to these institutional participants and not to consumers. Add to this the fact that
title insurance is required by the lender but paid for by the borrower and an environment is created
where consumer confidence in the title insurance industry can be quickly eroded.
One concern with this type arrangement is the creation of reverse competition. Since the
consumer has little knowledge of title insurance, title insurance companies and agents direct their
energy towards the recommenders (home builders, lenders, brokers, etc.) and ignore the consumer.
This creates an incentive to give kickbacks, referral fees, and other types of payments to

12
recommenders to secure their business. This could have the effect of driving up the cost to the
consumer.
The title insurance industry has come under scrutiny by consumer groups and regulators
concerned with what are viewed as high rates for title insurance. Recent investigations of the title
industry have been concerned with captive reinsurance agreements where title companies are rebating
back a portion of the premium to captive reinsurance companies formed by home builders, real estate
brokers, and others (Best’s Report, October 11, 2005). The question is whether these payments
amount to referral kickbacks with the concern that this can adversely affect consumers. Lehman
(2005) reports that regulators are accusing title companies of entering into phony reinsurance
agreements with captive reinsurers owned by home builders and real estate firms as a means of
bypassing state and federal prohibition against payments of referral fees on title insurance business.
The basis for this is the prohibition of referral fees outlined in the 1974 Real Estate Settlement
Procedures Act (RESPA). Lehman quotes Peter Rousmaniere, a risk and insurance consultant as
saying “This is the little village of insurance that nobody is paying attention to, and it’s about as rotten
as you can get.”
Asaro (2005) reports that HUD has sixty active investigations into alleged violations of RESPA
anti-kickback provisions. Asaro reports that regulators, in fact, have been concerned with this problem
since 1997. The NAIC is working in conjunction with HUD in looking into these illegal practices.
Asaro also points that a number of states have investigated the problem of rebates. Some
examples are: (a) in California title insurers have been accused of rebating premiums to sham captive
reinsurance companies, (b) in February 2005, a California-based title company agreed to refund
consumers $24 million in fees paid to reinsurance companies controlled by home builders, brokers,
lenders, and real estate agents, (c) settlements in 2003 and 2004 in California totaled $50 million (this
was in part for un-refunded interest earned on customer’s escrow accounts), (d) in Colorado nine title
insurance companies agreed to refund $103,000 to 2,000 homeowners rather than face sanctions,

13
having been accused of giving kickbacks dating back to 1997, (e) Colorado is negotiating settlements
with other major title insurers, (f) Minnesota regulators commenced an investigation into 19 title
insurance companies regarding reinsurance agreements, (g) HUD recently announced a $6.2 million
settlement with title insurers and lenders in Texas, (h) in March 2005 HUD announced a $450,000
settlement with title insurers and real estate companies in Oklahoma, (i) in April 2005 an investigation
into fee sharing with lenders and realty companies was begun in Wisconsin, and (j) investigations have
begun in Alaska, Massachusetts, and Washington.
IV. Previous Examination of Title Insurance Rates
A previous report completed in December 1997 by The David Cox Company examined title
insurance rates in Florida. This report analyzed Florida’s title insurance experience for the purpose of
determining the appropriate risk premium and charges for related title services. Recommendations of
this report were primarily to correct the subsidization of operations not intended to be funded by the
risk premium and to promote competition and efficiency. Some specific recommendations were: (1)
current title insurance risk rates were excessive and should be reduced by 13 percent, (2) that agents’
share of the risk premium should remain at no more than 70 percent, (3) additional steps should be
taken to assure that expenses used in rate-making are not excessive due to reverse competition.
V. An Analysis of Title Insurance Premiums
This study examines the regulatory treatment of title insurance premiums and title insurance
companies across states. In addition, the study provides an initial comparative analysis of total title
insurance costs between Florida and the all-inclusive rate states of California, Pennsylvania, and
Texas. Comparisons are also made of the rate structure in Florida relative to the remaining non-
inclusive states.
A. Market Structure of the Title Insurance Industry
The housing and mortgage financing/refinancing boom since the early-mid 1990s in the U.S.
has proven to be very beneficial to the title insurance business. Table 1 shows the direct premiums
14
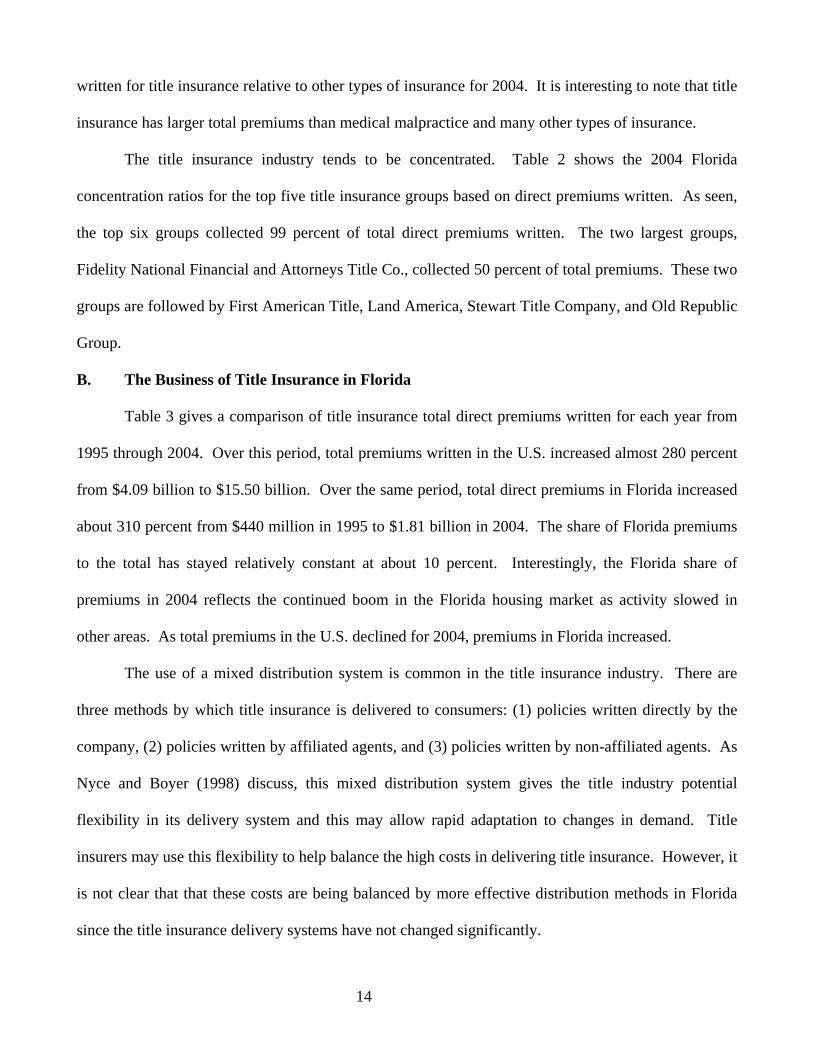
written for title insurance relative to other types of insurance for 2004. It is interesting to note that title
insurance has larger total premiums than medical malpractice and many other types of insurance.
The title insurance industry tends to be concentrated. Table 2 shows the 2004 Florida
concentration ratios for the top five title insurance groups based on direct premiums written. As seen,
the top six groups collected 99 percent of total direct premiums written. The two largest groups,
Fidelity National Financial and Attorneys Title Co., collected 50 percent of total premiums. These two
groups are followed by First American Title, Land America, Stewart Title Company, and Old Republic
Group.
B. The Business of Title Insurance in Florida
Table 3 gives a comparison of title insurance total direct premiums written for each year from
1995 through 2004. Over this period, total premiums written in the U.S. increased almost 280 percent
from $4.09 billion to $15.50 billion. Over the same period, total direct premiums in Florida increased
about 310 percent from $440 million in 1995 to $1.81 billion in 2004. The share of Florida premiums
to the total has stayed relatively constant at about 10 percent. Interestingly, the Florida share of
premiums in 2004 reflects the continued boom in the Florida housing market as activity slowed in
other areas. As total premiums in the U.S. declined for 2004, premiums in Florida increased.
The use of a mixed distribution system is common in the title insurance industry. There are
three methods by which title insurance is delivered to consumers: (1) policies written directly by the
company, (2) policies written by affiliated agents, and (3) policies written by non-affiliated agents. As
Nyce and Boyer (1998) discuss, this mixed distribution system gives the title industry potential
flexibility in its delivery system and this may allow rapid adaptation to changes in demand. Title
insurers may use this flexibility to help balance the high costs in delivering title insurance. However, it
is not clear that that these costs are being balanced by more effective distribution methods in Florida
since the title insurance delivery systems have not changed significantly.

15
Table 4 gives the breakdown of direct premiums written by distribution method in Florida from
1995 to 2004. As seen, the method of delivery did not change appreciably over this period. Non-
affiliated agencies have consistently written about 85 percent of Florida title insurance. About five
percent is written by affiliated agencies and about 10 percent is written directly by the title company.
C. The Cost of Title Insurance in Florida
The cost of title insurance in terms of premium and related services charges can be determined
by examining HUD-1 settlement forms. A sample of 48 HUD-1 forms for the period 2000 to 2005
was obtained from the Office of Insurance Regulation’s Consumer Complaints Division. Table 5 gives
summary statistics for these forms. Thirty-two of the 48 HUD-1 forms were simultaneous issue. The
average contract price was $273,413. Relative to title insurance, the average lender’s coverage was
$286,222 with an average premium of $233, or $2.06 per $1,000 of coverage. The average owner’s
title coverage was $269,673 with an average insurance premium of $1,372, or $5.59 per $1,000 of
coverage. Total settlement costs averaged $20,539. The average total cost of title insurance (premium
and related services charges) was $2,048 and averaged about fourteen percent of total settlement costs.
Title insurance related services charges include such items as settlement fees, title search, title
examination, and document preparation. Other than the title insurance premium and related
endorsements, costs that most often appeared on the settlement statement included settlement fee,
abstract/title search, title examination, and shipping/handling fee. Of these, the settlement fee had the
highest average cost of $188. The average cost of performing the title search and providing an abstract
cost was $123. Doing the title examination cost, on average, $95.
Table 6 shows the total cost of title insurance relative to the contract price for the 48 HUD-1
settlement forms. As the table shows, the cost of title insurance decreases as a percentage of the
contract price as the selling price increases. For example, for a contract price less than $100,000, the
total cost of title insurance is $702 or 1.54% of the selling price. In contrast, for a contract price
between $151,000 and $250,000, the cost of title insurance is $1,570 or 0.83% of the contract price.

16
Title insurance premiums comprise a substantial part of total title insurance costs with title insurance
premiums representing, on average, over 66 percent of total title insurance costs. The table also shows
that the amount of related services charges increases as the price increases. Overall, the average total
title costs were 1.05% of the contract price for the sample.
D. The Cost of Title Insurance in Florida by Coverage Amount
To better understand the pricing of title insurance in Florida, it is useful to compare premiums
across different price ranges and across states. The First American web site
(http://titlefees.firstam.com/Titlefees.asp) is used to calculate premiums by price range for Florida and
other states. First American is one of the largest writers of title insurance in the U.S. and Florida thus
the quoted rates should be somewhat representative of rates typically charged. The premium quotes
are based on information provided to the First American title fee calculator.
Table 7 gives the cost of title insurance in Florida for different coverage amounts as quoted by
the First American web site premium calculator. Part A shows the cost for simultaneous policies
(lender and owner policies purchased simultaneously). As seen, the cost is less when an owner’s
policy has been issued within the last three years. For example, for $50,000 in coverage the cost is
$6.24 per $1,000 with no prior coverage. This compares to $3.80 per $1,000 when there has been prior
coverage. As the table shows, the cost decreases as the coverage increases. With no prior coverage,
the cost per thousand drops from $6.24 for $50,000 in coverage to $5.20 per thousand for $500,000 in
coverage. This is a decrease of about 17 percent. With prior coverage the premium drops from $3.80
per thousand for $50,000 in coverage to $3.11 per thousand for $500,000 in coverage, a decrease of
about 18 percent. The decrease in cost is much more dramatic when the coverage reaches seven
figures. For example, with no prior coverage, the cost per thousand drops almost 30 percent from
$50,000 in coverage to $1,250,000. With prior coverage, the cost per thousand drops about 25 percent.
Part B of Table 7 gives the average cost when either a lender’s or owner’s policy is purchased.
Because the policies duplicate coverage, the cost is relatively the same whether it is a lender or buyer

17
policy. With no prior coverage, the cost per thousand drops from $5.74 at $50,000 of coverage to
$4.56 for coverage of $1,250,000. This is a decrease of about 20 percent. With prior coverage, the
cost per thousand drops from $3.30 to $2.82 for coverage increasing from $50,000 to $1,250,000. This
is a decrease of about 15 percent.
E. The Cost of Title Insurance in Florida Compared to All-Inclusive States
Table 8A compares the average cost of simultaneous policies in Florida to the all-inclusive
states, California, Pennsylvania, and Texas. The table gives cost comparisons based on both prior
coverage and no prior coverage. The table also gives the combined premium for the all-inclusive
states (AI). The premium for Florida reflects only the title premium and does not include related
services charges. For all states, the cost of title insurance is inversely related to the coverage (and
hence the value of the property). This is true whether there was prior coverage or not. As usual, the
cost is less with prior coverage in all states.
It is interesting to note that, with no prior coverage, the premium cost (without related services
charges) in Florida is greater than the total cost for the all-inclusive states in the upper coverage ranges.
This is not true when there was prior coverage.
Table 8B compares the average premium for the all-inclusive states to the Florida premium and
gives the estimated breakeven related services charges. For example, at $50,000 of coverage, the
average all-inclusive premium is $612.58 while the premium for Florida is $312.00. Thus the
breakeven charges are $300.58. If related services charges average more than this amount, then title
insurance in Florida would be more expensive than the all-inclusive states. At coverage of $250,000
title insurance is more expensive in Florida if average related services charges are greater than
$256.58. For coverage above $1,250,000 the premium alone in Florida exceeds the total cost of title
insurance for the all-inclusive states. When related services charges are added to the Florida premium,
the total cost for title insurance in Florida is significantly greater for upper-priced properties relative to
the all-inclusive states.

18
So, how does the cost of title insurance in Florida compare to the all-inclusive states? A rough
comparison may be made by referring back to the cost data disclosed in the HUD-1 forms in Table 6.
With no prior coverage, the estimated breakeven charges are less than the actual average charges from
the HUD-1 forms for all coverage categories. For the $151,000 to $250,000 coverage range, the
average total title cost is $1,570 with no prior coverage. This total cost minus the premium is $465.
This difference should be an indicator of the average related services costs for title insurance in this
coverage range. In comparison, the breakeven estimated related services charge is $256.58 for
$250,000 in coverage in Table 8B. This estimated breakeven amount is significantly less than the
average related services charges of $465 from the HUD-1 forms.
With prior coverage, the average premium cost for Florida is less than the all-inclusive states at
all coverage ranges. Also, from Table 8B, the actual related services charges are less than the
estimated breakeven charges for all coverage ranges except the upper range of $1,250,000. For
$250,000 in coverage the breakeven services charges are $679.96 compared to the actual services
charges of $465. Thus there is a price advantage if there was an owner policy in force within the last
three years of the purchase date.
F. The Cost of Title Insurance in Florida Compared to Non-Inclusive States
Table 9 compares title insurance premiums for Florida to all other states, excluding the all-
inclusive states. Since the all-inclusive states are excluded from the analysis, the quoted rates should
include only the premium and not the related services charges. Part A of Table 9 compares the total
cost for simultaneous policies. As seen, with no prior purchase the Florida premium per $1,000 of
coverage is higher than the average of other states at every coverage level. At the lower coverage
levels the Florida premium is about 45 percent higher than other states but at the upper range the cost
is more than double. For example, the cost at $500,000 of coverage is $5.20 per thousand compared to
the $2.41 average for other states. For this level of coverage the Florida premium is 115 percent
greater than the average premium for other states.

19
Table 9, Part A also compares the premium for Florida to other states given prior coverage. In
this case, the premium per thousand of coverage for Florida is greater than the average for other states
in all categories except the $50,000 coverage. At $250,000 of coverage, Florida’s premium is $0.65
per thousand (25 percent) more than the average for other states. At $500,000 of coverage, Florida’s
premium is $0.89 per thousand (40 percent) greater. At $1,250,000 of coverage, Florida’s premium is
$1.04 per thousand (58 percent) greater than other states.
Table 9, Part B compares the premiums for title insurance for Florida versus other non-
inclusive states given the purchase of only a lender or owner policy. With no prior coverage, the
premium is greater in every coverage category for Florida relative to other states. For example, the
premium in Florida for $100,000 of coverage is $2.59 per thousand greater (82 percent) than the
average for other states. For coverage of $500,000, the premium in Florida is $2.97 per thousand
greater (136 percent) than the average for other states.
Part B of Table 9 also compares the premiums for a lender or owner policy only for Florida to
non-inclusive states with prior coverage purchased from the carrier. Again, the premium for Florida is
greater than the average for other states for all coverage categories. For $100,000 of coverage, the
Florida premium is $1.24 greater per thousand (60 percent) than the average for other states. For
$500,000 of coverage, the Florida premium is $1.53 greater per thousand (100 percent) than the
average for other states.
VI. Recommendations for a More Comprehensive Study
The results from this preliminary study (along with the Dumm and Macpherson (2005) study)
could be followed up with a more comprehensive integrated comparative cost and financial study of
the title insurance industry in Florida. An expanded comparative cost study could include all insurers
and a larger sample of HUD-1 forms. A data call to title companies could include copies of their
retained HUD-1 forms and a request for insurers’ rate manuals and access to their rating models. The

20
HUD-1 forms could be requested in electronic form since most real estate closings are completed using
computerized software packages.
This study and the Dumm and Macpherson (2005) study could be the gateway for a more
complete comparative cost and financial analysis of title companies. This could be accomplished by
issuing a data call by state to all title insurers for premium quotes by size of risk. Title insurers could
be required to identify by state any specific charges for services provided over and above the charges
for risk and determination of insurability (search and title examination costs). The risk-adjusted
premium quote data by state could be statistically analyzed relative to factors such as (1) rate setting
(whether rates are promulgated, require prior approval, are unregulated, etc.), (2) whether the state
requires an all-inclusive rate, a risk rate, or something in-between, (3) loss ratios, and (4) the method of
distribution (affiliated versus non-affiliated agents).
The data call could also require Florida insurers to provide measures for premiums earned and
losses incurred by size of risk over some historical period such as the last five years. The loss data
could be developed to ultimate using standard actuarial techniques. The data could then be analyzed to
determine whether the current rates by layer of coverage are appropriate. A more comprehensive study
could also provide a comparison of premium quote dispersion between companies across states
compared to the companies’ market shares and examine the relative dispersion of premium quotes by
state between companies within the same holding company and the relationship between this
dispersion and the type of operations and market share.
21
VII. Summary
This study has provided an overview of the title insurance industry and a comparison of title
insurance premiums in Florida relative to all-inclusive states and non-inclusive states. Some
conclusions are:
• Title insurance premiums in 2004 totaled $15.5 billion and exceeded the premiums
collected for medical malpractice and many other types of insurance;
• The title insurance industry is concentrated with two insurance groups accounting for 50
percent of total premiums in 2004 and six groups accounting for 99 percent of total
premiums in Florida;
• Over the period 1995 to 2004 total direct premiums written increased about 280 percent
to $15.5 billion nationwide;
• Over the period 1995 to 2004 total direct premiums in Florida increased about 310
percent to $1.8 billion;
• Over the period 1995 to 2004 the Florida share of title insurance premiums relative to
the total has remained relatively constant at about 10 percent;
• Although total title insurance premiums in the U.S. declined in 2004, the total premiums
in Florida increased likely due in large part to a continued Florida housing boom and
rapidly rising home prices;
• From 1995 to 2004 the method of delivery of title insurance services in Florida did not
change appreciably: About 85 percent of title insurance is written by non-affiliated
agencies, five percent is written by affiliated agencies, and ten percent is written
directly by the title company;
• From a sample of 48 Florida HUD-1 forms over the period 2000 to 2005, the average
total cost of title insurance (premium and related services charges) was $2,048 and

22
averaged about 14 percent of total settlement costs. Title insurance premiums comprise
a substantial part of total title insurance costs with title insurance premiums
representing, on average, about 66 percent of total title insurance costs;
• The average total cost of title insurance (premium and related services charges) was
1.05 percent of the contract price and the cost as a percentage of the contract price
decreases as the contract price increases. This should be the result of two factors: title
insurers’ underwriting costs in the form of title research are somewhat consistent across
transactions and the insurance rate structure;
• Examining the cost of title insurance in Florida using the First American web site shows
that the cost decreases as the coverage increases (as expected) and is less when prior
coverage exists, i.e., an owner’s policy had been purchased within the last three years.
Given that the time period to qualify for reissue rates is longer in most states (i.e., 5 or
10 years versus 3 years) and the average length of time between sales is likely greater
than three years, it could be easier for consumers in other states to qualify for reissue
rates than for consumers in Florida;
• With simultaneous policies and increasing coverage from $50,000 to $500,000, the cost
per thousand decreases about 17 percent with no prior coverage and about 18 percent
with prior coverage;
• With separate lender or owner policies and increasing coverage from $50,000 to
$500,000, the cost per thousand decreases about 20 percent with no prior coverage and
about 15 percent with prior coverage;
• With no prior coverage, it is interesting to note that the Florida premium excluding any
related services charges is greater than the average total cost of the all-inclusive states in
the upper coverage ranges;
23
• With prior coverage, however, the Florida premium excluding any related services
charges is less than the average total cost of the all-inclusive states for all coverage
ranges;
• Using the total cost for the all-inclusive states and the Florida premium to calculate an
estimated breakeven amount for related services charges in Florida shows that the
estimated breakeven charges are less than the average actual charges from the Florida
HUD-1 forms in all coverage ranges with no prior purchase. For example, in the
$151,000 to $200,000 coverage range, the estimated breakeven charges are $160
compared to the actual charges of $465;
• With no prior coverage and simultaneous policies, Florida’s premium is higher than the
average for non-inclusive states at every coverage level ;
• With no prior coverage and simultaneous policies, Florida’s premium is about 45
percent higher than the average premium for non-inclusive states at lower coverage
levels;
• With no prior coverage and simultaneous policies, Florida’s premium is about 115
percent higher than the average premium for non-inclusive states at $500,000 of
coverage;
• With prior coverage and simultaneous policies, Florida’s premium is greater than the
average for non-inclusive states for all coverage ranges except $50,000;
• With prior coverage and simultaneous policies, Florida’s premium at $500,000 of
coverage is about 40 percent greater than the average premium for non-inclusive states;
• With no prior coverage and purchase of lender or owner policy only, Florida’s premium
is greater than the average premium for non-inclusive states for all coverage ranges;
24
• With no prior coverage and purchase of lender or owner policy only, Florida’s premium
at $500,000 of coverage is 136 percent greater than the average premium for non-
inclusive states;
• With prior coverage and purchase of lender or owner policy only, Florida’s premium is
greater than the average premium for non-inclusive states for all coverage ranges; and
• With prior coverage and purchase of lender or owner policy only, Florida’s premium at
$500,000 of coverage is 100 percent greater than the average premium for non-inclusive
states.
This preliminary study could provide the basis for a more comprehensive integrated
comparative cost and financial analysis of the title insurance industry in Florida. This could include a
larger sample of HUD-1 forms and a data call to all title insurers for premium rate quotes and related
services charges. A more sophisticated statistical analysis could be performed relating the cost of title
insurance to state characteristics such as rate setting requirements (promulgated, unregulated, etc.),
total title charges (all-inclusive, risk rate, etc.), loss ratios, and distribution methods. The data call
could also require Florida insurers to provide measures for premiums earned and losses incurred by
size of risk over some historical period such as the last five years. The loss data could be developed to
ultimate using standard actuarial techniques. The data could then be analyzed to determine whether
the current rates by layer of coverage are appropriate.

25
References ALTA Press Release, November 28, 2005. Benito Arrunada, “A Global Perspective on Title Insurance,” Housing Finance International, Vol. 16, No. 2, December 2001, pp. 3-11. Catherine A. Asaro, “Cracking Down on Illegal Practices in the Title Insurance Industry,” BNET Financial Services, October 31, 2005. John S. Baen and Randall S. Guttery, “The Coming Downsizing of Real Estate: Implications of Technology,” Journal of Real Estate Portfolio Management, Vol. 3, No. 1, 1997, pp. 1-18. Brigham Young Law Review, Issue 4, 1976, pp. 895-911. J. Carmichael Calder, S. H. Spencer Compton, and Joshua Stein, “A Report on Title Insurance in International Real Estate Transactions,” Briefings in Real Estate Finance, Vol. 4, No. 2, September 2004, pp. 165-172. “Clouds on the Horizon after Title Industry’s Bright Year,” A.M. Best Special Report, Oct 11, 2005. David B. Cox, “Report to the State of Florida Department of Insurance Regarding Title Insurance Rates,” Florida Department of Insurance, December 1997. Randy E. Dumm and David A. Macpherson, “A Preliminary Comparative Financial Analysis of Title Insurance Companies,” Research Project for the Florida Office of Insurance Regulation, December 2005. Scott B. Ehrlich, “Avoidance of Foreclosure Sales as Fraudulent Conveyances: Accommodating State and Federal Objectives,” Virginia Law Review, Vol. 73, No. 4, 1985, pp. 933-980. Fitch Ratings (as of December 6, 2004). Deborah Ann Ford, “Title Assurance and Settlement Charges,” AREUEA Journal, Vol. 10, No. 3, 1982, pp. 297-330. Alfred E. Hofflander and David Shulman, “The Distribution of Title Insurance: The Unregulated Intermediary,” The Journal of Risk and Insurance, Vol. XLIV, No. 3, September 1977, pp. 435-446. Don Koch, “Title Insurance: A Regulatory Perspective,” Journal of Insurance Regulation, Vol. 12, NO. 1, Fall 1993, pp. 3-13. R. J. Lehman, “A New Chapter in Title Insurance,” Best’s Review, Vol. 106, No. 2, June 2005, pp. 33-36. Robin Paul Malloy and Mark Klapow, “Attorney Malpractice for Failure to Require Fee Owner’s Title Insurance in a Residential Real Estate Transaction,” St. John’s Law Review, Vol. 74, No. 2, Spring 2000, pp. 407-449.

26
Beth Mattson-Tieg, “Title Insurers Enter ‘Virgin Markets’”, National Real Estate Investor, Vol. 46, No. 8, August 2004, pp. 48-51. Bill Moody, “A Timeline for Title Insurance,” Mortgage Banking, Vol. 65, No. 11, August 2005, pp. 57-62. Bill Moody, “The Competitive Landscape of Title,” Mortgage Banking, Vol. 63, No. 11, August 2003, pp. 46-53. Charles Nyce and M. Martin Boyer, “An Analysis of the Title Insurance Industry,” Journal of Insurance Regulation, Vol. 17, No. 2, Winter 1998, pp. 213-255. James M. Pedowitz, “Condominium Unit Title Insurance,” St. John’s Law Review, Vol. 73, No. 1, Winter 1999, pp. 183-197. Rocky Mountain News, November 17, 2005, “Title Insurance ‘Sham’; State Shutters Eleven Companies in Alleged Kickback Schemes” Moses K. Rosenberg, “Historical Perspective of the Development of Rate Regulation of Title Insurance,” The Journal of Risk and Insurance, Vol. XLIV, No. 2, June 1977, pp. 193-209. H. Lee Roussel and Moses K. Rosenberg, “The High Price of ‘Reform’: Title Insurance Rates and the Benefits of Rating Bureaus,” The Journal of Risk and Insurance, Vol. XLVIII, No. 4, December 1981, pp. 638-648. John Sayers, “How Are Title Insurance Companies Using GIS?” BNET Financial Services, October 31, 2005. Jerry D. Todd and Richard W. McEnally, “Profitability and Risk in the Title Insurance Industry –The Texas Experience,” The Journal of Risk and Insurance, Vol. XLI, No. 3, September 1974, pp. 415-434. Kevin E. Villani and John Simonson, “Real Estate Settlement Pricing: A Theoretical Framework,” AREUEA Journal, Vol. 10, No. 3, 1982, pp. 249-275. Lawrence J. White, “The Title Insuance Industry, Reverse Competition, and Controlled Business – A Different View,” The Journal of Risk and Insurance, Vol. LI, No. 2, June 1984, pp. 308-319.

27
Table 1 2004 Property/Casualty (Selected) and Title
Insurance Premiums Line of Insurance Net Premium Written ($000) Private Passenger Auto $156,734,038 Homeowner Multiple Peril $49,988,877 Other Liability $40,720,856 Workers Compensation $36,760,327 Commercial Multiple Peril $29,134,347 Commercial Auto $26,722,522 Title Insurance $15,488,147 Reinsurance $13,697,298 Accident & Health $9,955,816 Medical Malpractice $9,191,530 Fire $8,316,595 Allied Lines $8,307,595 Inland Marine $8,215,433 Other Lines $4,601,096 Mortgage Guaranty $4,323,176 Surety $3,857,003 Products Liability $3,395,002 Financial Guaranty $3,115,495 Ocean Marine $2,827,554 Aircraft $2,180,122 Farmowners Multiple Peril $2,118,462 Boiler & Machinery $1,572,208 Fidelity $1,309,335 Earthquake $1,098,392 Credit $806,449 Burlary & Theft $138,837 Source: Insurance Information Institute and NAIC Annual Statement Database

28
Table 2 Premiums by Top Six Florida Title Insurance Groups (2004)
Group Percent of Direct Premium Written Cumulative Percentage
Fidelity National Financial 28.38% 28.38% Attorneys Title Inc. 21.94% 50.32% First American Title 18.92% 69.24% Land America 14.28% 83.52% Stewart Title 8.60% 92.12% Old Republic 6.66% 98.78% Source: NAIC Annual Statement Database

29
Table 3
Direct Premiums Written 1995-2004 Florida and United States
Year FL U.S. FL/US 1995 $440,683,442 $4,091,726,971 10.77% 1996 $505,772,971 $5,011,453,957 10.09% 1997 $556,541,326 $5,524,086,890 10.07% 1998 $709,631,663 $7,504,683,903 9.46% 1999 $796,869,569 $8,061,396,286 9.89% 2000 $745,718,415 $7,260,111,728 10.27% 2001 $865,036,304 $9,124,617,201 9.48% 2002 $1,141,899,399 $11,950,486,929 9.56% 2003 $1,545,460,129 $15,654,386,946 9.87% 2004 $1,809,489,923 $15,502,481,749 11.67% Source: NAIC Annual Statement Database
Table 4 Premiums by Distribution Method- Florida
1995-2004
Year FL Total FL Direct
Operations PCT FL Non-Affiliate
Agencies PCT
FL Affiliate Agencies PCT
1995 $440,683,442 $45,528,171 10.33% $378,225,312 85.83% $16,929,959 3.84% 1996 $505,772,971 $47,635,776 9.42% $437,949,045 86.59% $20,188,150 3.99% 1997 $556,541,326 $56,826,205 10.21% $477,431,771 85.79% $22,283,350 4.00% 1998 $709,631,663 $76,451,923 10.77% $603,230,411 85.01% $29,949,329 4.22% 1999 $796,869,569 $76,262,308 9.57% $690,421,016 86.64% $30,186,245 3.79% 2000 $745,718,415 $79,632,877 10.68% $638,991,174 85.69% $27,094,364 3.63% 2001 $865,036,304 $100,652,525 11.64% $720,278,196 83.27% $44,105,583 5.10% 2002 $1,141,899,399 $123,134,564 10.78% $957,541,992 83.86% $61,222,843 5.36% 2003 $1,545,460,129 $184,039,524 11.91% $1,285,211,085 83.16% $76,209,520 4.93% 2004 $1,809,489,923 $177,233,893 9.79% $1,537,198,819 84.95% $95,057,211 5.25% Source: NAIC Annual Statement Database

30
Table 5
Summary Statistics From HUD-1 Forms Variable N Mean Std. Dev. Min Max Contract Selling Price 48 $273,412.50 $639,629.50 $7,500.00 $4,500,000.00 Loan Value 35 $283,528.10 $672,350.90 $16,360.00 $4,100,000.00 Lenders Coverage Amount 35 $286,221.50 $672,358.60 $16,360.00 $4,100,000.00 Lenders Premium 35 $233.05 $216.71 $25.00 $1,200.00 Lenders Premium Per $1000 Of Coverage 35 $2.06 $2.34 $0.01 $12.22 Owners Coverage Amount 45 $269,673.30 $659,277.40 $7,500.00 $4,500,000.00 Owners Premium 45 $1,372.42 $2,845.01 $100.00 $19,352.50 Owners Premium Per $1000 Of Coverage 44 $5.59 $1.30 $3.78 $13.33 Total Settlement Cost-Buyer 48 $6,376.17 $14,496.98 $11.00 $100,505.00 Total Settlement Cost-Seller 45 $15,106.58 $26,897.96 $488.00 $180,500.00 Total Settlement Cost 48 $20,538.58 $39,845.13 $644.00 $281,005.00 Total Title Cost 48 $2,047.67 $3,503.34 $225.00 $24,757.50 Total Title Cost/Total Settlement Cost 48 14.11% 11.11% 4.20% 55.75% Title Insurance Premium/Total Title Cost 48 66.23% 15.14% 18.20% 93.85% Total Title Cost by Category 1101 Settlement of Closing Fee 48 $187.52 $125.58 $10.00 $675.00 1102 Abstract or title search 46 $122.74 $72.12 $35.00 $350.00 1103 Title Examination 46 $95.13 $79.57 $5.00 $360.00 1104 Title Ins. Binder 1 $195.00 $195.00 $195.00 1105 Document preparation 10 $207.50 $140.52 $25.00 $475.00 1106 Notary Fees 3 $383.33 $332.92 $100.00 $750.00 1107 Attorney Fees 1 $3,000.00 $3,000.00 $3,000.00 1108 Title Insurance 48 $1,465.55 $2,750.72 $100.00 $19,327.50 1110a Endorsements 35 $246.93 $318.56 $25.00 $2,010.00 1111 Shipping and Handling 38 $57.82 $30.32 $15.00 $140.00 1112 Warehouse Fee 4 $48.75 $34.49 $25.00 $100.00 1300s Anything Regarding Title 4 $116.25 $92.32 $25.00 $230.00
Table 6 Relationship Between Contract Sales Price and Title Insurance Costs
N Contract
Sales Price
Total Settlement
Cost Total Title
Costs
Title Costs/Total Settlement
Cost
Title Costs/Contr
act Sales Price
Total Title Cost Less Premium
<$100,000 14 $49,414 $5,499 $702 20.23% 1.54% $347 $101,000-$150,000 9 $126,589 $13,657 $1,251 9.17% 1.00% $397 $151,000-$250,000 16 $193,819 $16,003 $1,570 12.82% 0.83% $465 $250,001-$1,250,000 8 $461,450 $31,113 $3,416 12.17% 0.75% $829 >$1,250,000 1 $4,500,000 $281,005 $24,758 8.81% 0.55% $5,430 All Homes 48 $273,413 $20,539 $2,048 14.11% 1.05% $2,765 Source: HUD-1 Forms

31
Table 7 Change in Premium Cost Analysis (Florida)
Part A: Simultaneous Policies No Prior Coverage Purchased From Carrier Prior Coverage Purchased From CarrierCoverage Premium Cost/$1000 Change in Cost Premium Cost/$1000 Change in Cost $50,000 $312.00 $6.24 $190.00 $3.80 $100,000 $600.00 $6.00 3.85% $355.00 $3.55 6.58% $250,000 $1,350.00 $5.40 10.00% $805.00 $3.22 9.30% $500,000 $2,600.00 $5.20 3.70% $1,555.00 $3.11 3.42% $1,250,000 $5,725.00 $4.58 11.92% $3,555.00 $2.84 8.55%
Part B: Lender or Owners Policies
No Prior Coverage Purchased From Carrier Prior Coverage Purchased From CarrierCoverage Premium Cost/$1000 Change in Cost Premium Cost/$1000 Change in Cost $50,000 $287.00 $5.74 $165.00 $3.30 $100,000 $575.00 $5.75 (0.17%) $330.00 $3.30 0.00% $250,000 $1,325.00 $5.30 7.83% $780.00 $3.12 5.45% $500,000 $2,575.00 $5.15 2.83% $1,530.00 $3.06 1.92% $1,250,000 $5,700.00 $4.56 11.46% $3,530.00 $2.82 7.71% Source: First American Title Company web site ( http://titlefees.firstam.com/Titlefees.asp)

32
Table 8A Price Comparison: Florida versus All Inclusive States (Simultaneous Policies)
No Prior Purchase From Carrier
Coverage Premium (CA)
Cost/$1000 (CA)
Premium (PA)
Cost/$1000 (PA)
Premium (TX)
Cost/$1000 (TX)
Avg Prem (AI)
Avg Cost (AI)
Premium (FL)
Cost/$1000 (FL)
$50,000 $659.00 $13.18 $558.75 $11.18 $620.00 $12.40 $612.58 $12.18 $312.00 $6.24 $100,000 $912.00 $9.12 $858.75 $8.59 $971.00 $9.71 $913.92 $8.85 $600.00 $6.00 $250,000 $1,412.00 $5.65 $1,608.75 $6.44 $1,799.00 $7.20 $1,606.58 $6.04 $1,350.00 $5.40 $500,000 $2,106.00 $4.21 $2,858.75 $5.72 $3,179.00 $6.36 $2,714.58 $4.96 $2,600.00 $5.20 $1,250,000 $3,857.00 $3.09 $5,421.25 $4.34 $7,071.50 $5.66 $5,449.92 $3.71 $5,725.00 $4.58
Prior Purchase From Carrier
Coverage Premium (CA)
Cost/$1000 (CA)
Premium (PA)
Cost/$1000 (PA)
Premium (TX)
Cost/$1000 (TX)
Avg Prem (AI)
Avg Cost (AI)
Premium (FL)
Cost/$1000 (FL)
$50,000 $596.00 $11.92 $502.88 $10.06 $620.00 $12.40 $572.96 $11.46 $190.00 $3.80 $100,000 $788.00 $7.88 $772.88 $7.73 $971.00 $9.71 $843.96 $8.44 $355.00 $3.55 $250,000 $1,208.00 $4.83 $1,447.88 $5.79 $1,799.00 $7.20 $1,484.96 $5.94 $805.00 $3.22 $500,000 $1,792.00 $3.58 $2,572.88 $5.15 $3,179.00 $6.36 $2,514.63 $5.03 $1,555.00 $3.11 $1,250,000 $3,265.00 $2.61 $4,879.12 $3.90 $7,071.50 $5.66 $5,071.87 $4.06 $3,555.00 $2.84 Source: First American Title Company web site ( http://titlefees.firstam.com/Titlefees.asp) *-The premiums for Texas are the same regardless of a prior purchase from the carrier.

33
Table 8B Calculation of Breakeven Title Costs (All Inclusive States Versus Florida)
No Prior Purchase From Carrier
Coverage Avg Prem (AI) Premium (FL)
Estimated Breakeven Title
Costs $50,000 $612.58 $312.00 $300.58 $100,000 $913.92 $600.00 $313.92 $250,000 $1,606.58 $1,350.00 $256.58 $500,000 $2,714.58 $2,600.00 $114.58 $1,250,000 $5,449.92 $5,725.00 ($275.08)
Prior Purchase From Carrier
Coverage Avg Prem (AI) Premium (FL)
Estimated Breakeven Title
Costs $50,000 $572.96 $190.00 $382.96 $100,000 $843.96 $355.00 $488.96 $250,000 $1,484.96 $805.00 $679.96 $500,000 $2,514.63 $1,555.00 $959.63 $1,250,000 $5,071.87 $3,555.00 $1,516.87 Source: First American Title Company web site ( http://titlefees.firstam.com/Titlefees.asp)

34
Table 9
Price Comparison: Other States Versus Florida
Part A: Simultaneous Policies No Prior Coverage Purchased From Carrier Prior Coverage Purchased From Carrier
Coverage Premium
(OS) Cost/$1000
(OS) Premium
(FL) Cost/$1000
(FL) Premium
(OS)Cost/$1000
(OS) Premium
(FL) Cost/$1000
(FL) $50,000 $235.75 $4.72 $312.00 $6.24 $225.12 $4.50 $190.00 $3.80 $100,000 $375.25 $3.75 $600.00 $6.00 $340.62 $3.41 $355.00 $3.55 $250,000 $691.20 $2.76 $1,350.00 $5.40 $641.56 $2.57 $805.00 $3.22 $500,000 $1,205.95 $2.41 $2,600.00 $5.20 $1,108.42 $2.22 $1,555.00 $3.11 $1,250,000 $2,518.20 $2.01 $5,725.00 $4.58 $2,244.06 $1.80 $3,555.00 $2.84
Part B: Lenders or Owners Policies
No Prior Coverage Purchased From Carrier Prior Coverage Purchased From Carrier
Coverage Premium
(OS) Cost/$1000
(OS) Premium
(FL) Cost/$1000
(FL) Premium
(OS) Cost/$1000
(OS) Premium
(FL) Cost/$1000
(FL) $50,000 $184.38 $3.69 $287.00 $5.74 $125.65 $2.51 $165.00 $3.30 $100,000 $315.69 $3.16 $575.00 $5.75 $206.35 $2.06 $330.00 $3.30 $250,000 $622.08 $2.49 $1,325.00 $5.30 $428.65 $1.71 $780.00 $3.12 $500,000 $1,092.15 $2.18 $2,575.00 $5.15 $766.65 $1.53 $1,530.00 $3.06 $1,250,000 $2,236.40 $1.79 $5,700.00 $4.56 $1,675.15 $1.34 $3,530.00 $2.82 Source: First American Title Company web site ( http://titlefees.firstam.com/Titlefees.asp)

The Florida Office of Insurance Regulation
A Preliminary Comparative Financial Analysis of Title Insurance Companies
July 2006
This preliminary report was produced pursuant to Section 627.782, Florida Statutes.

ACKNOWLEDGMENT This report was produced by: Randy E. Dumm, PhD Associate Professor of Risk Management and Insurance Department of Risk Management/Insurance, Real Estate and Business Law College of Business Florida State University Tallahassee, FL 32306-1110 Email: [email protected] Phone: 850-644-8214 and David A. Macpherson, PhD Rod and Hope Brim Eminent Scholar in Economics Department of Economics Florida State University Tallahassee, Fl 32306-2180 Email: [email protected] Phone: 850-644-3586 NOTE: This report is a preliminary overview of the state of the title insurance in Florida. The 2006 Florida Legislature provided in Specific Appropriation 2614, $150,000 to the Office of Insurance Regulation to gather title insurance data in accordance with section 624.501(27)(e)(2), Florida Statutes. The data shall be collected from licensed agents, agencies, and insurers. The information collected shall be sufficient to give due consideration to the factors set forth in section 627.782, Florida Statutes. To assist with its data collection and analysis, the office shall retain the services of an independent actuary with experience and expertise in the title insurance industry.
1
A Preliminary Comparative Financial Analysis of Title Insurance Companies
Executive Summary
In today’s environment, the real estate market and the insurance market enjoy a close relationship.
Along with hazard insurance, title insurance is usually required to close a real estate transaction. Quality
of title is a major concern in real property transactions and is typically provided by a title search, title
abstract, attorney’s letter of opinion, title certificate, and title insurance. Arrunada (2001) finds that title
insurance is present in 85 percent of residential sales transactions in the U.S. and provides protection to
the owner and/or lender against such problems as unknown recorded liens, defects in public records,
forgeries, and improperly delivered deeds.
The Florida Office of Insurance Regulation (OIR) is charged with ensuring that the insurance
industry in Florida is financially viable while providing insurance products to Florida consumers at a fair
price. The Florida OIR oversees insurers relative to licensing, premium rates, solvency, and other factors.
To fulfill its statutory responsibility, the OIR uses performance measures and standards to evaluate
performance. In addition, the Florida Insurance Commissioner, as a member of the National Association
of Insurance Commissioners (NAIC), serves to protect the public interest and promote competitive
insurance markets.
This study provides an updated preliminary examination of title insurance rates in Florida by
providing a company-level financial analysis across states incorporating all title insurance companies that
report financial data to the NAIC. The financial analysis includes examining various aspects of the title
industry. Specifically, the study:
(1) gives a comparison of title insurance direct premiums written from 1995-2004;
(2) examines direct premiums written by channel of distribution;
(3) shows the concentration of the title industry based on market share;
(4) examines the growth of the title industry from 1995-2004 relative to total assets, premiums
written, operating income, operating expenses, and net income;

(5) examines the structure of the industry in terms of group membership and financial leverage;
and
(6) examines the financial position of title companies relative to return on assets, return on equity,
premium/surplus ratios, and loss ratios.
This initial comparative analysis shows that the housing and mortgage refinancing boom since the mid-
1990s has been very beneficial to the title industry.
In terms of results, an overall view of the industry shows that:
• Title insurance premiums are a larger share of property and casualty premiums in Florida
(5.4%) than for the U.S (3.6%);
• Title insurers in Florida have favorable loss ratios (modified loss ratio = 3.2% in 2004)
compared to nearby states such as Alabama (5.4%), Georgia (8.8%), North Carolina (12.5%),
or South Carolina (9.7%). The results in Sirmans (2005) show that premiums in Florida are
higher than in other states. As such, it appears that title insurance in Florida may be
overpriced;
• From 1995 to 2004 title insurance total direct premiums in the U.S. increased almost 280
percent to $15.5 billion while, in Florida, total direct premiums increased about 310 percent to
$1.80 billion;
• The method of delivering title insurance in Florida has not changed appreciably over the last
decade and non-affiliated agencies write a greater percentage of title insurance in Florida (85
percent) than in the U.S. as a whole (61 percent);
• Regardless of concentration measure (percent of premiums, Herfindahl index) or territory
(Florida, all-inclusive states, U.S.), the title insurance industry is highly concentrated:
In Florida, two companies wrote 50 percent of premiums and six companies wrote 99
percent of premiums in 2004:
The Herfindahl index for Florida in 2004 was 0.1966;

The average Herfindahl index for all-inclusive states (California, Texas, Pennsylvania)
for 2004 was 0.2358;
The average Herfindahl index for all states excluding Florida in 2004 was 0.2390;
The lowest Herfindahl index in any state in 2004 was 0.1844;
The top five companies in any state have consistently written at least 90 percent of the
premiums, and
• Florida is one of three states in which title insurance rates are set by regulation.
An examination of the financial condition of the title industry shows that:
• Total assets for the title industry increased about 110 percent from $54.94 billion to $115.01
billion over the period 1995 to 2004;
• Net worth for the title industry increased by 106 percent from $21.52 billion to $44.25 billion
over the period 1995 to 2004;
• Direct premiums written for the title industry increased by 211 percent from $65.5 billion to
$203.98 billion over the period 1995 to 2004;
• For the U.S., the correlation between existing home sales and premiums written for the title
industry for the period 1995 to 2004 is .86. The correlation for Florida over the same period is
.95;
• Net income for the title industry increased by 368 percent from $2.18 billion to $10.21 billion
over the period 1995 to 2004;
• Revenue from affiliated agents increased by 327 percent over the period 1995 to 2004 while
revenue from non-affiliated agents increased by 204 percent; and
• The amount paid to title agents increased by 238 percent from $43 billion to $145 billion.

An examination of the structure of the industry shows that:
• While premiums, revenue, income, etc. increased in Florida over the decade 1995 to 2004, the
basic distribution structure and number of active insurers (based on direct premium written)
remained relatively unchanged:
In Florida, non-affiliated agencies are a much more common method for distribution
and have consistently written about 85 percent of Florida title insurance while affiliated
agencies have written about 5 percent;
• Over the 1995 to 2004 period, non-affiliated agencies have consistently written about 60
percent of U.S. title insurance. The percentage of premiums written directly by title companies
has fallen from 19 percent to 14 percent, while the percentage written by affiliated agencies
has increased from 19 percent to 26 percent;
• In 2004, about 66 percent of companies were members of a group compared to 62 percent in
1995;
• Comparing title insurers who are members of insurance groups with stand-alone title insurers
shows that, over the period 1995 to 2004, companies who belonged to an insurance group
were, on average:
substantially larger
experienced greater return on assets and return on equity, but
had poorer underwriting results (higher loss ratios).
An examination of financial performance trends for the title industry shows that:
• The title industry’s financial position improved significantly over the last decade;
• For the period 1995 to 2004, return on assets for the title industry increased from 4.10 percent
in 1995 to 5.90 percent while the return on equity increased from 3.10 percent in 1995 to 10.80
percent in 2004:

For the title industry, both return on assets and return on equity spiked in 1998,
bottomed out in 2000, and increased rapidly through 2003. Both returns declined in
2004;
Comparing the return on equity for title insurers to the return on equity for property
and casualty insurers shows that title insurers are impacted by the economic cycle and
housing market activity while property and casualty insurers are more impacted by
price competition (e.g., soft market conditions) and excessive underwriting losses;
• The proportion of direct premiums written as a percentage of operating income increased from
89 percent to 94 percent over the period 1995 to 2004;
• Total expenses relative to revenue decreased over the period 1995 to 2004;
• The proportion of operating income allocated to losses and loss expense remained relatively
constant at about 6 percent; and
• The industry’s loss ratio decreased only slightly from 7.80 percent in 1995 to 6.9 percent in
2004.
This preliminary study could provide the basis for a more comprehensive integrated comparative
cost and financial analysis of the title insurance industry in Florida. This could include a larger sample of
HUD-1 forms and a data call to all title insurers for premium rate quotes and related services charges. A
more sophisticated statistical analysis could be performed relating the cost of title insurance to state
characteristics such as rate setting requirements (promulgated, unregulated, etc.), total title charges (all-
inclusive, risk rate, etc.), loss ratios, and distribution methods. The data call could also require Florida
insurers to provide measures for premiums earned and losses incurred by size of risk over some historical
period such as the last five years. The loss data could be developed to ultimate using standard actuarial
techniques. The data could then be analyzed to determine whether the current rates by layer of coverage
are appropriate.
A Preliminary Comparative Financial Analysis of Title Insurance Companies
I. Introduction
In today’s environment, the real estate market and the insurance market enjoy a close relationship.
Both hazard insurance and title insurance are typically required to close a real estate transaction. Quality
of title is a major concern in real property transactions and is typically provided by a title search, title
abstract, attorney’s letter of opinion, title certificate, and title insurance. Arrunada (2001) finds that title
insurance is present in 85 percent of residential sales transactions in the U.S. and provides protection to
the owner and/or lender against such problems as unknown recorded liens, defects in public records,
forgeries, and improperly delivered deeds.
Problems with title can be both on and off record (Malloy and Klapow (2000)). Documents may
be on record but may be forged or fraudulent. Neglecting to record a document or mistakes by the
recording office create off record risks. Items that are generally excluded from coverage in a title policy
include any known defects, risks posed by zoning and environmental regulations, eminent domain,
defects causing no loss or damage, and defects subsequent to the date of the policy.
Title companies issue two main types of title policies: an owner’s policy covering the amount of
the purchase price and a lender’s policy covering the amount of the mortgage. While the owner may be
strongly encouraged to purchase an owner’s policy, the lender’s policy is usually mandatory since it is
required by the secondary mortgage market. Since real estate lending is no longer “local” because of
mortgage securitization, title insurance is a way of reassuring the national capital markets of the quality of
local title searches.
Title insurance is in a unique position since it is insuring against events that have already occurred
rather than unknown future events. Because of the nature of the business, the major expense for title
insurers is performing title searches. A November 28, 2005 ALTA press release indicates that title
insurers spend ten times as much on title searches and curing title problems as what they pay in claims.

As a result, whereas property and casualty insurers pay, on average, 87 cents for each dollar of premium
collected, title insurers pay about five cents (Asaro, October 31, 2005).
The Florida Office of Insurance Regulation (OIR) seeks to ensure that insurance companies in
Florida are financially viable and still provide insurance products to Florida consumers at a fair price.
The Florida OIR oversees insurers relative to licensing, premium rates, solvency, and other factors. To
fulfill its statutory responsibility, the OIR uses performance measures and standards to evaluate
performance. In addition to the OIR, the Florida Insurance Commissioner serves as a member of the
National Association of Insurance Commissioners (NAIC). The NAIC serves to protect the public
interest and promote competitive insurance markets.
Given the importance of title insurance in providing guarantees to purchasers of real property and
considering the cost that this insurance adds to the real estate transaction, title insurance continues to be
an insurance product that demands regulatory oversight and scrutiny. Section 627.782 of the Florida
Code regulates title insurance rates and charges for related title services. In accordance with Section
627.782, title insurance premiums in Florida are promulgated by the Office of Insurance Regulation
(OIR). Charges for related title services (provided for in Section 627.7711) are permitted, can be no less
than actual cost, and are not currently regulated by the OIR except that they can be no less than actual
cost. However, Section 627.782 permits limitations to be placed by rule on related title service charges.
The Code also (1) requires that the insurer retain no less than 30 percent of the risk premium, (2) requires
uniform policy forms, and (3) provides preemption of Federal anti-trust laws.
Subsection 627.782(7) reads: “The commission shall, in accordance with the standards provided in
subsection (2), review the premium as needed, but not less frequently than once every 3 years, and shall,
based upon the review required by the subsection, revise the premium if the results of the review so
warrant.” Per this requirement, this project provides an updated preliminary examination of title
insurance rates in Florida by providing a company-level financial analysis across states incorporating all
title insurance companies that report financial data to the NAIC.

The financial analysis includes examining various aspects of the title industry. Specifically, the
study:
(1) gives a comparison of title insurance direct premiums written from 1995-2004;
(2) examines direct premiums written by channel of distribution;
(3) shows the concentration of the title industry based on market share;
(4) examines the growth of the title industry from 1995-2004 relative to total assets, premiums
written, operating income, operating expenses, and net income;
(5) examines the structure of the industry in terms of group membership and financial leverage;
and
(6) examines the financial position of title companies relative to return on assets, return on equity,
and premium/surplus ratios.
This initial comparative analysis shows that the housing and mortgage refinancing boom since the mid-
1990s has been very kind to the title industry.
In addition, the analysis indicates that the title insurance industry in Florida differs from the rest of
the U.S. in some important ways. First, title insurance premiums are a larger share of property and
casualty premiums in Florida (5.4%) than for the U.S (3.6%). Second, the method of delivering title
insurance in Florida is different from the U.S. as whole. In Florida, non-affiliated agencies are a much
more common delivery method and have consistently written about 85 percent of Florida title insurance.
Non-affiliated agencies have written, on average, about five percent of Florida title insurance. In contrast,
for the U.S. as a whole, non-affiliated agencies have consistently written about 60 percent of title
insurance with affiliated agencies writing about 26 percent.
In Florida, charges for related title services are permitted (per Section 627.7711), can be no less
than actual cost, and are not currently regulated by the Florida OIR, except that they cannot be less than
actual cost. As shown in Sirmans (2005), the insurance premium makes up about two-thirds of the total

cost of title insurance with related charges comprising one-third. Thus related charges add another 50
percent to the cost of the premium itself.
II. Previous Examination of Title Insurance Rates
A previous report completed in December 1997 by The David Cox Company examined title
insurance rates in Florida. This report analyzed Florida’s title insurance experience for the purpose of
determining the appropriate risk premium and charges for related title services. Recommendations of this
report were primarily to correct the subsidization of operations not intended to be funded by the risk
premium and to promote competition and efficiency. Some specific recommendations were: (1) current
title insurance risk rates were excessive and should be reduced by 13 percent, (2) that agents’ share of the
risk premium should remain at no more than 70 percent, (3) additional steps should be taken to assure that
expenses used in rate-making are not excessive due to reverse competition.
III. Financial Analysis of the Title Insurance Industry
This study presents an initial comparative analysis of title insurers using basic financial statement
data provided by title insurers to the NAIC. As part of this analysis, the study will examine financial
results based on operation type (i.e., direct, non-affiliated, and affiliated), geographic location, group
affiliation, and by loss ratio.
A. Market Structure of the Title Insurance Industry
The housing and mortgage financing/refinancing boom since the early-mid 1990s has proven to be
very beneficial to the title insurance business. Table 1 shows the direct premiums written for title
insurance relative to other types of insurance for the U.S. and Florida. Nationally and for Florida, it is
interesting to note that title insurance has larger total premiums than medical malpractice and many other
types of insurance. Title insurance premiums are a larger share of property and casualty premiums in
Florida (5.4%) than for the U.S.(3.6%). In fact, Florida’s title insurance premiums are more than 11% of
national title insurance premiums.

B. The Business of Title Insurance in Florida
Table 2 gives a comparison of title insurance total direct premiums written for each year from
1995 through 2004. Over this period, total premiums written in the U.S. increased almost 280 percent
from $4.13 billion to $15.50 billion. Over the same period, total direct premiums in Florida have
increased about 310 percent from $440 million in 1995 to $1.81 billion. The share of Florida premiums
to the total has stayed relatively constant at about 10 percent. With the exception of the all-inclusive
states, title insurance premiums do not include related title services, which in Florida were equal to 34
percent of total title costs (Sirmans, 2005). Interestingly, the Florida share of premiums in 2004 reflects
the continued boom in the Florida housing market as activity slowed in other areas. As total premiums in
the U.S. declined for 2004, the total premiums in Florida increased.
The use of a mixed distribution system is common in the title insurance industry. There are three
methods by which title insurance is delivered to consumers: (1) policies written directly by the company,
(2) policies written by affiliated agents, and (3) policies written by non-affiliated agents. As Nyce and
Boyer (1998) discuss, this mixed distribution system can give the title industry flexibility in adapting to
changes in demand and may help balance the high costs of delivering title insurance. In Florida, it is not
clear that these costs are being balanced by a more effective distribution method since the title insurance
delivery system hasn’t changed significantly over the last decade,
Table 3A provides the distribution of premiums written by distribution method for the U.S. for
1995 to 2004. As the table demonstrates, non-affiliated agencies have consistently written about 60
percent of U.S. title insurance. The percentage of premiums written directly by title companies has fallen
from 19 percent to 14 percent, while the percentage written by affiliated agencies has increased from 19
percent to 26 percent.
Table 3B gives the breakdown of direct premiums written by distribution method in Florida from
1995 to 2004. As seen, the non-affiliated agencies write a greater percentage of the title insurance in
Florida than in the U.S. as a whole. Non-affiliated agencies in Florida consistently have written about 85

percent of Florida title insurance. On the other hand, affiliated agencies are a much less utilized delivery
method as they write only about five percent of Florida title insurance. About 10 percent is written
directly by the title company.
C. Market Share
As evidenced by percent of premiums and the more formal Herfindahl index measure, the title
insurance industry is indeed a concentrated industry. Table 4 shows the market shares by groups of title
insurers in Florida. As seen, two title companies control 50 percent of the market and six companies
control 99 percent of the market. Since the insurance industry is regulated at the state level, it is most
useful to measure market share and competition at the state level. Table 5A gives concentration measures
for the title industry by state for 2004. As at the national level, the title industry appears to be highly
concentrated at the state level. The table shows that the percent of premiums written by the top five
companies in each state is seldom less than ninety percent. In Florida, for example, five companies wrote
more than 92 percent of the business in 2004.
The Herfindahl index shown in Tables 5A and 5B is a measure of industry concentration and is
equal to the sum of the squared market shares of the firms in the industry. Since the Herfindahl index is
the sum of the squares of the market shares of each individual firm, the index can have a wide range. The
maximum Herfindahl of 1.0 indicates a monopoly and as such, higher index values indicate a decrease in
competition and an increase in pricing power. The Herfindahl indexes show that the title industry is
highly concentrated by state. In no state does the index drop below 0.1844. The Herfindahl index for
Florida is 0.1966.
The U.S. Department of Justice (DOJ) uses the Herfindahl index to determine whether mergers are
detrimental to the economy. If the index increases by 0.01, then the DOJ will investigate the merger
(though this can vary case by case). The DOJ regards Herfindahl index values below 0.1 to be
unconcentrated, 0.10 to 0.18s to be moderately concentrated, and those greater than 0.18 to be highly

concentrated. The major concern is that, as market concentration rises, competition and efficiency
decrease, and the likelihood of collusion and monopoly increase.
Table 5A also gives the status of rate regulation by state. In only ten states and the District of
Columbia are rates set competitively. Twenty-three states require prior approval for rate setting and
twelve states utilize a file and use method. In three states, rates are set by regulation (the Insurance
Commissioner promulgates the rate). Florida is one state in which rates are promulgated.
Table 5B compares the concentration of the title industry in Florida to the all-inclusive states
(California, Pennsylvania, and Texas) and to all states except Florida. In the all-inclusive states, over 93
percent of title business is controlled by the top five companies. For all states, the top five companies
control about 95 percent of title business. The Herfindahl index for the all-inclusive states is 0.2358 and
is 0.2390 for all states excluding Florida. In all cases, the title industry is seen to be highly concentrated.
Tables 6A and 6B provide additional information using state level data for 1995, 1999, and 2004.
Table 6A provides modified loss ratios by state and includes the District of Columbia. Loss ratios in both
tables are calculated as direct losses paid divided by direct premiums earned as loss adjustment expense
data were not available at the state level. Table 6B allows for comparisons between Florida and other
states. As can be seen, modified loss ratios are lower in Florida than in other states for each year shown
in Table 6A. The very favorable loss experience for title insurers in Florida (modified loss ratio = 3.2% in
2004) compared with neighboring states (Alabama = 5.4%, Georgia = 8.8%, North Carolina = 12.5%,
South Carolina = 9.7%) provides an indication that title insurance may be overpriced in Florida.
D. Financial Analysis of Title Industry
Table 7 shows the growth in the title insurance industry from 1995 to 2004. Average total assets
increased from $54.9 billion to $115.01 billion. This is an overall increase of about 110 percent or an
average growth per year of almost nine percent. Over the same period, net worth increased by about 106
percent from $21.52 billion to $44.25 billion. Direct premiums written rose dramatically by 211 percent
from $65.50 billion to $203.98 billion. Net premiums written and net premiums earned experienced

similar increases. Operating income for the title companies increased 194 percent. Meantime, net income
increased 368 percent from $2.18 billion to $10.21 billion.
The revenue values show that, as total revenue rose by about two hundred percent, the primary
contributor to this increase was revenue from affiliated agents. Although the absolute dollar amount for
this category is less than the other categories, revenue in this category increased by 327 percent over this
time period. Revenue from non-affiliated agents rose by 204 percent while revenue from direct
operations increased by 103 percent. This helps to illustrate the diversity in method of distribution for the
title industry.
Table 7 shows that, as revenue and income increased dramatically, total expenses paid also rose
rapidly by about 184 percent. Incurred loss and loss adjustment expenses increased at a much lower
amount of 118 percent. Over this period, title companies saw a sharp increase (238 percent) in the total
amount paid to the title agent from $43.06 billion to $145.35 billion.
Table 7 and Table 8 show that the title industry experienced significant growth over the decade
1995 to 2004, fueled by the booming housing market, the rapid increase in house prices, and the thriving
mortgage refinancing industry. Assets, revenues, and income for title companies increased dramatically
to unprecedented levels.
E. Financial Analysis of the Title Industry: Ratios
As the title industry thrived from 1995 to 2004, Table 8 shows that the basic structure of the
industry remained relatively constant. In 1995, about 62 percent of companies were members of a group.
This percentage increased only slightly in 2004 to 66 percent. The degree of leverage dropped slightly
from 50 percent to 45 percent.
Table 8 also shows that the industry’s financial position improved significantly. The return on
assets increased from 4.10 percent in 1995 to 5.90 percent in 2004. The return on equity increased even
more from 3.10 percent to 10.80 percent.

One common measure of a property-casualty insurer’s financial strength is premium to surplus
ratio. This ratio is computed by dividing net premiums written by surplus and is designed to measure the
ability of the insurer to absorb above-average losses. Premium to surplus measures of three or less are
considered acceptable. While the unique nature (i.e., small risk component) of title insurance makes this
measure less relevant, premium to surplus measures were calculated and reported in Table 8. As seen, the
average ratio has increased over time, indicating that, overall, industry financial strength has declined.
The net premium written relative to surplus increased from 2.60 times to 3.36 times.
Table 8 shows that the industry’s sources of revenue shifted somewhat. The thirty percent of
revenue produced by direct operations in 1995 had decreased to 22 percent in 2004. The percent of
revenue from non-affiliated agents stayed relatively constant at about 54 percent. However, the
percentage of revenue produced by affiliated agents increased from 16.50 percent to 25 percent.
The industry’s relationship between direct premiums written and revenue increased slightly over
the period. Direct premiums written were 88 percent of revenue in 1995 and had increased to 92 percent
in 2004. Escrow and settlement costs remained a small percentage of revenue (2 to 3 percent) whereas
other fees decreased as a percentage of revenue from about nine percent to about six percent. Total
expenses relative to direct premiums written dropped from 1.22 times to 1.09 times.
The proportion of expenses paid to title agents increased from 58 percent in 1995 to 69 percent in
2004. Incurred expenses as a percentage of operating income remained relatively constant at about 95
percent, as did expenses relative to revenue at 95 percent.
In 1995, direct premiums written made up 89 percent of operating income. By 2004 this
proportion had increased to 94 percent. Also, the percentage of operating income paid out in losses and
loss expense remained constant at slightly more than six percent. Most of operating income was paid out
in operating expenses with the proportion being about 95 percent for both 1995 and 2004.
The historically low loss ratio for the title industry was upheld over this decade. In 1995, the loss
ratio was almost eight percent. By 2004 this had decreased slightly to about seven percent.

F. Financial Analysis of the Title Industry: Annual Measures
Table 9 presents a more detailed year-by-year financial picture of the title industry over the period
1995 to 2004. After an initial stagnant period, total assets began increasing moderately in the late 1990s
and then began increasing dramatically in 2001 through 2004. Surplus performed in a similar manner,
experiencing rapid growth in the 2000s. On the other hand, premiums experienced steady growth, with
the exception of 2000 when there was a slight drop. Following 2000, however, premiums enjoyed a
significant rise until 2003. Premiums dropped slightly in 2004. Total revenue followed the same pattern
as income: steady increases except for 2000 and 2004. Expenses in the title industry have increased
steadily except for declines in 2000 and 2004.
Table 10 gives year-by-year ratios for the title industry over the period 1995 to 2004. The patterns
of these ratios reflect those for the dollar amounts given in Table 9.
As illustrated in Figure 1, the movement in total assets, capital and surplus, net premium written,
operating income, and net income have trended upward over the period 1995 to 2004. During this period,
title insurers saw substantial growth in average total assets and net premiums written.
Given the demand for title insurance is driven primarily by the demand for housing, it is not
surprising that there is a very strong, positive relationship between existing home sales and growth in title
insurance premiums. Table 11 provides correlation results between housing sales and title insurance
premiums for Florida and for the United States. For the U.S., the correlation between existing home sales
and premiums written for the title industry for the period 1995 to 2004 is .86. The correlation for Florida
over the same period is .95. These correlations serve to highlight the fact that the economic factors that
impact on the housing cycle are likely to have a greater impact on title insurer performance (e.g., asset
growth, total profitability) than losses paid under the title insurance contract.
The movement in several expense and operational measures is shown in Figure 2. The amount
paid to title agents as a percentage of total expenses has ranged between 58 percent and 70 percent.
Premiums as a percentage of operating income have increased over the 10-year period. During the period,

expenses as a percentage of operation income has remained relatively flat. This measure was 95.7
percent at the beginning of the period and 94.5 percent at the end of the period with the most favorable
result (89.5 percent) occurring in 2002.
Figure 3 provides information on return on assets as well as loss ratios for the period under
investigation. The return on assets spiked in 1998 then decreased to bottom out in 2000. It proceeded to
increase rapidly until 2003 but then experienced a slight decline in 2004. The loss ratio results show a
very different pattern. Not surprisingly, loss ratios are much more stable than firm performance measured
by return on assets. Loss ratios grew gradually through 2001 followed by a sharp improvement in 2002.
Loss ratios have trended upward since 2002. For the period 1999-2004, Figure 3 shows a lagged,
counter-cyclical type of pattern between loss ratios and firm performance.
To gain further perspective, Figure 4 shows the return on equity for title insurers and property and
casualty insurers over the period 1995 through 2004. Return on equity for title insurers lagged behind the
return on equity for property and casualty insurers in the early years of 1995 through 1997. However,
while return on equity for property and casualty insurers spiked in 1997 and began to decline, the return
on equity for title insurers continued to increase dramatically through 1998. Title insurers then
experienced a rapid decline in return on equity through 2000. Return on equity for property and casualty
insurers had also continued to decline over this period. Beginning in 2001, return on equity for title
insurers began to increase at a rapid pace through 2003. At the same time, return on equity for property
and casualty insurers continued to decline through 2001 then began to increase. While the return on
equity for property and casualty insurers continued to increase through 2004, the return on equity for title
insurers peaked in 2003 and decreased in 2004.
The movements in the equity returns across the two industries are the result of different influences.
Whereas title insurers are impacted by the economic cycle and the robustness of the housing market, the
property and casualty industry was more impacted by price competition (e.g., soft market conditions) and
excessive underwriting losses.

G. Financial Analysis of Title Industry by Group Membership
Tables 12 and 13 present the title industry statistics by group affiliation, (i.e., whether a company
was a member of an insurance group) for the period 1995 through 2004. As the data in both tables
indicate, there are clear differences between a company that is a member of an insurance group and one
that operates independently. Group members appear to enjoy a scale advantage over their non-group
competitors and on average, are substantially larger measured by any metric. For example average firm
size (total assets) for affiliated companies was over $168 million as compared to $13 million for
unaffiliated title insurers. Significant differences also appear to exist by performance measures such as
return on assets or return on equity (capital and surplus) and underwriting-specific measures like the loss
ratio.
Total assets for the unaffiliated or stand-lone companies held relatively constant from 1995 to
2000, then began increasing through 2003. There was a sharp decline in total assets in 2004 from a high
of $24.1 billion in 2003 to $13 billion in 2004. Interestingly, in the early years (1995-1999), as total
assets held relatively constant, net income for the unaffiliateds increased dramatically from $184 million
to over one billion dollars. There was a sharp drop in net income in 2000 but then it increased every year
subsequent to 2003 when it peaked at $2.3 billion. Net income declined in 2004 from the 2003 high to
about $792 million.
As can be seen in Figure 5, the results clearly indicate that on average, members of insurance
groups enjoy superior performance compared to unaffiliated insurers. The affiliated companies
consistently experienced greater return on assets and return on equity (capital and surplus) relative to the
unaffiliated companies. Return on assets for the unaffiliateds experienced high volatility over the period
1995 through 2004. It increased from 1995 through 1998 to a peak of 8.6 percent and then dropped
rapidly to a low of 1.5 percent in 2000. It spiked again in 2002 at 9.18 percent but then had declined to
4.2 percent by 2004. Return on equity experienced a somewhat similar pattern, increasing in the early
years to peak at 14.8 percent in 1998. By 2001, however, it had decreased to – 5 percent. The year 2002
saw a high return of 13.2 percent but this had declined to 5.9 percent by 2004.
The affiliated companies experienced a better fate. Total assets increased almost continuously
from 1995 through 2004 from $80 billion to $168 billion. Net income experienced more volatility
peaking in 1998 at $3.4 billion and in 2003 at $20.56 billion. Net income grew continuously from 2000
to 2003 and then declined from its high in 2003 to $15.1 billion in 2004. Return on assets increased from
1995 through 1998 then declined through 2000. The second peak of 9.5 percent in 2003 was followed by
a decline to 6.8 percent in 2004. Return on equity increased in the early years and experienced peaks in
1998 at 19.3 percent and in 2003 at 20.3 percent. The return on equity for the nonaffiliated companies is
more volatile and lower than for the group members. The return on equity for the affiliated companies in
some years is sometimes more than double or three times greater the return on equity for the unaffiliated
companies.
The profitability advantage that affiliated title insurers enjoy does not appear to extend to the
underwriting side of the title insurance business. As can be seen in Figure 6, unaffiliated title insurers
consistently have a more favorable loss ratio than companies that operate within an insurance group.
Differences between unaffiliated and affiliated can be substantial. For example, the average affiliated loss
ratio in 2003 was more than twice as large as the average loss ratio for unaffiliated insurers.
Although the title insurers that were members of an insurance group experienced higher loss
ratios, they also experienced much higher returns on assets and equity relative to title insurers operated on
a stand-alone basis. Possible explanations for this inconsistency could be different rate and expense
structures or different distribution systems and business mix by state.
IV. Recommendations for a More Comprehensive Study
The results from this preliminary study (along with the Sirmans study) can be a springboard for a
more comprehensive integrated comparative cost and financial study of the title insurance industry in
Florida. The final comparative cost study could be broadened to include all insurers and a larger sample

of HUD-1 forms. A data call to title companies could include copies of their retained HUD-1 forms and a
request for insurers’ rate manuals and access to their rating models. The HUD-1 forms from agents could
be requested in electronic form since most real estate closings are done using computerized software
packages.
A comprehensive study could also contain a more complete comparative cost and financial study
of title companies. This could be accomplished by issuing a data call to all title insurers for premium
quotes by size of risk in each state in which they operate. Title insurers could be required to identify the
specific services included in each state above the charges for risk and determination of insurability (search
and title examination costs). The risk-adjusted premium quote data by state could be statistically analyzed
relative to factors such as (1) whether rate filings are promulgated, require prior approval, unregulated,
etc., (2) whether the state requires an all-inclusive rate, a risk rate, or something in-between, (3) loss
ratios, and (4) the method of distribution (affiliated versus non-affiliated agents).
The data call could also require Florida insurers to provide measures for premiums earned and
losses incurred by size of risk over some historical period such as the last five years. The loss data could
be developed to ultimate using standard actuarial techniques. The data could then be analyzed to
determine whether the current rates by layer of coverage are appropriate. Other useful areas to examine
could include: (1) a comparison of premium quote dispersion between companies across states compared
to the companies’ market shares and (2) the relative dispersion of premium quotes by state between
companies within the same holding company and the relationship between this dispersion and the type of
operations and market share.
V. Summary
This study has provided an initial comparative analysis of title insurers using basic financial
statement data provided by title insurers to the NAIC.
In terms of results, an overall view of the industry shows that:

• Title insurance premiums are a larger share of property and casualty premiums in Florida
(5.4%) than for the U.S (3.6%);
• Title insurers in Florida have favorable loss ratios (modified loss ratio = 3.2% in 2004)
compared to nearby states such as Alabama (5.4%), Georgia (8.8%), North Carolina (12.5%),
or South Carolina (9.7%). The results in Sirmans (2005) show that premiums in Florida are
higher than in other states. As such, it appears that title insurance in Florida may be
overpriced;
• From 1995 to 2004 title insurance total direct premiums in the U.S. increased almost 280
percent to $15.5 billion while, in Florida, total direct premiums increased about 310 percent to
$1.80 billion;
• The method of delivering title insurance in Florida has not changed appreciably over the last
decade and non-affiliated agencies write a greater percentage of title insurance in Florida (85
percent) than in the U.S. as a whole (61 percent);
• Regardless of concentration measure (percent of premiums, Herfindahl index) or territory
(Florida, all-inclusive states, U.S.), the title insurance industry is highly concentrated:
In Florida, two companies wrote 50 percent of premiums and six companies wrote 99
percent of premiums in 2004;
The Herfindahl index for Florida in 2004 was 0.1966;
The average Herfindahl index for all-inclusive states (California, Texas, Pennsylvania)
for 2004 was 0.2358;
The average Herfindahl index for all states excluding Florida in 2004 was 0.2390;
The lowest Herfindahl index in any state in 2004 was 0.1844;
The top five companies in any state have consistently written at least 90 percent of the
premiums, and
• Florida is one of three states in which title insurance rates are set by regulation.

An examination of the financial condition of the title industry shows that:
• Total assets for the title industry increased about 110 percent from $54.94 billion to $115.01
billion over the period 1995 to 2004;
• Net worth for the title industry increased by 106 percent from $21.52 billion to $44.25 billion
over the period 1995 to 2004;
• Direct premiums written for the title industry increased by 211 percent from $65.5 billion to
$203.98 billion over the period 1995 to 2004:
For the U.S. (excluding Florida)., the correlation between existing home sales and
premiums written for the title industry for the period 1995 to 2004 is .86. The
correlation for Florida over the same period is .95;
• Net income for the title industry increased by 368 percent from $2.18 billion to $10.21 billion
over the period 1995 to 2004;
• Revenue from affiliated agents increased by 327 percent over the period 1995 to 2004 while
revenue from non-affiliated agents increased by 204 percent; and
• The amount paid to title agents increased by 238 percent from $43 billion to $145 billion.
An examination of the structure of the industry shows that:
• While premiums, revenue, income, etc. increased in Florida over the decade 1995 to 2004, the
basic distribution structure and number of active insurers (based on direct premium written)
remained relatively unchanged:
In Florida, non-affiliated agencies are a much more common method for distribution
and have consistently written about 85 percent of Florida title insurance while affiliated
agencies have written about 5 percent;
• Over the 1995 to 2004 period, non-affiliated agencies have consistently written about 60
percent of U.S. title insurance. The percentage of premiums written directly by title companies
has fallen from 19 percent to 14 percent, while the percentage written by affiliated agencies
has increased from 19 percent to 26 percent;
• In 2004, about 66 percent of companies were members of a group compared to 62 percent in
1995;
• Comparing title insurers who are members of insurance groups with stand-alone title insurers
shows that, over the period 1995 to 2004, companies who belonged to an insurance group
were, on average:
substantially larger
experienced greater return on assets and return on equity, but
had poorer underwriting results (higher loss ratios).
An examination of financial performance trends for the title industry shows that:
• The title industry’s financial position improved significantly over the last decade;
• For the period 1995 to 2004, return on assets for the title industry increased from 4.10 percent
in 1995 to 5.90 percent while the return on equity increased from 3.10 percent in 1995 to 10.80
percent in 2004:
For the title industry, both return on assets and return on equity spiked in 1998,
bottomed out in 2000, and increased rapidly through 2003. Both returns declined in
2004;
Comparing the return on equity for title insurers to the return on equity for property
and casualty insurers shows that title insurers are impacted by the economic cycle and
housing market activity while property and casualty insurers are more impacted by a
price competition (e.g., soft market conditions) and excessive underwriting losses;
• The proportion of direct premiums written as a percentage of operating income increased from
89 percent to 94 percent over the period 1995 to 2004;
• Total expenses relative to revenue decreased over the period 1995 to 2004;
• The proportion of operating income allocated to losses and loss expense remained relatively
constant at about 6 percent; and
• The industry’s loss ratio decreased only slightly from 7.80 percent in 1995 to 6.9 percent in
2004.
This preliminary study could provide the basis for a more comprehensive integrated comparative
cost and financial analysis of the title insurance industry in Florida. This could include a larger sample of
HUD-1 forms and a data call to all title insurers for premium rate quotes and related services charges. A
more sophisticated statistical analysis could be performed relating the cost of title insurance to state
characteristics such as rate setting requirements (promulgated, unregulated, etc.), total title charges (all-
inclusive, risk rate, etc.), loss ratios, and distribution methods. The data call could also require Florida
insurers to provide measures for premiums earned and losses incurred by size of risk over some historical
period such as the last five years. The loss data could be developed to ultimate using standard actuarial
techniques. The data could then be analyzed to determine whether the current rates by layer of coverage
are appropriate.

References ALTA Press Release, November 28, 2005. Benito Arrunada, “A Global Perspective on Title Insurance,” Housing Finance International, Vol. 16, No. 2, December 2001, pp. 3-11. Catherine A. Asaro, “Cracking Down on Illegal Practices in the Title Insurance Industry,” BNET Financial Services, October 31, 2005. John S. Baen and Randall S. Guttery, “The Coming Downsizing of Real Estate: Implications of Technology,” Journal of Real Estate Portfolio Management, Vol. 3, No. 1, 1997, pp. 1-18. Brigham Young Law Review, Issue 4, 1976, pp. 895-911. J. Carmichael Calder, S. H. Spencer Compton, and Joshua Stein, “A Report on Title Insurance in International Real Estate Transactions,” Briefings in Real Estate Finance, Vol. 4, No. 2, September 2004, pp. 165-172. “Clouds on the Horizon after Title Industry’s Bright Year,” A.M. Best Special Report, Oct 11, 2005. David B. Cox, “Report to the State of Florida Department of Insurance Regarding Title Insurance Rates,” Florida Department of Insurance, December 1997. Scott B. Ehrlich, “Avoidance of Foreclosure Sales as Fraudulent Conveyances: Accommodating State and Federal Objectives,” Virginia Law Review, Vol. 73, No. 4, 1985, pp. 933-980. Fitch Ratings (as of December 6, 2004). Deborah Ann Ford, “Title Assurance and Settlement Charges,” AREUEA Journal, Vol. 10, No. 3, 1982, pp. 297-330. Alfred E. Hofflander and David Shulman, “The Distribution of Title Insurance: The Unregulated Intermediary,” The Journal of Risk and Insurance, Vol. XLIV, No. 3, September 1977, pp. 435-446. Don Koch, “Title Insurance: A Regulatory Perspective,” Journal of Insurance Regulation, Vol. 12, NO. 1, Fall 1993, pp. 3-13. R. J. Lehman, “A New Chapter in Title Insurance,” Best’s Review, Vol. 106, No. 2, June 2005, pp. 33-36. Robin Paul Malloy and Mark Klapow, “Attorney Malpractice for Failure to Require Fee Owner’s Title Insurance in a Residential Real Estate Transaction,” St. John’s Law Review, Vol. 74, No. 2, Spring 2000, pp. 407-449. Beth Mattson-Tieg, “Title Insurers Enter ‘Virgin Markets’”, National Real Estate Investor, Vol. 46, No. 8, August 2004, pp. 48-51. Bill Moody, “A Timeline for Title Insurance,” Mortgage Banking, Vol. 65, No. 11, August 2005, pp. 57-62.

Bill Moody, “The Competitive Landscape of Title,” Mortgage Banking, Vol. 63, No. 11, August 2003, pp. 46-53. Charles Nyce and M. Martin Boyer, “An Analysis of the Title Insurance Industry,” Journal of Insurance Regulation, Vol. 17, No. 2, Winter 1998, pp. 213-255. James M. Pedowitz, “Condominium Unit Title Insurance,” St. John’s Law Review, Vol. 73, No. 1, Winter 1999, pp. 183-197. Rocky Mountain News, November 17, 2005, “Title Insurance ‘Sham’; State Shutters Eleven Companies in Alleged Kickback Schemes” Moses K. Rosenberg, “Historical Perspective of the Development of Rate Regulation of Title Insurance,” The Journal of Risk and Insurance, Vol. XLIV, No. 2, June 1977, pp. 193-209. H. Lee Roussel and Moses K. Rosenberg, “The High Price of ‘Reform’: Title Insurance Rates and the Benefits of Rating Bureaus,” The Journal of Risk and Insurance, Vol. XLVIII, No. 4, December 1981, pp. 638-648. John Sayers, “How Are Title Insurance Companies Using GIS?” BNET Financial Services, October 31, 2005. G. Stacy Sirmans, “A Preliminary Examination of Title Insurance Regulation, Pricing, and Costs Structures,” Research Project for the Florida Office of Insurance Regulation, December 2005. Jerry D. Todd and Richard W. McEnally, “Profitability and Risk in the Title Insurance Industry –The Texas Experience,” The Journal of Risk and Insurance, Vol. XLI, No. 3, September 1974, pp. 415-434. Kevin E. Villani and John Simonson, “Real Estate Settlement Pricing: A Theoretical Framework,” AREUEA Journal, Vol. 10, No. 3, 1982, pp. 249-275. Lawrence J. White, “The Title Insuance Industry, Reverse Competition, and Controlled Business – A Different View,” The Journal of Risk and Insurance, Vol. LI, No. 2, June 1984, pp. 308-319.

26
Table 1 Property/Casualty (Selected) and Title Insurance Premiums for U.S. and Florida
($000)
U.S. 2004 Written
Premiums
Share of Title
Insurance to P&C
Florida 2003 Written
Premium
Share of Title Insurance to
P&C
Ratio of Florida to
U.S Private Passenger Auto $156,734,038 36.8% $11,048,140 38.9% 7.0%Homeowner Multiple Peril $49,988,877 11.7% $3,722,233 13.1% 7.4%Other Liability $40,720,856 9.6% $1,633,659 5.8% 4.0%Workers Compensation $36,760,327 8.6% $3,181,071 11.2% 8.7%Commercial Multiple Peril $29,134,347 6.8% $1,615,775 5.7% 5.5%Commercial Auto $26,722,522 6.3% $1,729,493 6.1% 6.5%Title Insurance $15,488,147 3.6% $1,545,460 5.4% 10.0%Accident & Health $9,955,816 2.3% $392,164 1.4% 3.9%Medical Malpractice $9,191,530 2.2% $691,075 2.4% 7.5%Fire $8,316,595 2.0% $327,809 1.2% 3.9%Allied Lines $8,307,595 1.9% $457,016 1.6% 5.5%Inland Marine $8,215,433 1.9% $605,521 2.1% 7.4%Mortgage Guaranty $4,323,176 1.0% $395,257 1.4% 9.1%Surety $3,857,003 0.9% $257,025 0.9% 6.7%Products Liability $3,395,002 0.8% $105,033 0.4% 3.1%Financial Guaranty $3,115,495 0.7% $136,525 0.5% 4.4%Ocean Marine $2,827,554 0.7% $227,226 0.8% 8.0%Aircraft $2,180,122 0.5% $152,563 0.5% 7.0%Farmowners’ Multiple Peril $2,118,462 0.5% $20,403 0.1% 1.0%Boiler & Machinery $1,572,208 0.4% $48,664 0.2% 3.1%Fidelity $1,309,335 0.3% $52,267 0.2% 4.0%Earthquake $1,098,392 0.3% $7,715 0.0% 0.7%Credit $806,449 0.2% $32,769 0.1% 4.1%Burglary & Theft $138,837 0.0% $5,470 0.0% 3.9%Total $426,278,118 100.0% $28,390,333 100.0% 6.7%Source: Insurance Information Institute, NAIC Annual Statement Database, and State of Florida OIR.

27
Table 2
Direct Premiums Written 1995-2004 ($000) Florida and United States
Year FL U.S. FL/US 1995 $440,683 $4,128,902 10.67% 1996 $505,773 $5,011,454 10.09% 1997 $556,541 $5,524,087 10.07% 1998 $709,632 $7,504,684 9.46% 1999 $796,870 $8,061,396 9.89% 2000 $745,718 $7,260,112 10.27% 2001 $865,036 $9,124,617 9.48% 2002 $1,141,899 $11,950,487 9.56% 2003 $1,545,460 $15,654,387 9.87% 2004 $1,809,490 $15,502,482 11.67% Source: NAIC Annual Statement Database

Table 3A
Premiums by Distribution Method- U.S. 1995-2004 ($000)
Year US Total US Direct
Operations PCT US Affiliate
Agencies PCT
US Non-Affiliate
Agencies PCT 1995 $4,128,902 $792,902 19.20% $781,784 18.93% $2,554,216 61.86% 1996 $5,011,454 $800,170 15.97% $1,081,897 21.59% $3,129,387 62.44% 1997 $5,524,087 $866,616 15.69% $1,268,029 22.95% $3,389,442 61.36% 1998 $7,504,684 $1,140,229 15.19% $1,951,470 26.00% $4,412,985 58.80% 1999 $8,061,396 $1,093,664 13.57% $1,920,061 23.82% $5,047,671 62.62% 2000 $7,260,112 $1,055,963 14.54% $1,839,114 25.33% $4,365,035 60.12% 2001 $9,124,617 $1,342,345 14.71% $2,605,997 28.56% $5,176,275 56.73% 2002 $11,950,487 $1,626,012 13.61% $3,286,677 27.50% $7,037,798 58.89% 2003 $15,654,387 $2,258,003 14.42% $4,164,763 26.60% $9,231,621 58.97% 2004 $15,502,482 $2,100,561 13.55% $4,014,337 25.89% $9,387,583 60.56% Source: NAIC Annual Statement Database
Table 3B Premiums by Distribution Method- Florida
1995-2004 ($000)
Year FL Total FL Direct
Operations PCT FL Affiliate
Agencies PCT
FL Non-Affiliate
Agencies PCT 1995 $440,683 $45,528 10.33% $16,930 3.84% $378,225 85.83% 1996 $505,773 $47,636 9.42% $20,188 3.99% $437,949 86.59% 1997 $556,541 $56,826 10.21% $22,283 4.00% $477,432 85.79% 1998 $709,632 $76,452 10.77% $29,949 4.22% $603,230 85.01% 1999 $796,870 $76,262 9.57% $30,186 3.79% $690,421 86.64% 2000 $745,718 $79,633 10.68% $27,094 3.63% $638,991 85.69% 2001 $865,036 $100,653 11.64% $44,106 5.10% $720,278 83.27% 2002 $1,141,899 $123,135 10.78% $61,223 5.36% $957,542 83.86% 2003 $1,545,460 $184,040 11.91% $76,210 4.93% $1,285,211 83.16% 2004 $1,809,490 $177,234 9.79% $95,057 5.25% $1,537,199 84.95% Source: NAIC Annual Statement Database
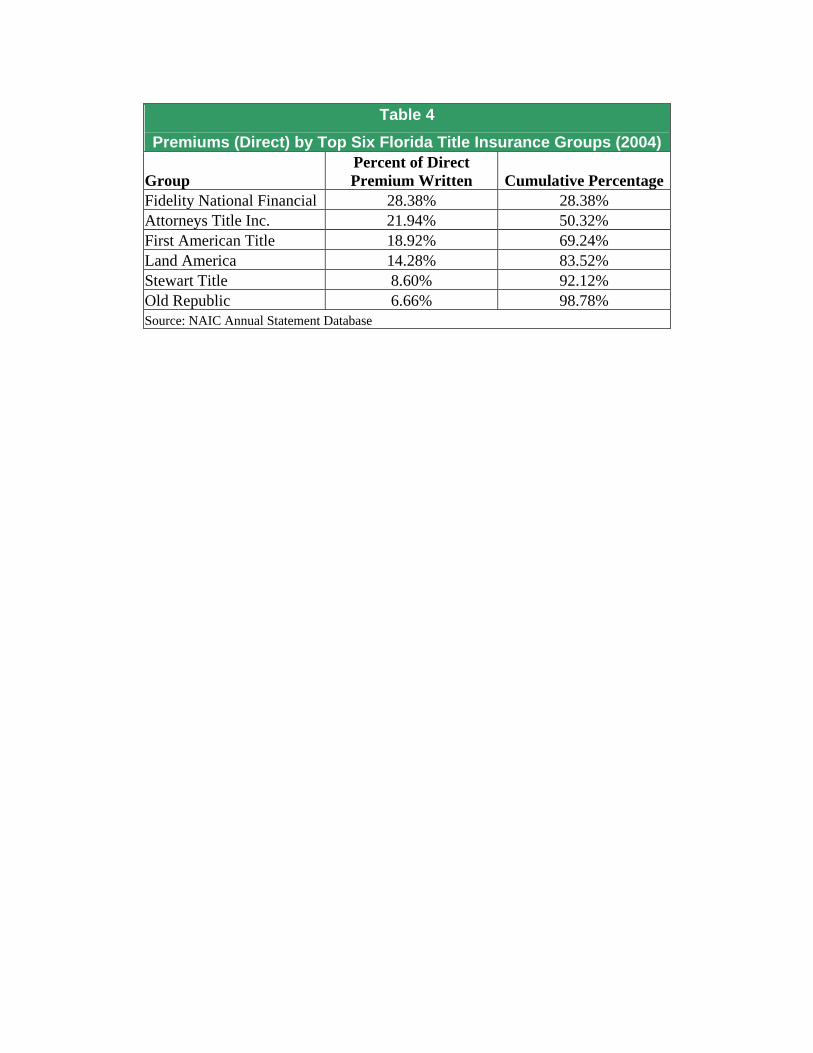
Table 4 Premiums (Direct) by Top Six Florida Title Insurance Groups (2004)
Group Percent of Direct Premium Written Cumulative Percentage
Fidelity National Financial 28.38% 28.38% Attorneys Title Inc. 21.94% 50.32% First American Title 18.92% 69.24% Land America 14.28% 83.52% Stewart Title 8.60% 92.12% Old Republic 6.66% 98.78% Source: NAIC Annual Statement Database

Table 5A
Rate Regulation and Concentration Measures* of the Title Insurance Industry by State (2004)
State Pct. Top 5 Companies Herfindahl
Rate Reg* State Pct. Top 5
Companies Herfindahl Rate Reg*
AK 1.0000 .3399 F&U MT 1.0000 .2787 F&U AL .9577 .1930 C NC .8901 .1991 PA AR .9857 .2169 C ND 1.0000 .2292 PA AZ .9121 .2403 PA NE .9860 .2199 F&U CA .9204 .2384 F&U NH .9970 .2358 PA CO .8417 .2000 PA NJ .9640 .2266 PA CT .9645 .2310 PA NM .9947 .2591 R DC .9941 .3077 C NV .9182 .2168 PA DE .9578 .2151 F&U NY .9794 .2445 PA FL .9211 .1966 R OH .9287 .1991 F&U GA .9922 .2244 C OK .8929 .2468 C HI 1.0000 .3210 F&U OR 1.0000 .3230 PA IA 1.0000 .3655 ** PA .9608 .2425 PA ID 1.0000 .2462 F&U RI .9800 .2945 PA IL .9251 .3028 C SC .9004 .2337 PA IN .9578 .2284 C SD .8832 .1844 PA KS .9997 .2386 F&U TN .9444 .2091 PA KY .9659 .2293 F&U TX .9477 .2278 R LA .9801 .2924 PA UT .9902 .2540 PA MA .9677 .2382 C VA .9435 .2054 C MD .9418 .2237 PA VT .9906 .2647 U&F ME .9996 .3057 PA WA 1.0000 .2714 PA MI .9813 .2642 PA WI .9976 .2643 F&U MN .9562 .2279 F&U WV .9154 .1877 C MO .9833 .2695 PA WY .9992 .3707 PA MS .8809 .1922 C
*- At the insurance group level **Regulation Type- C: Competitive Rate; F&U: File and Use; U&F: Use and File; PA: Prior Approval; R: Commissioner Promulgates Rate (Source: Nyce and Boyer, 1998)
Table 5B Concentration Measures* of the Title Insurance Industry:
Florida, All-Inclusive States, Other States (2004) Pct. Top 5 Companies Herfindahl
Florida .9211 .1966 All Inclusive States* *(Weighted) .9329 .2358 Non-Florida States (Weighted) .9471 .2390 *- At the insurance group level **All Inclusive States = California, Pennsylvania, and Texas Source: NAIC Annual Statement Database

Table 6A
Modified Loss Ratios by State* State 1995 1999 2004 State 1995 1999 2004 AK 10.1% 5.3% 0.9% MT 5.9% 4.2% 3.0% AL 8.9% 11.5% 5.4% NC 10.5% 8.8% 12.5% AR 4.0% 3.3% 6.9% ND 0.2% 0.0% 1.1% AZ 5.2% 3.1% 3.0% NE 4.4% 0.6% 2.4% CA 12.3% 4.5% 3.4% NH 18.4% 4.5% 2.2% CO 1.8% 2.5% 3.6% NJ 9.9% 4.9% 4.2% CT 8.4% 3.9% 3.5% NM -0.9% 5.2% 4.3% DC 18.7% 5.8% 5.6% NV 2.1% 3.8% 4.2% DE 6.0% 3.9% 2.3% NY 7.6% 3.9% 3.2% FL 5.5% 3.6% 3.2% OH 2.4% 2.7% 3.3% GA 8.0% 6.3% 8.8% OK 11.2% 5.1% 2.8% HI 13.3% 6.9% 4.2% OR 2.9% 2.5% 2.7% IA 2.4% 13.4% 36.8% PA 4.4% 2.5% 3.5% ID 3.2% 3.3% 2.7% RI 11.9% 2.1% 10.1% IL 10.9% 7.6% 12.9% SC 10.5% 5.5% 9.7% IN 3.5% 4.5% 16.6% SD -0.7% 0.3% 1.7% KS 3.0% 1.9% 5.1% TN 5.5% 2.2% 6.2% KY 1.9% 1.9% 8.6% TX 2.6% 1.7% 2.5% LA 14.7% 7.8% 3.7% UT 2.8% 2.5% 6.2% MA 10.8% 4.9% 4.2% VA 9.6% 5.1% 2.4% MD 13.9% 2.7% 2.8% VT 10.8% 2.7% 6.5% ME 14.4% 4.6% 3.9% WA 6.6% 6.1% 5.4% MI 1.9% 2.9% 7.2% WI 3.0% 2.2% 3.1% MN 7.2% 6.8% 6.3% WV 4.3% 1.0% 3.6% MO 16.7% 9.0% 12.9% WY 4.0% 2.7% 1.7% MS 17.2% 2.0% 6.4% *- Including District of Columbia. Modified Loss Ratio= Direct Losses Paid/Direct Premiums Earned
Table 6B Modified Loss Ratios: Florida versus Other States*
1995 1999 2004 Florida 5.5% 3.6% 3.2% Other States* 6.5% 4.2% 5.0% *- Includes District of Columbia but excludes Florida and All-inclusive States (California, Texas, Pennsylvania); Modified Loss Ratio= Direct Losses Paid/Direct Premiums Earned

Table 7 Descriptive Statistics: Financials ($000)
1995 and 2004 1995 2004 N Mean Std.Dev. Minimum Maximum N Mean Std.Dev. Minimum Maximum % Change
Total Assets 63 $54,945 $107,946 $416 $481,142 76 $115,009 $302,070 $671 $1,825,723 109.3% Capital and Surplus 63 $21,522 $39,720 $320 $205,631 76 $44,252 $116,277 $398 $746,046 105.6% Direct Premiums Written 63 $65,503 $142,963 $7 $707,420 76 $203,979 $551,237 $21 $3,372,438 211.4% Net Premiums Written 63 $65,333 $142,712 $7 $708,131 76 $203,458 $550,686 $21 $3,371,012 211.4% Net Premiums Earned 63 $64,293 $139,974 $6 $687,169 76 $198,339 $535,878 $20 $3,280,375 208.5% Operating Income 63 $72,761 $159,044 $35 $781,968 76 $213,946 $579,196 $22 $3,563,472 194.0% Investment Income 63 $2,889 $6,255 ($35) $29,475 76 $4,817 $15,934 $6 $108,385 66.7% Net Income 63 $2,181 $5,264 ($3,235) $27,980 76 $10,208 $33,562 ($1,653) $251,492 368.0% Total Revenue 63 $73,931 $161,921 $36 $802,219 76 $218,821 $594,239 $23 $3,655,535 196.0% Total Revenue (DO*) 63 $20,967 $53,298 $0 $288,746 76 $42,480 $131,819 $0 $814,615 102.6% Total Revenue (NAFF*) 63 $40,589 $86,585 $0 $406,060 76 $123,521 $328,445 $0 $2,036,632 204.3% Total Revenue (AFF*) 63 $12,375 $33,358 $0 $167,278 76 $52,820 $150,824 $0 $804,288 326.8% Total Expenses Paid 63 $68,917 $150,472 $2 $772,560 76 $195,410 $530,530 $40 $3,324,844 183.5% Losses and LAE 63 $4,174 $10,617 ($1) $68,994 76 $9,122 $24,595 ($287) $127,140 118.5% Operating Expense 63 $68,936 $150,465 $2 $772,560 76 $195,437 $530,521 $40 $3,324,844 183.5% Amount Paid to Title Agent 63 $43,065 $94,703 $0 $458,240 76 $145,349 $391,438 $0 $2,386,941 237.5% * DO= Direct Operations, NAFF=Non-affiliated Agencies, AFF=Affiliated Agencies. Source: NAIC Annual Statement Database
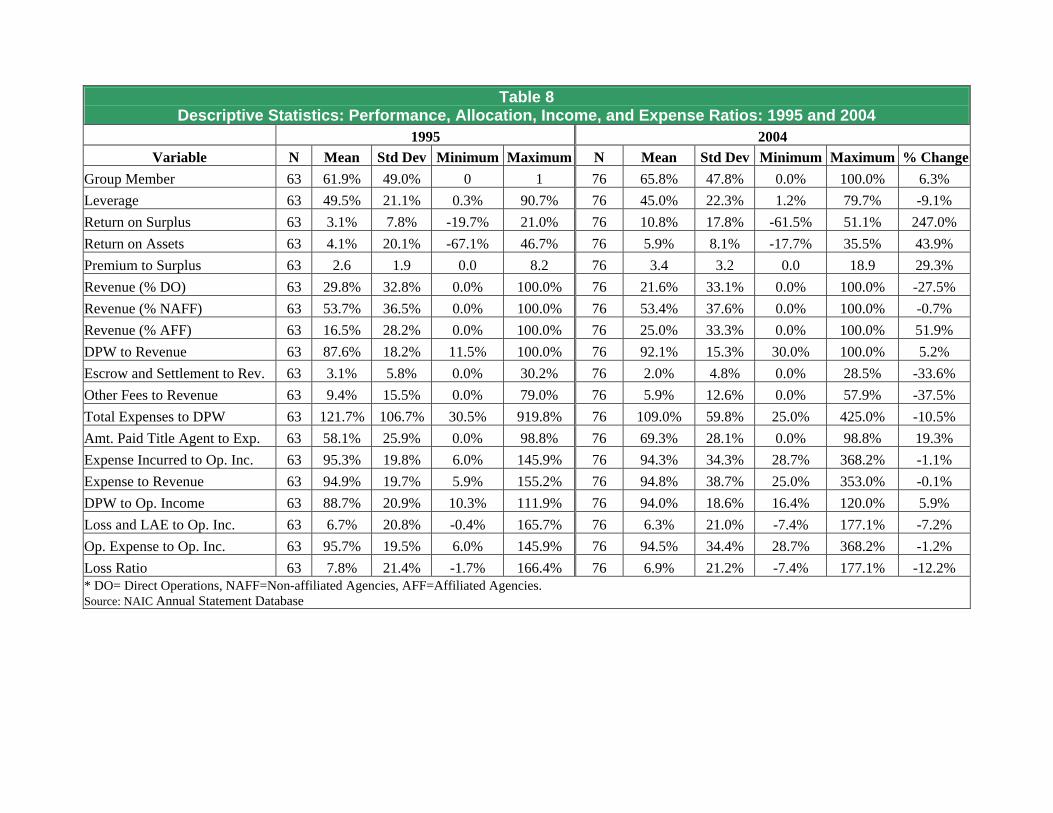
Table 8
Descriptive Statistics: Performance, Allocation, Income, and Expense Ratios: 1995 and 2004 1995 2004
Variable N Mean Std Dev Minimum Maximum N Mean Std Dev Minimum Maximum % ChangeGroup Member 63 61.9% 49.0% 0 1 76 65.8% 47.8% 0.0% 100.0% 6.3% Leverage 63 49.5% 21.1% 0.3% 90.7% 76 45.0% 22.3% 1.2% 79.7% -9.1% Return on Surplus 63 3.1% 7.8% -19.7% 21.0% 76 10.8% 17.8% -61.5% 51.1% 247.0% Return on Assets 63 4.1% 20.1% -67.1% 46.7% 76 5.9% 8.1% -17.7% 35.5% 43.9% Premium to Surplus 63 2.6 1.9 0.0 8.2 76 3.4 3.2 0.0 18.9 29.3% Revenue (% DO) 63 29.8% 32.8% 0.0% 100.0% 76 21.6% 33.1% 0.0% 100.0% -27.5% Revenue (% NAFF) 63 53.7% 36.5% 0.0% 100.0% 76 53.4% 37.6% 0.0% 100.0% -0.7% Revenue (% AFF) 63 16.5% 28.2% 0.0% 100.0% 76 25.0% 33.3% 0.0% 100.0% 51.9% DPW to Revenue 63 87.6% 18.2% 11.5% 100.0% 76 92.1% 15.3% 30.0% 100.0% 5.2% Escrow and Settlement to Rev. 63 3.1% 5.8% 0.0% 30.2% 76 2.0% 4.8% 0.0% 28.5% -33.6% Other Fees to Revenue 63 9.4% 15.5% 0.0% 79.0% 76 5.9% 12.6% 0.0% 57.9% -37.5% Total Expenses to DPW 63 121.7% 106.7% 30.5% 919.8% 76 109.0% 59.8% 25.0% 425.0% -10.5% Amt. Paid Title Agent to Exp. 63 58.1% 25.9% 0.0% 98.8% 76 69.3% 28.1% 0.0% 98.8% 19.3% Expense Incurred to Op. Inc. 63 95.3% 19.8% 6.0% 145.9% 76 94.3% 34.3% 28.7% 368.2% -1.1% Expense to Revenue 63 94.9% 19.7% 5.9% 155.2% 76 94.8% 38.7% 25.0% 353.0% -0.1% DPW to Op. Income 63 88.7% 20.9% 10.3% 111.9% 76 94.0% 18.6% 16.4% 120.0% 5.9% Loss and LAE to Op. Inc. 63 6.7% 20.8% -0.4% 165.7% 76 6.3% 21.0% -7.4% 177.1% -7.2% Op. Expense to Op. Inc. 63 95.7% 19.5% 6.0% 145.9% 76 94.5% 34.4% 28.7% 368.2% -1.2% Loss Ratio 63 7.8% 21.4% -1.7% 166.4% 76 6.9% 21.2% -7.4% 177.1% -12.2% * DO= Direct Operations, NAFF=Non-affiliated Agencies, AFF=Affiliated Agencies. Source: NAIC Annual Statement Database
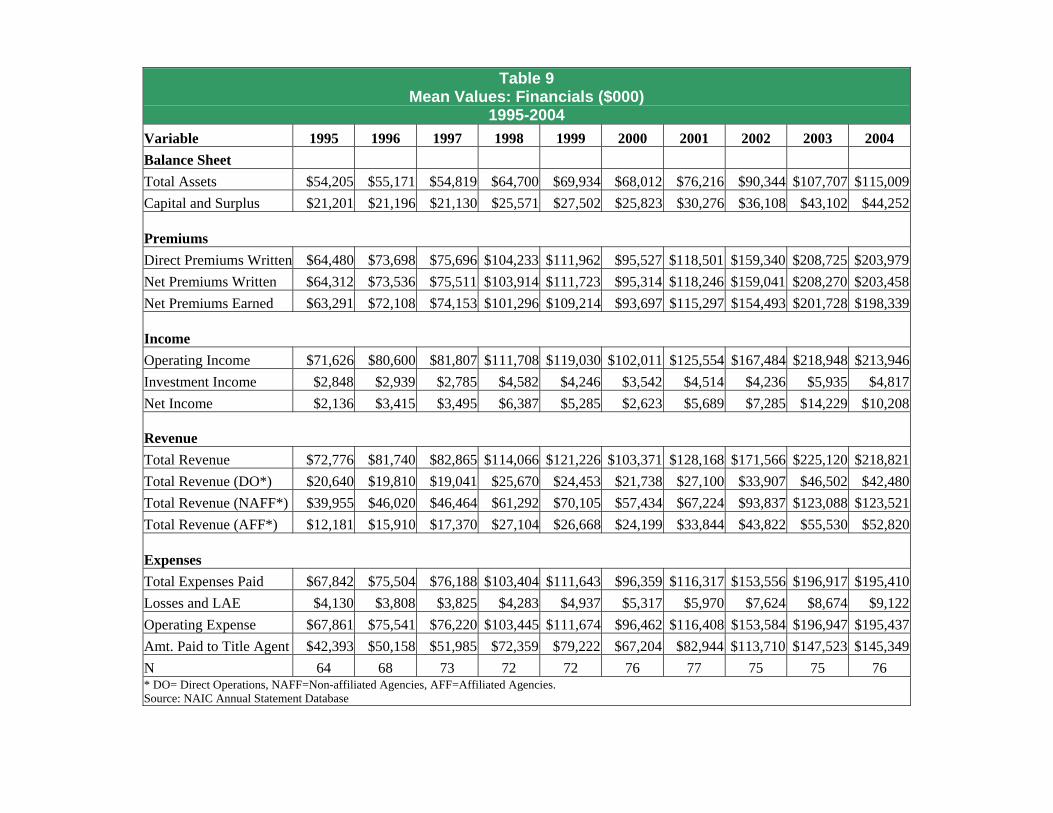
Table 9 Mean Values: Financials ($000)
1995-2004 Variable 1995 1996 1997 1998 1999 2000 2001 2002 2003 2004 Balance Sheet Total Assets $54,205 $55,171 $54,819 $64,700 $69,934 $68,012 $76,216 $90,344 $107,707 $115,009Capital and Surplus $21,201 $21,196 $21,130 $25,571 $27,502 $25,823 $30,276 $36,108 $43,102 $44,252 Premiums Direct Premiums Written $64,480 $73,698 $75,696 $104,233 $111,962 $95,527 $118,501 $159,340 $208,725 $203,979Net Premiums Written $64,312 $73,536 $75,511 $103,914 $111,723 $95,314 $118,246 $159,041 $208,270 $203,458Net Premiums Earned $63,291 $72,108 $74,153 $101,296 $109,214 $93,697 $115,297 $154,493 $201,728 $198,339 Income Operating Income $71,626 $80,600 $81,807 $111,708 $119,030 $102,011 $125,554 $167,484 $218,948 $213,946Investment Income $2,848 $2,939 $2,785 $4,582 $4,246 $3,542 $4,514 $4,236 $5,935 $4,817Net Income $2,136 $3,415 $3,495 $6,387 $5,285 $2,623 $5,689 $7,285 $14,229 $10,208 Revenue Total Revenue $72,776 $81,740 $82,865 $114,066 $121,226 $103,371 $128,168 $171,566 $225,120 $218,821Total Revenue (DO*) $20,640 $19,810 $19,041 $25,670 $24,453 $21,738 $27,100 $33,907 $46,502 $42,480Total Revenue (NAFF*) $39,955 $46,020 $46,464 $61,292 $70,105 $57,434 $67,224 $93,837 $123,088 $123,521Total Revenue (AFF*) $12,181 $15,910 $17,370 $27,104 $26,668 $24,199 $33,844 $43,822 $55,530 $52,820 Expenses Total Expenses Paid $67,842 $75,504 $76,188 $103,404 $111,643 $96,359 $116,317 $153,556 $196,917 $195,410Losses and LAE $4,130 $3,808 $3,825 $4,283 $4,937 $5,317 $5,970 $7,624 $8,674 $9,122Operating Expense $67,861 $75,541 $76,220 $103,445 $111,674 $96,462 $116,408 $153,584 $196,947 $195,437Amt. Paid to Title Agent $42,393 $50,158 $51,985 $72,359 $79,222 $67,204 $82,944 $113,710 $147,523 $145,349N 64 68 73 72 72 76 77 75 75 76 * DO= Direct Operations, NAFF=Non-affiliated Agencies, AFF=Affiliated Agencies. Source: NAIC Annual Statement Database

Table 10 Mean Values: Performance, Allocation, Expense, and Income Ratios: 1995-2004
1995 1996 1997 1998 1999 2000 2001 2002 2003 2004 Performance Leverage 49.5% 49.9% 45.4% 43.7% 43.4% 45.4% 46.9% 46.0% 45.0% 45.0% Return on Surplus 3.1% 4.3% 8.9% 17.7% 11.9% 3.9% 4.8% 13.2% 18.7% 10.8% Return on Assets 4.1% 4.3% 4.9% 9.5% 6.2% 2.7% 5.2% 7.8% 9.2% 5.9% Premium to Surplus 2.6 3.7 2.7 3.0 3.0 2.6 3.2 3.6 3.9 3.4 Allocation Revenue (% DO) 29.8% 29.8% 37.3% 33.0% 30.3% 14.0% 30.4% 26.2% 21.7% 21.6%Revenue (% NAFF) 53.7% 52.0% 41.7% 43.8% 48.5% 63.0% 46.2% 47.7% 51.1% 53.4%Revenue (% AFF) 16.5% 18.2% 21.0% 23.2% 21.1% 23.0% 23.5% 26.2% 27.3% 25.0%DPW to Revenue 87.6% 90.0% 83.9% 89.5% 89.9% 105.6% 89.3% 91.1% 91.5% 92.1%Escrow and Settlement to Rev. 3.1% 2.8% 2.3% 2.8% 2.6% 1.9% 2.2% 2.2% 2.1% 2.0%Other Fees to Revenue 9.4% 7.3% 13.8% 7.7% 7.5% -7.5% 8.5% 6.7% 6.4% 5.9% Expense Total Expenses to DPW 121.7% 116.7% 113.6% 117.2% 117.3% 106.0% 115.1% 104.1% 101.5% 109.0%Amt. Paid Title Agent to Exp. 58.1% 61.1% 62.3% 59.8% 61.1% 62.3% 64.3% 67.5% 70.0% 69.3% Expense Incurred to Op. Inc. 95.3% 89.3% 95.6% 99.6% 91.7% 95.6% 91.6% 90.1% 89.4% 94.3% Expense to Revenue 94.9% 101.0% 82.9% 99.8% 101.0% 45.6% 92.4% 90.4% 88.4% 94.8% Income DPW to Op. Income 88.7% 87.5% 91.8% 90.4% 90.1% 90.8% 91.3% 93.1% 94.1% 94.0% Loss and LAE to Op. Inc. 6.7% 9.6% 4.4% 4.8% 4.8% 6.0% 6.5% 3.0% 3.5% 6.3% Op. Expense to Op. Inc. 95.7% 90.8% 96.6% 100.5% 92.6% 96.8% 92.7% 90.5% 89.7% 94.5% Loss Ratio 7.8% 10.0% 4.8% 5.8% 5.5% 7.4% 7.8% 3.5% 4.0% 6.9%
N 63 68 73 72 72 76 77 75 75 76 Source: NAIC Annual Statement Database
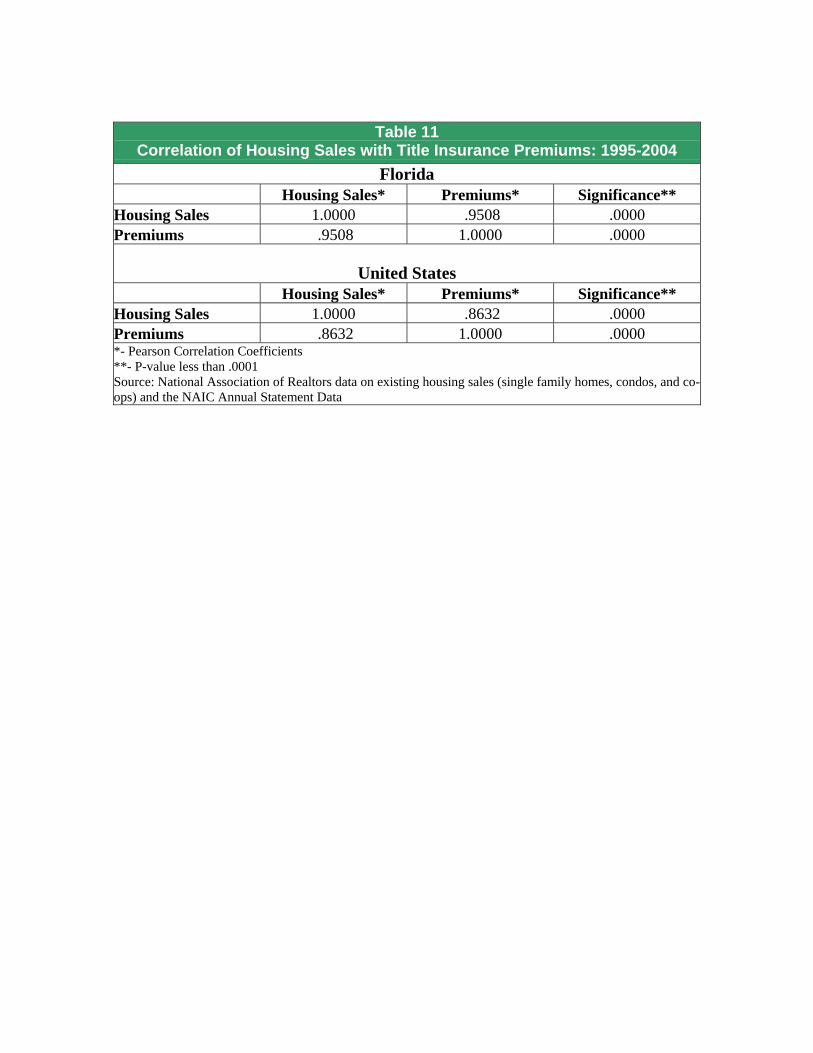
Table 11 Correlation of Housing Sales with Title Insurance Premiums: 1995-2004
Florida Housing Sales* Premiums* Significance**
Housing Sales 1.0000 .9508 .0000 Premiums .9508 1.0000 .0000
United States
Housing Sales* Premiums* Significance** Housing Sales 1.0000 .8632 .0000 Premiums .8632 1.0000 .0000 *- Pearson Correlation Coefficients **- P-value less than .0001 Source: National Association of Realtors data on existing housing sales (single family homes, condos, and co-ops) and the NAIC Annual Statement Data

Table 12
Analysis of Financial Data (Means) by Group Membership ($000) (Stand-alone Company or Group Member)
1995-2004 Unaffiliated Companies (Stand-alone Company)
1995 1996 1997 1998 1999 2000 2001 2002 2003 2004 Total Assets 14,122 13,768 12,375 14,648 17,486 15,573 16,800 20,041 24,093 12,995Capital and Surplus 5,389 4,633 5,460 6,815 8,035 6,445 6,521 7,792 9,429 7,088Direct Premiums Written 11,260 14,791 15,515 22,859 25,990 23,079 30,620 41,874 55,058 25,737Net Premiums Written 11,248 14,793 15,435 22,776 25,900 23,019 30,460 41,724 54,786 25,503Operating Income 13,851 17,023 17,059 24,405 27,852 24,698 32,435 43,561 56,787 25,578Net Income 184 429 1,011 1,355 1,132 145 337 535 2,292 793Total Expenses Paid 13,627 16,024 15,584 21,972 25,797 23,148 29,922 39,821 52,010 23,973Losses and LAE 809 1,096 743 868 910 1,733 1,711 2,805 2,215 633Operating Expense 13,631 16,071 15,633 22,020 25,836 23,397 30,139 39,839 52,031 23,993N 24 30 28 26 24 26 26 26 26 26
Affiliated Companies (Member of an Insurance Group)
1995 1996 1997 1998 1999 2000 2001 2002 2003 2004 Total Assets $80,066 $87,858 $81,228 $92,991 $96,158 $95,280 $106,507 $127,648 $152,073 $168,055Capital and Surplus $31,450 $34,271 $30,881 $36,172 $37,236 $35,899 $42,386 $51,133 $60,969 $63,577Direct Premiums Written $98,883 $120,203 $113,142 $150,226 $154,949 $133,200 $163,304 $221,668 $290,263 $296,666Net Premiums Written $98,616 $119,912 $112,891 $149,774 $154,635 $132,908 $163,000 $221,290 $289,710 $295,995Operating Income $109,014 $130,792 $122,094 $161,053 $164,620 $142,213 $173,026 $233,239 $304,992 $311,897Net Income $3,410 $5,772 $5,040 $9,231 $7,362 $3,912 $8,417 $10,867 $20,562 $15,104Total Expenses Paid $102,941 $122,461 $113,897 $149,432 $154,566 $134,428 $160,361 $213,905 $273,806 $284,557Losses and LAE $6,245 $5,949 $5,743 $6,214 $6,951 $7,180 $8,140 $10,181 $12,101 $13,535Operating Expense $102,969 $122,490 $113,920 $149,468 $154,593 $134,455 $160,388 $213,938 $273,841 $284,588N 39 38 45 46 48 50 51 49 49 50 Source: NAIC Annual Statement Database

Table 13 Analysis of Financial Ratios (Means) by Group Membership
(Stand-alone Company or Group Member) 1995-2004
Unaffiliated Companies (Stand-alone Company) 1995 1996 1997 1998 1999 2000 2001 2002 2003 2004 Return on Surplus 0.5% 1.0% 7.4% 14.8% 9.4% 1.1% -5.0% 13.2% 15.7% 5.9% Return on Assets 2.0% 3.6% 4.6% 8.6% 5.6% 1.5% 3.6% 9.8% 8.7% 4.2% Leverage 47.1% 46.3% 39.5% 38.7% 38.9% 43.6% 45.7% 41.1% 40.4% 38.9% Loss Ratio 5.9% 5.6% 3.2% 3.3% 6.1% 2.6% 8.1% 1.0% 3.0% 3.0% Op. Expense to Op. Income 95.7% 83.9% 95.4% 103.2% 88.6% 98.5% 95.7% 90.6% 93.5% 104.7% Amt. Paid Title Agent to Exp. 52.7% 57.3% 62.2% 60.4% 58.8% 66.3% 69.9% 72.2% 74.7% 72.9% N 24 30 28 26 24 26 26 26 26 26
Affiliated Companies (Member of an Insurance Group)
1995 1996 1997 1998 1999 2000 2001 2002 2003 2004 Return on Surplus 6.3% 6.9% 9.9% 19.3% 13.1% 5.4% 9.8% 13.2% 20.3% 13.4% Return on Assets 3.8% 4.9% 5.0% 10.0% 6.5% 3.3% 6.0% 6.8% 9.5% 6.8% Leverage 50.9% 52.7% 49.1% 46.4% 45.7% 46.3% 47.4% 48.5% 47.4% 48.1% Loss Ratio 9.0% 13.4% 5.7% 7.2% 5.3% 9.8% 7.7% 4.8% 4.5% 8.8% Op. Expense to Op. Income 95.7% 96.1% 97.4% 99.0% 94.6% 95.9% 91.1% 90.4% 87.6% 89.2% Amt. Paid Title Agent to Exp. 61.4% 64.0% 62.4% 59.4% 62.3% 60.2% 61.4% 65.0% 67.5% 67.4% N 39 38 45 46 48 50 51 49 49 50 Source: NAIC Annual Statement Database

Figure 1
Countrywide Title Insurance Industry: 1995-2004 ($000)
$0
$50,000
$100,000
$150,000
$200,000
$250,000
1995 1996 1997 1998 1999 2000 2001 2002 2003 2004
AssetsSurplusNPWOp. IncomeNet Income
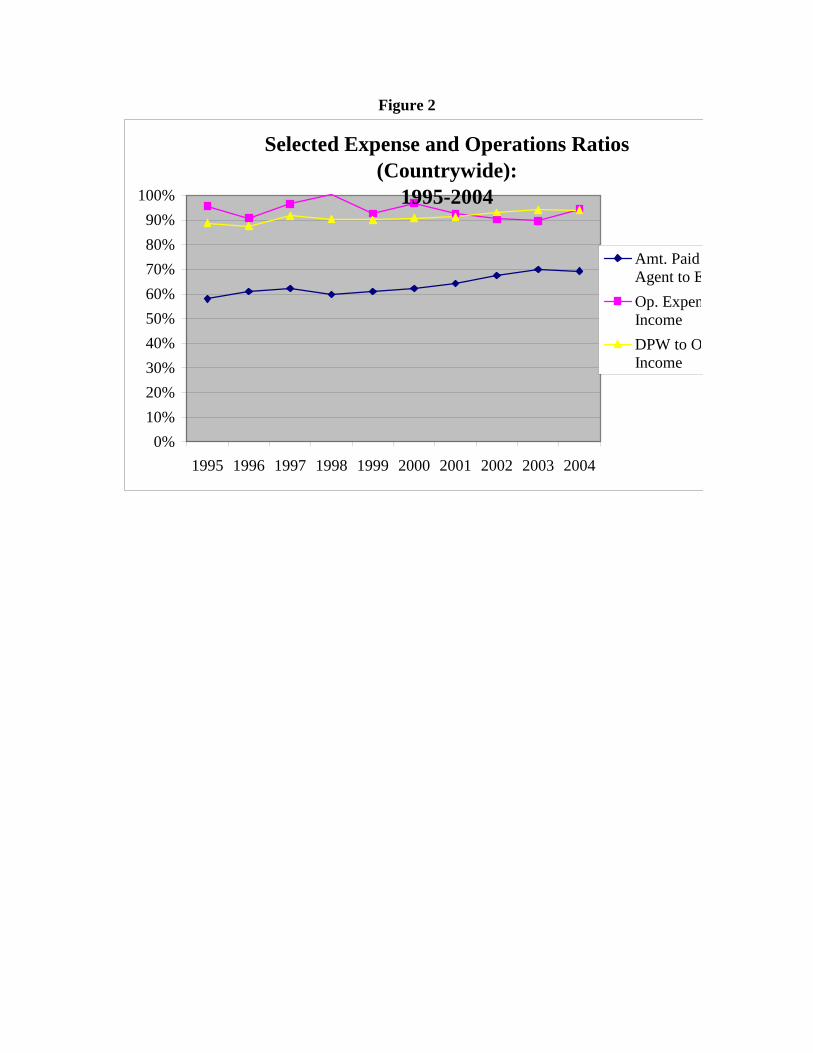
Figure 2
Selected Expense and Operations Ratios (Countrywide):
1995-2004
0%10%20%30%40%50%60%70%80%90%
100%
1995 1996 1997 1998 1999 2000 2001 2002 2003 2004
Amt. Paid Agent to EOp. ExpenIncomeDPW to OIncome
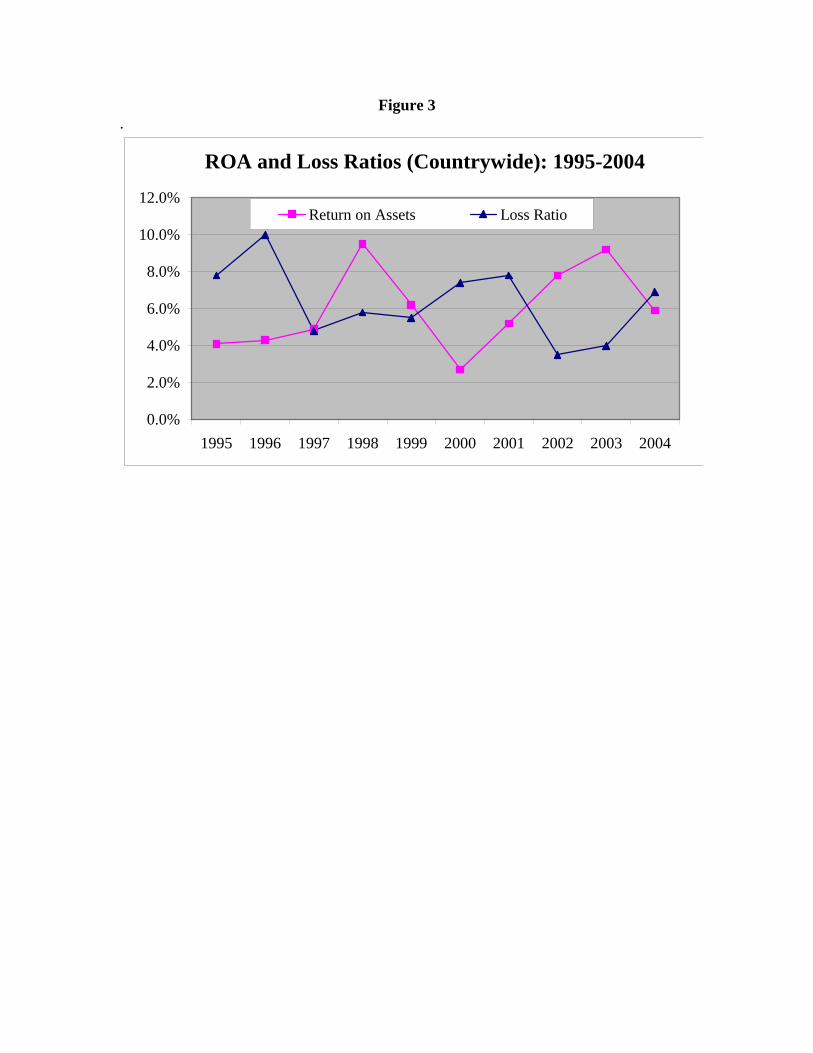
Figure 3 .
ROA and Loss Ratios (Countrywide): 1995-2004
0.0%
2.0%
4.0%
6.0%
8.0%
10.0%
12.0%
1995 1996 1997 1998 1999 2000 2001 2002 2003 2004
Return on Assets Loss Ratio
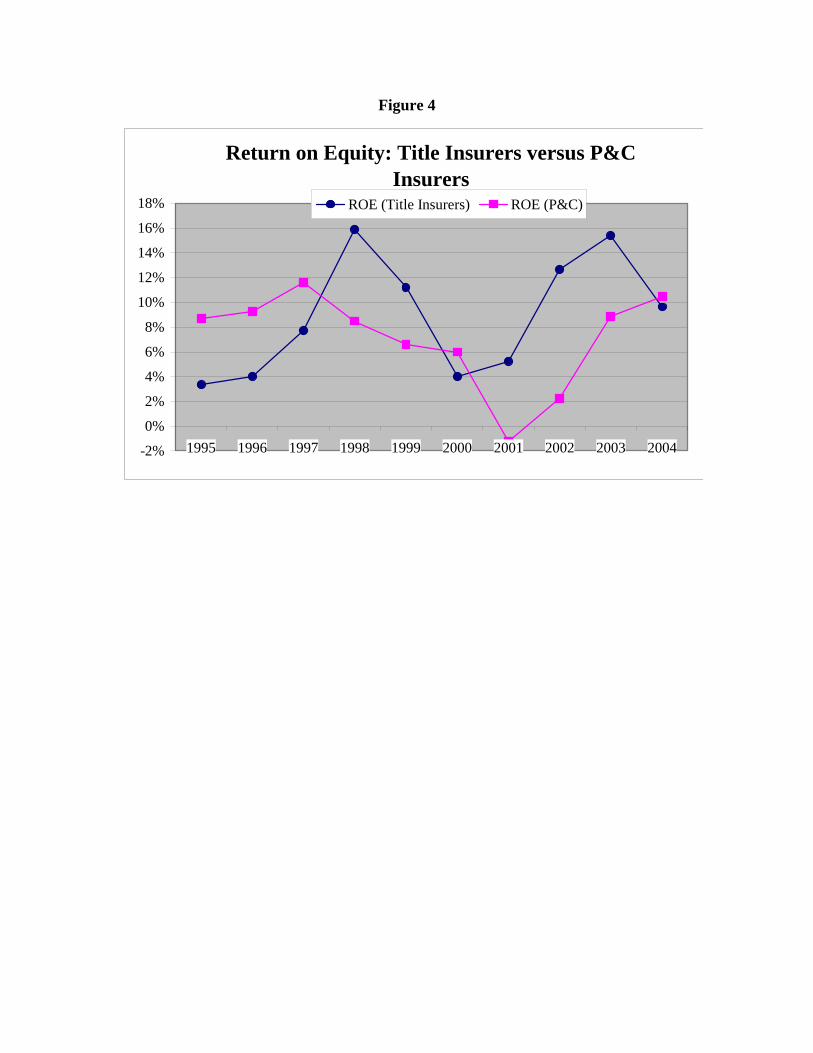
Figure 4
Return on Equity: Title Insurers versus P&C Insurers
-2%
0%
2%
4%
6%
8%
10%
12%
14%
16%
18%
1995 1996 1997 1998 1999 2000 2001 2002 2003 2004
ROE (Title Insurers) ROE (P&C)
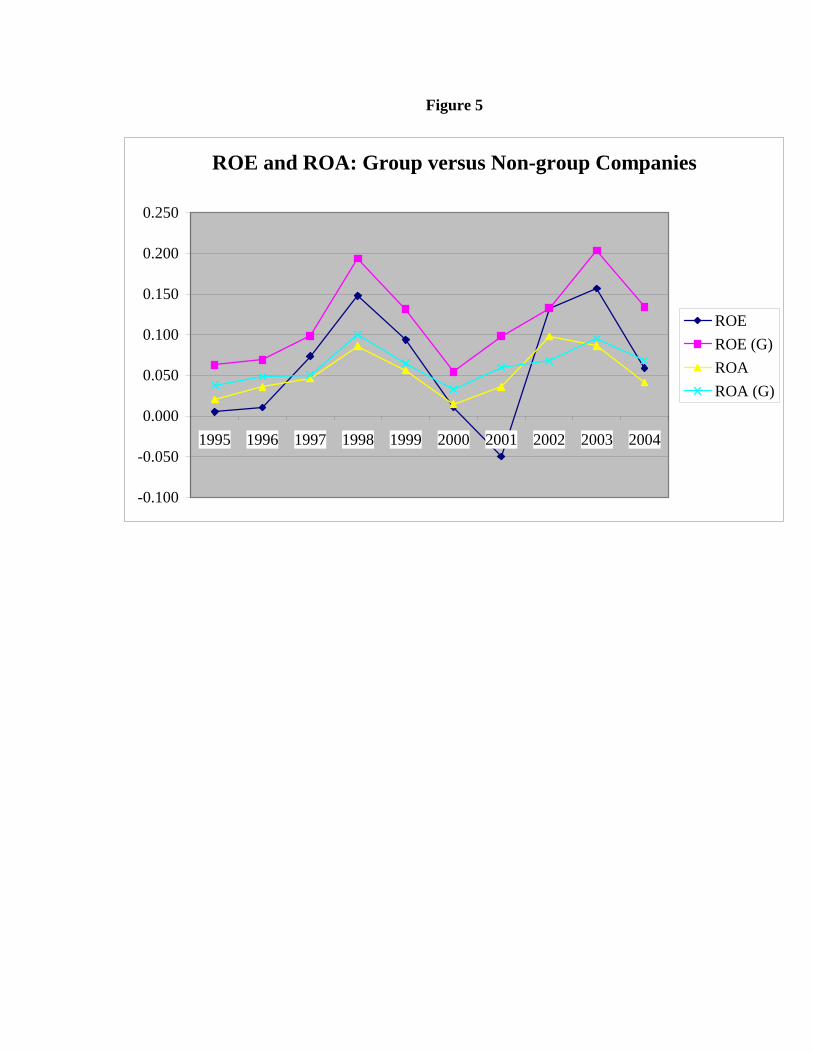
Figure 5
ROE and ROA: Group versus Non-group Companies
-0.100
-0.050
0.000
0.050
0.100
0.150
0.200
0.250
1995 1996 1997 1998 1999 2000 2001 2002 2003 2004
ROEROE (G)ROAROA (G)

Figure 6
Loss Ratios: Group versus Non-Group Companies
0%
2%
4%
6%
8%
10%
12%
14%
16%
1995 1996 1997 1998 1999 2000 2001 2002 2003 2004
Loss Ratio (NG) Loss Ratio (G)

June 9, 2006 Mr. Steve Parton General Counsel Office of Insurance Regulation 200 East Gaines Street Tallahassee, Florida 32399 RE: Title Insurance Final Report Attached please find the final report on title insurance that was initiated while I was employed by the Office of Insurance Regulation, and which I have been permitted to complete under my current position. While employed by OIR, I prepared the Data Request that was subsequently electronically distributed by OIR via e-mail on November 10, 2005 to all title insurance companies operating in the state of Florida. Several of the responders to the Data Request represented that the data provided was confidential. In certain cases such data is specifically identified in this final report. I accept no responsibility for performing the appropriate level of review regarding the classification of the data as privileged and confidential pursuant to the trade secrets statutes. Furthermore, this final report is being supplied to OIR on a confidential basis, and I assume no liability for its public release, distribution or use by a third party. If OIR decides to publicly release this final report, it should only be distributed in its entirety and should not replace the due diligence on behalf of any third party. The conclusions in this study are related to its stated purpose only and may not be applicable for other purposes. Should OIR determine that changes to the final report are needed, I reserve the right to make or approve all such changes. Additionally, I would appreciate notification of your determination of the limitations, if any, of the release of this final report or the underlying data. This letter and the accompanying text and exhibits constitute my final report. Thank you for your close attention to this matter. Sincerely, Stephen A. Alexander, FCAS, MAAA, MBA

June 9, 2006 Title Insurance Rates and Related Title Service Charges State of Florida Actuarial Analysis
Prepared by: Stephen A. Alexander, FCAS, MAAA, MBA

Actuarial Analysis Title Insurance
TABLE OF CONTENTS
INTRODUCTION 3
CONCLUSIONS AND RECOMMENDATIONS 5
INDUSTRY 6 Comparison with Other Insurance 6 Types of Policies 6 Types of Premiums 6 Related Title Services 6 Owner's Policy 7 Lender's Policy 7 Industry Profitability 7
LIMITATIONS 9 Distribution and Use 9 Data and Information Reliances 9 Key Assumptions and Limitations 11
ANALYSIS 12 Indicated Rates and Charges 12 Indicated Agent Compensation 14 Tax Base 18 Florida Market Concentration 18 Reissue Discounts 20 Minimum Loss Ratio 21
METHODOLOGY 22 Related Title Service Charges 22 Indicated Risk Premiums 24 Indicated Search, Examination and Closing Costs 25
EXHIBITS 28
Page 2 of 29

INTRODUCTION This report was prepared at the request of the Florida Office of Insurance Regulation (OIR) based upon the Title Insurance Data Request (Data Request) issued by OIR on November 10, 2005, which was prepared by the author while employed by the OIR. The objectives of this report are to provide indications of Florida title insurance rates and charges for related title insurance services based upon title insurance rates and charges for related title services in other states. The rationale of the Data Request was to gather data sufficient to compare Florida title insurance rates to rates currently charged in other states. It was decided that a traditional actuarial review of Florida title insurance rates may not be adequate, because such an analysis may have difficulty adjusting for: 1) inefficient provision of title services, 2) improper payments or subsidies to realtors, home builders, lenders or mortgage brokers, and 3) excessive salaries or bonuses paid to title agents or title insurance company executives. Although consumers are free to shop around for title insurance, many consumers defer such decisions to realtors, home builders, lenders or mortgage brokers, and title insurance companies have sometimes used illegal tactics in marketing to those decision-makers. Thus, the fundamental problem with title insurance is that the person who pays for title insurance is not the same as the person who buys it, leading to a condition of “reverse competition” that benefits decision makers to the detriment of consumers. Another reason why a traditional actuarial approach was not taken is that title insurance agents historically have not been responsive to the voluntary data calls issued by the OIR or its contractors. In 1997 only 22% of independent agents (by premium volume), 34% of affiliated agents (by premium volume) and 23 attorneys responded to OIR’s data call (David Cox 1998 report, pages 12 and 13). Since approximately 75% of Florida title industry revenue is paid to title agents either directly (via related title services) or indirectly (via a statutory maximum of 70% of title insurance premiums), it was determined that a voluntary data call to agents would not provide sufficient comprehensive data to establish actuarially sound rates.
Page 3 of 29
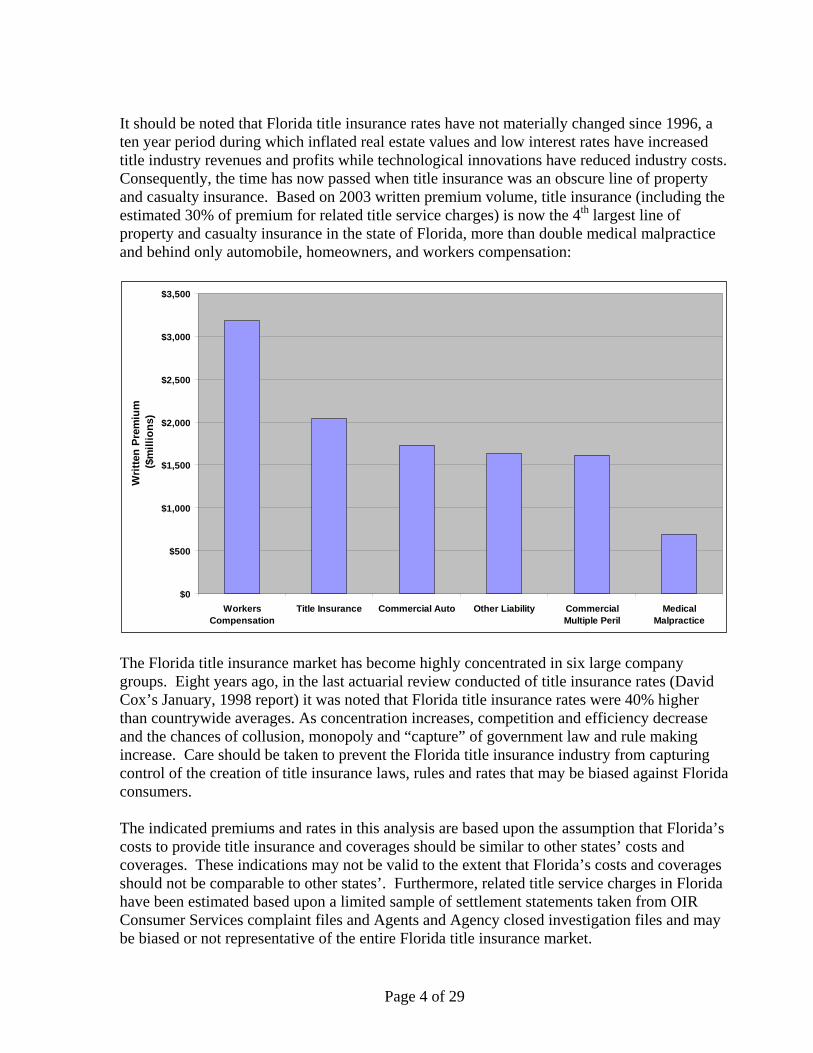
It should be noted that Florida title insurance rates have not materially changed since 1996, a ten year period during which inflated real estate values and low interest rates have increased title industry revenues and profits while technological innovations have reduced industry costs. Consequently, the time has now passed when title insurance was an obscure line of property and casualty insurance. Based on 2003 written premium volume, title insurance (including the estimated 30% of premium for related title service charges) is now the 4th largest line of property and casualty insurance in the state of Florida, more than double medical malpractice and behind only automobile, homeowners, and workers compensation:
$0
$500
$1,000
$1,500
$2,000
$2,500
$3,000
$3,500
WorkersCompensation
Title Insurance Commercial Auto Other Liability CommercialMultiple Peril
MedicalMalpractice
Writ
ten
Prem
ium
($m
illio
ns)
The Florida title insurance market has become highly concentrated in six large company groups. Eight years ago, in the last actuarial review conducted of title insurance rates (David Cox’s January, 1998 report) it was noted that Florida title insurance rates were 40% higher than countrywide averages. As concentration increases, competition and efficiency decrease and the chances of collusion, monopoly and “capture” of government law and rule making increase. Care should be taken to prevent the Florida title insurance industry from capturing control of the creation of title insurance laws, rules and rates that may be biased against Florida consumers. The indicated premiums and rates in this analysis are based upon the assumption that Florida’s costs to provide title insurance and coverages should be similar to other states’ costs and coverages. These indications may not be valid to the extent that Florida’s costs and coverages should not be comparable to other states’. Furthermore, related title service charges in Florida have been estimated based upon a limited sample of settlement statements taken from OIR Consumer Services complaint files and Agents and Agency closed investigation files and may be biased or not representative of the entire Florida title insurance market.
Page 4 of 29

CONCLUSIONS AND RECOMMENDATIONS • Average title insurance rates in Florida are 99.2% higher than comparable rates in the
surrounding states of Alabama, Georgia, Mississippi, North Carolina and South Carolina, and the indicated overall average change in title insurance rates is a reduction of 49.8%.
• Charges for the related title services of search, examination and closing in Florida are
estimated to be 37.7% lower than those in other states, and the indicated overall average change in related title service charges is an increase of 60.4%.
• The combined effect of decreasing title insurance rates and increasing charges for
related title services is an overall average decrease in Florida title insurance and related title service charges of 29.4%.
• If title insurance rates in Florida are reduced, limits should be placed by administrative
rule on related title service charges and endorsement premiums to prevent offsetting increases. Furthermore, to facilitate regulation and increase the taxable premium base, consideration should be given to a statutory change in the definition of title insurance “premium” to include the related title services of search, examination and closing as has been done in the “all-inclusive rate” states of Texas and Pennsylvania.
• Title insurance rates, related title service charges and endorsement premiums should
continue to be regulated in Florida to deter excessive consumer costs, foster efficiency and protect against collusion and monopoly. The Florida title insurance market is highly concentrated in six large company groups. As concentration increases, competition and efficiency decrease and the chances of collusion and monopoly increase. However, care should be taken to insure that “capture” of government regulation does not occur. The problem of regulator capture occurs when large companies control the setting of laws and administrative rules creating a system biased against consumers.
• By administrative rule amendment, the eligibility period for reissue discounts in Florida
should be increased from 3 years to 10 years consistent with reissue discounts typically granted in other states. When a real property is refinanced or sold during the eligibility period, title insurance may be issued at a discount.
• Consideration should be given to the imposition of a minimum loss ratio requirement
on title insurers in place of the 30% minimum retention requirement (title insurers by law must retain at least 30% of title insurance premiums (Section 727.782 F.S.)). This change in Florida law is recommended because: 1) title insurance is the only form of property and casualty or life and health insurance in the state of Florida that has such a provision, 2) elimination of this requirement will facilitate rate reduction, and 3) this provision appears unnecessary based on industry profitability.
Page 5 of 29

INDUSTRY Title insurance is insurance against defects in title to real property, available in most but not all countries. It is meant to protect an owner's or lender's financial interest in property against loss due to title defects, liens or other matter of public record. It will defend against a lawsuit attacking the title, or reimburse the insured for the actual monetary loss incurred, up to the dollar amount of insurance provided by the policy. Typically the real property interests insured are fee simple ownership or a mortgage. However, title insurance can be purchased to insure any interest in real property, including an easement, lease or life estate. Just as lenders require fire insurance and other types of insurance coverage to protect their investment, nearly all institutional lenders also require title insurance to protect their interest in the collateral of loans secured by real estate. Some mortgage lenders, especially non-institutional lenders, may not require title insurance.
Comparison with Other Insurance Title insurance differs in several respects from other types of insurance. Where most insurance is a contract where the insurer indemnifies or guarantees another party against a possible specific type of loss (such as an accident or death) at a future date, title insurance attempts to detect, prevent, and eliminate risks and losses caused by title problems which have their source in past events. Title companies attempt to achieve this by searching public records to develop and document the chain of title and to detect whether there are any adverse claims on the subject property. If liens or encumbrances are found, the insurer may take steps to fix them (for example, by obtaining a release of an old mortgage or deed of trust that has been paid off) before issuing the title policy or may specifically "except" those items from coverage. Title plants are sometimes maintained to index records geographically, with the goal of reducing claims.
Types of Policies Standardized forms of title insurance exist for owners, lenders, and for construction loans.
Types of Premiums Premiums for title insurance may include certain related title insurance services such as search, examination and closing. A title insurance premium that includes all related title services charges is called “all-inclusive”. A title insurance premium that does not include any charges for related title insurance services is called a “risk premium”.
Related Title Services Search, means a careful exploration and perusal of the public records in an effort to find all recorded instruments relating to a particular chain of title. Examination, means to peruse and study the instruments incident to a chain of title and to determine their effect and condition in order to reach a conclusion as to the status of title. Closing, in some areas called a “settlement”, is the process of completing a real estate transaction during which deeds, mortgages, leases and other required instruments are signed and/or delivered, an accounting between the parties is made, the money is disbursed, the papers are recorded, and all other
Page 6 of 29

details such as payment of outstanding liens and transfer of hazard insurance policies are completed. In addition to the above there may be additional related title service charges for such items as binders, document preparation, notary fees, attorney fees, shipping and handling, warehouse fees and other miscellaneous fees.
Owner's Policy The owner's policy insures a purchaser that the title to the property is free from defects (liens and encumbrances), except those which are listed as exceptions in the policy. It covers losses and damages suffered if the title is unmarketable (i.e., if the title can not be legally sold and conveyed to another party or if the property is "unmarketable"), for example if an interest in the property is found to belong to someone else, if there is no access to the land (if this coverage is provided), or if there is some other defect on the title. An owner's policy specifically lists what interest in the property is insured as of what effective date. The policy also contains various standard exclusions to coverage and also specific exceptions to coverage, based on documents that have been recorded against the property at some point in the past that the title company is unwilling to insure. The policy limits of the owner’s policy are typically the purchase price paid for the property. As with other types of insurance, coverages can also be added or deleted with an endorsement. There are many forms of standard endorsements to cover a variety of common issues. The premium for the policy may be paid by the seller or buyer as the parties agree; usually there is a custom in a particular state or county which is reflected in most local real estate contracts. Consumers should inquire about the cost of title insurance before signing a real estate contract which provides that they pay for title charges. A real estate attorney, broker, escrow officer (in the western states), or loan officer can provide detailed information to the consumer as to the price of title search and insurance before the real estate contract is signed. Title insurance coverage lasts as long as the insured retains an interest in the land insured and typically no additional premium is paid after the policy is issued.
Lender's Policy The lender's policy is separate from the owner's policy. This type of policy insures the validity and enforceability of the lien of the lender's mortgage or deed of trust. The lender's policy protects the lender for the amount of money lent against the property. Coverage under the lender's policy lasts as long as the loan secured by the mortgage or deed of trust has a balance. The title insurer's risk under a lender's policy is generally less than that of an owner's policy; as a result, insurers typically charge lower premiums for a lender's policy than would be charged for the same dollar amount of coverage on an owner's policy.
Industry Profitability In 2003, according to American Land Title Association (ALTA), the industry paid out about $662 million in claims, about 4.3% percent of the $15.7 billion taken in as premiums. By comparison, the boiler insurance industry, which like title insurance requires an emphasis on inspections and risk analysis, pays 25% of its premiums in claims. Comparing claims with premiums tells only part of the story, since, for example, title insurance companies have marketing expenses not incurred by the boiler insurance industry. But the
Page 7 of 29

industry's profitability is also hinted at by the repeated instances of state regulators uncovering cases where title insurers have engaged in illegal marketing tactics. Although owners are free to shop around for title insurance, many owners defer such decisions to lenders or real estate agents, and title insurance companies have sometimes used illegal tactics in marketing to those decision-makers. Illegal tactics noted in a CNN/Money article include kickbacks, free vacations, and the free use of office space and equipment. The article noted that in 2005 alone over a dozen title insurers settled with regulators for tens of millions of dollars over these practices. Further evidence of the industry's profitability can be found by comparing the title insurance costs in the 49 states where such insurance is issued with the costs associated with the state-run Title Guaranty Program in Iowa, where title insurance is illegal. The program is run by the Iowa Finance Authority. It costs $110 for up to $500,000 in coverage in the state; after adding costs for the services of an abstractor (who does the research on the property) and the legal fees, such a title guaranty costs about $400.00, versus the $1,100.00 paid for that same home in other states (based on figures cited by the Iowa Bar Association).
Page 8 of 29

LIMITATIONS Distribution and Use This study’s conclusions are developed in the accompanying text and exhibits, which together comprise the report. The conclusions in this study are related to its stated purpose only and may not be applicable for other purposes. Should OIR determine that changes to the report are needed, the author reserves the right to make or approve all such changes. Several of the responders to the Data Request represented that the data provided was confidential. In certain cases such data is specifically identified in this report. The author accepts no responsibility for performing the appropriate level of review regarding the classification of the data as privileged and confidential pursuant to the trade secrets statutes. This report is being supplied to OIR on a confidential basis and the author assumes no liability for its public release, distribution or use by a third party. If OIR decides to publicly release this report, it should only be distributed in its entirety and should not replace the due diligence on behalf of any third party.
Data and Information Reliances The following data and information was relied upon in order to complete this analysis:
• Data Request submissions were provided by 19 responding companies as summarized on Exhibit 8. The Data Request was electronically distributed via e-mail on November 10, 2005 to all title insurance companies operating in the state of Florida. It was composed of a Jurat page and Tables 1, 2 and 3, which each contained instructions for completion. The deadline for completing the Data Request was December 31, 2005, however the last submission was not received until February 8, 2005. All of the major writers in Florida of title insurance responded to the Data Request except companies in the Stewart Group (composing 8.6% of the 2004 Florida market). A copy of the Data Request can be obtained from the OIR.
• 50 HUD-1 settlement statements were taken from OIR Consumer Services complaint
files and Agents and Agencies closed investigation files and summarized by Dr. Stacy Sirmans in his Phase I study entitled “A Preliminary Examination of Title Insurance Regulation, Pricing and Costs Structures”, dated February, 2006. The real estate settlement agent must complete a Federal HUD-1 form on every real estate settlement transaction in the United States. A sample HUD-1 form and completion instructions may be obtained from the Federal Department of Housing and Urban Development.
• Title Insurance Statutory Annual Statement Schedule T Data for the years 1995 through
2004 were provided by OIR. This data was obtained from the NAIC database for every title insurance company operating anywhere in the United States during the time period 1995 through 2004. Schedule T shows for each title insurer: written premiums, earned premiums, paid losses, and incurred losses by state, by calendar year.
Page 9 of 29

• The industry section of this report was paraphrased or excerpted directly from Wikipedia or the American Land Title Insurance internet websites.
The accuracy of the data and information provided was relied upon without independent investigation or verification. The data was checked for reasonableness, and data considered inaccurate or incomplete was not used. However, if the data is subsequently found to be inaccurate or incomplete, the conclusions in this report may need to be revised.
Page 10 of 29

Key Assumptions and Limitations • The indicated premiums and rates in this analysis are based upon the assumption that
Florida’s costs to provide title insurance and coverages should be similar to other states’ costs and coverages. These indications may not be valid to the extent that Florida’s costs and coverages should not be comparable to other states’.
• Related title service charges in Florida have been estimated based upon a limited
sample of settlement statements taken from OIR Consumer Services complaint files and Agents and Agency closed investigation files and may be biased or not representative of the entire Florida title insurance market.
• It is assumed that risk premiums charged in the surrounding states of Alabama,
Georgia, Mississippi, North Carolina and South Carolina are more representative of reasonable Florida premiums than premiums based on countrywide averages.
• This analysis has been prepared in conformity with its intended use by persons
technically competent in the areas addressed and only for the stated purposes. Judgments as to the conclusions, indications, methods, and data contained in this analysis should be made only after studying the analysis in its entirety. Furthermore, the author is available to explain any matter presented herein. It is assumed that the user of the analysis will seek such explanation as to any matter in question.
• In performing this analysis, data as provided by the responding companies pursuant to
the Data Request, the summary of settlement statements provided by Dr. Sirmans and the Statutory Annual Statement Schedule T data provided by OIR was relied upon without audit or independent verification. Where data was lacking, insufficient, or unreliable it was not used, and actuarial judgment was used to supplement this analysis.
• In addition to the assumptions stated in the report, numerous other assumptions
underlie the calculations and results presented herein.
Page 11 of 29
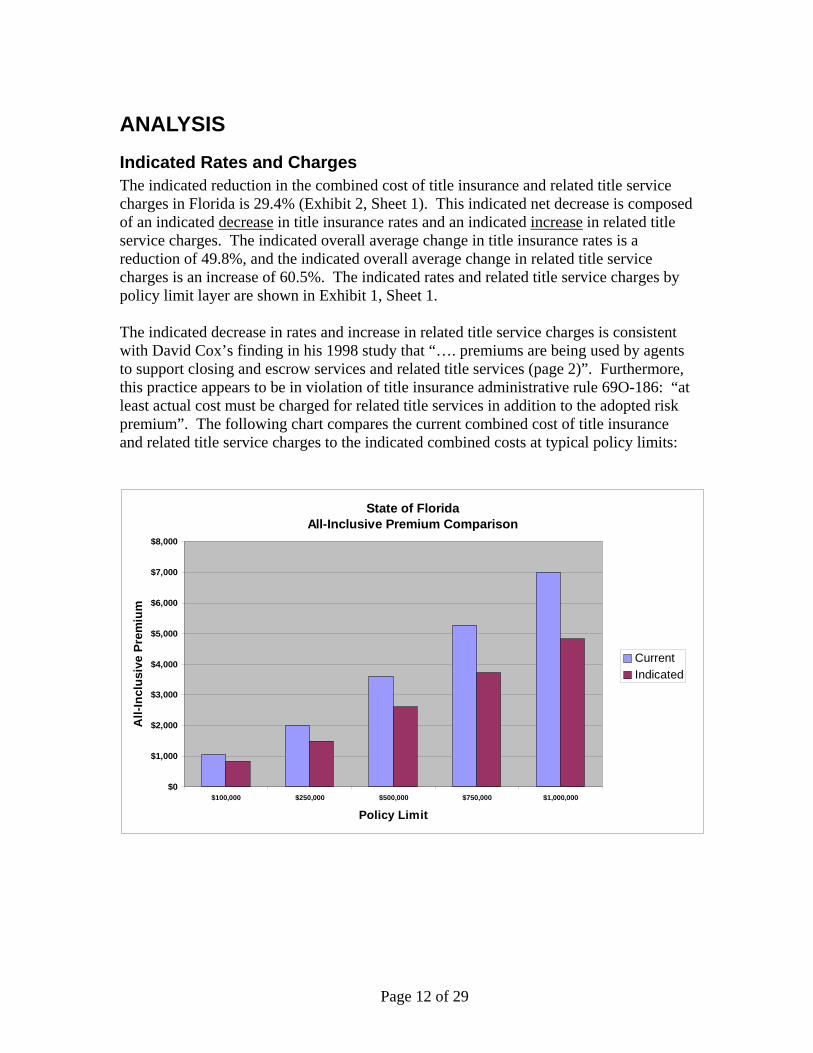
ANALYSIS Indicated Rates and Charges The indicated reduction in the combined cost of title insurance and related title service charges in Florida is 29.4% (Exhibit 2, Sheet 1). This indicated net decrease is composed of an indicated decrease in title insurance rates and an indicated increase in related title service charges. The indicated overall average change in title insurance rates is a reduction of 49.8%, and the indicated overall average change in related title service charges is an increase of 60.5%. The indicated rates and related title service charges by policy limit layer are shown in Exhibit 1, Sheet 1. The indicated decrease in rates and increase in related title service charges is consistent with David Cox’s finding in his 1998 study that “…. premiums are being used by agents to support closing and escrow services and related title services (page 2)”. Furthermore, this practice appears to be in violation of title insurance administrative rule 69O-186: “at least actual cost must be charged for related title services in addition to the adopted risk premium”. The following chart compares the current combined cost of title insurance and related title service charges to the indicated combined costs at typical policy limits:
State of FloridaAll-Inclusive Premium Comparison
$0
$1,000
$2,000
$3,000
$4,000
$5,000
$6,000
$7,000
$8,000
$100,000 $250,000 $500,000 $750,000 $1,000,000
Policy Limit
All-
Incl
usiv
e Pr
emiu
m
CurrentIndicated
Page 12 of 29

The above indicated combined costs of Florida title insurance and related title service charges are consistent with premiums currently charged in the all-inclusive states of Texas and Pennsylvania at lower limits and Pennsylvania at higher limits. The following charts compare these two all-inclusive states to the indicated Florida combined title premium and related title service charges at the indicated policy limits:
All-Inclusive Premium Comparison
$-
$200
$400
$600
$800
$1,000
$1,200
$1,400
$1,600
$1,800
$2,000
$25,000 $50,000 $100,000 $250,000Policy Limit
All-
Incl
usiv
e Pr
emiu
m
Texas
Pennsylvania
Florida
All-Inclusive Premium Comparison
$0
$5,000
$10,000
$15,000
$20,000
$25,000
$30,000
$35,000
$40,000
$45,000
$50,000
$500,000 $750,000 $1,000,000 $5,000,000 $10,000,000
Policy Limit
All-
Incl
usiv
e Pr
emiu
m
TexasPennsylvaniaFlorida
Page 13 of 29

Indicated Agent Compensation Indicated agent compensation will vary significantly based upon the definition of title insurance premium. Currently, by Florida law (Section 627.782(1), Florida Statutes), agent compensation equals a maximum of 70% of title insurance premium including endorsements plus 100.0% of related title service charges. If the definition of title insurance premium is expanded to include related title service charges, and the indicated rates are adopted, agent compensation will decline by an estimated 35.5%. If the definition of title insurance premium remains the same and continues to exclude related title service charges, and the indicated rates are adopted, agent compensation will decline by an estimated 21.5% (Exhibit 2, Sheet 6). Because the indications are that the combined premium and related title services revenue should decline, the share of the decrease that Florida title insurers and title agents will bear depends upon the maximum retention specified in Section 627.782(1), F.S. and the definition of title insurance premium in Section 627.7711(2) F.S.
Page 14 of 29

Current Rates and Charges With few exceptions, current Florida title insurance risk rates are the highest in the country. The following chart illustrates the rate disparity between Florida and the 26 other risk rate states:
Average PremiumsRisk Rate StatesOwner's Policy
Select Policy Limits
$-
$500
$1,000
$1,500
$2,000
$2,500
$3,000
$3,500
$4,000
MO NC SC NH ND AR OK GA AL VT MN KY DE ME RI CT MD MS WV VA MA AK LA NJ OH FL
$100,000
$250,000
$500,000
$750,000
It should also be noted that the premium disparity between Florida and the other 26 risk rate states increases as property values increase. For example, in the average cost state the percentage increase in premium between a $100,000 policy and a $750,000 policy is 550%, but in Florida the increase is approximately 650%. Therefore, as inflation pushes Florida property values up, more Florida properties will become subject to this premium disparity.
Page 15 of 29

Loss Ratios If rates reflect risk of loss, then the expectation would be that the ratio of losses to premium in the 26 risk rate states would be approximately the same. However, what is found is just the opposite: loss ratios are lower in the high risk rate states and higher in low risk rate states. The following chart illustrates this point:
Title Industry Loss RatiosRisk Rate States
2002 - 2004
0.0%
2.0%
4.0%
6.0%
8.0%
10.0%
12.0%
14.0%
MO NC SC NH ND AR OK GA AL VT MN KY DE ME RI CT MD MS WV VA MA AK LA NJ OH FL
ActualLossRatio
FittedLossRatio
The “Fitted Loss Ratio” line above is the predicted loss ratio based on rate level. Rate levels are predictive of loss ratios with a coefficient of determination (R squared) of .249, meaning 24.9% of the variation in loss ratios can be explained by the variation in rate levels. There are many other reasons why these loss ratios could vary such as random fluctuations in claims frequency or severity, varying credibility levels between states, higher risks of certain types of loss in certain states such as defalcation (title agent misuse of funds), etc. However, absent any evidence that expenses other than loss and loss expense are higher in Florida, Florida’s low loss ratio adds further support to the conclusion that Florida rates are too high.
Page 16 of 29

The Fund’s Premiums It is possible that it is more costly to operate a title insurance company in Florida causing premiums to be higher, but the premiums charged by The Attorney’s Title Insurance Fund (The Fund) do not support this possibility. The Fund is the second largest underwriter of title insurance in the state of Florida and operates in nine risk rate states. The following chart compares the premiums charged by The Fund in Florida at select policy limits to the premiums charged by The Fund in the other nine risk rate states in which it operates:
Attorneys' Title Insurance FundOwner's Policy Premiums
By Select Policy Limits
NC
NC
NC
SC
SC
SC
ILIL
IL
MN
MN
MN
AR
AR
AR
AL
AL
AL
GA
GA
GA
MI
MI
MI
FL
FL
FL
$0
$500
$1,000
$1,500
$2,000
$2,500
$3,000
$3,500
$100,000 $250,000 $500,000
Policy Limit
Since The Fund is a Florida based company operating through non-affiliated agents, nearly all its expenses can be classified as either: 1) loss or loss related, 2) Florida operating expenses, or 3) agent compensation. If The Fund’s risk of loss, operating expenses and agent compensation are comparable between states, then The Fund’s Florida premiums are too high. It could be argued that extra agent compensation is needed in Florida, and therefore the Fund’s rates should be higher in Florida. However, it is doubtful that Florida title work is so much different or more expensive to justify extra agent compensation. (To confirm The Fund’s risk of loss is approximately the same between states, one would expect The Fund’s Florida’s loss ratio to be lower, but because The Fund writes very little business outside of Florida, a comparison of The Fund’s Florida loss ratio to its other states’ loss ratio is not considered actuarially credible.)
Page 17 of 29

Tax Base If the definition of title insurance premium in Section 627.7711(2) F.S. is not amended, and the indicated changes are implemented, then the title insurance premium tax base will shrink by approximately 49.8% (Exhibit 2, Sheet 1, Column (11). However, if the definition of title insurance premium is amended by law to include related title insurance service charges, the estimated impact upon the tax base of decreasing title insurance premiums while increasing charges for related title insurance service charges is -9.1% (Exhibit 2, Sheet 2).
Florida Market Concentration Title insurance rates, related title service charges and endorsement premiums should continue to be regulated in Florida to deter excessive consumer costs, foster efficiency and protect against collusion and monopoly. The Florida title insurance market is highly concentrated in six large company groups. As concentration increases, competition and efficiency decrease and the chances of collusion and monopoly increase. Furthermore, care should be taken to insure that “capture” of government regulation does not occur. The problem of regulator capture takes place when large companies control the making of laws and administrative rules by which they are regulated, thus creating a system biased against consumers.
State of FloridaTitle Insurance
2004 Market ShareBy Company Group
0.0% 5.0% 10.0% 15.0% 20.0% 25.0% 30.0%
Others
Old Republic
Stewart
Land America
First American
Attorneys' Title
Fidelity
The Herfindahl index for the Florida title insurance market based on the above company groups is 19.7%. The Herfindahl index is a measure of industry concentration, and the United States Department of Justice considers Herfindahl indices between 0.1000 and 0.1800 to be moderately concentrated and indices above 0.1800 to be concentrated.
Page 18 of 29

The following table summarizes Florida 2004 market shares by company within company group:
Group Company
Name
Direct Written
Premium Company
Share Group Total
GroupShare
Fidelity Chicago Title
202,365,496 11.2%
Fidelity Fidelity National
158,239,195 8.7%
Fidelity Ticor FL
133,386,189 7.4%
Fidelity Ticor
12,522,909 0.7%
Fidelity National NY 6,962,671 0.4%
513,476,460 28.4%
Attorneys Title The Fund
396,973,170 21.9%
396,973,170 21.9%
First American First American
307,227,791 17.0%
First American United General
22,709,980 1.3%
First American Censtar
12,450,498 0.7%
342,388,269 18.9%
Land America Commonwealth
162,565,472 9.0%
Land America Lawyers
95,547,778 5.3%
Land America Transnation 104,417 0.0%
Land America TIC America 84,983 0.0%
258,302,650 14.3%
Stewart Stewart Title
Guaranty
154,951,793 8.6%
Stewart Alliance Title 696,984 0.0%
155,648,777 8.6%
Old Republic Old Republic
118,811,222 6.6%
118,811,222 6.6%
Others Others
23,889,375 1.3%
23,889,375 1.3%
Total Total
$1,809,489,923 100.0%
$1,809,489,923 100.0% Company names have been simplified in the above table because of space considerations. For example, Chicago Title Insurance Company has been simplified to Chicago Title.
Page 19 of 29

Reissue Discounts By administrative rule amendment, the eligibility period for reissue discounts in Florida should be increased from 3 years to 10 years consistent with reissue discounts typically granted in other states. When a real property is refinanced or sold during the eligibility period, title insurance may be issued at a discount. Only five companies were considered to correctly complete the reissue discount portion of Table 2 (Exhibit 8). Nevertheless, the limited data indicate that the Florida percentage of reissue discount (42.6%) is comparable to other states’ but the Florida eligibility period is significantly shorter than other states’, as illustrated in the following chart:
Attorneys' Title Insurance FundReissue Discounts
0%
10%
20%
30%
40%
50%
60%
70%
1 2 3 4 5 6 7 8 9 10
Number of Years of Eligibility
Dis
coun
t FL
AL, AR, GA& MN
NC & SC
MI
Page 20 of 29

Minimum Loss Ratio Consideration should be given to the imposition of a minimum loss ratio requirement on title insurers in place of the 30% minimum retention requirement (title insurers by law must retain at least 30% of title insurance premiums (Section 727.782 F.S.)) for the following reasons: 1) title insurance is the only form of property and casualty or life and health insurance in the state of Florida that has a minimum retention requirement, 2) elimination of the minimum retention requirement will facilitate rate reduction, 3) the minimum retention requirement appears unnecessary based on industry profitability, 4) a minimum loss ratio requirement will facilitate rate regulation by automatically triggering rate reviews as the industry loss ratio departs materially from the statutory minimum, and 5) a minimum loss ratio requirement will deter excessive company expenses, excessive agent compensation and illegal marketing tactics. Compare, for example, the approach taken in Florida to the regulation of health insurance: health insurance policies are required to maintain reasonable loss ratios (Section 627.410 (7)(a) F.S.), a requirement that protects consumers from excessive premiums due to excessive company expenses and excessive commissions paid to agents. Health insurance policies must return at least 75% of the aggregate amount of premiums earned for group policies, and at least 65% of the aggregate amount of premiums earned for individual policies (Section 627.6745 (7)(a) F.S.). Even though title insurance differs in several respects from other types of insurance, the industry’s involvement in illegal marketing tactics such as kickbacks, free vacations, and the free use of office space and equipment suggests that title insurers could reduce premiums and abide by a minimum loss ratio requirement with no adverse impact on profitability. As noted previously, the boiler insurance industry, which like title insurance requires an emphasis on inspections and risk analysis, pays 25% of its premiums in claims. The current indicated minimum loss ratio for the Florida title insurance industry is 4.5% (Exhibit 2, Sheet 7), if the indicated changes in premium and related title services are adopted and the definition of premium is expanded to include related title service charges. The current indicated minimum loss ratio for the Florida title insurance industry is 9.0% (Exhibit 2, Sheet 8), if the indicated changes in premium and related title services are adopted and the definition of premium remains unchanged. However, future minimum loss ratios should be increased as excessive company expenses, excessive agent compensation and illegal marketing tactics are uncovered in the Florida title insurance industry. Therefore, it is recommended that a minimum Florida title insurance industry loss ratio be required by law, but the particular ratio be set by administrative rule based upon ongoing investigations of the industry.
Page 21 of 29
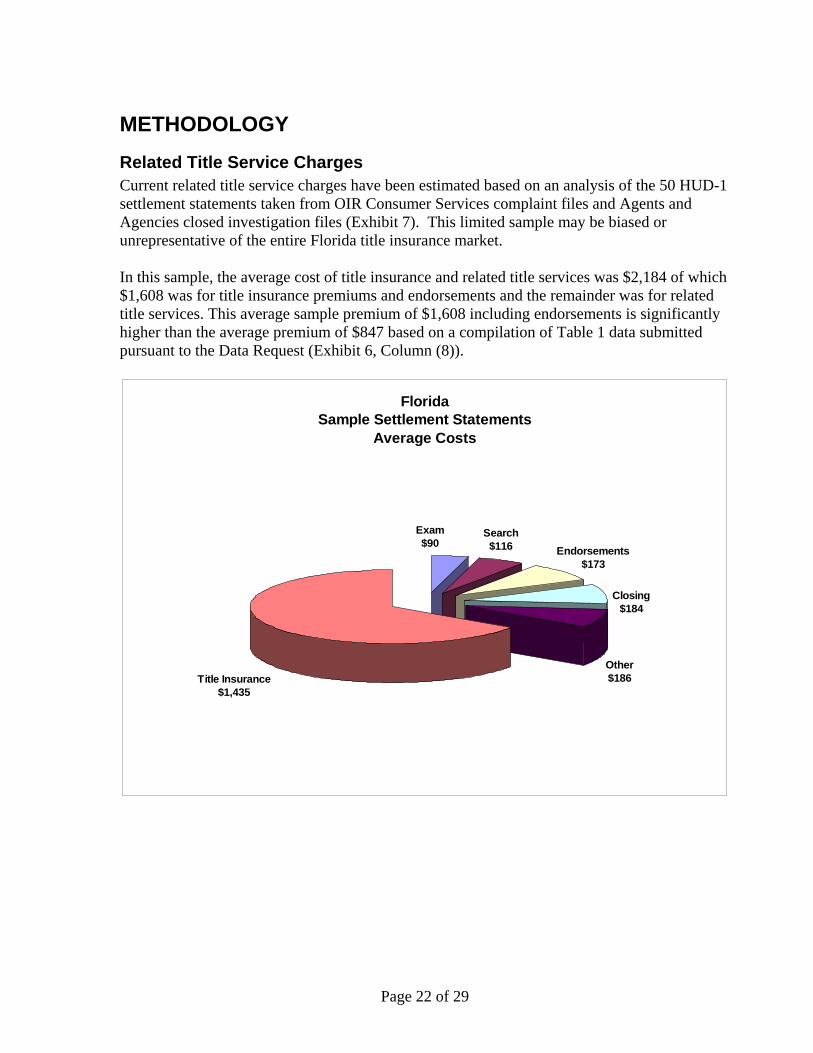
METHODOLOGY Related Title Service Charges Current related title service charges have been estimated based on an analysis of the 50 HUD-1 settlement statements taken from OIR Consumer Services complaint files and Agents and Agencies closed investigation files (Exhibit 7). This limited sample may be biased or unrepresentative of the entire Florida title insurance market. In this sample, the average cost of title insurance and related title services was $2,184 of which $1,608 was for title insurance premiums and endorsements and the remainder was for related title services. This average sample premium of $1,608 including endorsements is significantly higher than the average premium of $847 based on a compilation of Table 1 data submitted pursuant to the Data Request (Exhibit 6, Column (8)).
FloridaSample Settlement Statements
Average Costs
Other$186
Closing$184
Endorsements$173
Search$116
Title Insurance$1,435
Exam$90
Page 22 of 29

The difference in average premiums may be explained by: 1) the sample contains premiums and related title service charges for both owner’s and lender’s policies, while the Table 1 data is only owner policy data, 2) the limited sample size, 3) a possible unknown bias in the sample, 4) a difference in the average sample date of 11/19/2003 (Exhibit 7, Column (2)) versus the average experience period date of 7/1/2002 in Exhibit 6. In this analysis, an adjustment has been made for premium size by estimating related title service charges by size of title insurance premium in Exhibit 7, Column (20). The related title service charges are estimated to be a higher percentage of premiums for smaller premium sizes and a lower percentage of premiums for larger premium sizes. It is believed that the assumed variation in related title service charges as a percentage of premiums compensates for the bias in average premium size and increases the predictive value of the sample.
Page 23 of 29

Indicated Risk Premiums The indicated risk premiums and rates in this analysis are based upon the assumption that Florida’s costs to provide title insurance and coverages should be similar to other states’ costs and coverages. These indications may not be valid to the extent that Florida’s costs and coverages should not be comparable to other states’. Indicated risk premiums were estimated (Exhibit 5, Sheet 2) by averaging risk premiums for the surrounding states of Alabama, Georgia, Mississippi, North Carolina and South Carolina:
17 Responding CompaniesSurrounding States versus FloridaAverage Title Insurance Premiums
$310$632$565
$1,212
$2,438
$3,665
$4,891
$1,158
$2,090
$1,623
$0
$1,000
$2,000
$3,000
$4,000
$5,000
$6,000
$100,000 $250,000 $500,000 $750,000 $1,000,000
Policy Limit
SurroundingStates
Florida
It is assumed that risk premiums charged in surrounding states are more representative of reasonable Florida premiums than premiums based on countrywide averages. Note that 19 companies responded to the Data Request, but only 17 companies completed Table 3.
Page 24 of 29

Indicated Search, Examination and Closing Costs Of the 49 states other than Florida, it is assumed that 26 states (risk rate states) do not include search, examination, or closing charges in the title insurance premium, 19 states include search and examination but not closing charges in the title insurance premium, 2 states (Texas and Pennsylvania) include search, examination and closing charges in the title insurance premium, 1 state (Utah) includes closing but not search and examination costs, and 1 state (Iowa) prohibits by law the sale of title insurance. Based on this variation between states in the inclusion of title insurance costs and related title service charges in title insurance premiums, the indicated costs of title search, examination and closing are estimated. First American was the only large company operating in all states that was considered to correctly complete the related title services portion of Table 3. Therefore, states were classified in one of the above groups according to First American's completion of the related title services portion of Table 3. This assumption appears reasonable, because the indicated related title services charges for all companies is comparable to those indicated for First American - compare Exhibit 4, Sheets 1 and 2. The following chart compares the average premiums at select policy limits of: 1) the 26 risk rate states excluding Florida, 2) the 19 states that include search and examination in the title premium, and 3) the 2 states (Texas and Pennsylvania) that include search, examination and closing in the title insurance premium:
17 Responding CompaniesState Premium Comparison
$-
$1,000
$2,000
$3,000
$4,000
$5,000
$6,000
$100,000 $250,000 $500,000 $750,000 $1,000,000Policy Limit
Risk RateStates
Risk, SearchandExaminationRate States
Risk, Search,Examinationand ClosingRate States
Page 25 of 29

By subtracting risk rates from rates that include risk, search and examination, an estimate can be made of average search and examination costs; and by subtracting rates that include risk, search and examination from rates that include risk, search, examination and closing, an estimate can be made of closing costs (Exhibit 4, Sheet 1) as illustrated in the following chart at select policy limits:
17 Responding CompaniesSearch, Examination and Closing Costs
$0
$500
$1,000
$1,500
$2,000
$2,500
$3,000
100,000 250,000 500,000 750,000 1,000,000
Policy Limit
Search andExamination
Closing
For closing costs, a mathematical curve was fit to indicated closing costs (Exhibit 3). For policy limits of $5,000,000 and $10,000,000 the indicated closing costs are based upon the difference between Pennsylvania average premiums and the average premiums for states that include search and examination costs but not closing costs. For all other policy limits, the indicated closing costs are based upon the difference between the average of Texas and Pennsylvania premiums and the average premiums for states that include search and examination costs but not closing costs. The $5,000,000 and $10,000,000 limits were handled differently because: 1) Texas premiums are significantly higher at these policy limits and 2) Florida premiums are disproportionately discounted at these limits, suggesting that Florida rates for these policy limits are too high (see chart below and Exhibit 6, Column (12)). Rates by layer were estimated based on the current Florida title insurance premium layers of: $0-$100,000, $100,001-$1,000,000, $1,000,001-$5,000,000 and $5,000,000-$10,000,000. For search and examination, costs are estimated to be $175 at all premium sizes, based on the average for policy limits less than $1,000,000 (Exhibit 4, Sheet 1).
Page 26 of 29

The following chart illustrates the disproportionate discounting of Florida title insurance premiums at higher limits:
State of FloridaAverage Discounts From Manual Premium
By Policy Limit2000 - 2004
0.0%
10.0%
20.0%
30.0%
40.0%
50.0%
60.0%
$25,0
00
$50,0
00
$75,0
00
$100
,000
$200
,000
$300
,000
$400
,000
$500
,000
$600
,000
$700
,000
$800
,000
$900
,000
$1,00
0,000
$2,00
0,000
$3,00
0,000
$4,00
0,000
$5,00
0,000
$7,50
0,000
$10,0
00,00
0
$100
,000,0
00
Page 27 of 29

EXHIBITS Exhibit 1: Indicated Owner's Policy and Related Title Services Rates Exhibit 2, Sheet 1: Indicated Changes, Premiums and Related Title Services Exhibit 2, Sheet 2: Indicated Percentage Changes, Taxable Premium Base Exhibit 2, Sheet 3: Premium Comparison, All-Inclusive States versus Indicated Florida Exhibit 2, Sheet 4: Indicated Agent Compensation, Definition of Premium Changed to
Include Related Title Service Charges
Exhibit 2, Sheet 5: Indicated Agent Compensation, Definition of Premium Unchanged Exhibit 2, Sheet 6: Agent Compensation, Premium Definition Comparison Exhibit 2, Sheet 7: Minimum Loss Ratio, Definition of Premium Changed to Include
Related Title Service Charges Exhibit 2, Sheet 8: Minimum Loss Ratio, Definition of Premium Unchanged Exhibit 3: Fitted Closing Cost Exhibit 4, Sheet 1 Related Title Services Charges, Based on the Average Rates of 17
Responding Companies Exhibit 4, Sheet 2 Related Title Services Charges, Based on First American Rates Exhibit 5, Sheet 1 Surrounding States, Average Title Premium Exhibit 5, Sheet 2 Surrounding States versus Florida, Average Title Premium Exhibit 6 State of Florida, Summary of Experience
Exhibit 7 Sample Settlement Statements Exhibit 8 Data Request, Submission Compliance
Page 28 of 29

Actuarial Analysis Title Insurance
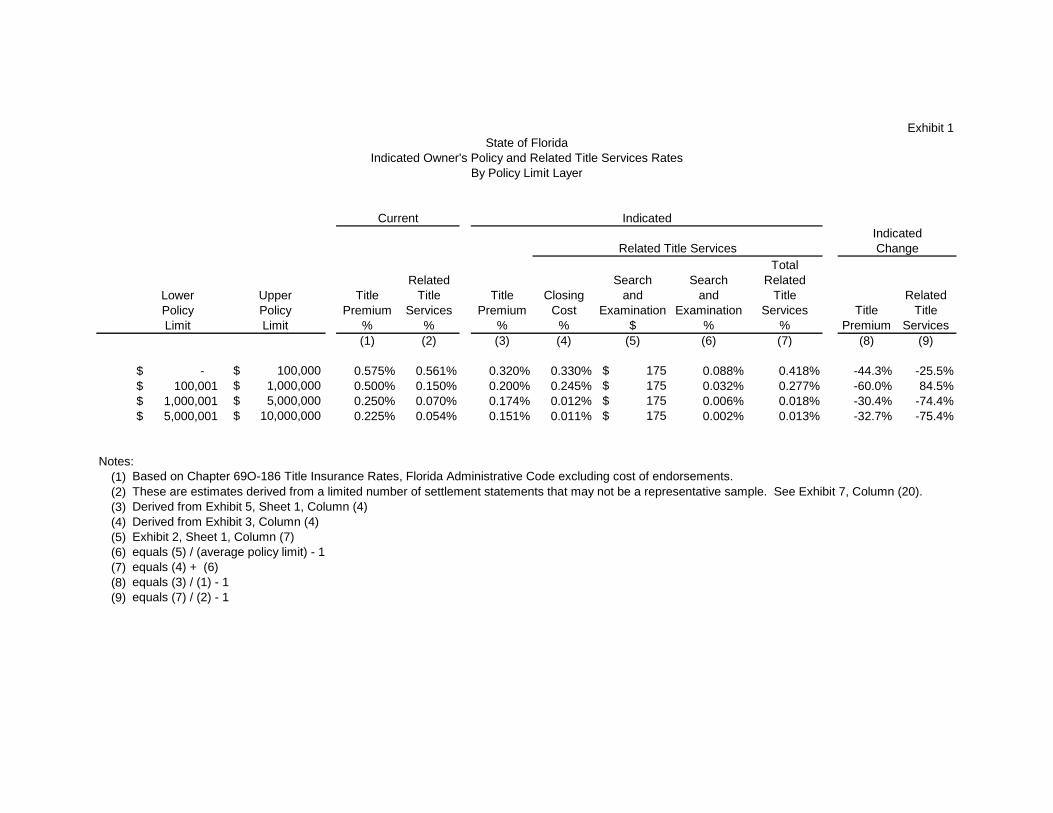
Exhibit 1
LowerPolicyLimit
UpperPolicyLimit
TitlePremium
%
RelatedTitle
Services%
TitlePremium
%
ClosingCost
%
Searchand
Examination$
Searchand
Examination%
TotalRelated
TitleServices
%Title
Premium
RelatedTitle
Services(1) (2) (3) (4) (5) (6) (7) (8) (9)
-$ $ 100,000 0.575% 0.561% 0.320% 0.330% $ 175 0.088% 0.418% -44.3% -25.5%100,001$ $ 1,000,000 0.500% 0.150% 0.200% 0.245% $ 175 0.032% 0.277% -60.0% 84.5%
1,000,001$ $ 5,000,000 0.250% 0.070% 0.174% 0.012% $ 175 0.006% 0.018% -30.4% -74.4%5,000,001$ $ 10,000,000 0.225% 0.054% 0.151% 0.011% $ 175 0.002% 0.013% -32.7% -75.4%
Notes:(1)(2)(3) Derived from Exhibit 5, Sheet 1, Column (4)(4) Derived from Exhibit 3, Column (4)(5) Exhibit 2, Sheet 1, Column (7)(6) equals (5) / (average policy limit) - 1(7) equals (4) + (6)(8) equals (3) / (1) - 1(9) equals (7) / (2) - 1
These are estimates derived from a limited number of settlement statements that may not be a representative sample. See Exhibit 7, Column (20). Based on Chapter 69O-186 Title Insurance Rates, Florida Administrative Code excluding cost of endorsements.
Change
Current Indicated
State of FloridaIndicated Owner's Policy and Related Title Services Rates
By Policy Limit Layer
IndicatedRelated Title Services

Exhibit 2Sheet 1
Owner's Policy Limit
ManualPremium
Estimated Cost of
Endorsements
Premium Including
Endorsements
Related Title
Services Total
Premium Including
EndorsementsSearch &
Examination Closing Subtotal Total Premium
Related Title
Services Total(1) (2) (3) (4) (5) (6) (7) (8) (9) (10) (11) (12) (13)
25,000$ 144$ 17$ 161$ 221$ 382$ 80$ 175$ 83$ 258$ 338$ -50.3% 16.4% -11.7%50,000 288 35 322 365 687 160 175 165 340 500 -50.3% -7.0% -27.3%
100,000 575 69 644 394 1,038 320 175 330 505 825 -50.3% 28.1% -20.5%250,000 1,325 159 1,484 502 1,986 620 175 698 873 1,493 -58.2% 73.9% -24.8%500,000 2,575 309 2,884 709 3,593 1,120 175 1,310 1,485 2,605 -61.2% 109.5% -27.5%750,000 3,825 459 4,284 987 5,271 1,620 175 1,923 2,098 3,718 -62.2% 112.6% -29.5%
1,000,000 5,075 609 5,684 1,309 6,993 2,120 175 2,535 2,710 4,830 -62.7% 107.0% -30.9%5,000,000 15,075 1,809 16,884 2,870 19,754 9,080 175 3,015 3,190 12,270 -46.2% 11.2% -37.9%
10,000,000 27,575 3,309 30,884 5,249 36,133 16,649 175 3,565 3,740 20,389 -46.1% -28.8% -43.6%
426,606$ 1,817$ 218$ 2,035$ 585$ 2,619$ 912$ 175$ 763$ 938$ 1,850$ -49.8% 60.4% -29.4%
Notes:
(1)(2) equals 12.0% x (1), based on Exhibit 7, Column (16) average and actuarial judgment(3)(4)(5)(6)(7)(8)(9)
(10)(11)(12)(13)
equals (6) / (3) - 1equals (9) / (4) - 1
Averages based on 2008 policy limits projected from 2004 limits at an average annual rate of increase of 16.0%.
equals (10) / (5) - 1
Based on Chapter 69O-186 Title Insurance Rates, Florida Administrative Code.
Derived from Exhibit 7, Column (20)equals (3) + (4)
equals (6) + (9)
Based on actuarial judgment and Exhibit 4, Sheet 1, Column (4)Exhibit 3, Column (4)
Indicated ChangesPremiums and Related Title Services
By Owner's Policy Limit
Average
Related Title Services
Indicated RatesCurrent Rates Indicated Change
equals (1) + (2)
Exhibit 5, Sheet 1, Column (4)
equals (7) + (8)

Exhibit 2Sheet 2
Owner's Policy Limit
ManualPremium
Estimated Cost of
Endorsements
Premium Including
Endorsements
Premium Including
EndorsementsSearch &
Examination Closing Subtotal TotalIndicated Change
(1) (2) (3) (4) (5) (6) (7) (8) (9)
25,000$ 144$ 17$ 161$ 80$ 175$ 83$ 258$ 338$ 109.6%50,000 288 35 322 160 175 165 340 500 55.3%
100,000 575 69 644 320 175 330 505 825 28.1%250,000 1,325 159 1,484 620 175 698 873 1,493 0.6%500,000 2,575 309 2,884 1,120 175 1,310 1,485 2,605 -9.7%750,000 3,825 459 4,284 1,620 175 1,923 2,098 3,718 -13.2%
1,000,000 5,075 609 5,684 2,120 175 2,535 2,710 4,830 -15.0%5,000,000 15,075 1,809 16,884 9,080 175 3,015 3,190 12,270 -27.3%
10,000,000 27,575 3,309 30,884 16,649 175 3,565 3,740 20,389 -34.0%
426,606$ 1,817$ 218$ 2,035$ 912$ 175$ 763$ 938$ 1,850$ -9.1%
Notes:
(1)(2) equals 12.0% x (1), based on Exhibit 7, Column (16) and actuarial judgment(3)(4)(5)(6)(7)(8)(9)
Average
equals (1) + (2)
equals (5) + (6)equals (4) + (7)
Exhibit 5, Sheet 1, Column (4)Based on actuarial judgment and Exhibit 4, Sheet 1, Column (4)
Averages based on 2008 policy limits projected from 2004 limits at an average annual rate of increase of 16.0%.
Indicated Percentage ChangesTaxable Premium BaseBy Owner's Policy Limit
Current Rates Indicated Rates
Related Title Services
Based on Chapter 69O-186 Title Insurance Rates, Florida Administrative Code.
Exhibit 3, Column (4)
equals (8) / (3) - 1

Exhibit 2Sheet 3
Owner's Policy Limit Texas Pennsylvania
IndicatedFlorida
(1) (2) (3)
25,000$ 345$ 392$ 338$ 50,000 523 527 500
100,000 875 814 825 250,000 1,745 1,527 1,493 500,000 3,132 2,714 2,605 750,000 4,519 3,615 3,718
1,000,000 5,906 4,517 4,830 5,000,000 24,416 13,204 12,270
Premium ComparisonAll-Inclusive States versus Indicated Florida
By Owner's Policy Limit
10,000,000 44,155 21,850 20,389
426,606$ 2,535$ 1,915$ 1,850$
Notes:
(3) Exhibit 2, Sheet 1, Column (10)
Average
Averages based on 2008 policy limits projected from 2004 limits at an average annual rate of increase of 16.0%.

Exhibit 2Sheet 4
Owner's Policy Limit
ManualPremium
Estimated Cost of
Endorsements
Premium Including
Endorsements
Related Title
Services TotalAgent
Compensation
Premium Including
EndorsementsSearch &
Examination Closing Subtotal TotalAgent
Compensation
Change in Agent
Compensation(1) (2) (3) (4) (5) (6) (7) (8) (9) (10) (11) (12) (13)
25,000$ 144$ 17$ 161$ 221$ 382$ 334$ 80$ 175$ 83$ 258$ 338$ 236$ -29.3%50,000 288 35 322 365 687 591 160 175 165 340 500 350 -40.8%
100,000 575 69 644 394 1,038 845 320 175 330 505 825 578 -31.7%250,000 1,325 159 1,484 502 1,986 1,540 620 175 698 873 1,493 1,045 -32.2%500,000 2,575 309 2,884 709 3,593 2,728 1,120 175 1,310 1,485 2,605 1,824 -33.1%750,000 3,825 459 4,284 987 5,271 3,985 1,620 175 1,923 2,098 3,718 2,602 -34.7%
1,000,000 5,075 609 5,684 1,309 6,993 5,288 2,120 175 2,535 2,710 4,830 3,381 -36.1%5,000,000 15,075 1,809 16,884 2,870 19,754 14,688 9,080 175 3,015 3,190 12,270 8,589 -41.5%
10,000,000 27,575 3,309 30,884 5,249 36,133 26,868 16,649 175 3,565 3,740 20,389 14,272 -46.9%
426,606$ 1,817$ 218$ 2,035$ 585$ 2,619$ 2,009$ 912$ 175$ 763$ 938$ 1,850$ 1,295$ -35.5%
Notes:
(1)(2) equals 12.0% x (1), based on Exhibit 7, Column (20) and actuarial judgment(3)(4)(5)(6)(7)(8)(9)
(10)(11)(12)(13)
Indicated Agent CompensationDefinition of Premium Changed to Include Related Title Service Charges
By Owner's Policy Limit
Current Rates Indicated Rates
Related Title Services
Average
Based on Chapter 69O-186 Title Insurance Rates, Florida Administrative Code.
equals (1) + (2)
Averages based on 2008 policy limits projected from 2004 limits at an average annual rate of increase of 16.0%.
Derived from Exhibit 7, Column (20)equals (3) + (4)
Exhibit 5, Sheet 1, Column (4)Based on actuarial judgment and Exhibit 4, Sheet 1, Column (4)
equals (12) / (6) - 1
equals .70 x (3) + (4)
Exhibit 3, Column (4)equals (8) + (9)equals (7) + (10)equals .70 x (11)

Exhibit 2Sheet 5
Owner's Policy Limit
ManualPremium
Estimated Cost of
Endorsements
Premium Including
Endorsements
Related Title
Services TotalAgent
Compensation
Premium Including
EndorsementsSearch &
Examination Closing Subtotal TotalAgent
Compensation
Change in Agent
Compensation(1) (2) (3) (4) (5) (6) (7) (8) (9) (10) (11) (12) (13)
25,000$ 144$ 17$ 161$ 221$ 382$ 334$ 80$ 175$ 83$ 258$ 338$ 314$ -6.1%50,000 288 35 322 365 687 591 160 175 165 340 500 452 -23.5%
100,000 575 69 644 394 1,038 845 320 175 330 505 825 729 -13.7%250,000 1,325 159 1,484 502 1,986 1,540 620 175 698 873 1,493 1,307 -15.2%500,000 2,575 309 2,884 709 3,593 2,728 1,120 175 1,310 1,485 2,605 2,269 -16.8%750,000 3,825 459 4,284 987 5,271 3,985 1,620 175 1,923 2,098 3,718 3,232 -18.9%
1,000,000 5,075 609 5,684 1,309 6,993 5,288 2,120 175 2,535 2,710 4,830 4,194 -20.7%5,000,000 15,075 1,809 16,884 2,870 19,754 14,688 9,080 175 3,015 3,190 12,270 9,546 -35.0%
10,000,000 27,575 3,309 30,884 5,249 36,133 26,868 16,649 175 3,565 3,740 20,389 15,394 -42.7%
426,606$ 1,817$ 218$ 2,035$ 585$ 2,619$ 2,009$ 912$ 175$ 763$ 938$ 1,850$ 1,576$ -21.5%
Notes:
(1)(2) equals 12.0% x (1), based on Exhibit 7, Column (20) and actuarial judgment(3)(4)(5)(6)(7)(8)(9)
(10)(11)(12)(12)
Indicated Agent CompensationDefinition of Premium Unchanged
By Owner's Policy Limit
Current Rates Indicated Rates
Related Title Services
Average
Based on Chapter 69O-186 Title Insurance Rates, Florida Administrative Code.
equals (1) + (2)
Averages based on 2008 policy limits projected from 2004 limits at an average annual rate of increase of 16.0%.
Derived from Exhibit 7, Column (20)equals (3) + (4)equals .70 x (3) + (4)Exhibit 5, Sheet 1, Column (4)
equals .70 x (7) + (10)equals (12) / (6) - 1
Based on actuarial judgment and Exhibit 4, Sheet 1, Column (4)Exhibit 3, Column (4)equals (8) + (9)equals (7) + (10)
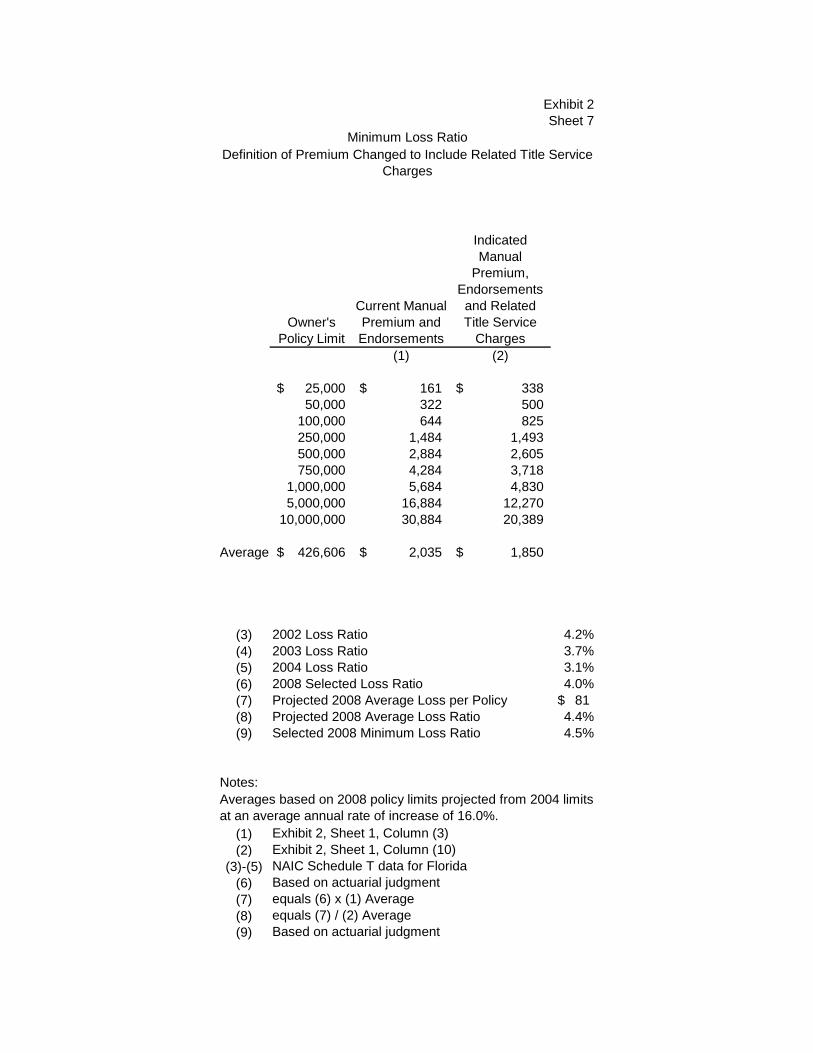
Exhibit 2Sheet 7
Owner's Policy Limit
Current Manual Premium and Endorsements
Indicated Manual
Premium, Endorsements and Related Title Service
Charges(1) (2)
25,000$ 161$ 338$ 50,000 322 500
100,000 644 825 250,000 1,484 1,493 500,000 2,884 2,605 750,000 4,284 3,718
1,000,000 5,684 4,830 5,000,000 16,884 12,270
10,000,000 30,884 20,389
Average 426,606$ 2,035$ 1,850$
(3) 2002 Loss Ratio 4.2%(4) 2003 Loss Ratio 3.7%(5) 2004 Loss Ratio 3.1%(6) 2008 Selected Loss Ratio 4.0%(7) Projected 2008 Average Loss per Policy 81$ (8) Projected 2008 Average Loss Ratio 4.4%(9) Selected 2008 Minimum Loss Ratio 4.5%
Notes:
(1)(2)
(3)-(5)(6)(7)(8)(9)
Minimum Loss RatioDefinition of Premium Changed to Include Related Title Service
Charges
Averages based on 2008 policy limits projected from 2004 limits at an average annual rate of increase of 16.0%.
Exhibit 2, Sheet 1, Column (3)
equals (7) / (2) AverageBased on actuarial judgment
Exhibit 2, Sheet 1, Column (10)NAIC Schedule T data for FloridaBased on actuarial judgmentequals (6) x (1) Average

Exhibit 2Sheet 8
Owner's Policy Limit
Current Manual Premium and Endorsements
Indicated Manual
Premium and Endorsements
(1) (2)
25,000$ 161$ 80$ 50,000 322 160
100,000 644 320 250,000 1,484 620 500,000 2,884 1,120 750,000 4,284 1,620
1,000,000 5,684 2,120 5,000,000 16,884 9,080
10,000,000 30,884 16,649
Average 426,606$ 2,035$ 912$
(3) 2002 Loss Ratio 4.2%(4) 2003 Loss Ratio 3.7%(5) 2004 Loss Ratio 3.1%(6) 2008 Selected Loss Ratio 4.0%(7) Projected 2008 Average Loss per Policy 81$ (8) Projected 2008 Average Loss Ratio 8.9%(9) Selected 2008 Minimum Loss Ratio 9.0%
Notes:
(1)(2)
(3)-(5)(6)(7)(8)(9) Based on actuarial judgment
Averages based on 2008 policy limits projected from 2004 limits at an average annual rate of increase of 16.0%.
Exhibit 2, Sheet 1, Column (6)NAIC Schedule T data for FloridaBased on actuarial judgmentequals (6) x (1) Average
Minimum Loss RatioDefinition of Premium Unchanged
Exhibit 2, Sheet 1, Column (3)
equals (7) / (2) Average
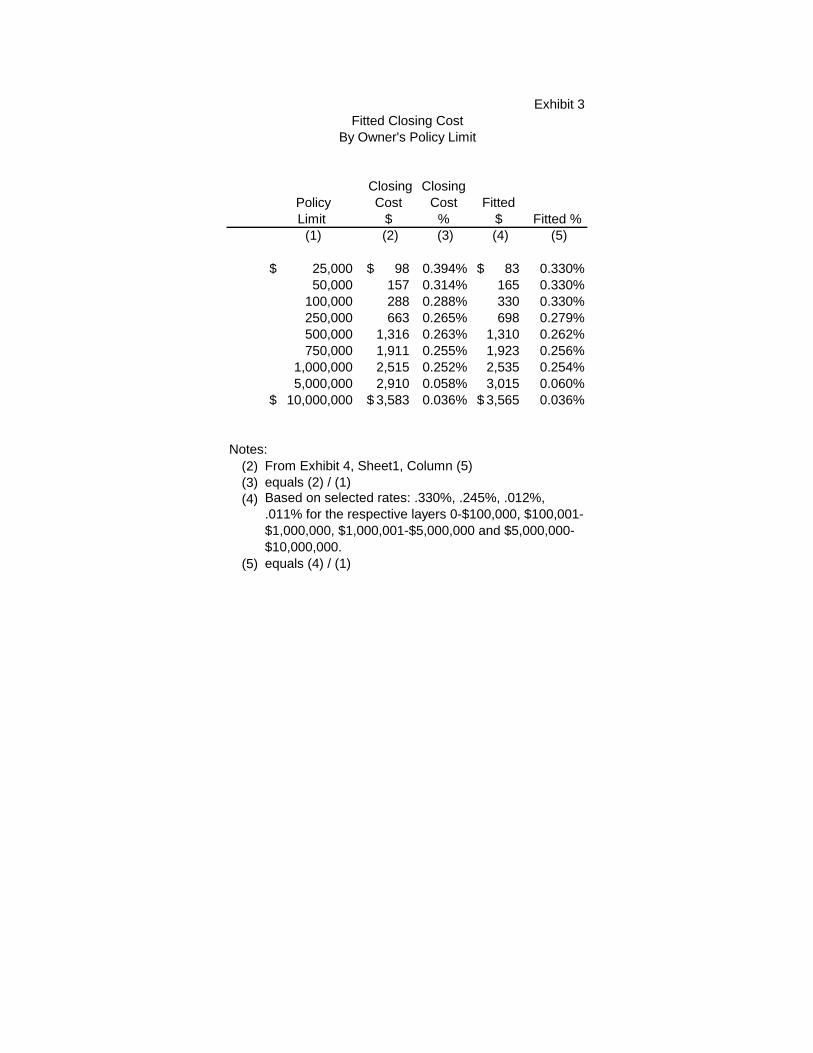
Exhibit 3
PolicyLimit
ClosingCost
$
Closing Cost
%Fitted
$ Fitted % (1) (2) (3) (4) (5)
25,000$ 98$ 0.394% 83$ 0.330%50,000 157 0.314% 165 0.330%
100,000 288 0.288% 330 0.330%250,000 663 0.265% 698 0.279%500,000 1,316 0.263% 1,310 0.262%750,000 1,911 0.255% 1,923 0.256%
1,000,000 2,515 0.252% 2,535 0.254%5,000,000 2,910 0.058% 3,015 0.060%
10,000,000$ 3,583$ 0.036% 3,565$ 0.036%
Notes:(2) From Exhibit 4, Sheet1, Column (5)(3) equals (2) / (1)(4)
(5) equals (4) / (1)
Fitted Closing CostBy Owner's Policy Limit
Based on selected rates: .330%, .245%, .012%, .011% for the respective layers 0-$100,000, $100,001-$1,000,000, $1,000,001-$5,000,000 and $5,000,000-$10,000,000.

Exhibit 4Sheet 1
Policy Limit
Risk, Search, Exam and
Closing StatesRisk, Search and
Exam StatesRisk Only
StatesSearch and
Exam Closing(1) (2) (3) (4) (5)
25,000$ 367$ 268$ 109$ 159$ 98$ 50,000 525 368 191 177 157
100,000 847 559 371 188 288 250,000 1,645 981 784 197 663 500,000 2,939 1,624 1,438 186 1,316 750,000 4,102 2,191 2,017 174 1,911
1,000,000 5,265 2,749 2,593 156 2,515 5,000,000 13,204 10,294 10,755 (461) 2,910
10,000,000$ 21,850$ 18,267$ 19,902$ (1,635)$ 3,583$
Average <$1,000,000 177
Notes:(1)
(2)
(3)
(4)(5)(6)
(7)
(8)(9)
Related Title Services ChargesBased on the Average Rates of 17 Responding Companies
Average 17 responding companys' premiums for 19 states that include risk, search and examination but not closing costs in title premium.Average 17 responding companies premiums for 26 states excluding Florida that include risk but not search, examination or closing costs in title insurance premium.
First American was the only large company operating in all states that was considered to complete the related title services portion of Table 3 correctly, therefore states were classified in (1), (2) and (3) as per First American's completion of related title services portion of Table 3. This assumption appears reasonable, because the indicated related title services charges for all companies is comparable to those indicated for First American - see Exhibit 4, Sheet 2.
Average Title Insurance Premiums
19 companies responded to Data Request, but only 17 completed Table 3.The average premiums for each state are straight averages of 17 responding companies that write business in Florida and may not represent the weighted average based on market shares of companies operating in each state. Companies that may have a significant market share in another state that do not write business in Florida were not requested to respond to this data call.
Related Title Services Charges
Average 17 responding companys' premiums for the states of Texas and Pennsylvania include risk, search, examination and closing costs in title premium, except Pennsylvania premiums for $5,000,000 and $10,000,000 limits.
equals (2) - (3)equals (1) - (2)The states of Utah and Iowa have been excluded from this analysis. Utah was considered to include closing costs in title premium but not search and examination, and therefore is not comparable to other states. The sale of title insurance is prohibited in the state of Iowa.

Exhibit 4Sheet 2
Policy Limit
Risk, Search, Exam and
ClosingRisk, Search
and Exam Risk OnlySearch and
Exam Closing(1) (2) (3) (4) (5)
25,000$ 382$ 301$ 111$ 190$ 80$ 50,000 539 398 189 208 142
100,000 865 605 382 223 260 250,000 1,654 1,041 808 232 613 500,000 2,969 1,688 1,474 214 1,281 750,000 4,128 2,216 2,071 145 1,912
1,000,000 5,287 2,747 2,663 84 2,539 5,000,000 13,484 10,078 11,270 (1,192) 3,406
10,000,000$ 21,984$ 17,770$ 20,708$ (2,938)$ 4,214$
Notes:(1)
(2)
(3)
(4)(5)(6)
(7)
The states of Utah and Iowa have been excluded from this analysis. Utah was considered to include closing costs in title premium but not search and examination, and therefore is not comparable to other states. The sale of title insurance is prohibited in the state of Iowa.
equals (2) - (3)equals (1) - (2)
Average First American premiums for 19 states that include risk, search and examination but not closing costs in title premium.Average First American premiums for 26 states excluding Florida that include risk but not search, examination or closing costs in title insurance premium.
First American was the only large company operating in all states that was considered to complete the related title services portion of Table 3 correctly.
Related Title Services ChargesBased on First American Rates
Average Title Insurance Premiums Related Title Services Charges
Average First American rates for the states of Texas and Pennsylvania include risk, search, examination and closing costs in title premium, except Pennsylvania premiums for $5,000,000 and $10,000,000 limits.

Exhibit 5Sheet 1
Policy Limit Owner'sPremium
Premium%
Fitted$ Fitted %
(1) (2) (3) (4) (5)
25,000$ 87$ 0.347% 80$ 0.320%50,000 163 0.326% 160 0.320%
100,000 310 0.310% 320 0.320%250,000 632 0.253% 620 0.248%500,000 1,158 0.232% 1,120 0.224%750,000 1,623 0.216% 1,620 0.216%
1,000,000 2,090 0.209% 2,120 0.212%5,000,000 9,089 0.182% 9,080 0.182%
10,000,000$ 16,677$ 0.167% 16,649$ 0.166%
Surrounding StatesAverage Title PremiumBy Owner's Policy Limit
Notes:(2) From Exhibit 5, Sheet 2, Column (6)(3) equals (2) / (1)(4)
(5) equals (4) / (1)
Based on selected rates: .320%, .200%, .174%, .151% for the respective layers 0-$100,000, $100,001-$1,000,000, $1,000,001-$5,000,000 and $5,000,000-$10,000,000.
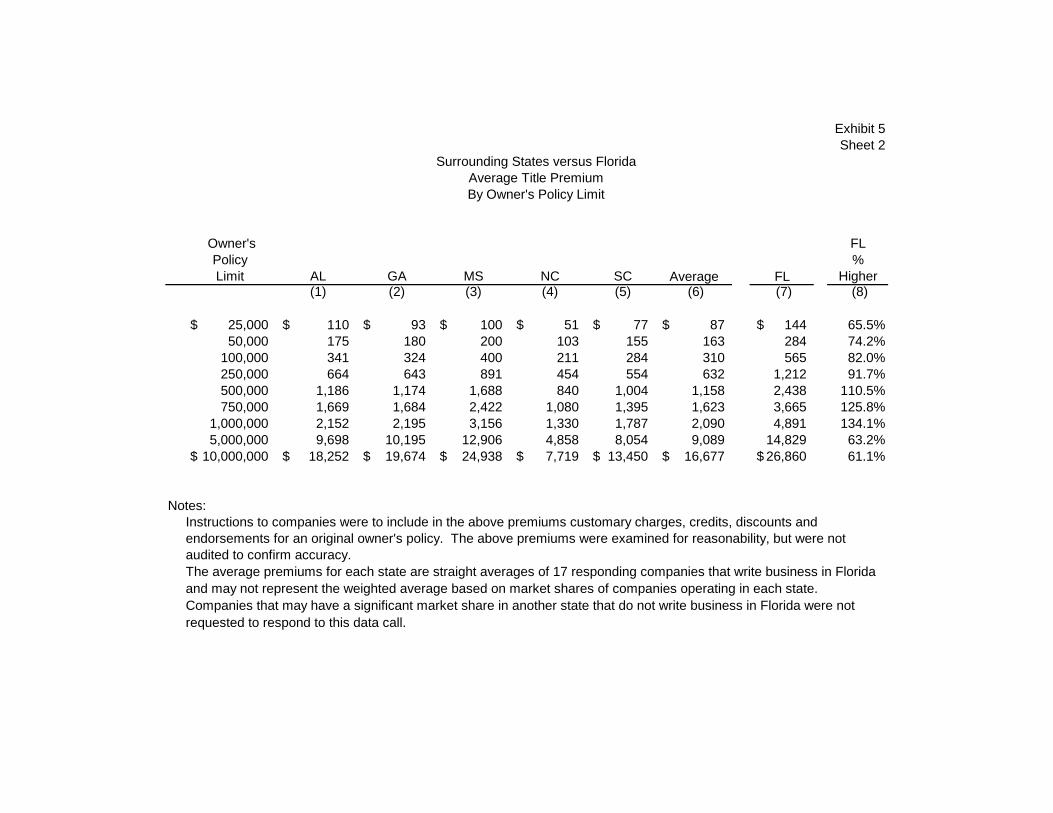
Exhibit 5Sheet 2
Owner'sPolicyLimit AL GA MS NC SC Average FL
FL%
Higher (1) (2) (3) (4) (5) (6) (7) (8)
25,000$ 110$ 93$ 100$ 51$ 77$ 87$ 144$ 65.5%50,000 175 180 200 103 155 163 284 74.2%
100,000 341 324 400 211 284 310 565 82.0%250,000 664 643 891 454 554 632 1,212 91.7%500,000 1,186 1,174 1,688 840 1,004 1,158 2,438 110.5%750,000 1,669 1,684 2,422 1,080 1,395 1,623 3,665 125.8%
1,000,000 2,152 2,195 3,156 1,330 1,787 2,090 4,891 134.1%5,000,000 9,698 10,195 12,906 4,858 8,054 9,089 14,829 63.2%
10,000,000$ 18,252$ 19,674$ 24,938$ 7,719$ 13,450$ 16,677$ 26,860$ 61.1%
Notes:
The average premiums for each state are straight averages of 17 responding companies that write business in Florida and may not represent the weighted average based on market shares of companies operating in each state. Companies that may have a significant market share in another state that do not write business in Florida were not requested to respond to this data call.
Surrounding States versus FloridaAverage Title PremiumBy Owner's Policy Limit
Instructions to companies were to include in the above premiums customary charges, credits, discounts and endorsements for an original owner's policy. The above premiums were examined for reasonability, but were not audited to confirm accuracy.

Exhibit 6
Lower Policy Limit
Upper Policy Limit
AverageLimit
2000 - 2004 Owner's Policies
2000 - 2004 Owner's Written
Premium
2000 - 2004 Owner's Paid
Losses
2000 - 2004 Owner's Case
Incurred Losses
Average Owner's Premium
Average Owner's Rate per $1,000
CaseIncurred
Loss Ratio
Estimated Average Manual
Premium
Discount From
Manual(1) (2) (3) (4) (5) (6) (7) (8) (9) (10) (11) (12)
- 25,000 12,500 786,387 72,063,949 5,181,889 5,688,657 92 7.33 7.9% 100 8.4% 25,001 50,000 37,501 317,644 61,988,115 4,479,893 5,183,494 195 5.20 8.4% 216 9.5% 50,001 75,000 62,501 387,957 120,758,420 6,439,527 7,618,187 311 4.98 6.3% 359 13.4% 75,001 100,000 87,501 457,802 186,465,749 9,550,759 10,901,983 407 4.65 5.8% 503 19.0% 100,001 200,000 150,001 1,392,019 834,276,744 18,071,839 22,344,429 599 4.00 2.7% 825 27.4% 200,001 300,000 250,001 494,731 462,606,586 11,431,911 14,175,426 935 3.74 3.1% 1,325 29.4% 300,001 400,000 350,001 207,617 263,859,573 5,637,685 7,464,350 1,271 3.63 2.8% 1,825 30.4% 400,001 500,000 450,001 99,545 162,914,648 2,608,791 2,793,108 1,637 3.64 1.7% 2,325 29.6% 500,001 600,000 550,001 56,867 113,236,085 3,984,733 4,398,329 1,991 3.62 3.9% 2,825 29.5% 600,001 700,000 650,001 36,636 85,836,721 2,167,170 2,692,843 2,343 3.60 3.1% 3,325 29.5% 700,001 800,000 750,001 29,422 76,200,978 1,126,831 1,724,857 2,590 3.45 2.3% 3,825 32.3% 800,001 900,000 850,001 20,261 57,894,787 1,662,534 2,457,602 2,858 3.36 4.2% 4,325 33.9% 900,001 1,000,000 950,001 15,696 52,269,954 641,167 1,023,699 3,330 3.51 2.0% 4,825 31.0% 1,000,001 2,000,000 1,500,001 62,844 234,827,254 11,267,516 16,754,569 3,737 2.49 7.1% 6,325 40.9% 2,000,001 3,000,000 2,500,001 22,163 108,665,227 2,601,899 2,944,460 4,903 1.96 2.7% 8,825 44.4% 3,000,001 4,000,000 3,500,001 13,540 76,259,610 414,588 404,591 5,632 1.61 0.5% 11,325 50.3% 4,000,001 5,000,000 4,500,001 9,867 60,813,514 471,888 1,020,436 6,163 1.37 1.7% 13,825 55.4% 5,000,001 7,500,000 6,250,001 14,169 109,685,868 5,198,212 3,628,591 7,741 1.24 3.3% 17,888 56.7% 7,500,001 10,000,000 8,750,001 4,862 57,123,060 213,179 314,836 11,749 1.34 0.6% 23,513 50.0% 10,000,001 100,000,000 17,000,000 28,678 577,596,475 2,137,726 2,322,487 20,141 1.18 0.4% 40,325 50.1%
337,627 4,458,707 3,775,343,317 95,289,738 115,856,932 847 3.1%
Notes:(3) equals [(1) + (2)] / 2
(4) - (7) compilation of Table 1 data submitted pursuant to Data Request(8) equals (5) / (4)(9) equals( (8) / (3)) * 1000
(10) equals (7) / (5)(11) based on Chapter 69O-186 Title Insurance Rates, Florida Administrative Code excluding cost of endorsements, minimum manual premium is $100.(12) equals (8) / (11) - 1
Title InsuranceSummary of ExperienceBy Owner's Policy Limit
State of Florida

Exhibit 7
File NumberSettlement
Date
ContractSalesPrice
ClosingFee Search Exam Binder
DocumentPreparation
NotaryFees
AttorneyFees
Shippingand
HandlingWarehouse
Fee
AnythingRegarding
Title Title
Insurance Endorsements
Endorsementto Premium
Ratio
TitleInsuranceIncluding
Endorsements
RelatedTitle
Services Ratio(2) (3) (4) (5) (6) (7) (8) (9) (10) (11) (12) (13) (14) (15) (16) (17) (18) (19)
2/28/2004 7,500 25 100 25 - - - - - - - 100 - 0.0% 100 150 150.0%6/15/2004 17,000 25 100 25 - - - - - - - 100 - 0.0% 100 150 150.0%6/4/2002 20,450 50 100 50 - - - - - 100 - 321 - 0.0% 321 300 93.5%6/4/2002 20,450 50 100 50 - - - - - - - 121 - 0.0% 121 200 165.6%7/18/2005 29,900 76 50 76 - - - - 75 - - 172 - 0.0% 172 277 161.1%7/11/2003 32,000 50 100 50 - - - - - - - 184 25 13.6% 209 200 95.7%
21 9/9/2004 32,000 150 80 90 - - - - 15 35 - 184 - 0.0% 184 370 201.1%05 4/26/2006 38,000 10 60 5 - - - - 20 - - 219 - 0.0% 219 95 43.5%
5/10/2001 50,650 135 100 50 - - - - - - - 293 - 0.0% 293 285 97.2%5/4/2005 55,000 250 150 360 - 275 - - 35 - 150 216 - 0.0% 216 1,220 565.2%6/23/2003 56,000 150 100 50 - - - - 25 - - 522 150 28.7% 672 325 48.4%5/3/2004 78,700 150 100 50 - - - - 25 - - 654 150 22.9% 804 325 40.4%
11/10/2000 88,000 50 100 50 - 195 - - 30 - - 706 145 20.5% 851 425 49.9%8/8/2003 92,000 150 100 50 - - - - 25 - - 729 150 20.6% 879 325 37.0%5/15/2003 94,600 295 350 275 - 295 - - - - 60 569 82 14.4% 651 1,275 195.9%1/24/2003 109,500 200 100 75 - - - - 63 - - 923 162 17.6% 1,085 438 40.4%1/24/2003 115,000 200 100 75 - - - - 63 - - 950 165 17.4% 1,115 438 39.3%6/25/2000 115,000 125 225 125 - 135 - - 74 - - 460 95 20.7% 555 684 123.2%2/19/2003 120,000 175 100 75 - - - - 63 - - 975 168 17.2% 1,143 413 36.1%11/27/2002 125,000 175 100 75 - - - - 98 - - 1,000 170 17.0% 1,170 448 38.3%2/14/2003 129,900 175 100 75 - - - - 63 - - 1,025 172 16.8% 1,197 413 34.5%12/10/2002 140,000 150 100 75 - - - - 33 - - 775 - 0.0% 775 358 46.2%6/6/2005 141,000 100 85 25 - - - - 70 - - 483 106 21.9% 588 280 47.6%
12/26/2002 143,900 175 75 50 - - - - 63 - - 1,095 179 16.4% 1,274 363 28.5%4/27/2005 156,000 300 150 150 - 150 100 - 110 - - 885 153 17.3% 1,038 960 92.5%8/17/2001 157,000 100 100 50 - - - - - - - 860 - 0.0% 860 250 29.1%1/23/2003 157,900 175 100 75 - - - - 63 - - 1,165 182 15.6% 1,346 413 30.7%2/25/2005 160,000 175 75 75 - 125 - - 25 - - 900 140 15.6% 1,040 475 45.7%1/3/2003 171,400 175 100 75 - 25 - - 84 - - 1,232 193 15.7% 1,425 459 32.2%5/6/2005 175,000 250 350 250 - 350 - - - - 230 1,275 153 12.0% 1,428 1,430 100.2%3/31/2005 180,000 60 35 35 - - - - 30 - - 990 125 12.6% 1,115 160 14.3%12/17/2002 184,900 175 100 75 - - - - 84 - - 1,300 235 18.1% 1,534 434 28.3%12/24/2002 188,000 150 100 75 - - - - 33 - - 815 - 0.0% 815 358 43.9%2/17/2003 205,000 150 100 75 - - - - 15 - - 1,100 - 0.0% 1,100 340 30.9%2/12/2003 209,900 175 100 75 - - - - 84 - - 1,425 212 14.9% 1,637 434 26.5%
MA 8/31/2004 218,000 200 200 50 - - - - 85 35 25 1,460 70 4.8% 1,530 595 38.9%9/2/2005 223,000 300 90 90 - - - - 80 25 - 1,540 331 21.5% 1,871 585 31.3%4/26/2005 225,000 125 96 75 - - - - 52 - - 1,200 299 24.9% 1,499 348 23.2%6/24/2005 240,000 150 50 95 - - - - 35 - - 1,275 - 0.0% 1,275 330 25.9%7/21/2005 242,000 250 75 100 - - - - - - - 1,225 150 12.3% 1,375 425 30.9%2/28/2003 248,000 100 - - - - - - 63 - - 300 232 77.2% 532 163 30.7%1/27/2003 291,700 175 100 75 - 50 - - 63 - - 1,833 253 13.8% 2,086 463 22.2%8/12/2005 417,900 500 250 95 195 - - - 110 - - 2,355 311 13.2% 2,666 1,150 43.1%11/29/2002 425,000 200 100 75 - - - - 72 - - 2,525 358 14.2% 2,883 447 15.5%12/15/2004 440,000 500 100 50 - - - - 30 - - 2,300 305 13.3% 2,605 680 26.1%7/15/2005 467,000 300 350 300 - - 300 - 140 - - 2,710 321 11.8% 3,031 1,390 45.9%6/30/2005 520,000 675 - 275 - 475 750 - 75 - - 3,099 343 11.1% 3,442 2,250 65.4%1/31/2003 565,000 150 100 75 - - - - 15 - - 2,900 - 0.0% 2,900 340 11.7%
/Buck 3/23/2005 565,000 350 175 - - - - - - - - 2,975 348 11.7% 3,323 525 15.8%6/29/2004 4,500,000 250 125 250 - - - 3,000 45 - - 19,328 2,010 10.4% 21,338 3,670 17.2%
ount 50 9,201 5,796 4,521 195 2,075 1,150 3,000 2,232 195 465 71,742 8,643 12.0% 80,385 28,830 35.9%11/19/2003 267,685 184 116 90 4 42 23 60 45 4 9 1,435 173 12.0% 1,608 577 35.9%
onsumer Services Complaint Files and Agents and Agencies Closed Investigation Files
State of FloridaTitle Insurance
Sample Settlement Statements
Fitted(1) (20)
01C13909 158.3%05C14823 142.7%04C11544 137.5%04C11544 137.5%
AM0506212 124.0%06C12969 121.2%
0204-1773- 121.2%1040- 113.5%
01C10069 98.9%05117H 94.3%
04C12777 93.3%02C14130 72.8%10C09798 65.8%07C13034 63.0%03-0581A 61.2%
03-280 52.0%03-279a 49.0%00189C 41.0%03-330 40.7%03-236 40.4%03-335 40.1%03-253 39.6%
2062-831942 39.5%03-246 39.3%
2005-0015 38.6%07C10733 38.6%
03-272 38.5%2331.00 38.4%03-273 37.8%
05003101 37.6%05CV031562 37.3%
03-270 37.1%03-271 36.9%03-306 36.0%03-327 35.7%
746041133- 35.3%20043291 35.1%
50449 35.0%20052542 34.2%
05-879 34.1%03-329 33.8%03-300 31.7%03-1015 26.4%03-224 26.1%
2004243 25.6%05-250 24.6%05-0401 23.1%03-298 23.0%
Branson 23.0%03-20117 17.0%
Sum / C 32.4%Average 32.4%
Source: C

Exhibit 8
Group Company Responsed Table 1 Reissue
RelatedTitle
Services Table 3Attorneys' Title Attorneys' Title Insurance Fund, Inc. Yes Yes Yes Yes Yes
Fidelity Chicago Title Insurance Company Yes Yes No No YesFidelity Fidelity National Title Insurance Company Yes Yes No No YesFidelity National Title Insurance Company Yes Yes Yes Yes YesFidelity National Title Insurance Of New York Inc. Yes Yes No No YesFidelity Security Union Title Insurance Company No n/a n/a n/a n/aFidelity Ticor Title Insurance Company Yes Yes No No YesFidelity Ticor Title Insurance Company Of Florida Yes Yes No No Yes
First American Censtar Title Insurance Company Yes Yes Yes Yes YesFirst American First American Title Insurance Company Yes Yes No Yes YesFirst American United General Title Insurance Company No n/a n/a n/a n/aLand America Commonwealth Land Title Insurance Company Yes Yes No No YesLand America Lawyers Title Insurance Corporation Yes Yes No No YesLand America Title Insurance Company Of America Yes No No No YesLand America Transnation Title Insurance Company Yes No No No YesOhio Farmers Southern Title Insurance Corporation No n/a n/a n/a n/aOld Republic American Guaranty Title Insurance Company Yes No No No NoOld Republic Old Republic National Title Insurance Company Yes Yes No No Yes
Stewart Alliance Title Of America, Inc. No n/a n/a n/a n/aStewart Stewart Title Guaranty Company No n/a n/a n/a n/a
n/a Atlantic Title Insurance Company Of South Carolina Yes No No No Non/a Commerce Title Insurance Company Yes Yes Yes Yes Yesn/a Investors Title Insurance Company No n/a n/a n/a n/an/a North American Title Insurance Corporation Yes Yes No No Yesn/a Westcor Land Title Insurance Company Yes Yes Yes No Yes
Totals:Yes 19 15 5 5 1No 6 4 14 14n/a 0 6 6 6 6
25 25 25 25 25
Notes:A "No" indicates that the data was not provided, inconsistent or unreliable.
Table 2
Data RequestSubmission Compliance
72