an analysis of energy-efficient voice over ip...
TRANSCRIPT

AN ANALYSIS OF ENERGY-EFFICIENT VOICE OVER IP
COMMUNICATION IN WIRELESS NETWORKS
by
JOHN KOTWICKI
Submitted in partial fulfillment of the requirements
for the degree of Master of Science
Thesis Advisers: Dr. Frank Merat and Dr. Vincenzo Liberatore
Department of Electrical Engineering and Computer Science
CASE WESTERN RESERVE UNIVERSITY
March, 2004

Contents
1 Introduction 1
1.1 Motivation . . . . . . . . . . . . . . . . . . . . . . . . . . . . . . . . . 2
1.2 Organization of Thesis . . . . . . . . . . . . . . . . . . . . . . . . . . 2
2 Background 4
2.1 Wireless Networks . . . . . . . . . . . . . . . . . . . . . . . . . . . . 4
2.2 Wireless Networks and the OSI Model . . . . . . . . . . . . . . . . . 5
2.3 Power Conservation in the Protocol Stack . . . . . . . . . . . . . . . 6
2.3.1 Physical Layer . . . . . . . . . . . . . . . . . . . . . . . . . . . 7
2.3.2 Datalink Layer . . . . . . . . . . . . . . . . . . . . . . . . . . 7
2.3.3 Network Layer . . . . . . . . . . . . . . . . . . . . . . . . . . 9
2.3.4 Transport Layer . . . . . . . . . . . . . . . . . . . . . . . . . . 10
2.3.5 Application Layer . . . . . . . . . . . . . . . . . . . . . . . . . 11
2.4 Interlayer Interaction . . . . . . . . . . . . . . . . . . . . . . . . . . . 13
2.5 Middleware in Wireless Networks . . . . . . . . . . . . . . . . . . . . 14
2.6 Voice over IP . . . . . . . . . . . . . . . . . . . . . . . . . . . . . . . 15
2.6.1 Encoding Voice . . . . . . . . . . . . . . . . . . . . . . . . . . 15
i

2.6.2 Setting up and Maintaining Calls . . . . . . . . . . . . . . . . 16
2.7 VoIP and Energy Efficiency . . . . . . . . . . . . . . . . . . . . . . . 17
3 Problem Statement 18
3.1 Analysis Goals . . . . . . . . . . . . . . . . . . . . . . . . . . . . . . 18
3.1.1 Comparison MOS Ratings . . . . . . . . . . . . . . . . . . . . 19
3.2 Application Layer Knowledge . . . . . . . . . . . . . . . . . . . . . . 20
3.2.1 Other Forms of Application Layer Knowledge . . . . . . . . . 21
3.2.2 Prediction Problem . . . . . . . . . . . . . . . . . . . . . . . . 22
3.3 QoS Metrics . . . . . . . . . . . . . . . . . . . . . . . . . . . . . . . . 23
3.3.1 Latency . . . . . . . . . . . . . . . . . . . . . . . . . . . . . . 23
3.3.2 Jitter . . . . . . . . . . . . . . . . . . . . . . . . . . . . . . . . 24
3.3.3 Packet Loss . . . . . . . . . . . . . . . . . . . . . . . . . . . . 24
3.3.4 Echo . . . . . . . . . . . . . . . . . . . . . . . . . . . . . . . . 25
3.3.5 Digitization Distortion . . . . . . . . . . . . . . . . . . . . . . 25
3.3.6 Packet Size & Header Weight . . . . . . . . . . . . . . . . . . 26
3.4 Analysis of QoS . . . . . . . . . . . . . . . . . . . . . . . . . . . . . . 26
3.5 Bandwidth Reduction vs. Energy Savings . . . . . . . . . . . . . . . 27
4 Analysis Models 28
4.1 Modeling WNIC Energy Usage . . . . . . . . . . . . . . . . . . . . . 28
4.1.1 Finite State Machine Model . . . . . . . . . . . . . . . . . . . 31
4.1.2 State Transitions . . . . . . . . . . . . . . . . . . . . . . . . . 31
4.1.3 Energy Balance . . . . . . . . . . . . . . . . . . . . . . . . . . 35
ii

4.1.4 Deriving Energy Usage from Network Traffic . . . . . . . . . . 35
4.2 Modeling Predicted User Satisfaction . . . . . . . . . . . . . . . . . . 36
4.2.1 Simultaneous Impairments . . . . . . . . . . . . . . . . . . . . 37
4.2.2 Delay Impairments . . . . . . . . . . . . . . . . . . . . . . . . 37
4.2.3 Equipment Impairment . . . . . . . . . . . . . . . . . . . . . . 39
4.3 E-model & MOS Correlation . . . . . . . . . . . . . . . . . . . . . . . 39
4.4 Instantaneous vs. Overall MOS Rating . . . . . . . . . . . . . . . . . 41
5 Implementation 42
5.1 VoIP Application Architecture . . . . . . . . . . . . . . . . . . . . . . 42
5.1.1 Audio Source . . . . . . . . . . . . . . . . . . . . . . . . . . . 43
5.1.2 VoIP Traffic . . . . . . . . . . . . . . . . . . . . . . . . . . . . 44
5.1.3 Packet Headers . . . . . . . . . . . . . . . . . . . . . . . . . . 44
5.1.4 Measuring Network Statistics . . . . . . . . . . . . . . . . . . 45
5.2 Energy-Saving Algorithm . . . . . . . . . . . . . . . . . . . . . . . . . 46
5.3 Sending Application . . . . . . . . . . . . . . . . . . . . . . . . . . . 46
5.3.1 Energy-Saving Host . . . . . . . . . . . . . . . . . . . . . . . . 46
5.3.2 Always On Host . . . . . . . . . . . . . . . . . . . . . . . . . . 47
5.4 Receiving Application . . . . . . . . . . . . . . . . . . . . . . . . . . 50
5.5 Analysis Assumptions . . . . . . . . . . . . . . . . . . . . . . . . . . 50
5.6 Initial Application Output . . . . . . . . . . . . . . . . . . . . . . . . 51
5.7 Energy-Saving Output . . . . . . . . . . . . . . . . . . . . . . . . . . 51
5.7.1 Discussion of Delay . . . . . . . . . . . . . . . . . . . . . . . . 52
iii

5.7.2 Discussion of MOS Rating . . . . . . . . . . . . . . . . . . . . 54
5.7.3 Discussion of Energy Savings . . . . . . . . . . . . . . . . . . 58
5.8 Contributing Factors . . . . . . . . . . . . . . . . . . . . . . . . . . . 58
5.8.1 Sleep-To-Idle Period . . . . . . . . . . . . . . . . . . . . . . . 58
5.8.2 802.11 Retry Limit . . . . . . . . . . . . . . . . . . . . . . . . 58
5.9 Extending Results in Simulation . . . . . . . . . . . . . . . . . . . . . 61
5.9.1 Energy Modeling . . . . . . . . . . . . . . . . . . . . . . . . . 61
5.9.2 Delay Modeling . . . . . . . . . . . . . . . . . . . . . . . . . . 61
5.9.3 Loss Modeling . . . . . . . . . . . . . . . . . . . . . . . . . . . 62
6 Results 63
6.1 Simulation Setup . . . . . . . . . . . . . . . . . . . . . . . . . . . . . 63
6.2 Sleep-to-Idle Transition of 100 ms . . . . . . . . . . . . . . . . . . . . 64
6.3 Sleep-to-Idle Transition of 50 ms . . . . . . . . . . . . . . . . . . . . . 65
6.4 Interpretation of MOS Rating . . . . . . . . . . . . . . . . . . . . . . 67
7 Conclusions 69
7.1 Optimal Energy Saving and MOS Ratings . . . . . . . . . . . . . . . 69
7.2 Future Work . . . . . . . . . . . . . . . . . . . . . . . . . . . . . . . . 70
7.2.1 Effects of Two-Sided Deployment . . . . . . . . . . . . . . . . 70
7.2.2 Effect of Multiple Users . . . . . . . . . . . . . . . . . . . . . 71
7.2.3 Providing QoS at the MAC Layer . . . . . . . . . . . . . . . . 71
iv

List of Tables
3.1 MOS Rating Scale . . . . . . . . . . . . . . . . . . . . . . . . . . . . 20
3.2 R-Values, MOS Rankings, and User Satisfaction [1] . . . . . . . . . . 20
4.1 Average Power Consumption for Different Operating Modes . . . . . 31
4.2 Energy & Time Required for State Transitions . . . . . . . . . . . . . 32
v

List of Figures
2.1 OSI Model . . . . . . . . . . . . . . . . . . . . . . . . . . . . . . . . . 6
2.2 VoIP Process . . . . . . . . . . . . . . . . . . . . . . . . . . . . . . . 16
3.1 Playback Scheme to Smooth Variable Network Delay . . . . . . . . . 25
4.1 PCI Extender Card Modified for Measuring Power . . . . . . . . . . . 30
4.2 Finite State Machine Model . . . . . . . . . . . . . . . . . . . . . . . 32
4.3 Sleep to Idle Transition . . . . . . . . . . . . . . . . . . . . . . . . . . 33
4.4 Idle to Sleep Transition . . . . . . . . . . . . . . . . . . . . . . . . . . 34
4.5 Effect of Absolute Delay on E-model Rating . . . . . . . . . . . . . . 38
4.6 Effect of Packet Loss on E-model Rating . . . . . . . . . . . . . . . . 40
5.1 VoIP Application Architecture . . . . . . . . . . . . . . . . . . . . . . 43
5.2 Sequence for Emptying the Queue when WNIC Transitions to On . . 48
5.3 Delay for Receiver with Always On WNIC . . . . . . . . . . . . . . . 53
5.4 Delay for Receiver with Energy-Saving WNIC . . . . . . . . . . . . . 55
5.5 MOS Ratings for Receiver with Always On WNIC . . . . . . . . . . . 56
5.6 MOS Ratings for Receiver with Energy-Saving WNIC . . . . . . . . . 57
vi

5.7 Effect of Retry Limit on Percentage Packet Loss . . . . . . . . . . . . 60
6.1 MOS for Sleep-to-Idle Transition of 100 ms (200 ms On Time) . . . . 64
6.2 Energy Savings for Sleep-to-Idle Transition of 100 ms (200 ms On Time) 65
6.3 MOS for Sleep-to-Idle Transition of 50 ms and (150 ms On Time) . . 66
6.4 Energy Savings for Sleep-to-Idle Transition of 50 ms (150 ms On Time) 67
vii

List of Algorithms
1 Energy Saving Algorithm on Sending Application . . . . . . . . . . . 49
2 Receiving Application Algorithm . . . . . . . . . . . . . . . . . . . . 50
viii

Acknowledgments
First and foremost I would like to thank my advisers, Dr. Frank Merat and Dr. Vin-
cenzo Liberatore, for their guidance and support throughout the entire thesis. I would
also like to thank Robert Leskovec of the EECS Department at Case Western Reserve
University for his help and advice in the construction of testing equipment for this
thesis. Finally, I would like to thank Kyle Jamieson and Anita Markopoulou for their
advice.
ix

List of Abbreviations
CBR Constant Bit Rate
CSMA/CA Carrier Sense Mutliple Access / Collision Avoidance
CTS Clear To Send
FEC Frame Erasure Concealment
FSM Finite State Machine
ICMP Internet Control Message Protocol
ITU International Telecommunication Union
MAC Media Access Control
MOS Mean Opinion Score
NTP Network Time Protocol
PCI Peripheral Component Interconnect
PCM Pulse Code Modulation
PLC Packet Loss Concealment
x

PSTN Public Switched Telephone Network
QoS Quality of Service
RTP Real-Time Protocol
RTS Request To Send
SIP Session Initiantion Protocol
UDP User Datagram Protocol
VAD Voice Activity Detection
VoIP Voice over Internet Protocol
WLAN Wireless Local Area Network
WNIC Wireless Network Interface Card
xi

An Analysis of Energy-Efficient Voice over IP Communication
in Wireless Networks
Abstract
by
JOHN KOTWICKI
Mobile wireless devices that place a heavy demand on their wireless interface cards
are notorious for quickly depleting energy supplies. Software strategies for minimizing
the amount of time network interfaces remain active help reduce energy waste, how-
ever, introduce a tradeoff, usually in the form of increased latency or loss in network
traffic. Real-time, interactive network applications, such as Voice over IP (VoIP),
are particularly sensitive to an increase in these parameters, and therefore require
special consideration. This work uses two models to illustrate the balance between
energy savings and predicted user satisfaction with a VoIP implementation developed
for analysis. After examining the specific implementation, this work extends these
results in simulation to enumerate the possibilities that might exist in a production-
quality system. The results of these simulations demonstrate VoIP applications in
wireless networks exhibit acceptable quality while achieving significant energy savings
from software techniques that control the network interface.

Chapter 1
Introduction
Wireless devices, from personal digital assistants to laptops, now exist as a significant
portion of the computing appliances available to consumers. Users of these devices
constantly endure quickly depleting energy supplies, mostly from peripherals like
wireless interfaces. Prolonged use of network applications popular on desktop systems
lead to the need for more frequent battery changing or recharging. Recent research
aims to more more effectively manage the energy supply of mobile devices running
network-intensive applications. One network application with potential growth for
wireless devices is Voice over IP (VoIP), a collection of technologies that deliver
the equivalent of a telephone call over a packet-switched network. Assuring Quality
of Service (QoS) in VoIP calls, while reducing the power consumption of wireless
interfaces, presents new challenges for designers of wireless network applications and
protocols. Energy-saving strategies that do not adversely affect the needs of real-time
applications like VoIP are new ground for wireless research.
1

1.1 Motivation
For the optimization of a protocol to have any effect on the overall energy savings of
the system, the component using the protocol must demand a significant portion of
the total energy available to the device. Recent research shows that wireless network
interface cards (WNICs) may comprise anywhere from 10% to 50% of the system’s
total power consumption, depending on the type of device [2]. Limiting the use of
the network interface requires a tradeoff, however, usually in the form of increased
latency or diminished throughput. These effects negatively impact many network
applications, especially those that have real-time traffic such as interactive audio.
Despite these concerns much commercial interest exists for implementing voice
services in wireless networks. Cisco Systems has even released a Wireless IP Phone
for IEEE 802.11 networks, though the device only allows 3-4 hours of talk time before
needing to be recharged [3]. Optimizing power consumption of wireless devices while
still providing quality service is therefore a problem deserving of investigation.
1.2 Organization of Thesis
This thesis first introduces a survey of research focusing on the minimization of power
consumption by devices in wireless networks. Several contributions illustrate success-
ful, software-based strategies that control the state of wireless network interfaces.
Following this background is a more formal statement framing the problem of re-
ducing power consumption specific to the needs of a VoIP application. This work also
explores an appropriate measure for determining the effect of energy-saving techniques
2

on this application and its traffic. Since the overall opinion of the users of a system
is the ultimate test of quality, this work advocates a user-perceived QoS metric.
Models for capturing the total energy usage and predicted user satisfaction are
both part of this work. Measurements from a specific wireless network interface card
result in a precise energy model. The user perceived QoS model comes from published
listening quality studies and work that correlates various transmission conditions with
the outcome of those studies.
To validate the models and obtain an insight into the factors that affect the user
perceived QoS and energy savings this work uses a custom-built VoIP application
in a wireless network. From the implementation this work extends the models in
simulation to arrive at results that reflect the hardware available for mobile wireless
devices.
Through simulation this work demonstrates that substantial energy savings (up
to 26%) are possible with acceptable user satisfaction. Furthermore, the results show
a QoS metric assessing perceived quality, rather than direct comparison of network
metrics, provide the best means for analyzing the effects of an energy-saving strategy.
3

Chapter 2
Background
Wireless networks and VoIP technology individually have been receiving much atten-
tion from researchers due to their recent explosion in popularity. Numerous proposals
for new hardware strategies and protocol designs attempt to better manage energy
resources and improve reliability in wireless networks. VoIP research focuses mainly
on providing Quality of Service, and greatly benefits from an efficient and reliable
wireless medium.
2.1 Wireless Networks
Offering the freedom of mobility and the option of connecting to the existing wired
infrastructure, a Wireless Local Area Network (WLAN) provides a means for ex-
changing information among portable computers [4]. Currently most wireless devices
communicate via an access point or base station, which acts as a central coordina-
tor for all traffic in the network providing an infrastructured network topology [5].
4

Alternatively, these devices may cooperatively form and maintain a wireless ad hoc
network without the the use of an access point [6]. In ad hoc networks nodes within
radio range of each other communicate via a peer-to-peer communication scheme [4],
or employ multi-hop communication in which two devices not in direct contact relay
traffic through intermediate neighbors [7].
As the primary energy resource of portable wireless networking members, the
small-capacity batteries most commonly available require extreme sensitivity to power
consumption from the system components. The power overhead in providing wireless
connectivity is one of the most compelling reasons behind investigating new methods
for reducing the energy exhaustion of the batteries by network interfaces [2].
2.2 Wireless Networks and the OSI Model
Existing as an international standard, the Open Systems Interconnection (OSI) refer-
ence model (Figure 2.1) aids researchers working in the field of computer networking.
The model consists of seven layers, five of which commonly appear in most network
stacks for systems on the Internet, and outlines the functionality that must be present
at each layer to provide effective communication between two applications [8]. Wire-
less devices use the model for their network stacks as well, however, they must replace
many of the protocols that exist in the traditional wired systems with new designs
that reflect the phenomena present in wireless networks, and in particular, pay more
attention to power consumption.
5

Application
Presentation
Session
Transport
Network
Datalink
Physical
Figure 2.1: OSI Model
2.3 Power Conservation in the Protocol Stack
Typically researchers focus on two different approaches to energy savings for com-
munications. Dynamically adjusting the transmission power of a radio and inserting
power management logic into network protocols embody all attempts at energy man-
agement so far [5]. The newest work in the field appears to favor the latter software
approach, mostly because of its applicability to a wider range of devices.
Dividing the total power consumption into the amount of energy required at each
layer in the OSI model provides an effective means for evaluating the overall energy
usage and identifying areas where there is room for improvement. Previous research
suggests that communication generates most of its energy waste by retransmitting
packets after a collision on the communications medium, overhearing traffic intended
6

for another node, handling protocol control packets, and listening for packets when
there is no traffic on the network (“idle listening”) [9]. Reducing these four actions
at any layer may result in considerable overall energy savings.
2.3.1 Physical Layer
Designers of wireless equipment must choose between technology that extends the
range of communication and conserves system energy. The IEEE 802.11 protocol spec-
ifies encoding methods for transmitting bits over a wireless medium, and few changes
to this scheme exist outside of hardware. One significant contribution, though, is ad-
justable transmitter power. By tuning the power on its transmitter a network node
can control the range of its broadcast, reducing power when neighbors are nearby and
increasing power when they are farther away [5]. This technique, although simple, po-
tentially allows for several concurrent transmissions to occur, increasing throughput
as well as power savings [5]. Researchers also recommend taking the physical layer
into deep consideration when designing higher level protocols instead of treating it as
a “blackbox” [10], the separation of layers philosophy fundamental to the OSI model.
2.3.2 Datalink Layer
Because significant energy waste occurs as a result of network nodes sharing a broad-
cast medium there is interest in new Media Access Control (MAC) protocols. Re-
search aims to ameliorate the effects of mobility, and dynamic topologies in ad hoc
networks, while achieving reasonable power consumption. The IEEE 802.11b proto-
col, operating at 11 Mbps in the 2.4 GHz unlicensed ISM band, is probably the most
7

prevalent of all protocols available at the present time for WLAN communication
[5]. New proposals for datalink layer protocols introduce features for eliminating the
practices that waste the most energy.
The Multiple Access with Collision Avoidance (MACA) protocol is one of the first
attempts at wireless medium access. It introduces a three-way handshake in which
the sending node announces its intention to send by broadcasting a request-to-send
(RTS) frame, the receiving node replies with a clear-to-send (CTS) frame, and the
original sender begins transmitting if the previous transmissions are successful [4].
IEEE 802.11 modifies the scheme, more formally known as Collision Sense Multiple
Access/Collision Avoidance (CSMA/CA), introducing an acknowledgment at the end
of the sequence [6]. While providing a certain degree of reliability to an unreliable
physical layer, these types of scheduling do not work well from an energy standpoint
because all neighboring nodes consume power to receive the broadcasts when normally
a single node is the only intended recipient [11].
One of the first MAC layer protocols to consider energy resources, the Power
Aware Multi-Access with Signaling (PAMAS) protocol introduces a separate signaling
channel so that nodes may power off the main data channel when it is not in use but
still hear network broadcasts from other nodes in the network using a lower-energy
signaling channel [11]. The authors of PAMAS suggest turning off an interface if a
node senses a neighbor’s transmission and has no data waiting to be sent or, if it has
data to send, turning off an interface if it knows that one neighbor is transmitting
and another is receiving. While effective it is not practical for most wireless networks
to have another radio, especially since most manufacturers of wireless devices already
8

use the established IEEE 802.11 protocol.
2.3.3 Network Layer
Multi-hop communication, in which all nodes act as routers to forward traffic among
neighbors, is an essential component in ad hoc networks, but is not much of a concern
in an infrastructure-based network. Of the many proposed protocols Dynamic Source
Routing (DSR) and Ad Hoc On-Demand Distance Vector (AODV) are two examples
recently published as Experimental RFCs supported by the Internet Engineering Task
Force (IETF) MANET working group [12]. Also in the growing list of multi-hop
protocols are Destination Sequenced Distance Vector (DSDV), Zone Routing Protocol
(ZRP), and Associativity Based Routing (ABR), among others [4]. Originally aiming
to solve the problems of multi-hop routing and mobility in ad hoc networks, developers
evaluated protocols with traditional metrics such as shortest number of hops and
smallest delay, however, the metric of minimal power consumption is appearing more
frequently [6, 7, 13, 14].
Newer research recognizes the importance the energy metric. Furthermore the idea
of “network survivability,” in which it is more critical to maintain connectivity over
increasing the lifetime of an individual node [15], provides a new energy-constrained
goal. Achieving a balance among nodes that route most of the traffic in a network is
essential for maximizing the lifetime of a network [14]. Most popular ad hoc network
layer protocols do not include this feature and may suffer the consequences of network
partitioning or limited lifetimes that are a direct result from overuse of a particular
node [15].
9

Various strategies for conserving energy meet with different levels of success de-
pending on the application involved. Multi-hop communication itself potentially re-
duces power consumption by increasing the number of smaller-distance paths that a
signal must traverse [7]. Signal propagation models demonstrate that transmission
power is directly related to the square of the distance for short paths, so it is highly
desirable to reduce this parameter. As an illustration, consider doubling the distance
between two nodes. This increase would require four times the transmission power,
whereas only twice as much power if another node, centered between the sender and
receiver, relayed the traffic (neglecting the receiving and processing power at this
intermediate node).
Most of the wireless routing protocols proposed are only theoretical models, tested
through simulation but not in actual implementation. Research concerning the de-
tail of network simulation suggests that often forgotten-about attributes, such as the
power consumed by an idle WNIC, actually contribute substantially to the overall
energy profile of a protocol [13]. With the inclusion of these parameters the difference
between any two network layer protocols is nearly negligible from an energy perspec-
tive [13]. While the functionality of the new network layer protocols is necessary for
forming and sustaining ad hoc networks, other layers in the network stack abstraction
should assume the responsibility for managing the details of power conservation.
2.3.4 Transport Layer
Although reliable end-to-end transport is desirable, it is difficult to optimize for power
consumption in a wireless network. Phenomena such as interference and mobility,
10

affect the RTT estimates that are integral to the traditional Transmission Control
Protocol (TCP) [4]. Even though a node in a wireless network sends an acknowl-
edgment, the network might lose this segment through a noisy wireless channel or
a changing topology, but not necessarily because of congestion as the TCP protocol
incorrectly assumes [16]. The diminished throughput caused by congestion control
requires radios to remain active longer and to retransmit segments already received
by the recipient, two sources of heavy energy waste.
Conserving energy by recognizing the presence of the different wireless phenomena
is a key contribution to transport protocols for ad hoc networks. Modifications to
TCP include TCP Feedback (TCP-F), where nodes sensing a link failure are able to
signal the sender so that it may freeze communications until the network remedies
the problem [4]. Other techniques abandon the traditional TCP protocol and use
application-specific protocols, as is the case with Pump Slowly, Fetch Quickly (PSFQ),
a protocol that incorporates a hop-by-hop recovery scheme to more reliably transport
data [17]. Careful consideration of underlying protocols as well as the data passed
from applications contribute to a practical transport layer protocol.
2.3.5 Application Layer
As the highest level in the OSI model the application layer controls the interfaces
of common Internet services. Lorch and Smith classify energy management at this
layer into three categories: “transition,” “load-change,” and “adaptation [18].” A
transition strategy involves identifying when a particular device may change states to
conserve energy, a load change strategy uncovers functionality adaptations that en-
11

courage longer low power intervals, and an adaptation strategy modifies the software
to take advantage of the power saving capabilities of the hardware [18]. Considering
that the application possesses the most information about the traffic present in a
network, it is the best candidate for the injection of energy-conserving algorithms
that will yield the most benefit.
While much research advocates the use of application layer knowledge in energy
conservation [18, 19, 20, 21, 22], few actual examples of implementations exist. One
proposal that targets a specific application involves the analysis of traffic generated
by various multimedia formats. The authors of this work attempt to shape the traf-
fic in a way that is conducive to accurate prediction so that a wireless interface
may power off during periods of inactivity [22]. This idea follows the “load-change”
strategy previously outlined. Additionally, two application layer protocols, the Basic
Energy-Conserving Algorithm (BECA) and the Adaptive Fidelity Energy-Conserving
Algorithm (AFECA), best exemplify an “adaptation” strategy [19]. The first of these
protocols uses knowledge from the application layer to turn radios off, while the sec-
ond combines this concept with information on the density of the network in order
to fine tune the sleep cycle [19]. A “transition” strategy involves analyzing the traffic
generated by these applications and controlling the radio communication accordingly.
Even though the nascent application layer protocols introduce novel energy sav-
ings, using application level knowledge is not an entirely new concept and derives
some support from the classic “End-to-End Argument” [18]. The end-to-end ar-
gument warns against building too much functionality into the lower layers of the
network stack since it is likely that the components of a network will not have all
12

properties in common. [23]. Simply moving all responsibility to the application layer
is not the complete solution, though, because of the penalties that result from inter-
actions between layers.
2.4 Interlayer Interaction
Most challenging in the design of a power-aware protocol for a wireless network is
the interaction that occurs between protocols at different layers. For instance, at the
application layer, simply turning a node’s radio off when it is not an end point in
any communication might be detrimental to the operation of the network layer for
nodes that also function as routers [24]. Furthermore, when a radio is turned off a
node misses all transmissions, including MAC layer broadcasts, network layer routing
updates, and application layer messages [19]. This inefficiency, commonly resolved by
a “prediction strategy,” posses a problem involving a tradeoff between energy savings
and latency in a network [18].
In addition to the effects of decisions made at the application layer, other layers
have unproductive interactions as well. The TCP congestion control algorithm con-
fuses packet loss due to errors caused by wireless transmission phenomena with packet
loss due to network congestion [4]. Providing some reliable transmission mechanisms
at the link layer helps to overcome this particular problem [25]. These examples pro-
vide a lesson in ensuring that the protocols chosen for each layer in a network work
in concert to provide efficient communication, both in latency and energy.
13

2.5 Middleware in Wireless Networks
One of the primary roles of middleware in a distributed system is to hide the het-
erogeneity present in the network [8], and this is no exception for wireless networks,
which typically contain nodes of varying processing abilities and energy capacities [26].
Usually existing between the operating system and the applications, middleware al-
lows nodes of different configurations to communicate freely [27]. Because wireless
networks introduce reasons to carefully consider the strict independent layers of the
OSI model [7], middleware presents the opportunity to patch the discrepancies intro-
duced by a wireless medium and the interactions that occur between protocols. This
functionality allows for some energy savings without rewriting or modifying existing
protocols.
Although research has not given much attention to using middleware directly for
energy management, it has addressed several related issues. Identified as a key consid-
eration in wireless middleware design, localized algorithms that exchange information
in small neighborhoods aid in scalability [21], reducing the overhead, and therefore
the energy expenditure of the individual nodes. Moreover, application knowledge
shared with the middleware allows for data aggregation and caching [21] preventing
redundant transmissions that unnecessarily consume power. Such techniques might
be useful for nodes that experience temporary losses in connectivity caused by power-
conserving algorithms [16].
The Span protocol, though not really middleware, attacks the same goal of mask-
ing heterogeneity. It exists between the routing and datalink layers of the OSI model
14
and attempts to establish a backbone for a network by electing nodes with the best en-
ergy reserves to be traffic-forwarding coordinators [28]. While the coordinators route
packets nodes not participating in network communication may turn their radios off,
significantly reducing power consumption.
2.6 Voice over IP
Voice over IP (VoIP) is a collective term given to protocols, software, and hardware
that allow the transmission of voice traffic normally handled by the Public Switched
Telephone Network (PSTN) to traverse packet-switched data networks [29]. Recent
interest for VoIP has included support for inexpensive long distance calls [30] and
integration into existing wireless mobile services [31]. Given the reduction in quality
inherent in delivering a continuous signal over a packet network, research attempts to
discover better methods for providing an acceptable level of service for all applications
of VoIP.
2.6.1 Encoding Voice
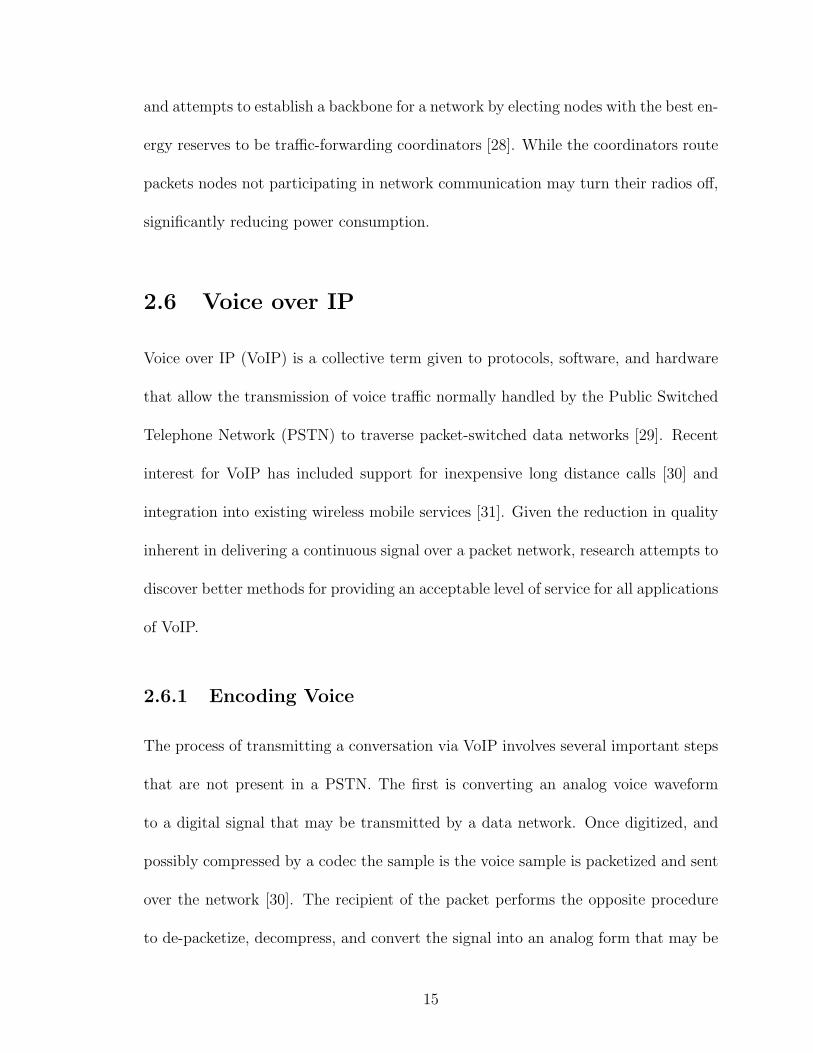
The process of transmitting a conversation via VoIP involves several important steps
that are not present in a PSTN. The first is converting an analog voice waveform
to a digital signal that may be transmitted by a data network. Once digitized, and
possibly compressed by a codec the sample is the voice sample is packetized and sent
over the network [30]. The recipient of the packet performs the opposite procedure
to de-packetize, decompress, and convert the signal into an analog form that may be
15
Figure 2.2: VoIP Process
played back [32]. Figure 2.2 illustrates the entire process.
Several codecs exists for encoding voice signals for VoIP. The G.711 codec is one
of the most popular codecs available [33]. While certainly not the smallest in terms
of data rate, the codec provides one of the best voice qualities and advanced features
such as echo cancellation [34].
2.6.2 Setting up and Maintaining Calls
In addition to delivering the actual voice content, another protocol is responsible for
setting up, maintaining, and tearing down call sessions. Session Initiation Protocol
(SIP) and H.323 are two examples of protocols that perform this particular function.
Modeled after HTTP, SIP uses a reliable transport protocol to signal that one user
16

wants to call another, a terminal is “ringing,” and a connection is established [29].
These features, while small in the amount of traffic generated when compared to the
rest of the call data, are essential to providing equivalent PSTN functionality.
2.7 VoIP and Energy Efficiency
Much of the research concerning VoIP technology focuses primarily on providing
Quality of Service (QoS) and reducing the bandwidth for a large volume of calls in a
network. The most popular metrics for evaluating these two criteria include packet
loss, end-to-end delay, and jitter, as well as choice of codec and packet size [35].
Power awareness has, so far, not been a major research concern for VoIP in
WLANs. Providing the best quality is counterproductive to reducing the power con-
sumption given that devices will always want to be on and ready to receive all packets
as quickly as possible.
17

Chapter 3
Problem Statement
This work analyzes the effects of simple energy-saving techniques on the perceived
quality of Voice of IP (VoIP) calls conducted over a wireless network. Currently,
algorithms exist for powering off radio interfaces during intervals when they are not
needed in order to conserve power [19, 16], however these algorithms do not consider
the unique constraints imposed by VoIP traffic. VoIP, unlike many of the applications
previously considered, is more sensitive to network phenomenon such as delay, jitter,
and packet loss, and requires special attention, especially in a wireless setting. Since
higher layers in a system hierarchy are better able to manage energy this analysis
makes all energy-saving attempts at the application layer.
3.1 Analysis Goals
The goal of this analysis is to determine the combination of factors that conserve as
much system energy as possible while still maintaining an acceptable level of quality
18

in the speech delivered to VoIP applications. Energy-saving algorithms that power
off WNICs obviously introduce some delay, at best, and more likely yield packet loss
when combined with an unreliable transport layer, like UDP, which VoIP applications
typically employ. A balance between consuming power at a reasonable rate and
providing quality service is necessary.
Acceptable quality is a subjective metric, however, listening quality studies pro-
vide some guidelines that correlate network metrics such as delay and loss, as well as
choice of codec, with a mean opinion score (MOS) generated by study participants
ranking their satisfaction with a particular call quality [36]. These numbers provide
some bounds to work within and help quantify the metric. Table 3.1 summarizes
the five-point MOS scale broadly classifying speech quality as published by the In-
ternational Telecommunication Union (ITU). In addition to the MOS there is also
an “E-model” that predicts user satisfaction on a 100-point scale using parameters
derived from transmission conditions [1]. Table 3.2, published by the ITU, shows the
R-Value output of the E-model with corresponding MOS [1]. It also includes two
other ratings, the percentage of study participants who would rate the call good or
better (GoB), and the percentage of those who would rate the call poor or worse
(PoW).
3.1.1 Comparison MOS Ratings
The MOS ratings of systems already in widespread use offer insight into an acceptable
lower bound on quality. Presumably any service in existence with a large user base,
such as the cellular phone network, has an acceptable satisfaction rating. A recent
19

Quality of Speech MOS RatingExcellent 5Good 4Fair 3Poor 2Bad 1
Table 3.1: MOS Rating Scale
R-value MOS GoB (%) PoW (%) User Satisfaction90 4.34 97 ∼0 Very Satisfied80 4.03 89 ∼0 Satisfied70 3.60 73 6 Some users dissatisfied60 3.10 50 17 Many users dissatisfied50 2.58 27 38 Nearly all users dissatisfied
Table 3.2: R-Values, MOS Rankings, and User Satisfaction [1]
report issued by Psytechnics, a voice quality measurement company specializing in
perceptual listening quality, shows MOS ratings ranging between 2.9 and 3.5 for eight
different handset models and between 3.3 and 3.6 for five different public mobile
operators in the United Kingdom [37].
3.2 Application Layer Knowledge
As discussed in the previous chapter, research suggests the best location for energy-
saving algorithms is the application layer because of its knowledge of the traffic. An
essential definition in constructing an application for analysis is the exact makeup
of application layer knowledge. For this analysis, information concerning when and
how often an application intends to transmit or receive data as well as how much
data needs to be processed constitutes application layer knowledge. For applications
20

that send and receive real-time data, application layer knowledge must also include
bounds on how quickly and how reliably messages must be received by the opposite
end of the communication, though the enforcement of these bounds is not entirely
in control of the application. Attention to this information allows an application to
intelligently control the state of the network interface. Individual network services
have different traffic patterns, and so protocols lower in the network stack may only
make vague guesses for the best way to control the wireless interface [22]. Time-
sensitive applications, like live streaming audio, have well-defined parameters for the
volume and frequency of their traffic as well as bounds on its latency [38].
For VoIP the choice of codec defines all traffic generated by the application. The
codec rate determines how often the application produces packets and the sampling
rate used by the codec sets the size of those packets. With this knowledge and the
constraints on acceptable delays the application can put the network interface into
a sleep state, buffer packets, and send everything in a single burst upon waking up.
This strategy is similar in spirit to the work of Chandra and Vahdat on streaming
multimedia [22], however, also considers the real-time constraints, and interactive
nature, of VoIP traffic. Attempting to control the WNIC without this knowledge
might result in excessive delays if overzealous in saving energy or inefficient power
consumption if too conservative in reducing latency.
3.2.1 Other Forms of Application Layer Knowledge
Some typical network applications, such as web clients, may issue requests for re-
sources that a server has previously transmitted and may benefit from the storage
21
of the more frequently used files to prevent excessive network traffic. Caches on the
client itself as well as proxy servers in close proximity to the client reduce the load on
the network, and in wireless networks, unnecessary usage of precious system resources
by the WNIC [21].
Unfortunately, VoIP applications usually do not have many repeated portions of
a conversation (at least any that would sound natural when inserted at a later point
in time) and cannot benefit from these storage techniques. The Chandra and Vahdat
strategy for streaming multimedia files suggests keeping a proxy one hop away from
the the client so that enough data may be buffered and delivered at predictable
intervals [22]. VoIP is not compatible with this power-saving architecture since live
voice streams would not sound natural if processed in large chunks and intervals.
3.2.2 Prediction Problem
Applications have a relatively easy task when controlling the network interface through
knowledge of when transmissions must occur. Predicting when an application run-
ning on another host in the network intends to transmit that must be received locally
is a far more difficult problem. Sleeping through these transmissions may cause an
application to miss message or to receive data later than expected.
One possible solution for arriving at effective sleep cycles is to use a low-power ra-
dio interface to listen for attempts at communication from other nodes in the network.
Upon recognizing incoming traffic, an application could then power up a second, high-
power interface for communication, as proposed by the “Wake on Wireless” design
[39]. This approach allows for great energy savings when a device is not being used at
22

all and could turn over control to an algorithm that manages the high-power interface
for active communication.
Given that VoIP applications use best-effort transport protocols to deliver their
data, a node cannot be asleep when a packet arrives. This analysis will later show
that on small time scales (≤ 500 ms) the prediction problem becomes a negligible
concern for 802.11 wireless networks.
3.3 QoS Metrics
Several traditional QoS metrics provide an indication of how well users might perceive
the quality of a VoIP call. Though users of a service may not be able to distinguish
between small changes in these parameters (e.g. a 50 ms delay vs. an 80 ms delay),
they still identify limits on when a service quality becomes unacceptable.
3.3.1 Latency
Latency, or delay, is the time from when an audio signal is first recorded on one
end of the communication to the moment it is heard on the opposite end. Often
works analyzing QoS refer to this definition more specifically as “absolute delay” or
“mouth-to-ear” delay [1]. Evaluation studies show one-way delays surpassing 200 ms
to be noticeable [30], and those over 400 ms to be unacceptable to many users [38].
Several factors, some more tunable than others, introduce delay into VoIP ap-
plications. The time period for a codec to produce a single packet of audio, the
forced playout period of an application, and the delays already present in a commu-
23

nications network are three contributing factors identified by one particular research
group studying delay patterns of VoIP traffic [34]. Applications, to some extent, can
regulate the first two of these delays by the changing the codec or playout scheme
[40]. The third delay is a combination of the available bandwidth in a network, the
number of hops between endpoints, the physical distance between two nodes, and the
traffic density in the network [38]. These factors are not always as easy to control.
Also contributing to this network delay are retransmissions caused by the larger error
rate of wireless networks when compared to their wired counterparts [41].
3.3.2 Jitter
Jitter, the difference in the delay of successive packets [34], produces unnatural breaks
in the voice when becoming too large. In practice applications reduce the effects of
jitter by buffering packets [40], which introduces some delay as previously discussed.
This increase in latency makes the use of large buffers for live, interactive audio
unacceptable. Small buffers are necessary, though, to smooth variable network delay
allowing the playback of audio samples to be continuous (Figure 3.1).
3.3.3 Packet Loss
Packet loss, especially prevalent in wireless networks, occasionally causes audio pack-
ets to not be available when it is their turn to be played. Since most audio is transmit-
ted via an unreliable transport protocol such as UDP, there is usually some expected
loss in congested paths or wireless links. Algorithms known as Packet Loss Conceal-
ment (PLC), or Frame Erasure Concealment (FEC), help to cover up the occasional
24

Figure 3.1: Playback Scheme to Smooth Variable Network Delay
lost packet, however are not as effective for long absent sequences of voice [35, 38].
3.3.4 Echo
Though not directly measurable as a network statistic, echo is a noticeable effect
exacerbated by network conditions, namely delay [1]. Codecs usually contain at least
some echo cancellation ability [35], making its effects less annoying.
3.3.5 Digitization Distortion
Like echo, the distortion due to the discretization of an analog signal is not directly
measurable in the network, but may be perceivable by users. VoIP requires an analog-
to-digital conversion in order to use a packet-switched network [33]. Converting a
waveform into a digital format introduces quantization noise that alters the sound
25

when converted back to a waveform on the other end of the communication [32].
3.3.6 Packet Size & Header Weight
A balance exists between sending many packets with a small delay and taking more
time to assemble larger packets [30]. The larger packets are more efficient because
the headers that must be prefixed no matter what the size is. Another considera-
tion to take into account is that larger frames are more likely to be corrupted when
transmission quality is poor [41].
3.4 Analysis of QoS
VoIP applications usually use UDP to transport their audio samples to the receiving
end of the conversation. While UDP reduces overhead by using a small, 8-byte header,
it is also a best effort protocol and hence not always reliable. This combination
implies that applications must be robust against an occasional loss of packets since
no feedback mechanisms exist [30]1. Furthermore, users will not recognize a difference
in the quality due to delay until the parameter reaches a threshold of around 150 ms
[34].
Since there is a certain degree of ambiguity in the interpretation of many of the
network statistics, an analysis cannot rely on these parameters alone to quantify the
quality level of a particular call. Ultimately user satisfaction determines acceptable
levels for the network parameters. There is therefore a distinction between the in-
1This analysis later explains a compensation for unreliable transport present in the 802.11 MAClayer.
26

trinsic QoS represented by the network statistics and the perceived QoS represented
by a ranking derived from usability studies [32].
3.5 Bandwidth Reduction vs. Energy Savings
Many strategies for decreasing the bandwidth requirements of VoIP applications exist,
however, Feeney and Nilsson note that energy conservation and bandwidth reduction
are not necessarily related [42]. The ratio of power consumed while a WNIC is in
idle state over a receive state is not much when compared to the difference in power
consumption between idle and sleep states [43]. Hence, technologies that enable
bandwidth reduction may not greatly influence energy savings if the WNIC still must
be idle, ready to receive or transmit at regular intervals. One such innovation for
bandwidth minimization is silence suppression algorithms, or Voice Activity Detection
(VAD), which prevents the transmission of packets when the user is not talking [44].
While these algorithms cut down the number of transmissions, the card still needs to
remain idle, ready to receive samples from the opposite end of the communication.
The same argument may be made for switching to a lower bit rate codec.
27

Chapter 4
Analysis Models
Powering off a WNIC during periods when the system is not using that particular piece
of hardware has the potential for great energy savings. However, there is a tradeoff
between these savings and the quality of service provided on traffic entering and
exiting nodes implementing power-aware algorithms, and time sensitive applications
are especially affected. Detailed models that unambiguously quantify and carefully
account for energy savings and user satisfaction provide insight into the tradeoff and
offer a means to arrive at an optimal solution that minimizes power consumption and
maximizes perceived user satisfaction.
4.1 Modeling WNIC Energy Usage
The experiments involving VoIP communication in this analysis all use the Cisco
Aironet 350 PCI WNIC. This interface is the same as the PC Card version of the
product, but is wrapped in a PCI cradle. A custom-built measurement apparatus
28

provides the measurements vital to the energy analysis.
The power measurements are much like those already present in the literature for
similar research [42, 43, 45], but measure power delivered to a PCI WNIC, rather than
a PCMCIA peripheral. To measure power a PCI extender card is placed between the
WNIC and the PCI slot in a desktop computer. This extender consists of metal strips
that carry the signal of each of the pins to a standard PCI interface slot at the top of
the card, and to which electronic devices may be attached for measurements (Figure
4.1). Of the 124 pins present in a typical 32-bit PCI device, 13 deliver power to this
specific card. For the measurements each of these 13 rails are connected to a single
point, which is then attached to one end of a 2.0 W, 1.0 Ohm resistor before finally
being multiplexed into 13 separate paths again at the other end of the resistor. With
this configuration all current now flows through the resistor before reaching the card.
Using Ohm’s law one may derive this current by measuring the voltage across the
resistor. This current, when multiplied by the voltage across the card, produces the
instantaneous power delivered to the interface.
Measuring an instantaneous voltage requires the use of a digital oscilloscope. The
oscilloscope has two inputs consisting of probes attached at each end of the resis-
tor. The smaller-valued signal is then subtracted from the larger-valued to yield a
composite signal representing the differential voltage across the resistor. Through
the functionality provided by a digital oscilloscope, one may capture a plot of the
voltage across the resistor during a small period of time. These plots are useful in
determining the exact power consumption of the WNIC while in various states and
while transitioning between states. By integrating over an interval of interest, one
29

Figure 4.1: PCI Extender Card Modified for Measuring Power
30
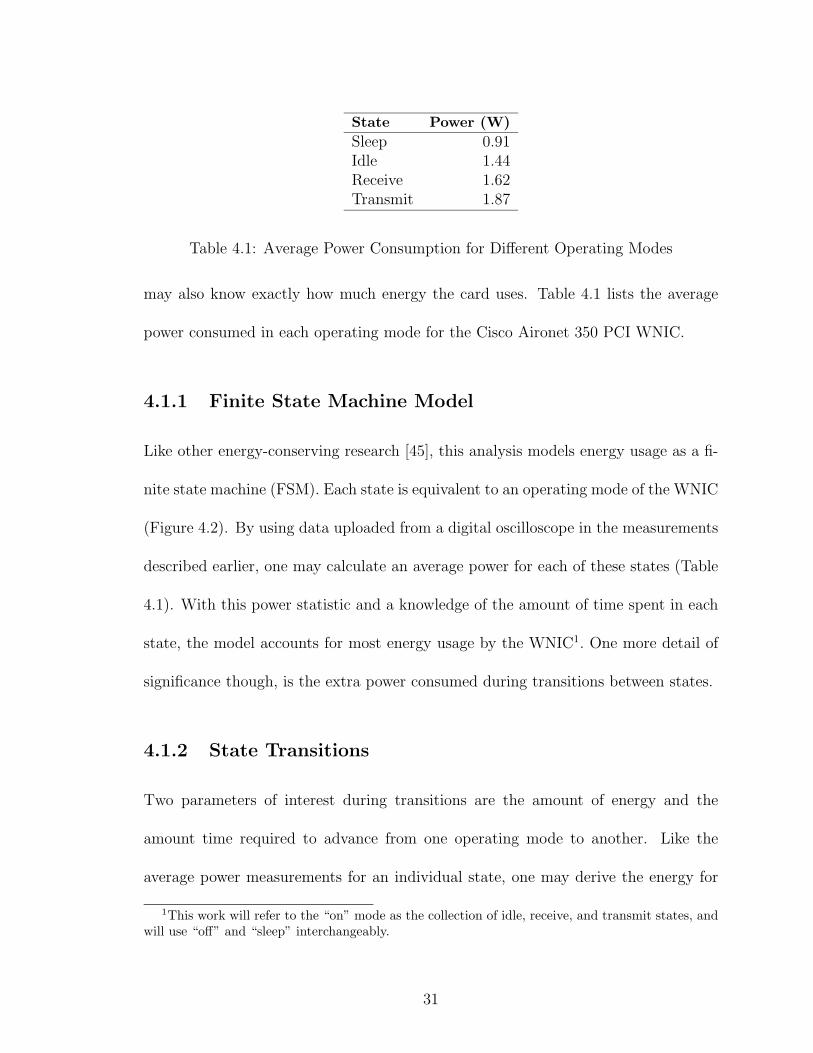
State Power (W)Sleep 0.91Idle 1.44Receive 1.62Transmit 1.87
Table 4.1: Average Power Consumption for Different Operating Modes
may also know exactly how much energy the card uses. Table 4.1 lists the average
power consumed in each operating mode for the Cisco Aironet 350 PCI WNIC.
4.1.1 Finite State Machine Model
Like other energy-conserving research [45], this analysis models energy usage as a fi-
nite state machine (FSM). Each state is equivalent to an operating mode of the WNIC
(Figure 4.2). By using data uploaded from a digital oscilloscope in the measurements
described earlier, one may calculate an average power for each of these states (Table
4.1). With this power statistic and a knowledge of the amount of time spent in each
state, the model accounts for most energy usage by the WNIC1. One more detail of
significance though, is the extra power consumed during transitions between states.
4.1.2 State Transitions
Two parameters of interest during transitions are the amount of energy and the
amount time required to advance from one operating mode to another. Like the
average power measurements for an individual state, one may derive the energy for
1This work will refer to the “on” mode as the collection of idle, receive, and transmit states, andwill use “off” and “sleep” interchangeably.
31

Figure 4.2: Finite State Machine Model
Transition Energy (mJ) Time (ms)Sleep To On 441 333On To Sleep 21.4 16.0
Table 4.2: Energy & Time Required for State Transitions
transitions from the data generated by the oscilloscope. For example, the transition
from an sleep to an idle state (Figure 4.3) requires 441 mJ of energy and 333 ms
of time. The time factor seems large when compared to other values reported in
the literature [43, 45] for the most recent technology, but probably reflects the extra
circuitry encapsulating the card in the PCI holder. Transitions from the idle to sleep
state (Figure 4.4) are much faster requiring 21.4 mJ and lasting around 16 ms. The
analysis described in this chapter considers transitions between the idle state and
both the receive and transmit states to be negligible.
32

0.6
0.8
1
1.2
1.4
1.6
1.8
2
-0.2 0 0.2 0.4 0.6 0.8
Pow
er (
W)
�
Time (s)
Power vs. Time for Sleep to Idle Transition
Figure 4.3: Sleep to Idle Transition
33

0.7
0.8
0.9
1
1.1
1.2
1.3
1.4
1.5
1.6
1.7
1.8
-0.2 0 0.2 0.4 0.6 0.8
Pow
er (
W)
�
Time (s)
Power vs. Time for Idle to Sleep Transition
Figure 4.4: Idle to Sleep Transition
34

4.1.3 Energy Balance
For powering off an interface during periods of no activity to be effective from an
energy-savings perspective, the energy usage during the sleep state combined with
the transitions to and from this state must be less than the energy usage of the idle
state if the card had remained on for the entire period [46].
Eon−to−sleep + Esleep + Esleep−to−on ≤ Eidle (4.1)
Integrating over the portions of the power plots for the state transitions and
assuming an average power for the sleep and idle states, the equation may be rewritten
as the following:
∫ 0.016
0Pon−to−sleep(t)dt+Psleeptthresh+
∫ 0.333
0Psleep−to−on(t)dt ≤ Pidle(tthresh+0.016+0.333)
(4.2)
Solving for tthresh results in a negative time indicating that it is always better to
power off the WNIC as long as the application using the interface deems the transition
times affordable.
4.1.4 Deriving Energy Usage from Network Traffic
Taking advantage of the FSM energy model prevents the need to constantly perform
cumbersome measurements on the WNIC during the course of an experiment. A
packet analyzer (e.g. tcpdump) verifies when a WNIC is transmitting or receiving,
35

and the size of the packet being sent or received divided by the bandwidth of the link
dictates the time spent in a particular state. Because the application controls the
state of the WNIC, it also is aware of when the card is transitioning to an sleep state,
remaining in an sleep state, and transitioning back to an idle state. The remaining
time the WNIC must be spending in the idle state.
4.2 Modeling Predicted User Satisfaction
A psychoacoustic scale known as the E-model provides an appropriate metric for
estimating how satisfied a user will be with a call given some basic transmission
parameters. The overall equation for the E-model is as follows:
R = Ro − Is − Id − Ie−eff + A (4.3)
The first term, Ro is a signal-to-noise ratio derived from conditions related to the
fidelity of the telephone equipment and the distractions in the surrounding environ-
ment where the call takes place. The ITU provides default recommended values for
the parameters that influence this value [1]. From Ro three different impairments
subtract from the value so far accrued. The final factor, A, is a constant known as
the advantage factor, which allows one to move the rating up to twenty points in
the positive direction to accommodate for special circumstances in which users would
be willing to tolerate a lower rating in exchange for some other convenience. For
example, high mobility will suffer from low data transfer rates forcing the use of a
lower-bandwidth, lower-quality codec, but presumably the user will be satisfied with
36

this choice if there are no other options for those conditions. For purposes of this
analysis, the advantage factor will remain at its default value of 0.
4.2.1 Simultaneous Impairments
First in the subtraction of impairments is a collection of factors Is, that occur concur-
rently and throughout the entire call. The E-model bundles these contributors into a
variable known as simultaneous impairments. Simultaneous impairments are mostly
a function of the particular codec in use. A prominent term in this collection is the
quantization distortion2, the difference between the true analog amplitude of a signal
and its discrete digital representation [32]. A codec might use non-uniform quanti-
zation to allow for finer resolution in the ranges most affected by quantization [33].
Other terms include the Overall Loudness Rating and the effects of a non-optimum
sidetone. The first of these two terms is highly variable depending on the speaker
and so the model defaults it at an average value [1]. The latter term applies mostly
to analog telephone networks and is not considered for VoIP applications.
4.2.2 Delay Impairments
In VoIP applications delays tend the have profound effects due to queuing and varying
traffic levels inherent in best-effort, packet-switched networks [38]. The absolute
delay, Ta, represents this phenomenon in the E-model [1]. Delays of 100 ms or less
have no impact on the impairment, while delays above 100 ms begin to induce a
2Presently the E-model only uses the quantization noise for the G.711 codec. For other codecs,the model includes a single equipment impairment factor.
37

60
65
70
75
80
85
90
95
0 50 100 150 200 250 300 350 400 450 500
E-m
odel
Rat
ing
�
Absolute Delay (ms)
E-model Rating vs. Absolute Delay
Figure 4.5: Effect of Absolute Delay on E-model Rating
great deterioration in perceived quality. Figure 4.5 shows the effect of varying delay
when all other E-model parameters remain at their default values. Additional delay
impairment terms include the effects of echo, but like other research using the E-model
[35], one may simplify these contributions by assuming the codec in use contains a
reasonable echo cancellation ability.
38

4.2.3 Equipment Impairment
The third, and final, impairment is the equipment impairment, Ie−eff . Aside from
some constants related to low bit rate codecs, the equipment impairment is only
related to packet loss [1]. Since packet loss is a more recent introduction to the
E-model, the methods for modeling this phenomenon are presently evolving. More
recent models recognize the differences between random loss and bursty loss as well
as the effects of the packet loss concealment algorithms present in many codecs [47].
Most packet loss for VoIP applications, especially this particular research, is a bursty
loss. With the reported impairments for varying percentages of bursty with basic
packet loss concealment techniques [47], the E-model may interpolate between the
known values to arrive at the contribution for any value of packet loss within the
defined range. These ranges contribute varying rates of quality degradation depending
on the percentage of loss. Figure 4.6 plots the effects of the interpolated contribution
of percentage loss to the overall rating when all other factors remain at their default
values.
4.3 E-model & MOS Correlation
The E-model also provides a correlation function to convert between the transmission
rating factor, R, and the more widely used MOS rating [1]. This conversion allows
one to predict user opinion from physical conditions.
39

40
45
50
55
60
65
70
75
80
85
90
95
0 5 10 15 20
E-m
odel
Rat
ing
�
Packet Loss (%)
E-model Rating vs. Packet Loss
Figure 4.6: Effect of Packet Loss on E-model Rating
40

4.4 Instantaneous vs. Overall MOS Rating
The calculation of the MOS rating occurs at the instant the packet is about to be
played back on the receiving end of the application. Since the latency of the current
packet will differ from the latency of other packets, the resulting in MOS rating po-
tentially may fluctuate throughout the duration of a call. For packet loss percentages
the E-model considers the statistic to be a running total calculated as the number of
packets not received over the the number of packets expected at the time of playback
[1].
While the packet by packet, or instantaneous, MOS provides some insight into user
satisfaction, the rating that a user would give at the conclusion of an entire session is
a more desirable statistic. Since network conditions did not vary throughout the calls
conducted using the implementation, the overall MOS rating may be approximated
with the average of the instantaneous MOS ratings [35]. This simplification provides
a single quantitative statistic useful for comparing different calls.
41

Chapter 5
Implementation
To investigate the effects of of a simple energy-saving technique, this work deploys a
custom-built VoIP application on a desktop system in an 802.11b network. Calculat-
ing the energy usage and user satisfaction by using the models derived in the previous
chapter provides quantitative evidence of the effectiveness of the technique. The goal
is not to arrive at optimal results for a desktop system, but rather to demonstrate
that energy savings are possible, and to validate the assumption in the models. From
the implementation it is then possible in simulation to explore the effect of varying
model parameters to reflect published hardware and software capabilities of other
wireless systems.
5.1 VoIP Application Architecture
For analysis this work implements a simple VoIP application on a desktop FreeBSD
system using the accompanying open source drivers for the Cisco Aironet 350 PCI
42

Figure 5.1: VoIP Application Architecture
WNIC examined earlier. Each peer in a VoIP session requires two processes, one to
record, packetize and send audio, and one to receive, de-packetize, and playback audio
(Figure 5.1 and Figure 2.2). Although seemingly performing analogous functions each
process is also responsible for other components related to energy savings and the
analysis of the current conditions induced by power-aware algorithms. This analysis
assumes that only one of the peers performs the energy saving algorithm while the
other peer remains constantly awake. For instance, in an infrastructure network, a
node would communicate with an access point that is always on.
5.1.1 Audio Source
This VoIP application uses G.711, a µ-Law Pulse Code Modulation (PCM) codec
with a bit rate of 64 Kbps. Any standard sound card available for PCs provides
capabilities for sampling a PCM stream from an input such as a microphone and
for “writing” the same stream to an output device, such as speakers or headphones.
The desired sample size and the bit rate dictate the time necessary to read or write
sample.
43

5.1.2 VoIP Traffic
VoIP traffic consists of two distinct parts, control and voice traffic. The control traf-
fic initiates calls at their start, tears-down sessions at their completion, and reports
errors throughout [29]. While necessary, the control packets become an insignifi-
cant contribution to the overall traffic when compared to voice data as call duration
increases.
VoIP voice traffic is a constant bit rate (CBR) stream that is identical and sym-
metrical between both communicating entities [34]. The choice of codec sets the rate
and the number of bits transmitted at each interval. G.711, operating at 64 kbps
produces 50 packets containing 160 bytes of audio data every second from each node
[44].
5.1.3 Packet Headers
Before the application sends the packet it appends a 12-byte RTP header containing
a sequence number and a timestamp. To this overhead, the transmission layer adds
an 8-byte UDP header followed by a 20-byte IP header prefixed by the network layer
[38]. When reaching the datalink layer the 160 byte audio sample is now 200 bytes.
The 802.11 MAC layer uses a 34-byte header for frames [48] yielding a final size of
234 bytes to be transmitted or received.
44

5.1.4 Measuring Network Statistics
After deciding on a codec, the only two parameters that will vary in the E-model
are delay and packet loss. Measurements for both these statistics are possible in a
controlled environment.
Measuring Delay
Before starting an instance of the VoIP application the two communicating peers
synchronize their clocks to a common reference point in the same broadcast range
using the Network Time Protocol (NTP), with an error of less than 1 ms. The sending
application timestamps every packet at the instant before reading a sample from the
sound card. Upon reception of this packet the receiving end obtains a timestamp
the moment before it is ready to play the sample. The difference between these two
timestamps represents the mouth-to-ear (m2e) delay, which the E-model uses as input
[1].
Measuring Packet Loss
The receiving end of the application calculates packet loss statistics by using a se-
quence number inserted by the sender. This number represents how many packets
the sender transmitted. By keeping its own counter the receiving end knows how
many packets it received. The ratio of received packets over sent packets represents
the success rate, therefore the percentage loss is the number of percentage points the
success rate is away from 100%. This calculation would of course not be accurate if
the network loses several packets at the very end of a call. Since extreme packet loss
45
is no more likely at the end of a call than at any point during a call, this analysis
ignores the anomaly of a final string of lost packets.
5.2 Energy-Saving Algorithm
Only one of the peers in a VoIP communication session takes advantage of the energy-
saving algorithm. The algorithm is a simple cycle that turns the WNIC on and off
in intervals specified by the user of the VoIP application. Since one peer is not using
the algorithm, its interface always remains on. In an infrastructure network, a node
communicates with an access point, so the constraint of only one node controlling its
WNIC is reasonable. In a peer-to-peer network nodes cannot both run the algorithm
unless they first perform additional synchronization to ensure they use their interfaces
at the same time. Such a situation is outside the scope of this analysis.
5.3 Sending Application
In addition to recording and sending audio samples, the sending application assumes
responsibility for the energy-saving algorithm if on the host using energy-conservation,
otherwise the “on time” of the WNIC is assumed to be equal to the duration of the
call (i.e. always on). Following is a detailed description of each scenario.
5.3.1 Energy-Saving Host
With its insight into the present state of the WNIC (on or off), the sending application
may either transmit packets immediately or buffer them for when the WNIC comes
46

back on. When the WNIC first begins its transition from the sleep to the idle state,
it will not be ready to transmit or receive until the transition completes. From
experience the application will overflow the allotted space in the kernel for UDP
packets or cause system instability when attempting to send out a burst of packets
accumulated during the off (sleep) portion of the cycle before the transition completes.
To ensure the application waits for the entire length of the transition period, it
employs a single ICMP ping to indicate the interface is ready (Figure 5.2). This
small, single piece of traffic does not greatly burden the system. The application
sends the ping immediately after turning the interface back on at the conclusion
of the off portion of the cycle. While it waits, the application continues to buffer
packets. Upon receiving a reply, the application then sends the contents of the queue.
For nodes in a different subnet, the application would send a ping to the gateway,
otherwise it would attempt to send a ping directly to its peer.
5.3.2 Always On Host
In contrast to the energy-conserving host the always on host continuously sends a
sample of audio every 20 ms as defined by the codec. Since the opposite peer is
running an energy-saving algorithm, the WNIC may not be available for receiving the
packets at the instant they are sent, though the sending application of the always on
host is unaware of this fact. The 802.11 retry mechanism, however, ensures that many
of these packets are eventually delivered. With a small sleep time and a sufficient
number of retries the application can ensure nearly zero loss.
47

Figure 5.2: Sequence for Emptying the Queue when WNIC Transitions to On
48

Algorithm 1 Energy Saving Algorithm on Sending Application
Require: WNIC Status = ONRequire: TransitionComplete = True
while true doRecordAudio ()PacketizeSample ()if (WNIC Status = OFF) then
QueuePacket ()if (Off Time Expired) then
TurnCardOn ()SendPing ()TransitionComplete ← False
end ifelse
if (TransitionComplete = True) thenSendPacket ()
else if (PingArrived = True) thenSendQueue ()TransitionComplete ← True
elseQueuePacket ()
end ifif (On Time Expired) then
TurnCardOff ()end if
end ifend while
49

5.4 Receiving Application
The receiving application is identical on both communicating hosts, however is af-
fected by the sending application, which control the state of the WNIC. While per-
forming the reception and playback of audio packets, the receiving application also
encapsulates the E-model rating calculation. Prior to playing a sample this part of
the application calculates the delay and the current loss percentage to pass to the
model. The application uses this data to compute an E-model R-Rating, which it
then converts to a MOS rating. During the entire run the code also maintains a
running average of the MOS so that, upon termination, the program will display a
single statistic predicting the user satisfaction with a particular call.
Algorithm 2 Receiving Application Algorithm
while (packets received ≤ packets expected) doReceive ()PrintSatistics ()PlayAudio ()
end while
5.5 Analysis Assumptions
Experiments involving the wireless transmission of VoIP packets take place in a con-
trolled environment. Only the participating peers communicate on the channel. Fur-
thermore, the nodes are less than 3 meters apart and because of this short distance
there is little fading. These conditions help to provide consistent and precise results,
but may not match entirely the often harsh set of phenomena that hinder WLANs.
Frames lost as a result of interference are more common in many wireless networks
50

[41].
Another aspect of the analysis deserving of careful scrutiny is the calculation of
message latency. Attempting to synchronize the clocks of two different nodes in a
network, a necessary step for deriving an absolute delay, is a known difficult problem
in any distributed environment [8]. By synchronizing to a common reference point
in the same broadcast range, two nodes are able to achieve clocks very close to the
same value with less than 1 ms of error. Given the resolution required for the delay
calculation, this error is perfectly acceptable.
5.6 Initial Application Output
As a first test of the VoIP application, run with the WNIC constantly awake, the
output is as expected. There is no packet loss, only a small delay, and a good MOS
rating. For the G.711 codec the theoretical best E-model output, accepting all the
recommended defaults, is 93.2, which translates to a MOS of 4.4 [1]. Most participants
in subjective listening studies regard MOS Ratings of 4.0 and above as good or better
(Table 3.1), setting the 4.4 rating as a high quality standard for comparison [33].
5.7 Energy-Saving Output
The control group offers a good MOS but, of course, no energy savings. To initiate an
energy saving cycle the VoIP program requires two parameters, the amount of time
to spend in the idle state ready to possibly transmit or receive, and the amount of
time to spend in the sleep state. From experience an on time of 100 ms or greater is
51

sufficient to allow the sending application to transmit the contents of its queue and
the receiving application to receive all of the packets sent by its peer.
Listening to the the audio output on each host verifies each stream is continuous
and intelligible. A more detailed discussion of delays, user satisfaction ratings, and
energy savings follows, as well as an analysis of contributing factors.
5.7.1 Discussion of Delay
Figure 5.3 plots the delays for each packet throughout the duration of a one minute
call at the host that receives from the energy-conserving sender. At the opposite
host the time in the off portion of the energy-saving cycle is 100 ms. Following this
period the WNIC requires approximately 333 ms until it is ready for transmission,
and in this implementation possibly 20 ms more to packetize another sample of audio
while waiting. The sum of these delays sets the minimum latency at 453 ms. If pings
testing the readiness of the interface incur additional delay in the network the overall
latency starts to increase until reaching a threshold in which the application begins
dropping packets. The implementation uses an adaptive buffer by reading from the
socket whenever the playback of the next packet is to begin. The delay, therefore, is
always the maximum observed delay until reaching the 500 ms cut-off point in which
the delay drops slightly since a packet is now missing from the playout sequence.
In Figure 5.4 the delays for each packet on the host implementing the energy-
saving algorithm are plotted for the duration of a one minute call. It seems as
though the hardware has the ability to receive before the transition completes, even
though it still cannot transmit, hence the shorter delays initially. An explanation
52

0
100
200
300
400
500
0 500 1000 1500 2000 2500 3000
Del
ay (
ms)
Sequence Number
Delay vs. Sequence Number
Figure 5.3: Delay for Receiver with Always On WNIC
53
for the escalation of the delay is a combination of the 802.11 retry mechanism and
the scheduling performed by the operating system on the host running the receiving
process. The implementation requires that the receiving application sleep for the
playback period of a packet since the call to function that plays the audio buffers the
sample on the sound card and returns immediately. The error in scheduling processes
in the OS combined with a competition between the two applications for use of the
network and sound card lead to some additional delays, which become complicated
to isolate and analyze. Since the worst case delay, which is valuable for modeling,
is clearly demonstrated by the opposite host, this analysis ignores the aberrations
discussed here.
5.7.2 Discussion of MOS Rating
Figures 5.5 and 5.6 show the instantaneous and average MOS ratings at the host with
an always on WNIC and an energy-saving WNIC respectively. As is evident from the
plots the MOS ratings quickly settle at a nearly a constantly value, changing no
more than a few tenths of a point in either direction, an effect that is unlikely to be
noticeable. This observation validates the assumption of that the average MOS rating
closely approximates the the overall MOS rating. Again, the worst case MOS occurs
at the host with the always on WNIC because it is receiving from a host running the
energy-saving algorithm, and is of interest for modeling.
54
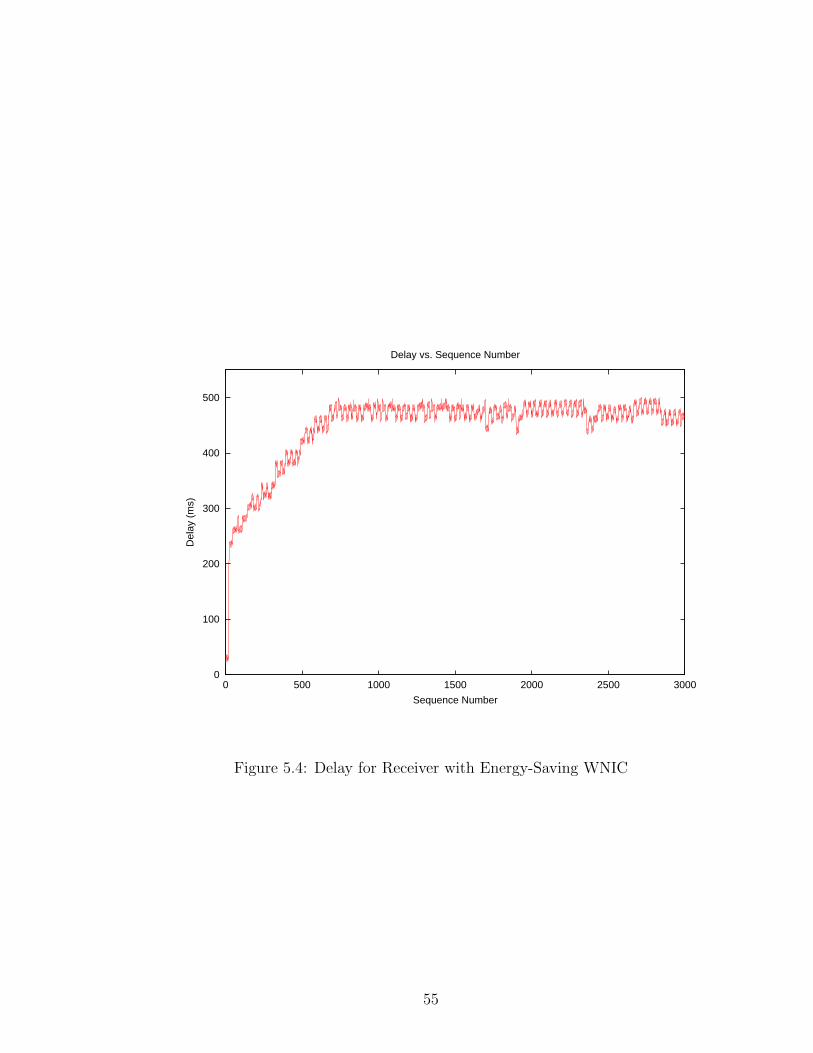
0
100
200
300
400
500
0 500 1000 1500 2000 2500 3000
Del
ay (
ms)
Sequence Number
Delay vs. Sequence Number
Figure 5.4: Delay for Receiver with Energy-Saving WNIC
55

0
1
2
3
4
5
0 500 1000 1500 2000 2500 3000
Mea
n O
pini
on S
core
(M
OS
)
Sequence Number
MOS vs. Sequence Number
Instantaneous MOSAverage MOS
Figure 5.5: MOS Ratings for Receiver with Always On WNIC
56

0
1
2
3
4
5
0 500 1000 1500 2000 2500 3000
Mea
n O
pini
on S
core
(M
OS
)
Sequence Number
MOS vs. Sequence Number
Instantaneous MOSAverage MOS
Figure 5.6: MOS Ratings for Receiver with Energy-Saving WNIC
57

5.7.3 Discussion of Energy Savings
The energy model reveals that the cycle of 500 ms on, 100 ms off requires 0.867 J
of energy per cycle, a relative difference of 10.3% when compared to a WNIC that
is constantly on for the same amount of time. This result supports the argument
for achieving successful energy conservation by using application layer knowledge to
select an appropriate cycle.
5.8 Contributing Factors
There are two system properties that are major contributors to the results of the
experiments. These parameters affect the hardware’s ability to transmit or receive
messages and ultimately affect delay or loss.
5.8.1 Sleep-To-Idle Period
As predicted the time from when the application issues a command to turn the WNIC
back on to the moment it is ready to transmit influences the latency of the packets.
This additional period is essentially equivalent to extending the off period since no
traffic may be transmitted or received during this time.
5.8.2 802.11 Retry Limit
One of the more surprising results of these experiments is the number of samples
received by nodes running an application that cycles the WNIC on and off. From
the prediction problem one would expect to lose all of the UDP segments during
58

sleep and transitioning periods, however, the application recovers remarkably well.
As previously mentioned, the reason for this robustness is the retry feature included
in the 802.11 MAC layer.
Retries are a special feature of 802.11 that do not exist in the traditional wired
Ethernet MAC layer. Due to the increased probability of frame loss or corruption
that results from the effects of wireless phenomena, the authors of 802.11 decided to
include positive acknowledgments as part of the protocol [48]. When a sender does
not receive an acknowledgment for a frame, it retries the transmission. A welcome
side effect of this behavior is that packets transmitted while the peer WNIC is off are
retried and eventually reach their destination, as long as the sender does not exceed
the limit for retry attempts.
Figure 5.7 illustrates the effect of the retry limit on the overall number of samples
that eventually reach the application on the receiving end, when that node has on and
off periods of 1.0 s each. The figure plots the percentage of total packets that failed
to be successfully delivered to a host with an always on WNIC against the maximum
number of transmission attempts for any single frame. The one second off period
helps to exaggerate the effect of the retry limit for illustration purposes and shows
that only a few extra attempts greatly aid in assuring a high probability of eventual
successful transmission. Decreasing the off time would shift the curve downwards so
that enough retry attempts would likely result in zero packet loss.
59

0
20
40
60
80
100
0 2 4 6 8 10 12
Pac
ket L
oss
(%)
�
Retry Limit
Packet Loss vs. Retry Limit
Figure 5.7: Effect of Retry Limit on Percentage Packet Loss
60

5.9 Extending Results in Simulation
The implementation uses current hardware, however, that hardware does not reflect
the technology available to mobile wireless systems. Research involving the power
consumption of wireless interfaces report sleep-to-idle transition times of as little as
20 ms [45] to around 100 ms [43]. To obtain a better knowledge of energy-saving
possibilities this analysis takes advantage of those transition periods to extend the
model in simulation. Other parameters in the simulation closely reflect the behavior
evident from the implementation.
5.9.1 Energy Modeling
For purposes of simulation the transmit, receive, idle, and sleep power levels are
assumed to be the same for a generic interface, as were measured for the Cisco WNIC.
From the fixed sleep-to-idle and idle-to-sleep transition energies the simulation derives
an average power from dividing the energies by the period of the transitions. This
average power is then multiplied by the new transition times. All other aspects of
the energy model remain identical.
5.9.2 Delay Modeling
When computing the MOS, the simulation assumes the delay to be the sum of the
sleep-to-idle transition and off periods. In addition, the simulation also includes in
the overall delay a 50 ms variable to represent wide area network delay when the
communicating hosts are further apart. This analysis assumes an adaptive playback
61

buffer that expands to the sum of all these delays.
5.9.3 Loss Modeling
Though setting the number of retry attempts made by the 802.11 MAC layer to a
large number ensures a high probability of success, the medium itself is still unreliable.
In addition interference, fading, and competition might introduce some delays that
exceed the size of the playback buffer, causing some packets that are successfully
delivered to a host to be dropped by the application. To allow for these occasional
phenomena, the simulation assumes a loss rate of 2%.
62

Chapter 6
Results
Through simulation this work explores the possible energy savings and predicted
user satisfaction that result from varying different system parameters, especially the
sleep-to-idle transition times. Review of these two metrics allows for the selection an
effective energy management cycle with appropriate user satisfaction. The simulations
demonstrate that even though the WNIC experiences some unavailability, the user
satisfaction still remains within acceptable bounds.
6.1 Simulation Setup
Each run of the simulation requires only two input parameters, the off period and
the on period of the WNIC for an energy cycle. Several other parameters remain
constant throughout a set of runs as described in the previous chapter. The following
sections describe the results for two different values for one of those constants, the
sleep-to-idle transition time.
63

0
0.5
1
1.5
2
2.5
3
3.5
4
100 150 200 250 300
MO
S R
atin
g
�
Sleep Time (ms)
MOS Rating vs. Sleep Time
Figure 6.1: MOS for Sleep-to-Idle Transition of 100 ms (200 ms On Time)
6.2 Sleep-to-Idle Transition of 100 ms
Figure 6.1 plots the MOS ratings for various off times ranging from 100 ms through
300 ms for a WNIC with a 100 ms sleep-to-idle transition time. All of these values are
at least as good as those reported for the handsets of mobile phones [37]. Of course
the decreased MOS rating in the simulation is a result of increased delay, rather than
increased loss, as is likely to be the case in the cellular phone network.
The energy-conserving algorithm offers substantial energy savings in addition to
acceptable quality (Figure 6.2). Each point on the graph directly corresponds to a
64

0
5
10
15
20
25
30
100 150 200 250 300
Ene
rgy
Sav
ings
(%
)
�
Sleep Time (ms)
Energy Savings vs. Sleep Time
Figure 6.2: Energy Savings for Sleep-to-Idle Transition of 100 ms (200 ms On Time)
point on the MOS figure for easy comparison.
6.3 Sleep-to-Idle Transition of 50 ms
Presented in Figure 6.3 are the MOS ratings for various sleep times for a WNIC with
a 50 ms sleep-to-idle transition time. These results show some improvement over the
MOS ratings for the card with a 100 ms sleep-to-idle transition time, with some of
the points for smaller sleep times approaching MOS ratings more typically associated
with the PSTN. Such a result seems counterintuitive in that it implies some users
65

0
0.5
1
1.5
2
2.5
3
3.5
4
100 150 200 250 300
MO
S R
atin
g
�
Sleep Time (ms)
MOS Rating vs. Sleep Time
Figure 6.3: MOS for Sleep-to-Idle Transition of 50 ms and (150 ms On Time)
may not even be able to distinguish between a normal telephone call and a VoIP call
in which the transmission mechanism is temporarily unavailable. This result shows
that the user perceived QoS more appropriately demonstrates that even though some
delay and loss exists, it is not necessarily any worse in quality if users cannot perceive
its effects.
Figure 6.4 plots the energy savings for the card with the 50 ms sleep-to-idle transi-
tion time. Under these conditions the savings exceed 26%. Assuming a direct relation
between power consumption and talk time, this combination of parameters could sig-
66
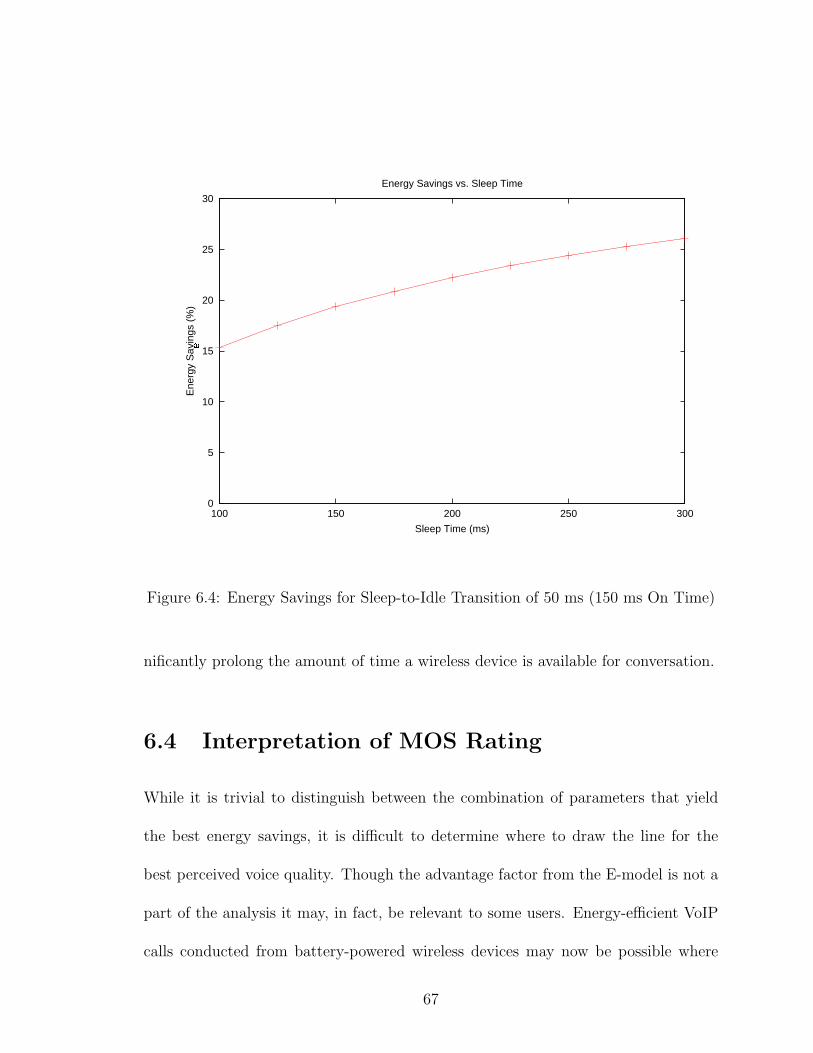
0
5
10
15
20
25
30
100 150 200 250 300
Ene
rgy
Sav
ings
(%
)
�
Sleep Time (ms)
Energy Savings vs. Sleep Time
Figure 6.4: Energy Savings for Sleep-to-Idle Transition of 50 ms (150 ms On Time)
nificantly prolong the amount of time a wireless device is available for conversation.
6.4 Interpretation of MOS Rating
While it is trivial to distinguish between the combination of parameters that yield
the best energy savings, it is difficult to determine where to draw the line for the
best perceived voice quality. Though the advantage factor from the E-model is not a
part of the analysis it may, in fact, be relevant to some users. Energy-efficient VoIP
calls conducted from battery-powered wireless devices may now be possible where
67

other wireless connectivity (e.g. cellular phone coverage) does not exist. Moreover,
a prolonged battery life or even the novelty of placing a “free” telephone call may
also entice users to be more accepting of a lower perceived quality rating. Therefore,
placing a cut-off on a MOS rating generally accepted as good, or toll-quality, is not
necessarily reflective of the best energy saving and quality combination.
Another point worth noting is that the MOS rating may even be higher than
predicted due to the models that currently exist for packet loss. As a relatively new
addition to the E-model, packet loss modeling has not quite matured. The version of
the E-model used for this analysis does not consider the ability of different codecs at
handling loss or loss concealment techniques, and applies a table of impairments for
a given percentage of loss [47]. A newer revision of the E-model addresses the need
for a “Packet-Loss Robustness Factor” that is different for each codec depending on
its ability to mask packet loss [49]. At present the recommendation only provides
preliminary results for possible values of this new factor, though.
68

Chapter 7
Conclusions
The results of this analysis provide evidence that real-time applications may benefit
from application layer energy-saving techniques. By not directly comparing network
metrics such as delay and loss and instead comparing a user’s perceived opinion of
quality this analysis better demonstrates the true effects of one energy-saving scheme
verses another. While the traditional intrinsic factors of QoS may vary, there may be
little or no change in the perceived QoS. The perceived QoS is ultimately the factor
that influences the adoption of an actual implementation by end users.
7.1 Optimal Energy Saving and MOS Ratings
Arriving at an optimal combination of energy and MOS ratings appears to be a
subjective decision as well. Users accustomed to the the quality of calls on the PSTN
(MOS ≥ 4.0) will only find the same level of service when using a WNIC with a short
off-to-on transition time and only achieve around 15% energy savings. For those
69

individuals who are regular users of cellular phones, a lower MOS rating might sound
normal. Finally, anyone who now may benefit from having access to these type of
calls may be willing to accept an even lower MOS rating.
7.2 Future Work
With satisfying results in simulation this work provides several possibilities for in-
vestigating the behavior of the energy-saving scheme under various other real-world
conditions. The presence of heterogeneous network nodes and other traffic in the
network offer interesting scenarios to investigate. Some other special circumstances
are explored in the sections that follow.
7.2.1 Effects of Two-Sided Deployment
Throughout the experiments in this analysis it is assumed that only one end of the
communication performs the energy-saving algorithm, which alternates the WNIC
between idle and sleep states. It would theoretically be possible to allow both nodes
to perform the same action, though it is necessary to ensure the on periods occur at
roughly the same time. Synchronizing the two nodes, in practice, is a difficult prob-
lem. In its present form the side with the power-saving cycle assumes the other end is
a constantly awake access point or node that will retry packets several times. Without
synchronization it is possible for both sides to miss the window of opportunity when
the WNIC is ready to receive on the opposite end.
Although synchronization is a difficult problem, it may not require much accuracy
70

if two wireless nodes exist in different networks. In this case there will be a constantly
awake node or access point, which retires the transmission of packets one hop away
from each communicating entity. Some synchronization would be necessary so when
a card on one end turns on and sends out a burst of packets the other end is not
about to turn off, further delaying the already late packets. Predicting the effects
of the wide area delay and degree of synchronization accuracy is extremely complex
making it difficult to surmise if such a design would even be possible.
7.2.2 Effect of Multiple Users
One simplifying assumption of this analysis is that the VoIP call between two nodes is
the only source of traffic in the wireless network. In a real-world implementation this
would usually not be the case and the call would compete with other voice and data
traffic for use of the medium introducing further delays. When considering multiple
network nodes, reducing the amount of bandwidth required for a call now becomes
a concern. There may also be an opportunity to reduce power consumption and
contention by offsetting the energy cycles of different conversations so that one call is
sending a burst of packets when the other call has two sleeping nodes and vice versa.
7.2.3 Providing QoS at the MAC Layer
Minimizing the delay and loss caused by the operation of the 802.11 MAC layer as-
sists in lessening the magnitude of these same two parameters which incur penalties
from energy saving techniques. While the retries are a welcome feature, there are
other parameters that may benefit from optimization for QoS. Some recent research
71

investigates the possibility of a distributed scheduling algorithm that fairly allocates
bandwidth at the 802.11 MAC layer based on assigned weights [50]. These modifica-
tions could potentially enhance the results of this analysis especially if deployed in a
more active network.
72

References
[1] “The e-model, a computational model for use in transmission planning,” Tech-
nical Recommendation G.107, International Telecommunication Union, March
2003.
[2] R. Kravents and P. Krishnan, “Power management techniques for mobile com-
munication,” in ACM MOBICOM, (Dallas, Texas), pp. 157–168, 1998.
[3] “Cisco wireless ip phone 7920.” Datasheet Available Onine, February 2004.
http://www.cisco.com/.
[4] C. K. Toh, Ad Hoc Mobile Wireless Networks: Protocols and Systems. Upper
Sadle River, NJ: Prentice Hall PTR, 2002.
[5] M. Ilyas, ed., The Handbook of Ad Hoc Wireless Networks. The Electrical Engi-
neering Handbook Series, CRC Press, 2003.
[6] C. E. Jones, K. M. Sivalingam, P. Agrawal, and J. C. Chen, “A survey of energy
efficient network protocols for wireless networks,” Wireless Networks, vol. 7,
pp. 343–358, 2000.
73

[7] R. Min and A. Chandrakasan, “Energy-efficient communication for ad-hoc wire-
less sensor networks,” in 35th Asilomar Conference on Signals, Systems, and
Computers, pp. 139–143, November 2001.
[8] G. Coulouris, J. Dollimore, and T. Kindberg, Distributed Systems: Concepts and
Design. Essex, England: Pearson Education, Ltd., third ed., 2001.
[9] W. Ye, J. Heidemann, and D. Estrin, “An energy-efficient mac protocol for wire-
less sensor networks,” in IEEE INFOCOM, pp. 1567–1576, 2002.
[10] E. Shih, S.-H. Cho, N. Ickes, R. Min, A. Sinha, A. Wang, and A. Chandrakasan,
“Physical layer driven protocol and algorithm design for energy-efficient wireless
sensor networks,” in ACM SIGMOBILE, (Rome, Italy), pp. 272–286, July 2001.
[11] S. Singh and C. Raghavendra, “Pamas - power aware multi-access protocol with
signalling for ad hoc networks,” ACM SIGCOMM Computer Communication
Review, vol. 28, no. 3, pp. 5–26, 1998.
[12] “Mobile ad-hoc networks (manet),” June 2003.
http://www.ietf.org/html.charters/manet-charter.html.
[13] J. Heidemann, N. Bulusu, J. Elson, C. Intanagonwiwat, K. chan Lan, Y. Xu,
W. Ye, D. Estrin, and R. Govindan, “Effects of detail in wireless network sim-
ulation.” Submitted to SCS Communication Networks and Distributed Systems
Modeling and Simulation Conference, September 2000.
[14] J.-H. Chang and L. Tassiulas, “Energy conserving routing in wireless ad-hoc
networks,” in IEEE Infocom, pp. 22–31, 2000.
74

[15] R. C. Shah and J. M. Rabaey, “Energy aware routing for low energy ad hoc sen-
sor networks,” in IEEE Wireless Communications and Networking Conference,
(Orlando, FL), pp. 350–355, March 2002.
[16] A. Kaminsky and H.-P. Bischof, “New architectures, protocols, and middleware
for ad hoc collaborative computing,” in Middleware 2003 Workshop on Mid-
dleware for Pervasive and Ad Hoc Computing, (Rio de Janeiro, Brazil), June
2003.
[17] C.-Y. Wan, A. T. Campbell, and L. Krishnamurthy, “Psfq: A reliable transport
protocol for wireless sensor networks,” in First ACM International Workshop
on Wireless Sensor Networks and Applications, (Atlanta, Georgia), September
2002.
[18] J. R. Lorch and A. J. Smith, “Software strategies for portable computer energy
management,” IEEE Personal Communications, pp. 60–73, June 1998.
[19] Y. Xu, J. Heidemann, and D. Estrin, “Adaptive energy-conserving routing for
multihop ad hoc networks,” Research Report 527, USC/Information Sciences
Institute, October 2000.
[20] A. Vahdat, A. Lebeck, and C. S. Ellis, “Every joule is precious: The case for
revisiting operating system design for energy efficiency,” in 9th ACM SIGOPS
European Workshop, (Kolding, Denmark), September 2000.
[21] K. Romer, O. Kasten, and F. Mattern, “Middleware challenges for wireless sensor
networks,” Mobile Computing and Communications Review, vol. 6, no. 2, 2002.
75

[22] S. Chandra and A. Vahdat, “Application-specific network management for
energy-aware streaming of popular multimedia formats,” in USENIX Annual
Technical Conference, June 2002.
[23] J. H. Saltzer, D. P. Reed, and D. D. Clark, “End-to-end arguments in system de-
sign,” ACM Transactions on Computer Systems, vol. 2, pp. 227–288, November
1984.
[24] R. Zheng and R. Kravets, “On-demand power management for ad hoc networks,”
in IEEE Infocom 2003, 2003.
[25] C. Liu and E. Modiano, “On the interaction between layered protocols: the case
of window flow control and arq,” in 2002 Conference on Information Sciences
and Systems, (Princeton University, New Jersey), March 2002.
[26] I. F. Akyildiz, W. Su, Y. Sankarasubramaniam, and E. Cayirci, “Wireless sensor
networks: A survey,” Computer Networks, vol. 38, pp. 393–422, 2002.
[27] K. A. Hawick and H. A. James, “Middleware for wireless sensors and robots,”
Technical Report DHCP-112, University of Wales, Bangor, North Wales, August
2002.
[28] B. Chen, K. Jamieson, H. Balakrishnan, and R. Morris, “Span: An energy-
efficient coordination algorithm for topology maintenance in ad hoc wireless net-
works,” in ACM SIGMOBILE, (Rome, Italy), pp. 85–96, 2001.
[29] L. Dang, C. Jennings, and D. Kelly, Pratical VoIP Using VOCAL. Sebastopol,
CA: O’Reilly & Associates, Inc., 2002.
76

[30] U. Varshney, A. Snow, M. McGivern, and C. Howard, “Voice over ip,” COM-
MUNICATIONS OF THE ACM, vol. 45, pp. 89–96, January 2002.
[31] A.-C. Pang, P. Lin, and Y.-B. Lin, “Modeling mis-routing calls due to user
mobility in wireless voip,” IEEE Communications Letters, vol. 4, no. 12, pp. 394–
397, 2000.
[32] W. C. Hardy, VoIP Service Quality: Measuring and Evaluating Packet-Switched
Voice. New York, NY: McGraw-Hill, 2003.
[33] D. Collins, Carrier Grade Voice Over IP. New York, NY: McGraw-Hill, 2003.
[34] J.-S. Han, S.-J. Ahn, and J.-W. Chung, “Study of delay patterns of weighted
voice traffic of end-to-end users on the voip network,” International Journal of
Network Management, vol. 12, pp. 271–280, 2002.
[35] A. P. Markopoulou, F. A. Tobagi, and M. J. Karam, “Assessment of voip quality
over internet backbones,” in Infocom, 2002.
[36] “Methods for subjective determination of transmission quality,” Technical Rec-
ommendation P.800, International Telecommunication Union, August 1996.
[37] “Mobile quality survey,” technical report, Psytechnics, Ipswich, United King-
dom, September 2003. Available Online: http://www.psytechnics.com.
[38] J. F. Kurose and K. W. Ross, Computer Networking: A Top-Down Approach
Featuring the Internet. New York, NY: Addison Wesley, second ed., 2003.
77

[39] E. Shih, P. Bahl, and M. J. Sinclair, “Wake on wireless: An event driven energy
saving strategy for battery operated devices,” in MOBICOM, September 2002.
[40] “Playout delay enhancements for voice over ip.” Available Online, October 2003.
http://www.cisco.com/.
[41] A. Servetti and J. C. D. Martin, “Adaptive interactive speech transmission over
802.11 wirelss lans,” in Proceedings of the IEEE Internation Workshop on DSP
in Mobile and Vehicular Systems, (Nagoya, Japan), April 2003.
[42] L. M. Feeney and M. Nilsson, “Investigating the energy consumption of a wireless
network interface in an ad hoc networking environment,” in IEEE INFOCOM,
pp. 1548–1557, 2001.
[43] M. Stemm, P. Gauthier, D. Harada, and R. H. Katz, “Reducing power con-
sumption of network interfaces in hand-held devices,” in Proceedings of the Third
Workshop on Mobile Multimedia Communications (MoMuC-3), (Princeton, NJ),
1996.
[44] “Voice over ip - per call bandwidth consumption,” June 2003.
[45] K. Jamieson, “Implementation of a power-saving protocol for ad hoc wireless
networks,” Master’s thesis, Massachusetts Institute of Technology, 2002.
[46] A. Sinha and A. P. Chandrakasan, “Operating system and algorithmic tech-
niques for energy scalable wireless sensor networks,” in Proceedings of the 2nd
International Conference on Mobile Data Management, January 2001.
78

[47] “Transmission impairments due to speech processing,” Technical Recommenda-
tion G.113, International Telecommunication Union, February 2001.
[48] M. S. Gast, 802.11 Wireless Networks: The Definitive Guide. Sebastopol, CA:
O’Reilly & Associates, Inc., 2002.
[49] “Transmission impairments due to speech processing,” Technical Recommenda-
tion G.113, International Telecommunication Union, May 2002.
[50] N. H. Vaidya, P. Bahl, and S. Gupta, “Distributed fair scheduling in a wireless
lan,” in Mobile Computing and Networking, pp. 167–178, 2000.
79