an age-structured model for childhood obesity
TRANSCRIPT

This article was downloaded by: [University of Southern Queensland]On: 02 October 2014, At: 23:50Publisher: RoutledgeInforma Ltd Registered in England and Wales Registered Number: 1072954 Registered office: Mortimer House,37-41 Mortimer Street, London W1T 3JH, UK
Mathematical Population Studies: An InternationalJournal of Mathematical DemographyPublication details, including instructions for authors and subscription information:http://www.tandfonline.com/loi/gmps20
An Age-Structured Model for Childhood ObesityGILBERTO GONZÁLEZ-PARRA a , LUCAS JÓDAR b , FRANCISCO JOSÉ SANTONJA b & RAFAELJACINTO VILLANUEVA ba Departamento de Cálculo , Universidad de los Andes , Mérida, Venezuelab Instituto Universitario de Matemática Multidisciplinar , Universidad Politécnica deValencia , SpainPublished online: 27 Jan 2010.
To cite this article: GILBERTO GONZÁLEZ-PARRA , LUCAS JÓDAR , FRANCISCO JOSÉ SANTONJA & RAFAEL JACINTO VILLANUEVA(2010) An Age-Structured Model for Childhood Obesity, Mathematical Population Studies: An International Journal ofMathematical Demography, 17:1, 1-11, DOI: 10.1080/07481180903467218
To link to this article: http://dx.doi.org/10.1080/07481180903467218
PLEASE SCROLL DOWN FOR ARTICLE
Taylor & Francis makes every effort to ensure the accuracy of all the information (the “Content”) containedin the publications on our platform. However, Taylor & Francis, our agents, and our licensors make norepresentations or warranties whatsoever as to the accuracy, completeness, or suitability for any purpose of theContent. Any opinions and views expressed in this publication are the opinions and views of the authors, andare not the views of or endorsed by Taylor & Francis. The accuracy of the Content should not be relied upon andshould be independently verified with primary sources of information. Taylor and Francis shall not be liable forany losses, actions, claims, proceedings, demands, costs, expenses, damages, and other liabilities whatsoeveror howsoever caused arising directly or indirectly in connection with, in relation to or arising out of the use ofthe Content.
This article may be used for research, teaching, and private study purposes. Any substantial or systematicreproduction, redistribution, reselling, loan, sub-licensing, systematic supply, or distribution in anyform to anyone is expressly forbidden. Terms & Conditions of access and use can be found at http://www.tandfonline.com/page/terms-and-conditions

Mathematical Population Studies, 17:1–11, 2010Copyright © Taylor & Francis Group, LLCISSN: 0889-8480 print/1547-724X onlineDOI: 10.1080/07481180903467218
An Age-Structured Model for Childhood Obesity
Gilberto González-ParraDepartamento de Cálculo,Universidad de los Andes, Mérida, Venezuela
Lucas JódarFrancisco José SantonjaRafael Jacinto VillanuevaInstituto Universitario de Matemática Multidisciplinar,Universidad Politécnica de Valencia, Spain
An age-structured model for childhood obesity at population level is fitted toempirical data in order to predict the proportion of overweighted and obesechildren in the 6–8 and 9–12 year old classes in the region of Valencia, Spain.
Keywords: age-structured population; childhood disease; obesity epidemic
1. INTRODUCTION
Obesity has become a serious health concern, with an increasingcost due to related diabetes, heart attacks, blindness, renalfailures, respiratory difficulties, arthritis, infertility, and psychologicaldisorders (Centers for Disease Control and Prevention [CDC], 2007;Ebbeling, Pawlak, and Ludwig, 2002).
Infant and juvenile obesity is a powerful predictor of adult ageobesity. We propose an age-structured model for obesity in the 6–8 and9–12 year old classes in the region of Valencia, Spain. We study obesityin its social dimension of transmission of unhealthy habits. Jódar,Santonja, and González-Parra (2008) showed that obesity is associatedwith eating habits, in particular consumption of bakery snacks, friedmeals, and soda drinks, and that habits spread by social contact(Evangelista, Ortiz, Rios-Soto, and Urdapilleta, 2004; Christakis and
Address correspondence to Gilberto González-Parra, Departamento de Cálculo,Fac. Ingeniería, Universidad de los Andes, Mérida 5101, Venezuela. E-mail:[email protected]
1
Dow
nloa
ded
by [
Uni
vers
ity o
f So
uthe
rn Q
ueen
slan
d] a
t 23:
50 0
2 O
ctob
er 2
014
2 G. González-Parra et al.
Fowler, 2007). Wang (2001) and Wang and Beydoun (2007) associatedobesity with socioeconomic status. Jódar et al. (2008) modelled thedynamics of children between 3 and 5 years old.
We will fit the age-structured model to the empirical data providedby the Health Institution of the Government of Valencia. In thisregion, a health survey is conducted every five years. We completedthe data with several other sources taken in Jódar et al. (2008).
In Section 2, a data analysis of the Encuesta de Salud de laComunidad Valenciana 2000–2001 (Health Survey of the Region ofValencia 2000–2001; ConselleriaSanitat, 2007) is used to identifythe prevalent factors of obesity for the 6–12 year old age class.This statistical analysis allows us to divide the 6–12 year old classinto 6–8 and 9–12 classes. In Section 3, we develop a demographicmodel using data from the Instituto Valenciano de Estadística (IVE,2007). The age-structured model is fitted to the available data. Somepossible scenarios in the next few years of overweighted and obesesubpopulations are highlighted by simulations and serve as guidelinesfor prophylaxis.
2. DATA ANALYSIS
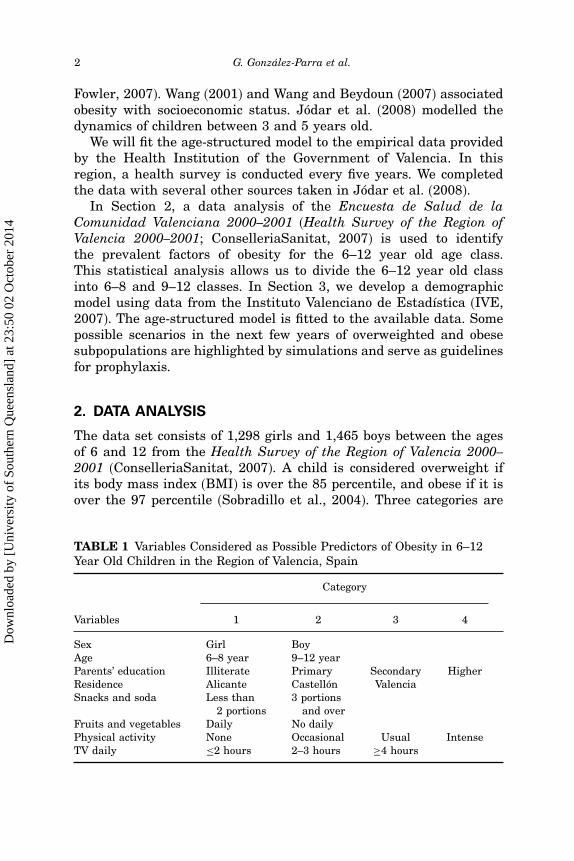
The data set consists of 1,298 girls and 1,465 boys between the agesof 6 and 12 from the Health Survey of the Region of Valencia 2000–2001 (ConselleriaSanitat, 2007). A child is considered overweight ifits body mass index (BMI) is over the 85 percentile, and obese if it isover the 97 percentile (Sobradillo et al., 2004). Three categories are
TABLE 1 Variables Considered as Possible Predictors of Obesity in 6–12Year Old Children in the Region of Valencia, Spain
Category
Variables 1 2 3 4
Sex Girl BoyAge 6–8 year 9–12 yearParents’ education Illiterate Primary Secondary HigherResidence Alicante Castellón ValenciaSnacks and soda Less than 3 portions
2 portions and overFruits and vegetables Daily No dailyPhysical activity None Occasional Usual IntenseTV daily ≤2 hours 2–3 hours ≥4 hours
Dow
nloa
ded
by [
Uni
vers
ity o
f So
uthe
rn Q
ueen
slan
d] a
t 23:
50 0
2 O
ctob
er 2
014

Age-Structured Model for Childhood Obesity 3
TABLE 2 Nonparametric �2 Tests Showing Lack of Independence withObesity in Children Between 6 and 12 Years Old in the Region of Valencia,Spain
Variable p-value �2 Degrees of freedom
Sex 0�066 5�44 2Age (6–8 and 9–12) 0.000 65�34 2Parents’ education 0.004 19�42 6Residence 0.025 11�16 4Snacks and soda drinks 0.009 9�33 2Fruits and vegetables 0.045 6�22 2Physical activity 0.007 17�77 6TV daily 0.113 10�30 6
defined with respect to BMI: normal weight, overweight, and obese.The possible predictors of overweight and obesity in children between6 and 12 years old are shown in Table 1.
The �2 tests shown in Table 2 show that obesity in children of theregion of Valencia is significantly not independent of age, educationof their parents, consumption of snacks and soda drinks, and physicalactivity. The incidence of obesity differs in the age groups 6–8 and9–12 years; this is why we model these two groups separately. Theresults are consistent with the statistics obtained in Christakis andFowler (2007), Evangelista et al. (2004), and Jódar et al. (2008), whereobesity is considered to be a health concern caused by unhealthyeating habits which themselves are transmitted by social link.
3. MODEL
3.1. Demography
The first part of the age-structured model (Brauer and Castillo-Chavez, 2001; Diekmann and Heesterbek, 2005; Hethcote, 2000;Thieme, 2003) consists of the balance equation (Thieme, 2003) fora group G1 of children between 6 and 8 years, and a group G2 ofchildren between 9 and 12. The demographic model is given by thelinear differential system (Hethcote, 2000):{
P ′1�t� = �Ptotal�t�− c1P1�t�− d1P1�t��
P ′2�t� = c1P1�t�− c2P2�t�− d2P2�t��
(1)
where Ptotal�t� is the total population size in the 6–12 year old class,Pi�t� the population size of the group Gi, � the recruitment rate,
Dow
nloa
ded
by [
Uni
vers
ity o
f So
uthe
rn Q
ueen
slan
d] a
t 23:
50 0
2 O
ctob
er 2
014

4 G. González-Parra et al.
and di and ci are respectively the death and transfer rates betweenthe successive age groups. The data show that the death rates arealmost zero in these age classes (IVE, 2007); we assume them null.In addition, they support the assumption that the inflow population �is balanced approximately by the outflow of the 6–12 age group (IVE,2007). Thus, we assume that the total number of children is constant(Anderson and May, 1991; Brauer and Castillo-Chavez, 2001). Eq. (1)simplifies to: {
�Ptotal − c1P1 = 0�
c1P1 − c2P2 = 0�(2)
As Ptotal = P1 + P2, normalizing the total number of children to unity,one gets
n1 + n2 = 1� (3)
where ni�t� is the proportion of children in the group Gi. Eq. (2)simplifies to: {
� − c1n1 = 0�
c1n1 − c2n2 = 0�(4)
Using Ptotal = 1, one gets 1 = ∫ 136 ��a� t�da, where ��a� t� denotes the
density of individuals of age a (measured in years) at time t. As �is taken constant one obtains � = 1
7year−1, then the inflow rate is
� = 17year
−1. Using Eq. (4) and
n1 =∫ 9
6�da = 3
7(5)
the parameter values of Eq. (2) and (4) are:
c1 =13� c2 =
14� n1 =
37� n2 =
47� (6)
The transfer rate ci is inversely proportional to the length of the ageclass Gi, the inflow population rate � is inversely proportional to thelength of the 6–12 year old class. All these properties come from theassumptions of constant population and null death rate. From IVE(2007), the demographic data for each age class from 1990 to 2006are available. The inflow population is approximately balanced by theoutflow.
Dow
nloa
ded
by [
Uni
vers
ity o
f So
uthe
rn Q
ueen
slan
d] a
t 23:
50 0
2 O
ctob
er 2
014
Age-Structured Model for Childhood Obesity 5
3.2. Age-Structured Obesity Model
For each age class, the population is divided into the proportion Ni�t�of children with normal weight, for each age class i; the proportionLi�t� of children with unhealthy habits but still normal weight; theproportion Si�t� of overweight children; the proportion Oi�t� of obesechildren, the proportion DSi
�t� of overweight children on diet; and theproportion DOi
�t� of obese children on diet. Ni�t�, Li�t�, Si�t�, Oi�t�,DSi
�t�, and DOi�t�, i = 1�2, correspond to proportions of normal weight,
latent, overweight, obese, overweight on diet and obese on diet of eachage class Gi, i = 1�2. By definition,
Ni�t�� Li�t�� Si�t��Oi�t��DSi�t��DOi
�t� ∈ �0�1� i = 1�2� (7)
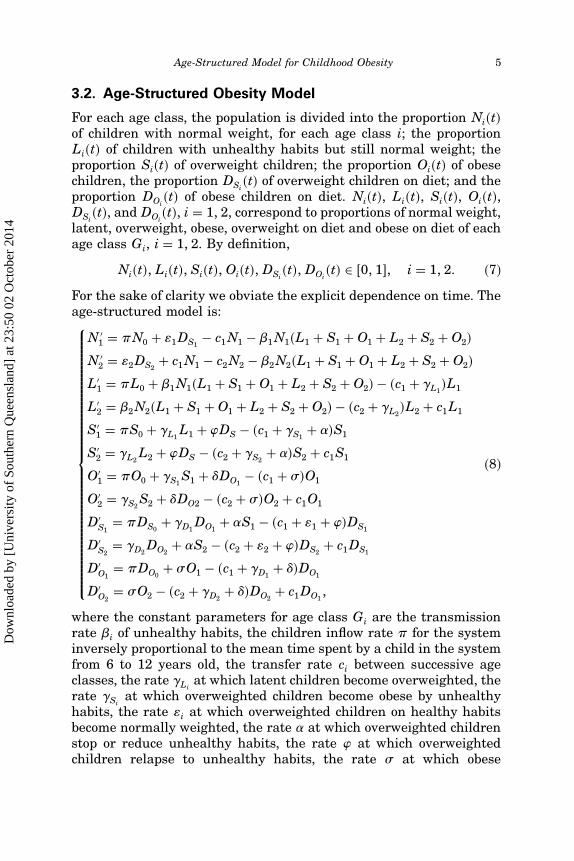
For the sake of clarity we obviate the explicit dependence on time. Theage-structured model is:
N ′1 = �N0 + 1DS1
− c1N1 − �1N1�L1 + S1 +O1 + L2 + S2 +O2�
N ′2 = 2DS2
+ c1N1 − c2N2 − �2N2�L1 + S1 +O1 + L2 + S2 +O2�
L′1 = �L0 + �1N1�L1 + S1 +O1 + L2 + S2 +O2�− �c1 + �L1
�L1
L′2 = �2N2�L1 + S1 +O1 + L2 + S2 +O2�− �c2 + �L2
�L2 + c1L1
S ′1 = �S0 + �L1
L1 + DS − �c1 + �S1+ ��S1
S ′2 = �L2
L2 + DS − �c2 + �S2+ ��S2 + c1S1
O′1 = �O0 + �S1
S1 + �DO1− �c1 + ��O1
O′2 = �S2
S2 + �DO2 − �c2 + ��O2 + c1O1
D′S1
= �DS0+ �D1
DO1+ �S1 − �c1 + 1 + �DS1
D′S2
= �D2DO2
+ �S2 − �c2 + 2 + �DS2+ c1DS1
D′O1
= �DO0+ �O1 − �c1 + �D1
+ ��DO1
D′O2
= �O2 − �c2 + �D2+ ��DO2
+ c1DO1�
(8)
where the constant parameters for age class Gi are the transmissionrate �i of unhealthy habits, the children inflow rate � for the systeminversely proportional to the mean time spent by a child in the systemfrom 6 to 12 years old, the transfer rate ci between successive ageclasses, the rate �Li
at which latent children become overweighted, therate �Si
at which overweighted children become obese by unhealthyhabits, the rate i at which overweighted children on healthy habitsbecome normally weighted, the rate � at which overweighted childrenstop or reduce unhealthy habits, the rate at which overweightedchildren relapse to unhealthy habits, the rate � at which obese
Dow
nloa
ded
by [
Uni
vers
ity o
f So
uthe
rn Q
ueen
slan
d] a
t 23:
50 0
2 O
ctob
er 2
014
6 G. González-Parra et al.
children stop or reduce unhealthy habits, the rate � at which obesechildren relapse to unhealthy habits, and the rate �Di at whichobese children with healthy habits become overweighted with healthyhabits. The initial distribution �N0� L0� S0�O0�DS0�DO0� comes fromthe previous age group (5 year old) entering into the system andassumed constant. The values of the parameters �, � , , and � arerelated to the diet rates of the parents, and we assume that theseparameters are independent of age.
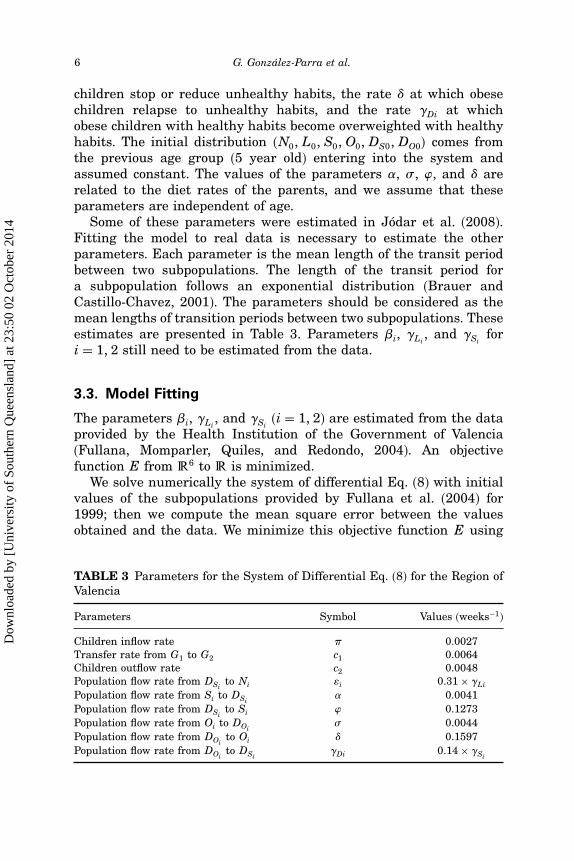
Some of these parameters were estimated in Jódar et al. (2008).Fitting the model to real data is necessary to estimate the otherparameters. Each parameter is the mean length of the transit periodbetween two subpopulations. The length of the transit period fora subpopulation follows an exponential distribution (Brauer andCastillo-Chavez, 2001). The parameters should be considered as themean lengths of transition periods between two subpopulations. Theseestimates are presented in Table 3. Parameters �i, �Li
, and �Sifor
i = 1�2 still need to be estimated from the data.
3.3. Model Fitting
The parameters �i, �Li, and �Si
(i = 1�2) are estimated from the dataprovided by the Health Institution of the Government of Valencia(Fullana, Momparler, Quiles, and Redondo, 2004). An objectivefunction E from �6 to � is minimized.
We solve numerically the system of differential Eq. (8) with initialvalues of the subpopulations provided by Fullana et al. (2004) for1999; then we compute the mean square error between the valuesobtained and the data. We minimize this objective function E using
TABLE 3 Parameters for the System of Differential Eq. (8) for the Region ofValencia
Parameters Symbol Values (weeks−1)
Children inflow rate � 0.0027Transfer rate from G1 to G2 c1 0.0064Children outflow rate c2 0.0048Population flow rate from DSi
to Ni i 0�31× �Li
Population flow rate from Si to DSi� 0.0041
Population flow rate from DSito Si 0.1273
Population flow rate from Oi to DOi� 0.0044
Population flow rate from DOito Oi � 0.1597
Population flow rate from DOito DSi
�Di 0�14× �Si
Dow
nloa
ded
by [
Uni
vers
ity o
f So
uthe
rn Q
ueen
slan
d] a
t 23:
50 0
2 O
ctob
er 2
014

Age-Structured Model for Childhood Obesity 7
the Nelder–Mead algorithm (Nelder and Mead, 1964), which requiresno computation of any derivative or gradient. Initial conditionsare obtained from data provided by Fullana et al. (2004) anddata from the Health Survey of the Region of Valencia 2000–2001(ConselleriaSanitat, 2007). The estimates of the unknown parametersvalues resulting from the minimization process gives �1 = 0�016,�2 = 0�0008, �L1
= 0�013, �L2= 0�0011, �S1
= 0�003, and �S2= 0�0002.
These values give the global minimum of the objective function E.Though the two age classes G1 and G2 have the same increasing
trend, the estimated transmission parameter value �2 correspondingto age class G2 is smaller than �1 of age class G1. It is similar withthe other parameters. This fact means that once the children of classG2 are overweighted and obese, it is easier to maintain the sameincreasing trend of overweight and obesity of the previous age classG1.
3.4. Scenarios
Simulations illustrate some possible scenarios in the next few years ofoverweighted and obese subpopulations among the 6–8 and 9–12 yearold children in the region of Valencia, Spain. First, a simulation from
FIGURE 1 Variation of the different subpopulations of G1 and G2 in theperiod 1999–2010.
Dow
nloa
ded
by [
Uni
vers
ity o
f So
uthe
rn Q
ueen
slan
d] a
t 23:
50 0
2 O
ctob
er 2
014

8 G. González-Parra et al.
1999 to 2010 uses the model with the estimated parameter valuesshown in Table 3 and obtained from the model fitting. As shownin Figure 1, obese and overweighted subpopulations in G1 and G2
present an increasing trend in concordance with the one observed inother countries (Bes-Rastrollo et al., 2006; Wang and Lobstein, 2006).The subpopulation of normal weight decreases and the percentage ofchildren on diets remains very low.
In addition, to analyze the prophylaxis of obesity, the parameters�1� �L1
, and �S1are reduced by 50%. The simulation of this case
is shown in Figure 2, where the population size of normal weightincreases and the population size of obese children decreases. A secondcase is shown in Figure 3, where the parameters �2� �L2
, and �S2
corresponding to G2 are reduced by 50%, in this case the increasingtrend of overweight and obesity varies only slightly. From these facts,reducing the parameters �1� �L1
, and �S1in G1 is more efficient
than reducing their counterparts parameters �2� �L2, and �S2
in G2.Moreover, the control parameters of diets �i and �i (i = 1�2) weremodified, but their effects on overweighted and obese populations are
FIGURE 2 Variation of the different subpopulations of G1 and G2 when�1� �L1
and �S1related to obesity growth of G1 are reduced by 50%.
Dow
nloa
ded
by [
Uni
vers
ity o
f So
uthe
rn Q
ueen
slan
d] a
t 23:
50 0
2 O
ctob
er 2
014

Age-Structured Model for Childhood Obesity 9
FIGURE 3 Variation of the different subpopulations of G1 and G2 when�2� �L2
and �S2related to obesity growth of G2 are reduced by 50%.
very small. Therefore, reducing obesity in children’s early years ismandatory.
4. CONCLUSION
Our age-structured model took advantage of a statistical study toinclude the fact that obesity among 6–12 year old children of theregion of Valencia, Spain, depends on the age and education oftheir parents, consumption of snacks and soda drinks, and physicalactivity. Then incidence of obesity is different in classes 6–8 and 9–12;therefore, the model distinguishes these two groups.
The model helps understand and predict the spread of obesity forthese age classes. The simulations showed an increasing number ofoverweighted and obese in the next few years. This tendency oughtto be modified by social educative campaigns. If two consecutive ageclasses G1 and G2 have the same increasing trend of obesity, childrenof group G2 can have healthier habits than those of G1 and maintainthe same increasing structural trend. Failing to prevent obesity inchildren´s early years makes it more difficult to reverse this trend.
Dow
nloa
ded
by [
Uni
vers
ity o
f So
uthe
rn Q
ueen
slan
d] a
t 23:
50 0
2 O
ctob
er 2
014

10 G. González-Parra et al.
ACKNOWLEDGMENTS
The authors are grateful to the anonymous reviewers. Weacknowledge the collaboration of the Oficina de Plan de Salud of theConselleria de Sanitat of the Comunidad Valenciana.
REFERENCES
Anderson, R. and May, R. (1991). Infectious Diseases of Humans. Oxford: ClarendonPress.
Bes-Rastrollo, M., Sánchez-Villegas, A., Gómez-Gracia, E., Martínez, J. A.,Pajares, R. M., and Martínez-González, M. (2006). Predictors of weight gain in aMediterranean cohort: The seguimiento Universidad de Navarra study. AmericanJournal of Clinical Nutrition, 83: 362–370.
Brauer, F. and Castillo-Chavez, C. (2001). Mathematical Models in Population Biologyand Epidemiology. New York: Springer-Verlag.
Castillo-Chavez, C., Hethcote, H., Andreases, V., Levin, S., and Liu, W. (1989).Epidemiological models with age structure, proportionate mixing, and cross-immunity. Journal of Mathematical Biology, 27: 233—258.
Centers for Disease Control and Prevention (CDC). (2007). Overweight and Obesity:Health Consequences. Retrieved February 5, 2007, from http://www.cdc.gov/nccdphp/dnpa/ obesity/consequences.htm
Christakis, N. and Fowler, J. (2007). The spread of obesity in a large social networkover 32 years. The New England Journal of Medicine, 357: 370–379.
ConselleriaSanitat (2007). Encuesta de salud de la comunidad Valenciana 2000–2001[Health survey of the region of Valencia 2000–2001]. Retrieved February 5, 2007,from http://193.145.164.73/publicaciones/documentos/V.4857.2002.pdf
DeGroot, M. (1988). Probabilidad y Estadistica [Probability and Statistics]. Mexico City,Mexico: Addison-Wesley.
Diekmann, O. and Heesterbek, J. A. P. (2005). Mathematical Epidemiology of InfectiousDiseases: Model Building, Analysis and Interpretation. West Sussex, UK: JohnWiley & Sons.
Ebbeling, C., Pawlak, D., and Ludwig, D. (2002). Childhood obesity: Public-health crisis,common sense cure. The Lancet, 360(9331): 473–482.
Evangelista, A., Ortiz, A., Rios-Soto, K., and Urdapilleta, A. (2004). USA the FastFood Nation: Obesity as an Epidemic. Los Alamos, NM: Los Alamos NationalLaboratory. Retrieved February 5, 2007, from http://math.lanl.gov/SummerPrograms/Reports2004/ev_or_ri_ur.pdf
Fullana, A., Momparler, P., Quiles, J., and Redondo, M. (2004). Situación actualde la obesidad en la infancia y en la adolescencia y estrategias de prevención2005–2009 [Present situation of infant and adolescent obesity and preventionstrategies 2005–2009]. Retrieved February 5, 2007, from www.sp.san.gva.es/DgspPortal/docs/Informe_Obesidad.pdf
Hethcote, H. (2000). The mathematics of infectious diseases. SIAM Review, 42: 599–653.IVE. (2007). Instituto Valenciano de Estadística. Retrieved February 5, 2007, from
http://www.ive.esJódar, L., Santonja, F., and González-Parra, G. (2008). Modeling dynamics of infant
obesity in the region of Valencia, Spain. Computers & Mathematics withApplications, 56: 679–689.
Dow
nloa
ded
by [
Uni
vers
ity o
f So
uthe
rn Q
ueen
slan
d] a
t 23:
50 0
2 O
ctob
er 2
014

Age-Structured Model for Childhood Obesity 11
Moreno, L., Sarría, A., Fleta, J., Rodríguez, G., Pérez, J., and Bueno, M. (2001).Sociodemographic factors and trends on overweight prevalence in children andadolescents in Aragón (Spain) from 1985 to 1995. Journal of Clinical Epidemiology,54: 921–927.
Nelder, J. and Mead, R. (1964). A simplex method for function minimization. TheComputer Journal, 7: 308–313.
Noymer, A. (2001). The transmission and persistence of “urban legends”: Sociologicalapplication of age-structured epidemic models. Journal of Mathematical Sociology,25: 299–323.
Ogden, C., Flegal, K., Carroll, M., and Johnson, C. (2002). Prevalence and trendsin overweight among us children and adolescents, 1999–2000. JAMA, 288:1728–1732.
Sobradillo, B., Aguirre, A., Aresti, U., Bilbao, A., Fernández-Ramos, C., Lizárraga, A.,et al. (2004). Curvas y tablas de crecimiento: Estudio longitudinal y transversal[Growth curves and tables: Longitudinal and transversal study]. Retrieved May 24,2007, from http://www.aepap.org/pdf/f_orbegozo_04.pdf
Thieme, H. (2003). Mathematics in Population Biology. Princeton, NJ: PrincetonUniversity Press.
Wang, Y. (2001). Cross-national comparison of childhood obesity: The epidemic and therelationships between obesity and socioeconomic status. International Journal ofEpidemiology, 30: 1129–1136.
Wang, Y. and Beydoun, M.A. (2007). The obesity epidemic in the United States – gender,age, socioeconomic, racial/ethnic, and geographic characteristics: A systematicreview and meta-regression analysis. Epidemiological Reviews, 29: 6–28.
Wang, Y. and Lobstein, T. (2006). Worldwide trends in childhood overweight and obesity.International Journal of Pediatric Obesity, 1: 11–25.
Dow
nloa
ded
by [
Uni
vers
ity o
f So
uthe
rn Q
ueen
slan
d] a
t 23:
50 0
2 O
ctob
er 2
014