an abstract of the thesis of - oregon state...
TRANSCRIPT


AN ABSTRACT OF THE THESIS OF Preston Baxter for the degree of Master of Science in Civil Engineering and Wood Science presented on February 9, 2004. Title: Comparison of Screening, Evaluation, Rehabilitation and Design Provisions for Wood-Framed Structures Abstract approved: Thomas H. Miller Rakesh Gupta
Many publications, documents, codes and guidelines exist related to the
seismic evaluation and rehabilitation design of existing buildings. This report
discusses the assumptions and methods employed for investigation of two
wood structures using four references: FEMA 154, FEMA 356, ASCE/SEI 31,
and 1997 UBC.
The screening performed using FEMA 154 demonstrates the importance of
conducting pre-inspection investigation of existing documentation such as
construction drawings. In the absence of this information, the screening
indicated that the structures would not require additional evaluation. A plans
check revealed a deficiency in the structural systems, that if included in the
evaluation, would mark them for additional analysis.
This investigation examines the demand-to-capacity ratios for shear walls and
roof diaphragms in the two wood-framed structures. It was expected that

requirements for the design of new structures in the 1997 UBC would be the
most conservative of these references. It was also expected that the
rehabilitation design provisions of FEMA 356 would be more conservative
than the existing building evaluation provisions in ASCE/SEI 31. The results of
this study show that the new building design provisions in the 1997 UBC are
not necessarily conservative when compared to the rehabilitation design
provisions in FEMA 356. In addition, the provisions in the design documents
FEMA 356 and the 1997 UBC are not necessarily conservative when compared
to existing building evaluation provisions in ASCE/SEI 31.
The likely cause of the unexpected results is the conservative Linear Static
Procedure and associated m factors for wood in the FEMA 356 and ASCE/SEI
31 documents. Additional research is needed to better calibrate these factors
and associated acceptance criteria to account for duration of shaking, the
number of cycles of nonlinear behavior, redundancy, etc.

© Copyright by Preston Baxter February 9, 2004
All Rights Reserved

Comparison of Screening, Evaluation, Rehabilitation and Design Provisions for Wood-Framed Structures
by Preston Baxter
A THESIS
submitted to
Oregon State University
in partial fulfillment of the requirements for the
degree of
Master of Science
Presented February 9, 2004 Commencement June 2004

Master of Science thesis of Preston Baxter presented on February 9, 2004. APPROVED: Co-Major Professor, representing Civil Engineering Co-Major Professor, representing Wood Science Head of the Department of Civil, Construction, and Environmental Engineering Head of the Department of Wood Science and Engineering Dean of the Graduate School I understand that my thesis will become part of the permanent collection of Oregon State University libraries. My signature below authorizes release of my thesis to any reader upon request.
Preston Baxter, Author

i
ACKNOWLEDGMENTS
I have many people who deserve thanks for helping make this project a
reality. My major professors, Dr. Thomas H. Miller and Dr. Rakesh Gupta,
have been supportive from the very beginning. They were always available to
help or encourage me in this effort, and have been instrumental in the
completion of the project.
Many thanks to my supervisors at CH2M Hill for allowing me the computer
resources and flexible work hours to continue working on this report. Sue
Frey, a member of the review committee, was especially supportive in offering
yearly reminders (typically at salary-setting) of the goal to complete my study
program.
My wife, Aurora, has been the most helpful in getting this project completed.
She has made many personal sacrifices to allow me the time required, and to
offer the encouragement I needed, to continue working. Without her constant
support I could not have finished this work.

ii
TABLE OF CONTENTS
Page
1 INTRODUCTION .................................................................................................... 2
2 LITERATURE REVIEW........................................................................................... 8
2.1 SCREENING DOCUMENT: FEMA 154 ...................................................... 9
2.2 REHABILITATION DOCUMENT: FEMA 356 ......................................... 12
2.3 EVALUATION DOCUMENT: ASCE/SEI 31 ........................................... 15
2.4 DESIGN DOCUMENT: 1997 UBC.............................................................. 18
2.5 PROCEDURE COMPARISONS.................................................................. 21
3 STRUCTURE DESCRIPTION............................................................................... 24
3.1 CONSTRUCTION HISTORY ...................................................................... 24
3.2 BUILDING DESCRIPTIONS ....................................................................... 24
3.3 ANALYZED AREAS .................................................................................... 27
4 ANALYSIS ASSUMPTIONS AND METHODS................................................. 30
4.1 FEMA 154 ....................................................................................................... 30
4.2 FEMA 356 ....................................................................................................... 36
4.2.1 PRIOR SEISMIC EVALUATION ....................................................... 37
4.2.2 REVIEW INITIAL CONSIDERATIONS ........................................... 37
4.2.3 SELECT REHABILITATION OBJECTIVE........................................ 38
4.2.3.1 TARGET BUILDING PERFORMANCE LEVEL..................... 39
4.2.3.2 SEISMIC HAZARD..................................................................... 44
4.2.4 OBTAIN AS-BUILT INFORMATION............................................... 56

TABLE OF CONTENTS (continued)
iii
4.2.5 SELECT REHABILITATION METHOD........................................... 57
4.2.6 SYSTEMATIC REHABILITATION ................................................... 57
4.2.7 PERFORM REHABILITATION DESIGN ......................................... 67
4.2.8 VERIFY REHABILITATION DESIGN .............................................. 82
4.3 ASCE/SEI 31.................................................................................................. 87
4.3.1 EVALUATION REQUIREMENTS .................................................... 88
4.3.2 SCREENING PHASE (TIER 1) – EXISTING STRUCTURE............ 93
4.3.3 SCREENING PHASE (TIER 1) – REHABILITATED STRUCTURE.......................................................................................................................... 99
4.3.4 EVALUATION PHASE (TIER 2) - GENERAL............................... 103
4.3.5 EVALUATION PHASE (TIER 2) – EXISTING STRUCTURE...... 103
4.3.6 EVALUATION PHASE (TIER 2) – REHABILITATED STRUCTURE................................................................................................ 104
4.3.7 DETAILED (TIER 3) EVALUATION – REHABILITATED STRUCTURE................................................................................................ 112
4.4 1997 UNIFORM BUILDING CODE ......................................................... 112
4.4.1 DESIGN BASE SHEAR...................................................................... 112
4.4.2 EARTHQUAKE LOADS ................................................................... 117
4.4.3 ALLOWABLE SHEAR ...................................................................... 119
5 RESULTS AND DISCUSSION ........................................................................... 122
5.1 DESIGN RESULTS ...................................................................................... 122
5.1.1 FEMA 154 ............................................................................................ 122

TABLE OF CONTENTS (continued)
iv
5.1.2 FEMA 356 ............................................................................................ 122
5.1.3 ASCE/SEI 31....................................................................................... 127
5.1.3.1 TIER 1 RESULTS ....................................................................... 127
5.1.3.2 TIER 2 RESULTS ....................................................................... 128
5.1.3.3 TIER 3 RESULTS ....................................................................... 130
5.1.4 1997 UBC ............................................................................................. 133
5.2 DCR COMPARISONS ................................................................................ 135
5.3 DOCUMENT USE DISCUSSION ............................................................. 141
5.3.1 FEMA 154 ............................................................................................ 141
5.3.2 FEMA 356 ............................................................................................ 143
5.3.3 ASCE/SEI 31....................................................................................... 149
5.3.4 1997 UBC ............................................................................................. 151
6 CONCLUSIONS AND RECOMMENDATIONS ............................................ 152
7 BIBLIOGRAPHY .................................................................................................. 155
APPENDICES .......................................................................................................... 159

v
LIST OF FIGURES
Figure Page
1. East Elevation of East Classrooms...................................................................... 24
2. South Elevation of East Classrooms ................................................................... 25
3. East Elevation of Gymnasium ............................................................................. 25
4. East Wall of Gymnasium and Walkway Between Gymnasium and East
Classrooms .......................................................................................................... 26
5. North Elevation of Administration Area........................................................... 26
6. West Elevation of Kindergarten Addition......................................................... 27
7. Plan View, Classroom Test Structure................................................................. 28
8. Plan View, Gymnasium Test Structure.............................................................. 28
9. Seismicity Regions in California, Idaho, Nevada, Oregon and Washington
(ATC 2002a, Figure A-2) .................................................................................... 30
10. FEMA 154 RVS Data Collection Form.............................................................. 32
11. FEMA 154 Recommended Benchmark Years (ATC 2002a, Table 2-2) ........ 35
12. Rehabilitation Process using FEMA 356 (ASCE 2000b)................................. 36
13. USGS Probabilistic Accelerations ..................................................................... 45
14. General Response Spectrum (ASCE 2000b).................................................... 48

LIST OF FIGURES (continued)
vi
15. Response Spectra................................................................................................. 50
16. Accidental Torsion .............................................................................................. 63
17. Classroom Shear Wall Element Stiffness Value “E” ...................................... 73
18. Gymnasium Shear Wall Element Stiffness Value “E” ................................... 73
19. Classroom Shear Wall Stiffness......................................................................... 74
20. Gymnasium Shear Wall Stiffness...................................................................... 74
21. Classroom Roof Diaphragm Model.................................................................. 78
22. Typical Classroom Model .................................................................................. 81
23. Typical Gymnasium Model ............................................................................... 81
24. Component Force Versus Deformation Curves (ASCE 2000b, Figure 2-3) 83
25. ASCE/SEI 31 General Provisions (ASCE 2003) .............................................. 87
26. Tier 1 Process (ASCE 2003, Figure 3-1) ............................................................ 93
27. Force Increase for Accidental Torsion............................................................ 106
28. Seismic Zone Map (ICBO 1997, Figure 16-2)................................................. 114

vii
LIST OF TABLES Table Page 1. Target Building Performance Levels (ASCE 2000b)......................................... 43
2. Fa Values (ASCE 2000b)........................................................................................ 47
3. Fv Values (ASCE 2000b)........................................................................................ 47
4. Damping Coefficients (ASCE 2000b).................................................................. 49
5. C1 Factor (ASCE 2000b) ........................................................................................ 51
6. Pseudo Lateral Load Coefficients ....................................................................... 52
7. Zone of Seismicity (ASCE 2000b)........................................................................ 53
8. Rehabilitation Objectives Matrix (ASCE 2000b) ............................................... 54
9. Data Collection Requirements (ASCE 2000b) ................................................... 57
10. Factored Shear Resistance in Kips per Foot for Seismic Forces on Structural
Use Panel Shear Walls (BSSC 2001a, Table 12.4.3-2a) ................................... 70
11. Allowable Plywood Stresses (APA 1997b) ...................................................... 72
12. Factored Shear Resistance in Kips per Foot for Horizontal Wood
Diaphragms (BSSC 2001a, Table 12.4.3-1a)..................................................... 77
13. Roof Element Stiffness Values........................................................................... 79
14. Possible Deformation- and Force-Controlled Actions (ASCE 2000b).......... 84

LIST OF TABLES (continued)
viii
15. Wood "m" Factors, from FEMA 356 Table 8-3 ................................................ 84
16. Levels of Seismicity (ASCE 2003, Table 2-1).................................................... 90
17. Fv Values, One Second Period (ASCE 2003, Table 3-5) ................................. 91
18. Fa Values, Short Period (ASCE 2003, Table 3-6) ............................................. 91
19. Shear Wall m Factors (ASCE 2003, Table 3-7) ............................................... 100
20. Modification Factors (ASCE 2003, Table 3-4) ................................................ 101
21. Possible Deformation- and Force-Controlled Actions (ASCE 2003).......... 108
22. Factored Shear Resistance in Kips per Foot for Seismic Forces on Structural
Use Panel Shear Walls (BSSC 2001a, Table 12.4.3-2a) ................................. 110
23. Factored Shear Resistance in Kips per Foot for Horizontal Wood
Diaphragms (BSSC 2001a, Table 12.4.3-1a)................................................... 111
24. m-Factors for Wood Components (ASCE 2003, Table 4-8) ......................... 111
25. Seismic Zone Factor Z (ICBO 1997, Table 16-I)............................................. 114
26. Seismic Coefficient Ca (ICBO 1997, Table 16-Q)........................................... 114
27. Seismic Coefficient Cv (ICBO 1997, Table 16-R)........................................... 114
28. Occupancy Category (ICBO 1997, Table 16-K) ............................................. 115
29. Structural Systems (ICBO 1997, Table 16-N)................................................. 116

LIST OF TABLES (continued)
ix
30. Allowable Shear (plf) for Horizontal Wood Structural Panel Diaphragms
(ICBO 1997, Table 23-II-H) .............................................................................. 120
31. Allowable Shear (plf) for Wood Structural Panel Shear Walls (ICBO 1997,
Table 23-II-I) ...................................................................................................... 121
32. FEMA 356 Classroom Roof Diaphragm DCR............................................... 123
33. FEMA 356 Gymnasium Roof Diaphragm DCR............................................ 123
34. FEMA 356 Classrooms Wall Panel DCR, E/W Seismic Direction ............. 125
35. FEMA 356 Classrooms Wall Panel DCR, N/S Seismic Direction .............. 125
36. FEMA 356 Gymnasium Wall Panel DCR, E/W Seismic Direction........... 125
37. FEMA 356 Gymnasium Wall Panel DCR, N/S Seismic Direction............ 125
38. ASCE/SEI 31 Tier 1 Wall Panel DCR ............................................................. 127
39. ASCE/SEI 31 Tier 2 Classroom Roof Diaphragm DCR............................... 128
40. ASCE/SEI 31 Tier 2 Gymnasium Roof Diaphragm DCR............................ 128
41. ASCE/SEI 31 Tier 2 Classrooms Wall Panel DCR, E/W Seismic Direction
............................................................................................................................. 129
42. ASCE/SEI 31 Tier 2 Classrooms Wall Panel DCR, N/S Seismic Direction
............................................................................................................................. 129

LIST OF TABLES (continued)
x
43. ASCE/SEI 31 Tier 2 Gymnasium Wall Panel DCR, E/W Seismic Direction
............................................................................................................................. 129
44. ASCE/SEI 31 Tier 2 Gymnasium Wall Panel DCR, N/S Seismic Direction
............................................................................................................................. 129
45. ASCE/SEI 31 Tier 3 Classroom Roof Diaphragm DCR............................... 131
46. ASCE/SEI 31 Tier 3 Gymnasium Roof Diaphragm DCR............................ 131
47. ASCE/SEI 31 Tier 3 Classrooms Wall Panel DCR, E/W Seismic Direction
............................................................................................................................. 131
48. ASCE/SEI 31 Tier 3 Classrooms Wall Panel DCR, N/S Seismic Direction
............................................................................................................................. 132
49. ASCE/SEI 31 Tier 3 Gymnasium Wall Panel DCR, E/W Seismic Direction
............................................................................................................................. 132
50. ASCE/SEI 31 Tier 3 Gymnasium Wall Panel DCR, N/S Seismic Direction
............................................................................................................................. 132
51. 1997 UBC Classroom Roof Diaphragm DCR ................................................ 133
52. 1997 UBC Gymnasium Roof Diaphragm DCR ............................................. 133
53. 1997 UBC Classrooms Wall Panel DCR, E/W Seismic Direction .............. 134
54. 1997 UBC Classrooms Wall Panel DCR, N/S Seismic Direction ............... 134

LIST OF TABLES (continued)
xi
55. 1997 UBC Gymnasium Wall Panel DCR, E/W Seismic Direction............. 134
56. 1997 UBC Gymnasium Wall Panel DCR, N/S Seismic Direction.............. 134
57. Summary of Classroom Roof Diaphragm DCR............................................ 137
58. Summary of Gymnasium Roof Diaphragm DCR......................................... 137
59. Summary of Classroom Wall Panel DCR, E/W Seismic Direction ........... 138
60. Summary of Classroom Wall Panel DCR, N/S Seismic Direction ............ 139
61. Summary of Gymnasium Wall Panel DCR, E/W Seismic Direction ........ 140
62. Summary of Gymnasium Wall Panel DCR, N/S Seismic Direction ......... 141

xii
LIST OF APPENDICES Appendix Page A: Global Calculations Inputs ............................................................................... 160
B: FEMA 154 Worksheets....................................................................................... 166
C: FEMA 356 Calculations ..................................................................................... 169
D: ASCE 31 Calculations ........................................................................................ 236
E: 1997 UBC Calculations....................................................................................... 262
F: Example MIDAS Model Input/Output........................................................... 296

xiii
LIST OF APPENDIX FIGURES
Figure Page
B 1. "Sidewalk Survey" RVS Form ........................................................................ 167
B 2. RVS Form with Plans Inspection................................................................... 168
F 1. Classroom Test Wall Elevation ...................................................................... 297
F 2. Classroom Test Wall Applied Loads (lbf.) ................................................... 298
F 3. Classroom Test Wall Displacement (inches)................................................ 299
F 4. Classroom Test Roof Plan............................................................................... 301
F 5. Classroom Test Roof Applied Loads............................................................. 301
F 6. Classroom Test Roof Displacement (in.) ...................................................... 302
F 7. Classroom Model ............................................................................................. 304
F 8. Model Lateral Load Coefficient, East (SX) Direction.................................. 304
F 9. Model Roof Shear, East Direction (lbf/ft) .................................................... 305
F 10. Model Wall Reactions, 10 ft. walls (lbf.) ..................................................... 306

COMPARISON OF SCREENING, EVALUATION, REHABILITATION AND DESIGN PROVISIONS FOR WOOD-
FRAMED STRUCTURES

2
1 INTRODUCTION
Earthquakes are one of the most terrifying and dangerous events in nature,
with the potential to cause widespread destruction and loss of life. While
historic records have shown specific geographic locations to be more prone to
seismic activity, earthquakes are in fact a national hazard. Geologists are
showing that many areas previously considered safe from earthquakes
actually have the potential to generate very large earth movements and cause
extensive damage. One such region is the Pacific Northwest, where there is
evidence of very large historic earthquakes along the Cascadia subduction
zone. As earthquakes become better understood, government officials, city
planners, building owners and citizens are becoming more concerned with
mitigation of seismic hazards through structural rehabilitation.
Many factors may lead to the decision to analyze and upgrade an existing
building for seismic hazard mitigation. Local ordinances may require the
evaluation and upgrade of public essential facilities. Building owners may
voluntarily choose to upgrade their facility for a number of reasons.
Whatever drives the decision to investigate the adequacy of an existing
structure to withstand anticipated ground shaking, there are many tools
available to the structural engineer to make the evaluation. Building codes and
handbooks are continually upgraded to incorporate what are believed to be
improvements to design and rehabilitation procedures.
New building codes have typically been concerned with ensuring a level of
“life safety” during the design seismic event. Life Safety may be defined as the
post-earthquake damage state that includes damage to structural components,
but retains a margin against onset of partial or total collapse (ASCE 2000b).

3
Over the years the definition of “design seismic event” has evolved as the
profession’s understanding of earthquakes has increased. Thus, a building
designed to the applicable building code in 1940, 1980, or much more recently
may not meet current code requirements. Other evolutions have taken place in
construction methods, materials, and workmanship. Many acceptable
practices from past years are no longer allowed in today’s codes and
regulations. Even with all the changes, new building codes are an essential
tool for establishing acceptability of existing materials, the ability of structures
to perform under current “design seismic event” forces, and as a reference for
rehabilitation approaches.
Within the United States, three building code councils have historically
developed and updated separate codes for the design and construction of new
buildings. The Southern Building Code Congress International published the
Standard Building Code, traditionally used in the Southeast. The Building
Officials & Code Administrators published the National Building Code, used
in the Northeast and Midwest. The International Conference of Building
Officials published the Uniform Building Code, used traditionally in the West.
These three organizations have now formally consolidated to form the
International Code Council which publishes the International Building Code
which is intended for use throughout the United States.
On a nation-wide level, several agencies and groups work to promote seismic
hazard mitigation. In 1974, the U. S. Congress authorized the National
Institute of Building Sciences (NIBS) to improve the building regulatory
environment, facilitate the introduction of new and existing products and
technology into the building profession, and disseminate nationally-
recognized technical and regulatory information (NIBS.org 2003). NIBS

4
oversees several councils and standing committees, including the Building
Seismic Safety Council (BSSC). BSSC works on a national level in developing
a unified approach to seismic hazard mitigation, bringing together public and
private interest expertise to provide broad consensus and authoritative
guidance (BSSCOnline.org, 2003).
In 1977 the U.S. Congress authorized the creation of the National Earthquake
Hazards Reduction Program (NEHRP) to improve the Nation’s
understanding of earthquake hazards and to mitigate their effects (USGS.gov
2003). Many agencies and councils have participated within NEHRP to
provide guidance for evaluation and rehabilitation of existing buildings. In
1984, the Federal Emergency Management Agency (FEMA) first began a
program to address the risk posed by seismically unsafe buildings, and has
collaborated with other organizations such as the Applied Technology
Council (ATC), the American Society of Civil Engineers (ASCE), the BSSC
and others. The results of their efforts have been the publication of numerous
reports, studies, handbooks, guidelines, and regulations. Some of these
publications include:
• Non-technical reports on seismic considerations: FEMA 99, Improving
Seismic Safety of New Buildings – A Non-Technical Explanation (BSSC
1995); FEMA 74, Reducing the Risks of Nonstructural Earthquake Damage:
A Practical Guide (FEMA 1994)
• Seismic guidebooks for schools: FEMA 88, Guidebook for Developing a
School Earthquake Safety Program (FEMA 1990); FEMA 149, Seismic
Considerations: Elementary and Secondary Schools (BSSC 1988); FEMA
159, Teacher’s Package for K-6 Grades (NSTA 1992); FEMA 240,

5
Earthquake Preparedness – What Every Childcare Provider Should Know!
(RPP 1993)
• Rapid visual screening procedures: FEMA 154, Rapid Visual Screening of
Buildings for Potential Seismic Hazards: A Handbook (ATC 2002a); FEMA
155, Rapid Visual Screening of Buildings for Potential Seismic Hazards:
Supporting Documentation (ATC 2002b)
• Seismic evaluations: FEMA 178, NEHRP Handbook for Seismic Evaluation
of Existing Buildings (BSSC 1992b); FEMA 310, Handbook for the Seismic
Evaluation of Buildings – A Prestandard (ASCE 1998); ASCE/SEI 31,
Seismic Evaluation of Buildings (ASCE 2003).
• Seismic rehabilitation: FEMA 273, NEHRP Guidelines for the Seismic
Rehabilitation of Buildings (ATC 1997a); FEMA 274, NEHRP Commentary
on the Guidelines for the Seismic Rehabilitation of Buildings (ATC 1997b);
FEMA 356, Prestandard and Commentary for the Seismic Rehabilitation of
Buildings (ASCE 2000b)
• Rehabilitation costs: FEMA 156, Typical Costs for Seismic Rehabilitation of
Existing Buildings: Volume 1: Summary (Hart 1994); FEMA 157, Typical
Costs for Seismic Rehabilitation of Existing Buildings: Volume 2:
Supporting Documentation (Hart 1995); FEMA 227, Benefit-Cost Model for
the Seismic Rehabilitation of Hazardous Buildings: Volume 1: A User’s
Manual (VSP 1992a); FEMA 228, Benefit-Cost Model for the Seismic
Rehabilitation of Hazardous Buildings: Volume 2: Supporting
Documentation (VSP 1992b).
• Rehabilitation techniques: FEMA 172, NEHRP Handbook of Techniques
for the Seismic Rehabilitation of Existing Buildings (BSSC 1992a), FEMA
276, Guidelines for the Seismic Rehabilitation of Buildings: Example
Applications (BSSC 1999a)

6
• Provisions for new buildings: FEMA 222, NEHRP Recommended
Provisions for the Development of Regulations for New Buildings (BSSC
1992c); FEMA 223, NEHRP Recommended Provisions for the Development
of Regulations for New Buildings, Commentary (BSSC 1992d); FEMA 302,
NEHRP Recommended Provisions for Seismic Regulations for New
Buildings and Other Structures, Part 1, Provisions (BSSC 1998a); FEMA
303, 1997 NEHRP Recommended Provisions for Seismic Regulations for
New Buildings and Other Structures, Part 2, Commentary (BSSC 1998b);
FEMA 368, 2000 NEHRP Recommended Provisions for New Buildings and
Other Structures, Part 1, Provisions (BSSC 2001a); FEMA 369, 2000 NEHRP
Recommended Provisions for New Buildings and Other Structures, Part 2,
Commentary (BSSC 2001b)
These publications are only a few of the many that make up the available
references for seismic hazard planning, identification, evaluation, mitigation
and rehabilitation. The design professional must decide which document(s)
are appropriate to investigate a proposed rehabilitation.
This report compares the use of several available methods for the evaluation
of the seismic performance of two wood-framed structures similar to
buildings that are part of Hoover Elementary School in Corvallis, Oregon.
Hoover School has been designated as a disaster shelter facility by local
officials, and thus it is a good candidate for seismic evaluation and potential
upgrade. The author has chosen from the many available approaches for this
report, making use of those most widely accepted and used currently in the
Pacific Northwest. The methods selected for comparative analysis are those
prescribed by:
• FEMA 154, Rapid Visual Screening of Bulidings for Potential Seismic Hazards

7
• FEMA 356, Prestandard and Commentary for the Seismic Rehabilitation of
Buildings
• ASCE/SEI 31, Seismic Evaluation of Buildings
• 1997 Uniform Building Code
The specific objectives of this research are:
• Complete the seismic screening in accordance with FEMA 154. Discuss
results of screening in context with overall design requirements.
• Complete seismic analysis and rehabilitation design check in accordance
with FEMA 356.
• Complete seismic evaluation in accordance with ASCE/SEI 31.
• Complete seismic analysis and design check in accordance with the 1997
UBC.
• Compare and discuss the approaches and results for each document.
• Provide user comment on the documents used for this report, including
applicability, ease of use, completeness, etc. Make specific
recommendations for improving the use of the documents for wood
buildings.
• Make recommendations for future research to improve these seismic
evaluation and analysis documents, specifically for use with wood
buildings.

8
2 LITERATURE REVIEW
As described in the Introduction section of this report, there are many
organizations and research groups that are working toward a better
understanding of seismic evaluation and rehabilitation of structures. The
results of their research are evident in the many reports, handbooks,
recommendations and codes that have been produced. While much
information is available on current research efforts and design
recommendations, little is available comparing the approaches, analysis
methods, evaluation and design results of these documents.
The model building codes (SBC, BOCA, UBC, IBC) for new construction
design are thorough and comprehensive. The codes include information on
building design, materials testing, field inspections, and a wide range of
construction-related subjects. The provisions are widely respected and trusted
to provide life-safety level performance of structures designed to the codes.
This “level of comfort” in the engineering community has been derived from
observations of building performance during and after seismic events, use of
many design approaches over a long period of time, and results of academic
research. The model building codes are legally adopted as the governing
document by which local buildings must be designed. The Uniform Building
Code is the model code currently adopted in the state of Oregon for new
building design.
Documents that specialize in seismic evaluation and rehabilitation are not as
widely accepted or used as the model building codes. These have not
traditionally been legally adopted as governing methods, partly because the
documents are relatively new and also because they have been written as

9
guidelines and handbooks for design professionals. Some documents will
continue to be published as handbooks, while others are being converted to
mandatory, code-like language. It is expected that seismic evaluation and
rehabilitation will eventually be governed by widely-accepted methods in
adopted codes.
This report focuses on only four of the many available handbooks, reports,
codes and other documents for structural evaluation and rehabilitation. These
documents can be categorized as Screening, Rehabilitation, Evaluation and
Design documents.
2.1 SCREENING DOCUMENT: FEMA 154
FEMA 154, Rapid Visual Screening of Buildings for Potential Seismic Hazards: A
Handbook (ATC 2002a) is a handbook intended to provide a fast, relatively
cheap, and simple method for designating structures which are most likely to
require rehabilitation.
The first edition was completed by the Applied Technology Council (ATC) in
1988, and in 1999 the ATC was contracted by FEMA to update the document.
The second edition was completed as part of a strategic plan to periodically
update all FEMA documents concerned with the seismic evaluation and
rehabilitation of existing buildings. Updates in the second edition are based on
information developed since 1988, including (1) new knowledge about the
performance of buildings during damaging earthquakes, including the 1989
Loma Prieta and 1994 Northridge earthquakes; (2) new knowledge about
seismic hazards, including updated national seismic hazard maps published
by the U.S. Geological Survey in 1996; (3) other new seismic evaluation and
damage prediction tools; and (4) experience from the widespread use of the

10
original FEMA 154 Handbook by federal, state and municipal agencies, and
others (ATC 2002a).
Updates were based on voluntary user feedback from those who had made
use of FEMA 154 for more than 70,000 structures, a review of available
information on the seismic performance of buildings, and a users workshop to
learn first-hand the problems and successes of those that had used the rapid
visual screening (RVS) procedures (ATC 2002a). FEMA 155 contains a
technical basis for the updated procedures, a summary of the results from the
solicitation of user feedback, and a detailed description of the scores and
modifiers used in the procedure (ATC 2002b).
One of the major updates from the first to the second edition was the revision
of the Basic Structural Hazard (BSH) scores. The first edition contained BSH
scores based on the expert-opinion damage probability matrices provided in
the ATC-13 report Earthquake Damage Evaluation Data for California (ATC 1985).
The scoring system update incorporates new knowledge on seismic hazard
mapping, new knowledge on earthquake performance of buildings, and
calibration information derived from studies of buildings evaluated using
both the FEMA 154 RVS procedure and the FEMA 178 detailed seismic
evaluation procedure (ATC 2002a).
Additional updates were made to the Performance Modification Factors, now
referred to as Score Modifiers. Several categories were added, removed, or
replaced and the scores altered. New modifiers for soil type are included, and
the relatively subjective category “Poor Condition” was removed.
The RVS procedure itself consists of no structural analysis calculations at all.
Instead the inspector assigns various scores and modifiers during the

11
inspection, and according to a scoring system presented in the document. The
process will typically take between 15-30 minutes per building, and is
normally accomplished without even entering the structure. Because the
procedure does not include detailed structural calculations, a wider variety of
persons may be qualified to perform the inspections. The procedure was
developed for use by local building officials, professional engineers, registered
architects, building owners, emergency managers, and interested citizens
(ATC 2002a).
Initial screening procedures may be performed completely by external visual
inspection, or a “sidewalk survey” in which the screener completes a Data
Collection Form based upon visual inspection of the building exterior, and if
possible the building interior. The primary lateral-load-resisting system and
structural materials are identified and noted on the form, and a Basic
Structural Hazard Score is assigned based on the observations. Modifications
are made to the Basic Structural Hazard Score based on additional
observations, and the modifiers are either added to or subtracted from the
Basic Structural Hazard Score to arrive at a final Structural Score, S. Final S
scores typically range from 0 to 7, with higher scores corresponding to better
expected seismic performance.
A cutoff value of 2 is recommended, and buildings having an S score of 2 or
less should be investigated by a design professional. The more advanced
analysis may prove that the building is in fact adequate. Conversely, buildings
having an S score above 2 may in fact be potentially unsafe. However, the RVS
procedures are intended to quickly identify large groups or types of buildings
that are likely to require further analysis, and not necessarily to correctly

12
classify every building as “safe” or “potentially unsafe” based solely on visual
observation.
In addition to the RVS survey forms and scoring sheets, the second edition of
FEMA 154 includes guidance on planning and managing an RVS survey, more
guidance for identifying the structural lateral-load-resisting system in the
field, the use of interior inspection or pre-survey reviews of building plans to
identify a buildings lateral-load-resisting system and updated Basic Structural
Hazard Scores and Score Modifiers (ATC 2002a).
2.2 REHABILITATION DOCUMENT: FEMA 356
At some point during the seismic screening and evaluation process for a
structure, it may be decided that the building requires rehabilitation to
upgrade the expected performance during an earthquake. FEMA 356,
Prestandard and Commentary for the Seismic Rehabilitation of Buildings (ASCE
2000b) is one tool that provides designers with expected force levels and
component acceptance criteria. The result is a rehabilitation plan which will
upgrade the building to meet expected seismic demands at a chosen seismic
performance level. It is important to note that use of FEMA 356 is intended
only after a deficiency has been identified for rehabilitation, not for use as an
evaluation tool for existing structures.
FEMA 356 is an interim document that has two main objectives. The first is to
encourage the wider application of provisions used in FEMA 273, NEHRP
Guidelines for the Seismic Rehabilitation of Buildings (ATC 1997a) by converting it
into mandatory language. The second is to provide a basis for a nationally-
recognized, ANSI-approved standard to help in disseminating and
incorporating the approaches and technology of the prestandard into the

13
mainstream of design and construction practices in the United States (ASCE
2000b). FEMA 356 is intended to be generally applicable to seismic
rehabilitation of all buildings, regardless of importance, occupancy, historic
status, or other classifications of use (ASCE 2000b).
The provisions of FEMA 356 are specifically written and applicable to the
rehabilitation of existing buildings and are, in general, more appropriate for
that purpose than are new building codes (ASCE 2000b). New building codes
regulate the design and detailing of structures to include design practices,
detailing and methods of construction that may not have been available when
a particular structure was constructed. Thus, the requirements and provisions
of new codes may not be directly applicable to existing structures.
FEMA 356 may be used as a follow-up to a previous evaluation, or it may be
used as a tool that ascertains compliance with a selected rehabilitation
objective. Evaluation using FEMA 356 may be more stringent than other
evaluation methodologies (such as ASCE/SEI 31) because the provisions have
been calibrated for use in design while other evaluation methods have
historically been set lower to minimize the need to strengthen those structures
with only moderate deficiencies (ASCE 2000b).
The description of damage states in relation to specific performance levels is
included in FEMA 356 and can be useful for owners and design professionals
when selecting an appropriate design objective. Techniques for repair of
earthquake damage are not included, but references are provided in the
materials chapters when such guidelines exist.
The design approach used in FEMA 356 is significantly different than the
approach used in the model building codes in that the provisions are based on

14
a performance-based design methodology. While the model codes are
calibrated to a “life safety” level of performance, a higher or lower
performance level may be selected when applying the provisions of FEMA
356. The chosen performance level governs the calculated force levels and
other requirements in the provisions. The model building codes have
historically been based on linear static force procedures. FEMA 356 includes
provisions for linear static, linear dynamic, non-linear static and non-linear
dynamic procedures.
FEMA 356 is currently an “interim” document, and committees will collect
comments from users, debate the merits of those comments, make updates
and changes to the language where appropriate, and eventually release a final
document for use. During the process of finalizing the document several
reports and studies have been and will be published. Summaries of revisions
made to FEMA 273 are documented in FEMA 357, Global Topics Report on the
Prestandard and Commentary for the Seismic Rehabilitation of Buildings (ASCE
2000a). Changes include such global topics as reorganization of the document,
discussion of the level of seismic accelerations used, and other technical issues.
Similar reports on submitted comments will likely be produced as the process
continues to finalize the FEMA 356 methodologies.
FEMA 343, Case Studies: An Assessment of the NEHRP Guidelines for the Seismic
Rehabilitation of Buildings (BSSC 1999b) is a compilation of key findings and
user feedback based on use of FEMA 273. Much of the information contained
in the assessments from the building designs has been incorporated into the
FEMA 356 provisions (ASCE 2000b).

15
2.3 EVALUATION DOCUMENT: ASCE/SEI 31
ASCE/SEI 31, Seismic Evaluation of Buildings (ASCE 2003) provides a three-
tiered process for the seismic evaluation of existing buildings. The tiered
methods were used in FEMA 178, Handbook for the Seismic Evaluation of Existing
Buildings (BSSC 1992b). FEMA 178 was updated and replaced by FEMA 310,
Handbook for Seismic Evaluation of Buildings – A Prestandard (ASCE 1998), which
has now been replaced by ASCE/SEI 31.
The need for evaluation may be indicated by other evaluations or screenings,
such as FEMA 154.The evaluation process systematically progresses from
simple, checklist-style screenings of buildings (Tier 1 evaluation) to more
detailed evaluations of building systems (Tier 2 and Tier 3 evaluations).
A Tier 1 evaluation consists of reviewing pertinent building documentation,
checking “Benchmark Building” criteria, and completing applicable checklists.
Potential deficiencies are summarized upon completion of the evaluation.
Deficiencies identified during the Tier 1 evaluation are evaluated in more
detail according to the provisions provided in the document. Detailed seismic
criteria and element acceptability are calculated. Potential deficiencies are
summarized upon completion of the evaluation.
When the design professional desires more detailed analysis of deficiencies
identified during a Tier 2 analysis, a Tier 3 evaluation may be performed. A
Tier 3 evaluation may be based on either approved provisions for seismic
rehabilitation design, or on well-established provisions for design of new
buildings. In either case, the designer should use 75% of the design forces for
the Tier 3 evaluation. This force reduction is allowed because the force levels

16
in these documents are intended for design. Design spectra have traditionally
been based on “mean-plus-one standard deviation” from the 10%-in-50-year
earthquake. The additional standard deviation provides a factor of safety in
design which is considered too conservative for existing building evaluation.
The 0.75 reduction is intended to reduce the conservative load level to one that
is believed to be more appropriate for evaluating existing buildings (ASCE
2003).
Similar to results of screening procedures in FEMA 154, failing to meet criteria
of lower-tiered requirements does not necessarily mean that the building is
unsafe. Rather, such a result indicates the need for more detailed structural
analysis of the component or system.
In general, the information collected during the initial investigation must be
sufficient to complete all Tier 1 checklists, define the seismicity, and identify
the building type. This will typically include a review of construction
documents and specifications pertaining to the original design and
construction, as well as any subsequent construction during the life of the
structure. Destructive examination may be required, depending on the chosen
performance level and at the judgment of the evaluator. Unless provided
elsewhere in the construction documents, a list of acceptable default material
properties for Tier 1 and Tier 2 analyses is provided in ASCE/SEI 31. The
design professional should look for an existing geotechnical report on soil
conditions, to help establish site and soil parameters.
If a Tier 2 evaluation is required, additional information about the building
may need to be collected. Additional destructive and non-destructive
examinations and testing may be required. Default material properties may be
used, but it is recommended that material property data from the building

17
codes from the year of construction be used, or that physical testing be
performed.
Detailed building information is required for a Tier 3 analysis. If no
construction documents are available, then they must be created and critical
components and connections identified. Additional destructive and non-
destructive testing may be required to determine material properties; default
values provided in the document may not be used for a Tier 3 evaluation.
A site visit shall be conducted by the design professional to verify existing
data, or to collect required additional data. Typical data to be determined or
confirmed include a general building description, structural system
description, description of nonstructural elements and their connections,
building type, site class, building use, architectural features, adjacent
buildings and general building condition. As needed, the design professional
may need to revisit the site to verify or determine additional required data.
ASCE/SEI 31 evaluations are based on two performance levels, Immediate
Occupancy (IO) and Life Safety (LS). The design professional conducting the
evaluation, preferably with input from the building owner, must decide which
performance level is appropriate. FEMA 178 addresses only the Life Safety
performance level, and ASCE/SEI 31 addresses both Life Safety and
Immediate Occupancy performance levels. The evaluations are also written
based on defined structure types, with Tier 1 and Tier 2 requirements written
specifically for separate building types and materials.
The checklists provided in the document include specific items for each of
various building types. Among many others, it includes “Wood Light Frames”
and “Wood Frames – Commercial and Industrial.” If a structure does not

18
match any of the types listed, a General Checklist is used. Judgment must be
used when selecting the building type, because many structures do not match
completely the descriptions provided. The user is encouraged to focus on the
lateral-force-resisting system when making the building type selection.
A “Benchmark Building” is defined as one built after acceptable seismic
provisions were instituted in the model building codes (National Building
Code, Uniform Building Code, International Building Code, etc.). A building
constructed according to acceptable seismic provisions is automatically in
compliance with the Tier 1 evaluation because it is assumed that the level of
design and detailing are adequate. For buildings built before acceptable
seismic provisions were in place, the designer completes checklists for the
identification of potential structural deficiencies.
The document lists, for each building type, the first year of publication of each
code in which the seismic provisions are considered acceptable. The
Benchmark Building year designation may change as new provisions are
instituted for particular building types. The use of the Benchmark Building
provisions are optional; the design professional may choose to proceed with a
structural Tier 1 evaluation even if the benchmark year criterion is met.
2.4 DESIGN DOCUMENT: 1997 UBC
Design provisions of the Uniform Building Code (ICBO 1997) are used as a
comparison with the requirements of the rehabilitation and evaluation
documents. Evaluating existing buildings per UBC requirements is an
accepted method, but is not the primary intent of the document. However, use
of UBC provisions provides a good comparison with other publications of
force levels and rehabilitation requirements.

19
Seismic provisions of the UBC are based on recommendations and code
development by the Structural Engineers Association of California (SEAOC).
The other model building codes, (National Building Code, Standard Building
Code, International Building Code) are generally based on the seismic
requirements developed by BSSC and published as the NEHRP Recommended
Provisions for the Development of Seismic Regulations for Buildings and Other
Structures (BSSC 1998a and 1998b).
Wood design procedures and requirements are based on working-stress force
levels, whereas the evaluation and analysis requirements of FEMA 356 and
ASCE/SEI 31 are based on ultimate strength levels. For this reason, a direct
comparison of design forces for each code can not be made. Rather, a
comparison of the final design requirements for each code is presented.
Buildings designed or evaluated according to the provisions of the 1997 UBC
are expected to meet the Life Safety performance level. The NEHRP-based
documents allow the user to specify varying performance levels ranging from
“Not Considered” (least stringent) to “Immediate Occupancy” (most
stringent). This flexibility is not part of the 1997 UBC provisions, and has
historically not been included in any of the major model codes.
To increase the expected performance level of certain essential or other special
facilities, the 1997 UBC provisions include an increase in design forces by
using an Importance Factor, I. For typical structures I = 1.0, but for essential
facilities I = 1.5. In the NEHRP-based codes, direct selection of the building
performance level is made, resulting in design spectral accelerations and m
factors.

20
For wood structures, seismic design forces in the 1997 UBC provisions are
initially computed at the strength force level and then divided by a factor of
1.4 to reduce them to the working stress force level. This differs from the
NEHRP-based documents, which design to strength force levels. Allowable
element forces and stresses in the 1997 UBC provisions are also provided at
working stress levels.
The load combinations in the 1997 UBC include a set of alternate combinations
for allowable stress design methods. When the alternate combinations are
used, an increase of 33% of the allowable stress may be taken for short-term
loads. For this analysis, it is assumed that the alternate combinations are used,
and the stress increase is taken. The allowable shear tables in the 1997 UBC are
for short-term loading and include the allowable increase.
Ductility refers to the ability of an element to deform beyond the elastic limit
without experiencing complete structural failure. The 1997 UBC accounts for
the ductility of the lateral-force-resisting system by reducing the seismic force
using an R factor. This differs from the approach of the NEHRP-based
documents, which increases the element capacity by an m factor.
A complete design check of all of Hoover School’s structures was completed
in 1999 using the provisions of the 1997 UBC under a contract between CH2M
Hill, Inc. and the Corvallis 509J School District (Baxter et al. 1999). That design
check includes investigation of overturning, diaphragm chord design, shear
wall rehabilitation, top-of-wall connections, comparison with wind forces,
CMU anchorage, and details for the recommended upgrades. The shear wall
upgrades recommended in the report included addition of ½-in plywood
panels to create new shear walls, addition of panel hold-down anchors if none
are currently installed (anchors are not indicated on the construction

21
documents), and addition of a steel strap diaphragm chord at the classroom
structures. These upgrades are used as the assumed rehabilitation for the
evaluation, rehabilitation and design checks for this report.
Some of the recommendations, such as addition of diaphragm straps and
shear wall hold-downs, are assumed to have been completed. For the shear
wall rehabilitation, addition of ½-in. C-D plywood to selected wall areas was
prescribed. The plan of adding ½-in. C-D plywood to exterior shear walls is
used as the primary rehabilitation scheme for all rehabilitations used in this
report. The nailing pattern used for all methods in this report is 8d @ 6 in. on
center at panel edges and 12 in. field spacing, common nail size.
For the roof diaphragms, the ¾-in. thick diaphragm panels (classroom
structure) are assumed to be nailed using 10d @ 4 in. at panel edges and 10d @
12 in. field nailing (common nails), and the 5/8” thick panels (gymnasium
structure) are assumed to be nailed using 10d @ 6 in. at panel edges and 10d @
12 in. field nailing (common nails).
This report includes design provisions and checks for the shear wall and
diaphragm elements only. For a typical consulting engineer’s evaluation
report, additional considerations such as adequacy of connections at the tops
of walls, anchorage to foundations, investigation of roof element sub-
diaphragms and soil bearing capacity checks would be included, but are not
addressed in this comparison report.
2.5 PROCEDURE COMPARISONS
Engineering procedures for evaluating the seismic sufficiency of existing
buildings and developing rehabilitation solutions have not been as well

22
defined as new design procedures and, from a national perspective, there is no
uniformly accepted set of engineering requirements for seismic rehabilitation
(BSSC 1999a). There is also very little information published on a direct
comparison of design results from the existing codes and handbooks for any
material type. I consulted Dr. Dan Dolan, professor at Washington State
University and an active participant from the wood community in the
development of several FEMA documents pertaining to seismic rehabilitation.
Dr. Dolan was not aware of any such calculations or reports having been
published.
One article compares U.S. seismic codes (McIntosh and Pezeshk 1997), but the
article was based on previous editions of the NEHRP and UBC publications.
No published resources were located comparing the current versions of the
documents reviewed in this report.
Anecdotal evidence exists that the “m” factors employed in Linear Static
Procedures (LSP) of the NEHRP-based methods may be overly conservative.
Designs conducted by Dr. Tom Miller for the consulting firm CH2M Hill in
Corvallis, Oregon showed that the rehabilitation requirements of a FEMA 356
LSP analysis for a concrete building were much more stringent than those
required by a 1997 UBC analysis. Designers from other consulting firms have
confirmed that they have seen similar apparent problems with Linear Static
Procedures. Reports written by private consulting firms are typically not
published or available to the public, and I did not have access to any others.
Chris Poland, the Chairman, CEO and President of Degenkolb Engineers in
San Francisco also serves as chairman of the ASCE Seismic Rehabilitation
Standards Committee. When asked if he was aware of any reports or
published results with low m factors, he responded that he believes the

23
problem is in the conservative analysis approach inherent with LSP
provisions. The R factors for new buildings are really calibration factors to get
us back to the level we have always been comfortable with, based on
observation of damage after earthquakes. The m factors are derived and, by
nature, do not include duration of shaking, number of cycles of nonlinear
behavior, etc. (Poland 2003). He suggested findings from this report be
presented to a wood structures committee being formed to deal with
comments on the FEMA 356 provisions.

24
3 STRUCTURE DESCRIPTION
Hoover Elementary School is located in Corvallis, Oregon. The facility
comprises several areas including classrooms, administrative offices,
kindergarten and a gymnasium. Each of these areas is separate structurally,
connected by hallways and corridors. The structural walls are wood framing
and the roof diaphragm is plywood.
3.1 CONSTRUCTION HISTORY
Original construction at Hoover School in 1967 included the two classroom
wings, the administration area, and the gymnasium. In 1976 the Kindergarten
Building was added and the play area behind the gymnasium was covered.
Both construction phases were designed by the architectural firm Jeppsen,
Miller & Tobias Architects of Corvallis, Oregon.
3.2 BUILDING DESCRIPTIONS
East and West Classrooms
The classroom units (Figures
1 and 2) are 80 ft. by 90 ft. in
plan with interior bearing
walls. The classroom exterior
walls are 2x6 vertical wood
studs, batt insulation, and
gypsum or wood panel walls
inside. All exterior walls are
covered with a channeled
vertical wood siding, with a ¾ in. minimum thickness and 1½ in. maximum
Figure 1. East Elevation of East Classrooms

25
thickness. The walls are blocked at approximately 3 ft. 0 in. on center for edge
nailing of the siding, and diagonal wood let-in bracing is designed to resist
lateral loads.
The roof is supported by
open web trusses 32 in. deep
at mid-span, spaced at 4 ft. 0
in. on center. Glulam beams
support an upper roof
structure and span window
openings. Typically the soffit
(the horizontal extension of
the roof from the building
wall) overhangs the exterior
walls by 10 ft.
Gymnasium
The gymnasium (Figures 3 and 4) is the only area of the building which has
high ceilings, approximately
20 ft. high. At the high ceiling
area, the roof is framed with
wood trusses at 6 ft. 0 in. on
center, and 2x4 purlins at 24
in. on center. The exterior
walls consist of 2x6 vertical
studs with gypsum board on
the interior and wood siding
Figure 2. South Elevation of East Classrooms
Figure 3. East Elevation of Gymnasium

26
on the exterior, similar to the
walls at the classrooms,
administration area and
Kindergarten Addition. In
addition, there are steel
channels at 6 ft. on center that
run full wall height.
Locker and shower rooms are
located east of the main
gymnasium room, with a
mechanical room above on a second floor mezzanine. West of the gymnasium
is the stage area, and also two smaller storage rooms. Above those two storage
areas, north of the stage area, is another mechanical mezzanine. Above these
two mezzanine areas the local roof is supported by prefabricated wood trusses
at 4 ft. 0 in. on center with blocking at 4 ft. 0 in. on center.
There is no soffit at any of the three exterior gymnasium walls.
Administration
The Administration area
(Figure 5) contains the main
offices, library, and a hallway
connecting the two main
classroom areas and the
gymnasium. The exterior
walls of this area are similar to
those of the classroom areas,
Figure 4. East Wall of Gymnasium and Walkway Between Gymnasium and East Classrooms
Figure 5. North Elevation of Administration Area

27
except the soffit overhang at this area is approximately 5 ft. The roof joists are
32 in. deep at mid-span.
Kindergarten Addition
The Kindergarten addition (Figure
6) was designed in 1976 and
constructed using the same methods
as for the east and west classroom
areas.
3.3 ANALYZED AREAS
The classrooms and gymnasium areas were chosen as a basis for the analysis
test structures for evaluation. The classroom areas are regular in plan
dimensions, have low ceilings, and have significant openings in two opposite
walls. For seismic loads in the East/West direction there are door and window
openings that will allow analysis of typical, separate wall piers. For seismic
loads in the North/South direction there are no openings. The North/South
seismic analysis will provide results representative of typical low-rise
structures with few openings, while the East/West seismic analysis will
include effects on “high aspect ratio” shear panels. A plan view of the
classroom test structure is shown in Figure 7.
Figure 6. West Elevation of Kindergarten Addition

28
Figure 7. Plan View, Classroom Test Structure The other building configuration used is similar to the Hoover Elementary
School gymnasium. This area has high ceilings and will have a building
period and seismic coefficient different than the classroom. The wall openings
are comprised mainly of door and window openings, and also a display case
at the Northwest corner. A plan view of the gymnasium test structure is
shown in Figure 8.
Figure 8. Plan View, Gymnasium Test Structure

29
A previous rehabilitation design completed for Hoover Elementary School
using the 1997 UBC provisions showed that one layer of ½-in. C-D grade
plywood is sufficient to rehabilitate the structure. To facilitate direct
comparison of the analysis, evaluation, rehabilitation and design provisions,
the buildings are assumed to be completely sheathed with one layer of ½-in.
C-D plywood, and the ratio of the calculated element forces divided by the
prescribed element capacity for each method is compared. Preliminary results
showed that a single layer of ½-in. plywood is not adequate for all methods,
so an additional analysis assuming two layers of ½-in. plywood wall
sheathing and additional roof diaphragm sheathing is also performed. A
double-sheathed wall would typically have a single layer of plywood
sheathing attached to both the inside and outside faces. Special nail stagger
requirements would need to be used to prevent wood splitting in the framing
members.

30
4 ANALYSIS ASSUMPTIONS AND METHODS
4.1 FEMA 154
Figure 9. Seismicity Regions in California, Idaho, Nevada, Oregon and Washington (ATC 2002a, Figure A-2)

31
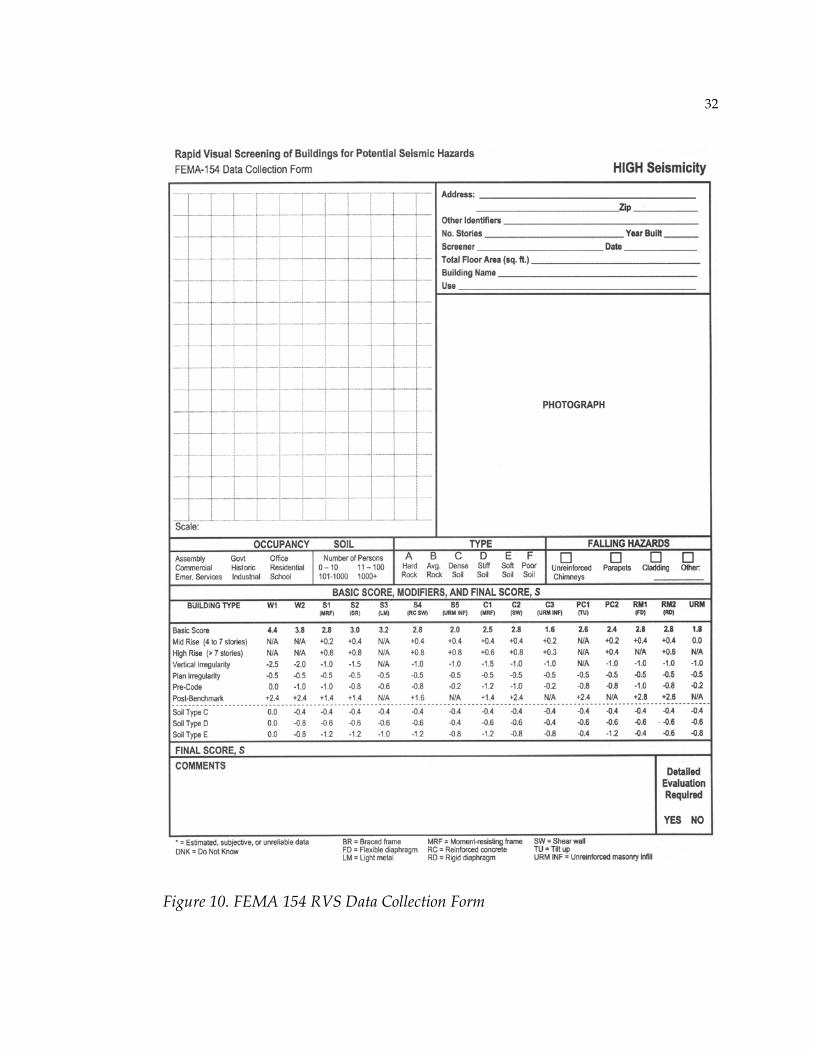
The Data Collection Form used depends on the Seismicity Region. Figure 9
shows the NEHRP Seismicity Regions for the northwestern United States.
Corvallis, Oregon is within the area shown as HIGH seismicity.
Figure 10 shows the RVS Data Collection Form for regions of High Seismicity.
All information required for and collected during a screening is recorded on
this form. Some of the information, such as Occupancy and Falling Hazards, is
intended for general information and categorization of building importance or
additional non-structural investigations. Since these items will not directly
affect the results of the screening score, they are not discussed here.
Structure types are grouped into fifteen general classes, such as “Light wood-
frame residential and commercial buildings smaller than or equal to 5,000
square feet (W1),” “Braced steel frame buildings (S2),” and others.
Descriptions and examples of each building type are included in FEMA 154 to
help the screener choose the correct building type. Wood-framed buildings are
either type “W1” or “W2.” Type “W1” structures are residential and
commercial wood-frame buildings equal to or smaller than 5,000 ft2. Type
“W2” structures are greater than 5,000 ft2. The classroom structure is (80 ft. x
90 ft.) = 7,200 ft2, and the gymnasium is (116 ft. x 96 ft.) = 11,136 ft2. Thus, each
structure is Building Type W2.
Each building type is assigned a Basic Structural Hazard score, depending on
the earthquake forces the building is likely to experience. These basic scores
range from 1.6 to 7.4, and are derived from the probability of collapse of the
building, given the ground motion corresponding to the maximum considered
earthquake (ATC 2002b). For Building Type W2 in High seismic area, the Basic
Structural Hazard Score is 3.8.
32
Figure 10. FEMA 154 RVS Data Collection Form

33
After the Basic Structural Hazard Score has been determined, Score Modifiers
are applied for various attributes of the building and site. Each modifier adds
to, or subtracts from, the Basic Structural Hazard Score to arrive at the Final
Structural Score, S. If possible, the investigator should review construction
documents, specifications, soils reports, or any other documentation. When
this data is not available, the screening may proceed using visual inspection
only. This is often called a “sidewalk survey.” Score Modifiers for a visual-
only inspection:
• Mid-Rise Buildings and High-Rise Buildings: These modifiers are
applied for buildings having 4-7 stories and those higher than 8 stories,
respectively. Neither is true for the two buildings at Hoover School and the
modifiers are not used. (These modifiers are typically not applicable to
wood-framed buildings because they rarely exceed 3 stories.)
• Vertical Irregularity: If the building is irregularly shaped in elevation (i.e.
walls not vertical or are set-back) this Score Modifier must be taken. This
Score Modifier also applies for buildings with soft stories (low stiffness
compared to stories above or below), or for buildings built on steep ground
slopes. At Hoover School, each area appears to have complete vertical load
paths from the roof to the ground, no soft stories exist, and the ground is
nearly level. This Score Modifier is not taken.
• Plan Irregularity: This type of irregularity applies where a re-entrant
corner is present, such as for “L” or “T” shaped buildings. Other
irregularities that might cause torsion would also be justification for taking
this Score Modifier. Since both test structures are rectangular in plan, this
Score Modifier is not taken.
• Pre-Code: This Score Modifier is taken if the building was constructed in a
high or moderate seismicity region, and if it was designed and constructed

34
prior to the initial adoption and enforcement of seismic codes for that
building type. Original construction of Hoover School was completed in
1967, and it is assumed that the design was completed based on the UBC
requirements of the then-current code. (FEMA 154 also allows for use of
the default code year 1941 when it is unknown whether the building was
constructed according to the requirements of a seismic building code.) The
buildings were not built “Pre-Code” and the modifier is not taken.
• Post-Benchmark: This Score Modifier is applicable if the building being
screened was designed and constructed after significantly improved
seismic code provisions for that building type were adopted. Figure 11
shows the recommended Benchmark years. Since the original construction
of both the classrooms and gymnasium areas was completed in 1967,
which predates the benchmark year, this Score Modifier is not taken.
• Soil Type: Score Modifiers for Soil Types C, D, and E are included on the
Data Collection Form. If the appropriate Soil Type was not identified prior
to the screening, Soil Type E may be assumed except for one- and two-
story structures with roof height equal to or less than 25 feet, Soil Type D
may be assumed. The classroom area wall height is 9 ft and the
gymnasium area wall height is approximately 21.3 ft. Due to the absence of
a soils report and geotechnical classification, Soil Type D is assumed for
both structures. A Score Modifier equal to –0.8 is taken.
During the course of this research project, the construction drawings were
obtained from the School District Offices. A review of the drawings revealed
that the lateral design did not include plywood sheathing on the walls, but
instead incorporated a diagonal brace member notched, or “let in” to the
vertical studs. Based on the poor performance of this construction method in
earthquakes, the lateral-load-resistance capacity is very low and for design

35
should be ignored (Breyer 1993). This deficiency triggers the inclusion of the
Vertical Irregularity Score Modifier, which is equal to –2.0.
Figure 11. FEMA 154 Recommended Benchmark Years (ATC 2002a, Table 2-2)

36
4.2 FEMA 356
Figure 12 shows the FEMA 356 process in flowchart format.
Figure 12. Rehabilitation Process using FEMA 356 (ASCE 2000b)

37
4.2.1 Prior Seismic Evaluation
Before an analysis is completed in accordance with FEMA 356, the structure
must already be designated as requiring rehabilitation. This can be
accomplished using any process for evaluating the existing structure, such as
the provisions of ASCE/SEI 31. The evaluation should be based on a specific
rehabilitation objective, similar or equivalent to those used in FEMA 356. The
evaluations performed for the test structures in accordance with ASCE/SEI 31
(included in this report) show that they are non-compliant and require
structural rehabilitation.
4.2.2 Review Initial Considerations
The design professional must review initial (existing) conditions, and
understand any other rehabilitation design considerations such as structural
characteristics of the building, site seismic and geologic hazards, results of
prior seismic evaluations, building use and occupancy, historic status,
economic considerations, societal issues, and local jurisdictional requirements
(ASCE 2000b).
• Structural Characteristics for Hoover School are primarily determined
from a review of the construction documents. General building layout,
member sizes, connection details, locations of doors and windows, and
other details are all available. The intended lateral load-resisting elements
are the diagonal “let-in” bracing in select walls. Several site visits have
been made to the school to verify the condition of the structure, check for
deterioration of structural elements, and investigate existing conditions
generally. There were no outward signs of deterioration or damage to the

38
structure. Several photographs taken during those site visits are included
in the Structure Descriptions.
• Site Seismic Hazards and Geologic Data were not available for the Hoover
Elementary School site. Default values prescribed in FEMA 356 are used
for this analysis.
• Prior Seismic Evaluations of Hoover Elementary School include
evaluation in accordance with ASCE/SEI 31 and indicates the need for
structural rehabilitation. (Details on the assumptions and methods used for
this evaluation are included in this report.)
• Building Use and Occupancy: Typically schools are not treated in building
codes with a higher degree of importance than other non-essential
facilities. However, the local Red Cross has designated Hoover School as a
disaster shelter facility in the event of an earthquake or other emergency.
Building Use and Building Occupancy are not considered explicitly in
FEMA 356.
• Other Considerations: The building is not considered “historic” by the
community and it is assumed that there are no restrictions on the materials
or methods that can be used in the rehabilitation.
4.2.3 Select Rehabilitation Objective
The building owner or code official should select a Rehabilitation Objective for
the building. Rehabilitation Objectives are goals which consist of a Target
Building Performance Level and a Seismic Hazard Level. For this theoretical
analysis, the author makes these selections.

39
4.2.3.1 TARGET BUILDING PERFORMANCE LEVEL
Target Building Performance Levels represent a combination of the Structural
Performance Level and Nonstructural Performance Level.
Structural Performance Level
FEMA 356 defines four discrete Structural Performance Levels:
Immediate Occupancy (S-1), Life Safety (S-3), Collapse Prevention (S-5)
and Not Considered (S-6). Intermediate Structural Performance Ranges
are also allowed: Damage Control Range (S-2) and Limited Safety
Range (S-4). Definitions of each Structural Performance Level are
provided in the document, and the Structural Performance Ranges
represent the full range of damage between adjacent Structural
Performance Levels. General descriptions of expected damage for each
building type are also provided in the commentary to help the owner
make the appropriate performance level selection.
The Immediate Occupancy Performance Level (S-1) is defined as “the
post-earthquake damage state that remains safe to occupy, essentially
retains the pre-earthquake design strength and stiffness of the
structure, and is in compliance with the acceptance criteria specified in
this standard for this Structural Performance Level” (ASCE 2000b). The
Commentary indicates that the structural damage level at this
Performance Level is very low, and the basic gravity- and lateral-load-
resisting systems remain intact. Some minor structural repairs may be
needed, but would not be required before reoccupying the building.
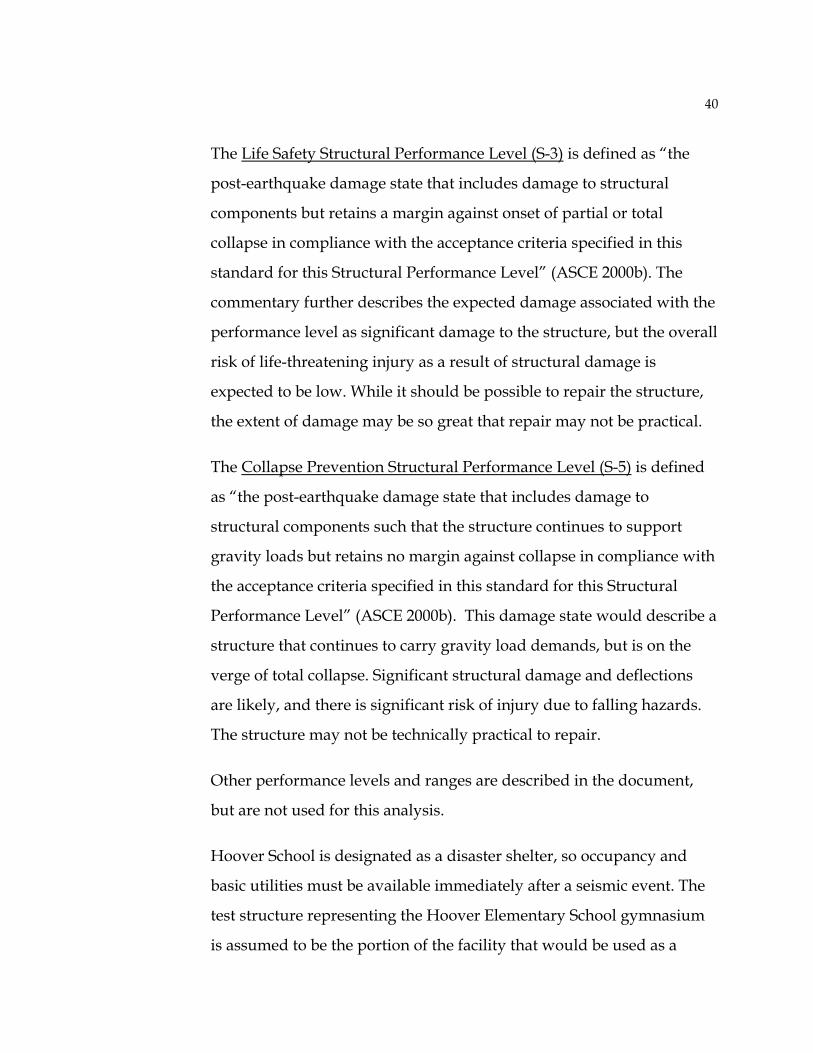
40
The Life Safety Structural Performance Level (S-3) is defined as “the
post-earthquake damage state that includes damage to structural
components but retains a margin against onset of partial or total
collapse in compliance with the acceptance criteria specified in this
standard for this Structural Performance Level” (ASCE 2000b). The
commentary further describes the expected damage associated with the
performance level as significant damage to the structure, but the overall
risk of life-threatening injury as a result of structural damage is
expected to be low. While it should be possible to repair the structure,
the extent of damage may be so great that repair may not be practical.
The Collapse Prevention Structural Performance Level (S-5) is defined
as “the post-earthquake damage state that includes damage to
structural components such that the structure continues to support
gravity loads but retains no margin against collapse in compliance with
the acceptance criteria specified in this standard for this Structural
Performance Level” (ASCE 2000b). This damage state would describe a
structure that continues to carry gravity load demands, but is on the
verge of total collapse. Significant structural damage and deflections
are likely, and there is significant risk of injury due to falling hazards.
The structure may not be technically practical to repair.
Other performance levels and ranges are described in the document,
but are not used for this analysis.
Hoover School is designated as a disaster shelter, so occupancy and
basic utilities must be available immediately after a seismic event. The
test structure representing the Hoover Elementary School gymnasium
is assumed to be the portion of the facility that would be used as a

41
shelter. It includes a large assembly room, showers and restrooms, etc.
The Immediate Occupancy Structural Performance Level (S-1) is
selected for the gymnasium test structure.
The test structure representing the Hoover Elementary School
classrooms is assumed to NOT be required for use as a shelter, due to
the absence of any critical utilities. The Life Safety Structural
Performance Level (S-3) is selected for the classrooms test structure.
Nonstructural Performance Level
FEMA 356 defines five discrete Nonstructural Performance Levels,
consisting of Operational (N-A), Immediate Occupancy (N-B), Life
Safety (N-C), Hazards Reduced (N-D), and Not Considered (N-E).
Nonstructural components may consist of partitions, ceilings,
mechanical systems (HVAC, plumbing, fire protection), and electrical
systems. While rehabilitation for nonstructural items is not explicitly
addressed in this report, designation of a Nonstructural Performance
Level is required for assignment of the overall Target Building
Performance Level.
The Operational Nonstructural Performance Level (N-A) is defined as
“the post-earthquake damage state in which the nonstructural
components are able to support the pre-earthquake functions present in
the building” (ASCE 2000b). The Commentary further explains that it is
often necessary to provide emergency standby utilities to achieve this
performance level, as well as rigorous qualification testing of key
electrical and mechanical systems to ensure they remain functional
during or after strong shaking.

42
The Immediate Occupancy Nonstructural Performance Level (N-B) is
defined as “the post-earthquake damage state that includes damage to
nonstructural components, but building access and life safety systems –
including doors, stairways, elevators, emergency lighting, fire alarms,
and suppression systems – generally remain available and operable,
provided that power is available” (ASCE 2000b). The Commentary
indicates that some window breakage and other slight damage may
occur, and that normal building operations may be impaired while
minor cleanup takes place, the main mechanical and electrical systems
should be able to function. The risk of life-threatening injury due to
nonstructural damage is very low.
The Life Safety Nonstructural Performance Level (N-C) is defined as
“the post-earthquake damage state that includes damage to
nonstructural components but the damage is non-life threatening”
(ASCE 2000b). There may be significant damage to nonstructural
components, but they haven’t become dislodged or fallen such that
they would pose a threat to life safety. Repairs to the damaged systems
may be extensive.
Nonstructural Performance Not Considered (N-E) is an option in which
the nonstructural components are not considered in the building
rehabilitation. Other nonstructural performance levels are described in
the document, but are not incorporated into the analysis for this report.
A disaster shelter should only need the major mechanical and electrical
systems operational. Some minor damage to other systems requiring
cleanup would be acceptable, so the Immediate Occupancy
Nonstructural Performance Level (N-B) is selected for the gymnasium

43
test structure. More extensive damage, but not loss of life, is considered
acceptable for the classroom structure, so the Life Safety Nonstructural
Performance Level (N-C) is selected.
The Target Building Performance Level designation is a combination of the
selected structural and nonstructural performance levels. A selection matrix
for the Target Building Performance Level is provided in Table 1. For a
combination of Immediate Occupancy Structural Performance Level (S-1) and
Immediate Occupancy Nonstructural Performance Level (N-B), the Target
Building Performance Level for the gymnasium test structure is the
Immediate Occupancy Building Performance Level (1-B). For a combination
of Life Safety Structural Performance Level (S-3) and Life Safety Nonstructural
Performance Level (N-C), the Target Building Performance Level for the
classroom test structure is the Life Safety Building Performance Level (3-C).
The combination of Collapse Prevention Structural Performance Level (S-5)
and Nonstructural Performance Not Considered (N-E) will also be considered
Table 1. Target Building Performance Levels (ASCE 2000b)

44
for each structure as part of the analysis. The combination results in the
Collapse Prevention Building Performance Level (5-E).
4.2.3.2 SEISMIC HAZARD
The acceleration parameters required for construction of the design response
spectra are the short-period response acceleration parameter, SXS, and the
response acceleration parameter at a one-second period, SX1. The parameters
are dependent on proximity to geologic fault lines, as well as the selected
probability of occurrence.
Site class modifications are dependent on the properties of the soil at the site.
Where no site-specific soils data are available, and where there is no evidence
of soft clay soils (Class E) in the vicinity of the site, the default site class is
taken as Class D (ASCE 2000b). For Hoover Elementary School there is no site-
specific geologic data available, so the assumed site class is taken as Class D.
Acceleration Levels
The United States Geological Survey (USGS), as part of a joint effort with the
BSSC, developed Maximum Considered Earthquake (MCE) maps of the
United States. Values plotted represent ground accelerations for the short-
period response parameter, SS, and the acceleration parameter at the one-
second period, S1. These 2%/50 year maps plot the accelerations for which
there is a 2% probability that actual seismic accelerations may exceed the
plotted acceleration within a 50-year period. The 2%/50 year acceleration is
defined as the Maximum Considered Earthquake (MCE).
Maps are also provided which show the seismic accelerations for which there
is a 10% probability that actual seismic accelerations may exceed the plotted

45
acceleration within a 50-year period. The MCE and 10%/50 year spectral
accelerations are used to set the default design parameters, but the designer
may choose ANY return period for the rehabilitation design. Equations are
provided to convert the mapped values to any desired probability of
exceedance. The MCE and 10%/50 year acceleration values are used for this
analysis.
The USGS has made the mapped values available on the internet (U.S.
Geologic Survey 2003). The user can input a 5-digit zip code, and the SS (0.2
second) and S1 (1 second) spectral acceleration (SA) values are reported from
several probabilistic maps. The results of the online inquiry for zip code 97330
in Corvallis, Oregon are shown in Figure 13. SS=0.43g for 10% probability of
exceedance (PE) in 50 years, and 1.08g for 2%/50 years. S1=0.20g for 10%/50
years, and 0.47g for 2%/50 years.
Figure 13. USGS Probabilistic Accelerations

46
Earthquake Hazard Levels
Two basic Earthquake Hazard Levels are defined in FEMA 356: the Basic
Safety Earthquake 1 (BSE-1) and Basic Safety Earthquake 2 (BSE-2). BSE-1 uses
the lesser of (1) accelerations with a 10% probability of exceedance in 50 years,
modified for site class, or (2) two-thirds of the MCE spectral accelerations,
modified for site class. BSE-2 uses the MCE spectral accelerations, modified
for site class.
Adjustments to the SS and S1 values are applied according to the following
equations, FEMA 356 Eq. 1-4 and 1-5. Values of Fa and Fv are interpolated from
FEMA 356 Tables 2 and 3.
(Eq. 1-4)
(Eq. 1-5)
For Site Class D and SS=0.43g (10%/50 year recurrence), the interpolated value
of Fa=1.456. For SS=1.08g (2%/50 year recurrence), Fa=1.068. The
corresponding modified spectral response parameters SXS are 0.626 (10%/50
year recurrence) and 1.153 (2%/50 year recurrence). The smaller of 0.626 and
two-thirds of 1.153 gives the design BSE-1 value SXS=0.626.
For Site Class D and S1 = 0.20 (10%/50 year recurrence), the value of Fv = 2.
For S1 = 0.47 (2%/50 year recurrence), Fv = 1.530. The corresponding modified
spectral response parameters SX1 are 0.400 (10%/50 year recurrence) and 0.719
(2%/50 year recurrence). The smaller of 0.400 and two-thirds of 0.719 gives the
design BSE-1 value SX1=0.400.
SXS Fa SS⋅
SX1 Fv S1⋅

47
Table 2. Fa Values (ASCE 2000b)
Table 3. Fv Values (ASCE 2000b)

48
Figure 14. General Response Spectrum (ASCE 2000b)
The general response spectrum used by FEMA 356 is shown in Figure 14.
Spectral acceleration values are computed from the following:
for 0 < T < T0 (Eq. 1-8)
for T0 < T < TS (Eq. 1-9)
for T > TS (Eq. 1-10)
The values BS and B1 are based on the effective viscous damping ratio, β, of the
structure. The assumed value of β is 5%, except: (1) for structures without
exterior cladding, β=2%; (2) for structures with wood diaphragms and interior
Sa Sxs5Bs
2−⎛⎜⎝
⎞
⎠
TTs
⋅ 0.4+⎡⎢⎣
⎤⎥⎦
⋅
SaSxsBs
SaSx1B1 T⋅

49
partitions and cross walls that interconnect the diaphragm levels at a
maximum spacing of 40 ft. on center transverse to the direction of motion,
β=10%; (3) for structures rehabilitated using seismic isolation or enhanced
energy dissipation technologies, β is calculated using special methods. Hoover
School has exterior wood siding attached, so the first exception does not
apply. The interior partitions at the classroom structure do not extend to the
roof diaphragm, and those in the gymnasium are spaced greater than 40 ft.
Thus, the second exception also does not apply. Therefore the effective viscous
damping for this analysis is 5%. Values of BS and B1 are taken from the Table
4, and for 5% effective viscous damping, BS=1.0 and B1=1.0.
Table 4. Damping Coefficients (ASCE 2000b)
Period values TS and T0 are given by the expressions:
(Eq. 1-11)
TSSX1 BS⋅( )SXS B1⋅( )

50
(Eq. 1-12)
The combination of Target Building Performance Level and Seismic Hazard
lead to a Rehabilitation Objective selection. Objectives may be specified for
any expected seismic accelerations. The BSE-1 and BSE-2 acceleration levels
described in the document are used in this analysis.
The response spectrum for the BSE-1 and BSE-2 Earthquake Hazard Levels are
shown in Figure 15. As expected, the acceleration values for the BSE-2
Earthquake Hazard Level are higher than the BSE-1.
Figure 15. Response Spectra Lateral seismic load is applied to the structure as a percentage of the weight.
The formula for determining the seismic load is:
(Eq. 3-10)
where:
T0 0.2 TS⋅
V C1 C2⋅ C3⋅ Cm⋅ Sa⋅ W⋅

51
V = pseudo lateral load, lbf. C1 = inelastic displacement modification factor C2 = modification factor for combined effects factor for pinched
hysteresis shape, stiffness degradation, strength deterioration C3 = P-∆ modification factor Cm = higher mode mass participation factor Sa = response spectrum acceleration, ft/sec2 W = effective seismic mass, lbm.
C1 is a modification factor used to relate expected maximum inelastic
displacements to displacements calculated using the linear elastic
approximation. The factor is calculated from the fundamental period (T) and
characteristic period of the response spectrum (Ts). The value is determined as
shown in Table 5. For the classroom structure, C1=1.304 for Life Safety and
C1=1.298 for Collapse Prevention. For the gymnasium, C1=1.04 for Immediate
Occupancy and C1=1.027 for Collapse Prevention.
Table 5. C1 Factor (ASCE 2000b) Criteria C1
T < 0.10 sec 1.5
T >= Ts 1.0
0.10 sec <= T < Ts Interpolate between
0.10 sec and Ts
C2 is a modification factor to represent the effects of pinched hysteresis shape,
stiffness degradation, and strength deterioration. This factor is always taken as
1.0 for linear analysis procedures (ASCE 2000b), which is the procedure used
in this report.
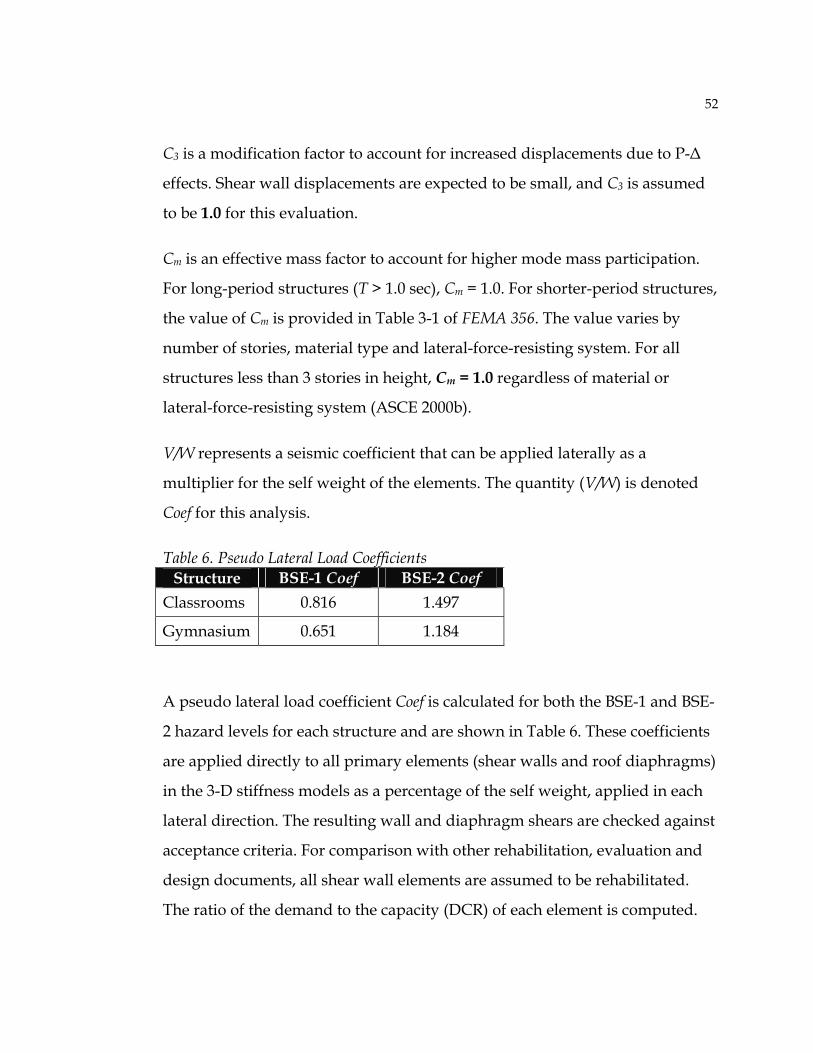
52
C3 is a modification factor to account for increased displacements due to P-∆
effects. Shear wall displacements are expected to be small, and C3 is assumed
to be 1.0 for this evaluation.
Cm is an effective mass factor to account for higher mode mass participation.
For long-period structures (T > 1.0 sec), Cm = 1.0. For shorter-period structures,
the value of Cm is provided in Table 3-1 of FEMA 356. The value varies by
number of stories, material type and lateral-force-resisting system. For all
structures less than 3 stories in height, Cm = 1.0 regardless of material or
lateral-force-resisting system (ASCE 2000b).
V/W represents a seismic coefficient that can be applied laterally as a
multiplier for the self weight of the elements. The quantity (V/W) is denoted
Coef for this analysis.
Table 6. Pseudo Lateral Load Coefficients Structure BSE-1 Coef BSE-2 Coef
Classrooms 0.816 1.497
Gymnasium 0.651 1.184
A pseudo lateral load coefficient Coef is calculated for both the BSE-1 and BSE-
2 hazard levels for each structure and are shown in Table 6. These coefficients
are applied directly to all primary elements (shear walls and roof diaphragms)
in the 3-D stiffness models as a percentage of the self weight, applied in each
lateral direction. The resulting wall and diaphragm shears are checked against
acceptance criteria. For comparison with other rehabilitation, evaluation and
design documents, all shear wall elements are assumed to be rehabilitated.
The ratio of the demand to the capacity (DCR) of each element is computed.

53
A zone of seismicity is defined as High, Moderate or Low as shown in Table 7.
All values are based on the spectral parameters for 10%/50 year recurrence
(ASCE 2000b). For Hoover School, SXS=0.626g and SX1=0.400g. These criteria
satisfy both requirements for the designation High Zone of Seismicity.
Table 7. Zone of Seismicity (ASCE 2000b) Zone of
Seismicity SXS SX1 Combination
High >= 0.5g >= 0.2g Both true
Moderate 0.167 <= SXS < 0.5g 0.067 <= SX1 < 0.2g Either true
Low < 0.167g < 0.067g Both true

54
Rehabilitation Objective Selection
Table 8. Rehabilitation Objectives Matrix (ASCE 2000b)

55
Rehabilitation objectives, with the associated Earthquake Hazard Levels and
Target Building Performances, are shown in matrix format in Table 8. The
Basic Safety Objective (BSO) is a defined objective that achieves the goals of
Life Safety Building Performance Level (3-C) for the BSE-1 Earthquake Hazard
Level and Collapse Prevention Building Performance Level (5-E) for the BSE-2
Earthquake Hazard Level (ASCE 2000b). These correspond to the matrix
values k and p.
An Enhanced Rehabilitation Objective is defined as either: (1) Target Building
Performance Levels that exceed those of the BSO at either the BSE-1 or BSE-2
hazard levels, or both, or (2) Target Building Performance Levels of the BSO
using an Earthquake Hazard Level that exceeds either the BSE-1 or BSE-2
hazard levels, or both. Enhanced Rehabilitation Objectives correspond to
matrix values to the left or below the BSO values (k and p).
The Target Building Performance Level selected for the gymnasium test
structure at the BSE-1 Earthquake Hazard Level is Immediate Occupancy (1-
B), which exceeds the Building Performance Level defined for the BSO. The
position in the matrix for this selection corresponds to letter j, which is
positioned to the left of the BSO entry of k. Thus, the rehabilitation for the
gymnasium structure is termed an Enhanced Objective. The Target Building
Performance Level for the BSE-2 Earthquake Hazard Level is Collapse
Prevention (5-E).
The Target Building Performance Level selected for the classroom test
structure at the BSE-1 Earthquake Hazard Level is Life Safety (3-C), which
corresponds to the matrix position k, the same as for the BSO. The Target
Building Performance Level selected for the BSE-2 Earthquake Hazard Level
is Collapse Prevention (5-E), which corresponds to matrix entry p, the same

56
as for the BSO. Thus, the Rehabilitation Objective for the classrooms test
structure is the Basic Safety Objective.
4.2.4 Obtain As-Built Information
The Corvallis 509J School District had archived the construction documents
from original construction of Hoover School and the Kindergarten addition.
No other documentation (specifications, as-built drawings, soils data, etc.) was
found.
A site visit was conducted to ascertain the general condition of the building.
The visible elements (roof, wall covering, doors, windows, etc.) were all as
shown on the construction drawings. No major differences in construction
were visible from what was shown in the drawings. An interior survey was
also made to verify some of the connections and structural systems that were
visible above the suspended ceilings. All major elements inspected were in
good condition.
A Knowledge Factor, κ, is prescribed to account for uncertainty in the
collection of as-built information. The level of knowledge is based on several
factors, as shown in Table 9.
As the Rehabilitation Objective for a portion of Hoover Elementary School is
an Enhanced Objective, the Level of Knowledge must qualify for either Usual
or Comprehensive. The difference between these levels is the degree of testing
performed. For wood buildings, when design drawings are available expected
strength materials properties may be verified by observing a material grade
stamp at one or more locations. It is assumed that grade stamps at one or more
locations can be easily observed during rehabilitation construction. This

57
Table 9. Data Collection Requirements (ASCE 2000b)
qualifies as the minimum testing required for compliance with
Comprehensive Testing (ASCE 2000b). Thus, the Knowledge Factor is equal to
1.00. If visual inspection of grade stamps is not possible during construction,
the knowledge factor is equal to 0.75. This analysis will use both levels of
knowledge and offer a comparison of results.
4.2.5 Select Rehabilitation Method
Two rehabilitation methods are defined in FEMA 356, the Simplified
Rehabilitation Method and the Systematic Rehabilitation Method. To achieve
the Basic Safety Objective or an Enhanced Objective, the Simplified
Rehabilitation Method is not permitted (ASCE 2000b). The Systematic
Rehabilitation Method is used for both test structures.
4.2.6 Systematic Rehabilitation
The steps in a Systematic Rehabilitation include identification of deficiencies,
selection of the rehabilitation strategy, use of an appropriate analysis

58
procedure, and giving consideration to general requirements as described
below.
Consider Deficiencies
The lateral-force-resisting system at Hoover Elementary School was designed
as vertical stud walls with 1x6 diagonal let-in wood bracing. Starting with the
1994 UBC this construction method was disallowed for resisting lateral loads
in Seismic Zones 2B and higher (ICBO 1994). The method is not included at all
in FEMA 356, and no existing properties are provided for this system. A
system is discussed which includes horizontal lumber sheathing with
diagonal let-in bracing, but the commentary notes that the braces typically fail
at very low loads and any initial benefit from the braces is lost.
Experience in the 1971 San Fernando earthquake demonstrated the
inadequacy of diagonal let-in braces. Many either failed in tension or pulled
out of the bottom plate. It is common to set the lateral-load-resistance capacity
of this system to zero (Breyer 1993).
At the classroom roof diaphragms, the edges of the roof plywood are detailed
with blocking members only. Typical diaphragms include an edge member, or
“chord” to develop horizontal shear forces. The chord element must be
continuous or a series of elements connected with diaphragm ties. Stiffness
properties for “unchorded” diaphragms are provided in FEMA 356, and result
in approximately half the stiffness of a comparable “chorded” diaphragm.
During the CH2M Hill investigation this deficiency was deemed to be of high
enough importance that details were provided for the installation of
continuous steel straps to form a diaphragm chord (Baxter et al. 1999). For the
FEMA 356 analysis, it is assumed that these steel chord elements are installed.

59
Select Rehabilitation Strategy
Several rehabilitation strategies are defined and explained in FEMA 356. Local
Modification of Components is used when the major building components
have substantial strength and stiffness, but specific components are deficient.
This method is typically appropriate when only a few components require
rehabilitation. As the entire lateral-force-resisting system at both test
structures is inadequate, Local Modification of Components is not an
appropriate strategy.
Removal or Lessening of Existing Irregularities is an acceptable method when
irregularities such as changes in stiffness, mass or strength are present. Such
differences may be apparent between adjacent stories of a structure, and may
be the result of a discontinuity in the structure. Each of the test structures are
regular-shaped and single story; Removal or Lessening of Existing
Irregularities is not an appropriate strategy.
Mass Reduction may be an effective means of reducing the seismic forces
developed in a structure. Reductions may include demolition of upper stories,
removal of heavy wall cladding, or relocation of heavy equipment. The wood-
frame construction of the test structures is relatively light, so Mass Reduction
is not an appropriate strategy.
Seismic Isolation and Supplemental Energy Dissipation are typically
employed to resist especially high seismic forces or deformations, or to protect
important building contents from damage. Heavy, stiff, historic structures are
a common application for base isolation. The level of force required to make
these strategies viable is far beyond the forces which are developed in the test
structures, so they are not appropriate in this case.

60
Global Structural Stiffening and Global Structural Strengthening are two
strategies that involve the addition of structural elements to increase the
stiffness or strength of existing elements. Construction of new shear walls is
an effective way to increase both stiffness and strength. Both strategies are
appropriate and necessary for the rehabilitation of the test structures due to
the very flexible, weak system of let-in bracing currently in place.
Select Analysis Procedure
Five analysis procedures are described in FEMA 356: Linear Static Procedure
(LSP), Linear Dynamic Procedure (LDP), Nonlinear Static Procedure (NSP),
Nonlinear Dynamic Procedure (NDP) and Alternative rational analysis. The
LSP is the design method most often used during design, and is the method
used in the other analyses in this report. If applicable, LSP is the preferred
method of analysis for this evaluation.
Compliance with several criteria are required for the LSP to be applicable. For
either of the linear methods to be applicable, the structure must respond to the
design earthquake in a nearly elastic manner. Limitations on building
irregularity and component force demands help the designer predict elastic
response. A static analysis provides good approximation of building response
if the structure has nearly-uniform building properties and a low fundamental
building period. To qualify, the structure must meet specific criteria.
Limitations on use of linear procedures are, in part, dependent on the
structure having a regular configuration. Four irregularities are defined; the
presence of any may force the designer to use a nonlinear procedure. If none
of these irregularities is present, the LSP are acceptable.

61
In-Plane Discontinuity Irregularity, Out-of-Plane Discontinuity Irregularity,
Severe Weak Story Irregularity and Severe Torsional Strength Irregularity all
relate to the relative stiffness of primary elements in the lateral-force-resisting
system from one story to an adjacent story. Since Hoover School is comprised
of single-story structures, these irregularities are not present and LSP are
applicable.
After verifying the applicability of the linear procedures, the user must then
decide whether the static procedure may be used. There are five criteria, four
of which relate to dimensional and stiffness properties from story to story.
Since the structures at Hoover School are all single-story, none of these criteria
apply or need to be checked. The remaining criterion states that for use of the
LSP, the fundamental period of the building must not be greater than or equal
to 3.5 times the characteristic period of the response spectrum TS. This check is
made during the analysis computations, and for each test structure this
criterion is met. Thus, the LSP is an appropriate analysis method.
The following general design requirements are applicable for any building for
which the systematic seismic rehabilitation method is selected. These
requirements include modeling as well as detailing requirements.
Multidirectional Seismic Effects
Unless the building has a plan irregularity or a primary column that is
part of two or more braced intersecting braced frames, the structure
need only be checked with seismic forces applied from a single
direction parallel to each main axis of the building. The classroom and
gymnasium test structures do not have any of the listed plan

62
irregularities, nor do they have any primary columns or braced frames.
Multidirectional Seismic Effects need not be included.
P- ∆ Effects
For linear procedures a stability coefficient must be calculated at each
story:
(Eq. 3-2)
where:
P = portion of the total weight of the structure including dead, permanent live, and 25% of transient live loads acting on the bearing walls, lbf.
V = Total calculated lateral shear force, lbf. h = height of the story, ft. δ = lateral story drift, ft.
If the stability coefficient is less than 0.1, the P- ∆ effects need not be
included. For the test structures, the ratio P/V = (DL + 25% * LL * W *
L) / (Coef * DL). The heights of the structures are known, and the
lateral story drift can be taken from the analysis. If the computed
stability coefficient is higher than 0.1 then the applied lateral load forces
must be increased. All stability coefficients are less than 0.1, so P- ∆
effects do not need to be included.
Horizontal Torsion
The effects of horizontal torsion are required to be included for the
analysis of all buildings without flexible diaphragms. FEMA 356
defines a flexible diaphragm as one for which the horizontal, in-plane
θP δ⋅
V h⋅

63
deflection is at least twice the lateral deflection of the story below. A
diaphragm is defined as rigid if the diaphragm deflection is less than
half the lateral story deflection, and is defined as stiff otherwise. Using
3-D models that include a single layer of diaphragm sheathing for each
structure, the displacements at the top of wall are extracted and the
average value computed. The maximum diaphragm deflection is also
taken from the model. The ratio of the maximum diaphragm deflection
to the average wall deflection is used to assign the appropriate
diaphragm classification. (See Appendix C: FEMA Calculations for
diaphragm deflection results.) The results of the 3-D models show that
the classroom area roof diaphragm is rigid and the gymnasium area
roof diaphragm is stiff. This rules out two-dimensional analysis for
either structure.
Actual horizontal torsional moment is calculated as the story seismic
shear multiplied by the eccentricity between the center of mass and the
center of rigidity. The test structures are modeled using 3-dimensional
finite-element models which account for any actual torsion
automatically.
Figure 16. Accidental Torsion

64
Accidental horizontal torsion is defined as the seismic story shear force
multiplied by a distance equal to 5% of the horizontal dimension of the
building perpendicular to the direction of applied seismic loading. This
quantity is intended to cover the effects of the rotational component of
the ground motion, differences between computed and actual stiffness,
and unfavorable distributions of dead and live load masses. The story
shear force for each roof diaphragm is equal to the dead load of the
diaphragm plus the top half of the walls perpendicular to the applied
shear, multiplied by the seismic coefficient, Coef. This force multiplied
by 5% of the building dimension perpendicular to the direction of load
represents the accidental horizontal torsion. To include this effect in the
3-D stiffness models, line loads are applied to the nodes at the edges of
the diaphragm as shown in Figure 16.
Increased forces and displacements due to accidental torsion must be
calculated when the accidental torsion is greater than 25% of the actual
torsional moment. Since there is insignificant actual torsion in the
rectangular-shaped structures, the effects of accidental torsion are
greater than 25% of the actual torsion. Thus, accidental torsion is
included.
An additional amplification factor must be applied to the accidental
horizontal torsional moment when the ratio of the maximum
diaphragm deflection to the average diaphragm deflection due to
actual loads and accidental torsion is greater than 1.2. A check of the
ratio of the maximum displacement to the average displacement for the
roof diaphragm elements resulted in a value of approximately 1.1.

65
Thus, the forces and displacements due to accidental torsion are not
further amplified in this analysis.
Overturning
Failing to meet the overturning requirements results in requirements
for increased anchorage of the structure to the foundation, or the
foundation to the soil. Since these requirements do not have an effect
on the required length of shear wall, and will not impact the results of
the wall length comparisons, overturning is not checked for this
analysis.
Continuity
All elements are required to be tied together into a complete load path
for the transfer of lateral forces. This level of detailing and document-
checking is beyond the scope of this research project.
Diaphragms
Diaphragms are the horizontal elements that transfer inertial forces to
vertical elements of the lateral-force-resisting systems.
Diaphragm Chords
Diaphragms are designated as “chorded” or “unchorded” depending
on whether a continuous diaphragm chord, a continuous wall or frame
element, or a continuous combination of both are provided. All Hoover
School roof diaphragms were originally designed and detailed with
continuous chord members except at the original classroom areas. The
expected shear stiffness of an unchorded diaphragm is half the value

66
for a chorded diaphragm. The rehabilitation detailing for the
diaphragm considered during the CH2M Hill design included the
addition of a steel strap diaphragm chord. This analysis assumes that
the steel strap is installed as a chord at the classroom roof diaphragms.
Diaphragm Collectors and Diaphragm Ties
These requirements address collection of shear forces at boundaries or
other discontinuities in the diaphragms. Since both test structures are
regular in shape, no discontinuities are present and these provisions do
not apply.
Walls and Nonstructural Components
These requirements relate to out-of-plane force transfer between the
diaphragm and vertical wall elements, or the anchorage of
nonstructural components. This detailed connections check is an
important part of a complete design, but does not directly affect the
evaluation of the shear wall or roof panels and is beyond the scope of
this research project.
Structures Sharing Common Elements and Building Separation
The test structures act independently of any other structure.
Vertical Seismic Effects
The effects of vertical seismic loads must be considered only for:
1. Cantilever elements and components
2. Pre-stressed elements and components

67
3. Structural components for which the gravity load demands
exceed 80% of the nominal capacity of the component.
None of the primary elements are cantilevered or pre-stressed
elements. The lightweight framing is also loaded at much less than 80%
of the vertical load capacity.
4.2.7 Perform Rehabilitation Design
This portion of the project includes the development and analysis of the
mathematical models. Development of each mathematical model includes
determination of appropriate stiffness values for each of the element types, as
well as formation of the virtual model elements within a finite-element
program.
Nearly all elements in a structure will affect the building’s overall stiffness
and response to lateral loads. Primary elements and components are those that
provide capacity of the structure to resist collapse under seismic forces.
Secondary elements and components are all that are not classified as Primary.
For linear analysis procedures, only the stiffness and lateral load resistance of
Primary elements are included.
For the test structures, the designated Primary elements and components are
the roof diaphragms and exterior shear walls. Other internal walls, framing,
and construction in the Hoover Elementary School buildings are classified as
Secondary elements and components, and therefore are not included in the 3-
D models.
Material properties for wood elements are provided in Chapter 8 of FEMA
356. The existing lateral-force-resisting system is not given any stiffness or

68
strength properties; not only is the “let-in” bracing system very weak, but
Section 8.5.1 states that different walls sheathed with dissimilar materials
along the same line of lateral-force resistance shall be analyzed based only on
the wall sheathing with the greatest capacity. Thus, only stiffness values for
new shear wall elements and existing or new roof diaphragms are computed
and assigned in the model.
The material type used for the shear wall elements and roof diaphragms is
“Wood Structural Panel Sheathing.” A “panel” refers to plywood nailed to
structural members, and a series of panels makes up a shear wall or roof
diaphragm element. In these formulations, the word “panel” may be used in
place of “shear wall.”
Shear Wall Element Formulation
The general equation for stiffness of wood structural panel sheathing (or shear
wall) is:
(Eq. 8-2)
where:
∆y = Deflection of panel at yield, in. vy = Shear at yield in the direction under consideration, lbf/ft h = Shear wall height, ft. E = Modulus of elasticity of boundary member, psi A = Area of boundary member cross section, in2 b = Shear wall width, ft. G = Modulus of rigidity of wood structural panel, psi t = Effective thickness of wood structural panel, in.
∆y8 νy⋅ h3
⋅
E A⋅ b⋅
νy h⋅
G t⋅+ 0.75 h⋅ en⋅+
hb
⎛⎜⎝
⎞⎠
d⋅+

69
da = Deflection at yield of tie-down anchorage or deflection at load level to anchorage at end of wall, in.
en = Nail deformation at yield load per nail, in.
As the computed deflection is intended to be at yield of the panel, the yield
strength must be a known quantity. FEMA 356 does not include any strength
values for wood structural panel sheathing but provides criteria for
determining the strength based on testing. An alternative method is to use
strengths calculated using LRFD-based values in an approved code, taken as
the nominal strength with φ = 1.0, and multiplied by 0.8 for plywood. The
commentary references the 2000 Edition of NEHRP Recommended Provisions for
Seismic Regulations for New Buildings and Other Structures (BSSC 2001a) for
nominal strength values.
For this analysis, the new shear wall panels are assumed to be ½-in C-D
plywood with 8d common nails at 6 in. on center edge nailing. Because ½”
sheathing is not listed, values for 15/32” sheathing are used. The factored
shear resistance for this panel type is taken from Table 12.4.3-2a in FEMA 368
(BSSC 2001a) as 340 lbf/ft. The table footnotes state that the tabulated values
are based on φ = 0.65. An excerpt of Table 12.4.3-2a is shown in Table 10. The
yield shear force is equal to the factored shear resistance, divided by 0.65,
multiplied by 0.80.
Typical shear wall height at the classrooms is taken as h = 9ft for the purpose
of formulating the material stiffness. Gymnasium shear walls are taken as h =
21ft + 4in.

70
Table 10. Factored Shear Resistance in Kips per Foot for Seismic Forces on Structural Use Panel Shear Walls (BSSC 2001a, Table 12.4.3-2a)
The boundary members at the ends of the shear panels are typical framing
members, 2x6 framing studs. The actual material grade of the wall studs is not
included on the plans, so the modulus of elasticity of the studs is assumed to
be E = 1600ksi and the cross-sectional area is A = (1.5in) x (5.5in) = 8.25in2.
To obtain the value for modulus of rigidity of the wood structural panel, the
designer is referred to the Plywood Design Specification (APA 1997b). Table 11
shows various plywood properties, including the modulus of rigidity, G. The
wood species is assumed to be Douglas-Fir native to Oregon, which is

71
classified as Species Group 1. The sheathing is assumed to be rated APA C-D
Plugged, with exterior glue specified. This combination qualifies for Grade
Stress Level 2. The panels are assumed to be used in the dry condition, so the
modulus of rigidity, G = 90,000 psi.
The CH2M Hill rehabilitation scheme specified Simpson PHD tie-down
anchors at each end of the new shear wall panels (Baxter et al. 1999). This
analysis assumes that Simpson PHD2-SDS3 anchors are in place. These are
similar to a lag-bolt connection, and the document allows a default
deformation at yield for lag bolt connections of da = 0.10 in.
Nail deformation for 8d nails is given in the document as en = 0.08 for
Structural I grade panels. This value must be multiplied by 1.2 for other panel
grades, and C-D is the assumed grade for this analysis. Thus, en = 1.2 x 0.08 =
0.096.
The remaining variable in Equation 8-2 is the panel width b. Since this
quantity will be varied in the model based on assumed panel lengths, the
panel deflection cannot be directly calculated. It is also noted that ∆y is not
directly or inversely proportional to the quantity b, and the panel deflection is
not linearly related to the panel width.
To overcome the nonlinear relationship between the panel deflection and the
panel width, a series of trial calculations and finite-element models was run to
calibrate the calculated deflection to the modeled element behavior. Models
were comprised of 1 ft. x 1 ft. plate elements and the panel capacity applied at
each node along the top of the modeled wall. For any given width b the
material constant E within the finite-element model was varied until the
predicted deflection per Equation 8-2 was achieved. This results in the

72
Table 11. Allowable Plywood Stresses (APA 1997b)
following relationship between modeled material stiffness and shear wall
length, as shown in Figure 17 for classroom walls and Figure 18 for the
gymnasium walls. The input and output of one such test model is included in
the appendices of this report.

73
0 5 10 15 20 250
50
100
150
200Element Stiffness
Wall Length
Mat
eria
l Sti
ffne
ss
Ez
ksi
bz
ft
Figure 17. Classroom Shear Wall Element Stiffness Value “E”
0 10 20 30 40 500
100
200
300Element Stiffness
Wall Length
Mat
eria
l Sti
ffne
ss
Ez
ksi
bz
ft
Figure 18. Gymnasium Shear Wall Element Stiffness Value “E” The actual computed wall stiffness, defined as the design load capacity
divided by the wall deflection, is shown in Figure 19 for the classroom
structure and in Figure 20 for the gymnasium. The calibrated E values also
result in linear stiffness with respect to wall length.

74
0 5 10 15 20 250
5
10
15Wall Stiffness
Wall Length
Wal
l Sti
ffne
ss kwall z
kipin
bz
ft
Figure 19. Classroom Shear Wall Stiffness
0 10 20 30 40 500
5
10
15Gymnasium Wall Stiffness
Wall Length
Wal
l Sti
ffne
ss kwall z
kipin
bz
ft
Figure 20. Gymnasium Shear Wall Stiffness
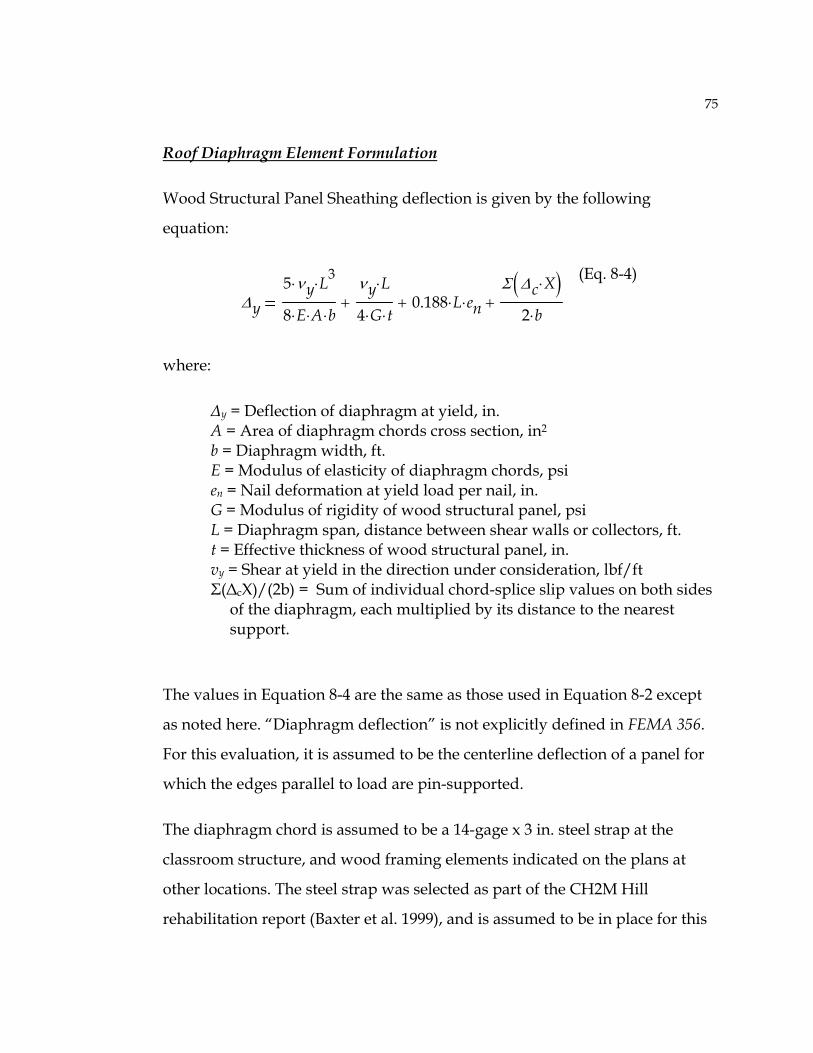
75
Roof Diaphragm Element Formulation
Wood Structural Panel Sheathing deflection is given by the following
equation:
(Eq. 8-4)
where:
∆y = Deflection of diaphragm at yield, in. A = Area of diaphragm chords cross section, in2 b = Diaphragm width, ft. E = Modulus of elasticity of diaphragm chords, psi en = Nail deformation at yield load per nail, in. G = Modulus of rigidity of wood structural panel, psi L = Diaphragm span, distance between shear walls or collectors, ft. t = Effective thickness of wood structural panel, in. vy = Shear at yield in the direction under consideration, lbf/ft Σ(∆cX)/(2b) = Sum of individual chord-splice slip values on both sides
of the diaphragm, each multiplied by its distance to the nearest support.
The values in Equation 8-4 are the same as those used in Equation 8-2 except
as noted here. “Diaphragm deflection” is not explicitly defined in FEMA 356.
For this evaluation, it is assumed to be the centerline deflection of a panel for
which the edges parallel to load are pin-supported.
The diaphragm chord is assumed to be a 14-gage x 3 in. steel strap at the
classroom structure, and wood framing elements indicated on the plans at
other locations. The steel strap was selected as part of the CH2M Hill
rehabilitation report (Baxter et al. 1999), and is assumed to be in place for this
∆y5 νy⋅ L3
⋅
8 E⋅ A⋅ b⋅
νy L⋅
4 G⋅ t⋅+ 0.188 L⋅ en⋅+
Σ ∆c X⋅( )2 b⋅
+

76
evaluation. (The alternative is no chord at all, which does not meet FEMA 356
requirements for diaphragm evaluation.) Diaphragm stiffness and area values
are different for each roof diaphragm type.
Diaphragm width is taken as the dimension of the diaphragm parallel to the
applied load. This is also equal to the length of supports for the diaphragm in
the stiffness model. Diaphragm span is the distance between shear wall
supports, and is taken directly from the construction documents. The effective
thickness of diaphragm panels is also taken directly from the construction
documents, and varies from structure to structure.
Factored shear resistance of the diaphragms is taken from Table 12.4.3-1a of
the NEHRP Recommended Provisions for Seismic Regulations for New Buildings
and Other Structures (BSSC 2001a). An excerpt is shown in Table 12. The table
provides a set of values for Structural I panel grades, and another set of values
for all other panels. For consistency with other evaluations and design checks,
it is assumed that the panels at Hoover School are Exterior C-D grade. The
assumed edge nailing is 10d @ 4 in. for ¾-in. diaphragms, and 10d @ 6 in. for
5/8-in. diaphragms. The factored shear resistance for ¾-in. (23/32-in.)
diaphragms is 840 lbf/ft, and the factored shear resistance for 5/8-in. (19/32-
in.) diaphragms is 420 lbf/ft. The yield shear force is equal to the factored
shear resistance divided by 0.65.
Chord splice-slip values are assumed to be zero. Actual locations of splices
and magnitude of slip across those joints are not known, and FEMA 356 does
not provide any guidance for making an assumption in the absence of known
data for this value. The effect of the zero slip assumption is not expected to
have a material effect on the results of the analysis and comparisons.

77
Table 12. Factored Shear Resistance in Kips per Foot for Horizontal Wood Diaphragms (BSSC 2001a, Table 12.4.3-1a)
Equation 8-4 is not a linear expression in terms of load or geometry. Therefore,
a series of trial calculations and finite-element models were run to calibrate
the calculated deflection to the modeled element behavior. A test model was
set up for each roof diaphragm and the material stiffness adjusted until the
calculated diaphragm deflection was achieved in the model.
FEMA 356 provides no guidance for the setup of such test models. For this
analysis, the diaphragms are assumed to be pinned-connected at the wall

78
lines. Each diaphragm model consists of half the width of roof for a given
direction of load (East and South), with the symmetry “cut line” of the
diaphragm at the center of the diaphragm span. Nodes along that centerline
are restrained for symmetry against rotation about their “z” or “outward”
axis, and are allowed only to translate in the direction of load.
The shear load vy is applied as a series of point loads along the diaphragm
centerline. This induces an equivalent uniform shear at the supported edge of
the model. The “E” value is adjusted until the lateral deflection matches the
deflection given by Equation 8-4. An example of the deflected shape for the
classroom structure roof diaphragm is shown in Figure 21.
The equivalent “E” property derived from the finite element models for each
roof diaphragm is different for each seismic load direction because the values
of “L” and “b” are reversed. The average value of the roof diaphragm “E”
properties for the two lateral load directions, as shown in Table 13, is used as
Figure 21. Classroom Roof Diaphragm Model

79
Table 13. Roof Element Stiffness Values Element Stiffness (ksi)
Structure Diaphragm E/W Seismic Load
N/S Seismic Load
Average Value
Classrooms 83.2 82.7 82.95 Gymnasium 59.2 67.7 63.45
the combined “E” property of the diaphragm in the 3-D model of each
structure.
Finite Element Model Construction
FEMA 356 permits analysis using two-dimensional models when the specific
diaphragm stiffness criteria are met. Diaphragm classification as Flexible, Stiff
or Rigid is based on relative deflections of the diaphragm and shear walls.
Displacements taken from the finite-element models confirm that the
classroom structure roof diaphragm is rigid and the gymnasium roof
diaphragm is stiff. (Detailed calculations are provided in the Appendices.)
Thus, a two-dimensional analysis is not appropriate for the test structures.
Each building is modeled using plate elements for the walls and roof. The
material properties are assigned according to the results of the test modeling
for material “E” stiffness. All wall elements that are not part of a shear wall
are modeled with zero stiffness so that all shear is resisted by the new shear
panel elements.
Six Poisson ratios describe the behavior of orthotropic plywood panels, but a
single isotropic value is used in the finite-element model. A sensitivity
analysis on the effect of varied ratios showed that in-plane deformations of the
shear panels was not significantly affected by the Poisson ratio value used. An
average softwood value of 0.40 is used in the models (Bodig and Jayne 1993).

80
For the models which include a single layer of roof sheathing, the roof plate
elements are modeled as 0.75 in. thick at the classrooms and 0.625 in. thick at
the gymnasium. The weight density of these elements is equal to the estimated
total roof dead load (roofing, sheathing, trusses, joists, beams, ceiling, etc.),
divided by the element thickness. Thus, the elements represent the total roof
dead load. Where double sheathing layers are used, the estimated total roof
dead load is increased for the additional sheathing layer. The element
thickness is doubled to model a doubling of the in-plane element stiffness. The
weight density of the elements is decreased because the total weight increases
by a smaller percentage than the increase in element thickness.
For the models that include a single layer of wall sheathing, the wall plate
elements are modeled as 0.50 in. thick. The weight density of these elements is
equal to the estimated total wall dead load (framing, siding, gypsum,
insulation) divided by the element thickness. Thus, the elements represent the
total wall dead load. Where double sheathing layers are used, the estimated
total wall dead load is increased for the additional sheathing layer. The
element thickness is doubled to model a doubling of the in-plane element
stiffness, and the weight density of the elements is decreased because the total
weight increases by a smaller percentage than the increase in element
thickness.
The lateral seismic forces are “activated” by applying a factor of the element
self weight in the lateral (X- and Y-) directions. The factor is equal to the
calculated pseudo lateral load coefficient Coef.
Figure 22 depicts a typical classroom model, and Figure 23 shows a
gymnasium model. The program used for the analyses is MIDAS/GEN
version 5.8.1.

81
Figure 22. Typical Classroom Model
Figure 23. Typical Gymnasium Model All wall and roof elements are modeled as 1 ft. square to facilitate the
extraction of shear loads and reactions. This fine mesh size causes a
deterioration in the speed of model analysis, and is probably not necessary for
force output accuracy, but the author chose to use this mesh size for
convenience. Nodes at the base of the wall elements are fixed (no rotation or
translation), and all others are free (no restrictions).

82
The terms and variables in the calculation of the pseudo lateral load coefficient
Coef are described earlier in this report. Calculations for the pseudo lateral
load coefficient Coef for each facility, for each performance level, and for each
knowledge factor are included in Appendix C.
4.2.8 Verify Rehabilitation Design
The typical “design process” would involve iterating lengths of wall panels
(applying the appropriate material properties for each panel) until the
capacity in each panel and diaphragm is not exceeded. To compare the results
of methods used in this report, all available wall panels are assumed to be
upgraded. The resulting shear force in each panel is then compared with the
capacity of the panel to arrive at a Demand-to-Capacity Ratio (DCR). A DCR
greater than 1.0 indicates that the demand exceeds the capacity, and the
structural configuration is not acceptable. The DCR for each model
configuration and for each element can be compared with associated element
DCR’s from the other analysis, evaluation and design methods.
Primary components analyzed using linear procedures must be classified as
either deformation-controlled or force-controlled elements. Behaviors of these
element types are described by component force versus deformation curves,
as shown in Figure 24.
Deformation-controlled behavior is shown in the Type 1 curve. This behavior
type includes an elastic range (point 0 to point 1) followed by a plastic range
(points 1 to 3) with reserve strength for supporting gravity loads at point 3.
The response is defined as deformation-controlled when e > 2g on the curve.
That is, the element can experience relatively large deflections in the plastic
response range before loss of load-carrying capacity.

83
Figure 24. Component Force Versus Deformation Curves (ASCE 2000b, Figure 2-3) The Type 2 curve shows the response of a less-ductile material, one which can
absorb less deformation after yield than can a more ductile material. The Type
3 curve shows the response of a brittle material, and is designated force-
controlled. After reaching the yield stress (point 1 on the curve) the material
has very little or no reserve capacity.
Wood structures and connections are often ductile, and when used in shear
walls and diaphragms may deform well beyond the deformation at the elastic
limit and still maintain the ability to carry gravity loads. Thus, the acceptance
criteria for wood shear walls and diaphragms is considered deformation-
controlled. Examples of deformation- and force-controlled actions are shown
in Table 14.
Accounting for the component ductility is accomplished through the
assignment of an m factor. This Component demand modifier factor is
prescribed in FEMA 356 based on the material, element type, component
classification, panel dimensions and performance level. Table 15 shows the m
factors for the elements used in the Hoover School models. The factors are
based on the element dimensions h and b (height and length) for the shear
walls and L and b (length and width) for the roof diaphragms. The factors are

84
Table 14. Possible Deformation- and Force-Controlled Actions (ASCE 2000b)
Table 15. Wood "m" Factors, from FEMA 356 Table 8-3 Element Performance
Level m Factor
IO 1.7 LS 3.8 Shear Wall, h/b < 1.0 CP 4.5 IO 1.4 LS 2.6 Shear Wall, 2.0 < h/b < 3.5 CP 3.0 IO 1.4 LS 2.6 Diaphragm, L/b < 3.0 CP 3.0 IO 1.4 LS 2.6 Diaphragm, L/b = 4.0 CP 3.0

85
also different for the force level being investigated. For this analysis the
Immediate Occupancy (IO), Life Safety (LS) and Collapse Prevention (CP) levels are
used.
Linear interpolation of the tabular values is allowed for h/b ratios between 1.0
and 2.0, and for L/b ratios between 3.0 and 4.0. Shear Wall factors are for
“Wood Structural Panel Sheathing or Siding.” Diaphragm factors are for
“Wood Structural Panel, Blocked, Chorded.”
The general equation for the acceptance criteria for deformation-controlled
actions in Linear Procedures is:
(Eq. 3-20)
where:
m = Component or element demand modifier (factor) QCE = Expected strength of the component or element at the
deformation level under consideration QUD = Deformation-controlled design action κ = Knowledge factor
The “m” factor, knowledge factor and expected strength have been described
previously. The deformation-controlled design action is the wall shear for wall
elements, and the in-plane diaphragm shear for roof elements. QCE is the
expected strength of the wall or roof element as calculated for the stiffness test
models.
In a typical design check, the designer would increase the dimensions of the
shear wall or roof elements until the acceptance criteria equation was met. For
this analysis, however, all walls are assumed to be sheathed with one or two
m κ⋅ QCE⋅ QUD≥

86
layers of ½-in. C-D plywood, and the roof diaphragms are assumed to be
either single- or double-sheathed with the plywood shown on the drawings.
The ratio of QUD divided by (m * κ * QCE) is equal to the Demand-to-Capacity
Ratio, or DCR. A DCR value greater than 1 indicates the demand is greater
than the capacity, and the structural configuration is not acceptable. The
computed DCR for each structural component is compared with the DCR
values computed for the other analysis methods.

87
4.3 ASCE/SEI 31
The evaluation process is shown in Figure 25.
Figure 25. ASCE/SEI 31 General Provisions (ASCE 2003)

88
4.3.1 Evaluation Requirements
General evaluation requirements must be met before any analysis can begin.
These include: determine the level of investigation required, conduct a site
visit, define the desired level of performance, determine the level of seismicity,
and identify the building type.
Level of Investigation Required
Construction drawings for the Hoover School and the Kindergarten
Addition were available from the school district. No other data such as
specifications, soils reports, or physical testing results were available.
All data used for this report are taken from the available drawings or
the default values provided in ASCE/SEI 31.
Site Visit
Several site visits have been performed at Hoover School to verify the
existing conditions. The general condition of the structure is very good,
with no noticeable structural problems such as rot or excessive
deformations.
Level of Performance
The desired level of performance must be defined prior to the
evaluation. The two levels defined in the standard are Life Safety (LS)
and Immediate Occupancy (IO).
At the Life Safety Performance Level, the performance criteria include
(1) at least some margin against either partial or total structural collapse

89
remains following the earthquake, and (2) injuries may occur, but the
overall risk of life-threatening injury as a result of the structural
damage is expected to be low (ASCE 2003).
The Immediate Occupancy Performance Level is defined by the
following performance criteria: (1) following the design earthquake, the
basic vertical- and lateral-force-resisting systems retain nearly all of
their pre-earthquake, strength, and (b) very limited damage to both
structural and nonstructural components is anticipated during the
design earthquake that will require some minor repairs, but the critical
parts of the building are habitable (ASCE 2003).
Due to the emergency shelter designation by the local Red Cross
agency of the Hoover School, the gymnasium test structure is assigned
the Immediate Occupancy (IO) Performance Level. The classroom test
structure is assigned the Life Safety (LS) Performance Level. These
levels are similar in definition to the IO and LS Performance Levels
used in FEMA 356, however, the probability of achieving these
performance levels for an existing building is less than for a new or
rehabilitation design. A building which meets these provisions may or
may not meet similar performance level standards in a current code or
rehabilitation document.
Level of Seismicity
The level of seismicity shall be designed as low, moderate or high in
accordance with Table 16.

90
Table 16. Levels of Seismicity (ASCE 2003, Table 2-1)
The USGS has made the Maximum Considered Earthquake (MCE)
mapped values available on the internet (U.S. Geologic Survey 2003).
The user can input a 5-digit zip code, and the SS (0.2 second) and S1 (1
second) values are reported from several probabilistic maps. A more
detailed description of these acceleration values and the results of an
online query are is included in the FEMA 356 Analysis Assumptions
and Methods section of this report. The MCE values for Ss and S1 are
equal to 1.083g and 0.469g.
The parameters SD1 and SDS are a function of the parameters S1 and SS,
modified for soil properties:
(Eq. 3-5)
(Eq. 3-6)
where:
SDS = design short-period spectral acceleration parameter SD1 = design spectral acceleration parameter at one-second
period Fv, Fa = site coefficients
SD123
Fv⋅ S1⋅
SDS23
Fa⋅ SS⋅

91
The 2/3 factor is generally intended to provide a 50% margin of safety
between the force which causes the loss of the first primary element
and the force which causes collapse (ASCE 2003).
The site coefficients are provided in the document, and are functions of
the mapped MCE acceleration values and the site class. Fv values are
shown in Table 17 and Fa values are shown in Table 18.
Table 17. Fv Values, One Second Period (ASCE 2003, Table 3-5)
Table 18. Fa Values, Short Period (ASCE 2003, Table 3-6)
Where sufficient soil information is not known to appropriately assign
the site class, the assumed site class is D. The values of Fv and Fa are
interpolated as Fv=1.530 and Fa=1.068. The associated spectral
acceleration values are equal to SD1=0.479g and SDS=0.769g. Both
parameters meet the criteria to assign the Level of Seismicity equal to
High.

92
Building Type
The Wood Light Frames (W1) building type description is very similar
to the construction methods used for Hoover School. Descriptors that
match include: roof framing consists of wood joists or rafters on wood
studs at 24 in. on center or less, first-floor framing supported directly
on the foundation, foundation consists of concrete spread footings,
lateral forces resisted by wood frame diaphragms and shear walls, and
shear walls and roof diaphragm sheathing consist of plywood.
However, the main use-descriptor for this building type is single- or
multi-family dwellings, which does not describe the use of Hoover
School.
The Multi-Story, Multi-Unit, Residential (W1A) is building type is
similar to Building Type W1, but includes multiple stories with plan
areas at each floor greater than 3000 ft2. This description does not match
Hoover School, which has only a single story height.
Wood Frames, Commercial and Industrial (W2) includes commercial
and industrial buildings with a floor area of 5000 ft2 or more and
includes few if any interior walls. Other descriptors are similar to
Building Type W1.
Because the floor plan area of each test structure is more than 5000 ft2
and the majority of the descriptors for Building Type W1 match the
construction, Building Type W2 is selected for each structure.

93
4.3.2 Screening Phase (Tier 1) – Existing Structure
Figure 26. Tier 1 Process (ASCE 2003, Figure 3-1)

94
The ASCE/SEI 31 Tier 1 of the evaluation process is shown in Figure 26.
Benchmark Building Check
The construction drawings for Hoover Elementary School are marked with the
year 1967, so the structure was likely designed in accordance with the 1964
Uniform Building Code. Table 3-1 in ASCE/SEI 31 indicates that for Building
Type W2 and using UBC provisions, the Benchmark Building year is 1976.
Thus, Hoover School does not meet the Benchmark Building criteria and the
Tier 1 building evaluation is required. In addition, buildings originally
designed in accordance with UBC requirements but evaluated to the
Immediate Occupancy Performance Level are automatically disqualified from
Benchmark Building status because UBC provisions are at the lower, Life
Safety level.
Selection of Checklists
For buildings within a high level of seismicity and being evaluated to
Immediate Occupancy or Life Safety levels of performance, the Basic
Structural, Supplemental Structural (where applicable), Geologic Site Hazard
and Foundation, Basic Nonstructural, and Intermediate Nonstructural
checklists are all required. Buildings evaluated to the Immediate Occupancy
level of performance also use the Supplemental Nonstructural checklist.
Because this project is only concerned with the relative impacts that each
approach has on the structural rehabilitation, the Geologic and Nonstructural
checklists are not completed. During an actual building evaluation, however,
these checklists would all be required. Although not included in the list of
structural checklists in FEMA/SEI 31 section 3.7, the Supplemental Structural

95
Checklist for Building Type W2: Wood Frames, Commercial and Industrial is
assumed to be required and is included in this evaluation.
For each checklist statement, the reviewer marks the “C” if the item is
compliant, the “NC” if not compliant, or “N/A” if not applicable. Those items
that are marked “NC” will require further investigation. Because the same
construction methods were used and the same checklists are required for each
test structure, the statement responses are the same for both structures. A
description of each statement and the result for the test structures (before
rehabilitation) follow.
Basic Structural Checklist for Building Type W2: Wood Frames, Commercial
and Industrial
Building System
LOAD PATH: The “let-in” braces in the existing shear walls are
considered inadequate to carry any significant lateral load, and
therefore the lateral-force-resisting system is inadequate. NC
MEZZANINES: N/A
WEAK STORY: Each structure has only one story. N/A
SOFT STORY: Each structure has only one story. N/A
GEOMETRY: There are no changes in horizontal dimension of the
lateral-force-resisting system. C
VERTICAL DISCONTINUITIES: Vertical elements in the lateral-force-
resisting system are continuous to the foundation. C
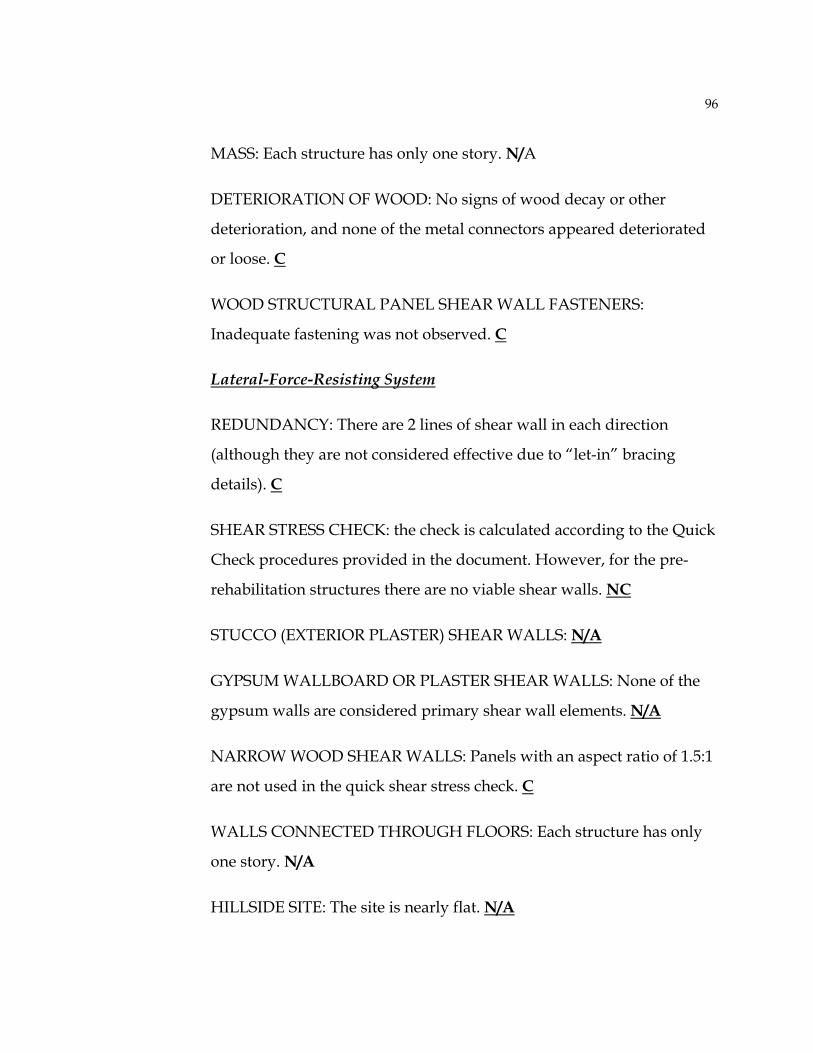
96
MASS: Each structure has only one story. N/A
DETERIORATION OF WOOD: No signs of wood decay or other
deterioration, and none of the metal connectors appeared deteriorated
or loose. C
WOOD STRUCTURAL PANEL SHEAR WALL FASTENERS:
Inadequate fastening was not observed. C
Lateral-Force-Resisting System
REDUNDANCY: There are 2 lines of shear wall in each direction
(although they are not considered effective due to “let-in” bracing
details). C
SHEAR STRESS CHECK: the check is calculated according to the Quick
Check procedures provided in the document. However, for the pre-
rehabilitation structures there are no viable shear walls. NC
STUCCO (EXTERIOR PLASTER) SHEAR WALLS: N/A
GYPSUM WALLBOARD OR PLASTER SHEAR WALLS: None of the
gypsum walls are considered primary shear wall elements. N/A
NARROW WOOD SHEAR WALLS: Panels with an aspect ratio of 1.5:1
are not used in the quick shear stress check. C
WALLS CONNECTED THROUGH FLOORS: Each structure has only
one story. N/A
HILLSIDE SITE: The site is nearly flat. N/A

97
CRIPPLE WALLS: There are no cripple walls present at either
structure. N/A
OPENINGS: The maximum opening percentage is at the North and
South walls of the classrooms where 50% of the wall length is openings.
N/A
Connections
WOOD POSTS: There are no wood posts in the structural system. N/A
WOOD SILLS: The drawings do not explicitly show or specify spacing
of sill bolts. Sills are assumed to be bolted to the foundation, which
could be verified through destructive investigation. C
GIRDER/COLUMN CONNECTION: Columns are not used in the
structural systems. N/A
Supplemental Structural Checklist for Building Type W2: Wood Frames,
Commercial and Industrial
Lateral-Force-Resisting System
HOLD-DOWN ANCHORS: For Immediate Occupancy performance
level, all shear walls must have hold-down anchors attached at the end
studs. Hold-down anchors are not indicated on the original
construction drawings, and are assumed to not be present. NC
Diaphragms
DIAPHRAGM CONTINUITY: Wood diaphragms do not include split-
level floors or expansion joints. C

98
ROOF CHORD CONTINUITY: At the classrooms roof diaphragm,
there is not a continuous chord member indicated in the drawings. NC
PLAN IRREGULARITIES: Each structure has a regular plan free from
re-entrant corners. N/A
DIAPHRAGM REINFORCEMENT AT OPENINGS: No diaphragm
openings greater than 50% of the area are present. N/A
STRAIGHT SHEATHING: There are no straight-sheathed diaphragms.
N/A
SPANS: Each roof diaphragm is comprised of wood structural panels.
C
UNBLOCKED DIAPHRAGMS: Each roof diaphragm is assumed to be
blocked. N/A
OTHER DIAPHRAGMS: Each roof diaphragm is comprised of wood. C
Connections
WOOD SILL BOLTS: spacing shall be 4 feet or less for Immediate
Occupancy. For this analysis, the spacing of wood sill bolts is assumed
to be in compliance. This could be verified by destructive investigation.
C
Deficiencies Summary
The use of “let-in” bracing at shear walls is assumed to be an inadequate
system for resisting lateral loads (LOAD PATH) and this very weak system
does not meet the SHEAR STRESS CHECK. Both of these deficiencies are

99
proposed to be addressed by the addition of wood structural panels (also
called shear walls) to provide adequate lateral shear resistance. The new shear
panels would require installation of panel HOLD-DOWN ANCHORS,
installed per accepted practice.
The roof diaphragm elements are lacking a continuous chord member (ROOF
CHORD CONTINUITY). The proposed rehabilitation is the installation of a
continuous steel nailer strap at the edge of the plywood diaphragm, per the
CH2M Hill report (Baxter et al. 1999).
4.3.3 Screening Phase (Tier 1) – Rehabilitated Structure
The previously-identified Tier 1 deficiencies for the existing structures will
now be re-evaluated assuming the proposed rehabilitations have been
provided.
Basic Structural Checklist for Building Type W2: Wood Frames, Commercial
and Industrial
Building System
LOAD PATH: Plywood-sheathed wall panels provides a continuous
load path for seismic forces. C
Lateral-Force-Resisting System
SHEAR STRESS CHECK: Shear stress in shear walls is computed using
the following equation:
(Eq. 3-12) ν
1m
VAw
⎛⎜⎝
⎞
⎠⋅

100
where:
υ = average shear stress in shear wall, lbf/ft m = component modification factor V = story shear (for 1-story building), lbf. Aw = total length of shear wall in direction of loading for wood-
framed buildings, ft.
The component modification factors m are shown in Table 19. For the
Immediate Occupancy screening level and a wood structure m = 2.0.
For the Life Safety screening level and a wood structure m = 4.0.
Table 19. Shear Wall m Factors (ASCE 2003, Table 3-7)
The pseudo lateral force V is calculated using the following equation:
(Eq. 3-1)
where:
V = Pseudo lateral force, lbf. C = Modification factor, taken from ASCE/SEI 31 Table 3-4 Sa = Response spectral acceleration at the fundamental building
period, ft/sec2 W = Effective seismic weight of the building, lbm.
V C Sa⋅ W⋅

101
Table 20. Modification Factors (ASCE 2003, Table 3-4)
The modification factors are shown in Table 20. For a single-story wood
building, C = 1.3. The building’s fundamental period is calculated as:
(Eq. 3-8)
where:
T = fundamental period, sec. Ct = 0.060 for wood buildings hn = height to roof level, ft. β = 0.75 (except for concrete or steel moment-resisting frames)
The height, hn, at the classrooms is taken as 9ft and at the gymnasium as
21ft 4in. The fundamental period, T, is 0.312sec at the classrooms and
0.596sec at the gymnasium.
The response spectral acceleration is related to the MCE accelerations
and fundamental period by the following expressions:
(Eq. 3-4)
where:
Sa = spectral acceleration, not greater than SDS
T Ct hnβ⋅
SaSD1
T

102
T = fundamental period of vibration of the building, sec. SD1 = design one-second spectral acceleration parameter
The values SDS and SD1 were calculated previously. The spectral
acceleration Sa = 0.769g at the classrooms and 0.769g at the
gymnasium, both controlled by the value of SDS.
The acceptable load in each shear panel can be computed based on the
checklist-specified allowable shear stress of 1,000plf for structural panel
sheathing. Re-arranging Equation 3-12, the required length of shear
wall equals:
where:
υ = 1,000 plf
Calculations for the required length of shear wall compared to the
actual length of shear wall are provided in the Results section of this
report. All panels meet the requirements to pass the Tier 1 SHEAR
STRESS CHECK. C
Supplemental Structural Checklist for Building Type W2: Wood Frames,
Commercial and Industrial
Lateral-Force-Resisting System
HOLD-DOWN ANCHORS: The proposed rehabilitation includes
installation of hold-down anchors at the end of each shear panel. C
Aw1m
Vν
⎛⎜⎝
⎞⎠
⋅

103
Diaphragms
ROOF CHORD CONTINUITY: The proposed rehabilitation includes
installation of a steel strap at the edges of the Classroom roof
diaphragms. C
4.3.4 Evaluation Phase (Tier 2) - General
FEMA 356 Table 3-3 provides the maximum number of stories, based on
building type and level of seismicity, beyond which a Full-Building Tier 2
analysis is required. For all single-story, wood-framed structures a Full-
Building Tier 2 analysis is not required. Thus, only those Tier 1 statements that
are Non-Compliant must be evaluated at a Tier 2 level. For each of the Tier 1
checklist statements an associated Tier 2 section is provided, and must be
checked for statements that are “NC”. Although all Tier 1 statements for the
rehabilitated structures are in compliance, the Tier 2 evaluation is included in
this report for comparison with other methods.
The Tier 2 evaluation includes Linear Static, Linear Dynamic, and Special
Procedures. The Linear Dynamic Procedure is required only when the
building is taller than 100 feet, or when a SOFT STORY, GEOMETRY or MASS
DISCONTINUITY exist. The Special Procedures are used only for
unreinforced masonry structures. Since none of the specified discontinuities
exist, and for the wood-frame building type, the Linear Static Procedure is
used for the Tier 2 analyses.
4.3.5 Evaluation Phase (Tier 2) – Existing Structure
The Tier 1 statements that were “NC” for the existing structure that relate to
the main lateral-force-resisting elements (the shear walls and roof

104
diaphragms) are checked using the Tier 2 evaluation. The rehabilitation
procedure is described for each.
Basic Structural Checklist for Building Type W2: Wood Frames, Commercial
and Industrial
Building System
LOAD PATH (Sec. 4.3.1.1): There is no Tier 2 Evaluation procedure for
this deficiency. Rehabilitation of the existing structure is required.
Lateral-Force-Resisting System
SHEAR STRESS CHECK (Sec. 4.4.2.7.1): A Linear Static Analysis is
required to check shear stresses. The procedures are similar to those
required in the Tier 1 analysis, but because no viable shear walls are
part of the existing structure this check is not compliant. Rehabilitation
of the existing structure is required.
4.3.6 Evaluation Phase (Tier 2) – Rehabilitated Structure
The Tier 2 analysis is performed assuming the addition of structural panel
sheathing has been performed to create viable shear walls. The analysis is
performed using either the Linear Static Procedure (LSP) or Linear Dynamic
Procedure (LDP). The LDP is used for buildings taller than 100 ft., those with
structural irregularities, or for other special building types. The test structures
meet all the requirements for the use of the LSP, which consists of the
following steps:
• Develop a mathematical building model
• Calculate the pseudo lateral force

105
• Calculate the lateral forces vertical distribution
• Calculate the building or component forces and displacements
• Calculate diaphragm forces
• Compare the component actions with the acceptance criteria.
Mathematical Building Model
Two-dimensional analysis is allowed either for (1) buildings with flexible
diaphragms, or (2) for buildings in which the torsional effects are insignificant.
Given the regular plan shape (i.e. no re-entrant corners, regular distribution of
shear walls) any torsional effects are minor. Thus, a two-dimensional model
is used for this analysis.
Inclusion of horizontal torsion due to accidental torsion is required. The
minimum applied torsion moment is equal to an offset of the seismic load by
5% of the dimension perpendicular to the direction of load. For a rectangular -
shaped building, the resulting shear transferred to one shear wall is 0.55*V, or
a 10% increase over the load calculated without accidental torsion (see Figure
27). The effects of shear load reduction at the opposite shear wall due to
horizontal torsion are ignored.
Components are classified as Primary or Secondary. Primary components are
those which are considered to resist seismic forces, and are the only
components required to be included in the model. The designated Primary
components are the roof diaphragms and exterior shear walls.

106
CL
5% * LV
L/2L/2
0.55 * V 0.45 * V
Figure 27. Force Increase for Accidental Torsion Seismic forces may be checked in each of the principal building directions
separately unless the building is torsionally irregular. The rectangular shape
of each test structure is torsionally regular; therefore inclusion of the effects
of multi-directional excitation are not required.
Pseudo Lateral Force
The pseudo lateral force is computed using the same procedure as for Tier 1.
Vertical Distribution of Seismic Forces
For a single-story structure, the load assigned to the roof diaphragm is based
on the assumed seismic weight for the roof, as well as the upper half of the
walls perpendicular to the direction of load. This assumption is the same
made for the 1997 UBC distribution of forces.
Calculate Building Forces and Displacements
Building forces are calculated for the shear walls, and are compared with the
acceptance criteria. Because the buildings are regular in shape, are
approximately symmetric about the centerline of the diaphragms in each

107
direction, and the wall panels are assumed to be flexible, the uniform shear to
the top of each panel is equal to the total shear multiplied by the ratio of the
panel length to the total lengths of all panels for a given load direction.
The assumption that the diaphragms are flexible elements is a typical design
assumption for wood-framed buildings. A procedure for determination of
diaphragm deflections, which would be used to verify this assumption, is not
provided in ASCE/SEI 31. This analysis is based on the assumption that the
wood roof diaphragms are flexible.
Calculate Diaphragm Forces
Since the diaphragm is symmetrically loaded and the structures are both
torsionally regular, the reactions to each shear wall line are equal. The
diaphragm load is calculated using the following formula for a one-story
building:
(Eq. 4-4)
where:
Fp = total roof diaphragm force, lbf. C = modification factor F = lateral force applied at roof level, lbf.
The modification factor is taken from Table 3-4 (ASCE 2003), and is equal to
1.3 for wood structures. The lateral force applied at the roof level is equal to
the pseudo lateral force for the roof component, plus the pseudo lateral force
for the upper half of the two walls perpendicular to the direction of seismic
loading.
Fp1C
F⋅

108
Compare Component Actions with Acceptance Criteria
Acceptance criteria are based on the classification of each component as either
Deformation-Controlled or Force-Controlled. Examples of each are given in
Table 21.
Shear in the wood shear walls and diaphragms are Deformation-Controlled
actions. (The diaphragm carries no lateral loads from elements in any story
above.) Other component actions, such as axial load and moment, are not
considered for this analysis. Also ignored for this analysis are the effects of
Table 21. Possible Deformation- and Force-Controlled Actions (ASCE 2003)
gravity loads, because only the lateral shear forces due to seismic loads are
investigated.

109
For Deformation-Controlled actions, the acceptance criteria is:
(Eq. 4-11)
where:
QCE = expected strength of the component, 1.25*nominal strength, lbf. QUD = load effect from seismic force, lbf. m = component demand modifier
The component nominal strength for shear walls is taken from the NEHRP
Recommended Provisions for Seismic Regulations of New Buildings and Other
Structures (BSSC 2001a). An excerpt from Table 12.4.3-2a is shown in Table 22.
For this analysis, the new shear wall panels are assumed to be ½-in. C-D
plywood with 8d @ 6 in. on center edge nailing (t = 0.5in). The factored shear
resistance for this panel type is 340 lbf/ft. The table footnotes state that the
tabulated values are based on φ = 0.65, which means the resistance values are
divided by 0.65 to arrive at yield values.
Component strength for the diaphragms is taken from Table 12.4.3-1a of the
NEHRP Recommended Provisions for Seismic Regulations for New Buildings and
Other Structures (BSSC 2001a). An excerpt is provided in Table 23. It is
assumed for this analysis that the diaphragm sheathing is Exterior C-D grade
(not Structural 1), and the assumed edge nailing is 10d @ 4 in. for ¾-in.
diaphragms, and 10d @ 6 in. for 5/8-in diaphragms. The factored shear
QCEQUD
m≥
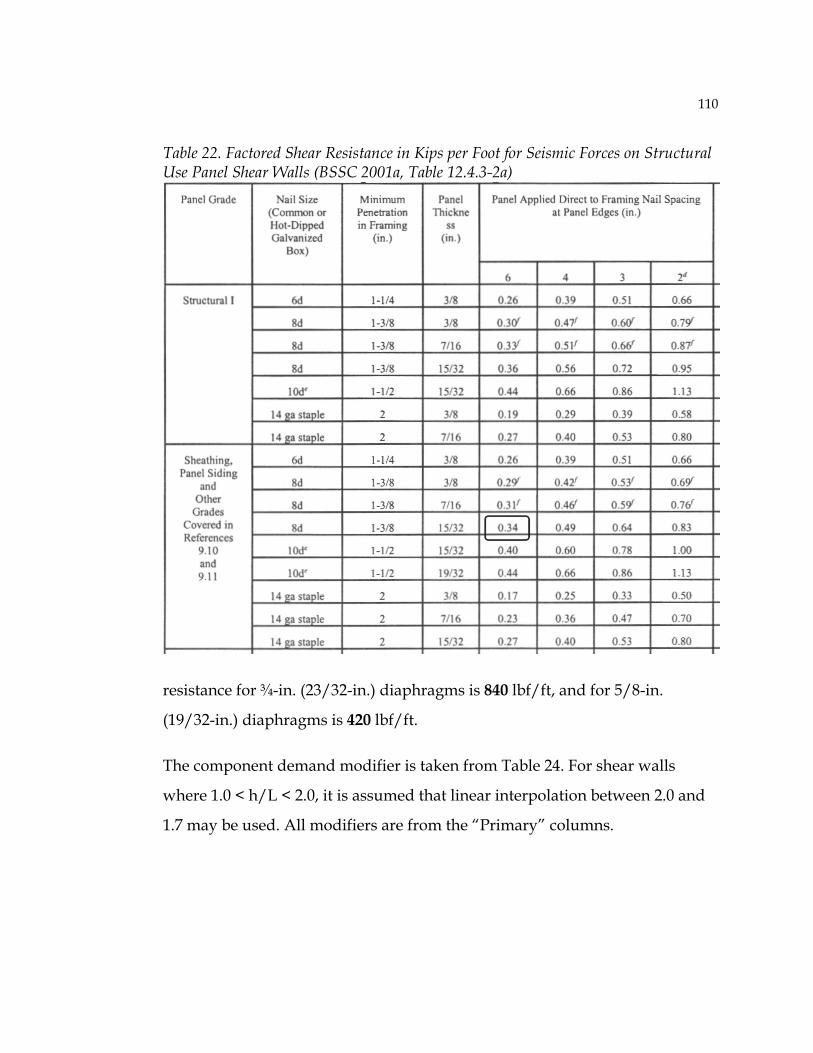
110
Table 22. Factored Shear Resistance in Kips per Foot for Seismic Forces on Structural Use Panel Shear Walls (BSSC 2001a, Table 12.4.3-2a)
resistance for ¾-in. (23/32-in.) diaphragms is 840 lbf/ft, and for 5/8-in.
(19/32-in.) diaphragms is 420 lbf/ft.
The component demand modifier is taken from Table 24. For shear walls
where 1.0 < h/L < 2.0, it is assumed that linear interpolation between 2.0 and
1.7 may be used. All modifiers are from the “Primary” columns.

111
Table 23. Factored Shear Resistance in Kips per Foot for Horizontal Wood Diaphragms (BSSC 2001a, Table 12.4.3-1a)
Table 24. m-Factors for Wood Components (ASCE 2003, Table 4-8)

112
For comparison with results for the other methods used in this report, a
Demand-to-Capacity (DCR) ratio is calculated for each panel and diaphragm.
The DCR for each component is equal to the REQUIRED length of shear panel
divided by the ACTUAL length of shear panel. If the resulting DCR is greater
than 1.0, that indicates the panel length is inadequate. It is assumed for this
analysis that all available panels are sheathed.
4.3.7 Detailed (Tier 3) Evaluation – Rehabilitated Structure
The Tier 3 evaluation is performed by repeating the analysis according to
FEMA 356 provisions, except the input forces are multiplied by 0.75. This
reduction factor is described in the Literature Review section of this report.
The Tier 3 Demand-to-Capacity Ratio (DCR) for each component is equal to
0.75 times the DCR from the FEMA 356 analysis.
4.4 1997 UNIFORM BUILDING CODE
The static force procedure in the 1997 UBC is used for this analysis. The
procedure is a linear, static approach as in the other rehabilitation and
evaluation documents used in this report. It is also the most commonly-used
method, and is appropriate for the design analysis of the test structures.
4.4.1 Design Base Shear
The total design shear (at ultimate strength level) is calculated from the
following equations:
(Eq. 30-4)
V
Cv I⋅
R T⋅W⋅

113
(Eq. 30-5)
(Eq. 30-6)
where:
V = the total design lateral force, lbf. Cv = seismic response coefficient Ca = seismic response coefficient I = importance factor R = overstrength and ductility factor T = fundamental building period, sec. W = total seismic dead load, lbf.
The seismic response coefficients are selected based on the seismic zone factor,
Z, and the appropriate soil profile type. Western Oregon is located in seismic
zone 3 as shown in Figure 28. Therefore Z = 0.30 from Table 25.
Soil profiles are defined based on soil properties such as shear wave velocity
and standard penetration blow counts. The soil type definitions are the same
as those used in the NEHRP-based documents. If inadequate information is
available to assign the soil profile based on the definitions, the default Soil
Profile Type is SD. Since no soils report is available, the default profile is used.
The seismic response coefficients Ca and Cv are obtained from Tables 26 and
27.
Using Z = 0.3 and soil profile type SD, the seismic response coefficients are Ca
= 0.36 and Cv = 0.54.
V2.5 Ca⋅ I⋅
RW⋅
V 0.11 Ca⋅ I⋅ W⋅

114
Figure 28. Seismic Zone Map (ICBO 1997, Figure 16-2)
Table 25. Seismic Zone Factor Z (ICBO 1997, Table 16-I)
Table 26. Seismic Coefficient Ca (ICBO 1997, Table 16-Q)
Table 27. Seismic Coefficient Cv (ICBO 1997, Table 16-R)

115
Table 28. Occupancy Category (ICBO 1997, Table 16-K)
The importance factor, I, is taken from Table 28. The local Red Cross has
designated Hoover School as an emergency shelter. It is assumed for this
analysis that only the gymnasium will be required in the case of an
emergency, and is assigned the importance factor I = 1.25. The classroom
structure is assigned the importance factor I = 1.00.
The overstrength and ductility factor is taken from Table 29. The structural
system for the Hoover School structures is a bearing wall system with light-
framed walls with shear panels, three stories or less. Thus, the ductility factor
R = 5.5.

116
Table 29. Structural Systems (ICBO 1997, Table 16-N)
The fundamental building period, T, may be computed from the following
expression.
(Eq. 30-8)
T Ct hn( )
34
⋅

117
where:
T = fundamental building period, sec. Ct = 0.020 for wood structures hn = height to roof, ft.
Using hn = 9 ft. for the classrooms and hn = 21 ft. 4 in. for the gymnasium, the
fundamental building periods are T = 0.104 sec for the classrooms and T =
0.199 sec for the gymnasium.
The quantity V/W (written Coef in the calculations) is equal to the seismic
coefficient which is applied to the dead load of the structure to represent the
design lateral force. The value of V is computed from equation 30-4, with the
expression in equation 30-5 representing an upper limit and the expression in
equation 30-4 the lower limit. The resulting lateral force coefficient Coef =
0.164 for the classrooms and Coef = 0.205 for the gymnasium. These
coefficients are multiplied by the structure weight to give the lateral strength-
level design force.
4.4.2 Earthquake Loads
The earthquake load, E, to be used for design is given below.
(Eq. 30-1)
where:
E = earthquake load, lbf. ρ = reliability / redundancy factor Eh = earthquake load due to the base shear, V, lbf. Ev = load effect due to vertical component of the earthquake ground
motion, lbf.
E ρ Eh⋅ Ev+

118
The vertical seismic load effect may be taken as zero for allowable stress level
forces.
The reliability /redundancy factor is given by the following expression.
(Eq. 30-3)
where:
ρ = reliability / redundancy factor, not less than 1.0 nor greater than 1.5 rmax = maximum element-story shear ratio AB = ground floor area, ft2
For shear walls, the element-story shear ratio is defined as the maximum value
of the product of the wall shear multiplied by 10/lw, where lw is the length of
wall in feet. For structures with flexible diaphragms (assumed for the test
structures), the wall shear is equal to the total diaphragm shear multiplied by
the ratio of the panel length divided by the sum of all panel lengths.
Substitution of terms reduces the expression for r to 10 divided by the sum of
all panel lengths (in feet). See Appendix E for a description of this algebraic
substitution. For each structure, ρ = 1.0 and E = V. To reduce the strength-level
forces to allowable stress level, the design loads E are divided by 1.4.
The seismic weight for diaphragm shear calculation is taken as the weight of
the roof elements plus the weight of the top half of each wall and panel
perpendicular to the direction of seismic load, multiplied by the seismic
coefficient Coef. The diaphragms do not meet the criteria for classification as
ρ 220
rmax AB⋅−

119
flexible (see Appendix C), so the roof diaphragm shear force is distributed to
each shear panel based on relative rigidities. To account for accidental torsion,
the diaphragm loads are increased by 10%.
Each panel (element of shear wall) also resists its own in-plane seismic load.
When added to the shear load from the roof diaphragm, the total load
represents the in-plane shear on the panel. This total load is compared to the
allowable panel shear.
4.4.3 Allowable Shear
The allowable shear load for a horizontal wood structural panel diaphragms
or wood structural panel shear walls is dependent on many factors. Those
directly considered by the 1997 UBC include panel grade, nail size, width of
framing members, edge nail spacing and panel blocking. Allowable shear
values for horizontal wood structural panel diaphragms are given in Table 30.
Allowable shear values for wood structural panel shear walls are given in
Table 31.
The classrooms roof sheathing is assumed to be grade C-D, ¾-in. plywood
with 10d @ 4 in. edge nailing. The thickest panel listed is 19/32-in., so the
allowable diaphragm shear is 425 plf. The gymnasium roof sheathing is
assumed to be grade C-D, 5/8-in. plywood with 10d @ 6 in. edge nailing. The
value for 19/32-in. is used, and the allowable diaphragm shear is 320 plf.
The new wall sheathing is ½-in. plywood, grade C-D, nailed with 8d @ 6 in.
The allowable panel shear is taken as 260 plf.

120
Where “double panel” calculations are performed, it is assumed that the
allowable shear forces are doubled. This would represent sheathing the wall
on both sides with plywood (inside and outside) to double the shear capacity.
Table 30. Allowable Shear (plf) for Horizontal Wood Structural Panel Diaphragms (ICBO 1997, Table 23-II-H)
The Demand-to-Capacity (DCR) ratio calculated for the 1997 UBC is equal to
the calculated shear in each element (at allowable stress force level), divided
by the allowable shear. Element DCR values greater than 1.0 indicate the
element capacity is inadequate to resist the calculated demand.

121
Table 31. Allowable Shear (plf) for Wood Structural Panel Shear Walls (ICBO 1997, Table 23-II-I)

122
5 RESULTS AND DISCUSSION
5.1 DESIGN RESULTS
5.1.1 FEMA 154
The final Structural Score S is determined by adding up the applicable scores
and modifiers noted during the survey. For the Hoover Elementary School,
the final S scores based on the “sidewalk survey” level of investigation are
equal to (3.8 – 0.8) = 3.0 which is above the cutoff value. Thus, the structures
would likely be considered adequate to resist seismic loads based on the RVS.
A review of the construction drawings for Hoover Elementary School shows
that the exterior shear walls were constructed with diagonal “let-in” bracing to
resist lateral loads. This construction method has been shown to perform
poorly in seismic events, and should not be considered a viable lateral-force-
resisting system (Breyer 1993). Thus, the VERTICAL IRREGULARITY Score
Modifier –2.0 should be taken for both structures, resulting in a Final
Structural Score of (3.8 - 2.0 - 0.8) = 1.0. Since this is below the cutoff value of
2.0, a more detailed evaluation is deemed appropriate.
5.1.2 FEMA 356
The Demand-to-Capacity Ratios (DCR) for the classroom roof and gymnasium
roof diaphragms are shown in Tables 32 and 33, respectively. A DCR less than
or equal to 1.0 represents an acceptable structural configuration.

123
Table 32. FEMA 356 Classroom Roof Diaphragm DCR
ThicknessE/W N/S E/W N/S E/W N/S E/W N/S
Single Layer 0.25 0.13 0.35 0.18 0.34 0.18 0.47 0.24Double Layer 0.15 0.08 0.21 0.11 0.20 0.10 0.28 0.14
CPκ = 1.0 κ = 0.75
LS CP LS
Table 33. FEMA 356 Gymnasium Roof Diaphragm DCR
ThicknessE/W N/S E/W N/S E/W N/S E/W N/S
Single Layer 0.87 0.83 0.59 0.56 1.16 1.10 0.79 0.75Double Layer 0.50 0.48 0.34 0.33 0.67 0.64 0.46 0.43
CPκ = 1.0 κ = 0.75
IO CP IO
For each configuration and load direction, the higher DCR value represents
the controlling load level. For example, the gymnasium single layer
configuration loaded in the East/West direction with κ = 0.75 has an
Immediate Occupancy level DCR equal to 1.16, and a Collapse Prevention
DCR equal to 0.79. Since the Immediate Occupancy DCR is the higher value,
this controls the design check for the diaphragm element in the East/West
seismic direction. Because the controlling DCR is greater than 1.0, the
diaphragm would be considered inadequate and a different rehabilitation
method or system would be required.
The resulting DCRs are inversely proportional to the knowledge factor, κ. If a
higher degree of knowledge about the materials and construction methods is
attained, the DCRs are proportionally reduced. For the classroom roof
diaphragm, the existing configuration meets the acceptance criteria using κ =
0.75 or κ = 1.0. In practice, this means that there would be no benefit to the
designer in conducting the required testing or demolition of roofing materials
to view sheathing grade stamps. Increasing the knowledge factor is not

124
required because even at the lower level of knowledge, the existing classroom
diaphragm meets the acceptance criteria.
At the gymnasium, the existing diaphragm configuration would not be
deemed acceptable for κ = 0.75 because the DCR values for the East/West and
the North/South load directions both exceed 1.0. If sufficient demolition were
performed to assure the plywood grade and to attain κ = 1.0, then the existing,
single-layer configuration would be acceptable. Otherwise a rehabilitation
involving addition of a second layer of roof sheathing meets the acceptance
criteria.
At the classroom roof, the Collapse Prevention DCRs are higher than the
corresponding Life Safety DCRs. This indicates that the Collapse Prevention
force level and associated acceptance criteria control the design check of the
classroom roof diaphragm. Conversely, the Immediate Occupancy DCRs at
the gymnasium diaphragm are all higher than the Collapse Prevention DCRs.
This indicates that the Immediate Occupancy force level and associated
acceptance criteria control the design check of the gymnasium roof
diaphragm. Several factors are included in the development of the design
forces, such as building period, sheathing thickness and panel aspect ratios.
The most significant effect is from the very low m factors used with the
Immediate Occupancy level forces, compared to the factors used for Collapse
Prevention and Life Safety.
The DCRs for the classroom panels resisting East/West seismic loads are
provided in Table 34, and for panels resisting North/South seismic loads in
Table 35. Similar tables for the gymnasium are provided in Tables 36 and 37.

125
Table 34. FEMA 356 Classrooms Wall Panel DCR, E/W Seismic Direction
Single Double Single Double Single Double Single Double10 0.73 0.43 1.12 0.67 0.97 0.57 1.50 0.8915 0.66 0.39 1.02 0.61 0.88 0.52 1.36 0.81
κ = 0.75LS CP
Panel Length
(ft)LS CP
κ = 1.0
Table 35. FEMA 356 Classrooms Wall Panel DCR, N/S Seismic Direction
Single Double Single Double Single Double Single Double80 0.38 0.23 0.59 0.35 0.51 0.30 0.79 0.47
κ = 0.75LS CP
Panel Length
(ft)LS CP
κ = 1.0
Table 36. FEMA 356 Gymnasium Wall Panel DCR, E/W Seismic Direction
Single Double Single Double Single Double Single Double14 2.34 1.34 1.77 1.01 3.12 1.79 2.36 1.3516 2.51 1.44 1.83 1.05 3.35 1.92 2.43 1.4023 2.21 1.27 1.52 0.87 2.94 1.69 2.02 1.1624 1.65 0.95 1.13 0.65 2.20 1.26 1.51 0.8726 1.98 1.14 1.36 0.78 2.64 1.52 1.81 1.0445 1.28 0.74 0.88 0.51 1.71 0.98 1.17 0.67
κ = 0.75IO CP
Panel Length
(ft)IO CP
κ = 1.0
Table 37. FEMA 356 Gymnasium Wall Panel DCR, N/S Seismic Direction
Single Double Single Double Single Double Single Double9 2.47 1.41 2.10 1.20 3.30 1.89 2.80 1.6010 2.19 1.26 1.86 1.07 2.92 1.68 2.48 1.4213 1.98 1.13 1.53 0.88 2.64 1.51 2.04 1.1718 2.13 1.22 1.51 0.87 2.84 1.63 2.01 1.1621 2.01 1.15 1.38 0.79 2.68 1.54 1.84 1.0637 1.54 0.89 1.06 0.61 2.06 1.18 1.41 0.8155 1.20 0.69 0.83 0.48 1.60 0.92 1.10 0.63
κ = 0.75IO CP
Panel Length
(ft)IO CP
κ = 1.0

126
For κ = 0.75, only the longest classroom panels (length = 80 ft.) have DCRs that
meet LS and CP level forces using a single layer of sheathing. All other
classroom panels have either the LS or CP DCR greater than 1.0. Because the
existing structures would require addition of plywood sheathing, as there are
no existing sheathed walls, it is unlikely that this knowledge factor would be
appropriate. The plywood grade and connection details are known for new
construction, so the knowledge factor would equal 1.0. Even at this level of
knowledge, only the longest of the classroom panels would meet the
acceptance criteria. Thus, the proposed single-panel rehabilitation is not
acceptable for the shorter classroom shear panels. Installation of double layer
sheathing results in DCRs less than 1.0, and would be an acceptable
rehabilitation.
At the gymnasium structure, none of the single-sheathed panels meet the
acceptance criteria. For a knowledge factor κ = 1.0, appropriate for addition of
new sheathing panels, only the longest panels (24 ft., 37 ft., 45 ft. and 55 ft.)
meet the acceptance criteria when two panel layers are added. Double
sheathing layers would not be acceptable at other panel locations because the
DCRs for the remaining panels are greater than 1.0 at the IO or CP levels, or
both.
For a typical rehabilitation design, methods that are not acceptable would be
modified until the resulting DCR’s were below 1.0. Some methods might
include increasing the thickness of plywood, increasing the amount of nailing,
installation of additional interior shear walls or other bracing, reducing the
expected performance level, or some combination of any or all of these.
For comparison with the other analysis methods and results, only the values
obtained for κ = 1.0 are used. It is assumed that for an actual rehabilitation the

127
engineer would be able to specify the required number of tests or grade stamp
inspections to ensure the use of the appropriate assumed material properties.
The element DCR used for comparison with results from the other methods is
the HIGHER of the two force levels. For example, the DCR for the 21 ft. long
gymnasium shear panel is equal to 2.01, the greater value of the Immediate
Occupancy DCR (2.01) and the Collapse Prevention DCR (1.38).
5.1.3 ASCE/SEI 31
5.1.3.1 TIER 1 RESULTS
Tier 1 includes a check only of the wall panels for each seismic load direction.
No checks are made for the acceptability of the roof diaphragm elements. The
Design-to-Capacity Ratios (DCRs) for this analysis are shown in Table 38.
Table 38. ASCE/SEI 31 Tier 1 Wall Panel DCR
E/W N/SClassrooms 0.41 0.23Gymnasium 0.74 0.76
Seismic DirectionStructure
The Tier 1 analysis shows that the shear force in each wall panel (classrooms
and gymnasium) is at an acceptable level because all DCRs are less than 1.0.
The results are the same whether the rehabilitation includes a single or double
layer of sheathing, because the acceptance criteria is a force of 1,000 lbf/ft for
walls sheathed with plywood, regardless of the thickness of the sheathing or
nailing pattern.

128
5.1.3.2 TIER 2 RESULTS
Tier 2 involves evaluation of roof diaphragm and wall panel elements for each
seismic load direction. The DCRs for the classroom roof diaphragm are shown
in Table 39, and for the gymnasium roof diaphragm in Table 40.
Table 39. ASCE/SEI 31 Tier 2 Classroom Roof Diaphragm DCR
E/W N/SSingle Layer 0.23 0.13
Double Layer 0.13 0.08
Seismic DirectionThickness
Table 40. ASCE/SEI 31 Tier 2 Gymnasium Roof Diaphragm DCR
E/W N/SSingle Layer 0.52 0.49
Double Layer 0.30 0.28
Seismic DirectionThickness
Because all DCRs are less than 1.0, this indicates that the existing, single-layer
configurations do not require rehabilitation. The double-layer configuration
DCRs are computed in this report to allow comparison with the results from
other methods. As expected, the DCRs for the double-layer configuration are
lower than for the single-layer configuration because the added sheathing
layer provides added capacity.
The DCRs for the classroom panels resisting East/West seismic loads are
provided in Table 41, and for panels resisting North/South seismic loads in
Table 42. Similar tables for the gymnasium are provided in Tables 43 and 44.

129
Table 41. ASCE/SEI 31 Tier 2 Classrooms Wall Panel DCR, E/W Seismic Direction Panel Length
(ft) Single Double10 0.63 0.3715 0.63 0.37
Panels
Table 42. ASCE/SEI 31 Tier 2 Classrooms Wall Panel DCR, N/S Seismic Direction Panel Length
(ft) Single Double80 0.35 0.21
Panels
Table 43. ASCE/SEI 31 Tier 2 Gymnasium Wall Panel DCR, E/W Seismic Direction Panel Length
(ft) Single Double14 1.23 0.7016 1.19 0.6823 1.13 0.6524 1.13 0.6526 1.13 0.6545 1.13 0.65
Panels
Table 44. ASCE/SEI 31 Tier 2 Gymnasium Wall Panel DCR, N/S Seismic Direction Panel Length
(ft) Single Double9 1.19 0.6810 1.19 0.6813 1.12 0.6418 1.04 0.5921 1.01 0.5837 1.01 0.5855 1.01 0.58
Panels
The calculated DCRs indicate that all classroom shear walls meet the
acceptance criteria for a single layer of sheathing. The evaluation would
conclude that these structures, with only a single layer of wall sheathing,
would not require rehabilitation because the DCRs are less than 1.0. At the

130
gymnasium structure, a single layer of sheathing would not be adequate, but a
double layer would meet acceptance criteria. The higher DCR values at the
gymnasium are in large part due to the decreased m factors used for the
Immediate Occupancy level. The factors are approximately half of the values
used for the Life Safety level at the classrooms.
Some of the DCR values are identical with the values computed for other wall
lengths, and some are different. For example, in the East/West seismic
direction the DCR value for the 16 ft.-long gymnasium wall panel is not equal
to the DCRs for the gymnasium panels 23 ft. or greater, but the DCRs for the
longer panels are equal to each other. The shear panels are assumed treated as
flexible elements and resist the same diaphragm shear per foot at the top of
wall regardless of length. However, the m factor is calculated based on the
ratio of height to length. Where those m factors are equal, the resulting DCR
values are also equal. For the example cited here, the m factor for the 16 ft.
panel is equal to 1.80, and the m factors for the panels 23 ft. or longer are all
equal to 2.0.
5.1.3.3 TIER 3 RESULTS
ASCE Tier 3 involves the same processes used in FEMA 356, with the forces
multiplied by 0.75. Thus, the Tier 3 DCRs are equal to 0.75 times the associated
DCRs from FEMA 356. This relationship is valid only because Linear
Procedures are used in the analysis, and linear element behavior is assumed.
DCRs for the classroom roof and gymnasium roof diaphragms are shown in
Tables 45 and 46, respectively.

131
Table 45. ASCE/SEI 31 Tier 3 Classroom Roof Diaphragm DCR
ThicknessE/W N/S E/W N/S E/W N/S E/W N/S
Single Layer 0.19 0.10 0.26 0.14 0.26 0.14 0.35 0.18Double Layer 0.11 0.06 0.16 0.08 0.15 0.08 0.21 0.11
CPκ = 1.0 κ = 0.75
LS CP LS
Table 46. ASCE/SEI 31 Tier 3 Gymnasium Roof Diaphragm DCR
ThicknessE/W N/S E/W N/S E/W N/S E/W N/S
Single Layer 0.65 0.62 0.44 0.42 0.87 0.83 0.59 0.56Double Layer 0.38 0.36 0.26 0.25 0.50 0.48 0.35 0.32
CPκ = 1.0 κ = 0.75
IO CP IO
These results show that each existing roof diaphragm is acceptable regardless
of the knowledge level used (0.75 or 1.0) for the calculated seismic loads
because all DCR values are less than 1.0. Comparing the DCR values for the
classroom roof, the Collapse Prevention level forces control the evaluation
because the DCRs are higher than the Life Safety DCRs. At the gymnasium
structure, the Immediate Occupancy DCRs are higher than the Collapse
Prevention DCRs, so the Immediate Occupancy level forces control the
evaluation.
The DCRs for the classroom panels resisting East/West seismic loads are
provided in Table 47, and for panels resisting North/South seismic loads in
Table 48. Similar tables for the gymnasium are provided in Tables 49 and 50.
Table 47. ASCE/SEI 31 Tier 3 Classrooms Wall Panel DCR, E/W Seismic Direction
Single Double Single Double Single Double Single Double10 0.55 0.32 0.84 0.50 0.73 0.43 1.13 0.6715 0.50 0.29 0.77 0.46 0.66 0.39 1.02 0.61
κ = 0.75LS CP
Panel Length
(ft)LS CP
κ = 1.0

132
Table 48. ASCE/SEI 31 Tier 3 Classrooms Wall Panel DCR, N/S Seismic Direction
Single Double Single Double Single Double Single Double80 0.29 0.17 0.44 0.26 0.38 0.23 0.59 0.35
κ = 0.75LS CP
Panel Length
(ft)LS CP
κ = 1.0
Table 49. ASCE/SEI 31 Tier 3 Gymnasium Wall Panel DCR, E/W Seismic Direction
Single Double Single Double Single Double Single Double14 1.76 1.01 1.33 0.76 2.34 1.34 1.77 1.0116 1.88 1.08 1.37 0.79 2.51 1.44 1.82 1.0523 1.66 0.95 1.14 0.65 2.21 1.27 1.52 0.8724 1.24 0.71 0.85 0.49 1.65 0.95 1.13 0.6526 1.49 0.86 1.02 0.59 1.98 1.14 1.36 0.7845 0.96 0.56 0.66 0.38 1.28 0.74 0.88 0.50
κ = 0.75IO CP
Panel Length
(ft)IO CP
κ = 1.0
Table 50. ASCE/SEI 31 Tier 3 Gymnasium Wall Panel DCR, N/S Seismic Direction
Single Double Single Double Single Double Single Double9 1.85 1.06 1.58 0.90 2.48 1.42 2.10 1.2010 1.64 0.95 1.40 0.80 2.19 1.26 1.86 1.0713 1.49 0.85 1.15 0.66 1.98 1.13 1.53 0.8818 1.60 0.92 1.13 0.65 2.13 1.22 1.51 0.8721 1.51 0.86 1.04 0.59 2.01 1.16 1.38 0.8037 1.16 0.67 0.80 0.46 1.55 0.89 1.06 0.6155 0.90 0.52 0.62 0.36 1.20 0.69 0.83 0.47
κ = 0.75IO CP
Panel Length
(ft)IO CP
κ = 1.0
The 10 ft. and 15 ft. classroom panels do not meet the acceptance criteria for
single-layer sheathing because of the reduced knowledge factor. The panels
do meet acceptance criteria if double sheathing is used. The 80 ft. panels meet
the criteria for a single layer of sheathing, using either κ = 1.0 or κ = 0.75. For
the gymnasium structure, none of the single-layer panels meet the acceptance
criteria for κ = 0.75, and only the 45 ft. and 55 ft. panels meet the single-layer
acceptance criteria with κ =1.0. Actual rehabilitation at either of these

133
structures would involve addition of new plywood sheathing, so the higher
knowledge factor would be applicable. Gymnasium panel lengths greater than
16 ft. meet the acceptance criteria for double sheathing, but the shorter panels
do not. The shorter panels have lower m values, which reduces their capacity
and increases the DCRs.
For comparison with other analysis methods and results, only the values
calculated for κ =1.0 are used.
5.1.4 1997 UBC
The Demand-to-Capacity Ratio (DCR) for the classroom roof and gymnasium
roof diaphragms are shown in Tables 51 and 52, respectively.
Table 51. 1997 UBC Classroom Roof Diaphragm DCR
E/W N/SSingle Layer 0.17 0.19
Double Layer 0.10 0.11
Thickness Seismic Direction
Table 52. 1997 UBC Gymnasium Roof Diaphragm DCR
E/W N/SSingle Layer 0.22 0.27
Double Layer 0.13 0.16
Thickness Seismic Direction
Because all DCR values are less than 1.0, this indicates that the existing, single-
layer configuration of roof sheathing is acceptable to resist the calculated
loads. The double layer values are included for comparison with the other
analysis methods.

134
The DCR for the classroom panels resisting East/West seismic loads are
provided in Table 53, and for panels resisting North/South seismic loads in
Table 54. Similar tables for the gymnasium are provided in Tables 55 and 56.
Table 53. 1997 UBC Classrooms Wall Panel DCR, E/W Seismic Direction
Single Double10 0.64 0.3815 0.66 0.39
Panel Length(ft)
Thickness
Table 54. 1997 UBC Classrooms Wall Panel DCR, N/S Seismic Direction
Single Double80 0.39 0.23
Panel Length(ft)
Thickness
Table 55. 1997 UBC Gymnasium Wall Panel DCR, E/W Seismic Direction
Single Double14 0.70 0.4116 0.71 0.4223 0.74 0.4324 0.74 0.4326 0.75 0.4345 0.78 0.44
Panel Length(ft)
Thickness
Table 56. 1997 UBC Gymnasium Wall Panel DCR, N/S Seismic Direction
Single Double9 0.61 0.3510 0.63 0.3613 0.65 0.3818 0.68 0.4021 0.69 0.4137 0.73 0.4255 0.75 0.42
Panel Length(ft)
Thickness

135
All single-layer DCR values are less than 1.0, indicating that a single layer of
½-in. plywood sheathing is an acceptable rehabilitation method. The double
layer values are provided for comparison to the other methods in this report.
This result was anticipated, because the addition of a single ½-in. layer of
plywood sheathing to the exterior walls was the recommended rehabilitation
method for these elements in the original CH2M Hill report.
5.2 DCR COMPARISONS
The Demand-to-Capacity Ratio (DCR) value for each element, and for each
method of analysis or evaluation, should be compared to the expected level of
conservatism inherent in the method. For example, application of provisions
from the design methods (1997 UBC and FEMA 356) are expected to result in
more conservative results. Moreover, new buildings would generally be
designed for increased calculated design forces, a longer life expectancy than
for rehabilitation of existing structures, more stringent seismic detailing
requirements for new elements, etc. Lower requirements for existing building
evaluation vs. design can be thought of as giving a “break” to existing
buildings, exempting the evaluation from all of the requirements in design
methods. Therefore the DCRs for new building design using the 1997 UBC are
expected to be higher than for FEMA 356, which are expected to be higher
than all of the values computed for the ASCE/SEI 31 methods.
In general, a measure of the conservatism in a given method is the level of
investigation involved. Where more detailed evaluation or analysis is
performed, this generally (but not always) results in a less conservative design
check and would be represented by a lower DCR value. For the three
ASCE/SEI 31 methods, the level of conservatism from Tier 1 through Tier 3 is

136
expected to decrease as the level of analysis increases. Therefore the DCR
values should be highest for Tier 1 (most conservative), lower for Tier 2, and
lowest for Tier 3 (most detailed analysis).
A 3-D analysis is generally expected to provide less conservative results,
which would cause a reduction in the element DCR values. Because the FEMA
356 and ASCE/SEI 31 Tier 3 results are based on 3-D models, it is possible that
the DCR values might be lower than an ASCE/SEI 31 Tier 2 evaluation, which
is based on a more conservative 2-D analysis. It is still expected that the 1997
UBC results will be the most conservative, and have the highest DCR values.
In summary, the expected results of a DCR comparison should show that the
values increase in the following order (except FEMA 356, which could be
lower than ASCE/SEI 31 Tier 2):
• ASCE/SEI 31 Tier 3 (lowest DCR)
• ASCE/SEI 31 Tier 2
• ASCE/SEI 31 Tier 1
• FEMA 356
• 1997 UBC (highest DCR)
While this ranking order may not be true for all elements, it is expected that
the evaluation method DCRs (ASCE/SEI 31) should generally be lower than
the design method DCRs (FEMA 356, 1997 UBC).
The summary DCRs for the classroom roof are shown in Table 57, and for the
gymnasium roof in Table 58. There is no value in the ASCE/SEI 31 Tier 1
column because that method does not include any provisions for checking
horizontal diaphragms.

137
The relative values of the DCRs do not match what was expected. Instead of
being the highest value, the 1997 UBC DCRs are lower for the East/West
seismic direction than the other methods. This indicates that the 1997 UBC
method would actually allow the THINNEST diaphragm element. In the
North/South seismic direction the results are about equal. This loading
direction is relatively simple because there are no openings in the walls.
In all cases the existing, single-layer configuration would be deemed
adequate, even if the relative values are not in the expected increasing order.
Table 57. Summary of Classroom Roof Diaphragm DCR
Tier 1 Tier 2 Tier 3Single Layer 0.35 NA 0.23 0.26 0.17Double Layer 0.21 NA 0.13 0.16 0.10
Tier 1 Tier 2 Tier 3Single Layer 0.18 NA 0.13 0.14 0.19Double Layer 0.11 NA 0.08 0.08 0.11
Thickness
Thickness
ASCE/SEI 31 1997 UBC
E/W Seismic Direction
N/S Seismic Direction
FEMA 356
FEMA 356 ASCE/SEI 31 1997 UBC
Table 58. Summary of Gymnasium Roof Diaphragm DCR
Tier 1 Tier 2 Tier 3Single Layer 0.87 NA 0.52 0.65 0.22Double Layer 0.50 NA 0.30 0.38 0.13
Tier 1 Tier 2 Tier 3Single Layer 0.83 NA 0.49 0.62 0.27Double Layer 0.48 NA 0.28 0.36 0.16
Thickness
Thickness
ASCE/SEI 31 1997 UBCFEMA 356
E/W Seismic Direction
N/S Seismic Direction
FEMA 356 ASCE/SEI 31 1997 UBC

138
The difference in roof DCRs is notable at the gymnasium structure, where the
FEMA 356 and ASCE/SEI 31 provisions result in much higher values. This is
because the m factors used in the Immediate Occupancy force level are much
lower than for the Collapse Prevention level check, causing an increase in the
DCR. The 1997 UBC also requires an increase in design forces for the
gymnasium structure due to its status as an essential facility, but the increase
is a lower percentage than the increase required in FEMA 356 and ASCE/SEI
31. The higher FEMA 356 values also cause the ASCE/SEI 31 Tier 3 DCRs to be
higher than the 1997 UBC values.
The increase in the FEMA 356 provisions also causes the ASCE/SEI 31 Tier 3
results to be higher than the Tier 2 result, which is reverse of the expected
relative values. The Tier 3 results and FEMA 356 results are both higher than
the 1997 UBC results, which is the reverse of the expected relative values. The
m factors in the FEMA 356 provisions are the main reason for the higher
values.
Table 59. Summary of Classroom Wall Panel DCR, E/W Seismic Direction
Tier 1 Tier 2 Tier 310 1.12 0.41 0.63 0.84 0.6415 1.02 0.41 0.63 0.77 0.64
Tier 1 Tier 2 Tier 310 0.67 0.41 0.37 0.50 0.3815 0.61 0.41 0.37 0.46 0.38
ASCE/SEI 31 1997 UBC
Panel Length(ft)
Panel Length(ft)
ASCE/SEI 31 1997 UBCFEMA 356
Single Panel Layer
Double Panel Layer
FEMA 356

139
Table 60. Summary of Classroom Wall Panel DCR, N/S Seismic Direction
Tier 1 Tier 2 Tier 380 0.59 0.23 0.35 0.44 0.39
Tier 1 Tier 2 Tier 380 0.35 0.23 0.21 0.26 0.23
Panel Length(ft)
Panel Length(ft)
ASCE/SEI 31 1997 UBCFEMA 356
Single Panel Layer
Double Panel Layer
FEMA 356 ASCE/SEI 31 1997 UBC
The summary DCRs for the classroom wall panels are shown in Table 59 for
seismic load in the East/West direction, and in Table 60 for seismic load in the
North/South direction. The DCR values are comparable between the Tier 1
(double panel layer), Tier 2 and 1997 UBC methods, but it was expected that
the 1997 UBC method would have the highest DCR. The values for 1997 UBC
are lower than the FEMA 356 and ASCE/SEI 31 results, which is not the
expected result.
Comparison of the ASCE/SEI 31 Tier 2 and Tier 3 shows the Tier 2 values are
lower than the Tier 3 values, reverse of the expected results. This is because
the results from the FEMA 356 analysis are also high, and the Tier 3 results are
equal to 75% of the FEMA 356 values.
Summary DCRs for the gymnasium walls are shown in Tables 61 and 62.
Similar to previous results, the 1997 UBC DCR values are not the highest of
the methods. Except for the longest wall panels with single layer sheathing,
the 1997 UBC values are lower than all other methods. The Tier 1 results are
comparable to the 1997 UBC results for the single-layer sheathing, but the
comparison values diverge for double-layer sheathing. No reduction is
evident in the Tier 1 DCRs for double-layer sheathing because the acceptance

140
Table 61. Summary of Gymnasium Wall Panel DCR, E/W Seismic Direction
Tier 1 Tier 2 Tier 314 2.34 0.76 1.23 1.76 0.7016 2.51 0.76 1.19 1.88 0.7123 2.21 0.76 1.13 1.66 0.7424 1.65 0.76 1.13 1.24 0.7426 1.98 0.76 1.13 1.49 0.7545 1.28 0.76 1.13 0.96 0.78
Tier 1 Tier 2 Tier 314 1.34 0.76 0.70 1.01 0.4116 1.44 0.76 0.68 1.08 0.4223 1.27 0.76 0.65 0.95 0.4324 0.95 0.76 0.65 0.71 0.4326 1.14 0.76 0.65 0.86 0.4345 0.74 0.76 0.65 0.56 0.44
ASCE/SEI 31 1997 UBC
Panel Length(ft)
Panel Length(ft)
ASCE/SEI 31 1997 UBCFEMA 356
Single Panel Layer
Double Panel Layer
FEMA 356
criteria is not based on panel thickness, while the allowable forces in the 1997
UBC methods are increased for thicker panels.
The Tier 3 results are generally higher than the Tier 2 or Tier 1 results, which
was not expected. This is because the Tier 3 results are directly proportional to
the FEMA 356 results, which are significantly higher than all other methods.
This unexpected result is most likely due to the conservative approach in the
FEMA 356 and ASCE/SEI 31 Liner Static Procedures, as well as the m factors
used in each analysis. This result was observed in the classroom structure also,
but the differences are much more pronounced in the gymnasium structure.
The wider difference is due to the much more stringent requirements of the
Immediate Occupancy force levels (gymnasium) compared to the Life Safety
force levels (classroom). The 1997 UBC analysis also includes an increase in

141
Table 62. Summary of Gymnasium Wall Panel DCR, N/S Seismic Direction
Tier 1 Tier 2 Tier 39 2.47 0.74 1.19 1.85 0.6110 2.19 0.74 1.19 1.64 0.6313 1.98 0.74 1.12 1.49 0.6518 2.13 0.74 1.04 1.60 0.6821 2.01 0.74 1.01 1.51 0.6937 1.54 0.74 1.01 1.16 0.7355 1.20 0.74 1.01 0.90 0.75
Tier 1 Tier 2 Tier 39 1.41 0.74 0.68 1.06 0.3510 1.26 0.74 0.68 0.95 0.3613 1.13 0.74 0.64 0.85 0.3818 1.22 0.74 0.59 0.92 0.4021 1.15 0.74 0.58 0.86 0.4137 0.89 0.74 0.58 0.67 0.4255 0.69 0.74 0.58 0.52 0.42
ASCE/SEI 31 1997 UBC
Panel Length(ft)
Panel Length(ft)
ASCE/SEI 31 1997 UBC
Single Panel Layer
Double Panel Layer
FEMA 356
FEMA 356
the forces for the gymnasium structure, but the increased importance factor
represents only a 25% increase in forces due to importance. The m factors for
Immediate Occupancy are approximately half of the Life Safety m factors,
which results in double the DCR values. The m factors in ASCE/SEI 31 for
Immediate Occupancy are also approximately half the values for Life Safety.
5.3 DOCUMENT USE DISCUSSION
5.3.1 FEMA 154
A final S score of 2.0 or less indicates that the structure requires additional
detailed structural evaluation. A high Rapid Visual Screening (RVS) score

142
does not necessarily “rule out” a more detailed seismic evaluation of the
structure. Schools, emergency facilities, historic buildings or other special
structure types may have elevated importance following an earthquake that
would dictate a detailed analysis. Hoover School is a designated Red Cross
Disaster Shelter, and should probably have a detailed analysis completed
regardless of the FEMA 154 Final Structural Score.
Hoover Elementary School is one of those buildings that FEMA 154 states may
be mis-categorized by the procedures and screening. In this case, the
structures were deemed to be adequate based on the visual screening alone,
but a serious structural deficiency was identified based on a plans review. The
visual analysis alone did not expose the deficiency because the building
system was obscured from the view of the screener.
While the screening failed to identify the hazard present in the Hoover
Elementary School system, the RVS is a good tool for making fast and easy
evaluations for a large number of buildings in a relatively short period of time.
These initial screenings could have great value to a local municipality that
must prioritize resources toward the detailed analysis and rehabilitation of the
most hazardous structures.
The organization, explanations, examples and descriptions are all very good
for the intended users of the document. The method is quick and easy, which
would allow for evaluations of many buildings in a relatively short period of
time.

143
5.3.2 FEMA 356
In general, FEMA 356 is written in technical language that would probably be
difficult to understand for most users not thoroughly familiar with structural
design for seismic loadings. Many important design decisions are to be made
by building owners (such as performance levels), but the document is not
written to their level of understanding of structural systems, building
performance and seismic behaviors. A structural engineer with seismic design
experience or the local building official would need to guide the owner
through the process of determining appropriate performance levels and
rehabilitation objectives. As a rehabilitation tool, FEMA 356 is very
comprehensive and detailed. The depth of analysis and engineering will tend
to exclude non-experienced users of the document, which is not a criticism.
The user should have an in-depth knowledge of structural engineering
principles and seismic design before applying the provisions of this
document.
Several items and procedures in the document seemed inadequate, confusing,
or potentially incorrect. A brief discussion of those items follows.
1. Performance Levels for Essential Facilities
The document is written with the stated intent to allow for a wide range of
rehabilitation objectives and performance levels. This represents a departure
from the codified “Importance Factors” used in the model codes, where
building classifications are provided and design modifiers specified. Model
codes that are based on Life-Safety performance do not explicitly allow for
performance-based designs, so many owners do not have experience in
making this type of selection for their building.

144
Certain facilities should generally be rehabilitated to higher performance
levels than other buildings. Emergency facilities, hospitals, and other essential
facilities should be evaluated and rehabilitated to Enhanced Rehabilitation
Objectives to increase the likelihood that they will be operational immediately
after or soon after an earthquake. Hazardous materials storage facilities or
other important, but non-emergency-response related buildings, may also
require certain minimum design levels.
2. Cost of Performance Level Selection
The shift in responsibility for specifying performance objectives from the
design document to building owners may be difficult for owners who likely
do not have a “feel” for how the performance levels and rehabilitation
objectives will impact the rehabilitation design, cost of upgrades, and time
required for construction. Engineers will be required to bridge the gap
between state-of-the-art science implementation and the impact on
construction costs. A compilation of actual building designs and associated
costs, or design case studies and cost analyses, would be a valuable tool for
those who need to choose an appropriate performance level for rehabilitation
design.
3. General Design Criteria
Very little mention is made throughout the document of other design forces
which should be considered during a rehabilitation design. I recognize that
the NEHRP-based documents deal with seismic provisions only, but designers
must not neglect other forces such as wind, earth pressures, hydraulic loads,
etc. Especially for light-weight, tall buildings (such as the Hoover Elementary
School gymnasium) wind forces may induce higher force levels in the

145
elements than do seismic forces. This was the result in the rehabilitation report
completed by CH2M Hill (Baxter et al. 1999).
4. Requirements for Use of 3-D Model
A two-dimensional stiffness model is allowed when the horizontal
diaphragms are classified as either flexible (no further restrictions) or rigid
when horizontal torsion is negligible or accounted for as specified.
Classification is based on the relative deflection of the diaphragm compared to
the story drift of the story below. Some key information is not provided in the
text or commentary of FEMA 356 in determining the applicability of a 2-D
design.
No guidance is provided in the document for estimating diaphragm
deflections. Several methods and approaches currently exist to estimate in-
plane deformations, but none are referenced in the document. Most methods
involve complicated equations, factors for nail spacing and patterns, and other
assumptions. Determining an estimated in-plane diaphragm deflection, and
relating that to the associated story drift are not trivial efforts even when a 2-D
analysis is used. For this report the deflection results from the 3-D analysis
were used as the basis for classification of the diaphragms. The result was that
the wood diaphragms (which have been assumed to be flexible elements)
were either stiff or rigid, which ruled out use of a 2-D design approach.
5. Wood Structural Panel Expected Strength Determination
Default Expected Strength Values are provided for all wood elements EXCEPT
wood structural panel sheathing in Table 8-1, Chapter 8 of FEMA 356. The
document allows use of calculated LRFD values from “an approved code,”
with specified φ factor = 1.0 and an additional 0.8 factor for panels, for

146
determining a panel deflection at yield. (The 0.8 additional factor converts
nominal to expected strengths, but is only referenced in the section pertaining
to wall panels.) Only in the commentary are the “AF&PA LRFD” and “BSSC
(2000)” referenced. The second reference is the 2000 Edition of NEHRP
Recommended Provisions for Seismic Regulations for New Buildings and Other
Structures (BSSC 2001a), and is used as the basis for the wood structural panel
strength values in this report. Values are taken from Table 12.4.3-2a, which
according to the table notes (printed on a separate page) are based on φ = 0.65.
Dividing the listed values by 0.65 and multiplying by the 0.8 reduction factor
provides the expected strength values for this report. Another reference is
required to obtain the Shear Modulus value, G. Once this deflection is
calculated, it must be calibrated to the particular length of shear wall under
consideration, and a series of stiffness values produced to provide the
expected strength. This process of consulting several references and multiple
calculations to arrive a an expected strength value seems more time-
consuming and error-prone than should be necessary.
6. Wood Structural Panel Model Element Stiffness
Significant effort was required to determine the element stiffness used for the
roof and shear wall elements. The stiffness was based on equations provided
in Chapter 8 of FEMA 356 for lateral deflections at yield. It is assumed that the
response of the elements at loads below yield are linear from zero to yield.
To model the plate elements in a 3-D elastic model, an equivalent “E” value is
required. Equations 8-2 and 8-4 for deflection at yield have several
components. For a given wall height, h, or diaphragm width, L, the deflection
is not linearly dependent on the other element dimension. This means that the
constant components such as shear deformation and nail deformation (not

147
dependent on element dimensions) contribute a higher percentage of the
deformation for longer panel lengths and deeper diaphragms. For modeling
element properties this also means that for each shear panel length and
diaphragm depth the element will be assigned a different stiffness property
“E” to match the expected deflections at yield.
The process described in this report is quite tedious, requiring a series of
finite-element models. For each wall panel height, h, a series of models with
different lengths is required. For each diaphragm and for each seismic loading
direction, a finite-element model is required with the assumed boundary
conditions. Finally, for each model the stiffness value “E” must be modified by
trial-and-error until the expected displacement is attained. This yields a curve
of stiffness values based on the actual wall panel or diaphragm dimensions,
and this must be applied to the structural models accordingly. Each curve is
valid only for the assumed panel thickness, t, used in the deformation
equations.
The “E” value determined for the roof diaphragms is different for each seismic
load direction. For this analysis, an average of the “E” values for each
direction is used as the element stiffness in the finite-element models.
Computing the stiffness vs. dimensions curves for each element is only part of
the process. For this analysis, the dimensions of rehabilitated panels and roof
diaphragms were not changed. If this analysis were being run to determine
the minimum length of each wall panel, different material properties would
have to be assigned when the panel lengths were optimized. If the minimum
required roof panel thickness is being evaluated, a new set of stiffness vs.
dimensions curves would be required for each panel thickness evaluated. This

148
represents an extraordinary amount of computational effort when compared
to current methods of practice.
7. Verification of “m” Factors in Linear Static Procedure
The results of the DCR comparison were quite surprising. It was anticipated
that the “design-level” requirements (FEMA 356 and 1997 UBC) would be
more stringent than for the screening and evaluation requirements (FEMA 154
and ASCE/SEI 31), but the relative DCR values for FEMA 356 seem to be
excessively high. One explanation could be that the m factors used are not
properly calibrated for use in the Linear Static Procedure.
Several sources have suggested that the m factors in the NEHRP-based
documents may not be properly calibrated for use in Linear Static Procedures.
An email from Chris Poland (2003) states:
“The problem with the m factors is real and in my mind stems from the
conservative analysis approach inherent in the LSP. The R factors we
[use] for new buildings are really calibration factors to get us back to
the level we have always been comfortable with based on observation
of damage after earthquakes. The m factors are derived and, by nature,
do not include duration of shaking, the number of cycles of nonlinear
behavior, redundancy, etc.”
Anecdotal evidence from other designers indicates that these results are
typical of the conservative LSP, regardless of the material used.
149
5.3.3 ASCE/SEI 31
The evaluation document ASCE/SEI 31 is written for use by experienced
structural designers. The terms used, equations presented, and calculations
required are beyond what a “lay-person” would be able to understand. While
not a limitation, potential users of the document should understand who the
target audience is.
1. Level of Investigation
In general, ASCE/SEI 31 is organized very well. One exception is the “Level of
Investigation Required” section in which the level of information collected is
explained. For a Tier 1 analysis, the document requires that “the level of
investigation shall be sufficient to complete Tier 1 Checklists.” The same
section also states that “In addition to the information required for a Tier 1
Evaluation, sufficient information shall be collected for a Tier 2 Evaluation to
complete the required Tier 2 Procedures.” These statements may seem
obvious at first, but when considered with respect to the progression of the
evaluation further clarification is required.
For a typical Tier 1 evaluation the level of investigation required is relatively
low, relying on visual inspection of the building and construction documents.
Tier 2 investigation may involve destructive examination and possibly
physical material testing. It does not make sense to require the Tier 2 level of
investigation until and unless the Tier 1 evaluation identifies structural
deficiencies. The intent of the document is not to require Tier 2 level of
investigation before any evaluation begins, but this is not clearly explained in
the document. Consulting engineers who contract with a building owner to
conduct an evaluation will need to include contract language to address when

150
and what type of investigations are to be performed, and under what
circumstances.
2. Tier 1 Shear Stress Check
The SHEAR STRESS CHECK does not actually check the stress in the shear
panels. The acceptable load value is given in units of pounds per foot, which
does not account for thickness of wall sheathing or nailing pattern. This is
likely intended to be a conservative estimate of linear load reaction that
should work for most existing panels. However, the acceptance value of 1,000
lb/ft seems quite high. For example, the calculated ultimate capacity of the
wall panels according to FEMA 356 procedures was 418 lb/ft.
Based on the DCR for wood panels in this report, the Tier 1 force level is not
necessarily conservative. While the Tier 1 check did prove to be equal to or
more conservative than the 1997 UBC requirements, the comparison with Tier
2 and Tier 3 analyses often showed Tier 1 to be LESS conservative. This could
be due to the m factors on structural wood panels, which may not be properly
calibrated to a Linear Static Procedure. (See discussion for FEMA 356.) This
unconservative result is likely also due to the high Tier 1 acceptance shear
load of 1,000 lb/ft.
3. Tier 3 Evaluation
The Tier 3 evaluation is a check against acceptable design codes, with a 25%
reduction in design forces. This reduction is an acknowledgment that design
forces under current seismic provisions are typically higher than were
required when existing structures were built. Requiring all structures to meet
current design code level forces would, in theory, require all structures being
evaluated to be rehabilitated to current code requirements. This is not the

151
intent of the evaluation process; rather, the intent is to identify those
structures that are found to be potentially dangerous during a seismic event.
This reduction in forces also verifies the basic idea that the results of an
evaluation or analysis for an existing structure should be less stringent than
the results obtained by use of design level forces. As is discussed in this
report, the findings for these test structures show that the provisions of the
current evaluation and rehabilitation analysis documents do not necessarily
result in the less conservative results expected.
5.3.4 1997 UBC
The use of model building codes is not typically recommended for the analysis
or rehabilitation of existing buildings. It is generally accepted that design
forces for new buildings are significantly higher than appropriate for either
rehabilitation or evaluation. New design codes have been developed and used
for many years, and engineers have become accustomed to the provisions and
requirements. For this reason, using familiar building code provisions can be a
useful benchmark for comparison with other rehabilitation or evaluation
methods. However, the designer needs a clear understanding of what the
expected results of a new building design compared to a rehabilitation design
should be. Further research similar to this report for other building types,
materials, configurations, building uses, design and rehabilitation provisions
will add to the body of knowledge available to help guide designers.

152
6 CONCLUSIONS AND RECOMMENDATIONS
• The FEMA 154 screenings show that with no prior knowledge of the
structures or building systems, the facility would not be recommended for
further analysis. If a plans review is performed prior to the screening, then
the results do indicate that further structural analysis is warranted.
Developers of a screening procedure should recognize that essential
facilities require more detailed analyses performed regardless of the Final
Structural Score. For more important facilities, a preliminary plans review
should be a required part of the screening process.
• FEMA 356 requires that the Performance Level be selected prior to the
analysis. Some guidance or minimum Enhanced Performance Objectives
should be specified in the document for essential facilities. Additional
documentation that the effects of the various Performance Levels have on
rehabilitation costs should be compiled and made available to designers
and building owners to help make the appropriate selection.
• The NEHRP-based documents (FEMA 356, ASCE/SEI 31) are written as
seismic rehabilitation and evaluation documents, but references should be
provided to other design codes or documents for comparison with design
loads such as wind. Current building design for wind allows selection of
wind speed to determine design loads, but it is unclear what loads would
be comparable with each seismic Performance Levels.
• The 3-D modeling requirements and provisions in FEMA 356 need to be
clarified and improved. A clear process or more detailed explanation for
the use of the current deflection equations in determining model element
properties is needed. Boundary conditions for test models should be

153
clarified. Another recommendation is the creation of a table of stiffness
values to be used in finite-element models, with the values based on panel
thickness, materials, nailing patterns, assumptions on chord-splice slip, etc.
• The process for determining element capacity values for wood structural
sheathing (horizontal diaphragms and shear walls) is not efficient. A table
of values of expected strengths based on panel thickness, nailing patterns,
direction of load, material grade, etc. provided within a single document
would make the design process more streamlined and reduce the chance
for computational errors. Where detailed information about an existing
panel system is not available, conservative, default expected strength
values should be provided.
• The ASCE/SEI Tier 1 “stress check” is not conservative. The 1,000 lbf/ft
allowable load is not a conservative value, and is not dependent on the
panel thickness, nailing pattern, connections, etc. This check could
incorporate panel thickness and the allowable force level should be
reduced to a more conservative value for this screening-level check.
• The results of the DCR comparisons showed that the 1997 UBC provisions
do not always result in conservative designs, as was expected. The results
of the FEMA 356 provisions, especially for the Immediate Occupancy load
level, are typically much more conservative than the new building
provisions of 1997 UBC. This is likely caused by the current m values used
in FEMA 356 and ASCE/SEI 31 under the Linear Static Procedures.
• Several new subcommittees of the ASCE Seismic Rehabilitation Standards
Committee are being formed, including one for wood (Poland 2003). It is
recommended that the m factors be verified or modified for use in the LSP

154
to arrive at designs more comparable with the levels attained in current
design codes, or that a clear evidential basis be provided to explain the
design force levels and acceptance criteria.

155
7 BIBLIOGRAPHY
American Plywood Association (APA). (1997a). Diaphragms and shear walls. Tacoma, WA. American Plywood Association (APA). (1997b). Plywood design specification. Tacoma, WA. American Society of Civil Engineers (ASCE). (1998). “Handbook for the seismic evaluation of buildings – a prestandard.” FEMA Publication 310. Reston, VA. American Society of Civil Engineers (ASCE). (2000a). “Global topics report on the prestandard and commentary for the seismic rehabilitation of buildings.” FEMA Publication 357. Redwood City, CA. American Society of Civil Engineers (ASCE). (2000b). “Prestandard and commentary for the seismic rehabilitation of buildings” FEMA Publication 356. Reston, VA. American Society of Civil Engineers (ASCE). (2003). “Seismic evaluation of buildings.” ASCE/SEI 31-03. Reston, VA. Applied Technology Council (ATC). (1985). “Earthquake damage evaluation data for california.” ATC Publication 13. Redwood City, CA. Applied Technology Council (ATC). (1997a). “NEHRP guidelines for the seismic rehabilitation of buildings.” FEMA Publication 273. Redwood City, CA. Applied Technology Council (ATC). (1997b). “NEHRP commentary on the guidelines for the seismic rehabilitation of buildings.” FEMA Publication 274. Redwood City, CA. Applied Technology Council (ATC). (2002a). “Rapid visual screening of buildings for potential seismic hazards: a handbook, second edition.” FEMA Publication 154. Redwood City, CA. Applied Technology Council (ATC). (2002b). “Rapid visual screening of buildings for potential seismic hazards: supporting documentation.” FEMA Publication 155. Redwood City, CA.

156
Baxter, P.W., Frey, S. and Pitkin, S. (1999). “Seismic Analysis and Evaluation Report for Hoover Elementary School.” CH2M Hill, Inc., Corvallis, OR. Bay Area Regional Earthquake Preparedness Project (RPP). (1993). “Earthquake preparedness: what every childcare provider should know.” FEMA Publication 240. Governor’s Office of Emergency Services, Oakland, CA. Bodig, J. and Jayne, B. A. (1993). Mechanics of wood and wood composites. Krieger Publishing Company, Malabar, FL. Breyer, D. (1993). Design of wood structures, third edition. McGraw-Hill, Inc. “BSSC Online.” (2003). <http://www.bssconline.org/> Building Seismic Safety Council (BSSC). (1988). “Seismic considerations: elementary and secondary schools.” FEMA Publication 149. Washington, DC. Building Seismic Safety Council (BSSC). (1992a). “NEHRP handbook of techniques for the seismic rehabilitation of existing buildings.“ FEMA Publication 172. Washington, DC. Building Seismic Safety Council (BSSC). (1992b). “NEHRP handbook for the seismic evaluation of existing buildings.“ FEMA Publication 178. Washington, DC. Building Seismic Safety Council (BSSC), (1992c). “NEHRP recommeded provisions for the development of regulations for new buildings.“ FEMA Publication 222. Washington, DC. Building Seismic Safety Council (BSSC). (1992d). “NEHRP recommeded provisions for the development of regulations for new buildings, part 2, commentary.“ FEMA Publication 223. Washington, DC. Building Seismic Safety Council (BSSC). (1995). “A nontechnical explanation of the NEHRP recommended provisions.” FEMA Publication 99. Washington, DC. Building Seismic Safety Council (BSSC). (1998a). “NEHRP recommended provisions for seismic regulations for new buildings and other structures.” FEMA Publication 302, Part 1, Provisions. Washington, DC.

157
Building Seismic Safety Council (BSSC). (1998b). “NEHRP recommended provisions for seismic regulations for new buildings and other structures.” FEMA Publication 303, Part 2, Commentary. Washington, DC. Building Seismic Safety Council (BSSC). (1999a). “Example applications of the NEHRP guidelines for the seismic rehabilitation of buildings.” FEMA Publication 276. Washington, DC. Building Seismic Safety Council (BSSC). (1999b). “Case studies: an assessment of the NEHRP guidelines for the seismic rehabilitation of buildings.” FEMA Publication 343. Washington, DC. Building Seismic Safety Council (BSSC). (2001a). “NEHRP recommended provisions for seismic regulations for new buildings and other structures.” FEMA Publication 368, Part 1, Provisions. Washington, DC. Building Seismic Safety Council (BSSC). (2001b). “NEHRP recommended provisions for seismic regulations for new buildings and other structures.” FEMA Publication 369, Part 2, Commentary. Washington, DC. Federal Emergency Management Agency (FEMA). (1990). “Guidebook for developing a school earthquake safety program.” FEMA Publication 88. Washington, DC. Federal Emergency Management Agency (FEMA). (1994). “Reducing the risks of nonstructural earthquake damage, a practical guide.” FEMA Publication 74. Washington, DC. Hart Consultant Group, Inc. (Hart). (1994). “Typical costs for seismic rehabilitation of existing buildings: volume 1: summary.” FEMA Publication 156. Santa Monica, CA. Hart Consultant Group, Inc. (Hart). (1995). “Typical costs for seismic rehabilitation of existing buildings: volume 2: supporting documentation.” FEMA Publication 157. Santa Monica, CA. International Conference of Building Officials (ICBO). (1994). Uniform building code. Whittier, CA.

158
International Conference of Building Officials (ICBO). (1997). Uniform building code. Whittier, CA. McIntosh, R.D. and Pezeshk, S. (1997). “Comparison of Recent U.S. Seismic Codes.” Journal of Structural Engineering, ASCE, 123(8), 993-1000. “National Institute of Building Sciences.” (2003). <http://www.nibs.org> National Science Teachers Association (NSTA). (1992). “Teacher’s package for k-6 grades.” FEMA Publication 159. Arlington, VA. Poland, C.D. (2003). Electronic mail correspondence dated 12 December. “U.S. Geological Survey.” (2003). <http://www.usgs.gov> VSP Associates, Inc. (1992a). “Benefit-cost model for the seismic rehabilitation of hazardous buildings: volume 1: a user’s manual.” FEMA Publication 227. Sacramento, CA. VSP Associates, Inc. (1992b). “Benefit-cost model for the seismic rehabilitation of hazardous buildings: volume e: supporting documentation.” FEMA Publication 228. Sacramento, CA.

159
APPENDICES

160
APPENDIX A: GLOBAL CALCULATIONS INPUTS

161
Roofing 2.25 psf= Breyer App. B
Sheathing t( ) 3psf
in⎛⎜⎝
⎞
⎠t( )⋅:= Sheathing 0.75in( ) 2.25psf= Breyer App. B
Truss6plf( )
4ft( ):= EstimateTruss 1.5 psf=
Joist 1.7psf:= Breyer App. A,2x10 @ 24"
DLbeams 1.4psf:= Estimate
Ceiling 1.0psf:=
Misc 1.5psf:= Estimate
DLroof_CR Roofing Sheathing 0.75in( )+ Truss+ Joist+DLbeams Ceiling+ Misc++
...:=
DLroof_CR 11.6 psf=
Preston BaxterHoover Elementary SchoolSeismic Accelerations
Spectral Acceleration values are taken fromhttp://eqint.cr.usgs.gov/eq/html/zipcode.shtml using the zip code 97330.
Spectral Accelerations (10%/50 years)Ss_1 43% g⋅:= Ss_1 0.43 g=
S1_1 20% g⋅:= S1_1 0.2g=
Spectral Accelerations (2%/50 years)Ss_2 108% g⋅:= Ss_2 1.08 g=
S1_2 47% g⋅:= S1_2 0.47g=
Building Element WeightsClassroomsExisting Roof
Roofing 1.5psf
in⋅
⎛⎜⎝
⎞
⎠1.5 in⋅( )⋅:=

162
DL of new panel with 2 layers of 1/2" plywoodDLpanel2_CR 12.6 psf=
DL of new panel with 1 layer of 1/2" plywoodDLpanel_CR 11.1 psf=
DLpanel2_CR DLwall_CR Sheathing tpanel2( )+:=
DLpanel_CR DLwall_CR Sheathing tpanel( )+:=
Use for sheathing on both sidestpanel2 2 tpanel⋅:=
Assumed rehabilitation panel thicknesstpanel 0.5in:=
New Panels
DL of existing wallsDLwall_CR 9.6psf=
DLwall_CR Framing Siding+ Gypsum+ Insulation+:=
1989 FundamentalHandbook Table 4
Insulation 1pcf( ) 6in( )⋅:=
Reinforced MasonryTable 5-1, 2 layers ofgypsum
Gypsum 2 4psf
in⎛⎜⎝
⎞
⎠⋅ 0.625in( )⋅:=
Breyer App. B,1" siding
Siding 2.5psf:=
Breyer App. A,2x6 @ 16"
Framing 1.6psf:=
Existing Walls
DLroof2_CR 13.9 psf=
DLroof2_CR DLroof_CR Sheathing 0.75in( )+:=
New Roof

163
N
90'
80'
Dimension in N/S directionLCR 80ft:=
Dimension in E/W directionWCR 90ft:=
ClassroomsBuilding Plan Dimensions
hn_GYM 21ft 4in+:=
hn_CR 9ft:=
Roof Elevations
DLpanel2_GYM 12.6 psf=DLpanel2_GYM DLpanel2_CR:=
DLpanel_GYM 11.1 psf=DLpanel_GYM DLpanel_CR:=
DLwall_GYM 9.6psf=DLwall_GYM DLwall_CR:=
DLroof2_GYM 13.1 psf=
DLroof2_GYM DLroof_GYM Sheathing 0.625in( )+:=
DLroof_GYM 11.225 psf=
DLroof_GYM DLroof_CR Sheathing 0.75in( )− Sheathing 0.625in( )+:=
Gymnasium

164
116'
96'
N
LGYM 96ft:=
WGYM 116ft:=
Gymnasium
LOP_CR_W 0ft:=LOP_CR_S 45ft:=
LOP_CR_E 0ft:=LOP_CR_N 45ft:=
Wall Opening Lengths
Numpanel_CR_NSj2:=lpanel_CR_NSj
80ft:=
Number of wall panels for N/S seismic directionj 1 1..:=
Numpanel_CR_EWi
62
:=lpanel_CR_EWi
10ft15ft
:=
Number of wall panels for E/W seismic directioni 1 2..:=
Shear Panel Lengths

165
Shear Panel Lengths
k 1 6..:= Number of wall panels for E/W seismic direction
lpanel_GYM_EWk
14ft16ft23ft24ft26ft45ft
:=Numpanel_GYM_EWk
1:=
l 1 7..:= Number of wall panels for N/S seismic direction
lpanel_GYM_NSl
9ft10ft13ft18ft21ft37ft55ft
:=Numpanel_GYM_NSl
1:=
Wall Opening Lengths
LOP_GYM_N 33ft:= LOP_GYM_E 14ft:=
LOP_GYM_S 34ft:= LOP_GYM_W 9ft:=

166
APPENDIX B: FEMA 154 WORKSHEETS

167
Figure B 1. "Sidewalk Survey" RVS Form

168
Figure B 2. RVS Form with Plans Inspection

169
APPENDIX C: FEMA 356 CALCULATIONS

170
Note: units are divided out of each variable because the equation is empirical.
∆ h b,( )
8νy_panel
plf⎛⎜⎝
⎞
⎠⋅
hft
⎛⎜⎝
⎞
⎠
3⋅
Epsi
⎛⎜⎝
⎞
⎠
A
in2⎛⎜⎜⎝
⎞
⎠⋅
bft
⎛⎜⎝
⎞
⎠⋅
νy_panel
plf⎛⎜⎝
⎞
⎠
hft
⎛⎜⎝
⎞
⎠⋅
G
psi⎛⎜⎝
⎞
⎠
tpanel
in
⎛⎜⎝
⎞
⎠⋅
+ 0.75h
ft⎛⎜⎝
⎞
⎠⋅ en⋅+
h
b⎛⎜⎝
⎞
⎠
da
in
⎛⎜⎝
⎞
⎠⋅+
⎡⎢⎢⎢⎢⎢⎣
⎤⎥⎥⎥⎥⎥⎦
in⋅:=
Sec. 8.5.9.1Use for 8d common nailsen 0.096:=
Sec. 8.3.2.5Assumed hold-down elongationda 0.10in:=
Assumed panel thicknesstpanel 0.5 in=
APA Table 3Modulus of rigidity of panelG 90000psi:=
Area of 2x6 boundary elementA 1.5in( ) 5.5in( )⋅:=
Modulus of elasticity of boundary member,assumed value for Douglas Fir wall stud
E 1600ksi:=
Sec. 8.5.9.2 &C8.5.9.2
νy_panel 418 plf=νy_panel 0.8νLRFD
0.65⋅:=
NEHRP Table12.4.3-2a
"Sheathing, Other Grades" with 8d@6"assumed nail spacing, 15/32" plywoodthickness, φ = 0.65
νLRFD 340plf:=
The stiffness of wood panel sheathing as defined in Equation 8-2 of FEMA 356 is a functionof panel height, width and constants given in FEMA 356. In order to model the shellelements in SAP to achieve the prescribed deflections at specified load, a "pseudo"stiffness property E is applied to the model material. This stiffness is not related in any wayto the material property of wood or the components of the wall. Instead, this quantitiy isused to help model the entire panel to achieve the performance prescribed by FEMA 356.
Shearwall Stiffness
Preston BaxterReference:C:\Thesis\The Report\Global Inputs.mcd(R)
Hoover School Analysis - FEMA 356

171
Classroom PanelsTo determine the appropriate "pseudo" stiffness property for the shearwall panels, a testmodel consisting of plate elements was constructed. For each length of shearwall thedeflection per FEMA 356 is calculated, and the "E" value modified in the test model untilthe resulting deflection matched the calculated deflection.
z 1 22..:=
bz
4ft5ft6ft7ft8ft9ft
10ft11ft12ft13ft14ft15ft16ft17ft18ft19ft20ft21ft22ft23ft24ft25ft
:=∆ hn_CR bz,( )
1.0030.949
0.913
0.887
0.867
0.852
0.840
0.830
0.822
0.815
0.809
0.804
0.799
0.796
0.792
0.789
0.786
0.783
0.781
0.779
0.777
0.775
in=
Ez
171.9ksi125.9ksi99.5ksi83.1ksi72.4ksi64.9ksi59.7ksi55.8ksi53.0ksi50.9ksi49.3ksi48.1ksi47.1ksi46.3ksi45.8ksi45.3ksi45.0ksi44.7ksi44.5ksi44.3ksi44.1ksi44.0ksi
:=

172
Short Panel Results
0 5 10 15 20 250
50
100
150
200Element Stiffness
Wall Length
Mat
eria
l Stif
fnes
sEz
ksi
bz
ft
kwallz
νy_panel bz⋅
∆ hn_CR bz,( ):=
0 5 10 15 20 250
5
10
15Wall Stiffness
Wall Length
Wal
l Stif
fnes
s kwallz
kipin
bz
ft

173
Gymnasium Panels
bz
8ft10ft12ft14ft16ft18ft20ft22ft24ft26ft28ft30ft32ft34ft36ft38ft40ft42ft44ft46ft48ft50ft
:=∆ hn_GYM bz,( )
2.3092.194
2.117
2.063
2.022
1.990
1.964
1.943
1.926
1.911
1.899
1.888
1.878
1.870
1.862
1.855
1.849
1.844
1.839
1.834
1.830
1.826
in=
Ez
242.2ksi173.0ksi133.3ksi108.5ksi
92.1ksi80.7ksi72.6ksi66.6ksi62.1ksi58.6ksi55.9ksi53.8ksi52.2ksi51.0ksi49.8ksi48.9ksi48.2ksi47.6ksi47.2ksi46.8ksi46.4ksi46.2ksi
:=

174
Tall Panel Results
0 10 20 30 40 500
100
200
300Element Stiffness
Wall Length
Mat
eria
l Stif
fnes
s
Ez
ksi
bz
ft
kwallz
νy_panel bz⋅
∆ hn_GYM bz,( ):=
0 10 20 30 40 500
5
10
15Gymnasium Wall Stiffness
Wall Length
Wal
l Stif
fnes
s kwallz
kipin
bz
ft
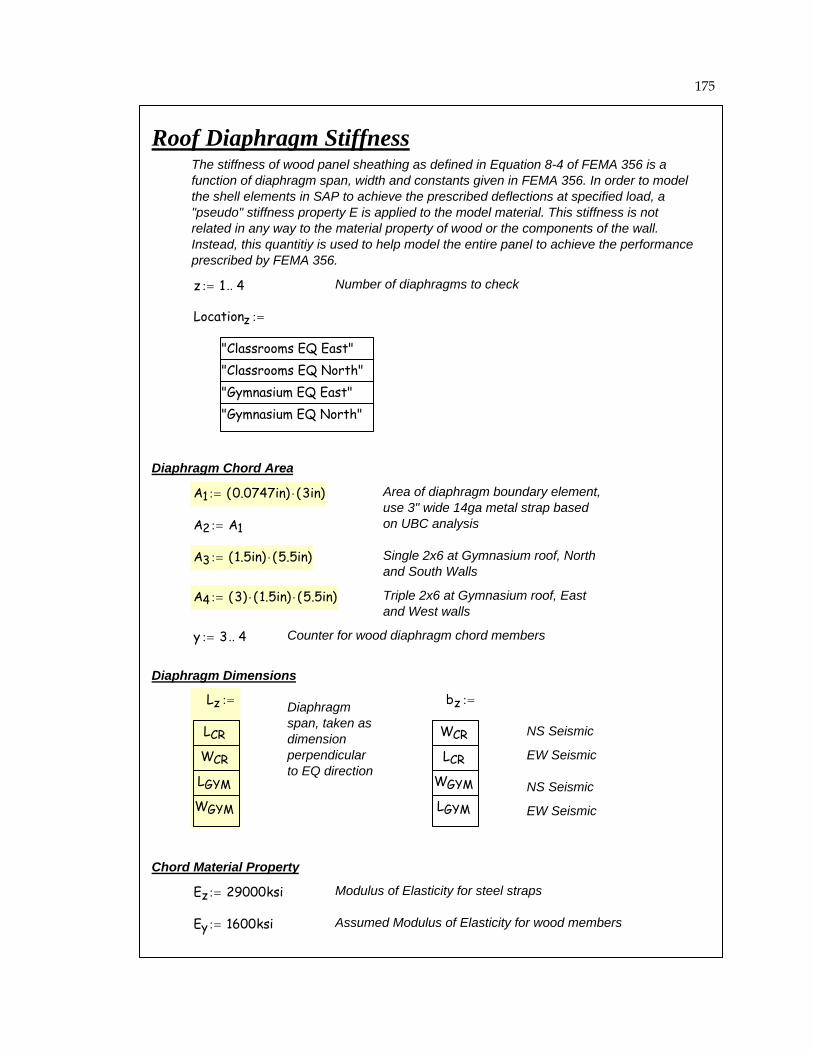
175
Assumed Modulus of Elasticity for wood membersEy 1600ksi:=
Modulus of Elasticity for steel strapsEz 29000ksi:=
Chord Material Property
EW Seismic
NS Seismic
EW Seismic
NS Seismic
bz
WCR
LCR
WGYM
LGYM
:=Diaphragmspan, taken asdimensionperpendicularto EQ direction
Lz
LCR
WCR
LGYM
WGYM
:=
Diaphragm Dimensions
Counter for wood diaphragm chord membersy 3 4..:=
Triple 2x6 at Gymnasium roof, Eastand West walls
A4 3( ) 1.5in( )⋅ 5.5in( )⋅:=
Single 2x6 at Gymnasium roof, Northand South Walls
A3 1.5in( ) 5.5in( )⋅:=
A2 A1:=
Area of diaphragm boundary element,use 3" wide 14ga metal strap basedon UBC analysis
A1 0.0747in( ) 3in( )⋅:=
Diaphragm Chord Area
Locationz
"Classrooms EQ East""Classrooms EQ North""Gymnasium EQ East""Gymnasium EQ North"
:=
Number of diaphragms to checkz 1 4..:=
The stiffness of wood panel sheathing as defined in Equation 8-4 of FEMA 356 is afunction of diaphragm span, width and constants given in FEMA 356. In order to modelthe shell elements in SAP to achieve the prescribed deflections at specified load, a"pseudo" stiffness property E is applied to the model material. This stiffness is notrelated in any way to the material property of wood or the components of the wall.Instead, this quantitiy is used to help model the entire panel to achieve the performanceprescribed by FEMA 356.
Roof Diaphragm Stiffness

176
Locationz"Classrooms EQ East"
"Classrooms EQ North"
"Gymnasium EQ East"
"Gymnasium EQ North"
=
νy_roofz
2646646
323
323
plf
=νy_roofz
12921292
646
646
plf
=
νy_roof4νy_roof3
:=νy_roof3
νLRFD
0.65:=
NEHRP Table12.4.3-1a
"Sheathing, Other Grades" with 10d@6"assumed nail spacing, 19/32" plywoodthickness, φ = 0.65
νLRFD 420plf:=
νy_roof2νy_roof1
:=νy_roof1
νLRFD
0.65:=
NEHRP Table12.4.3-1a
"Sheathing, Other Grades" with 10d@4"assumed nail spacing, 23/32" plywoodthickness, φ = 0.65
νLRFD 840plf:=
Yield Shear
Gymnasium roof (#3-4)
Panel thickness at classroom roofs (#1-2)
troofz
0.75in0.75in
0.625in0.625in
:=
Panel Thickness

177
Use for roof diaphragmEGYM 63450 psi=
EGYM mean Epanel3Epanel4,⎛
⎝⎞⎠
:=
Epanel467.7ksi=∆
44.686 in=
Epanel359.2ksi=∆
33.974 in=
Gymnasium
Use for roof diaphragmECR 82950 psi=
ECR mean Epanel1Epanel2,⎛
⎝⎞⎠
:=
Epanel282.7ksi=∆
24.812 in=
Epanel183.2ksi=∆
13.978 in=
Classrooms
Diaphragm "E" Property
Epanelz
83.2 ksi⋅
82.7 ksi⋅
59.2 ksi⋅
67.7 ksi⋅
:=Locationz
"Classrooms EQ East""Classrooms EQ North"
"Gymnasium EQ East"
"Gymnasium EQ North"
=∆
z3.9784.812
3.974
4.686
in
=Model Stiffness
∆z
∆ νy_roofzLz, Ez, Az, bz, troofz
,⎛⎝
⎞⎠
:=
Note: units are divided out of each variable because the equation is empirical.
∆ νy L, E, A, b, t,( )5
νy
plf⎛⎜⎝
⎞
⎠⋅
Lft
⎛⎜⎝
⎞
⎠
3⋅
8E
psi⎛⎜⎝
⎞
⎠
A
in2⎛⎜⎜⎝
⎞
⎠⋅⋅
bft
⎛⎜⎝
⎞
⎠⋅
νy
plf⎛⎜⎝
⎞
⎠
Lft
⎛⎜⎝
⎞
⎠⋅
4G
psi⋅
tin
⎛⎜⎝
⎞
⎠⋅
+ 0.376L
ft⎛⎜⎝
⎞
⎠⋅ en⋅+
∆cX
2 b⋅ in⋅⎛⎜⎝
⎞
⎠+
⎡⎢⎢⎢⎢⎢⎣
⎤⎥⎥⎥⎥⎥⎦
in⋅:=
Assumed summation of chord splice slip∆cX 0in2:=
Deflections

178
γpanel2_CR 151.2 pcf=γpanel2_CRDLpanel2_CR
tpanel2:=
γpanel_CR 266.4 pcf=γpanel_CRDLpanel_CR
tpanel:=
tpanel2 1 in=
Modeled thickness of new panelstpanel 0.5 in=
DLpanel2_CR 12.6 psf=
DLpanel_CR 11.1 psf=
Panel Elements
γwall_CR 115.2 pcf=γwall_CRDLwall_CR
twall:=
Modeled thickness of existing wallstwall 1in:=
DLwall_CR 9.6psf=
Wall Elements
γroof2_CR 110.8 pcf=γroof2_CRDLroof2_CR
2 troof1⋅
:=
γroof_CR 185.6 pcf=γroof_CRDLroof_CR
troof1
:=
2 troof1⋅ 1.5 in=
troof10.75 in=
DLroof2_CR 13.9 psf=
DLroof_CR 11.6 psf=
Roof Elements
Classrooms
Model Element Weights

179
γpanel2_GYM 151.2 pcf=γpanel2_GYMDLpanel2_GYM
tpanel2:=
γpanel_GYM 266.4 pcf=γpanel_GYMDLpanel_GYM
tpanel:=
tpanel2 1 in=
Modeled thickness of new panelstpanel 0.5 in=
DLpanel2_GYM 12.6 psf=
DLpanel_GYM 11.1 psf=
Panel Elements
γwall_GYM 115.2 pcf=γwall_GYMDLwall_GYM
twall:=
Modeled thickness of existing wallstwall 1 in=
DLwall_GYM 9.6psf=
Wall Elements
γroof2_GYM 125.8 pcf=γroof2_GYMDLroof2_GYM
2 troof3⋅
:=
γroof_GYM 215.5 pcf=γroof_GYMDLroof_GYM
troof3
:=
2 troof3⋅ 1.25 in=
troof30.625 in=
DLroof2_GYM 13.1 psf=
DLroof_GYM 11.2 psf=
Roof Elements
Gymnasium

180
Eq. 1-5
BSE-2 Spectral Accelerations (2%/50 years)
Ss_2 1.08 g= S1_2 0.47g=
Site Class
Fa interpolate 1.00 g⋅ 1.25 g⋅, 1.1, 1.0, Ss_2,( ):= Table 1-4
Fv interpolate 0.40 g⋅ 0.50 g⋅, 1.6, 1.5, S1_2,( ):= Table 1-5
Fa 1.068= Fv 1.530=
Sxs_2 Fa Ss_2⋅:= Sxs_2 1.153 g= Eq. 1-4
Sx1_2 Fv S1_2⋅:= Sx1_2 0.719 g= Eq. 1-5
2
3Sxs_2⋅ 0.769 g=
2
3Sx1_2⋅ 0.479 g=
Seismic Hazard (Linear Static Procedure) Sec. 3.3.1
BSE-1 Spectral Accelerations (10%/50 years)
Ss_1 0.43 g= S1_1 0.2g=
Site Class
Without specific geologic survey data, use Site Class D 1.6.1.4.2
Fa interpolate 0.25 g⋅ 0.50 g⋅, 1.6, 1.4, Ss_1,( ):= Table 1-4
Fv interpolate 0.1 g⋅ 0.20 g⋅, 2.4, 2.0, S1_1,( ):= Table 1-5
Fa 1.456= Fv 2.000=
Sxs_1 Fa Ss_1⋅:= Sxs_1 0.626 g= Eq. 1-4
Sx1_1 Fv S1_1⋅:= Sx1_1 0.400 g=

181
T hn( ) Cthn
ft
⎛⎜⎝
⎞
⎠
β
⋅ sec⋅:=Eq. 3-7Fundamental building period
Sec. 3.3.1.2.2Not steel or concrete MRFβ 0.75:=
Sec. 3.3.1.2, Table 10-2Type W2 buildingCt 0.060:=
Sec. 3.3.1.2 Method 2Period Determination
Counter: 1 = BSE-1, 2 = BSE-2n 1 2..:=
Sx120.719 g=Sx12
Sx1_2:=
Sxs21.153 g=Sxs2
Sxs_2:=
Design Spectral Accelerations for BSE-2
Sx110.400 g=Sx11
min Sx1_12
3Sx1_2⋅,
⎛⎜⎝
⎞
⎠:=
Sxs10.626 g=Sxs1
min Sxs_12
3Sxs_2⋅,
⎛⎜⎝
⎞
⎠:=
1.6.1.2Design Spectral Accelerations for BSE-1

182
C1 T Ts,( ) linterp0.10sec
Ts
⎛⎜⎜⎝
⎞
⎠
1.5
1.0
⎛⎜⎝
⎞
⎠, T,
⎡⎢⎢⎣
⎤⎥⎥⎦
1.5 T 0.10sec<if
1.0 T Ts≥if
:= Sec. 3.3.1.3.1
C2 1.0:= Valid for linear procedures Sec. 3.3.1.3.1
C3 1.0:= Assume that overturning need not beinvestigated.
Section3.3.1.3.1
Cm 1.0:= Use for all 1-story structures Table 3-1
Sa Ts T0, T, Sxs, Sx1,( ) Sxs5
Bs2−
⎛⎜⎝
⎞
⎠
T
Ts⋅ 0.4+
⎡⎢⎣
⎤⎥⎦
⋅⎡⎢⎣
⎤⎥⎦
T T0≤if
Sx1
B1 T⋅sec⋅
⎛⎜⎜⎝
⎞
⎠T Ts>if
Sxs
Bsotherwise
:= Eq. 1-8
Eq. 1-10
Eq. 1-9
Lateral load coefficient, to bemultiplied by seismic mass togenerate pseudo static lateral load
Coef C1 Sa,( ) C1 C2⋅ C3⋅ Cm⋅Sa
g⋅:= Eq. 3-10
Pseudo Lateral LoadBs 1.0:= B1 1.0:= Assume 5% damping Table 1-6
Tsn
Sx1nBs⋅
SxsnB1⋅
sec:= T0n0.2 Tsn
⋅:= Eq. 1-11 & 1-12
Tsn
0.6390.623
sec
= T0n
0.1280.125
sec
=
BSE-1
BSE-2
Check applicability of Linear Static Procedures:
Check T hn_CR( ) 3.5 Tsn⋅,⎛
⎝⎞⎠
"OK""OK"
= Check T hn_GYM( ) 3.5 Tsn⋅,⎛
⎝⎞⎠
"OK""OK"
= 2.4.1.2
T hn_CR( ) 0.312 sec= T hn_GYM( ) 0.596 sec=

183
BSE-2 (CP)
BSE-1 (IO)
CoefGYMn
0.6511.184
=Sa_GYMn
0.6261.153
g
=C1_GYMn
1.041.027
=
CoefGYMnCoef C1_GYMn
Sa_GYMn,⎛
⎝⎞⎠
:=
Sa_GYMnSa Tsn
T0n, TGYM, Sxsn
, Sx1n,⎛
⎝⎞⎠
:=
C1_GYMnC1 TGYM Tsn
,⎛⎝
⎞⎠
:=
TGYM 0.596 sec=TGYM T hn_GYM( ):=
hn_GYM 21.333 ft=
Pseudo Lateral Load - Gymnasium
BSE-2 (CP)
BSE-1 (LS)
CoefCRn
0.8161.497
=Sa_CRn
0.6261.153
g
=C1_CRn
1.3041.298
=
CoefCRnCoef C1_CRn
Sa_CRn,⎛
⎝⎞⎠
:=
Sa_CRnSa Tsn
T0n, TCR, Sxsn
, Sx1n,⎛
⎝⎞⎠
:=
C1_CRnC1 TCR Tsn
,⎛⎝
⎞⎠
:=
TCR 0.312 sec=TCR T hn_CR( ):=
hn_CR 9 ft=
Pseudo Lateral Load - Classrooms

184
νCR2_NSn
5499
plf
=νCR2_EWn
4888
plf
=VCR2n
86158
kip
=
νCR2_NSn
0.05 VCR2n⋅
LCR:=νCR2_EWn
0.05 VCR2n⋅
WCR:=
VCR2nWtCR2 CoefCRn
⋅:=
WtCR2 106 kip=WtCR2 WCR LCR⋅ DLroof2_CR⋅
i
lpanel_CR_EWiDLpanel2_CR⋅
hn_CR
2⋅
⎛⎜⎝
⎞
⎠∑+...
j
lpanel_CR_NSjDLpanel2_CR⋅
hn_CR
2⋅
⎛⎜⎝
⎞
⎠∑+
...
:=
BSE-2 (CP)
BSE-1 (LS)
νCR_NSn
4583
plf
=νCR_EWn
4074
plf
=VCRn
72133
kip
=
νCR_NSn
0.05 VCRn⋅
LCR:=
Additional load to tops of walls for accidental torsionνCR_EWn
0.05 VCRn⋅
WCR:=
Total seismic story shearVCRnWtCR CoefCRn
⋅:=
WtCR 89 kip=WtCR WCR LCR⋅ DLroof_CR⋅
i
lpanel_CR_EWiDLpanel_CR⋅
hn_CR
2⋅
⎛⎜⎝
⎞
⎠∑+...
j
lpanel_CR_NSjDLpanel_CR⋅
hn_CR
2⋅
⎛⎜⎝
⎞
⎠∑+
...
:=
ClassroomsAccidental Torsion Load

185
νGYM2_NSn
68123
plf
=νGYM2_EWn
56102
plf
=
νGYM_NSn
59107
plf
=νGYM_EWn
4989
plf
=VGYM2n
130236
kip
=VGYMn
113205
kip
=
νGYM2_NSn
0.05 VGYM2n⋅
LGYM:=νGYM_NSn
0.05 VGYMn⋅
LGYM:=
νGYM2_EWn
0.05 VGYM2n⋅
WGYM:=νGYM_EWn
0.05 VGYMn⋅
WGYM:=
VGYM2nWtGYM2 CoefGYMn
⋅:=VGYMnWtGYM CoefGYMn
⋅:=
WtGYM2 199 kip=WtGYM 173 kip=
WtGYM2 WGYM LGYM⋅ DLroof2_GYM⋅
DLpanel2_GYMhn_GYM
2⋅
k
lpanel_GYM_EWk⎛⎝
⎞⎠∑
l
lpanel_GYM_NSl⎛⎝
⎞⎠∑+⎡⎢
⎢⎣
⎤⎥⎥⎦
⋅+
...
DLwall_GYMhn_GYM
2⋅ 2 WGYM⋅
k
lpanel_GYM_EWk⎛⎝
⎞⎠∑−⎡⎢
⎢⎣
⎤⎥⎥⎦
2 LGYM⋅
l
lpanel_GYM_NSl⎛⎝
⎞⎠∑−⎡⎢
⎢⎣
⎤⎥⎥⎦
+
...⎡⎢⎢⎢⎢⎢⎣
⎤⎥⎥⎥⎥⎥⎦
⋅+
...
:=
WtGYM WGYM LGYM⋅ DLroof_GYM⋅
DLpanel_GYMhn_GYM
2⋅
k
lpanel_GYM_EWk⎛⎝
⎞⎠∑
l
lpanel_GYM_NSl⎛⎝
⎞⎠∑+⎡⎢
⎢⎣
⎤⎥⎥⎦
⋅+
...
DLwall_GYMhn_GYM
2⋅ 2 WGYM⋅
k
lpanel_GYM_EWk⎛⎝
⎞⎠∑−⎡⎢
⎢⎣
⎤⎥⎥⎦
2 LGYM⋅
l
lpanel_GYM_NSl⎛⎝
⎞⎠∑−⎡⎢
⎢⎣
⎤⎥⎥⎦
+
...⎡⎢⎢⎢⎢⎢⎣
⎤⎥⎥⎥⎥⎥⎦
⋅+
...
:=
Gymnasium

186
Knowledge Factor, use each factor for eachTarget Building Performance Level.
κn
1.00.75
:=
Knowledge Factors
Factor for L/b = 4.0m2_RTBP
1.52.53.0
:=
Factor for L/b < 3.0m1_RTBP
1.53.04.0
:=
Roof Diaphragm "m" Factors
Factor for 2.0 < h.b < 3.5m2_PTBP
1.42.63.0
:=
Collapse Prevention
Life Safety
Immediate Occupancy
Table 8-3Factor for h/b < 1.0m1_PTBP
1.73.84.5
:=
Counter for Target Building Performance:1 = Immediate Occupancy2 = Life Safety3 = Collapse Prevention
TBP 1 3..:=
Wall Panel "m" Factors
Model Acceptance Criteria

187
Interpolate for3.0 < L/b < 4.0
troof troof2 troof troof2K = 1.0 3877 7754 3231 6462
K = 0.75 2908 5815 2423 4846K = 1.0 5169 10338 3877 7754
K = 0.75 3877 7754 2908 5815
Acceptance Loads for Classroom Roof Diaphragm
Life Safety
Collapse Prevention
L/b < 3.0plf
L/b = 4.0plf
ν'accept_CR_R2_CPn 2,m2_R3
κn
⋅ νy_roof21⋅:=
ν'accept_CR_R2_CPn 1,m1_R3
κn
⋅ νy_roof21⋅:=
ν'accept_CR_R2_LSn 2,m2_R2
κn
⋅ νy_roof21⋅:=
Acceptance loads for double-sheathedroof diaphragm (double capacityassumed)
ν'accept_CR_R2_LSn 1,m1_R2
κn
⋅ νy_roof21⋅:=
ν'accept_CR_R_CPn 2,m2_R3
κn
⋅ νy_roof1⋅:=
ν'accept_CR_R_CPn 1,m1_R3
κn
⋅ νy_roof1⋅:=
Shear for L/b = 4.0ν'accept_CR_R_LSn 2,m2_R2
κn
⋅ νy_roof1⋅:=
Eq. 3-20Shear for L/b < 3.0ν'accept_CR_R_LSn 1,m1_R2
κn
⋅ νy_roof1⋅:=
Acceptance Loads - Classrooms
Assume that double-sheathingroof diaphragm doubles roofdiaphragm capacity
νy_roof212585 plf=νy_roof2 2 νy_roof⋅:=
νy_roof11292 plf=
Yield Strength - Classrooms
Roof Diaphragms

188
Yield Strength - Gymnasium
νy_roof3646 plf=
νy_roof231292 plf=
Acceptance Loads - Gymnasium
ν'accept_GYM_R_IOn 1,m1_R1
κn
⋅ νy_roof3⋅:=
ν'accept_GYM_R_IOn 2,m2_R1
κn
⋅ νy_roof3⋅:=
ν'accept_GYM_R_CPn 1,m1_R3
κn
⋅ νy_roof3⋅:=
ν'accept_GYM_R_CPn 2,m2_R3
κn
⋅ νy_roof3⋅:=
ν'accept_GYM_R2_IOn 1,m1_R1
κn
⋅ νy_roof23⋅:=
ν'accept_GYM_R2_IOn 2,m2_R1
κn
⋅ νy_roof23⋅:=
ν'accept_GYM_R2_CPn 1,m1_R3
κn
⋅ νy_roof23⋅:=
ν'accept_GYM_R2_CPn 2,m2_R3
κn
⋅ νy_roof23⋅:=
troof troof2 troof troof2K = 1.0 969 1938 969 1938
K = 0.75 727 1454 727 1454K = 1.0 2585 5169 1938 3877
K = 0.75 1938 3877 1454 2908
Acceptance Loads for Gymnasium Roof Diaphragm
Immediate Occupancy
Collapse Prevention
L/b < 3.0plf
L/b = 4.0plf
Interpolate for3.0 < L/b < 4.0

189
Interpolate for1.0 < h/b < 2.0
tpanel tpanel2 troof troof2K = 1.0 711 1423 586 1172K = 0.75 534 1067 439 879K = 1.0 1590 3180 1088 2176K = 0.75 1193 2385 816 1632K = 1.0 1883 3766 1255 2511K = 0.75 1412 2825 942 1883
Acceptance Loads for Wall Panels
Immediate Occupancy
Collapse Prevention
h/b < 1.0plf
2.0 < h/b < 3.5plf
Life Safety
ν'accept_P2_CPn 2,m2_P3
κn
⋅ νy_panel⋅:=ν'accept_P2_LSn 2,m2_P2
κn
⋅ νy_panel2⋅:=
ν'accept_P2_CPn 1,m1_P3
κn
⋅ νy_panel2⋅:=ν'accept_P2_LSn 1,m1_P2
κn
⋅ νy_panel2⋅:=
ν'accept_P2_IOn 2,m2_P1
κn
⋅ νy_panel2⋅:=
Acceptance loads for wall sheathed onboth sides (double capacity assumed)
ν'accept_P2_IOn 1,m1_P1
κn
⋅ νy_panel2⋅:=
ν'accept_P_CPn 2,m2_P3
κn
⋅ νy_panel⋅:=ν'accept_P_LSn 2,m2_P2
κn
⋅ νy_panel⋅:=
ν'accept_P_CPn 1,m1_P3
κn
⋅ νy_panel⋅:=ν'accept_P_LSn 1,m1_P2
κn
⋅ νy_panel⋅:=
Shear for 2.0 < h/b < 3.5ν'accept_P_IOn 2,m2_P1
κn
⋅ νy_panel⋅:=
Shear for h/b < 1.0ν'accept_P_IOn 1,m1_P1
κn
⋅ νy_panel⋅:=
Acceptance Loads
Assume that sheathing on 2sides of wall doubles thepanel capacity.
νy_panel2 837 plf=νy_panel2 2 νy_panel⋅:=
νy_panel 418 plf=
Yield Strength
Shear Panels

190
Design Results - SetupAcceptance Criteria Selection
N
L
W
L for N/S seismicb for E/W seismic
L for E/W seismicb for N/S seismic
hnb b b
Roof Diaphragms
For 0 < L/b < 3.0, use ν1.For 3.0 < L/b < 4.0 interpolate between ν1 and ν2.For L/b = 4.0, use ν2.Otherwise set to zero.
νaccept_R ν1 ν2, L, b,( ) 0plf
ν1L
b3.0≤
⎛⎜⎝
⎞
⎠if
linterp3.0
4.0
⎛⎜⎝
⎞
⎠
ν1
ν2
⎛⎜⎜⎝
⎞
⎠,
Lb
,⎡⎢⎢⎣
⎤⎥⎥⎦
3.0Lb
< 4.0≤⎛⎜⎝
⎞
⎠if
ν2L
b3.5=
⎛⎜⎝
⎞
⎠if
:=

191
Shear Wall Panels
For 0 < h/b < 1.0, use ν1.For 1.0 < h/b < 2.0 interpolate between ν1 and ν2.For 2.0 < h/b < 3.5, use ν2.Otherwise set to zero.
νaccept_P ν1 ν2, h, b,( ) 0plf
ν1h
b1.0≤
⎛⎜⎝
⎞
⎠if
linterp1.0
2.0
⎛⎜⎝
⎞
⎠
ν1
ν2
⎛⎜⎜⎝
⎞
⎠,
hb
,⎡⎢⎢⎣
⎤⎥⎥⎦
1.0hb
< 2.0≤⎛⎜⎝
⎞
⎠if
ν2 2.0h
b< 3.5≤
⎛⎜⎝
⎞
⎠if
:=
Acceptance of Seismic CoefficientA check is conducted to ensure that P-∆ effects need not be included.
θP δ⋅
V h⋅=
The value θ is set equal to 0.1, P equals the DL plus 25% of the total roof live load,V equals the total lateral shear, and h is the building height. V equals the seismiccoefficient times the DL. The story drift coefficient can be re-written as:
θDL 0.25 LLroof⋅+( ) δ⋅
Coef DL⋅( ) h⋅=
Assuming the roof live load is equal to 25psf * W * L, the allowable story drift δ equals:
δ DL Coef, h, W, L,( )0.1 Coef DL⋅( ) h⋅[ ]⋅
DL 0.25 25psf( )⋅ W L⋅( )⋅+[ ]:=

192
δ2_NS 0.77in:=δ2_EW 1.23in:=
νpanel2_EWi
1368plf1242plf
:= νpanel2_NSj721plf:=
νroof2_NS 609plf:=νroof2_EW 1167plf:=
Double Panel Layer
Roof displacementδNS 1.29in:=δEW 2.08in:=
νpanel_NSj609plf:=lpanel_CR_NSj
80 ft
=
νpanel_EWi
1154plf1048plf
:= Modeled panel lengths,associated basereactions
lpanel_CR_EWi
1015
ft
=
Maximum in-planeshear force in roof
νroof_NS 509plf:=νroof_EW 983plf:=
Single Panel Layer
BSE-1: Life Safety
Minimum panel lengthMin 2.571 ft=Minhn_CR
3.5:=
LCR 80 ft=WCR 90 ft=hn_CR 9 ft=
Design Results - Classrooms

193
DCR for roof shear
Double Layer
ν1_R2Kν'accept_CR_R2_LSK 1,
:= ν2_R2Kν'accept_CR_R2_LSK 2,
:=
νaccept_R2_EW νaccept_R ν1_R2Kν2_R2K, L, b,⎛
⎝⎞⎠
:=
DCRR2_EWνroof2_EW
νaccept_R2_EW:=
Acceptance Criteria for Roof: N/S seismic direction
L WCR:= b LCR:=L
b1.125=
Single Layer
νaccept_R_NS νaccept_R ν1_RKν2_RK, L, b,⎛
⎝⎞⎠
:= DCRR_NSνroof_NS
νaccept_R_NS:=
Double Layer
νaccept_R2_NS νaccept_R ν1_R2Kν2_R2K, L, b,⎛
⎝⎞⎠
:= DCRR2_NSνroof2_NS
νaccept_R2_NS:=
Acceptance Criteria for Roof: E/W seismic direction
L LCR:= b WCR:= "W" is the dimension in theEW direction
L
b0.889=
Choose appropriate value for knowledge factor
K 1= 1 for K = 12 for K = 0.75
Single Layer
ν1_RKν'accept_CR_R_LSK 1,
:= Roof acceptance shear for h/b < 1.0
ν2_RKν'accept_CR_R_LSK 2,
:= Roof acceptance shear for 2.0 < h/b < 3.5
νaccept_R_EW νaccept_R ν1_RKν2_RK, L, b,⎛
⎝⎞⎠
:= Acceptance shear for h/b
DCRR_EWνroof_EW
νaccept_R_EW:=

194
DCRP2_NSj
νpanel2_NSj
νaccept_P2_NSj
:=νaccept_P2_NSjνaccept_P ν1_P2 ν2_P2, h, bj,( ):=
Double Layer
DCRP_NSj
νpanel_NSj
νaccept_P_NSj
:=νaccept_P_NSjνaccept_P ν1_P ν2_P, h, bj,( ):=
Single Layer
h
bj
0.113
=b lpanel_CR_NS:=
Acceptance Criteria for Wall Panels: N/S seismic direction
DCRP2_EWi
νpanel2_EWi
νaccept_P2_EWi
:=
νaccept_P2_EWiνaccept_P ν1_P2 ν2_P2, h, bi,( ):=
ν2_P2 ν'accept_P2_LSK 2,:=ν1_P2 ν'accept_P2_LSK 1,
:=
Double Layer
DCRP_EWi
νpanel_EWi
νaccept_P_EWi
:=
νaccept_P_EWiνaccept_P ν1_P ν2_P, h, bi,( ):=
ν2_P ν'accept_P_LSK 2,:=ν1_P ν'accept_P_LSK 1,
:=
Single Layer
h
bi
0.900.60
=b lpanel_CR_EW:=h hn_CR:=
Acceptance Criteria for Wall Panels: E/W seismic direction

195
δ2_NSδaccept
0.116=δ2_EWδaccept
0.186=
Check δ2_NS δaccept,( ) "OK"=Check δ2_EW δaccept,( ) "OK"=
δaccept 0.552 ft=δaccept δ DL CoefCR1, hn_CR, WCR, LCR,⎛
⎝⎞⎠
:=
DL 136 kip=
DL WCR LCR⋅ DLroof2_CR⋅ lpanel_tot DLpanel2_CR⋅ lwall_tot DLwall_CR⋅+( ) hn_CR⋅+:=
Check Story Drift - Double Layer
δNSδaccept
0.203=δEW
δaccept0.327=
Check δNS δaccept,( ) "OK"=Check δEW δaccept,( ) "OK"=
δaccept 0.53 ft=δaccept δ DL CoefCR1, hn_CR, WCR, LCR,⎛
⎝⎞⎠
:=
VCR12.331 106
× lbft sec-2=
DL 116 kip=
DL WCR LCR⋅ DLroof_CR⋅ lpanel_tot DLpanel_CR⋅ lwall_tot DLwall_CR⋅+( ) hn_CR⋅+:=
lwall_tot 90 ft=lwall_tot 2 WCR LCR+( )⋅ lpanel_tot−:=
lpanel_tot 250 ft=lpanel_tot
i
lpanel_CR_EWiNumpanel_CR_EWi⋅⎛
⎝⎞⎠∑
j
lpanel_CR_NSjNumpanel_CR_NSj⋅⎛
⎝⎞⎠∑+...:=
Check Story Drift - Single Layer

196
Classrooms, Life Safety, K = 1.0, Single Panel Layerv vaccept
(plf) (plf)Roof 983 3877 0.25 OK
Wall Panel (ft)10 1154 1590 0.73 OK15 1048 1590 0.66 OK
East-West Earthquake Direction
DCR Status
Classrooms, Life Safety, K = 1.0, Single Panel Layerv vaccept
(plf) (plf)Roof 509 3877 0.13 OK
Wall Panel (ft)80 609 1590 0.38 OK
North-South Earthquake Direction
DCR Status
Classrooms, Life Safety, K = 1.0, Double Panel Layerv vaccept
(plf) (plf)Roof 1167 7754 0.15 OK
Wall Panel (ft)10 1368 3180 0.43 OK15 1242 3180 0.39 OK
East-West Earthquake Direction
DCR Status
Classrooms, Life Safety, K = 1.0, Double Panel Layerv vaccept
(plf) (plf)Roof 609 7754 0.08 OK
Wall Panel (ft)80 721 3180 0.23 OK
North-South Earthquake Direction
DCR Status
Data output

197
DCRR2_NSνroof2_NS
νaccept_R2_NS:=
νaccept_R2_NS νaccept_R ν1_R2Kν2_R2K, L, b,⎛
⎝⎞⎠
:=
Double Layer
DCRR_NSνroof_NS
νaccept_R_NS:=
νaccept_R_NS νaccept_R ν1_RKν2_RK, L, b,⎛
⎝⎞⎠
:=
Single Layer
L
b1.125=
b LCR:=L WCR:=
Acceptance Criteria for Roof: N/S seismic direction
DCRR2_EWνroof2_EW
νaccept_R2_EW:=
νaccept_R2_EW νaccept_R ν1_R2Kν2_R2K, L, b,⎛
⎝⎞⎠
:=
ν2_R2Kν'accept_CR_R2_LSK 2,
:=ν1_R2Kν'accept_CR_R2_LSK 1,
:=
Double Layer
DCRR_EWνroof_EW
νaccept_R_EW:=
νaccept_R_EW νaccept_R ν1_RKν2_RK, L, b,⎛
⎝⎞⎠
:=
ν2_RKν'accept_CR_R_LSK 2,
:=ν1_RKν'accept_CR_R_LSK 1,
:=
Single Layer
L
b0.889=
"W" is the dimension in theEW direction
b WCR:=L LCR:=
Acceptance Criteria for Roof: E/W seismic direction
K 2=

198
DCRP2_NSj
νpanel2_NSj
νaccept_P2_NSj
:=νaccept_P2_NSj
νaccept_P ν1_P2 ν2_P2, h, bj,( ):=
Double Layer
DCRP_NSj
νpanel_NSj
νaccept_P_NSj
:=νaccept_P_NSj
νaccept_P ν1_P ν2_P, h, bj,( ):=
Single Layer
h
bj
0.113
=b lpanel_CR_NS:=
Acceptance Criteria for Wall Panels: N/S seismic direction
DCRP2_EWi
νpanel2_EWi
νaccept_P2_EWi
:=
νaccept_P2_EWiνaccept_P ν1_P2 ν2_P2, h, bi,( ):=
ν2_P2 ν'accept_P2_LSK 2,:=ν1_P2 ν'accept_P2_LSK 1,
:=
Double Layer
DCRP_EWi
νpanel_EWi
νaccept_P_EWi
:=
νaccept_P_EWiνaccept_P ν1_P ν2_P, h, bi,( ):=
ν2_P ν'accept_P_LSK 2,:=ν1_P ν'accept_P_LSK 1,
:=
Single Layer
h
bi
0.900.60
=b lpanel_CR_EW:=h hn_CR:=
Acceptance Criteria for Wall Panels: E/W seismic direction

199
Classrooms, Life Safety, K = 0.75, Single Panel Layerv vaccept
(plf) (plf)Roof 983 2908 0.34 OK
Wall Panel (ft)10 1154 1193 0.97 OK15 1048 1193 0.88 OK
East-West Earthquake Direction
DCR Status
Classrooms, Life Safety, K = 0.75, Single Panel Layerv vaccept
(plf) (plf)Roof 509 2908 0.18 OK
Wall Panel (ft)80 609 1193 0.51 OK
North-South Earthquake Direction
DCR Status
Classrooms, Life Safety, K = 0.75, Double Panel Layerv vaccept
(plf) (plf)Roof 1167 5815 0.2 OK
Wall Panel (ft)10 1368 2385 0.57 OK15 1242 2385 0.52 OK
East-West Earthquake Direction
DCR Status
Classrooms, Life Safety, K = 0.75, Double Panel Layerv vaccept
(plf) (plf)Roof 609 5815 0.1 OK
Wall Panel (ft)80 721 2385 0.3 OK
North-South Earthquake Direction
DCR Status
Data Output

200
δ2_NS 1.41in:=δ2_EW 2.26in:=
νpanel2_NSj1323plf:=
νpanel2_EWi
2510plf2279plf
:=
νroof2_NS 1113plf:=νroof2_EW 2141plf:=
Double Panel Layer
δNS 2.37in:=δEW 3.81in:=
νpanel_NSj1118plf:=
lpanel_CR_NSj
80 ft
=
νpanel_EWi
2118plf1923plf
:=lpanel_CR_EWi
1015
ft
=
νroof_NS 935plf:=νroof_EW 1803plf:=
Single Panel Layer
Collapse Prevention

201
DCRR2_NSνroof2_NS
νaccept_R2_NS:=
νaccept_R2_NS νaccept_R ν1_R2Kν2_R2K, L, b,⎛
⎝⎞⎠
:=
Double Layer
DCRR_NSνroof_NS
νaccept_R_NS:=
νaccept_R_NS νaccept_R ν1_RKν2_RK, L, b,⎛
⎝⎞⎠
:=
Single Layer
L
b1.125=
b LCR:=L WCR:=
Acceptance Criteria for Roof: N/S seismic direction
DCRR2_EWνroof2_EW
νaccept_R2_EW:=
νaccept_R2_EW νaccept_R ν1_R2Kν2_R2K, L, b,⎛
⎝⎞⎠
:=
ν2_R2Kν'accept_CR_R2_CPK 2,
:=ν1_R2Kν'accept_CR_R2_CPK 1,
:=
Double Layer
DCRR_EWνroof_EW
νaccept_R_EW:=
νaccept_R_EW νaccept_R ν1_RKν2_RK, L, b,⎛
⎝⎞⎠
:=
ν2_RKν'accept_CR_R_CPK 2,
:=ν1_RKν'accept_CR_R_CPK 1,
:=
Single Layer
L
b0.889=
"W" is the dimension in theEW direction
b WCR:=L LCR:=
Acceptance Criteria for Roof: E/W seismic direction
K 1=

202
DCRP2_NSj
νpanel2_NSj
νaccept_P2_NSj
:=νaccept_P2_NSj
νaccept_P ν1_P2 ν2_P2, h, bj,( ):=
Double Layer
DCRP_NSj
νpanel_NSj
νaccept_P_NSj
:=νaccept_P_NSj
νaccept_P ν1_P ν2_P, h, bj,( ):=
Single Layer
h
bj
0.113
=b lpanel_CR_NS:=
Acceptance Criteria for Wall Panels: N/S seismic direction
DCRP2_EWi
νpanel2_EWi
νaccept_P2_EWi
:=
νaccept_P2_EWiνaccept_P ν1_P2 ν2_P2, h, bi,( ):=
ν2_P2 ν'accept_P2_CPK 2,:=ν1_P2 ν'accept_P2_CPK 1,
:=
Double Layer
DCRP_EWi
νpanel_EWi
νaccept_P_EWi
:=
νaccept_P_EWiνaccept_P ν1_P ν2_P, h, bi,( ):=
ν2_P ν'accept_P_CPK 2,:=ν1_P ν'accept_P_CPK 1,
:=
Single Layer
h
bi
0.900.60
=b lpanel_CR_EW:=h hn_CR:=
Acceptance Criteria for Wall Panels: E/W seismic direction

203
δ2_NSδaccept
0.116=δ2_EWδaccept
0.186=
Check δ2_NS δaccept,( ) "OK"=Check δ2_EW δaccept,( ) "OK"=
δaccept 1.012 ft=δaccept δ DL CoefCR2, hn_CR, WCR, LCR,⎛
⎝⎞⎠
:=
DL 136 kip=
DL WCR LCR⋅ DLroof2_CR⋅ lpanel_tot DLpanel2_CR⋅ lwall_tot DLwall_CR⋅+( ) hn_CR⋅+:=
Check Story Drift - Double Layer
δNSδaccept
0.203=δEW
δaccept0.327=
Check δNS δaccept,( ) "OK"=Check δEW δaccept,( ) "OK"=
δaccept 0.971 ft=δaccept δ DL CoefCR2, hn_CR, WCR, LCR,⎛
⎝⎞⎠
:=
VCR24.275 106
× lbft sec-2=
DL 116 kip=
DL WCR LCR⋅ DLroof_CR⋅ lpanel_tot DLpanel_CR⋅ lwall_tot DLwall_CR⋅+( ) hn_CR⋅+:=
Check Story Drift - Single Layer

204
Classrooms, Collapse Prevention, K = 1.0, Single Panel Layerv vaccept
(plf) (plf)Roof 1803 5169 0.35 OK
Wall Panel (ft)10 2118 1883 1.12 NG15 1923 1883 1.02 NG
East-West Earthquake Direction
DCR Status
Classrooms, Collapse Prevention, K = 1.0, Single Panel Layerv vaccept
(plf) (plf)Roof 935 5169 0.18 OK
Wall Panel (ft)80 1118 1883 0.59 OK
North-South Earthquake Direction
DCR Status
Classrooms, Collapse Prevention, K = 1.0, Double Panel Layerv vaccept
(plf) (plf)Roof 2141 10338 0.21 OK
Wall Panel (ft)10 2510 3766 0.67 OK15 2279 3766 0.61 OK
East-West Earthquake Direction
DCR Status
Classrooms, Collapse Prevention, K = 1.0, Double Panel Layerv vaccept
(plf) (plf)Roof 1113 10338 0.11 OK
Wall Panel (ft)80 1323 3766 0.35 OK
North-South Earthquake Direction
DCR Status
Data Output

205
DCRR2_NSνroof2_NS
νaccept_R2_NS:=
νaccept_R2_NS νaccept_R ν1_R2Kν2_R2K, L, b,⎛
⎝⎞⎠
:=
Double Layer
DCRR_NSνroof_NS
νaccept_R_NS:=
νaccept_R_NS νaccept_R ν1_RKν2_RK, L, b,⎛
⎝⎞⎠
:=
Single Layer
L
b1.125=
b LCR:=L WCR:=
Acceptance Criteria for Roof: N/S seismic direction
DCRR2_EWνroof2_EW
νaccept_R2_EW:=
νaccept_R2_EW νaccept_R ν1_R2Kν2_R2K, L, b,⎛
⎝⎞⎠
:=
ν2_R2Kν'accept_CR_R2_CPK 2,
:=ν1_R2Kν'accept_CR_R2_CPK 1,
:=
Double Layer
DCRR_EWνroof_EW
νaccept_R_EW:=
νaccept_R_EW νaccept_R ν1_RKν2_RK, L, b,⎛
⎝⎞⎠
:=
ν2_RKν'accept_CR_R_CPK 2,
:=ν1_RKν'accept_CR_R_CPK 1,
:=
Single Layer
L
b0.889=
"W" is the dimension in theEW direction
b WCR:=L LCR:=
Acceptance Criteria for Roof: E/W seismic direction
K 2=

206
DCRP2_NSj
νpanel2_NSj
νaccept_P2_NSj
:=νaccept_P2_NSj
νaccept_P ν1_P2 ν2_P2, h, bj,( ):=
Double Layer
DCRP_NSj
νpanel_NSj
νaccept_P_NSj
:=νaccept_P_NSj
νaccept_P ν1_P ν2_P, h, bj,( ):=
Single Layer
h
bj
0.113
=b lpanel_CR_NS:=
Acceptance Criteria for Wall Panels: N/S seismic direction
DCRP2_EWi
νpanel2_EWi
νaccept_P2_EWi
:=
νaccept_P2_EWiνaccept_P ν1_P2 ν2_P2, h, bi,( ):=
ν2_P2 ν'accept_P2_CPK 2,:=ν1_P2 ν'accept_P2_CPK 1,
:=
Double Layer
DCRP_EWi
νpanel_EWi
νaccept_P_EWi
:=
νaccept_P_EWiνaccept_P ν1_P ν2_P, h, bi,( ):=
ν2_P ν'accept_P_CPK 2,:=ν1_P ν'accept_P_CPK 1,
:=
Single Layer
h
bi
0.900.60
=b lpanel_CR_EW:=h hn_CR:=
Acceptance Criteria for Wall Panels: E/W seismic direction

207
Classrooms, Collapse Prevention, K = 0.75, Single Panel Layerv vaccept
(plf) (plf)Roof 1803 3877 0.47 OK
Wall Panel (ft)10 2118 1412 1.5 NG15 1923 1412 1.36 NG
East-West Earthquake Direction
DCR Status
Classrooms, Collapse Prevention, K = 0.75, Single Panel Layerv vaccept
(plf) (plf)Roof 935 3877 0.24 OK
Wall Panel (ft)80 1118 1412 0.79 OK
North-South Earthquake Direction
DCR Status
Classrooms, Collapse Prevention, K = 0.75, Double Panel Layerv vaccept
(plf) (plf)Roof 2141 7754 0.28 OK
Wall Panel (ft)10 2510 2825 0.89 OK15 2279 2825 0.81 OK
East-West Earthquake Direction
DCR Status
Classrooms, Collapse Prevention, K = 0.75, Double Panel Layerv vaccept
(plf) (plf)Roof 1113 7754 0.14 OK
Wall Panel (ft)80 1323 2825 0.47 OK
North-South Earthquake Direction
DCR Status
Data Output

208
νpanel2_NSl
1657plf1475plf1429plf1685plf1637plf1261plf984plf
:=νpanel2_EWk
1733plf1928plf1800plf1349plf1617plf1047plf
:= δ2_NS 2.55in:=
νroof2_NS 925plf:=νroof2_EW 973plf:=δ2_EW 2.46in:=
Double Panel Layer
νpanel_NSl
1449plf1284plf1247plf1466plf1424plf1097plf856plf
:=lpanel_GYM_NSl
910
13
18
21
37
55
ft
=
νpanel_EWk
1511plf1681plf1569plf1174plf1407plf
910plf
:= δNS 4.42in:=lpanel_GYM_EWk
1416
23
24
26
45
ft
=
δEW 4.28in:=νroof_NS 802plf:=νroof_EW 844plf:=
Single Panel Layer
Immediate Occupancy
Minimum panel lengthMin 6.095 ft=Minhn_GYM
3.5:=
LGYM 96 ft=WGYM 116 ft=hn_GYM 21.333 ft=
Design Results - Gymnasium

209
DCRR2_NSνroof2_NS
νaccept_R2_NS:=
νaccept_R2_NS νaccept_R ν1_R2Kν2_R2K, L, b,⎛
⎝⎞⎠
:=
Double Layer
DCRR_NSνroof_NS
νaccept_R_NS:=
νaccept_R_NS νaccept_R ν1_RKν2_RK, L, b,⎛
⎝⎞⎠
:=
Single Layer
L
b1.208=
b LGYM:=L WGYM:=
Acceptance Criteria for Roof: N/S seismic direction
DCRR2_EWνroof2_EW
νaccept_R2_EW:=
νaccept_R2_EW νaccept_R ν1_R2Kν2_R2K, L, b,⎛
⎝⎞⎠
:=
ν2_R2Kν'accept_GYM_R2_IOK 2,
:=ν1_R2Kν'accept_GYM_R2_IOK 1,
:=
Double Layer
DCRR_EWνroof_EW
νaccept_R_EW:=
νaccept_R_EW νaccept_R ν1_RKν2_RK, L, b,⎛
⎝⎞⎠
:=
ν2_RKν'accept_GYM_R_IOK 2,
:=ν1_RKν'accept_GYM_R_IOK 1,
:=
Single Layer
L
b0.828=
"W" is the dimension in theEW direction
b WGYM:=L LGYM:=
Acceptance Criteria for Roof: E/W seismic direction
K 1=

210
DCRP2_NSl
νpanel2_NSl
νaccept_P2_NSl
:=
νaccept_P2_NSlνaccept_P ν1_P2 ν2_P2, h, bl,( ):=
Double Layer
DCRP_NSl
νpanel_NSl
νaccept_P_NSl
:=
νaccept_P_NSlνaccept_P ν1_P ν2_P, h, bl,( ):=
Single Layer
h
bl
2.372.133
1.641
1.185
1.016
0.577
0.388
=b lpanel_GYM_NS:=
Acceptance Criteria for Wall Panels: N/S seismic direction
DCRP2_EWk
νpanel2_EWk
νaccept_P2_EWk
:=
νaccept_P2_EWkνaccept_P ν1_P2 ν2_P2, h, bk,( ):=
ν2_P2 ν'accept_P2_IOK 2,:=ν1_P2 ν'accept_P2_IOK 1,
:=
Double Layer
DCRP_EWk
νpanel_EWk
νaccept_P_EWk
:=
νaccept_P_EWkνaccept_P ν1_P ν2_P, h, bk,( ):=
ν2_P ν'accept_P_IOK 2,:=ν1_P ν'accept_P_IOK 1,
:=
Single Layer
h
bk
1.5241.333
0.928
0.889
0.821
0.474
=b lpanel_GYM_EW:=h hn_GYM:=
Acceptance Criteria for Wall Panels: E/W seismic direction
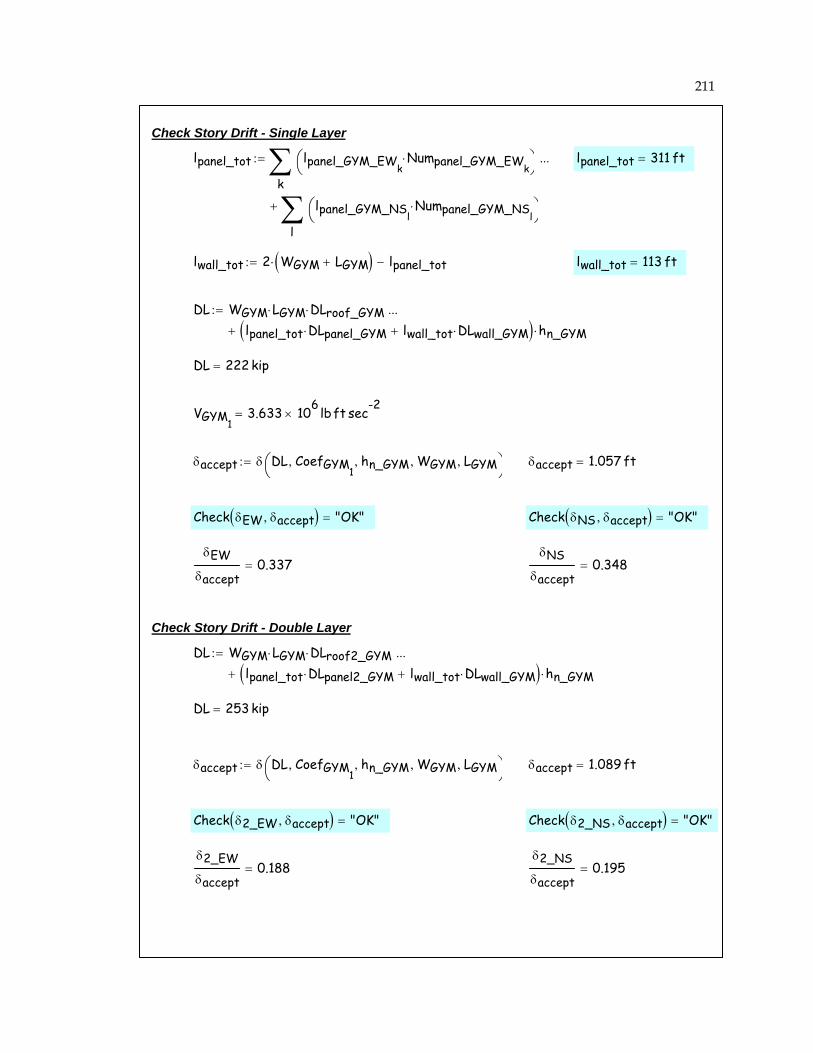
211
δ2_NSδaccept
0.195=δ2_EWδaccept
0.188=
Check δ2_NS δaccept,( ) "OK"=Check δ2_EW δaccept,( ) "OK"=
δaccept 1.089 ft=δaccept δ DL CoefGYM1, hn_GYM, WGYM, LGYM,⎛
⎝⎞⎠
:=
DL 253 kip=
DL WGYM LGYM⋅ DLroof2_GYM⋅
lpanel_tot DLpanel2_GYM⋅ lwall_tot DLwall_GYM⋅+( ) hn_GYM⋅+
...:=
Check Story Drift - Double Layer
δNSδaccept
0.348=δEW
δaccept0.337=
Check δNS δaccept,( ) "OK"=Check δEW δaccept,( ) "OK"=
δaccept 1.057 ft=δaccept δ DL CoefGYM1, hn_GYM, WGYM, LGYM,⎛
⎝⎞⎠
:=
VGYM13.633 106
× lbft sec-2=
DL 222 kip=
DL WGYM LGYM⋅ DLroof_GYM⋅
lpanel_tot DLpanel_GYM⋅ lwall_tot DLwall_GYM⋅+( ) hn_GYM⋅+
...:=
lwall_tot 113 ft=lwall_tot 2 WGYM LGYM+( )⋅ lpanel_tot−:=
lpanel_tot 311 ft=lpanel_tot
k
lpanel_GYM_EWkNumpanel_GYM_EWk⋅⎛
⎝⎞⎠∑
l
lpanel_GYM_NSlNumpanel_GYM_NSl⋅⎛
⎝⎞⎠∑+...:=
Check Story Drift - Single Layer

212
Gymnasium, Immediate Occupancy, K = 1.0, Single Panel Layerv vaccept
(plf) (plf)Roof 844 969 0.87 OK
Wall Panel (ft)14 1511 646 2.34 NG16 1681 670 2.51 NG23 1569 711 2.21 NG24 1174 711 1.65 NG26 1407 711 1.98 NG45 910 711 1.28 NG
East-West Earthquake Direction
DCR Status
Gymnasium, Immediate Occupancy, K = 1.0, Single Panel Layerv vaccept
(plf) (plf)Roof 802 969 0.83 OK
Wall Panel (ft)9 1449 586 2.47 NG10 1284 586 2.19 NG13 1247 631 1.98 NG18 1466 688 2.13 NG21 1424 709 2.01 NG37 1097 711 1.54 NG55 856 711 1.2 NG
North-South Earthquake Direction
DCR Status

213
Gymnasium, Immediate Occupancy, K = 1.0, Double Panel Layerv vaccept
(plf) (plf)Roof 973 1938 0.5 OK
Wall Panel (ft)14 1733 1291 1.34 NG16 1928 1339 1.44 NG23 1800 1423 1.27 NG24 1349 1423 0.95 OK26 1617 1423 1.14 NG45 1047 1423 0.74 OK
East-West Earthquake Direction
DCR Status
Gymnasium, Immediate Occupancy, K = 1.0, Double Panel Layerv vaccept
(plf) (plf)Roof 925 1938 0.48 OK
Wall Panel (ft)9 1657 1172 1.41 NG10 1475 1172 1.26 NG13 1429 1262 1.13 NG18 1685 1376 1.22 NG21 1637 1419 1.15 NG37 1261 1423 0.89 OK55 984 1423 0.69 OK
North-South Earthquake Direction
DCR Status
Data Output

214
DCRR2_NSνroof2_NS
νaccept_R2_NS:=
νaccept_R2_NS νaccept_R ν1_R2Kν2_R2K, L, b,⎛
⎝⎞⎠
:=
Double Layer
DCRR_NSνroof_NS
νaccept_R_NS:=
νaccept_R_NS νaccept_R ν1_RKν2_RK, L, b,⎛
⎝⎞⎠
:=
Single Layer
L
b1.208=
b LGYM:=L WGYM:=
Acceptance Criteria for Roof: N/S seismic direction
DCRR2_EWνroof2_EW
νaccept_R2_EW:=
νaccept_R2_EW νaccept_R ν1_R2Kν2_R2K, L, b,⎛
⎝⎞⎠
:=
ν2_R2Kν'accept_GYM_R2_IOK 2,
:=ν1_R2Kν'accept_GYM_R2_IOK 1,
:=
Double Layer
DCRR_EWνroof_EW
νaccept_R_EW:=
νaccept_R_EW νaccept_R ν1_RKν2_RK, L, b,⎛
⎝⎞⎠
:=
ν2_RKν'accept_GYM_R_IOK 2,
:=ν1_RKν'accept_GYM_R_IOK 1,
:=
Single Layer
L
b0.828=
"W" is the dimension in theEW direction
b WGYM:=L LGYM:=
Acceptance Criteria for Roof: E/W seismic direction
K 2=

215
DCRP2_NSl
νpanel2_NSl
νaccept_P2_NSl
:=
νaccept_P2_NSlνaccept_P ν1_P2 ν2_P2, h, bl,( ):=
Double Layer
DCRP_NSl
νpanel_NSl
νaccept_P_NSl
:=
νaccept_P_NSlνaccept_P ν1_P ν2_P, h, bl,( ):=
Single Layer
h
bl
2.372.133
1.641
1.185
1.016
0.577
0.388
=b lpanel_GYM_NS:=
Acceptance Criteria for Wall Panels: N/S seismic direction
DCRP2_EWk
νpanel2_EWk
νaccept_P2_EWk
:=
νaccept_P2_EWkνaccept_P ν1_P2 ν2_P2, h, bk,( ):=
ν2_P2 ν'accept_P2_IOK 2,:=ν1_P2 ν'accept_P2_IOK 1,
:=
Double Layer
DCRP_EWk
νpanel_EWk
νaccept_P_EWk
:=
νaccept_P_EWkνaccept_P ν1_P ν2_P, h, bk,( ):=
ν2_P ν'accept_P_IOK 2,:=ν1_P ν'accept_P_IOK 1,
:=
Single Layer
h
bk
1.5241.333
0.928
0.889
0.821
0.474
=b lpanel_GYM_EW:=h hn_GYM:=
Acceptance Criteria for Wall Panels: E/W seismic direction

216
Gymnasium, Immediate Occupancy, K = 0.75, Single Panel Layerv vaccept
(plf) (plf)Roof 844 727 1.16 NG
Wall Panel (ft)14 1511 484 3.12 NG16 1681 502 3.35 NG23 1569 534 2.94 NG24 1174 534 2.2 NG26 1407 534 2.64 NG45 910 534 1.71 NG
East-West Earthquake Direction
DCR Status
Gymnasium, Immediate Occupancy, K = 0.75, Single Panel Layerv vaccept
(plf) (plf)Roof 802 727 1.1 NG
Wall Panel (ft)9 1449 439 3.3 NG10 1284 439 2.92 NG13 1247 473 2.64 NG18 1466 516 2.84 NG21 1424 532 2.68 NG37 1097 534 2.06 NG55 856 534 1.6 NG
North-South Earthquake Direction
DCR Status

217
Gymnasium, Immediate Occupancy, K = 0.75, Double Panel Layerv vaccept
(plf) (plf)Roof 973 1454 0.67 OK
Wall Panel (ft)14 1733 968 1.79 NG16 1928 1004 1.92 NG23 1800 1067 1.69 NG24 1349 1067 1.26 NG26 1617 1067 1.52 NG45 1047 1067 0.98 OK
East-West Earthquake Direction
DCR Status
Gymnasium, Immediate Occupancy, K = 0.75, Double Panel Layerv vaccept
(plf) (plf)Roof 925 1454 0.64 OK
Wall Panel (ft)9 1657 879 1.89 NG10 1475 879 1.68 NG13 1429 946 1.51 NG18 1685 1032 1.63 NG21 1637 1064 1.54 NG37 1261 1067 1.18 NG55 984 1067 0.92 OK
North-South Earthquake Direction
DCR Status
Data Output

218
νpanel2_NSl
3016plf2683plf2600plf3063plf2976plf2292plf1790plf
:=νpanel2_EWk
3152plf3506plf3273plf2454plf2940plf1903plf
:= δ2_NS 4.63in:=
δ2_EW 4.48in:=νroof2_NS 1682plf:=νroof2_EW 1769plf:=
Double Panel Layer
νpanel_NSl
2637plf2336plf2269plf2667plf2589plf1994plf1557plf
:=lpanel_GYM_NSl
910
13
18
21
37
55
ft
=
νpanel_EWk
2749plf3056plf2853plf2135plf2559plf1655plf
:=lpanel_GYM_EWk
1416
23
24
26
45
ft
=δNS 8.03in:=
δEW 7.79in:=νroof_NS 1458plf:=νroof_EW 1535plf:=
Single Panel Layer
Collapse Prevention

219
DCRR2_NSνroof2_NS
νaccept_R2_NS:=
νaccept_R2_NS νaccept_R ν1_R2Kν2_R2K, L, b,⎛
⎝⎞⎠
:=
Double Layer
DCRR_NSνroof_NS
νaccept_R_NS:=
νaccept_R_NS νaccept_R ν1_RKν2_RK, L, b,⎛
⎝⎞⎠
:=
Single Layer
L
b1.208=
b LGYM:=L WGYM:=
Acceptance Criteria for Roof: N/S seismic direction
DCRR2_EWνroof2_EW
νaccept_R2_EW:=
νaccept_R2_EW νaccept_R ν1_R2Kν2_R2K, L, b,⎛
⎝⎞⎠
:=
ν1_R2Kν'accept_GYM_R2_CPK 1,
:=ν2_R2K
ν'accept_GYM_R2_CPK 2,:=
Double Layer
DCRR_EWνroof_EW
νaccept_R_EW:=
νaccept_R_EW νaccept_R ν1_RKν2_RK, L, b,⎛
⎝⎞⎠
:=
ν1_RKν'accept_GYM_R_CPK 1,
:=ν2_RK
ν'accept_GYM_R_CPK 2,:=
Single Layer
L
b0.828=
"W" is the dimension in theEW direction
b WGYM:=L LGYM:=
Acceptance Criteria for Roof: E/W seismic direction
K 1=

220
DCRP2_NSl
νpanel2_NSl
νaccept_P2_NSl
:=
νaccept_P2_NSlνaccept_P ν1_P2 ν2_P2, h, bl,( ):=
Double Layer
DCRP_NSl
νpanel_NSl
νaccept_P_NSl
:=
νaccept_P_NSlνaccept_P ν1_P ν2_P, h, bl,( ):=
Single Layer
h
bl
2.372.133
1.641
1.185
1.016
0.577
0.388
=b lpanel_GYM_NS:=
Acceptance Criteria for Wall Panels: N/S seismic direction
DCRP2_EWk
νpanel2_EWk
νaccept_P2_EWk
:=
νaccept_P2_EWkνaccept_P ν1_P2 ν2_P2, h, bk,( ):=
ν2_P2 ν'accept_P2_CPK 2,:=ν1_P2 ν'accept_P2_CPK 1,
:=
Double Layer
DCRP_EWk
νpanel_EWk
νaccept_P_EWk
:=
νaccept_P_EWkνaccept_P ν1_P ν2_P, h, bk,( ):=
ν2_P ν'accept_P_CPK 2,:=ν1_P ν'accept_P_CPK 1,
:=
Single Layer
h
bk
1.5241.333
0.928
0.889
0.821
0.474
=b lpanel_GYM_EW:=h hn_GYM:=
Acceptance Criteria for Wall Panels: E/W seismic direction

221
δ2_NSδaccept
0.195=δ2_EWδaccept
0.189=
Check δ2_NS δaccept,( ) "OK"=Check δ2_EW δaccept,( ) "OK"=
δaccept 1.98 ft=δaccept δ DL CoefGYM2, hn_GYM, WGYM, LGYM,⎛
⎝⎞⎠
:=
DL 253 kip=
DL WGYM LGYM⋅ DLroof2_GYM⋅
lpanel_tot DLpanel2_GYM⋅ lwall_tot DLwall_GYM⋅+( ) hn_GYM⋅+
...:=
Check Story Drift - Double Layer
δNSδaccept
0.348=δEW
δaccept0.338=
Check δNS δaccept,( ) "OK"=Check δEW δaccept,( ) "OK"=
δaccept 1.923 ft=δaccept δ DL CoefGYM2, hn_GYM, WGYM, LGYM,⎛
⎝⎞⎠
:=
VGYM26.606 106
× lbft sec-2=
DL 222 kip=
DL WGYM LGYM⋅ DLroof_GYM⋅
lpanel_tot DLpanel_GYM⋅ lwall_tot DLwall_GYM⋅+( ) hn_GYM⋅+
...:=
Check Story Drift - Single Layer

222
Gymnasium, Collapse Prevention, K = 1.0, Single Panel Layerv vaccept
(plf) (plf)Roof 1535 2585 0.59 OK
Wall Panel (ft)14 2749 1554 1.77 NG16 3056 1674 1.83 NG23 2853 1883 1.52 NG24 2135 1883 1.13 NG26 2559 1883 1.36 NG45 1655 1883 0.88 OK
East-West Earthquake Direction
DCR Status
Gymnasium, Collapse Prevention, K = 1.0, Single Panel Layerv vaccept
(plf) (plf)Roof 1458 2585 0.56 OK
Wall Panel (ft)9 2637 1255 2.1 NG10 2336 1255 1.86 NG13 2269 1481 1.53 NG18 2667 1767 1.51 NG21 2589 1873 1.38 NG37 1994 1883 1.06 NG55 1557 1883 0.83 OK
North-South Earthquake Direction
DCR Status

223
Gymnasium, Collapse Prevention, K = 1.0, Double Panel Layerv vaccept
(plf) (plf)Roof 1769 5169 0.34 OK
Wall Panel (ft)14 3152 3109 1.01 NG16 3506 3348 1.05 NG23 3273 3766 0.87 OK24 2454 3766 0.65 OK26 2940 3766 0.78 OK45 1903 3766 0.51 OK
East-West Earthquake Direction
DCR Status
Gymnasium, Collapse Prevention, K = 1.0, Double Panel Layerv vaccept
(plf) (plf)Roof 1682 5169 0.33 OK
Wall Panel (ft)9 3016 2511 1.2 NG10 2683 2511 1.07 NG13 2600 2961 0.88 OK18 3063 3534 0.87 OK21 2976 3746 0.79 OK37 2292 3766 0.61 OK55 1790 3766 0.48 OK
North-South Earthquake Direction
DCR Status
Data Output

224
DCRR2_NSνroof2_NS
νaccept_R2_NS:=
νaccept_R2_NS νaccept_R ν1_R2Kν2_R2K, L, b,⎛
⎝⎞⎠
:=
Double Layer
DCRR_NSνroof_NS
νaccept_R_NS:=
νaccept_R_NS νaccept_R ν1_RKν2_RK, L, b,⎛
⎝⎞⎠
:=
Single Layer
L
b1.208=
b LGYM:=L WGYM:=
Acceptance Criteria for Roof: N/S seismic direction
DCRR2_EWνroof2_EW
νaccept_R2_EW:=
νaccept_R2_EW νaccept_R ν1_R2Kν2_R2K, L, b,⎛
⎝⎞⎠
:=
ν2_R2Kν'accept_GYM_R2_CPK 2,
:=ν1_R2Kν'accept_GYM_R2_CPK 1,
:=
Double Layer
DCRR_EWνroof_EW
νaccept_R_EW:=
νaccept_R_EW νaccept_R ν1_RKν2_RK, L, b,⎛
⎝⎞⎠
:=
ν2_RKν'accept_GYM_R_CPK 2,
:=ν1_RKν'accept_GYM_R_CPK 1,
:=
Single Layer
L
b0.828=
"W" is the dimension in theEW direction
b WGYM:=L LGYM:=
Acceptance Criteria for Roof: E/W seismic direction
K 2=

225
DCRP2_NSl
νpanel2_NSl
νaccept_P2_NSl
:=
νaccept_P2_NSlνaccept_P ν1_P2 ν2_P2, h, bl,( ):=
Double Layer
DCRP_NSl
νpanel_NSl
νaccept_P_NSl
:=
νaccept_P_NSlνaccept_P ν1_P ν2_P, h, bl,( ):=
Single Layer
h
bl
2.372.133
1.641
1.185
1.016
0.577
0.388
=b lpanel_GYM_NS:=
Acceptance Criteria for Wall Panels: E/W seismic direction
DCRP2_EWk
νpanel2_EWk
νaccept_P2_EWk
:=
νaccept_P2_EWkνaccept_P ν1_P2 ν2_P2, h, bk,( ):=
ν2_P2 ν'accept_P2_CPK 2,:=ν1_P2 ν'accept_P2_CPK 1,
:=
Double Layer
DCRP_EWk
νpanel_EWk
νaccept_P_EWk
:=
νaccept_P_EWkνaccept_P ν1_P ν2_P, h, bk,( ):=
ν2_P ν'accept_P_CPK 2,:=ν1_P ν'accept_P_CPK 1,
:=
Single Layer
h
bk
1.5241.333
0.928
0.889
0.821
0.474
=b lpanel_GYM_EW:=h hn_GYM:=
Acceptance Criteria for Wall Panels: E/W seismic direction

226
Gymnasium, Collapse Prevention, K = 0.75, Single Panel Layerv vaccept
(plf) (plf)Roof 1535 1938 0.79 OK
Wall Panel (ft)14 2749 1166 2.36 NG16 3056 1255 2.43 NG23 2853 1412 2.02 NG24 2135 1412 1.51 NG26 2559 1412 1.81 NG45 1655 1412 1.17 NG
East-West Earthquake Direction
DCR Status
Gymnasium, Collapse Prevention, K = 0.75, Single Panel Layerv vaccept
(plf) (plf)Roof 1458 1938 0.75 OK
Wall Panel (ft)9 2637 942 2.8 NG10 2336 942 2.48 NG13 2269 1111 2.04 NG18 2667 1325 2.01 NG21 2589 1405 1.84 NG37 1994 1412 1.41 NG55 1557 1412 1.1 NG
North-South Earthquake Direction
DCR Status

227
Gymnasium, Collapse Prevention, K = 0.75, Double Panel Layerv vaccept
(plf) (plf)Roof 1769 3877 0.46 OK
Wall Panel (ft)14 3152 2331 1.35 NG16 3506 2511 1.4 NG23 3273 2825 1.16 NG24 2454 2825 0.87 OK26 2940 2825 1.04 NG45 1903 2825 0.67 OK
East-West Earthquake Direction
DCR Status
Gymnasium, Collapse Prevention, K = 0.75, Double Panel Layerv vaccept
(plf) (plf)Roof 1682 3877 0.43 OK
Wall Panel (ft)9 3016 1883 1.6 NG10 2683 1883 1.42 NG13 2600 2221 1.17 NG18 3063 2650 1.16 NG21 2976 2810 1.06 NG37 2292 2825 0.81 OK55 1790 2825 0.63 OK
North-South Earthquake Direction
DCR Status
Data Output

228
EW Dir NS Dirv (plf) 983 509
vaccept (plf) 3877 3877DCR 0.25 0.13
v (plf) 1803 935vaccept (plf) 5169 5169
DCR 0.35 0.18v (plf) 983 509
vaccept (plf) 2908 2908DCR 0.34 0.18
v (plf) 1803 935vaccept (plf) 3877 3877
DCR 0.47 0.24
Single Panel
K=1.0
K=0.75
Classroom Roof Results Summary
LS
CP
LS
CP
EW Dir NS Dirv (plf) 844 802
vaccept (plf) 969 969DCR 0.87 0.83
v (plf) 1535 1458vaccept (plf) 2585 2585
DCR 0.59 0.56v (plf) 844 802
vaccept (plf) 727 727DCR 1.16 1.1
v (plf) 1535 1458vaccept (plf) 1938 1938
DCR 0.79 0.75
Single Panel
K=1.0
K=0.75
Gymnasium Roof Results Summary
IO
CP
IO
CP
10 15 80v (plf) 1154 1048 609
vaccept (plf) 1590 1590 1590DCR 0.73 0.66 0.38
v (plf) 2118 1923 1118vaccept (plf) 1883 1883 1883
DCR 1.12 1.02 0.59v (plf) 1154 1048 609
vaccept (plf) 1193 1193 1193DCR 0.97 0.88 0.51
v (plf) 2118 1923 1118vaccept (plf) 1412 1412 1412
DCR 1.5 1.36 0.79
Classroom Wall Results SummarySingle Panel
K=1.0
Panel Length (ft)
K=0.75
LS
CP
LS
CP

229
14 16 23 24 26 45v (plf) 1511 1681 1569 1174 1407 910
vaccept (plf) 646 670 711 711 711 711DCR 2.34 2.51 2.21 1.65 1.98 1.28
v (plf) 2749 3056 2853 2135 2559 1655vaccept (plf) 1554 1674 1883 1883 1883 1883
DCR 1.77 1.83 1.52 1.13 1.36 0.88v (plf) 1511 1681 1569 1174 1407 910
vaccept (plf) 484 502 534 534 534 534DCR 3.12 3.35 2.94 2.2 2.64 1.71
v (plf) 2749 3056 2853 2135 2559 1655vaccept (plf) 1166 1255 1412 1412 1412 1412
DCR 2.36 2.43 2.02 1.51 1.81 1.17
Gymnasium Wall Results SummarySingle Panel, EQ in EW direction
Panel Length (ft)
K=1.0
K=0.75
LS
CP
LS
CP
9 10 13 18 21 37 55v (plf) 1449 1284 1247 1466 1424 1097 856
vaccept (plf) 586 586 631 688 709 711 711DCR 2.47 2.19 1.98 2.13 2.01 1.54 1.2
v (plf) 2637 2336 2269 2667 2589 1994 1557vaccept (plf) 1255 1255 1481 1767 1873 1883 1883
DCR 2.1 1.86 1.53 1.51 1.38 1.06 0.83v (plf) 1449 1284 1247 1466 1424 1097 856
vaccept (plf) 439 439 473 516 532 534 534DCR 3.3 2.92 2.64 2.84 2.68 2.06 1.6
v (plf) 2637 2336 2269 2667 2589 1994 1557vaccept (plf) 942 942 1111 1325 1405 1412 1412
DCR 2.8 2.48 2.04 2.01 1.84 1.41 1.1
Gymnasium Wall Results Summary
K=0.75
IO
CP
IO
CP
Single Panel, EQ in NS directionPanel Length (ft)
K=1.0

230
EW Dir NS Dirv (plf) 1167 609
vaccept (plf) 7754 7754DCR 0.15 0.08
v (plf) 2141 1113vaccept (plf) 10338 10338
DCR 0.21 0.11v (plf) 1167 609
vaccept (plf) 5815 5815DCR 0.2 0.1
v (plf) 2141 1113vaccept (plf) 7754 7754
DCR 0.28 0.14
Double Panel
K=1.0
K=0.75
Classroom Roof Results Summary
LS
CP
LS
CP
EW Dir NS Dirv (plf) 973 925
vaccept (plf) 1938 1938DCR 0.5 0.48
v (plf) 1769 1682vaccept (plf) 5169 5169
DCR 0.34 0.33v (plf) 973 925
vaccept (plf) 1454 1454DCR 0.67 0.64
v (plf) 1769 1682vaccept (plf) 3877 3877
DCR 0.46 0.43
Double Panel
K=1.0
K=0.75
Gymnasium Roof Results Summary
IO
CP
IO
CP
10 15 80v (plf) 1368 1242 721
vaccept (plf) 3180 3180 3180DCR 0.43 0.39 0.23
v (plf) 2510 2279 1323vaccept (plf) 3766 3766 3766
DCR 0.67 0.61 0.35v (plf) 1368 1242 721
vaccept (plf) 2385 2385 2385DCR 0.57 0.52 0.3
v (plf) 2510 2279 1323vaccept (plf) 2825 2825 2825
DCR 0.89 0.81 0.47
Classroom Wall Results SummaryDouble Panel
K=1.0
Panel Length (ft)
K=0.75
LS
CP
LS
CP

231
14 16 23 24 26 45v (plf) 1733 1928 1800 1349 1617 1047
vaccept (plf) 1291 1339 1423 1423 1423 1423DCR 1.34 1.44 1.27 0.95 1.14 0.74
v (plf) 3152 3506 3273 2454 2940 1903vaccept (plf) 3109 3348 3766 3766 3766 3766
DCR 1.01 1.05 0.87 0.65 0.78 0.51v (plf) 1733 1928 1800 1349 1617 1047
vaccept (plf) 968 1004 1067 1067 1067 1067DCR 1.79 1.92 1.69 1.26 1.52 0.98
v (plf) 3152 3506 3273 2454 2940 1903vaccept (plf) 2331 2511 2825 2825 2825 2825
DCR 1.35 1.4 1.16 0.87 1.04 0.67
K=1.0
K=0.75
IO
CP
IO
CP
Gymnasium Wall Results SummaryDouble Panel, EQ in EW direction
Panel Length (ft)
9 10 13 18 21 37 55v (plf) 1657 1475 1429 1685 1637 1261 984
vaccept (plf) 1172 1172 1262 1376 1419 1423 1423DCR 1.41 1.26 1.13 1.22 1.15 0.89 0.69
v (plf) 3016 2683 2600 3063 2976 2292 1790vaccept (plf) 2511 2511 2961 3534 3746 3766 3766
DCR 1.2 1.07 0.88 0.87 0.79 0.61 0.48v (plf) 1657 1475 1429 1685 1637 1261 984
vaccept (plf) 879 879 946 1032 1064 1067 1067DCR 1.89 1.68 1.51 1.63 1.54 1.18 0.92
v (plf) 3016 2683 2600 3063 2976 2292 1790vaccept (plf) 1883 1883 2221 2650 2810 2825 2825
DCR 1.6 1.42 1.17 1.16 1.06 0.81 0.63
Gymnasium Wall Results Summary
K=0.75
IO
CP
IO
CP
Double Panel, EQ in NS directionPanel Length (ft)
K=1.0
Data Output

232
∆R_EW mean ∆CR_EW( )−
mean ∆CR_EW( )0.336=
ClassCR_EW "Rigid"=
ClassCR_EW "Rigid"∆R_EW mean ∆CR_EW( )−
mean ∆CR_EW( )⎛⎜⎝
⎞
⎠0.5<if
"Flexible"∆R_EW mean ∆CR_EW( )−
mean ∆CR_EW( )⎛⎜⎝
⎞
⎠2.0>if
"Stiff" otherwise
:=
Average story driftmean ∆CR_EW( ) 2.849 in=
Extract only the DX story displacements
∆CR_EW submatrix DriftCR_EW 2, length DriftCR_EW1⟨ ⟩⎛
⎝⎞⎠ 1−, 2, 2,⎛
⎝⎞⎠ in:=
length DriftCR_EW1⟨ ⟩⎛
⎝⎞⎠ 184=
DriftCR_EW...\FEMA CR EW Story Drift.xls
:=Import all selected story drift values
Maximum DX diaphragm displacement∆R_EW 3.807in:=
Classrooms, E/W Direction
The diaphragm deflection is defined as the maximum lateral deformation of the diaphragm,or the lateral deflection in excess of the supporting shear wall deflection. The maximumlateral diaphram deflection is taken from the MIDAS models. An average story drift is takenas the average of the all node deflections at the top of the shear walls resisting lateral load.These values are used to classify the diaphragms as either flexible, stiff, or rigid. All modelresults are taken from the Collapse Prevention level forces, single thickness panels.
Diaphragm Deflections

233
Classrooms, N/S DirectionSimilar to the E/W direction, except use DY displacements.
∆R_NS 2.369in:=
DriftCR_NS...\FEMA CR NS Story Drift.xls
:=
length DriftCR_NS1⟨ ⟩⎛
⎝⎞⎠ 164=
∆CR_NS submatrix DriftCR_NS 2, length DriftCR_NS1⟨ ⟩⎛
⎝⎞⎠ 1−, 3, 3,⎛
⎝⎞⎠ in:=
mean ∆CR_NS( ) 1.082 in=
ClassCR_NS "Rigid"∆R_NS mean ∆CR_NS( )−
mean ∆CR_NS( )⎛⎜⎝
⎞
⎠0.5<if
"Flexible"∆R_NS mean ∆CR_NS( )−
mean ∆CR_NS( )⎛⎜⎝
⎞
⎠2.0>if
"Stiff" otherwise
:=
ClassCR_NS "Stiff"=
∆R_NS mean ∆CR_NS( )−
mean ∆CR_NS( )1.189=
Structure diaphragm classification is "Rigid" if either direction is "Rigid." If neither directionis "Rigid" then the structure diaphragm classification is "Stiff" if either direction is "Stiff."Otherwise the structure diaphragm classification is "Flexible."

234
Gymnasium N/S Direction∆R_NS 7.785in:=
DriftGYM_NS\FEMA GYM NS Story Drift.x
:=
length DriftGYM_NS1⟨ ⟩⎛
⎝⎞⎠ 196=
∆GYM_NS submatrix DriftGYM_NS 2, length DriftGYM_NS1⟨ ⟩⎛
⎝⎞⎠ 1−, 3, 3,⎛
⎝⎞⎠ in:=
mean ∆GYM_NS( ) 4.858 in=
ClassGYM_NS "Rigid"∆R_NS mean ∆GYM_NS( )−
mean ∆GYM_NS( )⎛⎜⎝
⎞
⎠0.5<if
"Flexible"∆R_NS mean ∆GYM_NS( )−
mean ∆GYM_NS( )⎛⎜⎝
⎞
⎠2.0>if
"Stiff" otherwise
:=
ClassGYM_NS "Stiff"=
∆R_NS mean ∆GYM_NS( )−
mean ∆GYM_NS( )0.603=

235
Gymnasium N/S Direction∆R_NS 8.029in:=
DriftGYM_NS\FEMA GYM NS Story Drift.x
:=
length DriftGYM_NS1⟨ ⟩⎛
⎝⎞⎠ 196=
∆GYM_NS submatrix DriftGYM_NS 2, length DriftGYM_NS1⟨ ⟩⎛
⎝⎞⎠ 1−, 3, 3,⎛
⎝⎞⎠ in:=
mean ∆GYM_NS( ) 4.858 in=
ClassGYM_NS "Rigid"∆R_NS mean ∆GYM_NS( )−
mean ∆GYM_NS( )⎛⎜⎝
⎞
⎠0.5<if
"Flexible"∆R_NS mean ∆GYM_NS( )−
mean ∆GYM_NS( )⎛⎜⎝
⎞
⎠2.0>if
"Stiff" otherwise
:=
ClassGYM_NS "Stiff"=
∆R_NS mean ∆GYM_NS( )−
mean ∆GYM_NS( )0.653=

236
APPENDIX D: ASCE 31 CALCULATIONS

237
LOP_CR_E 0 ft=LOP_CR_W 0 ft=
Length of wall openingsLOP_CR_S 45 ft=LOP_CR_N 45 ft=
Numpanel_CR_NSj
2
=lpanel_CR_NSj
80 ft
=
Length of shear panelsNumpanel_CR_EWi
62
=lpanel_CR_EWi
1015
ft
=
Building dimension in N/S directionLCR 80 ft=
Building dimension in E/W directionWCR 90 ft=
Classrooms
Structure Geometry
Preston BaxterReference:C:\Thesis\The Report\Global Inputs.mcd(R)
Hoover School Analysis - ASCE 31
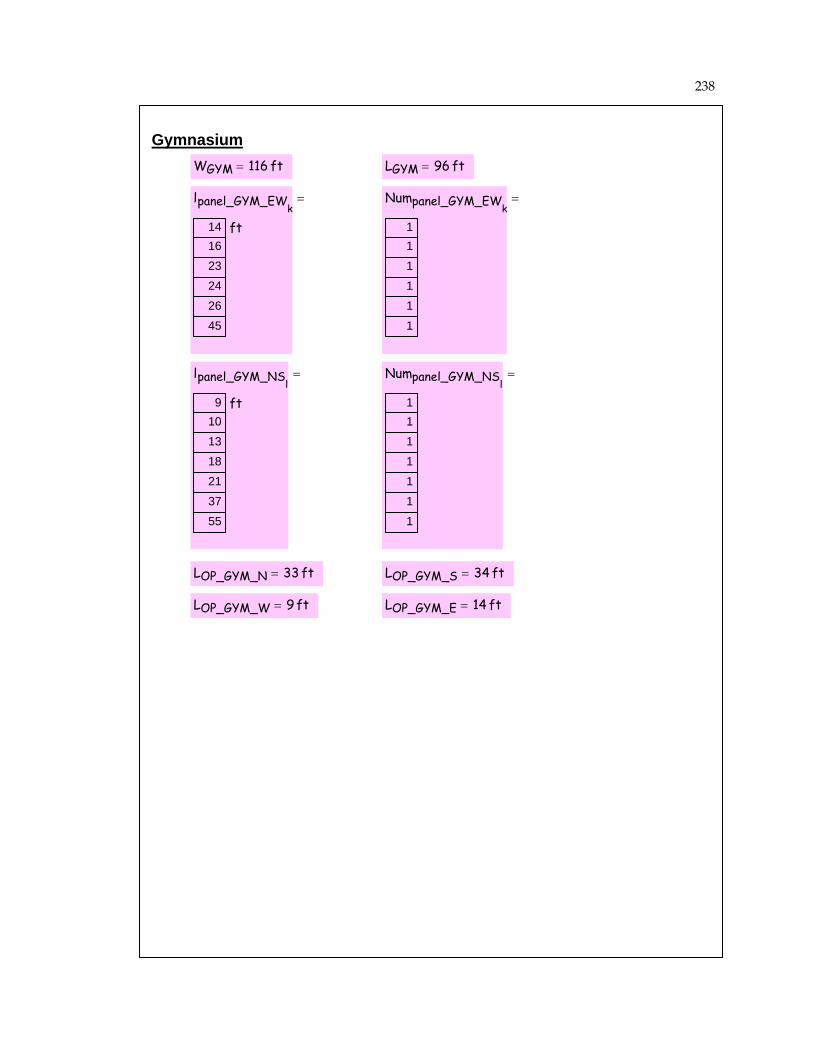
238
GymnasiumWGYM 116 ft= LGYM 96 ft=
lpanel_GYM_EWk
1416
23
24
26
45
ft
= Numpanel_GYM_EWk
11
1
1
1
1
=
lpanel_GYM_NSl
910
13
18
21
37
55
ft
= Numpanel_GYM_NSl
11
1
1
1
1
1
=
LOP_GYM_N 33 ft= LOP_GYM_S 34 ft=
LOP_GYM_W 9 ft= LOP_GYM_E 14 ft=

239
SD1 0.479 g= Eq. 3-5
SDS2
3Fa⋅ Ss⋅:= SDS 0.769 g= Eq. 3-6
Period Determination Sec. 3.5.2.4
Ct 0.060:= Type W1 building
β 0.75:= Not steel or concrete MRF
T hn( ) Cthn
ft
⎛⎜⎝
⎞
⎠
β
⋅ sec⋅:= Fundamental building period Eq. 3-8
T hn_CR( ) 0.312 sec= T hn_GYM( ) 0.596 sec=
Level of SeismicityMCE Spectral Accelerations (2%/50 years)
Ss Ss_2:= Ss 1.08 g=
S1 S1_2:= S1 0.47 g=
Site ClassWithout specific geologic survey data, use Site Class D Sec. 3.5.2.3.1
Fv linterp0.4 g⋅
0.5 g⋅
⎛⎜⎝
⎞
⎠
1.6
1.5
⎛⎜⎝
⎞
⎠, S1,
⎡⎢⎣
⎤⎥⎦
:= Fv 1.530= Table 3-5
Fa linterp1.00 g⋅
1.25 g⋅
⎛⎜⎝
⎞
⎠
1.1
1.0
⎛⎜⎝
⎞
⎠, Ss,
⎡⎢⎣
⎤⎥⎦
:= Fa 1.068= Table 3-6
Acceleration Parameters
SD12
3Fv⋅ S1⋅:=

240
Spectral AccelerationSDS 0.769 g=
Sa_CR minSD1
T hn_CR( ) sec⋅ SDS,⎛⎜⎜⎝
⎞
⎠:= Eq. 3-4
SD1
T hn_CR( ) sec⋅ 1.538 g= Sa_CR 0.769 g=
Sa_GYM minSD1
T hn_GYM( ) sec⋅ SDS,⎛⎜⎜⎝
⎞
⎠:=
SD1
T hn_GYM( ) sec⋅ 0.805 g= Sa_GYM 0.769 g=

241
luse lpanel Numpanel, hn,( ) ltot 0ft←
lw_minhn
1.5←
i 1←
lw lpaneliNumpaneli⋅←
ltot ltot lw+( )← lw lw_min≥( )if
i i 1+←
i length lpanel( )<while
ltot
:=
Only wall panels with an aspect ratio less than 1.5:1 may be used in the resistance oflateral forces. More narrow panels must be neglected for lateral resistance.
Demand/Capacity Ratios
Total required lengthof shear wall
Aw_CR 37.3ft=Aw_CR1
mCR
VCR
1000plf⋅:=
Total pseudolateral force
VCR 149.1 kip=VCR CSa_CR
g⋅ WtCR⋅:=
Total building weightWtCR 149.2 kip=WtCR Wtroof_CR Wtwalls_CR+:=
Weight of wallsWtwalls_CR 21.6 kip=
Wtwalls_CR 2 WCR( )⋅ 2 LCR⋅+ lOP_CR_tot( )−⎡⎣ ⎤⎦ hn_CR⋅ DLwall_CR⋅:=
Weight of roofWtroof_CR 127.6 kip=
Wtroof_CR WCR 20ft+( ) LCR 20ft+( )⋅ DLroof_CR⋅:=
lOP_CR_tot LOP_CR_N LOP_CR_S+ LOP_CR_W+ LOP_CR_E+:=
Classrooms
Table 3-7Component modification factorsmGYM 2.0:=mCR 4.0:=
Table 3-4Use for 1-story, W1 buildingsC 1.3:=
Pseudo Lateral ForceTier 1 Analysis, Rehabilitated Building

242
Aw_GYM 99.7ft=Aw_GYM1
mGYM
VGYM
1000plf⋅:=
VGYM 199.4 kip=VGYM CSa_GYM
g⋅ WtGYM⋅:=
WtGYM 199.5 kip=WtGYM Wtroof_GYM Wtwalls_GYM+:=
Weight of walls, approx 88' x 7' wall openingsWtwalls_GYM 74.5kip=
Wtwalls_GYM 2 WGYM LGYM+( )⋅ hn_GYM⋅ LOP_GYM_tot( ) hn_GYM 7ft−( )⋅−⎡⎣ ⎤⎦ DLwall_GYM⋅:=
Weight of roofWtroof_GYM 125 kip=
Wtroof_GYM WGYM( ) LGYM( )⋅ DLroof_GYM⋅:=
LOP_GYM_tot LOP_GYM_N LOP_GYM_S+ LOP_GYM_W+ LOP_GYM_E+:=
Gymnasium
DCRCR_NS_T1 0.233=DCRCR_NS_T1Aw_CR
lpanel_CR_NS_T1:=
DCRCR_EW_T1 0.414=DCRCR_EW_T1Aw_CR
lpanel_CR_EW_T1:=
lpanel_CR_NS_T1 160 ft=
lpanel_CR_NS_T1 luse lpanel_CR_NS Numpanel_CR_NS, hn_CR,( ):=
Usable length of shear panellpanel_CR_EW_T1 90 ft=
lpanel_CR_EW_T1 luse lpanel_CR_EW Numpanel_CR_EW, hn_CR,( ):=
Maximum length of usable shear panelhn_CR
1.56 ft=

243
Demand/Capacity Ratios
hn_GYM
1.514.222 ft=
lpanel_GYM_EW_T1 luse lpanel_GYM_EW Numpanel_GYM_EW, hn_GYM,( ):=
lpanel_GYM_EW_T1 134 ft=
lpanel_GYM_NS_T1 luse lpanel_GYM_NS Numpanel_GYM_NS, hn_GYM,( ):=
lpanel_GYM_NS_T1 131 ft=
DCRGYM_EW_T1Aw_GYM
lpanel_GYM_EW_T1:= DCRGYM_EW_T1 0.744=
DCRGYM_NS_T1Aw_GYM
lpanel_GYM_NS_T1:= DCRGYM_NS_T1 0.761=
Data Output

244
mwall_GYM h L,( ) 2.0h
L1.0≤if
linterp1
2
⎛⎜⎝
⎞
⎠
2.0
1.7
⎛⎜⎝
⎞
⎠,
h
L,
⎡⎢⎣
⎤⎥⎦
1.0h
L≤ 2.0≤if
1.7 2.0h
L≤ 3.5≤if
0 otherwise
:=
mwall_CR h L,( ) 4.5h
L1.0≤if
linterp1
2
⎛⎜⎝
⎞
⎠
4.5
3.5
⎛⎜⎝
⎞
⎠,
h
L,
⎡⎢⎣
⎤⎥⎦
1.0h
L≤ 2.0≤if
3.5 2.0h
L≤ 3.5≤if
0 otherwise
:=
QCE_wall2 1308 plf=QCE_wall2 2 QCE_wall⋅:=
QCE_wall 654 plf=QCE_wall 340plf1.25
0.65⋅:=
mroof_GYM 2.0:=mroof_CR 3.5:=
QCE_GYM_roof2 1615 plf=QCE_GYM_roof2 2 QCE_GYM_roof⋅:=
QCE_GYM_roof 808 plf=QCE_GYM_roof 420plf1.25
0.65⋅:=
QCE_CR_roof2 3231 plf=QCE_CR_roof2 2 QCE_CR_roof⋅:=
QCE_CR_roof 1615 plf=QCE_CR_roof 840plf1.25
0.65⋅:=
Element Capacity
The method for calculating pseudo lateral force is the same as calculated for Tier 1.
Pseudo Lateral Force
Tier 2 Analysis, Rehabilitated Structure
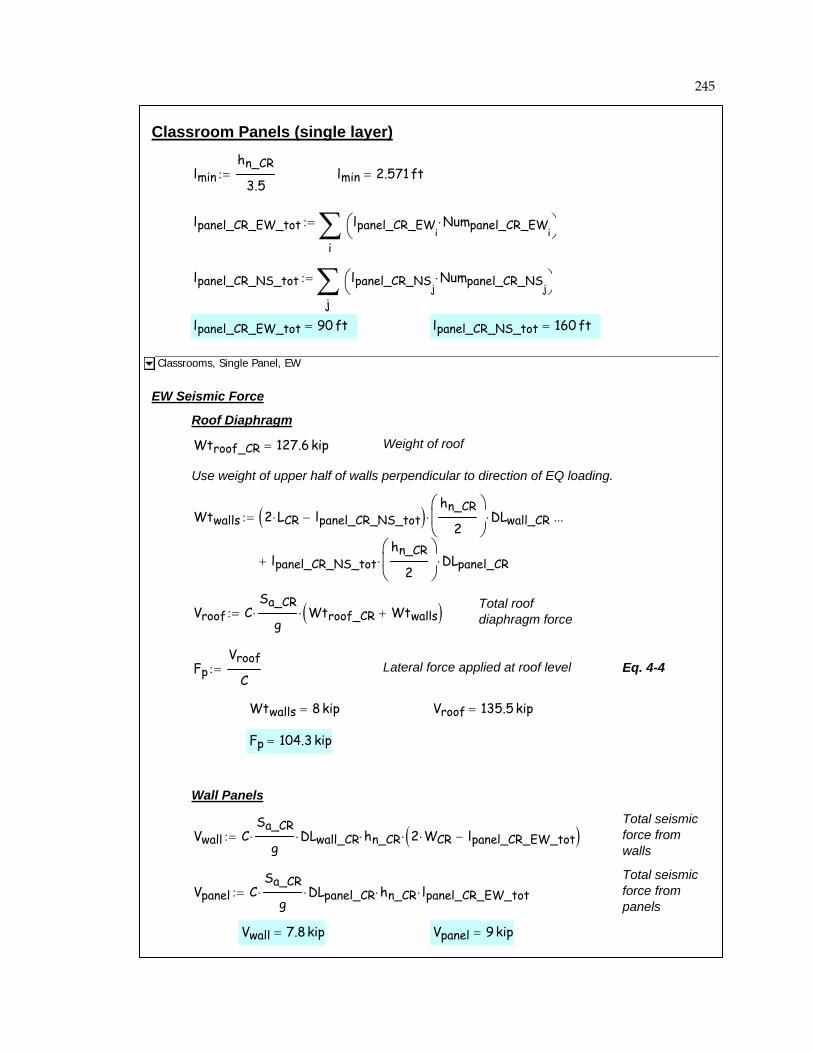
245
Vpanel 9 kip=Vwall 7.8kip=
Vpanel CSa_CR
g⋅ DLpanel_CR⋅ hn_CR⋅ lpanel_CR_EW_tot⋅:=
Total seismicforce frompanels
Vwall CSa_CR
g⋅ DLwall_CR⋅ hn_CR⋅ 2 WCR⋅ lpanel_CR_EW_tot−( )⋅:=
Total seismicforce fromwalls
Wall Panels
Fp 104.3 kip=
Vroof 135.5 kip=Wtwalls 8 kip=
Eq. 4-4Lateral force applied at roof levelFpVroof
C:=
Vroof CSa_CR
g⋅ Wtroof_CR Wtwalls+( )⋅:=
Total roofdiaphragm force
Wtwalls 2 LCR⋅ lpanel_CR_NS_tot−( )hn_CR
2
⎛⎜⎝
⎞
⎠⋅ DLwall_CR⋅
lpanel_CR_NS_tothn_CR
2
⎛⎜⎝
⎞
⎠⋅ DLpanel_CR⋅+
...:=
Use weight of upper half of walls perpendicular to direction of EQ loading.
Weight of roofWtroof_CR 127.6 kip=
Roof Diaphragm
EW Seismic Force
Classrooms, Single Panel, EW
lpanel_CR_NS_tot 160 ft=lpanel_CR_EW_tot 90 ft=
lpanel_CR_NS_tot
j
lpanel_CR_NSjNumpanel_CR_NSj⋅⎛
⎝⎞⎠∑:=
lpanel_CR_EW_tot
i
lpanel_CR_EWiNumpanel_CR_EWi⋅⎛
⎝⎞⎠∑:=
lmin 2.571 ft=lminhn_CR
3.5:=
Classroom Panels (single layer)

246
Classrooms, Single Panel, EW
DCRCR_P_EW_T2i
0.6330.633
=lpanel_CR_EWi
1015
ft
=lpanel_req_paneli6.39.5
ft
=
Ratioi0.1110.167
=mwall_CR_EWi
4.504.50
=
hn_CR
lpanel_CR_EWi
0.900.60
=
DCRCR_P_EW_T2i
lpanel_req_paneli
lpanel_CR_EWi
:=Ratio of required panel length(including 10% additional foraccidental torsion) to actualpanel length
lpanel_req_paneli
1.1 Vroof Vwall+ Vpanel+( )QCE_wall mwall_CR_EWi
⋅Ratioi⋅:=
Required panel length ateach panel location,including effect ofaccidental torsion.
Ratioi
lpanel_CR_EWi
lpanel_CR_EW_tot:=
Ratio of each panel length tosummation of panel lengths
mwall_CR_EWimwall_CR hn_CR lpanel_CR_EWi
,⎛⎝
⎞⎠
:=
Acceptance Criteria: shear panels
DCRCR_R_EW_T2 0.225=DCRCR_R_EW_T2lpanel_req_roof
lpanel_CR_EW_tot:=
lpanel_CR_EW_tot 90 ft=
lpanel_req_roof 20.3ft=
lpanel_req_roof1.1 Fp⋅
QCE_CR_roof mroof_CR⋅:=
Total panel length required for roofshear and accidental torsion
Acceptance Criteria: roof

247
DCRCR_R_NS_T2 0.127=DCRCR_R_NS_T2lpanel_req_roof
lpanel_CR_NS_tot:=
lpanel_CR_NS_tot 160 ft=
lpanel_req_roof 20.3ft=
lpanel_req_roof1.1 Fp⋅
QCE_CR_roof mroof_CR⋅:=
Acceptance Criteria: roof
Vpanel 16 kip=Vwall 0 kip=
Vpanel CSa_CR
g⋅ DLpanel_CR⋅ hn_CR⋅ lpanel_CR_NS_tot⋅:=
Vwall CSa_CR
g⋅ DLwall_CR⋅ hn_CR⋅ 2 LCR⋅ lpanel_CR_NS_tot−( )⋅:=
Wall Panels
Fp 104.6 kip=
Vroof 135.9 kip=Wtwalls 8.4kip=
Eq. 4-4FpVroof
C:=
Vroof CSa_CR
g⋅ Wtroof_CR Wtwalls+( )⋅:=
Wtwalls 2 WCR⋅ lpanel_CR_EW_tot−( )hn_CR
2
⎛⎜⎝
⎞
⎠⋅ DLwall_CR⋅
lpanel_CR_EW_tothn_CR
2
⎛⎜⎝
⎞
⎠⋅ DLpanel_CR⋅+
...:=
Wtroof_CR 127.6 kip=
Roof Diaphragm
NS Seismic Force
Classrooms, Single Panel, NS

248
Acceptance Criteria: shear panels
mwall_CR_NSjmwall_CR hn_CR lpanel_CR_NSj
,⎛⎝
⎞⎠
:=
Ratioj
lpanel_CR_NSj
lpanel_CR_NS_tot:=
lpanel_req_panelj
1.1 Vroof Vwall+ Vpanel+( )⋅
QCE_wall mwall_CR_NSj⋅
Ratioj⋅:=
DCRCR_P_NS_T2j
lpanel_req_panelj
lpanel_CR_NSj
:=
hn_CR
lpanel_CR_NSj
0.11
=mwall_CR_NSj
4.50
= Ratioj0.5
=
lpanel_req_panelj28.4 ft
= lpanel_CR_NSj
80 ft
= DCRCR_P_NS_T2j
0.355
=
Classrooms, Single Panel, NS

249
Vpanel2 10.2 kip=Vwall 7.8kip=
Vpanel2 CSa_CR
g⋅ DLpanel2_CR⋅ hn_CR⋅ lpanel_CR_EW_tot⋅:=
Vwall CSa_CR
g⋅ DLwall_CR⋅ hn_CR⋅ 2 WCR⋅ lpanel_CR_EW_tot−( )⋅:=
Wall Panels
Fp 124.1 kip=
Vroof2 161.4 kip=Wtwalls2 9.1 kip=
Eq. 4-4FpVroof2
C:=
Vroof2 CSa_CR
g⋅ Wtroof2_CR Wtwalls2+( )⋅:=
Wtwalls2 2 LCR⋅ lpanel_CR_NS_tot−( )hn_CR
2
⎛⎜⎝
⎞
⎠⋅ DLwall_CR⋅
lpanel_CR_NS_tothn_CR
2
⎛⎜⎝
⎞
⎠⋅ DLpanel2_CR⋅+
...:=
Wtroof2_CR WCR 20ft+( ) LCR 20ft+( )⋅ DLroof2_CR⋅:=
Roof Diaphragm
EW Seismic Force
Classrooms, Double Panel, EW
Classroom Panels (double layer)

250
Classrooms, Double Panel, EW
DCRCR_P2_EW_T2i
0.3720.372
=lpanel_CR_EWi
1015
ft
=lpanel2_req_paneli3.75.6
ft
=
Ratioi0.1110.167
=mwall_CR_EWi
4.504.50
=
hn_CR
lpanel_CR_EWi
0.900.60
=
DCRCR_P2_EW_T2i
lpanel2_req_paneli
lpanel_CR_EWi
:=
lpanel2_req_paneli
1.1 Vroof2 Vwall+ Vpanel2+( )⋅
QCE_wall2 mwall_CR_EWi⋅
Ratioi⋅:=
Ratioi
lpanel_CR_EWi
lpanel_CR_EW_tot:=
mwall_CR_EWimwall_CR hn_CR lpanel_CR_EWi
,⎛⎝
⎞⎠
:=
Acceptance Criteria: shear panels
DCRCR_R2_EW_T2 0.134=DCRCR_R2_EW_T2lpanel2_req_roof
lpanel_CR_EW_tot:=
lpanel_CR_EW_tot 90 ft=
lpanel2_req_roof 12.1 ft=
lpanel2_req_roof1.1 Fp⋅
QCE_CR_roof2 mroof_CR⋅:=
Acceptance Criteria: roof

251
Vpanel2 18.1 kip=Vwall 0 kip=
Vpanel2 CSa_CR
g⋅ DLpanel2_CR⋅ hn_CR⋅ lpanel_CR_NS_tot⋅:=
Vwall CSa_CR
g⋅ DLwall_CR⋅ hn_CR⋅ 2 LCR⋅ lpanel_CR_NS_tot−( )⋅:=
Wall Panels
Fp 124.1 kip=
Vroof2 161.3 kip=Wtwalls2 9 kip=
Eq. 4-4FpVroof2
C:=
Vroof2 CSa_CR
g⋅ Wtroof2_CR Wtwalls2+( )⋅:=
Wtwalls2 2 WCR⋅ lpanel_CR_EW_tot−( )hn_CR
2
⎛⎜⎝
⎞
⎠⋅ DLwall_CR⋅
lpanel_CR_EW_tothn_CR
2
⎛⎜⎝
⎞
⎠⋅ DLpanel2_CR⋅+
...:=
Wtroof2_CR 152.4 kip=
Roof Diaphragm
NS Seismic Force
Classrooms, Double Panel, NS

252
Classrooms, Double Panel, NS
DCRCR_P2_NS_T2j
0.21
=lpanel_CR_NSj
80 ft
=lpanel2_req_panelj16.8 ft
=
Ratioj0.5
=mwall_CR_NSj
4.50
=
hn_CR
lpanel_CR_NSj
0.11
=
DCRCR_P2_NS_T2j
lpanel2_req_panelj
lpanel_CR_NSj
:=
lpanel2_req_panelj
1.1 Vroof2 Vwall+ Vpanel2+( )⋅
QCE_wall2 mwall_CR_NSj⋅
Ratioj⋅:=
Ratioj
lpanel_CR_NSj
lpanel_CR_NS_tot:=
mwall_CR_NSjmwall_CR hn_CR lpanel_CR_NSj
,⎛⎝
⎞⎠
:=
Acceptance Criteria: shear panels
DCRCR_R2_NS_T2 0.075=DCRCR_R2_NS_T2lpanel2_req_roof
lpanel_CR_NS_tot:=
lpanel_CR_NS_tot 160 ft=
lpanel2_req_roof 12.1 ft=
lpanel2_req_roof1.1 Fp⋅
QCE_CR_roof2 mroof_CR⋅:=
Acceptance Criteria: roof

253
Vpanel 35 kip=Vwall 17.2 kip=
Vpanel CSa_GYM
g⋅ DLpanel_GYM⋅ hn_GYM⋅ lpanel_GYM_EW_tot⋅:=
Vwall CSa_GYM
g⋅ DLwall_GYM⋅ hn_GYM⋅ 2 WGYM⋅ lpanel_GYM_EW_tot−( )⋅:=
Wall Panels
Fp 113.2 kip=
Vroof 147.2 kip=Wtwalls 22.3kip=
FpVroof
C:=
Vroof CSa_GYM
g⋅ Wtroof_GYM Wtwalls+( )⋅:=
Wtwalls 2 LGYM⋅ lpanel_GYM_NS_tot−( )hn_GYM
2
⎛⎜⎝
⎞
⎠⋅ DLwall_GYM⋅
lpanel_GYM_NS_tothn_GYM
2
⎛⎜⎝
⎞
⎠⋅ DLpanel_GYM⋅+
...:=
Wtroof_GYM 125 kip=
Roof Diaphragm
EW Seismic Force
lpanel_GYM_NS_tot 163 ft=
lpanel_GYM_EW_tot 148 ft=
lpanel_GYM_NS_tot
l
lpanel_GYM_NSlNumpanel_GYM_NSl⋅⎛
⎝⎞⎠∑:=
lpanel_GYM_EW_tot
k
lpanel_GYM_EWkNumpanel_GYM_EWk⋅⎛
⎝⎞⎠∑:=
lmin 6.095 ft=lminhn_GYM
3.5:=
Gymnasium, Single Panel, EW
Gymnasium Panels (single layer)

254
Gymnasium, Single Panel, EW
DCRGYM_P_EW_T2k
1.231.193
1.134
1.134
1.134
1.134
=lpanel_GYM_EWk
1416
23
24
26
45
ft
=lpanel_req_panelk17.219.1
26.1
27.2
29.5
51
ft
=
Ratiok0.0950.108
0.155
0.162
0.176
0.304
=mwall_GYM_EWk
1.841.90
2.00
2.00
2.00
2.00
=
hn_GYM
lpanel_GYM_EWk
1.521.33
0.93
0.89
0.82
0.47
=
DCRGYM_P_EW_T2k
lpanel_req_panelk
lpanel_GYM_EWk
:=
lpanel_req_panelk
1.1 Vroof Vwall+ Vpanel+( )⋅
QCE_wall mwall_GYM_EWk⋅
Ratiok⋅:=Ratiok
lpanel_GYM_EWk
lpanel_GYM_EW_tot:=
mwall_GYM_EWkmwall_GYM hn_GYM lpanel_GYM_EWk
,⎛⎝
⎞⎠
:=
Acceptance Criteria: shear panels
DCRGYM_R_EW_T2 0.521=DCRGYM_R_EW_T2lpanel_req_roof
lpanel_GYM_EW_tot:=
lpanel_GYM_EW_tot 148 ft=
lpanel_req_roof 77.1 ft=lpanel_req_roof
1.1 Fp⋅
QCE_GYM_roof mroof_GYM⋅:=
Acceptance Criteria: roof

255
DCRGYM_R_NS_T2 0.485=DCRGYM_R_NS_T2lpanel_req_roof
lpanel_GYM_NS_tot:=
lpanel_GYM_NS_tot 163 ft=
lpanel_req_roof 79.1 ft=
lpanel_req_roof1.1 Fp⋅
QCE_GYM_roof mroof_GYM⋅:=
Acceptance Criteria: roof
Vpanel 38.6kip=Vwall 5.9kip=
Vpanel CSa_GYM
g⋅ DLpanel_GYM⋅ hn_GYM⋅ lpanel_GYM_NS_tot⋅:=
Vwall CSa_GYM
g⋅ DLwall_GYM⋅ hn_GYM⋅ 2 LGYM⋅ lpanel_GYM_NS_tot−( )⋅:=
Wall Panels
Fp 116.2 kip=
Vroof 151.1 kip=Wtwalls 26.1 kip=
FpVroof
C:=
Vroof CSa_GYM
g⋅ Wtroof_GYM Wtwalls+( )⋅:=
Wtwalls 2 WGYM⋅ lpanel_GYM_EW_tot−( )hn_GYM
2
⎛⎜⎝
⎞
⎠⋅ DLwall_GYM⋅
lpanel_GYM_EW_tothn_GYM
2
⎛⎜⎝
⎞
⎠⋅ DLpanel_GYM⋅+
...:=
Wtroof_GYM 125 kip=
Roof Diaphragm
NS Seismic Force
Gymnasium, Single Panel, NS

256
Acceptance Criteria: shear panels
mwall_GYM_NSlmwall_GYM hn_GYM lpanel_GYM_NSl
,⎛⎝
⎞⎠
:=
Ratiol
lpanel_GYM_NSl
lpanel_GYM_NS_tot:=
lpanel_req_panell
1.1 Vroof Vwall+ Vpanel+( )⋅
QCE_wall mwall_GYM_NSl⋅
Ratiol⋅:=
DCRGYM_P_NS_T2l
lpanel_req_panell
lpanel_GYM_NSl
:=
hn_GYM
lpanel_GYM_NSl
2.372.13
1.64
1.19
1.02
0.58
0.39
=mwall_GYM_NSl
1.701.70
1.81
1.94
2.00
2.00
2.00
= Ratiol0.0550.061
0.08
0.11
0.129
0.227
0.337
=
lpanel_req_panell10.711.9
14.5
18.7
21.2
37.3
55.5
ft
= lpanel_GYM_NSl
910
13
18
21
37
55
ft
= DCRGYM_P_NS_T2l
1.1881.188
1.117
1.038
1.012
1.009
1.009
=
Gymnasium, Single Panel, NS

257
DCRGYM_R2_EW_T2 0.302=DCRGYM_R2_EW_T2lpanel2_req_roof
lpanel_GYM_EW_tot:=
lpanel_GYM_EW_tot 148 ft=
lpanel2_req_roof 44.7 ft=
lpanel2_req_roof1.1 Fp⋅
QCE_GYM_roof2 mroof_GYM⋅:=
Acceptance Criteria: roof
Vpanel2 39.8 kip=Vwall 17.2 kip=
Vpanel2 CSa_GYM
g⋅ DLpanel2_GYM⋅ hn_GYM⋅ lpanel_GYM_EW_tot⋅:=
Vwall CSa_GYM
g⋅ DLwall_GYM⋅ hn_GYM⋅ 2 WGYM⋅ lpanel_GYM_EW_tot−( )⋅:=
Wall Panels
Fp 131.3 kip=
Vroof2 170.7 kip=Wtwalls2 24.9 kip=
FpVroof2
C:=
Vroof2 CSa_GYM
g⋅ Wtroof2_GYM Wtwalls2+( )⋅:=
Wtwalls2 2 LGYM⋅ lpanel_GYM_NS_tot−( )hn_GYM
2
⎛⎜⎝
⎞
⎠⋅ DLwall_GYM⋅
lpanel_GYM_NS_tothn_GYM
2
⎛⎜⎝
⎞
⎠⋅ DLpanel2_GYM⋅+
...:=
Wtroof2_GYM WGYM( ) LGYM( )⋅ DLroof2_GYM⋅:=
Roof Diaphragm
EW Seismic Force
Gymnasium, Double Panel, EW
Gymnasium Panels (double layer)

258
Acceptance Criteria: shear panels
mwall_GYM_EWkmwall_GYM hn_GYM lpanel_GYM_EWk
,⎛⎝
⎞⎠
:=
Ratiok
lpanel_GYM_EWk
lpanel_GYM_EW_tot:=
lpanel2_req_panelk
1.1 Vroof2 Vwall+ Vpanel2+( )⋅
QCE_wall2 mwall_GYM_EWk⋅
Ratiok⋅:=
DCRGYM_P2_EW_T2k
lpanel2_req_panelk
lpanel_GYM_EWk
:=
hn_GYM
lpanel_GYM_EWk
1.521.33
0.93
0.89
0.82
0.47
=mwall_GYM_EWk
1.841.90
2.00
2.00
2.00
2.00
= Ratiok0.0950.108
0.155
0.162
0.176
0.304
=
lpanel2_req_panelk9.8
10.9
14.9
15.5
16.8
29.1
ft
= lpanel_GYM_EWk
1416
23
24
26
45
ft
= DCRGYM_P2_EW_T2k
0.7020.681
0.647
0.647
0.647
0.647
=
Gymnasium, Double Panel, EW

259
DCRGYM_R2_NS_T2 0.28=DCRGYM_R2_NS_T2lpanel2_req_roof
lpanel_GYM_NS_tot:=
lpanel_GYM_NS_tot 163 ft=
lpanel2_req_roof 45.7 ft=
lpanel2_req_roof1.1 Fp⋅
QCE_GYM_roof2 mroof_GYM⋅:=
Acceptance Criteria: roof
Vpanel2 43.8 kip=Vwall 5.9kip=
Vpanel2 CSa_GYM
g⋅ DLpanel2_GYM⋅ hn_GYM⋅ lpanel_GYM_NS_tot⋅:=
Vwall CSa_GYM
g⋅ DLwall_GYM⋅ hn_GYM⋅ 2 LGYM⋅ lpanel_GYM_NS_tot−( )⋅:=
Wall Panels
Fp 134.1 kip=
Vroof2 174.3 kip=Wtwalls2 28.5 kip=
FpVroof2
C:=
Vroof2 CSa_GYM
g⋅ Wtroof2_GYM Wtwalls2+( )⋅:=
Wtwalls2 2 WGYM⋅ lpanel_GYM_EW_tot−( )hn_GYM
2
⎛⎜⎝
⎞
⎠⋅ DLwall_GYM⋅
lpanel_GYM_EW_tothn_GYM
2
⎛⎜⎝
⎞
⎠⋅ DLpanel2_GYM⋅+
...:=
Wtroof2_GYM 145.9 kip=
Roof Diaphragm
NS Seismic Force
Gymnasium, Double Panel, NS

260
Acceptance Criteria: shear panels
mwall_GYM_NSlmwall_GYM hn_GYM lpanel_GYM_NSl
,⎛⎝
⎞⎠
:=
Ratiol
lpanel_GYM_NSl
lpanel_GYM_NS_tot:=
lpanel2_req_panell
1.1 Vroof2 Vwall+ Vpanel2+( )⋅
QCE_wall2 mwall_GYM_NSl⋅
Ratiol⋅:=
DCRGYM_P2_NS_T2l
lpanel2_req_panell
lpanel_GYM_NSl
:=
hn_GYM
lpanel_GYM_NSl
2.372.13
1.64
1.19
1.02
0.58
0.39
=mwall_GYM_NSl
1.701.70
1.81
1.94
2.00
2.00
2.00
= Ratiol0.0550.061
0.08
0.11
0.129
0.227
0.337
=
lpanel2_req_panell6.16.8
8.3
10.7
12.2
21.4
31.8
ft
= lpanel_GYM_NSl
910
13
18
21
37
55
ft
= DCRGYM_P2_NS_T2l
0.680.68
0.64
0.595
0.579
0.578
0.578
=
Gymnasium, Double Panel, NS
Data Output

261
Tier 3 Evaluation, Rehabilitated StructureUse the 3-D models developed for FEMA 356, using 0.75 times the applied forces.For methods, equations, and calculations details see FEMA 356 calculations. Tier 3DCR results are equal to 0.75 times the FEMA 356 results.

262
APPENDIX E: 1997 UBC CALCULATIONS

263
Existing wall DLDLwall_CR 9.6psf=
Double-panel shear wall panel DLDLpanel2_CR 12.6 psf=
Single-panel shear wall panel DLDLpanel_CR 11.1 psf=
Double-panel roof DLDLroof2_CR 13.9 psf=
Single-panel roof DLDLroof_CR 11.6 psf=
Building Weights
Numpanel_CR_NSj
2
=lpanel_CR_NSj
80 ft
=
Shear panel dimensionsNumpanel_CR_EWi
62
=lpanel_CR_EWi
1015
ft
=
Classroom wall heighthn_CR 9 ft=
Structure dimension in N/S directionLCR 80 ft=
Structure dimension in E/W directionWCR 90 ft=
Building Dimensions
Classrooms
Structure Information
Preston BaxterReference:C:\Thesis\The Report\Global Inputs.mcd(R)
Hoover School Analysis - UBC 1997

264
Existing wall DLDLwall_CR 9.6psf=
Double-panel shear wall panel DLDLpanel2_CR 12.6 psf=
Single-panel shear wall panel DLDLpanel_CR 11.1 psf=
Double-panel roof DLDLroof2_CR 13.9 psf=
Single-panel roof DLDLroof_CR 11.6 psf=
Building Weights
Numpanel_GYM_NSl
11
1
1
1
1
1
=lpanel_GYM_NSl
910
13
18
21
37
55
ft
=
Shear panel dimensionsNumpanel_GYM_EWk
11
1
1
1
1
=lpanel_GYM_EWk
1416
23
24
26
45
ft
=
Gymnasium wall heighthn_CR 9 ft=
Structure dimension in N/S directionLCR 80 ft=
Structure dimension in E/W directionWCR 90 ft=
Building Dimensions
Gymnasium
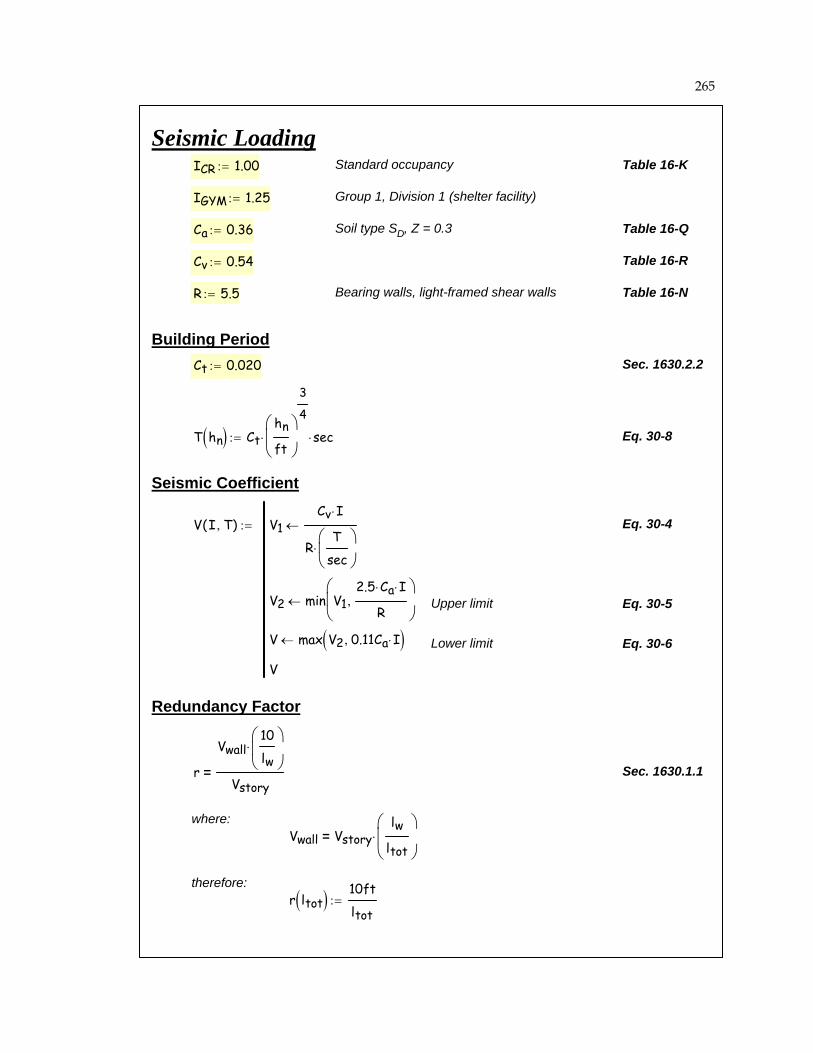
265
T hn( ) Cthn
ft
⎛⎜⎝
⎞
⎠
3
4
⋅ sec⋅:= Eq. 30-8
Seismic Coefficient
V I T,( ) V1Cv I⋅
RT
sec⎛⎜⎝
⎞
⎠⋅
←
V2 min V12.5 Ca⋅ I⋅
R,
⎛⎜⎝
⎞
⎠←
V max V2 0.11Ca I⋅,( )←
V
:= Eq. 30-4
Upper limit Eq. 30-5
Lower limit Eq. 30-6
Redundancy Factor
r
Vwall10
lw
⎛⎜⎝
⎞
⎠⋅
Vstory= Sec. 1630.1.1
where:Vwall Vstory
lw
ltot
⎛⎜⎜⎝
⎞
⎠⋅=
therefore:r ltot( ) 10ft
ltot:=
Seismic LoadingICR 1.00:= Standard occupancy Table 16-K
IGYM 1.25:= Group 1, Division 1 (shelter facility)
Ca 0.36:= Soil type SD, Z = 0.3 Table 16-Q
Cv 0.54:= Table 16-R
R 5.5:= Bearing walls, light-framed shear walls Table 16-N
Building PeriodCt 0.020:= Sec. 1630.2.2

266
Building dimension parallel to EQ
W LCR:= Building dimension perpendicular to EQ
lpanel lpanel_CR_EW:= Panel length(s)
lpanel_tot
i
lpanel_CR_EWiNumpanel_CR_EWi⋅⎛
⎝⎞⎠∑:= lpanel_tot 90 ft=
l'panel_tot
j
lpanel_CR_NSjNumpanel_CR_NSj⋅⎛
⎝⎞⎠∑:= Total length of panels
perpendicular to EQ
l'panel_tot 160 ft=
Diaphragm Shear to Top of Wall
Vroof DLroof( ) L 20 ft⋅+( )⋅ W⋅ Coef⋅:= Include 20 ft of additional roof for 10' overhangs
Shear into diaphragm due to top half of walls perpendicular to EQ
Vwalls l'panel_tot DLpanel⋅ 2 W⋅ l'panel_tot−( ) DLwall⋅+⎡⎣ ⎤⎦hn
2
⎛⎜⎝
⎞
⎠⋅ Coef⋅:=
νR_roofVroof Vwalls+
2 L⋅:= νR_roof 100.065 plf=
Vroof 16.704 kip= Vwalls 1.308 kip=
Classroom AreasSeismic Inputs
Coef V ICR T hn_CR( ),( ):= Coef 0.164=
Seismic Load: E/W Direction, Single PanelSeismic Weight
DLroof DLroof_CR:= Total weight of roof DLroof 11.6 psf=
DLwall DLwall_CR:= Weight of existing walls DLwall 9.6psf=
DLpanel DLpanel_CR:= Weight of new panels DLpanel 11.1 psf=
hn hn_CR:= Height of walls hn 9 ft=
Dimensions
L WCR:=

267
Steel strap area
L 90 ft= Width of diaphram parallel to load
G 90000psi:= Modulus of rigidity, Exterior C-D Table 23-2-J
tR 0.75in:= Panel thickness
Dc 0:= X 0:= Assumed values
en_R_CR en νR_roof 4in( )⋅⎡⎣ ⎤⎦ en_10d,⎡⎣ ⎤⎦:=
νR_roof 4in( )⋅ 33 lbf= en_R_CR 0.0008=
∆R_CR5 νR_roof⋅ W3
⋅
8 ER⋅ AR⋅ L⋅
νR_roof W⋅
4 G⋅ tR⋅+ 0.188 W⋅ en_R_CR⋅+
⎛⎜⎜⎝
⎞
⎠:= ∆R_CR 0.832 in=
Nail Slip
Table 23-2-K
νnail
60lbf
80lbf
100lbf
120lbf
140lbf
160lbf
180lbf
200lbf
220lbf
240lbf
⎛⎜⎜⎜⎜⎜⎜⎜⎜⎜⎜⎜⎜⎜⎜⎜⎝
⎞
⎟⎟⎟⎟⎟⎟⎟⎟⎟⎟⎟⎟⎟
⎠
:= en_8d
0.008
0.012
0.018
0.023
0.031
0.041
0.056
0.074
0.096
0
⎛⎜⎜⎜⎜⎜⎜⎜⎜⎜⎜⎜⎜⎜⎜⎜⎝
⎞
⎟⎟⎟⎟⎟⎟⎟⎟⎟⎟⎟⎟⎟
⎠
:= en_10d
0.006
0.010
0.013
0.018
0.023
0.029
0.037
0.047
0.060
0.077
⎛⎜⎜⎜⎜⎜⎜⎜⎜⎜⎜⎜⎜⎜⎜⎜⎝
⎞
⎟⎟⎟⎟⎟⎟⎟⎟⎟⎟⎟⎟⎟
⎠
:=
en ν en_nail,( ) linterp νnail en_nail, ν,( ) 1.2⋅:=
Input a load per nail, choose the data for the nail size, and the en value is returned. The 1.2factor is for lumber except Structural I.
Diaphragm Deflection
∆dia5 νR_roof⋅ W3
⋅
8 ER⋅ AR⋅ L⋅
νR_roof W⋅
4 G⋅ tR⋅+ 0.188 W⋅ en⋅+
Σ Dc X⋅( )2 L⋅
+= APA 1997a
νR_roof 100 plf= Total load divided by length of BUILDING walls parallel to load
W 80 ft= Dimension perpendicular to seismic load direction
ER 29000ksi:= Young's modulus for steel strap
AR 0.224in2:=

268
∆CR_EWVroof Vwalls+
i
kpanel_CR_EWiNumpanel_CR_EWi⋅⎛
⎝⎞⎠∑
:=
kpanel_CR_EWi
νi
lpanel_CR_EWi⋅
∆P_CR_EWi
:=
∆P_CR_EWi
8 νi
⋅ hn3
⋅
EP AP⋅ lpanel_CR_EWi⋅
νi
hn⋅
G tP⋅+ 0.75 hn⋅ en_P_CRi
⋅⎛⎝
⎞⎠
+hn
lpanel_CR_EWi
da⋅+:=
en_P_CRi
0.02430.0252
=
en_P_CRien ν
i6in( )⋅⎡
⎣⎤⎦
en_8d,⎡⎣
⎤⎦
:=ν
i
218plf224plf
:= lpanel_CR_EWi
1015
ft
=
Assumed hold-down slipda 0.10in:=
Panel shear modulusG 90 ksi=
Panel thicknesstP 0.5in:=
2x6 boundary memberAP 1.5in 5.5⋅ in:=
Assumed wood stiffnessEP 1600ksi:=
Classroom wall heighthn hn_CR:=
APA 1997a∆wall8 ν⋅ hn
3⋅
EP AP⋅ b⋅
ν hn⋅
G tP⋅+ 0.75 hn⋅ en⋅( )+
h
bda⋅+=
Wall panel deflections are calculated at an assumed load level. The resulting deflection,divided by the applied load, is used as the panel stiffness. The sum of the panel stiffnessis used to compute the story drift. If the diaphragm is RIGID then the input load must beiterated.
If the diaphragms are classified as FLEXIBLE from the deflection calculations, then theshear load to each panel is equivalent. Otherwise the shear forces are distributed based onrelative stiffness, or relative rigidity, of the panels.
Wall Panel Stiffness

269
Design seismic load from panel self weight
νwall 16 plf=νwall DLpanel hn⋅ Coef⋅:=
Design load to panel from roof
νroofi
218224
plf
=νroofi
VCR_EWi
lpanel_CR_EWi
:=
Total force to each pier from roofdiaphragm, including accidental torsion
VCR_EWi
21843355
lbf
=VCR_EWiVroof Vwalls+( ) 1.1⋅ RRi( )⋅:=
RRi0.11
0.169
=RRi
kpanel_CR_EWi
i
kpanel_CR_EWiNumpanel_CR_EWi⋅⎛
⎝⎞⎠∑
:=
Diaphragm "Rigid"=
∆R_CR∆CR_EW
0.412=Diaphragm "Flexible"∆R_CR∆CR_EW
2.0≥if
"Rigid" otherwise
:=
∆CR_EW 2.02 in=∆P_CR_EWi
2.2172.225
in
=kpanel_CR_EWi
9831510
lbfin
=

270
DCRCR_P_EWi
0.6450.659
=DCRCR_R_EW 0.168=
DCRCR_P_EWEwall
CapacityP:=DCRCR_R_EW
Eroof
CapacityR:=
Demand / Capacity Ratios
CapacityP 260plf:=Table 23-II-I-1Use for wall panel capacity,
assumes 19/32" exteriorsheathing with 10d@6" edgenailing
Ewalli168171
plf
=Ewall ρνroof νwall+( )
1.4⋅ Ev+:=
Table 23-II-HCapacityR 425plf:=
Use for roof diaphragmcapacity, assumes 19/32"panel with 10d@4" spacing
Eroof 71 plf=Eroof ρνR_roof
1.4⋅ Ev+:=
Eq. 30-1,convert toallowablestress level
Sec. 1630.1.1Use zero for Allowable Stress DesignEv 0plf:=
Design Shear (Allowable Stress Level)
ρ 1.0=ρ max ρ'( ):=
ρ' 1.00=rmax 0.111=ρ' ρ1 220
rmaxAb
ft2⋅
−←
ρ2 min ρ1 1.5,( )←
max ρ2 1.0,( )
:=
Ab L W⋅:=rmax r lpanel_tot( ):=
Redundancy Factor

271
en_P_CRi
0.03240.0336
=
en_P_CRien ν
i6in( )⋅⎡
⎣⎤⎦
en_8d,⎡⎣
⎤⎦
:=ν
i
260plf265plf
:= lpanel_CR_EWi
1015
ft
=
tP 1.0in:=
Wall Panel Stiffness
∆R_CR 1.219 in=∆R_CR5 νR_roof⋅ W3
⋅
8 ER⋅ AR⋅ L⋅
νR_roof W⋅
4 G⋅ tR⋅+ 0.188 W⋅ en_R_CR⋅+
⎛⎜⎜⎝
⎞
⎠:=
en_R_CR 0.0023=νR_roof 4in( )⋅ 40 lbf=
en_R_CR en νR_roof 4in( )⋅⎡⎣ ⎤⎦ en_10d,⎡⎣ ⎤⎦:=
tR 1.50in:=νR_roof 119 plf=
Diaphragm Deflection
Vwalls 1.485 kip=Vroof 19.944 kip=
νR_roof 119.047 plf=νR_roofVroof Vwalls+
2 L⋅:=
Vwalls l'panel_tot DLpanel⋅ 2 W⋅ l'panel_tot−( ) DLwall⋅+⎡⎣ ⎤⎦hn
2
⎛⎜⎝
⎞
⎠⋅ Coef⋅:=
Vroof DLroof( ) L 20 ft⋅+( )⋅ W⋅ Coef⋅:=
Diaphragm Shear to Top of Wall
DLpanel 12.6 psf=DLpanel DLpanel2_CR:=
DLroof 13.9 psf=DLroof DLroof2_CR:=
Seismic Weight
Seismic Load: E/W Direction, Double Panel

272
νwall 19 plf=νwall DLpanel hn⋅ Coef⋅:=
νroofi
261264
plf
=νroofi
VCR_EWi
lpanel_CR_EWi
:=
VCR_EWi
26093957
lbf
=VCR_EWiVroof Vwalls+( ) 1.1⋅ RRi( )⋅:=
RRi0.1110.168
=RRi
kpanel_CR_EWi
i
kpanel_CR_EWiNumpanel_CR_EWi⋅⎛
⎝⎞⎠∑
:=
Diaphragm "Rigid"=
∆R_CR∆CR_EW
0.464=Diaphragm "Flexible"∆R_CR∆CR_EW
2.0≥if
"Rigid" otherwise
:=
∆CR_EW 2.626 in=∆P_CR_EWi
2.8782.902
in
=kpanel_CR_EWi
9031370
lbfin
=
∆CR_EWVroof Vwalls+
i
kpanel_CR_EWiNumpanel_CR_EWi⋅⎛
⎝⎞⎠∑
:=
kpanel_CR_EWi
νi
lpanel_CR_EWi⋅
∆P_CR_EWi
:=
∆P_CR_EWi
8 νi
⋅ hn3
⋅
EP AP⋅ lpanel_CR_EWi⋅
νi
hn⋅
G tP⋅+ 0.75 hn⋅ en_P_CRi
⋅⎛⎝
⎞⎠
+hn
lpanel_CR_EWi
da⋅+:=

273
Design Shear (Allowable Stress Level)
Eroof ρνR_roof
1.4⋅ Ev+:= Eroof 85 plf=
Ewall ρνroof νwall+( )
1.4⋅ Ev+:= Ewalli
200202
plf
=
Demand / Capacity Ratios
DCRCR_R2_EWEroof
2 CapacityR⋅:= DCRCR_P2_EW
Ewall
2 CapacityP⋅:=
DCRCR_R2_EW 0.1= DCRCR_P2_EWi
0.3840.388
=

274
l'panel_tot 90 ft=
Diaphragm Shear to Top of Wall
Vroof DLroof( ) L 20 ft⋅+( )⋅ W⋅ Coef⋅:=
Vwalls l'panel_tot DLpanel⋅ 2 W⋅ l'panel_tot−( ) DLwall⋅+⎡⎣ ⎤⎦hn
2
⎛⎜⎝
⎞
⎠⋅ Coef⋅:=
νR_roofVroof Vwalls+
2 L⋅:= νR_roof 115.347 plf=
Vroof 17.084 kip= Vwalls 1.372 kip=
Diaphragm Deflection
νR_roof 115 plf= tR 0.75in:=
en_R_CR en νR_roof 4in( )⋅⎡⎣ ⎤⎦ en_10d,⎡⎣ ⎤⎦:=
νR_roof 4in( )⋅ 38 lbf= en_R_CR 0.002=
∆R_CR5 νR_roof⋅ W3
⋅
8 ER⋅ AR⋅ L⋅
νR_roof W⋅
4 G⋅ tR⋅+ 0.188 W⋅ en_R_CR⋅+
⎛⎜⎜⎝
⎞
⎠:= ∆R_CR 1.664 in=
Seismic Load: N/S Direction, Single PanelSeismic Weight
DLroof DLroof_CR:= DLroof 11.6 psf=
DLpanel DLpanel_CR:= DLpanel 11.1 psf=
Dimensions
L LCR:= Building dimension parallel to EQ
W WCR:= Building dimension perpendicular to EQ
lpanel lpanel_CR_NS:= Panel length(s)
lpanel_tot
j
lpanel_CR_NSjNumpanel_CR_NSj⋅⎛
⎝⎞⎠∑:= lpanel_tot 160 ft=
l'panel_tot
i
lpanel_CR_EWiNumpanel_CR_EWi⋅⎛
⎝⎞⎠∑:=

275
VCR_NSj
10151 lbf
=VCR_NSjVroof Vwalls+( ) 1.1⋅ RRj( )⋅:=
RRj0.5
=RRj
kpanel_CR_NSj
j
kpanel_CR_NSjNumpanel_CR_NSj⋅⎛
⎝⎞⎠∑
:=
Diaphragm "Rigid"=
∆R_CR∆CR_NS
1.386=Diaphragm "Flexible"∆R_CR∆CR_NS
2.0≥if
"Rigid" otherwise
:=
∆CR_NS 1.2 in=∆P_CR_NSj
2.705 in
=kpanel_CR_NSj
7690lbfin
=
∆CR_NSVroof Vwalls+
j
kpanel_CR_NSjNumpanel_CR_NSj⋅⎛
⎝⎞⎠∑
:=
kpanel_CR_NSj
νj
lpanel_CR_NSj⋅
∆P_CR_NSj
:=
∆P_CR_NSj
8 νj
⋅ hn3
⋅
EP AP⋅ lpanel_CR_NSj⋅
νj
hn⋅
G tP⋅+ 0.75 hn⋅ en_P_CRj
⋅⎛⎝
⎞⎠
+hn
lpanel_CR_NSj
da⋅+:=
en_P_CRj
0.0324
=
en_P_CRjen ν
j6in( )⋅⎡
⎣⎤⎦
en_8d,⎡⎣
⎤⎦
:=νj
260plf:=lpanel_CR_NSj
80 ft
=
tP 0.5in:=
Wall Panel Stiffness

276
νroofj
VCR_NSj
lpanel_CR_NSj
:= νroofj
127 plf
=
νwall DLpanel hn⋅ Coef⋅:= νwall 16 plf=
Design Shear (Allowable Stress Level)
Eroof ρνR_roof
1.4⋅ Ev+:= Eroof 82 plf=
Ewalljρ
νroofjνwall+( )
1.4⋅ Ev+:= Ewallj
102 plf
=
Demand / Capacity Ratios
DCRCR_R_NSEroof
CapacityR:= DCRCR_P_NSj
Ewallj
CapacityP:=
DCRCR_R_NS 0.194= DCRCR_P_NSj
0.393
=

277
en_P_CRj
0.0132
=
en_P_CRjen ν
j6in( )⋅⎡
⎣⎤⎦
en_8d,⎡⎣
⎤⎦
:=νj
150plf:=lpanel_CR_NSj
80 ft
=
tP 1.0in:=
Wall Panel Stiffness
∆R_CR 2.219 in=∆R_CR5 νR_roof⋅ W3
⋅
8 ER⋅ AR⋅ L⋅
νR_roof W⋅
4 G⋅ tR⋅+ 0.188 W⋅ en_R_CR⋅+
⎛⎜⎜⎝
⎞
⎠:=
en_R_CR 0.0037=νR_roof 4in( )⋅ 46 lbf=
en_R_CR en νR_roof 4in( )⋅⎡⎣ ⎤⎦ en_10d,⎡⎣ ⎤⎦:=
tR 1.50in:=νR_roof 137 plf=
Diaphragm Deflection
Vwalls 1.471 kip=Vroof 20.397 kip=
νR_roof 136.678 plf=νR_roofVroof Vwalls+
2 L⋅:=
Vwalls l'panel_tot DLpanel⋅ 2 W⋅ l'panel_tot−( ) DLwall⋅+⎡⎣ ⎤⎦hn
2
⎛⎜⎝
⎞
⎠⋅ Coef⋅:=
Vroof DLroof( ) L 20 ft⋅+( )⋅ W⋅ Coef⋅:=
Diaphragm Shear to Top of Wall
DLpanel 12.6 psf=DLpanel DLpanel2_CR:=
DLroof 13.9 psf=DLroof DLroof2_CR:=
Seismic Weight
Seismic Load: N/S Direction, Double Panel

278
νwall 19 plf=νwall DLpanel hn⋅ Coef⋅:=
νroofj
150 plf
=νroofj
VCR_NSj
lpanel_CR_NSj
:=
VCR_NSj
12028 lbf
=VCR_NSjVroof Vwalls+( ) 1.1⋅ RRj( )⋅:=
RRj0.5
=RRj
kpanel_CR_NSj
j
kpanel_CR_NSjNumpanel_CR_NSj⋅⎛
⎝⎞⎠∑
:=
Diaphragm "Flexible"=
∆R_CR∆CR_NS
2.203=Diaphragm "Flexible"∆R_CR∆CR_NS
2.0≥if
"Rigid" otherwise
:=
∆CR_NS 1.007 in=∆P_CR_NSj
1.105 in
=kpanel_CR_NSj
10856lbfin
=
∆CR_NSVroof Vwalls+
j
kpanel_CR_NSjNumpanel_CR_NSj⋅⎛
⎝⎞⎠∑
:=
kpanel_CR_NSj
νj
lpanel_CR_NSj⋅
∆P_CR_NSj
:=
∆P_CR_NSj
8 νj
⋅ hn3
⋅
EP AP⋅ lpanel_CR_NSj⋅
νj
hn⋅
G tP⋅+ 0.75 hn⋅ en_P_CRj
⋅⎛⎝
⎞⎠
+hn
lpanel_CR_NSj
da⋅+:=

279
Design Shear (Allowable Stress Level)
Eroof ρνR_roof
1.4⋅ Ev+:= Eroof 98 plf=
Ewall ρνroof νwall+( )
1.4⋅ Ev+:= Ewallj
121 plf
=
Demand / Capacity Ratios
DCRCR_R2_NSEroof
2 CapacityR⋅:= DCRCR_P2_NSj
Ewallj
2 CapacityP⋅:=
DCRCR_R2_NS 0.115= DCRCR_P2_NSj
0.232
=
Note: because there are no openings, a RIGID and FLEXIBLE diaphragm assumption result in thesame shear wall forces.

280
Building dimension parallel to EQ
W LGYM:= Building dimension perpendicular to EQ
lpanel lpanel_GYM_EW:= Panel length(s)
lpanel_tot
k
lpanel_GYM_EWkNumpanel_GYM_EWk⋅⎛
⎝⎞⎠∑:= lpanel_tot 148 ft=
l'panel_tot
l
lpanel_GYM_NSlNumpanel_GYM_NSl⋅⎛
⎝⎞⎠∑:= l'panel_tot 163 ft=
Diaphragm Shear to Top of Wall
Vroof DLroof( ) L⋅ W⋅ Coef⋅:=
Vwalls l'panel_tot DLpanel⋅ 2 W⋅ l'panel_tot−( ) DLwall⋅+⎡⎣ ⎤⎦hn
2
⎛⎜⎝
⎞
⎠⋅ Coef⋅:=
νR_roofVroof Vwalls+
2 L⋅:= νR_roof 129.843 plf=
Vroof 25.569 kip= Vwalls 4.555 kip=
GymnasiumSeismic Inputs
Coef V IGYM T hn_GYM( ),( ):= Coef 0.205=
Seismic Load: E/W Direction, Single PanelSeismic Weight
DLroof DLroof_GYM:= DLroof 11.2 psf=
DLpanel DLpanel_GYM:= DLpanel 11.1 psf=
DLwall DLwall_GYM:= DLwall 9.6psf=
hn hn_GYM:= hn 21.333 ft=
Dimensions
L WGYM:=

281
∆GYM_EWVroof Vwalls+
k
kpanel_GYM_EWkNumpanel_GYM_EWk⋅⎛
⎝⎞⎠∑
:=
kpanel_GYM_EWk
νk
lpanel_GYM_EWk⋅
∆P_GYM_EWk
:=
∆P_GYM_EWk
8 νk
⋅ hn3
⋅
EP AP⋅ lpanel_GYM_EWk⋅
νk
hn⋅
G tP⋅+ 0.75 hn⋅ en_P_GYMk
⋅⎛⎝
⎞⎠
+
hn
lpanel_GYM_EWk
da⋅+
...:=
en_P_GYMk
0.02230.0231
0.0249
0.025
0.0253
0.027
=
en_P_GYMken ν
k6in( )⋅⎡
⎣⎤⎦
en_8d,⎡⎣
⎤⎦
:=ν
k
205plf210plf222plf223plf225plf236plf
:= lpanel_GYM_EWk
1416
23
24
26
45
ft
=
tP 0.5in:=
Wall Panel Stiffness
∆R_GYM 1.889 in=∆R_GYM5 νR_roof⋅ W3
⋅
8 ER⋅ AR⋅ L⋅
νR_roof W⋅
4 G⋅ tR⋅+ 0.188 W⋅ en_R_GYM⋅+
⎛⎜⎜⎝
⎞
⎠:=
en_R_GYM 0.0032=νR_roof 4in( )⋅ 43 lbf=
en_R_GYM en νR_roof 4in( )⋅⎡⎣ ⎤⎦ en_10d,⎡⎣ ⎤⎦:=
tR 0.625in:=νR_roof 130 plf=
Diaphragm Deflection

282
kpanel_GYM_EWk
515601
902
946
1032
1859
lbfin
=∆P_GYM_EWk
5.5755.595
5.66
5.66
5.667
5.714
in
= ∆GYM_EW 5.146 in=
Diaphragm "Flexible"∆R_GYM∆GYM_EW
2.0≥if
"Rigid" otherwise
:=∆R_GYM∆GYM_EW
0.367=
Diaphragm "Rigid"=
RRk
kpanel_GYM_EWk
k
kpanel_GYM_EWkNumpanel_GYM_EWk⋅⎛
⎝⎞⎠∑
:=
VGYM_EWkVroof Vwalls+( ) 1.1⋅ RRk( )⋅:=
νroofk
VGYM_EWk
lpanel_GYM_EWk
:=
νwall DLpanel hn⋅ Coef⋅:=
VGYM_EWk
29143399
5106
5352
5843
10521
lbf
= νroofk
208212
222
223
225
234
plf
= νwall 48 plf=RRk0.0880.103
0.154
0.162
0.176
0.318
=

283
Design Shear (Allowable Stress Level)
Eroof ρνR_roof
1.4⋅ Ev+:= Eroof 93 plf=
Ewall ρνroof νwall+( )
1.4⋅ Ev+:= Ewallk
183186
193
194
195
202
plf
=
Demand / Capacity Ratios
DCRGYM_R_EWEroof
CapacityR:= DCRGYM_P_EW
Ewall
CapacityP:=
DCRGYM_R_EW 0.218= DCRGYM_P_EWk
0.7050.717
0.743
0.746
0.75
0.775
=

284
∆R_GYM 2.407 in=∆R_GYM5 νR_roof⋅ W3
⋅
8 ER⋅ AR⋅ L⋅
νR_roof W⋅
4 G⋅ tR⋅+ 0.188 W⋅ en_R_GYM⋅+
⎛⎜⎜⎝
⎞
⎠:=
en_R_GYM 0.0048=νR_roof 4in( )⋅ 50 lbf=
en_R_GYM en νR_roof 4in( )⋅⎡⎣ ⎤⎦ en_10d,⎡⎣ ⎤⎦:=
tR 1.25in:=νR_roof 151 plf=
Diaphragm Deflection
Vwalls 5.088 kip=Vroof 29.839 kip=
νR_roof 150.551 plf=νR_roofVroof Vwalls+
2 L⋅:=
Vwalls l'panel_tot DLpanel⋅ 2 W⋅ l'panel_tot−( ) DLwall⋅+⎡⎣ ⎤⎦hn
2
⎛⎜⎝
⎞
⎠⋅ Coef⋅:=
Vroof DLroof( ) L⋅ W⋅ Coef⋅:=
Diaphragm Shear to Top of Wall
DLpanel 12.6 psf=DLpanel DLpanel2_GYM:=
DLroof 13.1 psf=DLroof DLroof2_GYM:=
Seismic Weight
Seismic Load: E/W Direction, Double Panel

285
Wall Panel Stiffness
tP 1.0in:=
lpanel_GYM_EWk
1416
23
24
26
45
ft
=νk
245plf249plf258plf259plf261plf269plf
:=en_P_GYMk
en νk
6in( )⋅⎡⎣
⎤⎦
en_8d,⎡⎣
⎤⎦
:=
en_P_GYMk
0.02880.0298
0.0319
0.0322
0.0326
0.0346
=
∆P_GYM_EWk
8 νk
⋅ hn3
⋅
EP AP⋅ lpanel_GYM_EWk⋅
νk
hn⋅
G tP⋅+ 0.75 hn⋅ en_P_GYMk
⋅⎛⎝
⎞⎠
+
hn
lpanel_GYM_EWk
da⋅+
...:=
kpanel_GYM_EWk
νk
lpanel_GYM_EWk⋅
∆P_GYM_EWk
:=
∆GYM_EWVroof Vwalls+
k
kpanel_GYM_EWkNumpanel_GYM_EWk⋅⎛
⎝⎞⎠∑
:=
kpanel_GYM_EWk
492569
839
877
953
1689
lbfin
=∆P_GYM_EWk
6.9767.005
7.075
7.087
7.12
7.169
in
= ∆GYM_EW 6.447 in=

286
Diaphragm "Flexible"∆R_GYM∆GYM_EW
2.0≥if
"Rigid" otherwise
:=∆R_GYM∆GYM_EW
0.373=
Diaphragm "Rigid"=
RRk
kpanel_GYM_EWk
k
kpanel_GYM_EWkNumpanel_GYM_EWk⋅⎛
⎝⎞⎠∑
:=
VGYM_EWkVroof Vwalls+( ) 1.1⋅ RRk( )⋅:=
νroofk
VGYM_EWk
lpanel_GYM_EWk
:=
νwall DLpanel hn⋅ Coef⋅:=
VGYM_EWk
34874033
5948
6220
6759
11974
lbf
= νroofk
249252
259
259
260
266
plf
= νwall 55 plf=RRk0.0910.105
0.155
0.162
0.176
0.312
=

287
Design Shear (Allowable Stress Level)
Eroof ρνR_roof
1.4⋅ Ev+:= Eroof 108 plf=
Ewall ρνroof νwall+( )
1.4⋅ Ev+:= Ewallk
217219
224
224
225
229
plf
=
Demand / Capacity Ratios
DCRGYM_R2_EWEroof
2 CapacityR⋅:= DCRGYM_P2_EW
Ewall
2 CapacityP⋅:=
DCRGYM_R2_EW 0.127= DCRGYM_P2_EWk
0.4180.422
0.431
0.432
0.433
0.441
=

288
Vwalls 5.344 kip=Vroof 25.569 kip=
νR_roof 161.001plf=νR_roofVroof Vwalls+
2 L⋅:=
Vwalls l'panel_tot DLpanel⋅ 2 W⋅ l'panel_tot−( ) DLwall⋅+⎡⎣ ⎤⎦hn
2
⎛⎜⎝
⎞
⎠⋅ Coef⋅:=
Vroof DLroof( ) L⋅ W⋅ Coef⋅:=
Diaphragm Shear to Top of Wall
l'panel_tot 148 ft=l'panel_tot
k
lpanel_GYM_EWkNumpanel_GYM_EWk⋅⎛
⎝⎞⎠∑:=
lpanel_tot 163 ft=lpanel_tot
l
lpanel_GYM_NSlNumpanel_GYM_NSl⋅⎛
⎝⎞⎠∑:=
Panel length(s)lpanel lpanel_GYM_NS:=
Building dimension perpendicular to EQW WGYM:=
Building dimension parallel to EQL LGYM:=
Dimensions
DLpanel 11.1 psf=DLpanel DLpanel_GYM:=
DLroof 11.2 psf=DLroof DLroof_GYM:=
Seismic Weight
Seismic Load: N/S Direction, Single Panel

289
∆GYM_NSVroof Vwalls+
l
kpanel_GYM_NSlNumpanel_GYM_NSl⋅⎛
⎝⎞⎠∑
:=
kpanel_GYM_NSl
νl
lpanel_GYM_NSl⋅
∆P_GYM_NSl
:=
∆P_GYM_NSl
8 νl
⋅ hn3
⋅
EP AP⋅ lpanel_GYM_NSl⋅
νl
hn⋅
G tP⋅+ 0.75 hn⋅ en_P_GYMl
⋅⎛⎝
⎞⎠
+
hn
lpanel_GYM_NSl
da⋅+
...:=
en_P_GYMl
0.01710.018
0.0198
0.0216
0.0222
0.0241
0.025
=
en_P_GYMlen ν
l6in( )⋅⎡
⎣⎤⎦
en_8d,⎡⎣
⎤⎦
:=ν
l
175plf180plf190plf200plf204plf217plf223plf
:= lpanel_GYM_NSl
910
13
18
21
37
55
ft
=
tP 0.5in:=
Wall Panel Stiffness
∆R_GYM 4.592 in=∆R_GYM5 νR_roof⋅ W3
⋅
8 ER⋅ AR⋅ L⋅
νR_roof W⋅
4 G⋅ tR⋅+ 0.188 W⋅ en_R_GYM⋅+
⎛⎜⎜⎝
⎞
⎠:=
en_R_GYM 0.0057=νR_roof 4in( )⋅ 54 lbf=
en_R_GYM en νR_roof 4in( )⋅⎡⎣ ⎤⎦ en_10d,⎡⎣ ⎤⎦:=
tR 0.625in:=νR_roof 161 plf=
Diaphragm Deflection

290
kpanel_GYM_NSl
317358
485
700
832
1541
2340
lbfin
=∆P_GYM_NSl
4.9765.026
5.088
5.145
5.147
5.211
5.24
in
= ∆GYM_NS 4.703 in=
Diaphragm "Flexible"∆R_GYM∆GYM_NS
2.0≥if
"Rigid" otherwise
:=∆R_GYM∆GYM_NS
0.976=
Diaphragm "Rigid"=
RRl
kpanel_GYM_NSl
l
kpanel_GYM_NSlNumpanel_GYM_NSl⋅⎛
⎝⎞⎠∑
:=
VGYM_NSlVroof Vwalls+( ) 1.1⋅ RRl( )⋅:=
νroofl
VGYM_NSl
lpanel_GYM_NSl
:=
νwall DLpanel hn⋅ Coef⋅:=
VGYM_NSl
16371853
2511
3619
4306
7970
12107
lbf
= νroofl
182185
193
201
205
215
220
plf
= νwall 48 plf=RRl0.0480.054
0.074
0.106
0.127
0.234
0.356
=

291
Design Shear (Allowable Stress Level)
Eroof ρνR_roof
1.4⋅ Ev+:= Eroof 115 plf=
Ewall ρνroof νwall+( )
1.4⋅ Ev+:= Ewalll
165167
173
178
181
188
192
plf
=
Demand / Capacity Ratios
DCRGYM_R_NSEroof
CapacityR:= DCRGYM_P_NS
Ewall
CapacityP:=
DCRGYM_R_NS 0.271= DCRGYM_P_NSl
0.6330.642
0.664
0.685
0.696
0.725
0.738
=

292
∆R_GYM 5.54 in=∆R_GYM5 νR_roof⋅ W3
⋅
8 ER⋅ AR⋅ L⋅
νR_roof W⋅
4 G⋅ tR⋅+ 0.188 W⋅ en_R_GYM⋅+
⎛⎜⎜⎝
⎞
⎠:=
en_R_GYM 0.0077=νR_roof 4in( )⋅ 62 lbf=
en_R_GYM en νR_roof 4in( )⋅⎡⎣ ⎤⎦ en_10d,⎡⎣ ⎤⎦:=
tR 1.25in:=νR_roof 186 plf=
Diaphragm Deflection
Vwalls 5.828 kip=Vroof 29.839 kip=
νR_roof 185.768 plf=νR_roofVroof Vwalls+
2 L⋅:=
Vwalls l'panel_tot DLpanel⋅ 2 W⋅ l'panel_tot−( ) DLwall⋅+⎡⎣ ⎤⎦hn
2
⎛⎜⎝
⎞
⎠⋅ Coef⋅:=
Vroof DLroof( ) L⋅ W⋅ Coef⋅:=
Diaphragm Shear to Top of Wall
DLpanel 12.6 psf=DLpanel DLpanel2_GYM:=
DLroof 13.1 psf=DLroof DLroof2_GYM:=
Seismic Weight
Seismic Load: N/S Direction, Double Panel

293
Wall Panel Stiffness
tP 1.0in:=
lpanel_GYM_NSl
910
13
18
21
37
55
ft
=νl
202plf208plf221plf235plf240plf250plf254plf
:=en_P_GYMl
en νl
6in( )⋅⎡⎣
⎤⎦
en_8d,⎡⎣
⎤⎦
:=
en_P_GYMl
0.02190.0228
0.0247
0.0268
0.0276
0.03
0.031
=
∆P_GYM_NSl
8 νl
⋅ hn3
⋅
EP AP⋅ lpanel_GYM_NSl⋅
νl
hn⋅
G tP⋅+ 0.75 hn⋅ en_P_GYMl
⋅⎛⎝
⎞⎠
+
hn
lpanel_GYM_NSl
da⋅+
...:=
kpanel_GYM_NSl
νl
lpanel_GYM_NSl⋅
∆P_GYM_NSl
:=
∆GYM_NSVroof Vwalls+
l
kpanel_GYM_NSlNumpanel_GYM_NSl⋅⎛
⎝⎞⎠∑
:=

294
kpanel_GYM_NSl
299340
466
677
805
1456
2193
lbfin
=∆P_GYM_NSl
6.0756.109
6.169
6.251
6.265
6.354
6.369
in
= ∆GYM_NS 5.72 in=
Diaphragm "Flexible"∆R_GYM∆GYM_NS
2.0≥if
"Rigid" otherwise
:=∆R_GYM∆GYM_NS
0.969=
Diaphragm "Rigid"=
RRl
kpanel_GYM_NSl
l
kpanel_GYM_NSlNumpanel_GYM_NSl⋅⎛
⎝⎞⎠∑
:=
VGYM_NSlVroof Vwalls+( ) 1.1⋅ RRl( )⋅:=
νroofl
VGYM_NSl
lpanel_GYM_NSl
:=
νwall DLpanel hn⋅ Coef⋅:=
VGYM_NSl
18832142
2930
4257
5062
9159
13800
lbf
= νroofl
209214
225
237
241
248
251
plf
= νwall 55 plf=RRl0.0480.055
0.075
0.109
0.129
0.233
0.352
=

295
Design Shear (Allowable Stress Level)
Eroof ρνR_roof
1.4⋅ Ev+:= Eroof 133 plf=
Ewall ρνroof νwall+( )
1.4⋅ Ev+:= Ewalll
189192
200
208
211
216
218
plf
=
Demand / Capacity Ratios
DCRGYM_R2_NSEroof
2 CapacityR⋅:= DCRGYM_P2_NS
Ewall
2 CapacityP⋅:=
DCRGYM_R2_NS 0.156= DCRGYM_P2_NSl
0.3630.37
0.385
0.4
0.407
0.416
0.42
=
Data Output

296
APPENDIX F: EXAMPLES OF MIDAS MODEL INPUT/OUTPUT
MIDAS SOFTWARE
The finite element software used for the various analyses is MIDAS/Gen
v5.8.1, developed by MIDAS Information Technology Co., Ltd. The software is
a commercially-available structural analysis and design program.
WALL STIFFNESS TEST MODELS
The models are comprised of nine rows of 1 ft. x 1 ft. x 0.5 in. plate elements.
Nodes at the base of the wall are fixed against rotation and translation in all
directions. The diaphragm shear load is applied along the nodes at the top of
the wall. The Poisson’s ratio is equal to 0.4 (Bodig and Jayne 1993).
For the length of wall being modeled, the material stiffness “E” is modified
until the deflection at the top corner of the wall is equal to (or slightly less
than) the calculated deflection in the calculations. The wall length is then
modified by adding or removing a column of elements and verifying the
applied loads. For each length of wall the appropriate “E” value is noted.
Models, inputs and outputs were generated in 1 ft. increments from for
classroom wall segments from 4 ft. to 25 ft. long in 1 ft. increments. For the
gymnasium structure wall segments from 8 ft. to 50 ft. long in 2 ft. increments
were modeled. The graphics, inputs and outputs included in this appendix
pertain to a 4 ft.-long segment of a classroom wall. The model files are
included on the CD that accompanies this report.
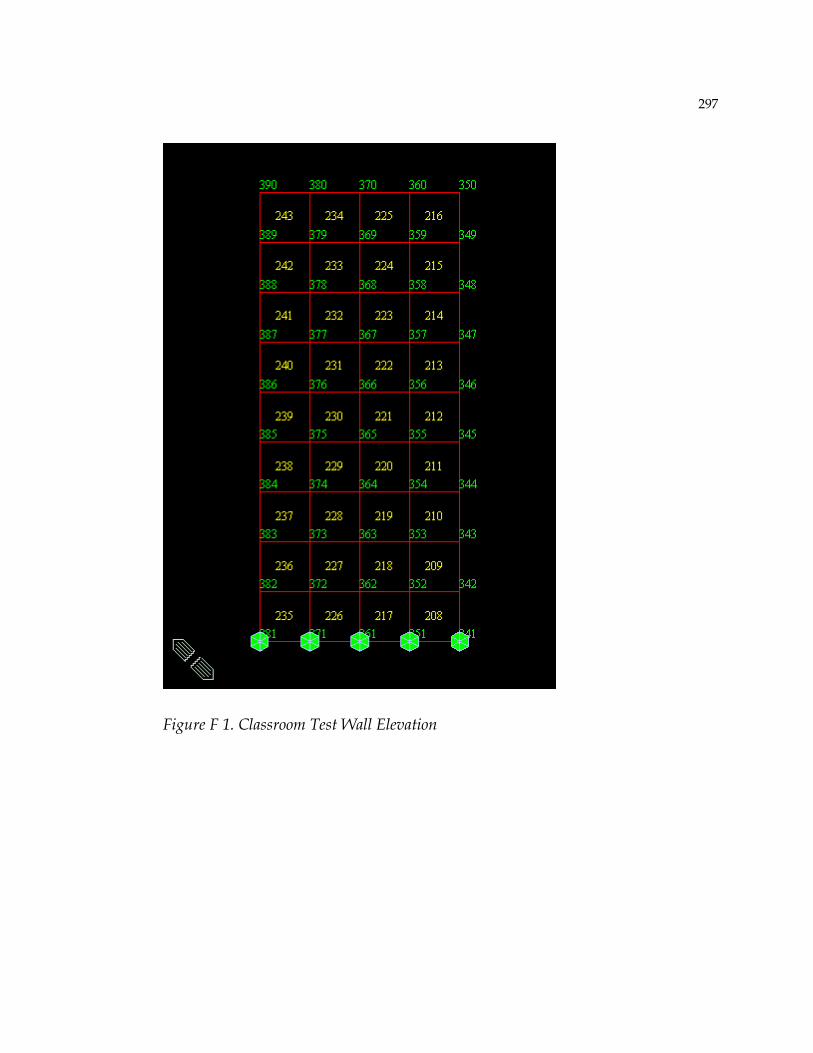
297
Figure F 1. Classroom Test Wall Elevation

298
Figure F 2. Classroom Test Wall Applied Loads (lbf.)

299
Figure F 3. Classroom Test Wall Displacement (inches)

300
ROOF DIAPHRAGM STIFFNESS TEST MODELS
The models are comprised of 1 ft. x 1 ft. plate elements, with the thickness
matching the existing plywood thickness for each structure. For a given
direction of loading, half of the diaphragm is modeled. A line of symmetry at
the center of the diaphragm, in the direction of load, is used as a boundary.
The nodes at the edge supported on a wall line are restrained against
translation. The nodes at the diaphragm centerline are restrained against
rotation about the “upward” axis, perpendicular to the plane of the model.
The calculated diaphragm load is applied along the diaphragm center nodes.
Poisson’s ratio is equal to 0.4 (Bodig and Jayne 1993).
The material stiffness “E” is modified until the maximum model deflection is
equal to (or slightly less than) the calculated deflection in the calculations. A
similar model is constructed for the same diaphragm loaded in the orthogonal
lateral direction. The average of the resulting “E” values is used for the
material stiffness in the structure models.
The graphics, inputs and outputs included in this appendix pertain to the
classroom roof diaphragm loaded in the East direction. The width in the “Y”
direction is equal to 40 ft., or half of the actual 80 ft. width. The length in the
“X” direction is equal to 90 ft. The model files for the diaphragms are included
on the CD that accompanies this report.

301
Figure F 4. Classroom Test Roof Plan
Figure F 5. Classroom Test Roof Applied Loads

302
Figure F 6. Classroom Test Roof Displacement (in.)

303
STRUCTURE MODELS
The models are comprised of 1 ft. x 1 ft. plate elements, except the top row of
the gymnasium walls which are 1 ft. x 1ft. 4 in. plate elements. The nodes at
the base of the walls are fixed against translation and rotation. Openings in the
walls approximate the locations and sizes of the openings in the actual Hoover
School classroom and gymnasium structures. The thickness of the elements
depends on the wall or roof diaphragm being modeled:
• Existing walls = 1 in. thick
• Walls with 1 layer of plywood sheathing = 0.5 in. thick
• Walls with 2 layers of plywood sheathing = 1 in. thick
• Existing roof elements = plywood thickness from the construction
documents
• Roof elements with additional plywood layer = 2 x the thickness used for
existing roof elements.
The material “E” stiffness derived in the wall test models is applied for the
length of modeled shear wall (distance between wall openings). The roof
element stiffness value is the average value derived from the roof stiffness
models. The “E” value for existing walls which are not rehabilitated is set to
zero. Poisson’s ratio is equal to 0.4 (Bodig and Jayne 1993).
The weight density for each element type is calculated as the total weight of
the wall or roof assembly, divided by the thickness noted above. This weight
density is input for each element type. The applied load is a multiple of the
structure’s self weight, activated in the lateral direction. The multiple is equal
to the calculated seismic shear coefficient, Coef.

304
The roof diaphragm shear is taken as the maximum value of Fxy (in-plane
element shear) for the roof diaphragm elements only. The wall shear is taken
as the maximum reaction at the base of each length of shear wall. Because the
walls are modeled as one-foot elements, the reaction is equal to the “pounds
per foot” in-plane shear of the wall.
The graphics, inputs and outputs included in this appendix pertain to a
classroom model loaded in the East direction, and wall reactions show 10 ft.-
long walls. Separate models are used for each structure, for each load level
(BSE-1 and BSE-2), and for the case where additional sheathing is applied. All
model files are included on the CD that accompanies this report.
Figure F 7. Classroom Model
Figure F 8. Model Lateral Load Coefficient, East (SX) Direction

305
Figure F 9. Model Roof Shear, East Direction (lbf/ft)

306
Figure F 10. Model Wall Reactions, 10 ft. walls (lbf.)
