an abstract of the thesis of jose luis maya de leon for
TRANSCRIPT

AN ABSTRACT OF THE THESIS OF
JOSE LUIS MAYA DE LEON for the DOCTOR OF PHILOSOPHY(Name) (Degree)
in Agronomic Crop Science presented on(Major Department)
Title: COMBINING ABILITY AND ASSOCIATION OF AGRONOMIC
TRAITS INVOLVING THREE SOURCES OF DWARFISM IN
WHEAT (TRITICUM AESTIVUM, L. EM THELL.)
Redacted for privacyWarren E. ronstad
Abstract approved:
Three genetically different dwarf cultivars of spring wheat were
evaluated as potential sources of short stature to use in a wheat im-
provement program. The study involved a five parent diallel cross
which included a semidwarf, a standard height and three dwarf culti-
vars. The genetic sources of dwarfism included a Norma 10 derivative
named Vicam 71, a derived line from Tom Thumb called Tordo, and
Olesen dwarf. Experimental material consisted of parental lines,
F l' F 2, and both backcrosses to the parents space planted in a
randomized block design. The agronomic characters measured on
an individual plant basis were: (1) plant height, (2) days to heading,
(3) number of tillers, (4) number of spikelets per spike, (5) head
length, (6) days to maturity, (7) grain yield, (8) harvest index, (9)
kernel weight, (10) number of kernels per spikelet, (11) rachis
internode length, (12) grain filling period and, (13) head grain weight.

Estimates of gene action were determined by heterosis, heterobelti-
osis, broad and narrow sense heritabilities and combining ability
analyses. Associations among traits were estimated by phenotypic,
environmental, and genotypic correlations as well as path-coefficient
analysis for grain yield and eight of the variables.
There were significant differences among the parental lines,
their crosses, and generations for all traits measured. Either
partial dominance for tallness or no dominance was manifested for
those crosses involving the dwarf cultivars Vicam 71 and Olesen.
Tordo, when crossed to taller wheats showed dominance for short
stature. All three genetic sources of dwarfism and their resulting
progenies manifested desirable agronomic characteristics. Vicam
71 was a good parent in terms of grain yield and number of tillers
per plant. Tordo was the best source for increasing the number of
spikelets per spike, kernel weight and head grain weight. Olesen
was a good progenitor for increasing number of kernels per spikelet.
All three dwarf cultivars displayed some advantage(s) over the other
two and all could be used to breed short statured wheats with a
possibility of success. Plant height did not appear to have a direct
effect on plant grain yield in any of the 10 crosses.
With the exception of number of tillers per plant and grain
yield, a major proportion of the phenotypic variability observed for
all characters studied was due to genetic factors. A large portion of

the total genetic variability associated with days to heading, maturity,
height, rachis internode, spikelet number, kernels per spikelet,
kernel weight, and harvest index was mainly a result of additive gene
action. Both additive and non-additive genetic effects were involved
in the expression of grain filling period and head weight. The non-
additive portion of the genetic variance associated with tiller number
and grain yield per plant was relatively large when compared with the
additive portion. Therefore, selection for increased expression of
tillers and yield should be delayed until the F4 or later generations
where a large degree of homozygosity has been obtained.
The genetic correlations for individual crosses indicated that
only a few of the traits studied were associated in the same manner
in most or all the 10 hybridizations. High positive genetic correla-
tions were found between plant grain yield vs tiller number and ker-
nels per spikelet, tiller number vs days to maturity, kernels per
spikelet vs head grain weight, plant height vs head weight, and head
length vs rachis internode length. High negative genetic correlations
were found between kernel weight vs days to maturity, plant height
vs harvest index, and days to heading vs grain filling period. Most
correlations among agronomic traits were different in value and/or
sign from one cross to another suggesting different gene associations
in the parental cultivars. Genetic correlations between components
of yield showed this type of inconsistency. Therefore, grain yield

could be increased by a combined increase of more than one com-
ponent of yield without compensatory oscillation among them because
tiller number, spikelet number, kernels per spikelet and kernel
weight were often not correlated between one another and sometimes
were positively correlated. Path-coefficients analysis indicated that
number of tiller per plant had a high direct effect on grain yield in
all crosses. With the exception of two crosses, indirect effects of
this trait were negligible. In the latter two crosses tiller number had
a high negative indirect effect on plant grain yield via head grain
weight. Kernels per spikelet and kernel weight had no direct effects
on grain yield but their indirect effects via head weight were positive
and significant.
Large amounts of additive gene action were observed in the
expression of plant height. This trait was also highly negatively
correlated with harvest index; therefore, phenotypic selection for
restricted plant height would be useful in obtaining lines with high
grain to straw ratios.
In general, crosses that showed high specific combining ability
effects involved parents with low general combining ability. However,
there were some exceptions to this rule. Crosses of high x high and
high x low general combiners presented high specific combining
ability effects, suggesting that some additive gene action may be in-
volved in the superior performance of these combinations. Also the

F2
generation did not differ from the F in assessing general corn-
bining ability.
A wheat breeder should be aware of those genetic associations
between agronomic traits that could be used to select superior culti-
vars. However, the genetic correlations in this study suggested that
each cross represented a different set of gene associations depending
upon the parents involved. If some progress is to be made in using
the genetic variability available in the crop, the breeder should not
try to select exactly the same type of plant from every cross. Every
hybridization is potentially a source of better lines if they are well
planned and the reasons they were made are remembered during
selection. It is very important to realize what are the contributions
of each parental line in a cross and what are the most important trait
associations present in each parent. Superior genotypes could be
selected on this basis while preserving the natural genetic variability
existing in the crop.
Combining Ability and Associations of Agronomic TraitsInvolving Three Sources of Dwarfism in Wheat
(Triticum aestivum, L. em Thell)
by
Jose Luis Maya de Leon
A THESIS
submitted to
Oregon State University
in partial fulfillment ofthe requirements for the
degree of
Doctor of Philosophy
June 1975

APPROVED:
Redacted for privacyProfessor of Agronomy
in charge of major
Redacted for privacyHead ofr Lepar`ment of Ag gnomic Crop Science
Redacted for privacy
Dean of Graduate School
Date thesis is presented
Typed by Susie Kozlik for JL2_s.eI2Lt...M..a.y..___c1_s_,_Ls...oa

ACKNOWLEDGEMENI S
Although words cannot express my appreciation, I wish to thank
my major professor, Dr. Warren E. Kronstad, whose guidance,
assistance and friendship have been so valuable during my course
work and the preparation of this thesis.
I want to extend my thanks to Dr. Mary L. Powelson for her
critical review of the manuscript. To all members of the cereal
breeding program from whom I received so much and gave back so
little, my grateful appreciation.
I sincerely thank Dr. W. H. Foote, Dr. R. V. Frakes, Dr.
R. J. Metzger, Dr. T. C. Moore, and Dr. R. L. Powelson for
serving on my graduate committee and reviewing the manuscript.
A special thanks is extended to Mr. P. G. Stanwood for his
assistance in the computation of some data and to Geri Kay Heinrich
for typing the rough draft of the thesis.
I am indebted to the Rockefeller Foundation for its financial
support during my study at Oregon State University.

WITH LOVE TO:
Raquel, my wifeFrancisco, my sonEmilio and Leonila, my parentsOlga and Marianela, my sisters

TABLE OF CONTENTS
INTRODUCTION
Pale
1
LITERATURE REVIEW 4
Semidwarf Wheats 4Association Among Agronomic Traits 10
Heritability 14
Combining Ability 19
MATERIALS AND METHODS 23
RESULTS AND DISCUSSION 31
SUMMARY AND CONCLUSIONS 98
BIBLIOGRAPHY 105
APPENDIX
Pedigree and Description of CultivarsSummary Table of Weather InformationSummary Table of Genetic Correlations
113115116

LIST OF TABLES
Table Page
1 Observed mean squares for twelve agronomic character-istics for parents, Fi's, F2ts, BC1Ts and BC2rs 32
2 Observed mean squares for harvest index for Fi's andparents 33
3 Means, Variances (Var.), Coefficients of Variation(C. V.), Broad Sense Heritabilities (Hbs), NarrowSense Heritabilities (Hns), number of observations (n),and degree of dominance (d) for plant height, in theten crosses studied and their parents 36
4 Heterosis as percentage of the midparent (MP) and higherparent (HP) for the thirteen characters studied in thediallel cross of five spring wheats
5 Heterosis as percentage of the midparent (MP) andhigher parent (HP) for the thirteen characters studiedin the diallel cross of five spring wheats
6 Heterosis as percentage of the midparent (MP) andhigher parent (HP) for the thirteen characters studiedin the diallel cross of five spring wheats
7 Means, Variances (Var.), Coefficients of Variation(C. V.), Broad Sense Heritability (Hbs), Narrow SenseHeritability (Hns), and number of observations (n) forHarvest Index, Days to Heading, Rachis InternodeLength, in the ten crosses studied and their parents
8 Means, Variances (Var.), Coefficients of Variation(C. V.), Broad Sense Heritability (Hbs), Narrow SenseHeritability (Hns), and number of observations (n) forNumber of Spike lets per Spike, Head Length, Days toMaturity in the ten crosses studied and their parents
41
42
43
50
51
Means, Variances (Var.), Coefficients of Variation(C.V.), Broad Sense Heritability (Hbs), Narrow SenseHeritability (Hns), and number of observations (n) forGrain Filling Period, Number of Kernels per Spike let,Kernel Weight in the ten crosses studied and their parents 52

Table P, age
10 Means, Variances (Var. ), Coefficients of Variation(C.V.), Broad Sense Heritability (fibs), Narrow SenseHeritability (Hns), and number of observations (n) forNumber_ f Tillers per Yield per plant, HeadWeight in the ten crosses studied and their parents
11 Phenotypic (rPh), environmental (rE), and genotypic(rG) correlations between all pairs of the thirteencharacters measured for the cross Sonora 64/Yaqui50
12 Phenotypic (rPh), environmental (rE), and genotypic(rG) correlations between all pairs of the thirteencharacters measured for the cross Sonora 64 /Olesen
13 Phenotypic (rPh), environmental (rE), and genotypic(rG) correlations between all pairs of the thirteencharacters measured for the cross Sonora 64/Tordo
14 Phenotypic (rPh), environmental (rE), and genotypic(rG) correlations between all pairs of the thirteencharacters measured for the cross Yaqui 50/01esen
15 Phenotypic (rPh), environmental (rE), and genotypic(rG) correlations between all pairs of the thirteencharacters measured for the cross Yaqui 50 /Tondo
53
59
60
61
62
63
16 Phenotypic (rPh), environmental (rE), and genotypic(rG) correlations between all pairs of the thirteencharacters measured for the cross Vicam 71/Sonora 64 64
17 Phenotypic (rPh), environmental (rE), and genotypic (rG)correlations between all pairs of the thirteen charac-ters measured for the cross Vicam 71/Yaqui 50
18 Phenotypic (rPh), environmental (rE), and genotypic(rG) correlations between all pairs of the thirteencharacters measured for the cross Vicam 71 /Olesen
19 Phenotypic (rPh), environmental (rE), and genotypic(rG) correlations between all pairs of the thirteencharacters measured for the cross Vicam 71/Tordo
65
66
67

Table Page
20 Phenotypic (rPh), environmental (rE), and genotypic(rG) correlations between all pairs of the thirteencharacters measured for the cross Tordo/Olesen
21 Path-coefficients analysis of grain yield per plant v,eight agronomic traits at the phenotypic level, usingreplication means of the F1, F2, BC1 and BC2 foreach cross
68
78
22 Path-coefficients analysis of grain yield per plant v. eightagronomic traits at the phenotypic level, using replica-tion means of the F1, F2, BC1 and BC2 for each cross 79
23 Observed mean squares for general combining ability(G.C.A.) and specific combining ability (S.C. A. ) forten of the characters studied in the F1 and F2generations
24 Components of variance for- general combining ability(G. C. A. ), specific combining ability (S. C. A. ),andratios of G. C. A. variances to S. C. A. variances forten agronomic traits measured in F1 and F2 genera-tions
$6
88
25 Estimates of general combining ability effects for tenvariables studied in the F1 and F2 generations 91
26 Estimates of specific combining ability effects in the F1and F2 generations for those traits that had specificcombining ability differences in the analysis of vari-ance 92

COMBINING ABILITY AND ASSOCIATIONS OF AGRONOMICTRAITS INVOLVING THREE SOURCES OF DWARFISM IN
WHEAT (TRITICUM AESTIVUM, L. EM THELL)
INTRODUCTION
Plant height is one of the most important agronomic traits in
wheat. The impact of the semidwarf growth habit to wheat produc-
tion is one of the major accomplishments in agriculture this century.
Just recently even shorter wheats, the so called t1triple dwarfs,"
have been released as commercial varieties in Mexico, India, and
Pakistan. These wheats may, allow better utilization of nitrogen
fertilizer and more efficient moisture management than the semi-
dwarf varieties first released to the farmer just a decade ago. Short
statured wheats have spread rather rapidly in irrigated and high rain-
fall areas in developed and lesser developed countries. By 1970, in
India alone, more than 10 million ha of wheat were planted with
semidwarf varieties, most of them sister selections of one cross
made in Mexico called 8156. Large areas of Bezostaya in the Soviet
Union and Eastern Europe, Scout in the central plains of the United
States, Blueboy in the southereastern part of the United States,
Gaines in the Pacific Northwest, plus a few other varieties in other
wheat producing countries of the world account for several additional
million ha of short straw wheats. All these varieties are Norin 10
derivaties. The widespread acceptance and use of semidwarf wheats

are both encouraging and dangerous. Their growth habit and required
management practices make them a target for foliar diseases. Be-
cause large areas are planted to one variety or a few varieties all
having a common genetic background, the genetic vulnerability of the
crop is greatly increased. The semidwarf habit of growth is here
to stay, but alternative genetic sources will have to be developed in
order to broaden the genetic basis of the wheat crop. Most of the
information on new sources of short statured wheats has been limited
to genetic studies on number of genes involved in the expression of
plant height and very often only one genetic source of dwarfism was
used. Genetic studies are a source of valuable information, but the
wheat breeder is also selecting for several other agronomic traits at
one time. Therefore, an understanding of the type of gene action
involved in the expression of the different agronomic traits under
consideration at selection time is very important. It is also essential
to know the genetic associations existing among these traits for a
successful utilization of the short stature growth habit from each of
the alternate genetic sources.
The objectives of the present study were: 1) to evaluate three
genetically different dwarf cultivars as potential sources of short
straw when crossed with a semidwarf and a tall standard variety;
2) to compare their dominant effects in the F1 and F2 generations;
3) to evaluate the type of gene action involved in the expression of
3
plant height and several other agronomic traits in the parental culti-
var and in the crosses from a five parent diallel; 4) to study genetic
and phenotypic correlations between several agronomic traits in each
of the three genetic sources for dwarfism; and 5) to assess the advan-
tages and disadvantages, if any, of the different sources of dwarfism
for a more efficient utilization in a wheat improvement program.

4
LITERATURE REVIEW
Semiclwarf Wheats
The term semidwarf wheat has been used to refer to the growth
habit of wheats derived from the Japanese variety Norin 10. These
wheat cultivars then become distinguishable from the grass dwarf
types reported in the literature as abnormal genotypes (Farrel, 1898;
Ficks and Qualset, 1973a). Norin 10, a Japanese variety, was re-
leased in 1935 from a selection of the cross Turkey Red x Fultz-
Daruma. Other sources of dwarfing wheats have been used but their
success has not been as dramatic as with Norin 10. Dwarf cultivars
available are: Seu Seun 27 and Suwon 92 from Korea (Reitz and
Salmon, 1968); several Italian varieties of the Strampelli series
which were derived from crosses between European varieties and
unknown Japanese cultivars with short culms (Borojevic, 1971); Tom
Thumb, a very short stiff-strawed wheat originally from Tibet; and
Olesen dwarf, a complex cross between Pitic "sib" with a dwarf
cultivar of unknown origin found in Rhodesia and with an additional
cross to a Mara derivative (CIMMYT, 1966-67 report).
The need for short strawed varieties which do not lodge under
high nitrogen fertilization and high soil moisture was stressed nearly
two decades ago (Vogel et al. , 1956; Borlaug, 1958). Vogel and co-
workers mentioned selections of Norin. 10 x Brevor crosses which

5
were 60 to 80 cm tall and under experimental conditions yielded
better than Brevor, a relatively short strawed variety of about 120
cm tall. They concluded that semidwarf growth habit represented an
excellent opportunity for the breeding of wheats better suited to
highly productive soils (Vogel et al., 1956).
The first semidwarf variety, a soft white winter wheat named
after the late Professor Gaines of Washington State University, was
released in 1961. This variety revolutionized wheat production in
the Western Region of the United States (Frey, 1970). Other breeding
programs were also interested in the potential of semidwarf wheats,
and as a result other commercial semidwarf wheat cultivars were
commercially released. In 1962 Pitic 62 and Penjamo 62, both
Norin 10 derivatives, were released in Mexico and subsequently
cultivated in many parts of the world. By 1968 there were about 6 to
7.5 million ha of several Norin 10 derivatives seeded as commercial
varieties around the world (Borlaug, 1968; Reitz and Salmon, 1968).
The initial success of the semidwarf varieties stimulated
breeders all over the world to incorporate this habit of growth into
their breeding programs. Several new semidwarf wheat varieties
were released as a consequence and one of the most outstanding was
the Russian variety Bezostaya. To date Bezostaya is the widest
grown winter wheat variety in the world. The genetic source of the
short stature trait in this variety was the Japanese cultivar

6
Yakogomugi (Lukyanenko, 1966). There were also reports that short
wheat cultivars outyielded the standard check varieties under irriga-
tion and under high rainfall conditions, but under dryland conditions
they produced less than or equalled the check varieties (Porter et al.
1964).
The association of other agronomic characteristics became
apparent with the incorporation of short culms into the new wheats.
These characteristics have been the subject of study by several
workers in order to establish criteria for selection. The most effi-
cient selection in terms of yield were combinations of high tillering
capacity, early spring recovery for fall planted wheat, high lodging
and shattering resistance, medium semidwarf plant height, medium
culm diameter and head size, and small to medium length and width
of leaf (Vogel et al. , 1963).
Superiority of yield in semidwarf varieties when compared with
tall standard varieties is due to more kernels per spikelet and more
spikelets per spike (Johnson et al. , 1966). Some semidwarf varieties
have a test weight as high as the tall varieties (McNeal et al. , 1960).
Synchronization of tillering in semidwarf wheat varieties may
account for the lower rate of mortality, in later formed tillers. In
the tall spring wheat variety NP 798, mortality in later formed tillers
was twice as great as in the semidwarf cultivar Sonora 63 (Singh et al. ,
1972).

In general, tall wheat varieties spend large amounts of nutri-
ents in stem development, while short varieties achieve a more
efficient distribution of assimilates between the grain and the straw
(Borojevic, 1971). As a result of this, short varieties produce more
spikes per plant, more kernels per spike, and more spikelets per
spike, and also have longer heads (Vick and Khera, 1972).
The genetics involving the inheritance of the short straw char-
acteristic in semidwarf wheats has received considerable attention.
The number of genetic factors governing the expression of plant
height in the Japanese variety Norin 10 is believed to be two major
independent genes (Allan et al. , 1968; Briggle and Vogel, 1968;
Bhatt, 1972), which behave as partially dominant for tallness (Romero
and Frey, 1973). The possibility of three factors being involved in
the inheritance of plant height in Norin 10 has also been proposed.
Two of this alleles have twice as much penetrance as the third allele,
and all three genes involved have a cumulative effect (Romero and
Frey, 1973).
Other genetic studies have shown that major genes for short
culm in Norin 10 derivatives are the same for those found in the
Korean varieties Suwon 92 and. Seu Seun 27; the two genes have been
identified as Sdi and Sd2. These two genes produce very similar
effects on the culm length phenotype when occurring singly. They are
positively associated with agronomic traits such as high kernel weight,

8
seedling vigor and yield; however, Sd1
seems to be better adapted to
a wide range of environmental conditions whereas Sd2
is adapted to
specific environmental or management conditions (Allan and Pritchett,
1973).
There are some indications that with Olesen dwarf, the mecha-
nism of inheritance of short stem is different from Norm 10; in
addition to the two major recessive genes contained in Norin 10,
Olesen dwarf also carries a partially dominant gene for shorter culm
length (Ficks and Qualset, 1973b). However, there is evidence that
two major genes, each partially dominant for short stem, are also
involved in the inheritance of plant height in the Olesen dwarf wheat
cultivar (Hoff 21p1. , 1973). Another hypothesis is that Olesen carries
two partially dominant genes for short straw length with one of the
genes exerting a greater effect in reducing plant height. The two
genes together have a cumulative effect (Anand and Aulakh, 1971).
In Tom Thumb, another dwarfing source, the genetic mecha-
nism may also be dominant in nature. The Fi's resulting of crosses
made between Tom Thumb and several Norin 10 derivatives have
been reported to be closer to the shorter parent in height, indicating
partial dominance (Plech, 1968). Using crosses between the aneu-
ploid series of two standard winter wheat varieties and Tom Thumb
the chromosome bearing the genetic mechanism for short culm length
has been identified as chromosome 4A. The gene present in Tom

9
Thumb showed the same expression for height in the heterozygous or
hemizygous condition which indicated that the genetic mechanism of
plant height was controlled by a single partially dominant height-
reducing gene (Morris et al. , 1972).
The suggested genetic mechanism involved in the inheritance of
the semidwarf growth habit coming from Norin 10 and its derivatives
is not consistent with respect to the number of genes involved. Four
main theories have been proposed to explain the inheritance of plant
height in semidwarf wheats: 1) one major gene and several minor
genes (Powel and Schlehuber, 1967 2) two major genes (Allan and
Vogel, 1963; 1964) with the possibility that minor modifying culm
length genes can affect the height of short selections (Allan et al. ,
1968); 3) three or more genes (Johnson, Schmidt and Mekasha, 1966);
and 4) three major genes with additive effects, one with a smaller
effect and the possibility of several minor genes (Romero and Frey,
1972).
Reduced plant height has been of tremendous importance in
increasing wheat yields. In short strawed varieties the problem of
lodging has been reduced, thus making possible the application of
high levels of nitrogen fertilizer (Athwal, 1971). In addition, semi-
dwarf wheats also have more fertile florets than the tall standard
varieties and as a consequence higher grain to straw ratios are ob-
tained; another reason for the high harvest index in semidwarf

10
varieties is a large number of kernels per head and more kernels per
spikelet (Donald, 1968). The larger number of kernels per head and
per spikelet may be attributed to the reduced competition by the stems
for carbohydrates during the ear primordia development (Wareing,
1970).
Association Among Agronomic Traits
The amount of variability for a given trait in segregating popu-
lations is not often completely available because the breeder is often
selecting for several important characteristics at one time. There-
fore, an understanding of interrelationships among various traits is
very important. Through the study of these relationships significant
associations may be found between highly heritable traits and eco-
nomically important ones that are of a complex nature, thus allowing
the breeder to practice indirect selection (Ghandi et al. , 1964).
Another reason for studying relationships between different traits is
to facilitate the interpretation of genetic analysis. It is desirable to
know the degree of association between different traits and if possible
to work with characters which are independent of each other at both
the environmental and genetic level (Whitehouse et al., 1958).
Due to the independent development of yield components, they
are used very often to explain the structure of economic grain yield
in wheat. Each component, i. e. number of spikes per plant, number

11
of kernels per spike, and kernel weight, or all of them together may
give an indication of grain yield potential which is a very complex
character (Baier and Robertson, 1967).
Simple correlations between several agronomic traits have been
calculated. Five out of fifteen possible simple correlations were
found to be significant: 1) kernels per spike were significantly corre-
lated with yield and negatively correlated with number of spikes; 2)
number of spikes was negatively correlated with earliness of flower-
ing; and 3) kernels per spike had a positive correlation with height
and earliness (Fonseca and Patterson, 1968). Cu lm length and kernel
weight were reported to be highly positively correlated in two wheat
crosses derived from Norin 10 (Reddi et al 1969). However, corre-
lations between tiller number and kernel weight were low and between
tiller number and head length inconsistent.
The contributions of the area and duration of the different parts
of the wheat plant to the grain yield of wheat have also been studied.
The green area duration of the flag leaf a,nd the peduncle gave a
significant correlation with grain yield (Spiertz et al. , 1971).
Phenotypic and genotypic correlations have been used to refine
the estimation of the associations between different traits. In general,
phenotypic and genotypic correlations have the same sign but differ
in magnitude, hence allowing the identification of more precise levels
of significance (Singh et al., 1969; Khadr, 1971).

12
When causal relationships among a set of interrelated variables
are known, path coefficient analysis provides a means of detecting
direct and indirect effects of one variable upon another. The corre-
lation coefficient is broken down into components of direct and in-
direct causal relationships (Li, 1956). Path coefficient analysis, in
a study on selection for yield in wheat, was a means of separating
the direct and indirect effects of several traits and their complex
correlations with yield. Total correlations were high for grain yield
vs number of grains per ear, number of ears per plant, and 250 ker-
nel weight. The direct effects of 250 kernel weight and number of
ears per plant were responsible for their significant association
with yield, while the relationship between number of grains per ear
and yield was mainly due to indirect effects via 250 kernel weight and
ear length (Das, 1972).
Direct and indirect effects of kernel weight, kernels per spike-
let, number of spikelets per spike, spikes per plant, and plant height
on total plant yield for forty five F1 crosses between ten soft white
winter wheats were studied. Negative association between kernel
weight and number of kernels per spikelet canceled out large direct
effects of kernel weight on plant yield. High positive correlations
were found between yield per plant with kernels per spikelet and with
spikelets per spike; both associations were determined almost com-
pletely by direct effects, and only small positive or negative effects

13
were exerted indirectly. There was also a negative correlation be-
tween spikes per plant and yield, which was a result of negative
associations of spike number with kernel number and spikelet number.
Plant height exerted a positive indirect effect by way of kernel number
on plant grain yield (Kronstad, 1963).
A similar study involving forty genotypes of spring wheat from
diverse origins revealed that kernel weight had the greatest direct and
indirect effects upon grain yield per plant. Head number had a signifi-
cant direct effect on seed yield but the indirect effects via this trait
were insignificant (Bhatt, 1973).
Recently multiple regression analysis utilizing different plant
characters has been used to study relationships among variables.
The percentage of the variability in the dependent variable which is
accounted for by changes in the independent variables can be assessed.
This percentage is used in determining which one(s) of the variable(s)
can better predict the dependent variable's performance. Usually
grain yield is used as the dependent variable and the components of
yield, i. e. spike number, kernel number, and kernel weight, and
other agronomic traits are assigned predicting values (Hsu and
Walton, 1970; Walton, 1971a; Syme, 1972).
Generally association which show the most consistency are
those between components of yield with grain yield. The most con-
sistent is number of tiller per plant or per unit area with yield.

14
Associations between kernel weight and kernel number per head with
yield are less consistent. The assumption that components of yield
are independent of each other does not always hold true due to en-
vironmental effects as well as the nature of the genotypes studied
(Anand et al., 1972; Khan et al. , 1972).
Heritability
In practice the plant breeder deals more often with plant traits
which are not simply inherited, i. e. quantitatively inherited charac-
ters such as grain yield. Because of the nature of these complex
traits biometrical procedures are used to estimate the relative de-
gree of transmissability of the trait in question. The key to under-
standing these estimates of gene action is to realize that the
differences between individuals or populations do not depend that
much on the magnitude of the effect of individual genes. Their
differences are mainly due to the total gene effects and the relative
importance of heredity and the environment in producing the final
phenotype (Allard, 1960).
One of the statistics used for estimating transmissability of a
trait is the heritability estimate (H). The heritability concept is
based on the assumption that the genotype and environment have
contributed jointly to the final expression of the phenotype and this
can be expressed by the formula:
15P = G + E
where P represents the phenotype, G the genetic make up of the
individual and E the environmental effects on the genotype (Wright,
1921). Heritability can be defined as that portion of the total varia-
bility which is due to genetic causes (Allard, 1960). More specifically
heritability can be defined as the ratio of the additive genetic vari-
ance to phenotypic variance (Falconer, 1960). Heritability can also
be referred as to the degree to which the characteristics of a plant
are repeated in its offspring (Briggs and Knowles, 1967).
The ratio between total genetic variance to phenotypic variance
has been termed broad sense heritability. The genotypic variance
can be subdivided into additive and non-additive genetic variance.
The ratio of the additive genetic variance to the phenotypic variance
is called narrow sense heritability (Dudley and Moll, 1969).
Heritability estimates apply to a particular characteristic
within a particular population. Because a heritability estimate is a
ratio, its value can change either as the numerator or denominator
changes. If a character is strongly influenced by the environment, its
heritability estimate will be low when grown under widely fluctuating
environments. But if the population were grown in an environment
with low variation, the same character would show high heritability
(Lush, 1945). There have been estimations of heritability, for differ-
ent traits in wheat but the most studied has been grain yield and its
"mr,nr, crt4

16
Kernel weight was studied in a cross between a large kerneled
spring wheat and a small kerneled cultivar. Narrow sense herita-
bility for kernel weight was estimated using various methods and the
values ranged from 37 to 69 percent with the latter value the most
probable (Sharma and Knott, 1964).
A cross between two winter wheat cultivars differing in plant
height was studied in the F1, backcross, and F2 generations. The
heritability values of six plant and seed traits were estimated using
narrow and broad sense heritability estimates. Number of heads per
plant had a very low narrow sense heritability estimate. All the other
components of yield, i e. kernels per spikelet, spikelet number, and
kernel weight, had relatively high values, of transmissability. Their
percentages were high enough to permit successful selection in the
F2 generation; the opposite was true for tiller number and grain yield.
Broad sense heritability estimates were always higher than narrow
sense heritability estimates (Johnson et al. , 1966). In a similar
study involving two semidwarf and two tall spring wheats, large grain
number per ear was found to be dominant over small grain number.
However, the major variance component controlling this character
was additive, with heritability values ranging from high to low de-
pending on the degree of environmental influence (Singh and Anand,
1971a). The same workers studied the other two components of yield
and concluded that the effect of the environmental variations on the

17
number of spikes per plant was quite significant and as a result of
this, heritability values were low. Kernel weight had relatively high
narrow sense heritability estimates even when the environment played
a large role (Singh and Anand, 1971b; 1972).
Components of the analysis of variance were used to estimate
heritability values in spring wheat. Randomly chosen F5 lines of
three spring wheat crosses were planted in a randomized block design
over several years. The genetic variance was calculated from the
mean square estimate of the differences among lines. The pheno-
typic variance was determined from the years times lines interaction
mean square. The heritability value for grain yield was significantly
higher for one of the crosses (Bush et al. , 1971).
Components of yield have also been studied in durum wheats.
A diallel analysis of crosses between six cultivars from five different
countries indicated that the phenotypic expression of number of ears
per plant and number of grains per spikelet was independent of the
other characters. Phenotypic expression of spikelets per head and
kernel weight was influenced by characters developed earlier in the
developmental sequence. Therefore, heads per plant and kernels per
spikelet had high narrow sense heritability values, i. e. 70 and 65
percent, respectively, while spikelets per head and kernel weight had
low narrow sense heritability estimates, i. e. 30 and 19 percent,
respectively (Lee and Kaltisikes, 1972).

18
Heritability estimates for and among various agronomic traits
in wheat show some inconsistency due to: 1) the method used in cal-
culating the heritability estimate (Johnson et al, , 1966); 2) the genetic
background of the parental lines (Schmalz, 1972); and 3) the intensity
of the environmental variations. Estimations of broad sense heri-
tability are usually higher than narrow sense heritabilities (Anwar
and Chowdry, 1969). The heritability estimates of the components of
yield are usually higher than estimates of grain yield heritabilities
per se (Fonseca and Patterson, 1968) suggesting that selection for
spike number, spikelet number, kernels per spikelet, and kernel
weight in early generations has a better chance to be successful than
direct selection for yield. Of the components of yield, kernel weight
generally has a higher heritability value than the other yield com-
ponents (Bhatt, 1972). The range in heritability estimates may also
depend on how different the parental means are, i. e. wide crosses
usually give high heritability values whereas crosses between closely
related cultivars give low values for heritability (Sun et al. , 1972).
However, number of grains per spike, kernels per spikelet and
spikelets per spike are traits which could also respond well to selec-
tion in early generations provided that the proper combinations are
made (Virk et al. , 1971).

19
Combining Ability
Combining ability is a relative measure of the power of a
parental cultivar to transmit characteristics to its offspring. It may
be thought of as two types: 1) general combining ability which refers
to the average performance of a line in hybrid combinations, and 2)
specific combining ability which designates those cases in which cer-
tain cross combinations do better or worse than expected on the basis
of the average general combining ability of the two parental lines
involved in the cross (Sprague and Tatum, 1942).
If selection is to be positive in segregating populations the
breeder must be able to identify superior genotypes which when
hybridized will transmit their desirable characteristics to future
generations. The breeder of self-pollinated crops can base his selec-
tion utilizing that segment of the total genetic variability due to addi-
tive gene action and those gene interactions which follow the additive
scheme, since this is the only type of gene action that can be retained
after inbreeding (Kronstad, 1963).
General and specific combining ability effects were estimated
from a diallel set of crosses in winter wheat. The combining ability
analysis was done only for the F1is excluding reciprocals, and a large
part of the total genetic variation for yield and yield components was
associated with a significant general combining ability effect. Specific

20
combining ability effects were significant for plant yield and height but
not for the components of yield (Kronstad and Foote, 1964; Walton,
1969).
Parental lines may differ in their combining ability and one of
the problems of the plant breeder is to identify those lines which are
going to produce high yielding progenies. It has been reported that
crosses of wheat which were better than the parental means either in
earliness or in plant height in the F1
and F2 generations (Borojevic,
1963).
However, in the case of yield, the differences in combining
ability between the parental cultivars was not directly related to their
own yielding capacity. Generally good combiners for yield were good
combiners for some of the components of yield, but good combiners
for the yield components were not necessarily good combiners for
grain yield (Singh and Gupta, 1969).
There are several methods to estimate the type of gene action.
The graphical analysis proposed by Jinks and Hayman (1953) and
Griffing's combining ability analysis (1956) were compared by using
data obtained from the F1, F2, and F3 generations of a diallel set of
crosses between five varieties of wheat. The combining ability
analysis was found to be more reliable in predicting the prepotency of
the parental lines. This was especially true in later generations

21
when the expression of dominance effects was reduced and the contri-
bution of non-allelic effects was greater (Tandon et al., 1970).
A partial diallel set of crosses has also been used to estimate
general combining ability effects for several agronomic traits in
wheat. The results were in agreement with those found with the com-
plete diallel set of crosses in that genetic variation for yield and yield
components was associated with significant general combining ability
effects (Somayajulu et al., 1970).
The F1
and F2 generations of a diallel set of crosses between
six wheat varieties were compared for their combining ability esti-
mates. Correlations between F1
and F2 general combining ability
effects during two years were significant not only for the components
of yield but for plant grain yield also. This was not true for the
specific combining ability effects of all the characters studied (Paroda
and Joshi, 1970).
General combining ability effects were the major components of
genetic variation in crosses involving soft red winter wheats, where
heterosis levels exceeded 25 percent for grain yield. In this same
experiment parents with high general combining ability were superior
parents for wheat hybrids. However, there was a big loss of heterosis
in the F2 generation, suggesting that both dominance and epistatic
type of gene action could be involved in the expression of heterosis
the F1
hybrids of wheat (Blitzer and Fu, 1972).

22
A combining ability study involving ten varieties of durum wheat
from diverse origin showed that number of tillers per plant, kernels
per spike, and kernel weight had significant general combining ability
effects. Kernel weight was the only character studied where signifi-
cant specific combining ability effects were noted (Widner and Lebsock,
1973).
The study of combining ability may be useful in selecting par-
ental cultivars that could produce more desirable progenies. There
are indications that both additive and dominance components as well as
epistatic components of genetic variance influence the expression of
yield in wheat, because highly significant general and specific com-
bining ability effects have been found. However, additive genetic
variance is preponderant in the expression of the components of yield
(Kronstad and Foote, 1964; Brown et al 1966; Walton, 1971b;
Gyawali et al., 1968). Those parental lines with high general com-
bining ability effects seem to be good parents for F1
hybrid combina-
tions in wheat; specific combining ability would not make a significant
contribution in the improvement of self-pollinated crops unless the
commercial exploitation of heterosis becomes possible (Blitzer and
Fu, 1972).
23
MATERIALS AND METHODS
Five parental cultivars of spring wheat were chosen from the
genetic stock at the International Maize and Wheat Improvement
Center in Mexico (CIMMYT). Crosses were made in 1970 at CIANO
Experimental Station in Ciudad Obregon, Mexico, in a diallel fashion,
excluding reciprocals. The F1' s were grown at the same station the
following season, and the F2
seed for each cross was harvested in
bulk. During this season additional F1
single crosses were made and
the backcrosses to both parents were also obtained.
The parental lines used included: Yaqui 50, Sonora 64, Vicam
71, Olesen and Tordo. The pedigree and description of each cultivar
is given in the Appendix. The first three entries have been commercial
varieties in Mexico at different periods from 1950 to present. Yaqui
50 is a tall standard variety, Sonora 64 is a two gene semidwarf and
Vicam 71 is a triple dwarf variety, the latter two were derived from
Norin 10. Tordo is a line which is shorter than Vicam 71; it is a
derivative of Tom Thumb and was produced in the hybrid wheat pro-
gram sponsored jointly by CIMMYT -INIA in Mexico. Olesen is the
shortest of all cultivars used in this experiment; it has very thick
culms and very stiff straw.
The parental lines, first filial generation (F1), second filial
generation (F2), backcrosses to the shorter parent in the single cross

24
(BC 1),and backcrosses to the tall parent (BC
2) were sown in a com-
pletely randomized block design on December 6, 1972, at the experi-
mental station in Ciudad Obregon, Mexico. There were 67 rows, 7.5 Ti
long with 30 cm spacing between rows, per replication, and a total
of four replications. There was one row of each parental line along
with the respective F1
planted in each replication. With the exception
of the Fits, each row was planted with 24 seeds approximately 30 cm
apart. In the case of the Fits, only 10 seeds per row were planted.
There were 45 entries in the experiment which included five
parents, and 10 Fits, 10 Fars, 10 BCits, and 10 BC2's. For the
latter three generations there were either one, two, or four rows
sown of each in every replication, and the number was dependent on
the difference in height between the two cultivars involved in the cross.
Crosses between Yaqui 50 and the three dwarf cultivars were planted
with two rows for the backcrosses and four rows for the F2Is in each
replication; other crosses were planted with one row for the back-
crosses and two rows for the F2
in every replication.
Prior to planting, 150 kg/ha of nitrogen and 50 kg/ha of phos-
phorous were applied. The plots were irrigated seven times during
the season, including one at sowing time and the last one was applied
on April 9, 1973. Diathion was applied two times during the season
at a rate of 60 cc per 10.L of water for aphid control. Weeds were
controlled by hand cultivation.

25
Data were collected on and individual plant basis. A total of
thirteen characteristics were scored in the following manner:
1. Days to ear emergence was recorded when approximatelyhalf the number of tillers of each individual plant had thewhole spike extruded beyond the auricules of the flag leaf.
2. Plant height was obtained by measuring the length from thebase of the crown to the tip of the ear of the main tillerexcluding awns.
3. Number of tillers was recorded as the number of spike-bearing culms.
4. Number of spikelets was obtained by averaging the numberof spikelets on the head of the main tiller and on anothertiller selected at random from the first flush of tillers.
5. Head length was obtained by measuring the length of theear on the tallest culm, excluding awns.
6. Days to maturity was scored when approximately half ofthe tillers of the plant had reached physiological maturity.
7. Grain yield per plant was the weight of the grain in grams.
8. Harvest index, expressed in percent, was the ratio of grainyield per plant to the weight of the whole plant excludingroots (this character was recorded for only half of theplants harvested.
9. Kernel weight was calculated by weighing 500 kernelsamples per plant and dividing by 500 to obtain the averageweight of a kernel (when there was less than 500 kernels,the total number of kernels was used to calculate kernelweight).
10. Number of kernels per spikelet was calculated indirectlyfrom grain yield per plant, 500 kernel weight, number ofeffective tillers, and number of spikelets per spike, usingthe following formula:
26
(Grain yield per plant/kernels/spikelet = 500 kernel weight) 500
Number of tillers per plantNumber of spikelets per spike
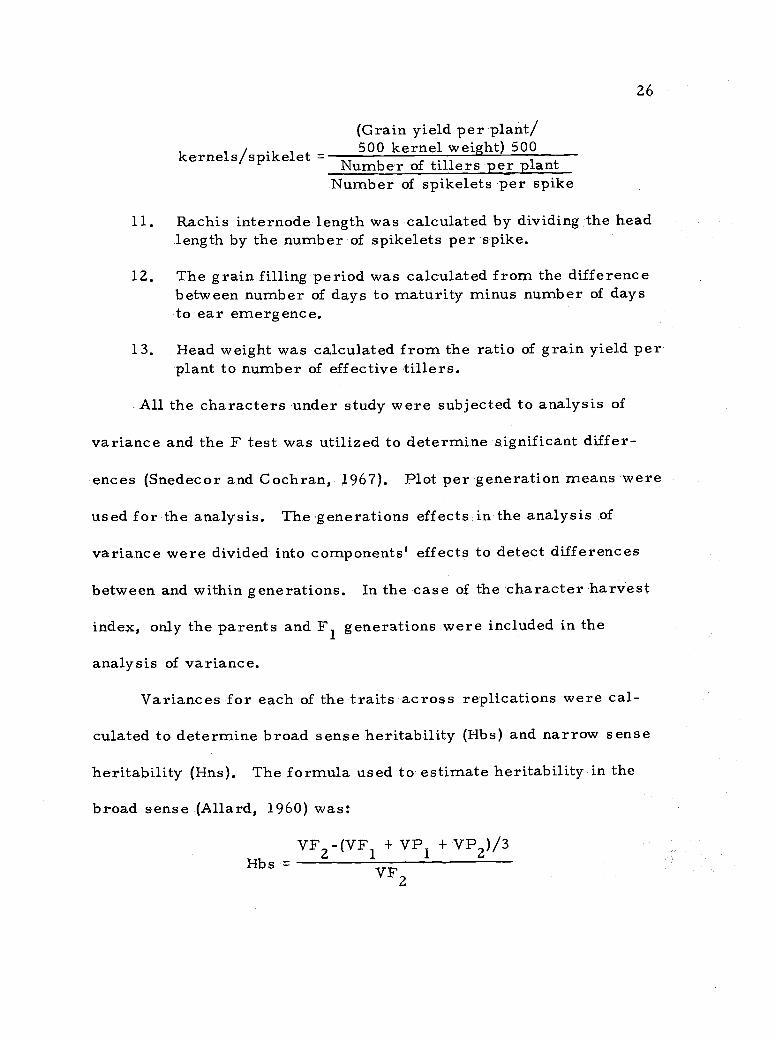
11. Rachis internode length was calculated by dividing the headlength by the number of spikelets per spike.
12. The grain filling period was calculated from the differencebetween number of days to maturity minus number of daysto ear emergence.
13. Head weight was calculated from the ratio of grain yield perplant to number of effective tillers.
All the characters under study were subjected to analysis of
variance and the F test was utilized to determine significant differ-
ences (Snedecor and Cochran, 1967). Plot per generation means were
used for the analysis. The generations effects in the analysis of
variance were divided into components' effects to detect differences
between and within generations. In the case of the character harvest
index, only the parents and F generations were included in the
analysis of variance.
Variances for each of the traits across replications were cal-
culated to determine broad sense heritability (Hbs) and narrow sense
heritability (Hns). The formula used to estimate heritability in the
broad sense (Allard, 1960) was:
VF2 -(VF1 + VP1 + VP )/3Hbs VF
2

27
and the formula to estimate narrow senseheritability (Warner, 1952)
was:
Hns2VF
2-(VBC
1+ VBC2)
VF2
where: VF1
= variance of the first filial generation, VF2= variance
of the second filial generation, VBC1
= variance of the backcross to
the short parent, VBC2 = variance of the backcross to the tall parent,
VP1
= variance of the short parent, and VP2 = variance of the tall
pa rent.
Degree of dominance displayed for plant height in the F1 and F2
was calculated using the following formula:
D = TP-(P1 + P2)/2
1- (F.
1+ P2)/2
dl -
d2=
D
D
where D = differential, d = degree of dominance, TP = tall parent
mean, dl = degree of dominance for F,, d2 = degree of dominance for/....
F2, P1 = tall parent mean, = short parent mean, F1
= first filial
generation mean. Heterosis was calculated for each trait in each
cross as the percentage increase of the F1
or F2 above the mean of
the parental lines. The formula used was that described by
Matzinger et al. (1962):

28
F - MPHeterosis
F1x 100
MP
where MP is the mid parent value and F1
is the mean of the first
filial generation. If the value resulting from this formula was nega-
tive, heterosis was considered negative in sign. Possible superiority
of the F1
in respect to the better parent was estimated by using the
formula proposed by Fonseca and Patterson (1968a):
F - HPHeterobeltiosis - x 100
HP
where HP is the mean value of the better parent and F1
is the mean
of the generation following the cross; as heterosis, negative hetero-
beltiosis values were considered.
Phenotypic, environmental and genotypic correlations were used
to estimate degree of association between the agronomic traits studied
for each of the 10 crosses. As suggested by Falconer (1960), the F1
correlations were considered as environmental correlations, the F2
correlations were considered as phenotypic correlations and the
genetic correlations were calculated from the formula:
rPh = Fix THY rG + TE-; fEy rE
where: rPh = phenotypic correlation between x and y, rG = genetic
correlation between x and y, rE = environmental correlation between
x and y, H = heritability, with subscript x or y, according to the trait,
29
E = 1-H, also with subscripts according to the trait.
Path-coefficient analysis, as suggested by Wright (1921, 1922),
and discussed by Dewey and Lu (1959) and Li (1948) was used to pro-
vide a means of studying the direct and indirect contributions of
various characters in building up a complex correlation. By this
method the relationships between yield and yield components from the
replication means of the Fl, F2, BC1, and BC for each cross were
studied.
Estimates of general and specific combining ability were ob-
tained for 10 of the traits studied, excluding rachis internode, days
to heading and harvest index, by the method proposed by Griffing
(1956) where the parents and one set of Fits were included, recipro-
cals excluded. Because the parents were selected on the basis of
plant height and represented a specific population, a fixed model was
used. This combining ability analysis has been termed by Griffing as
Experimental Method 2, Model I. The diallel crossing system gives
rise to p(p + 1)/2 different genotypes, where p = number of parental
lines in the diallel. Contributions of the parents due to general com-
bining ability (G. C. A. ) and specific combining ability (S.C./3i.)
effects were also computed for 10 of the traits studied (Griffing, 1956).
Components of variance due to G. C. A. and S. C. A. were parti-
tioned according to the same Griffings model. Ratios between G. C. A.
effects and S. C. A. effects were calculated to compare the relative

30
magnitude of these variances in the F1 and the F2 generations. The
following F ratios were used to test for G. C.A. and S. C.A. effects:
F,p-1,m = Mg /Me' to test for differences among G. C. A. effects
F,p(p-1)/2, m = Ms /Me' to test for differences among S. C.A. effects.
where Mg = mean square for G. C. A. , Ms = mean square for S. C.A.
Me' = error mean square from the combining ability analysis, p
number of parental lines, and m = degrees of freedom for the error
term in the combining ability analysis.
The analysis of combining ability was determined only for the
F1
and F2
generations.

31
RESULTS AND DISCUSSION
Analysis of variance - The five parental cultivars used in this
study represented a wide range in genetic diversity for plant height.
These parental cultivars were also very diverse for the expression of
other agronomic traits which may be of interest to the breeder when
developing new semidwarf wheats. To test the significance of this
genetic variability, an analysis of variance was used to detect differ-
ences among genotypes as well as between and within generations for
all thirteen characters measured (Tables 1 and 2). Significant differ-
ences (p = 0.01) were observed among genotypes for all characters
studied; among generations for all characters except days to maturity;
and for all characters within generations.
To justify the combining ability analysis for the parental lines
and the F1
and F2 generations, differences existing within each of
the generations were tested for significance. Significant differences
(p = 0.01) were detected within each of the generations for most of
the traits studied. Yield per plant between F1
crosses, number of
tillers per plant between the parental lines, days to maturity between
the Fits, and head grain weight between the parents, were signifi-
cantly different at a lower probability level (p = 0. 05).
The within generations results from the analysis of variance,
in general, confirm the assumption that genetic diversity existed

Table 1. Observed mean squares for twelve agronomic characteristics for parents,
Degrees Yield Number Number KernelsSource of of per of of per KernelVariation Freedom Plant Tillers Spikelets Spikelet Weight
F1's, F2's, BC1's and BC2's,
Days to Days toHeight Heading Maturity
of a five spring wheats dialiel cross.
Grain Rachis HeadFilling Head Inter- GrainPeriod Length node Weight
Reps 3 341.57** 103.52** 5.90** .039 49.10** 156.90** 36.55** 7.16 6.02 1.05** .106* .092*Genotypes 44 304.17** 68.73** 4.98** .103** 21.52** 2114.91** 48.01** 16.22** 22.82** 6.09** .631** .142**Between Generations 4 977.02** 227.56** 1.24** .150** 32.20** 2181.58** 74.45** 3.23 96.92** .83* .139** .546**Within Generations 40 236.88** 52.88** 5,36** .098** 20.45** 2108.24** 45.37** 17.52** 15.41** 6.62** .680** .102**Parents 4 317.94 131.42* 9.89** .225** 41.22** 4933.62** 160.30** 49.30** 52.07** 14.83** 1.482** .121*F1's 9 522.54* 66.80 4.61** .100** 17.57** 1729.11** 16.29** 14.89* 4.83 6.51** .669** .208**F2's 9 106.47 34.73** 2.73** .043** 20.97** 1669.58** 35.27** 11.58** 12.57** 3.92** .455** .068**BC1's 9 78.13 26.51** 4,33** .067** 18.06** 720.93** 15.89 ** 7.29** 7.36** 6.05** .703** 070**3C2's 9 204.38** 48.58** 7.75** .127 15.99** 3057.01** 62.95** 22.18** 20.57** 6.35** .538** 052genotypes x Reps a
.(2132 90.48 17.39 .27 .030 3.19 7.73 3.03 2.98 3.15 .26 .030 032
Parents x Reps 12 118.59 36.96 .36 .017 2.29 3.56 4.67 1.50 9.11 .19 .021 032F1's x Reps k3 27 175.94 31.07 .41 .023 2.90 5.26 3.47 6.14 3.49 .30 .039 056F2's x Reps(4 27 49.34 10.46 .26 .012 2.22 10.76 1.95 2.52 1.69 .24 .033 015BC1's x Reps(5 27 41.91 8.00 .16 .020 3.09 5.01 2.24 1.83 1.63 .22 .039 .021BC2's x Reps(6 27 64.68 9.16 .22 .063 3.01 10.59 2.09 2.32 2.57 .33 .019 035Between Gens x Reps 12 130.00 22.35 .24 .039 7.53 10.26 6.79 2.44 4.40 .22 ,022 039
TOTAL 179
Coefficient of Variation 17.76 18.59 2.18 6.97 4.44 3.59 1.79 1.22 4.00 4.37 3.54 7.54
* significant differences at the 56 probability level** significant differences at the 1% probability level
Error term for Reps, -Genotypes, Between Generations, and Within Generations2) Error term for Parents3; Error term for F1's4; Error term for F2's
Error term for BCI's6, Error term for BC2's

33
Table 2. Observed mean squares for harvest index for Fits andparents.
Degreesof
Freedom
HarvestIndex
Reps
Genotypes
3
14
1.35
74. 33 **
Between Generations 1 66.16**
Within Generations 13 75. 39**
Parents 4 203.95**
F1' s 9 18.26**
Genotypes x Reps 142 2.09
Parents x Reps 212 2.99
Fits x Reps 327 1.71
Between Generations x Reps 3 1.86
TOTA L 59
Coefficient of Variation 3.39
**Significant differences at the 1% probability level
1 Error term for Reps, Genotypes, Between Generations, and WithinGenerations
2Error term for Parents3Error term for Flt s
34
among the parental lines. However, there were no statistical differ-
ences for yield per plant within the parental lines, within the F2
generation, and within the BC1, as well as for number of tillers per
plant among the Fi's, kernels per spikelet among the BC and grain
filling period among the F1' .
For most traits studied the coefficients of variation (C.V.)
were below 8, but in the case of tillers per plant and yield they were
18.59 and 17.76 percent, respectively (Table 1). These are rela-
tively high C. V. values (Snedecor and Cochran, 1967). Examining
the means for number of tillers and yield per plant of the parental
lines (Table 10), there were differences of 33 and 28 percent respec-
tively between the line with the highest value and that with the lowest
one. These differences appeared large enough to be significant.
However, the expression of tiller number and plant yield may have
been influenced to a greater extent by the environment, thus increas-
ing the value of the error term and making differences more difficult
to detect. Similar results of high C. V. for tillers per plant have been
reported by Kronstad (1963) and Daaloul (1973). In both studies
significant differences were difficult to detect among crosses other-
-wise proven to be genetically diverse. Because grain yield depended
so much on tillering capacity in the present study, this could account
for the difficulty in detecting yield differences.

35
From the results of the analysis of variance, there was enough
evidence to assume genetic diversity among the parental cultivars and
their crosses for all the traits measured, and to justify an analysis of
the type of gene action involved in their genetic expression.
Degree of dominance for plant height and heterosis - The semi-
dwarf trait could be better utilized in a breeding program if the type
of gene action involved in the inheritance of this trait for each of the
different genetic sources was better understood. One of the simplest
ways to calculate gene action is to estimate the degree of dominance
(d) using mean values. For calculating d the following assumptions
were made: 1) if no dominance existed or any kind of epistatic effects,
all the gene action was assumed to be additive if the F1
value ap-
proached the mid parent value; 2) if only one gene was present,
dominance would refer to that particular locus, and if more than one
gene was involved dominance would be an average value.
Estimations of degree of dominance for plant height in each of
the 10 crosses was calculated to determine if differences existed
among the dwarf cultivars in this study (Table 3). In most of the
crosses the value of d was positive, indicating dominance for tallness.
The degree of dominance varied but, in general, it was about 10 per-
cent higher than the midparent. However, in most of those crosses
involving the cultivar Tordo dominance values were negative. In the
cross Tordo/Olesen, in which Tordo was the tall parent, d was
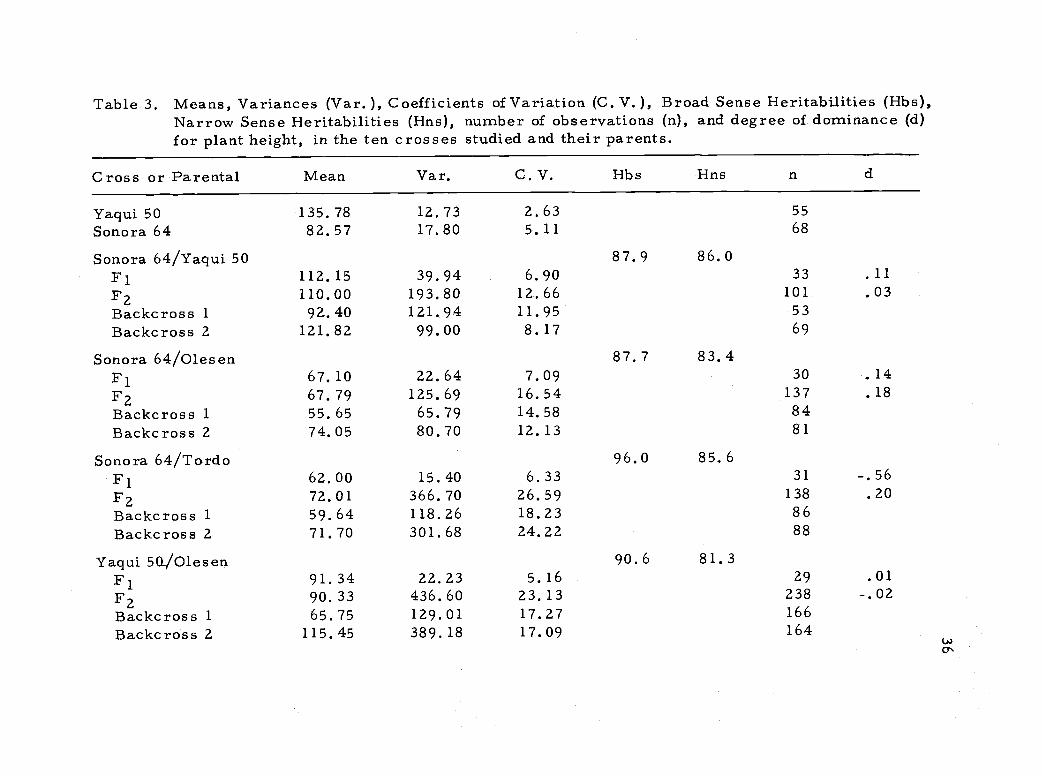
Table 3. Means, Variances (Var. ), Coefficients of Variation (C. V.), Broad Sense Heritabilities (Hbs),Narrow Sense Heritabilities (Hns), number of observations (n), and degree of dominance (d)for plant height, in the ten crosses studied and their parents.
Cross or Parental Mean Var. C. V. Hbs Hns
Yaqui 50 135.78 12.73 2.63 55
Sonora 64 82.57 17.80 5.11 68
Sonora 64/Yaqui 50 87.9 86.0Fl 112.15 39.94 6.90 33 .11F2 110.00 193.80 12.66 101 .03Backcross 1 92.40 121.94 11.95 53Backcross 2 121.82 99.00 8.17 69
Sonora 64/01es en 87.7 83.4F1 67.10 22.64 7.09 30 . 14
F2 67.79 125.69 16.54 137 .18Backcross 1 55.65 65.79 14.58 84Backcross 2 74.05 80.70 12.13 81
Sonora 64/Tordo 96.0 85.6F1 62.00 15.40 6.33 31 -. 56
F2 72.01 366.70 26.59 138 .20Backcross 1 59.64 118.26 18.23 86Backcross 2 71.70 301.68 24.22 88
Yaqui 50./Olesen 90.6 81.3F1 91.34 22.23 5.16 29 . 01
F2 90.33 436.60 23.13 238 -.02Backcross 1 65.75 129.01 17.27 166Backcross 2 115.45 389.18 17.09 164

Table 3. Continued.
Cross or Parental Mean Var. C. V. Hbs Hns n.
Yaqui 50/Tordo 97. 6 74.3
F1 86.41 18.25 4.94 29 -.24
F2 91.15 586.96 26.58 278 -.12
Backcross 1 69.45 161.20 18.28 159
Backcross 2 107.96 576.63 22.24 163
Vicam 71/Sonora 64 79.8 79.2
F1 74.61 45.90 9.08 36 -.28
F2 78.79 129.43 14.44 142 .40
Backcross 1 72.96 54.64 10.13 87
Backcross 2 78.07 101.74 10.85 75
Vicam 71 /Yaqui 50 95.8 82.2
Fl 105.20 24,29 4.68 34 .07
F2 106,07 409.28 18.96 264 .09
Backcross 1 84.38 156.09 14.81 147
Backcross 2 125.52 326.02 14.38 156
Vicam 71 /01esen 82.7 74.5
F1 59.10 9.60 5.24 29 .07
F2 57.53 58.09 13.25 129 -.07
Backcross 1 54.19 34.51 10.84 63
Backcross 2 60.27 38.39 10.28 66
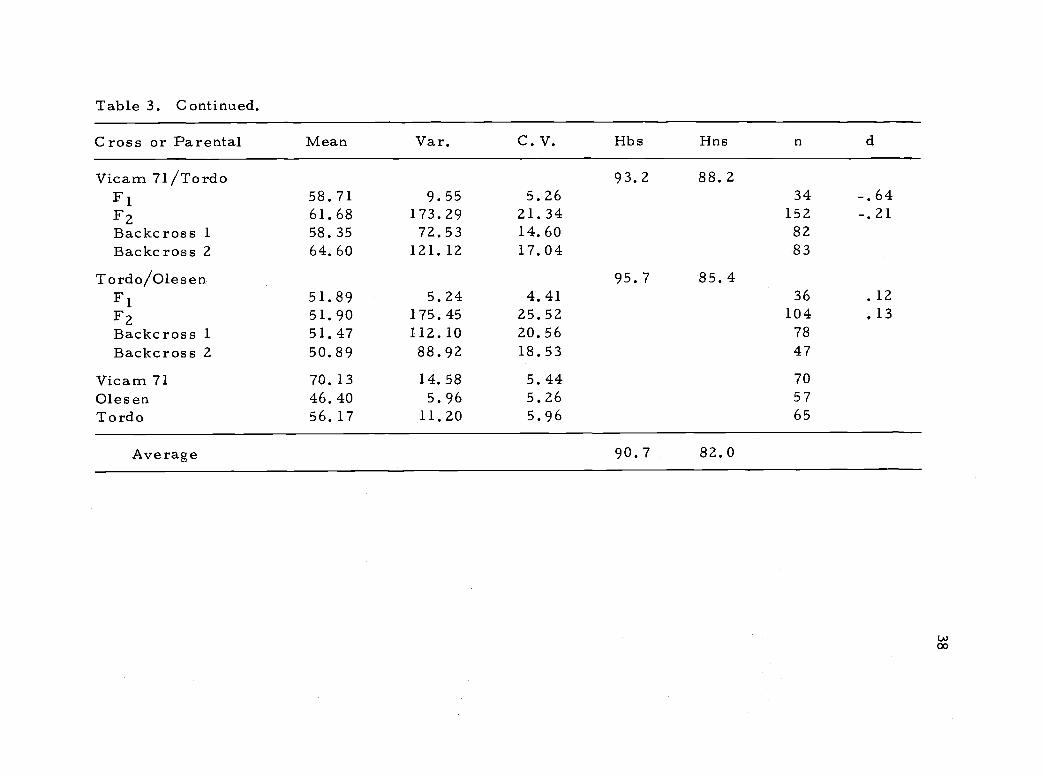
Table 3. Continued.
Cross or Parental Mean Var. C. V. Hbs Hns
Vicam 71/Tordo 93.2 88.2F1 58.71 9.55 5.26 34 -.64F2 61.68 173.29 21.34 152 -.21Backcross 1 58.35 72.53 14.60 82Backcross 2 64.60 121.12 17.04 83
Tordo/Olesen 95.7 85.4F1 51.89 5.24 4.41 36 .12F2 51.90 175.45 25.52 104 .13Backcross 1 51.47 112.10 20.56 78Backcross 2 50.89 88.92 18.53 47
Vicam 71 70.13 14.58 5.44 70Oles en 46.40 5.96 5.26 57Tordo 56.17 11.20 5.96 65
Average 90.7 82.0

39
positive. The degree of dominance varied and in the crosses Sonora
64/Tordo and Vicam 71/Tordo dominance was more towards the
short parent than the midparent indicating that there were strong
dominant effects for shortness of straw from this cultivar derived
from Tom Thumb.
Only a slight degree of dominance for tallness was present in
crosses involving Vicam 71 and Olesen dwarf. In these crosses
additive gene action could not be ruled out as a major component of
the genetic variability for plant height. Similar results were reported
by Ficks and Qualset (1973) in a study using a Norin 10 derivative and
Olesen. In crosses involving Tordo, however, non-additive gene
action played a larger role because the degree of dominance for short
straw was higher. Morris 21 al. , (1972), reported similar results
working with monosomics of Tom Thumb and two tall standard vari-
eties.
As an ultimate goal the breeder of self-pollinated crops has to
identify and select lines which possess superior agronomic charac-
teristics. This is usually done after several generations of selfing.
Success in selection will depend primarily on the type of gene action
involved in the expression of the character(s) under consideration
plus the amount of environmental influence. The breeder is mainly
concerned with those effects which remain constant or can be fixed
by means of selection. Heterosis, expressed as a percentage of the

40
midparent or as a percentage of the high parent, is a means of de-
tecting some of these gene effects by a simple comparison of means
in the early generations. The superiority, or inferiority, of the F1
hybrid may be due to intra-allelic interactions that are lost after
inbreeding or to epistatic effects of an additive type that can be fixed
by means of selection. When the F2 generation is also evaluated for
heterosis, then the amount of heterotic effects lossed after a genera-
tion of selfing, or the amount of inbreeding depression, may give some
indications of the type of gene action involved in the expression of a
particular trait.
Heterosis values in this study were high and positive for head
grain weight and kernels per spikelet when the average values of the
heterosis effects for all crosses were compared (Table 6). Head
weight appeared to respond more to non-additive gene action as
heterosis values were quite high in the F1
(15. 18 percent of MP,
10.77 percent of HP) and were greatly reduced in the F2, (6.86
percent of MP, 2.75 percent of HP). The crosses having the highest
heterosis values for head weight were Yaqui 50 /Olesen and Vicam
71/Yaqui 50. The three parents involved in these crosses had the
lowest head weight means. Therefore, high heterotic effects may
very well indicate that the genes involved in these effects were differ-
ent in each of the parental lines, and the possibility exists of finding
recombinations which would have higher head weight than the parental

fable 4. Heterosis as percentage of the midparent (MP) and higher parent (HP) for four charactersstudied in the diallel cross 7Nf five spring wheats.
PLANT HEIGHT DAYS TO HEADINGF2 P1
HP
F2
_tt,P HP MP MP HP
Sonora 64/Yaqui 50 2.72 -17.40 .76 -18.99 1.94 -5.56 3.68 -3.76Sonora 64/olesen 4.06 -18.74 5.13 -17.90 8.13 5.03 4.29 1.30Sonora 64 /fordo -10.62 -24.91 3.81 -12.79 5.97 -1.04 3.43 -3.41Yaqui 50 /ulesen .27 -32.73 -.83 -33.47 3.40 -1.52 3.06 -1.84Yaqui 50/Tordo -9.97 -36.36 -5.03 -32.87 2.02 1.14 1.72 1.01Vitam 71/Sonora 64 -2.28 -9.64 3.20 -4.58 5.02 -1.49 2.21 -4.13Vicam 71/Yaqui 50 2.18 -22.52 3.03 -21.88 1.00 - .38 1.14 - .20Vicam 71 /ulesen 1.43 -15.73 -1.26 -17.97 4.27 .59 5.37 1.65Vicam 71/Tordo -7.03 -16.28 -2.33 -12.05 1.51 1.03 1.23 .75fordo/blesen 1.18 -7.62 1.20 -7.60 3.90 -.22 3.49 -.62
Average -1.81 -20.19 .77 -18.-01 3.72 -.24 2.98 -.92
HARVEST INDEX RACHIS INTERNODE
Sonora 64/Yaqui 50 9.18 -9.20 4.01 -13.50 -.94 -6.37 -3.37 -8.67Sonora 64/olesen 2.52 .42 -2.09 -4.10 .11 -6.36 -.96 -7.36Sonora 64/Tordo 1.64 1.09 .31 -.23 00 -3.17 -.19 -3.35Yaqui 5U/Olesen 15.13 -5.82 10.87 -9.31 -2.89 -13.81 -4.09 -14.87Yaqui 50 /fordo 15.90 -4.03 2.54 -15.09 13.26 .53 6.08 -5.84Vicam 71/Sonora 64 3.70 2.95 3.47 2.72 .97 -6.96 1.62 -6.36Vicam 71/Yaqui 50 10.99 -8.23 6.91 -11.60 -.51 -12.92 -7.18 -18.76Vicam 71/01esen 1.16 -.20 -1.95 -3.26 -2.55 -4.11 -1.62 -3.20Vicam 71 /fordo -2.33 -2.52 -1.26 -1.45 -2.19 -12.48 -3.23 -13.41Tordo/olesen .75 -.79 -3.06 -4.54 -.10 -9.31 -.92 -10.06
Average 5.86 -2.63 1.97 -6.04 .52 -7.50 -1.39 -9.19

Table 5. Heterosis as percentage of the midparent (MP) and higher parent (HP) for four charactersstudied in the diallel cross of five spring wheats.
NUMBER OF SPIKELETS DAYS TO MATURITY
F1 F2 F1 F2
MP HP MP HP MP HP MP HP
Sonora 64/Yaqui 50 1.18 -6.24 .28 -7.08 -2.32 -5.28 -1.37 -4.37
Sonora 64/01esen 2.97 -1.07 1.b3 -2.36 1.16 -0.36 -0.23 -1.72
Sonora 64 /fordo -3.37 -10.37 .88 -6.42 .28 -2.61 -1.46 -4.30
Yaqui 50/01esen .29 -3.42 1.36 -2.39 -1.80 -3.35 -0.58 -2.16
Yaqui 50/Fordo 1.47 1.35 .52 .40 -0.37 -0.53 -1.37 -1.53
Vicam 71/Sonora 64 .18 -4.98 1.59 -3.64 .18 -1.48 -0.33 -1.99
Vicam 71/Yaqui 50 3.12 .60 1.32 -1.15 -1.12 -2.52 -0.75 -2.16
Vicam 71/Ulesen .23 -1.09 1.16 -0.17 .64 .47 .47 .30
Vicam 71/Tordo 2.67 .28 .39 -1.95 -0.30 -1.55 -1.43 -2.68
Tordo/Olesen .62 -2.99 -1.12 -4.66 -1.05 -2.46 -0.67 -2.08
---Average .94 -0.47 -1.97 -0.77 -2.27-2.79 .80 -2.94
HEAD LENGTH GRAIN FILLING PERIOD
Sonora 64/Yaqui 50 -0.48 -12.43 -3.99 -15.52 -8.19 -14.01 -11.27 -16.89
Sonora 64/Ulesen 3.57 0.46 1.00 -2.03 -10.35 -11.20 -7.96 -8.84
Sonora 64/Fordo -3.54 -13.00 0.00 -9.81 -9.70 -14.01 -10.42 -15.19
Yaqui 50/01esen -3.07 -16.92 -2.25 -16.22 -11.63 -16.48 -8.75 -13.75
Yaqui 50/Pordo 5.41 2.53 -2.60 -5.27 -5.17 -6.81 -8.99 -10.57
Vicam 71/sonora 64 1.05 -1.94 3.14 .09 -8.89 -15.40 -5.33 -12.10
Vicam 71 /"Yaqui. 50 2.21 -12.36 -6.39 -19.73 -5.22 -6.10 -6.54 -7.41
Vicam 71/ulesen -2.60 -2.65 -1.42 -1.47 -6.63 -12.53 -9.54 -15.25
Vicam 71/Tordo 0.00 -12.18 -3.55 -15.30 -4.04 -6.56 -7.12 -9.56
Fordo/Olesen .38 -11.88 -3.09 -14.93 -10.55 -14.03 -7.43 -11.03
Average .29 -8.04 -1.91 -10.02 -8.04 -11.71 -8.33 -12.06

rable 6 Heterosis as Tercentage of the midparent (MP) and higher parent (HP) for five characters studied in the diallelcross of five spring wheats.
KERNELS PER SPIKELET YIELD PER PLANTFl F2 F1 F2
MP HP MP HP MP HP MP HP
Sonora 64/Yaqui 50 5.76 -2.21 -2.58 -9.93Sonora 64/01esen 7.84 3.68 3.63 -0.37Sonora 64/Tordo 7.75 -2.94 1.22 -8.82Yaqui 50/01esen 16.60 11.95 3.73 -0.40Yaqui 50/Tordo 11.80 8.66 6.46 3.46Vicam 71/Sonora 64 1.21 -7.72 .81 -8'09Vicam 71/Yaqui 50 12.09 10.39 5.05 3.46
Vicam 71/01esen 3.16 -2.39 1.47 -3.98Vicam 71/rordo 9.50 8.03 5.43 4.02Tordo/oIesen .64 -5.98 6.18 -0.80
Average 7.63 2.15 3.14 -2.14
2.44 -2.-71 -0.85 -5.842.89 -7.15 -1.46 -11,07
- 34.60 -35.17 -2.80 -3.659.54 -2.34 8.20 -3.55
- 11.30 -16.47 -17.00 -21.82-21.33 -27.23 -3.87 -11,-0921.83 18.49 -12.34 -14.74-16.63 -29.79 8.34 -8.77-13.42 -20.56 -18.47 -25.19-6.12 -14.60 17.70 7.07
-6.67 -13.75 -2.25 -9.86
KERNEL WEIGHT FILLERS PER PLANT HEAD WEIGHT
Sonora 64/Yaqui 50 11.18 3.69 6.06 -1.09 -17.32 -27.50 -6.67 -18.17 19.02 10.83 3.80 -3.33
Sonora 64/01esen 7.24 1.60 2.76 -2.64 -12.26 -17.13 -8.33 -13.42 19.82 13.33 7.93 2.08
..)onora 64/Tordo 4.85 1.95 4.10 1.21 -43.02 -43.27 -9.60 -9.99 10.23 10.00 7.31 7.08
Yaqui 50/01esen 16.59 14.66 9.26 7.45 -18.39 -31.86 .06 -16.46 36.82 34.58 14.49 12.62
Yaqui 50/Tordo 7.49 -2.34 3.58 -5.89 -27.66 -36.81 -24.70 -34.22 21.52 13.39 9.86 2.51
Vicam 71/Sonora 64 4.97 3.27 2.38 .73 -27.69 -35.95 -8.70 -19.14 6.37 .83 4.61 -0.83
Vicam 71 /Yaqui 50 9.83 4.01 3.84 -4.94 -4.19 -5.29 -18.64 -18.64 26.06 23.72 5.69 3.72
Vicam 71/01esen -2.15 -5.84 -6.00 -9.55 -16.61 -29.71 4.10 -12.26 1.63 1.39 -1.16 -1.39Vicam 71/fordo 1.59 -2.77 3.44 -1.01 -22.29 -31.43 -26.33 -35.-00 11.89 6.28 8.81 3.35Pordo/Olesen -4.47 -11.87 -0.74 -8.43 -2.63 -7.66 4.92 -0.50 -1.54 -6.69 7.28 1.67
Average 5.71 .64 2,87 -1.76 -19.21 -26.66 -9.38 -17.78 15.18 10.77 6.86 2.75

44
cultivars, even if the main gene action was of the nonadditive type.
The cross between Sonora 64 and Tordo, the two parents with the
highest head grain weight means, showed some degree of heterosis
which was not reduced in the F2. Additive gene effects may be in-
volved in the expression of this trait in this particular cross, and the
possibility exist that genotypes may be selected with a higher head
grain weight than both parents.
There was less heterosis for number of kernels per spikelet. In
general, heterotic effects were significantly reduced in the F2, indi-
cating that non-additive gene action was important in the expression
of this trait in the F1. However, there were some crosses where
reduction of heterosis in the F2 was not as drastic, i. e. Yaqui 50/
Olesen, Yaqui 50/Tordo, Vicam 71/Yaqui 50 and Vicam 71/Tordo.
The small reduction in heterotic effects in the F2, indicated that
perhaps additive gene action played a bigger role in these crosses,
and selection for higher number of kernels per spikelet is plausible.
Other traits showing significant heterosis, but of the negative
type, were grain filling period (-8.04 percent of the MP and -11.71
percent of the HP), number of tillers per plant (-19.21 percent of the
MP, -26.66 percent of the HP), and grain yield per plant (-6.67 per-
cent of the MP, -13.75 percent of the HP). Grain filling period did
not show changes in heterotic effects from the F1 to the F2 (Table 5),
hence additive gene effects may be important in the expression of this

45
trait, None of the crosses had positive heterosis values. Because
additive effects seemed important and significant differences were
detected among the parental lines (Table 1), there is the possibility
that transgressive segregation will occur. Therefore, families with
a longer grain filling period could be selected. A long filling period
may be a means of increasing seed set and kernel weight, two im-
portant components of yield.
A very large negative heterosis value for number of tillers per
plant was observed in the F1 but was reduced drastically in the F2
generation (Table 6). This trait would be expected to respond to non-
additive gene action and would be difficult to select for in early gener-
ations. Yield per plant followed a similar pattern as tillers per plant
(Table 6). The negative heterotic value was not as large for grain
yield as for tillers number, due perhaps to compensatory effects by
the other yield components, except tiller number.
Kernel weight showed some heterosis in respect to the mid-
parent when all crosses were averaged (Table 6). The cross between
the two cultivars with the lowest kernel weight, i. e. Yaqui 50 /Olesen,
had the highest heterotic effects. Each parent may have contributed
different genes that enhanced kernel weight in the F1, and recombina-
tions with higher kernel weight than both parents are possible provided
it was not all due to non-additive gene action. The cross between the
two cultivars with the highest kernel weight, Sonora 64 /Tordo, showed
46
very little heterosis. However, the heterosis values for this trait
were positive with respect to both the midparent and high parent.
Because these effects remained positive in the F2, the genetic vari-
ance was probably additive and some lines with higher kernel weight
than the parents could be selected from this cross. The amount of
heterosis observed for the remaining traits was very small, and hence
additive gene action was involved in the expression of these traits
(Tables 4, 5, and 6). This was confirmed by the lack of a significant
change in the heterotic values from the F1
to the F2 generations.
Crosses with the parental cultivar Tordo were the only ones in
which negative heterosis values for plant height were observed, con-
firming that some non-additive gene action is involved in the expres-
sion of height in those crosses made with this cultivar. Non-additive
gene action for reduced plant height could be very important in a
hybrid wheat program because with heterosis for grain yield lodging
becomes a big problem. Crosses between tall standard varieties and
semidwarf wheats derived from Norin 10 usually have the greatest
heterosis for grain yield. However, because tallness is usually
dominant over shortness, the F1
is tall and lodges very often (CIMMYT
report, 1968). Tordo or Tom Thumb derivatives could be used as a
means of producing short Fi hybrids that do not lodge because of the
dominance for short stature in the F1
generation.

47
Days to heading showed almost no heterosis. In general, the F1
crosses were a little bit earlier than the late parent and later than the
midparent. Days to maturity followed the same trend as days to
heading. Therefore, it seems possible to select for earliness, if
desired, in early generations. Sonora 64 and Olesen would be the
best parents for earliness.
Number of spikelets per spike showed no heterosis. The cross
Yaqui 50/Tordo had the largest number of spikelets as well as the
longest head size? a trait which also showed no heterosis. Vicam 71
and Olesen have very compact and small heads and when these culti-
vars are crossed to other parents the F1
and F2 generations showed
negative heterosis values for head size and rachis internode length.
This negative characteristic would have to be overcome when using
Olesen and Vicam 71 as parents if an increase in head size is one of
the objectives. From the analysis of heterosis, additive gene action
was important in the genetic mechanism for earliness, plant height,
rachis internode length, head length, and number of spikelets per
spike. The possibility exists that selection could be practiced for
these traits in early generations with good probabilities of success.
Harvest index showed some positive heterosis values in relation to the
midparent but none with respect to the high parent. Crosses between
short and tall cultivars had the most heterosis with respect to the
midparent and had the least heterosis with respect to the high parent.

48
For the wheats used in this study, a high harvest index was an indica-
tion of short plant height. Since effective selection for short strawed
wheats is quite possible, the same would be true for high harvest
index, a character that some investigators consider an indication of
more efficient translocation of assimilates to the kernel (Syme, 1972).
There were also indications, except with tiller number, that additive
gene action was present in the expression of components of yield.
Heritability - The amount of variability observed for a trait in
a population of plants may be due to: 1) differences in the genetic
constitution of the individual plants, 2) differences in the environment
to which each of the genotypes is being exposed, and 3) genotype-
environment interactions. Therefore it is important to understand the
relative role of heredity, the environment, and their interaction in
the variability observed in the character(s) under study.
Broad sense heritability values estimate that proportion of the
total variability which is due to genetic causes, without specifying as
to the nature of gene action that is involved in the expression of the
trait in question. Heritability in the broad sense is very useful when
working with cross-pollinated or vegetatively propagated crops that
can be used commercially as F1
hybrids.
Narrow sense heritability is a more refined way of examining
the relationship between environment and heredity. Narrow sense
heritability estimates are computed on the basis of the additive genetic

49
variance, and hence gives a better indication of the degree to which a
progeny will resemble its parents in latter generation. Working with
self-pollinated crops, it is the additive part of the genetic variance
that is most important in terms of the effective progress that can be
made through selection.
Broad sense heritability estimates in the present experiment
varied from 14.5 percent for number of tillers per plant to 90.7
percent for plant height (Tables 3 and 10). More than one half of the
phenotypic variability for the expression of plant height, days to
heading, head length, days to maturity, number of kernels per spike-
let, head grain weight, and grain filling period, was due to genetic
reasons (Tables 3, 7, 8, 9, and 10). The environment accounted
for more than one half of the total variability in number of tillers
per plant, grain yield per plant, and harvest index (Tables 7 and 10).
The range of variability for the heritability estimates was smaller
for those traits that showed higher Hbs values while the opposite was
true for those traits that had lower Hbs values. Plant breeders often
encounter difficulty when trying to select in early generations for
superior genotypes for traits such as tillering capacity or yield, be-
cause it is very difficult to separate the effects of the environment
from those of heredity. Therefore, selection for these traits in rela-
tively homozygous lines should be delayed to later generations, when

Table 7. Means, variances (Var.), coefficients of variation (C.V.), broad sense heritability (Hbe), narrow sense heritability (Hns),and number of observations (n) for Harvest Index, Days to Heading, Rachis Internode Length, in ten spring wheat crosses andtheir parents.
HARVEST INDEX DAYS TO HEADING RACHIS INTERNODE LENGTHCROSS or PARENTAL MEAN VAR. L.V. Hbs Hns n NEAR VAR. C.V. Hbs Hns n
%
MEAN VAR, C.V. Hbs HnsYaqui 50 28.84 15.37 13.60 54 99.76 8.56 2.93 54 5.65 .126 6.29 34Sonora 64 43.48 10.95 7.61 68 85.08 2.50 1.86 68 5.03 .294 10.78
42.9 41.268
Sonora 64/Yaqui 50 19.2 >100 71.4 64.5Fl 39.48 7.17 6.78 33 94.21 20.11 4.76 33 5.29 .215 8.76 33F2 37.61 13.81 9.88 53 96.01 36.39 6.28 100 5.16 .371 11,80 99Backcross 1 41.50 13.66 8.91 30 95.76 33.62 6.05 54 5.16Backcross 2
.2861..1:
5234.91 54.64 21.17 7 100.47 15.68 3.94
Sonora 64 /Olesen 44.3 28.9 76.7 48.968 5.32
62.3 19.167
Fl 45.53 2.21 3.27 30 94.80 12.72 3.76 30 4.71 .083 6.14 30F2 43.48 12.48 8.13 91 91.43 38.98 6.83 137 4.66 .441 14,25 137Backcross 1 43.44 10.33 7.40 33 94.96 25.56 5.32 81 4.70 .405 13,54 81Backcross 2 43.99 11.02 7.55 49 93.52 33.35 6.17 81 4.99 .393 12.57 81
78.7 67.9Sonora 64/Tordo 49.2 41.3Fl 44.43 7.28 6.07 31 97.03 14.76 3.96 31 5.20 .151 7.48 31F2 43.85 16.92 9.38 74 94.71 37.59 6.47 138 5.19 .456 13.01 138Backcross 1 46.76 15.45 8.41 19 98.94 20.75 4.60 84 5.29 .347 11.14 82Backcross 2 43.99 11.40 7.68 62 93.11 28.91 5.77
74.3 42.288 5.05 .308 10.99
69.2 19.188
Yaqui 50 /Olesen 46.1 32.8Fl 42.70 2.37 3.61 29 98.24 4.26 2.10 29 4.87 .245 10.16 29F2 41.12 15.72 9.64 77 97.92 32.22 5.80 213 4.81 .533 15.19 211Backcross 1 43.54 15.26 8.97 57 98.20 27.72 5.36 162 4.56 .478 15.15 161Backcross 2 36.78 11.02 9.03 53 101.23 23.13 4,75
63.2 32.4153 5.11 .486 13.64
63.6 26.2 150Yaqui 5b7Tordo 59.7 36.4Fl 42.18 3.05 4.14 29 100.30 12.67 3.53 29 5.68 .204 7.96 29F2 37.32 21.48 12.42 63 100.61 25.35 5.00 235 5.32 .431 12.34
.438 11.78234
Backcross 1 41.07 16.93 10.02 21 100.52 19.28 4.37 159 5.6237 102.50 23.22 4.70 148 5.51
44.2 39.5 1'1'1
18.21 11.85 .311 10.12Backcross 2 . 01
Vicam 71/Sonora 64 43.3 29.2 77.9 75.8Fl 45.42 9.87 6.92 36 95.67 20.46 4,73
106 93.11 41.01 6.8836 4.68 .147 8.20
.319 11.9936
F2 45.32 15.93 8.81 140 4.71 14046 94.63 28.69 5.49 .238 10.99Backcross 1 43.18 8.74 6.85 8569 92.64 22.24 5.09
4.44 8475 .274 10.86Backcross 2 42.49 18.47 10,11
83.8 83.0 63.4 11.475
Vicam 71/Yaqui 50 61.6 53.3Fl 34 99.38 5.88 2.44 .145 7,7540.49 2.11 3.59 34 4.92 34F2 39.00 20.62 11.64 83 99.56- 38.37 5,22 236 4.59 .332 12.55
52 100.32 19.06 4.35 .309 12.41236
Backcross 1 41.57 13.91 8.9744 102.88 25.83 4.94
139 4.48.317 10.95
137Backcross 2 35.03 16.33 11.54 134 5.14 134
Vicam 71 /Olesen 61.1 34.6Fl 45.25 5.48 5.17 29 97,69 11,94 3.54
62.3 47.04.20 .063 6.00
58.6 50.4
F2 43.86 16.64 9,30 26 98.72 24.86 5.0529
.224 11.1529
25 97.63 25.36 5.16101 4.24
.223 10.70101
Backcross 1 43.05 14.48 8.84 51 4.41Backcross 2 43.63 13.35 8.37 7 99.67 12.68 3.57 .112 7.72
5145 4.34
Vicam 71/Tordo 50.4 32.5 69.4 60.4 63.4 42.445
Fl 43.01 2.47 3.66 34 7.15 2.7099.06 .082 6.0972 98.79 19.73 4.50
34 4.70.288 11.55
34F2 43.48 10.95 7.61 150 4.65 150Backcross 1 45.13 9.46 6.82 813 101.05 12.45 3.49 4.94 .227 9.64Backcross 2 42.62 8.88 6.99 29 98.69 15,10 3.94 .227 10.77
8182 4.43
63.3 58.3 69.1 60.781
Tordo/Olesen 61.5 34.036 97.83 9.91 3.22 4.87 .039 4.04F1 44.98 3.61 4.22 36
.326 11.8336
F2 43.28 16.35 9.34 14 97.44 26.04 5.2417 96.09 18.05 4.42
79 4.83 79-0Backcross 1 45.07 12.14 7.73 65 4.58 65.240 10.70
Backcross 2 40.73 15.00 9.51 3 101.46 18.84 4.28 35 4.86 .214 9.50 3569 97.12 4.22 2.12 4.24 .U93 7.18Vicam 71 44.12 6.26 5.6757 90.26 11.98 3,83
69 69Olesen 45.34 7,70 6.12
63 98.05 6.76 2.6557
.141 6.98574.38 .122 8.00
Average 72.1 58.D5.37 65 LATordo 43.95 7,5.7 5.26
49.6 35.9 59.4 36.6 CD

Table 8. Means, variances (Var.), coefficients of variation (C.V.)., broad sense heritability (Hbs), narrow sense heritability (Hns),and number of observations (n) for Number of Spikelets per Spike, Head Length, Days to Maturity in ten spring Wheat crossesand their parents.
NUMBER OF SPIKELETS PER SPIKE HEAD LENGTH DAYS TO MATURITY
CROSS or PARENTAL MEAN VAR. C.V. fits Hns n MEAN VAR. C.V. Hbs Hns n MEAN VAR. C.V. Hbs Hns nYaqui 50 25.14 2.13 5.80 55 14.24 1.50 8.60 55 145.85 6.35 1.73 55Sonora 64 21.45 1.96 6.53 68 10.82 1.63 11.79 68 137.00 9.52 2.25 68Sonora 64/Yaqui 50 72.0 44.0 49,3 45.2 47.2 45.4
Fl 23.57 1.75 5.61 33 12.47 1.51 9.87F2 23.36 6.95 11.29 101 12.03 3.05 14.51
33 138.15 6.01 1.77 33101 139.48 13.80 2.66 102
Backcross 1 22.49 4.24 9.16 54 11.59 3.29 15.65 53 140.51 10.72 2.33 55Backcross 2 24.20 6.60 10.62 69 12.88 1,43 9.28 69 142.54 10.62 2.28 70
Sonora 64/01esen 67.3 44.230 10,87
61.-6 5.8 69.4 65.1F1 .72 3.69 .57 6.93 30 140.73 3.69 1.36 3023.03
137 10.60 2.43 14.71F2 22.73 4.55 9.38 137Backcross 1 22.34 2.25 6.72 84 10.45 3.95 19.10
137 138.80 17.66 3.0384 140.28 11.00 2.36 84
Backcross 2 21.60 4.84 10.19 81 10.75 2.18 13.74 81 139.89 12.82 2.56 81Sonora 64/Tordo 65.4 54.5 45.9 45.-3 38.8 36.8
31 11.71 1.55 10.6-0Fl 22.48 2.32 6.78 31 141.58 9.45 2.17 31138 12.14 2.69 13.50F2 23.47 6.63 10.97 138 139.12 14.52 2.74 138-85 12.73 2.14 11.49Backcross 1 24.33 6.19 10.23 8588 11.12 2.02 12.78
86 142.89 11.19 2.34Backcross 2 22.02 3.46 B.45 88 138.31 12.81 2.59 88
Yaqui -51T/ bilesen 69.3 31.0 75.1 65.3 74.2 52.829 11,83 1.63 10.79Fl 24.28 1.21 4,52 29 140.96 2.96 1.22 29
240 11.93 4,99 18.72F2 24.54 5.55 9.60 238 142.70 17.18 2.90 232166 10.-82 3.14 16.38Backcross 1 23.99 5.55 9.82 166 141.78 9.96 2.23 167
Backcross 2 24.41 3.83 8.02 163 12.57 3.58 15.05 164 142.54 15.33 2.7563.1 16.6
166Yaqui 50/Tordo 67.1 36.7
29 14.60 1.51 8.4161.4 53.5
Fl 25.48 2.67 6.41 29 145.07 9.56 2.13 29278 13.49 3,79 14.44F2 25.24 7.50 10.85 278 143.62 20,39 3.14 267159 13.83 4.-03 14.52Backcross 1 24.90 7.94 11.32 159 143.47 13.48 2.56 160
Backcross 2 25.39 4.31 8.18 163 14.01 2.92 12.20 163 144.31 16.39 2.80 165Vicam 71 /Sonora 64 31.1 20.8 65.9 59.5 55.1 54.6
Fl 22.72 2.92 7.52 36 10.61 1.33 10.87 36 139.61 7.56 1.97 36142 10.83 3.43 17.10 142 138.89 16.87 2.95F2 23.04 3.56 8.19 142
Backcross 1 23.36 3.24 7.71 87 10.32 1.73 16.76 87 140.73 12.45 2.51 87Backcross 2 21.45 3.14 8.26 75 10.34 3.09 17.00 75 137.15 12.07 2.53 75
72.7 49.7Vicam 71/Yaqui 50 59.6 45.734 12.48
76.1 62:5--Fl 25.29 2.58 6.35 .93 7.73
264 11.43 3.64 16.6934 142.17 4.21 1.44 34
264 142.70 22.57 3.332 24.85 5.93 9.80147 10.95 2.22 13.59
264Backcross 1 24.67 5.59 9,58 147 14..1, _,..57 2.49 145Backcross 2 24.85 3.56 7.59 156 12.83 3.25 14.06 156 143.40 18.51 3.00 156
.3 42.9Vicam 71/01esen 57.5 54,4 76 64.5 50.1Fl 23.65 1.95 5.90 29 9.91 .41 6.47 29 142.38 5.38 1.63 29
128 10.03 2.19 14.77F2 23.87 4.87 9.24 129 142.14 14.10 2.64 109Backcross 1 23.25 3.54 8.09 63 10.25 1.58 12.27
9489 1.86 13.7963 140.71 10.21 2.04 58
Backcross 2 23.11 3.55 8,15 6669,2 58.1
66 142.26 10.93 1.85 53Vicam 71 /Tondo 48.1 4.7 50.7
40'2Fl 25.15 1.95 5.55 .82 7.64152 11.40 2.77 14.60
34 143.11 3.50 1.3134 11.82 34F2 24.59 4.52 8.65
82 12.61 1.78 10.57152 141.48 11.40 2.39 151
Backcross 1 25.50 3.36 7.1983 10.77 2.15 13.62
82 143.77 8.15 1.99 82Backcross 2 24.27 5.47 9.64
70.2 58.383 141.70 10.07 2.24
46.9 24.884
Tordo/Olesen 64.6 23.0Fl 24.33 1.14 4.39 .48 5:84
104 11.45 2.54 13.91 104141.80 2.79 1.18 36
F2 23.91 5.21 9.5478 10.97 1.21 10.03
04 142.34 9.09 2.12 89Backcross 1 24.00 4.95 9.27
47 11.44 2.39 13.5178 141.94 7.74 1.96 71
Backcross 2 23.40 4.27 8.8370 10.18 .55 7,29
47 143.03 8.19 2.00 37Vicam 71 23.91 2.48 -6.58
57 10.1765 13,46
.60 7.6370 141.71 5.65 1.68 7057 141.23 4.00 1.42 57Olesen 23.28 1.78 5.73
1.19 8,1-0Tondo 25.08 2.61 6.44 -65 145.37 7.70 1.91 65Average 60.2 35.9 64,9 44.7
..._58.4 48.6
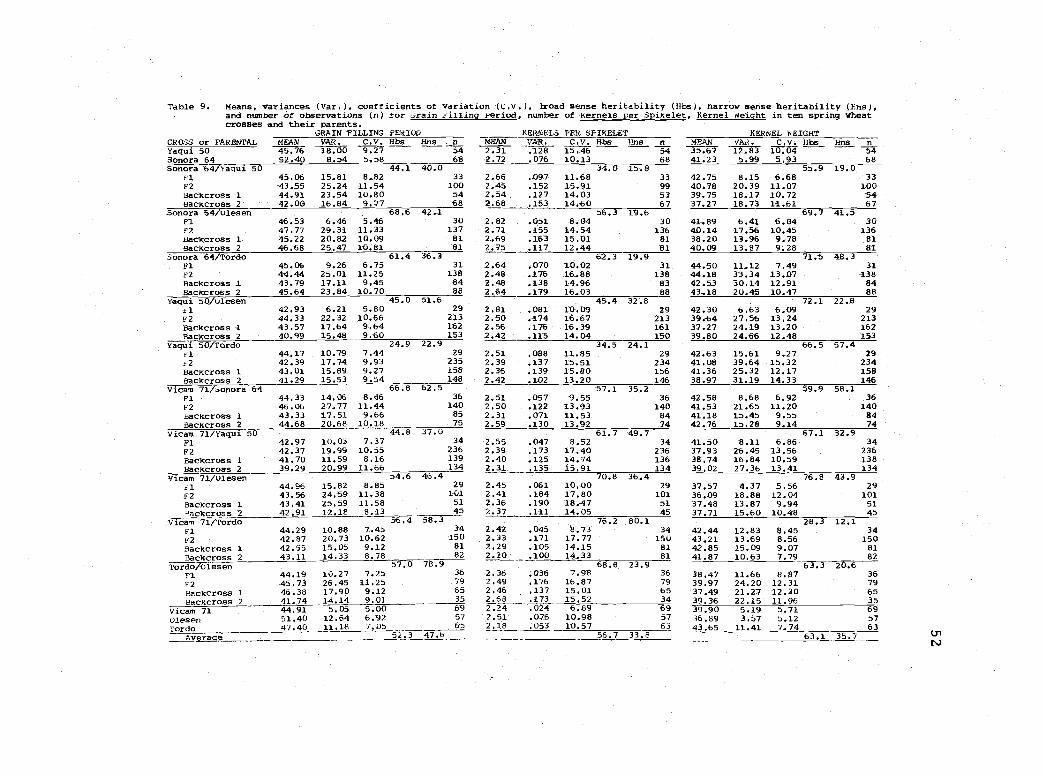
Table 9. Means, variancesand numbercrosses
CROSS or PARENTAL
(Var.), Coefficientsof observations (n)
and their parents.GRAIN FILLING
of variation 1C.V.), broad sense heritability (Hbs), narrow sensefor Grain Filling Period, number of Kernels per Spikelet, Kernel Weight
heritability (Ens),in ten spring wheat
WEIGHTPERIOD KERNELS PER SPIKELET KERNELMEAN VAR. C.V. Hbs Ens -MEAN VAR. C.V. Hbs Hns n MEAN C.V. Hbs Hns
Yaqui 50 45.76 18.-00 9.27 54 2.31 .126 15.46 54 35.67 12.83 076TSonora 64 52.40 8.54 5.58 68 2.72 .076 10.13 68 41.23 5.99 5.93 68Sonora 64/Yaqui 50 44.1 40.0 34.0 15.8 55.9 19.0
el 45.106 15.81 8.82 33 2.66 .997 11.68 33 42.75 8.15 6.68 33F2 -43.55 25.24 11.54 100 2.45 .152 15.91 99 40.78 29.39 11.97 100-Backcross 1 44.91 23.54 10.80 54 2.54 .127 14.03 53 39.75 18.17 10.72 54Backcross 2 42.00 16.84 9.77 68 2.68 .153 14.60 67 37.27 18.73 11.61 67
Sonora 64/Lassen 68.6 42.1 56.3 19.6 69.7 41.5Fl 46.53 6.46 5.46 30 2.82 .051 8.04 30 41,89 6.41 6.04 30F2 47.77 29.31 11.33 137 2.71 .155 14.54 136 4D.I4 17.56 10.45 136Backcross 1 45.22 20.82 10.09 81 2.69 .163 15.01 81 38.20 13.96 9.76 81Backcross 2 46.68 25.47 19.61 81 2.75 .117 12.44 81 40.09 13.87 9.28 81
Sonora 64/Tordo 61.4 36.3 62.3 19.9 71.5 48.3Fl 45.06 9.26 6.75 31 2.64 .070 19.92 31 44.50 11.12 7.49 31F2 44.44 25.01 11.25 138 2.48 .176 16,88 138 44.18 33.34 13.97 138Backcross 1 43.79 17.11 9.45 84 2.48 .138 14.96 83 42.53 30.14 12.91 84Backcross 2 45.64 23.84 10.70 88 2.64 .179 16.03 88 43,18 20.45 10.47 88
Yaqui 50 ulesen 45.0 51.6 45.4 32.8 72.1 22.8Fl 42.93 6.21 5.80 29 2.81 .081 19.09 29 42.30 6.63 6.09 29F2 44.33 22.32 10.66 213 2.50 .174 16.67 213 39.64 27.56 13.24 213Backcross A 43.57 17.64 9.64 162 2.56 .176 16,39 161 37.27 24.19 13.20 162Backcross 40.99 15.48 9.60 153 2.42 .115 14.04 150 39.80 24.66 12.48 153
Yaqui 50/Tardo 24.9 22.9 34,5 24.1 66.5 57.4El 44.17 10.79 7.44 29 2.51 .988 11.85 29 42.63 15.61 9.27 29F2 42.39 17.74 9.93 235 2.39 .137 15.51 234 41.08 39.64 15.32 234Backcross 1 43.01 15.89 9.27 158 2.36 .139 15.80 156 41.36 25.32 12.17 158Backcross 2 41.29 15.53 9.54 148 2.42 .102 13.20 146 38.97 31.19 14.33 146
Vicam 71/Sonora 64 66.8 62.5 57.1 35.2 59.9 58.1Fl 44.33 14.06 8.46 36 2.51 .057 9.55 36 42.58 8.68 6.92 36E2 46.06 27.77 11.44 140 2.50 .122 13.93 140 41.53 21.65 11.20 140Backcross 1 43.33 17.51 9.66 85 2.31 .071 11.53 84 41.18 15.45 9.55 84Backcross 2 44.68 20.68 10.18 75 2.59 '.130 13.92 74 42.76 15.28 9.14 74
Vicam 71/Yaqui 50 44.8 37.0 61.7 49.7 67.1 32.9Fl 42.97 10.03 7.37 34 2.55 .047 8.52 34 41.50 8.11 6.86 34F2 42.37 19.99 10.55 236 2.39 .173 17,40 236 37.93 26.45 13.56 236Backcross 1 41.70 11.59 8.16 139 2.40 .125 14.74 136 38.74 16.84 10.59 138Backcross 2 39.29 20.99 11.66 134 2.31 .135 15.91 134 39.02 27.36 13.41 134
Vicam 71/01esen 54.6 46.4 70.8 36,4 76.8 43.9fl 44.96 15.82 8.85 29 2.45 .061 10.00 29 37.57 4.37 5.56 29F2 43.56 24.59 11.38 101 2.41 .184 17.80 191 36.09 18.88 12.04 101Backcross 1 43.41 25.59 11.58 51 2.36 .190 18,47 51 37.48 13.87 9.94 515ackcross 2 42.91 12.18 8.13 45 2.37 .111 14.05 45 37.71 15.60 10.48 45
Vicam 71/Tordo 56.4 58.3 76.2 80,1 28.3 12.1Fl 44.29 19.88 7.45 34 2.42 .045 8.73 34 42.44 12.83 8.45 34F2 42.87 20.73 10.62 150 2.33 .171 17.77 150 43.21 13.69 8.56 150Backcross 1 42.55 15.95 9.12 81 2.29 .105 14.15 81 42.85 15.09 9.07 81Backcross 2 43.11 14.33 8.78 82 2.20 .100 14.33 81 41.87 10.63 7.79 82
Tordo7oiesen 57.0 78.9 68.8 23.9 63.3Fl 44.19 10.27 7.25 36 2.36 .036 7.98 36 38.47 11.66 8.87 36F2 45.73 26.45 11.25 79 2.49 .176 16.87 79 39.97 24.20 12.31 79Backcross 1 46.38 17.90 9.12 65 2.46 .137 15.-01 65 37.49 21.27 12.30 65Backcross 2 41.74 14.14 9.01 35 2.68 .173 15.52 34 39.36 22.15 11.96 35
Vicam 71 44.91 5.05 5.00 69 2.24 .024 6.89 69 39.90 5.19 5.71 69Olesen 51.40 12.64 6.92 57 2.51 .076 10.98 57 36.89 3.57 5.12 57Tordo 47.40 11.18 7.05 65 2.18 .053 10.57 63 43.65 11.41 7.74 63
Average 52.3 47.6 56-7 33.8 63.1 35.7

Table 10. Means, variancesand numberand their
CROSS or PARENTAL
(Var.), coefficients of variation (C.V.)4 broad sense heritability (Hbs), narrow sense heritability (fins),of observations (n) for Number of Tillers per plant, Yield per plant, Head Weight in ten spring wheat crosses
parents.NUMBER uF TILLERS YIELD HEAD WEIGHT
MEAN VAR. C.V. Hbs Hns n MEAN VAR. C.V. Hbs Hns n MEAN VAR. C.V. Hbs Fins nYaqui 50 32.14 143,90 37.32 55 64.87 500.13 34.47 54 2.07 .144 18.35 54Sonora 64 24.22 93.79 39.98 68 58.34 545.09 40.02 68 2.40 .098 13.05 68Sonora 64/Yaqui 50 30.4 7100 13.4 77.5 35.3 23.1
El 23.30 47.22 29.49 33 63.11 452.92 33.72 33 2.66 .144 14.27 33P2 26.30 136.39 44.41 101 61.08 576.42 39.30 100 2.32 .199 19.23 99Backcross 1 21.68 47.01 31.62 54 48.67 201.29 29.15 53 2.28 .184 18.81 53Backcross 2 23.67 80.87 38.00 69 57.05 404.64 35,26 68 2.40 .168 17.04 67
sonora 64/01esen 8.2 36.6 18.3 47.5 64.0 16.7Fl 20.07 37.86 30.66 30 54.17 247.96 29.07 30 2.72 .085 10.68 30F2 20.97 69.92 39.87 137 51.88 482.79 42,35 137 2.45 .239 19.95 136Backcross 1 17.48 42.25 37.17 84 41.45 316.75 42.93 81 2.31 .207 19.69 81Backcross 2 21.13 71.99 40.14 81 49.97 419.36 40.98 81 2.37 .231 20.27 81
Sonora 64/fordo 7.0 >100 4,5 61.8 48.9 13.6Fl 13.74 23.60 35.35 31 37.82 310.97 46.62 31 2.64 .164 15.34 31P2 21.80 68.40 37,94 138 56.21 429.01 36.85 138 2.57 .257 19.73 138Backcross 1 18.05 31.43 31.07 86 46.17 276.60 36.02 84 2,54 .237 19.17 84Backcross 2 16.86 34.55 34,86 88 42.97 316.48 41.40 88 2,49 .242 19.76 88
Yaqui 50/Ulesen 26.1 74.3 11.1 27.9 63.4 15.8Fl 21.90 54.95 33.85 29 63.35 519.38 35.97 29 2.88 .081 9.91 29
26.85 117.24 40.33 240 62.57 518.70 36.40 213 2.41 .273 21.66 213Backcross 1 20.86 70.12 40.14 166 46.80 434.42 44.53 162 2.29 .341 25.48 161Backcross 2 20.98 77.27 41.90 164 50.48 458.41 42.41 153 2.33 .162 17.24 151
Yaqui 50/Pordo 5.0 68.9 8.8 61.0 53.7 53,4Fl 20.31 56.36 36.96 29 54.19 408.89 41.21 29 2.71 .171 15.27 29F2 21.14 95.97 46.34 278 50.71 501.42 44.16 235 2.45 .322 23.11 234Backcross 1 19.71 53.41 37.08 159 46,96 341.32 39.34 159 2.43 .297 22.45 156Backcross 2 21.26 72.40 40.03 163 50.75 355.61 37.16 146 2.37 .175 17.67 146
Vicam 71/Sonora 64 9.0 87.9 8.6 76.5 53.8 7.7Fl 20.11 45.53 33.55 36 49.95 532.94 46.21 36 2.42 .096 12.81 36F2 25.39 89.27 37.21 142 61.03 570.12 39.12 140 2.38 .169 17.27 140Backcross 1 20.71 63.37 38.43 87 47.93 415.72 42.53 85 2,23 .139 16.72 84Backcross 2 15.65 36.72 38.71 75 37.84 288.48 44.88 75 2.40 .186 17.97 74
Vicam 71/Yaqui 50 7.2 24.5 9.7 46.7 52.4 41.6Fl 30.44 58.98 29.20 34 81.33 528.60 28.27 34 2.66 .080 10.62 34F2 26.15 110.47 40.01 263 58.52 558.87 40,40 236 2.23 .185 19.30 236Backcross 1 24.44 100.70 41.06 147 56.16 536.44 41.24 138 2.28 .141 16.50 136Backcross 2 24.17 93.20 39.95 156 52.35 320.42 34.19 134 2.21 .152 17.64 134
Vicam 71/ulesen 16.5 3.5 16.] 46,8 62.8 13.2Fl 22.07 86.21 42.07 29 48.19 579.28 47.74 29 2.18 .088 13.66 29P2 27.55 100.50 36.38 128
64R:628548.90 37.42 101 2.12 .182 20.11 101
Backcross 1 22.59 113.41 47.15 63 504.80 46.15 51 2.07 .178 20.38 51Backcross 2 23.17 84.11 39.59 66 57.38 336.05 31.95 45 2.13 .162 18.90 45
Vicam 71/Cordo 13.0 77.3 8,8 45,1 63,6 62,3P1 21.53 76.92 40.74 34 54.53 395.36 36.46 34 2.54 .117 13.49 34F2 20.41 89.44 46.34 152 51.35 458.55 41.70 150 2.47 .265 20.82 150Backcross 1 18.10 58.19 42.15 82 44.94 294.54 38.19 81 2.49 .181 17.09 81Backcross 2 21.64 51.53 33.18 83 49.86 415.65 40.89 82 2.24 .184 19.14 81
Tordo/Ulesen 22.7 69.4 51.1 79.7 67.5 31.4Fl 22.17 51.17 32.27 36 48.95 232.94 31,18 36 2.23 .066 11.53 36F2 23.89 79.98 37.43 104 61.37 660.78 41.89 79 2.43 .280 21.74 79Backcross 1 24.49 63.47 32.54 78 55.51 347.57 33.58 65 2.25 .212 20.46 65Backcross 2 13.87 40.94 46.12 47 36.62 447.10 57.74 34 2.17 .260 23.50 35
Vicam 71 31.40 104.53 32.56 70 68.64 486705 32.12 69 2.15 .040 9.29 69Olesen 21.53 61.00 36,28 57 46.96 363.77 40.62 57 2.14 .075 12.81 57Fordo 24.01 73.36 35.66 65 57.32 373.32 33.70 63 2,39 .132 15.21 63
Average 14.564.2 15.1 57.1 56.5 27.9

54
the role of environment can be better assessed through replications
over locations and years.
Narrow sense heritability estimates were in general smaller
than Hbs values. There were, however, two exceptions: number of
tillers per plant and grain yield per plant. Narrow sense heritability
estimates were very high for these traits and in two crosses Hns
estimates for number of tillers per plant were over 100 percent.
Broad sense heritability estimates for tiller number and yield, how-
ever, were slightly less than those reported previously for wheat
(Johnson, et al., 1966). In general, Hns values for grain yield and to
a lesser degree for number of tillers per plant in wheat have been
reported by other workers to be low (Alcala, 1973; Anwar and
Chowdhry, 1969; Singh and Anand, 1971b) and even negative heri-
tability values in both narrow sense and broad sense have also been
reported for these two traits (Johnson, et al. , 1966; Daaloul, 1973).
The analysis of variance showed that differences among parental
lines and between the different generations for plant grain yield and
number of tillers per plant were not as great as they were for all the
other traits, even though the means of the parental cultivars were
widely separated (Table 10). The effects of the environment on the
expression of tiller number and grain yield may have been so great
as to inflate the error term, making differences more difficult to
detect. The same reasons may account for the discrepancies observed

55
between Hbs and Hns. Sometimes the variances for tiller number and
grain yield per plant in the F2
were smaller than the parental and F1
variances with the backcrosses variances being the smallest (Table
10). When using Warner's formula for calculating Hns (1952), the F2
variances were doubled while the summation of the BC variances was
quite small. Methods available to estimate heritability are based on
the assumption that interactions between additive and non-additive
effects, non-additive gene action interactions, and genotype-environ-
ment interactions have a value of zero. As a result the additive
and/or dominance components of variance may be inflated (Allard,
1960). Inflation of the additive gene effects for tiller number and plant
grain yield could have occurred in this experiment and as a conse-
quence very high Hns estimations were obtained.
Narrow sense heritability estimates for plant height were con-
sistently high for all 10 crosses (Table 3). Values ranged from 74.3
to 88.2 percent. Therefore, plant height is considered a highly
heritable trait that can be selected for in the F2 and F3 generations.
Narrow sense heritability values for days to heading were also high,
with the crosses Vicam 71/Yaqui 50, Vicam 71/Sonora 64, and Sonora
64/Tordo having the largest values. For days to maturity Hns ranged
from 65.1 percent in the cross Sonora 64 /Olesen to 24.8 percent in
the cross Tordo/Olesen. Most of the crosses had heritability values
for this character of 50 percent or more, so selection for early or

56
late material could be made in early generations. Length of grain
filling period was also a trait with high additive genetic effects.
Crosses with the highest heritability values in the narrow sense were
Tordo/Olesen (78.9 percent), Vicam 71/Sonora 64 (62.5 percent),
and Vicam 71/Tordo (58.8 percent).
Rachis internode length and head length had similar Hns values;
the crosses Yaqui 50 /Olesen and Tordo/Olesen had the highest Hns
values. Tordo was a good parent in terms of head size; additive gene
action was significantly present in the expression of this trait in all
the crosses made with this cultivar.
Narrow sense heritability estimates for head grain weight and
harvest index were low when averaged for all the crosses. However,
there were two crosses with high levels of additive gene action for
these traits. Vicam 71/Tordo had a Hns value for head weight of
62.3 percent and the cross Vicam 71/Yaqui 50 had a harvest index
Hns value of 53.3 percent indicating that additive gene action could be
important in the expression of these traits in these two crosses.
Heritability estimates for harvest index were consistently lower than
those for plant height, hence selection for short strawed genotypes
would probably be a more efficient way of improving grain to straw
ratios.
When all the crosses were averaged Hns estimates for the other
yield components besides number of tillers per plant were relatively
57
low. However, there were some crosses that showed high Fins esti-
mates for some of the yield components. Sonora 64/Tordo had a Hns
estimate of 54.5 percent for number of spikelets per spike. Vicam
71/Sonora 64 (58.1 percent), Yaqui 50/Tordo (57. 4 percent) and
Sonora 64/Tordo (48.3 percent) were crosses where additive gene
action was important in the expression of kernel weight. For kernels
per spikelet Fins was particularly high in the cross Vicam 71/Tordo,
indicating that it should be possible to select plants with a large num-
ber of kernels per spikelet with the high kernel weight of Tordo.
The characters studied can be ranked as follows according to
the magnitude of additive gene action involved in their expression as
estimated by }Ins: plant height, number of tillers per plant, days to
heading, plant grain yield, days to maturity, length of grain filling
period, head length, rachis, internode length, harvest index, number
of spikelets per spike, kernel weight, number of kernels per spikelet
and head weight. However, the estimates of Hns for plant yield and
number of tillers per plant were particularly high and there is the
possibility that they are overestimations of the amount of addive gene
action involved in the expression of this traits.
Correlations among agronomic traits - The practice of selection
for several traits at one time requires a knowledge of the interrela-
tionships that exist among and between them. Phenotypic correlations,
which are very often used to evaluate associations among traits, are
58
sometimes influenced to a large extent by environmental effects.
Therefore correlations at the genotypic level may give a better idea
of the gene associations existing in a population.
Genotypic correlations may be computed from phenotypic and
environmental correlations and either narrow or broad sense herita-
bility estimates. In self-pollinated crops narrow sense heritabilities
are more appropriate for calculating genetic correlations because
genetic associations with additive gene action will probably remain the
same after several generations of selfing. However, in the present
experiment, Hns estimates for number of tillers per plant and plant
grain yield appeared to be overestimations of the additive components
of variance; therefore, broad sense heritabilities were judged to be
more appropriate for calculating genetic correlations involving these
two traits. For the remaining 11 characters the genetic correlations
were the actual breeding values because Hns estimates were used for
their computation. The phenotypic, environmental and genotypic cor-
relations were calculated for all possible combinations of 13 charac-
ters in every cross (Tables 11 to 20). Because a large number of
observations were used to compute the correlations and degrees of
freedom were quite large, probability levels of significance were not
assigned.
In general the magnitude of the phenotypic and environmental
correlations was consistent, to some extent, for all crosses. There
was, however, a lack of consistency for the genotypic correlations.

Tab(ell. Yhenotypic (rPh), environmental (rE), and genotypic (rG) correlations between all pairs of the thirteen characters measured for thewheat cross -onora 64/Yaqui 50.
TillersspikeletNumber
Kernelsper
SpikeletKernelWeight
Headweight Height
Days toHeading
days toMaturity
GrainFillingPeriod
HeadLength
rachisInternode
HarvestIndex
Yield rPh .8490 .1188 .3886 .0131 .3957 .3477 -.0904 -.1880 .2599 .4183 .3837 .2673rE .8748 .4362 .3.367 .1565 .5917 .4175 -.3430 -.1033 .6286 .3043 .2132 .2613r(:,(1) .8415 -.7617 .6947 -.7394 .4954 .5872 .3394 -.4742 -.8346 .8479 .9855 .3038
Tillers rph .1660 .1461 -.1931 .U557 .3578 -.0329 .2540 .2358 .4254 .4369 .1060
rrt:4(1)
.4578-.3276
-.0740.9251
.0054-.8203
.1108
.2613.3609.4794
-.2993.2617
-.0789.8146
.6604
.5476.1785.8502
.1625
.9406.1857
-.1377
Spikelet No. rph .1841 -.1409 .3400 .6157 .2146 .1504 -.1501 .6076 .3174 -.2903rE -.0069 .0503 .324/ .4547 .0577 .3768 .3751 .4906 -.0859 -.1564rG .7162 -.6045 .3981 ./939 .3545 -.129/ -.8531 .7530 .8612 -.6368
Kernell,pkt rph .1702 .8510 .4175 -.092/ -.0530 .0929 .3/55 .4983 .3972rE .3592 .8356 .3907 -.0/88 -.0875 .0796 .239U .4/74 .0342rG -.7298 .9349 .7687 -.1554 .0236 .1445 .7976 .6365 .1620
Kernel wt. rPh .4503 .0114 -.4610 -.5919 .1047 -.3137 -.2071 .3574rE .7016 .0556 -.4756 -.4812 .0843 -.0098 -,0304 .5919rG -.4937 -.0181 -.5883 -.9257 .1666 -.0223 -.6652 -.6358
Head Wt, rPh .4779 -.1616 -.2073 .0498 .3359 .0498 .4061rE .1863 -.270/ -.1690 .3096 .3058 .1451 .3212r6 .1564 -.0522 -.3020 -.5280 .4252 -.1548 .1261
Height rPh .1712 .0323 -.1831 .5803 .4856 -.5036rE .2862 .4615 .1469 .4498 .2192 -.3734rG .0857 -.1525 -.3848 .7317 .7101 -.9303
caws to rPh .5720 -.7767 ..1853 .1265 -.4031Heading rE .7675 -.6741 .3013 .3032 -.4588
rG, .4326 -.9166 .2823 -.0233 -.6983
(Jays to rPh .0675 .3625 .2487 -.3304Maturity rE .0311 .5092 .3450 -.5169
v7 .1166 .6149 .1230 .0438
Grain Filling rph -.0761 .0347 .2330Period rE .3293 -.0021 .1093
v) -.6230 .0885 .5661
Head Length rPh .8793 .0858rE .8249 -.1420V4 .9525 .6120
Sachis Internode rPh .2827rE .0523rG .8770
)Comoutation of genetic correlations for yiela and tillers were done using broad sense heritabilities. For all the other measured traits,narrow sense heritabilities were used.
U4

Table 12. Phenotypic (rPh). environmental (rE), and genotypic (rG) correlations between all pairs of the thirteen characters measured for thewheat cross Sonora 64/01esen.
FillersSpikeletNumber
Kernelsper
SpikeletkernelWeight
Headweight Height
oays toHeading
Days toMaturity
GrainFillingPeriod
HeadLength
RachisInternode
HarvestIndex
Yield rPh .9109 .3306 .3544 -.0181 .4048 .4437 -.2431 .3819 .5646 .4344 .2904 -.0814rE .9396 .4160 .2337 -.1219 .2675 .1632 -.0934 .2309 .5686 .4554 .2756 .2134rG(1) .7933 .1748 .8712 .2401 1.0532 .9819 .6109 .7492 .6252 .3386 .3548 -1.0612
Tillers rPh .2626 -.0436 -.2013 -.1290 .2623 -.2496 .4187 .6065 .4078 .2933 -.1641re .3555 -.1982 -.3657 -.2566 .0445 -.1311 .3910 ;5760 .4817 .3360 -.0946rG(1) .0429 .9992 .3615 .8151 .9366 -.7981 .8543 1.0041 .5821 .0299 -.5695
Spikelet Number rPh -.0772 -.1982 .2163 .0982 .1253 .2665 .0965 .3634 -.1210 -.2161rE -.2341 .0114 .1164 .0247 -.0091 .2741 .4540 .4646 -.0208 .0618rG .2704 -.4780 .5040 .1494 .2800 .1967 -.3745 .1659 -.3683 -.7135
Fernels/Spikelet rPh .0254 .7927 .3268 .0234 .1465 .0587 .0904 .1379 .1627rE .1471 .7843 -.0288 -.2546 -.2527 -.0238 .0660 .2041 .0077rG -.2647 .8338 .8343 .6027 .7849- .2609 .3091 -.1380 .6591
kernel Weight rPh .4533 .4089 -.1785 -.4384 -.1417 -.1057 -.0057 .1512rE .6325 .1126 -.7218 -.6077 .1209 -.3177 -.4104 .4672rG .0371 .6354 .4798 -.3152 -.5073 .8388 .9826 -.4334
Head ,,eight rPh .5047 -.0115 .D068 .0103 .1642 .0698 .1325rE .4372 -.4139 -.4771 .1796 .0868 -.1193 .1830rk4 .9167 .9047 .8008 -.4316 .8871 .9392 -.0379
Height rPh -.0122 .0344 .0468 .2724 .2482 -.3537rE -.0780 .0258 .2776 .3327 -.4104 -.0711rG .0165 .0383 -.0663 .6403 .9987 -.6707
Days to rill .4202 -.6663 .1265 -.0117 -.2948Heading rE .7848 -.5567 .3875 .4331 -.2398
rG .1573 -.8011 -.8452 -.9495 -.3997
pays to rPh .3696 -3556 .2761 -.1671
Maturity rE .2541 .5089 .4231 -.1512rG .4878 .4984 .1454 -.2116
Crain ,illing reh .2648 .2377 .1454Period rE .2104 .1130 .0170
rG .7002 .5655 .3856
Head Length rah .8210 -.0799rE .8535 -.1409_r.1 .7213 .2735
:3achis Internode rph .0114rE .0981
(1) Computation of genetic correlatiOns for yield and tillers were done u -inn broad sense heritabilities. For all the other measured traits,
narrow sense heritabilities were used.O
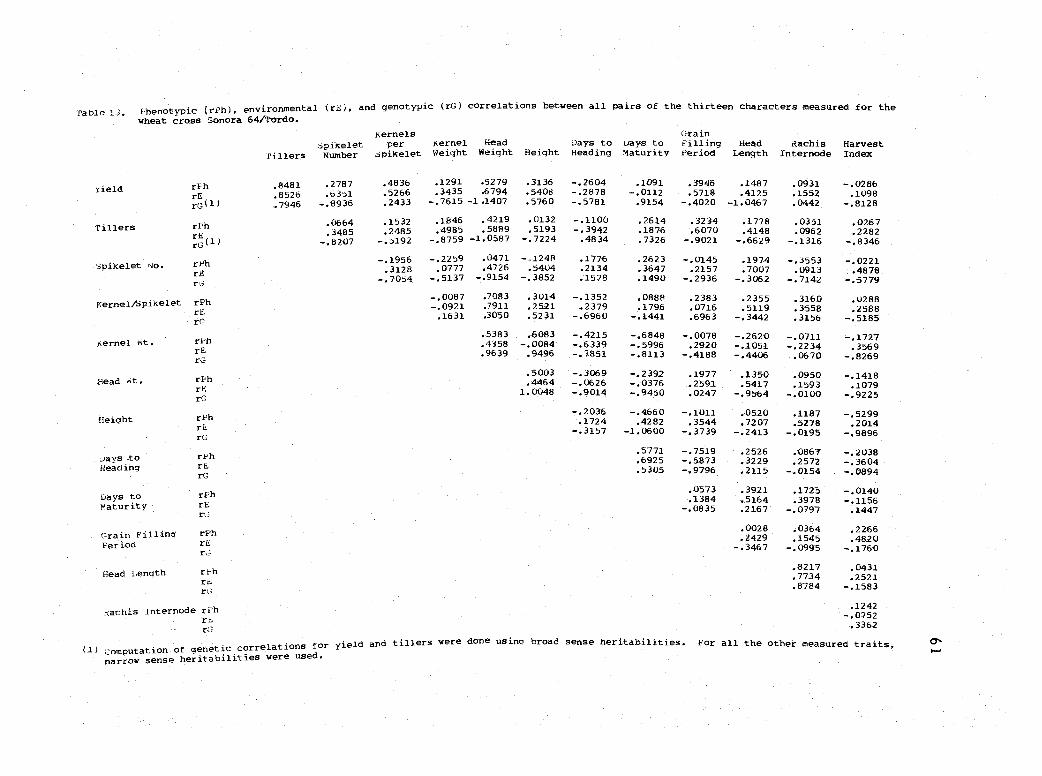
Table 13. Phenotypic (rPh), environmental (rE), and genotypic (rG) correlations between all pairs of the thirteen characters measured for the
wheat cross Sonora 64 /Tondo.
GrainKernelsspikelet per Kernel Head Days to Days to Filling Head :2ise
IndexHarvest
't!Tillers Number Spikelet Weight Weight Height Heading Maturity Period Length In
-.0286.1098
-.8128
.0267
-:fil3::
-.0221:.4878-.5779
.0288
-.5185258
-.1727.3569
-.8269
-.1418.1079
-.9225
-:=94-.9896
-.2038-.3604-.0894
::01t
.1447
.2266
.4820-.1760
.2521-.1583
-:=, 3362
.0931.1091 .1487.4125
.3946rPh .2787 .4836 .1291 .5279 .3136 -.2604
.5718Yield .8481.5266 .3435 .6794 .5408 -.2878 -.0112rE .6351
.9154 -.4020 -1.0467 .0442.8526
.2433 -.7615-1.1407 .5760 -.5781rG(1) .7946 -.8936
.0351.1846 .4219 .0132 -.1100 .2614 .3234.1532Tillers rPh 0664
.3485 .2485 .4985 .5889 .5193 -.3942-.8759 -1.0587 -.7224 .4834
.1876 .6070 :
.7326 -.9021 -.6629 -.1316rEG(1) -.8207 -.5192
.2623 -.0145 .1974 -.3553Spikelet o. rPh -.1956 --.2259 0471 -.1248
.3128 .0777 .4726 .5404 .2134 .3647.1490 -.7142
rE -:M67 -.3062r.4
-.7054 -.5137 -.9154 -.3852
KerneliSpikelet rPh-.0087 .7083 .3014 -.1352 .0888 .2383 .2355 .3160-.0921 .7911 .2521 .2379 .1796 .0716
.6963 -.3442.3558rE
.1631 .3050 .5231 -.6960 -.1441rG
.5383 .-6083 -.4215 -.6848 -.0078 -.2620 -.0711Kernel .2920 -.1051 -.2234t. rPh .4358 -.0084 -.6339 -.5996
.9639 .9496 -.7851 -.8113 -4188 -.4406 -0670rE. . .rG
.5003 -.3069 -.2392 .1977 .1350 .0950Head nt. rPh .4464 -.0626 -.0376 .2591 .5417 .1593rE 1.0048 -.9014 -.9450 .0247 -.9564 -.0100
.0520 .1187
rG
-:= -:= -.1011.3544 .7207Height rPh
-.3157 -1.0600 -.3739 -.2413 -.0195rE
.2526
rG
.5771 -.7519 .0867Days to rph .6925 -.5873 .3229 .2572Heading rE .5305 -.9796 .2115 -.0154rG
.0573 .3921 .1725
.1384 .5164rPhDays to
.20:
-.0797Maturity rErG
.1545Grain Filling rPh
- .3467 -.0995rEPeriodrG
.8217Head Length rPh
.7734rE .8784rG
,(achis Internode rkhTr.
rG
(1) Computation, of genetic correlationsfor yield and tillers were done using broad sense heritabilities. For all the other measured traits, ON
1....,
narrow sense heritabilities were used.

Table 14. Phenotypic (rPh), environmental (rE), and genotypic (rG) correlations between all pairs of the thirteen characters measured for thewheat cross Yaqui 50 /Olesen.
TillersSpikeletNumber
Kernelsper
SpikeletKernelWeight
HeadWeight Height
Days toHeading
Days toMaturity
GrainFillingPeriod
HeadLength
RachisInternode
HarvestIndex
Yield rPh .8058 .1813 .1604 .2401 .3502 .3788 -.1721 -.0210 .2061 .2922 .2539 -.0253rE .9666 .4076 .0402 .2350 .3436 .5134 -.2920 .2651 .4443 .6689 .4511 .2218rG(1) .1312 -.7436 .6778 .2855 .3996 .5641 .1719 -.7961 -.3566 -.2946 -.8836 -1.0310
Tillers rPh .2421 -.3060 -.1677 -.2318 .0811 -.0667 .2050 .2491 .3218 .2521 -.0170rE .3676 -.1532 .1078 -.1113 .4935 -.2737 .3664 .4926 .6301 .5371 .2593rG(1) -.0717 -.6768 -1.0212 -.7091 -.2222 .3380 -.0307 -.1240 .0066 -.7309 -.6826
Spikelet Number rph -.3123 -.4177 -.0912 .0967 .2517 .4583 -.3108 .5699 .1310 -.1729rE -.1423 -.2492 .2143 .4498 -.1249 -.0892 .0202 .2898 -.0931 .0606rG -.6114 -.8870 -.9313 -.1292 .9140 1.0114 -.8063 .9515 .8242 -.6716
Kernels/Spikelet rPh -.2933 .8147 .3117 -.1707 -.3058 -.0299 -.1649 -.0258 .0193rE -.3925 .7512 .0699 .0561 -.3015 -.1954 .2016 .2393 .1132rG -.0387 1.0966 .5556 -.5528 -.3268 .1982 -.5667 -.8080 -.1731
Kernel Weight rph .6628 .4125 -.4670 -.5742 .1318 -.2565 -.0659 .0170rE .6499 -.0232 -.2873 -.3403 -.0011 -.0478 -.0842 .1057rG .7314 .9786 -.8868 -1.0629 .3862 -.6006 .0031 -.2162
Head Weight rPh .5196 -.1980 -.3949 -.0578 -.0469 .0014 -.0523rE .3463 -.0440 -.3837 -.2068 .2845 .1366 .2152rG 1.0663 -.6479 -.5297 .3270 -.6248 -.6409 -.9408
Height rPh .0261 -.3373 -.2785 .1922 .1800 -.5602rE -.1153 -.2009 .0234 .3840 .3097 -.2441rG .1093 -.4237 -.4408 .1295 .1511 -.9172
Days to rPh .5929 -.7478 .3989 .1673 -.1379Heading rE .1733 -.7604 .1790 .2869 -.2395
rG 1.0642 -.7406 .6072 -.1017 .0305
Days to rPh .0666 .4321 .2589 .0967Maturity rE .4657 .3303 .4168 .2102
rG -.2988 .5082 .0042 -.0521
Grain Filling rPh -.1437 .0026 .1849Period rE .1028 .0848 .3639
rG -.3201 -.1607 .0550
Head Length rPh .8044 ..1572rE .8661 .0621rG .9783 -.4045
Rachis Internode rPh -.0705rE -.0722rr; -.0690
Ch(1) Computation of genetic correlations for yield and tillers ere done using broad sense heritabilities. For all the other measured traitspJ
narrow sense heritabilities were used.

cable 19. Phenotypic (rPh), environmental (rE), and genotypic (rG) correlations between all pairs of the thirteen characters measured for thewheat cross Vicam 71/Tordo.
TillersSpikeletNumber
Kernelsper
spikeletKernelWeight
HeadWeight Height
Days toHeading
Days toMaturity
GrainFillingPeriod
HeadLength
RachisInternode
HarvestIndex
Yield rPh .8767 .4148 .4008 -.0069 .1899 .3747 -.3746 -.0170 .3361 .4014 .1304 .3416rE .9055 .3801 .2927 -.1231 -.0662 .5041 -.4575 .1439 .5613 .4381 .4175 .2104rG(1) .6592 .9398 1.0399 1.0012 .9768 .7514 -.4323 -.6554 -.0399 .5775 .8915 .7190
Tillers rPh .3225 .0147 -.2068 .0434 .1063 -.4266 .0717 .4664 .2770 .0722 .2322.2925 .0452 -.3191 -.2773 .5717 -.4330 .3155 .5423 .3773 .3831 .0971
(1) .7169 -.0126 .5691 .7045 -.2247 -.7392 -.6755 .5052 .1786 -.8398 .7622
spikelet Number rPh -.0166 -.1200 .3249 .1353 .0313 -.1384 -.0563 .4831 -.2520 .1062rE -.4536 -.0520 .1712 -.0529 .1925 -.1693 -.2993 .6100 -.1467 .1888rG .9325 -.9601 1.2990 .7517 -.5161 -.0771 .7997 .5908 -1.0168 -.3659
Kernels/Spikelet rPh .0782 .8451 .5422 .0101 -.0974 -.1080 .3249 .3578 .2482rE -.1237 .3929 -.0308 -.0559 .4514 .2739 -.0081 .3982 -.0682rG .4174 1.0439 .6507 .0371 -.4461 -.2735 .4797 .3826 .5354
Kernel Weight rPh .4159 .2566 -.1388 -.4834 -.2102 -.1190 -.0335 -.0733rE .5153 -.2598 .1192 -.3574 -.3140 -.3859 -.3281 .1214rG .4134 1.0415 -.7736 -1.0169 -.0757 .4345 .8828 -.8412
Head Weight rPh .6103 -.0255 -.2155 -.1589 .3957 .1682 .2234rE -.3109 .2040 -.0097 -.2689 .0906 -.0381 .2212rG .9118 -.1701 -.4214 -.0867 .5979 .3618 .2485
Height rPh .0207 -.2237 -.1974 .3456 .2444 -.0649rE -.4674 -.0148 .4666 .0622 .1205 -.0445rG .1668 -.3691 -.4196 .4635 .3483 -.0978
Days to rPh .4312 -.7269 .0325 .0000 -.1970Heading rE .1258 -.8233 .0170 -.1495 .3113
rG .7508 -.6612 .0432 .1411 -.8079
Days to rPh .2706 .1152 .0320 .0141Maturity rE .4312 .3353 .5757 .0337
rG .1142 -.1077 -.7409 -.0202
Grain Filling rPh .0382 .0150 .2030
Period rE .1298 .4303 -.2544rG -.0276 -.3940 .7764
Head Length rPh .6879 .0506rE .6932 .1618rG .6998 -.0816
gachis Tnternode rPh -.0262rE .0611rG -.1732
(1) Computation of genetic correlations for yield and tillers were done using broad sense heritabilities. For all the other measured traits,
narrow sense heritabilities were used. CN-4

Table 20. Phenotypic (rPh), environmental (rE), and genotypic (rG) correlations between all pairs of the thirteen characters measured for thewheat cross Tordo/Olesen.
Yield
Tillers
Spikelet Number
Kernels/Spikelet
Kernel Weight
Head weight
Height
Days toHeading
Days toMaturity
Grain. FillingPeriod
Head Length
Rachis Internode
TillersSpikeletNumber
Kernelsper
SpikeletKernelWeight
HeadWeight Height
Days toHeading
Days toMaturity
GrainFillingPeriod
HeadLength
RachisInternode
HarvestIndex
rPh .8262 .3448 .3117 .2096 .3734 .3145 -.5494 .0707 .5480 .2736 .0816 -.0280rErG(1)
rPh
.9241
.7577.4950'.1198
.4552
-.0263.9378
-.1422
.1661
.9650
-.1823
-.0219.9738
-.0576
.5416
.2570
.0366
-.5590-.5443
-.4238
-.1545.4618
.1330
.4622
.6292
.4417
.5694
.0302
.2392
.2827-.0760
-.0121
.0855-.1837
.0566rEr(1)
rPh
.4558
.4532-.2757.2973
-,2232
-.5061.9905
-.4082
-.3930.8562
.0860
.5383-.3276
-.1838
-.5061-.3752
-.0037
-.0402.6897
.3320
.4994
.5671
.1565
.5639-.2225
.2921
.3145-.4496
-.2437
.0560
.0598
-.0809rE -.2231 -.2773 .0309 .3190 .0000 .1513 .0639 .7180 -.0507 -.0417rG -.2236 -.8792 .2364 -.6560 -.0101 .9080 .3069 -.3134 -5776 -.1829
rph .2967 .8565 .3619 -.2210 -.0685 .2368 -.0862 .0367 -.0074rE .1668 .7444 -.1210 .0870 .0980 -.0936 -.1680 .0006 -.1637rG .7528 1.0089 .8903 -.7233 -.5859 .6317 .0226 .0955 .3810
rPh .6579 .3044 -.3390 -.2678 .1699 .1642 .2760 --A0e6rE .7063 -.1924 -.0616 -.5325 -.2725 -.3088 -.1328 .2314rG .5372 .8819 -.8759 .6356 .6981 .9865 .9903 -.6654
rPh .4885 -.3589 -.1124 .3115 .1223 .1659 -.0437rE -.0966 -.0044 -.3120 -.2319 -.0668 -.1219 .0506rG 1.0024 -.8333 .4002 .8031 .3693 .5250 -.2379
rPh -.3749 .4255 .1074 .0238 .1122 -.4910rE -.0462 -.0506 .0614 .5211 .3980 .1663rG -.5152 -.8881 .1177 -.1485 .0234 -1.0070
rPh .2777 -.8062 -.2025 -.1950 .0277rE .3142 -.8374 -.1746 -.2559 .0314rG .2676 - .8-224 -.2224 -.1537 .0252
rph .2665 .1548 -.0187 -.2384rE .2207 .0377 -.0682 -.4506rG .4037 .3516 .0474 .2722
rPh .2250 .1358 .0583rE .2183- .2426 -.2725rG .2363 .0953 .3089
rPh .8542 .3876rE .6557 .0565rG .9897 .8040
rph .4170rE .1345rG .7671
(1) Computation of genetic correlations for yield and tillers were done using broad sense heritabilities. For all the other measured traits,narrow sense heritabilities were used. CN
00

69
Some genetic correlations for certain traits consistently had high
correlation values but others did not when assessed for each individual
cross. Number of tillers per plant was highly positively correlated
with plant grain yield at the genotypic level in seven of the 10 crosses
(Tables 11, 12, 13, 15, 17, 19, and 20), while phenotypic and environ-
mental correlations of the same two traits were always highly posi-
tively correlated. Number of kernels per spikelet and grain yield
were highly positively correlated at the genotypic level in eight of the
10 crosses (Tables 11, 12, 14, 15, 17, 18, 19, and 20) but they were
not correlated at the phenotypical and environmental level. This lack
of association maybe due to the low heritability of yield per plant and
the masking of genetic effects by the environment. The other two
components of yield were less consistent in their genetic association
with plant yield. Number of spikelets per spike was positively corre-
lated with yield only in the crosses Vicam 71/Tordo and Yaqui
50/Tordo (Tables 15 and 19) and negatively correlated in three crosses
(Tables 11, 13, and 14). Kernel weight was highly correlated with
yield in six of the 10 crosses; however, three of the associations were
negative (Tables 11, 13, 17, 18, 19, and 20). The three crosses
showing high positive genetic correlations between plant grain yield
and kernel weight were all possible combinations among the three
dwarf cultivars. Progress in increasing grain yield through selection

70
for high kernel weight in these three crosses is a strong possibility.
In the cross Vicam 71/Tordo there were high positive genetic
correlations between grain yield and the four yield components; hence
it is very likely that plant grain yield increase could be obtained in
this cross through selection for high expression of yield components
(Table 19).
The trait head grain weight was the recipient of the average
contributions of spikelet number, kernels per spikelet, and kernel
weight to plant yield. In five out of the 10 crosses head weight was
positively genetically correlated with grain yield and only in two
crosses was there a negative association between these traits (Tables
12, 13, 15, 16, 18, 19, and 20). Selection for increased head weight,
in most of the cases, could, be a-means of increasing grain yield be-
cause head weight may be considered as an intermediate step between
grain yield and its late components; i. e., kernels per spikelet,
spikelet number and kernel weight. Head grain weight is a trait that
deserves special attention because it could be easily implemented into
a breeding program. A random sample of a fixed number of heads
could be taken from those lines that looked promising in the field; they
could be treshed and weighed and with this information the final
selection could be made.
Other genetic associations that were fairly consistent among the
crosses were number of tillers per plant and days to maturity. These

71
two traits were highly positively correlated in 60 percent of the
crosses (Tables 11, 12, 13, 15, 16, and 20). Number of kernels per
spikelet and head weight were highly positively associated in terms of
the genotypic correlation in 90 percent of the crosses. This associa-
tion was also high for both phenotypic and environmental correlations
(Tables 11, 12, 14, 15, 16, 17, 18, 19, and 20). High environmental
correlations between agronomic traits may cause a problem when
selection is based on correlated characters; however, the non-genetic
influence caused by environmental interactions in the association of
kernels per spikelet and head weight in this experiment may be over-
come because of the consistent positive genetic correlation between
these traits.
Kernel weight and plant height were genetically correlated in
50 percent of the crosses (Tables 13, 14, 18, 19, and 20). However,
in this particular case the term plant height could be misleading:
Three of the crosses were combinations among the three dwarf culti-
vars, another one was the cross Sonora 64/Tordo and only one cross
involved the standard height parent, i. e. , Yaqui 50 /Olesen. This may
suggest that the kernel weight-plant height association held true when
the variability for plant height was not very large. Therefore those
plants which were "tall" and also had high kernel weight, with the
exception of the cross Yaqui 50/01esen, could practically be con-
sidered dwarf wheats.
72
High negative genetic correlations were found between kernel
weight and days to maturity in seven of the 10 crosses (Tables 11,.13,
14, 15, 16, 17, and 19). The genotypes which were early tended to
have a heavy kernel weight. The late maturing genotypes had a lower
kernel weight which may have resulted from rising temperatures and
moisture stress conditions during the late part of the growing season.
Genetic correlations between head grain weight and plant height
were positive and high in 70 percent of the crosses (Tables 12, 13,
14, 16, 18, 19, and 20), but again this association was present in
most cases in those crosses involving the semi-dwarf wheat Sonora 64
and the three dwarf cultivars. The persistence of this type of associa-
tion may indicate that in a cross between a tall standard variety and
a dwarf cultivar, selection should be made for intermediate types in
plant height and in a cross involving two short wheats selection should
be in favour of relatively tall plants.
There was a high negative genetic correlation between plant
height and harvest index in eight of the 10 crosses (Tables 11, 12, 13,
14, 15, 16, 17, and 20). In crosses where the genetic correlation
for these two traits was not as high, dwarf parents were involved.
High grain to straw ratios could be the result of increased rates of
photosynthates translocated to the ear of the wheat plant due to sink-
source relationships (Wallace, 1972). Also a high harvest index
may be due to a reduction of height. With reduced plant height less

73
nutrients are utilized for vegetative growth, and a relatively larger
amount of assimilates are distributed to the grain (Borojevic, 1971).
Phenotypic, genotypic, and environmental correlations between
days to heading and grain filling period (GFP) were high and negative
in all 10 crosses. Days to maturity was never directly correlated
with GFP. If length of GFP needs to be extended, the best indirect
way of achieving it would be through selection for fast spike emer-
gence. Increasing the duration of GFP could be a means of increasing
the expression of number of kernels per spikelet and kernel weight,
the two last yield components to develop. However, the genetic corre-
lation between GFP with number of kernels per spikelet and kernel
weight was high and positive in only two crosses (Tables 15, 18, and
20). Perhaps a high positive correlation between GFP with number of
kernels per spikelet and kernel weight may have been observed more
often if measurements of GFP were based on time from anthesis to
senescence.
A very consistent association at the phenotypic, environmental,
and genotypic level was between head length and rachis internode
length. The observed correlations between these two traits were high
and positive in all 10 crosses. An increase in the length of the head
more often resulted in a more lax head rather than a higher number
of spikelets per spike.

74
Some of the genetic correlations that were not consistent over
all the crosses are of prime importance. Number of tillers per plant
was negatively correlated with the other components of yield as follows:
two crosses with number of spikelets per spike (Tables 13 and 15);
in one cross with number of kernels per spikelet (Table 16); and in
five crosses with kernel weight (Tables 11, 13, 14, 15, and 17).
Tiller number per plant was found to have a large positive genetic
correlation with the other components of yield as follows: spikelet
number in one cross (Table 19); four crosses with kernels per spikelet
(Tables 11, 12, 15, and 19); and two crosses with kernel weight
(Tables 19 and 20). Therefore the possibility exists of increasing
grain yield in several of the crosses studied by a combined increase
of the components of yield without compensatory effects among them.
This seems possible because yield components were often not corre-
lated and even in some cases positively correlated. However kernel
weight had a high and negative genetic correlation with tiller number
per plant, spikelet number per spike and plant grain yield in some
crosses (Tables 11, 13, 14, 15, 17, 19, and 20). These negative
associations may be attributed to stress conditions that existed when
this yield component was being finalized in its development. Most of
the crosses showing this type of associations with kernel weight in-
volved Yaqui 50 and Vicam 71, the two parents which had the largest
number of tillers per plant and were late maturing. In general, the

75
genetic correlations observed were characteristic of each individual
cross, with the exception of those trait associations already mentioned
that showed some consistency in their value and sign for most or all
crosses. Many interrelationships differed from one cross to another
due to different gene associations in the parental lines and/or the
differences in their mean values of the characters under study.
For example, when Sonora 64 was crossed with Yaqui 50,
(Son/Y), plant grain yield was highly negatively correlated with grain
filling period and the genetic correlation of yield with head length and
rachis internode length was high and positive (Table 11). These latter
two characteristics are associated with the parental cultivar Yaqui 50
and this association may indicate that yield in this particular cross
was mainly being transmitted by the parental variety Yaqui 50. How-
ever, when Sonora 64 was crossed with Olesen, (Son /O ), grain
filling period was highly positively associated with grain yield and
head length while rachis internode length correlations with yield were
small (Table 12). These same two crosses can be compared for other
genetic correlations. When the cross was Son/Y, a positive correla-
tion between plant tiller number and rachis internode was observed;
with Son/On, there was no genetic association between these two
traits. With Son/Y, there was a positive genetic correlation between
spikelet number per spike with head length and rachis internode and
a negative correlation with grain filling period. In the cross Son/On,

76
associations between the same traits were negligible. With Son/Y,
kernels per spikelet were positively correlated with head length and
in the cross Son/On there was no correlation between these same
traits. A negative genetic correlation between rachis internode length
and kernel weight occurred in the cross Son/Y, and in Son/On there
was a positive correlation between the same two traits. Grain filling
period and plant height were positively associated at the genotypic
level in the cross Son/On and negatively genetically correlated in the
cross Son/Y.
The differences in genetic associations between these two
crosses as well as among the other eight crosses should serve as an
indication to the breeder that when selection is performed in these
populations he has to remember the main characteristics of each of
the parents of every cross and associate them with the potential of
the individual plants or families that he is going to select. This could
be true for almost any hybridization. Very often one of the genotypes
involved in a cross is the source of high yield and the other parent is
a source of a particular characteristic(s) that has to be incorporated.
During selection the plant breeder must remember all those genetic
associations between different agronomic traits in the high yielding
variety, because by this means the capacity of high yield production
may be identified. Once these characteristics are fixed, the incor-
poration of the new ones should be attempted. Otherwise, the

77
probability of recovering or improving the yield potential of the best
parental line may be reduced. All of this emphasizes the need for the
breeder to be knowledgable of the genetic potential of the material in
the field, and be perfectly cognizant of what he wants from each
particular hybridization.
Path analysis - The study of association between traits by
means of correlation coefficients serves as a guideline for the selec-
tion of desirable plant types. However, when several factors are
considered at one time the relationships between the variables be-
comes more complex and a different type of analysis is needed to
understand direct and indirect effects of variables that influence a
complex correlation. The path-coefficient analysis developed by
Wright (1921, 1923) and discussed by Dewey and Lu (1959) partitions
the correlation coefficient into the direct and indirect effects and
permits a more critical examination of the relative importance of
each of the characters within the system.
The direct and indirect effects of eight agronomic traits with
plant grain yield at the phenotypic level were evaluated by path co-
efficient analysis for each of the 10 crosses (Tables 21 and 22).
Plant height showed a significant positive correlation with plant grain
yield in only two of the crosses: i. e. Sonora 64/Yaqui 50 and Sonora
64 /Olesen (p = 0.05). In eight of the crosses there was no significant
correlation between yield and height. Neither direct or indirect effects

78
Table 21. Path-coefficients analysis of grainphenotypic level, using replication means of the
CHARACTER
yield per plant vs eightFl, F2, BC1 and BC2
CROSS, CROSSson/Y1 Son/0111
agronomicfor each wheat
CROSSSon/Torl
traits atcross.
CROSSY/Oril
the
CROSSY/TorlPLANT GRAIN YIELD AND PLANT HEIGHT
Direct effect ,0335 -.0418 .0320 =7(5097 :1-085
Indirect effect via Tillers per ?lent .3993 .4926 .3892 .0340 .2167Indirect effect via Spikelet Number .0716 .0048 -.0163 -.0203 -.0594Indirect effect via Harvest Index -.0224 .0019 -.0120 -.0753 -.0470Indirect effect via Kernels per Spikelet ,.0089 -.0100 .0405 .0528 -.0634Indirect effect via Kernel Weight -.0259 -.0586 ,.0107 .0018 .2483Indirect effect via grain Filling Period -.0030 .0584 .0007 .1192 .0309Indirect effect via Head Weight .1393 .1226 .0091 .0594 -.2158
Correlation (r2,3) .5A36* .5700* .4324 .1619 .2179
MANI. GRAIN YIELD AND TILLERS PER PLANTDirect effect 1.0455 .8196 .8759 .9269 1.1686Indirect effect via Plant Height .0128 -.0251 .0142 -.0004 .0201Indirect effect via Spikelet Number .0193 -.0488 .0467 -.0174 -.0660Indirect effect via Harvest Index -.0133 .0056 -.0030 -.0015 -.0006Indirect effect via Kernels per Spikelet ,0093 -.0150 .0112 .0705 .3731Indirect effect via Kernel Weight -.0590 .0169 -.0386 .0003 .2456Indirect effect via Grain Filling Period -.0016 .9914 .0003 -.0747 -.0194Indirect effect via Head Weight
Correlation (r3,4)-.2217-.1913**
.0836 ,0257 -.0721 -.8353___..62**-88.9282*4 .9325e* ,83T.677,
PLANT GRAIN YIELD AND SPIKELET NUMBERDirect effect .0834 -.1101 .0898 -.0478 -.1729Indirect effect via Plant Height .02N8 .0018 -.0058 -.0041 .0373Indirect effect via Tillers per Plant .2421 .3636 .4557 .3382 .4460Indirect effect via Harvest Index -.0205 -.0015 .0053 -.0490 -.0124Indirect effect via Kernels per Spikelet 0130 -.0299 -.0060 .0420 .1157Indirect effect via Kernel Weight -.0358 -.0257 -.0194 -.0007 .1337Indirect effect via Grain Filling period -.0028 .0349 -.0004 .0426 .0063
Indirect effect via Head Weight .2003 .3719 0576_t_ .0214 -.0709Correlation (r3,5) .6051* .5770* .3425 .4828
PLANT GRAIN YIELD AND HARVEST INDEXDirect effect .0313 -.0308 .0287 .0954 .0715Indirect effect via Plant Height -.0240 .0026 -.0134 .0077 -.0714Indirect effect via Tillers per Plant -.4457 -.1502 -.0902 -.0144 -.0103Indirect effect via Spikelet Number -.0545 -.0052 .0167 .0246 .0300
Indirect effect via Kernels per Spikelet .0001 ,.0708 .0160 -.1199 -.1574Indirect effect via Kernel Weight .0687 -.0960 .0331 .0010 -.2661Indirect effect via Grain Pilling Period .0039 -.0378 .0001 -.0998 -.0464Indirect effect via Head Weight .0919 .4255 .0486 .2247 .6184
Correlation (r3,10) -.3283 .0371 .0397 .1191 .1682
PLANT GRAIN YIELD AND KERNELS PER SPIKELETDirect effect -.0271 -.1219 .1718 -.2178 -.6028Indirect effect via Plant Height ,0110 -.0034 .0075 .0024 .0114Indirect effect via Tillers per Plant -.3583 .1008 .0569 -.3002 -.7233Indirect effect via Spikelet Number .0399 -.0270 -.0031 .0092 .0332Indirect effect via Harvest Index -.0001 -.0179 .0027 .0525 .0187Indirect effect via Kernel Weight .0025 _.0741 -.0300 .0017 -.2045Indirect effect via Grain Filling Period .0004 -.0161 .0002 .0034 .0023Indirect effect via Head Weight .3925 .5469 .1055 .5390 1,2746
Correlation (r3,12) 06-07 .3873 .3115 .0902 -.2505
PLANT GRAIN YIELD AND KERNEL WEIGHTDirect effect .1384 -.1612 .1185 .0070 -.4804Indirect effect via Plant Height -.0063 -.0152 -.0029 -.0024 -.0561Indirect effect via Tiilers per Plant -.4456 -.0862 -.2850 .0425 -.5975Indirect effect via Spikelet Number -.0216 -.0175 -.0147 .0048 .0481Indirect effect via Harvest Index .0155 -.0182 .0080 .0136 .0396Indirect effect via Kernels per Spikelet -.0560 -.0435 -.0530 -.3318IndireCt effect via Grain Filling period .0045 -.0221 .0007 -.0253 -.0257Indirect effect via Dead Weight .3153 .5534 .0537 .4775 1.1832
Correlation (r3,13) -.0001 .1768 -.1652 .4647 2.2206
PLANT GRAIN YIELD AND GRAIN FILLING PERIODDirect effect .0086 .1120 .0020 -.1817 -.0672Indirect effect via Plant Height -.0116 -.0218 .0113 .0064 -.0485Indirect effect via Tillers per Plant -.2019 .6689 :1175 .3811 .3380Indirect effect via Spikelet Number -.0270 -.0343 -.0161 .0112 .0161Indirect effect via Harvest Index .0142 .0104 .0021 .0524 .0494Indirect effect via Kernels per Spikelet -.0012 .0175 .0212 .0041 .0203Indirect effect via Kernel height .0723 .0318 .0393 .0010 -.1835Indirect effect via. Head weight"
Correlation (r3,15)_4651.0184--
-.0621.7223**
.0387 .0007.2751--
.2063.2159 .3309
PLANT GRAIN YIELD AND HEAD WEIGHTDirect effect 5184 .6879 .1562 .6667 1.4346Indirect effect via Plant pieihht ,0090 -.0075 .0019 -.0009 r-.0163IndireCt effect via Tillers per Plant -.4475 .0996 .1441 -.1003 -.6804Indirect effect via .Spikelet Number .0322 -.0595 .0331 -.0015 ,0085Indirect effect via Harvest Index .0055 -.0191 .0089 .0321 .0308Indirect effect via Kernels per Spikelet -.0205 -.0969 .1160 ,.1761 *.5356Indirect effect via Kernel Weignt .0842 -.1297 .0408 .0050 -.3963Indirect effect via Grain Filling period .0077 -.0101 .0005 -.0002 0097_
Correlatioh (r3.16) .1842 .50151 .4250 -.1645
1 ion = sonora 64, k" . Yaqui 50, on = 11'sen, Tor = rordo; Dc = Vicam 71
* significant at the probability level ** significant at the '1% prObability level

79
Table 22. Path-coefficients analysis Of grainphenotypic level, using replication
PLANT GRAIN YIELD ANL PLANT HEIGHTDirect effect
yield per plant vs eight agronomic traits at themeans Of the Fl, F2, Bel and HC2 for each wheat cross.
CROSS CROSS CROSS CROSS CROSSVc/Sonl Vc/Y1 Vc/Onl Vc/Tor Tor /On1
.0147 .0572 -.0626 .0440 -.1167Indirect effect via Tillers per. Plant -.1202 .0201 .2699 .3829 -.0385Indirect effect via Spikelet Number -.0151 -.0307 -.1466 -.0624 .0073Indirect effect via Harvest Index -.0074 -.1147 .0162 .0030 -.0016
Indirect effect via Kernels per Spikelet -.0007 .0492 ,4854 -.1017 -.0044Indirect effect via Kernel Weight .0241 ,.0029 -.0198 -.0206 -.0080Indirect effect via Grain Filling Period -.0171 .0215 .0077 -.0034 .0034
Indirect effect via Head Weight -.0236 -.0665 -.3697 -.0807 .1820Correlation (r2,3) -.1454 -.0667 .1806 .1612
PLANT GRAIN YIELD AND TILLERS. PER PLANTDirect effect .9683 .8203 .8705 .9662 .9881
Indirect effect via Plant Height -.0018 .0014 -.0194 .0174 .0045
indirect effect via Spikelet Number .0299 -.0165 -.4471 .0000 .1020
Indirect effect via Harvest Index .0079 .0157 .0136 .0036 -.0541
Indirect effect via Kernels per Spikelet .0002 -.0570 .3393 .0448 -.2151
Indirect effect via Kernel Weight 0462 .0070 .5541 -.0448 .0243
Indirect effect via Grain Filling Period -.0243 -.0301 .0156 .0225Indirect effect via Head Weight .0291 .1355 -.4903 -.0271 .0392
Correlation (r3,4) .9630** .P962** .8364** .9358** .9114**
PLANT GRAIN YIELD AND S PIKELET NUMBERDirect effect .0427 -.1051 -.7034 .1471 .1250Indirect effect via Plant Height -.0052 .0167 -.0130 -.0187 -.0065indirect effect via Tillers per Plant .6793 .1288 .5535 -.0002 .8062
Indirect effect via Harvest Index .0041 _.0152 .0024 -.0003 -.0692Indirect effect via Kernels per Spikelet .0102 -.0379 .1297 .0407 -.2468Tndirect effect via Kernel Weight -.0535 -.0350 .6868 .0016 .0150
Indirect effect via Grain Filling Period ,0027 -.0146 .0151 -.0093 .0153
Indirect effect via Head Weight -.0546 .3550 -.2664 .0623 .0116
Correlation (r3,5)
pLAD:T GRAIN YIELD AND HARVEST INDEX
.6258** .2926 .4044 .2232- .6502**
Direct effect .0176 .1273 .0711 -.0068 - .0895
Indirect effect via Plant Height -.0062 -.0516 -.0142 -.0194 -.0022
Indirect effect via Tillers per Plant ,4292 .1012 .1668 -.5142 .5976
Indirect effect via Spikelet Number .0100 .0126 -.0233 .0070 .0967
Indirect effect via Kernels per Spikelet -.0113 -.1039 -.4862 .0386 -.2039
Indirect effect via Kernel Weight -.0180 -.0254 -.3123 .0208 .0027
Indirect effect via Grain Filling Period -.0187 -.0286 .0070 .0045 .0221
Indirect effeCt via Head Weignt .1267 .2999 .8909 .0383 .1281
Correlation (r3,10) .5294* .73316 .2997 -.4313 .5517*
PLANT CRAIN YIELD AND KERNELS PEa SPIKEDETDirect effect -.0260 -.1714 -1.4108 .1843 .2766
indirect effect via Plant Height .0004 -.0164 .0215 -.0243 .0018
Indirect effect via Tillers per Plant -.0091 .1772 -.2094 .2346 -.7684
Indirect effect via Spikelet -Number -.0167 -.0232 .0647 .0325 -.1116Indirect effect via Harvest Index .0076 .0777 .0245 -.0014 .0660
Indirect effect via Kernel Weight .0123 -.0441 -.0295 -.0015 -.0117
Indirect effect via Grain Filling eriod -.0280 -.0228 -.0093 -.0110 -.0227
Indirect effect via Head. Weight .2468 .5435 1.7095 .0792 -.1028
Correlation (3,13) .1873 .5199* .1612 .4923 -.6727**
FLANV GRAIN YIELD AND KERNEL WEIGHTDirect effect. .0784 -.1343 -.9665 .0575 -.0556
Indirect effect via Plant Height .0045 .0012 -.0013 -.0158 -.0168
Indirect effect via Tillers per Plant -.5712 -.0426 -.4991 -.7530 -.4313
Indirect effect via Spikelet Number -.0291 -.0274 .4999 .0041 -.0338
Indirect effect via Harvest Index -.0040 .0240 .0230 -.0025 .0043
Indirect effect via Kernels per Spikelet -.0041 -.0563 -.0430 -.0049 .0583
Indirect effect via Grain Pilling Period .0009 -,0107 -.0070 .0242 -.0070
Indirect effect via Head Weight .0681 .5487 .6090 .0586 .2478
Correlation (1-3,13) -.4565 .3027 -.3850 -.2341
PLANT GRAIN YIELD AND GRAIN riLLING PERIODDirect effect -.0487 -.0537 .0277 -.0403 .0359
Indirect effect via Plant Height .0052 -.0229 -.6173 .0037 -.0111
Indirect effect via Tillers per Plant .4837 .4605 .4885 .5814 .6180
Indirect effect via Spikelet Number -.0024 -.0286 -.3820 .0341 .0532
Indirect effect via Harvest Index .0068 .0677 .0180 .0007 -.0550
Indirect effect via Kernels per Spikelet -.0149 -.0727 .4746 .0104 -.1743
Indirect effect via Kernel Weight -.0015 -.0268 .2425 -.0345 .0109
Indirect effect via Head weight .1609 .3153 -.4717 -.0115 .2572
Correlation (r3,15) .5890* .6387** .3802 .5841* .7346**
TIANT '.=PAIN YIELD AND HEAD WEIGHTDirect effect .2688 .6943 1,8771 .1108 .4838
indirect effect via Plant Height -.0013 -.0055 .0123 -.0320 -.0439
Indirect effect via Tillers per Plant .1048 .1601 -.2274 -.2363 .0800
Indirect effect via spikelet vumber -.0087 -.0537 .0998 .u827 .0030
Indireet effect via Harvest Index, .0083 .0550 .0338 -.0023 -.0237
Indirect effect. via Kernels per 'Spikelet -.0239 -.1342 -1.2848 .1318 -.0588
Tndirect effect via Kernel Weight .0198 -.1062 -.3135 .0304 -.6285
Indirect effect via "rain Filling Period -.0291 -.0244 -.1)070 .0042 .0191
Correlatioh (r3,16) .5855* .1903 .0892 .4310
1 Son 3,onora 64, F "Yaqui 50, un = ulesen, Oor = Tordo, Pc vicam 71
* significant at the probability level ** Significant at the probability level

80
were important in the system. The exception to this may be the
cross Sonora 64/Tordo where some indirect effects of plant height
on grain yield via number of tillers per plant were observed. In the
crosses Sonora 64/Yaqui 50 and Sonora 64 /Olesen the direct effects
of plant height on grain yield were negligible. However, positive
indirect effects through tiller number and to a lesser extent the weight
of grains per ear accounted for the overall significant positive corre-
lation between yield and height in these crosses. In every case
Sonora 64 was one of the parents and in all three crosses, including
Sonora 64/Tordo, the tall parent had more tillering capacity. If
selection is going to be applied to these three populations it is possible
that the best lines could come from relatively taller plants than from
the shorter ones.
The total correlation between the number of tillers per plant
and grain yield per plant was high, positive and significant in all 10
crosses. The direct effects were always high and also positive and
the indirect effects of tillers number via other traits were negligible
except in the crosses Yaqui 50 /Tondo and Vicam 71 /Olesen. In these
two crosses there were high negative indirect effects via head grain
weight, indicating that any increase in the number of tillers per plant
would lead to a decrease in weight of grain per ear and a reduction
in yield. In the cross Vicam 71/01esen there was also a positive
indirect effect of number of tillers per plant via kernel weight but it

81
was offset by a sizeable negative indirect effect through number of
spikelets per spike. This is an example of one of the characteristics
of Olesen dwarf, i. e. the head is so compact that an increase in
kernel weight is the result of a decrease in the number of spikelets
per spike. A positive and significant correlation between spikelets
per spike and grain yield was observed in the crosses Sonora 64/Tordo
(p = 0.05) Sonora 64 /Olesen (p = 0.05), Vicam 71/Sonora 64 (p = 0.01)
and Tordo/Olesen (p = 0.01). In three of the remaining crosses,
i. e. Sonora 64/Yaqui 50, Yaqui 50 /Tondo, and Vicam 71 /Olesen, the
total correlation was not statistically significant but it was high and
had similar direct and indirect effects as those four previously men-
tioned. When the total correlation was partitioned into effects through
other traits it was found that the direct effects of spikelet number on
grain yield were negligible in all crosses except Vicam 71 /Olesen.
In this last cross there was a negative direct effect of spikelet number
on grain yield; both of the parents of this cross had the smallest
mean value for spikelet number, thus it is possible to assume that
their yield capacity was associated with other yield components and
not with number of spikelets per spike. In all seven crosses pre-
viously mentioned spikelet number had a positive indirect effect
through tiller number per plant on grain yield. These associations
accurately describe the parental cultivars, except for Vicam 71, in
that tillering capacity was associated with longer heads and more
82
spikelets per spike. In the cross Vicam 71/Olesen the positive in-
direct effects of spikelet number via kernel weight were more im-
portant than those via tillering and the two together may have offset
the negative direct effects , resulting in a positive total correlation
between spikelet number and grain yield.
There were only two crosses where a positive significant cor-
relation was found between harvest index and grain yield, i. e. Vicam
71/Sonora 64 and Tordo/Olesen (p = 0.05). In both cases the direct
effects were negligible and the significant correlation between these
two traits was a result of positive indirect effects via number of spikes
per plant. The cross Vicam 71/Tordo had a negative correlation
between harvest index and yield per plant due to high indirect effects
via number of tillers per plant. In other words, high grain to straw
ratios were offsetting the tillering capacity of the plant and grain
yields were reduced.
The phenotypic correlation between number of kernels per
spikelet and plant grain yield was positive and significant in the cross
Vicam 71/Yaqui 50 ( p = 0.05) and negatively significant in Tordo/
Olesen (p = 0, 01). In both cases the direct effects were small and
the significance of the total correlation was due to the indirect effects.
In the cross Vicam 71/Yaqui 50 kernels per spikelet had a significant
positive indirect effect on grain yield via its positive association with
head grain weight. Similar indirect effects were observed in eight

83
crosses out of the 10 but in most cases the total correlation was
negligible due to negative indirect effects through number of tillers
per plant. More kernels per spikelet were due to less number of
tillers per plant. Because only negative indirect effects via tillering
capacity were present in the cross Tordo/Olesen the total phenotypic
correlation between kernels per spikelet and grain yield was negative.
Number of kernels per spikelet may be a trait which is dependent for
its full expression on its ability to compete for assimilates with
earlier developed yield components as number of spikes per plant and
spikelets per spike. This negative association, however, was offset
in certain hybrid combinations as demonstrated with the crosses
Vicam 71/Yaqui 50 and Vicam 71/Tordo. Both of these crosses
showed positive indirect effects of kernels per spikelet via tiller
number.
The cross Vicam 71/Tordo had a significant negative correla-
tion between kernel weight and plant grain yield (p = 0.01). This
negative correlation was the result of negative indirect effects via
tillers per plant.
The cross Vicam 71/01esen was an example of how complex the
relationships among several traits can be. Positive indirect effects
of kernel weight via head weight and spikelet number and strong nega-
tive direct effects plus negative indirect effects via number of tillers
per plant resulted in a negative correlation between kernel weight and

84
plant grain yield. In general, kernel weight had negligible direct
effects on plant grain yield but had a large positive influence on yield
via head weight and negative indirect effects through number of tillers
per plant.
Grain filling period was significantly correlated with grain
yield in 50 percent of the crosses. Direct effects of grain filling per-
iod were negligible in all crosses. The positive indirect effects via
spikes per plant were high in almost all crosses and the positive in-
direct effects through head grain weight were not as high as those
through tiller number but contributed in some instances to a signifi-
cant total correlation. Head weight was significantly correlated with
yield in only two crosses (p = 0.05). In the cross Sonora 64/Tordo
the significant correlation was the result of the summation of positive
indirect effects via yield components because direct effects were small.
In the cross Vicam 71/Yaqui 50 the direct effects of head grain weight
on plant grain yield were high and positive as it was for most of the
other crosses. Usually these effects were offset by negative indirect
effects via number of tillers per plant. Thus selection must be either
for number of spikes per plant or head weight, because selection
response to both of these traits seems unlikely to occur.
Number of spikes per plant was the only trait that showed con-
sistent direct effects on plant grain yield. All the other direct and
indirect effects as well as the total correlations displayed some

85
degree of inconsistency from one cross to another. In general the
other components of yield, i. e. number of spikelets per spike, num-
ber of kernels per spikelet, and kernel weight had no direct effect on
grain yield but had positive indirect effects via head weight. Spikelet
number was positively associated with number of tillers per plant,
and kernels per spikelet and kernel weight were negatively associated
with number of tillers per plant. However, there were several ex-
ceptions to these associations depending on the characteristics of the
parental cultivars involved in each cross. Therefore each individual
cross should be handled differently during selection.
Combining ability - Combining ability analysis has been used to
estimate the relative magnitude of the gene action involved in the
expression of a trait (Kronstad and Foote, 1964; Brown et al., 1966;
Fonseca and Patterson, 1968). General combining ability effects
(G.C.A.) and specific combining ability effects (S. C. A.) were com-
puted for both the F1
and F2 generations (Table 23) for 10 agronomic
traits: plant height, plant grain yield, number of tillers per plant,
number of spikelets per spike, head length, days to maturity, kernels
per spikelet, kernel weight, grain filling period, and head grain
weight. There were significant differences (p = 0.01) in G. C. A. in
both the F1
and F2 generations for the 10 agronomic traits measured
with the exception of plant grain yield in the F2 and head grain weight
in the F1
which were significantly different at the five percent

Table 23. Observed mean squares for general combining ability (G. C. A.) and specific combiningability (S. C. A.) for ten of the characters studied in the F1 and F2 generations. 1
Source D. F. Plant Height Plant Yield Tillers Per Plant Spikelet NumberFl F2 Fl F2 Fl F2 F
1F2
G. C. A. 4 8708.57** 8642. 43 ** 884. 04 ** 210.22* 206. 73 ** 141.04** 18.88** 15.76**S. C. A. 10 49.65** 19.82* 271.80 141.35 74. 47* 38.64 0.62 0.17Error 42 4.99 9.13 174.48 78.11 45.79 20.95 0.38 0.27
Source D. F. Head Length Maturity Kernels Per Spikelet Kernel WeightFl F2
1 2 1F2
1F2
G. C. A. 4 28.25** 23.07** 63.86** 70.80** 0. 33 ** 0. 30 ** 48.29** 72. 62 **S.C. A. 10 0.50 0.31 7.77 2.70 0.10** 0.02 19.82** 7.38**Error 42 0.26 0.23 4.66 2.28 0.02 0.02 2.89 2.34
Source D. F. Grain Filling Period Head Weight1
F2 F1
F2
G. C. A. 4 47.34** 74.20** 0.14* 0.21**S.C. A. 10 23.53** 21.22** 0.34** 0. 06**
Error 42 5.38 3.88 0.05 0.02
'Using Griffing' s model (1956)
Significant at the 5% probability level
**Significant at the 1% probability level

87
probability level. Testing of S. C. A. variance showed that there were
highly significant differences (p = 0.01) for plant height in the F1,
kernels per spikelet in the F1, and in both the F1
and F2
for kernel
weight, grain filling period, and head weight. There were significant
differences (p = 0.05) for S.C.A. for plant height in the F2 and tillers
per plant in the F1. There were no statistical differences in S.C. A.
in any of the two generations for plant yield, spikelet number, head
length, and days to maturity. There were no S.C. A. differences for
number of tillers per plant and number of kernels per spikelet in the
F2 generation. Additive genetic effects, which are estimated by
G. C. A. , were important in the expression of all traits studied.
However, non-additive gene effects estimated by S. C. A. were also
important in the expression of some traits. Therefore, measurement
of the relative amount of each type of gene action involved in the ex-
pression of each trait in both generations would give a better indication
of the potential of early generation selection (Table 24). High G. C. A. /
S. C. A. ratios indicate that the additive genetic variance is a sizeable
proportion of the total genetic variance (Daaloul, 1973). Low ratios
suggest that non-additive effects are proportionally important in the
genetic expression of the trait and therefore selection may not be
very effective. Large G. C. A. /S. C. A. ratios revealed that a large
part of the genetic variability associated with plant height, number of
spikelets per spike, head length, days to maturity, and number of

Table 24. Components of variance for general combining ability (G. C. A. ), specific combining ability(S. C. A.) and ratios of G. C. A. variances to S.C. A. variances for ten agronomic traitsmeasured in F1 and F2 generations. 1
Source
G. C. A.
S.C. A.
G. C. A. /S. C. A.Error
Plant Height Plant Yield Tillers Per Spikelet Head LengthPlant Numb e r
Fl F2 F1
F2 F1 F2
F1 F2 F1 F2
1243.37 1233.33 101.37 18.87 22.99 17.16 2.64 2.21 4.00 3.2644.66 10.69 97.32 63.24 28.68 17.69 0.24 N. S. 0.24 N. S.
27.80 115.37 1.04 0.30 0.80 0.97 11.00 Large 16.67 Large4.99 9.13 174.48 78.11 45.79 20.95 0.38 0.27 0.26 0.23
Source Maturity Kernels Per Kernel Grain Filling Head WeightSpikelet Weight Period
F1
F22
F F F2 F1Fl F F1 F2 F1 1
G. C. A.
S. C. A.
G. C. A. /S. C. A.
Error
8.46 9.80 0.044 0.040 6.49 10.04 5.99 10.05 0.013 0.0273.11 0.42 0.080 N. S. 16.96 5.04 18.15 17.34 0.290 0.0402.72 23.33 0.550 Large 0.38 1.99 0.33 0.58 0.045 0.6754.66 2.28 0.020 0.020 2.89 2.34 5.38 3.88 0.050 0.020
1 Following Griffing's procedures (1956)

89
kernels per spikelet was the result of additive gene action. With days
to maturity and kernels per spikelet, the ratios were not very large
in the F1
but were greater in the F2, indicating that non-additive gene
action was present in the F1 generation but was quickly lost after one
generation of selfing. Therefore, it would be possible to effectively
select for these traits as early as the F2. The G. C. A. IS. C. A.
ratios for kernel weight and head weight were small in the F1
but had
the tendency to increase in the F2.
The possibility exists that genes
which behave in a non-additive manner will not interfere with the
additive gene effects after one or more generations of selfing. Grain
filling period, number of tillers per plant, and plant grain yield, had
low G. C.A. /S. C. A. ratios for both the F1
and F2 generations, indi-
cating a preponderance of non-additive (dominance and epistasis)
gene action in their expression. The fact that the non-additive effects
for these traits remained relatively important after one generation of
selfing could mean that it may take several generations of selfing to
have lower S.C. A. ratios. The combining ability analysis of variance
did not detect plant yield and tiller number differences for S.C. A.
whereas the G.C. A. effects were significantly different, The genetic
differences observed for these two traits were probably due only to
additive gene effects. However, after low G. C. A. /S. C. A. ratios
were calculated it is possible to assume that non-additive gene action
was relatively more important than the analysis of variance showed.

90
Low G.C. A. /S. C.A. ratios for these traits have also been reported
by Daaloul (1973) and Paroda and Joshi (1970a). It is possible that in
the present experiment genotype-environment interactions made the
error term for tiller number and plant yield so large that no S. C.A.
differences could be detected even if they existed. Daaloul (1973)
reported a similar situation for tiller number in winter wheat. In the
present experiment S. C.A. differences were difficult to detect for
plant yield due possibly to a large dependency on plant tillering
capacity. G.C.A. /S. C.A. ratios increased from the F1
to the F2 for
almost every trait, except number of tillers per plant and plant grain
yield. Components of yield G. C. A. /S. C. A. ratios were always
higher in the F2 than in the F1, except tiller number, confirming that
additive gene action is more preponderant in the expression of these
traits than in grain yield per se. Hence selection for yield compon-
ents may be a more efficient way of increasing total plant yield.
Identification of those parental cultivars that are "good com-
biners" or throw better- progenies for a given trait is of paramount
importance. Such knowledge provides information on which parental
combinations have a better probability of producing better performing
lines. For this purpose G.C.A. effects and S.C.A. effects were
calculated (Tables 25 and 26).
Olesen and Tordo were the two cultivars that showed the best
general combining ability for short straw. Estimates of S.C.A.

Table 25. Estimates of general combining ability effects for ten variables studied in the F1 and F2 generations. 1
Parent Height Plant Yield TillersPer Plant
F1
F2 F1 F2
F1
F2
Vicam 71 -3. 74 -3. 84 4. 55 3. 13 2. 51 1. 79
Sonora 64 2. 58 3. 23 -2. 87 -0. 44 -2. 17 -1.06
Yaqui. 50 28.94 28. 51 7. 45 2. 53 3, 36 2.94
Tordo -13.39 -12.06 -4, 82 -2. 54 -2, 28 -2.31
Olesen -14. 39 -15. 84 -4.30 -2, 68 -1.42 -1.35
S. E. (g.-gj
1. 19 1.61 7.06 4. 72 3, 62 2.45
Spike let Number
F1 F2
Head Length
F1 F2
0, 16 0. 13 -0. 80 -0.81
-1. 28 -1. 13 -0, 50 -0.33
0. 78 0. 74 1. 28 1. 12
0. 59 0. 56 0. 87 0. 81
-0. 26 -0. 30 -0. 86 -0. 79
0.33 0.28 0. 27 0. 26
Parent Maturity Kernels PerSpikelet
F1
Kernel Weight
Vicam 71
Sonora 64
Yaqui 50
Tordo
Oleson
S. E. (g.-g.)#1 )
0.09 0.00
-2.37 -2. 57
0.88 1. 46
1.63 1. 18
-0. 23 -0.07
1. 15 0. 81
-0. 10 -0.07 -0.23 -0.24
0. 15 1. 15 1.24 1. 12
-0.01 -0.06 -O. 72 -1. 53
0, 11 -0.08 1.39 2. 12
0.06 0.07 -1.68 -1.48
0.08 0.08 0.91 0, 82
Grain FillingPeriod
F1 F2
Head Weight
F1
-1, 03 -1.23 -0.09 -0.06
1. 54 1.88 0.08 0.08
-1. 39 -1, 69 0.04 -0.08
-0. 28 -0. 51 0.03 0. 10
1. 15 1. 56 -0.06 -0.03
1. 24 1.05 0. 12 0.08
#Standard error of the difference between two general combining ability effects where i j,1
Using Griffings procedures (1956 )

Table 26, Estimates of specific combining ability effects in the F1 and F2 generations for those traits that had specific combining ability differencesin the analysis of variance, 1
Cross or Self Plant Height
F1 F2
Tillers PerPlant
F1
Kernels PerSpikelet
F1
Kernel Weight
F1 F2
Grain FillingPeriod
F1
F2
Head Weight
F1 F2
Vcm /Son -1.37 0.63 -4.04 -0.07 0.65 0.62 -1.96 -0.25 -0.04 0.04Vcm /Y 2.02 3.60 0.93 0. 14 1.49 -0.62 -0. 29 -0. 18 0. 26 0.04Vcm /Tor' -1.65 -1.33 -2.93 0.09 0. 52 1.32 -0. 39 -1. 11 0.14 0.11Vcm /On 0. 10 -1. 30 -1.04 -0.03 -1. 55 -2, 10 -0.07 -2, 18 -0. 13 -0. 10
Son/Y 3.20 0.27 -1.64 0.02 1, 44 0.33 -0.61 -2.04 0. 11 -0,02Son/Tor -4. 48 2, 10 -5. 25 0. 10 0. 80 0.45 -2, 21 -2.46 0.09 0.07Son/On 2.02 1.88 0.64 0.09 1.25 0.43 -2. 14 -1.04 0. 24 0.07Y/Tor -6. 58 -3. 94 -4. 54 0. 12 1, 31 0.53 0.46 -0. 89 0. 22 0. 10
Y /On -0. 33 -0. 40 -3. 89 0.26 3.66 2. 58 -2.71 -1.46 0.45 0.21Tor/On 2, 24 0. 92 2. 50 -0,07 -2, 05 -0.62 -2.07 -0. 89 -0. 18 0.04
S. E. (S. -Sik )# 2.92 3.96 8. 86 0. 18 2.23 2.00 3.04 2.58 0.29 0, 18
S. E. (S. _ Ski )## 2.67 3.61 8.09 0. 17 2.03 1.83 2. 77 2.35 0. 27 0. 17
Vicam 71 = VcmSonora 64 = SonYaqui 50 = YTordo = TorOlesen = OnlUsing
Griffing's model (1956 )
# Standard error ofeffects where i
##Standard error ofeffects where i A
the difference between twoj, k; j k
the difference between twoj, k, 1;j k, 1; k # 1
specific combining ability
specific combining ability

93
effects for plant height indicated that all crosses with the parental
line Tordo, except Tordo/Olesen, showed very high negative S.C.A.
effects, which means that Tordo is a good source for reducing plant
height in the F1
generation. Specific combining ability effects in the
F2 generation were similar for both Tordo and Olesen dwarf. Non
additive effects might have been involved in the expression of height
in the dwarf parent Tordo and were partially lost after one generation
of selfing. The estimated S. C. A. effects in those crosses involving
Vicam 71 and Olesen with Sonora 64 and Yaqui 50 were more con-
sistent from one generation to another than those involving Tordo.
This was especially true for the cultivar Olesen.
Yaqui 50 and Vicam 71 were the only parents showing positive
G. C. A. effects for number of tillers per plant and grain yield in both
generations. Tordo had the lowest G. C. A. effects for grain yield
in the F1
and Olesen the lowest in the F2. There were only three
crosses with positive S. C. A. effects for tiller number in the F1
gener-
ation. These combinations were Vicam 71/Yaqui 50, a high x high
general combiner, and Tordo/Olesen, a low x low general combiner.
The former had two parents with the highest means for tiller number
and because plant yield was so highly correlated with this yield com-
ponent, grain yield per plant may be increased by selecting for tiller
number. Yaqui 50, Tordo, and Vicam 71 were the best general
combiners, in that order, for number of spikelets per spikes. Vicam

94
71 had an average number of spikelets per spike but high G.C.A.
effects for this trait.
This could mean a possibility of improving yield in crosses with
Vicam 71 by increasing the number of spikelets per spike. The
crosses of Vicam 71 times Yaqui 50 and Tordo, which were two
parental cultivars with high means and high general combining ability
in both generations, may be a very good source of large number of
spikelets per spike and high yield. Sonora 64 was the best source
of earliness because it had the most negative values for G. C. A.
effects for days to maturity. Tordo in the F1 and Yaqui 50 in the F2
had the highest G.C.A. effects for days to maturity, therefore they
both can be considered as good sources for lateness.
Sonora 64 and Olesen were the best general combiners for num-
ber of kernels per spikelet. Tordo had high G. C. A. effects for
kernels per spikelet in the F1; however, F2 G.C.A. effects revealed
that some type of gene interactions were present in the expression of
this trait in this cultivar and that these effects were lost after selfing.
The best combination for kernels per spikelet in the terms of its
S. C. A. effects in the F1
was the cross Yaqui 50 /Olesen.
Estimation of G. C.A. effects for kernel weight were high for
Tordo and Sonora 64. Tordo showed very high G. C. A. effects in the
F2' almost twice as much as Sonora 64, while in the F1
the difference
was not as great between these two cultivars. Additive effects for
95
kernel weight in crosses involving Tordo were significantly increased
after selling and the possibility of selecting for high kernel weight
strains in crosses with this cultivar looks promising. The highest
S.C. A. effects for kernel weight in the F1
were observed in the cross
Yaqui 50 /Olesen which was a low x low general combiner combination.
In addition both parental lines had the lowest mean values for this
character. Therefore, it seems very unlikely that progress could
be made through selection in this cross.
The cross Vicam 71/Tordo represents a combination of a very
high general combiner for plant grain yield and tiller number with a
very high, general combiner for kernel weight. This cross also had
the second highest S. C. A. effects for kernel weight. Theoretically
the possibility exists of selecting genotypes with increased expression
for the aforementioned yield components with a resultant increase in
grain yield.
The cross Sonora 64/Tordo was a high x high general combiner
combination for kernel weight which showed positive S.C. A. effects
in both generations. The possibility exists for increasing kernel
weight with this combination because these two cultivars had the
highest mean value for kernel weight. Sonora 64 was the best general
combiner for longer grain filling period and the only other cultivar
that showed positive estimation of G. C. A. effects for this trait was
Olesen. Only the cross Yaqui 50/Tordo, a low x low G. C. A.

96
combiner, showed positive S.C. A. effects for grain filling period. It
would be very difficult to extend the length of grain filling period
through non-additive effects because these effects influence the length
of this agronomic trait to a large extent in a negative manner.
The best general combiners for head grain weight were Sonora
64 and Tordo. Their G. C.A. effects were not as consistent from the
F1
to the F2 as with the other agronomic traits. The cross with the
highest S.C. A. effects for head grain weight was Yaqui 50/01esen.
The crosses Sonora 64 /Olesen and Yaqui 50/Tordo had high S. C. A.
effects for head weight and both involved one parent with high head
weight mean and high general combining ability. The F2 generation
may be used effectively for general combining ability studies. This
seemed possible because the ranking of the parental cultivars for
their G. C. A. effects was about the same from the F1 and F2
genera-
tions. This was true for most traits measured with the exception of
head grain weight. Similar results have been reported by Paroda and
Joshi (1970b). However, the reliance of the F2 generation for esti-
mating S. C.A. needs further testing because S.C. A. effects were not
computed for several traits. In those traits where S. C.A. effects
were calculated for both the F1 and F2
generations, the latter genera-
tion estimations of non-additive effects were similar to those observed
in the F1.

97
The parental lines used in this study differed in their general
combining ability, which was related to the parental means for each
of the traits studied. Usually high S.C. A. effects were associated
with parents of low G. C.A. effects; however, there were exceptions
for some traits. Combinations of high x high and high x low general
combiners had high S. C.A. effects, indicating the possibility that
some additive gene action may have been involved in the superior
performance of these combinations.

98SUMMARY AND CONCLUSIONS
Three genetically different dwarf cultivars of spring wheat were
evaluated as potential sources of short stature to use in a wheat im-
provement program. The study involved a five parent diallel cross,
space planted in a randomized block design with four replications.
The five parents included a semidwarf, a standard height and three
dwarf cultivars. The dwarf cultivars were: Vicam 71 a Norin 10
derivative, Tordo a Tom Thumb derivative, and Olesen dwarf.
Sonora 64 was selected as the semidwarf and the standard height
cultivar was Yaqui 50. The experimental population included the five
parental lines, ten F1
single crosses, ten F2' s from the single
crosses, ten backcrosses to the short parent, and ten backcrosses to
the tall parent. Information was recorded on individual plant basis
for 13 agronomic traits which included: plant height, days to emer-
gence, number of tillers, number of spikelets per spike, head length,
days to maturity, grain yield, harvest index (grain to straw ratio),
kernel weight, number of kernels per spikelet, rachis internode
length, grain filling period (days from heading to maturity), and head
grain weight.
All the characters studied were subjected to an analysis of
variance to detect differences among the forty five entries in the ex-
periment and between and within generations. To compare the reduc-
tion of plant height in the F1 and F2 generation by the different dwarf

99
cultivars, degree of dominance was calculated for the ten hybrids.
Information about the type of gene action for the agronomic characters
studied was estimated by heterosis and heterobeltiosis values, broad
and narrow sense heritability estimates, and combining ability analysis.
In addition, phenotypic, environmental, and genotypic correla-
tions were used to estimate the degree of association between the
agronomic traits studied for each of the 10 crosses. Path-coefficient
analysis was used to provide a means of studying the indirect and
direct effects of various agronomic traits in determining their final
association with plant grain yield. The following conclusions were
drawn.
1. There were genetic differences among the parental cultivars,
their crosses, and generations for all the 13 agronomic traits studied.
2. Partial dominance for tallness was manifested for those
crosses involving the cultivars Vicam 71 and Olesen dwarf. However,
the degree of dominance was so small that some possibilities exist
that the mode of gene action in the inheritance of plant height for these
two dwarf sources is mainly of the additive type. This was especially
true for Olesen dwarf.
3. The cultivar Tordo, when crossed to taller wheats, showed
strong dominance effects towards short stature.
4. Strong heterosis for reduced plant height in crosses involving
the cultivar Tordo were observed. This cultivar, or other Tom Thumb

100
derivatives, may be the best choice to produce short statured F1
hybrids that do not lodge. Olesen dwarf crosses did not show domi-
nance for short straw. However, this cultivar is very short and the Fl
values were always very close to the mid parent value for plant height.
Olesen may also have some potential to be used as a source for short
statured F1
hybrids. The cross between Vicam 71, the Norin 10
derivative, and the standard height variety Yaqui 50 was significantly
taller than the mid parent. Vicam 71 has limited possibilities to be
successfully used as a parent for short statured single cross hybrids
involving a tall standard cultivar.
5. All three sources of dwarfism and their resulting progenies
displayed desirable agronomic characteristics. They have the genetic
potential to be used as a source to produce superior dwarf and semi-
dwarf wheats in a breeding program. Vicam 71 was a good parent in
terms of grain yield and number of tillers per plant. Tordo was the
best source for increasing the number of spikelets per spike, kernel
weight and head grain weight. Olesen was a good progenitor for
increasing number of kernels per spikelet. If these cultivars were
to be ranked in terms of superior offspring for desirable agronomic
traits, Vicam 71 would be first, Tordo second and Olesen dwarf third.
However, each of these parents had some advantage(s) over the other
two and all could be successfully used in breeding short statured
wheats.

101
6. Plant height did not appear to have any direct effect on plant
grain yield in any of the 10 crosses.
7. Fifty percent or more of the phenotypic variability present
for plant height, days to heading, head length, kernel weight, number
of spikelets per spike, rachis internode length, days to maturity,
number of kernels per spikelet, head grain weight, grain filling period,
and harvest index, was due to genetic variation. The amount of
variation present for number of tillers per plant and grain yield was
significantly smaller than that accounted for by the environment in
most of the crosses.
8. The amount of genetic variability associated with days to
heading, days to maturity, plant height, rachis internode length,
number of spikelets per spike, kernels per spikelet, kernel weight,
and harvest index, was mainly the result of additive gene action.
Therefore, effective selection for these traits could be initiated as
early as the F2 generation.
9. Non additive and additive gene action were equally important
in the genetic expression of grain filling period and head grain weight
and as a result selection should be delayed until the F3 or later
generations for these characters.
10. The non-additive portion of the total genetic variance asso-
ciated with number of tillers and grain yield per plant was relatively
important; hence, if selection for these traits is going to be effective,

102
it should be delayed until the F4 or later generations where a large
degree of homozygocity has been obtained.
11. Genetic correlations between some agronomic traits were
consistently high in most of the crosses studied. High positive genetic
correlations were found between plant grain yield vs number of tillers
per plant and kernels per spikelet, number of tillers per plant vs
days to maturity, kernels per spikelet vs head grain weight, plant
height vs head grain weight, and head length vs rachis internode length.
High negative genetic correlations were found between kernel weight
vs days to maturity, plant height vs harvest index, and days to heading
vs grain filling period.
12. Most correlations among agronomic traits were different
from one cross to another due to different gene associations in the
parental lines. The genetic correlations between yield components
varied in value and sign for the different crosses. Therefore, grain
yield could be increased by a combined increase of more than one
yield component because tiller number, spikelet number, kernels
per spikelet, and kernel weight were often not correlated between one
another and some times were even positively correlated.
13. With the large amount of additive gene action present in
the expression of plant height and the consistently high negative genetic
correlation of this trait with harvest index, phenotypic selection for

103
restricted plant height would be useful in obtaining lines with high
grain to straw ratios.
14. Number of tillers per plant had a high direct effect on grain
yield in all crosses. With the exception of two crosses indirect effects
of this trait were negligible. Yaqui 50/Tordo and Vicam 71/01esen
presented high negative indirect effects of tiller number on plant grain
yield via head grain weight. Kernels per spikelet and kernel weight
had no direct effects on grain yield but their indirect effects via head
weight were significant.
15. The F2 generation can be used effectively to estimate
G. C.A. effects from a diallel cross.
16. In general, high S.C. A. effects were associated with
parents of low S. C. A. and vice versa. However, there were excep-
tions for some traits and crosses. High x high and high x low general
combiner combinations had high S.C.A. effects, indicating the possi-
bility that some additive gene action is involved in the superior
performance of these combinations.
17. A wheat breeder should be aware of those genetic associa-
tions between different agronomic traits that occur consistently among
crosses. A correct utilization of genetic associations could lead to
the development of superior wheat cultivars. However, the breeder
should not attempt to select the same plant type from every cross if
he hopes to make progress by using the genetic variability available

104
in the crop. The genetic correlations in this study suggested that each
cross has a particular combination of genes depending upon the par-
ents involved. Every cross is potentially a source of better lines if
when selecting the breeder remembers the reason why the hybridiza-
tion was performed. It is very important to know the contributions of
each parent in a cross combination and the most important trait
associations present in each parent. Through the proper management
of segregating populations of individual crosses superior genotypes
could be obtained.

105
BIBLIOGRAPHY
Allan, R. E. and J. A. Pritchett. 1973. Prediction of SemidwarfCu lm-Length Genotypes in Wheat. Crop Sci., 13:597-599.
Allan, R. E. and 0. A. Vogel. 1963. F2 Monosomic Analysis ofCu lm Length in Wheat Crosses Involving Semidwarf Norio 10 xBrevor 14 and the Chinese Spring Series. Crop Sci. , 3:538-540.
1964. F2 Monosomic Analysis of Coleoptile andFirst-Leaf Development in Two Series of Wheat Crosses. CropSci. , 4 :338 -399.
Allan, R. E., 0. A. Vogel and C. J. Peterson. 1968. Inheritanceand Differentiation of Semidwarf Culm Length of Wheat. CropSci., 8:701-704.
Allard, R. W. 1960. Principles of Plant Breeding. John Wiley andSons. New York.
Alcala, D. S. M. 1973. Evaluation of Parental Performance for GrainYield inTwo Populations of Wheat (Triticum aestivum Vill. , Host).Ph.D thesis. Oregon State University, Corvallis, Oregon.
Anand, S. C. and H. S. Aulakh. 1971. Inheritance of Dwarfness inOlesen's Dwarf (T. aestivum L.) Wheat Information Service,32:14-17.
Anand, S. C. , H. S. Aulakh and S. K. Sharma. 1972. AssociationAmong Yield Components in Dwarf Wheats. Indian J. Agric.Sci. 42:935-938.
Anwar, A. R. and A. R. Chowdhy. 1969. Heritability and Inheri-tance of Plant Height, Heading Date, and Grain Yield in FourSpring Wheat Crosses. Crop Sci. , 9:760-761.
Athwal, D. S. 1971. Semidwarf Rice and Wheat in Global Food Needs.The Quart Review of Biol., 46:1-34.
Baier, W. and G. W. Robertson. 1967. Estimating Yield Componentsof Wheat from Calculated Soil Moisture. Can. J. Plant Sci.46:617-630.

106
Bhatt, G. M. 1972. Inheritance of Heading Date, Plant Height, andKernel Weight in Two Spring Wheat Crosses. Crop Sci., 12:95-98.
1973. Significance of Path Coefficient AnalysisDetermining the Nature of Character Association. Eurphytica.22:338 -343.
Bitzer, M. J. and S. H. Fu. 1972. Heterosis and Combining Abilityin Southern Soft Red Winter Wheats. Crop Sci. 12:35-37.
Borlaug, N. E. 1957. The Impact of Agricultural Research onMexican Wheat Production. Transactions of the New YorkAcademy of Sciences, Series II, 20:278-295.
1968. Wheat Breeding and its Impact in World FoodSupply. Proc, 3rd. Int. Wheat Genet. Symp. 1-36.
Borojevic, S. 1963. Combining Ability in Wheat Crosses. Proc.2nd. Int. Wheat Genet. Symp. , 18-24.
1971. Building a Model of High-Yielding WheatVarieties. Savremena Poljoprivreda (Contemporary Agricul-ture). 19:33-46.
Briggle, L. W. and 0. A. Vogel. 1968. Breeding Short Stature,Disease Resistant Wheats in the United States. Euphytica, 17,(Suppl. 1):107-130.
Briggs, F. N. and P. F. Knowles. 1967. Introduction to PlantBreeding Reinhold Pub. Co, New York.
Brown, C. M. , R. 0. Weibel, and R. D. Seif. 1966. Heterosis andCombining Ability in Common Winter Wheat. Crop Sci. 6:382-383.
Burton, G. W. 1951, Quantitative Inheritance in Pearl Millet(Pennisetum glaucum). Agron. J. , 43:409-417.
Bush, R. H. , K. S. Lucken, and R. C. Frohberg. 1971. F1 HybridsVersus Random F5 Line Performance and Estimates of GeneticEffects in Spring Wheat. Crop Sci. 11:357-361.

107
CIMMYT 1966-67 Report. 1968. Dwarfness in Hybrids. pp. 78-79.International Maize and Wheat Improvement Center. MexicoCity, Mexico.
Daaloul, A. 1973. Genetic and Environmental Factors Influencingthe Effectiveness of Early Generation Selection in a Dial lelCross Involving Four Winter Wheat Cultivars (Triticum aesti-vum, Vill. , Host). Ph. D. Thesis. Oregon State University,Corvallis, Oregon.
Das, P. K. 1972. Studies on Selection for Yield in Wheat. Anapplication of Genotypic and Phenotypic Correlations, PathCoefficient Analysis and Descriminant Functions. J. Agric.Sci. Camb. 79:447-453.
Dewey, D. R. and K. H. Lu. 1959. A Correlation and Path-Coeffi-cient Analysis Components of Crested Wheatgrass Seed Produc-tion. Agron. J. 51:515-518.
Donald, C. M. 1968. The Breeding of Crop Ideotypes. Euphytica.17:385-403.
Draper, N. R. and H. Smith. 1966. Applied Regression Analysis.John Wiley and Sons, Inc. New York. London, Sydney.
Dudley, J. W. and R. H. Moll. 1969. Interpretation and Use ofEstimates of Heritability and Genetic Variances in PlantBreeding.Crop Sci. , 9:257-262.
Falconer, D. S. 1960. Introduction to Quantitative Genetics. RonaldPress Co. New York.
Farrer, W. 1898. The Making and Improvement of Wheats forAustralian Conditions. Agricultural Gazette of New South Wales.9:131-168, 241-260.
Fick, G. N. and C. 0. Qualset. 1973a. Genes for Dwarfness inWheat, Triticum aestivum L. Genetics, 75:531-539.
1973b. Inheritance and Distribution of Grass-Dwarfing Genes in Short-Statured Wheats. Crop Sci. 13:31-33.
Fonseca, S. and F. L. Patterson. 1968a. Hybrid Vigour in a SevenParent Diallel Cross in Common Winter Wheat. (Triticumaestivum L.). Crop Sci. , 8:85-88.

108
Fonseca, S. and F. L. Patterson. 1968b. Yield Components,Heritabilities and Interrelationship in Winter Wheat (T.aestivum L.) Crop Sci., 8:614-617.
Frey, K. J. 1971. Improving Crop Yields Through Plant Yields.In Moving off the Yield Plateau. ASA special publication 15-58.
Griffing, B. 1956. Concept of General and Specific Combining Abilityin Relation to Diallel Crossing Systems. Australian J. of Biol.Sci. 9:463-493.
Gyawali, K. K., C. 0. Qualset and W. T. Yamazaki. 1968. Esti-mates of Heterosis and Combining Ability in Winter Wheat.Crop Sci., 322-324.
Hoff, J. C. , B. J. Kolp and K. E. Bohnenblust. 1973. Inheritanceof Coleoptile Length and Culm Length in Crosses InvolvingOlesen's Dwarf Spring Wheat. Crop Sci. , 13:181-183.
Hsu, P. and P. D. Walton. 1970. The Inheritance of Morphologicaland Agronomic Characters in Spring Wheat Euphytica. 19:54-60.
Jinks, J. L. and B. I. Hayman. 1953. The Analysis of DiallelCrosses. Maize Genetics Cooperative Newsletter. 27:48-54.
Johnson, V. A., J. W. Schmidt, and W. Mekasha. 1966. Compari-son of Yield Components and Agronomic Characteristics of FourWinter Wheat Varieties Differing in Plant Height. Agron. J.58:438-441.
Johnson, V. A., K. J. Biever, A. Haunold and J. W. S. Schmidt.1966. Inheritance of Plant Height, Yield of Grain, and OtherPlant and Seed Characteristics in a Cross of Hard Red WinterWheat, Triticum aestivum L. Crop Sci., 6:336-338.
Khaor, F. H. 1971. Variability and Covariability for Plant Height,Heading Date, and Seed Weight in Wheat Crosses. Theoret.Appl. Genetics. 41:100-103.
Khan, A. W., N. U. Khan and D. C. Beohar. 1972. Estimates ofGenetic Variability and Correlation Coefficients of Some Bio-metric Characters in Rain fed Wheat (T. aestivum L.).Indian J. Agric. Sci. 42:557-561.

109
Kronstad, W. E. 1963. Combining Ability and Gene Action Estimatesand the Association of the Components of Yield in Winter WheatCrosses. Ph. D. Thesis. Oregon State University, Corvallis,Oregon.
Kronstad, W. E. and W. H. Foote. 1964. General and SpecificCombining Ability Estimates in Winter Wheat (Triticum aestivumVill. , Host). Crop Sci. 4:616-619.
Lee, J. and P. J. Kaltsikes. 1972. Dialled Analysis of CorrelatedSequential Characters in Durum Wheat. Crop Sci. , 12:770-772.
Li, C. C. 1948. An Introduction to Population Genetics. NationalPeking University Press. Peiping China.
1956. The Concept of Path Coefficient and itsImpact on Population Genetics. Biometrics. 12:190-210.
Lukyanenko, P. P. 1966. The Development of High-Yielding WinterWheat Varieties with High-Quality Grain. Acta AgriculturaeScandinavica, Suppl. 16:323-330.
Lush, J. L. 1945. Animal Breeding Plans. Iowa State CollegePress, 3rd ed. Ames, Iowa.
Morris, R. , J. W. Schmidt, and V. A. Johnson. 1972. Chrom-osomal Location of a Dwarfing Gene in Tom Thumb WheatDerivative by Monosomic Analysis. Crop Sci. , 12:247-249.
McNeal, F. H., M. A. Berg, and M. G. Klages. 1960. Evaluationof Semidwarf Selections from a Spring Wheat BreedingProgram. Agron. J., 52:710-712.
Paroda, R. S. and A. B. Joshi. 1970a. Genetic Architecture ofYield and Components of Yield in Wheat. Indian J. Genet. &Plant Breed. , 30:298-314.
1970b. Combining Ability in Wheat. Indian J.Genet. & Plant Breed. 30:630-637.
Piech, J. 1968. Monosomic and Conventional Genetic Analysis ofSemidwarfism and Grass-Clump Dwarfism in Common Wheat.Euphytica, 17(Suppl. 1):153-170.

110
Porter, K. B. , I. M. Atkins, E. C. Gilmore, K. A. Lahr, and P.Scottino. 1964. Evaluation of Short Stature Winter Wheats(Triticum aestivum, L.) for Production Under Texas Conditions.Agron. J., 56:393-396.
Powel, J. B. and A. M. Schlehuber. 1967. Components of HeightInheritance of the Semidwarf Straw Character in Wheat.(Triticum aestivum, L.) Crop Sci. , 7:511-516.
Reddi, M. V. , E. G. Heyne, and G. H. L. Liang. 1969. Heritabilitiesand Interrelationships of Shortness and Other Characters in F3and F4 Generations of Two Wheat Crosses (T. aestivum, L.)Crop Sci. , 9:222-225.
Reitz, L. P. and S. C. Salmon. 1968. Origin, History, and Use ofNorin 10 Wheat. Crop Sci., 8:686-689.
Romero, G. E. and K. J. Frey. 1972. Herencia de Altura de Plantaen Cruzamientos entre Variedades "Normales" y "Semi-enanas"de Trigo. Turrialba, 22:189-197.
Romero, G. E. and K. J. Frey. 1973. Inheritance of Semidwarfnessin Several Wheat Crosses. Crop Sci. , 13:334-337.
Schmalz, H. 1972. Studies on the Inheritance of Number of Spikeletsper Ear in Bread Wheat. Archiv fur Zuchtungsforshung 2:153-165. In Plant Breeding Abstracts (1973) 43:4839.
Sharma, D. and D. R. Knott. 1964. The Inheritance of Seed Weightin a Wheat Cross. Can. J. Genet. Cytol. 6:419-425.
Singh, J. and S. C. Anand. 1971a. Inheritance of Grain Number inWheat. Indian J. Genet. and Plant Breed. 31:177-183.
1971b. Inheritance of Spike Number in Wheat.Indian J. Genet. and Plant Breed. 31:212-217.
Singh, J. and S. C. Anand. 1972. Inheritance of Kernel Weight inWheat. Indian J. Genet. and Plant Breed. 32:299-302.
Singh, K. B. and V. P, Gupta. 1969. Combining Ability in Wheat.Indian J. Genet. and Plant Breed. 29:227-232.

111
Singh, R. D. , B. N. Chatterjee and S. N. Sanyal, 1972. Tilleringpattern in tall and dwarf Wheat Varieties under different levelsof nitrogen and Spacing. Indian J. Agri. Sci. 42:42-47.
Singh, S. P. , M. S. Shrivastava, and S. V. Valamker. 1970.Variability and Correlation Coefficients for Grain Yield andOther Quantitative Characters in Triticum durum Desf. IndianJ. Agri. Sci. , 40:1042-1045.
Snedecor, G. W. and W. C. Cochran. 1967. Statistical Methods.Iowa State University Press. Ames, Iowa.
Somayajulu, P. L. N. , A. B. Joshi and B. R. Murty, 1970. Com-bining Ability in Wheat. Ind. J. Genet. & Plant Breed. 30:134-141.
Spiertz, J. H. , B. A. ten Hag and L. J. P. Kupers. 1971. RelationBetween Green Area Duration and Grain Yield in Some Varietiesof Spring Wheat Neth. J. Agri. Sci., 19:211-222.
Sprague, G. F. and L. A. Tatum. 1942. General vs Specific Com-bining Ability in Single Crosses of Corn. J. of Amer. Soc. ofAgron. 34:923-32.
Sun, P. L. F. , H. L. Shands, and R. A. Forsberg. 1972. Inheritanceof Kernel Weight in Six Spring Wheat Crosses. Crop Sci. , 12:1-5.
Syme, J. R. 1972. Single Plant Characters as a Measure of FieldPlot Performance of Wheat Cultivars. Aust. J. Agri. Res. ,23:753-760.
Tandon, J. P. , A. B. Joshi and K. B. L. Jain. 1970. Comparisonof Graphic and Combining Ability Analysis of Diallel Crossesin Wheat. Indian J. Genet. & Plant Breed. 30:91-103.
Virk, D. S. , S. C. Anand and A. S. Khehra. 1971. Heritability ofSome Important Quantitative Characters in Wheat (T. aestivumL.) Madras Agricultural Journal 58:194-198. In Plant BreedingAbstracts (1972) 42:7172.
Virk, D. S. and A. S. Khehra. 1972. Variability and Interrelation-ships of Wheat (Triticum aestivum L.) Indian J. Agri. Sci. 42:657-660.

112
Vogel, 0. A., R. E. Allan, and C. J. Peterson. 1963. Plant andPerformance Characteristics of Semidwarf Winter WheatsProducing Most Efficiently in Eastern Washington. Agron.J. 55:397-398.
Vogel, 0. A., J. C. Craddock, Jr., C. E. Muir, E. H. Everson andC. R. Rhode, 1956. Semidwarf Growth Habit in Winter WheatImprovement for the Pacific Northwest. Agron. J., 48:76-78.
Wallace, D. H., J. L. Ozbun, and H. M. Munger. 1972. Physio-logical genetics of Crop Yield. Advances in Agronomy 24 :97-146.
Walton, P. D. 1969. Inheritance of Morphological CharactersAssociated with Yield in Spring Wheat. Can. J. Plant Sei.49:587-596.
1971a. The Use of Factor Analysis in DeterminingCharacters for Yield Selection in wheat. Euphytica, 20 :416-421.
422-424.1971b. Heterosis in Spring Wheat. Crop Sci., 11;
Wareing, P. F. 1970. Plant Science and Food Production. TheAdvancement of Science, 27:1-10.
Warner, J. N. 1952. A Method for Estimating Heritability. Agron.J., 7:427-430.
Whitehouse, R. N. A., J. B. Thompson and M. A. M. Do ValleRibeiro. 1958. Studies on the Breeding of Self-PollinatedCereals. II. The Use of a Diallel Cross Analysis in YieldProduction. Euphytica, 7:147-169.
Widner, J. N. and K. L. Lebsock. 1973. Combining Ability in DurumWheat: I. Agronomic Characteristics. Crop Sci., 13:164-167.
Wright, S. 1921. Correlation and Causation. J. Agri. Res, 20:557-585.
8:239-255.1923. The Theory of Path Coefficients. Genetics.

APPENDIX

113
PEDIGREE AND DESCRIPTION OF CULTIVARS
Olesen. (Pitic "sib/Mazoe, S948-A1). Olesen is a very short,
soft red, spring wheat cultivar bred by Dr. Robert Olesen in Rhodesia.
It has very thick and strong culms, is awned and white chaffed, has
small and clavate heads and is an early maturing cultivar. No infor-
mation is available about its disease resistance.
Sonora 64. (Yaktana 54/2/Norin 10/ Brevor/3/ 2*Yaqui 54,
II-8429-2Y-6C-6Y-4C-2Y-1C). Sonora 64 is a hard red spring wheat
cultivar that was released as a commercial variety in Mexico in 1964.
It has a semidwarf growth habit, averaging 80 to 90 cm in height.
It is awned, white chaffed and has oblong heads of regular size. It
has high grain test weight and good yield potential and breadmaking
characteristics. It is currently susceptible to some of the prevalent
races of leaf and stripe rust in Mexico. It is a very early and widely
adapted cultivar due to its insensitivity to day length.
Tordo. (Nainari 60/2/Tom Thumb/ Sonora 64/3/ Lerma Rojo
64/Sonora 64, FI-244-67-1Y-6B). Tordo is a hard red spring wheat
almost as short as Olesen dwarf. The original source of dwarfing is
the cultivar Tom Thumb which was originally from Tibet. It is an
awned cultivar with brown chaff when ripe, with a long fusiform head.
It is used as breeding material in the Maize and Wheat Improvement
Center in Mexico. Its resistance to diseases and breadmaking

114
characteristics are not well known. It is medium late in maturity.
Vicam 71. (Lerma Rojo 64/ Sonora 64//Napo 63, II- 22398 -39M-
1R-0Y-101M-0Y). Vicam 71 is a soft white spring cultivar which was
released as a commercial variety in Mexico in 1971. It has short
and stiff stems, averaging 65 to 75 cm (triple dwarf) in height, is
awned and has brown chaff, small oblong heads, medium test weight
and soft and extensible gluten. It is resistant to the prevalent races
of stem rust in Mexico and moderately resistant to leaf rust. It is a
cultivar with a high yield potential, is late maturing and tillers
profusely.
Yaqui 50. (Newthatch/ Marroqui, 120-3c(9-11c)-24c). Yaqui
50 is a hard red spring, tall standard cultivar which was widely grown
in Mexico. It has thick calms which give it fairly good straw strength,
is awnless and white chaffed, has long-laxe oblong heads. It has low
test weight, but has good milling and baking quality. It has adult plant
resistance to all known races of stem rust with the exception of race
15B. It is susceptible to the prevalent races of leaf rust in Mexico.
It is a late maturing cultivar with good yield potential that has been
replaced by semidwarf varieties.

Appendix Table 1.
115
Summary of weather information from November1972 to April, 1973 at CIANO ExperimentalStation, Ciudad Obregon, Sonora, Mexico.Wheat Physiology Meteorological Station.
Month Temperature °C Rainfall Evapor-ation**
Mean max Mean min mm mm72
-73long*term
72-73
long*term
72-73
long*term
72-73
November 26.8 28.9 10.5 11.8 1,4 6.2 4.95
December 24.7 24.1 9.4 8.8 27.3 20.1 3.38
January 21.8 23.4 5.9 6.8 15.7 15.1 2.65
February 24.1 24.8 8.9 6.9 38.4 6.8 3.10
March 24.8 27.4 7.3 8.3 7.7 2.4 5.21
April 29.4 31.4 8.0 10.8 15.1 0.4 7.47
J.
**1960 to 1972 = 13 years
USWB Class A pan

Appendix Table 2. Summary of the genotypic correlations between thirteen agronomic traits and ten wheat crosses.
Kernels GrainSpikelet per Kernel Head Days to Days to Filling Head
Tillers Number Spikelet Weight Weight Height Heading Maturity Period LengthRachis
InternodeHarvestIndex
yield * 1.20,5, -1,-3,-4, 1,2,4,5, -1,-3, 2,-3,5, 2,6,7, 5,-8 2,3,-4 -1,-5, 1,-3 1,-4,5,9 -2.-3r4.196X 9 7,8,9,X -7,8,9X -6,:9X 9 -7 -8,9
Tillers -3,-5, 1,2,5, -1.-3,r4r5, 204-4, 2,-3,9 5,7 1,2,3,5, 2.-af- 5, 1,-4,5,9 -3,-4,9 4,..19!.1pci-c04,A2_sdc -7
1.-3 1 3.-1-5,9f.7111,-2 - .- . -1 2 6
Spikelet Number 1,-45, -4,-5. -3,-4. 1,9 4,5,6,7 4,5,7,X -1,-4r6, 1,4,7 1,-3,4, -2,-69 -9,-X -6,9 -7,9 7.-9
J 3, -1 -4 1,-3 2 4 4 1.-4 3 3.-Z -2
Kernels/Spikelet -1,x 42456. 1,2,X -8,-X 2
7A9. x5,8 1,-4,5 8
(1. -1 9 3 -2 1 2 2.-1 01
Kernel Weight 3,4,6 3,4,8, -4,- 5, -14-3,-4,-5, 8,X 2,- 5,-7, 2,- 7,9,X -3,81-9,9,X -9,-X .6,-7,- 9 X -X
3 5 -4 -7 2 i. -3 3.-1 1.-=Head Weight 2,3,4, 2,-3, 2,-3,-6 8,X 2,-3 2,6 1,-3 .-4,
68 .9. X -8 , -X 5.-6,87 1.-3 1.-2 2 1.-1 2 3.-3
Height -X 1 1,2,7 4.-2,-4-4--B
-1 0 1 3
Days to Heading 4,5,7,8 -1,-4-446, -2,7 -2 -1,-5,-94Q0-8,9,3C
1. -1 -1 -3 J
Days to Maturity -9CrossNumber to 0 -1 0
1 = Son 64/Y 50Grain Filling 2 = Son 64/On -1,2Period 3 = Son 64/Tor
4 = Y 50/On 11.-1 15 = Y 50/Tor
Head Length 6 = Vc 71/Son 64 -8,X7 = Vc 71/Y 508 = Vc 71/On
47.8.9.XIx 1.-1
9 = Vc 71/TorRachis Internode X = Tor/On
13.-3.
* indicates cross number which showed high genetic correlations:between .'the corresponding traits. A negative sign signifies the correlationwas negative.
** Refers to total number of crosses where either high positive or negative correlatiOns were observed.rr