amy mitchell, jeffrey gottfried, michael barthel and elisa...
TRANSCRIPT

FOR RELEASE JULY 7, 2016
BY Amy Mitchell, Jeffrey Gottfried, Michael Barthel and Elisa Shearer
FOR MEDIA OR OTHER INQUIRIES:
Amy Mitchell, Director of Journalism Research
Rachel Weisel, Communications Associate
202.419.4372
www.pewresearch.org
RECOMMENDED CITATION: Pew Research Center, July, 2016, “The Modern News Consumer”
NUMBERS, FACTS AND TRENDS SHAPING THE WORLD

2
PEW RESEARCH CENTER
www.pewresearch.org
About Pew Research Center
Pew Research Center is a nonpartisan fact tank that informs the public about the issues, attitudes
and trends shaping America and the world. It does not take policy positions. The Center conducts
public opinion polling, demographic research, content analysis and other data-driven social
science research. It studies U.S. politics and policy; journalism and media; internet, science and
technology; religion and public life; Hispanic trends; global attitudes and trends; and U.S. social
and demographic trends. All of the Center’s reports are available at www.pewresearch.org. Pew
Research Center is a subsidiary of The Pew Charitable Trusts, its primary funder. This report was
made possible by The Pew Charitable Trusts, which received support for the project from the John
S. and James L. Knight Foundation.
© Pew Research Center 2016

3
PEW RESEARCH CENTER
www.pewresearch.org
The Modern News Consumer
Wave after wave of digital innovation has introduced a new set of influences on the public’s news
habits. Social media, messaging apps, texts and email provide a constant stream of news from
people we’re close to as well as total strangers. News stories can now come piecemeal, as links or
shares, putting less emphasis on the publisher. And, hyper levels of immediacy and mobility can
create an expectation that the news will come to us whether we look for it or not. How have these
influences shaped Americans’ appetite for and attitudes toward the news? What, in other words,
are the defining traits of the modern news consumer?
A new, two-part survey by Pew Research Center, conducted in early 2016 in association with the
John S. and James L. Knight Foundation, reveals a public that is cautious as it moves into this
more complex news environment and discerning in its evaluation of available news sources.
To be sure, news remains an important part of public life. More than seven-in-ten U.S. adults
follow national and local news somewhat or very closely – 65% follow international news with the
same regularity. Fully 81% of Americans get at least some of this news through websites, apps or
social networking sites. And, this digital news intake is increasingly mobile. Among those who get
news both on desktop computers and mobile devices, more than half prefer mobile.
In this digital news environment, the role of friends and family is amplified, but Americans still
reveal strong ties to news organizations. The data also reinforce how, despite the dramatic changes
witnessed over the last decade, the digital news era is still very much in its adolescence.
These findings come from a two-part study which asked U.S. adults a wide range of questions
about their news habits and attitudes, and then over the course of a subsequent week asked them
in real time about news they had gotten in the last two hours. The first survey was conducted Jan.
12-Feb. 8, 2016, among 4,654 U.S. adults ages 18 and older who are members of Pew Research
Center’s American Trends Panel. The second survey consisted of 14 short, online surveys that were
administered two per day from Feb. 24-March 1, 2016. Survey invitations were sent at different
times each day, and responses were accepted for two hours after the invitations were sent.
Panelists who completed the January wave on the web and reported that they get news online
were asked to participate in the experiential study; 2,078 panelists participated and completed at
least 10 of the 14 surveys.

4
PEW RESEARCH CENTER
www.pewresearch.org
Updated September 2017: In the Spanish language version of the questionnaire, “local television
news” was mistranslated as “television news” for a question asking respondents how often they
watch local television news (which resulted in a 46% share who said they do so often). This
affected the 66 respondents who took the survey in Spanish (4% of the sample after weighting)
The effects of this mistranslation were minimal and do not affect the report’s conclusions.

5
PEW RESEARCH CENTER
www.pewresearch.org
1. Pathways to news
In 2016, Americans express a clear preference for getting their news on a screen – though
which screen that is varies. TV remains the dominant screen, followed by digital. Still, TV news
use is dramatically lower among younger adults, suggesting further shake-ups to come.
As of early 2016, just
two-in-ten U.S. adults often
get news from print
newspapers. This has fallen
from 27% in 2013.
This decrease occurred
across all age groups, though
the age differences are still
stark: Only 5% of 18- to 29-
year-olds often get news
from a print newspaper,
whereas about half (48%) of
those 65 and older do.
Compared with print,
nearly twice as many adults
(38%) often get news online,
either from news
websites/apps (28%), on
social media (18%) or both.
(81% of adults ever get news
on these online platforms.)
Still, TV continues to be the most widely used news platform; 57% of U.S. adults often get TV-
based news, either from local TV (46%), cable (31%), network (30%) or some combination of the
three. This same pattern emerges when people are asked which platform they prefer – TV sits at
the top, followed by the web, with radio and print trailing behind.
But demographics speak to the fragility behind those TV numbers. While solid majorities of
both those ages 50-64 (72%) and those 65+ (85%) often get news on TV, far smaller shares of
younger adults do so (45% of those 30-49 and 27% of those 18-29). Alternatively, the two younger
groups of adults are much more likely than older adults to turn to online platforms for news – 50%
of 18- to 29-year-olds and 49% of those ages 30-49 often do so.
About four-in-ten Americans often get news online
% of U.S. adults who often get news on each platform
% of each age group who often get news on each platform
Note: Just 1% said they never got news on any platform (not shown).
Source: Survey conducted Jan. 12-Feb. 8, 2016.
“The Modern News Consumer”
PEW RESEARCH CENTER

6
PEW RESEARCH CENTER
TV’s staying power over print is buttressed by the fact that Americans who prefer to watch
news still choose TV, while most of those who prefer to read the news have migrated online.
The greatest portion of U.S. adults, 46%, prefer to watch news rather than read it (35%) or
listen to it (17%).
When paired with the platforms people prefer, the data reveal that as of now, the web has
largely pulled in “readers” rather than “watchers.” While those who prefer watching news
predominantly opt for TV and listeners turn to radio, most of those who prefer reading news now
opt to get news online rather than in print (59%, compared with 26% of news readers who opt for
print).
News watchers overwhelmingly prefer television, while readers prefer the web
Of those who prefer watching/reading/listening to their news, % who prefer getting their news on each platform
Note: Platform preference (TV, online, radio, print) includes those who only get news on each. Just 1% said they never get news on any
platform (not shown).
Source: Survey conducted Jan. 12-Feb. 8, 2016.
“The Modern News Consumer”
PEW RESEARCH CENTER

7
PEW RESEARCH CENTER
www.pewresearch.org
Within the digital realm, mobile news consumption is rising rapidly. The portion of Americans
who ever get news on a mobile device has gone up from 54% in 2013 to 72% today.
Two-thirds, 66%, of adults get news on both
types of digital devices, while 13% get news only
on a desktop/laptop and 5% only do so on a
mobile device (15% do not get news on any
digital device).
But, among those who get news on both,
more prefer mobile (56% to 42% who prefer
desktop).
One of the most prominent distinctions
between those oriented towards mobile devices
for their digital news and those oriented
towards desktops is age. Fully seven-in-ten of
those ages 18-29 either prefer or only use
mobile for getting their digital news, compared
with 53% of those 30-49, 29% of those 50-64
and just 16% of those 65+. When it comes to
news attitudes and habits, the two groups are
quite similar. This includes loyalty to news
sources, trust in information from news
organizations, discussion of news with others
and level of engagement with news on social
media.
Rapid growth since 2013 in portion
using mobile to get news;
desktop/laptop usage holds steady
% of U.S. adults who ever get news on …
Source: Survey conducted Jan. 12-Feb. 8, 2016.
“The Modern News Consumer”
PEW RESEARCH CENTER

8
PEW RESEARCH CENTER
www.pewresearch.org
11%
15
4
61%
59
38
Very Somewhat Net
71%
74
42
News organizations
People they are close with
People they are not
particularly close with
36%
15
6
40%
54
28
Often Sometimes Net
76%
69
34
News organizations
People they are close with
People they are not
particularly close with
Personal contacts are also
a common source of news
and can play an amplified
role online. But Americans
see clear distinctions
between news
organizations, friends and
family, and more distant
individuals.
About two-thirds (63%) of
Americans say family and
friends are an important way
they get news, whether online
or offline; 10% see them as the
most important.
Still, online news
organizations play the larger
role: 36% of online news
consumers often get news
from news organizations,
compared with about half as many who do so from people with whom they are close (15%). Even
fewer (6%) say they often get news from people they’re not close with.
But those who get news from these sources are as likely to say the news from close friends and
family is relevant as they are to say this of news organizations; 15% of those who get online news
from close personal contacts say those updates are very near to their interests, compared with 11%
who get news from news organizations and 4% of those who get news from more distant contacts.
The less newsy are more likely to say friends and family are important pathways to news: 69%
of those who follow news less often say friends and family are important, compared with 57% of
those who follow news all or most of the time. Additionally, women are more likely than men to
say friends and family are important, young adults are more likely than older adults, and blacks
are more likely than whites to say this.
2. Trust and accuracy
Online news consumers more likely to get news from
professional outlets than from friends, family – but
just as likely to think each provides relevant news
% of online news consumers who get news online from … often/sometimes
Of those who get news online from each, % who say that the news they get
from … is very/somewhat near to their interests
Source: Survey conducted Jan. 12-Feb. 8, 2016.
“The Modern News Consumer”
PEW RESEARCH CENTER
9
PEW RESEARCH CENTER
www.pewresearch.org
22%
18
14
60%
59
63
Local news orgs
National news orgs
Family, friends &
acquaintances
Some A lot
82%
76
77
Net
4 30 34 Social media
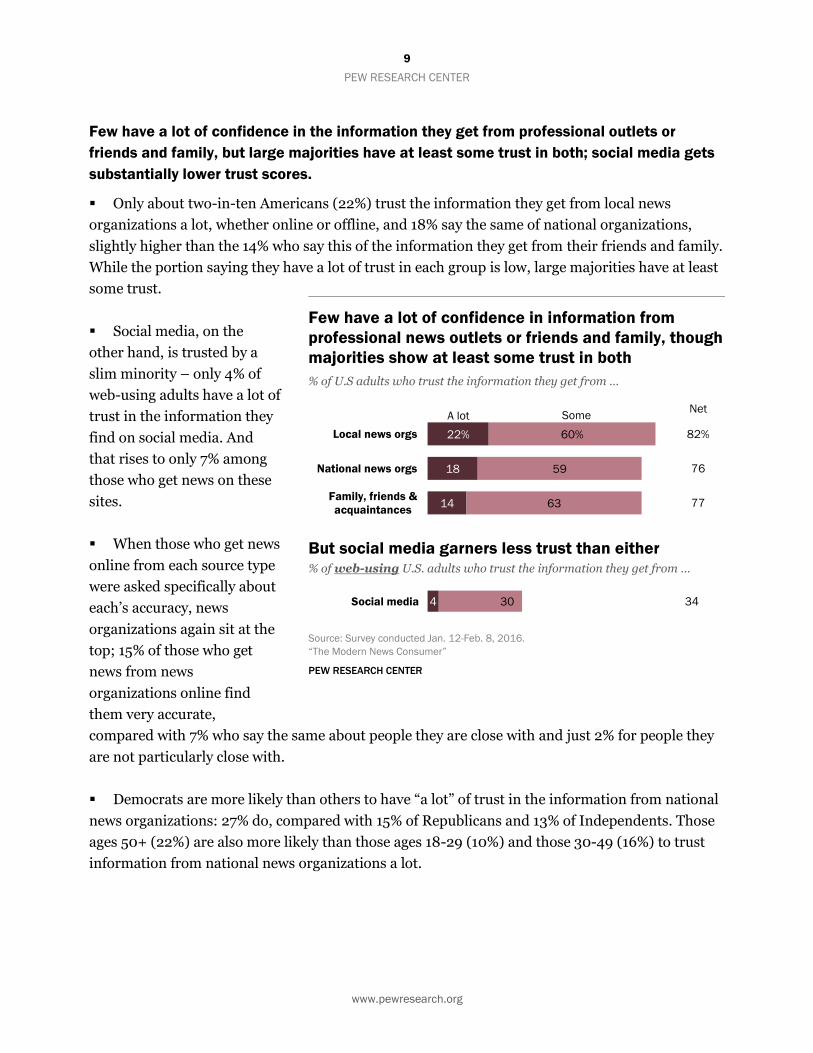
Few have a lot of confidence in the information they get from professional outlets or
friends and family, but large majorities have at least some trust in both; social media gets
substantially lower trust scores.
Only about two-in-ten Americans (22%) trust the information they get from local news
organizations a lot, whether online or offline, and 18% say the same of national organizations,
slightly higher than the 14% who say this of the information they get from their friends and family.
While the portion saying they have a lot of trust in each group is low, large majorities have at least
some trust.
Social media, on the
other hand, is trusted by a
slim minority – only 4% of
web-using adults have a lot of
trust in the information they
find on social media. And
that rises to only 7% among
those who get news on these
sites.
When those who get news
online from each source type
were asked specifically about
each’s accuracy, news
organizations again sit at the
top; 15% of those who get
news from news
organizations online find
them very accurate,
compared with 7% who say the same about people they are close with and just 2% for people they
are not particularly close with.
Democrats are more likely than others to have “a lot” of trust in the information from national
news organizations: 27% do, compared with 15% of Republicans and 13% of Independents. Those
ages 50+ (22%) are also more likely than those ages 18-29 (10%) and those 30-49 (16%) to trust
information from national news organizations a lot.
Few have a lot of confidence in information from
professional news outlets or friends and family, though
majorities show at least some trust in both
% of U.S adults who trust the information they get from …
But social media garners less trust than either % of web-using U.S. adults who trust the information they get from …
Source: Survey conducted Jan. 12-Feb. 8, 2016.
“The Modern News Consumer”
PEW RESEARCH CENTER

10
PEW RESEARCH CENTER
www.pewresearch.org
U.S. adults see the news media as performing its watchdog function – but overwhelmingly
say that news organizations are biased.
Three-quarters of
Americans think that news
organizations keep political
leaders in check – preventing
them from doing things that
they shouldn’t be doing.
But about the same
portion (74%) say that news
organizations tend to favor
one side – including 75% of
those who say the media
prevents leaders from doing
things they shouldn’t.
Political differences
emerge here with
conservative Republicans
most likely to think that news
organizations are one-sided.
This ideological
difference is reinforced by
earlier research that asked
about trust of individual
news organizations. Of the 36
sources asked about in our
2014 survey, 28 of them were
trusted more than distrusted
by respondents who
expressed consistently liberal political views across a range of questions about political values; 24
of them were distrusted more than trusted by consistent conservatives.
Three-fourths of Americans think news organizations
keep political leaders in line
% of U.S. adults who think that news organizations keep political leaders
from doing …
But nearly the same portion say news media are
biased
% of U.S. adults who think that news organizations … when covering
political and social issues
Source: Survey conducted Jan. 12-Feb. 8, 2016.
“The Modern News Consumer”
PEW RESEARCH CENTER

11
PEW RESEARCH CENTER
www.pewresearch.org
31% 35% 33%
Represents more
than one side Represents just
one side
They don't get this
news from friends
& family online
Of the 35% who say it represents just one side ...
69% say they would prefer
a greater mix of views ...
... while 30% are OK that
it represents just one side.
Americans are more evenly divided on whether online news they get from friends and
family is one-sided – but many would prefer that it were not.
35% of online news
consumers say the news they
get from their friends and
family online is one-sided;
31% say that it represents
more than one side.
Most, 69%, of those who
say that the news from
friends and family online is
one-sided would prefer that
they post or send things that
represent a greater mix of
views. Three-in-ten are OK
with the one-sidedness.
Conservative Republicans
that say the news they get
from friends and family is
fairly one-sided are much more likely than others to say that this is OK (51%, compared with about a
third or less of other political groups).
Americans are more divided in whether they think
news they get online from friends and family is one-
sided
% of online news consumers who think that the news their friends and
family post or send online about political and social issues …
Source: Survey conducted Jan. 12-Feb. 8, 2016.
“The Modern News Consumer”
PEW RESEARCH CENTER

12
PEW RESEARCH CENTER
www.pewresearch.org
51%
76%
48%
23%
Loyal Not particularly loyal
Turn to the same sources
Don't turn to the
same sources
18% of U.S.
adults say
they are not
loyal & don't
go to the
same sources
-- the "non-
loyal"
46% of U.S.
adults say they
are loyal & go to
the same
sources -- the
"very loyal"
% of U.S. adults who say they are ... to their news sources
% of U.S. adults who usually ... when they get news
3. Loyalty and source attention
Updated February 2017: The numbers for source recall were updated to account for the small
number of times respondents skipped the question. No number changed by more than one
percentage point.
Attitudinally, Americans are split on whether they feel loyal to their news sources – but
behaviorally, they tend to stick to the same sources anyway.
About half (51%) of Americans say that they are loyal to their news sources, while 48% say they
are not particularly loyal.
At the same time though, 76% of Americans say they usually turn to the same sources for news.
Taken together, nearly half (46%) of Americans both describe themselves as loyal and also go
to the same sources repeatedly (the “very loyal”). Just 18% are neither attitudinally nor
behaviorally loyal (the “non-loyal”).
Older adults are more likely to be in this group: 58% of those ages 65+ are “very loyal,”
whereas only 28% of those ages 18-29 are. And women are more likely to be very loyal (49%) than
men (43%).
Attitudinally, Americans are split in their loyalty to news sources; behaviorally, they
are overwhelmingly loyal
Note: “No answer” not shown.
Source: Survey conducted Jan. 12-Feb. 8, 2016.
“The Modern News Consumer”
PEW RESEARCH CENTER
13
PEW RESEARCH CENTER
www.pewresearch.org
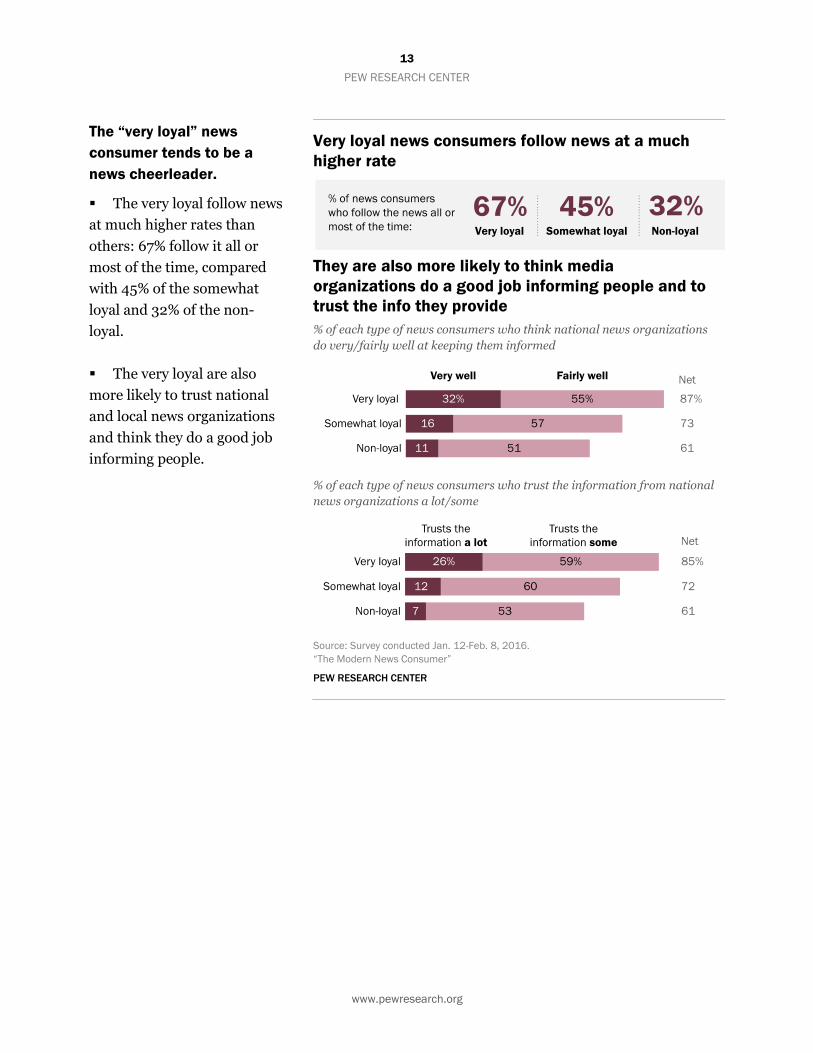
The “very loyal” news
consumer tends to be a
news cheerleader.
The very loyal follow news
at much higher rates than
others: 67% follow it all or
most of the time, compared
with 45% of the somewhat
loyal and 32% of the non-
loyal.
The very loyal are also
more likely to trust national
and local news organizations
and think they do a good job
informing people.
Very loyal news consumers follow news at a much
higher rate
They are also more likely to think media
organizations do a good job informing people and to
trust the info they provide
% of each type of news consumers who think national news organizations
do very/fairly well at keeping them informed
% of each type of news consumers who trust the information from national
news organizations a lot/some
Source: Survey conducted Jan. 12-Feb. 8, 2016.
“The Modern News Consumer”
PEW RESEARCH CENTER

14
PEW RESEARCH CENTER
www.pewresearch.org
And they are also heavily reliant on TV; 54% of very loyal news consumers prefer to get news
from TV. No other platform comes close. Among the non-loyal, however, there is a much wider
mix of preferred platforms including more weight towards digital sources when compared with the
very loyal.
TV dominates as preferred news platform among very loyal news consumers; wider
mix among the non-loyal
% who prefer getting their news on each platform
Note: Platform preference includes those who only get news on each. Just 1% said they never get news on any platform (not shown).
Source: Survey conducted Jan. 12-Feb. 8, 2016.
“The Modern News Consumer”
PEW RESEARCH CENTER

15
PEW RESEARCH CENTER
www.pewresearch.org
38% 31% 16% 15%
Less than
half, but
not never Every time Never
At least
half, but not
every time
69% could recall the news
source at least half of the time
There are also signs that people pay attention to the sources of news online, though less
so among the “non-loyal” news consumers.
A follow-up survey asked
about the news consumers
may have gotten online in the
past two hours. Panelists who
completed the January wave
on the web and reported that
they get news online were
asked to participate. Survey
invitations were sent at
different times each day, and
responses were accepted for
two hours after the
invitations were sent.
Respondents were asked if
they’d gotten news in the past
two hours about various
topics, where they’d gotten
news from and what they’d
done with the news, if anything.
When asked if they remembered the source of an article they arrived at from a link, about 4-in-
10 (38%) remembered every time; only 15% never remembered.
This is particularly true among the very loyal and the somewhat loyal. Of those who got news
from links, 39% of the very loyal and 41% of the somewhat loyal remembered every time,
compared with 28% of the non-loyal.
In a real-time analysis, nearly 4-in-10 of those who got
news from links could recall the source every time
Among those who got news 3 or more times from a link in a given week, %
who could recall the source of that news …
Note: Analysis is on online news consumers who clicked on news links at least three times
within the given week.
Source: Survey conducted Feb. 24-March 1, 2016.
“The Modern News Consumer”
PEW RESEARCH CENTER
16
PEW RESEARCH CENTER
www.pewresearch.org
26%
16
11
8
6
5
3
54%
42
38
29
30
26
16
Click on links to news stories
"Like" news stories
Share or repost news stories
Comment on news stories
Post links to news stories
themselves
Discuss issues in the news on
the site
Post their own photos or
videos of a news event
Net
80%
58
49
37
36
31
19
Often Sometimes
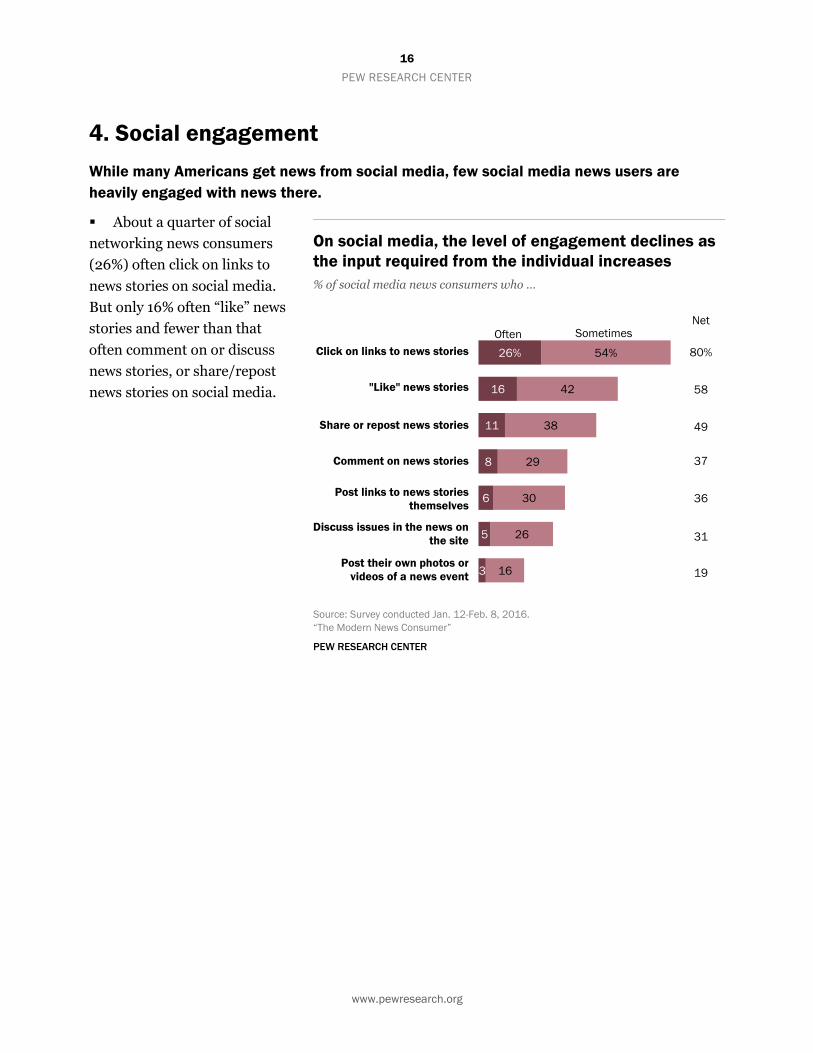
4. Social engagement
While many Americans get news from social media, few social media news users are
heavily engaged with news there.
About a quarter of social
networking news consumers
(26%) often click on links to
news stories on social media.
But only 16% often “like” news
stories and fewer than that
often comment on or discuss
news stories, or share/repost
news stories on social media.
On social media, the level of engagement declines as
the input required from the individual increases
% of social media news consumers who …
Source: Survey conducted Jan. 12-Feb. 8, 2016.
“The Modern News Consumer”
PEW RESEARCH CENTER
17
PEW RESEARCH CENTER
www.pewresearch.org
85%
13
Word of mouth
A digital method
(social media, email
or text)
30%
17
11
5
4
3
47
Spoke with someone
Searched for more
information
Posted on social media
Sent via email or text
Bookmarked for later
Commented on story
Did nothing
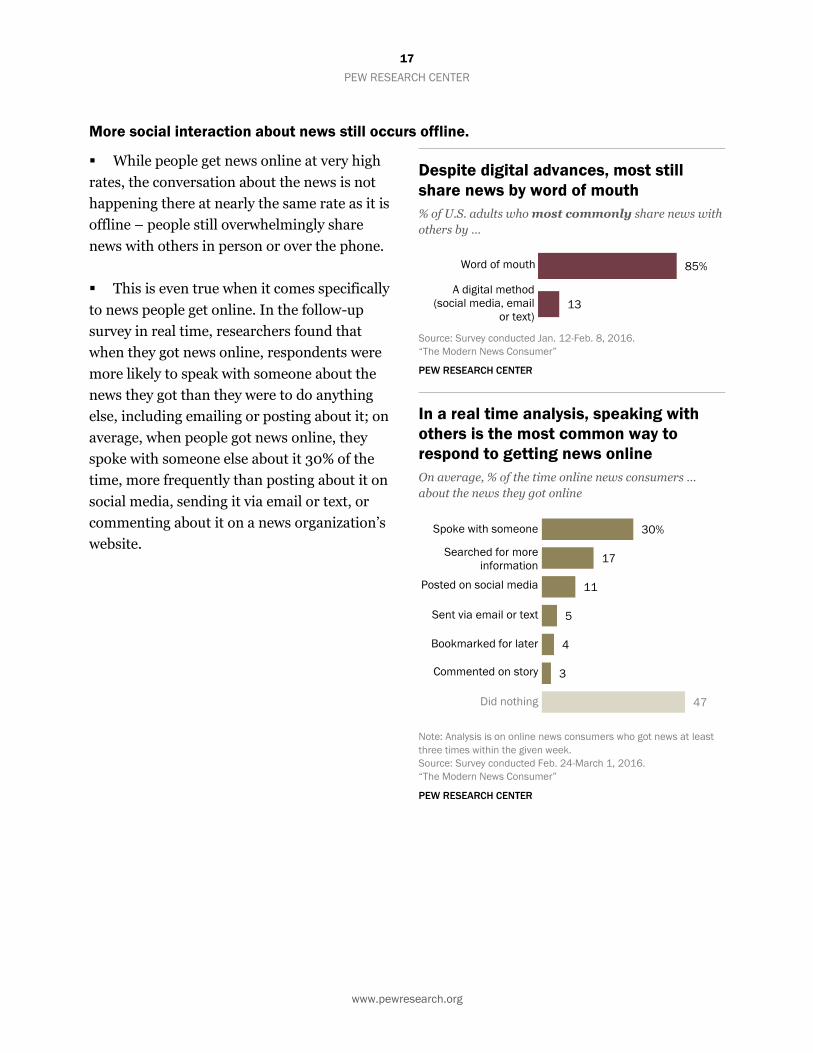
More social interaction about news still occurs offline.
While people get news online at very high
rates, the conversation about the news is not
happening there at nearly the same rate as it is
offline – people still overwhelmingly share
news with others in person or over the phone.
This is even true when it comes specifically
to news people get online. In the follow-up
survey in real time, researchers found that
when they got news online, respondents were
more likely to speak with someone about the
news they got than they were to do anything
else, including emailing or posting about it; on
average, when people got news online, they
spoke with someone else about it 30% of the
time, more frequently than posting about it on
social media, sending it via email or text, or
commenting about it on a news organization’s
website.
Despite digital advances, most still
share news by word of mouth
% of U.S. adults who most commonly share news with
others by …
Source: Survey conducted Jan. 12-Feb. 8, 2016.
“The Modern News Consumer”
PEW RESEARCH CENTER
In a real time analysis, speaking with
others is the most common way to
respond to getting news online
On average, % of the time online news consumers …
about the news they got online
Note: Analysis is on online news consumers who got news at least
three times within the given week.
Source: Survey conducted Feb. 24-March 1, 2016.
“The Modern News Consumer”
PEW RESEARCH CENTER

18
PEW RESEARCH CENTER
www.pewresearch.org
5. Digital distinctions
Intentionality matters when it comes to online news consumption: those who seek the news
out behave differently than those who stumble into news while doing other things online.
Overall, more digital news consumers get their news online in the process of accomplishing
other digital tasks (55%) than specifically seek the news out (44%).
Those who get news online by seeking it out (“seekers”) are more interested in news overall:
63% say that they follow the news all or most of the time, compared with 43% of those who do not
tend to seek out news online.
Seekers are also more likely than other online news consumers to get news online from news
organizations and news websites or apps, though their use of social media as a source for news is
about the same when accounting for demographic differences.
Seekers are less likely to say that friends and family are an important way they get news: 56%,
compared with almost seven-in-ten of non-seekers (69%).
Men and white non-Hispanics are more likely to seek out news online: 51% of men seek out
news online, compared with 37% of women, and about half of whites (47%) are seekers, compared
with 31% of blacks.
Those who seek news online more likely to get news from websites than those who
happen upon news – but both are about as likely to get news from social media
Source: Survey conducted Jan. 12-Feb. 8, 2016.
“The Modern News Consumer”
PEW RESEARCH CENTER

19
PEW RESEARCH CENTER
www.pewresearch.org
67%
81%
Those who prefer
digital
Those who prefer
other platforms
56%
38
44%
60
Find news online while
seeking it out
Come across news while
doing other things
Those who prefer
digital
Those who prefer
other platforms
Only about a third of digital news consumers (36%) actually prefer the online world as their
primary platform for news.
Those who prefer digital news (who also tend to be younger adults) have a more negative view
of the news media overall. They trust it less (67% trust national news organizations at least some,
compared with 81% of others) and sense more media bias: 81% say the media favor one side,
compared with 71% of those who prefer other platforms for getting news. 1
Online, though, they
demonstrate a more active
interest in news, seeking it out
rather than just happening
upon it while doing other
things. They are also more
likely to say that getting news
online gives them a wider
range of news than they would
get otherwise.
Those who prefer to get
news online are also more
likely to often click on links to
news stories on social media
(35% of digital preferrers who
get news on social media vs.
21% of other social media
news consumers) and to at
least sometimes post their
own news links (42% vs. 32%
of others). Those who prefer
to get digital news are also
more likely than others to share news digitally (27% say this is the most common way they share
news, compared with just 8% of others). But even those who prefer digital platforms for news are
most likely to share news with others by talking with them.
Younger adults are more likely to prefer to get news digitally: 54% of those ages 18-29 do,
compared with 38% of those ages 30-49, 15% of those ages 50-64 and 7% of those ages 65+. Those
1 These differences persist even when accounting for age.
Those who prefer to get news online have more
negative attitudes toward the news media
% who trust national news organizations at least some
Online, however, they’re much more likely to
intentionally seek news out
% of online news consumers who mostly...
Note: Just 1% said they never got news on any platform (not shown).
Source: Survey conducted Jan. 12-Feb. 8, 2016.
“The Modern News Consumer”
PEW RESEARCH CENTER

20
PEW RESEARCH CENTER
www.pewresearch.org
with college educations are also more likely to prefer digital: 37% of those with college degrees and
33% of those with some college education, compared with just 17% of those with high school
degrees or less.

21
PEW RESEARCH CENTER
www.pewresearch.org
6. Young adults
Young adults follow the news less closely, and they have more negative attitudes about the
news media. But they are more likely than their elders to get news online.
Those ages 18-29 are less interested in local and national news, and they discuss the news at
lower rates compared with those older than them. They are also less likely to get news often from
legacy platforms like TV and print newspapers.
But when it comes to the news in the digital realm, these young adults outpace their elders.
About a third often get news from social networking sites (32%) and from news websites and apps
(34%). Their use of social networking sites for news is higher than among any other age group,
while their use of news websites/apps is higher than that of those ages 50 and older.
Attitudinally, they are more negative toward the news media, displaying lower levels of both
approval of news organizations and trust in the information they get from them. But earlier research
by Pew Research Center found that they are no less trusting when it comes to specific news sources
with which they are familiar. In other words, while they may be less trusting of the media in general,
when it comes to news brands they’re familiar with, trust is less of an issue.

22
PEW RESEARCH CENTER
www.pewresearch.org
Young adults are less enthusiastic about news
% of each age group who …
But they are more likely to get news online
% of each age group who often get news from …
Source: Survey conducted Jan. 12-Feb. 8, 2016.
“The Modern News Consumer”
PEW RESEARCH CENTER

23
PEW RESEARCH CENTER
www.pewresearch.org
11%
13
10
7
36%
39
41
32
18-29
30-49
50-64
65+
Sometimes Often Net
47%
51
51
40
7%
6
9
10
28%
25
36
30
18-29
30-49
50-64
65+
Sometimes Often Net
35%
32
45
41
Despite this digital focus, young adults are no more likely to engage with news on social
media than others.
The fact that young adults have greater
interest in news on social media does not
result in greater engagement with news there,
as they are no more likely to share/repost
news stories or comment on news stories than
others.
Despite their lower levels of news interest
in general, on social media, those ages 18-29
are at least as likely as others to often click on
links to news stories (30%, which is on par
with those ages 30-49 and higher than those
50+).
Young adults no more likely to engage
with news on social media
% of social media news consumers ages … who share or
repost news stories on social media …
% of social media news consumers ages … who comment
on news stories on social media …
Source: Survey conducted Jan. 12-Feb. 8, 2016.
“The Modern News Consumer”
PEW RESEARCH CENTER
24
PEW RESEARCH CENTER
www.pewresearch.org
87%
77
57
73
Cons. Republican
Mod./Lib. Republican
Cons./Mod. Democrat
Lib. Democrat
13%
18
24
31
Cons. Republican
Mod./Lib. Republican
Cons./Mod. Democrat
Lib. Democrat
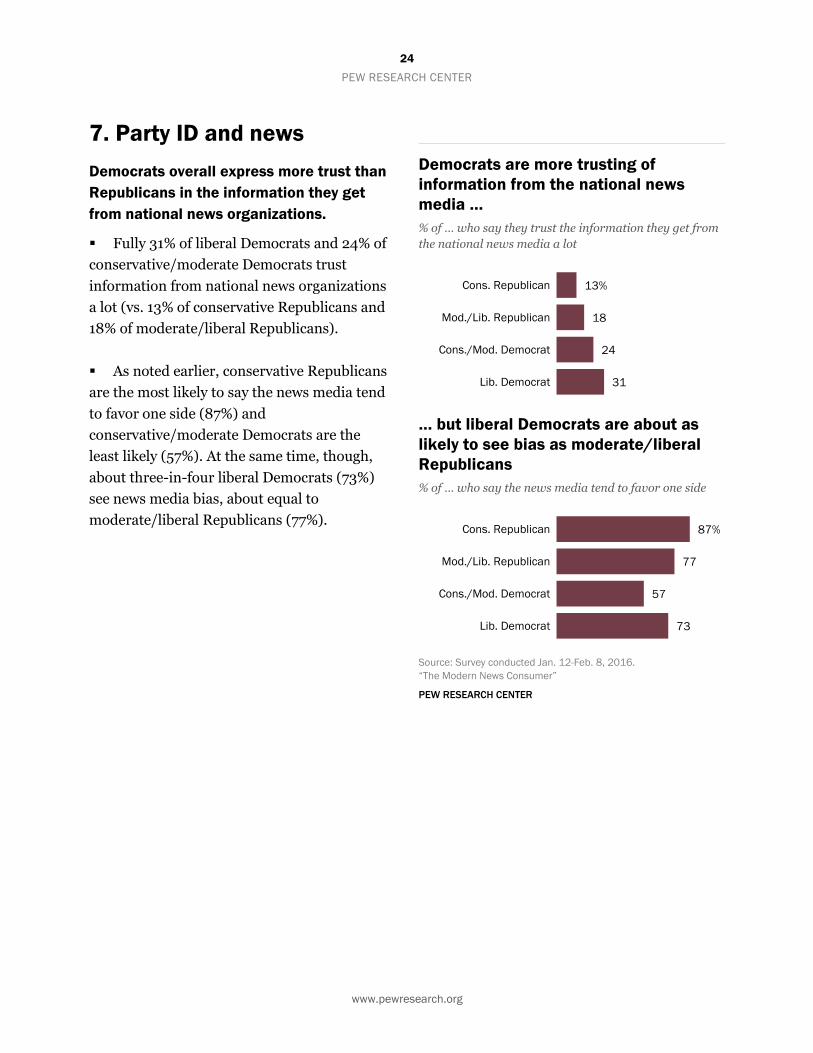
7. Party ID and news
Democrats overall express more trust than
Republicans in the information they get
from national news organizations.
Fully 31% of liberal Democrats and 24% of
conservative/moderate Democrats trust
information from national news organizations
a lot (vs. 13% of conservative Republicans and
18% of moderate/liberal Republicans).
As noted earlier, conservative Republicans
are the most likely to say the news media tend
to favor one side (87%) and
conservative/moderate Democrats are the
least likely (57%). At the same time, though,
about three-in-four liberal Democrats (73%)
see news media bias, about equal to
moderate/liberal Republicans (77%).
Democrats are more trusting of
information from the national news
media …
% of … who say they trust the information they get from
the national news media a lot
… but liberal Democrats are about as
likely to see bias as moderate/liberal
Republicans
% of … who say the news media tend to favor one side
Source: Survey conducted Jan. 12-Feb. 8, 2016.
“The Modern News Consumer”
PEW RESEARCH CENTER

25
PEW RESEARCH CENTER
www.pewresearch.org
39%
33
29
44
Cons. Republican
Mod./Lib. Republican
Cons./Mod. Democrat
Lib. Democrat
51%
27
23
34
Cons. Republican
Mod./Lib. Republican
Cons./Mod. Democrat
Lib. Democrat
Online, those at either end of the
ideological spectrum are somewhat more
likely to get one-sided news from family
and friends; Conservative Republicans are
most likely to be OK with it. But both sides
see personal contacts as an important
news source.
Among online news consumers, roughly
four-in-ten conservative Republicans (39%)
and about as many liberal Democrats (44%)
say news they get from family and friends
online represents just one side, outpacing the
more moderate members of each party.
But about half (51%) of conservative
Republicans who said they see mostly one-
sided news say this is OK, exceeding all other
political groups, including liberal Democrats
(34%).
The Center has seen similar differences
across the ideological spectrum in the past. In
our 2014 report on political polarization and
media habits, we found that half of consistent
conservatives say they only talk politics with
other conservatives, while liberals were most
likely to drop a friend because of politics.
These differences emerge despite the fact that both sides are about equally likely to consider
friends and family an important source for news. Liberal Democrats are, however, somewhat less
likely to say friends and family are the most important way they get news (5%, compared with 10%
or more among the other groups).
Liberal Dems, conservative Reps more
likely to get one-sided news from family
and friends online …
% of … online news consumers who say the news they get
from family and friends online represents just one side
… but conservative Republicans are
most likely to think that’s OK
Of those online news consumers who say they mostly
only see news from one side, % of … who say that’s OK
Source: Survey conducted Jan. 12-Feb. 8, 2016.
“The Modern News Consumer”
PEW RESEARCH CENTER
26
PEW RESEARCH CENTER
www.pewresearch.org
Acknowledgments
This report was made possible by The Pew Charitable Trusts, which received support for the
project from the John S. and James L. Knight Foundation.
This report is a collaborative effort based on the input and analysis of the following individuals.
Amy Mitchell, Director, Journalism Research
Michael Barthel, Research Associate
Jeffrey Gottfried, Research Associate
Elisa Shearer, Research Analyst
Galen Stocking, Research Associate
Jessica Mahone, Research Associate
Rachel Weisel, Communications Associate
Margaret Porteus, Information Graphics Designer
Shannon Greenwood, Assistant Digital Producer
Kyley McGeeney, Research Methodologist
Yanna Yan, Methodology Assistant

27
PEW RESEARCH CENTER
www.pewresearch.org
Methodology
The American Trends Panel (ATP), created by Pew Research Center, is a nationally representative
panel of randomly selected U.S. adults living in households. Respondents who self-identify as
internet users and who provided an email address participate in the panel via monthly self-
administered web surveys, and those who do not use the internet or decline to provide an email
address participate via the mail. The panel is being managed by Abt SRBI.
Data in this report are drawn from the January wave of the panel, conducted Jan. 12-Feb. 8, 2016
among 4,654 respondents (4,339 by web and 315 by mail). The January wave of the panel was
conducted by Pew Research Center in association with the John S. and James L. Knight
Foundation. Panelists who have access to the internet but take surveys by mail were not sampled
in this wave (i.e. mail respondents to this wave are all non-internet users). The margin of sampling
error for the full sample of 4,654 respondents is plus or minus 2.4 percentage points.
Members of the American Trends Panel were recruited from two large, national landline and
cellphone random-digit-dial (RDD) surveys conducted in English and Spanish. At the end of each
survey, respondents were invited to join the panel. The first group of panelists was recruited from
the 2014 Political Polarization and Typology Survey, conducted Jan. 23 to March 16, 2014. Of the
10,013 adults interviewed, 9,809 were invited to take part in the panel and a total of 5,338 agreed
to participate.2 The second group of panelists was recruited from the 2015 Survey on Government,
conducted Aug. 27 to Oct. 4, 2015. Of the 6,004 adults interviewed, all were invited to join the
panel, and 2,976 agreed to participate.3
Participating panelists provided either a mailing address or an email address to which a welcome
packet, a monetary incentive and future survey invitations could be sent. Panelists also receive a
small monetary incentive after participating in each wave of the survey.
The ATP data were weighted in a multistep process that begins with a base weight incorporating
the respondents’ original survey selection probability and the fact that in 2014 some panelists were
subsampled for invitation to the panel. Next, an adjustment was made for the fact that the
2 When data collection for the 2014 Political Polarization and Typology Survey began, non-internet users were subsampled at a rate of 25%,
but a decision was made shortly thereafter to invite all non-internet users to join. In total, 83% of non-internet users were invited to join the
panel. 3 Respondents to the 2014 Political Polarization and Typology Survey who indicated that they are internet users but refused to provide an
email address were initially permitted to participate in the American Trends Panel by mail, but were no longer permitted to join the panel after
Feb. 6, 2014. Internet users from the 2015 Survey on Government who refused to provide an email address were not permitted to join the
panel.

28
PEW RESEARCH CENTER
www.pewresearch.org
propensity to join the panel and remain an active panelist varied across different groups in the
sample. The final step in the weighting uses an iterative technique that matches gender, age,
education, race, Hispanic origin and region to parameters from the U.S. Census Bureau's 2014
American Community Survey. Population density is weighted to match the 2010 U.S. Decennial
Census. Telephone service is weighted to estimates of telephone coverage for 2016 that were
projected from the January-June 2015 National Health Interview Survey. Volunteerism is
weighted to match the 2013 Current Population Survey Volunteer Supplement. It also adjusts for
party affiliation using an average of the three most recent Pew Research Center general public
telephone surveys. Internet access is adjusted using a measure from the 2015 Survey on
Government. Frequency of internet use is weighted to an estimate of daily internet use projected
to 2016 from the 2013 Current Population Survey Computer and Internet Use Supplement. The
share of respondents who get news from 10 different social networks was weighted to match a Pew
Research Center survey from March-April 2016. Sampling errors and statistical tests of
significance take into account the effect of weighting. Interviews are conducted in both English
and Spanish, but the Hispanic sample in the American Trends Panel is predominantly native born
and English speaking.
The following table shows the unweighted sample sizes and the error attributable to sampling that
would be expected at the 95% level of confidence for different groups in the survey:
Group Unweighted sample size Plus or minus …
Total sample 4,654 2.4%
Online news consumers 4,236 2.5%
Social media news consumers 3,040 2.9%
Sample sizes and sampling errors for other subgroups are available upon request.
In addition to sampling error, one should bear in mind that question wording and practical
difficulties in conducting surveys can introduce error or bias into the findings of opinion polls.
The web component of the January wave had a response rate of 69% (4,339 responses among
6,301 web-based individuals in the panel); the mail component had a response rate of 67% (315
responses among 474 non-web individuals in the panel). Taking account of the combined,
weighted response rate for the recruitment surveys (10.0%) and attrition from panel members

29
PEW RESEARCH CENTER
www.pewresearch.org
who were removed at their request or for inactivity, the cumulative response rate for the January
ATP wave is 2.9%4.
The experiential study consisted of 14 short online surveys that were administered two per day
from Feb. 24 through March 1, 2016. The January wave of the panel was conducted by Pew
Research Center in association with the John S. and James L. Knight Foundation. Survey
invitations were sent at different times each day, and responses were accepted for two hours after
the invitations were sent. Panelists who completed the January wave on the web and reported that
they get news online (from a desktop/laptop computer or mobile device) were asked to participate
in the experiential study. Of the 4,236 respondents who were asked, 3,827 agreed to participate in
the experiential study.5 The analysis in this report relies on the 2,078 panelists who completed at
least 10 of the 14 surveys.
For the experiential study, the data were weighted using a similar process to the full January wave.
The base weight accounting for the initial probability of selection was adjusted to account for the
propensity to have completed 10 or more of the experiential study surveys. The data were then
weighted to match all online news users from the January wave on the following variables: gender,
age, education, race and Hispanic ethnicity, region, population density, telephone service, internet
access, frequency of internet use, volunteerism, party affiliation and the use of 10 different social
networking sites for news.
The following table shows the unweighted sample sizes and the error attributable to sampling that
would be expected at the 95% level of confidence for different groups in the survey:
Sample sizes and sampling errors for other subgroups are available upon request.
In addition to sampling error, one should bear in mind that question wording and practical
difficulties in conducting surveys can introduce error or bias into the findings of opinion polls.
4 Approximately once per year, panelists who have not participated in multiple consecutive waves are removed from the panel. These cases
are counted in the denominator of cumulative response rates. 5 Of the 3,827 respondents who agreed to participate, 24 were deemed ineligible because they declined to provide their time zones or were
not in a U.S. time zone at the time of the experiential study.
Group Unweighted sample size Plus or minus …
Total sample 2,078 3.5%
30
PEW RESEARCH CENTER
www.pewresearch.org
The experiential study had a response rate of 55% (2,078 responses among 3,803 who were
eligible and agreed to participate). Taking account of the combined, weighted response rate for the
recruitment surveys (10.0%), attrition from panel members who were removed at their request or
for inactivity, and agreement to participate in the experiential study, the cumulative response rate
for the January ATP wave is 1.4%6.
© Pew Research Center, 2016
6 Approximately once per year, panelists who have not participated in multiple consecutive waves are removed from the panel. These cases
are counted in the denominator of cumulative response rates.

31
PEW RESEARCH CENTER
www.pewresearch.org
Topline questionnaire
2016 PEW RESEARCH CENTER’S AMERICAN TRENDS PANEL WAVE 14 January FINAL TOPLINE
January 12th– February 8th, 2016
TOTAL N=4,654 WEB RESPONDENTS N=4,339 MAIL RESPONDENTS N=3157
Note: In the Spanish language version of the questionnaire, “local television news” was mistranslated as “television news” for NEWS_PLATFORM item D. This affected the 66 respondents who took the survey in
Spanish (4% of the sample after weighting). The effects of this mistranslation were minimal and do not
affect the report’s conclusions. ASK ALL: NEWS_LEVEL How closely do you follow…
Very
closely Somewhat
closely Not very closely
Not at all closely
No Answer
a. International news
Jan 12-Feb 8 2016 [N=4,654] 19 46 25 9 *
b. National news
Jan 12-Feb 8 2016 [N=4,654] 33 44 16 6 *
c. Local news
Jan 12-Feb 8 2016 [N=4,654] 37 41 16 6 *
d. News about your neighborhood
Jan 12-Feb 8 2016 [N=4,654] 33 37 20 10 *
ASK ALL: NEWS_TOPIC How closely do you follow each type of news, either in the newspaper, on television,
radio, or the internet? Very
closely Somewhat
closely Not very closely
Not at all closely
No Answer
a. Government and politics
Jan 12-Feb 8 2016 [N=4,654] 30 43 19 7 1
b. People and events in your own community
Jan 12-Feb 8 2016 [N=4,654] 17 45 28 9 1
c. Sports
Jan 12-Feb 8 2016 [N=4,654] 16 29 26 29 1
d. Business and finance
Jan 12-Feb 8 2016 [N=4,654] 12 41 32 14 1
e. Science and technology
7 Question wording in this topline is that from the web version of the survey. Question wording and format was adapted for
the paper questionnaire delivered by mail; this questionnaire is available on request. All questions asked in both modes
unless noted.

32
PEW RESEARCH CENTER
www.pewresearch.org
Jan 12-Feb 8 2016 [N=4,654] 16 47 29 8 1
f. Entertainment
Jan 12-Feb 8 2016 [N=4,654] 9 33 38 19 1
g. Crime
Jan 12-Feb 8 2016 [N=4,654] 27 43 23 6 1
h. Health news
Jan 12-Feb 8 2016 [N=4,654] 20 47 24 7 1
ASK ALL: NEWS_DEVICE Thinking about news (by news we mean information about events and issues
that involve more than just your friends and family), how often do you get news… [RANDOMIZE]
Often Sometimes Hardly ever Never No Answer
a. On a desktop or laptop
computer
Jan 12-Feb 8 2016 [N=4,654] 33 30 16 21 *
Aug 21-Sep 2 2013 [N=5,173] 35 30 17 18 *
b. On a mobile device (such as a smartphone or tablet)
Jan 12-Feb 8 2016 [N=4,654] 36 24 12 28 *
Aug 21-Sep 2 2013 [N=5,173] 21 19 13 46 *
ASK IF GETS NEWS ON BOTH COMPUTER AND MOBILE DEVICE (NEWS_DEVICEa=1-3 & NEWS_DEVICEb=1-3): NEWSDIGPREF Do you prefer to get your news…
Jan 12-Feb 8
2016 Based on got news on both
N=3,497
42 On a desktop or laptop computer 56 On a mobile device (such as a smartphone or tablet) 2 No answer

33
PEW RESEARCH CENTER
www.pewresearch.org
ASK ALL: NEWS_PLATFORM And how often do you… [RANDOMIZE]
Often Sometimes
Hardly
ever Never
No
Answer
a. Read any newspapers in print?
Jan 12-Feb 8 2016 [N=4,654] 20 28 31 21 *
Aug 21-Sep 2 2013 [N=5,173] 27 27 27 19 *
b. Listen to news on the radio?
Jan 12-Feb 8 2016 [N=4,654] 25 34 24 17 *
Aug 21-Sep 2 2013 [N=5,173] 26 30 27 18 *
c. NO ITEM C
d. Watch local television news?
Jan 12-Feb 8 2016 [N=4,654] 46 27 17 10 *
Aug 21-Sep 2 2013 [N=5,173] 46 26 17 11 *
e. Watch national evening
network television news (such as ABC World News, CBS Evening News, or NBC Nightly News)?
Jan 12-Feb 8 2016 [N=4,654] 30 27 25 17 *
Aug 21-Sep 2 2013 [N=5,173] 31 28 24 18 *
f. Watch cable television news (such as CNN, The Fox News cable channel, or MSBNC)?
Jan 12-Feb 8 2016 [N=4,654] 31 27 24 18 *
Aug 21-Sep 2 2013 [N=5,173] 24 28 26 21 *
g. Get news from a social
networking site (such as Facebook or Twitter)?
Jan 12-Feb 8 2016 [N=4,654] 18 26 18 38 *
h. Get news from a website or app?
Jan 12-Feb 8 2016 [N=4,654] 28 28 18 26 *

34
PEW RESEARCH CENTER
www.pewresearch.org
ASK IF GETS NEWS FROM MORE THAN ONE PLATFORM IN NEWS_PLATFORM (NEWSPLATFORMa-h=1-3). DO NOT ASK IF ONLY GETS NEWS ON TV AND NO OTHERS (IF ONLY NEWS_PLATFORMd-f=1-3). AND/OR PLATFORM FROM NEWS_PLATFORM IF GETS NEWS FROM JUST ONE SOURCE (OR JUST ONE TELEVISION SOURCE):
NEWS_PREF1 Which of the following would you say you prefer for getting news?
Jan 12-Feb 8 2016
N=4,654 11 Reading news in a print newspaper 12 Listening to news on the radio
46 Watching news on television 9 Getting news from a social networking site (such as Facebook or
Twitter)
20 Getting news from a website or app 1 No Answer 1 Did not get news on any platform
[NOTE: PLATFORM PREFERENCE INCLUDES THOSE WHO ONLY GET NEWS ON EACH]
ASK ALL:
NEWS_FORM Whether online or offline, do you prefer to get your news by…? [RANDOMIZE]
Jan 12-Feb 8 2016
N=4,654 35 Reading it
46 Watching it 17 Listening to it 2 No Answer
ASK ALL: NEWS_DISCUSS How often do you discuss the news with others?
Jan 12-Feb 8
2016 N=4,654
29 Nearly every day 44 A few times a week 17 A few times a month
10 Less often * No Answer

35
PEW RESEARCH CENTER
www.pewresearch.org
ASK ALL: NEWSAPPRE Thinking about who you typically share your opinions with about the news, do you tend to share them with…
Jan 12-Feb 8 2016
N=4,654 26 People I know well, but also those I don’t know very well 64 Just people I know well, such as friends and family 9 I do not typically share my opinions about the news with others 1 No Answer
ASK ALL:
NEWSSHARE When you share a news story with others, what is the most common way you share it? [RANDOMIZE 1-4]
Jan 12-Feb 8 2016
N=4,654 85 By talking with them either in person or by phone 5 Through email or text message 8 Through social networking sites 1 In hard copy
1 No Answer
ASK ALL: FAMNEWSSHARE When family or friends share a news story with you, what is the most common way
they share it? [RANDOMIZE 1-4; IN SAME ORDER AS NEWSSHARE]
Jan 12-Feb 8 2016
N=4,654 76 By talking with them either in person or by phone 10 Through email or text message 13 Through social networking sites
1 In hard copy 1 No Answer
[PROGRAMMING NOTE: RANDOMIZE MEDIALOYAL1-4] ASK ALL: Thinking about the sources you get your news from beyond your friends and family…
MEDIALOYAL1 Which of the following statements comes closer to your view? [RANDOMIZE]
Jan 12-Feb 8
2016 N=4,654
22 I don’t give much thought to the sources I get my news from 76 I give a good deal of thought to the sources I get my news from
1 No Answer
36
PEW RESEARCH CENTER
www.pewresearch.org
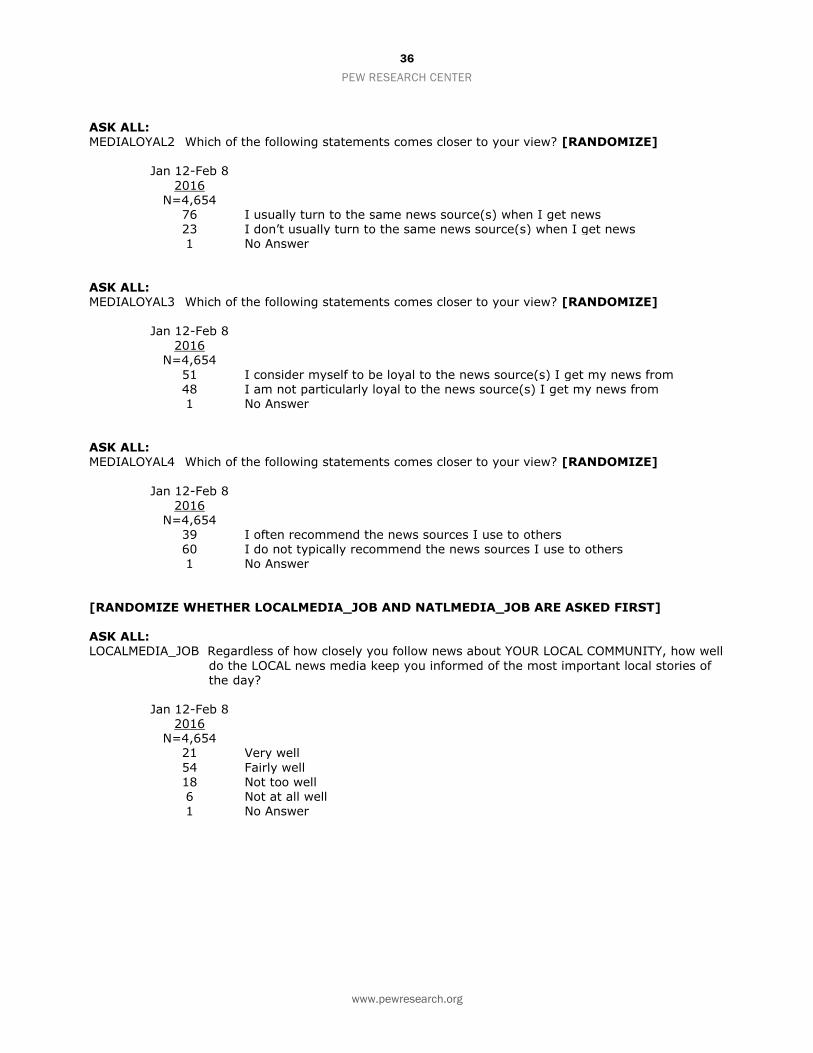
ASK ALL: MEDIALOYAL2 Which of the following statements comes closer to your view? [RANDOMIZE]
Jan 12-Feb 8
2016 N=4,654
76 I usually turn to the same news source(s) when I get news 23 I don’t usually turn to the same news source(s) when I get news 1 No Answer
ASK ALL: MEDIALOYAL3 Which of the following statements comes closer to your view? [RANDOMIZE]
Jan 12-Feb 8 2016
N=4,654
51 I consider myself to be loyal to the news source(s) I get my news from 48 I am not particularly loyal to the news source(s) I get my news from 1 No Answer
ASK ALL: MEDIALOYAL4 Which of the following statements comes closer to your view? [RANDOMIZE]
Jan 12-Feb 8
2016 N=4,654
39 I often recommend the news sources I use to others 60 I do not typically recommend the news sources I use to others
1 No Answer
[RANDOMIZE WHETHER LOCALMEDIA_JOB AND NATLMEDIA_JOB ARE ASKED FIRST] ASK ALL: LOCALMEDIA_JOB Regardless of how closely you follow news about YOUR LOCAL COMMUNITY, how well
do the LOCAL news media keep you informed of the most important local stories of the day?
Jan 12-Feb 8
2016 N=4,654
21 Very well
54 Fairly well
18 Not too well 6 Not at all well 1 No Answer

37
PEW RESEARCH CENTER
www.pewresearch.org
ASK ALL: NATLMEDIA_JOB Regardless of how closely you follow NATIONAL NEWS, how well do the NATIONAL
news media keep you informed of the most important national stories of the day?
Jan 12-Feb 8 2016
N=4,654 23 Very well 54 Fairly well 17 Not too well 5 Not at all well
1 No Answer
ASK ALL:
FAMNEWS Thinking about the news you get from your friends, family and acquaintances, which of the following statements best describes you…
Jan 12-Feb 8 2016
N=4,654 10 Friends, family and acquaintances are the most important way I get news
54 Friends, family and acquaintances are an important way I get news, but not the most important way
35 Friends, family and acquaintances are not a very important way I get news
1 No Answer
ASK ALL: GROUP_TRUST How much, if at all, do you trust the information you get from…?
A lot Some Not too much
Not at all
No Answer
a. National news organizations
Jan 12-Feb 8 2016 [N=4,654] 18 59 18 6 *
b. Local news organizations
Jan 12-Feb 8 2016 [N=4,654] 22 60 14 3 1
c. Friends, family, and acquaintances
Jan 12-Feb 8 2016 [N=4,654] 14 63 19 3 1
d. Social networking sites, such as
Facebook and Twitter
Web only [N=4,339] 4 30 33 32 1

38
PEW RESEARCH CENTER
www.pewresearch.org
[PROGRAMMING NOTE: RANDOMIZE WATCHDOG_1 & WATCHDOG_3] ASK ALL: WATCHDOG_1 Some people think that by criticizing leaders, news organizations keep political leaders
from doing their job. Others think that such criticism is worth it because it keeps political leaders from doing things that should not be done. Which position is closer to your opinion?
Jan 12-Feb 8
2016 N= 4,654
21 Keep political leaders from doing their job 75 Keep political leaders from doing things that shouldn’t be done 4 No Answer
ASK ALL:
WATCHDOG_3 In presenting the news dealing with political and social issues, do you think that news organizations deal fairly with all sides, or do they tend to favor one side?
Jan 12-Feb 8
2016 N= 4,654
24 Deal fairly with all sides
74 Tend to favor one side 3 No Answer
Now we are going to ask you some questions about the news you get online, whether on a computer,
phone, or tablet. Again, by news we mean information about events and issues that involve more than
just your friends or family. ASK IF GETS NEWS DIGITALLY (NEWS_DEVICEa=1-3 OR NEWS_DEVICEb=1-3): NEWS_SOURCE How often do you get news online from… [RANDOMIZE]
Often Sometimes Hardly ever Never No Answer
a. People that you are close with
Jan 12-Feb 8 2016 [N=4,236] 15 54 24 6 *
b. People you are not particularly close with
Jan 12-Feb 8 2016 [N=4,236] 6 28 41 25 *
c. News organizations
Jan 12-Feb 8 2016 [N=4,236] 36 40 16 7 1

39
PEW RESEARCH CENTER
www.pewresearch.org
ASK IF AT LEAST HARDLY EVER TO AT LEAST 1 ITEM IN NEWS_SOURCE (NEWS_SOURCEa-c=1-3); SHOW ONLY THOSE AT LEAST HARDLY EVER IN NEWS_SOURCE (NEWS_SOURCEa-c=1-3): NEWSACC How accurate, do you think, is the news posted online by…
a. People that you are close with
Jan 12-Feb 8 2016
N=4,045 7 Very accurate 68 Somewhat accurate
22 Not too accurate 2 Not at all accurate 2 No answer
b. People you are not particularly close with
Jan 12-Feb 8 2016
N=3,370 2 Very accurate 49 Somewhat accurate 42 Not too accurate 4 Not at all accurate
2 No answer
c. News organizations
Jan 12-Feb 8 2016
N=4,040
15 Very accurate 69 Somewhat accurate 13 Not too accurate 2 Not at all accurate 1 No answer
ASK IF AT LEAST HARDLY EVER TO AT LEAST 1 ITEM IN NEWS_SOURCE (NEWS_SOURCEa-c=1-3); SHOW ONLY THOSE AT LEAST HARDLY EVER IN NEWS_SOURCE (NEWS_SOURCEa-c=1-3): NEWSINTERESTS How near to your interests is the news posted online by… a. People that you are close with
Jan 12-Feb 8
2016 N=4,045
15 Very near to my interests 59 Somewhat near to my interests 20 Not too near to my interests 4 Not at all near to my interests
2 No answer

40
PEW RESEARCH CENTER
www.pewresearch.org
NEWSINTERESTS CONTINUED… b. People that you are not particularly close with
Jan 12-Feb 8
2016 N=3,370
4 Very near to my interests 38 Somewhat near to my interests 48 Not too near to my interests 9 Not at all near to my interests 2 No answer
c. News organizations
Jan 12-Feb 8 2016
N=4,040
11 Very near to my interests 61 Somewhat near to my interests 24 Not too near to my interests 4 Not at all near to my interests 1 No answer
ASK IF SEES INACCURATE NEWS ONLINE (NEWSACCa-c=2-4): DIGNEWSFACT When you are online and come across information in a news story that you think is
inaccurate, how often do you take it upon yourself to figure out whether it is accurate?
Jan 12-Feb 8 2016
N=4,074
32 Often 43 Sometimes 17 Hardly ever 7 Never * No Answer
ASK IF GETS NEWS DIGITALLY (NEWS_DEVICEa=1-3 OR NEWS_DEVICEb=1-3): DIGWDOG_3 Thinking about the news that your friends, family and acquaintances post or send you
online about political and social issues, overall, do you think the mix of news you get from them… [RANDOMIZE 1 & 2; KEEP 3 LAST]
Jan 12-Feb 8
2016 N=4,236
35 Represents just one side 31 Represents more than one side 33 They don’t send me news about political and social issues 1 No Answer

41
PEW RESEARCH CENTER
www.pewresearch.org
ASK IF TEND TO FAVOR ONE SIDE (DIGWDOG_3=1): DIGFAVOR Would you prefer that the news your friends, family and acquaintances post or send
you online about political and social issues has a greater mix of views from all sides, or do you think it’s okay that overall it represents just one side?
Jan 12-Feb 8
2016 N=1,745
69 Would prefer a greater mix of views 30 It’s okay that overall it represents just one side 1 No Answer
ASK IF GETS NEWS DIGITALLY (NEWS_DEVICEa=1-3 OR NEWS_DEVICEb=1-3):
DIGNEWSFIRST Which statement best describes how you get news online, whether on a computer, phone, or tablet, even if neither is exactly right? [RANDOMIZE]
Jan 12-Feb 8 2016
N=4,236 44 I mostly come across news online because I’m looking for it 55 I mostly come across news online when I’m doing other things online 2 No Answer
ASK IF GETS NEWS DIGITALLY (NEWS_DEVICEa=1-3 OR NEWS_DEVICEb=1-3): DIGNEWSEXP When online, some people interact a lot with others about the news, while others
tend to keep more to themselves. What comes closer to what you do? [RANDOMIZE]
Jan 12-Feb 8
2016 N=4,236
18 I tend to interact with others online about the news 80 I tend to not really interact with others about the news I get online 2 No Answer
ASK IF GETS NEWS BOTH DIGITALLY (NEWS_DEVICEa=1-3 OR NEWS_DEVICEb=1-3) AND NOT DIGITALLY (ANY NEWS_PLATFORMa-f=1-3): DIGNEWSSAME Which of the following phrases better describes your news habits?
[RANDOMIZE]
Jan 12-Feb 8
2016
N=4,202 40 I mostly turn to the SAME news sources online as I do offline 57 I mostly turn to DIFFERENT sources for news depending on whether I
am getting news online or offline 2 No Answer

42
PEW RESEARCH CENTER
www.pewresearch.org
ASK IF GETS NEWS BOTH DIGITALLY (NEWS_DEVICEa=1-3 OR NEWS_DEVICEb=1-3) AND NOT DIGITALLY (ANY NEWS_PLATFORMa-f=1-3): DIGNEWSMORE1 Which of the following statements comes closer to your view of the online news
you get? Getting news online… [RANDOMIZE]
Jan 12-Feb 8
2016 N=4,202
72 Exposes me to a wider range of news stories than I would get otherwise
25 Does not expose me to more news stories than I would have gotten
otherwise 3 No Answer
ASK ALL WEB: NEWSDIG Thinking about all the time you spend online, how much of that time is spent getting
news?
Jan 12-Feb 8 2016
N=4,339 9 A lot 42 Some
39 Not too much 8 Not at all 1 No Answer

43
PEW RESEARCH CENTER
www.pewresearch.org
ASK ALL WEB: SNS Do you use any of the following social networking sites? [Check all that apply] [RANDOMIZE
WITH “OTHER” ALWAYS LAST]
BASED ON TOTAL Yes No No Answer a. Facebook
Jan 12-Feb 8, 2016 [N=4,654] 67 33 - Mar 13-15, 20-22, 2015 [N=2,035] 66 34 1 Aug 21-Sep 2, 2013 [N=5,173] 64 36 *
b. Twitter
Jan 12-Feb 8, 2016 [N=4,654] 16 84 - Mar 13-15, 20-22, 2015 [N=2,035] 17 83 1 Aug 21-Sep 2, 2013 [N=5,173] 16 84 *
d. LinkedIn
Jan 12-Feb 8, 2016 [N=4,654] 20 80 - Aug 21-Sep 2, 2013 [N=5,173] 19 80 *
e. Instagram
Jan 12-Feb 8, 2016 [N=4,654] 19 81 - Aug 21-Sep 2, 2013 [N=5,173] 12 88 *
f. Vine Jan 12-Feb 8, 2016 [N=4,654] 2 98 -
Aug 21-Sep 2, 2013 [N=5,173] 3 97 * g. Tumblr
Jan 12-Feb 8, 2016 [N=4,654] 4 96 - Aug 21-Sep 2, 2013 [N=5,173] 4 96 *
h. YouTube Jan 12-Feb 8, 2016 [N=4,654] 48 52 -
Aug 21-Sep 2, 2013 [N=5,173] 51 49 *
i. Reddit Jan 12-Feb 8, 2016 [N=4,654] 4 96 - Aug 21-Sep 2, 2013 [N=5,173] 3 97 *
j. Snapchat
Jan 12-Feb 8, 2016 [N=4,654] 10 90 - k. Other
Jan 12-Feb 8, 2016 [N=4,654] 11 89 - Aug 21-Sep 2, 2013 [N=5,173] 3 97 *

44
PEW RESEARCH CENTER
www.pewresearch.org
ASK IF AT LEAST YES TO 1 ITEM SNS; SHOW ONLY THOSE SITES USED (SNSA, SNSB, SNSD- SNSJ=1): SNSNEWS Do you ever get news or news headlines on any of the following sites? Again, by news
we mean information about events and issues that involve more than just your friends or
family. [RANDOMIZE]
Yes No
No Answer
BASED ON FACEBOOK USERS: a. Facebook
Jan 12-Feb 8, 2016 [N=3,210] 66 34 *
Mar 13-15, 20-22, 2015 [N=1,343] 63 37 * Aug 21-Sep 2, 2013 [N=3,268] 47 53 0
BASED ON TWITTER USERS:
b. Twitter Jan 12-Feb 8, 2016 [N=908] 59 41 1 Mar 13-15, 20-22, 2015 [N=347] 63 37 0
Aug 21-Sep 2, 2013 [N=736] 52 48 0
BASED ON LINKEDIN USERS: d. LinkedIn
Jan 12-Feb 8, 2016 [N=1,348] 19 81 * Aug 21-Sep 2, 2013 [N=1,107] 13 87 0
BASED ON INSTAGRAM USERS: e. Instagram
Jan 12-Feb 8, 2016 [N=933] 23 76 1 Aug 21-Sep 2, 2013 [N=467] 13 87 0
BASED ON VINE USERS: f. Vine
Jan 12-Feb 8, 2016 [N=115] 14 84 2 Aug 21-Sep 2, 2013 [N=113] 9 91 0
BASED ON TUMBLR USERS: g. Tumblr
Jan 12-Feb 8, 2016 [N=198] 31 69 - Aug 21-Sep 2, 2013 [N=159] 29 71 0
BASED ON YOUTUBE USERS: h. YouTube
Jan 12-Feb 8, 2016 [N=2,542] 21 77 1 Aug 21-Sep 2, 2013 [N=2,506] 20 80 0
BASED ON REDDIT USERS:
i. Reddit Jan 12-Feb 8, 2016 [N=288] 70 30 * Aug 21-Sep 2, 2013 [N=114] 62 38 0
BASED ON SNAPCHAT USERS: j. Snapchat
Jan 12-Feb 8, 2016 [N=439] 17 82 1

45
PEW RESEARCH CENTER
www.pewresearch.org
ASK IF AT LEAST YES TO 1 ITEM SNSNEWS (SNSNEWSA, SNSNEWSB, SNSNEWSD-J =1): SNSSOURCE When you follow a link to a news story on a social networking site, how much attention,
if any, do you pay to the news source the link takes you to? Jan 12-Feb 8
2016 N=3,040
38 A lot of attention 44 Some attention 14 Very little attention 3 No attention at all * No Answer
ASK IF AT LEAST YES TO 1 ITEM SNSNEWS (SNSNEWSA, SNSNEWSB, SNSNEWSD-J=1):
SNSACT Thinking about when you are on a social networking site, how often, if at all, do you… [RANDOMIZE]
Often Sometimes
Hardly ever Never No Answer
a. Click on links to news stories
Jan 12-Feb 8 2016 [N=3,040] 26 54 14 6 *
b. Post links to news stories yourself
Jan 12-Feb 8 2016 [N=3,040] 6 30 32 31 *
c. Share or repost links to news
stories that were originally posted by someone else
Jan 12-Feb 8 2016 [N=3,040] 11 38 30 21 *
d. “Like” news stories
Jan 12-Feb 8 2016 [N=3,040] 16 42 25 16 1
e. Comment on news stories
Jan 12-Feb 8 2016 [N=3,040] 8 29 33 29 1
f. Post my own photos or videos of a news event
Jan 12-Feb 8 2016 [N=3,040] 3 16 31 50 *
g. Discuss issues in the news with others on that site
Jan 12-Feb 8 2016 [N=3,040] 5 26 33 36 *

46
PEW RESEARCH CENTER
www.pewresearch.org
2015 PEW RESEARCH CENTER’S AMERICAN TRENDS PANEL WAVE 14.5 FEBRUARY – EXPERIENTIAL STUDY
February 24th – March 1st 2016
WEB RESPONDENTS N=2,078
ASK ALL:
GOTNEWS_EXP In the past two hours, did you get news about any of the following topics online, such as on a computer, phone or tablet?
a. Government and politics b. People and events in your own community
c. Sports d. Business and finance
e. Science and technology f. Entertainment g. Crime h. Health news i. Other j. Did not get news online
RESULTS HELD FOR FUTURE RELEASE ASK IF CHOSE MORE THAN ONE TOPIC IN GOTNEWS_EXP: TOPNEWS_EXP Of the topics you got news from in the past two hours, which one did you get the most
news about?
1 Government and politics 2 People and events in your own community 3 Sports 4 Business and finance 5 Science and technology 6 Entertainment
7 Crime 8 Health news 9 Other
RESULTS HELD FOR FUTURE RELEASE

47
PEW RESEARCH CENTER
www.pewresearch.org
ASK IF CHOSE ANY TOPIC IN GOTNEWS_EXP: NEWSPLAT_EXP When it comes to the news you got online about [INSERT TOPIC FROM
TOPNEWS_EXP] in the past two hours, how did you get that news?
a. A post or link from a social networking site, such as Facebook or Twitter b. Going directly to a news organization’s website or app c. Through searching for information on a search engine/website d. An email or text message from a friend or family member e. An email, text message, or mobile alert from a news organization f. Other [specify]
RESULTS HELD FOR FUTURE RELEASE
ASK IF CHOSE ANY TOPIC IN GOTNEWS_EXP: NEWSACTION_EXP Finally, when it comes to the news you got online about [INSERT TOPIC FROM
TOPNEWS_EXP] in the past two hours, did you do any of the following with that news?
Feb 24-Mar 1
2016 Out of those who chose at least one topic 3 or
more times N=1,757
30 Spoke with someone about the news you got, either in person or over the phone
17 Searched for additional stories or information about the news you got
11 Posted, shared, or commented on an article on a social networking site, such as Facebook or Twitter
5 Sent an article to someone by email or text message
4 Bookmarked it or saved it in some way
3 Commented on a news organization’s webpage
47 Didn’t do any of these with the news you got [EXCLUSIVE PUNCH]

48
PEW RESEARCH CENTER
www.pewresearch.org
ASK IF GOT NEWS VIA LINK OR EMAIL (NEWSPLAT_EXPa=1 or NEWSPLAT_EXPd=1 or NEWSPLAT_EXPe=1): NEWSSOURCE_EXP If you followed any links from a social networking site, email or text message to
get that news, what specific news outlet(s) did the link(s) take you to?
Type the name of up to 3 specific news outlets in the boxes below. (Please do not type the name
of a social networking site. We are interested in the original outlet of that news.) If you do not remember, please click “Do not remember.” If you did not follow any links, please click “Did not follow any links.”
Feb 24-Mar 1
2016 Out of those who got
news from a link three or more times
N=747
38 Remembered every time
31 Remembered at least half of the time, but not every time
16 Remembered less than half of the time, but not never
15 Never remembered