amundi 3-6 m
TRANSCRIPT

ANNUAL REPORT
NOVEMBER 2020
AMUNDI 3-6 M
UCITS
Asset Management CompanyAmundi Asset ManagementDelegated fund accountantCACEIS Fund Administration FranceCustodianCACEIS BANKAuditorsKPMG AUDIT

UCIT AMUNDI 3-6 M
Annual Report in 30/11/2020
2
Contents Pages
Informations about the Fund 3Activity report 9Significant events during the financial period 21Specific details 22Regulatory informations 23Auditor's Certification 26Annual accounts 32
Balance Sheet Asset 33
Balance Sheet Liabilities 34
Off-balance sheet 35
IncomeStatement 36
Notes to the annual accounts 37Accounting rules and methods 38
Changes in net assets 41
Additional information 42
Table of profit (loss) of the fund over the past five financial periods 54
Portfolio 57

UCIT AMUNDI 3-6 M
Annual Report in 30/11/2020
3
Informations about the Fund Fund Characteristics Classification OPC Monétaire à Valeur Liquidative Variable Standard (standard variable NAV money-market fund) Allocation of net income E-C units: Reinvested I-C units: Reinvested I2-C units: Reinvested R-C units: Reinvested S-C units: Reinvested PERI-C units: Reinvested Allocation of net capital gains realised E-C units: Reinvested I-C units: Reinvested I2-C units: Reinvested R-C units: Reinvested S-C units: Reinvested PERI-C units: Reinvested Investment objective The fund’s investment objective is to outperform its benchmark index, respectively the EONIA for units denominated in euros and the capitalised Fed Funds for units denominated in USD, over a minimum 3-month investment horizon after ongoing fees. However, phases of negative money-market yields may undermine fund returns. Moreover, after subtracting ongoing fees, the fund could underperform the capitalised EONIA. Benchmark index Capitalised EONIA: The EONIA expresses the overnight euro money market rate. It is calculated by the ESCB (European System of Central Banks) as the average of interest rates on transactions conducted on the euro-denominated money markets by a panel of international banks. Changes in this depend on the monetary policy implemented by the European Central Bank. The capitalised EONIA also takes into account the effect of reinvesting interest according to the OIS (Overnight Indexed Swap) method. The European Money Market Institute, the administrator of the EONIA index, is exempt from Article 2.2 of the benchmark regulation as a central bank and as such is not included on the ESMA register. All the information on the index is available on the administrator’s website https://www.emmibenchmarks.eu/. Further to Regulation (EU) 2016/1011 of the European Parliament and of the Council of 8 June 2016, the Asset Manager applies a benchmark index monitoring procedure that describes the measures to be taken in the event of a major change to an index or if the index is discontinued. Investment strategy 1. Strategies used Prior framework of the investment universe: - The fund is made up of high quality money-market instruments and negotiable debt securities (bonds, Treasuries, etc.) and their derivatives.
High quality is defined according to an internal assessment process, taking into account a range of factors, including the credit quality of the instrument, the type of asset class of the instrument, the liquidity profile, and for structured financial instruments, the operational and counterparty risks inherent to the investment structure.

UCIT AMUNDI 3-6 M
Annual Report in 30/11/2020
4
This internal process led to a prior framework of the investment universe based on two main priorities: - A Risks tool defining in particular the list of authorised instruments and limits by issuer type or by instrument type; - An eligible investment universe including issuers selected by the asset manager. This assessment is based on a specific valuation by a credit analysis team independent of management, following an internal credit quality assessment procedure. With a view to achieving its investment objective and outperforming the benchmark index, the Fund’s investment process is organised around the following value pillars: 1/ Asset liquidity analysis and liquidity management: Liquidity is achieved using various interest rate instruments available on the capital markets. The assets of the Fund are broken down into different maturity segments, which are adjusted based on the change in subscriptions and redemptions, enabling the liquidity of the fund to be maintained. 2/ Selection of debt securities (negotiable debt securities, bonds) from public and private issuers: This selection is made in accordance with observations of a number of parameters: studies made by various research arms (macroeconomic, credit-specific) of the Crédit Agricole Group or other investment financial institutions. an assessment by the management team of the premium offered by that issuer's securities to compensate the signature and/or liquidity risk. a new issuer will be studied with greater interest the more it contributes to diversifying the portfolio. The selection is based on the conviction that, on average, credit spreads pay more than just the signature risk, provided that effective credit research takes place allowing a selective approach. 3/ Active management of the Weighted Average Maturity: based on the asset management team’s short-term euro zone rate forecasts. All euro fixed income and credit managers come together to agree on a euro zone government bond yield forecast by maturity. The team’s expectations in terms of future changes by the European Central Bank are particularly important due to the concentration of investments made by funds in the short-term fixed-income market. The limits observed by this fund are as follows:
Weighted Average Maturity(1) less than or equal to 6 months Weighted Average Life(2) less than or equal to 12 months 1-day liquidity more than 7.5% of net assets 7-day liquidity more than 15% of net assets
Maximum residual lifespan of securities and instruments
2 years. Variable-rate money-market instruments and fixed-rate money-market instruments hedged by a swap are updated based on a money-market rate or index.
Credit quality of the instruments
In order to assess the credit quality of securities, the asset manager may, at the time of their non- exclusive acquisition, refer to "investment grade" category ratings from any reputable ratings agencies that it deems the most relevant; it shall make every effort to avoid any automatic reliance on such ratings for the period in which it holds the securities.
(1) Weighted Average Maturity = this constitutes the average period to maturity for all securities held by the UCITS, weighted to reflect the relative weighting of each instrument, given that the maturity of a floating rate instrument is the time remaining until the next review of the money-market rate, as opposed to the time

UCIT AMUNDI 3-6 M
Annual Report in 30/11/2020
5
remaining until the repayment of the instrument’s capital. In practice, the Weighted Average Maturity is used to assess the sensitivity of a money-market fund to variations in money market interest rates. (2) Weighted Average Life = this is the weighted average of the residual lifespan of each security held by the UCITS, meaning the remaining lifespan until the full repayment of the security capital (not taking into account interest maturities and reductions in the principal sum). The Weighted Average Life is used to assess the credit risk and the liquidity risk. 2. Description of assets used (excluding derivatives) Money-market instruments: Up to 100% of the UCITS’ net assets are invested in negotiable debt securities and bonds, issued in euros or in any other currency, by public or private entities. The Fund may invest in the following instruments: - Variable-rate bonds with maturities of less than 2 years. Fixed-rate securities with maturities greater than 397 days will be hedged against the interest-rate risk - London CDs - EMTNs - Euro Commercial Paper - US Commercial Paper - Short- and Medium-Term Negotiable Debt Securities - Asset Backed Commercial Paper Investment in shares or units of other UCIs The Fund may invest up to 10% of its assets in units or shares of the following short-term or standard money-market UCIs: French or foreign UCITS French or European AIFs that respect the criteria set out in the French Monetary and Financial Code These UCIs may invest up to 10% of their assets in UCITS or AIFs. They may be managed by the Asset Manager or an affiliated company. The risk profile of these UCIs is compatible with that of the UCITS. 3. Description of derivatives used The use of futures is an integral part of the investment process due to the advantages they offer in terms of liquidity and/or their cost-effectiveness. Information about the counterparties to OTC derivative contracts: Counterparties are selected through the procedure in effect at Amundi and based on the principle of selecting the best market counterparties. This involves: - dual validation of the counterparties by the head of Amundi Intermédiation and the Amundi Asset Management Credit Committee based on an analysis of their financial and operational profiles (type of activities, governance, reputation, etc.) conducted by a team of credit analysts independent of the portfolio management teams. - a limited number of financial institutions with which the UCITS trades. Types of markets: regulated organised over-the-counter Categories of risks in which the portfolio management team intends to trade: equity interest rate foreign exchange credit Types of positions and description of all transactions, which must be limited to the achievement of the investment objective:

UCIT AMUNDI 3-6 M
Annual Report in 30/11/2020
6
hedging exposure arbitrage Types of instruments used: futures: on interest rates options: on interest rate futures swaps: currencies, rates currency forwards credit derivatives: Credit Default Swaps other Strategy for using derivatives to achieve the investment objective: interest rate risk hedging currency risk hedging credit risk hedging or arbitrage volatility arbitrage or positions Options and currency swaps are used to hedge the exposure from the securities portfolio. Interest rate swaps are used to hedge the portfolio faced with a change in interest rates. Currency swaps are used to fully hedge the exposure from the securities portfolio. Interest rate futures can be used to hedge an existing position in the portfolio, based on the different maturities of the yield curve. Currency forwards are used to hedge the exposure from the securities portfolio. 4. Description of securities with embedded derivatives Categories of risks in which the portfolio manager intends to trade: equity interest rate foreign exchange credit Types of operations or transactions that may only be carried out in the interest of achieving the investment objective: hedging exposure arbitrage Types of instruments used Puttable bonds Callable bonds Strategy for using derivatives to achieve the investment objective general portfolio hedging and hedging of certain risks and/or securities re-establishment of synthetic exposure to assets and risks exposure to the credit market (callable and puttable only) 5. Deposits The UCITS may make deposits with a maximum term of 12 months. Such deposits are used for cash management purposes and thus help achieve the fund’s investment objective. These are redeemable on demand or may be withdrawn at any time. Deposits are made with banks having their head offices in a Member State or, if they have their head office in a third country, they are subject to prudential rules considered equivalent to the rules laid down in European Union law. 6. Cash borrowing Cash borrowing is prohibited. Nonetheless, in situations such as substantial redemptions or credits to the account that are unsettled for technical reasons, the fund may, exceptionally, have a temporary debit balance.

UCIT AMUNDI 3-6 M
Annual Report in 30/11/2020
7
The debit situation will be cleared as quickly as possible in the bearers' best interest. 7. Temporary purchases and sales of securities Type of transactions used: reverse repurchase transactions and repurchase transactions in accordance with the French Monetary and Financial Code securities lending and borrowing in accordance with the French Monetary and Financial Code: prohibited These transactions can be cancelled at any time provided two business days' advance notice is given. Repurchase transactions have a maximum temporary period of seven business days. These assets are kept with the Custodian. Types of operations or transactions that may only be carried out in the interest of achieving the investment objective: cash management: through reverse repurchase agreements optimisation of UCITS revenue potential contribution to the UCITS’ leverage The Fund's commitments arising from temporary purchases and sales of securities may not exceed 100% of assets. Total commitments on derivatives and temporary purchases and sales of securities are limited to 100% of net assets. Total portfolio exposure to all risks arising from commitments and positions in directly-held securities will not exceed 100% of net assets. Compensation: See Fees and Commissions section Summary of the percentages used:
Type of transaction
Reverse repurchase transactions
Repurchase transactions Securities lending Securities
borrowing
Maximum proportion of net assets
100% 10% Prohibited Prohibited
Expected proportion of net assets
25% 1% Prohibited Prohibited
8- Information related to financial collateral (temporary purchases and sales of securities and/or OTC derivatives): Types of financial collateral: For the purposes of temporary purchases and sales of securities and OTC derivatives transactions, the Fund may receive collateral in the form of cash or securities. Securities received as collateral shall meet criteria set by the Asset Manager. They must be: - liquid, - transferable at all times, - diversified, in accordance with the UCITS’ eligibility, exposure, and diversification rules, - issued by an issuer that is not an entity belonging to the counterparty or its group. For bonds, the securities must also be issued by high-quality issuers located within the OECD with a minimum rating of AAA to BBB- on the Standard & Poor's scale or a rating deemed equivalent by the asset manager. Bonds must have a maximum maturity of 50 years. The criteria described above are set out in the Risk Policy, which may be consulted on the Asset Manager’s website (www.amundi.com) and is subject to change, particularly in the event of exceptional market circumstances.

UCIT AMUNDI 3-6 M
Annual Report in 30/11/2020
8
Haircuts may be applied to the collateral received. Such haircuts factor in credit quality, security price volatility and stress test results. Re-use of cash received as collateral: Cash received as collateral, limited to 10% of net assets, may be reinvested in deposits or in securities issued or guaranteed by a public or semi-public entity in a EU member country or an authorised third country, in accordance with the asset manager’s Risks Policy. Re-use of securities received as collateral: Not authorised: Securities received as collateral may not be sold, reinvested or pledged as collateral. Risk profile - Risk of loss of capital The main classification-related risks are: - Interest rate risk erest rate risk The main risks considered for portfolio management purposes are: - Credit risk The other risks are: - Counterparty risk - Liquidity risk associated with temporary purchases and sales of securities - Legal risk

UCIT AMUNDI 3-6 M
Annual Report in 30/11/2020
9
Activity report Décembre 2019The ECB left its key interest rates unchanged in December: the refi rate stayed at 0%, the deposit facility rate at -0.50% and the marginal rate at 0.25%.Investors were particularly sensitive to political events. In the United Kingdom, the specter of a disordered exit from the European Union receded after the conservative party's resounding victory in the December 12 general elections. Also, in the China/US trade dispute, both parties seem close to an agreement that would avoid the introduction of new import tariffs and partly reduce those already applied. This reduced uncertainty triggered renewed appetite for risky assets, leading symmetrically to a rise in 'risk-free' yields. Yields on German and French 10-year government bonds therefore rose by respectively 17bp and 16bp. The rise was more limited at the short end of the curve (11bp and 3bp respectively for the German 5 year and 2 year rates) as short-term rates are anchored by ECB key rates. Spreads on peripheral country government bonds and corporate bonds contracted by between 10bp and 15bp, thereby cushioning a large part of the rise in risk-free rates.In this environment, the portfolio recorded a net annualized performance of -0.23% for the month. We continue to focus on securities with maturities of close to one year, in the form of negotiable debt securities and bonds. Our exposure to Italian government securities stayed at the same level, but the average maturity of the securities held was lengthened slightly so as to benefit from the fall in interest rates. We have kept a substantial cash pocket in order to be able to deal with the fluctuations in liabilities generally seen at the end of the year. The portfolio's weighted average life (WAL) was up slightly to 186 days and its weighted average maturity (WAM) was stable at 107 days at the end of the month.
Janvier 2020The ECB left its key interest rates unchanged in January: the refi rate stayed at 0%, the deposit facility rate at -0.50% and the marginal rate at 0.25%. The ECB reiterated its intention of continuing to purchase assets at a pace of ?20 billion a month. President Lagarde also announced that the ECB would conduct an in-depth review of the meaning of "price stability" and of the way in which the ECB will integrate climate change into its models and forecasts in the future. In the United States, the Fed made no changes to its monetary policy at its January meeting.As from the middle of January, investors' optimism was wiped out by developments linked to the Coronavirus epidemic. The market therefore switched to risk-off mode and risk-free assets were particularly sought after. This resulted in a sharp fall in German yields. After rising to a high of close to -0.15% on January 13, German 10-year ended the month at a low of -0.44%. Investment Grade credit showed good resilience given the sentiment of aversion to risk and an avalanche of primary issues: issues totaled ?64 billion compared with ?57 billion in the same month in 2019 but credit spreads remained stable over the month. In this environment, the portfolio recorded a net annualized performance of -0.21% for the month. We continue to focus on securities with maturities of close to one year, in the form of negotiable debt securities and bonds, as well as BBB-rated securities, which represent almost 50% of the portfolio. We significantly reduced the portfolio's position on Italian sovereign bonds given the sharp fall in yields. The portfolio's weighted average life (WAL) was stable at 184 days and its weighted average maturity (WAM) was up, ending the month at 117 days.
Février 2020The ECB left its key interest rates unchanged in February: the refi rate stayed at 0%, the deposit facility rate at -0.50% and the marginal rate at 0.25%. Developments linked to the coronavirus epidemic have completely masked the economic figures published on both sides of the Atlantic.The flight to quality took concrete form in a very strong increase in demand for safe-haven securities, particularly German and US government bonds whose yields have plummeted: the German 10-year yield dropped by 17bp over the month, ending February at -0.60% while US 10-year yield, after shedding 35bp, dropped to a record low of 1.14%. Conversely, the yield on Italian government bonds rose significantly. Italian 10-year yield has risen from 0.90% to 1.20% and the the 2-year rate has risen from -0.20% to 0%. Although Investment Grade Euro Credit showed relatively better resistance than other classes of risky assets, the average spread widened by +20bp over the month (+25bp in the last week alone) while the slump in sovereign yields positively counterbalanced this relative underperformance of credit. In the United States, Fed Chairman, Jerome Powell, declared that the central bank's present monetary policy continued to be appropriate but said that the coronavirus was an additional uncertainty that the Fed would be watching closely. Given the recent massive sales on the markets, investors are now expecting further action by the central banks (an interest-rate cut by the ECB and three interest-rate cuts by the Fed over the coming months). In this environment, the portfolio recorded a net annualized performance of -0.31% for the month. We continue to focus on securities with maturities of close to one year,

UCIT AMUNDI 3-6 M
Annual Report in 30/11/2020
10
in the form of negotiable debt securities and bonds. We have taken advantage of the widening in credit spreads to invest in short-term securities (maturities of shorter than one year) whose yields have become attractive again. The portfolio's weighted average life (WAL) is stable at 188 days, as is its weighted average maturity (WAM), at 116 days at the end of the month.
Mars 2020Lockdowns implemented in a growing number of countries to fight coronavirus have increased investors' concerns regarding the health crisis impact on economic activity. As a result, credit spreads widened by unprecedented scale in such a short period of time. The 1-3 yr Merrill Lynch Corporate Index vs Libor, a close proxy of the investment universe, rose from 47 bp on February 28th to 187 bp on March 24th before stabilizing at 181 bp on March 31st. Over the full year 2019 this index fluctuated between 32 and 79 bp. The massive supportive measures announced by the ECB (particularly the ?750 bn Pandemic Emergency Purchase Programme which includes Commercial Papers in addition to the issuances comprised in the precedent programs), as well as by most European countries probably helped stabilize the market by month end.More into detail, no sector was spared by the credit spread widening. However bonds' prices adjusted more rapidly than those of Commercial papers, whose prices displayed greater inertia. In this context, the fund's performance resulted at 90% from the credit spreads widening of the bond bucket, which represents 33% of the fund. However the strong bond repricing led to a marked rise in the portfolio's yield to maturity, from -0.17% in February, to +0.31% by end of March.We have during the recent period implemented the following strategy:
The monitoring of the liquidity bucket was a key focus, in a context of high liquidity stress on the market. The instant liquidity bucket was raised from 15% to 30%. This increase was implemented through some sales, as well as by not rolling maturing issuances We have been careful to maintain the portfolio's structure and in keeping the issuances with the highest yield, so as to preserve the performance recovery capacity. Meanwhile we put emphasize on the credit quality, the average portfolio's rating remaining A.
Average life : the increase of the liquidity bucket led to a decrease of the average life, which remains below 5 months (154 days). It should help the portfolio benefiting from the convergence to par effect as soon as spreads will stabilize. Bonds with maturities greater than 13 months only represent 6 % of the total AUM.
Modified duration: the WAM of the portfolio was slightly reduced, at 86 days, as a consequence of the liquidity bucket increase.
Avril 2020The huge packages announced by central banks as well as most governments across most developed countries helped stabilize financial markets in end of March and throughout April. Both the FED and the ECB confirmed their commitment to use their full range of tools to fight against the unprecedented deterioration in economic activity caused by the lockdown in the wake of the COVID-19 crisis. The ECB left its key rates unchanged, but announced new liquidity measures to support the transmission mechanism of monetary policy and bank lending amid persisting signs of tension in money market rates: Easing of TLTRO III conditions by lowering by 50bp the rate corridor of the facility. Introducing of a new liquidity facilities, PELTROs (pandemic emergency longer-term refinancing operations), which consist in a series of additional longer-term refinancing operations to ensure sufficient liquidity and smooth money market conditions during the pandemic period. The interest rate will be 25 basis points below the refi rate (currently 0%)The ECB started buying assets within the frame of the new Pandemic Emergency Purchase Program (PEPP) in April, for as much as ? 118bn. These supportive measures as well as the prospect of a gradual easing of the lockdown, led to strong credit spreads tightening: the 1-3 yr Merrill Lynch Corporate Index vs Libor, a close proxy of the investment universe, tightened from around 200 bp as of end of March to 142 by April end.We have during the recent period implemented the following strategy: Liquidity bucket remained a key focus, although the liquidity stress on the market eased markedly. The instant liquidity bucket rose from 30% to 37%. This increase was implemented by not rolling maturing issuances, and by selling some of the expensive issuances held in the portfolio. In the same time we bought some commercial papers with short maturities displaying strong credit quality as well as attractive yields Credit quality: we put emphasize on the credit quality, the average portfolio's rating remaining A. Average life : the increase of the liquidity bucket led to a decrease of the average life, which is now close to 4 months (128 days vs 154 days as of end of March). It helps the portfolio benefiting from the convergence to par effect. Modified duration: the WAM of the portfolio was slightly reduced, at 67 days vs 87 days as at end of March, as a consequence of the liquidity bucket increase.
The yield to maturity of the portfolio rose from +0.31% to +0.42% over the month
Mai 2020Despite the particularly bad macroeconomic data published in all parts of the world, the tone of the markets

UCIT AMUNDI 3-6 M
Annual Report in 30/11/2020
11
remained positive throughout May. There were numerous catalysts for this movement: The announcement in Europe of a global stimulus package of ?750 billion proposed by the European Commission and national relief packages for various key sectors of the economy (automobile, tourism, farming, etc.) A steady improvement in the health situation with a marked drop in the number of new cases and Covid-19 related deaths in most European countries Prospect of gradual reopening in the main European countries
Continuing implementation of the ECB's securities purchases programGerman yields therefore trended up during the month, with 10-year yield ending the month at -0.45%, corresponding to a rise of 14bp month on month. In contrasts, the debt of the 'peripheral' European countries benefited from the proposed aid package: Italian debt recorded a significant contraction in yields, with 10-year yield ending the month at 1.45%, down by 40bp month on month.The ECB bought more than ?192 billion of debt securities on the markets in May, of which ?115 billion as part of the PEPP. The scale of its purchases helped accentuate the tightening in credit spreads: the spread on the Merrill Lynch 1-3-Year Corporate index against Libor, which can be considered a proxy of the investment universe, narrowed from 132bp to 114bp over the month.In terms of portfolio management, we focused on the following: Liquidity: managing the portfolio's liquidity continues to be a key point. The fund's cash pocket remains at between 30% and 35%. We have invested repayments and subscriptions in commercial paper and certificates of deposit with very high credit quality and maturities of under six months. Average life: the portfolio's WAL is now of less than 4 months (119 days versus 128 days at the end of April), which will enable the portfolio to benefit from the pull to par. Average maturity: WAM was also down, to 61 days versus 67 at end-April.
Juin 2020The wave of optimism seen in the markets in May lasted until mid-June. In the wake of the European Commission's proposal for the creation of a ?750 billion recovery fund, the ECB produced a positive surprise when it increased the size of the PEPP by ?600 billion, which was more than had been expected by the markets, and extended its duration to June 2021 at the earliest. Its key rates remain unchanged. As expected, there was substantial demand for the June TLTRO-III, which offered particularly advantageous refinancing conditions (loans with interest rates as low as -1%): the Eurozone banks borrowed more than ?1,300 billion from the ECB during this operation. Italian and Spanish banks have been the main beneficiaries of these refinancing operations, with borrowings of, respectively, ?180 billion and ?125 billion. In the United States, the Fed also reiterated its commitment to upholding the US economy. It left the Fed Funds rate unchanged, at close to zero. Jerome Powell's particularly cautious comments on the outlook for the US economy somewhat dampened the markets' optimism. Against a background of strong growth in new cases of Covid 19 in the United States, the Fed chairman stressed that the vigor of the recovery in the US economy was particularly uncertain. In this environment, after widening at the beginning of June, German rates remained stable, with 10-year yield fluctuating within a range of -0.35% to -0.45%. In contrast, Italian sovereign yields continued the contraction initiated in May, with the 10-year rate ending the month at 1.25% versus 1.5% at the beginning of the month. With regard to credit, the significant tightening in credit spreads recorded since the beginning of May (start of ECB's PEPP purchases) came to a halt in mid-June, following Jerome Powell's cautious remarks and the spread of the coronavirus epidemic in the United States. Spreads subsequently stabilized. In terms of portfolio management, we focused on the following: Portfolio liquidity: liquidity remains a key issue and the fund's cash pocket remains at between 30% and 35%. We have invested repayments and subscriptions in commercial paper and certificates of deposit with high credit quality and maturities of under one year. Average life: the portfolio's WAL is now close to 3 months (106 days versus 119 days at the end of May), which will enable the portfolio to benefit from the pull to par. Interest-rate sensitivity: the portfolio's weighted average maturity (WAM) is also down, at 55 days versus 61 days at the end of May.
Juillet 2020The reporting season has begun in the United States and earnings have been less negative than expected by the consensus. For example, the banking sector managed to outperform thanks in particular to the corporate and investment banking activities with revenues from trading activities boosted by the volatility of the financial markets during the period. However, the results also showed the strong rise in the cost of risk and therefore in provisions.Moreover, the Eurozone's 27 Member States have reached an agreement on the ?750 billion recovery fund (?390 billion in grants and ?360 billion in loans), which is the first step towards a common debt to be pooled at the level of the European Commission.The macroeconomic data published at the beginning of the month was fairly positive, even though the previous months used as a yardstick were at historically low levels, but the second-quarter growth figures for Germany, Italy, France and Spain, which came out at, respectively, -10.1%, -12.4%, -13.8% and -18.5%, drove home the severity of the crisis. The tensions between the United States and China, against a backdrop of spying, and the resurgence of the Covid-19 epidemic

UCIT AMUNDI 3-6 M
Annual Report in 30/11/2020
12
throughout the Americas (North and South) also added to investors' fears. In terms of portfolio management, we focused on the following: - Portfolio liquidity: liquidity remains a key issue and the fund's cash pocket remains close to 30%.- we are continuing to invest repayments and subscriptions in commercial paper and certificates of deposit with high credit quality and maturities of under one year.- Weighted average life: the portfolio's WAL has increased slightly, from 106 days at the end of June to 112 days at the end of July.- Interest rate sensitivity: the portfolio's WAM has also increased, to 61 days at the end of July versus 55 days at the end of June.
Août 2020The dynamic market momentum of July continued in August. It continued to be buoyed, both in Europe and in the United States, by monetary and fiscal stimulus measures and positive leading indicators pointing to a strong recovery despite the historic fall in GDP in the second quarter. The central banks are continuing their ultra-loose policies and remain resolutely prepared to maintain the conditions of liquidity needed to support economic recovery. In the United States, at the Jackson Hole symposium, the FED chairman announced a change in the inflation target. The new policy sets an "average inflation target", which means that inflation can rise a little above the long-term target of 2%. The aim is enable a return to full employment by maintaining a loose monetary policy over an extended period.In these conditions, German 10-year yield rose by 12 basis points to -0.40% while the US 10-year yield rose by 17 basis points to +0.70%. The rise in long-term interest rates is linked to expectations of an increase in long-term issues, both in the United States and in Europe, against the background of the new inflation target in the United States. Credit spreads continued to tighten, but at a slower pace than in July.In terms of portfolio management, we focused on the following: Portfolio liquidity: the fund's cash pocket remains close to 30%. We have invested repayments and subscriptions in commercial paper, certificates of deposit and bonds with high credit quality and maturities of under one year.
Weighted average life: The portfolio's WAL remains at close to three months, at 95 days. Weighted average maturity (WAM) has dropped, down to 52 days compared with 61 days at the end of July.
Septembre 2020Market sentiment was shored up during the month by confirmation of unconditional monetary and fiscal support. At the same time, this was offset by the uncertain economic outlook, exacerbated by the upsurge of new Covid-19 cases and new sources of uncertainty such as Brexit and the difficulties encountered by Democrats and Republicans in coming to an agreement on the fiscal stimulus package in the United States.The ECB and the Federal Reserve both reaffirmed their intention of pursuing their accommodative monetary policies so as to ensure price stability and uphold the economic recovery. Speaking before the European Parliament, Christine Lagarde said that deflation would continue in the Eurozone over the coming months, due to the recent appreciation of the euro and the fall in oil prices. In the Eurozone, the 5th tranche of TLTRO-III met with demand totaling ?174.5 billion from 388 banks. This success mechanically increased the liquidity surplus within the Eurosystem, which now stands at ?3,000 billion, and pushed money-market interest rates down. The ?STR therefore dropped to a new record low at -0.57% while 3-month Euribor oscillated at around -0.50%, which is the level of the ECB deposit facility rate. In the United States, the FED outlined its new monetary policy of targeting average inflation of around 2%: it will keep its interest rates close to zero until at least 2023 while leaving its asset purchases program unchanged for the moment.With regard to the macroeconomic indicators, manufacturing PMI was stronger than expected in both Europe and the United States, while services PMI fell: many sectors (restaurants, hotels, tourism, culture, etc.) have been hurt by the restrictions that are being (re)introduced in a growing number of countries to combat the spread of the coronavirus epidemic.Government bond yields fell during the month: German 10-year yield dropped by 13bp to -0.52%, which is the bottom limit of its range over the past five months. Italian spreads tightened by 11bp during the month, boosted by the positive results of the Italian constitutional referendum and the regional elections, which have reduced the risk of political instability.In this environment, we have focused on the following: Portfolio liquidity: the fund's cash pocket remains close to 30%. We have invested repayments and subscriptions in commercial paper, certificates of deposit and bonds with high credit quality and maturities of under one year. Given the scale of sovereign bond purchases by the ECB and the positive news flow on the country, we have once again purchases Italian sovereign debt with maturities of shorter than seven months. Average life: the portfolio's weighted average life (WAL) has increased, to 105 days versus 95 days at the end of August. Interest-rate sensitivity: the portfolio's weighted average maturity (WAM) is also up, at 68 days versus 52 days at the end of August.
Octobre 2020Market sentiment deteriorated during the month in the wake of announcements of tighter restrictions in Europe

UCIT AMUNDI 3-6 M
Annual Report in 30/11/2020
13
to combat the second wave of the Covid 19 outbreak. Investors now anticipate that these measures could prematurely halt the rebound in growth seen in Q3. The result was a flight to quality in interest rates, with the German 10-year rate ending the month at -0.63%, 10 bps lower than at the end of September.Credit spreads remained remarkably stable, largely thanks to the ECB's very strong technical support and the prospect of an increase in the amount of the bond purchase programme (BPPP) announced in December in view of the deteriorating economic environment in the Euro zone. The ECB left its rates unchanged at the October meeting. In this context, we have given priority to the following areas of management : Portfolio liquidity: the fund's cash position remains close to 30%. We invest cash and subscriptions in commercial papers, certificates of deposit and bonds of high credit quality, with maturities of less than 1 year. Given the scale of the ECB's purchases of sovereign securities, we have purchased Spanish sovereign securities with maturities of less than 12 months. Average life: the portfolio's WAL is also down, to 87 days compared with 105 days at the end of September. Interest rate sensitivity: the portfolio's WAM also increased to 57 days from 68 days at the end of September.
Novembre 2020New lockdown measures were announced in October and November in numerous European countries and some States in the US in an attempt to counter the second wave of the Covid-19 epidemic. This accelerated the downturn in leading macroeconomic indicators that had begun at the end of the summer: PMI indices in Europe dropped significantly, to below the 50 mark in nearly all countries, dragged down by the slump in the services sector. However, the announcements from Pfizer and Moderna concerning the efficacy of their vaccines acted as a powerful antidote, boosting investor morale and leading them to flock back to risk assets in November. The equity markets posted record month performances (+12% for the MSCI World) whereas the yields on the sovereign debt of the 'peripheral' countries continued to contract. The Italian 10-year rate ended November at 0.62%, down by 13bp.Investment Grade credit spreads also benefited from this renewed appetite for risk, all the more so as they still benefit from powerful support from the ECB purchases program and a scarcity of supply as there were fewer primary issues than in previous months. The Merrill Lynch 1-3 Year Euro Corporate Index, proxy of the fund's investment universe, tightened by 20bp during the month against German rates, ending the month at 67bp and moving closer to its level of February (62bp) before the health crisis arose.In this environment, we have focused on the following : Portfolio liquidity: the fund's cash pocket remains close to 30%. We have invested repayments and subscriptions in commercial paper, certificates of deposit and bonds with high credit quality and maturities of under one year. Weighted average life: The portfolio's WAL was up slightly, at 96 days compared with 87 days at the end of October. Weighted average maturity (WAM) remained virtually unchanged, at 59 days compared with 57 days at the end of October.
For the period under review, the performance of each of the units of the portfolio AMUNDI 3-6 M and its benchmark stood at:- Unit AMUNDI 3 - 6 M - I2 (C) in EUR currency: -0.35%/ -0.47%- Unit AMUNDI ULTRA SHORT TERM BOND SRI - E (C) in EUR currency: -0.45%/ -0.47%- Unit AMUNDI ULTRA SHORT TERM BOND SRI - I (C) in EUR currency: -0.36%/ -0.47%- Unit AMUNDI ULTRA SHORT TERM BOND SRI - PERI (C) in EUR currency: -0.44%/ -0.47%- Unit AMUNDI ULTRA SHORT TERM BOND SRI - R (C) in EUR currency: -0.45%/ -0.47%- Unit AMUNDI ULTRA SHORT TERM BOND SRI - S (C) in EUR currency: -0.38%/ -0.47%
Past performance is no guarantee of future performance.
INFORMATION ON INCIDENTS RELATED TO THE COVID-19 CRISISThe Covid-19 health crisis has had no material impact on the UCI over the financial year.
Principal movements in portfolio listing during the period
Movements (in amount)Securities
Acquisitions Transfers
AMUNDI CASH CORPORATE I2 764,646,347.49 794,084,226.54

UCIT AMUNDI 3-6 M
Annual Report in 30/11/2020
14
AMUNDI 3 M I2 558,346,754.41 643,734,809.97
ITALIE E6R+0.8% 15-12-20 130,525,600.00 130,389,300.00
SPAI LETR DEL TESO ZCP 07-05-21 130,356,494.11 130,349,060.84
SPAI LETR DEL TESO ZCP 13-11-20 130,080,077.39 130,080,962.44
ENDESA SA 020620 FIX -0,035 130,000,884.73 130,000,000.00
SPAI LETR DEL TESO ZCP 04-12-20 105,030,755.18 35,002,061.23
ZCP 11-06-21 65,195,783.25 65,193,799.43
ABB FINANCE B V 140520 FIX -0,1 65,001,263.91 65,000,000.00
FIDELITY NATIONAL INFORMATION 070520 FIX 0,16 64,999,422.23 65,000,000.00

UCIT AMUNDI 3-6 M
Annual Report in 30/11/2020
15
Efficient portfolio management (EPM) techniques and Financial derivative instruments in EURa) Exposure obtained through the EPM techniques and Financial derivative instruments
• Exposure obtained through the EPM techniques: 31,750,000.88o Securities lending: o Securities loans: o Reverse repurchase agreement: 31,750,000.88o Repurchase:
• Underlying exposure reached through financial derivative instruments: 89,650,000.00o Forward transaction: o Future: o Options: o Swap: 89,650,000.00
b) Identity of the counterparty(ies) to EPM techniques and financial derivative instruments
Financial derivative instruments (?)BNP PARIBAS FRANCEHSBC FRANCE EX CCF
Identity of the counterparty(ies) to EPM techniques
LA BANQUE POSTALE
(?) 4.en???

UCIT AMUNDI 3-6 M
Annual Report in 30/11/2020
16
c) Type and amount of collateral received by the UCITS to reduce counterparty risk
Types of financial instruments Amount portfolio currency
EPM
. Term deposit
. Equities
. Bonds 31,998,990.96
. UCITS
. Cash (?) 22.06
Total 31,999,013.02
Financial derivative instruments
. Term deposit
. Equities
. Bonds
. UCITS
. Cash
Total
(?) 5.en???
d) Revenues and operational cost/fees from EPM
Revenues and operational cost/fees Amount portfolio currency
. Revenues (?) 306.48
. Other revenues
Total revenues 306.48
. Direct operational fees 976,677.60
. Indirects operational fees
. Other fees
Total fees 976,677.60
(?) 6.en???
UCIT AMUNDI 3-6 M
Annual Report in 30/11/2020
17
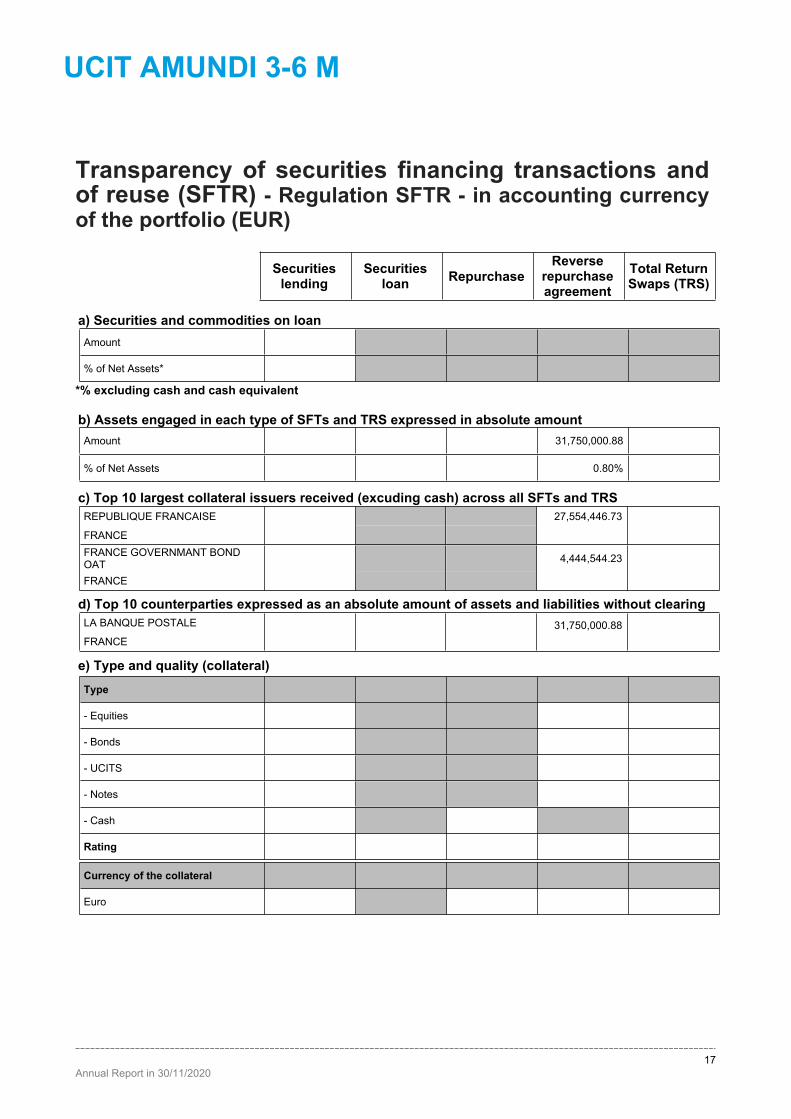
Transparency of securities financing transactions and of reuse (SFTR) - Regulation SFTR - in accounting currency of the portfolio (EUR)
Securities lending
Securities loan Repurchase
Reverse repurchase agreement
Total Return Swaps (TRS)
a) Securities and commodities on loanAmount
% of Net Assets*
*% excluding cash and cash equivalent
b) Assets engaged in each type of SFTs and TRS expressed in absolute amountAmount 31,750,000.88
% of Net Assets 0.80% c) Top 10 largest collateral issuers received (excuding cash) across all SFTs and TRSREPUBLIQUE FRANCAISE 27,554,446.73
FRANCEFRANCE GOVERNMANT BOND OAT 4,444,544.23
FRANCE
d) Top 10 counterparties expressed as an absolute amount of assets and liabilities without clearingLA BANQUE POSTALE 31,750,000.88 FRANCE
e) Type and quality (collateral)Type
- Equities
- Bonds
- UCITS
- Notes
- Cash
Rating
Currency of the collateral
Euro

UCIT AMUNDI 3-6 M
Annual Report in 30/11/2020
18
Securities lending
Securities loan Repurchase
Reverse repurchase agreement
Total Return Swaps (TRS)
f) Settlement and clearing
Tri-party X
Central Counterparty
Bilateral X X g) Maturity tenor of the collateral broken down maturity buckets< 1 day
[1 day - 1 week]
]1week- 1 month]
]1month - 3 months]
]3months- 1 year]
> 1 year
Open 31,998,990.96 h) Maturity tenor of the SFTs and TRS broken down maturity buckets< 1 day
[1 day - 1 week] 31,750,000.88
]1week- 1 month]
]1month - 3 months]
]3months- 1 year]
> 1 year
Open i) Data on reuse of collateral
Maximum amount (%)
Amount reused (%)
Cash collateral reinvestment returns to the collective investment undertaking in euro
j) Data on safekeeping of collateral received by the collective investment undertakingCACEIS Bank
Securities 31,998,990.96
Cash

UCIT AMUNDI 3-6 M
Annual Report in 30/11/2020
19
Securities lending
Securities loan Repurchase
Reverse repurchase agreement
Total Return Swaps (TRS)
k) Data on safekeeping of collateral granted by the collective investment undertakingSecurities
Cash l) Data on return and cost broken downIncomes
- UCITS
- Manager
- Third parties
Costs
- UCITS 976,703.58
- Manager
- Third parties
e) Type and quality (collateral)
Amundi Asset Management undertakes to accept only securities of a high credit quality and to increase the value of its collateral by applying valuation discounts to securities loaned to it. This process is regularly reviewed and updated.
i) Data on reuse of collateral
« The regulations governing UCIT forbid the reuse of collateral securities. Cash collateral received is: o reinvested in short-term money market funds (as defined by ESMA in its ‘Guidelines on ETFs and other UCITS issues’)o placed on deposit;o reinvested in high-quality long-term government bondso reinvested in high-quality short-term government bondso used for the purpose of reverse repurchase transactions.»The maximum proportion of received collateral that may be reused is 0% in the case of securities and 100% in the case of cash.The effective usage amounts to 0% for collateral securities and 100% for cash collateral.
k) Data on safekeeping of collateral granted by the collective investment undertaking
CPR Asset Management undertakes to do business with a limited number of depositaries, selected to ensure the adequate custody of securities received and cash.
l) Data on return and cost broken down
For securities lending transactions and repurchase agreements, BFT Investment Managers has entrusted Amundi Intermédiation, acting on behalf of the UCITS, with the following responsibilities: selecting counterparties, ordering the implementation of market agreements, monitoring counterparty risk, performing qualitative and quantitative monitoring of collateralisation (dispersion checks, ratings, liquid assets), repurchase agreements and securities lending. Income generated from these transactions is paid into the

UCIT AMUNDI 3-6 M
Annual Report in 30/11/2020
20
UCITS. Costs generated by these transactions are incurred by the UCITS. Charges by Amundi Intermédiation must not exceed 50% of the income generated by these transactions.

UCIT AMUNDI 3-6 M
Annual Report in 30/11/2020
21
Significant events during the financial period Le 23 mars 2020 Prospectus updated: 23 March 2020

UCIT AMUNDI 3-6 M
Annual Report in 30/11/2020
22
Specific details Voting rights
The exercise of voting rights attached to the securities included in the fund's assets and the decision on the contribution in securities are defined in the fund regulations.
Group funds and instruments
In order to obtain information on the financial instruments held in the portfolio that are issued by the Management Company or by its affiliates, please refer to the sections:• Additional information,• Group financial instruments held in the portfolio in the annual financial statements for the year ended, attached hereto.
Calculating overall risk
Specify the method used to measure the overall risk:• Commitment calculation methodFutures contracts are recorded at their market value as off-balance-sheet commitments, at the settlement price. Conditional forward transactions are translated to the underlying equivalent. Over-the-counter interest rate swaps are evaluated based on the nominal amount, plus or minus the corresponding estimation difference.
• Overall risk calculation method: the mutual fund uses the commitment calculation method to calculate the mutual fund's overall exposure to financial contracts.• Leverage - Funds to which the risk calculation method is applied Indicative leverage level: 1.

UCIT AMUNDI 3-6 M
Annual Report in 30/11/2020
23
Regulatory informations Selection procedure for brokers and counterparties
Our Management Company and its "Trading" subsidiary attaches great importance to the selection of transactional service providers that are brokers or counterparties.
Its selection methods are as follows:
- Brokers are selected by geographical area and then by business. Counterparties are selected by business.- Brokers and counterparties are provided with a quarterly internal memorandum. The company departments involved in the rating process are directly concerned by the services rendered by these service providers.The "Trading" subsidiary organises and determines this rating based on the scores provided by each team leader concerned, using the following criteria:
For teams of managers, financial analysts and strategists:- general commercial relations, understanding of needs, relevance of contracts,- quality of market and opportunities advice, consultancy monitoring,- quality of research and publications,- universe of securities covered, company and management visits.
For teams of traders:- quality of personnel, market knowledge and information on companies, confidentiality,- price proposals,- quality of execution,- quality of transactions processing, connectivity, technical standards and responsiveness.
Our Company's Compliance and Middle Office departments have a right of veto.
Accreditation of a new transactional service provider (broker or counterparty)
The Trading subsidiary is in charge of processing authorisation dossiers and obtain approval from the Risk and Compliance departments. When the transactional service provider (broker or counterparty) is authorised, it is rated in the following quarter.
Monitoring committees for transactional service providers (brokers and counterparties)
These monitoring committees meet every quarter under the chairmanship of the Trading subsidiary manager.The purpose of the meetings is to:- validate past activity and the new selection to be implemented in the following quarter,- decide on whether service providers will form part of a group that will be assigned a certain number of transactions,- define the business outlook.In this perspective, the monitoring committees review the statistics and ratings assigned to each service provider and take decisions accordingly.
Report on broking fees
A report on broking fees is available for bearers. It can be viewed at the following web address: www.amundi.com.
The ucits' compliance with targets relating to ESG (environmental, social and governance) criteria

UCIT AMUNDI 3-6 M
Annual Report in 30/11/2020
24
Remuneration Policy
1. Remuneration policy and practices of the AIFM/Management company
The remuneration policy implemented by Amundi Asset Management (“Amundi AM”) is compliant with the rules in terms of remuneration specified in the Directive 2011/61/UE of the European Parliament and of the Council of June 8th 2011 on Alternative Investment Fund Managers (the “AIFM Directive”), and in the Directive 2014/91/UE of July 23rd 2014 on undertakings for collective investment in transferable securities (the “UCITS V Directive”). These rules, about remuneration policies and practices, have for objective to promote sound and effective risk management of fund managers and the funds they manage.
This policy is incorporated within the framework of the remuneration policy of Amundi reviewed each year by its Remuneration Committee. The latter checked the application of the remuneration policy in relation to the 2018 fiscal year, its compliance with the AIFM/UCITS Directives’ principles and approved the policy applicable for the 2019 exercise at its meeting held on February 8th 2019.
In 2019, the implementation of the Amundi remuneration policy was subject to an internal, central and independent audit, driven by the Amundi Internal Audit.
1.1 Amounts of remuneration paid by the Management companies to its employees
During fiscal year 2019, the total amount of compensation (including fixed, deferred and non-deferred bonus) paid by Amundi AM to its employees (1 381 employees at December 31st 2019) is EUR 145 414 374. This amount is split as follows:
The total amount of fixed remuneration paid by Amundi AM in 2019: EUR 105 383 398, which represents 72% of the total amount of compensation paid by Amundi AM to its staff, were in the form of fixed remuneration. The total amount of bonus deferred and non-deferred paid by Amundi AM in 2019: EUR 40 030 975, which represents 28% of the total amount of compensation paid by Amundi AM to its staff, were in this form. The entire staff is eligible for variable compensation.
Additionally, some ‘carried interest’ was paid by Amundi AM with respect to fiscal year 2019, and is taken into account in the total amount of bonus referred to here above.
Of the total amount of remuneration (fixed and bonus deferred and non-deferred) paid during the fiscal year, EUR 13 994 636 were paid to the ‘executives and senior managers’ of Amundi AM (28 employees at December 31st 2019), and EUR 11 917 096 were paid to the ‘senior investment managers’ whose professional activities have a material impact on Amundi AM’s risk profile (40 employees at December 31st 2019).
1.2 Alignment of remuneration policy and practices with risk profile of the AIFs/UCITS
The Amundi Group has adopted and implemented remuneration policy and practices compliant with the latest norms, rules, and guidelines issued from the regulatory authorities for its management companies (AIFM/UCITS).
The Amundi Group has also identified all of its ‘Identified Staff’, which includes all the employees of the Amundi Group having a decision authority on the UCITS/AIFM management companies or the UCITS/AIFs managed and consequently likely to have a significant impact on the performance or the risk profile.
The variable remuneration awarded to the Amundi Group staff takes into account the performance of the employee, its business unit and the Amundi Group as a whole, and is based on financial and non-financial criteria as well as the respect of sound risk management rules.
The criteria taken into account for performance assessment and remuneration award depends on the nature of the employee’s functions:
1. Management and selection of AIFs/UCITS functions Common financial criteria:

UCIT AMUNDI 3-6 M
Annual Report in 30/11/2020
25
- Gross and net performance over 1, 3 years;- Information ratio and Sharpe ratio over 1, 3 and 5 years;- Performance fees collected during fiscal year when relevant;- Competitive ranking;- Contribution to net inflows/Successful requests for proposals, mandates during fiscal year. Common non-financial criteria:- Respect of internal rules in terms of risk management and prevention (Risk/Compliance);- Innovation/Product development;- Sharing of best practices and collaboration between employees;- Commercial engagement;- Quality of management.
2. Sales and marketing functions Common financial criteria:- Net inflows;- Revenues;- Gross inflows; client base development and retention; product mix;Common non-financial criteria:- Joint consideration of Amundi’s and clients’ interests;- Clients satisfaction and quality of relationship;- Quality of management;- Securing/developing the business;- Cross-functional approach and sharing of best practices;- Entrepreneurial spirit.
3. Control and support functionsFor control and support functions, performance assessment and remuneration award are independent from the performance of the business they oversee.Common criteria taken into account are:- Mainly criteria related to the meeting of objectives linked to their functions (risk management, quality of controls, completion of projects, tools and systems improvement etc.)- When financial criteria are used, these are mainly related to management/ optimization of expenses.
The above-mentioned performance criteria, and specifically those applicable to Identified staff in charge of the management of AIFs/UCITS, comply with the applicable regulation as well as to the AIF’s/UCITS investment policy. These internal rules of Amundi Group contribute to a sound and effective risk management.
Furthermore, Amundi Group has adopted and implemented, for its entire staff, measures aiming to align remuneration with long-term performance and risks in order to avoid conflicts of interest.
In this respect, notably:- The deferral policy has been adapted to comply with the AIFM and UCITS V Directives’ requirements. - The deferred portion of bonus for identified staff members is awarded in financial instruments indexed at 100% on the performance of a basket of AIFs and/or UCITS funds managed.- The actual payment of the deferred portion is linked to the financial situation of Amundi Group, with the continued employment within the group and to a sound and effective risk management over the vesting period.
Energy transition law for green growth (Article 173, law n°2015-992)
@@@CARBONE

UCIT AMUNDI 3-6 M
Annual Report in 30/11/2020
26
Auditor's Certification
UCIT AMUNDI 3-6 M
Annual Report in 30/11/2020
28

UCIT AMUNDI 3-6 M
Annual Report in 30/11/2020
29

UCIT AMUNDI 3-6 M
Annual Report in 30/11/2020
30

UCIT AMUNDI 3-6 M
Annual Report in 30/11/2020
31
@@@RAP-SPE

UCIT AMUNDI 3-6 M
Annual Report in 30/11/2020
32
Annual accounts

UCIT AMUNDI 3-6 M
Annual Report in 30/11/2020
33
Balance sheet - asset on 11/30/2020 inEUR
11/30/2020 11/29/2019
FIXED ASSETS, NET DEPOSITS 8,002,249.11FINANCIAL INSTRUMENTS 3,170,577,957.82 6,429,214,540.23Equities and similar securities
Traded in a regulated market or equivalent Not traded in a regulated market or equivalent
Bonds and similar securities 946,443,674.86 2,780,568,198.29Traded in a regulated market or equivalent 946,443,674.86 2,780,568,198.29Not traded in a regulated market or equivalent
Credit instruments 1,806,483,111.65 3,094,303,801.61Traded in a regulated market or equivalent 1,806,483,111.65 3,094,303,801.61
Negotiable credit instruments (Notes) 1,806,483,111.65 3,094,303,801.61Other credit instruments
Not traded in a regulated market or equivalent Collective investment undertakings 385,848,427.76 554,173,131.75
General-purpose UCITS and alternative investment funds intended for non-professionals and equivalents in other countries 385,848,427.76 554,173,131.75
Other Funds intended for non-professionals and equivalents in other EU Member States
General-purpose professional funds and equivalents in other EU Member States and listed securitisation entities
Other professional investment funds and equivalents in other EU Member States and listed securitisation agencies
Other non-European entities Temporary transactions in securities 31,736,189.63
Credits for securities held under sell-back deals 31,736,189.63 Credits for loaned securities Borrowed securities Securities sold under buy-back deals Other temporary transactions
Hedges 66,553.92 169,408.58Hedges in a regulated market or equivalent Other operations 66,553.92 169,408.58
Other financial instruments RECEIVABLES 7,228,271.21 51,930,656.11Forward currency transactions Other 7,228,271.21 51,930,656.11
FINANCIAL ACCOUNTS 782,764,453.26 541,200,183.58Cash and cash equivalents 782,764,453.26 541,200,183.58
TOTAL ASSETS 3,960,570,682.29 7,030,347,629.03

UCIT AMUNDI 3-6 M
Annual Report in 30/11/2020
34
Balance sheet - liabilities on 11/30/2020 en EUR 11/30/2020 11/29/2019
SHAREHOLDERS' FUNDS
Capital 3,975,111,231.79 6,999,122,659.75
Allocation Report of distributed items (?)
Brought forward (?)
Allocation Report of distributed items on Net Income (?,??) -17,137,306.14 -34,750,314.97
Result (?,??) 511,627.67 21,226,510.88
TOTAL NET SHAREHOLDERS' FUNDS * 3,958,485,553.32 6,985,598,855.66* Net Assets
FINANCIAL INSTRUMENTS 2,872.66Transactions involving transfer of financial instruments 2,872.66
Temporary transactions in securities
Sums owed for securities sold under buy-back deals
Sums owed for borrowed securities
Other temporary transactions
Hedges
Hedges in a regulated market or equivalent
Other hedges
PAYABLES 2,085,128.97 44,745,900.71Forward currencytransactions
Others 2,085,128.97 44,745,900.71
FINANCIAL ACCOUNTS Short-term credit
Loans received
TOTAL LIABILITIES 3,960,570,682.29 7,030,347,629.03
(?) 0.en???(??) 1.en???

UCIT AMUNDI 3-6 M
Annual Report in 30/11/2020
35
Off-balance sheet on 11/30/2020 en EUR 11/30/2020 11/29/2019
HEDGES
Contracts in regulated markets or similar
OTC contracts
Interest rate swaps
OIS/0.0/FIX/-0.548 20,000,000.00
OIS/0.0/FIX/-0.651 5,000,000.00
OIS/0.0/FIX/-0.688 17,950,000.00 17,950,000.00
OIS/0.0/FIX/-0.613 20,300,000.00
OIS/0.0/FIX/-0.562 21,700,000.00 21,700,000.00
OIS/0.0/FIX/-0.528 15,820,000.00
OIS/0.0/FIX/-0.481 50,000,000.00
Other commitments
OTHER OPERATIONS
Contracts in regulated markets or similar
OTC contracts
Other commitments

UCIT AMUNDI 3-6 M
Annual Report in 30/11/2020
36
Income statement on 11/30/2020 in EUR 11/30/2020 11/29/2019
Revenues from financial operations
Revenues from deposits and financial accounts 6,230.91 18,267.01
Revenues from equities and similar securities
Revenues from bonds and similar securities 11,826,528.78 29,183,320.09
Revenues from credit instruments -61,233.49 419,772.44
Revenues from temporary acquisition and disposal of securities 306.48 355.15
Revenues from hedges 120,291.66 33,863.93
Other financial revenues
TOTAL (1) 11,892,124.34 29,655,578.62
Charges on financial operationsCharges on temporary acquisition and disposal of securities 976,677.60 3,520.61
Charges on hedges 7,482.23
Charges on financial debts 4,526,861.77 1,341,148.91
Other financial charges
TOTAL (2) 5,503,539.37 1,352,151.75
NET INCOME FROM FINANCIAL OPERATIONS (1 - 2) 6,388,584.97 28,303,426.87Other income (3)
Management fees and depreciation provisions (4) 5,134,181.65 5,912,492.44
NET INCOME OF THE BUSINESS YEAR (L.214-17-1) (1 - 2 + 3 - 4) 1,254,403.32 22,390,934.43Revenue adjustment (5) -742,775.65 -1,164,423.55
Interim Distribution on Net Income paid during the business year (6)
NET PROFIT (1 - 2 + 3 - 4 + 5 - 6) 511,627.67 21,226,510.88

UCIT AMUNDI 3-6 M
Annual Report in 30/11/2020
37
Notes to the annual accounts

UCIT AMUNDI 3-6 M
Annual Report in 30/11/2020
38
1. Accounting rules and methods Les comptes annuels sont présentés sous la forme prévue par le règlement ANC n° 2014-01, modifié.
Les principes généraux de la comptabilité s'appliquent :- image fidèle, comparabilité, continuité de l'activité,- régularité, sincérité,- prudence,- permanence des méthodes d'un exercice à l'autre.
Le mode de comptabilisation retenu pour l'enregistrement des produits des titres à revenu fixe est celui des intérêts courus.
Les entrées et les cessions de titres sont comptabilisées frais exclus.La devise de référence de la comptabilité du portefeuille est en euro.La durée de l'exercice est de 12 mois.
Information sur les incidences liées à la crise du COVID-19Les comptes ont été établis par la société de gestion sur la base des éléments disponibles dans un contexte évolutif de crise liée au Covid-19.
Règles d'évaluation des actifsLes instruments financiers sont enregistrés en comptabilité selon la méthode des coûts historiques et inscrits au bilan à leur valeur actuelle qui est déterminée par la dernière valeur de marché connue ou à défaut d'existence de marché par tous moyens externes ou par recours à des modèles financiers.Les différences entre les valeurs actuelles utilisées lors du calcul de la valeur liquidative et les coûts historiques des valeurs mobilières à leur entrée en portefeuille sont enregistrées dans des comptes « différences d'estimation ».Les valeurs qui ne sont pas dans la devise du portefeuille sont évaluées conformément au principe énoncé ci-dessous, puis converties dans la devise du portefeuille suivant le cours des devises au jour de l'évaluation.
Dépôts :Les dépôts d'une durée de vie résiduelle inférieure ou égale à 3 mois sont valorisés selon la méthode linéaire.
Actions, obligations et autres valeurs négociées sur un marché réglementé ou assimilé :Pour le calcul de la valeur liquidative, les actions et autres valeurs négociées sur un marché réglementé ou assimilé sont évaluées sur la base du dernier cours de bourse du jour.Les obligations et valeurs assimilées sont évaluées au cours de clôture communiqués par différents prestataires de services financiers. Les intérêts courus des obligations et valeurs assimilées sont calculés jusqu'à la date de la valeur liquidative.
Actions, obligations et autres valeurs non négociées sur un marché réglementé ou assimilé :Les valeurs non négociées sur un marché réglementé sont évaluées sous la responsabilité de la société de gestion en utilisant des méthodes fondées sur la valeur patrimoniale et le rendement, en prenant en considération les prix retenus lors de transactions significatives récentes.
Titres de créances négociables :Les actifs des fonds monétaires de la société de gestion Amundi sont valorisés quotidiennement. Ils sont valorisés chaque fois que possible selon la valorisation au prix de marché et quand cela ne l'est pas, à partir d'un spread de marché. Afin de valider la pertinence des prix retenus pour valoriser les actifs, une mesure régulière de l'écart entre les prix comptabilisés et les prix de cession traités est effectuée par le Département des Risques.
OPC détenus :

UCIT AMUNDI 3-6 M
Annual Report in 30/11/2020
39
Les parts ou actions d'OPC seront valorisées à la dernière valeur liquidative connue.
Opérations temporaires sur titres :Les titres reçus en pension sont inscrits à l'actif dans la rubrique « créances représentatives des titres reçus en pension » pour le montant prévu dans le contrat, majoré des intérêts courus à recevoir.
Les titres donnés en pension sont inscrits en portefeuille acheteur pour leur valeur actuelle. La dette représentative des titres donnés en pension est inscrite en portefeuille vendeur à la valeur fixée au contrat majorée des intérêts courus à payer.
Les titres prêtés sont valorisés à leur valeur actuelle et sont inscrits à l'actif dans la rubrique « créances représentatives de titres prêtés » à la valeur actuelle majorée des intérêts courus à recevoir.
Les titres empruntés sont inscrits à l'actif dans la rubrique « titres empruntés » pour le montant prévu dans le contrat, et au passif dans la rubrique « dettes représentatives de titres empruntés » pour le montant prévu dans le contrat majoré des intérêts courus à payer.
Instruments financiers à terme :
Instruments financiers à terme négociés sur un marché réglementé ou assimilé :Les instruments financiers à terme négociés sur les marchés réglementés sont valorisés au cours de compensation du jour.
Instruments financiers à terme non négociés sur un marché réglementé ou assimilé :
Les Swaps :
Les contrats d'échange de taux d'intérêt et/ou de devises sont valorisés à leur valeur de marché en fonction du prix calculé par actualisation des flux d'intérêts futurs aux taux d'intérêts et/ou de devises de marché. Ce prix est corrigé du risque de signature.
Les swaps d'indice sont évalués de façon actuarielle sur la base d'un taux de référence fourni par la contrepartie.
Les autres swaps sont évalués à leur valeur de marché ou à une valeur estimée selon les modalités arrêtées par la société de gestion.
Engagements Hors Bilan :
Les contrats à terme ferme sont portés pour leur valeur de marché en engagements hors bilan au cours utilisé dans le portefeuille.Les opérations à terme conditionnelles sont traduites en équivalent sous-jacent.Les engagements sur contrats d'échange sont présentés à leur valeur nominale, ou en l'absence de valeur nominale pour un montant équivalent.
Frais de gestionLes frais de gestion et de fonctionnement recouvrent l'ensemble des frais relatif à l'OPC : gestion financière, administrative, comptable, conservation, distribution, frais d'audit...Ces frais sont imputés au compte de résultat de l'OPC.Les frais de gestion n'incluent pas les frais de transaction. Pour plus de précision sur les frais effectivement facturés à l'OPC, se reporter au prospectus.
Ils sont enregistrés au prorata temporis à chaque calcul de valeur liquidative.
Le cumul de ces frais respecte le taux de frais maximum de l'actif net indiqué dans le prospectus ou le règlement du fonds :

UCIT AMUNDI 3-6 M
Annual Report in 30/11/2020
40
FR0013436011 - AMUNDI ULTRA SHORT TERM BOND SRI - PERI (C) : Taux de frais maximum de 0,45%
FR0013297496 - AMUNDI ULTRA SHORT TERM BOND SRI - R (C) : Taux de frais maximum de 0,45%FR0013224359 - AMUNDI ULTRA SHORT TERM BOND SRI - S (C) : Taux de frais maximum de 0,10%FR0013108941 - AMUNDI ULTRA SHORT TERM BOND SRI I-2 : Taux de frais maximum de 0,15%FR0011365212 - AMUNDI ULTRA SHORT TERM BOND SRI M E-C : Taux de frais maximum de 0,45%FR0011088657 - AMUNDI ULTRA SHORT TERM BOND SRI M I-C : Taux de frais maximum de 0,15% TTC@@@SUPERF-TXT
Affectation des sommes distribuables
Définition des sommes distribuablesLes sommes distribuables sont constituées par :
Le résultat :Le résultat net de l'exercice est égal au montant des intérêts, arrérages, primes et lots, dividendes, jetons de présence et tous autres produits relatifs aux titres constituant le portefeuille, majorés du produit des sommes momentanément disponibles et diminué du montant des frais de gestion et de la charge des emprunts.Il est augmenté du report à nouveau et majoré ou diminué du solde du compte de régularisation des revenus.
Les Plus et Moins-values :Les plus-values réalisées, nettes de frais, diminuées des moins-values réalisées, nettes de frais, constatées au cours de l’exercice, augmentées des plus-values nettes de même nature constatées au cours d’exercices antérieurs n’ayant pas fait l’objet d’une distribution ou d’une capitalisation et diminuées ou augmentées du solde du compte de régularisation des plus-values.
Modalités d'affectation des sommes distribuables :
Unit(s) Allocation of net income Allocation of net capital gains or losses realized
Units AMUNDI ULTRA SHORT TERM BOND SRI I-2 Capitalisation Capitalisation
Units AMUNDI ULTRA SHORT TERM BOND SRI M E-C Capitalisation Capitalisation
Units AMUNDI ULTRA SHORT TERM BOND SRI M I-C Capitalisation Capitalisation
Units AMUNDI ULTRA SHORT TERM BOND SRI - PERI (C) Capitalisation Capitalisation
Units AMUNDI ULTRA SHORT TERM BOND SRI - R (C) Capitalisation Capitalisation
Units AMUNDI ULTRA SHORT TERM BOND SRI - S (C) Capitalisation Capitalisation

UCIT AMUNDI 3-6 M
Annual Report in 30/11/2020
41
2. Changes in net asset on 11/30/2020 in EUR
11/30/2020 11/29/2019
NET ASSETS IN START OF PERIOD 6,985,598,855.66 5,112,130,615.77
Subscriptions (including subscription fees received by the fund) 8,668,674,533.83 9,397,621,599.53
Redemptions (net of redemption fees received by the fund) -11,672,359,721.16 -7,512,721,015.19
Capital gains realised on deposits and financial instruments 191,156.87 83,328.00
Capital losses realised on deposits and financial instruments -26,377,202.11 -35,290,241.37
Capital gains realised on hedges 231,657.66 2,248,045.59
Capital losses realised on hedges -33,000.00 -4,199,034.88
Dealing costs -674,700.69 -1,004,424.83
Exchange gains/losses -276,212.32 1,160,827.99
Changes in difference on estimation (deposits and financial instruments) 2,376,485.57 2,985,749.85
Difference on estimation, period N -5,622,997.48 -7,999,483.05
Difference on estimation, period N-1 7,999,483.05 10,985,232.90
Changes in difference on estimation (hedges) -120,703.31 192,470.77
Difference on estimation, period N 28,537.27 149,240.58
Difference on estimation, period N-1 -149,240.58 43,230.19
Net Capital gains and losses Accumulated from Previous business year
Distribution on Net Capital Gains and Losses from previous business year
Net profit for the period, before adjustment prepayments 1,254,403.32 22,390,934.43
Allocation Report of distributed items on Net Income
Interim Distribution on Net Income paid during the business year
Other items
NET ASSETS IN END OF PERIOD 3,958,485,553.32 6,985,598,855.66
UCIT AMUNDI 3-6 M
Annual Report in 30/11/2020
42
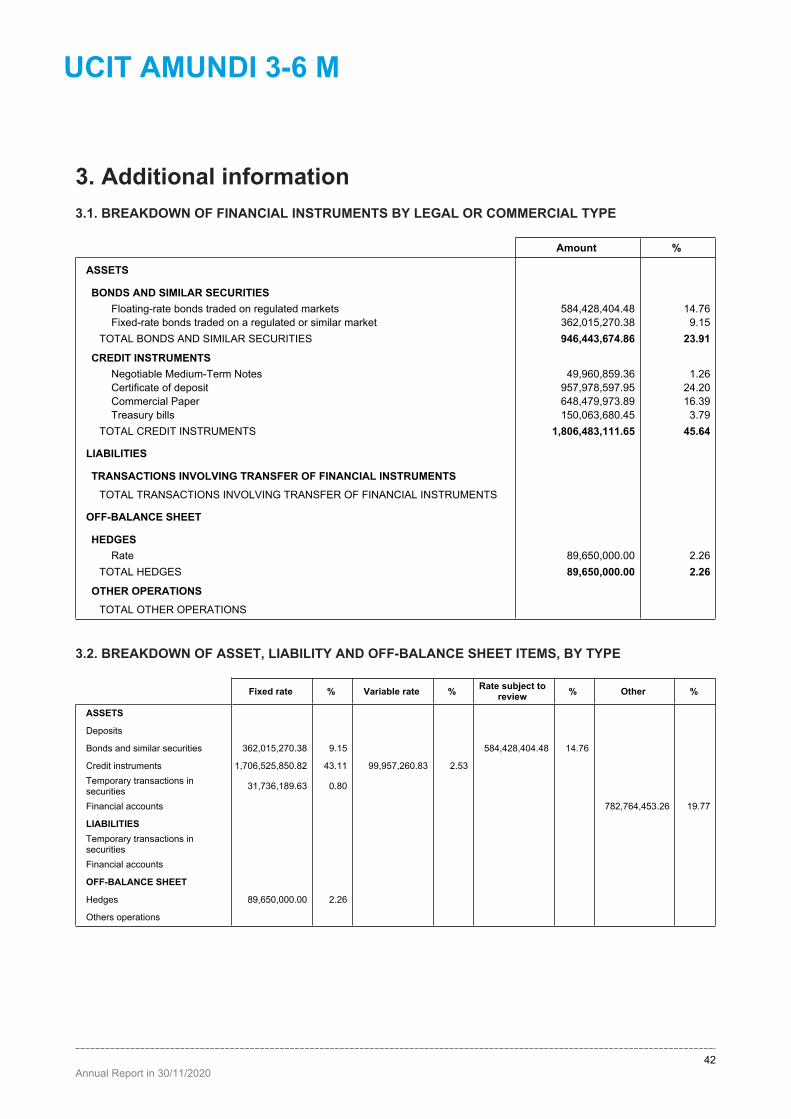
3. Additional information 3.1. BREAKDOWN OF FINANCIAL INSTRUMENTS BY LEGAL OR COMMERCIAL TYPE
Amount %
ASSETS
BONDS AND SIMILAR SECURITIESFloating-rate bonds traded on regulated markets 584,428,404.48 14.76Fixed-rate bonds traded on a regulated or similar market 362,015,270.38 9.15
TOTAL BONDS AND SIMILAR SECURITIES 946,443,674.86 23.91
CREDIT INSTRUMENTSNegotiable Medium-Term Notes 49,960,859.36 1.26Certificate of deposit 957,978,597.95 24.20Commercial Paper 648,479,973.89 16.39Treasury bills 150,063,680.45 3.79
TOTAL CREDIT INSTRUMENTS 1,806,483,111.65 45.64
LIABILITIES
TRANSACTIONS INVOLVING TRANSFER OF FINANCIAL INSTRUMENTSTOTAL TRANSACTIONS INVOLVING TRANSFER OF FINANCIAL INSTRUMENTS
OFF-BALANCE SHEET
HEDGESRate 89,650,000.00 2.26
TOTAL HEDGES 89,650,000.00 2.26
OTHER OPERATIONSTOTAL OTHER OPERATIONS
3.2. BREAKDOWN OF ASSET, LIABILITY AND OFF-BALANCE SHEET ITEMS, BY TYPE
Fixed rate % Variable rate % Rate subject to review % Other %
ASSETS
Deposits
Bonds and similar securities 362,015,270.38 9.15 584,428,404.48 14.76
Credit instruments 1,706,525,850.82 43.11 99,957,260.83 2.53 Temporary transactions in securities 31,736,189.63 0.80
Financial accounts 782,764,453.26 19.77
LIABILITIESTemporary transactions in securities
Financial accounts
OFF-BALANCE SHEET
Hedges 89,650,000.00 2.26
Others operations

UCIT AMUNDI 3-6 M
Annual Report in 30/11/2020
43
3.3.BREAKDOWN OF ASSET, LIABILITY AND OFF-BALANCE SHEET ITEMS, BY TIME TO MATURITY(?)
< 3 months % ]3 months - 1 year] % ]1- 3 years] % ]3 - 5 years] % > 5 years %
ASSETS
Deposits Bonds and similar securities 255,364,638.66 6.45 630,798,713.24 15.94 60,280,322.96 1.52
Credit instruments 1,151,050,040.74 29.08 655,433,070.91 16.56
Temporary transactions in securities
31,736,189.63 0.80
Financial accounts 782,764,453.26 19.77
LIABILITIESTemporary transactions in securities
Financial accounts
OFF-BALANCE SHEETHedges 71,700,000.00 1.81 17,950,000.00 0.45
Others operations (?) 2.en???
3.4. BREAKDOWN OF ASSET, LIABILITY AND OFF-BALANCE SHEET ITEMS, BY LISTING OR EVALUATION CURRENCY (HORS EUR)
Currency1JPY
Currency 2SEK
Currency 3USD
Currency NOther currencies
Amount % Amount % Amount % Amount %
ASSETS
Deposits
Equities and similar securities
Bonds and similar securities
Credit instruments
Mutual fund
Temporary transactions in securities
Receivables
Financial accounts 97,679.76 52,007.02 28,119.62 16,090.93
LIABILITIESTransactions involving transfer of financial instruments
emporary transactions in securities
Debts 8,981.63
Financial accounts
OFF-BALANCE SHEET
Hedges
Other operations

UCIT AMUNDI 3-6 M
Annual Report in 30/11/2020
44
3.5. RECEIVABLES AND PAYABLES: BREAKDOWN BY ITEMS
Type of debit/credit 11/30/2020
RECEIVABLESSales deferred settlement 6,927,815.44
Collateral 300,455.77
TOTAL RECEIVABLES 7,228,271.21PAYABLES
Fixed management fees 805,427.70
Variable management fees 998,434.88
Collateral 22.06
Other payables 281,244.33
TOTAL PAYABLES 2,085,128.97TOTAL PAYABLES AND RECEIVABLES 5,143,142.24
3.6.SHAREHOLDERS' FUNDS
3.6.1.Number of units issued or redeemed
In units In value
Unit AMUNDI ULTRA SHORT TERM BOND SRI I-2
Units subscribed during the period 175,647.000 1,749,855,682.35
Units redeemed during the period -279,374.904 -2,782,572,642.85
Net Subscriptions/Redemptions -103,727.904 -1,032,716,960.50
Units in circulation at the end of the period 62,310.859
Unit AMUNDI ULTRA SHORT TERM BOND SRI M E-C
Units subscribed during the period 2,271.610 22,588,524.87
Units redeemed during the period -2,618.959 -26,038,526.56
Net Subscriptions/Redemptions -347.349 -3,450,001.69
Units in circulation at the end of the period 1,333.150
Unit AMUNDI ULTRA SHORT TERM BOND SRI M I-C
Units subscribed during the period 66,917.354 6,800,074,864.19
Units redeemed during the period -80,660.654 -8,195,566,408.75
Net Subscriptions/Redemptions -13,743.300 -1,395,491,544.56
Units in circulation at the end of the period 30,065.631
Unit AMUNDI ULTRA SHORT TERM BOND SRI - PERI (C)
Units subscribed during the period 538.317 53,570.49
Units redeemed during the period -0.013 -1.29
Net Subscriptions/Redemptions 538.304 53,569.20
Units in circulation at the end of the period 615.667

UCIT AMUNDI 3-6 M
Annual Report in 30/11/2020
45
3.6.1.Number of units issued or redeemed
In units In value
Unit AMUNDI ULTRA SHORT TERM BOND SRI - R (C)
Units subscribed during the period 707.712 700,267.30
Units redeemed during the period -586.648 -580,125.42
Net Subscriptions/Redemptions 121.064 120,141.88
Units in circulation at the end of the period 178.585
Unit AMUNDI ULTRA SHORT TERM BOND SRI - S (C)
Units subscribed during the period 96,395.574 95,401,624.63
Units redeemed during the period -674,291.906 -667,602,016.29
Net Subscriptions/Redemptions -577,896.332 -572,200,391.66
Units in circulation at the end of the period 277,020.108

UCIT AMUNDI 3-6 M
Annual Report in 30/11/2020
46
3.6.2.Subscription and/or redemption fees
In Value
Unit AMUNDI ULTRA SHORT TERM BOND SRI I-2Total acquired subscription and/or redemption fees
Acquired subscription fees
Acquired redemption fees
Unit AMUNDI ULTRA SHORT TERM BOND SRI M E-CTotal acquired subscription and/or redemption fees
Acquired subscription fees
Acquired redemption fees
Unit AMUNDI ULTRA SHORT TERM BOND SRI M I-CTotal acquired subscription and/or redemption fees
Acquired subscription fees
Acquired redemption fees
Unit AMUNDI ULTRA SHORT TERM BOND SRI - PERI (C)Total acquired subscription and/or redemption fees
Acquired subscription fees
Acquired redemption fees
Unit AMUNDI ULTRA SHORT TERM BOND SRI - R (C)Total acquired subscription and/or redemption fees
Acquired subscription fees
Acquired redemption fees
Unit AMUNDI ULTRA SHORT TERM BOND SRI - S (C)Total acquired subscription and/or redemption fees
Acquired subscription fees
Acquired redemption fees

UCIT AMUNDI 3-6 M
Annual Report in 30/11/2020
47
3.7. MANAGEMENT FEES
11/30/2020
Units AMUNDI ULTRA SHORT TERM BOND SRI I-2
Guarantee commission
Fixed management fees 884,835.31
Percentage set for fixed management fees 0.06
Variable management fees 148,445.02
Trailer fees
Units AMUNDI ULTRA SHORT TERM BOND SRI M E-C
Guarantee commission
Fixed management fees 30,961.31
Percentage set for fixed management fees 0.17
Variable management fees
Trailer fees
Units AMUNDI ULTRA SHORT TERM BOND SRI M I-C
Guarantee commission
Fixed management fees 2,846,845.63
Percentage set for fixed management fees 0.07
Variable management fees 722,959.59
Trailer fees
Units AMUNDI ULTRA SHORT TERM BOND SRI - PERI (C)
Guarantee commission
Fixed management fees 31.51
Percentage set for fixed management fees 0.18
Variable management fees 1.05
Trailer fees
Units AMUNDI ULTRA SHORT TERM BOND SRI - R (C)
Guarantee commission
Fixed management fees 286.72
Percentage set for fixed management fees 0.17
Variable management fees 0.73
Trailer fees
Units AMUNDI ULTRA SHORT TERM BOND SRI - S (C)
Guarantee commission
Fixed management fees 463,865.24
Percentage set for fixed management fees 0.09
Variable management fees 35,949.54
Trailer fees

UCIT AMUNDI 3-6 M
Annual Report in 30/11/2020
48
3.8. COMMITMENTS RECEIVED AND GIVEN
11/30/2020
Guarantees received by the fund
- including capital guarantees
Other commitments received
Other commitments given

UCIT AMUNDI 3-6 M
Annual Report in 30/11/2020
49
3.9.FUTHER DETAILS
3.9.1 Stock market values of temporarily acquired securities
11/30/2020
Securities held under sell-back deals 31,998,990.96
Borrowed securities
3.9.2. Stock market values of pledged securities
11/30/2020
Financial instruments pledged but not reclassified
Financial instruments received as pledges but not recognized in the Balance Sheet
3.9.3.Financial instruments held, issued and/or administrated by the GROUPE
ISIN code Name of security 11/30/2020
Equities
Bonds
Notes (TCN)
UCITS 385,848,427.76
FR0013016607 AMUNDI 3 M I2 180,142,345.50
FR0013095312 AMUNDI CASH CORPORATE I2 173,199,225.99
FR0010979278 CPR MONETAIRE ESG I 32,506,856.27
Hedges
Total group financial instruments 385,848,427.76

UCIT AMUNDI 3-6 M
Annual Report in 30/11/2020
50
3.10. TABLE OF ALLOCATION OF THE DISTRIBUTABLE SUMS
Table of allocation of the distributable share of the sums concerned to profit (loss)
11/30/2020 11/29/2019
Sums not yet allocated
Brought forward Profit (loss) 511,627.67 21,226,510.88
Total 511,627.67 21,226,510.88
11/30/2020 11/29/2019
Units AMUNDI ULTRA SHORT TERM BOND SRI I-2
AllocationDistribution Brought forward Capitalized 124,142.02 2,289,587.60Total 124,142.02 2,289,587.60
11/30/2020 11/29/2019
Units AMUNDI ULTRA SHORT TERM BOND SRI M E-C
AllocationDistribution Brought forward Capitalized -10,228.14 41,732.32Total -10,228.14 41,732.32
11/30/2020 11/29/2019
Units AMUNDI ULTRA SHORT TERM BOND SRI M I-C
AllocationDistribution Brought forward Capitalized 420,204.70 16,078,625.39Total 420,204.70 16,078,625.39

UCIT AMUNDI 3-6 M
Annual Report in 30/11/2020
51
11/30/2020 11/29/2019
Units AMUNDI ULTRA SHORT TERM BOND SRI - PERI (C)
AllocationDistribution Brought forward Capitalized -45.51 3.03Total -45.51 3.03
11/30/2020 11/29/2019
Units AMUNDI ULTRA SHORT TERM BOND SRI - R (C)
AllocationDistribution Brought forward Capitalized -147.77 56.57Total -147.77 56.57
11/30/2020 11/29/2019
Units AMUNDI ULTRA SHORT TERM BOND SRI - S (C)
AllocationDistribution Brought forward Capitalized -22,297.63 2,816,505.97Total -22,297.63 2,816,505.97

UCIT AMUNDI 3-6 M
Annual Report in 30/11/2020
52
Table of allocation of the distributable share of the sums concerned to capital gains and losses
11/30/2020 11/29/2019
Sums not yet allocated
Net Capital gains and losses Accumulated from Previous business year
Net Capital gains and losses of the business year -17,137,306.14 -34,750,314.97Allocation Report of distributed items on Net Capital Gains and Losses
Total -17,137,306.14 -34,750,314.97
11/30/2020 11/29/2019
Units AMUNDI ULTRA SHORT TERM BOND SRI I-2
Allocation
Distribution Net capital gains and losses accumulated per share Capitalized -2,685,229.26 -4,497,246.17Total -2,685,229.26 -4,497,246.17
11/30/2020 11/29/2019
Units AMUNDI ULTRA SHORT TERM BOND SRI M E-C
Allocation
Distribution Net capital gains and losses accumulated per share Capitalized -57,318.65 -95,208.38Total -57,318.65 -95,208.38
11/30/2020 11/29/2019
Units AMUNDI ULTRA SHORT TERM BOND SRI M I-C
Allocation
Distribution Net capital gains and losses accumulated per share Capitalized -13,206,924.78 -25,334,559.08Total -13,206,924.78 -25,334,559.08
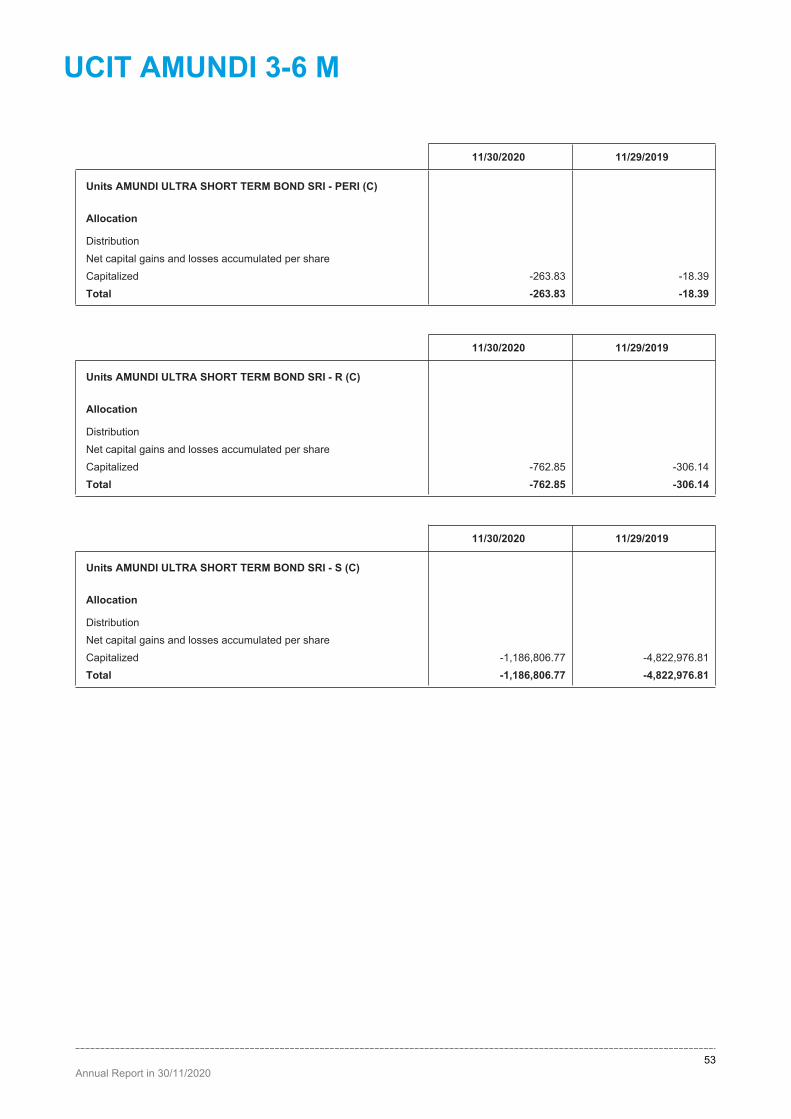
UCIT AMUNDI 3-6 M
Annual Report in 30/11/2020
53
11/30/2020 11/29/2019
Units AMUNDI ULTRA SHORT TERM BOND SRI - PERI (C)
Allocation
Distribution Net capital gains and losses accumulated per share Capitalized -263.83 -18.39Total -263.83 -18.39
11/30/2020 11/29/2019
Units AMUNDI ULTRA SHORT TERM BOND SRI - R (C)
Allocation
Distribution Net capital gains and losses accumulated per share Capitalized -762.85 -306.14Total -762.85 -306.14
11/30/2020 11/29/2019
Units AMUNDI ULTRA SHORT TERM BOND SRI - S (C)
Allocation
Distribution Net capital gains and losses accumulated per share Capitalized -1,186,806.77 -4,822,976.81Total -1,186,806.77 -4,822,976.81
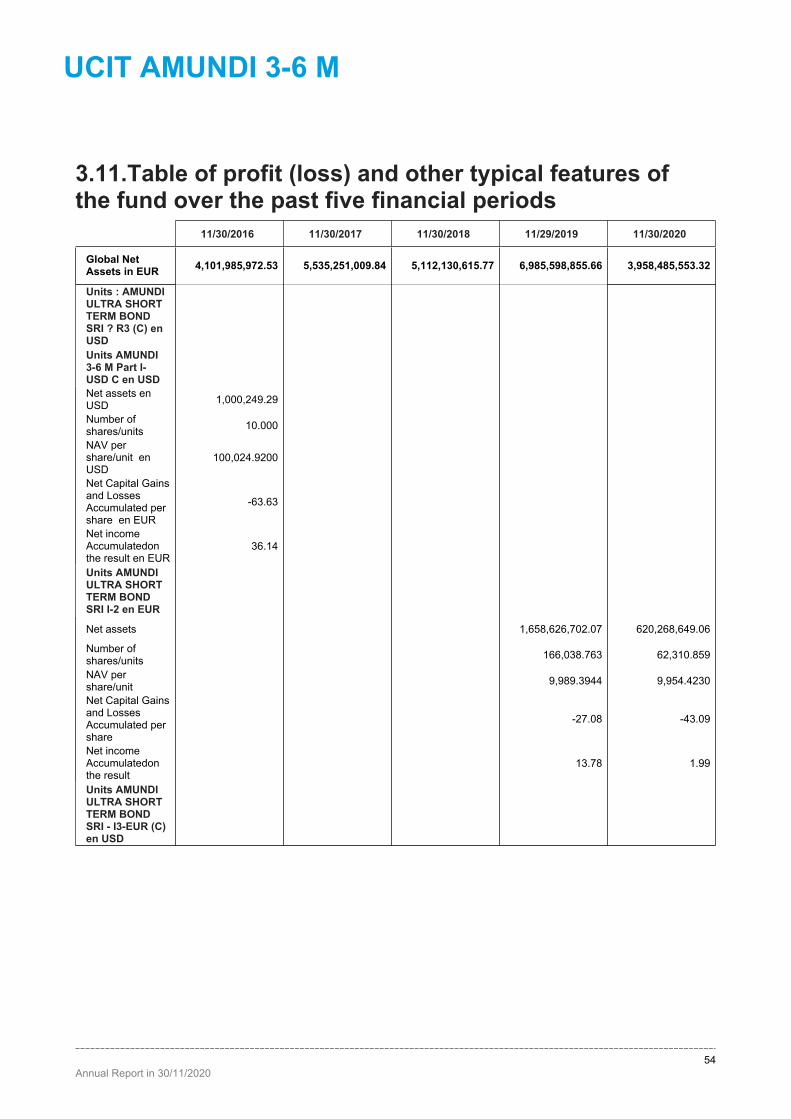
UCIT AMUNDI 3-6 M
Annual Report in 30/11/2020
54
3.11.Table of profit (loss) and other typical features of the fund over the past five financial periods
11/30/2016 11/30/2017 11/30/2018 11/29/2019 11/30/2020
Global Net Assets in EUR 4,101,985,972.53 5,535,251,009.84 5,112,130,615.77 6,985,598,855.66 3,958,485,553.32
Units : AMUNDI ULTRA SHORT TERM BOND SRI ? R3 (C) en USD Units AMUNDI 3-6 M Part I-USD C en USD Net assets en USD 1,000,249.29
Number of shares/units 10.000
NAV per share/unit en USD
100,024.9200
Net Capital Gains and Losses Accumulated per share en EUR
-63.63
Net income Accumulatedon the result en EUR
36.14
Units AMUNDI ULTRA SHORT TERM BOND SRI I-2 en EUR
Net assets 1,658,626,702.07 620,268,649.06
Number of shares/units 166,038.763 62,310.859
NAV per share/unit 9,989.3944 9,954.4230
Net Capital Gains and Losses Accumulated per share
-27.08 -43.09
Net income Accumulatedon the result
13.78 1.99
Units AMUNDI ULTRA SHORT TERM BOND SRI - I3-EUR (C) en USD

UCIT AMUNDI 3-6 M
Annual Report in 30/11/2020
55
3.11.Table of profit (loss) and other typical features of the fund over the past five financial periods
11/30/2016 11/30/2017 11/30/2018 11/29/2019 11/30/2020
Units AMUNDI ULTRA SHORT TERM BOND SRI M E-C en EUR
Net assets 52,790,500.06 37,990,831.49 24,686,260.14 16,756,938.54 13,233,981.36
Number of shares/units 5,244.174 3,782.505 2,468.756 1,680.499 1,333.150
NAV per share/unit 10,066.5042 10,043.8284 9,999.4734 9,971.4064 9,926.8509
Net Capital Gains and Losses Accumulated per share
-69.79 -79.05 -54.14 -56.65 -42.99
Net income Accumulatedon the result
103.96 44.88 8.57 24.83 -7.67
Units AMUNDI ULTRA SHORT TERM BOND SRI M I-C en EUR
Net assets 4,048,252,552.70 4,883,312,865.15 4,585,109,716.75 4,461,005,602.50 3,050,635,336.82
Number of shares/units 39,519.294 47,728.221 44,951.355 43,808.931 30,065.631
NAV per share/unit 102,437.3702 102,314.9986 102,001.5907 101,828.6796 101,465.8676
Net Capital Gains and Losses Accumulated per share
-709.93 -804.78 -551.82 -578.29 -439.26
Net income Accumulatedon the result
1,169.62 565.37 226.19 367.01 13.97
Units AMUNDI ULTRA SHORT TERM BOND SRI - P (C) en USD Units AMUNDI ULTRA SHORT TERM BOND SRI - PERI (C) en EUR
Net assets 7,727.88 61,225.17
Number of shares/units 77.363 615.667
NAV per share/unit 99.8911 99.4452
Net Capital Gains and Losses Accumulated per share
-0.23 -0.42
Net income Accumulatedon the result
0.03 -0.07
Units AMUNDI ULTRA SHORT TERM BOND SRI - PM (C) en USD

UCIT AMUNDI 3-6 M
Annual Report in 30/11/2020
56
3.11.Table of profit (loss) and other typical features of the fund over the past five financial periods
11/30/2016 11/30/2017 11/30/2018 11/29/2019 11/30/2020
Units AMUNDI ULTRA SHORT TERM BOND SRI - R (C) en EUR
Net assets 999.96 994.19 56,965.10 176,058.42
Number of shares/units 1.000 1.000 57.521 178.585
NAV per share/unit 999.9600 994.1900 990.3357 985.8522
Net Capital Gains and Losses Accumulated per share
0.07 -5.19 -5.32 -4.27
Net income Accumulatedon the result
0.07 -0.82 0.98 -0.82
Units AMUNDI ULTRA SHORT TERM BOND SRI - R1 (C) en USD Units AMUNDI ULTRA SHORT TERM BOND SRI - R2 (C) en USD Units AMUNDI ULTRA SHORT TERM BOND SRI - S (C) en EUR
Net assets 613,946,313.24 502,333,644.69 849,144,919.57 274,110,302.49
Number of shares/units 614,749.159 504,727.975 854,916.440 277,020.108
NAV per share/unit 998.6940 995.2561 993.2490 989.4960
Net Capital Gains and Losses Accumulated per share
-6.83 -5.38 -5.64 -4.28
Net income Accumulatedon the result
4.05 1.82 3.29 -0.08
Units AMUNDI ULTRA SHORT TERM BOND SRI - U (C) en USD
null

UCIT AMUNDI 3-6 M
Annual Report in 30/11/2020
57
3.12. Portfolio listing of financial instruments in EUR Name of security Curren
cy Quantity Market value % Net Assets
Bonds and similar securitiesListed bonds and similar securitiesFRANCE
ALD E3R+0.34% 26-02-21 EMTN EUR 37,600,000 37,625,111.16 0.95BPCE 2.125% 17/03/21 EMTN EUR 4,400,000 4,499,887.73 0.12COMPAGNIE DE SAINT GOBAIN E3R+0.35% 22-03-21 EUR 30,000,000 30,014,850.00 0.75ENGIE6.375% 18/01/21 EMTN EUR 1,300,000 1,383,168.71 0.04FRANCE TELECOM 3.875% 2021 EMTN EUR 3,500,000 3,636,447.59 0.09SG E3R+0.65% 06-09-21 EMTN EUR 20,000,000 20,101,713.13 0.51UNIBAIL RODAMCO SE E3R+0.33% 21-06-21 EUR 55,000,000 54,973,875.00 1.38VEOLIA ENV 4.247% 06/01/21 EMTN EUR 1,600,000 1,668,238.22 0.04VILOGIA STE ANONYME D HLM E3R+0.6% 08-10-21 EUR 6,000,000 5,992,150.56 0.16
TOTAL FRANCE 159,895,442.10 4.04GERMANY
BERTELSMANN 0.25% 26-05-21 EUR 18,000,000 18,069,010.58 0.45CONTINENTAL E3R+0.5% 11-04-21 EUR 26,900,000 26,898,251.50 0.68DAIGR 0 7/8 01/12/21 EUR 21,720,000 21,918,567.16 0.55DAIMLER 2% 25/06/2021 EUR 8,000,000 8,178,387.15 0.21DEUTSCHE WOHNEN AG 0.0% 26-01-21 EUR 15,000,000 15,004,230.90 0.38VOLKSWAGEN BANK E3R+0.42% 15-06-21 EUR 21,300,000 21,330,740.16 0.54VOLKSWAGEN BANK E3R+0.7% 08-12-21 EUR 10,000,000 10,037,472.96 0.26VOLKSWAGEN FINANCIAL SERVICES AG 0.16% 16-09-21 EUR 42,000,000 42,182,504.16 1.06VOLKSWAGEN FINANCIAL SERVICES AG E3R+0.8% 15-02-21 EUR 21,500,000 21,530,714.92 0.55VOLKSWAGEN LEASING 0.25% 16-02-21 EUR 1,650,000 1,655,306.59 0.04VOLKSWAGEN LEASING E3R+0.45% 02-08-21 EUR 1,800,000 1,802,843.68 0.04VOLKSWAGEN LEASING E3R+0.45% 06-07-21 EUR 43,600,000 43,653,410.00 1.10VW 0 3/8 04/12/21 EUR 6,500,000 6,531,760.83 0.17
TOTAL GERMANY 238,793,200.59 6.03IRELAND
INTESA BANK IRELAND E3R+0.55% 26-03-21 EUR 50,000,000 50,087,629.50 1.27TOTAL IRELAND 50,087,629.50 1.27
ITALYISPIM 0 02/28/21 EUR 38,840,000 38,924,297.74 0.98ITALY BUONI POLIENNALI DEL TESORO 0.05% 15-04-21 EUR 50,000,000 50,104,409.34 1.26MEDI CRE 1.625% 19-01-21 EMTN EUR 3,715,000 3,777,243.58 0.10UNICREDIT SPA 3.25% 01/21 EUR 42,315,000 43,705,899.06 1.11
TOTAL ITALY 136,511,849.72 3.45JAPAN
ASAHI BREWERIES 0.321% 19-09-21 EUR 7,300,000 7,338,606.16 0.19TOTAL JAPAN 7,338,606.16 0.19
LUXEMBOURGINTE BANK LUXEMBOURG E3R+0.75% 26-09-21 EUR 60,000,000 60,198,285.00 1.52
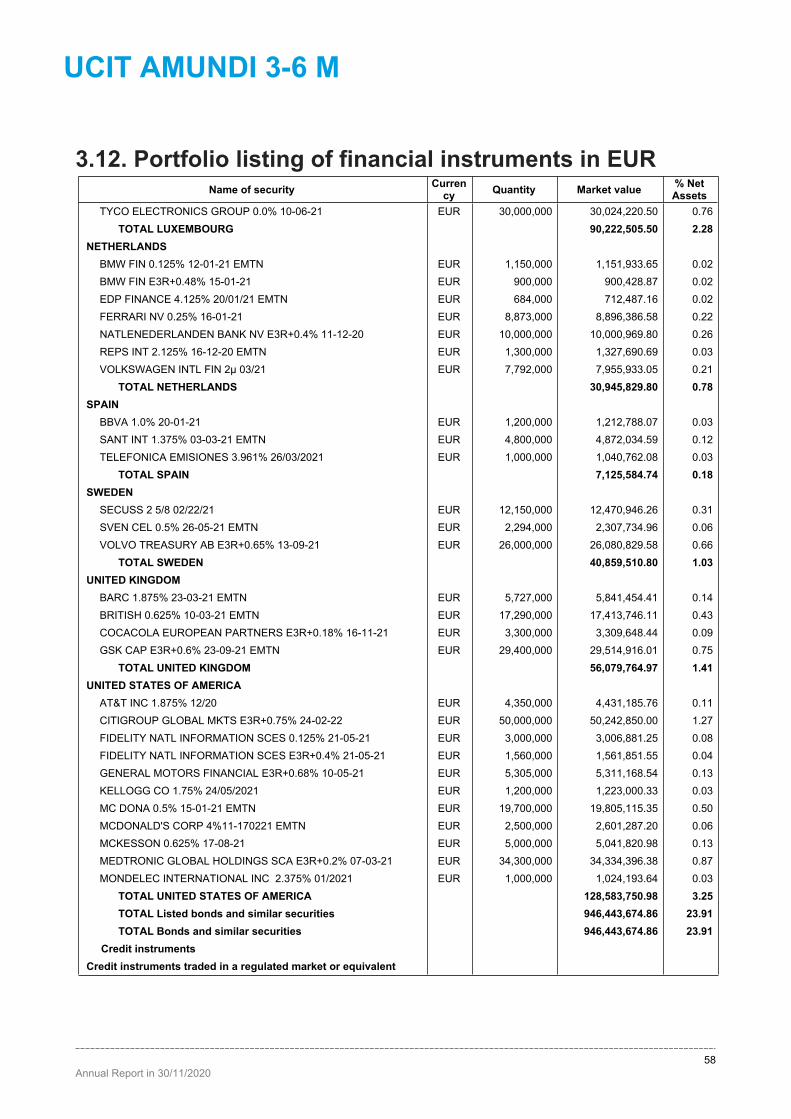
UCIT AMUNDI 3-6 M
Annual Report in 30/11/2020
58
3.12. Portfolio listing of financial instruments in EUR Name of security Curren
cy Quantity Market value % Net Assets
TYCO ELECTRONICS GROUP 0.0% 10-06-21 EUR 30,000,000 30,024,220.50 0.76TOTAL LUXEMBOURG 90,222,505.50 2.28
NETHERLANDSBMW FIN 0.125% 12-01-21 EMTN EUR 1,150,000 1,151,933.65 0.02BMW FIN E3R+0.48% 15-01-21 EUR 900,000 900,428.87 0.02EDP FINANCE 4.125% 20/01/21 EMTN EUR 684,000 712,487.16 0.02FERRARI NV 0.25% 16-01-21 EUR 8,873,000 8,896,386.58 0.22NATLENEDERLANDEN BANK NV E3R+0.4% 11-12-20 EUR 10,000,000 10,000,969.80 0.26REPS INT 2.125% 16-12-20 EMTN EUR 1,300,000 1,327,690.69 0.03VOLKSWAGEN INTL FIN 2µ 03/21 EUR 7,792,000 7,955,933.05 0.21
TOTAL NETHERLANDS 30,945,829.80 0.78SPAIN
BBVA 1.0% 20-01-21 EUR 1,200,000 1,212,788.07 0.03SANT INT 1.375% 03-03-21 EMTN EUR 4,800,000 4,872,034.59 0.12TELEFONICA EMISIONES 3.961% 26/03/2021 EUR 1,000,000 1,040,762.08 0.03
TOTAL SPAIN 7,125,584.74 0.18SWEDEN
SECUSS 2 5/8 02/22/21 EUR 12,150,000 12,470,946.26 0.31SVEN CEL 0.5% 26-05-21 EMTN EUR 2,294,000 2,307,734.96 0.06VOLVO TREASURY AB E3R+0.65% 13-09-21 EUR 26,000,000 26,080,829.58 0.66
TOTAL SWEDEN 40,859,510.80 1.03UNITED KINGDOM
BARC 1.875% 23-03-21 EMTN EUR 5,727,000 5,841,454.41 0.14BRITISH 0.625% 10-03-21 EMTN EUR 17,290,000 17,413,746.11 0.43COCACOLA EUROPEAN PARTNERS E3R+0.18% 16-11-21 EUR 3,300,000 3,309,648.44 0.09GSK CAP E3R+0.6% 23-09-21 EMTN EUR 29,400,000 29,514,916.01 0.75
TOTAL UNITED KINGDOM 56,079,764.97 1.41UNITED STATES OF AMERICA
AT&T INC 1.875% 12/20 EUR 4,350,000 4,431,185.76 0.11CITIGROUP GLOBAL MKTS E3R+0.75% 24-02-22 EUR 50,000,000 50,242,850.00 1.27FIDELITY NATL INFORMATION SCES 0.125% 21-05-21 EUR 3,000,000 3,006,881.25 0.08FIDELITY NATL INFORMATION SCES E3R+0.4% 21-05-21 EUR 1,560,000 1,561,851.55 0.04GENERAL MOTORS FINANCIAL E3R+0.68% 10-05-21 EUR 5,305,000 5,311,168.54 0.13KELLOGG CO 1.75% 24/05/2021 EUR 1,200,000 1,223,000.33 0.03MC DONA 0.5% 15-01-21 EMTN EUR 19,700,000 19,805,115.35 0.50MCDONALD'S CORP 4%11-170221 EMTN EUR 2,500,000 2,601,287.20 0.06MCKESSON 0.625% 17-08-21 EUR 5,000,000 5,041,820.98 0.13MEDTRONIC GLOBAL HOLDINGS SCA E3R+0.2% 07-03-21 EUR 34,300,000 34,334,396.38 0.87MONDELEC INTERNATIONAL INC 2.375% 01/2021 EUR 1,000,000 1,024,193.64 0.03
TOTAL UNITED STATES OF AMERICA 128,583,750.98 3.25TOTAL Listed bonds and similar securities 946,443,674.86 23.91TOTAL Bonds and similar securities 946,443,674.86 23.91
Credit instrumentsCredit instruments traded in a regulated market or equivalent

UCIT AMUNDI 3-6 M
Annual Report in 30/11/2020
59
3.12. Portfolio listing of financial instruments in EUR Name of security Curren
cy Quantity Market value % Net Assets
BELGIUMAB INBEV NVSA ZCP 11-01-21 EUR 45,000,000 45,018,446.17 1.14BELFIUS BANK 060921 FIX -0.46 EUR 30,000,000 30,122,188.77 0.77INBEV BELGIUM NV ZCP 11-12-20 EUR 20,000,000 20,002,204.49 0.50
TOTAL BELGIUM 95,142,839.43 2.41FRANCE
AXA BANQUE 17/12/20 ZAXAP EUR F -0.255 EUR 20,000,000 20,005,642.84 0.51BANQUE PSA FINANCE 230721 FIX 1.0E-8 EUR 30,000,000 30,000,224.88 0.76BFCM (BANQUE FED 071220 FIX -0.18 EUR 50,000,000 50,005,716.64 1.27BFCM (BANQUE FEDE 020821 FIX -0.405 EUR 60,000,000 60,195,576.00 1.52BFCM (BANQUE FEDE 041220 FIX -0.265 EUR 30,000,000 30,001,969.33 0.75COFACE 150221 FIX -0.265 EUR 4,500,000 4,502,653.67 0.11CREDIT INDUSTRIEL ET COMMERCIAL 010721 F EUR 60,000,000 60,174,792.02 1.52CREDIT INDUSTRIEL ET COMMERCIAL 020721 OIS 0.2 EUR 50,000,000 49,996,401.47 1.27CREDIT MUTUEL ARKEA 021220 FIX -0.145 EUR 25,000,000 25,000,719.15 0.63CREDIT MUTUEL ARKEA 210121 FIX -0.255 EUR 50,000,000 50,037,123.14 1.27GROUPE EIFFAGE 130121 FIX -0.21 EUR 17,000,000 17,009,645.19 0.43HAVAS SA 161220 FIX -0.025 EUR 10,000,000 10,000,555.21 0.25HAVAS SA 171220 FIX -0.02 EUR 5,000,000 5,000,296.22 0.13HAVAS SA 311220 FIX -0.005 EUR 15,000,000 15,001,389.46 0.38ILIAD SA 290121 FIX -0.155 EUR 24,000,000 24,015,582.47 0.60INGENICO GROUP SA 220121 FIX -0.385 EUR 15,000,000 15,006,357.66 0.38NATIXIS 021220 FIX -0.18 EUR 30,000,000 30,001,020.30 0.76NEXITY 071220 FIX 0.05 EUR 6,000,000 6,000,575.57 0.16NORD EST 301220 FIX -0.16 EUR 20,000,000 20,008,043.40 0.50SAFRAN SA 290321 FIX 0.09 EUR 28,000,000 28,001,417.10 0.71SCHNEIDER ELECTRIC SE 100221 FIX -0.395 EUR 20,000,000 20,017,885.29 0.50SOCIETE GENERALE SA 021220 FIX -0.18 EUR 30,000,000 30,000,978.61 0.76SOCIETE GENERALE SA 210621 OIS 0.29 EUR 50,000,000 49,960,859.36 1.26SYND TRAN ILE DE F ZCP 08-04-21 EUR 10,000,000 10,013,052.02 0.25UBISOFT ENTERTAINMENT SA 120421 FIX -0.18 EUR 6,000,000 6,004,377.88 0.16UNIFERGIE UNION 220121 FIX -0.24 EUR 45,000,000 45,035,846.74 1.13VEOLIA ENVIRONNEMENT SA 010721 FIX -0.44 EUR 28,000,000 28,076,076.78 0.70
TOTAL FRANCE 739,074,778.40 18.67GERMANY
VOLKSWAGEN LEASING GMBH 070621 FIX 0.07 EUR 50,000,000 50,006,898.18 1.26TOTAL GERMANY 50,006,898.18 1.26
IRELANDINTESA SANPAOLO BANK IRELAND PLC 090221 FIX -0.18 EUR 65,000,000 65,069,282.19 1.65
TOTAL IRELAND 65,069,282.19 1.65ITALY
ITAL BUON ORDI DEL ZCP 26-02-21 EUR 30,000,000 30,038,255.39 0.76ITAL BUON ORDI DEL ZCP 31-12-20 EUR 50,000,000 50,021,924.89 1.26SNAM ZCP 11-03-21 EUR 39,000,000 39,047,317.68 0.98

UCIT AMUNDI 3-6 M
Annual Report in 30/11/2020
60
3.12. Portfolio listing of financial instruments in EUR Name of security Curren
cy Quantity Market value % Net Assets
SNAM ZCP 25-03-21 EUR 17,000,000 17,005,589.88 0.43UNICREDIT SPA 150121 FIX -0.23 EUR 60,000,000 60,035,974.04 1.52
TOTAL ITALY 196,149,061.88 4.95LUXEMBOURG
DH EUROPE FINANCE II SARL 270121 FIX -0. EUR 45,000,000 45,009,959.87 1.13INDUSTRIAL AND C 290321 FIX -0.23 EUR 30,000,000 30,035,220.68 0.76
TOTAL LUXEMBOURG 75,045,180.55 1.89NETHERLANDS
AMERICA MOVIL BV 081220 FIX -0.27 EUR 12,500,000 12,500,872.18 0.31AMERICA MOVIL BV 091220 FIX -0.26 EUR 1,500,000 1,500,114.77 0.04AMERICA MOVIL BV 220321 FIX -0.25 EUR 34,500,000 34,530,160.18 0.87AMERICA MOVIL BV ZCP 16-09-21 EUR 30,000,000 30,073,123.95 0.76COCA COLA HELLENIC BOTTLING CO SA 150421 EUR 7,000,000 7,003,477.77 0.18ENEL FINA INTL NV ZCP 18-12-20 EUR 19,000,000 19,003,011.99 0.48ENEL FINANCE INTERNATIONAL NV 181220 FIX EUR 6,000,000 6,000,980.35 0.15GRANDVISION FINANCE BV 260121 FIX -0.355 EUR 5,000,000 5,002,093.62 0.13IBERDROLA INTERNATIONAL BV 080321 FIX -0.465 EUR 30,000,000 30,039,931.73 0.76INTERNATIONAL ENDESA BV 040121 FIX -0.35 EUR 20,000,000 20,007,906.02 0.51REPSOL INTERNATIONAL FINANCE BV 120221 F EUR 47,000,000 47,051,313.65 1.19TELEFONICA EUROPE BV 110121 FIX -0.185 EUR 50,000,000 50,020,314.76 1.26
TOTAL NETHERLANDS 262,733,300.97 6.64SPAIN
BANCO SANTANDER S.A 180621 FIX -0.155 EUR 40,000,000 40,111,240.11 1.01BANCO SANTANDER S.A 200121 FIX -0.39 EUR 8,500,000 8,506,253.02 0.22CAIXABANK SA 080121 FIX -0.24 EUR 20,000,000 20,010,907.07 0.51CAIXABANK SA 100321 FIX -0.46 EUR 25,000,000 25,035,144.47 0.63ENDE ZCP 07-01-21 EUR 15,000,000 15,006,269.89 0.38SANTANDER CONSUMER FINANCE S.A 110121 FIX -0.19 EUR 40,000,000 40,025,752.38 1.01SPAI LETR DEL TESO ZCP 04-12-20 EUR 70,000,000 70,003,500.17 1.76
TOTAL SPAIN 218,699,067.11 5.52UNITED KINGDOM
INTESA SANPAOLO LONDON 210121 FIX -0.21 EUR 30,000,000 30,023,634.89 0.75TOTAL UNITED KINGDOM 30,023,634.89 0.75
UNITED STATES OF AMERICAFIDELITY NATION 211220 FIX -0.2 EUR 34,500,000 34,507,285.98 0.88FIDE NATL INFO SER ZCP 26-02-21 EUR 40,000,000 40,031,782.07 1.01
TOTAL UNITED STATES OF AMERICA 74,539,068.05 1.89TOTAL Credit instruments traded in a regulated market or equivalent 1,806,483,111.65 45.63
TOTAL Credit instruments 1,806,483,111.65 45.63Collective investment undertakings
General-purpose UCITS and alternative investment funds intended for non-professionals and equivalents in other countriesFRANCE
AMUNDI 3 M I2 EUR 18,200.102 180,142,345.50 4.55

UCIT AMUNDI 3-6 M
Annual Report in 30/11/2020
61
3.12. Portfolio listing of financial instruments in EUR Name of security Curren
cy Quantity Market value % Net Assets
AMUNDI CASH CORPORATE I2 EUR 17,500.388 173,199,225.99 4.38CPR MONETAIRE ESG I EUR 1,589 32,506,856.27 0.82
TOTAL FRANCE 385,848,427.76 9.75TOTAL General-purpose UCITS and alternative investment funds intended for non-professionals and equivalents in other countries
385,848,427.76 9.75
TOTAL Collective investment undertakings 385,848,427.76 9.75Securities purchased under agreement to resellFRANCE
FRAN GOVE BON 1.25% 25-05-36 EUR 3,668,591 4,450,000.88 0.11OATE 1,85%11-25072027 INDX EUR 20,000,000 27,300,000.00 0.69
TOTAL FRANCE 31,750,000.88 0.80TOTAL Securities purchased under agreement to resell 31,750,000.88 0.80
Compensations for securities taken in repo -13,811.25 Hedges
Other hedgesInterest rate swapsOIS/0.0/FIX/-0.481 EUR 50,000,000 8,711.29 0.01OIS/0.0/FIX/-0.562 EUR 21,700,000 21,972.93 OIS/0.0/FIX/-0.688 EUR 17,950,000 35,869.70
TOTAL Interest rate swaps 66,553.92 0.01TOTAL Other hedges 66,553.92 0.01TOTAL Hedges 66,553.92 0.01
Receivables 7,228,271.21 0.18Payables -2,085,128.97 -0.05Financial accounts 782,764,453.26 19.77Net assets 3,958,485,553.32 100.00
Units AMUNDI ULTRA SHORT TERM BOND SRI - PERI (C) EUR 615.667 99.4452Units AMUNDI ULTRA SHORT TERM BOND SRI M I-C EUR 30,065.631 101,465.8676Units AMUNDI ULTRA SHORT TERM BOND SRI - S (C) EUR 277,020.108 989.4960Units AMUNDI ULTRA SHORT TERM BOND SRI - R (C) EUR 178.585 985.8522Units AMUNDI ULTRA SHORT TERM BOND SRI M E-C EUR 1,333.150 9,926.8509Units AMUNDI ULTRA SHORT TERM BOND SRI I-2 EUR 62,310.859 9,954.4230

Amundi Asset Management, French “société par actions simplifiée”-SAS. 1 086 262 605 € capital amount.Licensed by the French Market Regulator (AMF) as a portfolio management company reg N° GP 04 000 036.437 574 452 RCS Paris. Registered Office social : 90, boulevard Pasteur 75 015 Paris France - amundi.com - www.amundi.com