amulsar gold project site, armenia
TRANSCRIPT

Golder, Golder Associates and the GA globe design are trademarks of Golder Associates Corporation
EARTHQUAKE HAZARD ASSESSMENT AND SEISMIC PARAMETERS
Amulsar Gold Project Site, Armenia
Submitted To: Lydian International Limited
Ground Floor, Charles House Charles Street St. Helier, Jersey JE2 4SF Channel Islands, United Kingdom
Submitted By: Golder Associates Inc.
230 Commerce, Suite 200 Irvine, California 92602
Distribution: SGS Metcon/KD Engineering
7701 North Business Park Drive Tucson, Arizona 85743 USA Wardell Armstrong International Wheal Jane, Baldhu, Truro Cornwall, TR3 6EH, United Kingdom
July 29, 2013 1138159713 038 R Rev1
REPO
RT

July 2013 ES-1 1138159713 038 R Rev1
I:\11\81597-13\0400\038_R_Rev1\1138159713 038 R Rev1 LydianAmulsar SeismicParameters 29JUL13.docx
EXECUTIVE SUMMARY Lydian International Limited is undertaking a Feasibility Study (FS) for their Amulsar gold project in the
central Armenia highlands. The Amulsar gold project site is located within a mountainous, geologically
complex, and seismically active region of the Arabia-Eurasia plate boundary zone. The northward motion
of the Arabian plate and collision with the Eurasia plate has continued to generate crustal deformation
that is manifest as active faulting and folding, period volcanic eruptions, and destructive earthquakes.
Historic records indicate that at least 3,150 earthquakes included have occurred in the region from 2150
BC to the end of August 2011. Armenian records indicate that the site has experienced strong to very
strong shaking at least three times in the last 900 years.
A seismotectonic model containing 53 separate seismic sources is used to develop probabilistic and
deterministic seismic hazard analyses specific to the Amulsar gold project site location. The Pambak-
Sevan-Sunik fault Segment 4 (PSSF4) located approximately 10 km north of the Amulsar gold project
area at its closest approach makes a strong contribution to the site hazard. The PSSF4 has an average
long-term slip rate of 1.55±0.65 mm/yr., and is not known to have generated a major earthquake in
historic time (approximately the last 10,000 years).
Seismic hazard analyses were performed at the heap leach facility, the crusher facility, the waste dump,
and the open pit sites. Probabilistic analyses yielded a 475-year return period PGA ranging between
0.18 g and 0.21 g and a 2,475-year return period PGA ranging from 0.33 g and 0.40 g for soil Site Class
B at the four sites. Deterministic results PGA values of median PGA values ranging between 0.22 g and
0.27 g across the four sites. Deterministic results show 84th percentile PGA values range between 0.37 g
and 0.46 g across the four sites.
Seismic parameters recommended for application of the 2009 IBC-ASCE 7-05 parameters at the Crusher
facility site are 0.91 g (SS) and 0.26 g (S1) for the MCEQ. A long period transition period (TL) of
12 seconds is recommended for the Amulsar project site.

July 2013 i 1138159713 038 R Rev1
I:\11\81597-13\0400\038_R_Rev1\1138159713 038 R Rev1 LydianAmulsar SeismicParameters 29JUL13.docx
Table of Contents
EXECUTIVE SUMMARY ........................................................................................................................ ES-1
1.0 INTRODUCTION .............................................................................................................................. 1
1.1 Background .................................................................................................................................. 1
1.2 Work Scope .................................................................................................................................. 2 1.3 Report Organization ..................................................................................................................... 3
2.0 REGIONAL TECTONIC AND SEISMIC SETTING .......................................................................... 4
2.1 Plate Tectonic and Structural Geological Framework .................................................................. 4
3.0 SEISMOTECTONIC MODEL ........................................................................................................... 5
3.1 Seismogenic Faults ...................................................................................................................... 5
3.1.1 The Pambak-Sevan-Sunik Fault System ................................................................................. 7 3.1.2 Garni Fault System ................................................................................................................... 7
3.1.3 Surface Fault Rupture at the Amulsar Site .............................................................................. 7
3.2 Earthquake Recurrence Relationships ........................................................................................ 8
3.3 Historical Earthquake Record .................................................................................................... 12
4.0 SEISMIC HAZARD ANALYSIS ...................................................................................................... 14
4.1 Deterministic Seismic Hazard Analysis ...................................................................................... 14 4.2 Probabilistic Seismic Hazard Analysis ....................................................................................... 14
4.2.1 Methodology ........................................................................................................................... 14
4.2.2 Parameters Used in the Probabilistic Seismic Hazard Assessment ...................................... 16
4.2.3 Uncertainties .......................................................................................................................... 16
4.2.4 Disaggregation ....................................................................................................................... 17 4.3 Ground Motion Prediction Equations ......................................................................................... 17
5.0 RESULTS AND DISCUSSION ...................................................................................................... 18
5.1 Site Soil Classification ................................................................................................................ 18
5.2 Hazard Curves ........................................................................................................................... 18
5.3 Response Spectra ...................................................................................................................... 18
5.4 Seismic Source Contribution ...................................................................................................... 20 5.5 Hazard Disaggregation by Magnitude, and Distance ................................................................ 20
5.6 Deterministic Seismic Hazard Analysis ...................................................................................... 22
5.7 2009 IBC-ASCE 7-05 Maximum Considered Earthquake ......................................................... 23
5.8 Long Period Transition Period.................................................................................................... 24
6.0 SUMMARY OF PRINCIPAL CONCLUSIONS AND RECOMMENDATIONS ................................ 25
7.0 CLOSING ....................................................................................................................................... 26 8.0 REFERENCES ............................................................................................................................... 27

July 2013 ii 1138159713 038 R Rev1
I:\11\81597-13\0400\038_R_Rev1\1138159713 038 R Rev1 LydianAmulsar SeismicParameters 29JUL13.docx
List of Tables Table 1-1 Coordinates for Center Points of Proposed Mine Infrastructure Sites ................................ 2 Table 3-1 Estimated Geologic and Geometric Characteristics of Potential Crustal Seismic
Sources within about 200 km of the Amulsar Gold Project Site ......................................... 9 Table 3-2 Medvedev-Sponheuer-Karnik (MSK) Scale of Seismic Intensity ...................................... 13 Table 4-1 Earthquake GMPEs and Their Relative Weightings Used in the Amulsar Gold
Project Site Seismic Hazard Analysis ............................................................................... 17 Table 5-1 Selected Spectral Accelerations for the HLF Site, Amulsar Gold Project, Central
Armenia, IBC 2009-ASCE 7-05 Site Class B .................................................................... 19 Table 5-2 Selected Spectral Accelerations for the Crusher Facility Site, Amulsar Gold
Project, Central Armenia, IBC 2009-ASCE 7-05 Site Class B .......................................... 19 Table 5-3 Selected Spectral Accelerations for the Waste Dump Site, Amulsar Gold Project,
Central Armenia, IBC 2009-ASCE 7-05 Site Class B ....................................................... 19 Table 5-4 Selected Spectral Accelerations for Open Pit Site, Amulsar Gold Project, Central
Armenia, IBC 2009-ASCE 7-05 Site Class B .................................................................... 20 Table 5-5 Disaggregation Results for 475-year Ground Motions at the HLF Site, Amulsar
Gold Project, Central Armenia .......................................................................................... 21 Table 5-6 Disaggregation Results for 2,475-year Ground Motions at HLF Site, Amulsar
Gold Project, Central Armenia .......................................................................................... 21 Table 5-7 Disaggregation Results for 475-year Ground Motions at Waste Dump Site,
Amulsar Gold Project, Central Armenia ............................................................................ 22 Table 5-8 Disaggregation Results for 2,475-year Ground Motions at Waste Dump Site,
Amulsar Gold Project, Central Armenia ............................................................................ 22 Table 5-9 Deterministic PGA Values for Selected Sites at the Amulsar Gold Project Site ............... 23 Table 5-10 PGA and Selected Spectral Accelerations (5% Damped) for Selected Return
Periods at the HLF Site1 ................................................................................................... 23 Table 5-11 PGA and Selected Spectral Accelerations (5% Damped) for Selected Return
Periods at the Crushing Plant Site1 .................................................................................. 23
List of Figures Figure 1 Historic Earthquakes, Amulsar Gold Project Figure 2 Historic Earthquakes and Fault Sources, Amulsar Gold Project Figure 3 Source Earthquake and Felt Intensities for Historic Earthquakes, Amulsar Gold Project Figure 4 PGA, 0.2-second and 1-second Spectral Acceleration Hazard Curves – Heap Leach Pad
Facility, Amulsar Gold Project Figure 5 PGA, 0.2-second and 1-second Spectral Acceleration Hazard Curves – Crusher Facility,
Amulsar Gold Project Figure 6 PGA, 0.2-second and 1-second Spectral Acceleration Hazard Curves – Waste Rock
Dump, Amulsar Gold Project Figure 7 PGA, 0.2-second and 1-second Spectral Acceleration Hazard Curves – Open Pit,
Amulsar Gold Project Figure 8 Equal Hazard Horizontal Acceleration Response Spectra – Heap Leach Pad Facility,
Amulsar Gold Project Figure 9 Equal Hazard Horizontal Acceleration Response Spectra – Crusher Facility, Amulsar
Gold Project Figure 10 Equal Hazard Horizontal Acceleration Response Spectra – Waste Rock Dump, Amulsar
Gold Project Figure 11 Equal Hazard Horizontal Acceleration Response Spectra – Open Pit, Amulsar Gold
Project Figure 12 Seismic Source Contributions for PGA – Heap Leach Pad Facility, Amulsar Gold Project

July 2013 iii 1138159713 038 R Rev1
I:\11\81597-13\0400\038_R_Rev1\1138159713 038 R Rev1 LydianAmulsar SeismicParameters 29JUL13.docx
Figure 13 Hazard Disaggregation by Magnitude and Distance – 475-year PGA – Heap Leach Pad Facility, Amulsar Gold Project
Figure 14 Hazard Disaggregation by Magnitude and Distance – 475-year 0.2-second Spectral Acceleration – Heap Leach Pad Facility, Amulsar Gold Project
Figure 15 Hazard Disaggregation by Magnitude and Distance – 475-year 1.0-second Spectral Acceleration – Heap Leach Pad Facility, Amulsar Gold Project
Figure 16 Hazard Disaggregation by Magnitude and Distance – 2,475-year PGA – Heap Leach Pad Facility, Amulsar Gold Project
Figure 17 Hazard Disaggregation by Magnitude and Distance – 2,475-year 0.2-second Spectral Acceleration – Heap Leach Pad Facility, Amulsar Gold Project
Figure 18 Hazard Disaggregation by Magnitude and Distance – 2,475-year 1.0-second Spectral Acceleration – Heap Leach Pad Facility, Amulsar Gold Project
Figure 19 Hazard Disaggregation by Magnitude and Distance – 475-year PGA – Crusher Facility, Amulsar Gold Project
Figure 20 Hazard Disaggregation by Magnitude and Distance – 475-year 0.2-second Spectral Acceleration – Crusher Facility, Amulsar Gold Project
Figure 21 Hazard Disaggregation by Magnitude and Distance – 475-year 1.0-second Spectral Acceleration – Crusher Facility, Amulsar Gold Project
Figure 22 Hazard Disaggregation by Magnitude and Distance – 2,475-year PGA – Crusher Facility, Amulsar Gold Project
Figure 23 Hazard Disaggregation by Magnitude and Distance – 2,475-year 0.2-second Spectral Acceleration – Crusher Facility, Amulsar Gold Project
Figure 24 Hazard Disaggregation by Magnitude and Distance – 2,475-year 1.0-second Spectral Acceleration – Crusher Facility, Amulsar Gold Project
Figure 25 Hazard Disaggregation by Magnitude and Distance – 475-year PGA – Waste Rock Dump, Amulsar Gold Project
Figure 26 Hazard Disaggregation by Magnitude and Distance – 475-year 0.2-second Spectral Acceleration – Waste Rock Dump, Amulsar Gold Project
Figure 27 Hazard Disaggregation by Magnitude and Distance – 475-year 1.0-second Spectral Acceleration – Waste Rock Dump, Amulsar Gold Project
Figure 28 Hazard Disaggregation by Magnitude and Distance – 2,475-year PGA – Waste Rock Dump, Amulsar Gold Project
Figure 29 Hazard Disaggregation by Magnitude and Distance – 2,475-year 0.2-second Spectral Acceleration – Waste Rock Dump, Amulsar Gold Project
Figure 30 Hazard Disaggregation by Magnitude and Distance – 2,475-year 1.0-second Spectral Acceleration – Waste Rock Dump, Amulsar Gold Project
Figure 31 Hazard Disaggregation by Magnitude and Distance – 475-year PGA – Open Pit, Amulsar Gold Project
Figure 32 Hazard Disaggregation by Magnitude and Distance – 475-year 0.2-second Spectral Acceleration – Open Pit, Amulsar Gold Project
Figure 33 Hazard Disaggregation by Magnitude and Distance – 475-year 1.0-second Spectral Acceleration – Open Pit, Amulsar Gold Project
Figure 34 Hazard Disaggregation by Magnitude and Distance – 2,475-year PGA – Open Pit, Amulsar Gold Project
Figure 35 Hazard Disaggregation by Magnitude and Distance – 2,475-year 0.2-second Spectral Acceleration – Open Pit, Amulsar Gold Project
Figure 36 Hazard Disaggregation by Magnitude and Distance – 2,475-year 1.0-second Spectral Acceleration – Open Pit, Amulsar Gold Project
Figure 37 Deterministic Horizontal Acceleration Response Spectra – Heap Leach Pad Facility Figure 38 Deterministic Horizontal Acceleration Response Spectra – Crusher Facility Figure 39 Deterministic Horizontal Acceleration Response Spectra – Waste Rock Dump Figure 40 Deterministic Horizontal Acceleration Response Spectra – Open Pit

July 2013 1 1138159713 038 R Rev1
I:\11\81597-13\0400\038_R_Rev1\1138159713 038 R Rev1 LydianAmulsar SeismicParameters 29JUL13.docx
1.0 INTRODUCTION This technical report presents the results of a seismic hazard assessment and the parameters
recommended for seismic analysis and design for the Amulsar gold project under development by Lydian
International in the central Armenia highlands. Key mining infrastructure sites that require seismic design
parameters include a heap leach facility (HLF), crushing plant, overland conveyor system, waste rock
dump, and open pit sites. The seismic design parameters for structural design of building and non-
building structures are as specified in the International Code Council’s International Building Code (IBC)
2009 and the American Society of Civil Engineers’ (ASCE) 7-05 Standard (2006), (2009 IBC-ASCE 7-05).
Also provided are 475-year return period and deterministic maximum credible earthquake (MCE)
response spectra.
1.1 Background Lydian International Limited (Lydian) is undertaking a Feasibility Study (FS) for their Amulsar gold project
in the central Armenia highlands (Figure 1). The Amulsar gold project development is envisioned as an
open pit operation with a gold heap leach facility and processing plant for this high-sulfidation type
epithermal gold project. In November 2008, Golder Associates Inc. (Golder) and SGS Metcon/KD
Engineering Inc. (SGS) prepared a project scoping study for a heap leach facility (HLF) and process plant
(Golder 2008). For scoping-level seismic analysis, Golder (2008) provided a summary of readily available
seismic hazard estimates from international and Armenian sources. A 475-year peak ground acceleration
(PGA) for the site of about 0.4 to 0.5 g (Golder 2008; Figure 2) was indicated based on regional maps
developed for the Global Seismic Hazard Assessment Project (GSHAP). The seismic zonation map of
the Republic of Armenia (Golder 2008; Figure 2) indicates a maximum horizontal acceleration of 0.3 g for
the Amulsar site that has a stated a return period of about 5,000 year (90% probability of non-
exceedance in 500 years). The Armenian estimates of seismic hazard are significantly lower than
GSHAP, and it remains unclear as to what is an appropriate value for seismic design.
Feasibility-level field investigations and facility siting evaluations for the Amulsar gold project were
completed in the fall of 2011. The purpose of these field investigations was to identify suitable sites and
feasibility-level designs for the major mining facilities to be included in the FS, including sites for the HLF,
crushing plant, waste rock dump site and open pit. Golder completed the initial revision of this
earthquake hazard assessment in March of 2012 based on the facility locations selected as of November
2011 (locations shown on KDE Drawing 00-G-001 P5). Over the past year, two key facilities, the HLF
and the crusher, have been relocated. This revision of the earthquake hazard assessment is being
issued to address the changes in the earthquake hazards for these facilities due to relocation. This
revision did not include re-evaluation of seismic hazards to include additional earthquakes or publications
that may have occurred since the initial submittal. The proposed location for the waste dump (about 5 km

July 2013 2 1138159713 038 R Rev1
I:\11\81597-13\0400\038_R_Rev1\1138159713 038 R Rev1 LydianAmulsar SeismicParameters 29JUL13.docx
north of the proposed Tigranes/Artavasdes open pit) and the proposed locations for the open pits remain
unchanged.
The proposed HLF was originally located about 4 km east of the open pit on the true left bank (east side)
of the Vorotan River. Subsequently, during several meetings and discussions held in late 2012, Armenian
government officials expressed a strong preference for the HLF to be located on the west side of the
Amulsar mountain divide (i.e., outside of the Vorotan drainage basin) and the Immediate Impact Zone of
the Lake Sevan Catchment. In order to accommodate the revised guidance from the government, a
revised siting study was completed, resulting in the HLF being relocated to a site approximately 5km
northwest from the proposed Erato Pit.
The location for the crushing plant site was originally located about 2 km north of the proposed
Tigranes/Artavasdes open pit on the east-facing slopes of Amulsar. However, given the changed HLF
location and also modified pit limits, the location of the crusher was moved to a site approximately 2km
NNW of the proposed Erato pit, on the northwest facing slopes of Amulsar. The coordinates for the major
mine facilities as evaluated for this seismic hazard study are listed in Table 1-1 below:
Table 1-1 Coordinates for Center Points of Proposed Mine Infrastructure Sites
Site Name Latitude
(Degrees North) Longitude
(Degrees East)
Heap Leach Facility (HLF) 39.764024 45.654032 Crushing Plant 39.760966 45.700141 Waste Dump 39.769713 45.713586 Open Pit 39.723647 45.718601
Part of the FS investigation work requires that appropriate seismic parameters are selected for structural
analysis and design. Because of the wide variation in existing ground motion estimates, Lydian
requested Golder to develop a scope of work to develop a state-of-practice, site-specific seismic hazard
analysis for the Amulsar site. The site-specific seismic parameters developed from this study will be used
for seismic analysis and design at the site.
1.2 Work Scope Golder’s proposed work scope was contained in a letter proposal to Lydian (113-81597FS.230 Rev. A,
August 5, 2011), and included both deterministic and probabilistic seismic hazard analyses to develop
earthquake ground shaking estimates for the major mine plant and infrastructure sites within the Amulsar
gold project site. The revisions to Golder’s report include the new location of the HLF and crusher facility.
Golder’s has completed the following tasks to develop seismic parameters for the Amulsar gold project
sites:

July 2013 3 1138159713 038 R Rev1
I:\11\81597-13\0400\038_R_Rev1\1138159713 038 R Rev1 LydianAmulsar SeismicParameters 29JUL13.docx
Gathered information on the regional tectonics, location and activity of major crustal faults, and collected and processed information on historical earthquake hypocenters from local and international earthquake catalogs.
Defined seismic source zones based on the location of active faults and historic earthquakes not associated with known faults or the subduction zone.
Reviewed the number and weighting of crustal fault earthquake ground motions attenuation relationships, including the five Next Generation Attenuation (NGA) relationships that are suitable for the prediction of earthquake ground motion attenuation.
Developed site-specific, earthquake ground motion hazard curves from probabilistic seismic hazard analysis (PSHA) using EZ-FRISK 7.62 (Risk Engineering, 2012).
Calculated values for peak horizontal ground acceleration (PGA), and 0.2-second and 1.0-second (5-percent damped) for 475-, and 2,475-year return periods at each site.
Evaluated deterministic earthquake ground motions at the HLF and Waste Dump sites.
Evaluated seismic parameters SS and S1 for the maximum considered earthquake (MConE) on a Site Class B soil site for the 2009 IBC-ASCE 7-05 procedures, and the recommended long period transition period.
Evaluated soil Site Classes for four sites in the crushing plant area using existing borehole information and the 2009 IBC-ASCE 7-05 standard.
Prepared this report that presents the results of the seismic hazard analysis and seismic design parameters recommended for the Amulsar gold project sites.
1.3 Report Organization This report comprises eight major sections. Section 1 is an introduction to the purpose of the study and
describes the scope of work undertaken for this study. Section 2 presents a brief summary of the regional
geologic and tectonic setting of the Amulsar gold project site that provides context to the description of
historic earthquakes and the major mapped faults that are also included in Section 2. Section 3 describes
the data and basis for the development of the fault source models. In Section 4, we develop the
probabilistic and deterministic seismic hazard analyses and describe the results and recommendations for
seismic parameters in Section 5.
Section 6 is a summary of our principal conclusions and recommendations, and Section 7 provides
closing remarks and signatures of the report authors. Section 8 contains reference details for publications
cited in the report. Tables are included within the body of the report while figures are provided following
Section 8.
July 2013 4 1138159713 038 R Rev1
I:\11\81597-13\0400\038_R_Rev1\1138159713 038 R Rev1 LydianAmulsar SeismicParameters 29JUL13.docx
2.0 REGIONAL TECTONIC AND SEISMIC SETTING The Amulsar gold project site is located within a mountainous, geologically complex, and seismically
active region of the Arabia-Eurasia plate boundary zone (Figure 1). The northward motion of the Arabian
plate and collision with the Eurasia plate has continued to generate crustal deformation that is manifest as
active faulting and folding, periodic volcanic eruptions, and destructive earthquakes.
2.1 Plate Tectonic and Structural Geological Framework The Amulsar gold project site is situated within a continent-continent collision zone associated with the
convergence of the Arabian and Eurasian tectonic plates (Figure 1). Plate convergence results in north-
south-oriented shortening and east-west extension of the crust within the collision zone. Continued
collision has caused westward ejection the Anatolian block, eastward translation of Iranian block; and
widespread Quaternary and historic volcanic activity. Karakhanian et al. (2004) and the references
contained therein provide a summary of the various models for the complex pattern of recent deformation
in the Caucasus region of Eurasia.
Crustal deformation models from Global Positioning System (GPS) surveys indicate present-day
shortening rates across the Arabian-Eurasian collision zone of 10±2 mm/year (Karakhanian et al. 2004).
North of the Amulsar gold project site, shortening across the Main Caucasus Thrust increases from west
to east, from approximately 4±1 mm/year to 10±1 mm/year, respectively (Kadirov et al. 2008).
The pattern of surface faulting in the region surrounding the Amulsar Gold project site includes the full
range of crustal fault types that occur within an overall trans-contractional strain regime. The general
pattern of observed faults (e.g., Dilek et al., 2010) includes the following:
Northwest-striking, dextral strike-slip faults
Northeast-striking, left-lateral strike-slip faults
North- to northwest-striking reverse (thrust) faults that generally dip to the north
North-striking normal faults that are often associated with the active volcanism
July 2013 5 1138159713 038 R Rev1
I:\11\81597-13\0400\038_R_Rev1\1138159713 038 R Rev1 LydianAmulsar SeismicParameters 29JUL13.docx
3.0 SEISMOTECTONIC MODEL In seismic hazard studies, a seismic source model is developed to represent specific seismotectonic
regions capable of producing and influencing the earthquake ground motions expected at the site of
interest. The seismotectonic model defines the active and potentially active seismic sources that can
contribute to the earthquake ground motions at the site.
The seismic source model for the Amulsar gold project site has been developed from the available
published geological, tectonic, and seismological information. The potential sources are seismically
active faults that demonstrate evidence for past co-seismic displacement during the Quaternary (about
the last 1.8 million years). The seismic source model is defined in terms of parameters that include fault
location, fault geometry, fault displacement mechanisms, maximum earthquake magnitudes, probability of
existence, and earthquake recurrence models.
Details regarding the characterization of the main sources within the seismic source model are presented
in the following sections.
3.1 Seismogenic Faults Table 3-1 lists the mapped faults and fault segments within about 250 km of the Amulsar gold project site.
We have identified 17 fault systems within approximately 250 km of the Amulsar gold project site. The
faults have been segmented into 53 separate seismogenic sources. The faults and fault segments are
shown on Figure 2.
The PSHA undertaken for this study includes 53 individual seismic sources to represent crustal faults and
fault segments located within about 200 km of the project site (Figure 2). Faults and fault segments were
included as seismic sources based on our review of published fault maps and regional tectonic studies as
listed in Table 3-1. Based upon our experience and judgment, we made a qualitative assessment of our
confidence level (High, Medium, or Low) for the fault being a potential seismogenic source in the region.
Our judgments of fault activity and slip rate are constrained by the total tectonic plate velocity for the
region as established by interpretation of GPS surveys (Karakhanian et al. 2004).
To model the crustal faults as seismic sources, we made the following general assumptions about the characteristics of the crustal fault seismic sources:
For fault segments without published average slip rates, we assigned a minimum slip rate of 0.5 mm/yr. The assumption was based on Karakhanian et al. (2004) who indicate that slip rates associated with Quaternary-active faults in Armenia, eastern Turkey, and northwestern Iran range from 0.5 to 4 mm/yr.
The seismogenic thickness of the crust is about 10 to 15 km. We based this assumption on the range of depths of instrumental earthquake hypocenters, and the hypocentral depths of the larger, well-studied instrumental recorded earthquakes such the 1988 M 6.8 Spitak earthquake that had a focal depth of about 10 km (Philip et al., 1992).

July 2013 6 1138159713 038 R Rev1
I:\11\81597-13\0400\038_R_Rev1\1138159713 038 R Rev1 LydianAmulsar SeismicParameters 29JUL13.docx
Fault segments with a High confidence level were assigned a probability of activity equal to 1.0. Fault segments with a Medium confidence level were assigned a probability of activity equal to 0.5. Fault segments with a Low confidence level were assigned a probability of activity equal to 0.25.
The maximum magnitude for each fault was estimated from fault rupture-earthquake magnitude
relationships from Wells and Coppersmith (1994), Anderson et al. (1996) and Hanks and Bakun (2002)
(see Note 10 of Table 3-1). These references are based on empirical fault rupture-earthquake magnitude
relationships observed during historic fault rupture earthquakes. Faults were assumed to rupture to a
depth of 15 km. The individual source characteristics collected, or estimated from the available data, and
used to calculate the maximum magnitude included:
Source (fault) type
Strike and dip direction of the fault
Total fault length
Segment or rupture length of the fault
Rupture width
Rupture area
Slip rate or recurrence interval
Each of these characteristics was used in the application of the fault rupture-earthquake magnitude
relationships to calculate a range of possible maximum earthquake magnitudes for the individual sources.
The maximum magnitude listed in Table 3-1 was taken as the average magnitude from several fault
rupture-earthquake magnitude relationships. We have assumed a ±0.3 magnitude range for the PSHA.
It should be noted that some of the fault and fault segments have multiple fault types listed in Table 3-1.
The multiple types for these faults and fault segments reflects the different senses of movement indicated
in the various studies available in the literature. The first fault type listed in Table 3-1 was assumed for
input into the PSHA, and represents the sense of fault movement for which we had the most confidence.
We paid particular attention in this study to the location and activity of faults within about 50 km of the
project site because future large earthquakes generated by movement along these faults are likely to
produce the strongest earthquake shaking at the Amulsar gold project site. The fault systems within 50
km of the site are the Pambak-Sevan-Sunik fault system, the Garni fault, and an unmanned fault system
near Ghegham. The segments of the Pambak-Sevan-Sunik fault system and Garni fault system closest
to the Amulsar gold project site are discussed in more detail below.

July 2013 7 1138159713 038 R Rev1
I:\11\81597-13\0400\038_R_Rev1\1138159713 038 R Rev1 LydianAmulsar SeismicParameters 29JUL13.docx
3.1.1 The Pambak-Sevan-Sunik Fault System Of the major faults in central and southern Armenia, the Pambak-Sevan-Sunik fault (Philip et al. 2001)
appears to be the fault that has undergone the most detailed assessment of its location, average slip rate
and paleoseismic record. We identified two segments of the Pambak-Sevan-Sunik fault within
approximately 30 km of the Amulsar gold project site (Figure 2; Table 3-1)—The Pambak-Sevan-Sunik
fault Segment 4 (PSSF4) and Pambak-Sevan-Sunik fault Segment 5a (PSSF5a). The characteristics of
these fault segments are described below.
The Pambak-Sevan-Sunik fault Segment 4 (PSSF4) is a northwest-striking, trans-contractional fault with
right-lateral and reverse-thrust displacement (Philip et al., 2001, Karakhanian et al., 2004). It is
approximately 98 km long and located about 10 km north of the Amulsar gold project area at its closest
approach. From Karakhanian et al. (2004), the horizontal and vertical average long-term slip rates are
1.55±0.65 mm/yr and 0.25 ± 0.25 mm/yr, respectively. The estimated maximum magnitude earthquake is
M 7.2 for the PSSF4 segment (Karakhanian et al., 2004).
The Pambak-Sevan-Sunik fault Segment 5 (PSSF5) is a northwest-striking right-lateral fault
approximately 200 km long and located about 14 km southeast of the Amulsar gold project site at its
closest approach. From Karakhanian et al. (2004), the average horizontal long-term slip rate is 1.3±0.5
mm/yr for PSSF5 that we have segmented into a right-lateral segment (PSSF5a), and two normal fault
segments (PSSF5b, PSSF5c) based on fault geometry provided in Karakhanian et al. (2004). The
estimated maximum magnitude earthquake is M 6.9 for the PSSF5a segment with 48 km length
(Karakhanian et al., 2004).
3.1.2 Garni Fault System The Garni fault Segment 5 (GF5) is a northwest-striking fault approximately 80 km long located about 20
km southwest of the project site (Figure 2) at its closest approach. We have combined the multiple fault
segments shown by Karakhanian et al. (2004) into a single fault segment with an assumed dextral (right-
lateral) sense of fault slip. Karakhanian et al. (2004) do not provide an average slip rate estimate for the
Garni fault. In the absence of available information, we assume a horizontal slip rate of 1-2 mm/yr for the
GF5 segment (Table 3-1) based upon the slip rate for the adjacent Pambak-Sevan-Sunik fault system
and its similar fault slip type and close proximity to the PSSF5 fault segment.
3.1.3 Surface Fault Rupture at the Amulsar Site Golder’s field investigations and review of available literature and satellite imagery found no geomorphic
evidence for the trace(s) of faults or other tectonic geomorphology within the project site or located within
the proposed sites of major facilities such as the HLF, waste dump, crushing plant, or open pit.
Accordingly, it is Golder’s opinion that seismically active faults are not present within the project site, and
there is a very low potential for surface fault rupture within the project site.

July 2013 8 1138159713 038 R Rev1
I:\11\81597-13\0400\038_R_Rev1\1138159713 038 R Rev1 LydianAmulsar SeismicParameters 29JUL13.docx
3.2 Earthquake Recurrence Relationships Earthquake recurrence relationships represent the frequency of earthquake occurrence within a seismic
source. The recurrence relationships are important input parameters for site-specific PSHA because they
influence the return period of the earthquake ground motions. For this study, a truncated exponential
magnitude model and the full characteristic model (Youngs and Coppersmith 1985) model have been
used to characterize the earthquake distribution and recurrence for each of the 53 fault and fault
segments seismic sources. A 0.7 weighting was used for the full characteristic model and a 0.3 weighting
was used for the truncated exponential magnitude model.
The truncated exponential magnitude model follows a log-linear frequency magnitude relationship
proposed by Gutenberg and Richter (1944) and expressed as:
Log N = a – b⋅M
Where N is the cumulative number of earthquakes greater than or equal to M, and “a” and “b” are
constants. The “a-value” represents the earthquake activity rate or number of events observed above a
threshold magnitude. The “b-value” is the slope of the log-linear frequency magnitude relationship and
controls the relative frequency of different magnitude earthquakes. Lower b-values represent a higher
relative frequency of occurrence of larger events, and hence higher overall seismic hazard. We assumed
a b-value of 0.9 for all the fault sources for the PSHA.

July 2013 9 1138159713 038 R Rev1
I:\11\81597-13\0400\038_R_Rev1\1138159713 038 R Rev1 LydianAmulsar SeismicParameters 29JUL13.docx
Table 3-1 Estimated Geologic and Geometric Characteristics of Potential Crustal Seismic Sources within about 200 km of the Amulsar Gold Project Site
Fault or Fault System1
Fault or Fault Segment1 Fault Type2
Fault Strike3
Fault Dip (°) &
Direction4
Total Segment Length (km)5
Distance to Amulsar
Gold Project Site
(km)
Qualitative Data
Confidence Level6
Total Slip Rate
Range (mm/yr)7
Estimated Recurrence
Interval8
Most Recent Historic
Earthquake (Year &
Magnitude)9
Estimated Maximum Magnitude
(M)10 Data
Sources11 Comments Pambak-Sevan-Sunik Fault System (PSSF)
PSSF1 RLSS, R, T WNW 90 115 131 High 2.5-4.6 1622±179 yrs (g), 2240±640 yrs (d)
--- 7.2 4 Ref. 4 indicates that the PSSF fault system is the longest active structure in Armenia, with the greatest slip rates, and strongest earthquakes. Slip rates for PSSF1, PSSF2, PSSF 4, and PSSF5 from Ref. 4. We assume a horizontal slip rate of 2-4 mm/yr for PSSF3 based on magnitude of slip on PSSF1 and PSSF2. We assign 0.5 mm/yr horizontal slip rate to PSSF5b and 5c, based on Ref. 4 indicating that slip rates on active faults in Armenia, eastern Turkey, and northwestern Iran have slip rates of 0.5 to 4 mm/yr. We developed two additional faulting scenarios for this seismic hazard analysis: PSSF2 & 4; PSSF4, 5a & 5b.
PSSF2 RLSS, R, T, N NW 90 82 88 High 1.5-3.7 >4388±950 yrs (g), 3970±1698 yrs (d)
<757 BC M7.3* 7.1 4
PSSF3 R, RLSS WNW 45S 97 43 Medium 2-4 (h) --- 1139 ~M7.5-7.7 7.3 4, 7 PSSF4 RLSS NW 90 98 11 High 0.9-2.2 4675±207 yrs
(g), 3444±637 yrs (d)
762 BC M7.1* 7.2 4
PSSF5a RLSS NNW 90 48 14 Medium 0.8-1.8 (h) ≤10,500±1600 yrs (g)
1407 M~7.0 6.9 4, 7 PSSF5b N NNW 60 E 58 59 Medium 0.5 (h) 1407 M~7.0 7.1 4, 7 PSSF5c N NNW 60 E 88 35 Medium 0.5 (h) 1931 M6.5 7.2 4, 7
Unnamed Faults S of PSSF5
Unnamed Fault 1 South of PSSF5
R E 45 N 34 103 Low 0.5-1 (h) --- --- 6.9 7 These two reverse faults are located to the south of the PSSF5 segments. PSSF5a is a right-lateral strike-slip fault with approximately 0.8 to 1.8 mm/yr of horizontal slip. Assuming this displacement is equally transferred to the two unnamed reverse faults, we assign a horizontal slip rate of 0.5 to 1 mm/yr to each unnamed reverse fault.
Unnamed Fault 2 South of PSSF 5
R E 45 N 42 108 Low 0.5-1 (h) --- --- 7.0 7
Unnamed Fault N of PSSF1
Unnamed Fault N of PSSF1
T E 30 N 84 172 Low 0.5-1 (h) --- --- 7.4 3, 4, 7 The dip of this fault is ambiguous: no fault designation shown (Ref. 3), north-dipping thrust fault (Ref. 4), and south-dipping thrust fault (Ref. 7). We assume the fault is a north-dipping thrust fault based on PSSF3 geometry, and assign a horizontal slip rate of 0.5-1 mm/yr based on similar strike and length to unnamed faults 68 and 69.
Garni Fault System
Spitak Fault (SpF) R, T, RLSS, N WNW 45 NNE 31 148 High 2.5-3.6 <20,934±377 yrs (g)
1988 M6.8 6.9, 6.7, ≥7.1 (Ref 4)
2, 4, 6, 7 At the north end of the Garni fault system, a horsetail structure is located at the junction of the PSSF1 fault segment. The western trace of the horsetail structure is the 32 km surface rupture (Ref. 4) from the 1988 moment magnitude M6.8 (Ref. 2) Spitak earthquake (SpF). We assign 2.5-3.6 mm/yr total slip rate (from GF1 and SpF fault characteristics from Ref. 4) to the GF2 and GF3a segments of similar strike. For GF3b and GF4 segments, a minimum horizontal slip rate of 0.5 mm/yr is assigned based on Ref. 4 indicating that slip rates on active faults in Armenia, eastern Turkey, and northwestern Iran have slip rates of 0.5 to 4 mm/yr. We assign a total slip rate of 1-2 mm/yr to GF5 based on the neighboring PSSF4 total slip rate.
GF1 RLSS, R. T NW 90 29 122 1827 M7.1 4, 7 GF2 RLSS, N NNW 90 70 86 Low 2.5-3.6 --- 1827 M6.5-7.0 7.0 4 GF3a RLSS NW 90 49 57 Low 2.5-3.6 --- 906 M6.8 6.9 4 GF3b N NW 60 WSW 31 57 Low 0.5 (h) --- --- 6.8 4 GF4 N NNW 60 SW 43 53 Low 0.5 (h) --- --- 6.9 4 GF5 RLSS, R, T NW 90 80 20 Low 1-2 --- 735 M7.2 7.1 3, 4

July 2013 10 1138159713 038 R Rev1
I:\11\81597-13\0400\038_R_Rev1\1138159713 038 R Rev1 LydianAmulsar SeismicParameters 29JUL13.docx
Fault or Fault System1
Fault or Fault Segment1 Fault Type2
Fault Strike3
Fault Dip (°) &
Direction4
Total Segment Length (km)5
Distance to Amulsar
Gold Project Site
(km)
Qualitative Data
Confidence Level6
Total Slip Rate
Range (mm/yr)7
Estimated Recurrence
Interval8
Most Recent Historic
Earthquake (Year &
Magnitude)9
Estimated Maximum Magnitude
(M)10 Data
Sources11 Comments Unnamed Faults Near Ghegham
Unnamed Fault 1 Ghegham Area
N NNW 60 ENE 100 39 Low 0.5 (h) --- --- 7.3 3, 4 We assume a 0.5 mm/yr horizontal slip rate for these two unnamed fault west of Sevan Lake based on the lower bounds from Ref. 4 indicating that slip rates on active faults in Armenia, eastern Turkey, and northwestern Iran have slip rates of 0.5 to 4 mm/yr.
Unnamed Fault 2 Ghegham Area
RLSS NNW 90 50 51 Low 0.5 (h) --- --- 6.9 3, 4
Zheltorechensk-Sarighamish Fault (ESF)
ESF LLSS ENE 90 93 170 Low 1.5-3.7 --- --- 7.2 3, 4 This fault forms part of the outer structural boundary on the western side of the Armenian wedge block. We assume a total slip rate of 1.5-3.7 mm/yr based on PSSF2, the fault on the eastern side of the Armenian wedge equivalent to the ESF.
Akhourian Fault AkF1 LLSS NE 90 29 189 Low 2.5-3.6 --- --- 6.7 4, 7 This fault forms part of the inner structural boundary on the western side of the Armenian wedge block. We assume a total slip rate of 2.5-3.6 mm/yr based on GF1, the fault on the eastern side of the Armenian wedge that is equivalent to the Akhourian fault.
AkF2 LLSS NE 90 52 189 Low 2.5-3.6 --- 1935 M6.0-6.4 6.9 4, 7 AkF3 LLSS NE 90 48 203 Low 2.5-3.6 --- --- 6.9 4, 7
Sardarapat-Nakhichevan Fault System (SNFS)
Kagyzman (KF) RLSS WNW 90 51 170 Low 1.7-2.1 --- --- 6.9 4 Ref. 4 provides a vertical slip rate estimate for the SF of 0.7 mm/yr and notes that estimating the horizontal rate was not possible. We assume a horizontal slip rate of 1.5-2 mm/yr based on the North Tabriz fault segment. For the four fault segments in the SNFS, we assign a total slip rate of 1.7-2.1 mm/yr for these faults.
Sardarapat (SF) RLSS WNW 90 56 126 Medium 1.7-2.1 --- --- 7.0 4 Parackar-Dvin (PDF) RLSS, R, T NW 90 59 91 Low 1.7-2.1 --- 851-893 AD: at
least 3 events M6.0-7.0
7.0 4
Nakhichevan (NF) RLSS, R, T NW 90 148 69 Low 1.7-2.1 --- --- 7.4 4 Dogubayazit-Maku Faults
Dogubayazit (DF) RLSS NW 90 41 121 Low 1.5-2 (h) --- 368 M7.0 (?) 6.8 4 We assume horizontal slip rates of 1.5-2 mm/yr for the MF and DF faults based on the North Tabriz fault segment; and 0.5 mm/yr horizontal slip rate on IF based on the GSKFb-e faults. Note that Ref. 4 discusses the 368 earthquake both on the Garni and Dogubayazit faults; and that the 1843 Khoy earthquake (M5.9) may have occurred on the Maku fault.
Maku (MF) RLSS NW 90 123 111 Low 1.5-2 (h) --- 1843 M5.9 (?) 7.3 4 Igdir (IF) N, RLSS NW 60 NE 66 119 Low 0.5 (h) --- 1962 M5.2 7.1 4
Gailatu-Siah Cheshmeh-Khoy Fault (GSKF)
GSKF RLSS NW 90 176 140 Low 1.5-2 (h) --- 1840 M7.4 7.4 4 We assume horizontal slip rates of 1.5-2 mm/yr for the GSKF based on the North Tabriz fault segment. The 0.5 mm/yr horizontal slip rate for GSKFb-e fault segments is based on the lower bounds from Ref. 4 indicating that slip rates on active faults in Armenia, eastern Turkey, and northwestern Iran have slip rates of 0.5 to 4 mm/yr.
GSKFa RLSS NW 90 70 161 Low 1.5-2 (h) --- --- 7.1 4 GSKFb N NW 60 NE 38 165 Low 0.5 (h) --- --- 6.9 4 GSKFc N NW 60 NE 34 159 Low 0.5 (h) --- --- 6.8 4 GSKFd N NW 60 NE 25 157 Low 0.5 (h) --- --- 6.7 4 GSKFe N NW 60 NE 30 136 Low 0.5 (h) --- --- 6.8 4
North Tabriz Fault North Tabriz (NTF) RLSS, R NW 90 52 178 Medium At least 1.5-2 (h), unknown (v)
--- 1780 M7.4 6.9 4, 7 The North Tabriz fault has a combined length of 210 km, and the North Mishu fault (2 segments) has a combined length of 80 km. Minimum horizontal slip rate is estimated at least 1.5-2 mm/yr. TS1 and SF1 segments are identified as left-lateral strike-slip faults by Ref. 4 and reverse faults by Ref. 7. We interpret extensions TS2 and SF2 as left-lateral strike-slip faults. Based on the horizontal slip rate for the North Tabriz segment,
North Mishu (NMF1) RLSS NW 90 38 154 Low 0.5-1 (h) --- --- 6.8 4 North Mishu (NMF2) RLSS NW 90 66 145 Low 0.5-1 (h) --- 1786 M6.3 7.1 4 Tasuj (TF1) LLSS, R E 90 55 149 Low 0.5-1 (h) --- --- 7.0 4, 7 Tasuj (TF2) LLSS E 90 21 180 Low 0.5-1 (h) --- 1931 M7.2 6.6 4, 7 Sufian (SuF1) LLSS, R E 90 33 156 Low 0.5-1 (h) --- --- 6.8 4, 7

July 2013 11 1138159713 038 R Rev1
I:\11\81597-13\0400\038_R_Rev1\1138159713 038 R Rev1 LydianAmulsar SeismicParameters 29JUL13.docx
Fault or Fault System1
Fault or Fault Segment1 Fault Type2
Fault Strike3
Fault Dip (°) &
Direction4
Total Segment Length (km)5
Distance to Amulsar
Gold Project Site
(km)
Qualitative Data
Confidence Level6
Total Slip Rate
Range (mm/yr)7
Estimated Recurrence
Interval8
Most Recent Historic
Earthquake (Year &
Magnitude)9
Estimated Maximum Magnitude
(M)10 Data
Sources11 Comments Sufian (SuF2) LLSS E 90 31 164 Low 0.5-1 (h) --- --- 6.8 4, 7 plus up to three fault segments west of Sufian that
may partition slip from the North Tabriz segment, we assign a horizontal slip rate of approximately 0.5-1 mm/yr to the NMF, SF, and TF segments.
Chalderan Fault CF RLSS NW 90 107 148 Low 1.5-2 (h) --- 1976 M7.1 7.2 1, 4 Ref. 1 noted that an earthquake in 1696 (M~7.0) occurred in the region, but not necessarily on the Chalderan fault. We assign a horizontal slip rate of 1.5-2 mm/yr based on the adjacent North Tabriz fault segment.
Akerin Fault AF RLSS NNW 90 155 43 Low 1-2 --- --- 7.4 4, 7 We assume a total slip rate of 1-2 mm/yr based on the similar PSSF4 segment adjacent to the west.
Lesser Caucasus Thrust
LCT 1 T NW 30 S 63 124 Low 0.5 (v) --- --- 7.3 5 From Ref. 5, horizontal shortening (based on GPS networks) occurs across the Main Caucasus Thrust (MCT) rather than the LCT. We assume a horizontal slip rate of 0.5 mm/yr for the LCT based on the lower bounds from Ref. 3 indicating that slip rates on active faults in Armenia, eastern Turkey, and northwestern Iran have di-slip rates of 0.5 to 4 mm/yr. Segment boundaries based on changes in fault strike and historic maxima for thrust fault ruptures.
LCT 2 T NW 30 S 100 87 Low 0.5 (v) 7.5 LCT 3 T NW 30 S 129 79 Low 0.5 (v) 7.6
Main Caucasus Thrust
MCT 1 T NW 30 N 52 251 Low 4 (v) --- --- 7.2 5, 7 From Ref. 5, horizontal shortening (based on GPS networks) across the MCT increases west to east 4±1 mm/yr to 10±1 mm/yr. We assume for longitude of the Amulsar Project site a dip-slip rat of 4 mm/yr for the MCT. Segment boundaries based on changes in fault strike and historic maxima for thrust fault ruptures.
MCT 2 T NW 30 N 87 218 Low 4 (v) 1139? 7.4 MCT 3 T NW 30 N 111 199 Low 4 (v) 7.5 MCT 4 T NW 30 N 75 200 Low 4 (v) 7.3
Aras Fault ArF LLSS NE 90 112 112 Low 1-2 --- --- 7.3 5, 7 We assume a total slip rate of 1-2 mm/yr based on the PSSF4 segment to the west.
Notes: 1. Fault sources identified from the available literature, data, and maps. 2. Fault type is indicated as follows: (SS) strike slip; (LLSS) left-lateral strike-slip; (RLSS) right-lateral strike-slip; (R) reverse; (T) thrust; (N) normal. Bold text indicates fault type input into seismotectonics model. 3. Fault strike represents general strike from the available literature, data, and maps. 4. Our default assumption for fault dip if not cited in the literature is: 90, strike-slip fault; 60, normal fault; 45, reverse fault; 30, thrust fault. 5. For segment lengths not cited in the literature, we estimate segment length from available fault maps, and measurements in ArcGIS™ and Google Earth™. 6. Qualitative Data Confidence Level: (High) fault segments with the most published data; (Medium) fault segments with some published data; (Low) fault segments with little to no published data. 7. Total slip rate from literature review or our assumptions. Some estimates provide (v)ertical or (h)orizontal slip rates only. 8. Recurrence Time from available information in literature review using (g)eological method or (d)irect method. 9. Most recent historic earthquake identified in literature review. Prehistoric earthquakes identified by (*). 10. Magnitude from literature review or calculated using the geologic and geometric characteristics of the potential sources, along with the fault rupture/earthquake magnitude relationships of Wells and Coppersmith (1994), Anderson et al. (1996) and Hanks and Bakun (2002). M = moment magnitude.
Fault depth to 15 km depth assumed. The estimated maximum magnitude was taken as the arithmetic mean of the fault rupture/earthquake magnitude relationships. 11. Data Sources: (1) Berberian and Yeats (1999); (2) Engdahl and Villaseñor (2002); (3) Karakhanian et al. (2002); (4) Karakhanian et al. (2004); (5) Kadirov et al. (2008); (6) Philip et al. (1992); (7) Philip et al. (2001); --- Information not located in literature review
July 2013 12 1138159713 038 R Rev1
I:\11\81597-13\0400\038_R_Rev1\1138159713 038 R Rev1 LydianAmulsar SeismicParameters 29JUL13.docx
3.3 Historical Earthquake Record We developed an earthquake catalog for this project from a search of the five online catalogs listed
below. The catalogs were searched for a broad area surrounding the Caucuses extending from 30 to
50 degrees north and 35 to 55 degrees east. The search captured epicenters for 5,724 earthquakes
(including duplicates, foreshocks and aftershocks) occurring from 2150 BC to the end of August 2011. All
but 84 of these earthquakes have occurred since the beginning of the twentieth century.
Global Centroid-Moment-Tensor (CMT) online catalog (http://www.globalcmt.org/)
US Geological Survey Centennial Earthquake Catalog (CENT) (http://earthquake.usgs.gov/research/data/centennial)
International Seismological Centre (ISC) online catalog (http://www.isc.ac.uk)
Advanced National Seismic System (ANSS) online catalog (http://www.ncedc.org/cnss/)
US Geological Survey/NEIC Preliminary Determination of Epicenters (PDE) online catalog (http://earthquake.usgs.gov/regional/neic/)
Figure 1 shows the epicenters of the 3,150 earthquakes included in the project catalog from 2150 BC to
the end of August 2011 after duplicate earthquake events were removed (duplicate removal) and the
catalog was processed to remove foreshocks and aftershocks (declustering) using the methods of
Gardner and Knopoff (1974) and Reasenberg (1985). Figure 2 shows the location of earthquakes from
the declustered project catalog within about 200 km of the Amulsar gold project site.
In addition to the earthquake catalogs listed above, we also reviewed the Armenian atlas of strong
earthquakes (Babayan 2006) that contains descriptions and isoseismal maps for the 107 relatively well-
documented, strongly felt earthquakes in Armenia that have occurred from 600 B.C. to 2003. We
reviewed the isoseismal maps to estimate the MSK felt intensity (Table 3-2) at the Amulsar gold project
site. Figure 3 shows the estimated earthquake epicenter locations for the major felt earthquakes in
Armenia and the estimated Medvedev-Sponheuer-Karnik (MSK) felt intensity (Table 3-2) at the Amulsar
gold project site. Of the 38 earthquakes in the Atlas with isoseismal maps that extend from 1139 to 2003,
only three have developed MSK intensities of VI (6) or greater at the Amulsar site.

July 2013 13 1138159713 038 R Rev1
I:\11\81597-13\0400\038_R_Rev1\1138159713 038 R Rev1 LydianAmulsar SeismicParameters 29JUL13.docx
Table 3-2 Medvedev-Sponheuer-Karnik (MSK) Scale of Seismic Intensity
Intensity Level
Apparent Force
Behavioral Effects Building/Structural Effects Geologic Effects
I Imperceptible Not felt II Very light Felt
sporadically
III Light Felt only by people at rest
IV Moderate Felt indoors, many awakened
Windows vibrate
V Fairly strong Widely felt outdoors
Interior plaster cracks, hanging objects swing, tables shift
VI Strong Fright Damage to chimneys and masonry Isolated cracks in soft ground
VII Very strong Many people flee their dwellings
Serious damage to buildings in poor condition, chimneys collapse
Isolated landslides on steep slopes
VIII Damaging General fright Many old houses undergo partial collapse, breaks in canals
Changes in wells, rockfalls onto roads
IX Destructive Panic Large breaks in substandard structures, damage to well-constructed houses, underground pipe breakages
Cracks in ground, sand eruptions, widespread landslides
X Devastating General panic Brick buildings destroyed Rails twisted, landslides on riverbanks, formation of new lakes
XI Catastrophic Few buildings remain standing, water thrown from canals
Widespread ground disturbances, tsunamis
XII Very catastrophic
Surface and underground structures completely destroyed
Upheaval of the landscape, tsunamis
The historical record of pre-instrumental and instrumental earthquakes indicates that the Amulsar gold
project site is located in a region of moderate to high seismicity. The record indicates that strong to very
strong earthquake shaking has probably occurred at the Amulsar project site at least three times in the
last 900 years.

July 2013 14 1138159713 038 R Rev1
I:\11\81597-13\0400\038_R_Rev1\1138159713 038 R Rev1 LydianAmulsar SeismicParameters 29JUL13.docx
4.0 SEISMIC HAZARD ANALYSIS In this section, we discuss the seismic hazard analysis inputs and procedures for both deterministic and
probabilistic methods.
4.1 Deterministic Seismic Hazard Analysis Deterministic seismic hazard analysis (DSHA) uses available historic, instrumental earthquake records,
and geologic data to generate discrete, single-valued estimates of ground motion at a site. Typically, one
or more earthquakes are specified by magnitude and location with respect to the site. DSHA uses a
concept of maximum credible earthquake (MCE). The MCE is the largest earthquake possible that
appears along a recognized fault or within a geographically defined tectonic province, under the presently
known or presumed tectonic framework (ICOLD 1989). In DSHA, little regard is given to the earthquake
recurrence interval, which may vary from less than a hundred years to more than ten thousand years,
depending on the geologic environment under consideration. DSHA cannot be used to estimate the
return period or probability of occurrence of specified earthquake ground motions.
The specific seismic source and site location parameters required to estimate ground motions in a DSHA
are:
Fault (source) type
Maximum magnitude
Closest horizontal distance to the surface projection of the fault rupture plane
Closest distance to the rupture plane
Focal depth
Site soil conditions
4.2 Probabilistic Seismic Hazard Analysis Probabilistic seismic hazard analysis (PSHA) estimates the likelihood that specified earthquake ground
motions will be exceeded during a specified time. The likelihood of being exceeded is determined based
on the probability of occurrence of all earthquakes at different locations on each significant seismic
source, and the rate at which ground motions attenuate away from the earthquake source.
4.2.1 Methodology The PSHA technique used for this study follows the procedure published by Cornell (1968) and McGuire
(1976, 2004). The PSHA calculations were carried out using the commercially available software EZ-
FRISK by Risk Engineering v. 7.62 (2012). The methodology involves computing how often a specified
level of ground motion is exceeded at the site. Specifically, the annual rate of events, n, that produces a
ground motion parameter, SA(Tn), that exceeds a specified level, Sa(Tn), at the site is computed. The
inverse of n is the return period.

July 2013 15 1138159713 038 R Rev1
I:\11\81597-13\0400\038_R_Rev1\1138159713 038 R Rev1 LydianAmulsar SeismicParameters 29JUL13.docx
The standard hazard is written as:
𝜈(𝑆𝐴(𝑇𝑛) > 𝑆𝑎(𝑇𝑛)) = ∫ ∫ ∫ > εεε ε dmdddfdfmfdmTnSTnSPMN DMaAm )()()(],,|)()([)( min
Where d is the site-to source distance, m is the earthquake magnitude; ε describes the number of
logarithmic standard deviations by which the logarithmic ground motion deviates from the median; Tn is
the natural period of vibration in seconds; Nm(Mmin) is the annual rate of earthquakes with a magnitude
greater than or equal to Mmin. fM(m), fD(d), fε(ε) are probability density functions for magnitude and
distance and epsilon. These probability density functions describe the relative rates of different
earthquake scenarios.
The ground motion variability is contained in the term P(SA(Tn)>Sa(Tn)|m,d,ε), where:
𝑃(𝑆𝐴(𝑇𝑛) > 𝑆𝑎(𝑇𝑛)|𝑚,𝑑, ε) = � 𝑓𝑆𝑎(𝑆𝑎 ,𝑚,𝑑, ε)𝑑𝑆𝑎∞
𝑆𝑎
where fSa(Sa,m,d,ε) is the probability density function for the ground motion. This is defined by the ground
motion attenuation model.
For multiple seismic sources, the annual rate of events with ground motions that exceed Sa(Tn) is the
sum of the annual rate of events from the individual sources. This assumes the sources are independent.
To convert the annual rate of events to probability of being exceeded at least once in a period of T years,
a Poisson earthquake recurrence probability model is generally considered. For a Poisson process,
𝑃(𝑆𝐴(𝑇𝑛) > 𝑆𝑎(𝑇𝑛)|𝑇) = 1 − 𝑒−(𝜈�𝑆𝐴(𝑇𝑛)>𝑆𝑎(𝑇𝑛)�𝑇)
The annual probability is the probability for T=1.
The hazard level is generally given in terms of probability of being exceeded in T years. For a Poisson
model, the equivalent annual rate is given by:
𝜈(𝑆𝐴(𝑇𝑛) > 𝑆𝑎(𝑇𝑛)) = −ln (1 − 𝑃(𝑆𝐴(𝑇𝑛) > 𝑆𝑎(𝑇𝑛)|𝑇))
𝑇
For a 10-percent chance of being exceeded in 50 years, T =50 years and P = 0.1. Then, n, equals
0.0021/yr. The inverse (return period) of this rate is 475 years.

July 2013 16 1138159713 038 R Rev1
I:\11\81597-13\0400\038_R_Rev1\1138159713 038 R Rev1 LydianAmulsar SeismicParameters 29JUL13.docx
4.2.2 Parameters Used in the Probabilistic Seismic Hazard Assessment A summary of the source parameters used in the PSHA are given in Table 4-1. The source parameters
for the PSHA include the following:
Fault (source) type
Probability of activity
Earthquake model (exponential or characteristic)
Slip rate (or recurrence interval)
Maximum magnitude
Closest horizontal distance to the surface projection of the fault rupture plane
Closest distance to the rupture plane
Focal depth
Site soil conditions
4.2.3 Uncertainties There are two types of uncertainties considered in the probabilistic hazard model: aleatory variability and
epistemic uncertainty. Aleatory variability is the natural randomness in a process because of the
simplified modeling of a complex process. The aleatory variability is parameterized by a probability
density function (Abrahamson 2006, 2009). Epistemic uncertainty is the scientific uncertainty in the
simplified model of the process and is parameterized by alternative models (Abrahamson 2006, 2009).
The simplified model parameters for seismic sources include the maximum magnitude, slip rate, ground
motion attenuation, and earthquake magnitude probability density function.
Epistemic uncertainty is commonly handled in a logic tree approach. In this study, the epistemic
uncertainty was considered with respect to the following parameters:
Earthquake ground-motion prediction equations (GMPE): The four shallow crustal attenuation relationships used in this study were weighted equally as indicated in Table 4-1.
Maximum magnitude of the fault sources: The maximum magnitudes are listed in Table 3-1. A range of ±0.3 magnitude units was used to define the upper and lower bounds. The preferred maximum magnitude was given a weight of 0.6 and the upper and lower bounds were given weights of 0.2 each.
Slip rate of the fault sources: The range of slip rates for each of the seismic sources are listed in Table 3-1. The preferred slip rate was taken as the midpoint of the range. For the faults and fault segments with a single slip rate in Table 3-1, this slip rate was the preferred slip rate. For a slip rate of 0.5 mm/yr, the range in slip rates was defined by ±0.25 mm/yr. For a slip rate of 4 mm/yr, the range in slip rates was defined by ±2 mm/yr. The preferred slip rate was given a weight of 0.6 and the upper and lower bounds were given weights of 0.2 each.

July 2013 17 1138159713 038 R Rev1
I:\11\81597-13\0400\038_R_Rev1\1138159713 038 R Rev1 LydianAmulsar SeismicParameters 29JUL13.docx
4.2.4 Disaggregation The hazard curve gives the combined effect of magnitudes and distances from each source on the
probability of exceeding a given ground motion level. When disaggregating the hazard, the fractional
contribution of different scenario groups (e.g., magnitude and distance) to the total hazard is computed.
The disaggregation identifies which seismic sources contribute to the hazard at the site (Abrahamson
2006, 2009).
In addition, the quantification of the parameter epsilon (ε) can also be obtained through the
disaggregation analysis. The parameter epsilon describes the number of logarithmic standard deviations
by which the logarithmic ground motion deviates from the median (McGuire 2004) given by the predictive
ground motion equation. This parameter, along with the magnitudes and distances, are useful
parameters for selecting and scaling existing earthquake ground motions for dynamic analysis (Baker and
Cornell 2005, 2006).
In this report, the results of the disaggregation are presented as a two-dimensional magnitude and
distance bins. The bins define the range over which the contribution to the hazard is computed. For
example, in one dimension a magnitude bin of 5.9 to 6.0 is the contribution to the hazard from the
earthquakes with a magnitude between 5.9 and 6. In two dimensions, it would become the contribution to
the hazard from the earthquakes with a magnitude between 5.9 and 6 located 0 to 5 km from the site.
4.3 Ground Motion Prediction Equations The GMPE and their relative weightings for the crustal fault seismic sources are summarized in Table 4-1
below. These GMPEs were developed as part of the Next Generation Attenuation program in 2008, and
are applicable to plate boundary regions with seismically active faults such as Armenia.
Table 4-1 Earthquake GMPEs and Their Relative Weightings Used in the Amulsar Gold Project Site Seismic Hazard Analysis
Earthquake Ground-Motion Prediction Equation Weighting Applicable Seismic Sources
Abrahamson and Silva (2008) NGA 0.25
All Crustal Fault Sources Boore and Atkinson (2008) NGA 0.25 Campbell and Bozorgnia (2008) NGA 0.25 Chiou and Youngs (2008) NGA 0.25

July 2013 18 1138159713 038 R Rev1
I:\11\81597-13\0400\038_R_Rev1\1138159713 038 R Rev1 LydianAmulsar SeismicParameters 29JUL13.docx
5.0 RESULTS AND DISCUSSION In this section, we present the results of the seismic hazard analysis using probabilistic and deterministic
methods. Site hazard curves and 5-percent damped response spectra are provided as well as seismic
parameters specified in the 2009 IBC-ASCE 7-05 procedures.
5.1 Site Soil Classification Site Class B as defined in the 2009 IBC-ASCE 7-05 standard was used for the ground motion and
response spectra calculations at the Amulsar gold project site. Site Class B is defined as a site with an
average shear wave velocity (Vs) between 760 and 1500 m/s for the upper 30 m of the soil column (Vs30).
Where the soil Site Class is different from these conditions, site coefficients are applied to adjust the
5-percent damped acceleration response spectrum.
5.2 Hazard Curves Figure 4 shows PGA, 0.2-second and 1.0-second, 5-percent damped spectral acceleration hazard curves
developed for a soil Site Class B at the HLF site. Interpolation of curves shown in Figure 4 indicates that
the 475-year return period PGA (annual frequency of being exceeded of 0.0021) is 0.18 g. The 475-year
return period 0.2-second and 1.0-second spectral accelerations are 0.44 g and 0.12 g for soil Site Class
B, respectively.
Figure 5 shows PGA, 0.2-second and 1.0-second, 5-percent damped spectral acceleration hazard curves
developed for a Site Class B at the crusher facility. Figure 6 shows PGA, 0.2-second and 1.0-second,
5-percent damped spectral acceleration hazard curves developed for a soil Site Class B at the waste rock
dump site. Figure 7 shows PGA, 0.2-second and 1.0-second, 5-percent damped spectral acceleration
hazard curves developed for a Site Class B at the open pit site.
5.3 Response Spectra Figure 8 shows the 5-percent damped, uniform hazard acceleration response spectra for the 475-year,
1,000-year, and 2,475-year return periods for soil Site Class B as a function of structural period for
periods ranging from 0.01 to 10 seconds at the HLF site. The spectral acceleration at a period of 0.01
seconds is essentially equivalent to the PGA. The term uniform hazard is used because there is an equal
probability of exceeding the ground motions at any spectral period (Abrahamson 2006, 2009). Figure 8
shows that the peak spectral response typically occurs at a period of about 0.15 seconds. Table 5-1
presents some selected spectral accelerations at the HLF site.

July 2013 19 1138159713 038 R Rev1
I:\11\81597-13\0400\038_R_Rev1\1138159713 038 R Rev1 LydianAmulsar SeismicParameters 29JUL13.docx
Table 5-1 Selected Spectral Accelerations for the HLF Site, Amulsar Gold Project, Central Armenia, IBC 2009-ASCE 7-05 Site Class B
Return Period PGA (g) 0.2 sec (g) 1.0 sec (g)
475-years 0.18 0.44 0.12 1,000-years 0.24 0.59 0.16 2,475-years 0.33 0.82 (Ss) 0.24 (S1)
Figure 9 shows the 5-percent damped, uniform hazard acceleration response spectra for the 475-year,
1,000-year, and 2,475-year for soil Site Class B as a function of structural period for periods ranging from
0.01 to 10 seconds at the crusher facility. Table 5-2 presents some selected spectral accelerations at the
crusher facility site.
Table 5-2 Selected Spectral Accelerations for the Crusher Facility Site, Amulsar Gold Project, Central Armenia, IBC 2009-ASCE 7-05 Site Class B
Return Period PGA (g) 0.2 sec (g) 1.0 sec (g)
475-years 0.20 0.47 0.12 1,000-years 0.27 0.64 0.17 2,475-years 0.37 0.91 (Ss) 0.26 (S1)
Figure 10 shows the 5-percent damped, uniform hazard acceleration response spectra for the 475-year,
1,000-year, and 2,475-year for Site Class B as a function of structural period for periods ranging from
0.01 to 10 seconds at the waste rock dump. Table 5-3 presents some selected spectral accelerations at
the waste dump site.
Table 5-3 Selected Spectral Accelerations for the Waste Dump Site, Amulsar Gold Project, Central Armenia, IBC 2009-ASCE 7-05 Site Class B
Return Period PGA (g) 0.2 sec (g) 1.0 sec (g)
475-years 0.21 0.50 0.13 1,000-years 0.29 0.69 0.18 2,475-years 0.40 0.99 (Ss) 0.28 (S1)
Figure 11 shows the 5-percent damped, uniform hazard acceleration response spectra for the 475-year,
1,000-year, and 2,475-year for soil Site Class B as a function of structural period for periods ranging from
0.01 to 10 seconds at the open pit. Table 5-4 presents some selected spectral accelerations at the open
pit site.

July 2013 20 1138159713 038 R Rev1
I:\11\81597-13\0400\038_R_Rev1\1138159713 038 R Rev1 LydianAmulsar SeismicParameters 29JUL13.docx
Table 5-4 Selected Spectral Accelerations for Open Pit Site, Amulsar Gold Project, Central Armenia, IBC 2009-ASCE 7-05 Site Class B
Return Period PGA (g) 0.2 sec (g) 1.0 sec (g)
475-years 0.18 0.44 0.12 1,000-years 0.24 0.59 0.16 2,475-years 0.33 0.82 (Ss) 0.24 (S1)
Figure 8 through Figure 11 and Table 5-1 through Table 5-4 indicate that the ground motions are largest
at the waste rock dump and smallest at the open pit. The differences in spectral acceleration ranged from
approximately 8 to 18 percent depending on the spectral period and return period. The differences in
spectral acceleration at the four sites can be attributed to differences in the distance to the fault segment
PSSF4.
5.4 Seismic Source Contribution The seismic source contribution to the probabilistic seismic hazard at the HLF site at the Amulsar gold
project is shown in Figure 12 for the PGA. Data shown in Figure 12 indicate that for PGAs greater than
0.02 g, the major contribution to the ground motion is from the fault segment PSSF4 (Table 3-1). Similar
results were observed for other spectral periods at the HLF site, and similar results were observed at the
crusher facility, waste dump, and open pit sites.
The contribution to the seismic hazard at the four sites is dominated by the fault segment PSSF4. These
results are not surprising since this fault segment has a moderate average slip rate and is relatively close
(about 10 to 12 km) to the four sites.
5.5 Hazard Disaggregation by Magnitude, and Distance Disaggregation by magnitude and distance at the HLF site at the Amulsar gold project for the 475-year
return period PGA ground motion is shown in Figure 13. Disaggregation of the 475-year PGA indicates
that the major contributor to the total hazard is from a crustal earthquake (M 7.2) at distances less than 15
km from the site on fault segment PSSF4. The mean magnitude earthquake for the PGA at the heap
leach pad facility is M 6.3 at a distance of 21.3 km from the site.
Figures 14 and 15 show the results of disaggregation for magnitude and distance at the HLF site. Results
are shown for the 475-year return period 0.2-second and 1.0-second spectral accelerations. Table 5-5
summarizes the disaggregation by magnitude and distance at the heap leach pad facility at the Amulsar
gold project for the 475-year return period PGA, 0.2-second and 1.0-second spectral accelerations,
respectively.

July 2013 21 1138159713 038 R Rev1
I:\11\81597-13\0400\038_R_Rev1\1138159713 038 R Rev1 LydianAmulsar SeismicParameters 29JUL13.docx
Table 5-5 Disaggregation Results for 475-year Ground Motions at the HLF Site, Amulsar Gold Project, Central Armenia
Return Period
Period (seconds)
Acceleration (g)
Mean Magnitude
(M)
Mean Distance
(km)
Modal Magnitude
(M)
Modal Distance
(km)
475-year PGA 0.18 6.3 21.3 7.2 13.4 475-year 0.2 0.44 6.3 22.1 7.2 13.4 475-year 1.0 0.12 6.8 34.9 7.2 13.3
Figures 16 to 18 present the disaggregation by magnitude and distance at the HLF site for the 2,475-year
return period PGA, 0.2-second and 1.0-second spectral accelerations, respectively. Table 5-6
summarizes the disaggregation by magnitude and distance results at the HLF site for the 2,475-year
return period PGA, 0.2-second and 1.0-second spectral accelerations, respectively.
Table 5-6 Disaggregation Results for 2,475-year Ground Motions at HLF Site, Amulsar Gold Project, Central Armenia
Return Period
Period (seconds)
Acceleration (g)
Mean Magnitude
(M)
Mean Distance
(km)
Modal Magnitude
(M)
Modal Distance
(km)
2,475-year PGA 0.33 6.5 17.3 7.2 13.4 2,475-year 0.2 0.82 6.5 17.6 7.2 13.4 2,475-year 1.0 0.24 7.0 23.1 7.2 13.4
Figures 19 to 21 present the disaggregation by magnitude and distance results at the crusher facility for
the 475-year return period PGA, 0.2-second and 1.0-second spectral accelerations, respectively. Figures
22 to 24 present the disaggregation by magnitude and distance at the crusher facility for the 475-year
return period PGA, 0.2-second and 1.0-second spectral accelerations, respectively.
Figures 25 to 27 present the disaggregation by magnitude and distance at the waste rock dump at the
Amulsar gold project for the 475-year return period PGA, 0.2-second and 1.0-second spectral
accelerations, respectively. Table 5-7 summarizes the disaggregation by magnitude and distance at the
waste dump site for the 475-year return period PGA, 0.2-second and 1.0-second spectral accelerations,
respectively.

July 2013 22 1138159713 038 R Rev1
I:\11\81597-13\0400\038_R_Rev1\1138159713 038 R Rev1 LydianAmulsar SeismicParameters 29JUL13.docx
Table 5-7 Disaggregation Results for 475-year Ground Motions at Waste Dump Site, Amulsar Gold Project, Central Armenia
Return Period
Period (seconds)
Acceleration (g)
Mean Magnitude
(M)
Mean Distance
(km)
Modal Magnitude
(M)
Modal Distance
(km)
475-year PGA 0.21 6.3 15.9 7.2 9.6 475-year 0.2 0.50 6.3 16.7 7.2 9.6 475-year 1.0 0.13 6.7 28.1 7.2 9.6
Figures 28 to 30 present the disaggregation by magnitude and distance at the waste dump site at the
Amulsar gold project for the 2,475-year return period PGA, 0.2-second and 1.0-second spectral
accelerations, respectively. Table 5-8 summarizes the disaggregation by magnitude and distance at the
waste dump site for the 2,475-year return period PGA, 0.2-second and 1.0-second spectral accelerations,
respectively
Table 5-8 Disaggregation Results for 2,475-year Ground Motions at Waste Dump Site, Amulsar Gold Project, Central Armenia
Return Period
Period (seconds)
Acceleration (g)
Mean Magnitude
(M)
Mean Distance
(km)
Modal Magnitude
(M)
Modal Distance
(km)
2,475-year PGA 0.40 6.4 12.3 7.2 9.6 2,475-year 0.2 0.99 6.4 12.6 7.2 9.6 2,475-year 1.0 0.28 6.9 16.4 7.2 9.6
Figures 31 to 33 present the disaggregation by magnitude and distance at the crusher facility site for the
475-year return period PGA, 0.2-second and 1.0-second spectral accelerations, respectively. Figures 34
to 36 present the disaggregation by magnitude and distance at the crusher facility site for the 475-year
return period PGA, 0.2-second and 1.0-second spectral accelerations, respectively.
5.6 Deterministic Seismic Hazard Analysis We evaluated the deterministic response spectra (median and 84th-percentile) developed from each of the
known major fault sources. The response spectra were developed for soil Site Class B sites (Vs30 = 760
to 1500 m/s) at the HLF, crusher facility, waste dump and open pit sites. The median and 84th percentile
acceleration response spectra for the HLF site are shown in Figure 37. The median and 84th percentile
acceleration response spectra for the crusher facility site are shown in Figure 38. The median and 84th
percentile acceleration response spectra for the waste dump site are shown in Figure 39. The median
and 84th percentile acceleration response spectra for the open pit site are shown in Figure 40. Table 5-9
lists PGA values for each site.

July 2013 23 1138159713 038 R Rev1
I:\11\81597-13\0400\038_R_Rev1\1138159713 038 R Rev1 LydianAmulsar SeismicParameters 29JUL13.docx
Table 5-9 Deterministic PGA Values for Selected Sites at the Amulsar Gold Project Site
Site Median (50th-percentile)
PGA (g) 84th-percentile
PGA (g)
Heap Leach Facility 0.22 0.37 Crusher Facility 0.24 0.42
Waste Dump 0.27 0.46 Open Pit 0.22 0.37
5.7 2009 IBC-ASCE 7-05 Maximum Considered Earthquake The 2009 IBC-ASCE 7-05 seismic design provisions define design-level ground motions based on a
5-percent damped acceleration response spectrum for a Maximum Considered Earthquake (MCEQ). The
MCEQ spectrum is developed using spectral acceleration values at 0.2 second (SS) and 1.0 second (S1)
calculated with a 2-percent probability of being exceeded in 50 years, or 2,475-year return period, on a
soil Site Class B site—a site with an average shear-wave velocity on the upper 30 m (Vs30) between 760
and 1,500 m/s. For this study, the SS and S1 spectral acceleration values were determined from our site-
specific PSHA for a Vs30 of 760 m/s. Spectral acceleration values for HLF and crushing plant sites are
listed in Table 5-10 and Table 5-11 below:
Table 5-10 PGA and Selected Spectral Accelerations (5% Damped) for Selected Return Periods at the HLF Site1
Return Period (years)
PGA (g)
Sa (0.2 seconds) (g)2
Sa (1.0 second) (g)2
475 0.18 0.44 0.12 2,475 0.33 0.82 (SS) 0.24 (S1)
Notes: 1. All values are calculated for outcropping rock conditions (Vs30 = 760 to 1500 m/sec) 2. SS and S1 are from the Maximum Considered Earthquake for the 2009 IBC-ASCE 7-05 short and long period spectral
accelerations, respectively.
Table 5-11 PGA and Selected Spectral Accelerations (5% Damped) for Selected Return Periods at the Crushing Plant Site1
Return Period (years)
PGA (g)
Sa (0.2 seconds) (g)2
Sa (1.0 second) (g)2
475 0.20 0.47 0.12 2,475 0.37 0.91 (SS) 0.26 (S1)
Notes: 1. All values are calculated for outcropping rock conditions (Vs30 = 760 to 1500 m/sec) 2. SS and S1 are from the Maximum Considered Earthquake for the 2009 IBC-ASCE 7-05 short and long period spectral
accelerations, respectively.
The 2,475-year values are to determine the MCEQ based upon the 2009 IBC-ASCE 7-05 procedures.

July 2013 24 1138159713 038 R Rev1
I:\11\81597-13\0400\038_R_Rev1\1138159713 038 R Rev1 LydianAmulsar SeismicParameters 29JUL13.docx
5.8 Long Period Transition Period ASCE 7-05 procedures require the use of a long-period transition period (TL–in seconds) for the
development of MCEQ design response spectra. Maps for the USA showing the distribution of long
period transition periods are provided in ASCE 7-05, Figures 22-15 to 22-20 (pages 228-233). Maps are
not provided for regions outside of the USA.
We recommend a long period transition period (TL) of 12 seconds for the Amulsar gold project site. Our
recommendation is based on our review of the distribution of long period transitions for the western USA,
as shown in ASCE 7-05, Chapter 22. The seismic hazard in western North America and in coastal
California in particular, has its major contribution from frequent earthquakes associated with the strike-slip
and reverse faults within the wider San Andreas fault system that makes up this part of the North
America-Pacific tectonic plate boundary. The seismotectonic situation in southern California is very
similar to that in this part of Eurasia (Figure 1) where the Amulsar gold project site is located. Thus, we
consider a long period transition period (TL) of 12 seconds appropriate for structural design for the
proposed Amulsar building and non-building facilities where 2009 IBC-ASCE 7-05 procedures are
applied.

July 2013 25 1138159713 038 R Rev1
I:\11\81597-13\0400\038_R_Rev1\1138159713 038 R Rev1 LydianAmulsar SeismicParameters 29JUL13.docx
6.0 SUMMARY OF PRINCIPAL CONCLUSIONS AND RECOMMENDATIONS Historical records of earthquake occurrence and damage indicate that the Amulsar gold project site is
located in a region of moderate to high seismicity. These results are in general agreement with the
results of the PSHA that indicate a 475-year return period PGA value of 0.2 g at the project site. Some
principal conclusions are presented below:
There have been 107 relatively well-documented, strongly felt earthquakes in Armenia that have occurred from 600 B.C. to 2003. Historical records indicate that the site has experienced strong to very strong shaking at least three times in the last 900 years.
The Amulsar gold project site is situated within a continent-continent collision zone associated with the convergence of the Arabian and Eurasian tectonic plates. There are at least 17 fault zones with 53 fault segments within approximately 250 km of the project site.
The Pambak-Sevan-Sunik fault Segment 4 (PSSF4) is located 10 km north of the Amulsar gold project area at its closest approach. PSSF4 has an average horizontal slip rate of 1.55 mm/yr. The estimated maximum magnitude earthquake is M 7.2 for the PSSF4 segment.
A seismotectonic model containing 53 separate seismic sources is used to develop probabilistic and deterministic seismic hazard analyses specific to the Amulsar gold project site location.
Probabilistic analyses yielded a 475-year return period PGA ranging from 0.18 g and 0.21 g and a 2,475-year return period PGA ranging from 0.33 g and 0.40 g for outcropping rock at the four sites investigated.
Deterministic results PGA values of median PGA values ranging 0.22 g and 0.27 g across the four sites. Deterministic results PGA values of 84th percentile PGA values ranging 0.37 g and 0.46 g across the four sites.
Recommended 2009 IBC-ASCE 7-05 parameters for the Crusher facility site are 0.91 g (SS) and 0.26 g (S1) for the MCEQ. A long period transition period (TL) of 12 seconds is recommended for the Amulsar project site.

July 2013 26 1138159713 038 R Rev1
I:\11\81597-13\0400\038_R_Rev1\1138159713 038 R Rev1 LydianAmulsar SeismicParameters 29JUL13.docx
7.0 CLOSING It has been our pleasure to provide this updated seismic hazard analysis for Lydian International Ltd. The
results of the assessment indicate a moderate to high level of seismic hazard based on the probabilistic
analyses. We consider that the probabilistic results are the most suitable for moving forward with
feasibility-level seismic design. If you have any questions or concerns, please do not hesitate to contact
us.
GOLDER ASSOCIATES INC.
Anthony Augello, PhD, PE Alan Hull, PhD, CEG Senior Engineer Principal
AA/AH/rg
July 2013 27 1138159713 038 R Rev1
I:\11\81597-13\0400\038_R_Rev1\1138159713 038 R Rev1 LydianAmulsar SeismicParameters 29JUL13.docx
8.0 REFERENCES Abrahamson, N. 2006. Seismic hazard assessment: Problems with Current Practice and Future
Developments, First European Conference on Earthquake Engineering and Seismology, Geneva, Switzerland, September 3-8.
Abrahamson, N. 2009. The State of the Practice of Seismic Hazard Analysis From the Good to the Bad, Earthquake Engineering Research Institute Distinguished Lecture Series.
Abrahamson, N., and W. Silva. 2008. Summary of the Abrahamson and Silva NGA ground-motion relations, Earthquake Spectra, Vol. 24, pp. 67-98.
American Society of Civil Engineers (ASCE). 2005. Minimum design loads for buildings and other structures. American Society of Civil Engineers ASCE 7-05.
Anderson, J.G., S.G. Wesnousky, and M.W. Stirling. 1996. Earthquake size as a function of fault slip rate. Bulletin of the Seismological Society of America, v. 86, n. 3, pp. 683-690.
Babayan, T. 2006. Atlas of strong earthquakes of the Republic of Armenia, Artsakh and adjacent territories from Ancient Time to 2003, National Academy of the Sciences Republic of Armenia. 139 pp.
Baker, J.W., and C.A. Cornell. 2005. "A Vector-Valued Ground Motion Intensity Measure Consisting of Spectral Acceleration and Epsilon," Earthquake Engineering & Structural Dynamics, 34 (10), 1193-1217.
Baker, J.W., and C.A. Cornell. 2006. "Which Spectral Acceleration Are You Using?” Earthquake Spectra, 22 (2) 293-312.
Berberian, M., and R.S. Yeats. 1999. Patterns of historical earthquake rupture in the Iranian Plateau. Bulletin of the Seismological Society of America, v. 89, pp. 120-139.
Boore, D., and G. Atkinson. 2008. Ground-Motion Prediction Equations for the Average Horizontal Component of PGA, PGV, and 5%-Damped PSA at Spectral Periods between 0.01 s and 10.0 s, Earthquake Spectra 24, pp. 99-138.
Campbell, K., and Y. Bozorgnia. 2008. NGA Ground Motion Model for the Geometric Mean Horizontal Component of PGA, PGV, PGD and 5% Damped Linear Elastic Response Spectra for Periods Ranging from 0.01 to 10 s. Earthquake Spectra 24, pp. 139-172.
Chiou, B., and R. Youngs. 2008. An NGA Model for the Average Horizontal Component of Peak Ground Motion and Response Spectra. Earthquake Spectra 24, pp. 173-215.
Cornell, C.A. 1968. Engineering Seismic Risk Analysis, Bulletin of Seismological Society of America, Vol. 58, N0 5, pp. 1583-1606.
Dilek, Y., N. Imamverdiyev, and S. Altunkaynak. 2010. Geochemistry and tectonics of Cenozoic volcanism in the Lesser Caucasus (Azerbaijan) and the peri-Arabian region: collision-induced mantle dynamics and its magmatic fingerprint. International Geology Review, v. 52, no. 4-6, pp. 536-578.
Engdahl, E.R., and A. Villaseñor. 2002. Global Seismicity: 1900–1999, in: Lee, W.H.K., H. Kanamori, P.C. Jennings, and C. Kisslinger (editors), International Handbook of Earthquake and Engineering Seismology, Part A, Chapter 41, pp. 665–690, Academic Press.

July 2013 28 1138159713 038 R Rev1
I:\11\81597-13\0400\038_R_Rev1\1138159713 038 R Rev1 LydianAmulsar SeismicParameters 29JUL13.docx
Gardner, J., and L. Knopoff. 1974. Is the sequence of earthquakes in Southern California, with aftershocks removed, Poissonian? Bulletin of the Seismological Society of America, v. 64, No. 5, pp. 1363-1367.
Global Seismic Hazard Assessment Program (GSHAP), Annali Di Geofisica, Vol. 42, N6, Institute of Geophysics, ETHZ, Zurich, Switzerland.
Golder Associates Inc. (Golder). 2008. Scoping Study Amulsar Project Heap Leach Facility Central Armenia. Project 085-14950028.500/B.1, November.
Hanks, T.C., and W.H. Bakun. 2002. A Bilinear Source-Scaling Model for M-log A Observations of continental Earthquakes. Bulletin of the Seismological Society of America, v. 92, no. 5, pp. 1841-1846.
International Code Council. 2009. International Building Code.
Kadirov, F., S. Mammadov, R. Reilinger, and S. McClusky. 2008. Some New Data On Modern Tectonic Deformation and Active Faulting In Azerbijan (According To Global Positioning System Measurements). Azerbaijan National Academy of Sciences Proceedings The Sciences of Earth, No. 1, p. 82-88, available Online (accessed 12-6-2011) at: http://www.gia.az/upload/file/papers/kadirov_data_modern_tectonic_faulting.pdf
Karakhanian, A.S., R. Djrbashian, V. Trifonov, H. Philip, S. Arakelian, and A. Avagian. 2002. Holocene-historical volcanism and active faults as natural risk factors for Armenia and adjacent countries. Journal of Volcanology and Geothermal Research, v. 113, pp. 319-344.
Karakhanian, A.S., V.G. Trifonov, H. Philip, A. Avagyan, K. Hessami, F. Jamali, M.S. Bayraktutan, H. Bagdassarian, S. Arakelian, V. Davtian, and A. Adilkhanyan. 2004. Active faulting and natural hazards in Armenia, eastern Turkey and northwestern Iran. Tectonophysics, v. 380, pp. 189-219.
McGuire, R. 2004. Seismic Hazard and Risk Analysis, Earthquake Engineering Research Institute, MNO-10.
Philip, H., A. Avagyan, A. Karakhanian, J.F. Ritz, and S. Rebai. 2001. Slip rates and recurrence intervals of strong earthquakes along the Pambak-Sevan-Sunik fault (Armenia). Tectonophysics, v. 343, no. 3–4, pp. 205–232.
Philip, H., E. Rogozhin, A. Cisternas, J.C. Bousquet, B. Borisov, and A. Karakhanian. 1992. The Armenian earthquake of 1988 December 7: faulting and folding, neotectonics and paleoseismicity. Geophysical Journal International, v. 110, pp. 141-158.
Reasenberg, P. 1985. Second order moment of central California seismicity, 1969-1982. Journal of Geophysical Research 90, pp. 5479-5495.
Risk Engineering. 2012. User’s Manual for EZ-FRISK Version 7.62, Software for Earthquake Ground Motion Estimation.
Wells, D.L., and K.J. Coppersmith. 1994. New empirical relationships among magnitude, rupture length, rupture width, rupture area, and surface displacement. Bulletin of the Seismological Society of America, v. 84, no. 4, pp. 974-1002.
Youngs and Coppersmith. 1985. Implications of Fault Slip Rates and Earthquake Recurrence Models to Probabilistic Seismic Hazard Estimates. Bulletin of the Seismological Society of America, Vol. 75, No. 4, pp. 939-964.

FIGURES

SOURCE:Surface and Bathymetry data set is the GEBCO_08 griddeveloped by GEBCO.
200 0 200Kilometers
HISTORIC EARTHQUAKES
AMULSAR GOLD PROJECTLYDIAN INTERNATIONAL
FIGURE 1
113-81597
CHECK
REVIEW
KJK
KJK
1/27/2012 0
³TITLE
PROJECT
PROJECT No.
DESIGN
GIS
FILE No.
SCALE AS SHOWN REV.
1/27/2012
113-81597-01
ARMENIA
AH 1/27/2012
#*
CaspianSea
Seaof Azov
BlackSea
Baku
TehranAleppo
Kharkiv
Baghdad
Yerevan
Donets'k
Damascus
T'Bilisi
Volgograd
Rostov-on-Don
Dnipropetrovs'k
Iran
Russia
Iraq
Turkey
Kazakhstan
Syria
Ukraine
AzerbaijanTurkmenistan
Jordan
Georgia
Saudi Arabia
Armenia
Lebanon
Israel
Israel
Kuwait55° E
55° E
50° E
50° E
45° E
45° E
40° E
40° E
35° E
35° E50° N 50° N
45° N 45° N
40° N 40° N
35° N 35° N
30° N 30° N
LEGEND#* AMULSAR GOLD PROJECT SITEEPICENTER MAGNITUDE
4.0 - 4.95.0 - 5.96.0 - 6.97.0 - 7.9
> 8.0

50 0 50Kilometers
HISTORIC EARTHQUAKESAND FAULT SEISMIC SOURCES
AMULSAR GOLD PROJECTLYDIAN INTERNATIONAL
FIGURE 2
113-81597
CHECK
REVIEW
KJK
KJK
1/27/2012 0
³TITLE
PROJECT
PROJECT No.
DESIGN
GIS
FILE No.
SCALE AS SHOWN REV.
1/27/2012
113-81597-02
ARMENIA
AH 1/27/2012
#*
Mingǝçevir Su AnbariniSemkir Reservoir
SevanLake
MCT
LCT
NF
CF
MF
IF
ArF
GSKF
ESF
SFKF
PSSF1
GF5
PSSF3
TF1
DF
PSSF4
NTF
PSSF2
AF (Akerin)
NMF2
AkF2
GF4
PSSF5c
GS K Fa
AkF3
GF3a
NMF1SuF1
GF1
SuF2
PSSF5b
TF2
PSSF5a
GF2 (Garni)
AkF1
GF3b
GSKFb GSKFc GSKFe
GSKFd
Unnamed Fault North of PSSF1
Unnamed Fault 1 Ghegham Area
Spitak Fault
Unnamed Fault 2South of PSSF5
Unnamed Fault 2
Ghegham Area
Unnamed Fault 1South of PSSF5
Iran
Georgia
Armenia
Azerbaijan
Turkey
Russia
Azerbaijan
Yerevan
T'Bilisi
47° E
47° E
46° E
46° E
45° E
45° E
44° E
44° E
42° N 42° N
41° N 41° N
40° N 40° N
39° N 39° N
LEGEND#* AMULSAR GOLD PROJECT SITE
FAULT SEISMIC SOURCESEPICENTER MAGNITUDE
4.0 - 4.95.0 - 5.96.0 - 6.97.0 - 7.9
SOURCE:Surface and Bathymetry data set is the GEBCO_08 griddeveloped by GEBCO.

#*
49° E
49° E
43° E 48° E
48° E
47° E
47° E
46° E
46° E
45° E
45° E
44° E
44° E43° N
42° N 42° N
41° N 41° N
40° N 40° N
39° N 39° N
38° N 38° N
REFERENCES1) Map data provided by ESRI.2) Babayan, Tamara Hovhannesi. 2006. Atlas of Strong Earthquakes of the Republic Armenia, Artsakh and Adjacent Territories from Ancient Times through 2003. Gyumri, Armenia: National Academy of Sciences of the Republic of Armenia Institute of the Geophysics and Engineering Seismology.
100 0 100Kilometers SOURCE EARTHQUAKES AND FELT
INTENSITIES FOR HISTORIC EARTHQUAKES
AMULSAR GOLD PROJECTLYDIAN INTERNATIONAL
FIGURE 3
113-81597
CHECKREVIEW
DJMDJM
1/28/2012 0
³TITLE
PROJECT
PROJECT No.DESIGN
GIS
FILE No.SCALE AS SHOWN REV.
1/28/2012
Intensity_Plot.mxd
ARMENIA
GEORGIA
ARMENIA
TURKEY
IRAN
AZERBAIJAN
RUSSIA
IRAQ
< 4 4-55-66-7
7-8
LEGEND
MSKINTENSITY
≤ 45
7
MAGNITUDE
L A K E S E VA N
AH 1/28/2012
#* Amulsar Gold Project Site
1840
1139
6
8
1931

Golder Associates
FIGURE 4 PGA, 0.2 second and 1 Second Spectral Acceleration Hazard Curves – Heap Leach Pad Facility
Amulsar Gold Project
1E-09
1E-08
0.0000001
0.000001
0.00001
0.0001
0.001
0.01
0.1
1
0 0.5 1 1.5 2 2.5 3
An
nu
al F
req
uen
cy o
f Exc
eed
ence
Acceleration (g)
Peak Ground Acceleration
0.2 second Spectral Acceleration
1 Second Spectral Acceleration

Golder Associates
FIGURE 5 PGA, 0.2 second and 1 Second Spectral Acceleration Hazard Curves – Crusher Facility
Amulsar Gold Project
1E-09
1E-08
0.0000001
0.000001
0.00001
0.0001
0.001
0.01
0.1
1
0 0.5 1 1.5 2 2.5 3
An
nu
al F
req
uen
cy o
f Exc
eed
ence
Acceleration (g)
Peak Ground Acceleration
0.2 second Spectral Acceleration
1 Second Spectral Acceleration

Golder Associates
FIGURE 6 PGA, 0.2 second and 1 Second Spectral Acceleration Hazard Curves – Waste Rock Dump
Amulsar Gold Project
1E-09
1E-08
0.0000001
0.000001
0.00001
0.0001
0.001
0.01
0.1
1
0 0.5 1 1.5 2 2.5 3
Annu
al Fr
eque
ncy
of E
xcee
denc
e
Acceleration (g)
Peak Ground Acceleration
0.2 second Spectral Acceleration
1 Second Spectral Acceleration

Golder Associates
FIGURE 7 PGA, 0.2 second and 1 Second Spectral Acceleration Hazard Curves – Open Pit
Amulsar Gold Project
1E-09
1E-08
0.0000001
0.000001
0.00001
0.0001
0.001
0.01
0.1
1
0 0.5 1 1.5 2 2.5 3
Annu
al Fr
eque
ncy
of E
xcee
denc
e
Acceleration (g)
Peak Ground Acceleration
0.2 second Spectral Acceleration
1 Second Spectral Acceleration

Golder Associates
FIGURE 8 Equal Hazard Horizontal Acceleration Response Spectra – Heap Leach Pad Facility
Amulsar Gold Project
0
0.1
0.2
0.3
0.4
0.5
0.6
0.7
0.8
0.9
1
0.01 0.1 1 10
Spec
tral
Acc
eler
atio
n (g
)
Period (seconds)
475-year Return Period
1,000-year Return Period
2,475-year Return Period

Golder Associates
FIGURE 9 Equal Hazard Horizontal Acceleration Response Spectra – Crusher Facility
Amulsar Gold Project
0
0.1
0.2
0.3
0.4
0.5
0.6
0.7
0.8
0.9
1
0.01 0.1 1 10
Spec
tral
Acc
eler
atio
n (g
)
Period (seconds)
475-year Return Period
1,000-year Return Period
2,475-year Return Period

Golder Associates
FIGURE 10 Equal Hazard Horizontal Acceleration Response Spectra – Waste Rock Dump Site
Amulsar Gold Project
0
0.2
0.4
0.6
0.8
1
1.2
0.01 0.1 1 10
Spec
tral
Acc
eler
atio
n (g
)
Period (seconds)
475-year Return Period
1,000-year Return Period
2,475-year Return Period

Golder Associates
FIGURE 11 Equal Hazard Horizontal Acceleration Response Spectra – Open Pit
Amulsar Gold Project
0
0.1
0.2
0.3
0.4
0.5
0.6
0.7
0.8
0.9
0.01 0.1 1 10
Spec
tral
Acc
eler
atio
n (g
)
Period (seconds)
475-year Return Period
1,000-year Return Period
2,475-year Return Period

Golder Associates
FIGURE 12 Seismic Source Contributions for PGA – Heap Leach Pad Facility
Amulsar Gold Project
1E-07
1E-06
1E-05
0.0001
0.001
0.01
0.1
1
0.0001 0.001 0.01 0.1 1 10
An
nu
al F
req
uen
cy o
f Exc
eed
ence
Acceleration (g)
Total Hazard
AF
GF2
GF3A
GF5
MCT2
MCT3
MCT4
NF
NTF
PSSF1
PSSF2
PSSF3
PSSF4
PSSF5A
PSSF5C
SF
Spitak Fault

Golder Associates
FIGURE 13 Hazard Disaggregation by Magnitude and Distance – 475-year PGA – Heap Leach Pad Facility
Amulsar Gold Project
5-5.
15.
2-5.
35.
4-5.
55.
6-5.
75.
8-5.
96-
6.1
6.2-
6.3
6.4-
6.5
6.6-
6.7
6.8-
6.9
7-7.
17.
2-7.
37.
4-7.
57.
6-7.
7
0.0E+00
5.0E-02
1.0E-01
1.5E-01
2.0E-01
2.5E-01
3.0E-01
2.5
12.5
22.5
32.5
42.5
52.5
62.5
72.5
82.5
92.5
102.
511
2.5
122.
513
2.5
142.
515
2.5
162.
517
2.5
182.
519
2.5
202.
521
2.5
222.
523
2.5
242.
525
2.5
262.
527
2.5
282.
529
2.5
Magnitude
Pro
babi
lity
Den
sity
Distance (km)
475-year Return Period5-5.15.1-5.25.2-5.35.3-5.45.4-5.55.5-5.65.6-5.75.7-5.85.8-5.95.9-66-6.16.1-6.26.2-6.36.3-6.46.4-6.56.5-6.66.6-6.76.7-6.86.8-6.96.9-77-7.17.1-7.27.2-7.37.3-7.47.4-7.57.5-7.67.6-7.7
Magnitude Bins

Golder Associates
FIGURE 14 Hazard Disaggregation by Magnitude and Distance – 475-year 0.2 s SA – Heap Leach Pad Facility
Amulsar Gold Project
5-5.
15.
2-5.
35.
4-5.
55.
6-5.
75.
8-5.
96-
6.1
6.2-
6.3
6.4-
6.5
6.6-
6.7
6.8-
6.9
7-7.
17.
2-7.
37.
4-7.
57.
6-7.
7
0.0E+00
5.0E-02
1.0E-01
1.5E-01
2.0E-01
2.5E-01
2.5
12.5
22.5
32.5
42.5
52.5
62.5
72.5
82.5
92.5
102.
511
2.5
122.
513
2.5
142.
515
2.5
162.
517
2.5
182.
519
2.5
202.
521
2.5
222.
523
2.5
242.
525
2.5
262.
527
2.5
282.
529
2.5
Magnitude
Pro
babi
lity
Den
sity
Distance (km)
475-year Return Period5-5.15.1-5.25.2-5.35.3-5.45.4-5.55.5-5.65.6-5.75.7-5.85.8-5.95.9-66-6.16.1-6.26.2-6.36.3-6.46.4-6.56.5-6.66.6-6.76.7-6.86.8-6.96.9-77-7.17.1-7.27.2-7.37.3-7.47.4-7.57.5-7.67.6-7.7
Magnitude Bins

Golder Associates
FIGURE 15 Hazard Disaggregation by Magnitude and Distance – 475-year 1.0 s SA – Heap Leach Pad Facility
Amulsar Gold Project
5-5.
15.
2-5.
35.
4-5.
55.
6-5.
75.
8-5.
96-
6.1
6.2-
6.3
6.4-
6.5
6.6-
6.7
6.8-
6.9
7-7.
17.
2-7.
37.
4-7.
57.
6-7.
7
0.0E+00
5.0E-02
1.0E-01
1.5E-01
2.0E-01
2.5E-01
3.0E-01
2.5
12.5
22.5
32.5
42.5
52.5
62.5
72.5
82.5
92.5
102.
511
2.5
122.
513
2.5
142.
515
2.5
162.
517
2.5
182.
519
2.5
202.
521
2.5
222.
523
2.5
242.
525
2.5
262.
527
2.5
282.
529
2.5
Magnitude
Pro
babi
lity
Den
sity
Distance (km)
475-year Return Period5-5.15.1-5.25.2-5.35.3-5.45.4-5.55.5-5.65.6-5.75.7-5.85.8-5.95.9-66-6.16.1-6.26.2-6.36.3-6.46.4-6.56.5-6.66.6-6.76.7-6.86.8-6.96.9-77-7.17.1-7.27.2-7.37.3-7.47.4-7.57.5-7.67.6-7.7
Magnitude Bins

Golder Associates
FIGURE 16 Hazard Disaggregation by Magnitude and Distance – 2,475-year PGA – Heap Leach Pad Facility
Amulsar Gold Project
5-5.
15.
2-5.
35.
4-5.
55.
6-5.
75.
8-5.
96-
6.1
6.2-
6.3
6.4-
6.5
6.6-
6.7
6.8-
6.9
7-7.
17.
2-7.
37.
4-7.
57.
6-7.
7
0.0E+00
5.0E-02
1.0E-01
1.5E-01
2.0E-01
2.5E-01
3.0E-01
3.5E-01
4.0E-01
4.5E-01
5.0E-01
2.5
12.5
22.5
32.5
42.5
52.5
62.5
72.5
82.5
92.5
102.
511
2.5
122.
513
2.5
142.
515
2.5
162.
517
2.5
182.
519
2.5
202.
521
2.5
222.
523
2.5
242.
525
2.5
262.
527
2.5
282.
529
2.5
Magnitude
Pro
babi
lity
Den
sity
Distance (km)
2,475-year Return Period5-5.15.1-5.25.2-5.35.3-5.45.4-5.55.5-5.65.6-5.75.7-5.85.8-5.95.9-66-6.16.1-6.26.2-6.36.3-6.46.4-6.56.5-6.66.6-6.76.7-6.86.8-6.96.9-77-7.17.1-7.27.2-7.37.3-7.47.4-7.57.5-7.67.6-7.7
Magnitude Bins

Golder Associates
FIGURE 17 Hazard Disaggregation by Magnitude and Distance – 2,475-year 0.2 s SA – Heap Leach Pad Facility
Amulsar Gold Project
5-5.
15.
2-5.
35.
4-5.
55.
6-5.
75.
8-5.
96-
6.1
6.2-
6.3
6.4-
6.5
6.6-
6.7
6.8-
6.9
7-7.
17.
2-7.
37.
4-7.
57.
6-7.
7
0.0E+00
5.0E-02
1.0E-01
1.5E-01
2.0E-01
2.5E-01
3.0E-01
3.5E-01
4.0E-01
4.5E-01
2.5
12.5
22.5
32.5
42.5
52.5
62.5
72.5
82.5
92.5
102.
511
2.5
122.
513
2.5
142.
515
2.5
162.
517
2.5
182.
519
2.5
202.
521
2.5
222.
523
2.5
242.
525
2.5
262.
527
2.5
282.
529
2.5
Magnitude
Pro
babi
lity
Den
sity
Distance (km)
2,475-year Return Period5-5.15.1-5.25.2-5.35.3-5.45.4-5.55.5-5.65.6-5.75.7-5.85.8-5.95.9-66-6.16.1-6.26.2-6.36.3-6.46.4-6.56.5-6.66.6-6.76.7-6.86.8-6.96.9-77-7.17.1-7.27.2-7.37.3-7.47.4-7.57.5-7.67.6-7.7
Magnitude Bins
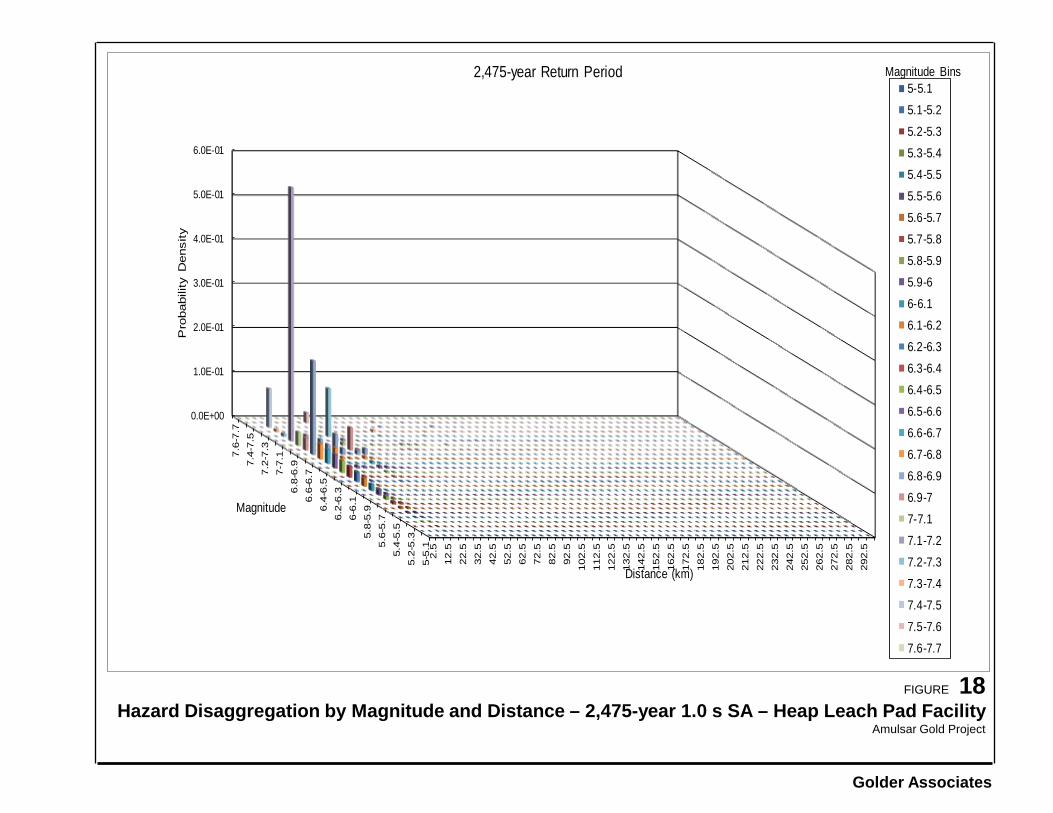
Golder Associates
FIGURE 18 Hazard Disaggregation by Magnitude and Distance – 2,475-year 1.0 s SA – Heap Leach Pad Facility
Amulsar Gold Project
5-5.
15.
2-5.
35.
4-5.
55.
6-5.
75.
8-5.
96-
6.1
6.2-
6.3
6.4-
6.5
6.6-
6.7
6.8-
6.9
7-7.
17.
2-7.
37.
4-7.
57.
6-7.
7
0.0E+00
1.0E-01
2.0E-01
3.0E-01
4.0E-01
5.0E-01
6.0E-01
2.5
12.5
22.5
32.5
42.5
52.5
62.5
72.5
82.5
92.5
102.
511
2.5
122.
513
2.5
142.
515
2.5
162.
517
2.5
182.
519
2.5
202.
521
2.5
222.
523
2.5
242.
525
2.5
262.
527
2.5
282.
529
2.5
Magnitude
Pro
babi
lity
Den
sity
Distance (km)
2,475-year Return Period5-5.15.1-5.25.2-5.35.3-5.45.4-5.55.5-5.65.6-5.75.7-5.85.8-5.95.9-66-6.16.1-6.26.2-6.36.3-6.46.4-6.56.5-6.66.6-6.76.7-6.86.8-6.96.9-77-7.17.1-7.27.2-7.37.3-7.47.4-7.57.5-7.67.6-7.7
Magnitude Bins
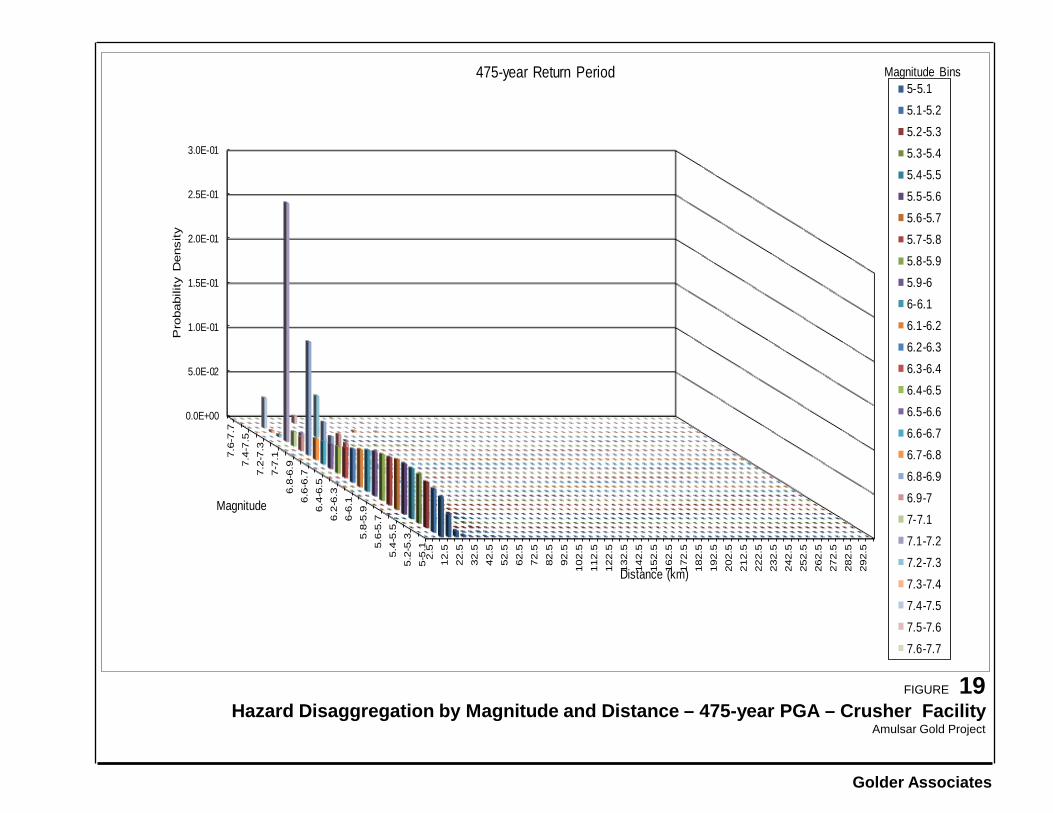
Golder Associates
FIGURE 19 Hazard Disaggregation by Magnitude and Distance – 475-year PGA – Crusher Facility
Amulsar Gold Project
5-5.
15.
2-5.
35.
4-5.
55.
6-5.
75.
8-5.
96-
6.1
6.2-
6.3
6.4-
6.5
6.6-
6.7
6.8-
6.9
7-7.
17.
2-7.
37.
4-7.
57.
6-7.
7
0.0E+00
5.0E-02
1.0E-01
1.5E-01
2.0E-01
2.5E-01
3.0E-01
2.5
12.5
22.5
32.5
42.5
52.5
62.5
72.5
82.5
92.5
102.
511
2.5
122.
513
2.5
142.
515
2.5
162.
517
2.5
182.
519
2.5
202.
521
2.5
222.
523
2.5
242.
525
2.5
262.
527
2.5
282.
529
2.5
Magnitude
Pro
babi
lity
Den
sity
Distance (km)
475-year Return Period5-5.15.1-5.25.2-5.35.3-5.45.4-5.55.5-5.65.6-5.75.7-5.85.8-5.95.9-66-6.16.1-6.26.2-6.36.3-6.46.4-6.56.5-6.66.6-6.76.7-6.86.8-6.96.9-77-7.17.1-7.27.2-7.37.3-7.47.4-7.57.5-7.67.6-7.7
Magnitude Bins

Golder Associates
FIGURE 20 Hazard Disaggregation by Magnitude and Distance – 475-year 0.2 s SA – Crusher Facility
Amulsar Gold Project
5-5.
15.
2-5.
35.
4-5.
55.
6-5.
75.
8-5.
96-
6.1
6.2-
6.3
6.4-
6.5
6.6-
6.7
6.8-
6.9
7-7.
17.
2-7.
37.
4-7.
57.
6-7.
7
0.0E+00
5.0E-02
1.0E-01
1.5E-01
2.0E-01
2.5E-01
3.0E-01
2.5
12.5
22.5
32.5
42.5
52.5
62.5
72.5
82.5
92.5
102.
511
2.5
122.
513
2.5
142.
515
2.5
162.
517
2.5
182.
519
2.5
202.
521
2.5
222.
523
2.5
242.
525
2.5
262.
527
2.5
282.
529
2.5
Magnitude
Pro
babi
lity
Den
sity
Distance (km)
475-year Return Period5-5.15.1-5.25.2-5.35.3-5.45.4-5.55.5-5.65.6-5.75.7-5.85.8-5.95.9-66-6.16.1-6.26.2-6.36.3-6.46.4-6.56.5-6.66.6-6.76.7-6.86.8-6.96.9-77-7.17.1-7.27.2-7.37.3-7.47.4-7.57.5-7.67.6-7.7
Magnitude Bins

Golder Associates
FIGURE 21 Hazard Disaggregation by Magnitude and Distance – 475-year 1.0 s SA – Crusher Facility
Amulsar Gold Project
5-5.
15.
2-5.
35.
4-5.
55.
6-5.
75.
8-5.
96-
6.1
6.2-
6.3
6.4-
6.5
6.6-
6.7
6.8-
6.9
7-7.
17.
2-7.
37.
4-7.
57.
6-7.
7
0.0E+00
5.0E-02
1.0E-01
1.5E-01
2.0E-01
2.5E-01
3.0E-01
2.5
12.5
22.5
32.5
42.5
52.5
62.5
72.5
82.5
92.5
102.
511
2.5
122.
513
2.5
142.
515
2.5
162.
517
2.5
182.
519
2.5
202.
521
2.5
222.
523
2.5
242.
525
2.5
262.
527
2.5
282.
529
2.5
Magnitude
Pro
babi
lity
Den
sity
Distance (km)
475-year Return Period5-5.15.1-5.25.2-5.35.3-5.45.4-5.55.5-5.65.6-5.75.7-5.85.8-5.95.9-66-6.16.1-6.26.2-6.36.3-6.46.4-6.56.5-6.66.6-6.76.7-6.86.8-6.96.9-77-7.17.1-7.27.2-7.37.3-7.47.4-7.57.5-7.67.6-7.7
Magnitude Bins

Golder Associates
FIGURE 22 Hazard Disaggregation by Magnitude and Distance – 2,475-year PGA – Crusher Facility
Amulsar Gold Project
5-5.
15.
2-5.
35.
4-5.
55.
6-5.
75.
8-5.
96-
6.1
6.2-
6.3
6.4-
6.5
6.6-
6.7
6.8-
6.9
7-7.
17.
2-7.
37.
4-7.
57.
6-7.
7
0.0E+00
5.0E-02
1.0E-01
1.5E-01
2.0E-01
2.5E-01
3.0E-01
3.5E-01
4.0E-01
4.5E-01
5.0E-01
2.5
12.5
22.5
32.5
42.5
52.5
62.5
72.5
82.5
92.5
102.
511
2.5
122.
513
2.5
142.
515
2.5
162.
517
2.5
182.
519
2.5
202.
521
2.5
222.
523
2.5
242.
525
2.5
262.
527
2.5
282.
529
2.5
Magnitude
Pro
babi
lity
Den
sity
Distance (km)
2,475-year Return Period5-5.15.1-5.25.2-5.35.3-5.45.4-5.55.5-5.65.6-5.75.7-5.85.8-5.95.9-66-6.16.1-6.26.2-6.36.3-6.46.4-6.56.5-6.66.6-6.76.7-6.86.8-6.96.9-77-7.17.1-7.27.2-7.37.3-7.47.4-7.57.5-7.67.6-7.7
Magnitude Bins

Golder Associates
FIGURE 23 Hazard Disaggregation by Magnitude and Distance – 2,475-year 0.2 s SA – Crusher Facility
Amulsar Gold Project
5-5.
15.
2-5.
35.
4-5.
55.
6-5.
75.
8-5.
96-
6.1
6.2-
6.3
6.4-
6.5
6.6-
6.7
6.8-
6.9
7-7.
17.
2-7.
37.
4-7.
57.
6-7.
7
0.0E+00
5.0E-02
1.0E-01
1.5E-01
2.0E-01
2.5E-01
3.0E-01
3.5E-01
4.0E-01
4.5E-01
5.0E-01
2.5
12.5
22.5
32.5
42.5
52.5
62.5
72.5
82.5
92.5
102.
511
2.5
122.
513
2.5
142.
515
2.5
162.
517
2.5
182.
519
2.5
202.
521
2.5
222.
523
2.5
242.
525
2.5
262.
527
2.5
282.
529
2.5
Magnitude
Pro
babi
lity
Den
sity
Distance (km)
2,475-year Return Period5-5.15.1-5.25.2-5.35.3-5.45.4-5.55.5-5.65.6-5.75.7-5.85.8-5.95.9-66-6.16.1-6.26.2-6.36.3-6.46.4-6.56.5-6.66.6-6.76.7-6.86.8-6.96.9-77-7.17.1-7.27.2-7.37.3-7.47.4-7.57.5-7.67.6-7.7
Magnitude Bins

Golder Associates
FIGURE 24 Hazard Disaggregation by Magnitude and Distance – 2,475-year 1.0 s SA – Crusher Facility
Amulsar Gold Project
5-5.
15.
2-5.
35.
4-5.
55.
6-5.
75.
8-5.
96-
6.1
6.2-
6.3
6.4-
6.5
6.6-
6.7
6.8-
6.9
7-7.
17.
2-7.
37.
4-7.
57.
6-7.
7
0.0E+00
1.0E-01
2.0E-01
3.0E-01
4.0E-01
5.0E-01
6.0E-01
7.0E-01
2.5
12.5
22.5
32.5
42.5
52.5
62.5
72.5
82.5
92.5
102.
511
2.5
122.
513
2.5
142.
515
2.5
162.
517
2.5
182.
519
2.5
202.
521
2.5
222.
523
2.5
242.
525
2.5
262.
527
2.5
282.
529
2.5
Magnitude
Pro
babi
lity
Den
sity
Distance (km)
2,475-year Return Period5-5.15.1-5.25.2-5.35.3-5.45.4-5.55.5-5.65.6-5.75.7-5.85.8-5.95.9-66-6.16.1-6.26.2-6.36.3-6.46.4-6.56.5-6.66.6-6.76.7-6.86.8-6.96.9-77-7.17.1-7.27.2-7.37.3-7.47.4-7.57.5-7.67.6-7.7
Magnitude Bins

Golder Associates
FIGURE 25 Hazard Disaggregation by Magnitude and Distance – 475-year PGA – Waste Rock Dump
Amulsar Gold Project
5-5.
15.
2-5.
35.
4-5.
55.
6-5.
75.
8-5.
96-
6.1
6.2-
6.3
6.4-
6.5
6.6-
6.7
6.8-
6.9
7-7.
17.
2-7.
37.
4-7.
57.
6-7.
7
0.0E+00
5.0E-02
1.0E-01
1.5E-01
2.0E-01
2.5E-01
3.0E-01
2.50
E+00
1.25
E+01
2.25
E+01
3.25
E+01
4.25
E+01
5.25
E+01
6.25
E+01
7.25
E+01
8.25
E+01
9.25
E+01
1.03
E+02
1.13
E+02
1.23
E+02
1.33
E+02
1.43
E+02
1.53
E+02
1.63
E+02
1.73
E+02
1.83
E+02
1.93
E+02
2.03
E+02
2.13
E+02
2.23
E+02
2.33
E+02
2.43
E+02
2.53
E+02
2.63
E+02
2.73
E+02
2.83
E+02
2.93
E+02
Magnitude
Pro
babi
lity
Den
sity
Distance (km)
475-year Return Period5-5.1
5.1-5.2
5.2-5.3
5.3-5.4
5.4-5.5
5.5-5.6
5.6-5.7
5.7-5.8
5.8-5.9
5.9-6
6-6.1
6.1-6.2
6.2-6.3
6.3-6.4
6.4-6.5
6.5-6.6
6.6-6.7
6.7-6.8
6.8-6.9
6.9-7
7-7.1
7.1-7.2
7.2-7.3
7.3-7.4
7.4-7.5
7.5-7.6
7.6-7.7
Magnitude Bins

Golder Associates
FIGURE 26 Hazard Disaggregation by Magnitude and Distance – 475-year 0.2 s SA – Waste Rock Dump
Amulsar Gold Project
5-5.
15.
2-5.
35.
4-5.
55.
6-5.
75.
8-5.
96-
6.1
6.2-
6.3
6.4-
6.5
6.6-
6.7
6.8-
6.9
7-7.
17.
2-7.
37.
4-7.
57.
6-7.
7
0.0E+00
5.0E-02
1.0E-01
1.5E-01
2.0E-01
2.5E-01
3.0E-01
2.50
E+00
1.25
E+01
2.25
E+01
3.25
E+01
4.25
E+01
5.25
E+01
6.25
E+01
7.25
E+01
8.25
E+01
9.25
E+01
1.03
E+02
1.13
E+02
1.23
E+02
1.33
E+02
1.43
E+02
1.53
E+02
1.63
E+02
1.73
E+02
1.83
E+02
1.93
E+02
2.03
E+02
2.13
E+02
2.23
E+02
2.33
E+02
2.43
E+02
2.53
E+02
2.63
E+02
2.73
E+02
2.83
E+02
2.93
E+02
Magnitude
Pro
babi
lity
Den
sity
Distance (km)
475-year Return Period5-5.1
5.1-5.2
5.2-5.3
5.3-5.4
5.4-5.5
5.5-5.6
5.6-5.7
5.7-5.8
5.8-5.9
5.9-6
6-6.1
6.1-6.2
6.2-6.3
6.3-6.4
6.4-6.5
6.5-6.6
6.6-6.7
6.7-6.8
6.8-6.9
6.9-7
7-7.1
7.1-7.2
7.2-7.3
7.3-7.4
7.4-7.5
7.5-7.6
7.6-7.7
Magnitude Bins

Golder Associates
FIGURE 27 Hazard Disaggregation by Magnitude and Distance – 475-year 1.0 s SA – Waste Rock Dump
Amulsar Gold Project
5-5.
15.
2-5.
35.
4-5.
55.
6-5.
75.
8-5.
96-
6.1
6.2-
6.3
6.4-
6.5
6.6-
6.7
6.8-
6.9
7-7.
17.
2-7.
37.
4-7.
57.
6-7.
7
0.0E+00
5.0E-02
1.0E-01
1.5E-01
2.0E-01
2.5E-01
3.0E-01
3.5E-01
2.50
E+00
1.25
E+01
2.25
E+01
3.25
E+01
4.25
E+01
5.25
E+01
6.25
E+01
7.25
E+01
8.25
E+01
9.25
E+01
1.03
E+02
1.13
E+02
1.23
E+02
1.33
E+02
1.43
E+02
1.53
E+02
1.63
E+02
1.73
E+02
1.83
E+02
1.93
E+02
2.03
E+02
2.13
E+02
2.23
E+02
2.33
E+02
2.43
E+02
2.53
E+02
2.63
E+02
2.73
E+02
2.83
E+02
2.93
E+02
Magnitude
Pro
babi
lity
Den
sity
Distance (km)
475-year Return Period5-5.1
5.1-5.2
5.2-5.3
5.3-5.4
5.4-5.5
5.5-5.6
5.6-5.7
5.7-5.8
5.8-5.9
5.9-6
6-6.1
6.1-6.2
6.2-6.3
6.3-6.4
6.4-6.5
6.5-6.6
6.6-6.7
6.7-6.8
6.8-6.9
6.9-7
7-7.1
7.1-7.2
7.2-7.3
7.3-7.4
7.4-7.5
7.5-7.6
7.6-7.7
Magnitude Bins

Golder Associates
FIGURE 28 Hazard Disaggregation by Magnitude and Distance – 2,475-year PGA – Waste Rock Dump
Amulsar Gold Project
5-5.
15.
2-5.
35.
4-5.
55.
6-5.
75.
8-5.
96-
6.1
6.2-
6.3
6.4-
6.5
6.6-
6.7
6.8-
6.9
7-7.
17.
2-7.
37.
4-7.
57.
6-7.
7
0.0E+00
5.0E-02
1.0E-01
1.5E-01
2.0E-01
2.5E-01
3.0E-01
3.5E-01
4.0E-01
4.5E-01
5.0E-01
2.50
E+00
1.25
E+01
2.25
E+01
3.25
E+01
4.25
E+01
5.25
E+01
6.25
E+01
7.25
E+01
8.25
E+01
9.25
E+01
1.03
E+02
1.13
E+02
1.23
E+02
1.33
E+02
1.43
E+02
1.53
E+02
1.63
E+02
1.73
E+02
1.83
E+02
1.93
E+02
2.03
E+02
2.13
E+02
2.23
E+02
2.33
E+02
2.43
E+02
2.53
E+02
2.63
E+02
2.73
E+02
2.83
E+02
2.93
E+02
Magnitude
Pro
babi
lity
Den
sity
Distance (km)
2,475-year Return Period5-5.1
5.1-5.2
5.2-5.3
5.3-5.4
5.4-5.5
5.5-5.6
5.6-5.7
5.7-5.8
5.8-5.9
5.9-6
6-6.1
6.1-6.2
6.2-6.3
6.3-6.4
6.4-6.5
6.5-6.6
6.6-6.7
6.7-6.8
6.8-6.9
6.9-7
7-7.1
7.1-7.2
7.2-7.3
7.3-7.4
7.4-7.5
7.5-7.6
7.6-7.7
Magnitude Bins

Golder Associates
FIGURE 29 Hazard Disaggregation by Magnitude and Distance – 2,475-year 0.2 s SA – Waste Rock Dump
Amulsar Gold Project
5-5.
15.
2-5.
35.
4-5.
55.
6-5.
75.
8-5.
96-
6.1
6.2-
6.3
6.4-
6.5
6.6-
6.7
6.8-
6.9
7-7.
17.
2-7.
37.
4-7.
57.
6-7.
7
0.0E+00
5.0E-02
1.0E-01
1.5E-01
2.0E-01
2.5E-01
3.0E-01
3.5E-01
4.0E-01
4.5E-01
5.0E-01
2.50
E+00
1.25
E+01
2.25
E+01
3.25
E+01
4.25
E+01
5.25
E+01
6.25
E+01
7.25
E+01
8.25
E+01
9.25
E+01
1.03
E+02
1.13
E+02
1.23
E+02
1.33
E+02
1.43
E+02
1.53
E+02
1.63
E+02
1.73
E+02
1.83
E+02
1.93
E+02
2.03
E+02
2.13
E+02
2.23
E+02
2.33
E+02
2.43
E+02
2.53
E+02
2.63
E+02
2.73
E+02
2.83
E+02
2.93
E+02
Magnitude
Pro
babi
lity
Den
sity
Distance (km)
2,475-year Return Period5-5.1
5.1-5.2
5.2-5.3
5.3-5.4
5.4-5.5
5.5-5.6
5.6-5.7
5.7-5.8
5.8-5.9
5.9-6
6-6.1
6.1-6.2
6.2-6.3
6.3-6.4
6.4-6.5
6.5-6.6
6.6-6.7
6.7-6.8
6.8-6.9
6.9-7
7-7.1
7.1-7.2
7.2-7.3
7.3-7.4
7.4-7.5
7.5-7.6
7.6-7.7
Magnitude Bins

Golder Associates
FIGURE 30 Hazard Disaggregation by Magnitude and Distance – 2,475-year 1.0 s SA – Waste Rock Dump
Amulsar Gold Project
5-5.
15.
2-5.
35.
4-5.
55.
6-5.
75.
8-5.
96-
6.1
6.2-
6.3
6.4-
6.5
6.6-
6.7
6.8-
6.9
7-7.
17.
2-7.
37.
4-7.
57.
6-7.
7
0.0E+00
1.0E-01
2.0E-01
3.0E-01
4.0E-01
5.0E-01
6.0E-01
7.0E-01
2.50
E+00
1.25
E+01
2.25
E+01
3.25
E+01
4.25
E+01
5.25
E+01
6.25
E+01
7.25
E+01
8.25
E+01
9.25
E+01
1.03
E+02
1.13
E+02
1.23
E+02
1.33
E+02
1.43
E+02
1.53
E+02
1.63
E+02
1.73
E+02
1.83
E+02
1.93
E+02
2.03
E+02
2.13
E+02
2.23
E+02
2.33
E+02
2.43
E+02
2.53
E+02
2.63
E+02
2.73
E+02
2.83
E+02
2.93
E+02
Magnitude
Pro
babi
lity
Den
sity
Distance (km)
2,475-year Return Period5-5.1
5.1-5.2
5.2-5.3
5.3-5.4
5.4-5.5
5.5-5.6
5.6-5.7
5.7-5.8
5.8-5.9
5.9-6
6-6.1
6.1-6.2
6.2-6.3
6.3-6.4
6.4-6.5
6.5-6.6
6.6-6.7
6.7-6.8
6.8-6.9
6.9-7
7-7.1
7.1-7.2
7.2-7.3
7.3-7.4
7.4-7.5
7.5-7.6
7.6-7.7
Magnitude Bins

Golder Associates
FIGURE 31 Hazard Disaggregation by Magnitude and Distance – 475-year PGA – Open Pit
Amulsar Gold Project
5-5.
15.
2-5.
35.
4-5.
55.
6-5.
75.
8-5.
96-
6.1
6.2-
6.3
6.4-
6.5
6.6-
6.7
6.8-
6.9
7-7.
17.
2-7.
37.
4-7.
57.
6-7.
7
0.0E+00
5.0E-02
1.0E-01
1.5E-01
2.0E-01
2.5E-01
2.50
E+00
1.25
E+01
2.25
E+01
3.25
E+01
4.25
E+01
5.25
E+01
6.25
E+01
7.25
E+01
8.25
E+01
9.25
E+01
1.03
E+02
1.13
E+02
1.23
E+02
1.33
E+02
1.43
E+02
1.53
E+02
1.63
E+02
1.73
E+02
1.83
E+02
1.93
E+02
2.03
E+02
2.13
E+02
2.23
E+02
2.33
E+02
2.43
E+02
2.53
E+02
2.63
E+02
2.73
E+02
2.83
E+02
2.93
E+02
Magnitude
Pro
babi
lity
Den
sity
Distance (km)
475-year Return Period5-5.1
5.1-5.2
5.2-5.3
5.3-5.4
5.4-5.5
5.5-5.6
5.6-5.7
5.7-5.8
5.8-5.9
5.9-6
6-6.1
6.1-6.2
6.2-6.3
6.3-6.4
6.4-6.5
6.5-6.6
6.6-6.7
6.7-6.8
6.8-6.9
6.9-7
7-7.1
7.1-7.2
7.2-7.3
7.3-7.4
7.4-7.5
7.5-7.6
7.6-7.7
Magnitude Bins

Golder Associates
FIGURE 32 Hazard Disaggregation by Magnitude and Distance – 475-year 0.2 s SA – Open Pit
Amulsar Gold Project
5-5.
15.
2-5.
35.
4-5.
55.
6-5.
75.
8-5.
96-
6.1
6.2-
6.3
6.4-
6.5
6.6-
6.7
6.8-
6.9
7-7.
17.
2-7.
37.
4-7.
57.
6-7.
7
0.0E+00
5.0E-02
1.0E-01
1.5E-01
2.0E-01
2.5E-01
2.50
E+00
1.25
E+01
2.25
E+01
3.25
E+01
4.25
E+01
5.25
E+01
6.25
E+01
7.25
E+01
8.25
E+01
9.25
E+01
1.03
E+02
1.13
E+02
1.23
E+02
1.33
E+02
1.43
E+02
1.53
E+02
1.63
E+02
1.73
E+02
1.83
E+02
1.93
E+02
2.03
E+02
2.13
E+02
2.23
E+02
2.33
E+02
2.43
E+02
2.53
E+02
2.63
E+02
2.73
E+02
2.83
E+02
2.93
E+02
Magnitude
Pro
babi
lity
Den
sity
Distance (km)
475-year Return Period5-5.1
5.1-5.2
5.2-5.3
5.3-5.4
5.4-5.5
5.5-5.6
5.6-5.7
5.7-5.8
5.8-5.9
5.9-6
6-6.1
6.1-6.2
6.2-6.3
6.3-6.4
6.4-6.5
6.5-6.6
6.6-6.7
6.7-6.8
6.8-6.9
6.9-7
7-7.1
7.1-7.2
7.2-7.3
7.3-7.4
7.4-7.5
7.5-7.6
7.6-7.7
Magnitude Bins
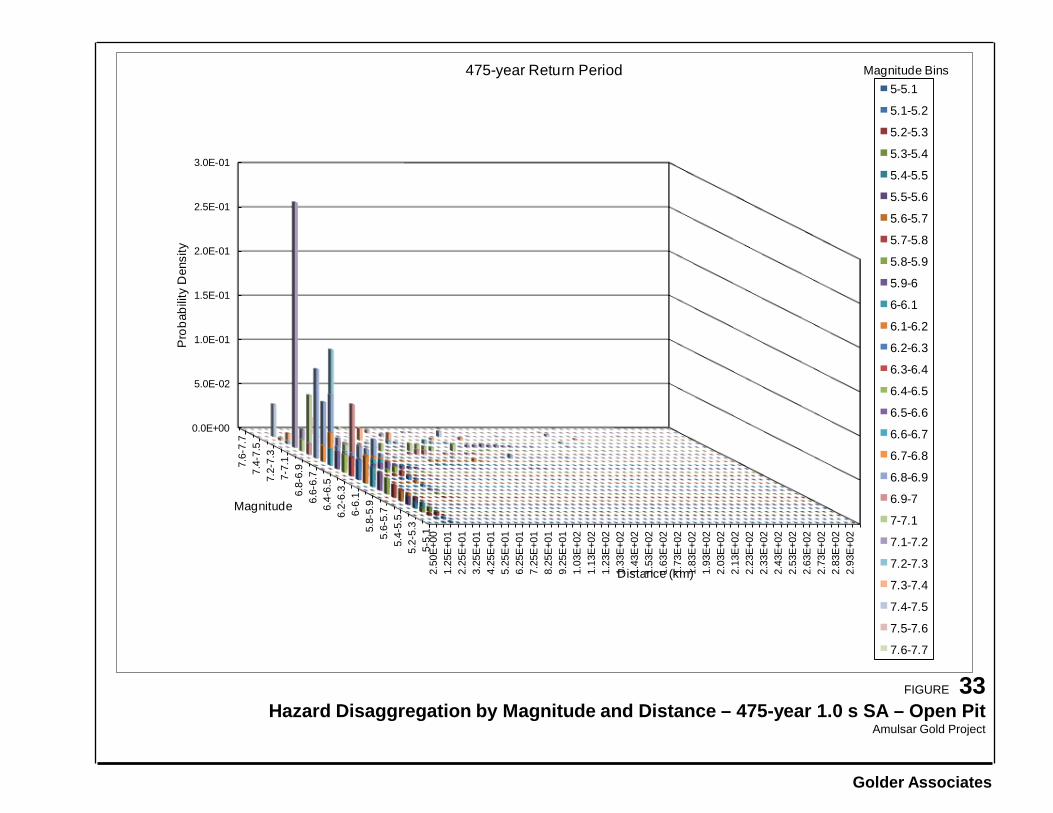
Golder Associates
FIGURE 33 Hazard Disaggregation by Magnitude and Distance – 475-year 1.0 s SA – Open Pit
Amulsar Gold Project
5-5.
15.
2-5.
35.
4-5.
55.
6-5.
75.
8-5.
96-
6.1
6.2-
6.3
6.4-
6.5
6.6-
6.7
6.8-
6.9
7-7.
17.
2-7.
37.
4-7.
57.
6-7.
7
0.0E+00
5.0E-02
1.0E-01
1.5E-01
2.0E-01
2.5E-01
3.0E-01
2.50
E+00
1.25
E+01
2.25
E+01
3.25
E+01
4.25
E+01
5.25
E+01
6.25
E+01
7.25
E+01
8.25
E+01
9.25
E+01
1.03
E+02
1.13
E+02
1.23
E+02
1.33
E+02
1.43
E+02
1.53
E+02
1.63
E+02
1.73
E+02
1.83
E+02
1.93
E+02
2.03
E+02
2.13
E+02
2.23
E+02
2.33
E+02
2.43
E+02
2.53
E+02
2.63
E+02
2.73
E+02
2.83
E+02
2.93
E+02
Magnitude
Pro
babi
lity
Den
sity
Distance (km)
475-year Return Period5-5.1
5.1-5.2
5.2-5.3
5.3-5.4
5.4-5.5
5.5-5.6
5.6-5.7
5.7-5.8
5.8-5.9
5.9-6
6-6.1
6.1-6.2
6.2-6.3
6.3-6.4
6.4-6.5
6.5-6.6
6.6-6.7
6.7-6.8
6.8-6.9
6.9-7
7-7.1
7.1-7.2
7.2-7.3
7.3-7.4
7.4-7.5
7.5-7.6
7.6-7.7
Magnitude Bins

Golder Associates
FIGURE 34 Hazard Disaggregation by Magnitude and Distance – 2,475-year PGA – Open Pit
Amulsar Gold Project
5-5.
15.
2-5.
35.
4-5.
55.
6-5.
75.
8-5.
96-
6.1
6.2-
6.3
6.4-
6.5
6.6-
6.7
6.8-
6.9
7-7.
17.
2-7.
37.
4-7.
57.
6-7.
7
0.0E+00
5.0E-02
1.0E-01
1.5E-01
2.0E-01
2.5E-01
3.0E-01
3.5E-01
4.0E-01
4.5E-01
2.50
E+00
1.25
E+01
2.25
E+01
3.25
E+01
4.25
E+01
5.25
E+01
6.25
E+01
7.25
E+01
8.25
E+01
9.25
E+01
1.03
E+02
1.13
E+02
1.23
E+02
1.33
E+02
1.43
E+02
1.53
E+02
1.63
E+02
1.73
E+02
1.83
E+02
1.93
E+02
2.03
E+02
2.13
E+02
2.23
E+02
2.33
E+02
2.43
E+02
2.53
E+02
2.63
E+02
2.73
E+02
2.83
E+02
2.93
E+02
Magnitude
Pro
babi
lity
Den
sity
Distance (km)
2,475-year Return Period5-5.1
5.1-5.2
5.2-5.3
5.3-5.4
5.4-5.5
5.5-5.6
5.6-5.7
5.7-5.8
5.8-5.9
5.9-6
6-6.1
6.1-6.2
6.2-6.3
6.3-6.4
6.4-6.5
6.5-6.6
6.6-6.7
6.7-6.8
6.8-6.9
6.9-7
7-7.1
7.1-7.2
7.2-7.3
7.3-7.4
7.4-7.5
7.5-7.6
7.6-7.7
Magnitude Bins

Golder Associates
FIGURE 35 Hazard Disaggregation by Magnitude and Distance – 2,475-year 0.2 s SA – Open Pit
Amulsar Gold Project
5-5.
15.
2-5.
35.
4-5.
55.
6-5.
75.
8-5.
96-
6.1
6.2-
6.3
6.4-
6.5
6.6-
6.7
6.8-
6.9
7-7.
17.
2-7.
37.
4-7.
57.
6-7.
7
0.0E+00
5.0E-02
1.0E-01
1.5E-01
2.0E-01
2.5E-01
3.0E-01
3.5E-01
4.0E-01
4.5E-01
2.50
E+00
1.25
E+01
2.25
E+01
3.25
E+01
4.25
E+01
5.25
E+01
6.25
E+01
7.25
E+01
8.25
E+01
9.25
E+01
1.03
E+02
1.13
E+02
1.23
E+02
1.33
E+02
1.43
E+02
1.53
E+02
1.63
E+02
1.73
E+02
1.83
E+02
1.93
E+02
2.03
E+02
2.13
E+02
2.23
E+02
2.33
E+02
2.43
E+02
2.53
E+02
2.63
E+02
2.73
E+02
2.83
E+02
2.93
E+02
Magnitude
Pro
babi
lity
Den
sity
Distance (km)
2,475-year Return Period5-5.1
5.1-5.2
5.2-5.3
5.3-5.4
5.4-5.5
5.5-5.6
5.6-5.7
5.7-5.8
5.8-5.9
5.9-6
6-6.1
6.1-6.2
6.2-6.3
6.3-6.4
6.4-6.5
6.5-6.6
6.6-6.7
6.7-6.8
6.8-6.9
6.9-7
7-7.1
7.1-7.2
7.2-7.3
7.3-7.4
7.4-7.5
7.5-7.6
7.6-7.7
Magnitude Bins

Golder Associates
FIGURE 36 Hazard Disaggregation by Magnitude and Distance – 2,475-year 1.0 s SA – Open Pit
Amulsar Gold Project
5-5.
15.
2-5.
35.
4-5.
55.
6-5.
75.
8-5.
96-
6.1
6.2-
6.3
6.4-
6.5
6.6-
6.7
6.8-
6.9
7-7.
17.
2-7.
37.
4-7.
57.
6-7.
7
0.0E+00
1.0E-01
2.0E-01
3.0E-01
4.0E-01
5.0E-01
6.0E-01
2.50
E+00
1.25
E+01
2.25
E+01
3.25
E+01
4.25
E+01
5.25
E+01
6.25
E+01
7.25
E+01
8.25
E+01
9.25
E+01
1.03
E+02
1.13
E+02
1.23
E+02
1.33
E+02
1.43
E+02
1.53
E+02
1.63
E+02
1.73
E+02
1.83
E+02
1.93
E+02
2.03
E+02
2.13
E+02
2.23
E+02
2.33
E+02
2.43
E+02
2.53
E+02
2.63
E+02
2.73
E+02
2.83
E+02
2.93
E+02
Magnitude
Pro
babi
lity
Den
sity
Distance (km)
2,475-year Return Period5-5.1
5.1-5.2
5.2-5.3
5.3-5.4
5.4-5.5
5.5-5.6
5.6-5.7
5.7-5.8
5.8-5.9
5.9-6
6-6.1
6.1-6.2
6.2-6.3
6.3-6.4
6.4-6.5
6.5-6.6
6.6-6.7
6.7-6.8
6.8-6.9
6.9-7
7-7.1
7.1-7.2
7.2-7.3
7.3-7.4
7.4-7.5
7.5-7.6
7.6-7.7
Magnitude Bins

Golder Associates
FIGURE 37 Deterministic Horizontal Acceleration Response Spectra – Heap Leach Pad Facility
Amulsar Gold Project
0
0.1
0.2
0.3
0.4
0.5
0.6
0.7
0.8
0.9
1
0.01 0.1 1 10
Spec
tral
Acc
eler
atio
n (g
)
Period (seconds)
Median Ground Motion 84th Percentile Ground Motion

Golder Associates
FIGURE 38 Deterministic Horizontal Acceleration Response Spectra – Crusher Facility
Amulsar Gold Project
0
0.2
0.4
0.6
0.8
1
1.2
0.01 0.1 1 10
Spec
tral
Acc
eler
atio
n (g
)
Period (seconds)
Median Ground Motion 84th Percentile Ground Motion

Golder Associates
FIGURE 39 Deterministic Horizontal Acceleration Response Spectra – Waste Rock Dump Site
Amulsar Gold Project
0
0.2
0.4
0.6
0.8
1
1.2
0.01 0.1 1 10
Spec
tral
Acc
eler
atio
n (g
)
Period (seconds)
Median Ground Motion
84th Percentile Ground Motion

Golder Associates
FIGURE 40 Deterministic Horizontal Acceleration Response Spectra – Open Pit
Amulsar Gold Project
0
0.1
0.2
0.3
0.4
0.5
0.6
0.7
0.8
0.9
1
0.01 0.1 1 10
Spec
tral
Acc
eler
atio
n (g
)
Period (seconds)
Median Ground Motion
84th Percentile Ground Motion

Golder, Golder Associates and the GA globe design are trademarks of Golder Associates Corporation
Golder Associates Inc. 230 Commerce Street, Suite 200
Irvine, California 92602 USA Tel: (714) 508-4400 Fax: (714) 508-4401