amt adoption and innovation an investigation of … · 01/11/2017 · amt adoption and innovation:...
TRANSCRIPT
Technovation 55-56 (2016) 42–55
Contents lists available at ScienceDirect
Technovation
http://d0166-49
n CorrE-m
Stepen.R
journal homepage: www.elsevier.com/locate/technovation
AMT adoption and innovation: An investigation of dynamicand complementary effects
Jane Bourke a,n, Stephen Roper b
a School of Economics, University College Cork, Irelandb Enterprise Research Centre and Warwick Business School, Coventry CV4 7AL, United Kingdom
a r t i c l e i n f o
Article history:Received 28 May 2015Received in revised form27 May 2016Accepted 27 May 2016Available online 16 June 2016
JEL codes:O31O33O34
Keywords:Advanced manufacturing technologyInnovationLearning-by-usingAdoptionDisruptive strategy
x.doi.org/10.1016/j.technovation.2016.05.00372/& 2016 Elsevier Ltd. All rights reserved.
esponding author.ail addresses: [email protected] (J. Bourke),[email protected] (S. Roper).
a b s t r a c t
The ability to innovate successfully is a key corporate capability, depending strongly on firms' access toknowledge capital: proprietary, tacit and embodied. Here, we focus on one specific source of knowledge –
advanced manufacturing technologies or AMTs – and consider its impact on firms' innovation success.AMTs relate to a series of process innovations which enable firms to take advantage of numerical anddigital technologies to optimise elements of a manufacturing process. Using panel data for Irish manu-facturing plants we identify lengthy learning-by-using effects in terms of firms' ability to derive in-novation benefits from AMT adoption. Disruption effects are evident in the short-term while positiveinnovation benefits occur six-plus years after adoption. Strong complementarities between simulta-neously adopted AMTs suggest the value of disruptive rather than incremental AMT implementationstrategies.
& 2016 Elsevier Ltd. All rights reserved.
1. Introduction
Our objective in this paper is to understand the AMT-innova-tion relationship, specifically focusing on the temporal profile andcomplementary effects of AMTs on innovation performance. Theability to innovate successfully is a key corporate capability, de-pending strongly on firms' access to knowledge capital: proprie-tary, tacit and embodied (Al-Laham et al., 2011; Wu and Shanley,2009; Tzabbar et al., 2008; Kyriakopoulos and de Ruyter, 2004).The relationship between proprietary knowledge (e.g. patents)and innovation has been widely explored (Artz et al., 2010;Mansfield, 1986), as has the relationship between innovation andtacit or un-codified knowledge (e.g. workforce skills) (Comacchioet al., 2012; Doran and Ryan, 2014; Knockaert et al., 2009; Ichijoand Kohlbacher, 2008). External knowledge sharing positivelyimpacts innovation performance, as do strong networks (Bellamyet al., 2014; Love et al., 2011; Ritala et al., 2015). Less attention hasbeen paid to the impact on innovation of the knowledge embodiedin firms' capital equipment. Here, we focus on one specific sourceof embodied knowledge – advanced manufacturing technologies
or AMTs – and consider its impact on firms’ innovation success.AMTs relate to a series of process innovations which enable firmsto take advantage of numerical and digital technologies to opti-mise elements of a manufacturing process. These may relate to thecontrol of individual pieces of production equipment – as in nu-merically controlled, computer numerically controlled (CNC) ma-chinery or robotics – the automated movement of items during themanufacturing process – as in automated materials handling(AMH) – or the integration and optimisation of the productionprocess – as in computer aided production management or com-puter integrated manufacturing (CIM) (Zammuto and O’Connor,1992).
Previous studies have considered the factors which shapefirms' adoption of AMTs, suggesting positive links between AMTadoption and firm size, skill levels and more flexible organisationalcultures (Zammuto and O’Connor, 1992). More recently, Gomezand Vargas (2012) illustrate, with a sample of Spanish manu-facturing firms, that R&D investments increase the likelihood ofAMT use. Export intensity and being part of a business group arealso positively associated with technology use (Gómez and Vargas,2012). A limited number of studies have also attempted to quantifythe impact of AMT use on employment and productivity. Bartels-man et al. (1998), for example, report higher average growth ratesof total factor productivity and employment for Dutch firms whichemployed AMT. Employment growth has also been linked to AMT

J. Bourke, S. Roper / Technovation 55-56 (2016) 42–55 43
use in France, the UK and the US, while employment reductionshave been noted in Italy, Norway and Denmark (Bartelsman et al.,1998). Arvantis and Hollenstein (2001), in their study of AMTadoption in Switzerland, highlight the need for further analysis ofthe relationship between technology diffusion and economicgrowth. In terms of the relationship between AMTs and innova-tion, research is limited. However, Barge-Gil et al. (2011) considerthe impact on innovation where a firm uses forms of computerizedaided manufacturing (CAM), robotics or CAD/CAM. In their data forSpain, adoption of AMTs is strongly correlated with firm size butonly weakly correlated with other firm characteristics such as R&Dintensity or design. AMT adoption then has a positive and sig-nificant effect on the probability of product innovation only fornon-R&D performers but a positive impact on probability of pro-cess innovation for both R&D performers and non-performers.Nair et al. (2013) report that exporters engage in more skilled useof manufacturing technologies than non-exporters, resulting inless rejects and shorter lead times. In addition, Khanchanaponget al. (2014) report complementary benefits of AMT and leanpractices use on a range of operational performance dimensions,including quality, lead-time, flexibility and cost.
Other studies report the influence of AMT in the innovativeprocess for low-and-medium technology firms (Santamaría et al.,2009) and for small firms (Raymond et al., 2009). Both studiessuggest the potential value of considering in more detail the fac-tors which may condition the effects of AMTs on innovation. Otherstudies have also suggested the difficulties which firms face in theeffective implementation of AMTs, creating the potential for dis-ruption effects, learning-by-using effects and time-lags in the ef-fect of AMTs on innovation (Tyre and Hauptman, 1992). Chan et al.(2015) report that the barriers to successful AMT implementationare experienced more acutely by smaller companies, with the lackof appropriate or proper training being the most severe barrier.
Using panel data for Irish manufacturing firms, which providesAMT adoption histories, we focus here on the relationship be-tween innovation and the prior adoption of AMTs. Specifically, weask whether, and over what period, the adoption of AMTs impactson firms' innovation success. The AMTs examined include com-puter-aided manufacturing (CAM), automated materials handling(AMH), computer-integrated manufacturing (CIM) and robotics.Most, if not all, of the prior studies of the relationship betweenAMTs and innovation have been based on cross-sectional datamaking causality difficult to identify, and providing little in-formation on the nature of the learning effects and lags involved inAMT adoption and the potential benefits for innovation. Our studymakes three main contributions. First, it clearly highlights thetemporal profile of the performance benefits of individual AMTs,highlighting short-term disruption effects but longer-term bene-fits. Second, it highlights complementarities between the adoptionof specific AMTs, and third it suggests the role of learning-by-usingeffects in the shaping of the AMT–innovation relationship (Ro-senberg, 1982).
The rest of the paper is organised as follows. Section 2 providesa brief overview of AMTs, and their degree of integration in themanufacturing process; a discussion of the relationship betweeninnovation and AMTs; and, the role of complementarities learning-by-using effects in the enhancement of firms’ innovation perfor-mance. Section 2 also outlines our three hypotheses relating to thepotential impacts of prior AMT adoption on innovation. Section 3describes the data used in our study. Our empirical analysis isbased on a panel dataset relating to Irish manufacturing firmswhich were surveyed at regular intervals over the 1994–2008period. Section 4 outlines the main empirical results and Section 5
discusses the implications of this work. Variable definitions areincluded in an Annex A.
2. Concepts and hypotheses
2.1. AMTs and Innovation
AMTs relate to a series of process innovations which enablefirms to take advantage of numerical and digital technologies tooptimise elements of a manufacturing process. We briefly describethe four AMTs studied in this paper and subsequently categorisethem based on the extent to which they integrate elements of themanufacturing process.
Computer-aided manufacturing (CAM) is the use of computersoftware to control machine tools and related machinery inmanufacturing process and would include processes such as nu-merically controlled machining, laser cutting, water-jet cuttingand robot control. Automated Materials Handling (AMH), some-times called automated storage/retrieval systems, involves theautomated movement of items during the manufacturing process.Such systems may use high-rise stacker cranes, automated guidedvehicle systems, computerized conveyors, computerized carousels,and other such systems to store and retrieve materials. Computer-integrated manufacturing (CIM) involves integrated systems of NCmachines, robots, material conveyors, and other such computer-driven equipment. Robotics may involve simple pick and placerobots, with 1, 2, or 3 degrees of freedom or more sophisticatedrobots that can handle tasks such as welding or painting on anassembly line and may also have the benefit of trajectory control(Kotha and Swamidass, 2000).
Innovation is identified as a critical driver of business pro-ductivity and economic growth (Schumpeter, 1934; Romer, 1990).Schumpeter (1934) argued that the catalyst to innovation is thetransformation of knowledge into new products or processes. Therelationship between innovation output and innovation inputs hasbeen used extensively in the literature (Crepon et al., 1998;McCann and Simonen, 2005; Griffith et al., 2008.; Roper et al.,2008). Numerous scholars have attempted to explain why somefirms are more likely to innovate, with firm characteristics, such assize, sector, ownership, and location being identified as influentialdrivers of innovation output (Audretsch and Feldman, 1996;Boschma, 2005; Gordon and McCann, 2005; Jordan and O’Leary,2008; McCann and Simonen, 2005; Tether, 1998; Romer, 1990;Roper et al., 2008). The importance of R&D to innovation activitywithin firms has also been established by many authors (Roperet al., 2008; Freel, 2003). Firms engaging in R&D activity benefittheir existing stock of knowledge resulting in commercial gainsfrom the introduction of new products, processes and/ or organi-sational innovations (Roper et al., 2004). There is also considerableevidence of the importance of external sources of knowledge forinnovation outputs (Mansury and Love, 2008). These externalsources of knowledge may include linkages with customers, sup-pliers, competitors and/or research institutes (Bellamy et al., 2014;Love et al., 2011; Roper et al., 2008). Likewise, managerial cap-abilities have been highlighted as an important factor in firm levelinnovation. Successful innovation requires that firms and man-agers provide clear and consistent signals to employees about thegoals and objectives of the firm (Barnes et al., 2006; Crowley andBourke, 2016). In addition, the technologies firms adopt and use,such as AMT, can influence innovation capabilities (Santamaríaet al., 2009; Raymond et al., 2009).
In recent decades, firms have made substantial investments in
J. Bourke, S. Roper / Technovation 55-56 (2016) 42–5544
AMT adoption and their diffusion across the manufacturing sectorhas been well documented. Factors such as firm size (Battisti et al.,2007; Karshenas and Stoneman, 1993); firm vintage (Arvantis andHollenstein, 2001; Battisti and Stoneman, 2005); human capital(Arvantis and Hollenstein, 2001; Parhi, 2007); exporting (Nairet al., 2013); cumulative learning from previous adoption experi-ence (learning-by-using) (Stoneman and Kwon, 1994; Colomboand Mosconi, 1995; McWilliams and Zilbermanfr, 1996; Stonemanand Toivanen, 1997; Arvantis and Hollenstein, 2001) seem influ-ential in AMT adoption. R&D (Karshenas and Stoneman, 1993;Baptista, 2000) and market conditions (Arvantis and Hollenstein,2001) seem less important. To date, research has focused largelyon explaining what influences and motivates AMT adoption andthe relationship between manufacturing capabilities and AMT use(Spanos and Voudouris, 2009). Empirical evidence in relation toAMT and flexibility (Lei and Goldhar, 1990; Khanchanapong et al.,2014; Meredith, 1988), low cost (Corbett and VanWassenhove,1993; Khanchanapong et al., 2014), and quality (Khanchanaponget al., 2014; Parthasarthy and Sethi, 1992) is positive. It is generallyaccepted that the primary benefit of AMT use is cost-efficientflexibility in the manufacturing function (Sohal, 1996).1
The potential for AMTs to contribute to innovation arises fromthe ability of AMTs to generate economies of scope, i.e. ‘the ca-pacity to efficiently and quickly produce any of a range of partswithin a family’ (Zammuto and O’Connor, 1992, p. 702). AMTs may,first, enable firms to adopt more flexible production systems al-lowing smaller batch sizes and enabling firms to cope better withperceived environmental uncertainty (Hofmann and Orr, 2005).Having more flexible production systems may also allow firms toadopt more complex innovation strategies with potentially higherreturns (Hewitt-Dundas, 2004). AMTs may also facilitate moreradical innovation strategies as firms seek to create market tur-bulence by engaging in disruptive innovation in order to establisha position of market or technological leadership (Anthony et al.,2008; Hang et al., 2010). Second, AMTs may lead to efficiencyadvantages, reducing the cost of innovations and increasing postinnovation returns. Ceteris paribus this will mean that firms wouldbe more likely to innovate or increase their level of innovativeactivity (Levin and Reiss, 1984; Calantone et al., 2010). Third, AMTsmay lead to improvements in product quality and reliability re-ducing the potential technical uncertainty of innovation, and againhaving positive effects on post-innovation returns. Quality im-provements may also have a negative impact on the commercialuncertainty of innovation (Astebro and Michela, 2005). Both arelikely to contribute positively to firms' incentive to innovate.
Despite the potential gains of AMT use there have been rela-tively few studies of the role of AMTs in shaping firms’ innovationactivities. Hewitt-Dundas (2004) explores the role of AMTs inshaping small firms’ innovation strategy choices, indicating thatfirms which have adopted AMTs are more likely to adopt ‘complex’strategies involving the production of new products for newmarkets. Raymond et al. (2009) also focus on small firms anddemonstrate a relationship between AMT adoption and innovationoutputs in Spanish small firms. Also in the context of Spain, Barge-Gil et al. (2011) argue that AMTs may contribute to explaininginnovation outcomes in firms which do not undertake R&D. Theyargue that including AMTs as part of the explanation of firms'innovation achievements may help to broaden the relevance ofresearch findings: ‘If the role of activities closer to daily routineswere highlighted as sources of innovation, however, managersmay be more likely to enter the innovation process. From theperspective of innovation policy, the majority of measures to foster
1 However, it is important to note that Boyer (1999) reports that manufacturingplants that emphasize low costs are also those investing more heavily in AMT.
innovation has focused on R&D activities and has therefore beenlimited to a subset of innovators' (p. 416). Santamaría et al. (2009)report that the use of AMT is a critical factor in the generation ofproduct and process innovations in low-and-medium technology(LMT) firms but is of limited importance in the case of hightechnology firms. Santamaría et al. (2009) argue that non-R&Dinternal activities are important for innovation in LMT industriesgiven the innovation process in such industries is not usually theresult of the latest scientific or technological knowledge, but morelikely to involve transforming the general stock of knowledge intoeconomically useful knowledge (Santamaría, Nieto, and Barge-Gil,2009). Interestingly, an earlier study reports a non-significant as-sociation with respect to AMT use and innovation capabilities inSwiss firms (Arvanitis et al., 2002).
One potentially important issue in relating AMTs to innovationis that appropriating the potential benefits of AMTs may be diffi-cult and time-consuming. Bunduchi et al. (2011) explain that thesuccessful implementation of process innovations requires anunderstanding of its benefits and costs, and that the cost-benefittrade-off can vary given how extensively the technology has beenadopted within an industry. Previous research has highlighted themany difficulties experienced by firms with respect to im-plementation and exploitation of AMTs (Sohal, 1996). Zammutoand O’Connor (1992), for example, summarise the results of anumber of studies which illustrate both the difficulties of im-plementing AMTs and the contingencies which may influencetheir effective implementation. As Barge-Gil et al. (2011) remark:‘skilled use of AMT is not easy to attain and depends upon severalcontingencies. It triggers many changes and success depends uponthe ability of a firm to assimilate them and upon changing prac-tices in order to afford a better fit with the AMT’ (Barge-Gil et al.,2011, p. 419).2 Training may, for example, contribute to enhanceindividual capabilities and firms’ abilities to take advantage of theinnovation benefits of AMTs (Barge-Gil et al., 2011). Similarly, moreflexible – less hierarchic – management structures and culturesmay also make AMT implementation more effective (Zammutoand O’Connor, 1992). We therefore anticipate that the initialadoption and implementation of AMT is likely to have a short termdisruptive effect with benefits only being realised in the mediumto long term (Spanos and Voudouris, 2009). This leads us to ourfirst hypothesis:
H1a. Adoption of AMTs will lead to a short term disruptive effect oninnovation performance.
H1b. Adoption of AMTs will lead to longer-term beneficial effects oninnovation performance.
2.2. AMT adoption: complementarities and learning-by-using effects
Scholars of AMT adoption and diffusion have used two modelsto conceptualise the trajectories of AMT adoption: the incrementaland the discontinuous models (Boyer, 1999). The incrementalmodel assumes that there is a logical, sequential progression inAMT adoption from stand-alone to intermediate and finally tointegrated technologies. According to the incremental model,adoption of a given technology should be deemed successful be-fore the next, possibly more complicated, technology is adopted(Meredith and Hill, 1987). In contrast, the discontinuous model ofAMT adoption argues that firms move towards using an integratedsystem, such as CIM, in a major discontinuous leap in which all theequipment is adopted at once rather than built up incrementally
2 The process of AMT implementation itself, however, may also have positivebenefits for innovation by stimulating new innovation as firms go through theprocess of learning-by-using the new technology.
3 Individual survey response rates were: 1994–96, 32.9 per cent; 1997–99, 32.8per cent; 2000–02, 34.1 per cent; 2003–05, 28.7 per cent; 2006–08, 38.0 per cent(Roper et al., 1996; Roper and Hewitt-Dundas, 1998; Roper and Anderson, 2000;Hewitt-Dundas and Roper, 2008).
4 Variable definitions are given in Annex 1.5 While this data is helpful one important limitation of the IIP is also worth
noting. The structure of the survey questionnaire means that this adoption data isonly collected for plants which reported undertaking some process innovationduring the previous three years. Plants need not, however, have undertaken pro-duct innovation.
J. Bourke, S. Roper / Technovation 55-56 (2016) 42–55 45
over time. The discontinuous model of AMT adoption claims thatsuccessful adoption of integrated AMT systems requires consider-able planning and resources and is a complex investment decisionlargely independent of previous adoption decisions (Meredith,1987). A common factor in these contrasting AMT adoption modelsis that firms do not typically adopt one AMT in isolation, butvarious AMTs are adopted either sequentially (incremental modelof adoption) or simultaneously (discontinuous model of adoption).Gomez and Vargas (2012) highlight the interrelations of some ofthe AMT technologies, advising that the adoption and use of thesetechnologies should not be analysed in isolation. Our analysis ex-tends to investigating whether complementarities arising fromsimultaneous adoption and learning-by-using effects from se-quential adoption enhance firms’ innovation performance.
Harnessing complementarities between different activities isan important aspect of firms’ strategic decision-making (Milgromand Roberts, 1990, 1995). While previous AMT studies have high-lighted complementarities from adopting a suite of AMTs si-multaneously; to date, there is little understanding of whethercomplementary AMTs benefit innovation performance. From theinnovation literature, we know however that firm innovationbenefits from complementary human resource managementpractices (Laursen and Foss, 2003) and organisational practices(Lhuillery, 2000). Therefore, any complementarities across AMTsare likely to enhance firm innovation.
In the innovation literature, there is also considerable evidenceof the benefits of experiential learning from initial adoption deci-sions on subsequent adoption decisions. Rosenberg (1972) describesthe process by which a firm increases its' stock of knowledge basedon its’ previous experience with technologies as learning-by-using.Previous studies have highlighted the benefit to firms of learning-by-using new technology with respect to subsequent adoption de-cision-making. For instance, Colombo and Mosconi (1995) reportcumulative learning effects from AMT adoption in the Italian me-talworking industry, McWilliams and Zilbermanfr (1996) reportlearning-by-using from the adoption of computer technology byfarmers in California, and Arvantis and Hollenstein (2001) reportlearning-by-using effects from use of an earlier generation ofmanufacturing technologies on AMT adoption by Swiss firms.
In order to determine the influence of AMT complementaritiesand learning-by-using effects on innovation, we examine the effectof simultaneous and sequential AMT adoption on innovation per-formance. Two discrete activities are complementary if adding oneactivity increases the returns from doing the other. Therefore, weexamine how adoption of one AMT may complement early adop-tion of another AMT, and hypothesise that simultaneous adoption oftwo AMTs will lead to increased returns on innovation performance.
H2. Simultaneous AMT adoption generates positive complemen-tarities increasing the benefits for innovation.
The cross-over and learning from simultaneous adoption islikely to benefit firm innovation to a greater extent than singularadoption. However, it is difficult to predict in advance where thecomplementarities, if any, are likely to exist between the fourAMTs examined in this paper.
In relation to the sequential adoption of AMTs, previous studieshave illustrated how AMT adoption benefits subsequent adoption(Arvantis and Hollenstein, 2001; Colombo and Mosconi, 1995;McWilliams and Zilbermanfr, 1996). It is likely that as a firm in-creases its stock of knowledge due to learning from earlier AMTadoption, the disruptive effects of subsequent AMT adoption andimplementation will be eased. Firms that sequentially adopt AMTsare likely to reap the benefits of previous ATM experience to agreater extent than firms who have no previous ATM experience.Therefore, we hypothesise that early adoption and implementation
of an ATM will enhance the innovation returns from subsequentadoption decisions.
H3. Early adoption of one AMT will generate learning-by-usingeffects increasing the innovation benefits of subsequent QIMadoption.
3. Data and methods
Our empirical analysis is based on the Irish Innovation Panel(IIP) which provides data on the innovation activity and AMT useof manufacturing plants in Ireland and Northern Ireland over theperiod 1994–2008. More specifically, this element of the IIP com-prises five surveys or waves each conducted using similar surveymethodologies and common questions. Individual survey waveswere designed to be representative of the population of manu-facturing plants in Ireland and Northern Ireland at the time of thesurvey. Sampling frames were derived either from administrativedata provided by government agencies in Ireland and NorthernIreland or private sector data providers. Each survey was con-ducted by post with extensive telephone follow-up and wasstructured by plant sizeband and industry. Each survey related tothe innovation activities of plants with 10 or more employees overa three-year reference period.3 Combining the individual surveysinto the IIP results in a highly unbalanced panel reflecting plants’non-response to individual surveys but also the opening and clo-sure of individual plants over the 1994–2008 period.
Plants' innovation activity in the IIP is represented by thestandard Community Innovation Survey indicator: the proportionof plants' total sales (at the end of each three-year reference per-iod) derived from products newly introduced during the previousthree years. This variable has been widely used as an indicator ofplants' innovation output (Laursen and Salter, 2006; Roper et al.,2008; Love et al., 2009), and reflects not only plants' ability tointroduce new products to the market but also their short-termcommercial success. Across those elements of the IIP used in thecurrent analysis, 16.3 per cent of plants’ sales were derived fromnewly introduced products (Table 1) a figure which remained re-latively constant through the different waves of the IIP (Fig. 1).4
One rather unusual feature of the IIP is that alongside plants'innovation activity it also provides information on the use andadoption of AMTs by manufacturing plants.5 Four specific AMTsare considered: Robotics, Automated materials handling, Compu-ter aided production management, and Computer integratedmanufacturing. For each of these technologies survey respondentswere asked to indicate whether or not they used the technologyand, if so, whether they had first introduced this technology in thethree year period covered by the survey, the previous three years,or prior to this. For each respondent this provides an indication ofwhether they are using each technology and an indication of thelength of time in which it has been in use in the plant. For ex-ample, around 17.5 per cent of the 1593 observations in the IIPwere using Robotics with 6.3 per cent of plants adopting this in thethree years prior to the date of the survey, 4.4 per cent adopting 3–6 years before the survey, and 6.4 per cent earlier than that

Table 1Sample descriptives. Source: Irish Innovation Panel – waves 2–6. Observations areweighted. Variable definitions in Annex A.
No. ofobservations
Mean Std. Dev.
Innovative sales from new products (%) 1704 16.312 22.571Innovative sales from new and im-proved products (%)
1700 27.612 30.515
AMT variablesRobotics Use 1593 0.175 0.380AMH Use 1622 0.272 0.445CAM Use 1704 0.385 0.487CIM Use 1625 0.214 0.410Robotics current adopter 1585 0.063 0.242Robotics previous adopter 1585 0.044 0.205Robotics early adopter 1585 0.064 0.245AMH current adopter 1602 0.107 0.309AMH previous adopter 1602 0.064 0.244AMH early adopter 1602 0.093 0.290CAM current adopter 1679 0.154 0.361CAM previous adopter 1679 0.095 0.293CAM early adopter 1679 0.125 0.331CIM current adopter 1611 0.086 0.280CIM previous adopter 1611 0.054 0.226CIM early adopter 1611 0.067 0.250
Plant characteristicsR&D in house 1704 0.520 0.500Linkages with customers 1704 0.291 0.455Linkages with suppliers 1704 0.315 0.465Horizontal linkages 1704 0.793 1.387Employment (log) 1704 3.693 1.102Firm Vintage 1704 29.020 28.543Externally Owned 1704 0.220 0.414Workforce with degree (%) 1704 10.330 12.893Government support 1704 0.261 0.439Exports (%) 1704 21.209 32.096
J. Bourke, S. Roper / Technovation 55-56 (2016) 42–5546
(Table 1).6 Computer Integrated Manufacturing (CIM) was im-plemented in around a quarter of plants of which 8.6 per centreported having adopted this technology in the previous 3 years.
The IIP also provides information on a number of other plantcharacteristics which previous studies have linked to innovationoutputs. For example, plants' in-house R&D activities are routinelylinked to innovation performance in econometric studies withsuggestions that the innovation-R&D relationship reflects bothknowledge creation (Harris and Trainor, 1995) and absorptive ca-pacity effects (Griffith et al., 2003). 52.0 per cent of plants wereconducting in-house R&D at the time of the IIP surveys (Table 1).Reflecting recent writing on open innovation (Chesbrough, 2007;Chesborough, 2006) external innovation relationships have alsobeen shown to play an important role in shaping innovation out-puts (Oerlemans et al., 1998; Ritala et al., 2013), complementingplants' internal capabilities (He and Wong, 2012; Cassiman andVeugelers, 2006; Arora and Gambardella, 1990; Belderbos et al.,2006; Cassiman and Veugelers, 2006). Here, we include three se-parate variables representing plants' external innovation co-op-eration with customers, suppliers and other organisations outsidethe supply chain. Around 29.1 per cent of plants reported havinginnovation cooperation with customers, while 31.5 per cent hadbackwards innovation cooperation with suppliers (Table 1). Linksoutside the supply chain could be with a variety of different typesof organisation (e.g. universities, consultants) and here we con-struct a count variable representing the number of types of part-ner with which a plant was cooperating. On average, plants werecooperating with around 0.79 organisations outside the supply
6 Table 2 includes the correlation matrix.
chain (Table 1). We also include in the analysis a variable reflectingthe proportion of each plant's workforce which have a degree levelqualification to reflect potential labour quality impacts on in-novation (Freel, 2005; Leiponen, 2005) or absorptive capacity. Fi-nally, studies of the impact of publicly funded R&D have, sinceGriliches (1995), repeatedly suggested that government supportfor R&D and innovation can have positive effects on innovationactivity both by boosting levels of investment (Hewitt-Dundas andRoper, 2009) and through its positive effect on organisationalcapabilities (Buiseret et al., 1995). Here, we therefore include adummy variable where plants received public support forinnovation.7
Our empirical approach focuses on the innovation or knowl-edge production function which represents the process throughwhich plants’ intellectual capital is transformed into innovationoutputs (Griliches, 1995; Love and Roper, 2001; Laursen and Salter,2006). If Ii is an innovation output indicator for plant i the in-novation production function might be summarised in cross-sec-tional terms as:
β β β β β β β δ= + + + + + + + ( )I AMT RD FS BS HS CONT 1i i i i i i i i0 1 2 3 4 5 6
where: AMTi denotes plants' adoption of AMTs, RDi are plants' in-house R&D investments, FSi, BSi and HSi are forwards, backwardsand horizontal knowledge search respectively, and CONTi is avector of other plant level controls (Annex A). Our hypothesessuggest, however, that the innovation benefits of AMT adoptionmay vary depending on the time since adoption with the potentialfor short-term disruption (H1a) and longer-term gains (H1b). Totest our hypotheses we estimate a dynamic version of Eq. (1) ex-plicitly identifying AMT adoption in the current (three-year) per-iod and in two previous periods, i.e.
β β β β β β
β β β δ
= + + + + +
+ + + + ( )
− −I AMT AMT AMT RD FS
BS HS CONT 2
i t it it i i
i i i i
0 10 11 1 12 2 2 3
4 5 6
Support for H1a requires β10o0, with H1b requiring β1140and β1240.
Our second and third hypotheses relate to potential com-plementarities and learning-by-using effects between AMTs, de-noted here AMTA and AMTB. If =−AMT 1t
B2 where a firm is an early
adopter of AMTB and zero otherwise we estimate:
β β β β
β β
β
β β β β β δ
= + * + * +
*
+ *( − ) + *( − )
+ *( − )
+ + + + + + ( )
− − − −
−
− − −
− −
I AMT AMT AMT AMT AMT
AMT
AMT AMT AMT AMT
AMT AMT
RD FS BS HS CONT
1 1
1
3
i tA
tB
tA
tB
tA
tB
tA
tB
tA
tB
tA
tB
i i i i i i
0 101 2 111 1 2 121 2
2
102 2 112 1 2
122 2 2
2 3 4 5 6
For Hypothesis 2, which reflects the complementary benefits ofsimultaneous adoption we anticipate that early adoption of AMTA
in period t-2 will have greater benefits where a firm also adoptsAMTB in period t-2. Here, we test β1214β122. For Hypothesis3 which reflects the potential learning-by-using effects from earlyadoption of AMTB we test whether β1014β102 and/or β1114β112.
Our choice of estimation method is dictated largely by the factthat we are using plant-level data from a highly unbalanced paneland that our dependent variables are percentages. We thereforemake use of tobit estimators, including in each model a set ofsector controls at the 2- digit level and a series of time dummies topick up any secular differences between the waves of the IIP.
7 Elsewhere we profile the range of public support initiatives for innovation inIreland and Northern Ireland over the period covered by the IIP (Meehan, 2000;O’Malley et al., 2008).

Table 2Correlation matrix. Source: Irish Innovation Panel – waves 2–6. Variable definitions in Annex A.
1 2 3 4 5 6 7 8 9 10 11 12 13 14
1 Sales from New Products 1.002 Sales from New & Improved Products 0.77 1.003 Robotics Use 0.15 0.14 1.004 AMH Use 0.09 0.11 0.36 1.005 CAM Use 0.09 0.13 0.24 0.28 1.006 CIM Use 0.09 0.09 0.35 0.35 0.45 1.007 Current Robotics Adoption 0.08 0.09 0.56 0.26 0.16 0.26 1.008 Previous Robotics Adoption 0.11 0.10 0.48 0.16 0.11 0.16 �0.06 1.009 Early Robotics Adoption 0.05 0.05 0.57 0.16 0.11 0.14 �0.07 �0.06 1.00
10 Current AMH Adoption �0.01 0.03 0.17 0.55 0.16 0.21 0.28 0.03 �0.03 1.0011 Previous AMH Adoption 0.08 0.08 0.22 0.47 0.11 0.20 0.10 0.24 0.03 �0.09 1.0012 Early AMH Adoption 0.07 0.06 0.17 0.54 0.17 0.13 0.01 0.00 0.25 �0.10 �0.09 1.0013 Current CAM Adoption 0.04 0.08 0.22 0.24 0.57 0.37 0.25 0.09 0.02 0.29 0.07 0.00 1.0014 Previous CAM Adoption �0.01 0.02 0.07 0.04 0.42 0.18 0.02 0.06 0.04 �0.04 0.05 0.06 �0.12 1.0015 Early CAM Adoption 0.09 0.09 0.04 0.13 0.50 0.10 �0.05 0.01 0.10 �0.04 0.05 0.19 �0.15 �0.1116 Current CIM Adoption 0.02 0.04 0.26 0.26 0.30 0.60 0.32 0.08 0.01 0.30 0.09 0.01 0.51 �0.0517 Previous CIM Adoption 0.03 0.05 0.11 0.13 0.21 0.49 0.03 0.13 0.04 0.05 0.16 0.00 0.07 0.3018 Early CIM Adoption 0.09 0.06 0.17 0.15 0.20 0.51 0.04 0.04 0.18 �0.05 0.08 0.21 �0.04 0.0719 R&D in house 0.20 0.31 0.08 0.12 0.13 0.08 0.03 0.03 0.07 0.06 0.05 0.08 0.04 0.0620 Linkages with customers 0.17 0.23 0.17 0.14 0.13 0.12 0.14 0.09 0.05 0.09 0.08 0.05 0.12 0.0421 Linkages with suppliers 0.19 0.23 0.17 0.18 0.16 0.16 0.12 0.09 0.06 0.11 0.09 0.07 0.13 0.0422 Horizontal linkages 0.15 0.22 0.20 0.22 0.19 0.21 0.16 0.11 0.06 0.16 0.13 0.05 0.16 0.0223 Employment (log) 0.15 0.18 0.35 0.27 0.29 0.25 0.25 0.18 0.12 0.17 0.14 0.12 0.27 0.0924 Firm Vintage �0.14 �0.10 �0.03 0.03 0.00 0.00 �0.03 0.00 �0.02 0.05 �0.01 0.00 0.03 0.0125 Externally Owned 0.13 0.12 0.23 0.14 0.16 0.14 0.16 0.14 0.08 0.08 0.09 0.05 0.19 0.0526 Workforce with degree (%) 0.16 0.17 0.06 0.01 0.02 0.04 0.05 0.02 0.02 0.03 0.01 �0.02 0.05 �0.0127 Government support 0.17 0.25 0.07 0.06 0.10 0.03 0.06 0.04 0.01 0.02 0.04 0.03 0.05 0.0328 Exports (%) 0.18 0.21 0.22 0.09 0.15 0.13 0.15 0.14 0.07 0.05 0.08 0.02 0.15 0.08
15 16 17 18 19 20 21 22 23 24 25 26 27 2815 Early CAM Adoption 1.0016 Current CIM Adoption �0.07 1.0017 Previous CIM Adoption �0.03 �0.07 1.0018 Early CIM Adoption 0.28 �0.08 �0.06 1.0019 R&D in house 0.09 0.04 0.02 0.06 1.0020 Linkages with customers 0.03 0.09 0.04 0.05 0.23 1.0021 Linkages with suppliers 0.07 0.11 0.08 0.06 0.20 0.62 1.0022 Horizontal linkages 0.09 0.16 0.06 0.11 0.23 0.59 0.55 1.0023 Employment (log) 0.06 0.22 0.11 0.06 0.19 0.16 0.19 0.26 1.0024 Firm Vintage �0.04 0.06 �0.02 �0.06 �0.04 �0.04 �0.01 0.05 0.09 1.0025 Externally Owned �0.01 0.12 0.10 0.00 0.00 0.07 0.11 0.11 0.42 0.04 1.0026 Workforce with degree (%) �0.02 0.04 �0.01 0.02 0.13 0.17 0.12 0.17 0.06 �0.01 0.16 1.0027 Government support 0.06 0.02 0.00 0.02 0.37 0.22 0.16 0.26 0.13 �0.03 �0.07 0.14 1.0028 Exports (%) �0.02 0.11 0.09 0.00 0.11 0.13 0.11 0.16 0.35 �0.10 0.48 0.31 0.09 1.00
Fig. 1. Innovative sales by Irish manufacturing plants: by period. Source: Irish Innovation Panel – waves 2–6. Observations are weighted. Variable definitions in Annex A.
J. Bourke, S. Roper / Technovation 55-56 (2016) 42–55 47
J. Bourke, S. Roper / Technovation 55-56 (2016) 42–5548
Observations are also weighted to provide representative resultsand take account of the structured nature of the IIP surveys.
Table 4Dynamic models: Tobit Models of innovative sales of new products. Source:Irish Innovation Panel – waves 2–6. Observations are weighted. All models containindustry and wave dummies. A full set of tables, which include industry and wavedummies, is available from the authors on request. Variable definitions in Annex A.
Model 1 Model 2 Model 3 Model 4
Current CAM Adoption �1.385(�1.547)
Previous CAM Adoption �3.379*
(�1.818)Early CAM Adoption 5.169***
(�1.632)Current AMH Adoption �2.119
4. Results
4.1. Dynamic analysis
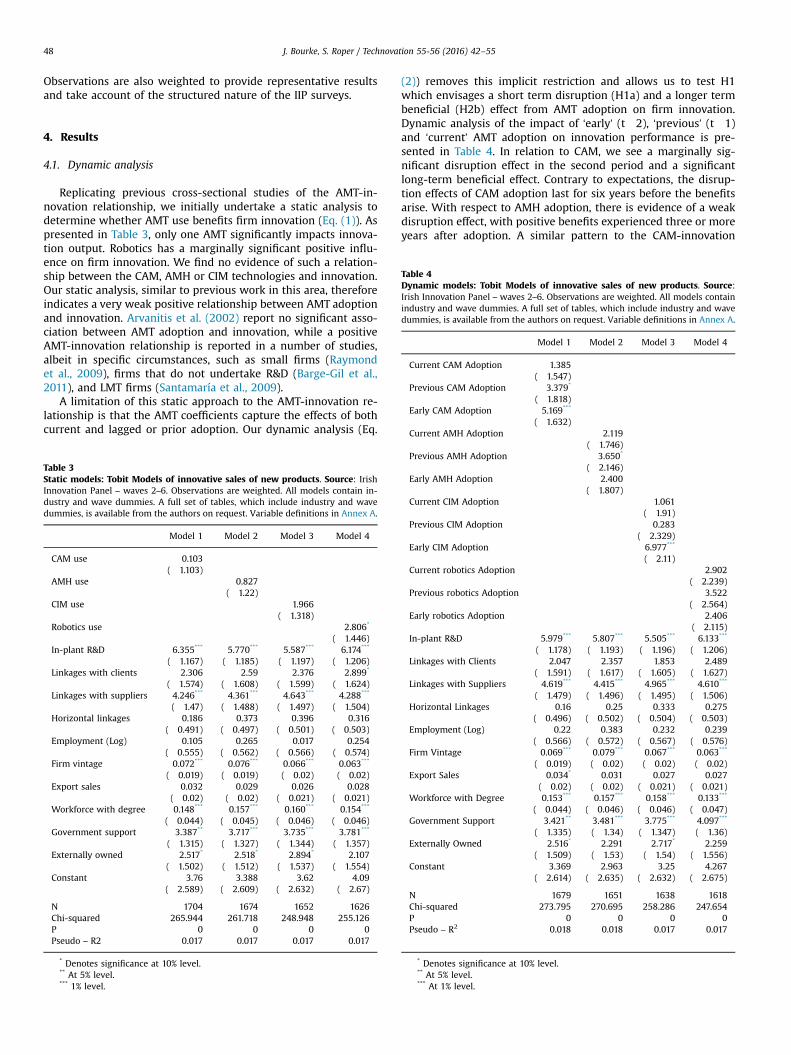
Replicating previous cross-sectional studies of the AMT-in-novation relationship, we initially undertake a static analysis todetermine whether AMT use benefits firm innovation (Eq. (1)). Aspresented in Table 3, only one AMT significantly impacts innova-tion output. Robotics has a marginally significant positive influ-ence on firm innovation. We find no evidence of such a relation-ship between the CAM, AMH or CIM technologies and innovation.Our static analysis, similar to previous work in this area, thereforeindicates a very weak positive relationship between AMT adoptionand innovation. Arvanitis et al. (2002) report no significant asso-ciation between AMT adoption and innovation, while a positiveAMT-innovation relationship is reported in a number of studies,albeit in specific circumstances, such as small firms (Raymondet al., 2009), firms that do not undertake R&D (Barge-Gil et al.,2011), and LMT firms (Santamaría et al., 2009).
A limitation of this static approach to the AMT-innovation re-lationship is that the AMT coefficients capture the effects of bothcurrent and lagged or prior adoption. Our dynamic analysis (Eq.
Table 3Static models: Tobit Models of innovative sales of new products. Source: IrishInnovation Panel – waves 2–6. Observations are weighted. All models contain in-dustry and wave dummies. A full set of tables, which include industry and wavedummies, is available from the authors on request. Variable definitions in Annex A.
Model 1 Model 2 Model 3 Model 4
CAM use 0.103(�1.103)
AMH use 0.827(�1.22)
CIM use 1.966(�1.318)
Robotics use 2.806*
(�1.446)In-plant R&D 6.355*** 5.770*** 5.587*** 6.174***
(�1.167) (�1.185) (�1.197) (�1.206)Linkages with clients 2.306 2.59 2.376 2.899*
(�1.574) (�1.608) (�1.599) (�1.624)Linkages with suppliers 4.246*** 4.361*** 4.643*** 4.288***
(�1.47) (�1.488) (�1.497) (�1.504)Horizontal linkages �0.186 �0.373 �0.396 �0.316
(�0.491) (�0.497) (�0.501) (�0.503)Employment (Log) 0.105 0.265 �0.017 �0.254
(�0.555) (�0.562) (�0.566) (�0.574)Firm vintage �0.072*** �0.076*** �0.066*** �0.063***
(�0.019) (�0.019) (�0.02) (�0.02)Export sales 0.032 0.029 0.026 0.028
(�0.02) (�0.02) (�0.021) (�0.021)Workforce with degree 0.148*** 0.157*** 0.160*** 0.154***
(�0.044) (�0.045) (�0.046) (�0.046)Government support 3.387** 3.717*** 3.735*** 3.781***
(�1.315) (�1.327) (�1.344) (�1.357)Externally owned 2.517* 2.518* 2.894* 2.107
(�1.502) (�1.512) (�1.537) (�1.554)Constant 3.76 3.388 3.62 4.09
(�2.589) (�2.609) (�2.632) (�2.67)
N 1704 1674 1652 1626Chi-squared 265.944 261.718 248.948 255.126P 0 0 0 0Pseudo – R2 0.017 0.017 0.017 0.017
* Denotes significance at 10% level.** At 5% level.*** 1% level.
(2)) removes this implicit restriction and allows us to test H1which envisages a short term disruption (H1a) and a longer termbeneficial (H2b) effect from AMT adoption on firm innovation.Dynamic analysis of the impact of ‘early’ (t�2), ‘previous’ (t�1)and ‘current’ AMT adoption on innovation performance is pre-sented in Table 4. In relation to CAM, we see a marginally sig-nificant disruption effect in the second period and a significantlong-term beneficial effect. Contrary to expectations, the disrup-tion effects of CAM adoption last for six years before the benefitsarise. With respect to AMH adoption, there is evidence of a weakdisruption effect, with positive benefits experienced three or moreyears after adoption. A similar pattern to the CAM-innovation
(�1.746)Previous AMH Adoption 3.650*
(�2.146)Early AMH Adoption 2.400
(�1.807)Current CIM Adoption �1.061
(�1.91)Previous CIM Adoption �0.283
(�2.329)Early CIM Adoption 6.977***
(�2.11)Current robotics Adoption 2.902
(�2.239)Previous robotics Adoption 3.522
(�2.564)Early robotics Adoption 2.406
(�2.115)In-plant R&D 5.979*** 5.807*** 5.505*** 6.133***
(�1.178) (�1.193) (�1.196) (�1.206)Linkages with Clients 2.047 2.357 1.853 2.489
(�1.591) (�1.617) (�1.605) (�1.627)Linkages with Suppliers 4.619*** 4.415*** 4.965*** 4.610***
(�1.479) (�1.496) (�1.495) (�1.506)Horizontal Linkages �0.16 �0.25 �0.333 �0.275
(�0.496) (�0.502) (�0.504) (�0.503)Employment (Log) 0.22 0.383 0.232 �0.239
(�0.566) (�0.572) (�0.567) (�0.576)Firm Vintage �0.069*** �0.079*** �0.067*** �0.063***
(�0.019) (�0.02) (�0.02) (�0.02)Export Sales 0.034* 0.031 0.027 0.027
(�0.02) (�0.02) (�0.021) (�0.021)Workforce with Degree 0.153*** 0.157*** 0.158*** 0.133***
(�0.044) (�0.046) (�0.046) (�0.047)Government Support 3.421** 3.481*** 3.775*** 4.097***
(�1.335) (�1.34) (�1.347) (�1.36)Externally Owned 2.516* 2.291 2.717* 2.259
(�1.509) (�1.53) (�1.54) (�1.556)Constant 3.369 2.963 3.25 4.267
(�2.614) (�2.635) (�2.632) (�2.675)
N 1679 1651 1638 1618Chi-squared 273.795 270.695 258.286 247.654P 0 0 0 0Pseudo – R2 0.018 0.018 0.017 0.017
* Denotes significance at 10% level.** At 5% level.*** At 1% level.

CAMAdoption
Earlier period
CIMAdoption
Earlier period
CIMAdoption
Previous period
CIMAdoption
Current periodCurrentperiod
Previousperiod
Earlierperiod
H3
H3
H2
Fig. 2. Overview of complementarity and LBU hypotheses.
J. Bourke, S. Roper / Technovation 55-56 (2016) 42–55 49
relationship is evident in the CIM analysis. CIM adoption results ina negative disruption effect over two periods, followed by a sig-nificantly stronger longer-term beneficial effect (Table 4). Finally,in relation to robotics, there is no evidence of a disruption effectand limited evidence of longer tem innovation benefits.
We hypothesised that AMT adoption would result in a shortterm disruption effect (H1a) and a longer term beneficial effect(H1b). We do find consistent but weak support for H1a. In relationto three technologies, CAM, AMH and CIM, we do find evidence ofshort-term disruption effects, although this finding is significantonly in the case of CAM. We find stronger evidence in support ofH1b, particularly in relation to CAM and CIM where there arestrong longer-term innovation benefits from adoption. The short-term disruption and longer-term beneficial effects pattern forCAM, AMH and CIM adoption is not evident in relation to robotics.
Our static and dynamic estimations highlight the different in-novation effects of AMTs depending on their period of acoption.We might conclude from our static analysis, for example, thatthere is no positive innovation benefit from CAM, AMH and CIMadoption. This would be wrong as our dynamic analysis clearlyidentifies the longer-term innovation benefits which do arise fromAMT adoption.
Other factors also prove important in determining firms' in-novation outputs. For example, R&D has a consistently positiveand significant effect on firm innovation performance. This findingis in line with previous studies (Harris and Trainor, 1995; Griffithet al., 2003). We also find that interactions with suppliers have apositive influence on firm innovation performance. Many studieshave also reported the positive influence of external relationshipson firm innovation outputs (Oerlemans et al., 1998; Ritala et al.,2013; He and Wong, 2012; Cassiman and Veugelers, 2006; Aroraand Gambardella, 1990; Belderbos et al., 2006; Cassiman andVeugelers, 2006). There is no evidence of a relationship betweeninteractions with customers or competitors and firms’ innovationperformance. Firm size, measured by number of employees, doesnot influence firm innovation performance. We do, however, find apositive relationship between a graduate workforce and firms’innovation performance. Firms with increasing proportions ofgraduates on their workforce report an increasing percentage ofsales from new products. Firm vintage negatively influences firminnovation, whereas exporting and externally-owned firms aremarginally more innovative. We also find that Government sup-port for innovation has a consistently positive and statisticallysignificant influence on firm innovation performance. Thus, firmswho receive government support for innovation report a higherpercentage of sales from new products relative to those firms whodo not receive such support. This finding is in line with earlierstudies (Buiseret et al., 1995; Love et al., 2011).
4.2. Complementarities and learning-by-using effects
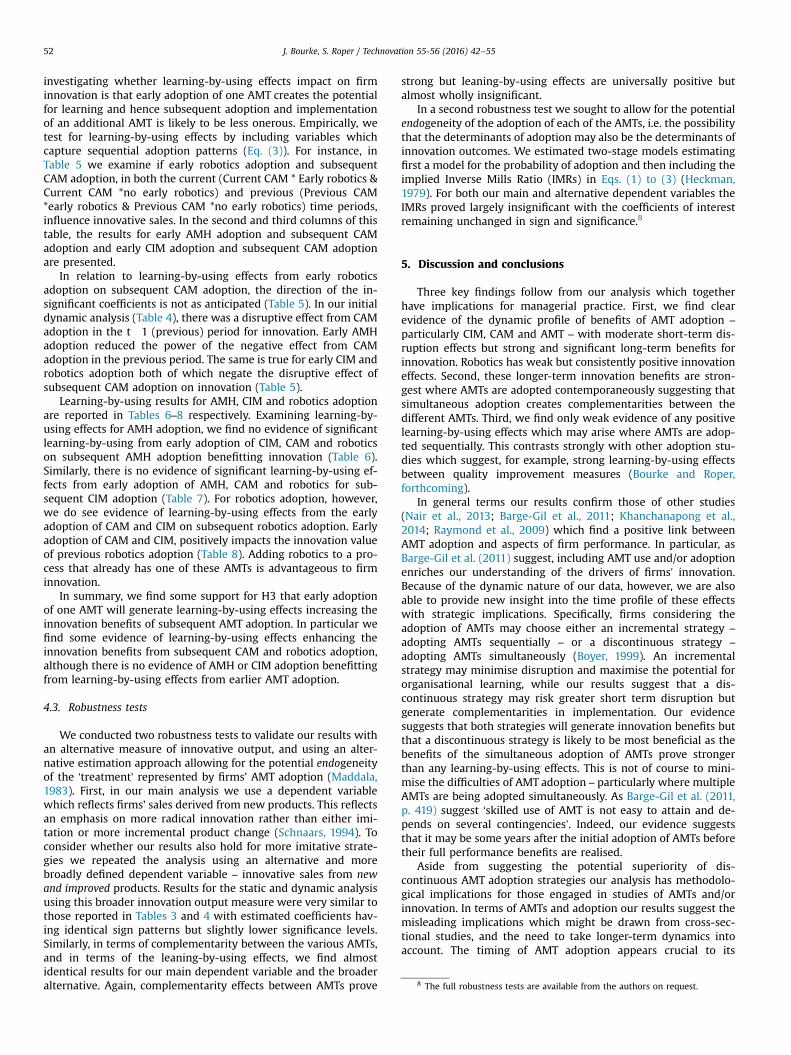
In our investigation of complementarities and learning-by-usingeffects, we attempt to determine if simultaneous and sequentialadoption of AMTs benefit the firm (see Fig. 2). We hypothesise thatsimultaneous AMT adoption (i.e. the adoption of more than one AMTin a given period) may generate positive complementarities in-creasing the benefits to innovation (H2), and that (early) adoption ofone AMT will generate learning-by-using effects increasing the in-novation benefits of subsequent AMT adoption (H3). We undertakefour sets of analyses which examine the influence of simultaneousand sequential adoption of AMTs on innovative sales. These analysesare reported in Tables 5–8, with each Table relating to the com-plementarities and learning-by-using effects associated with one
AMT. Table 5, for example, presents the results of our com-plementarity and learning-by-using analyses for CAM, and Tables 6–8present these analyses for AMH, CIM and robotics (Rob) respectively.In each case the structure of the table is similar with the first modelin Table 5, for example, examining if early CAM adoption and earlyrobotics adoption generate complementarities and learning-by-usingeffects for innovation. For our examination of complementarities, weinclude two variables in the first model, one of which captureswhether firms were early adopters of both CAM and robotics (EarlyCAM * Early robotics) and another which captures those that wereearly CAM adopters but not early robotics adopters (Early CAM *noearly robotics). In the same model we include variables which cap-ture the potential learning-by-using effects generated by sequentialadoption of AMTs. For instance, in the first model in Table 5, weexamine if early adoption of robotics and subsequent CAM adoption,in both the current and previous time periods influence sales. Aswith the complementarities we include two variables to test eachpotential effect: to test for learning by using effects on the innovationbenefits of current CAM adoption we include ‘Current CAM * Earlyrobotics’ and ‘Current CAM *no early robotics’; to test for learning byusing effects on the innovation benefits of previous adoption weinclude ‘Previous CAM *early robotics’ and ‘Previous CAM *no earlyrobotics’. In a similar pattern, the second model in Table 5 examinesif early adoption of both CAM and AMH generates complementaritiesfor innovation and, if early adoption of AMH and subsequent adop-tion of CAM in the current and previous time periods generateslearning-by-using benefits of innovation. The third model in Table 5examines if early adoption of both CAM and CIM generates com-plementarities for innovation and, if early adoption of CIM andsubsequent adoption of CAM in the current and previous time per-iods generates learning-by-using benefits. Each model includes thesame set of control variables as those in Tables 3 and 4 although forsimplicity these are not reported. Full results are available on request.
Complementarities exist where the sum of the benefits ofadopting AMTs separately is less than the benefit of adopting themsimultaneously (Eq. (3)). Empirically, we are examining the influ-ence of simultaneous early adoption of two AMTs on innovativesales. We first examine if complementarities exist between earlyCAM adoption and early adoption of the other three AMTs andthese results are presented in the first rows of Table 5. Our analysisreveals that, in each case, early adoption of other AMTs increasesthe innovation value of early adoption of CAM (as is evident from

Table 5CAM adoption: complementarities and learning by using effects. Source: Irish Innovation Panel – waves 2–6. Observations are weighted. Models contain identical controlvariables as reported in initial dynamic analysis (Table 4). A full set of tables, is available from the authors on request. Variable definitions in Annex A.
Innovation sales Innovation sales Innovation sales
Simultaneous CAM adoption: complementarities
Early CAM Adoption: w/wo early Rob Early CAM Adoption: w/wo early AMH Early CAM Adoption: w/wo early CIM
Early CAM* Early Rob 12.462*** Early CAM * Early AMH 7.650** Early CAM * Early CIM 6.444**
(�4.075) (�3.066) (�2.892)Early CAM * No Early Rob 3.470* Early CAM * No Early AMH 4.719** Early CAM * No Early CIM 4.234**
(�1.873) (�1.939) (�1.987)
Sequential CAM adoption: learning by usingCAM Adoption: w/wo early Rob adoption CAM Adoption: w/wo early AMH adoption CAM Adoption: w/wo early CIM adoptionCurrent CAM * Early Rob �5.804 Current CAM * Early AMH 10.616** Current CAM * Early CIM �6.182
(�5.658) (�4.824) (�6.740)Current CAM * No Early Rob �0.191 Current CAM * No Early AMH �1.717 Current CAM * No Early CIM �1.831
(�1.739) (�1.712) (�1.675)Previous CAM * Early Rob �7.142 Previous CAM * Early AMH �4.982 Previous CAM * Early CIM 3.881
(�6.217) (�4.479) (�5.764)Previous CAM * No Early Rob �3.923* Previous CAM * No Early AMH �3.837* Previous CAM * No Early CIM �5.537***
(�2.119) (�2.139) (�2.059)
CAM adoption conditional on Rob CAM adoption conditional on AMH CAM adoption conditional on CIMComplementarities 4.26** Complementarities 0.71 Complementarities 0.43LBU Current 0.94 LBU Current 6.08** LBU Current 0.40LBU Previous 0.25 LBU Previous 0.05 LBU Previous 2.44Observations 1704 1704 1704
n denotes significance at 10% level; nnat 5% level; nnn at 1% level.
Table 6AMH adoption: complementarities and learning by using effects. Source: Irish Innovation Panel – waves 2–6. Observations are weighted. Models contain identical controlvariables as reported in initial dynamic analysis (Table 4). A full set of tables, is available from the authors on request. Variable definitions in Annex A.
Innovation sales Innovation sales Innovation sales
Simultaneous AMT adoption: complementarities
Early AMH Adoption: w/wo early robotics Early AMH Adoption: w/wo early CAM Early AMH Adoption: w/wo early CIM
Early AMH n Early Rob 4.033 Early AMH n Early CAM 7.774nn Early AMH n Early CIM 7.916nn
(�3.787) (�3.07) (�3.895)Early AMH n No Early Rob 1.822 Early AMH n No Early CAM 1.297 Early AMH n No Early CIM 1.537
(�2.246) (�2.261) (�2.187)
Sequential AMT adoption: learning by usingAMH Adoption: w/wo early AMH adoption AMH Adoption: w/wo early CAM adoption AMH Adoption: w/wo early CIM adoptionCurrent AMH n Early Rob 1.344 Current AMH n Early CAM 1.523 Current AMH n Early CIM 1.052
(�7.576) (�5.448) (�9.404)Current AMH n No Early Rob �2.208 Current AMH n No Early CAM �1.864 Current AMH n No Early CIM �1.666
(�1.963) (�1.883) (�1.921)Previous AMH n Early Rob 5.458 Previous AMH n Early CAM 2.101 Previous AMH n Early CIM 6.335
(�7.561) (�4.502) (�5.217)Previous AMH n No Early Rob 3.703 Previous AMH n No Early CAM 5.103n Previous AMH n No Early CIM 3.825
(�2.389) (�2.514) (�2.484)
AMH adoption conditional on Rob AMH adoption conditional on CAM AMH adoption conditional on CIMComplementarities 0.27 Complementarities 3.09nn Complementarities 2.14LBU Current 0.21 LBU Current 0.36 LBU Current 0.08LBU Previous 0.05 LBU Previous 0.36 LBU Previous 0.19Observations 1704 1704 1704
Notes: n denotes significance at 10% level; nn5% level; nnn at 1% level.
J. Bourke, S. Roper / Technovation 55-56 (2016) 42–5550
the significant and larger coefficient for the first variable in eachmodel capturing simultaneous early adoption) (Table 5). For AMHwe see from Table 6 that simultaneous early adoption of AMH withCAM and with CIM enhances the innovation value of AMH;
although there is no evidence that simultaneous AMH and roboticsadoption has a value enhancing effect on AMH. Our com-plementarity results in relation to CIM (Table 7) are similar tothose for CAM, i.e. we find simultaneous adoption with any of the
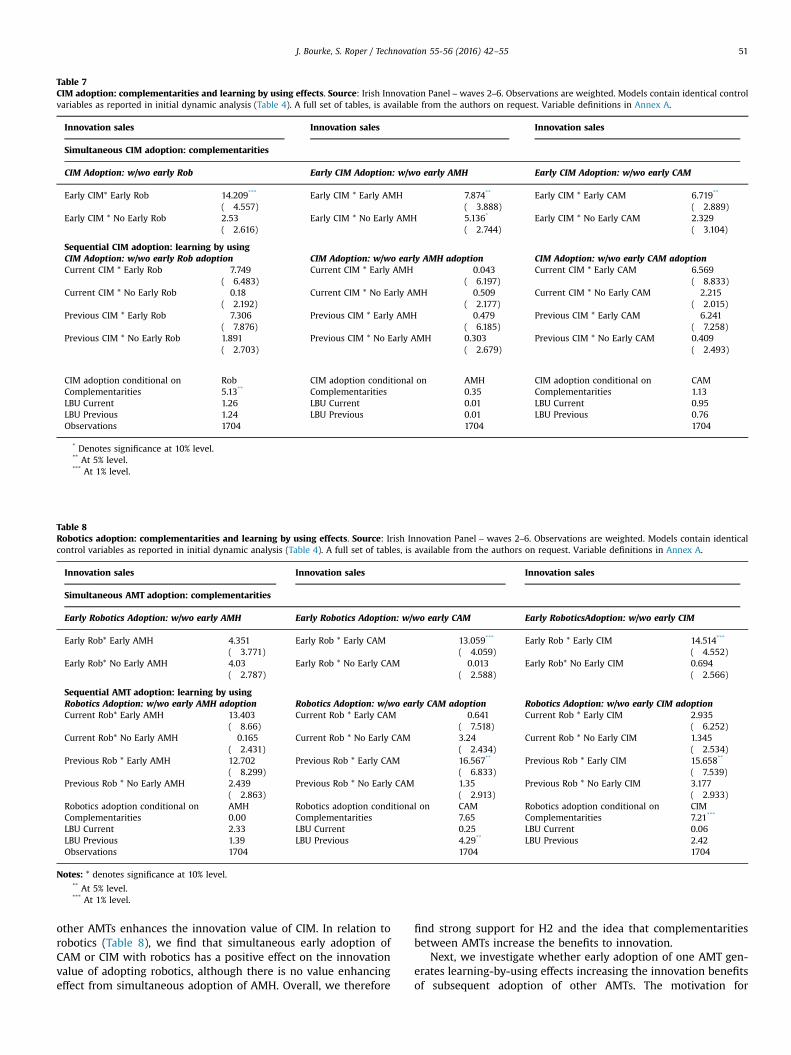
Table 7CIM adoption: complementarities and learning by using effects. Source: Irish Innovation Panel – waves 2–6. Observations are weighted. Models contain identical controlvariables as reported in initial dynamic analysis (Table 4). A full set of tables, is available from the authors on request. Variable definitions in Annex A.
Innovation sales Innovation sales Innovation sales
Simultaneous CIM adoption: complementarities
CIM Adoption: w/wo early Rob Early CIM Adoption: w/wo early AMH Early CIM Adoption: w/wo early CAM
Early CIM* Early Rob 14.209*** Early CIM * Early AMH 7.874** Early CIM * Early CAM 6.719**
(�4.557) (�3.888) (�2.889)Early CIM * No Early Rob 2.53 Early CIM * No Early AMH 5.136* Early CIM * No Early CAM 2.329
(�2.616) (�2.744) (�3.104)
Sequential CIM adoption: learning by usingCIM Adoption: w/wo early Rob adoption CIM Adoption: w/wo early AMH adoption CIM Adoption: w/wo early CAM adoptionCurrent CIM * Early Rob �7.749 Current CIM * Early AMH �0.043 Current CIM * Early CAM 6.569
(�6.483) (�6.197) (�8.833)Current CIM * No Early Rob �0.18 Current CIM * No Early AMH �0.509 Current CIM * No Early CAM �2.215
(�2.192) (�2.177) (�2.015)Previous CIM * Early Rob �7.306 Previous CIM * Early AMH �0.479 Previous CIM * Early CAM �6.241
(�7.876) (�6.185) (�7.258)Previous CIM * No Early Rob 1.891 Previous CIM * No Early AMH 0.303 Previous CIM * No Early CAM 0.409
(�2.703) (�2.679) (�2.493)
CIM adoption conditional on Rob CIM adoption conditional on AMH CIM adoption conditional on CAMComplementarities 5.13** Complementarities 0.35 Complementarities 1.13LBU Current 1.26 LBU Current 0.01 LBU Current 0.95LBU Previous 1.24 LBU Previous 0.01 LBU Previous 0.76Observations 1704 1704 1704
* Denotes significance at 10% level.** At 5% level.*** At 1% level.
Table 8Robotics adoption: complementarities and learning by using effects. Source: Irish Innovation Panel – waves 2–6. Observations are weighted. Models contain identicalcontrol variables as reported in initial dynamic analysis (Table 4). A full set of tables, is available from the authors on request. Variable definitions in Annex A.
Innovation sales Innovation sales Innovation sales
Simultaneous AMT adoption: complementarities
Early Robotics Adoption: w/wo early AMH Early Robotics Adoption: w/wo early CAM Early RoboticsAdoption: w/wo early CIM
Early Rob* Early AMH 4.351 Early Rob * Early CAM 13.059*** Early Rob * Early CIM 14.514***
(�3.771) (�4.059) (�4.552)Early Rob* No Early AMH 4.03 Early Rob * No Early CAM �0.013 Early Rob* No Early CIM 0.694
(�2.787) (�2.588) (�2.566)
Sequential AMT adoption: learning by usingRobotics Adoption: w/wo early AMH adoption Robotics Adoption: w/wo early CAM adoption Robotics Adoption: w/wo early CIM adoptionCurrent Rob* Early AMH 13.403 Current Rob * Early CAM �0.641 Current Rob * Early CIM 2.935
(�8.66) (�7.518) (�6.252)Current Rob* No Early AMH �0.165 Current Rob * No Early CAM 3.24 Current Rob * No Early CIM 1.345
(�2.431) (�2.434) (�2.534)Previous Rob * Early AMH 12.702 Previous Rob * Early CAM 16.567** Previous Rob * Early CIM 15.658**
(�8.299) (�6.833) (�7.539)Previous Rob * No Early AMH 2.439 Previous Rob * No Early CAM 1.35 Previous Rob * No Early CIM 3.177
(�2.863) (�2.913) (�2.933)Robotics adoption conditional on AMH Robotics adoption conditional on CAM Robotics adoption conditional on CIMComplementarities 0.00 Complementarities 7.65 Complementarities 7.21***
LBU Current 2.33 LBU Current 0.25 LBU Current 0.06LBU Previous 1.39 LBU Previous 4.29** LBU Previous 2.42Observations 1704 1704 1704
Notes: * denotes significance at 10% level.** At 5% level.*** At 1% level.
J. Bourke, S. Roper / Technovation 55-56 (2016) 42–55 51
other AMTs enhances the innovation value of CIM. In relation torobotics (Table 8), we find that simultaneous early adoption ofCAM or CIM with robotics has a positive effect on the innovationvalue of adopting robotics, although there is no value enhancingeffect from simultaneous adoption of AMH. Overall, we therefore
find strong support for H2 and the idea that complementaritiesbetween AMTs increase the benefits to innovation.
Next, we investigate whether early adoption of one AMT gen-erates learning-by-using effects increasing the innovation benefitsof subsequent adoption of other AMTs. The motivation for
8 The full robustness tests are available from the authors on request.
J. Bourke, S. Roper / Technovation 55-56 (2016) 42–5552
investigating whether learning-by-using effects impact on firminnovation is that early adoption of one AMT creates the potentialfor learning and hence subsequent adoption and implementationof an additional AMT is likely to be less onerous. Empirically, wetest for learning-by-using effects by including variables whichcapture sequential adoption patterns (Eq. (3)). For instance, inTable 5 we examine if early robotics adoption and subsequentCAM adoption, in both the current (Current CAM * Early robotics &Current CAM *no early robotics) and previous (Previous CAM*early robotics & Previous CAM *no early robotics) time periods,influence innovative sales. In the second and third columns of thistable, the results for early AMH adoption and subsequent CAMadoption and early CIM adoption and subsequent CAM adoptionare presented.
In relation to learning-by-using effects from early roboticsadoption on subsequent CAM adoption, the direction of the in-significant coefficients is not as anticipated (Table 5). In our initialdynamic analysis (Table 4), there was a disruptive effect from CAMadoption in the t�1 (previous) period for innovation. Early AMHadoption reduced the power of the negative effect from CAMadoption in the previous period. The same is true for early CIM androbotics adoption both of which negate the disruptive effect ofsubsequent CAM adoption on innovation (Table 5).
Learning-by-using results for AMH, CIM and robotics adoptionare reported in Tables 6–8 respectively. Examining learning-by-using effects for AMH adoption, we find no evidence of significantlearning-by-using from early adoption of CIM, CAM and roboticson subsequent AMH adoption benefitting innovation (Table 6).Similarly, there is no evidence of significant learning-by-using ef-fects from early adoption of AMH, CAM and robotics for sub-sequent CIM adoption (Table 7). For robotics adoption, however,we do see evidence of learning-by-using effects from the earlyadoption of CAM and CIM on subsequent robotics adoption. Earlyadoption of CAM and CIM, positively impacts the innovation valueof previous robotics adoption (Table 8). Adding robotics to a pro-cess that already has one of these AMTs is advantageous to firminnovation.
In summary, we find some support for H3 that early adoptionof one AMT will generate learning-by-using effects increasing theinnovation benefits of subsequent AMT adoption. In particular wefind some evidence of learning-by-using effects enhancing theinnovation benefits from subsequent CAM and robotics adoption,although there is no evidence of AMH or CIM adoption benefittingfrom learning-by-using effects from earlier AMT adoption.
4.3. Robustness tests
We conducted two robustness tests to validate our results withan alternative measure of innovative output, and using an alter-native estimation approach allowing for the potential endogeneityof the ‘treatment’ represented by firms' AMT adoption (Maddala,1983). First, in our main analysis we use a dependent variablewhich reflects firms' sales derived from new products. This reflectsan emphasis on more radical innovation rather than either imi-tation or more incremental product change (Schnaars, 1994). Toconsider whether our results also hold for more imitative strate-gies we repeated the analysis using an alternative and morebroadly defined dependent variable – innovative sales from newand improved products. Results for the static and dynamic analysisusing this broader innovation output measure were very similar tothose reported in Tables 3 and 4 with estimated coefficients hav-ing identical sign patterns but slightly lower significance levels.Similarly, in terms of complementarity between the various AMTs,and in terms of the leaning-by-using effects, we find almostidentical results for our main dependent variable and the broaderalternative. Again, complementarity effects between AMTs prove
strong but leaning-by-using effects are universally positive butalmost wholly insignificant.
In a second robustness test we sought to allow for the potentialendogeneity of the adoption of each of the AMTs, i.e. the possibilitythat the determinants of adoption may also be the determinants ofinnovation outcomes. We estimated two-stage models estimatingfirst a model for the probability of adoption and then including theimplied Inverse Mills Ratio (IMRs) in Eqs. (1) to (3) (Heckman,1979). For both our main and alternative dependent variables theIMRs proved largely insignificant with the coefficients of interestremaining unchanged in sign and significance.8
5. Discussion and conclusions
Three key findings follow from our analysis which togetherhave implications for managerial practice. First, we find clearevidence of the dynamic profile of benefits of AMT adoption –
particularly CIM, CAM and AMT – with moderate short-term dis-ruption effects but strong and significant long-term benefits forinnovation. Robotics has weak but consistently positive innovationeffects. Second, these longer-term innovation benefits are stron-gest where AMTs are adopted contemporaneously suggesting thatsimultaneous adoption creates complementarities between thedifferent AMTs. Third, we find only weak evidence of any positivelearning-by-using effects which may arise where AMTs are adop-ted sequentially. This contrasts strongly with other adoption stu-dies which suggest, for example, strong learning-by-using effectsbetween quality improvement measures (Bourke and Roper,forthcoming).
In general terms our results confirm those of other studies(Nair et al., 2013; Barge-Gil et al., 2011; Khanchanapong et al.,2014; Raymond et al., 2009) which find a positive link betweenAMT adoption and aspects of firm performance. In particular, asBarge-Gil et al. (2011) suggest, including AMT use and/or adoptionenriches our understanding of the drivers of firms’ innovation.Because of the dynamic nature of our data, however, we are alsoable to provide new insight into the time profile of these effectswith strategic implications. Specifically, firms considering theadoption of AMTs may choose either an incremental strategy –
adopting AMTs sequentially – or a discontinuous strategy –
adopting AMTs simultaneously (Boyer, 1999). An incrementalstrategy may minimise disruption and maximise the potential fororganisational learning, while our results suggest that a dis-continuous strategy may risk greater short term disruption butgenerate complementarities in implementation. Our evidencesuggests that both strategies will generate innovation benefits butthat a discontinuous strategy is likely to be most beneficial as thebenefits of the simultaneous adoption of AMTs prove strongerthan any learning-by-using effects. This is not of course to mini-mise the difficulties of AMT adoption – particularly where multipleAMTs are being adopted simultaneously. As Barge-Gil et al. (2011,p. 419) suggest ‘skilled use of AMT is not easy to attain and de-pends on several contingencies’. Indeed, our evidence suggeststhat it may be some years after the initial adoption of AMTs beforetheir full performance benefits are realised.
Aside from suggesting the potential superiority of dis-continuous AMT adoption strategies our analysis has methodolo-gical implications for those engaged in studies of AMTs and/orinnovation. In terms of AMTs and adoption our results suggest themisleading implications which might be drawn from cross-sec-tional studies, and the need to take longer-term dynamics intoaccount. The timing of AMT adoption appears crucial to its

J. Bourke, S. Roper / Technovation 55-56 (2016) 42–55 53
business benefits with coefficients in cross-sectional analyses im-plicitly ‘averaging’ opposing short-term disruption and longer-term beneficial effects. Second, as our results on the com-plementarities between AMTs suggest, the benefits of individualAMTs are strongly contextual, depending on the timing of adop-tion of other AMTs and potentially on other firm capabilities orstructural characteristics (Nair et al., 2013; Khanchanapong et al.,2014; Zammuto and O’Connor, 1992) which find a positive linkbetween AMT adoption and aspects of firm performance. In. Interms of innovation, our results reinforce the arguments of Barge-Gil et al. (2011) and the value of considering tangible as well asintangible investments as part of any explanation of firms'innovation.
Our analysis suffers from two main limitations. First, our ana-lysis focuses on Irish manufacturing businesses only and maytherefore be influenced by specific national circumstances. The1994–2008 period considered here, however, was a period of ra-pidly changing institutions in Ireland as well as marked changes inthe nation's economic fortunes – the Irish recovery of the late1990s, the 2000–02 high-tech crash, and a period of rapid sub-sequent growth. Second, we focus here purely on the averageAMT-innovation relationship and make little allowance for differ-ences in absorptive capacity between firms. The work of Sohal andothers (Chan et al., 2015; Hofmann and Orr, 2005; Sohal, 1996),however, suggests the potential importance of corporate cap-abilities linked to absorptive capacity for the effective im-plementation of AMTs. Sohal (1996), for example, in his ex-amination of AMT adoption by seven manufacturing companies
Table A1Variable definitions.
Innovation
Innovative sales (new) (% sales) An indicator representing the percentage of finewly introduced over the previous three yea
AMT variablesUse A binary variable taking value one if the planCurrent adopter A binary indictor taking value one if the plant h
currently using the technology.Early adopter A binary indictor taking value one if the plant
currently using the technology.Previous adopter A binary indictor taking value one if the plan
Plant characteristicsIn plant R&D A binary indictor taking value one if the planPercentage with degree Percentage of the workforce with a degree orPublic support for product innovation A binary indicator taking value one if the plant
years.Client Linkages A binary indicator taking value one if the planSupplier Linkages A binary indicator taking value one if the planHorizontal Linkages A count indicator of the breadth of plants’ oth
different types of partner the plant is workingprivate laboratory, industry research centre.
Employment Employment at the time of the survey.External ownership A binary indicator taking a value of one if theFirm vintage The age of the firm in years.Export sales Percentage of sales outside the British Isles
identified a number of advantages achieved through AMT adoptionincluding improved flexibility, reduced process time, reduced unitcosts and improvements in product quality. Problems during im-plementation arose from a lack of in-house programming skills,communication between departments and management, and thetrade-off between short-term production targets and the disrup-tion involved in AMT implementation. Other studies have em-phasised the importance of organisational culture as a pre-con-dition for successful AMT implementation (Zammuto and O’Con-nor, 1992). Are firms with stronger skill endowments, for example,able to accelerate the process of effective AMT implementation?How does this influence innovation outputs and competitiveoutcomes? Similar questions might also be posed in terms of R&Dor other in-house resources such as production engineering cap-abilities. Each of these questions might provide a useful focus forfuture research.
Acknowledgements
We are grateful for helpful comments from three referees andthe editor of this journal.
Annex A. Description of variables
See Annex Table A1.
rms’ sales at the time of the survey accounted for by products which had beenrs.
t uses the AMTad first introduced the AMT in the previous three years and zero otherwise and is
had first introduced the AMT in the previous six years and zero otherwise and is
t had introduced the AMT at any time and is currently using the technology.
t has an in-house R&D capacityequivalent qualificationhad received government support for product innovation over the previous three
t is co-operating with customers as part of its innovation activity.t is co-operating with suppliers as part of its innovation activity.er innovation partnering activity. Takes values 0–7 depending on how manywith: consultant, competitor, joint venture, government laboratory, university,
firm is owned outside Ireland.

J. Bourke, S. Roper / Technovation 55-56 (2016) 42–5554
References
Al-Laham, A., Tzabbar, D., Amburgey, T.L., 2011. The dynamics of knowledge stocksand knowledge flows: innovation consequences of recruitment and collabora-tion in biotech. Ind. Corp. Change 20, 555–583.
Anthony, S.D., Johnson, M.W., Sinfiled, J.V., Altman, E.J., 2008. The Innovators Guideto Growth – Putting Disruptive Innovation to Work. Harvard Business Press,Boston, MA.
Arora, A., Gambardella, A., 1990. Complementarity and external linkages: thestrategies of the large firms in biotechnology. J. Ind. Econ. 38, 361–379.
Artz, K.W., Norman, P.M., Hatfield, D.E., Cardinal, L.B., 2010. A longitudinal study ofthe impact of R&D, patents, and product innovation on firm performance. J.Product. Innov. Manag. 27, 725–740.
Arvanitis, S., Hollenstein, H., Lenz, S., 2002. The effectiveness of government pro-motion of Advanced Manufacturing Technologies (AMT): an economic analysisbased on Swiss micro data. Small Bus. Econ. 19, 321–340.
Arvantis, S., Hollenstein, H., 2001. The determinants of the adoption of advancedmanufacturing technology. Econ. Innov. New Technol. 10, 377–414.
Astebro, T., Michela, J.L., 2005. Predictors of the survival of innovations. J. Product.Innov. Manag. 22, 322–335.
Audretsch, D.B., Feldman, M.P., 1996. R&D spillovers and the geography of in-novation and production. Am. Econ. Rev. 86, 630–640.
Baptista, R., 2000. Do innovations diffuse faster within geographical clusters? Int. J.Ind. Organ 18, 515–535.
Barge-Gil, A., Jesus Nieto, M., Santamaria, L., 2011. Hidden innovators: the role ofnon-RD activities. Technol. Anal. Strat. Manag. 23, 415–432.
Barnes, J.W., Jackson, D.W.J., Hutt, M.D., Kumar, A., 2006. The role of culturestrength in shaping sales force outcomes. J. Personal. Sell. Sales Manag. 26,255–270.
Bartelsman, E., Van Leeuwen, G., Nieuwenhuijsen, H., 1998. Adoption of advancedmanufacturing technology and firm performance in The Netherlands. Econ.Innov. New Technol. 6, 291–312.
Battisti, G., Hollenstein, H., Stoneman, P., Woerter, M., 2007. Inter and intra firmdiffusion of ICT in the United Kingdom (UK) and Switzerland (CH): an inter-nationally comparative study base on firm-level data. Econ. Innov. New Tech-nol. 16, 669–687.
Battisti, G., Stoneman, P., 2005. The intra-firm diffusion of new process technolo-gies. Int. J. Ind. Organ 23, 1–22.
Belderbos, R., Carree, M., Lokshin, B., 2006. Complementarity in R&D cooperationstrategies. Rev. Ind. Organ 28, 401–426.
Boschma, R., 2005. Proximity and innovation: a critical assessment. Reg. Stud. 39,61–74.
Bellamy, M.A., et al., 2014. The influence of supply network structure on firm in-novation. J. Oper. Manag. 32 (6), 357–373.
Bourke, J., Roper, S., 2015. Innovation, Quality Management and Learning: A Dy-namic Analysis. Enterprise Research Centre, Warwick Business School, UnitedKingdom (forthcoming) (ERC Research paper No 30).
Boyer, K.K., 1999. Evolutionary patterns of flexible automation and performance: alongitudinal study. Manag. Sci. 45, 824–842.
Boyer, K.K., 1999. Evolutionary patterns of flexible automation and performance: alongitudinal study. Management Science 45 (6), 824–842.
Buiseret, T., Cameron, H.M., Georgiou, L., 1995. What differences does it make?Additionality in the public support of R&D in large firms. Int. J. Technol. Manag.10, 587–600.
Bunduchi, R., Weisshaar, C., Smart, A.U., 2011. Mapping the benefits and costs as-sociated with process innovation: The case of RFID adoption. Technovation 31(9), 505–521.
Calantone, R.J., Harmancioglu, N., Droge, C., 2010. Inconclusive Innovation “Re-turns”: a meta-analysis of research on innovation in new product development.J. Product. Innov. Manag. 27, 1065–1081.
Cassiman, B., Veugelers, R., 2006. In search of complementarity in innovation strategy:Internal R&D and external knowledge acquisition. Manag. Sci. 52, 68–82.
Chan, F., et al., 2015. Barriers to advanced manufacturing technology in small-medium enterprises (SMEs) in Malaysia. In: Proceedings of 2015 InternationalSymposium on Technology Management and Emerging Technologies (ISTMET).
Chesborough, H.W., 2006. Open Innovation: A New Paradign for UnderstandingIndustrial Innovation. Oxford University Press, Oxford.
Chesbrough, H.W., 2007. Why companies should have open business models. MITSloan Manag. Rev., 48.
Colombo, M.G., Mosconi, R., 1995. Complementarity and cumulative learning effectsin the early diffusion of multiple technologies. J. Ind. Econ. 43, 13–48.
Comacchio, A., S. Bonesso, S., Pizzi, C., 2012. Boundary spanning between industryand university: the role of technology transfer centres. J. Technol. Transf. 37 (6),943–966.
Corbett, C., VanWassenhove, L., 1993. Tradeoffs? What tradeoffs? Competence andcompetitiveness in manufacturing strategy. Calif. Manag. Rev. 35, 107–120.
Crowley, F., Bourke, J., 2016. The influence of human resource management systemson innovation: evidence from Ireland. Int. J. Innov. Manag. 20 (7) (forthcoming).
Crepon, B., Duguet, E., Mairessec, J., 1998. Research, innovation and productiviyy: aneconometric analysis at the firm level. Econ. Innov. New Technol. 7, 115–158.
Doran, J., Ryan, G., 2014. Firms' skills as drivers of radical and incremental in-novation. Econ. Lett. 125 (1), 107–109.
Freel, M.S., 2003. Sectoral patterns of small firm innovation: networking andproximity. Res. Policy 32, 751–770.
Freel, M.S., 2005. Patterns of Innovation and skills in small firms. Technovation 25,123–134.
Gordon, N.R., McCann, P., 2005. Innovation, agglomeration, and regional develop-ment. J. Econ. Geogr. 5 (5), 523–543.
Gómez, J., Vargas, P., 2012. Intangible resources and technology adoption in man-ufacturing firms. Res. Policy 41 (9), 1607–1619.
Griffith, R., Huergo, E., Mairesse, J., Peters, B., 2008. Innovation and productivityacross four European countries. Oxf. Rev. Econ. Policy 22, 483–498.
Griffith, R., Redding, S., Van Reenan, J., 2003. R&D and absorptive capacity: theoryand empirical evidence. Scand. J. Econ. 105, 99–118.
Griliches, Z., 1995. R&D and Productivity: Econometric Results and MeasurementIssues. Blackwell, Oxford.
Hang, C.C., Chen, J., Subramian, A.M., 2010. Developing disruptive products foremerging economies: lessons from Asian cases. Res. Technol. Manag. 53, 21.
Harris, R.I.D., Trainor, M., 1995. Innovation and R&D in Northern Ireland manu-facturing: a schumpeterian approach. Reg. Stud. 29, 593–604.
He, Z.L., Wong, P.K., 2012. Reaching out and reaching within: a study of the re-lationship between innovation collaboration and innovation performance. Ind.Innov. 19, 539–561.
Heckman, J., 1979. Sample Selection Bias as a specification error. Econometrica 47,153–161.
Hewitt-Dundas, N., 2004. The adoption of AMT and innovation strategy in smallfirms. Int. J. Innov. Technol. Manag. 1, 17–36.
Hewitt-Dundas, N., Roper, S., 2008. Ireland's Innovation Performance: 1991–2005.Quarterly Economic Commentary, ESRI, Dublin, pp. 46–68.
Hewitt-Dundas, N., Roper, S., 2009. Output additionality of public support for in-novation: evidence for Irish manufacturing plants. Eur. Plan. Stud. 18, 107–122.
Hofmann, C., Orr, S., 2005. Advanced manufacturing technology adoption – theGerman experience. Technovation 25, 711–724.
Ichijo, K., Kohlbacher, F., 2008. Tapping tacit local knowledge in emerging markets –the Toyota way. Knowl. Manag. Res. Pract. 6, 173–186.
Jordan, D., O’Leary, E., 2008. Is Irish innovation policy working? Evidence from Irishhigh-technology businesses. J. Stat. Soc. Inq. Soc. Irel. 37, 1–45.
Karshenas, M., Stoneman, P.L., 1993. Rank, stock, order, and epidemic effects in thediffusion of new process technologies: an empirical model. RAND J. Econ. 24,503–528.
Khanchanapong, T., Prajogo, D., Sohal, A.S., Cooper, B.K., Yeung, A.C.L., Cheng, T.C.,2014. The unique and complementary effects of manufacturing technologiesand lean practices on manufacturing operational performance. Int. J. Prod. Econ.153, 191–203.
Knockaert, M., Ucbasaran, D., Wright, M., Clarysse, B., 2009. How does tacitknowledge transfer inflence innovation speed? The case of science based en-trepreneurial firms. In: Vlerick Leuven Gent Working Paper Series 2009/07.
Kotha, S., Swamidass, P.M., 2000. Strategy, advanced manufacturing technology andperformance: empirical evidence from U.S. manufacturing firms. J. Oper.Manag. 18, 257–277.
Kyriakopoulos, K., de Ruyter, K., 2004. Knowledge stocks and information flows innew product development. J. Manag. Stud. 41, 1469–1498.
Laursen, K., Salter, A., 2006. Open for innovation: the role of openness in explaininginnovation performance among UK manufacturing firms. Strat. Manag. J. 27,131–150.
Laursen, K., Foss, N.J., 2003. New human resource management practices, com-plementarities and the impact on innovation performance. Cambridge J. econ.27 (2), 243–263.
Lei, D., Goldhar, J.D., 1990. Multiple niche competition: the strategic use of CIMtechnology. Manuf. Rev. 3, 195–206.
Leiponen, A., 2005. Skills and innovation. Int. J. Ind. Organ. 23, 303–323.Levin, R., Reiss, P., 1984. Tests of a Schumpeterian Model of R&D and Market
Structure. University Of Chicago Press, Chicago.Lhuillery, S., 2000. The organizational practices of innovation and the performances
of firms: an empirical investigation. Dynacom Website.Love, J.H., Roper, S., 2001. Networking and innovation success: a comparison of UK,
German and Irish companies. Res. Policy 30, 643–661.Love, J.H., Roper, S., Bryson, J.R., 2011. Openness, knowledge, innovation and growth
in UK business services. Res. Policy 40, 1438–1452.Love, J.H., Roper, S., Du, J., 2009. Innovation, ownership and profitability. Int. J. Ind. Organ.Maddala, G., 1983. Limited Dependent and Qualitative Variables in Econometrics.
Cambridge University Press, New York.Mansfield, E., 1986. Patents and innovation: an empirical study. Manag. Sci. 32, 173–181.Mansury, M.A., Love, J.H., 2008. Innovation, productivity and growth in US business
services: a firm-level analysis. Technovation 28, 52–62.McCann, P., Simonen, J., 2005. Innovation, knowledge spillovers and local labour
markets. Pap. Reg. Sci. 84, 465–485.McWilliams, B., Zilbermanfr, D., 1996. Time of technology adoption and learning by
using. Econ. Innov. New Technol. 4, 139–154.Meehan, E., 2000. Britain’s Irish question: Britain’s European question?: British-
Irish relations in the context of the European Union and the Belfast agreement.Rev. Int. Stud. 26, 83–97.
Meredith, J., 1987. The strategic advantages of the factory of the future. Calif.Manag. Rev. 29, 17–41.
Meredith, J., 1988. The role of manufacturing technology in competitiveness:peerless lasers processors. IEEE Trans. Eng. Manag. 35, 3–10.
Meredith, J., Hill, M.M., 1987. Justifying new manufacturing systems: a managerialapproach. Sloan Manag. Rev. 28, 49–61.
Milgrom, P., Roberts, J., 1990. The Economics of Modern Manufacturing: Technol-ogy, Strategy, and Organization. Am. Econ. Rev. 80 (3), 511–528.
Nair, A., et al., 2013. An examination of the use of manufacturing technologies andperformance implications in US plants with different export intensities. Int. J.Prod. Res. 51 (11), 3283–3299.
O’Malley, E., Roper, S., Hewitt-Dundas, N., 2008. High growth and innovation withlow R&D: the case of Ireland. In: Edquist, C., Hommen, L. (Eds.), Small EconomyInnovation System; Comparing Globalization, Change and Policy in Asia andEurope. Elgar.
Oerlemans, L., Meeus, M., Boekema, F., 1998. Do networks matter for innovation?The usefulness of the economic network approach in analysing innovation.Tijdschr. Econ. Soc. Gcografie 89, 298–309.

J. Bourke, S. Roper / Technovation 55-56 (2016) 42–55 55
Parhi, M., 2007. Global push, Competitiveness, and adoption of new technologies:reflections from Indian automotive firms. In: Proceedings of DRUID SummerConference. Copenhagen, CBS, Denmark.
Parthasarthy, R., Sethi, S.P., 1992. The impact of flexible automation on businessstrategy and organizational structure. Acad. Manag. Rev. 17, 86–111.
Raymond, L., Croteau, A.-M., Bergeron, F., 2009. The integrative role of IT in productand process innovation: growth and productivity outcomes for manufacturing.In: Filipe, J., Cordeiro, J. (Eds.), Enterprise Information Systems: Bk, pp. 27–39.
Ritala, P., Henttonen, K., Salojarvi, H., Sainio, L.M., Saarenketo, S., 2013. Gone fishingfor knowledge? The effect of strategic orientations on the scope of openknowledge search. Balt. J. Manag. 8, 328–348.
Ritala, P., Olander, H., Michailova, S., Husted, K., 2015. Knowledge sharing, knowl-edge leaking and relative innovation performance: an empirical study. Tech-novation 35, 22–31.
Romer, P.M., 1990. Endogenous technological change. J. Political Econ. 98, S71–S102.Roper, S., Anderson, J., 2000. Innovation and E-Commerce – A Cross-Border Com-
parison of Irish Manufacturing Plants, Belfast.Roper, S., Ashcroft, B., Love, J.H., Dunlop, S., Hofmann, H., Vogler-Ludwig, K., 1996.
Product Innovation and Development in UK, German and Irish Manufacturing.Queen's University of Belfast/University of Strathclyde/ifo Institut.
Roper, S., Du, J., Love, J.H., 2008. Modelling the innovation value chain. Res. Policy37, 961–977.
Roper, S., Hewitt-Dundas, N., 1998. Innovation, Networks and the Diffusion ofManufacturing Best Practice: A Comparison of Northern Ireland and the Re-public of Ireland. NIERC, Belfast.
Roper, S., Hewitt-Dundas, N., Love, J.H., 2004. An ex ante evaluation framework for theregional benefits of publicly supported R&D projects. Res. Policy 33, 487–509.
Rosenberg, N., 1982. Inside the Black Box:Technology and Economics. Cambridge
University Press, Cambridge.Santamaría, L., Nieto, M.J., Barge-Gil, A., 2009. Beyond formal R&D: taking ad-
vantage of other sources of innovation in low- and medium-technology in-dustries. Res. Policy 38, 507–517.
Schnaars, S.P., 1994. Managing Imitation Strategies. Free Press, New York.Schumpeter, J., 1934. The Theory of Economic Development. Harvard University
Press, Cambridge, MA.Sohal, A.S., 1996. Assessing AMT implementations: an empirical field study. Tech-
novation 16, 377–384.Spanos, Y.E., Voudouris, I., 2009. Antecedents and trajectories of AMT adoption: the
case of Greek manufacturing SMEs. Res. Policy 38, 144–155.Stoneman, P., Kwon, M.-J., 1994. The diffusion of multiple process technologies.
Econ. J. 104, 420–431.Stoneman, P., Toivanen, O., 1997. The diffusion of multiple technologies: an em-
pirical study. Econ. Innov. New Technol. 5, 1–17.Tether, B.S., 1998. Small and large firms: sources of unequal innovations? Res.
Policy 27, 725–745.Tyre, M.J., Hauptman, O., 1992. Effectiveness of organizational responses to tech-
nological-change in the production process. Organ Sci. 3, 301–320.Tzabbar, D., Aharonson, B.S., Amburgey, T.L., Al-Laham, A., 2008. When is the whole
bigger than the sum of its parts? Bundling knowledge stocks for innovativesuccess. Strat. Organ. 6, 375–406.
Wu, J.F., Shanley, M.T., 2009. Knowledge stock, exploration, and innovation: Re-search on the United States electromedical device industry. J. Bus. Res. 62,474–483.
Zammuto, R.F., O’Connor, E.J., 1992. Gaining advanced manufacturing technologiesbenefits – the roles of organization design and culture. Acad. Manag. Rev. 17,701–728.