ams annual report 2012
DESCRIPTION
2012TRANSCRIPT

Annual Report and Accounts 2012
Structured for Growth
Advanced M
edical Solutions Group plc Annual Report and Accounts 2012

Advanced Medical Solutions Group is a global medical device business providing innovative products and brands in the areas of accelerating healing and managing wounds, minimising adverse surgical outcomes and sealing and closing tissue.
Company Overview AMS at a glance1 Highlights 20122 Branded Direct3 Branded Distributed4 OEM5 Bulk Materials6 Operations
Business Review8 Chairman’s Statement9 Chief Executive’s Statement11 Financial Review14 Directors and Corporate Governance Standing Committees15 Management Team
Corporate Governance16 Advisors17 Directors’ Report22 Remuneration Report25 Corporate Governance Report28 Independent Auditor’s Report
Financial Statements29 Consolidated Income Statement29 Consolidated Statement of Comprehensive Income30 Consolidated Statement of Financial Position31 Consolidated Statement of Changes in Equity32 Consolidated Statement of Cash Flows33 Notes Forming Part of the Consolidated Financial Statements61 Company Balance Sheet62 Notes Forming Part of the Company Financial Statements65 Five Year Summary66 Notice of Meeting

Branded DirectDirect sales of AMS Group brands (ActivHeal®, LiquiBand®, RESORBA®) through our own sales teams in Germany, UK and Czech Republic.
Branded DistributedSales of AMS Group brands (ActivHeal®, LiquiBand®, RESORBA®) through our global network of distributors and sales into Russia.
OEMSales of finished products to global woundcare and wound closure OEM partners.
AMS at a glance
Delivering GrowthThrough four new focused business units
AMS Products and route to marketAMS manufactures woundcare products for an extensive list of Original Equipment Manufacturer (OEM) customers around the world, but the majority of the Group’s revenues come from its own brands - ActivHeal® woundcare products in the UK to the NHS, LiquiBand® cyanoacrylate products primarily in the UK, Europe and the USA and RESORBA® sutures and collagen woundcare products in Europe.
AMS’s products are sold globally via a network of regional or multinational partners and distributors, as well as via AMS’s own direct sales forces in the UK, Germany, Russia and Czech Republic.
At a glance Sales– Europe* – 32.1%– Germany – 26.5%– UK – 20.4%– USA – 19.0%– Rest of World – 2.0%* excluding UK and Germany
Head office – UK
Where we operate
Manufacturing – UK– Germany– the Netherlands– Czech Republic
Sales offices– UK– Germany– Russia– Czech Republic

OEMSales of finished products to global woundcare and wound closure OEM partners.
Bulk MaterialsSales of bulk material business (predominantly roll-stock foam) to converting partners in the woundcare market.
Our vision is to strengthen our position in our focus areas of woundcare dressings and surgical devices to become recognised as the preferred producer of innovative products and brands in:> accelerating healing and managing wounds;> minimising adverse surgical outcomes; and> sealing and closing tissue.
Countries we sell to
> 453 employees> Seven locations in five countries> Four business units> Technologies:
– alginates– silver alginates– foams– collagens– gels
– hydrocolloids– cyanoacrylate adhesives
and sealants– sutures

Group revenueup 53% to £52.6 million
Adjusted2 fully dilutedearnings per shareup 24% to 5.30p
Adjusted2 pro�t before taxup 85% to £12.1 million
Net funds/(debt) (£million)net debt reduced to £5.5 million
09 10 11 12
52.6
34.431.924.1
09 10 11 12
12.1
6.65.3
4.1
09 10 11 12
5.30
4.283.77
2.87
09 1011 12
(5.5)
(13.4)
3.91.7
Company O
verviewBusiness Review
Corporate Governance
Financial Statements
Advanced Medical Solutions G
roup plc Annual Report 2012 | PB
Advanced Medical Solutions G
roup plc Annual Report 2012 | 1
Highlights 2012Financial Highlights:
– Group revenue up 53% to £52.6 million (2011: £34.4 million), representing growth of 57% on a constant currency basis1
– Underlying like-for-like Group revenue on a constant currency basis (excluding RESORBA®) up by 3% to £35.1 million (2011: £34.4 million)
– Adjusted2 operating margin up 520 bps to 24.3% (2011: 19.1%)
– Adjusted2 profit before tax up 85% to £12.1 million (2011: £6.6 million)
– Profit before tax up 135% to £10.8 million (2011: £4.6 million)
– Adjusted2 fully diluted earnings per share up 24% to 5.30p (2011: 4.28p)
– Fully diluted earnings per share up 53% to 4.66p (2011: 3.04p)
– Operating cash flow before exceptional items3 of £13.4 million (2011: £6.7 million)
– Net debt reduced to £5.5 million (2011: £13.4 million)
– £3.6 million of original €25 million loan to acquire RESORBA® has been repaid ahead of schedule
– Proposed final dividend of 0.35p per share, making a total dividend for the year of 0.52p (2011: 0.45p), a 16% increase compared with the prior year
Business Highlights: – ActivHeal® continues its excellent progress in the NHS,
with a 29% increase in revenues
– Silver alginate revenues increased by 22%
– RESORBA® integration completed
– LiquiBand® sales in Germany via RESORBA® increased by 15%
– Successful contract award to supply NHS with sutures, haemostats as well as tissue adhesives from October 2012
– In the US, LiquiBand® market share by volume increased strongly to 13% (H1 2012: 10%) in the alternate site segment, although it declined to 4% (H1 2012: 6%) in the hospital segment
– New growth strategy launched for LiquiBand® in the US
– New trilaminate foam range launched into the EU and to the NHS
– Reorganisation of the Group complete to deliver growth1. Constant currency removes the effect of currency movements by re-translating the
current period’s performance at the previous period’s exchange rates2. All items are shown before exceptional items which were charged and, in 2012, were
£0.8 million (2011: £1.8 million) and before amortisation of acquired intangible assets which, in 2012, were £0.5 million (2011: £0.2 million) as defined in the financial review
3. Before exceptional items which were charged and, in 2012, were £0.8 million (2011: £1.8 million)

Advanced Medical Solutions G
roup plc Annual Report 2012 | 2
Advanced Medical Solutions G
roup plc Annual Report 2012 | 3
R E P A I R A N D R E G E N E R A T E
Branded Direct
Supporting health care providers, clinicians and patients in their care environment every day. This business unit provides trusted brands into hospitals and the private sector through its highly trained direct sales force in the UK, Germany and the Czech Republic.
Routes to MarketThe Group’s sales teams access the NHS in the UK and the hospital and dental markets in Germany as well as hospitals in the Czech Republic.
> Sales team in UK supporting ActivHeal®
> Sales team in UK targeting OR opportunity
> Sales teams in Germany and Czech Republic targeting hospitals and dental practices
StrategyOur strategy is to build on the Group’s brands to increase market share in the UK, Germany and Czech Republic.
> Increase sales of ActivHeal® into the NHS through:
> Clinical support team assistance >Market leading educational support > Improved range of products; trilaminate and bilaminate foam dressings
> Improve penetration into the Operating Room (OR) in UK through:
> OR sales team now in place > Initial sales of RESORBA® sutures and collagen products into NHS
> Increase market share in Germany and Czech Republic through:
> New products > Support of LiquiBand® > Accessing dental market
Research & DevelopmentNew products are key to supporting our direct sales opportunities.
This business unit will be responsible for developing our collagen and suture range of products.
> Strengthened collagens for dental applications
> Collagens with antibiotics
Additionally the hernia fixation device, which is a development to use cyanoacrylate internally, is expected to be approved for sales in Europe in 2013.
Branded DirectWith its strong brands; ActivHeal®, LiquiBand®, and a full portfolio of RESORBA® branded sutures, haemostats and an array of dental products, this business unit offers wound care and wound closure capabilities.
This business unit contributed 38% of Group revenue in 2012.

Advanced Medical Solutions G
roup plc Annual Report 2012 | 2
Advanced Medical Solutions G
roup plc Annual Report 2012 | 3
Company O
verviewBusiness Review
Corporate Governance
Financial Statements
R E P A I R A N D R E G E N E R A T E
Branded Distributed
Access to markets where the Group does not have a direct sales force is through our global distribution network supporting the Group’s brands.
Branded DistributedThis business unit drives sales of our branded products across the globe in all geographies not covered by our own direct sales forces. It includes some high opportunity areas such as establishing LiquiBand® in the US as well as growing an established RESORBA® business in Russia. It also includes the support of LiquiBand® and RESORBA® products across Europe.
This business unit contributed 13% of Group revenue in 2012 but has the potential to contribute more significantly.
StrategyOur strategy is to:
> Increase market share in the US through key partners
> Optimise the sales and marketing approach in Russia with launch of LiquiBand® into Russia expected in H2 2013
>Maximise opportunities across Europe, the Middle East and Asia with the combined distributor network for LiquiBand® and RESORBA®
> Gain approval for LiquiBand® in China
> Gain regulatory approval for sutures in the US, accessing the $1 billion suture market
Research & DevelopmentThe Branded Distributed business unit is responsible for the design and development of the LiquiBand® range of medical adhesives.
> Approval and launch of new variant of LiquiBand® for the US market in H2 2013
> Gain European approval for the internal application of cyanoacrylate for the fixation of hernia meshes in 2013
Routes to MarketSuccess with tissue adhesives in the US presents the largest, short-term opportunity.
> Supporting key partners in both the acute care (hospital) and the alternative site (non-hospital) market
>Working with both national and regional distributors to access the total US market
Elsewhere,
> Supporting existing distributors with an increased product portfolio – both RESORBA® and LiquiBand® brands
> Accessing new territories: China, Middle East and Asia through new distributors

Advanced Medical Solutions G
roup plc Annual Report 2012 | 4
Advanced Medical Solutions G
roup plc Annual Report 2012 | 5
OEM
The OEM (Original Equipment Manufacturer) business unit supports our business to business partners with innovative products that have global reach.
OEMThis business unit contributed 42% of Group revenue in 2012. It is responsible for growing our OEM contract manufacture sales through our partners. Additionally, the unit has responsibility for delivering value out of the advanced woundcare R&D stream.
Routes to MarketThe business unit will reinforce the process of key account management, so that AMS can build on its partnerships with B2B customers. Key objectives include:
> Expanding the range of products into existing customers
> Securing new customers through its reputation for quality, customer service and its regulatory capability
> Expanding its customer base in territories such as South America, Eastern Europe and the Middle East
StrategyOur strategy is to work with our partners to supply them with innovative products and a finished product solution. Having successfully supplied our partners with advanced woundcare products for many years, we now have a wider range of technologies to offer. Following our acquisition of RESORBA®, we aim to:
> Increase market share of the silver fibre market
> Develop the trilaminate foam opportunity
> Reinforce our position in the fibre and foam market through the launch of new products
Research & DevelopmentWe will continue to develop leading-edge products working with our partners and from our University research programmes. Our programmes include:
> Reinforcing our position in the fibres market
> Expanding our competitive trilaminate foam product offering, with the addition of anti-microbials and atraumatic wound contact layers

Advanced Medical Solutions G
roup plc Annual Report 2012 | 4
Advanced Medical Solutions G
roup plc Annual Report 2012 | 5
Company O
verviewBusiness Review
Corporate Governance
Financial Statements
Bulk Materials
Our focus is to provide innovative materials for our partners and to our internal customers.
Bulk MaterialsThis business unit contributed 7% of Group revenue in 2012. Its focus is to provide innovative materials for its partners and for internal customers in the Group.
The majority of the business is based on the Group’s foam technology but further opportunities include any of the Group’s other technology platforms such as alginates and gels thus providing access for our partners to AMS’s comprehensive material technology portfolio.
Routes to MarketThe Bulk Materials business unit will concentrate on building long-term relationships with partners and convertors as well as supplying the internal requirements of the Group.
> Expand commercial focus to new markets: Middle East, Far East and South America
Strategy > To extend the product offering through new product development
> To identify and deliver growth from new markets
Research & DevelopmentThe Bulk Materials business unit is committed to delivering material solutions for our customers.
> To develop new foam formulations such as antimicrobial and superabsorbents
> To expand technology portfolio

Advanced Medical Solutions G
roup plc Annual Report 2012 | 6
Advanced Medical Solutions G
roup plc Annual Report 2012 | 7
Operations
Employee safety, product quality, regulatory compliance, cost effectiveness and customer service are key to AMS’s operations.
Manufacturing StrategyAt AMS we are continuing to:
> Develop our LEAN manufacturing capability
> Promote Continuous Improvement activities
> Enhance employees’ skills to improve productivity and capacity to meet business growth
> Invest in equipment to improve efficiencies
Supply ChainWe work with our suppliers to improve our Supply Chain. Product quality and reliability of supply are foremost in our vendor ratings. In turn, we look to improve our service to our customers through:
> Reduced lead times
> Improved OTIF (On Time in Full) measurements
> Feedback from customer satisfaction ratings
Operations > At AMS we provide a safe working environment for all our employees. We ensure they are well trained, well led and motivated to excel.
> Our focus is in producing quality products. All our manufacturing processes are validated, our key suppliers are subjected to audit and verification and our Quality and Technical Support teams ensure that every product that leaves every plant is quality assured.
> All AMS devices are manufactured and tested to appropriate standards and all our facilities meet the requirements of our regulating bodies.
> Cost containment and waste reduction are key in a competitive world. Our LEAN manufacturing and Quality culture underpin our continuous improvement activities that ensure we can manufacture our products efficiently and effectively.
> AMS’s strong relationship with its customers is based upon integrity and performance. We strive to deliver what the customer wants.

Advanced Medical Solutions G
roup plc Annual Report 2012 | 6
Advanced Medical Solutions G
roup plc Annual Report 2012 | 7
Company O
verviewBusiness Review
Corporate Governance
Financial Statements
Our production processes are key to AMS delivering quality assured products to our customers.
RegulationThe requirements of compliance are constantly increasing. AMS has put into place resources and systems to ensure we meet the appropriate regulations whether they are in respect of Medical Device Registrations, Quality Management Systems, Health and Safety Policies or Environmental Legislation. We monitor:
> Registrations
> Compliance audits
> Safety scores
QualityAMS is focused on delivering quality assured products to its customers. Production processes such as packaging and sterilisation are validated to ISO standards. Statistical sampling techniques ensure that processes are run within specification limits and all products undergo inspection prior to release to customers.

Advanced Medical Solutions G
roup plc Annual Report 2012 | 8
Advanced Medical Solutions G
roup plc Annual Report 2012 | 9
Chairman’s Statement
Focused for future growth
Introduction2012 was an important year for the Group following the acquisition of RESORBA® in late December 2011. Group revenues and profits both saw strong growth as a result, not just from the new business we acquired but also from many of our existing operations which continued the excellent progress of the last few years.
As we indicated at the interims, we have been reviewing the organisational structure of the Group to ensure that the business is best positioned to deliver growth following the acquisition. As a result of this review, we have now moved from reporting under two business units, Advanced Woundcare and Wound Closure, to four business units: Branded Direct, Branded Distributed, OEM and Bulk Materials, and will be reporting our results under these business segments.
Financial HighlightsReported Group revenue was up 53% to £52.6 million (2011: £34.4 million) at constant currency. On a like-for-like, constant currency basis, excluding the contribution from RESORBA®, revenue grew 3% to £35.3 million (2011: £34.6 million).
The Group’s adjusted operating margin increased by 520 basis points (‘bps’) to 24.3% (2011: 19.1%), mainly due to the change in mix of business towards more of our own brands, including the contribution from the sutures and collagen products resulting from the RESORBA® acquisition. After net finance costs of £0.7 million (2011: £NIL), adjusted profit before tax increased by 85% to £12.1 million (2011: £6.6 million).
Adjusted fully diluted earnings per share¹ increased by 24% to 5.30p (2011: 4.28p).
Strong cash flow has reduced the Group’s net debt at 31 December 2012 to £5.5 million, which compares to £13.4 million at the end of 2011 following the RESORBA® acquisition. In this regard, we have been able to repay additional amounts of £2 million and €2 million of the original €25 million RESORBA® related term loan ahead of schedule.
Key Business AchievementsWe have now completed our restructuring of the Group so that we are appropriately organised to deliver the commercial opportunities resulting from our acquisition of RESORBA®. The details of this are included in the Chief Executive’s Review.
Within our Branded Direct business, ActivHeal® continues to perform well and achieved a 29% increase in revenues, while LiquiBand® in the UK grew by 5% with some initial success being seen from our new Operating Room (OR) sales force. The largest part of this unit, however, comprises the direct sales of RESORBA®‘s sutures, collagen and dental products into the German domestic market, which grew by 5% compared with 2011.
Sales of LiquiBand® into the US are included in our Branded Distributed business, and 2012 saw a mixed performance with continued gains in the non-hospital or alternative site market partly offset by a disappointing end to the year in the hospital market due to a key partner not meeting its contractual minima. However, we have now reassessed our market approach and our various partners’ capabilities, and we are pleased to advise that we will be positioning a new LiquiBand® product with a new partner in the US, with a launch expected in H2 2013. Elsewhere, the distributor business that we acquired with RESORBA® grew by a satisfactory 12%.
1 Adjusted basic earnings per share and adjusted fully diluted earnings per share are described in Note 15
Dr. Don EvansChairman
Within our OEM business, it was pleasing to see the 22% growth from our silver alginate business in 2012, well ahead of market growth rates. The previous destocking effect we saw with one of our partners is now well behind us.
As we had previously flagged, our Bulk Materials business declined 43% compared with the prior year due to pipeline filling by partners in 2011. This business is expected to return to growth in 2013.
DividendWe are proposing a final dividend of 0.35p per share, making a total dividend for the year of 0.52p per share, a 16% increase on 2011. If approved at the Annual General Meeting on 22 May 2013, this will be paid on 28 May 2013 to shareholders on the register at the close of business on 3 May 2013.
BoardWith the opportunities available to the Group we have decided to strengthen the Board and we will be adding a further Non-Executive Director with commercial experience during this year.
I also intend to step down as Chairman later this year after a successor has been found. In my 16 years with AMS I have seen the complete transformation of the Group, and I know that I will be leaving a business in excellent shape for future growth. I would like to thank the Board, my colleagues and all our employees for helping to build this great Company and to wish them all continued success.
EmployeesOn behalf of the Board, I would also like to thank all Group employees for all their hard work over the past year in ensuring the successful integration of RESORBA® into the Group as part of the continued development of AMS as a leading global medical technology business.
OutlookWe continue to be excited by the opportunities for LiquiBand® in the US and the benefits that our acquisition of RESORBA® will bring. These, together with the continued growth of ActivHeal® and silver alginate, as well as new product developments such as anti-microbial dressings and our hernia mesh device, give us confidence that the Group is well positioned for the future.
With our business more focused to deliver growth across the Group, we remain positive for the prospects of the Group.
Dr. Don EvansChairman10 April 2013

Advanced Medical Solutions G
roup plc Annual Report 2012 | 8
Advanced Medical Solutions G
roup plc Annual Report 2012 | 9
Financial Statements
Corporate Governance
Business ReviewCom
pany Overview
Key Performance Indicators (KPIs)
2012
2011
2010
2009
Revenue Growth(1)
53%
8%
18%
19%
24%
2012
2011
2010
2009
Adjusted fully dilutedearnings per share growth(2)
24%
14%
32%
33%
2012
2011
2010
2009
Return on Capital Employed
13.2%
26.0%
23.8%
24.7%
2012
2011
2010
2009
Adjusted operating margin(2)
24%
19%
17%
17%
24%
2012
2011
2010
2009
Customer service (OTIF)(3)
94%
87%
86%
93%
Chief Executive’s Statement
Chris MeredithChief Executive Officer
I am pleased to report that much of the progress highlighted at the interims continued through the second half of 2012, and AMS has delivered another strong year of growth. In particular, ActivHeal®, silver alginate and our converted foam portfolios all showed solid year-on-year progress and we are also pleased that the now completed integration of RESORBA® went to plan.
Business RestructureWith AMS now having multiple product portfolios, six manufacturing sites in four countries, several routes to market, and a number of different growth opportunities to pursue, the Group has been restructured to ensure the business continues to operate efficiently whilst retaining critical focus on each of our growth drivers. This has resulted in the reorganisation of the Group into four discrete business units - Branded Direct, Branded
Distributed, OEM and Bulk Materials - each responsible for two key value streams, namely a focused route-to-market and a core part of our R&D programme.
Each of the four business units will consist of a mix of sales, marketing, business development and R&D teams, led by individual business unit Directors, all of whom are appointed and in place. Linked to the above changes, our operational sites will focus on manufacturing their specialised products for any unit, with the focus being on sustained improvements in quality, efficiency, cost and service. Each operational site has a Site Manager who reports into our Group Operations Director. To complete the senior management team, a Group Quality and Regulatory Director will be starting in May 2013 to ensure that a consistent strategy and policy is adhered to throughout the Group, and a Site Manager for Germany has joined in March 2013.
I am pleased to report that the completion of the reorganisation marks the final stage of the integration of the RESORBA® business and we now have the focused organisational structure to deliver on the numerous opportunities across the Group.
OEM With revenue in 2012 of £22.0 million (2011: £18.5 million), our Original Equipment Manufacture (‘OEM’) business unit is the largest in the Group and has responsibility for driving our OEM contract manufacturing sales through business-to-business partners, as well as the R&D value stream associated with advanced woundcare dressings. Within this unit, accounting for nearly 50% of its revenue in 2012, are our silver alginate technologies which delivered 22% growth compared to 2011. After the destocking effect we previously saw with one of our major partners in 2011, it was pleasing to see our sales of silver alginate products grow by 26% in the UK and Europe and by 17% in the US. Silver alginate continues to be a key growth driver of this business unit. The rest of this business unit consists of alginate and foam-based finished dressings for our partners, together with the collagen OEM business acquired with RESORBA®.
R&D is working on a range of new anti-microbial dressings with launches scheduled during 2013.
Branded Direct Our Branded Direct business unit is the next largest with 2012 revenue of £20.1 million (2011: £5.7 million) and has responsibility for driving our own brand sales direct to end users in Germany, the UK and the Czech Republic, together with our suture and collagen R&D value stream as most sales based on these technologies are included in this unit. Other key growth drivers in this division are ActivHeal® sales to the NHS, up 29% in 2012, LiquiBand® sales into direct territories, up 5% in the UK and up 15% in Germany, and RESORBA® branded sutures and collagen dressings which grew by 5% in 2012 to £12.3 million.
(1) Revenue growth includes twelve months sales from RESORBA® acquisition(2) Before exceptional items and amortisation of acquired intangible assets(3) OTIF – ‘On time in full’

Advanced Medical Solutions G
roup plc Annual Report 2012 | 10
Advanced Medical Solutions G
roup plc Annual Report 2012 | 11
Working Group on NHS Tender
Branded Distributed Our Branded Distributed business unit reported 2012 revenue of £6.8 million (2011: £3.6 million) and has significant potential for growth given it has responsibility for driving our own brand sales through our third party network of global distribution partners, as well as managing our adhesives and sealants R&D value stream. This unit’s key growth drivers are LiquiBand® and sealants into the US which accounted for 29% of this unit’s total 2012 revenue (including sales to Russia), up by 10% over 2011.
Our progress into the US market with LiquiBand® was mixed in 2012. Latest data shows that we now have 13% of the alternative site market, a strong improvement from the 10% we had at the end of June 2012. We are pleased with this progress which is well in line with the targets that we set on launch two years ago. Our progress in the acute care or hospital sector has, however, been disappointing with our market share slipping back to 4% from the 6% we had at the half year. In this regard, LiquiBand® received less focus than we expected from one of our key partners in the second half of the year and this resulted in the partner not meeting their contractual minima in 2012. This has however given us an opportunity to reassess and refocus our US growth strategy for LiquiBand®, as outlined elsewhere in this report, and we remain positive about LiquiBand®’s overall prospects in the US.
This business unit also includes sales of RESORBA® products into Russia, along with RESORBA® and LiquiBand® products into new geographies through distributors, together with any ‘co-branded’ initiatives we choose to progress in order to get any of our technologies successfully established into new markets.
Bulk Materials Our final business unit handles our bulk materials, mainly roll-stock foam, through third-party partners who have their own converting and packaging capabilities. It also manufactures foam for AMS’s own operational requirements. Revenue in 2012 was lower at £3.8 million (2011: £6.6 million) due to the previously flagged pipeline filling from customer product launches that took place in 2011. Foam rollstock is the key growth driver in this unit, with 2012 revenue of £3.6 million (2011: £6.4 million), 86% of the total. We anticipate that revenue growth will resume in 2013.
Prospects for 2013I believe we have significant growth opportunities across all four of our new business units. Our strategic focus remains unchanged on our goal of establishing a leading global position in the woundcare, wound closure and sealants arenas, and the work done in 2012 ensures we have an organisation fit for purpose, with the RESORBA® business fully integrated.
Our silver alginate partners continue to make gains in the anti-microbial market segment, and planned product upgrades in 2013 will help strengthen our proposition in this area.
Our ActivHeal® success is expected to continue to build and deliver another year of solid double digit growth as we convert more hospitals and improve compliance in existing Trusts.
Our trial investment in a direct UK OR sales team is starting to deliver results with some notable recent LiquiBand® gains. This team will be strengthened further in 2013 and has also been trained on the RESORBA® products. With the tender awards that were granted in Q4 2012, we are well placed to grow our UK direct business in 2013.
The failure of a key US LiquiBand® partner to meet their contractual commitments in 2012 has allowed us to re-think our growth strategy in the US. Our alternate site partner has demonstrated what can be achieved with our formulations and designs. We have carved out individual areas of focus for our existing partners and will allow these to progress in 2013. Over and above these, we are seeking approval for a new formulation and plan to launch this by July 2013 with an additional new partner, giving them their own unique position and product and thereby further strengthening our ability to capture market share in the US tissue adhesive space.
Regulatory approvals are progressing for LiquiBand® in Russia and China, and we have a strategy that could see us introducing RESORBA® sutures into the US market for the first time, by the end of 2013.
On the new product front, we are still on track to gain approval for our Hernia Mesh Fixation device before the end of 2013 and will launch this initially through our own teams in the UK and Germany.
We are confident 2013 will be another strong year for the Group.
Chris MeredithChief Executive Officer10 April 2013

Corporate Governance
Financial Statements
Advanced Medical Solutions G
roup plc Annual Report 2012 | 10
Advanced Medical Solutions G
roup plc Annual Report 2012 | 11Business Review
Company O
verviewFinancial Review
Reported revenue increased by 53% to £52.6 million (2011: £34.4 million). At constant currency (that is re-translating the current period’s performance at the previous period’s exchange rates), revenue growth would have been 57%.
The Group had £0.8 million of exceptional items in 2012 (2011: £1.8 million) relating to integration and restructuring costs associated with the acquisition of the RESORBA® business. Amortisation of acquired intangible assets was £0.5 million (2011: £0.2 million).
Comparisons with 2011 are made on a pre-exceptional, pre-amortisation of acquired intangible assets cost basis as we believe that this provides a more relevant representation of the Group’s trading performance. To aid comparison, the Group’s adjusted income statement is summarised in Table 1 below.
Mary TavenerGroup Finance Director
Table 1Adjusted Income Statement
Year ended 31 December
2012 £’000
Year ended 31 December
2011 £’000 Change
Revenue 52,589 34,353 53.1%Gross profit 28,643 16,200 76.8%Distribution costs (543) (314)Administration expenses¹ (15,625) (9,546) 63.7%Other income 312 226
Adjusted operating profit 12,787 6,566 94.7%Net finance costs (662) (40)
Adjusted profit before tax 12,125 6,562 84.8%Amortisation of acquired intangibles (480) (168)Exceptional items (849) (1,807)
Profit before tax 10,796 4,587 135.4%Tax (1,104) 263
Profit for the year 9,692 4,850 99.8%Adjusted earnings per share – basic² 5.40p 4.36p 23.9%Earnings per share – basic² 4.75p 3.10p 53.0%Adjusted earnings per share – diluted² 5.30p 4.28p 23.8%Earnings per share – diluted² 4.66p 3.04p 53.0%
¹ Administration expenses exclude exceptional items and amortisation of acquired intangible assets² See Note 15 Earnings per share for details of calculation
Across the Group, gross margins increased by 730 bps to 54.5% (2011: 47.2%), reflecting the higher margins resulting from a direct, branded business.
Administration expenses¹ increased by 64% to £15.6 million (2011: £9.5 million) with increased costs resulting from the direct sales teams in Germany, the Czech Republic and Russia.
Total spend on R&D, both expensed and capitalised, was £2.8 million (2011: £1.5 million), however £0.8 million (2011: £0.3 million) was capitalised reflecting the progress of a number of projects.
Adjusted operating profit increased by 95% to £12.8 million (2011: £6.6 million) and the adjusted operating margin increased by 520 bps to 24.3% (2011: 19.1%).
Profit before tax for the period was 135% higher at £10.8 million (2011: £4.6 million).
The Group’s effective rate of tax for the year was 10.3%. This is reflective of the utilisation of previously unrecognised brought forward tax losses in the UK and R&D relief. It also reflects the impact of blending profits and losses from different countries and the different tax rates associated with these countries. The effective tax rate is lower than that reported at the half year due to the change in mix of sales in the second half of the year with LiquiBand® sales being lower than expected.
A reconciliation between the standard rate of taxation in the UK and the effective rate is summarised in Table 2.

Advanced Medical Solutions G
roup plc Annual Report 2012 | 12
Advanced Medical Solutions G
roup plc Annual Report 2012 | 13
Table 2Taxation %
Standard taxation rate 24.5Loss utilisation and recognition (15.1)Impact of differential between UK and overseas tax rate 0.5R&D relief (2.6)Expenses not deductible and prior year adjustments 3.0Effective taxation rate 10.3
Earnings (excluding exceptional items and amortisation of acquired intangible assets) increased by 61% to £11.0 million (2011: £6.8 million), resulting in a 24% increase in adjusted basic earnings per share to 5.40p (2011: 4.36p) and a 24% increase in fully diluted adjusted earnings per share to 5.30p (2011: 4.28p).
Profit after tax (after exceptional items and amortisation) increased by 100% to £9.7 million (2011: £4.9 million), resulting in a 53% increase in basic earnings per share to 4.75p (2011: 3.10p) and a 53% increase in fully diluted earnings per share to 4.66p (2011: 3.04p).
The Board is proposing a final dividend of 0.35p per share, to be paid on 28 May 2013 to shareholders on the register at the close of business on 3 May 2013. This follows the interim dividend of 0.17p per share that was paid on 2 November 2012 and would make a total dividend for the year of 0.52p per share (2011: 0.45p), a 16% increase on 2011.
The Group generated net cash from operating activities before exceptional items of £13.4 million (2011: £6.7 million) (see Table 5) and had net debt of £5.5 million (2011: £13.4 million) at the end of the year.
OEM This business unit’s revenues grew by 18% to £22.0 million (2011: £18.5 million), partly as a result of the £0.8 million collagen partner business acquired with RESORBA® and partly from the 22% growth of the silver alginate business.
The operating margin of this segment increased to 24% (2011: 19%) due to the contribution from both silver alginate and from collagen sales.
Branded DirectRevenues in this business unit increased by 255% to £20.1 million (2011: £5.7 million), largely due to sales into the German and Czech domestic markets of £12.3 million (2011: £NIL) resulting from the RESORBA® acquisition.
Also in this unit, ActivHeal® sales into the NHS continued to perform well, up by 29% compared to 2011, while LiquiBand® sales into the UK and Germany grew by 5% and 15% respectively, the latter resulting from the increased focus of the German sales team.
The operating margin from this segment was 30% (2011: 20%) reflecting the contribution of the higher margin suture business in Germany and the growth of the underlying ActivHeal® and LiquiBand® businesses in the UK.
Branded Distributed This business unit’s revenues grew by 89% to £6.8 million (2011: £3.6 million), with sales resulting from the RESORBA® acquisition contributing £3.9 million to this growth, including £1.6 million from our Russian subsidiary. LiquiBand® and sealants in the US grew by 10% despite one of our LiquiBand® distributors failing to meet its contractual minima for the year. Elsewhere, sales of LiquiBand® in Europe (excluding the UK and Germany) increased by 13% but small sales in early stage ROW markets such as Canada and Japan did not increase as further clinical data is needed locally to develop these new markets. This data is now being prepared.
The operating margin for this segment declined to 17% (2011: 24%) as the indirect business acquired from RESORBA® attracts a lower margin than the existing LiquiBand® business.
Bulk Materials Revenue from this business unit declined by 43% to £3.8 million (2011: £6.6 million) due to the previously flagged pipeline effect of product launches that occurred in 2011.
The operating margin of this segment declined to 8% (2011: 21%) reflecting the sensitivity of this business segment to the reduced sales and production volumes.
Segment ComparisonTable 3 below presents 2012 revenues under the previous business segments to aid comparison with the prior year.
Table 3
Previous business segments
Year ended31 December
2012£’000
Year ended31 December
2011£’000
Advanced woundcare 31,711 27,688Wound closure and sealants 20,878 6,665Consolidated 52,589 34,353
It is not possible to restate the current results, other than revenue, under the previous segments.
Geographic Breakdown of RevenuesFollowing the acquisition of RESORBA®, the geographic breakdown of Group revenues in 2012 is shown in Table 4 below:
Table 42012
£’000 % of total2011
£’000 % of total
Europe (excluding UK and Germany) 16,855 32.1 12,438 36.2
Germany 13,944 26.5 3,222 9.4UK 10,721 20.4 9,225 26.9USA 10,013 19.0 9,005 26.2Rest of World 1,056 2.0 463 1.3
Although nearly 60% of the Group’s sales are in Europe (excluding UK), only around 36% of sales are denominated in Euros. Approximately 75% of all sales to the US are denominated in US Dollars.
Financial Review
continued
Corporate Governance
Financial Statements
Advanced Medical Solutions G
roup plc Annual Report 2012 | 12
Advanced Medical Solutions G
roup plc Annual Report 2012 | 13Business Review
Company O
verview
Cash Flow
Table 5
Cash Flow
Year ended31 December
2012£’000
Year ended31 December
2011£’000
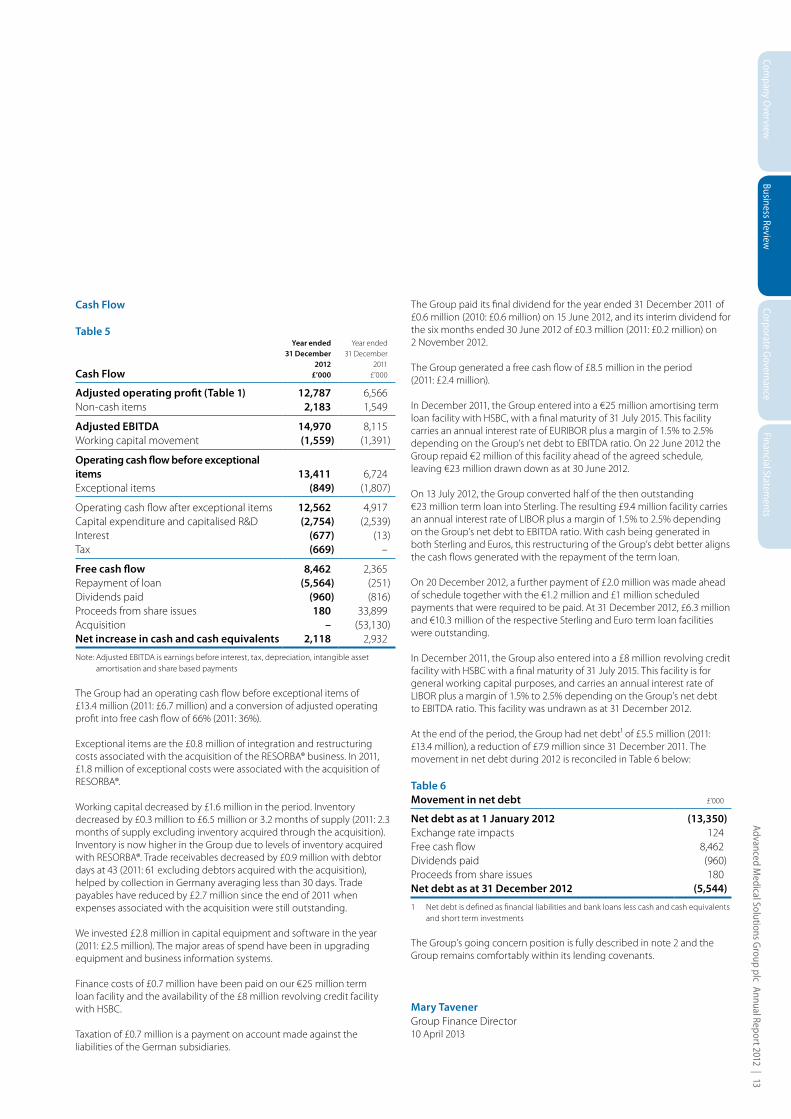
Adjusted operating profit (Table 1) 12,787 6,566Non-cash items 2,183 1,549
Adjusted EBITDA 14,970 8,115Working capital movement (1,559) (1,391)
Operating cash flow before exceptional items 13,411 6,724Exceptional items (849) (1,807)
Operating cash flow after exceptional items 12,562 4,917Capital expenditure and capitalised R&D (2,754) (2,539)Interest (677) (13)Tax (669) –
Free cash flow 8,462 2,365Repayment of loan (5,564) (251)Dividends paid (960) (816)Proceeds from share issues 180 33,899Acquisition – (53,130)Net increase in cash and cash equivalents 2,118 2,932
Note: Adjusted EBITDA is earnings before interest, tax, depreciation, intangible asset amortisation and share based payments
The Group had an operating cash flow before exceptional items of £13.4 million (2011: £6.7 million) and a conversion of adjusted operating profit into free cash flow of 66% (2011: 36%).
Exceptional items are the £0.8 million of integration and restructuring costs associated with the acquisition of the RESORBA® business. In 2011, £1.8 million of exceptional costs were associated with the acquisition of RESORBA®.
Working capital decreased by £1.6 million in the period. Inventory decreased by £0.3 million to £6.5 million or 3.2 months of supply (2011: 2.3 months of supply excluding inventory acquired through the acquisition). Inventory is now higher in the Group due to levels of inventory acquired with RESORBA®. Trade receivables decreased by £0.9 million with debtor days at 43 (2011: 61 excluding debtors acquired with the acquisition), helped by collection in Germany averaging less than 30 days. Trade payables have reduced by £2.7 million since the end of 2011 when expenses associated with the acquisition were still outstanding.
We invested £2.8 million in capital equipment and software in the year (2011: £2.5 million). The major areas of spend have been in upgrading equipment and business information systems.
Finance costs of £0.7 million have been paid on our €25 million term loan facility and the availability of the £8 million revolving credit facility with HSBC.
Taxation of £0.7 million is a payment on account made against the liabilities of the German subsidiaries.
The Group paid its final dividend for the year ended 31 December 2011 of £0.6 million (2010: £0.6 million) on 15 June 2012, and its interim dividend for the six months ended 30 June 2012 of £0.3 million (2011: £0.2 million) on 2 November 2012.
The Group generated a free cash flow of £8.5 million in the period (2011: £2.4 million).
In December 2011, the Group entered into a €25 million amortising term loan facility with HSBC, with a final maturity of 31 July 2015. This facility carries an annual interest rate of EURIBOR plus a margin of 1.5% to 2.5% depending on the Group’s net debt to EBITDA ratio. On 22 June 2012 the Group repaid €2 million of this facility ahead of the agreed schedule, leaving €23 million drawn down as at 30 June 2012.
On 13 July 2012, the Group converted half of the then outstanding €23 million term loan into Sterling. The resulting £9.4 million facility carries an annual interest rate of LIBOR plus a margin of 1.5% to 2.5% depending on the Group’s net debt to EBITDA ratio. With cash being generated in both Sterling and Euros, this restructuring of the Group’s debt better aligns the cash flows generated with the repayment of the term loan.
On 20 December 2012, a further payment of £2.0 million was made ahead of schedule together with the €1.2 million and £1 million scheduled payments that were required to be paid. At 31 December 2012, £6.3 million and €10.3 million of the respective Sterling and Euro term loan facilities were outstanding.
In December 2011, the Group also entered into a £8 million revolving credit facility with HSBC with a final maturity of 31 July 2015. This facility is for general working capital purposes, and carries an annual interest rate of LIBOR plus a margin of 1.5% to 2.5% depending on the Group’s net debt to EBITDA ratio. This facility was undrawn as at 31 December 2012.
At the end of the period, the Group had net debt¹ of £5.5 million (2011: £13.4 million), a reduction of £7.9 million since 31 December 2011. The movement in net debt during 2012 is reconciled in Table 6 below:
Table 6Movement in net debt £’000
Net debt as at 1 January 2012 (13,350)Exchange rate impacts 124Free cash flow 8,462Dividends paid (960)Proceeds from share issues 180Net debt as at 31 December 2012 (5,544)
1 Net debt is defined as financial liabilities and bank loans less cash and cash equivalents and short term investments
The Group’s going concern position is fully described in note 2 and the Group remains comfortably within its lending covenants.
Mary TavenerGroup Finance Director10 April 2013

Advanced Medical Solutions G
roup plc Annual Report 2012 | 14
Advanced Medical Solutions G
roup plc Annual Report 2012 | 15
Directors
Mary G Tavener ACMA, MCT, BA (Hons) Chem (Oxon) Group Finance Director ▲
Ms Tavener joined AMS as Finance Director in 1999. Prior to this, she was the Group Financial Controller at BTP plc during a period of considerable corporate activity and was involved in the acquisition and disposal of several businesses that repositioned BTP plc as a fine chemical company. Her experience has been gained in manufacturing and she has held financial positions with Cadburys Ltd and Parker Hannifin, a US Engineering Corporation. Prior to BTP plc, she was the Finance Director of Churchill Tableware Ltd.
Dr. Don W Evans BChemEng, MASc, PhD Non- Executive Chairman ■ ● ◆
Dr Evans was appointed Non-Executive Chairman of the Group in January 2011, having previously been Group Chief Executive Officer since January 2000. He joined AMS in 1997 as Operations Director and was appointed Managing Director of Advanced Woundcare in January 1999. After completing a degree in Chemical Engineering at the University of Queensland and a PhD in Biomedical Engineering at the University of Toronto, Dr Evans joined Johnson & Johnson UK where he worked for 19 years in Research & Development and Manufacturing. He was subsequently appointed Vice-President of European Operations for Johnson & Johnson Professional.
Chris Meredith BSc (Hons)Chief Executive Officer ◆
Mr Meredith was appointed Group Chief Executive Officer in January 2011. He joined AMS as Group Commercial Director in July 2005 following a successful 18-year career in international healthcare sales, marketing and business development. His experience prior to joining AMS covered business to business contract manufacturing, product development and clinical research, as well as branded product sales, all within the medical device, pharmaceutical or consumer healthcare markets. He was appointed Managing Director of Advanced Woundcare in February 2008 and in January 2010 he became Chief Operating Officer for the Group. Mr Meredith has previously held senior positions at Smiths Industries, Cardinal Health, Banner Pharmacaps, and Aster Cephac.
Penelope A Freer Senior IndependentNon-Executive Director ■ ● ◆
Ms Freer was appointed as Senior Independent Non-Executive Director of AMS on 1 March 2010. She is a partner of London Bridge Capital, an FSA authorised corporate advisory business and a non-executive director of Empresaria Group plc. With 25 years’ experience in investment banking she was formerly Head of Equities for Robert W Baird in London and prior to this held senior positions at Credit Lyonnais and NatWest Markets.
Stephen G Bellamy BCom & CA (NZ) Non-Executive Director ■ ● ◆
Mr Bellamy was appointed as Non-Executive Director of AMS on 20 February 2007. He is currently CEO and a founding partner of Accretion Capital LLP (provider of strategic capital and advice to European emerging technology companies) and Chairman of Becrypt Ltd (data security and protection technology) and Benefex Limited (on-line employee benefits solutions). Formerly an executive director of Sherwood International plc and Brierley Investments’ London operations, he has also held a number of other non-executive directorships and advisory roles. He is a New Zealand qualified chartered accountant.
■ Audit CommitteeS.G. Bellamy (Chairman)P.A. FreerD.W. Evans
● Remuneration CommitteeP.A. Freer (Chairman) S.G. BellamyD.W. Evans
◆ Nomination CommitteeD.W. Evans (Chairman) P.A. Freer S.G. BellamyC. Meredith
▲ Company SecretaryM.G. Tavener
Registered OfficePremier Park, 33 Road One, Winsford Industrial Estate, Winsford, Cheshire CW7 3RT
Registered Number2867684

Corporate Governance
Financial Statements
Advanced Medical Solutions G
roup plc Annual Report 2012 | 14
Advanced Medical Solutions G
roup plc Annual Report 2012 | 15Corporate G
overnanceFinancial Statem
entsBusiness Review
Company O
verview
ManagementTeam
Hans Alfter M.Sc., Dipl.-Ing.Business Unit Director, Branded Direct
Hans was appointed Director of our Branded Direct Business Unit in February 2013.
Hans has a degree in Physics and Biomedical Engineering Science from the University of Applied Sciences and Technology in Aachen, Germany and a Masters degree MSc from the University of Dundee in Scotland in 1992. Hans commenced his career with Johnson and Johnson in the health care market and was responsible for building up new business in Eastern Europe and Central Asia. This was followed by a position as Country Manager in Switzerland. Hans has also worked for Boston Scientific and Medtronic as Director Sales and Marketing and Nucletron and Covidien as General Manager for Germany, Austria, Switzerland, BENELUX, North Europe and Poland.
Jeffrey Willis BSc (Hons), EMSMOTBusiness Unit Director, Branded Distributed
Jeff joined AMS in October 2005 as Vice President Business Development, Americas, where he managed the US business.
Jeff graduated with a degree in Biomedical Engineering from the University of Florida in 1996 and completed a Masters programme in Management of Technology at Georgia Institute of Technology in 2001. He spent ten years with Kimberly-Clark Health Care in R & D Product Development, and New Business Development, and was a key member of the medical device M & A strategy team in Atlanta. In 2004, Jeff joined Abbott Laboratories in Columbus, Ohio as Manager of Licensing and Business Development supporting the medical nutritional and consumer products division.
In October 2009, Jeff assumed the role of Vice President of Group Marketing. In December 2011, Jeff also took responsibility for the Integration of RESORBA®.
Jeff was appointed Director of our Branded Distributed Business Unit in November 2012.
Richard Smith, ACABusiness Unit Director, OEM
Richard joined AMS in January 2009 having qualified as a chartered accountant in 1996.
After periods in banking and private practice, Richard joined Astra Zeneca in 2000 where he worked in a number of finance roles culminating in the position of Finance Director, M & A and Strategic Planning as part of a deal team covering commercial, manufacturing, R & D and legal.
In March 2011 Richard took over the role of VP Sales and Business Development. Richard was appointed Director of our OEM Business Unit in November 2012.
Pieter Van-Hoof, MEngBusiness Unit Director, Bulk Materials
Pieter joined Advanced Medical Solutions B.V. in November 2009 as General Manager. Having completed a Master’s degree in Engineering in Chemistry and Biochemistry at the Katholieke Universiteit Leuven (Belgium), Pieter joined Janssen Pharmaceutica working as a production supervisor in the manufacturing unit for sterile injectable products before joining the DuPont Engineering Polymers business in September 1999. At DuPont Engineering Polymers Pieter worked in a number of business process improvement roles in Supply Chain certifying as a 6 Sigma Master Black Belt before moving into Sales & Marketing. Before joining Advanced Medical Solutions B.V. Pieter held the position of European Customer Services Manager for DuPont Engineering Polymers.
Pieter was appointed Director of our Bulk Materials Business Unit in November 2012.
Richard StentonVice President of Group Operations
Richard was Managing Director of MedLogic Global Ltd now Advanced Medical Solutions (Plymouth) Limited, when it was acquired by Advanced Medical Solutions in May 2002. Richard was subsequently appointed General Manager with responsibility for R & D and Operations for the Wound Closure and Sealants business.
Richard spent 14 years in engineering and manufacturing with CR Bard Ltd, three years as a Project Director installing medical device manufacturing processes in Europe, South Africa and the Far East before joining HG Wallace – Smiths Industries Medical Systems in 1989 as Manufacturing Manager covering six medical device manufacturing sites in the UK. He joined Medlogic Global Ltd in 1997 and was responsible for setting up and managing the UK operation for their tissue adhesives business. Richard was appointed Vice President of Group Operations in July 2010.
Eddie Johnson, ACAGroup Financial Controller
Eddie joined AMS in 5 October 2011.
Having gained a first class degree in Maths and Computer Science from Keele, he qualified as a Chartered Accountant in 1996.
He has held a number of finance roles including, more recently, Western European Financial Controller for Sumitomo where he implemented J-Sox and Head of Commercial Finance at Norcros plc.
In November 2012, he was appointed Group Financial Controller.
Vicki Candler MCIPDGroup HR Manager
Vicki joined AMS in January 2007 as HR Manager having qualified as Member of the Chartered Institute of Personnel and Development in 1997. Vicki has over 20 year’s Human Resource management experience from several major multinational manufacturing companies. Prior to joining AMS she had roles with ICI Chemicals and Polymers Ltd and Compass Minerals where she worked in partnership with the senior management team to develop and deliver their strategic plans. Vicki was appointed to Group HR Manager in November 2012.

Advanced Medical Solutions G
roup plc Annual Report 2012 | 16
Advanced Medical Solutions G
roup plc Annual Report 2012 | 17
Advisors
Nominated Advisor and BrokerInvestec Bank plc2 Gresham StreetLondon EC2V 7QP
AuditorDeloitte LLPChartered Accountants & Statutory AuditorP.O. Box 5002 Hardman StreetManchester M60 2AT
SolicitorsWragge & Co55 Colmore RowBirmingham B3 2AS
Registrars and Transfer OfficeCapita RegistrarsThe Registry34 Beckenham RoadBeckenhamKent BR3 4TU
BankersHSBC99 -101 Lord StreetLiverpool L2 6PG
Patent AttorneysMarks & ClerkManchester OfficeSussex House83–85 Mosley StreetManchester M2 3LG
Foley & Lardner LLCBuilding 3Palo Alto Square3000 El Camino RealPalo Alto CA 94306
Public RelationsTavistock Communications131 Finsbury PavementLondon EC2A 1NT

Company O
verviewBusiness Review
Corporate Governance
Financial Statements
Advanced Medical Solutions G
roup plc Annual Report 2012 | 16
Advanced Medical Solutions G
roup plc Annual Report 2012 | 17
Directors’ ReportFor the year ended 31 December 2012
The directors present their report, incorporating the Chairman’s Statement, Chief Executive’s Statement and the Financial Review, and the audited financial statements for the year ended 31 December 2012.
Principal activities, trading review and future developmentsThe Group is primarily involved in the design, development, manufacture and distribution of novel high performance polymers, both natural and synthetic, for use in advanced woundcare dressings and of medical adhesives for closing and sealing tissue. The acquisition of RESORBA® in December 2011 has provided the Group with further technical capabilities in collagen and in sutures. Collagen is used both as a haemostat and as a scaffold for tissue regeneration. Sutures are used to close wounds both internally and topically. The Group distributes its products to the global medical device market by selling to healthcare companies and distributors and selling directly into the hospital and dental markets in Germany, the Czech Republic, Russia and to the NHS in the UK.
Business UnitsFollowing the acquisition of RESORBA® in December 2011, the Group has been restructured into four business units during 2012. The purpose of this is to focus resources to deliver growth opportunities across all four strategic routes to market.
The new structure provides clarity on accountability and responsibility, empower clear lines for decision making, improve prioritisation on key projects and focus operations on quality and cost-efficient manufacturing and supply. There are harmonised policies, processes and procedures across the Group and Group functions are utilised where appropriate. It is believed that the new business structure will support the growth of the Group in the most effective way. The business units are outlined in further detail on pages 2 to 5.
Principal risks and uncertaintiesAdvanced Medical Solutions Group plc is a business that depends on revenues through its sales to business partners and distributors and its direct sales to healthcare providers in the UK, Germany, the Czech Republic and Russia, together with a pipeline of new products through its research and development programme to build future revenues and a manufacturing capability to produce the products it sells.
The directors have set out below the principal risks facing the business. In addition to the risk factors discussed below, further information about the business, its strategy, products and markets and its financial risks is contained in the Business Review on pages 8 to 13.
Global economic conditionsThe Group has a widespread geographical market sector and customer base which helps to minimise the impact of any single event in one region or with one customer.
That said, the general economic climate is one where a number of governments, particularly in Europe, are looking to reduce spend on public services including spend on healthcare or, as in the US, governments are looking to raise taxes from medical device companies on the supply of medical devices, ultimately increasing costs.
In general, however, with an ageing population increasingly suffering from health problems such as obesity and diabetes, the incidence of chronic wounds which are treated with advanced woundcare dressings is increasing and the demographics are beneficial for the Group.
Revenue streams and consolidation in the sectorThe Group enters contractual relationships with its business partners wherever possible; however, there can be no guarantee that sales will be maintained or increased in future years. The healthcare sector continues to undergo consolidation. This presents both opportunities and risks. Consolidation could result in the loss of a partner to a competing business which could have an adverse effect on the results of the Group.
Reliance on key customersThe Group maintains close partnerships with a number of companies but aims not to have more than 20% of its revenues from any one partner. In 2012, no one partner contributed more than 10% of revenues. The loss of a key partner would impact the business in the short term, although as the Group increases in size, the significance of this for the Group overall, is reduced. The Group supports its partners and distributors with marketing assistance and with clinical trial programmes where possible to drive awareness of its products. There is a risk that if partners and distributors do not support the products or decide to change the focus of their priorities that opportunities are lost, resulting in revenue shortfall.
Pricing pressures and commoditisation of productsThere are also risks from pricing pressure and from competition from other products, particularly when the economic climate is difficult. The Group seeks to provide differentiated products that are patented wherever possible to reduce the effects of competition.
Risk associated with organisational structure and employee retentionThe Board reviewed the organisation of the Group in 2012 and implemented a new organisational structure with four clearly defined business units positioning the Group to deliver future growth as outlined on pages 2 to 5. It is recognised that implementation of a new organisational structure carries inherent risk. Management are working closely with staff with regular and open lines of communication to mitigate this risk.
The Group recognises that succession planning is key to the future of the business and that if this is not addressed, presents a risk to the Group. Succession plans are reviewed by the Nomination Committee with actions taken to address any gaps identified.
AcquisitionsIn making any acquisition there is some risk that the business acquired does not deliver the opportunities anticipated or that unanticipated problems arise. To mitigate this risk, detailed due diligence is undertaken to understand the business prior to it being acquired, and a detailed integration programme is implemented to deliver the opportunities anticipated.
New productsThe Group continues to invest in research and development to develop its next generation of products. By its nature, not all research leads to successful new products, although the Group believes that by monitoring progress against key milestones, it avoids excessive expenditure on projects that will not deliver a viable product. There is also the risk that the Group will not identify a new technology or opportunity before its competition and therefore miss an opportunity to gain competitive advantage. The business units will help to focus the Group to better understand market dynamics and to develop closer working relationships with key customers to reduce the risk of missed opportunities and ensure products meet customer requirements.

Advanced Medical Solutions G
roup plc Annual Report 2012 | 18
Advanced Medical Solutions G
roup plc Annual Report 2012 | 19
Raw materials and cost pressuresThe Group is exposed to the risk that margins would be eroded if price increases occur in raw materials, and the price increases could not be passed on to the business partner or customer. Wherever possible the Group tries to maintain more than one source of the supply of key materials. Where materials can only be sourced from a sole supplier or are linked to commodity prices the Group includes pricing mechanism clauses in its contracts wherever possible. If a sole supplier stopped supplying a key material at short notice, it could result in an interruption of supply of goods until a suitable solution could be found.
Product liability claimsAs a manufacturer, the Group is exposed to potential product liability claims but has in place insurance cover to mitigate this risk. The Group’s products are subject to medical device regulatory approval and certification before launch. The Group’s manufacturing facilities are in compliance with ISO 13485, the latest international quality assurance standard for medical devices and receives regular inspection by regulatory authorities.
Business information systemsAs the Group continues to grow, there is a risk that the Group outgrows its information systems. The Group has reviewed its information systems and is implementing new systems where required across the business. The Group recognises that there are risks in implementing new information systems which need to be managed but to not upgrade systems presents a greater risk in the longer term.
Financial riskThe Group is subject to various financial risks including the following:• Currency. The Group’s main currency exposures are to the US
dollar and the Euro, with 14% of the Group’s sales in US dollars and 36% of its sales in Euros. The Group’s policy is to hedge significant transaction exposure by using forward contracts and options. In 2012, if the average US dollar rate had depreciated against the actual sterling rate by 10%, there would have been a £0.7m (2011: £0.7m) impact on revenue and the gross margin and profit would have been reduced by 60bps (2011: 110bps). In 2012, if the average Euro rate had depreciated against the actual sterling rate by 10%, there would have been a £2.0m (2011: £0.7m) impact on revenue and the gross margin and profit would have been reduced by 70bps (2011: NIL).
• Credit. The Group assesses the risk of contracting with each customer and sets credit limits which are carefully monitored. If a significant risk is identified credit facilities are withdrawn and transactions are carried out on a cash basis. However, if a key partner was significantly affected by a difficult trading environment, this would have a short-term impact on the Group.
• Price. Supplier costs, discounts and rebates are monitored and checked in line with budgets and documentary evidence. Wherever possible contracts are in place with key suppliers which define prices and terms. The Group estimates that if material prices had increased by a further 5% in 2012 and the Group was unable to pass the increases on, there would have been a negative impact of £0.6m (2011: £0.4m) to the cost and the gross margin would have reduced by 100bps (2011: 110bps).
• Interest rate risk. The Group is subject to interest rate risk on its Term Loan and its Revolving Credit Facility if drawn. The Group’s policy is to review terms on a regular basis and if appropriate, convert a portion of its floating rate debt into fixed rate using interest rate swaps. Due to the debt profile of the Group and current forecasts on interest rates, all of the Group’s debt was at a floating rate of interest at the end of the financial year.
Capital StructureThe Group raises appropriate levels of debt to fund acquisitions on significant capital events, ensuring that it has adequate cash for working capital and short-term requirements.
The Group’s intention is to repay its term loan ahead of schedule in 2013, and to raise further finance as necessary.
Key Performance IndicatorsThe directors have monitored the performance of the Group with particular reference to the relevant key performance indicators: revenue growth, operating margin, earnings per share growth, customer service (OTIF) and return on capital employed. The Group monitors progress on a regular basis and will update KPIs during 2013 to reflect the new organisational structure.
Going concernAfter making enquiries and on the basis outlined in the Corporate Governance Report on pages 25 to 27, the directors have a reasonable expectation that the Group has adequate resources to continue in operational existence for the foreseeable future and for this reason they continue to adopt the going concern basis in preparing the accounts.
DividendsThe Group made a profit for the year to 31 December 2012 of £9.7 million (2011: £4.9 million). The directors are recommending payment of a final dividend of 0.35p per share. The final dividend will, subject to shareholders’ approval, be paid on 28 May 2013 to shareholders on the register at the close of business on 3 May 2013. This will make a total dividend of 0.52p for the full year (2011: 0.45p).
Research and DevelopmentThe Group has expensed to the income statement in the year ended 31 December 2012 £1,996,000 (2011: £1,255,000) on research and development. In accordance with International Accounting Standards a further £802,000 (2011: £266,000) has been capitalised. Further details on the Group’s research and development activities are included in the outline of the business units on pages 2 to 5.
Creditors’ payment policyThe Group’s policy, for all suppliers, is to fix terms of payment when agreeing the terms of each business transaction, to ensure the supplier is aware of those terms, and to abide by the agreed terms of payment provided that the supplier performs its obligations. Where terms have not been specifically agreed, it is the Group’s practice to settle invoices in line with local and industry requirements. The Group’s trade creditors at 31 December 2012 represented approximately 41 days of purchases (2011: 62 days).
Charitable and political contributionsThe Group did not make any charitable or political contributions during the year (2011: £NIL).
Share capital and issue of ordinary sharesThe authorised and issued share capital of the Company is set out in note 30 to the accounts on page 55.
Directors’ Report continuedFor the year ended 31 December 2012

Company O
verviewBusiness Review
Corporate Governance
Financial Statements
Advanced Medical Solutions G
roup plc Annual Report 2012 | 18
Advanced Medical Solutions G
roup plc Annual Report 2012 | 19
Substantial shareholdingsThe Company’s major shareholders at 8 March 2013 were:
No. of Ordinary
Shares %
BlackRock 20,173,777 9.86AXA Framlington 19,948,866 9.75Aviva Investors 10,579,562 5.17Schroder Investment Managers 10,050,000 4.91Legal & General Investment Management 8,422,025 4.12Investec Wealth & Investment 8,360,378 4.09Octopus Investments 7,591,703 3.71Directors 6,505,328 3.18
EmployeesThe Group depends on the skills and commitment of its employees in order to achieve its objectives. Staff at every level are encouraged to make the fullest possible contribution to the Group’s success. The Group is an equal opportunities employer. It is committed to giving fair and equal treatment to all employees and job applicants in terms of recruitment, pay conditions, promotions, training and all employment matters regardless of their race, sex, ethnic background or religious beliefs, sexual orientation or disabilities. An equal opportunities policy is in force which aims to ensure that all employees are selected, trained, compensated, promoted and transferred solely on the strength of their ability, skills, qualifications and merit. The Group also believes that all employees have a right to work in an environment free from discrimination and bullying.
The Group’s policy is to consult and discuss with employees, through meetings, both formal and informal, those matters likely to affect employees’ interests. The Employees’ Consultative Committee in the UK, and the Workers Council, in Germany, which comprises representatives of employees and management, meet regularly to discuss business issues and areas of concern. Management communicates with staff through regular team briefs.
The Group’s aim is to recruit and retain sufficient skilled and motivated employees to meet the needs of the business. The Group operates to the internationally recognised medical device standard ISO 13485. Staff work within a defined quality system and are trained in Lean Manufacturing Practices. Each line manager is responsible for implementing this approach. Employees are encouraged to become involved in the financial performance of the Group through participation in the Group’s share option plans and are incentivised directly through the Company’s bonus scheme, performance reviews, and training and development opportunities.
It is the Group’s policy to give full and fair consideration to all applications for employment from disabled persons having regard to their particular aptitudes and abilities and to encourage the training and career development of all personnel employed by the Group, including disabled persons. Should an employee become disabled, the Group would, where practicable, seek to continue their employment and arrange appropriate training.
Employees’ share schemesEmployees, except for participants in the Long-Term Incentive Plan (LTIP), may be eligible after a period of service to be granted options over shares in the Company under the Company Share Option Plan or Executive Share Option Scheme. The Group received HMRC approval in 2009 to adopt a Company Share Option Plan (CSOP). Under the CSOP, employees are allowed to receive up to £30,000 of options in a tax-efficient manner. Options granted under these schemes are not offered at a discount. Further details are included in the Remuneration Report on pages 22 to 24.
The Company also operates a Deferred Share Bonus Scheme (DSB) in which employees are invited to participate. The DSB encourages employee share ownership which helps to align the employees’ interests with those of the shareholders. The details on the DSB Scheme are provided in the Remuneration Report on page 23.
The Company no longer satisfies the requirements for granting tax-efficient options under its EMI scheme. Options already granted under this scheme will be allowed to vest in accordance with the rules of the scheme.
677,783 Ordinary Shares were issued during the year to employees exercising their share options. Details are given in note 33 to the Group financial statements.
Health and SafetyThe Group is committed to high standards in health, safety and environmental performance. It is the Group’s policy to abide by all laws, directives and regulations pertinent to its field of operations and to act in a manner so as to minimise the effects of its operations on the environment. The Group provides safe places and systems of work, safe plant and machinery, safe handling of materials and ensures appropriate information, instruction and training is given. Employees are encouraged to identify ‘near misses’ to ensure preventative actions are taken to avoid any unsafe work practices. Emphasis is placed on all employees having a responsibility to maintain a safe working environment. Health & Safety Committees at all sites assist with advice on safe working practices and ensure any corrective action is taken where necessary. Health and Safety reports are regularly received from Group sites and are reviewed by the Board. Regular audits are undertaken to evaluate compliance with Group policy.
EnvironmentWhere possible, the Group aims to reduce its impact on the environment. The Group facility at Winsford has been built with a high level of thermal insulation to reduce the Group’s carbon footprint. It is also one of the first in the country to utilise a solar wall: a renewable energy source that captures the sun’s warmth and supplements the building’s heating system. Lighting is controlled by movement sensors to avoid wastage and the heating system is fully programmable.

Advanced Medical Solutions G
roup plc Annual Report 2012 | 20
Advanced Medical Solutions G
roup plc Annual Report 2012 | 21
Directors and their interestsThe directors of the Company at 31 December 2012 and their interests, all of which are beneficially held, in the share capital of the Company were:
Ordinary shares of 5p each 31 December 2012
Ordinary shares of 5p each 31 December 2011
Shares DSBs LTIP Shares DSBs LTIP
D Evans 3,162,587 128,587 256,713 3,162,587 128,587 293,843M Tavener 2,088,601 135,488 530,049 2,074,151 135,488 352,534C Meredith 1,140,252 97,302 1,082,182 1,132,376 97,302 896,052S Bellamy 100,000 – – 100,000 – –P Freer 13,888 – – 13,888 – –
Further details of the directors’ remuneration and benefits are included in the Remuneration Report on pages 22 to 24.
The Board has agreed procedures for considering, and where appropriate, authorising directors’ conflicts. None of the directors had any interest during or at the end of the year in any contract in any relation to the business of the Company or its subsidiaries.
Directors’ and officers’ liability insuranceInsurance cover is in force in respect of the personal liabilities which may be incurred by directors and officers of the Company in the course of their service with the Group.
Re-appointmentAt the forthcoming Annual General Meeting, Don Evans, who was elected to Non-Executive Chairman on 1 January 2011, retires and will formally offer himself for reappointment. As Don was not independent upon appointment he is proposed for re-election annually. Don intends to step down as Chairman later this year after a successor has been found and is being reappointed to ensure continuity and a smooth transition to the new Chairman. Mary Tavener and Penny Freer will retire by rotation and, being eligible, will be proposed for re-appointment. Details of the current directors of the Company are as shown on page 14.
Directors’ responsibilities statementThe directors are responsible for preparing the Annual Report and the financial statements in accordance with applicable law and regulations.
Company law requires the directors to prepare financial statements for each financial year. Under that law the directors are required to prepare the Group financial statements in accordance with International Financial Reporting Standards (IFRSs) as adopted by the European Union and Article 4 of the IAS Regulation and have elected to prepare the parent company financial statements in accordance with United Kingdom Generally Accepted Accounting Practice (United Kingdom Accounting Standards and applicable law). Under company law the directors must not approve the accounts unless they are satisfied that they give a true and fair view of the state of affairs of the Company and of the profit or loss of the Company for that period.
In preparing the Parent Company financial statements, the directors are required to:• select suitable accounting policies and then apply them consistently; • make judgments and accounting estimates that are reasonable and prudent; and • prepare the financial statements on the going concern basis unless it is inappropriate to presume that the Company will continue in business.
In preparing the Group financial statements, International Accounting Standard 1 requires that directors:• properly select and apply accounting policies; • present information, including accounting policies, in a manner that provides relevant, reliable, comparable and understandable information; • provide additional disclosures when compliance with the specific requirements in IFRSs are insufficient to enable users to understand the
impact of particular transactions, other events and conditions on the entity’s financial position and financial performance; and • make an assessment of the Group’s ability to continue as a going concern.
The directors are responsible for keeping adequate accounting records that are sufficient to show and explain the Company’s transactions and disclose with reasonable accuracy at any time the financial position of the Company and enable them to ensure that the financial statements comply with the Companies Act 2006. They are also responsible for safeguarding the assets of the Company and hence for taking reasonable steps for the prevention and detection of fraud and other irregularities.
The directors are responsible for the maintenance and integrity of the corporate and financial information included on the Company’s website. Legislation in the United Kingdom governing the preparation and dissemination of financial statements may differ from legislation in other jurisdictions.
Directors’ Report continuedFor the year ended 31 December 2012

Company O
verviewBusiness Review
Corporate Governance
Financial Statements
Advanced Medical Solutions G
roup plc Annual Report 2012 | 20
Advanced Medical Solutions G
roup plc Annual Report 2012 | 21
Responsibility statementWe confirm that to the best of our knowledge:• the financial statements, prepared in accordance with the relevant
financial reporting framework, give a true and fair view of the assets, liabilities, financial position and profit or loss of the Company and the undertakings included in the consolidation taken as a whole; and
• the management report, which is incorporated into the Directors’ Report, includes a fair review of the development and performance of the business and the position of the Company and the undertakings included in the consolidation taken as a whole, together with a description of the principal risks and uncertainties that they face.
AuditorEach of the persons who is a director at the date of approval of this Annual Report confirms that:• so far as the director is aware, there is no relevant audit information
of which the Company’s auditor is unaware; and • the director has taken all the steps that he/she ought to have taken
as director in order to make himself/herself aware of any relevant audit information and to establish that the Company’s auditor is aware of that information.
This confirmation is given and should be interpreted in accordance with the provisions of S418 of the Companies Act 2006.
Deloitte LLP has expressed their willingness to continue in office as auditor and a resolution to reappoint them will be proposed at the forthcoming Annual General Meeting.
Special businessThe effect of Resolution 8, to be proposed at the meeting would be to disapply the statutory pre-emption rights conferred by S570 of the Companies Act 2006.
The effect of Resolution 9, to be proposed at the meeting would be to allow the Company to purchase its own shares conferred by S701 of the Companies Act 2006.
Annual General MeetingThe Annual General Meeting will be held at 11.00 am on 22 May 2013 at the offices of Investec Bank plc, 2 Gresham Street, London EC2V 7QP. Details of the notice of the Annual General Meeting are given on pages 66 to 68. The Annual General Meeting provides an opportunity for private shareholders to question your Board and to meet informally with the executive management after the meeting.
On behalf of the Board
Mary TavenerCompany Secretary 10 April 2013

Advanced Medical Solutions G
roup plc Annual Report 2012 | 22
Advanced Medical Solutions G
roup plc Annual Report 2012 | 23
The Board presents the Remuneration Report for the year ended 31 December 2012.
As an AIM quoted company, Advanced Medical Solutions Group plc is not required to comply with the Directors’ Remuneration Report Regulations 2002. The following disclosures are made voluntarily.
The members of the Remuneration Committee are all non-executive directors of the Group and have no personal financial interest arising from cross-directorship and no day-to-day involvement in running the business. The Committee met four times during the year. All meetings were attended by all members.
The Board has accepted the Remuneration Committee’s recommendations in full.
The Remuneration Committee, on behalf of the Board and in consultation with the Chief Executive, determines the Group’s policy on executive remuneration, employment conditions and the individual remuneration packages of executive directors of all Group companies and management earning in excess of £100,000 per annum and administers the Share Option Schemes. It also determines the design of performance-related pay schemes, sets the targets for such schemes and approves payment under such schemes. The Terms of Reference of the Remuneration Committee are reviewed each year and are available for review on the Company’s website ‘www.admedsol.com’.
Remuneration policyThe remuneration policy is based on the need to offer competitive packages to attract and retain senior executives of the highest calibre. Regular reviews of the policy are carried out, supported by independent advice, to ensure that the range and level of emoluments and incentive schemes continue to match current market practice. Kepler Associates were engaged in February 2012 to advise the Remuneration Committee with regard to the remuneration of the executives and senior management and the Remuneration Committee implemented changes taking into account their recommendations.
SalaryThe Remuneration Committee reviews the salaries of the executive directors of all Group companies annually and salaries are measured against performance and market medians.
Annual performance bonusEach of the directors is entitled under the terms of their service agreements to receive an annual bonus to be determined by the Remuneration Committee based on the Group’s financial and operating performance and the achievement of specific targets which are set by the Remuneration Committee. In 2012, the targets set were against Group revenue, Group profit before tax and earnings per share. Following the recommendations made by Kepler, each participant may receive up to 100% of his or her salary. 60% reward is dependent upon performance measured against targets resulting from the performance of the Group. 15% reward is achievable for meeting all personal objectives as long as the profit threshold metric is achieved. 25% reward is achieved through share matching. Half of any bonus earned over the first 20% is deferred as part of the Deferred Bonus Scheme. Senior management may earn up to 50% of their salary in bonus.
Share optionsEmployees, except for participants in the Long-Term Incentive Plan (LTIP), may be granted options over shares in the Company under the Company Share Option Plan and Executive Share Option Scheme, under which either approved or unapproved options may be granted. Options granted under these schemes are not offered at a discount.
The exercising of options under these schemes is conditional on certain performance conditions which are pre-determined by the Remuneration Committee and which accord with the Joint Statement from the Investment Committees of the Association of British Insurers and the National Association of Pension Funds. Options are exercisable normally only after the third anniversary of the date of grant (or such later time as may be determined at the time of grant) and cannot in any event be exercised later than the tenth anniversary of the date of grant. Awards will not vest if the Group is not profitable at the end of the performance period. Full details are included in note 33 on pages 57 to 60.
Company Share Option Plan (CSOP)The Company received approval for a Company Share Option Plan (CSOP) on 2 June 2010. This was adopted after HMRC approval on 13 August 2010. This Plan allows relevant employees to receive up to £30,000 of Company shares by reference to the market value of these shares on the grant date and to benefit from the growth in value of those shares.
2009 Executive Share Option SchemeOptions granted under this scheme are not offered at a discount. Up until 2010, the Company was able to offer options under an Enterprise Management Incentive (EMI) Scheme. The Company no longer satisfies the requirements for operating this scheme, however, options already granted will be allowed to vest in accordance with the scheme rules.
Long-term incentivesThe Company’s Long-Term Incentive Plan (LTIP) was introduced in 2005. Individuals who are entitled to awards under the LTIP are not eligible to receive options under the Company’s Share Option Plan or the Executive Share Option Scheme. The objectives of the LTIP are to align the interests of executives with those of shareholders by making a part of remuneration dependent on the success of management in delivering superior returns to shareholders. 50% of the Award is determined based on the performance of the Company compared with the AIM Healthcare Share Index over the vesting period and 50% of the Award is determined by the growth in the average earnings per share per year of the Company over the three year vesting period.
Of the 50% of the Award that is determined by reference to the AIM Healthcare Share Index, no shares will be awarded if the Company is ranked below the 50% level. If the Company is ranked in the upper quartile of the index i.e. at 75% or above, the full 50% of the Award shall become vested. If the Company is ranked between 50% and 75%, the provision of an Award which shall become vested shall be determined on a straight-line basis between 0% and 50%.
The other 50% of the Award will be vested if the Company achieves an average of 20% or more earnings per share (pre-exceptional items) growth per year over three years from the date of grant. The Committee has removed the annual underpin of 10% EPS growth being achieved in any one year with a discretionary underpin at the end of the performance period that requires the Committee to be satisfied that the recorded EPS performance is consistent with the underlying performance of the Company.
The proportion of the Award that shall become vested if the Company achieves an average earnings per share growth per year between 10% and 20% shall be on a straight-line basis between 0% and 50%.
Awards made have no performance re-testing facility.
Remuneration Report

Company O
verviewBusiness Review
Corporate Governance
Financial Statements
Advanced Medical Solutions G
roup plc Annual Report 2012 | 22
Advanced Medical Solutions G
roup plc Annual Report 2012 | 23
Deferred Share Bonus PlanThe Company also has a Deferred Share Bonus Plan (the ‘DSB’) which is available to all employees. The DSB allows for the payment of any bonus to be made in the form of shares. It also allows for the provision of additional matching shares if the bonus shares are held for a set period. The DSB encourages employees to acquire shares in the Company and retain those shares to receive additional free shares from the Company. It acts as a valuable retention tool and aligns the employees’ interests with those of shareholders. The first year that the DSB operated was in 2007.
PensionAll staff are entitled to become members of the Group Pension and Life Assurance Scheme, which was set up with effect from 1 February 1999. The Scheme entitles executive directors to contribute up to 10% of salary with the Group contributing 10%. All other employees contribute 3% of their salary which is matched by a 6% contribution from the Group. The Pension Plan is a money purchase scheme. In 2011, the Group made further arrangements allowing individuals to sacrifice their salary for pension contributions. The Group is preparing for the introduction of automatic enrolment.
Service agreementsThe service agreements for Chris Meredith and Mary Tavener are terminable by either party giving not less than 12 months’ notice in writing.
Private healthcareExecutive directors and other senior employees are entitled to private healthcare and permanent health insurance.
Non-executive directorsThe fees of the non-executive directors are determined by the executive directors. Non-executive directors receive travel expenses but do not participate in any incentive arrangements. The non-executive directors have entered into terms of appointment. The non-executive directors’ appointments are terminable by either party upon six months’ notice in writing without any right to compensation on early termination. Following his appointment as Non-Executive Chairman in January 2011, new terms of appointment were agreed with Don Evans. His appointment as Non-Executive Chairman was agreed for an initial term of one year. Thereafter, his appointment is terminable by either party upon six months’ notice in writing. Don Evans intends to step down as Chairman later this year after a successor has been found and will stand for re-election at the 2013 AGM to ensure continuity and a smooth transition to the new Chairman. As a result of his previous position as Chief Executive Officer, Don Evans held LTIPs with a vesting date of 23 April 2012. The Remuneration Committee recommended and the Board agreed that these LTIPs vested in the normal way, subject to the usual performance conditions. Don Evans is no longer eligible to receive LTIPs.
Don Evans also has bonuses earned in earlier years deferred as part of the Deferred Shares Bonus Scheme. The Remuneration Committee has recommended and the Board agreed that Don Evans should be allowed to leave his shares in the scheme for the normal retention time and not be required to withdraw them early from the scheme.
Directors’ emoluments
Salary and fees£’000
Annual bonus£’000
LTIPs exercised
during the year
£’000Benefits
£’000Pension
£’000
Total year
ended 2012
£’000
Total year ended
2011£’000
ExecutiveChris Meredith 200 36 – 1 14 251 254Mary Tavener 140 28 – 1 31 200 198Non-ExecutiveDon Evans 51 – – – – 51 116Steve Bellamy 35 – – – – 35 33Penny Freer 35 – – – – 35 34
461 64 – 2 45 572 635
The table above summarises the payments made to the directors for the 2012 financial year.
The annual bonus, which is discretionary, paid to the executive directors is in respect of 2011 financial year. Bonuses to the directors are not determined until the financial results have been audited and approved by the Board.
In 2012, the directors did not exercise any options or LTIPs. The executive directors were granted further LTIPs as detailed below. LTIPs awarded in 2009 partially vested in accordance with the performance conditions and a proportion lapsed.
The opening share price for 2012 was 92p and the closing price on the last trading day of the year, was 64p. The range during the year was 95p (high) and 54p (low). (Source: daily official list of the London Stock Exchange.)

Advanced Medical Solutions G
roup plc Annual Report 2012 | 24
Advanced Medical Solutions G
roup plc Annual Report 2012 | 25
0
50
100
150
200
250
300
350
2008 2009 2010 2011 2012 2013
0
50
100
150
200
250
300
350
2008 2009 2010 2011 2012 2013
Advanced Medical Solutions FTSE Techmark All Share Index
FTSE Small Cap Index
FTSE All Share Index
FTSE AIM All Share IndexFTSE All Share Healthcare Index
Shar
e pr
ice
mov
emen
t (re
base
d to
100
)Sh
are
pric
e m
ovem
ent (
reba
sed
to 1
00)
0
50
100
150
200
250
300
350
2008 2009 2010 2011 2012 2013
0
50
100
150
200
250
300
350
2008 2009 2010 2011 2012 2013
Advanced Medical Solutions FTSE Techmark All Share Index
FTSE Small Cap Index
FTSE All Share Index
FTSE AIM All Share IndexFTSE All Share Healthcare Index
Shar
e pr
ice
mov
emen
t (re
base
d to
100
)Sh
are
pric
e m
ovem
ent (
reba
sed
to 1
00)
Directors interests in the Long-Term Incentive Plan (LTIP)The maximum number of shares to be allocated to the directors under the LTIP, in each case for an aggregate consideration of £1, are as follows:
As at 31 December
2011Exercised in
the yearIssued in the year
Lapsed in the year
As at 31 December
2012
Market price at date of grant (p)
First vesting
date
Don Evans 293,843 – – 37,130 256,713 33.30 23 April 2012 (vested)
Mary Tavener 193,408 – – 24,439 168,969 33.30 23 April 2012 (vested)159,126 – – – 159,126 88.00 15 April 2014
– – 201,954 – 201,954 76.75 6 September 2015
Chris Meredith 589,234 – – 74,456 514,778 33.30 23 April 2012 (vested)306,818 – – – 306,818 88.00 15 April 2014
– – 260,586 – 260,586 76.75 6 September 2015
The entitlement to shares under the LTIP is subject to achieving the performance conditions referred to on page 22. The figures shown are maximum entitlements and the actual number of shares (if any) will depend on these performance conditions being achieved.
Awards made have no performance re-testing facility.
Five-year share performanceFor the five-year period ending 28 February 2013 the Advanced Medical Solutions Group plc share price has outperformed the FTSE All Share Index by 123%, FTSE Techmark All-Share Index by 68%, FTSE All-Share Health Care Index by 94% the FTSE Small Cap Index by 119% and FTSE AIM All-Share Index by 160%.
For the five-year period ending 28 February 2013 the Advanced Medical Solutions Group plc total shareholder return has outperformed the FTSE All Share Index by 104%, FTSE Techmark All-Share Index by 41%, FTSE All-Share Health Care Index by 61% the FTSE Small Cap Index by 104% and FTSE AIM All-Share Index by 159%.
Mary TavenerCompany Secretary 10 April 2013
Remuneration Report continued

Company O
verviewBusiness Review
Corporate Governance
Financial Statements
Advanced Medical Solutions G
roup plc Annual Report 2012 | 24
Advanced Medical Solutions G
roup plc Annual Report 2012 | 25
Corporate Governance Report
UK Corporate Governance CodeThe rules relating to AIM companies do not require the Company to report in accordance with the UK Corporate Governance Code 2010 (“the Code”). However the Board is committed to the principles of good corporate governance and the directors have applied the Code in a manner which they consider appropriate for the size of the Group. The departures considered more significant by the directors are mentioned below.
Board compositionThe Board comprises the non-executive Chairman, the Chief Executive, the Group Finance Director and two non-executive directors as detailed on page 14. The non-executive directors, both of whom are considered by the Board to be independent, bring significant experience of senior roles to their stewardship of the Group’s business. The Chairman fosters a climate of debate and challenge in the boardroom. This is built on his challenging but supportive relationship with the Chief Executive which sets the tone for Board interaction and discussions.
The Chairman, Don Evans, who was previously the Chief Executive Officer of the Group, is not considered to be an independent non-executive director.
The Board is aware that appointing the Chief Executive Officer to the role of Chairman does not comply with the independence criteria specified in A.3.1 of the Code. The remainder of the Board believes that Don Evans’s considerable experience in the sector and with the Group significantly outweighs any disadvantages that his lack of independence could potentially bring. The opinions of major shareholders and advisors were sought in advance of this decision being taken. Don Evans was not involved in the Board decision surrounding his appointment.
All directors are required to stand for re-election at the first Annual General Meeting following their appointment and, as a minimum, every three years thereafter. Don Evans intends to step down as Chairman later this year after a successor has been found and will stand for re-election at the 2013 AGM to ensure continuity and a smooth transition to the new Chairman. In addition, the Group intends to appoint a further Non-Executive Director with commercial experience to strengthen the Board. The recruitment has commenced.
Senior Independent DirectorIn 2010 Penny Freer was appointed as Senior Independent Director.
Board committeesThe Board has delegated specific authority to the Remuneration Committee, Nomination Committee and the Audit Committee.
Don Evans, Penny Freer and Steve Bellamy are members of the Remuneration, Audit and Nomination Committee’s. Chris Meredith is a member of the Nomination Committee.
Most Board Committee meetings are scheduled around Board meetings. The Terms of Reference of all three Board Committees are given on our corporate website ‘www.admedsol.com’.
Role of the BoardThe Board meets on a formal basis regularly, and met formally ten times in 2012. All of the directors attended all of the meetings. The Board’s practice is to hold several of its meetings each year at offices other than the Group Head Office. The Board retains full and effective control of the Group and has a schedule of matters specifically
reserved for its approval. The Board is responsible for formulating the Group’s corporate strategy, approval of budgets, monitoring financial performance, approval and review of major capital expenditure, corporate governance and risk management. Operational control is delegated to the executive directors and the Senior Management Team (SMT).
All directors have access to the advice and services of the Company Secretary and can take independent professional advice, if necessary, at the Group’s expense. The non-executive directors are able to contact the executive directors at any time for further information.
Board and committee evaluationThe performance evaluation of the Board, its Committees and directors is undertaken by the Chairman annually and implemented in collaboration with the Committee Chairman. The 2012 Board and Committee evaluations were conducted by way of each director and Committee member completing comprehensive questionnaires. The results are collated, discussed and acted upon by the Board and Committees. The Board reviews the outcomes of the Committee evaluations and assesses their performance. The Chairman confirms that the performance of the non-executive directors continues to be effective.
Professional advice, indemnities and insuranceThere is provision for directors to take independent professional advice relating to the discharge of their responsibilities should they feel they need it. The Company has arranged directors’ and officers’ liability insurance against certain liabilities and defence costs. However, the directors’ insurance does not provide protection in the event of a director being found to have acted fraudulently or dishonestly.
Investor relationsThe Board maintains a regular dialogue with its shareholders, mainly in the periods following the announcement of the interim and final results, but also at other times during the year. The views of shareholders are sought through direct contact and via feedback from advisors and are communicated to the Board as a whole. The Board encourages the participation of shareholders at its Annual General Meeting, notice of which is sent to shareholders at least 20 working days before the meeting. The AMS website ‘www.admedsol.com’ is regularly updated and provides additional information on the Group including information on the Group’s products and technology.
Annual General MeetingThis year’s AGM will, as last year, include a detailed presentation by the Chief Executive on the current progress of the business, including an outline of the new organisational structure, and allow the opportunity for follow up questions on this or any of the resolutions before the meeting. The Company proposes separate resolutions for each separate issue and specifically relating to the reports and accounts. The Company ensures all proxy votes are counted and indicates the level of proxies on each resolution along with the abstentions after it has been dealt with on a show of hands.
After the meeting, shareholders will have the opportunity to talk informally to the Board and Company staff and raise any further questions or issues they may have. The outcome of the AGM anda copy of the AGM presentation will be posted on the Company’s website after the meeting.

Advanced Medical Solutions G
roup plc Annual Report 2012 | 26
Advanced Medical Solutions G
roup plc Annual Report 2012 | 27
Internal control The Board is responsible for the Group’s system of internal control and for reviewing its effectiveness, taking guidance from the Audit Committee. In the context of the Group’s business any such system can only reasonably be expected to manage rather than eliminate risks arising from its operations. It can therefore only provide reasonable and not absolute assurance against material loss or misstatement.
Key features of the internal control system are as follows:• The Group has an organisational structure with clear
responsibilities and lines of accountability. The Group promotes the values of integrity and professionalism. The members of the Board are available to hear, in confidence, any individual’s concerns about improprieties.
• The Board has a schedule of matters expressly reserved for its consideration. This schedule includes potential acquisitions, major capital projects, treasury, risk management policies, approval of budgets and health & safety.
• The Board monitors the activities of the Group through the management accounts, monthly forecasts and other reports on current activities and plans. The Senior Management Team regularly monitors financial and operational performance in detail.
• The Group has set appropriate levels of authorisation which must be adhered to as the Group concludes its business.
• The Group operates a ‘whistle-blowing’ policy enabling any individual with a concern to approach the non-executive directors in confidence.
Risk ManagementManagement are responsible for the identification and evaluation of significant risks applicable to their areas of the business together with the design and operation of suitable internal controls. These risks are assessed on a continual basis and may be associated with a variety of internal or external factors including financial and operational risks.
Management report to the Board regularly on their review of risks and how they have managed the risks. The Board reviews the inherent risks, including the key risks, at Board meetings and the system of control necessary to manage such risks. The Board reviews the effectiveness of the Group’s procedure in managing risk and, therefore, believes it meets the requirements of the Guidance. The business risks and controls to mitigate the risks are formally reviewed by the Audit Committee and then by the Board at least twice a year.
Audit CommitteeThe Audit Committee comprises Steve Bellamy (Chairman), Don Evans and Penny Freer.
Steve Bellamy, a qualified Chartered Accountant, chairs the Committee. The Committee has Terms of Reference that are reviewed at least annually. The Assistant Company Secretary acts as Secretary to the Committee.
The Committee met four times during the year. All meetings were attended by all members. The Chief Executive Officer, Group Finance Director and Group Financial Controller and the external audit partner attended a number of these meetings. The Audit Committee also met with the external audit partner without the executives and senior managers present. The role of the Committee is to:• consider the appointment, fees, independence and effectiveness
of the auditor and the audit process, and discuss the scope of the audit and its findings;
• monitor the Group’s accounting policies;
• review and challenge the Group’s assessment of business risks and internal controls to mitigate these risks as well as reviewing the annual and interim statements prior to their submission for approval by the Board;
• review and challenge the Going Concern assumptions for the Group; • review the Group’s Whistle-blowing, Bribery and Gifts policies; • review the Group’s need for and implementation of an internal
audit function; and• annually assess the performance of external auditor.
It is the task of the Audit Committee to ensure that auditor objectivity and independence is safeguarded when non-audit services are provided by the auditor. To ensure auditor objectivity and independence there is a process in place to approve any non-audit work.
Internal AuditThe Audit Committee has considered that, given the size and nature of the Group’s operations, an internal audit resource is required in 2013. An internal audit plan will be agreed by the Audit Committee. All internal audit reports will be discussed with the Audit Committee and the external auditor and the recommendations considered and acted upon.
The Group also calls on the services of external bodies to review the controls in certain areas of the Group. The quality assurance systems are reviewed by the Group’s notified bodies, the British Standards Institution (BSI), TUV Product Service and Lloyd’s Quality Register Assurance on a regular basis.
Nomination CommitteeThe Nomination Committee comprises Don Evans (Chairman), Penny Freer, Steve Bellamy and Chris Meredith.
The Committee nominates and recommends the appointment of new directors to the Board, considers succession planning for directors and other senior management and membership of the Audit and Remuneration Committees. In making recommendations, the Committee takes into account the balance of skill, knowledge and experience of the Board and gives due regard to the benefits of diversity of the Board, including gender. The Committee has Terms of Reference that are reviewed at least annually. The Assistant Company Secretary acts as Secretary to the Committee.
The Committee reviewed the composition of the Board during 2012 and identified the need for a non-executive director with relevant commercial experience of the medical device sector. A profile for this position has been drawn up, agreed and a search using an external recruitment agency has commenced.
Following Don Evans’ indication that he intends to step down as Chairman of the Board later this year when a successor has been recruited, a profile for this position has been drawn up, agreed and an external recruitment agency appointed to identify suitable candidates. Don will stand for re-election at the 2013 AGM and willbe involved in the recruitment process to ensure continuity and a smooth transition.
The Committee met formally three times during the year. All meetings were attended by all members.
Corporate Governance Report continued

Company O
verviewBusiness Review
Corporate Governance
Financial Statements
Advanced Medical Solutions G
roup plc Annual Report 2012 | 26
Advanced Medical Solutions G
roup plc Annual Report 2012 | 27
Remuneration CommitteeThe Remuneration Committee comprises Penny Freer (Chairman), Don Evans and Steve Bellamy.
The Committee, in consultation with the Chief Executive, determines the Group’s policy on executive remuneration, employment conditions, and the individual remuneration packages of executive directors of all Group companies and senior management earning in excess of £100,000 per annum. It also approves all new incentive schemes, the grants of options under the Group’s Share Option Schemes, and the grant of shares under the Group’s Long-Term Incentive Plan (LTIP). The Committee has Terms of Reference that are reviewed at least annually. The Assistant Company Secretary acts as Secretary to the Committee. The Remuneration Committee met four times in 2012. All meetings were attended by all members. The report of the Committee is included on pages 22 to 24.
Going concernIn carrying out their duties in respect of going concern, the Directors have carried out a review of the Group’s financial position and cash flow forecasts for the next twelve months. These have been based on a comprehensive review of revenue, expenditure and cash flows, taking into account specific business risks and the current economic environment.
With regard to the Group’s financial position, it had cash and cash equivalents at the year-end of £8.9 million (2011: £7.1 million). The Group also has in place a term loan of €10.3 million and £6.3 million (2011: €25 million) and a revolving credit facility of £8 million which expires on 31 July 2015.
While the current economic environment is uncertain, AMS operates in a market whose demographics are favourable, underpinned by an increasing need for products to treat chronic and acute wounds. Consequently, market growth is predicted. The Group has a number of long-term contracts with customers across different geographic regions and also with substantial financial resources, ranging from government agencies through to global healthcare companies.
Having taken the above into consideration the Directors have reached the conclusion that the Group is well placed to manage its business risks in the current economic environment. Accordingly, they continue to adopt the going concern basis in preparing the financial statements.
Mary TavenerCompany Secretary 10 April 2013

Advanced Medical Solutions G
roup plc Annual Report 2012 | 28
Advanced Medical Solutions G
roup plc Annual Report 2012 | 29
Independent Auditor’s Report to the Members of Advanced Medical Solutions Group plc
We have audited the financial statements of Advanced Medical Solutions Group plc for the year ended 31 December 2012 which comprise the Consolidated Income Statement, the Consolidated Statement of Comprehensive Income, the Consolidated Statement of Financial Position, the Consolidated Statement of Changes in Equity, the Consolidated Statement of Cash Flows, the Company Balance Sheet, the related consolidated notes 1 to 35, and the related Company notes 1 to 9. The financial reporting framework that has been applied in the preparation of the Group financial statements is applicable law and International Financial Reporting Standards (IFRSs) as adopted by the European Union. The financial reporting framework that has been applied in the preparation of the parent company financial statements is applicable law and United Kingdom Accounting Standards (United Kingdom Generally Accepted Accounting Practice).
This report is made solely to the Company’s members, as a body, in accordance with Chapter 3 of Part 16 of the Companies Act 2006. Our audit work has been undertaken so that we might state to the Company’s members those matters we are required to state to them in an auditor’s report and for no other purpose. To the fullest extent permitted by law, we do not accept or assume responsibility to anyone other than the Company and the Company’s members as a body, for our audit work, for this report, or for the opinions we have formed.
Respective responsibilities of directors and auditorAs explained more fully in the Directors’ Responsibilities Statement, the directors are responsible for the preparation of the financial statements and for being satisfied that they give a true and fair view. Our responsibility is to audit and express an opinion on the financial statements in accordance with applicable law and International Standards on Auditing (UK and Ireland). Those standards require us to comply with the Auditing Practices Board’s Ethical Standards for Auditors.
Scope of the audit of the financial statementsAn audit involves obtaining evidence about the amounts and disclosures in the financial statements sufficient to give reasonable assurance that the financial statements are free from material misstatement, whether caused by fraud or error. This includes an assessment of: whether the accounting policies are appropriate to the Group’s and the parent company’s circumstances and have been consistently applied and adequately disclosed; the reasonableness of significant accounting estimates made by the directors; and the overall presentation of the financial statements. In addition, we read all the financial and non-financial information in the Annual Report to identify material inconsistencies with the audited financial statements. If we become aware of any apparent material misstatements or inconsistencies we consider the implications for our report.
Opinion on financial statementsIn our opinion:• the financial statements give a true and fair view of the state of the Group’s and of the parent company’s affairs as at 31 December 2012 and
of the Group’s profit for the year then ended; • the Group financial statements have been properly prepared in accordance with IFRSs as adopted by the European Union; • the parent company financial statements have been properly prepared in accordance with United Kingdom Generally Accepted Accounting
Practice; and • the financial statements have been prepared in accordance with the requirements of the Companies Act 2006.
Opinion on other matter prescribed by the Companies Act 2006In our opinion the information given in the Directors’ Report for the financial year for which the financial statements are prepared is consistent with the financial statements.
Matters on which we are required to report by exceptionWe have nothing to report in respect of the following matters where the Companies Act 2006 requires us to report to you if, in our opinion:• adequate accounting records have not been kept by the parent company, or returns adequate for our audit have not been received from
branches not visited by us; or • the parent company financial statements are not in agreement with the accounting records and returns; or • certain disclosures of directors’ remuneration specified by law are not made; or • we have not received all the information and explanations we require for our audit.
Timothy Edge (Senior statutory auditor) for and on behalf of Deloitte LLPChartered Accountants and Statutory AuditorManchester, United Kingdom10 April 2013

Company O
verviewBusiness Review
Corporate Governance
Financial Statements
Advanced Medical Solutions G
roup plc Annual Report 2012 | 28
Advanced Medical Solutions G
roup plc Annual Report 2012 | 29Financial Statem
entsCorporate G
overnance
Consolidated Income StatementFor the year ended 31 December 2012
Year ended 31 December 2012 Year ended 31 December 2011
Note
Beforeexceptional
items£’000
Exceptionalitems
(note 6)£’000
Total£’000
Beforeexceptional
items£’000
Exceptionalitems
(note 6)£’000
Total £’000
Revenue from continuing operations 4 52,589 – 52,589 34,353 – 34,353Cost of sales (23,946) – (23,946) (18,153) – (18,153)
Gross profit 28,643 – 28,643 16,200 – 16,200Distribution costs (543) – (543) (314) – (314)Administration costs (16,105) (849) (16,954) (9,714) (1,807) (11,521)Other income 312 – 312 226 – 226
Profit from operations 4, 5 12,307 (849) 11,458 6,398 (1,807) 4,591Finance income 11 35 – 35 75 – 75Finance costs 12 (697) – (697) (79) – (79)
Profit before taxation 11,645 (849) 10,796 6,394 (1,807) 4,587Income tax 13 (1,104) – (1,104) 263 – 263
Profit for the year attributable to equity holders of the parent 10,541 (849) 9,692 6,657 (1,807) 4,850
Earnings per share Basic 15 5.17p (0.42p) 4.75p 4.26p (1.16p) 3.10pDiluted 15 5.07p (0.41p) 4.66p 4.17p (1.13p) 3.04pAdjusted diluted 15 5.30p 4.28p
The above results relate to continuing operations.
Consolidated Statement of Comprehensive IncomeFor the year ended 31 December 2012
Year ended31 December
2012£’000
Year ended31 December
2011£’000
Profit for the year 9,692 4,850Exchange differences on translation of foreign operations (1,258) (158)(Loss)/gain arising on cash flow hedges (79) 134
Other comprehensive expense for the year (1,337) (24)
Total comprehensive income for the year attributable to equity holders of the parent 8,355 4,826

Advanced Medical Solutions G
roup plc Annual Report 2012 | 30
Advanced Medical Solutions G
roup plc Annual Report 2012 | 31
Consolidated Statement of Financial PositionAt 31 December 2012
Note2012
£’000
As restated2011
£’000
AssetsNon-current assetsAcquired intangible assets 16 10,435 11,227Software intangibles 16 1,134 816Development costs 16 1,628 951Goodwill 19 38,420 39,419Property, plant and equipment 17 17,599 17,819Deferred tax assets 18 2,651 3,524Trade and other receivables 17 21
71,884 73,777Current assetsInventories 20 6,456 6,714Trade and other receivables 21 10,179 11,098Current tax assets 172 408Cash and cash equivalents 22 8,867 7,122
25,674 25,342
Total assets 97,558 99,119
LiabilitiesCurrent liabilitiesBank overdraft 26 – Trade and other payables 23 5,605 8,300Current tax liabilities 250 264Other taxes payable 249 272Other loans 24 2,796 1,965Obligations under finance leases 24 5 21
8,931 10,822Non-current liabilitiesTrade and other payables 23 572 625Other loans 25 11,589 18,507Deferred tax liabilities 18 2,761 2,947Obligations under finance leases 25 7 6
14,929 22,085
Total liabilities 23,860 32,907
Net assets 73,698 66,212
EquityShare capital 30 10,230 10,176Share premium 31,887 31,704Share-based payments reserve 1,122 779Investment in own shares 31 (77) (40)Share-based payments deferred tax reserve 180 631Other reserve 31 1,531 1,531Hedging reserve 31 (47) 32Translation reserve 31 (1,399) (141)Retained earnings 30,271 21,540
Equity attributable to equity holders of the parent 73,698 66,212
The financial statements on pages 29 to 60 were approved by the Board of Directors and authorised for issue on 10 April 2013 and were signed on its behalf by:
Chris MeredithChief Executive Officer 10 April 2013

Company O
verviewBusiness Review
Corporate Governance
Financial Statements
Advanced Medical Solutions G
roup plc Annual Report 2012 | 30
Advanced Medical Solutions G
roup plc Annual Report 2012 | 31Financial Statem
entsCorporate G
overnance
Consolidated Statement of Changes in EquityAttributable to equity holders of the Group
Sharecapital
£’000
Sharepremium
£’000
Sharebased
payments£’000
Investmentin ownshares£’000
Sharebased
payments deferred tax
£’000
Otherreserve
£’000
Hedgingreserve
£’000
Translationreserve
£’000
Retainedearnings
£’000Total
£’000
At 1 January 2011 7,740 306 442 (37) 397 1,531 (102) 17 17,506 27,800
Consolidated profit for the year to 31 Dec 2011 – – – – – – – – 4,850 4,850
Other comprehensive income – – – – – – 134 (158) – (24)
Total comprehensive income – – – – – – 134 (158) 4,850 4,826
Share based payments – – 337 – 234 – – – – 571
Issue of share capital (net of expenses of £988,000) 2,411 31,316 – – – – – – – 33,727
Share options exercised 25 82 – – – – – – – 107
Shares purchased by EBT – – – (75) – – – – – (75)
Shares sold by EBT – – – 72 – – – – – 72Dividends paid – – – – – – – – (816) (816)
At 31 December 2011 10,176 31,704 779 (40) 631 1,531 32 (141) 21,540 66,212
Consolidated profit for the year to 31 Dec 2012 – – – – – – – – 9,692 9,692
Other comprehensive expense – – – – – – (79) (1,258) – (1,337)
Total comprehensive income – – – – – – (79) (1,258) 9,692 8,355
Share based payments – – 363 – (451) – – – – (88)
Issue of share capital – – – – – – – – – –
Share options exercised 54 183 (20) – – – – – – 217
Shares purchased by EBT – – – (81) – – – – – (81)
Shares sold by EBT – – – 44 – – – – – 44Dividends paid – – – – – – – – (961) (961)
At 31 December 2012 10,230 31,887 1,122 (77) 180 1,531 (47) (1,399) 30,271 73,698

Advanced Medical Solutions G
roup plc Annual Report 2012 | 32
Advanced Medical Solutions G
roup plc Annual Report 2012 | 33
Consolidated Statement of Cash FlowsFor the year ended 31 December 2012
Note
Year ended31 December
2012£’000
Year ended31 December
2011£’000
Cash flows from operating activitiesProfit from operations 11,458 4,591Adjustments for:Depreciation 1,633 1,115Amortisation – intellectual property rights 480 168 – development costs 125 85 – software intangibles 62 12Decrease/(increase) in inventories 258 (936)Decrease/(increase) in trade and other receivables 923 (3,029)(Decrease)/increase in trade and other payables (2,740) 2,574Share based payments expense 363 337Taxation (669) –
Net cash inflow from operating activities 11,893 4,917
Cash flows from investing activitiesPurchase of software (380) (812)Capitalised research and development (802) (266)Purchases of property, plant and equipment (1,572) (1,461)Interest received 35 75Acquisition of subsidiary 32 – (53,130)
Net cash used in investing activities (2,719) (55,594)
Cash flows from financing activitiesDividends paid (960) (816)Finance lease (20) (20)Repayment of secured loan (5,564) (251)New bank loan raised – 20,921Debt issue costs – (56)Issue of equity shares 217 33,902Shares purchased by EBT (81) (75)Shares sold by EBT 44 72Interest paid (692) (68)
Net cash (used in)/from financing activities (7,056) 53,609
Net increase in cash and cash equivalents 2,118 2,932Cash and cash equivalents at the beginning of the year 7,122 4,122Effect of foreign exchange rate changes (399) 68
Cash and cash equivalents net of short-term overdraft at the end of the year 22 8,841 7,122

Company O
verviewBusiness Review
Corporate Governance
Financial Statements
Advanced Medical Solutions G
roup plc Annual Report 2012 | 32
Advanced Medical Solutions G
roup plc Annual Report 2012 | 33Financial Statem
entsCorporate G
overnance
Notes Forming Part of the Consolidated Financial Statements
1. Reporting entityAdvanced Medical Solutions Group plc (“the Company”) is a public limited company incorporated and domiciled in England and Wales (registration number 2867684). The Company’s registered address is Premier Park, 33 Road One, Winsford Industrial Estate, Cheshire, CW7 3RT.
The Company’s ordinary shares are traded on the AIM market of the London Stock Exchange plc. The consolidated financial statements of the Company for the twelve months ended 31 December 2012 comprise the Company and its subsidiaries (together referred to as the “Group”).
The Group is primarily involved in the design, development and manufacture of novel high performance polymers (both natural and synthetic) for use in advanced woundcare dressings and materials, and medical adhesives and sutures, for closing and sealing tissue, for sale into the global medical device market.
2. Basis of preparationThe Group accounts have been prepared in accordance with International Financial Reporting Standards (IFRSs), as adopted by the EU.
The financial statements have been prepared on the historical cost basis of accounting except as disclosed in the accounting policies set out below.
The individual financial statements for each Group company are presented in the currency of the primary economic environment in which it operates (its functional currency). For the purpose of the consolidated financial statements, the results and financial position of each Group company are expressed in pounds sterling, which is the functional currency of the Company, and the presentation currency for the Consolidated Financial Statements.
In carrying out their duties in respect of going concern, the Directors have carried out a review of the Group’s financial position and cash flow forecasts for the next twelve months. These have been based on a comprehensive review of revenue, expenditure and cash flows, taking into account specific business risks and the current economic environment.
With regards to the Group’s financial position, it had cash and cash equivalents at the year-end of £8.2 million, and £14.4 million term loan repayable by 31 July 2015. The Group also has in place a revolving credit facility of £8 million, which has not been drawn down and expires on 31 July 2015.
While the current economic environment is uncertain, AMS operates in markets whose demographics are favourable, underpinned by an increasing need for products to treat chronic and acute wounds. Consequently, market growth is predicted. The Group has a number of long-term contracts with customers across different geographic regions and also with substantial financial resources, ranging from government agencies through to global healthcare companies.
After taking the above into consideration, the directors have reached a conclusion that the Group is well placed to manage its business risks in the current economic environment. Accordingly, they continue to adopt the going concern basis in preparing the accounts.
The Group has applied IAS 24 (revisions 2010), IFRIC 14 (amendments 2010) and improvements to IFRS (2010) . These have had no significant impact on this set of financial information.
3. Accounting policiesUse of estimates and judgmentsThe preparation of financial statements requires management to make judgments, estimates and assumptions that affect the application of accounting policies and the reported amounts of assets, liabilities, income and expense. Actual results may differ from these estimates. Estimates and underlying assumptions are reviewed on an ongoing basis. Revisions to accounting estimates are recognised in the period in which the estimate is revised and in any future periods affected.
Impairment of goodwillDetermining whether goodwill is impaired requires an estimation of the value in use of the cash-generating units to which the assets have been allocated. The value in use calculation requires the Group to estimate the future cash flows expected to arise from the cash-generating unit and a suitable discount rate to calculate present value.
Capitalisation of development costsIn determining the development expenses to be capitalised, estimates and assumptions are required based on expected future economic benefits generated by products that are the result of these development costs. Other important estimates and assumptions in this assessment process are the required internal rate of return, the distinction between research and development and the estimated useful life.
Share-based paymentThe charge to the income statement in relation to options and incentive plans is based on the Black-Scholes Merton or the Binominal Theorem valuation technique. This technique requires a number of assumptions to be made such as those in relation to share price volatility, movement in interest rates, dividend yields and staff behavioural patterns.

Advanced Medical Solutions G
roup plc Annual Report 2012 | 34
Advanced Medical Solutions G
roup plc Annual Report 2012 | 35
3. Accounting policies continuedInventory impairment provisionsThe Group makes provisions for inventory deemed to be obsolete or slow-moving. This provision is established on each individual stock keeping unit (SKU) based on the age of the stock, the forward order book, management’s experience and its assessment of the present value of estimated future cash flows.
Receivables impairment provisionsThe amounts presented in the balance sheet are net of allowances for doubtful receivables, estimated by the Group’s management based on prior experience and their assessment of the present value of estimated future cash flows.
Deferred taxA deferred tax asset is recognised when it is judged probable that the Group will generate taxable profits which can be offset against tax losses.
Basis of consolidationSubsidiaries are entities controlled by the Group. Control exists when the Group has the power to govern the financial and operating policies of an entity so as to retain benefits from its activities. The financial statements of the subsidiaries are included in the consolidated financial statements on the basis of acquisition accounting, from the date that control commences until the date that control ceases.
Intercompany transactions and balances between Group entities are eliminated upon consolidation.
Business combinationsThe acquisition of subsidiaries is accounted for using the purchase method. The cost of the acquisition is measured at the aggregate of the fair values, at the date of exchange, of assets given, liabilities incurred or assumed, the equity instruments issued by the Group in exchange for control of the acquiree, plus any costs directly attributable to the issue of debt or equity. Acquisition related expenses are accounted for as expenses in the period in which the costs are incurred and the services rendered, with the exception of directly attributable costs incurred as a result of raising equity, which are off-set against share premium, and raising debt, which are capitalised and amortised over the term of the debt. The acquiree’s identifiable assets, liabilities and contingent liabilities that meet the conditions for recognition under IFRS 3 Business Combinations are recognised at their fair value at the acquisition date, except for non-current assets (or disposal groups) that are classified as held for sale in accordance with IFRS 5 Non-Current Assets Held for Sale and Discontinued Operations, which are recognised and measured at fair value less costs to sell.
Goodwill arising on acquisition is recognised as an asset and initially measured at cost, being the excess of the cost of the business combination over the Group’s interest in the net fair value of the identifiable assets, liabilities and contingent liabilities recognised. If, after reassessment, the Group’s interest in the net fair value of the acquiree’s identifiable assets, liabilities and contingent liabilities exceeds the cost of the business combination, the excess is recognised immediately in profit or loss.
GoodwillGoodwill arising on consolidation represents the excess of the cost of acquisition over the Group’s interest in the fair value of the identifiable assets and liabilities of a subsidiary, associate or jointly controlled entity at the date of acquisition. Goodwill is initially recognised as an asset at cost and is subsequently measured at cost less any accumulated impairment losses. Goodwill which is recognised as an asset is reviewed for impairment at least annually. Any impairment is recognised immediately in profit or loss and is not subsequently reversed.
Revenue recognitionRevenue represents the fair value of sales of the Group’s products to external customers at amounts excluding value added tax, and is recognised when the products have been delivered and title has passed. Revenue is recognised to the extent that it is probable that the economic benefits will flow to the Group and the revenue can be reliably measured.
Revenue from royalty income receivable under licence agreements from external customers at amounts excluding value added tax is recognised as the products under licence are sold and the revenue can be reliably measured.
Other IncomeThis represents non-refundable up-front licence payments received for the grant of rights for the development and marketing of products, and other sundry income. The income is recognised in the income statement, over the life of each development project, in proportion to the stage of completion of each project.
Notes Forming Part of the Consolidated Financial Statements continued

Company O
verviewBusiness Review
Corporate Governance
Financial Statements
Advanced Medical Solutions G
roup plc Annual Report 2012 | 34
Advanced Medical Solutions G
roup plc Annual Report 2012 | 35Financial Statem
entsCorporate G
overnance
3. Accounting policies continuedFinance Income Finance income relates to interest earned on cash, cash equivalents and investments. Interest income is accrued on a time basis, by reference to the principal outstanding and at the effective interest rate applicable.
Finance Costs Finance costs relate to finance payments associated with financial liabilities. They are recognised in the income statement as they accrue using the effective interest method.
Finance costs directly attributable to the acquisition, construction or production of qualifying assets, which are assets that necessarily take a substantial period of time to get ready for their intended use, are added to the cost of those assets, until such time as the assets are substantially ready for their intended use.
Investment income earned on the temporary investment of specific borrowings pending their expenditure on qualifying assets is deducted from the borrowing costs eligible for capitalisation.
Provisions Provisions are recognised when the Group has a present obligation (legal or constructive) as a result of a past event, it is probable that an outflow of resources embodying economic benefits will be required to settle the obligation and a reliable estimate can be made of the amount of the obligation.
Foreign currencies Transactions in foreign currencies are translated at the foreign exchange rate ruling at the date of the transaction. Monetary assets and liabilities denominated in foreign currencies at the balance sheet date are translated at the foreign exchange rate ruling at that date. Foreign exchange differences arising on translation are recognised in the income statement. Non-monetary assets and liabilities that are measured in terms of historical cost in a foreign currency are translated using the exchange rate at the date of the transaction. Non-monetary assets and liabilities denominated in foreign currencies that are stated at fair value are translated at foreign exchange rates ruling at the date the fair value was determined.
The assets and liabilities of foreign operations, including goodwill and fair value adjustments arising on consolidation, are translated at foreign exchange rates ruling at the balance sheet date. The revenue and expenses of foreign operations are translated at an average rate for the year where this rate approximates to the foreign exchange rates at the dates of the transactions. Exchange differences arising on consolidation are recognised in equity.
HedgingThe Group designates certain hedging instruments, which include derivatives, embedded derivatives and non-derivatives in respect of foreign currency risk, as either fair value hedges, cash flow hedges, or hedges of net investments in foreign operations. Hedges of foreign exchange risk on firm commitments are accounted for as cash flow hedges. At the inception of the hedge relationship, the entity documents the relationship between the hedging instrument and the hedged item, along with its risk management objectives and its strategy for undertaking various hedge transactions. Furthermore, at the inception of the hedge and on an ongoing basis, the Group documents whether the hedging instrument is highly effective in offsetting changes in fair values or cash flows of the hedged item. Note 26 sets out details of the fair values of the derivative instruments used for hedging purposes. Movements in the hedging reserve in equity are described in note 31.
TaxationTaxation expense includes the amount of current income tax payable and the charge for the year in respect of deferred taxation.
The income tax payable is based on an estimation of the amount due on the taxable profit for the year. Taxable profit is different from profit before tax as reported in the income statement because it excludes items of income or expenditure which are not taxable or deductible in the year as a result of either the nature of the item or the fact that it is taxable or deductible in another period. The Group’s liability for current tax is calculated by using tax rates that have been enacted or substantively enacted by the balance sheet date.
Deferred tax is accounted for on a basis of temporary differences, except to the extent where it arises from the initial recognition of goodwill or of an asset or liability in a transaction that is not a business combination. Deferred tax assets are recognised only to the extent that it is probable that future taxable profits will be available against which temporary differences can be utilised.
Deferred tax is charged or credited to the income statement, except when it relates to items charged or credited directly to equity, in which case it is dealt with within equity. It is calculated at the tax rates that are expected to apply to the period when the asset is realised or the liability is settled based on tax laws enacted or substantively enacted by the balance sheet date.
Intangible assetsAcquired intangible assetsAcquired intangible assets that are acquired in a business combination are initially recognised at their fair value. Acquired intangible assets are purchased outright are initially recognised at cost, capitalised and amortised over their estimated useful economic lives. In determining the useful economic life each asset is reviewed separately and consideration given to the period over which the Group expects to derive economic benefit from the asset. Amortisation is included in administration costs. Acquired intangible assets with an indefinite useful economic life are not amortised but are subject to an annual impairment review as detailed on page 36.

Advanced Medical Solutions G
roup plc Annual Report 2012 | 36
Advanced Medical Solutions G
roup plc Annual Report 2012 | 37
3. Accounting policies continuedDevelopment costsExpenditure on research activities, undertaken with the prospect of gaining new scientific or technical knowledge, is recognised in the income statement as an expense in the period in which it is incurred.
Expenditure on development activities, where research findings are applied to a plan or design for the production of new or substantially improved products and processes, is capitalised once it can be demonstrated that the product or process is clearly identifiable, technically and commercially feasible, will generate future economic benefits, that the development costs of the asset can be measured reliably and the Group has sufficient resources to complete development. Expenditure capitalised is stated as the cost of materials and direct labour less accumulated amortisation. Where development expenditure results in new or substantially improved products or processes and it is probable that recovery will take place, it is capitalised and amortised on a straight-line basis over the product’s useful life starting from the date on which serial production commences, which is between one and ten years. Amortisation of capitalised development costs is included in cost of sales.
Patents and trademarksPatents and trademarks are measured initially at purchase cost and are amortised on a straight-line basis over their estimated useful lives, which is between three and twenty years. Amortisation is included in administration costs. Software intangibles Where computer software is not integral to an item of property, plant or equipment its costs are capitalised and categorised as intangible assets. Amortisation is provided on a straight-line basis over its economic useful life, which is between three and ten years. Property, plant and equipment Land and buildings and plant and equipment held for use in the production of goods and services or for administrative purposes are carried in the balance sheet at cost less any subsequent accumulated depreciation and subsequent accumulated impairment losses. The Group elected to use the fair value as the deemed cost in respect of land and buildings at the date of transition to IFRS. Fair value was calculated by reference to their existing use at the date of transition. Depreciation is provided to write off the cost, less estimated residual values, of all property, plant and equipment, over the expected useful life of the asset from the date that the asset is brought into use. It is calculated at the following rates:• Freehold property and improvements – 4% per annum on cost• Leasehold improvements – over the length of the lease• Plant and machinery – 6.7% to 33.3% per annum on cost• Fixtures and fittings – 33.3% per annum on cost• Motor vehicles – 25% per annum on cost
Property, plant and equipment in the course of construction for production are carried at cost, less any recognised impairment loss. Depreciation of these assets, on the same basis as other property, plant and equipment assets, commences when the assets are ready for their intended use.No depreciation is provided on freehold land.
Impairment of intangible assets excluding goodwillThe carrying amount of the Group’s assets other than inventories and deferred tax assets, are reviewed at each balance sheet date to determine whether there is any indication of impairment. If any such indication exists, the asset’s recoverable amount is estimated.
An impairment loss is recognised whenever the carrying amount of an asset or its cash-generating unit exceeds its recoverable amount. Impairment losses are recognised in the income statement.
Impairment losses recognised in respect of cash-generating units are allocated to reduce the carrying amount of the assets in the unit on a pro rata basis. A cash-generating unit is the smallest identifiable group of assets that generates cash inflows that are largely independent of the cash inflows from other assets or groups of assets.
Calculation of recoverable amountThe recoverable amount of the Group’s receivables carried at amortised cost is calculated as the present value of estimated future cash flows. As the Group’s receivables are of short duration they are not discounted.
Reversal of impairmentAn impairment loss in respect of a receivable carried at amortised cost is reversed if the subsequent increase in recoverable amount can be related objectively to an event occurring after the impairment loss was recognised.
In respect of other assets, an impairment loss is reversed when there is an indication that the impairment loss may no longer exist and there has been a change in the estimates used to determine the recoverable amount.
An impairment loss is reversed only to the extent that the asset’s carrying amount does not exceed the carrying amount that would have been determined, net of depreciation or amortisation, if no impairment loss had been recognised.
Notes Forming Part of the Consolidated Financial Statements continued

Company O
verviewBusiness Review
Corporate Governance
Financial Statements
Advanced Medical Solutions G
roup plc Annual Report 2012 | 36
Advanced Medical Solutions G
roup plc Annual Report 2012 | 37Financial Statem
entsCorporate G
overnance
3. Accounting policies continuedInventoryInventory is valued at the lower of cost or net realisable value. Cost comprises direct materials and, where applicable, direct labour costs that have been incurred in bringing the inventories to their present location and condition and an attributable proportion of manufacturing overheads based on normal levels of activity.
Net realisable value is based on estimated selling price less further costs to completion and disposal.
The Group makes provision for inventory deemed to be irrecoverable or where the net realisable value is lower than cost. This provision is established on a stock keeping unit (SKU) basis by reference to the age of the stock, the forward order book, management’s experience and its assessment of the present value of estimated future cash flow.
Financial InstrumentsClassification of financial instrumentsFinancial instruments are classified as financial assets, financial liabilities or equity instruments.
Financial instruments issued by the Group are treated as equity only to the extent that they meet the following two conditions:• They include no contractual obligations upon the Group to deliver cash or other financial assets that are potentially unfavourable to the
Group; and • Where the instrument will or may be settled in the Group’s own equity instruments, it is either a non-derivative that includes no obligation to
deliver a variable number of the Group’s own equity instruments or is a derivative that will be settled by the Group exchanging a fixed amount of cash or other financial assets for a fixed number of its own equity instruments.
To the extent that this definition is not met, the proceeds of issue are classified as a financial liability.
Recognition and valuation of financial assetsCash and cash equivalentsCash and cash equivalents comprise cash at bank and in hand and cash deposits and amounts under short-term guarantees, usually 90 days or less, that are held for the purpose of meeting short-term cash commitments and are subject to insignificant risk in change in value and which are readily convertible to a known amount of cash. Cash held in accounts with more than 90 days’ notice that are not required to meet short-term cash commitments are shown as an investment.
InvestmentsCash held in accounts with more than 90 days’ notice that are not required to meet short-term cash commitments are shown as an investment. The Group invests funds which are surplus to requirements in fixed rate deposits operating within parameters for credit ratings and credit limits for individual institutions that are approved and monitored by the Board.
Under IAS 39 “Financial instruments; recognition and measurement”, such investments are classified as loans and receivables and are recognised at fair value on initial recognition and subsequently measured at amortised cost using the effective interest method.
Trade and other receivablesTrade receivables are recognised and carried at the lower of their original invoiced value and recoverable amount. An impairment is made when it is likely that the balance will not be recovered in full. The recoverable amount is calculated as the present value of estimated future cash flows. Estimated future cash flows are not discounted due to the relatively short period of time between recognition of trade receivables and receipt of cash.
Recognition and valuation of financial liabilitiesFinancial liabilities are classified according to the substance of the contractual arrangements entered into.
Recognition and valuation of equity instrumentsEquity instruments are stated at par value. Any premium on issue is taken to the share premium account.
Trade payablesTrade payables are initially recognised at fair value and are subsequently recognised at amortised cost using the effective interest method.
Other loansOther loans are initially recognised at fair value and are subsequently recognised at amortised cost.
Financial liabilities at Fair Value Through Profit or Loss (‘FVTPL’)A derivative that is not designated and effective as a hedging instrument is classified as held for trading. Financial liabilities are classified as at FVTPL where the financial liabilities are held for trading.
Financial liabilities at FVTPL are stated at fair value, with any resultant gain or loss recognised in profit or loss. Fair value is determined in the manner described in note 26.

Advanced Medical Solutions G
roup plc Annual Report 2012 | 38
Advanced Medical Solutions G
roup plc Annual Report 2012 | 39
3. Accounting policies continuedDerivative financial instrumentsThe Group enters into foreign exchange forward contracts to manage its exposure to foreign exchange rate risk. Further details of derivative financial instruments are disclosed in note 26 to the financial statements.
Derivatives are initially recognised at fair value at the date a derivative contract is entered into and are subsequently remeasured to their fair value at each balance sheet date. The resulting gain or loss is recognised in profit or loss (administrative costs) immediately unless the derivative is designated and effective as a hedging instrument, in which event the timing of the recognition in profit or loss depends on the nature of the hedge relationship. The Group currently designates certain derivatives as hedges of highly probable forecast transactions or hedges of foreign currency risk of firm commitments (cash flow hedges). A derivative with a positive fair value is recognised as a financial asset whereas a derivative with a negative fair value is recognised as a financial liability.
Derivatives with remaining maturity of less than twelve months are presented as current assets or current liabilities.
Leased assetsLeases are classified as finance leases when the terms of the lease transfer substantially all the risks and rewards of ownership to the Group. All other leases are classified as operating leases.
Assets held as finance leases are recognised as assets of the Group at their fair value or, if lower, at the present value of the minimum lease payments during the lease term at the inception of the lease. Lease payments are apportioned between the reduction of the lease liability and finance charges in the income statement so as to achieve a constant rate of interest on the remaining balance of the liability. Assets held under finance leases are depreciated over the shorter of the estimated useful life of the assets and the lease term.
Assets leased under operating leases are not recorded on the balance sheet. Rental payments are charged directly to the income statement. Lease incentives, primarily up-front cash payments or rent-free periods, are capitalised and spread over the period of the lease term on a straight line basis unless another systematic basis is more representative of the time pattern of the users’ benefit. Payments made to acquire operating leases are treated as prepaid lease expenses and amortised over the life of the lease.
PensionsThe Group operates a money purchase pension scheme. The assets of the scheme are held separately from those of the Group in an independently administered fund. The amount charged against the income statement represents the contributions payable to the scheme in respect of the accounting period.
Share-based paymentsThe Group has applied the requirements of IFRS 2 ‘Share-based payments’. IFRS 2 has been applied to all options granted after 7 November 2002 that were unvested as of 1 January 2006.
The group issues equity–settled share-based payments to certain employees. Equity-settled share-based payments are measured at fair value at the date of grant. The fair value as determined at the grant date of equity–settled share-based payments is expensed on a straight-line basis over the vesting period, based on the Group’s estimate of options that will eventually vest.
Fair value is measured by use of a Black-Scholes Merton or a Binomial Theorem model. The expected life used in the model has been adjusted, based on management’s best estimate, for the effect of non-transferability, exercise restrictions and behavioural considerations.
Capital managementFor the years ended 31 December 2011 and 31 December 2012, the Group has had net debt. Capital is managed by maximising retained profits. Working capital is managed in order to generate maximum conversion of these profits into cash and cash equivalents thereby maintaining capital.
Capital includes share capital, share premium, investment in own shares, share-based payments reserve, share-based payments deferred tax reserve, other reserve, translation reserve, hedging reserves and retained earnings reserve. There are no externally imposed capital requirements on the Group.
Exceptional itemsExceptional items are those items that are unusual because of their size, nature or incidence, or that the directors consider should be disclosed separately to enable a full understanding of the Group’s results. This includes non-recurring acquisition and integration costs (see note 6). Exceptional items have been presented separately on the face of the income statement. The directors consider that this presentation gives a fairer presentation of the results of the Group.
Employee Benefit TrustsThe Group operates an Employee Benefit Trust (EBT): ‘Advanced Medical Solutions Group plc UK Employee Benefit Trust’.
The Group has de facto control of the assets, liabilities and shares held by the Trust and bears their benefits and risks. The Group records assets and liabilities of the Trust as its own.
Notes Forming Part of the Consolidated Financial Statements continued

Company O
verviewBusiness Review
Corporate Governance
Financial Statements
Advanced Medical Solutions G
roup plc Annual Report 2012 | 38
Advanced Medical Solutions G
roup plc Annual Report 2012 | 39Financial Statem
entsCorporate G
overnance
3. Accounting policies continuedNew accounting standards and IFRIC (IFRS Interpretations Committee) interpretationsThe following standards and amendments to existing standards became mandatory during the year:• Amendments to IAS 32 (effective 1 December 2011), Offsetting Financial Assets and Financial Liabilities• Amendments to IFRS 7 (effective 1 December 2011), Disclosures – Offsetting Financial Assets and Financial Liabilities
Where applicable the changes in the above standards have been reflected in the Group financial statements. The effect of these changes is not material to the Group accounts for the year ending 31 December 2012.
IFRS not yet effective and not adopted earlyThe following IFRSs have been issued but have not been adopted by the Group in these financial statements, as they are not yet effective; none of which is likely to have a material effect on the Group’s results, operations or financial position:• Amendments to IAS 1 Presentation of items of other comprehensive income; effective date 1 July 2012• Amendments to IAS 19 Employee benefits; effective date 1 July 2012• IFRS 9 Financial Instruments; effective date 1 January 2013• IFRS 10 Consolidated financial statements; effective date 1 January 2013• IFRS 11 Joint arrangements; effective date 1 January 2013• IFRS 12 Disclosure of interests in other entities; effective date 1 January 2013• IAS 27 Separate financial statements (2011); effective date 1 January 2013• IAS 28 Investments in associates and joint ventures (2011); effective date 1 January 2013• IFRS 13 Fair value measurement; effective date 1 January 2013• Improvements to IFRSs 2011; effective date 1 January 2013• Amendments to IFRS 7 and IAS 32 Offsetting financial assets and financial liabilities; effective dates 1 January 2013 and 1 January 2014• Amendments to IFRS 1 Government Loans; effective date 1 January 2013
Unless otherwise listed above, no other standard, amendment or interpretation is likely to have a material effect on the Group’s results, operations or financial position.
4. Segment informationAs referred to in the Chief Executive’s Report, the Group has been re-organised into four business units: branded direct, branded distributed, OEM (original equipment manufacturer) and bulk materials. These business units are the basis on which the Group reports its segment information. The comparative information has been restated under this new format.
Segment results, assets and liabilities include items directly attributable to a segment as well as those that can be allocated on a reasonable basis. Unallocated items comprise mainly investments, and related revenue, corporate assets, head office expenses and income tax assets. These are the measures reported to the Group’s Chief Executive for the purposes of resource allocation and assessment of segment performance.
Business segmentsThe principle activities of the business units are as follows:• Branded Direct – selling, marketing and innovation of the Group’s branded products by the Group’s sales teams• Branded Distributed – distribution, marketing and innovation of the Group’s brands sold by distributors in markets not serviced by the
Group’s sales teams• OEM – selling and innovation of products supplied to the Group’s global and national partners• Bulk Materials – selling, marketing and innovation of bulk materials to medical device partners and convertors

Advanced Medical Solutions G
roup plc Annual Report 2012 | 40
Advanced Medical Solutions G
roup plc Annual Report 2012 | 41
4. Segment information continuedSegment information about these businesses is presented below.
Year ended 31 December 2012
Brandeddirect£’000
Branded distributed
£’000OEM
£’000
Bulk materials
£’000Eliminations
£’000Consolidated
£’000
RevenueExternal sales 20,105 6,758 21,954 3,772 – 52,589Inter-segment sales – – – 468 (468) –
Total revenue 20,105 6,758 21,954 4,240 (468) 52,589
Result
Segment result 6,092 1,133 5,152 313 – 12,690Unallocated expenses (1,232)
Profit from operations 11,458Finance income 35Finance costs (697)
Profit before tax 10,796Tax (1,104)
Profit for the year 9,692
Unallocated expenses include £849,000 of exceptional costs incurred in respect of the acquisition of RESORBA®.
At 31 December 2012Other Information
Brandeddirect£’000
Branded distributed
£’000OEM
£’000
Bulkmaterials
£’000Consolidated
£’000
Capital additions:Software intangibles 106 18 247 8 380Development 134 129 539 – 802Property, plant and equipment 479 123 783 187 1,572Depreciation and amortisation 795 279 989 237 2,300
Balance sheetAssetsSegment assets 51,247 16,624 25,086 4,601 97,558Unallocated assets –
Consolidated total assets 97,558
LiabilitiesSegment liabilities 4,291 1,362 3,104 718 9,475Unallocated liabilities 14,385
Consolidated total liabilities 23,860
Year ended 31 December 2011
Brandeddirect£’000
Brandeddistributed
£’000OEM
£’000
Bulkmaterials
£’000Eliminations
’000Consolidated
£’000
RevenueExternal sales 5,660 3,570 18,529 6,595 – 34,353Inter-segment sales – – – 801 (801) –
Total revenue 5660 3,570 18,529 7,396 (801) 34,353
Result
Segment result 1,109 841 3,479 1,356 – 6,786Unallocated expenses (2,194)
Profit from operations 4,591Finance income 75Finance costs (79)
Profit before tax 4,587Tax 263
Profit for the year 4,850
Unallocated expenses include £1,807,000 of exceptional costs incurred in respect of the acquisition of RESORBA®.
Notes Forming Part of the Consolidated Financial Statements continued

Company O
verviewBusiness Review
Corporate Governance
Financial Statements
Advanced Medical Solutions G
roup plc Annual Report 2012 | 40
Advanced Medical Solutions G
roup plc Annual Report 2012 | 41Financial Statem
entsCorporate G
overnance
4. Segment information continued
At 31 December 2011Other Information
Brandeddirect£’000
Brandeddistributed
£’000OEM
£’000
Bulkmaterials
£’000Consolidated
£’000
Capital additions:Software intangibles 120 6 659 27 812Development – 21 245 – 266Property, plant and equipment 188 56 856 294 1,394Depreciation and amortisation 237 204 736 203 1,380
Balance sheetAssetsSegment assets 50,727 16,724 25,405 6,263 99,119Unallocated assets –
Consolidated total assets 99,119
LiabilitiesSegment liabilities 5,439 1,726 3,707 1,563 12,435Unallocated liabilities 20,472
Consolidated total liabilities 32,907
Geographical segmentsThe Group operates in the UK, Germany, the Netherlands, the Czech Republic and Russia, with sales personnel located in the USA. In presenting information on the basis of geographical segments, segment revenue is based on the geographical location of customers. Segment assets are based on the geographical location of the assets.
The following table provides an analysis of the group’s sales by geographical market, irrespective of the origin of the goods/services, based upon location of the Group’s customers:
Year ended31 December
2012£’000
Year ended31 December
2011£’000
United Kingdom 10,721 9,225Germany 13,944 3,222Europe excluding United Kingdom and Germany 16,855 12,438United States of America 10,013 9,005Rest of World 1,056 463
52,589 34,353
The following table provides an analysis of the Group’s total assets by geographical location.
Year ended31 December
2012£’000
Year ended31 December
2011£›000
United Kingdom 36,444 36,351Germany 55,132 56,860Europe excluding United Kingdom and Germany 5,923 5,870United States of America 59 38Rest of World – –
97,558 99,119

Advanced Medical Solutions G
roup plc Annual Report 2012 | 42
Advanced Medical Solutions G
roup plc Annual Report 2012 | 43
5. Profit from operations
Year ended31 December
2012£’000
Year ended31 December
2011£’000
Profit from operations is arrived at after charging:Depreciation of property, plant and equipment 1,633 1,115Amortisation of: – acquired intangible assets 480 168– software intangibles 62 12– development costs 125 85Operating lease rentals – plant and machinery 174 211 – land and buildings 810 840Research and development costs expensed to the income statement 1,996 1,255Cost of inventories recognised as expense 23,572 17,775Staff costs 15,971 10,211Net foreign exchange (gain)/loss (417) 13
6. Exceptional itemsDuring 2012, the Group incurred £849,000 of exceptional expenditure in respect of the integration of RESORBA® into the Advanced Medical Solutions Group which attracted tax deductions of £96,000 and resulted in an impact on net profit of £753,000. In the previous year, £1,807,000 of exceptional costs had been incurred relating to the acquisition of RESORBA®, which due to their capital nature were not deductible for income tax purposes.
7. Auditor’s remunerationAmounts payable to Deloitte LLP and their associates in respect of both audit and non-audit services:
Year ended31 December
2012£’000
Year ended31 December
2011£’000
Fees payable to the company's auditor and its associates for the audit of the company's annual accounts 15 10 Fees payable to the company's auditor and its associates for other services to the group– the audit of the company's subsidiaries 74 38
Total audit fees 89 48
Audit related assurance services 10 10 Taxation compliance services 12 12 Other services– Other assurance services – 20
Total non audit fees 22 42
Total fees 111 90
Fees payable to the Company’s auditor, Deloitte LLP and its associates, for non-audit services to the Company are not required to be disclosed in subsidiaries’ accounts because the consolidated financial statements are required to disclose such fees on a consolidated basis.
A description of the work of the Audit Committee is set out in the Corporate Governance section of the annual report which includes explanations of how audit objectivity and independence is safeguarded when non-audit services are provided by the auditor.
8. EmployeesThe average monthly number of employees of the Group during the year, including executive directors, was as follows:
Year ended31 December
2012Number
Year ended31 December
2011Number
Production 270 174Research and development 24 16Sales and marketing 100 40Administration 60 30
453 260
Notes Forming Part of the Consolidated Financial Statements continued

Company O
verviewBusiness Review
Corporate Governance
Financial Statements
Advanced Medical Solutions G
roup plc Annual Report 2012 | 42
Advanced Medical Solutions G
roup plc Annual Report 2012 | 43Financial Statem
entsCorporate G
overnance
8. Employees continuedYear ended
31 December 2012
£’000
Year ended31 December
2011£’000
Staff costs for all employees, including executive directors, consists of:Wages and salaries 13,377 8,591Social Security costs 1,764 940Pension costs 467 345Share-based payments (see note 33). 363 335
15,971 10,211
9. Directors’ emolumentsYear ended
31 December 2012
£’000
Year ended31 December
2011£’000
Remuneration for management services 503 563Pension 45 48Amounts paid to third parties 24 24Share-based payments 123 143
695 778
Executive DirectorsYear ended
31 December 2012
£’000
Year ended31 December
2011£’000
Salaries and short-term employee benefits 406 404Pension 45 48Share-based payments 113 143
564 595
Highest paid directorYear ended
31 December 2012
£’000
Year ended31 December
2011£’000
Salaries and short-term employee benefits 237 230Pension 14 24Share-based payments 72 78
323 332
Retirement benefits are accruing to the following number of directors under money purchase schemes 2 2
10. Key ManagementThe key management of the Group comprises the directors of the Group together with senior members of the management team. Their aggregate compensation is shown below:
Year ended31 December
2012£’000
Year ended31 December
2011£’000
Salaries and short-term employee benefits 1,187 1,307 Pension 104 117 Termination payments 20 – Share based payments 169 189
1,480 1,613

Advanced Medical Solutions G
roup plc Annual Report 2012 | 44
Advanced Medical Solutions G
roup plc Annual Report 2012 | 45
11. Finance IncomeYear ended
31 December 2012
£’000
Year ended31 December
2011£’000
Bank interest 20 70Rent deposit interest 15 5
35 75
12. Finance costsYear ended
31 December 2012
£’000
Year ended31 December
2011£’000
Finance leases 5 5 Other loan interest 5 6 Bank interest 687 68
Total interest expense 697 79
13. Taxation Year ended
31 December 2012
£’000
Year ended31 December
2011£’000
a) Analysis of charge for the yearCurrent tax:Tax on ordinary activities – current year 759 272Tax on ordinary activities – prior year – –
759 272
Deferred tax:Tax on ordinary activities – current year (110) (463)Tax on ordinary activities – prior year 236 (73)Effect of reduction in corporation tax rates to 24% (2011: 26%) 220 1
345 (535)
Taxation 1,104 (263)
b) Factors affecting tax charge for the yearThe tax assessed for the year is lower than the standard rate of corporation tax in the UK (24.5%) as explained below:
Profit before taxation 10,796 4,587Profit multiplied by the standard rate of corporation tax in the UK of 24.5% (2011: 26.5%) 2,645 1,216Effects of:Overseas tax rate versus UK corporate tax rate 55 (5)Expenses not deductible for tax purposes 120 614Depreciation for period greater than capital allowances – 114Utilisation and recognition of trading losses (1,771) (1,801)Research and development relief (192) (220)Share-based payments 9 (181)Adjustments in respect of prior year 236 –
Taxation 1,104 (263)
Legislation to reduce the main rate of UK corporation tax from 24% to 23% from 1 April 2013 was passed by Parliament on 17 July 2012. A further reduction to the main rate of UK corporation tax is proposed to reduce the rate to 22% from 1 April 2014 The reduction in the main rate to 23% had been substantively enacted at the balance sheet date and, therefore, the deferred tax assets are calculated in these financial statements at this rate.
In addition to the amount charged to the income statement and other comprehensive income, the Group has recognised directly in equity:• excess tax deductions related to share-based payments on exercised options together with;• changes in excess deferred tax deductions related to share-based payments, totalling £451,000 surplus: (2011: £234,000 deficit).
Notes Forming Part of the Consolidated Financial Statements continued

Company O
verviewBusiness Review
Corporate Governance
Financial Statements
Advanced Medical Solutions G
roup plc Annual Report 2012 | 44
Advanced Medical Solutions G
roup plc Annual Report 2012 | 45Financial Statem
entsCorporate G
overnance
14. DividendsAmounts recognised as distributions to equity holders in the period:
Year ended31 December
2012£’000
Year ended31 December
2011£’000
Final dividend for the year ended 31 December 2011 of 0.305p (2010: 0.38p) per ordinary share 616 590 Interim dividend for the year ended 31 December 2012 of 0.17p (2011: 0.145p) per ordinary share 344 226
960 816
Proposed final dividend for the year ended 31 December 2012 of 0.35p (2011: 0.305p) per ordinary share 716 625
716 625
The proposed final dividend is subject to approval by the shareholders and has not been included as a liability in these financial statements.
We do not anticipate there to be any tax impact as a result of this dividend.
15. Earnings per shareThe calculation of the basic and diluted earnings per share is based on the following data:
Year ended31 December
2012£’000
Year ended31 December
2011£’000
Earnings for the purposes of basic and diluted earnings per share being net profit attributable to equity holders of the parent– pre-exceptional items 10,541 6,657– post-exceptional items 9,692 4,850
Number of shares ‘000 ‘000
Weighted average number of ordinary shares for the purposes of basic earnings per share 204,059 156,398Effect of dilutive potential ordinary shares:share options, deferred share bonus, LTIPs 3,945 3,165
Weighted average number of ordinary shares for the purposes of diluted earnings per share 208,004 159,563
£’000 £’000
Profit for the year attributable to equity holders of the parent 9,692 4,850Amortisation of acquired intangible assets 480 168Exceptional items 849 1,807
Adjusted profit for the year attributable to equity holders of the parent 11,021 6,825
Earnings per share pence pence
Basic – pre exceptional items 5.17p 4.26pBasic – post exceptional items 4.75p 3.10pDiluted – pre exceptional items 5.07p 4.17pDiluted – post exceptional items 4.66p 3.04pAdjusted basic 5.40p 4.36pAdjusted diluted 5.30p 4.28p

Advanced Medical Solutions G
roup plc Annual Report 2012 | 46
Advanced Medical Solutions G
roup plc Annual Report 2012 | 47
16. Intangible assetsAcquired
intangible assets£’000
Softwareintangibles
£’000
DevelopmentCosts£’000
2012CostAt beginning of year 12,850 1,008 1,435 Additions – 380 802 Exchange differences (312) – –
At end of year 12,538 1,388 2,237
AmortisationAt beginning of year 1,623 192 484 Charged in the year 480 62 125
At end of year 2,103 254 609
Net book valueAt 31 December 2012 10,435 1,134 1,628
At 31 December 2011 11,227 816 951
Intangible assets are amortised on a straight-line basis and the amortisation is recognised within administration costs, with the exception of the RESORBA® brand name, which has a carrying value of £8,463,000, and the directors believe to have an indefinite useful economic life. In reaching this assessment the directors have considered that the RESORBA® brand has existed for over 80 years and is recognised as a market leader in the wound closure market in Germany.
Acquired intangible assets were initially recognised on the acquisition of MedLogic Global Limited representing patents and on the acquisition of RESORBA® representing brand names, know-how, customer listings and contracts.
Acquiredintangible
assets£’000
Softwareintangibles
£’000
Developmentcosts£’000
2011CostAt beginning of year 2,518 200 1,169On acquisition of subsidiary 10,332 – –Additions – 812 266Disposals – (4) –
At end of year 12,850 1008 1,435
AmortisationAt beginning of year 1,455 184 398Charged in the year 168 12 86Disposals – (4) –
At end of year 1,623 192 484
Net book valueAt 31 December 2011 11,227 816 951
At 31 December 2010 1,063 16 771
Notes Forming Part of the Consolidated Financial Statements continued

Company O
verviewBusiness Review
Corporate Governance
Financial Statements
Advanced Medical Solutions G
roup plc Annual Report 2012 | 46
Advanced Medical Solutions G
roup plc Annual Report 2012 | 47Financial Statem
entsCorporate G
overnance
17. Property, plant and equipmentFreehold land, property and
improvements£’000
Shortleasehold
improvements£’000
Plant andmachinery
£’000
Fixturesand
fittings£’000
Motorvehicles
£’000
Assetsunder
construction£’000
Total£’000
2012CostAt beginning of year 4,886 12 18,074 1,200 44 1,007 25,223 Additions 1 – 1,220 20 201 130 1,572 Transfer of assets into use – – 1,007 – – (1,007) – Disposals – – (702) – (181) – (883)Transfers – – 110 (620) 510 – –Exchange Adjustment (99) – (62) – (13) – (174)
At end of year 4,788 12 19,647 600 561 130 25,738
DepreciationAt beginning of year 28 10 7,182 140 44 – 7,404 Provided for the year 74 – 1,398 47 114 – 1,633 Disposals – – (743) – (131) – (874)Exchange Adjustment – – (24) – – – (24)
At end of year 102 10 7,813 187 27 – 8,139
Net book valueAt 31 December 2012 4,686 2 11,834 413 534 130 17,599 At 31 December 2011 4,858 2 10,892 1,060 – 1,007 17,819
At 31 December 2012, the Group had entered into contractual commitments for the acquisition of property, plant and equipment amounting to £812,000 (2011: £419,000).
The net book value of plant and equipment includes £11,000 of plant and machinery (2011: £28,000) held under finance leases. The related depreciation charge for the year was £12,000 for plant and machinery (2011: £18,000).
The net book value of plant and equipment includes £322,000 (2011: £338,000) of capitalised borrowing costs relating to the Winsford site.
Freehold land, property and
improvements£’000
Shortleasehold
improvements£’000
Plant andmachinery
£’000
Fixturesand
fittings£’000
Motorvehicles
£’000
Assetsunder
construction£’000
Total£’000
2011CostAt beginning of year 1,063 374 15,782 626 44 3,210 21,099 On acquisition of subsidiary 3,820 – 269 647 – – 4,736 Additions 3 – 182 17 – 1,192 1,394 Transfer of assets into use – – 3,394 1 – (3,395) – Disposals – (362) (1,511) (91) – – (1,964)Exchange adjustment – – (42) – – – (42)
At end of year 4,886 12 18,074 1,200 44 1,007 25,223
DepreciationAt beginning of year 24 372 7,639 192 44 – 8,271 Provided for the year 4 – 1,072 39 – – 1,115 Disposals – (362) (1,511) (91) – – (1,964)Exchange adjustment – – (18) – – – (18)
At end of year 28 10 7,182 140 44 – 7,404
Net book valueAt 31 December 2011 4,858 2 10,892 1,060 – 1,007 17,819
At 31 December 2010 1,039 2 8,143 434 – 3,210 12,828
In addition, the Group has capitalised borrowing costs of £320,000, included in current and non-current liabilities.

Advanced Medical Solutions G
roup plc Annual Report 2012 | 48
Advanced Medical Solutions G
roup plc Annual Report 2012 | 49
18. Deferred taxThe following are the major deferred tax liabilities and assets recognised by the Group and movements thereon during the current and prior reporting year.
Revaluationof building
£’000
Share-based payment
£’000
Taxlosses£’000
Advanced capital
allowances£’000
As restated Intangible
assets£’000
Total£’000
At 1 January 2011 (74) 521 2,309 – – 2,756 Charge to income – 69 465 – – 534 Charge to equity – 234 – – – 234 Acquisition of subsidiary – – – – (2,947) (2,947)
At 31 December 2011 (74) 824 2,774 – (2,947) 577 Charge to income 74 70 (256) (310) 89 (333)Charge to equity – (451) – – – (451)Exchange adjustment – – – – 97 97
At 31 December 2012 – 443 2,518 (310) (2,761) (110)
Maturity of the deferred tax asset is as follows:2012
£’0002011
£’000
Less than one year 1,484 2,250Greater than one year 1,167 1,274
2,651 3,524
Maturity of the deferred tax liability is as follows:
2012£’000
As restated 2011
£’000
Less than one year (133) (111)Greater than one year (2,628) (2,836)
(2,761) (2,947)
Certain deferred tax assets and liabilities have been offset. The following is the analysis of the deferred tax balances (after offset) for financial reporting purposes:
2012£’000
2011£’000
Deferred tax liabilities (310) (74)Deferred tax assets 2,961 3,598
2,651 3,524
At the balance sheet date, the Group has unused tax losses of £16.7 million (2011: £21.6 million) available for offset against future profits. A deferred tax asset of £2.5 million (2011: £2.8 million) has been recognised in respect of such losses. No deferred tax asset has been recognised in respect of the remaining £5.8 million (2011: £10.5 million) of such losses due to the unpredictability of future profit streams.
Notes Forming Part of the Consolidated Financial Statements continued

Company O
verviewBusiness Review
Corporate Governance
Financial Statements
Advanced Medical Solutions G
roup plc Annual Report 2012 | 48
Advanced Medical Solutions G
roup plc Annual Report 2012 | 49Financial Statem
entsCorporate G
overnance
19. Goodwill
2012£’000
As restated2011
£’000
CostAt 1 January 39,419 2,878Recognised on acquisition of a subsidiary – 36,610Exchange differences (999) (69)
At 31 December 38,420 39,419
Goodwill arose on the acquisition of Advanced Medical Solutions B.V. on 30 September 2009 and the acquisition of RESORBA® on 22 December 2011.
The goodwill and intangible assets with indefinite useful economic life have been allocated to the relevant business units in proportion to profit from operations on a consistent basis for all four segments as follows:
Brandeddirect£’000
Brandeddistributed
£’000OEM
£’000
Bulkmaterials
£’000Consolidated
£’000
Goodwill 27,986 8,847 349 1,238 38,420Intangible assets with indefinite economic life 6,364 2,098 – – 8,463
34,351 10,945 349 1,238 46,883
The Group tests goodwill annually for impairment, or more frequently if there are indications that goodwill might be impaired.
The recoverable amounts have been determined based on a value-in-use calculation on a cash generating unit basis, which uses cash flow projections based on financial budgets approved by the directors. These budgets have been adjusted to reflect the existing state of the business and, consequently, omit investment plans. Cash flows have been extrapolated to 20 years or less using a steady 2% (2011: 2%) per annum growth rate, being the medium-term expected growth which is consistent with external information. This growth rate does not exceed the long-term average growth rate for the market in which the Group operates. A discount rate adjustment of 8% per annum (2011: 8%), being the Group’s current pre-tax weighted average cost of capital, has been applied to these cash flows, being an estimation of current market risks and the time value of money. The directors believe that any reasonably possible further change in the key assumptions on which the recoverable amount is based would not cause any of the carrying amounts to exceed the relevant recoverable amount.
20. Inventories2012
£’0002011
£’000
Raw materials 2,940 3,321Work in progress 1,197 1,163Finished goods 2,319 2,230
6,456 6,714
There is no material difference between the replacement cost of stock and the amount at which it is stated in the financial statements.
Included above are finished goods of £NIL (2011: £NIL) carried at net realisable value.
2012£’000
2011£’000
Total gross inventories 6,851 6,982Inventory impairment (395) (268)
Net inventory 6,456 6,714
Inventory impairment2012
£’0002011
£’000
At beginning of year (314) (329)Income statement charge (610) (272)Provision released 41 67Provision utilised 488 266
At end of year (395) (268)

Advanced Medical Solutions G
roup plc Annual Report 2012 | 50
Advanced Medical Solutions G
roup plc Annual Report 2012 | 51
21. Trade and other receivables2012
£’0002011
£’000
Due within one yearTrade receivables 9,157 9,611Other receivables 146 679Prepayments and accrued income 876 808
10,179 11,098
2012£’000
2,011£’000
Amount receivable for the sale of goods 9,305 9,734Provision for impairment (148) (123)
9,157 9,611
The Group’s principal financial assets are cash and trade receivables. The Group’s credit risk is primarily attributable to its trade receivables.
The average credit period taken on sales of goods is 43 days (2011: 65 days). No interest is charged on the receivables within the contracted credit period. Thereafter, interest may be charged at 2% per month on the outstanding balance. In determining the recoverability of a trade receivable the Group considers any change in the credit quality of the trade receivable from the date credit was initially granted up to the reporting date. The concentration of credit risk is limited due to the Group’s large and unrelated customer base. Accordingly, the directors believe that there is no further credit provision required in excess of the allowance for impairments.
Before accepting any new customer, the Group assesses the potential customer’s credit quality and defines credit limits by customer. Limits are reviewed on an ongoing basis and reflect current payment history.
Included in the Group’s trade receivables balance are debtors which are past due at the reporting date for which the Group has not provided as there has not been a significant change in credit quality and the amounts are still considered recoverable. The Group does not hold any collateral or other credit enhancements over these balances. The carrying amount and ageing of these debtors are summarised below:
Ageing of overdue but not impaired receivables2012
£’0002011
£’000
31 to 60 days overdue 333 31861 to 90 days overdue 33 77
Total 366 395
Movement in provision for impairmentYear ended
31 December2012
£’000
Year ended 31 December
2011£’000
Balance at the beginning of the year 123 154Impairment losses recognised 41 32Amounts written off as uncollectible (1) (7)Amounts recovered during the year (15) (56)
Balance at the end of the year 148 123
Ageing of impaired trade receivables2012
£’0002011
£’000
31 to 60 days overdue – –61 to 90 days overdue – 14 Over 90 days overdue 148 109
Total 148 123
Analysis of customersIn the year ended 31 December 2012, there were no customers accounting for more than 10% of revenue (2011: one customer accounting for 10.6% of revenue).
Notes Forming Part of the Consolidated Financial Statements continued

Company O
verviewBusiness Review
Corporate Governance
Financial Statements
Advanced Medical Solutions G
roup plc Annual Report 2012 | 50
Advanced Medical Solutions G
roup plc Annual Report 2012 | 51Financial Statem
entsCorporate G
overnance
22. Investments, cash and cash equivalents2012
£’0002011
£’000
Cash and cash equivalents 8,867 7,122
Short term overdraft (26) _
Cash and cash equivalents net of short-term overdraft 8,841 7,122
Cash and cash equivalents comprise cash and short-term bank deposits with an original maturity of three months or less. The carrying amount of these assets is approximately equal to their fair value.
23. Trade and other payables2012
£’0002011
£’000
Current liabilitiesTrade payables 2,731 3,493 Other payables 706 1,309 Derivative financial instruments 47 – Accruals and deferred income 2,121 3,498
5,605 8,300
Non-current liabilitiesOther payables 572 625
Trade payables, other payables and accruals and deferred income principally comprise amounts outstanding for trade purchases and ongoing costs.
The average credit period taken for trade purchases is 41 days (2011: 62 days). No interest is charged on trade payables that are within pre-agreed credit terms. Thereafter, interest may be charged on the outstanding balances at various interest rates. The Group has financial risk management policies in place to ensure that all payables are paid within the pre-agreed credit terms.
The directors consider that the carrying amount of trade payables approximates to their fair value.
24. Current financial liabilities2012
£’0002011
£’000
Obligations under finance leases (see note 27) 5 21 Other loans 2,796 1,965
2,801 1,986
25. Non-current financial liabilities2012
£’0002011
£’000
Obligations under finance leases (see note 27) 7 6Other loans 11,589 18,507
11,596 18,513
The loan is denominated in Euros and Sterling and was taken out in December 2011. It is secured by fixed and floating charges and is repayable in instalments twice per year, with the remaining balance to be paid off in July 2015, when the facility expires. The interest rate payable is variable based on the Group's leverage. Interest on the loan that is denominated in sterling is charged at a rate over LIBOR and the interest on the loan that is denominated in Euros is charged at a rate over Euribor. The maturity by currency of finance leases and other loans is given in note 27.

Advanced Medical Solutions G
roup plc Annual Report 2012 | 52
Advanced Medical Solutions G
roup plc Annual Report 2012 | 53
Advanced Medical Solutions G
roup plc Annual Report 2012 | 52
Advanced Medical Solutions G
roup plc Annual Report 2012 | 53
26. Financial instrumentsCategories of financial instruments.All financial instruments held by the Group, as detailed in this note, are classified as ‘Loans and Receivables’ (trade and other receivables, cash and cash equivalents), ‘Held to maturity investments’ (short-term investments), ‘Financial Liabilities Measured at Amortised Cost’ (trade and other payables, financial liabilities and obligations under finance leases), ‘Derivative instruments in designated hedge accounting relationships (cash flow hedges)’ and ‘Fair value through profit and loss (FVTPL)’ (derivative financial instruments) under IAS 39 ‘Financial Instruments: Recognition and Measurement’ and finance leases under IAS 17 ‘ Leases’.
Carrying value
2012£’000
2011£’000
Financial assetsDerivative instruments in designated hedge accounting relationships (47) 32 Loans and receivables (including cash and cash equivalents) 19,110 18,209
Financial liabilitiesAmortised cost 20,574 29,424
Page 18 of the Directors’ Report provides an explanation of the financial risks faced by the Group and the objectives and policies for managing those risks. The information below deals with the financial assets and liabilities.
(a) Maturity of financial liabilitiesThe maturity profile of the Group’s financial liabilities, of which other loans and finance lease obligations are at fixed rates and denominated in sterling whilst derivative financial instruments are non-interest bearing, is as follows:
On demandor withinone year
£’000
Betweenone and
two years£’000
Betweentwo and
five years£’000
Fiveyears
or more£’000
Totalfinancialliabilities
£’000
Interestrate
%
2012Trade and other payables 5,605 52 158 362 6,177 –Other loans 2,796 3,282 8,307 – 14,385 variableFinance lease creditors 5 4 3 – 12 18.9
At 31 December 2012 8,406 3,338 8,468 362 20,574
On demandor withinone year
£’000
Betweenone and
two years£’000
Betweentwo and
five years£’000
Fiveyears
or more£’000
Totalfinancialliabilities
£’000
Interestrate
%
2011Trade and other payables 8,300 52 158 415 8,925 –Other loans 1,965 2,948 15,559 – 20,472 variableFinance lease creditors 21 2 4 – 27 14.7
At 31 December 2011 10,286 3,002 15,721 415 29,424
Notes Forming Part of the Consolidated Financial Statements continued

Company O
verviewBusiness Review
Corporate Governance
Financial Statements
Advanced Medical Solutions G
roup plc Annual Report 2012 | 52
Advanced Medical Solutions G
roup plc Annual Report 2012 | 53
Advanced Medical Solutions G
roup plc Annual Report 2012 | 52
Advanced Medical Solutions G
roup plc Annual Report 2012 | 53
26. Financial instruments continued
Fixed rate financial liabilities Weighted average period for
which rate is fixed
Financial liabilities on which no interest is paid
Weighted average period until maturity
2012Years
2011Years
2012Years
2011Years
Other loans 2 2 – –Finance lease creditors 5 4 – –
(b) Interest rate and currency of financial assetsThe currency and interest rate profile of the financial assets of the Group is as follows:
Investments and cash and cash equivalents
Total£’000
Floating£’000
Non-interestbearing
£’000
CurrencySterling 5,067 513 4,554US Dollar 1,742 20 1,722Euro 2,058 1,949 109
At 31 December 2012 8,867 2,482 6,385
Total£’000
Floating£’000
Non-interestbearing
£’000
CurrencySterling 4,289 4,289 – US Dollar 718 401 317 Euro 2,115 78 2,037
At 31 December 2011 7,122 4,768 2,354
Trade and other receivablesThe directors consider that the carrying amount of trade and other receivables approximates their fair value.
2012£’000
2011£’000
Sterling 6,077 7,368Euro 1,806 1,727US Dollar 2,297 2,003
10,180 11,098
The financial assets all mature within one year.
(c) Currency exposuresAt 31 December 2012, the Group had unhedged US Dollar currency exposures of £NIL (2011: £1,270,000) and unhedged Euro currency exposures of £NIL (2011: £3,220,000).
Risk sensitivitySee the Directors’ Report on page 18 for risk sensitivities in respect of US dollar and Euro denominated revenue and material prices.
Forward foreign exchange contractsIt is the policy of the Group to enter into forward foreign exchange contracts to cover specific foreign currency payments and receipts.

Advanced Medical Solutions G
roup plc Annual Report 2012 | 54
Advanced Medical Solutions G
roup plc Annual Report 2012 | 55
Advanced Medical Solutions G
roup plc Annual Report 2012 | 54
Advanced Medical Solutions G
roup plc Annual Report 2012 | 55
26. Financial instruments continuedThe following table details the forward foreign currency contracts outstanding as at the year-end:
Average exchange rate Foreign currency Contract value Fair value
Outstanding contracts2012
USD:£12011
USD:£12012
USD ‘0002011
USD ‘0002012
£’0002011
£’0002012
£’0002011
£’000
Cash flow hedgesSell US dollarsLess than 3 months 1.595 1.553 1,650 1,700 1,034 1,095 13 (4)3 to 6 months 1.596 – 1,350 – 846 – 10 –7 to 12 months 1.595 – 3,300 – 2,070 – 26 –
6,300 1,700 3,950 1,095 49 (4)
Average exchange rate Foreign currency Contract value Fair value
2012EUR:£1
2011EUR:£1
2012EUR ‘000
2011EUR ‘000
2012£’000
2011£’000
2012£’000
2011£’000
Sell EurosLess than 3 months 1.257 1.141 1,100 200 875 175 (22) 83 to 6 months 1.256 1.143 1,100 300 876 263 (23) 107 to 12 months 1.254 1.145 2,400 600 1,914 524 (51) 18
4,600 1,100 3,665 962 (96) 36
The fair value amounts presented above are the difference between the market value of equivalent instruments at the balance sheet date and the contract value of the instruments. No profits or losses are included in operating profit in the year (2011: £NIL) in respect of FVTPL contracts. The loss of £47,000 (2011: £32,000 profit) in respect of cash flow hedges has been taken to reserves.
27. Obligations under finance leasesMinimum lease payments Present value of lease payments
2012£’000
2011£’000
2012£’000
2011£’000
Amounts payable under finance leases:Within one year 6 22 5 21In the second to fifth years inclusive 8 8 7 6Less: future finance charges (2) (3) – –
Present value of lease obligations 12 27 12 27
Less: Amounts due for settlement within 12 months (shown under current financial liabilities) (6) (22) (5) (21)
Amounts due for settlement after 12 months 6 5 7 6
It is the Group’s policy to lease certain of its fixtures and equipment under finance leases. The average lease term is 5 years (2011: 4 years). For the year ended 31 December 2012, the average effective borrowing rate was 18.9% (2011: 14.7%). Interest rates are fixed at the contract date.
All lease obligations are denominated in sterling.
The fair value of the Group’s lease obligations approximates their carrying amount.
28. Fair value of financial assets and liabilitiesThe directors consider that the fair value of the Group’s financial instruments do not differ significantly from their book values.
Notes Forming Part of the Consolidated Financial Statements continued

Company O
verviewBusiness Review
Corporate Governance
Financial Statements
Advanced Medical Solutions G
roup plc Annual Report 2012 | 54
Advanced Medical Solutions G
roup plc Annual Report 2012 | 55
Advanced Medical Solutions G
roup plc Annual Report 2012 | 54
Advanced Medical Solutions G
roup plc Annual Report 2012 | 55
29. Foreign exchange ratesAverage rate Closing rate Percentage change
2012 2011 2012 2011Average
%Closing
%
CurrencyUS Dollar 1.5886 1.6057 1.6168 1.5461 (1) 5Euro 1.2302 1.1518 1.2263 1.195 7 3
30. Share capital
Number of ordinary shares of 5p eachAuthorised
‘000
Allotted,called up
and fully paid‘000
At 1 January 2011 206,447 154,805
New issues in the year – 48,214Share options exercised – 497
At 31 December 2011 206,447 203,516
New issues in the year – –Share options exercised – 1,102
At 31 December 2012 206,447 204,618
During the year, employees exercised share options for 978,124 shares (2011: 389,924) at a range of option prices from 9p to 83p.
During the year, 123,848 (2011: 112,576) shares were issued under the Deferred Share Bonus Scheme at the nominal value of 5p per share. At the balance sheet date, 478,000 (2011: 517,000) shares are retained by the Trust to meet the matching requirements of the scheme.
In December 2011, the company issued 48,214,000 shares in relation to the acquisition of RESORBA®, being 47,236,000 of placing shares and 978,000 of subscription shares.
Ordinary shares of 5p eachAuthorised
£’000
Allotted,called up
and fully paid£’000
At 1 January 2011 10,332 7,740
At 31 December 2011 10,332 10,176New issues in the year – –Share options exercised – 54
At 31 December 2012 10,332 10,230
31. ReservesInvestment in own sharesThis is the nominal value of the shares held in trust on behalf of employees in respect of the DSB scheme.
Other reserveThis represents Advanced Medical Solutions Limited’s share premium account arising from merger accounting.
Hedging reserveThe hedging reserve represents the cumulative amount of gains and losses on hedging instruments deemed effective in cash flow hedges. The cumulative deferred gain or loss on the hedging instrument is recognised in profit or loss only when the hedged transaction impacts the profit or loss, or is included as a basis adjustment to the non-financial hedged item, consistent with the applicable accounting policy.
Translation reserveExchange differences relating to the translation of the net assets of the Group’s foreign operations, which relate to subsidiaries only, from their functional currency into the parents functional currency, being Sterling, are recognised directly in the translation reserve. Gains and losses on hedging instruments that are designated as hedges of net investments in foreign operations are included in the translation reserve.
£1,258,000 has been recorded in the translation reserve during the period, which would otherwise have been recognised in administration costs (2011: £158,000), if hedge accounting had not been adopted.

Advanced Medical Solutions G
roup plc Annual Report 2012 | 56
Advanced Medical Solutions G
roup plc Annual Report 2012 | 57
Advanced Medical Solutions G
roup plc Annual Report 2012 | 56
Advanced Medical Solutions G
roup plc Annual Report 2012 | 57
32. Acquisition of subsidiaryOn 22 December 2011 the Group acquired the entire issued share capital of RESORBA®, a manufacturer of sutures and collagen products with direct sales capabilities in Germany, the Czech Republic and Russia. The primary reason for the acquisition is to provide the Group with further commercial opportunities and more direct control of our sales channels.
Bookvalue
31 December 2011
£’000
As reportedFair value
31 December 2011
£’000
Restatement31 December
2011£’000
RestatedFair value
31 December 2011
£’000
Identifiable net assets acquiredIntellectual property 5,544 11,763 (1,431) 10,332Property, plant and equipment 3,870 3,870 865 4,735Inventories 3,280 3,280 – 3,280Trade and other receivables 2,064 2,064 – 2,064Cash and cash equivalents 1,263 1,263 – 1,263Trade and other payables (1,412) (1,412) – (1,412)Deferred tax liabilities (1,571) (3,354) 406 (2,948)
13,038 17,474 (160) 17,314Goodwill 16,212 36,450 160 36,610
Total consideration 53,924 – 53,924
As required by IFRS3 – ‘Business Combinations’, any adjustments in the hindsight period to the provisional fair value of the assets and liabilities acquired with a business should be adjusted as if the amendments had occurred on the acquisition date. As a consequence, following the completion of the fair value exercise in relation to the acquisition of RESORBA® in 2011, the Group Balance Sheet as at 31 December 2011 has been restated to reflect the adjustments made. The impact of these adjustments is shown above.
Goodwill is denominated in Euros in line with RESORBA®’s functional currency. The goodwill has been translated at the closing Euro rate on each balance sheet date.
Satisfied by: £’000
Cash: Paid on 20 December 2011 52,869
Post closing adjustment: cash to be paid from Escrow in 2012 368Equity instruments (954,000 ordinary shares in AMS Group plc) 687
53,924
Net cash flow arising on acquisition £’000
Cash consideration 53,924Post closing adjustment: cash received from Escrow in 2012 469Cash acquired (1,263)
53,130
The goodwill arising on the acquisition of RESORBA® is attributable to the assembled workforce and the implied workforce.
None of the goodwill is expected to be deductible for income tax.
The fair value of financial assets includes receivables (predominately trade receivables) with a fair value of £2.1m and a gross contractual value of £2.1m. The best estimate at acquisition date of the contractual cash flows not to be collected are £NIL.
Total costs for the transaction amounted to £3,244,000, of which, £1,807,000 was included in administration costs (exceptional items), £449,000 was capitalised as the cost of debt, and £988,000 was off-set against share premium as the cost of raising equity.
RESORBA® contributed £NIL to revenue and £NIL to profit before tax for the period between the date of acquisition and 31 December 2011.
If the acquisition of RESORBA® had been completed on the first day of the financial year ended 31 December 2011, Group revenues for the period would have been £52,537,000 and the Group profit attributable to equity holders of the parent would have been £6,222,000.
Notes Forming Part of the Consolidated Financial Statements continued

Company O
verviewBusiness Review
Corporate Governance
Financial Statements
Advanced Medical Solutions G
roup plc Annual Report 2012 | 56
Advanced Medical Solutions G
roup plc Annual Report 2012 | 57
Advanced Medical Solutions G
roup plc Annual Report 2012 | 56
Advanced Medical Solutions G
roup plc Annual Report 2012 | 57
33. Share-based paymentsThe charge for share-based payments under IFRS 2 arises across the following schemes:
2012£’000
2011£’000
Unapproved Executive Share Option Scheme, Enterprise Management Incentive Scheme and Company Share Option Plan 59 64Long-Term Incentive Plan 143 141Deferred Share Bonus Scheme 161 132
363 337
Unapproved Executive Share Option Scheme and Enterprise Management Incentive Scheme(EMI) and Company Share Option Plan (CSOP)The fair value of the executive options is calculated based on a Black-Scholes Merton model assuming the inputs below:
Grant Date 15/7/2004 16/7/2004 21/3/2005 12/9/2005 15/3/2006 6/4/2006 21/9/2006
Share price at grant date 9p 9p 10.2p 9.25p 10.75p 10.75p 11.25pExercise price 9p 9p 10.2p 9.25p 10.75p 10.75p 11.25pExpected life 3.5 yrs 3.5 yrs 3.5 yrs 3.5 yrs 3.5 yrs 3.5 yrs 3.5 yrsContractual life 10 yrs 10 yrs 10 yrs 10 yrs 10 yrs 10 yrs 10 yrsRisk free rate 4.50% 4.50% 4.50% 4.50% 4.50% 4.50% 4.50%Expected volatility 30% 30% 30% 30% 30% 30% 30%Expected dividend yield 0% 0% 0% 0% 0% 0% 0%Fair value of options 2p 1p 1p 1p 2p 1p 1p
Grant Date 12/4/2007 26/9/2007 16/4/2008 15/10/2008 20/4/2009 5/10/2009
Share price at grant date 16.75p 26.75p 32.25p 31.75p 33.75p 28.75pExercise price 16.75p 26.75p 32.25p 31.75p 33.75p 28.75pExpected life 3.5 yrs 3.5 yrs 3.5 yrs 3.5 yrs 3 yrs 3 yrsContractual life 10 yrs 10 yrs 10 yrs 10 yrs 10 yrs 10 yrsRisk free rate 5.00% 5.00% 5.00% 5.00% 2.40% 2.40%Expected volatility 27% 27% 38% 38% 34% 34%Expected dividend yield 0% 0% 0% 0% 0% 0%Fair value of options 2p 4p 8p 8p 6p 5p
Grant Date 16/4/2010 20/10/2010 15/04/2011 08/09/2011 10/05/2012 20/06/2012 06/09/2012
Share price at grant date 42.0p 64.0p 88.0p 86.25p 69.08p 67.5p 76.75pExercise price 42.0p 64.0p 88.0p 86.25p 69.08p 67.5p 76.75pExpected life 3 .5yrs 3 yrs 3 yrs 3 yrs 3 yrs 3 yrs 3 yrsContractual life 10 yrs 10 yrs 10 yrs 10 yrs 10 yrs 10 yrs 10 yrsRisk free rate 2.40% 2.40% 1.92% 1.92% 0.39% 0.39% 0.17%Expected volatility 34% 34% 18% 18% 34% 34% 34%Expected dividend yield 0% 0% 0.7% 0.7% 0.7% 0.7% 0.7%Fair value of options 9p 8p 9p 9p 13p 12p 17p
Under the terms of the Company’s Share Option Schemes, approved by Shareholders in 1999 and amended in 2001 and 2002, the Board may offer options to purchase ordinary shares in the Company to all employees of the Company at the market price on a date to be determined prior to the date of the offer. Since 2005, individuals who are entitled to awards under the LTIP are no longer eligible to receive options under the Company’s Share Option Schemes.
Performance targets are assessed over a three-year period from the date of grant. Once options have vested they can be exercised during the period up to ten years from the date of grant.
The expected volatility was determined by calculating the historic volatility of the Group’s share price over the previous three years.

Advanced Medical Solutions G
roup plc Annual Report 2012 | 58
Advanced Medical Solutions G
roup plc Annual Report 2012 | 59
Advanced Medical Solutions G
roup plc Annual Report 2012 | 58
Advanced Medical Solutions G
roup plc Annual Report 2012 | 59
33. Share-based payments continuedOptions have been granted over the following number of ordinary shares which were outstanding at 31 December 2012
Date of grantOption
price (p)
Weightedaverageprice at
exercise (p)
No of optionsas at
1 January2012
Remaininglife
1 January2012 Issued Lapsed Exercised
No of optionsas at
31 December2012
Remaininglife
31 December2012
Unapproved Executive Share Option Scheme20.04.09 33.75 – 70,000 7.3 – – (70,000) – 6.316.04.10 42.00 – 388,000 8.3 – – – 388,000 7.320.10.10 64.00 – 306,250 8.8 – (153,125) – 153,125 7.820.06.12 67.50 – – – 584,226 – – 584,226 9.506.09.12 76.75 – – – 30,000 – – 30,000 9.7
Enterprise Management Incentive Scheme15.07.04 9.00 78.88 10,808 2.5 – – (8,308) 2,500 1.516.07.04 9.00 – 4,824 2.5 – – – 4,824 1.515.03.06 10.75 – 1,000 4.2 – – – 1,000 3.221.09.06 11.25 – 12,000 4.7 – – (1,000) 11,000 3.712.04.07 16.75 82.76 195,147 5.3 – – (65,808) 129,339 4.326.09.07 26.75 83.00 4,000 5.7 – – – 4,000 4.716.04.08 32.25 83.00 57,500 6.3 – – (2,500) 55,000 5.320.04.09 33.75 – 396,500 7.3 – – (307,500) 89,000 6.305.10.09 28.75 80.55 227,500 7.8 – (2,500) (150,000) 75,000 6.816.04.10 42.00 80.38 870,930 8.3 – (97,145) (72,667) 701,118 7.3
Company Share Option Plan20.10.10 64.00 – 118,750 8.8 – (46,875) – 71,875 7.815.04.11 88.00 – 30,000 9.3 – – – 30,000 8.308.09.11 86.25 – 54,000 9.7 – – – 54,000 8.710.05.12 69.08 – – – 139,000 (20,000) – 119,000 9.420.06.12 67.50 – – – 360,218 – – 360,218 9.506.09.12 76.75 – – – 50,000 – – 50,000 9.7
2,747,209 1,163,444 (319,645) (677,783) 2,913,225
The weighted average remaining contractual life of the options outstanding at 31 December 2012 is 8.0 years (2011 7.3 years).
2012Number of
Options
Weighted average
exercise price (p)
2011Number of
Options
Weighted average
exercise price (p)
Outstanding at beginning of the year 2,747,209 41.57 3,451,176 38.37Granted 1,163,444 68.74 84,000 86.77Exercised (677,783) 31.54 (383,924) 24.75Forfeited (319,645) 57.36 (404,043) 18.84
Outstanding at end of the year 2,913,225 53.19 2,747,209 41.57Exercisable at end of the year 371,663 25.31 285,279 22.56
Notes Forming Part of the Consolidated Financial Statements continued

Company O
verviewBusiness Review
Corporate Governance
Financial Statements
Advanced Medical Solutions G
roup plc Annual Report 2012 | 58
Advanced Medical Solutions G
roup plc Annual Report 2012 | 59
Advanced Medical Solutions G
roup plc Annual Report 2012 | 58
Advanced Medical Solutions G
roup plc Annual Report 2012 | 59
33. Share-based payments continuedLong Term Incentive Plan (LTIP)The fair value of the LTIP is calculated based on a binominal tree model assuming the inputs below:
Grant date 12/10/2005 12/4/2007 15/10/2008 23/4/2009 15/4/2011 20/6/2012 6/9/2012
Share price of grant date 8.75p 16.75p 31.75p 33.3p 88.00p 67.5p 76.75pExercise price 0p 0p 0p 0p 0p 0p 0pExpected life 3.5 yrs 3.5 yrs 3.5 yrs 3 yrs 3 yrs 3 yrs 3 yrsContractual life 10 yrs 10 yrs 10 yrs 10 yrs 10 yrs 10 yrs 10 yrsRisk free rate 4.50% 5.00% 4.20% 2.40% 1.92% 0.39% 0.39%Expected volatility 30% 27% 33% 34% 33% 34% 34%Expected dividend yield 0% 0% 0% 0% 0.7% 0.7% 0.7%Probability of performance conditions 40.40% 42.50% 100.00% 43% 52% 44% 49%Fair value of option 2p 4p 31.7p 14.5p 76.5p 28.8p 36.4p
The expected volatility was determined by calculating the historic volatility of the Group’s share price over the previous three years.
The entitlement to shares under the LTIP is subject to achieving the performance conditions referred to on page 22. The numbers shown are the maximum entitlements and the actual number of shares (if any) will depend on these performance conditions being achieved.
Date of grant
Marketprice at date of
grant (p)
Number of LTIPs at
1 January 2012
Remaininglife
1 January 2012 Issued Lapsed Exercised
Number of LTIPs
31 December2012
Remaining life
31 December2012
Long-Term Incentive Plan15.10.08 31.75 300,000 6.8 – – (287,007) 12,993 5.823.04.09 33.30 1,076,485 7.3 – (136,025) – 940,460 6.316.04.10 42.00 110,000 8.3 – – – 110,000 7.315.04.11 88.00 465,944 9.3 – – – 465,944 9.320.06.12 67.50 – – 650,000 (100,000) – 550,000 9.506.09.12 76.75 – – 462,540 – – 462,540 9.7
1,952,429 1,112,540 (236,025) (287,007) 2,541,937
The weighted average remaining contractual life of the LTIPs outstanding at 31 December 2012 is 8.1 years (2011: 7.8 years).
2012Number of
Options
2011Number of
Options
Outstanding at beginning of the period 1,952,429 1,486,485 Granted 1,112,540 465,944 Exercised (287,007) – Forfeited (236,025) –
Outstanding at end of the period 2,541,937 1,952,429
Exercisable at end of the period 953,453 300,000
The exercise price of these LTIPs is £1 for each issue of LTIPs.
Deferred Share Bonus Scheme (DSB)The fair value of the DSB is calculated based on a Black-Scholes Merton model assuming the inputs below:
Grant date 12/4/2007 12/4/2007 2/5/2008 4/6/2008 4/23/2009
Share price at grant date 18.25p 18.25p 35.50p 35.50p 34.00pExercise price 0p 0p 0p 0p 0pExpected life 3.5 yrs 3.5 yrs 3.5 yrs 3.5 yrs 3.0 yrsContractual life 10 yrs 10 yrs 10 yrs 10 yrs 10 yrsRisk-free rate 5.00% 5.00% 5.00% 5.00% 2.40%Expected volatility 27% 27% 38% 38% 30%Expected dividend yield 0% 0% 0% 0% 0%Probability of performance conditions 100% 66.70% 100% 100% 100%Fair value of option 14p 9p 30p 28p 29p

Advanced Medical Solutions G
roup plc Annual Report 2012 | 60
Advanced Medical Solutions G
roup plc Annual Report 2012 | 61
Advanced Medical Solutions G
roup plc Annual Report 2012 | 60
Advanced Medical Solutions G
roup plc Annual Report 2012 | 61
33. Share-based payments continuedGrant date 5/5/2010 5/5/2010 11/5/2011 11/5/2011 10/5/2012 10/5/2012
Share price at grant date 40.32p 40.32p 83.00p 83.00p 70.625p 70.625pExercise price 0p 0p 0p 0p 0p 0pExpected life 5 yrs 3 yrs 5 yrs 3 yrs 5 yrs 3 yrsContractual life 10 yrs 10 yrs 10 yrs 10 yrs 10 yrs 10 yrsRisk-free rate 2.40% 2.40% 1.92% 1.92% 0.39% 0.39%Expected volatility 34% 34% 18% 18% 34% 34%Expected dividend yield 0% 0% 0.7% 0.7% 0.7% 0.7%Probability of performance conditions 100% 100% 100% 100% 100% 100%Fair value of option 34p 34p 72p 72p 61p 62p
The expected volatility was determined by calculating the historic volatility of the Group’s share price over the previous 3 years.
The entitlement to shares under the DSB is subject to a 3 year holding period. Additionally, for certain levels of share matching, additional performance conditions also need to be achieved. The actual number of shares that will be matched will depend on these performance conditions. Details of the DSB are given on page 23.
Date of grant
Marketprice at date of
grant (p)
Number of DSB
matching shares at
1 January2012
Remaininglife
1 January2012 Issued Lapsed Exercised
Number of DSB
matching shares at
31 December2012
Remaininglife
31 December2012
Deferred Share Bonus Plan12.04.07 18.25 193,299 5.3 – – (66,843) 126,456 4.302.05.08 35.50 86,108 6.3 – – (14,513) 71,595 5.304.06.08 35.50 141,787 6.4 – – – 141,787 5.423.04.09 34.00 393,213 7.3 – (19,117) (90,943) 283,153 6.305.05.10 40.32 800,213 8.3 – (6,220) (14,922) 779,071 7.311.05.11 83.00 113,077 9.4 – (4,874) (8,710) 99,493 8.410.05.12 70.625 – – 69,374 (283) (2,123) 66,968 9.4
1,727,697 69,374 (30,494) (198,054) 1,568,523
The weighted average remaining contractual life of the DSBs outstanding at 31 December 2012 is 6.8 years (2011: 7.3 years)
Deferred Share Bonus Scheme (DSB)2012
Number ofOptions
2011Number of
Options
Outstanding at beginning of the period 1,727,697 1,703,365Granted 69,374 121,576Exercised (198,054) (68,146)Forfeited (30,494) (29,098)
Outstanding at end of the period 1,568,523 1,727,697
Exercisable at end of the period 622,991 421,194
The exercise price of the matching shares is £NIL.
34. Commitments under operating leasesAs at 31 December 2012, the Group had outstanding commitments under operating leases, which fall due as follows:
2012Land andbuildings
£’000
2012Other£’000
2011Land andbuildings
£’000
2011Other£’000
Amounts payable under operating leases:Within one year 873 134 872 110In two to five years 3,457 85 2,887 180After five years 6,533 – 6,419 –
10,863 219 10,178 290
35. Related party transactionTransactions between the Company and its subsidiaries, which are related parties, have been eliminated on consolidation and are not disclosed in this note.
Notes Forming Part of the Consolidated Financial Statements continued

Company O
verviewBusiness Review
Corporate Governance
Financial Statements
Advanced Medical Solutions G
roup plc Annual Report 2012 | 60
Advanced Medical Solutions G
roup plc Annual Report 2012 | 61
Advanced Medical Solutions G
roup plc Annual Report 2012 | 60
Advanced Medical Solutions G
roup plc Annual Report 2012 | 61
Note2012
£’0002011
£’000
Fixed assetsInvestments 3 58,403 62,236Deferred tax assets 501 –
58,904 62,236Current assetsDebtors – due within one year 4 12 986Cash at bank and in hand 2,652 1,822
2,664 2,808
Creditors : amounts falling due within one year 5 (3,114) (3,796)Net current liabilities (450) (988)
Creditors : after more than one year 6 (11,589) (18,507)
Net assets 46,865 42,741
Capital and reservesCalled up share capital 7 10,230 10,176Share-based payments reserve 8 1,122 779Investment in own shares 8 (77) (40)Share premium account 8 31,887 31,704Retained earnings 8 3,703 122
Equity shareholders’ funds 46,865 42,741
The financial statements of Advanced Medical Solutions Group plc (registration number 2867684) on pages 61 to 64 were approved by the Board of directors and authorised for issue on 10 April 2013 and were signed on its behalf by:
Chris MeredithChief Executive Officer10 April 2013
Company Balance SheetAt 31 December 2012

Advanced Medical Solutions G
roup plc Annual Report 2012 | 62
Advanced Medical Solutions G
roup plc Annual Report 2012 | 63
Advanced Medical Solutions G
roup plc Annual Report 2012 | 62
Advanced Medical Solutions G
roup plc Annual Report 2012 | 63
Notes Forming Part of the Company Financial Statements
1. Significant accounting policiesBasis of accountingThe separate financial statements of the company are presented as required by the Companies Act 2006. They have been prepared under the historical cost convention and in accordance with applicable United Kingdom Accounting Standards and law.
The principal accounting policies are summarised below. They have all been applied consistently throughout the year and the preceding year.
The Company has taken advantage of the exemption of FRS8 from disclosing transactions with other members of the Group and the exemption in FRS29 for making disclosures in relation to financial instruments.
InvestmentsFixed asset investments in subsidiaries and associates are shown at cost less provision for impairment.
For investments in subsidiaries acquired for consideration including the issue of shares qualifying for merger relief, cost is measured by reference to the nominal value only of the shares issued. Any premium is ignored.
Financial liabilities and equityFinancial liabilities and equity instruments are classified according to the substance of the contractual arrangements entered into. An equity instrument is any contract that evidences a residual interest in the assets of the Group after deducting all of its liabilities.
Share-based paymentsThe Group has applied the requirements of FRS20 Share-based Payments. In accordance with the transitional provisions, FRS 20 has been applied to all grants of equity instruments after 7 November 2002 that were unvested as at 1 January 2005.
The Group issues equity-settled share-based payments to certain employees. Equity-settled share-based payments are measured at fair value at the date of grant. The fair value as determined at the grant date of equity-settled share-based payments is expensed on a straight-line basis over the vesting period, based on the Group’s estimate of shares that will eventually vest.
Fair value is measured by use of a Black-Scholes Merton model. The expected life used in the model has been adjusted, based on management’s best-estimate, for the effect of non-transferability, exercise restrictions and behavioural considerations.
Liquid resourcesLiquid resources comprise variable term deposits that are accessible with less than 12 months’ notice.
2. Profit for the yearAs permitted by section 408 of the Companies Act 2006 the Company has elected not to present its own profit and loss account for the year. AMS Group plc reported a profit for the financial year ended 31 December 2012 of £2,942,000 (2011: Loss of £854,000).
The auditor’s remuneration for audit and other services is disclosed in note 7 to the consolidated financial statements.
The average number of employees in the year was 8 (2011: 6). The directors’ remuneration is detailed in note 9 to the consolidated financial statements.

Company O
verviewBusiness Review
Corporate Governance
Financial Statements
Advanced Medical Solutions G
roup plc Annual Report 2012 | 62
Advanced Medical Solutions G
roup plc Annual Report 2012 | 63
Advanced Medical Solutions G
roup plc Annual Report 2012 | 62
Advanced Medical Solutions G
roup plc Annual Report 2012 | 63
3. Fixed asset investmentsInvestments
in subsidiaries£’000
Loans£’000
Total£’000
CostAt 1 January 2012 7,481 92,000 99,481 Additions – – – Movement (1,853) (2,253) (4,106)Exchange adjustments – (246) (246)
At 31 December 2011 5,628 89,501 95,129
Provisions for impairmentAt 1 January 2012 1,670 35,575 37,245 Movement – (519) (519)
At 31 December 2012 1,670 35,056 36,726
Net Book valueAt 31 December 2012 3,958 54,445 58,403
At 31 December 2011 5,812 56,424 62,236
Shares in Group undertakings and loans to Group undertakings have been written down to recognise losses in subsidiary companies.
The following were subsidiary undertakings at the end of the year and have all been included in the consolidated accounts.
NameCountry ofOperation
Proportion ofvoting rights and ordinaryshare capitalHeld Nature of business
Advanced Medical Solutions Limited England 100% Development and manufacture of medical productsAdvanced Medical Solutions (UK) Limited England 100% Holding CompanyAdvanced Medical Solutions Trustee Company Limited England 100% Trustee CompanyAdvanced Medical Solutions (Plymouth) Limited England 100% Development and manufacture of medical productsAdvanced Healthcare Systems Limited England 100%* DormantAdvanced Medical Solutions Group Inc. USA 100%† Holding CompanyAdvanced Medical Solutions (US) Inc USA 100%§ Marketing support of medical productsMedLogic Global Holdings Limited England 100%¶ Holding CompanyInnovative Technologies Limited England 100%‡ DormantAdvanced Medical Solutions BV Netherlands 100% Development and manufacture of medical productsAdvanced Medical Solutions (Germany) GmbH Germany 100% Holding CompanyRESORBA® Medical GmbH Germany 100%# Development and manufacture of medical productsRESORBA® s.r.o. Czech Republic 100%# Manufacture and sales office of medical productsRESORBA® ooo Russia 100%# Sales office of medical productsMPN Medizin Produkte Neustadt GmbH Germany 100%# Manufacturer of medical products
* Held indirectly through Advanced Medical Solutions Limited‡ Held indirectly through MedLogic Global Holdings Limited† Held indirectly through Advanced Medical Solutions (UK) Limited§ Held indirectly through Advanced Medical Solutions Group Inc.¶ Held indirectly through Advanced Medical Solutions (Plymouth) Limited# Held indirectly through Advanced Medical Solutions (Germany) GmbH
The above table reflects the situation at the year-end.

Advanced Medical Solutions G
roup plc Annual Report 2012 | 64
Advanced Medical Solutions G
roup plc Annual Report 2012 | 65
Advanced Medical Solutions G
roup plc Annual Report 2012 | 64
Advanced Medical Solutions G
roup plc Annual Report 2012 | 65
4. Debtors2012
£’0002011
£’000
Due within one yearPrepayments and accrued income 11 12Other debtors 1 536Amounts due from subsidiary undertakings – 340
12 888
2012£’000
2011£’000
Due after more than one year Deferred tax assets 501 –
501 –
5. Creditors : amounts falling due within one year2012
£’0002011
£’000
Trade creditors 41 90 Other creditors 1 15 Loan 2,796 1,965 Accruals and deferred income 274 1,726
3,114 3,796
6. Creditors : amounts falling due after more than one year
2012£’000
2011£’000
Loan 11,589 18,507
11,589 18,507
7. Share capitalDetails on the share capital of the Company are provided in note 30 to the Group’s accounts.
8. ReservesShare-based
payments£’000
Investment in own shares
£’000Share premium
£’000
Retained earnings
£’000Total
£’000
At 1 January 2012 779 (40) 31,704 122 32,565 Share-based payments 363 – – – 363 Share options exercised (20) – 183 – 163Shares purchased by EBT – (81) – – (81)Shares sold by EBT – 44 – – 44Profit for the year – – – 2,942 2,942Dividends paid – – – (961) (961)Dividends received – – – 1,600 1,600
At 31 December 2012 1,122 (77) 31,887 3,703 36,635
9. Share-based paymentsThe charge for share-based payments under FRS20 arises across the following schemes:
2012£’000
2011£’000
Unapproved Executive Share Option Scheme, Enterprise Management Incentive Scheme and Company Share Option Plan 59 64Long-Term Incentive Plan 143 141Deferred Share Bonus Scheme 161 132
363 337
Details on the share-based payments of the Company are provided in note 33 on pages 57 to 60 in the notes to the Group’s accounts.
Notes Forming Part of the Company Financial Statements continued

Company O
verviewBusiness Review
Corporate Governance
Financial Statements
Advanced Medical Solutions G
roup plc Annual Report 2012 | 64
Advanced Medical Solutions G
roup plc Annual Report 2012 | 65
Advanced Medical Solutions G
roup plc Annual Report 2012 | 64
Advanced Medical Solutions G
roup plc Annual Report 2012 | 65
2012£m
2011£m
2010£m
2009£m
2008£m
2007£m
Consolidated income statement (Pre-exceptional items)Revenue 52.6 34.4 31.9 24.1 20.3 16.9 Profit from operations 12.3 6.4 5.3 4.1 2.7 1.7 Finance income – – – – 0.3 0.3 Profit attributable to equity holders of the parent 10.5 6.7 5.8 4.5 3.3 2.2 Basic earnings per share 5.2p 4.3p 3.8p 3.1p 2.3p 1.6p
Consolidated statement of financial positionNet assets employedNon-current assets 71.9 74.2 20.3 17.7 9.8 6.5 Current assets 25.7 25.3 12.7 12.1 14.7 12.7 Total liabilities (23.9) (33.3) (5.2) (6.9) (4.6) (3.5)
Net assets 73.7 66.2 27.8 22.9 19.9 15.7
Shareholders’ equityShare capital and investment in own shares 10.2 10.2 7.7 7.2 7.2 7.1 Share-based payments reserve 1.1 0.8 0.5 0.5 0.3 0.2 Share-based payments deferred tax reserve 0.2 0.6 0.4 0.6 0.6 0.3 Share premium account 31.9 31.7 0.3 0.1 – – Other reserve 1.5 1.5 1.5 1.5 1.5 1.5 Hedging reserve (0.1) – (0.1) – – – Translation reserve (1.4) (0.1) – 0.3 0.4 – Retained equity 30.3 21.5 17.5 12.7 9.9 6.6
Equity attributable to equity holders of the parent 73.7 66.2 27.8 22.9 19.9 15.7
Five Year Summary

Advanced Medical Solutions G
roup plc Annual Report 2012 | 66
Advanced Medical Solutions G
roup plc Annual Report 2012 | 67
Notice of Meeting
Notice is hereby given that the nineteenth Annual General Meeting of the Company will be held at 11.00 a.m. on 22 May 2013 at the offices of Investec Bank plc, 2 Gresham Street, London, EC2V 7QP for the following purposes:
As ordinary business:1. To receive the Report of the Directors and the Financial Statements of the Company for the year ended 31 December 2012 (together with the
report of the auditor thereon).
2. To approve the Directors’ Remuneration Report for the year ended 31 December 2012.
3. To reappoint Deloitte LLP as auditor and to authorise the directors to fix their remuneration.
4. To re-elect Penny Freer and Mary Tavener, (who retire by rotation in accordance with the Articles of Association) as directors of the Company.
5. To re-elect Dr. Don Evans, (who having been a director of the Company for more than ten years and is now Non-Executive Chairman, retires and is proposed for re-election each year) as a director of the Company.
6. To declare a final dividend of 0.35p per ordinary share, payable on 28 May 2013 to shareholders on the register at close of business on 3 May 2013.
As special business:To consider and, if thought fit, to pass Resolution 7, which will be proposed as an Ordinary Resolution, and Resolutions 8 and 9, which will be proposed as Special Resolutions.
7. To authorise the directors generally and unconditionally for the purposes of section 551 of the Companies Act 2006 (the ‘2006 Act’) to exercise all the powers of the Company to allot shares in the Company and to grant rights to subscribe for or to convert any security into shares in the Company (each an allotment of ‘relevant securities’) up to an aggregate nominal amount of £3,410,555 provided that this authority is for a period expiring upon the earlier of the date of the Company’s next Annual General Meeting and fifteen months after the date of the passing of this Resolution but the Company may before such expiry make an offer or agreement which would or might require relevant securities to be allotted after such expiry and the directors may allot relevant securities in pursuance of such offer or agreement notwithstanding that the authority conferred by this resolution has expired. This authority is in substitution for all subsisting authorities, to the extent unused.
8. Subject to the passing of resolution 7 above, to authorise the directors pursuant to section 570 of the 2006 Act to allot equity securities (within the meaning of section 560 of the 2006 Act) wholly for cash pursuant to the authority conferred by resolution 7 above as if section 561(1) of the 2006 Act did not apply to any such allotment, provided that this power shall be limited to the allotment of equity securities:
(a) in connection with an offer of such securities by way of rights to holders of ordinary shares in proportion (as nearly as may be practicable) to their respective holdings of such shares, but subject to such exclusions or other arrangements as the directors may deem necessary or expedient in relation to fractional entitlements or any legal or practical problems under the laws of any territory, or the requirements of any regulatory body or stock exchange;
(b) otherwise than pursuant to sub-paragraph (a) above up to an aggregate nominal amount of £1,023,166; and
(c) which shall expire on the earlier of the conclusion of the next Annual General Meeting of the Company and fifteen months after the date of the passing of this Resolution, save that the Company may before such expiry make an offer or agreement which would or might require equity securities to be allotted after such expiry and the directors may allot equity securities in pursuance of any such offer or agreement notwithstanding that the power conferred by this resolution has expired.
9. That the Company is hereby generally and unconditionally authorised for the purposes of Section 701 of the 2006 Act to make market purchases (within the meaning of Section 693(4) of the 2006 Act) of any of its ordinary shares of 5p each in the capital of the Company on such terms and in such manner as the directors may from time to time determine provided that:
(a) the maximum number of ordinary shares which may be purchased is 10,231,666;
(b) the minimum price which may be paid for each ordinary share is 5p which amount shall be exclusive of expenses, if any;
(c) the maximum price (exclusive of expenses) which may be paid for each ordinary share shall not be more than 5% above the average of the middle market quotations for an ordinary share as derived from The London Stock Exchange Daily Official List for the five business days immediately preceding the date on which the ordinary share is purchased;
(d) unless previously renewed, revoked or varied, this authority shall expire upon the earlier of the date of the Company’s next Annual General Meeting and fifteen months after the date of the passing of this Resolution; and
(e) under this authority the Company may make a contract to purchase ordinary shares which would or might be executed wholly or partly after the expiry of this authority, and may make purchases of ordinary shares pursuant to it as if this authority had not expired.
By order of the Board
Mary TavenerCompany Secretary10 April 2013
Registered office:Premier Park, 33 Road One, Winsford Industrial Estate,Winsford, Cheshire, CW7 3RT.

Company O
verviewBusiness Review
Corporate Governance
Financial Statements
Advanced Medical Solutions G
roup plc Annual Report 2012 | 66
Advanced Medical Solutions G
roup plc Annual Report 2012 | 67
Notes1. A member entitled to attend and vote at the meeting convened by the notice set out above may appoint a proxy to attend, speak and, on a
poll to vote in his place. A holder of more than one ordinary share may appoint different proxies in relation to each or any of those ordinary shares.
2. A member may appoint more than one proxy provided each proxy is appointed to exercise rights attached to different shares. A member may not appoint more than one proxy to exercise rights attached to any one share. To appoint more than one proxy notice must be given to the Company’s Registrars not later than 48 hours before the time appointed for the holding of the meeting.
3. A proxy does not need to be a member of the Company but must attend the meeting to represent you. Details of how to appoint the Chairman of the meeting or another person as your proxy using the proxy form are set out at note 1 of the proxy form. If you wish your proxy to speak on your behalf at the meeting you will need to appoint your own choice of proxy (not the Chairman) and give your instructions directly to them.
4. On a vote on a resolution on a show of hands at the meeting, a proxy has one vote for and one vote against if the proxy has been appointed by more than one member and the proxy has been instructed by one or more of the members to vote for the resolution and by one or more other member to vote against it.
5. Any corporation which is a member can appoint one or more corporate representatives who may exercise on its behalf all of its powers as a member provided that they do not do so in relation to the same shares.
6. A form of proxy is enclosed for use by members. To be effective, it must be completed and arrive not later than 48 hours before the time fixed for the Meeting at Capita Registrars, PXS, 34 Beckenham Road, Beckenham, Kent BR3 4TU. You may also deliver by hand to The Registry, 34 Beckenham Road, Beckenham, Kent BR3 4TU during usual business hours.
7. The register of directors’ interests in the shares of the Company will be available for inspection at the registered office of the Company during usual business hours on any weekday (public holidays excepted) until the date of the Meeting and also on that date and at the place of the Meeting from 9.00 a.m. until the conclusion of the Meeting.
8. The Company, pursuant to Regulation 41 of the Uncertificated Securities Regulations 2001, specifies that only those shareholders registered in the Register of Members of the Company as at 6:00 p.m. on 20 May 2013 shall be entitled to attend or vote at the aforesaid Annual General Meeting in respect of the number of shares registered in their names at that time. Changes in the entries in the relevant register of Securities after 6:00 p.m. on 20 May 2013 shall be disregarded in determining the rights of any person to attend or vote at the meeting.
Notes on special businessResolution 7: Authority to Allot Shares and other relevant securitiesThis resolution would give the directors the authority to allot ordinary shares up to an aggregate nominal amount equal to £3,410,555 (representing 68,211,113 ordinary shares of 5p each). This amount represents approximately one-third of the issued ordinary share capital of the Company as at 10 April 2013, the latest practicable date prior to publication of this Notice.
The authority sought under this resolution will expire at the conclusion of the Annual General Meeting of the Company held in 2014 or, if earlier, 15 months after the passing of the resolution.
While the Directors have no present intention of issuing any of the authorised but unissued share capital, it is considered prudent and appropriate to maintain the flexibility that this authority provides.
Resolution 8: Disapplication of Pre-emption RightsYour directors also require additional authority from shareholders to allot shares or grant rights over shares or sell treasury shares where they propose to do so for cash and otherwise than to existing shareholders in proportion to their existing holdings. Accordingly, Resolution 8 will be proposed as a special resolution to grant such authority. Apart from rights issues, open offers or any other pre-emptive offer as mentioned the authority will be limited to the issue of shares and sales of treasury shares for cash up to an aggregate nominal value of £1,023,166 (being 10% of the Company’s issued ordinary share capital at 10 April 2013, the latest practicable date prior to publication of this Notice). This is in keeping with the extent for which such authority has been sought and given at each previous Annual General Meeting of the Company since 2006.
Allotments made under the authorisation in paragraph (a) of Resolution 8 would be limited to allotments by way of a rights issue only (subject to the right of the directors to impose necessary or appropriate limitations to deal with, for example, fractional entitlements and regulatory matters).
If given, this authority will expire at the conclusion of the Annual General Meeting of the Company held in 2014 or, if earlier, 15 months after the passing of the resolution.

Advanced Medical Solutions G
roup plc Annual Report 2012 | 68
Advanced Medical Solutions G
roup plc Annual Report 2012 | PB
Notes on special business continuedResolutions 9: Purchase by the Company of its own SharesIn certain circumstances, it may be advantageous for the Company to purchase its own shares. Under Section 701 of the 2006 Act, the directors of a company may make market purchases of that company’s shares if authorised to do so. Your directors believe that granting such approval would be in the best interests of shareholders in allowing directors the flexibility to react promptly to circumstances requiring market purchases.
Accordingly, Resolution 9, which will be proposed as a special resolution, will give the directors the authority to purchase issued shares of the Company under Section 701 of the 2006 Act.
The authority contained in this resolution will be limited to an aggregate nominal value of £511,583 (representing 5% of the issued ordinary share capital of the Company as at 10 April 2013 the latest practicable date prior to publication of this Notice; representing 10,231,666 ordinary shares of 5p each). The price which may be paid for those shares is also restricted as set out in the resolution.
This authority will expire at the conclusion of the Annual General Meeting of the Company held in 2014 or, if earlier, 15 months after the passing of the resolution.
The Board has no present intention of exercising this authority. However, this will be kept under review, and the Board will use this power only if and when, taking account of market conditions prevailing at the time, other investment opportunities, appropriate gearing levels and the overall financial position of the Group, they believe that the effect of such purchases will be in the best interests of shareholders generally and that they will result in an increase in earnings per share.
Shares purchased under this authority may be held as treasury shares. Shares held in treasury do not carry voting rights and no dividends will be paid on any such shares. Shares held in treasury in this way can be sold for cash or cancelled. This would allow the Company to manage its capital base more effectively and to replenish its distributable reserves.
If and when the Board resolves to exercise its authority to make market purchases, it will at that time decide whether shares purchased are to be cancelled or held in treasury.
As at 10 April 2013, the latest practicable date prior to publication of this Notice, there were share options outstanding over ordinary shares, representing 3.4% of the Company’s issued ordinary share capital. The Company has no warrants in issue in relation to its shares. If the buyback authority was to be exercised in full, these options would represent 3.6% of the Company’s ordinary issued share capital.
Notice of Meeting continued


Registered Office:Premier Park, 33 Road OneWinsford Industrial EstateWinsford, Cheshire, CW7 3RT
Company Number: 2867684Tel: +44 (0)1606 863500Fax: +44 (0)1606 863600e-mail: [email protected]
Web: www.admedsol.com
Advanced M
edical Solutions Group plc Annual Report and Accounts 2012