ample asset management program learning environmentsimple.werf.org/simple/media/documents/focus 2 -...
TRANSCRIPT
PARSONS / GHD
Focus Topic 2: Meeting the IT Challenge - Toward an
“Enterprise Asset Management System
(EAMS)AMPLE
Asset Management Program Learning Environment

2PARSONS / GHD
IT Systems – 4 Core EAMS Components
Robust Enterprise Asset Management System –Enterprise-Wide EAM Functionality
4. Knowledge Management
1. Data Standards/Asset Hierarchy
FAILURE PLANS
SPECIALISTA.A.M
SYSTEMMODULES(Life Cycle)
PERFORMANCEMONITORING
CUSTOMERCALL CENTRE
DESIGNFUNCTIONS
CAD
MOBILE COMPUTING
RCM ANALYST
PROPERTY &CUSTOMERRECORDS
FINANCE SYSTEMGeneral Ledger etc.
OPERATIONSSCADA TELEMETRY
SYSTEM
MAPPINGSYSTEM
ASSET REGISTER(CORPORATE)
MAINTENANCEMANAGEMENT
DIRECT LINKSINDIRECT LINKS
SPECIALIST LIFE CYCLEAM APPLICATIONS
KEY ASSET MANAGEMENTAPPLICATIONSKEY ASSET MANAGEMENTAPPLICATIONS
SECONDARY A.A.M.APPLICATIONS
KNOWLEDGEMANAGEMENT
SYSTEM
OPERATIONSMANUALS
COMPLAINTS
WORKSMANAGEMENT
EDS
3. Architecture/Integration of Tools
2. Work Processes/”Best Practices”

3PARSONS / GHD
1. Data Standards and Asset HierarchyFACILITIES
PARENT ASSET
ASSET
CHILD ASSET
FACILITIES
PARENT ASSET
ASSET
CHILD ASSET
FACILITY
ASSET
CHILD ASSET
CHILD ASSET
PARENT ASSET
ASSET
CHILD ASSET
CHILD ASSET
PARENT ASSET
FACILITY
ASSET
CHILD ASSET
CHILD ASSET
ASSET
CHILD ASSET
CHILD ASSET
PARENT ASSETPARENT ASSET
ASSET
CHILD ASSET
CHILD ASSET
ASSET
CHILD ASSET
CHILD ASSET
PARENT ASSETPARENT ASSET
An agency’s data standards are the backbone of its management capabilities:
if we don’t know what we have, where it is, and what condition it is in, we can’t really be managing it.

4PARSONS / GHD
Del
phi G
roup
s
Inid
ivdu
al D
iscu
ssio
n
Exi
st (%
)
Use
Exi
st (%
)
Use
Exi
st (%
)
Use
Exi
st (%
)
Use
Exi
st (%
)
Use
Exi
st (%
)
Use
Exi
st (%
)
Use
Exi
st (%
)
Use
Exi
st (%
)
Use
Exi
st (%
)
Use
Exi
st (%
)
Use
Exi
st (%
)
Use
Use
Use
Asset Register 90 Y 50 Y 30 N 90 V 40 N 30 V 50 P 50 N 0 N 15 N 15 N 0 N V PHierarchy 80 Y 50 Y 40 N 0 N 20 N 30 N 50 N 50 N 0 N 0 N 0 N 0 N N PAsset Types 95 Y 50 Y 20 N 0 N 0 N 30 N 50 N 30 N 0 N 0 N 0 N 0 N N NSize (Length, Depth etc) 80 Y 50 Y 0 N 0 N 30 N 20 N 30 N 30 N 0 N 0 N 0 N 0 N N YMaterial 90 Y 50 Y 0 N 0 N 0 N 30 N 40 N 50 N 0 N 10 N 0 N 5 N N YDate of Construction 5 P 50 Y 0 N 80 P 0 N 30 N 50 Y 50 N 0 N 40 N 0 N 10 N N YCondition 5 P 0 N 10 N 0 N 0 N 0 N 0 N 0 N 0 N 15 N 0 N 0 N Y PPerformance 0 N 0 N 40 N 0 N 30 N 0 N 0 N 0 N 0 N 15 N 0 N 0 N Y PEffective Lives 0 N 0 N 0 N 40 V 0 N 40 P 0 N 0 N 0 N 0 N 0 N 0 N V YDifficulity Multipliers 0 N 0 N 0 N 0 N 0 N 0 N 0 N 0 N 70 Y 0 N 0 N 0 N V PUnit Rates 10 P 0 N 0 N 50 V 0 N 60 P 0 N 0 N 0 N 0 N 0 N 0 N Y YMaintenance 80 Y 0 N 0 N 0 N 40 N 0 N 0 N 0 N 0 N 0 N 0 N 0 N V YOperations 0 N 0 N 0 N 0 N 50 Y 0 N 0 N 0 N 0 N 0 N 0 N 0 N V YLevel of Service 0 N 0 N 0 N 0 N 0 N 0 N 0 N 0 N 0 N 30 P 0 N 30 P N YFuture Requirements 0 N 0 N 0 N 0 N 0 N 0 N 0 N 0 N 0 N 30 P 0 N 50 P N YGrowth / Capacity 0 N 0 N 0 N 0 N 0 N 0 N 0 N 0 N 0 N 60 Y 0 N 40 P N YRenewal / Replace 0 N 30 P 0 N 0 N 0 N 0 N 0 N 0 N 0 N 30 P 0 N 50 P N YConseqence of Failure 50 P 0 N 0 N 0 N 0 N 0 N 0 N 0 N 40 P 0 N 20 P 0 N V PRates Info 0 N 0 N 0 N 0 N 0 N 60 Y 0 N 0 N 0 N 0 N 0 N 0 N N Y
TSM
P - G
IS
(Spa
tial O
nly)
OC
SD S
trat P
lan
& O
ther
Rep
orts
CM
MS
J42
- CR
ISP
FIS
CIP
Pro
gram
Dat
aWar
ehou
se
RW
Bec
k M
odel
Faci
lity
Atla
s
Sew
er A
tlas
Crit
ical
ity T
able
s -
MC
C
TSM
P
0 No data exists30 Data exists for less than 50% of the assets60 Data exists for more than 50% of the assets
N Data will not be used as better data existsV Data will only be used to verify other sources of dataP Data will be used for less than 50% of the assetsY Data will be used for more than 50% of the assets
Searching for Registry Data

5PARSONS / GHD
Hierarchy – Plant Assets Source Data

6PARSONS / GHD
The “Data Standard”
• ID/naming• Attributes • Record layout• Database
architecture & protocol
• Data collection protocols

7PARSONS / GHD
Rolling up Confidence
Facility Strategy (confidence)
MMI component
Program Strategy (confidence)
System Strategy (confidence)
Asset Strategy (confidence)
Confidence at higher system levels is determined by Managed Maintenance Item (MMI) component accuracy.
16b.5

8PARSONS / GHD
2. Work Processes + “Best Practices”
X
XWho? What? When?“Best
Practice” work
processes should drive
system functionality
Treatment
X
X
X
X
Collection/Conveyance
Office Distribution

PARSONS / GHD
Dataflow Diagrams – Work Process + Data

10PARSONS / GHD
The System Design/Integration Process
Customer Needs Identified
Business Needs Defined
Development of Business Processes
Definition of IT Systems and Infrastructure Requirements
Development of Organizationaland Staff Requirements
Implementation/Transition Plans
ProcurementManagement

11PARSONS / GHD
3. Architecture/Integration of Tools
Knowledge Management
Decision-Making
CMMS EAMS
Valuation/Costing
RCM/Failure/Risk AnalysisFacilities
Private Industry
SLG
Transportation
Schools
Utilities

12PARSONS / GHD
Architecture/Integration of ToolsCore EAMS Package
FEMCA
Costing/Valuation
Risk
Administration
Security & Audit
Reporting
Remote Interface
Asset Register/Hierarchy
Existing Applications Most
agencies find it much
more cost-effective to
build on existing
platforms, step-by-
step.
GBA
GIS
Financial System
SCADA
Inte
rfac
es
“Plug-ins”
Optimized Renewals
Life Cycle Planning
ODRC Valuation
“CapEx”
Customer Services
Future Components
Decision Making
Works/Contract
Component
Management
Knowledge Management Component

13PARSONS / GHD
Asset Data Collection Interfaces
Ivara
Asset
Indicators
Checksheets on Handheld
devices
Standard Ivara UI
• Windows • WebAcc
Ivara Online Data Collection Interface
(ODC)
Manual collectionManual collection
Automatic Collection
Plant Information
Online Systems

14PARSONS / GHD
Risk Management -Definable Decay Curves

15PARSONS / GHD
Plug-In Applications May Be Relatively Inexpensive – AWWA’s “Plant Manager”

16PARSONS / GHD
Plug-In Applications May Be Relatively Inexpensive: USEPA’s Environmental Finance Center (Boise State)
“CAPFinance”
17PARSONS / GHD
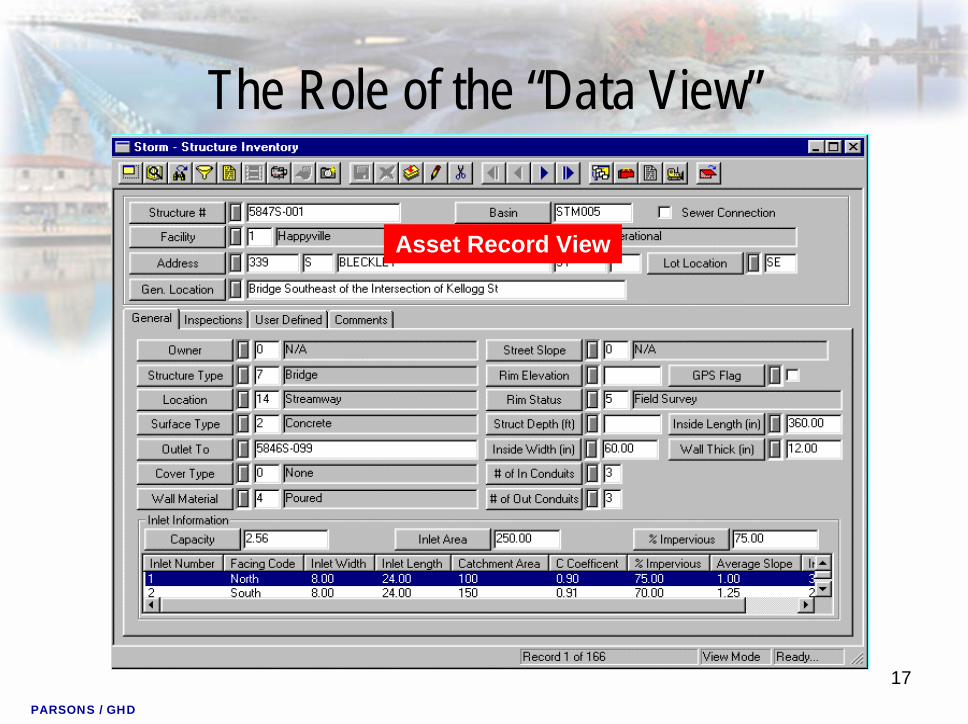
The Role of the “Data View”
Asset Record View

18PARSONS / GHD
The Role of the “Data View”Map View

19PARSONS / GHD
The Role of the “Data View”Performance View

20PARSONS / GHD
The Role of the “Data View”
“Process” View

21PARSONS / GHD
The Role of the “Data View”
“KPI” View

22PARSONS / GHD
Navigation by Images
• Click on the hotlinks to drill in.
• Icons (blinking) show highest alarm on each hotlinked asset
• Easy to use/understand

23PARSONS / GHD
Navigation by Images
• Down one level at the Screening Center
• More hotlinks to child assets
• Blinking icons for assets in alarm condition

24PARSONS / GHD
Navigation by Images
• One more level down
• Number of levels not restricted
• Key indicator dashboard on critical assets
• Blinking icons show severity, words show condition
• Interactive links (right mouse click)

25PARSONS / GHD
Friendly Work Process Interface

26PARSONS / GHD
Friendly Work Process Interface

27PARSONS / GHD
Asset Data Collection Interfaces
Ivara
Asset
Indicators
Checksheets on Handheld
devices
Standard Ivara UI
• Windows • WebAcc
Ivara Online Data Collection Interface
(ODC)
Manual collectionManual collection
Automatic Collection
Plant Information
Online Systems

28PARSONS / GHD
4. Knowledge Management
World’s Best Practices
World’s Best Practices
AAM Training
Org Practices & Procedures

29PARSONS / GHD
TH
E A
SS
ET
M
AN
AG
EM
EN
T
FRA
ME
WO
RK

30PARSONS / GHD
An AAM Program Is All About Knowledge Management
Information
Data
Knowledge
Wisdom

31PARSONS / GHD
It’s All About Better Decision Making
• Decision points– “Opex” & “Capex”– Optimal Renewal – Annuity renewal funding
• Strategic versus Tactical Levels
Opt
ion
1
Opt
ion
2
Opt
ion
3
Opt
ion
4
Opt
ion
5
2002
Tod
ay
2005
2015
2025
2030
2035
Treatment options M M RH RP RPDirect Cost 270 72 360 610 630
Indirect Cost 0 10 20 40 130Benefit 200 75 480 780 320
Option Ranking 4 3 1 2 5
Decay Curve
Catastrophic Failure
100% Level of Service
Minimum Level of Service
Benefit/Cost Ratio 0.7 0.9 1.3 1.2 0.42
Poor
Fair
Good
Poor
Fair
Good
Backlog Funding Model
-20
-10
0
10
20
30
40
50
0 1 2 3 4 5 6 7 8 9 10 11 12 13 14 15 16 17 18 19 20 21 22 23 24 25
Renewal Year
Bac
klog
in M
illio
ns
Base Funding- $550,000 Funding Level 1- 1,050,000Funding Level 2- 1,250,000 Funding Level 3- 1,500,000Funding @ 2% of Construction Cost- 2,516,000
FCI = 10%
FCI = 5%
FCI = 10%FCI = 10%
FCI = 5%FCI = 5%

32PARSONS / GHD
Effective Presentation is Key to Good Decision Making
Displays asset replacement profile and related annuity (reserve) values for selected asset groups
Commercial in Confidence

33PARSONS / GHD
Good Work Processes + Good Data =Confidence in Our Investment Decisions
0
20
40
60
80
100
120
2000 2010 2020 2030 2040 2050 2060
Year
Ris
k / C
ondi
tion
Sca
le
0
2000
4000
6000
8000
10000
12000
14000
16000
18000
Cos
t ($)
ConPoFCoFRiskMin RiskMin ConMn$Op$Cum$

34PARSONS / GHD

35PARSONS / GHD

36PARSONS / GHD
Lessons Learned…• Keep it simple – it’s more common sense than rocket
science• Keep it organized and focused
– Core questions/”storyline”– Gap Analysis and Quarterly Work Plans– AAM Charter
• Focus on the relevant decision process – who should be asking what questions and what is needed to give credible answers
• Implement in this order:1. Concepts and framework2. Work processes3. Data acquisition and IT development/integration
• Use prototype projects, Skills Teams• Focus where best gains can be made first• It’s ultimately all about knowledge management