amphibian red blood cell ferritin* - the journal … 3551 of the journal seriks of the north...
TRANSCRIPT

THE JCCJRXAL OF BIO~GICAL CHEYI~RY Vol. 248, No. 2, Issue of JanuarY 25, pp. 622-628, 1973
Prided in U.S.A.
Amphibian Red Blood Cell Ferritin*
(Received for publication, September 2, 1971, and in revised form august 7,1972)
ELIZABETH C. THEIL
From the Department of Biochemistry, North Carolina &ate University, Raleigh, North Carolina 27607
SUMMARY
Erythroid ferritin was isolated from tadpole red blood cells, an unusually abundant source, with an iron content of 12%. The apoprotein was characterized by sedimenta- tion equilibrium studies, sodium dodecyl sulfate gel elec- trophoresis, and by determination of amino acid composition. Tadpole red cell apoferritin has a molecular weight of 478,000, a subunit size of 19,600, and an amino acid composition similar to that of horse spleen apoferritin, particularly in its proline content. However, there is little or no cysteine in the tadpole protein in contrast to that from horse spleen; two other tadpole red cell proteins also have little or no cysteine.
The amount of ferritin in amphibian red blood cells de- creased from 0.9% of the soluble protein in the tadpole to 0.08% in the frog as measured immunologically; ferritin could not be detected in lysates of frog cells using gel elec- trophoresis.
A large non-hemoglobin iron pool in the tadpole red cell was indicated not only by the amount of ferritin but aIs.0 by the observation that cell suspensions could incorporate 14C-amino acids into hemoglobin without incorporating 5gFe into hemoglobin. Red ceil suspensions from adult frogs incorporated 14C-amino acids and Ve into hemoglobin.
Ferritin is an iron protein of large size and high iron content which is found in many tissues such as spleen, liver, and erythroid cells (1, 2). The function of ferritin in erythroid cells is not entirely clear (2), but changes in its amount and rate of syn- thesis have been associated with normal erythroid maturation as well as abnormal maturation and alterations in hemoglobin synthesis, e.g. megaloblastic anemias (3) and thalassetiia (4).
This report deals with ferritin in amphibian red blood cells. Such red cells are being used to study developmental changes because of the accessibility of animals in different developmental stages, because of the protein-synthesizing capacity of the cir- culating red cells, and because of the readily detectable differences between frog and tadpole red cell hemoglobins (5-7), non-hemo-
* This study was supported by funds from the National Insti- tute of Arthritis and Metabolic Diseases, The Research Corpora- tion, and the United Medical Health Services of North Carolina, Inc. Contribution from the School of Agriculture and Life Sci- ences and the School of Phvsical and Mathematical Sciences. Paper 3551 of the Journal Seriks of the North Carolina State Uni- versity Agricultural Experiment Station, Raleigh, North Carolina.
globin proteins (8), and red cell antigenic properties (9). In addition, a preliminary observation made by Herner and Frieden (10) has indicated that red blood cell iron metabolism changes during amphibian development. Frog red blood cells suspen- sion incorporated plasma-bound 69Fe into hemoglobin and into a non-hemoglobin fraction which they termed ‘<non-protein iron.” By contrast, tadpole red blood cell suspensions under the same conditions incorporated the 5gFe esclusively into the non-hemoglobin fraction. These results suggested to us that the non-hemoglobin 59Fe might be in ferritin, a protein with such a high iron content that its presence could he detected by 69Fe radioactivity at concentrations undetectable by protein staining. Then, the observed developmental changes in am- phibian red blood cell iron metabolism might be related to changes in ferritin concentration or properties.
The results in the present report describe the isolation and characterization of ferritin from tadpole red cells, in which it is unusually abundant, and the identification of ferritin as the “non-protein iron.” Herner and Frieden’s observations on the developmental change in red bIood cell iron metabolism (10) were confirmed and extended. To our knowledge, this report describes the first isolation of ferritin from an erythroid cell in sufficient quantity to allow determination of the size, subunit size, and amino acid composition of the apoprotein.
MATERIALS
Rana catesbeiana were obtained from Mogul-Ed, Oshkosh, Wisconsin, and from Howe Brothers Minnow Farm, Atlanta, Texas. The tadpoles were maintained outdoors in a fresh water pool and in the laboratory in aquaria containing dechlorinated tap water and aquatic plants; supplementary food was provided daily with Mogul-Ed Special Growth Food. X11 tadpoles were kept in the laboratory for at least a week before use and devel- opmental stages were assigned as outlined by Kollrox and Taylor as described by Rugh (11). R. cafesbeiana adults were obtained through spontaneous metamorphosis of tadpoles in the laboratory or from the Southern Frog Company, Dumas, Arkansas; they were kept in pans of tap water in the laboratory and were fed a daily diet of flies.
Tricaine methane sulfonate anesthetic was purchased from Ayerst Laboratories, New York, N. Y. Horse spleen ferritin and the rabbit antiserum, as well as Coomassie brilliant blue, were products of Schwarz-Mann. Bovine serum albumin, ovalbumin, and cytochrome c were obtained from the Sigma Chemical Com- pany, papain from Calbiochem, and sodium dodecyl sulfate was the product of the Nutritional Biochemical Company. The Pharmacia Fine Chemicals Company supplied Sephadex G-100 and G-200, while the reagents for acrylamide gel electrophoresis
622
by guest on May 18, 2019
http://ww
w.jbc.org/
Dow
nloaded from
623
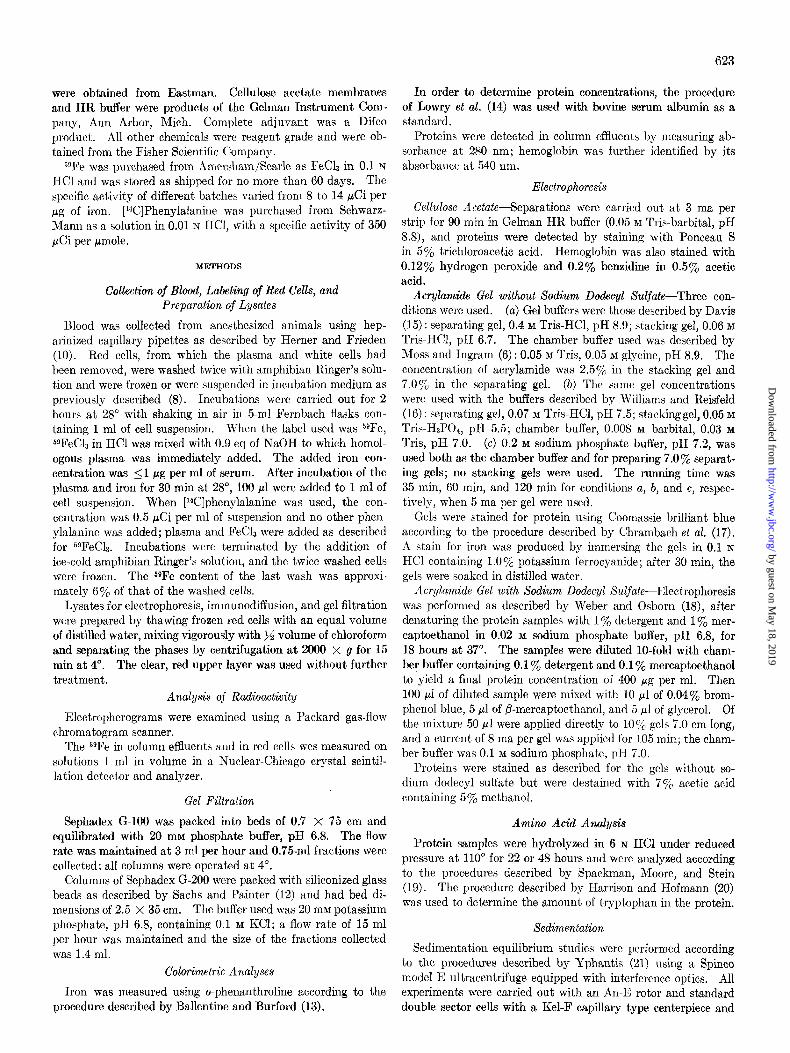
were obtained from Eastman. Cellulose acetate membranes In order to determine protein concentrations, the procedure and HR buffer were products of the Gelman Instrument Com- of Lowry et al. (14) was used with bovine serum albumin as a pany, Ann Arbor, Mich. Complete adjuvant was a Difco standard. product. All other chemicals were reagent grade and were ob- Proteins were detected in column effluents by measuring ab- tained from the Fisher Scientific Company. sorbance at 280 nm; hemoglobin was further identified by its
sgFe was purchased from hmersham/Searle as FeClz in 0.1 N absorbance at 540 nm. WC1 and was stored as shipped for no more than 60 days. The specific activity of different batches varied from 8 to 14 &i per
Electrophoresis
pg of iron. [14C]Phenylalanine was purchased from Schwarz- Cellulose Acetate-Separations were carried out at 3 ma per
Mann as a solution in 0.01 N HCI, with a specific activity of 350 strip for 90 min in Gelman HR buffer (0.05 M Tris-barbital, pH
#Zi per pmole. 8.8), and proteins were detected by staining with Ponceau S in 5% trichloroacetic acid. Hemoglobin was also stained with
METHODS 0.12% hydrogen peroxide and 0.2% benzidine in 0.5% acetic acid.
Collection of Blood, Labeling of Red Cells, and Preparation of Lysates
Blood was collected from anesthesized animals using hep- arinized capillary pipettes as described by Herner and Frieden (10). Red cells, from which the plasma and white cells had been removed, were washed twice with amphibian Ringer’s solu- tion and were frozen or were suspended in incubation medium as previously described (8). Incubat,ions were carried out for 2 hours at 28” with shaking in air in 5-ml Fernbach flasks corl- taining 1 ml of cell suspension. When the label used was BgFc, 59FeC13 in HCl was mixed with 0.9 eq of NaOH to which homol- ogous plasma was immediately added. The added iron con- centration was 21 fig per ml of serum. After incubation of the plasma and iron for 30 min at 28”, 100 ~1 were added to 1 ml of cell suspension. When [l*C]phenylalanine was used, the con- centration was 0.5 PCi per ml of suspension and no other phen- ylalanine was added; plasma and FeC13 were added as described for 5gFeCls. Incubations were terminated by the addition of ice-cold amphibian Ringer’s solution, and the twice washed cells were frozen. The 5gFe content of the last wash was approxi- mately 6a/, of that of the washed cells.
Lysates for electrophoresis, immunodiffusion, and gel filtration were prepared by thawing frozen red cells with an equal volume of distilled water, mixing vigorously with $4 volume of chloroform and separating the phases by centrifugation at 2000 x g for 15 min at 4”. The clear, red upper layer was used without further treatment.
Analysis of Radioactivity
Electropherograms were examined using a Packard gas-flow chromatogram scanner.
The sgFe in column effluents and in red cells wes measured on solutions 1 ml in volume in a Nuclear-Chicago crystal scintil- lation detector and analyzer.
AcmJlamide Gel without Sodium Dodeeyl Sulfate-Three con- ditions were used. (a) G 1 b f f e u ers were those described by Davis (15) : separating gel, 0.4 M Tris-HCI, pH 8.9; stacking gel, 0.06 M
Tris-HCl, pH 6.7. The chamber buffer used was described by Moss and Ingram (6) : 0.05 M Tris, 0.05 M glycine, pH 8.9. The concentration of acrylamide was 2.5y0 in the stacking gel and 7.0% in the separating gel. (b) The same gel concentrations were used with the buffers described by Williams and Reisfeld (16) : separating gel, 0.07 M Tris-HCl, pH 7.5; stacking gel, 0.05 M
Tris-H$O+ pH 5.5; chamber buffer, 0.008 &f barbital, 0.03 M
Tris, pH 7.0. (c) 0.2 M sodium phosphate buffer, pH 7.2, was used both as the chamber buffer and for preparing 7.0% separat- ing gels; no stacking gels were used. The running time was 35 min, 60 min, and 120 min for conditions a, b, and c, respec- tively, when 5 ma per gel were used.
Gels were stained for protein using Coomassie brilliant blue according to the procedure described by Chrambach et al. (17). A stain for iron was produced by immersing the gels in 0.1 N HCl containing 1.0% potassium ferrocyanide; after 30 min, the gels were soaked in distilled water.
Acrylamide Gel with Sodium Dodecyl Sulfate-Electrophoresis was performed as described by Weber and Osborn (18), after denaturing the protein samples with 1 y. detergent and 1 y. mer- captoethanol in 0.02 M sodium phosphate buffer, pH 6.8, for 18 hours at 37’. The samples were diluted lo-fold with cham- ber buffer containing 0.1% detergent and 0.1% mercaptoethanol to yield a final protein concentration of 400 pg per ml. Then 100 ~1 of diluted sample were mixed with 10 yl of 0.04% brom- phenol blue, 5 ~1 of /3-mercaptoethanol, and 5 ~1 of glycerol. Of the mixture 50 ~1 were applied directly to 10% gels 7.0 cm long, and a current of 8 ma per gel was applied for 105 min; the cham- ber buffer was 0.1 M sodium phosphate, p1-I 7.0.
Proteins were stained as described for the gels without so- dium dodecyl sulfate but were destained with 7% acetic acid
Gel Filtration containing 5% methanol.
Sephadex G-100 was packed into beds of 0.7 X 75 cm and Amino Acid Analysis equilibrated with 20 mM phosphate buffer, pH 6.8. The flow rate was maintained at 3 ml per hour and 0.75-ml fractions were Protein samples were hydrolyzed in 6 N HCl under reduced
collect,ed; all columns were operated at 4”. pressure at 110” for 22 or 48 hours and were analyzed according
Columns of Sephadex G-200 were packed with siliconized glass to the procedures described by Spackman, Moore, and Stein
beads as described by Sachs and Painter (12) and had bed di- (19). The procedure described by Harrison and Hofmann (20)
mensions of 2.5 x 35 cm. The buffer used was 20 mM potassium was used to determine the amount of tryptophan in the protein.
phosphate, pH 6.8, containing 0.1 ~\r KCI; a flow rate of 15 ml Xedimentation per hour was maintained and the size of the fractions collected was 1.4 ml. Sedimentation equilibrium studies were performed according
Calorimetric Analyses to the procedures described by Yphantis (21) using a Spinco model E ultracentrifuge equipped with interference optics. All
Iron was measured using o-phenanthroline according to the experiments were carried out with an An-E rotor and st,andard procedure described by Ballentine and Burford (13). double sector cells with a Kel-F capillary type centerpiece and
by guest on May 18, 2019
http://ww
w.jbc.org/
Dow
nloaded from

624
sapphire windows. The fringe patterns were recorded on Kodak II G spectrographic plates and were analyzed with a Gaertner microcomparator. In all the experiments, which were per- formed at 24”, 0.02 M potassium phosphate buffer, pH 6.8, with 0.1 M KC1 was used.
Preparation of Antiserum to Tadpole Liver Fe&in
Ta.dpole liver was used as an abundant source of ferritin for the preparation of an antiserum. Ferritin was isolated from aqueous extracts of frozen liver by precipitation with 50% (SH&SG4 followed by gel filtration on Sepharose 6B which had been equilibrated with 0.02 M potassium phosphate, pH 6.8. Those protein fractions which contained iron but no heme (judged by Aj40) were pooled and concentrated. Analysis of ferritin preparations by gel electrophoresis showed the presence of only one protein component which also stained for iron. The ab- sorption spectra of the samples were typical of ferritin. Ferrit.in was emulsified with complete adjuvant, injected int,o a young male albino rabbit, and the rabbit bled, all according to standard procedures (22). A single, Prussian blue staining precipitin band was observed Tvhen the antiserum was tested against the
antigen or the crude liver extract by double diffusion in agar.
HIGSULTS L b
Isolation of Fe&tin and Apojerritin from Tadpok Red Blood Cells-Red blood cells were collected and frozen from prrmct- amorphic tadpoles of Stages XI to XIII. In a typical prep- aration, 3.0 ml of frozen cells were used with the results shown in Table I; all steps of t.he procedure, after lysis, were performed at 4”. Fraction I consisted of a lysate prepared as described under “Methods” except that the stroma were re-extracted with 36 volume of water which was added to the lysate to increase the amount of starting material. Debris was removed by cen- trifugation at 15,000 X g for 15 min.
Ferritin in Fraction I was concentrated by sediment,ation for 2 hours at 50,000 rpm in a Spinco model L ultracentrifuge using a model 50 rotor equipped with adapters to hold 2-ml tubes. The pellet, thus obtained was dissolved in 1.0 ml of water and constituted Fraction II. At this stage of isolation, ferritin ap- peared to be about 70% pure as judged by elect.rophoresis in acrylamide gels; the main contaminant was hemoglobin.
Ferritin was further purified by applying Fraction II to a column of Sephadex G-200 equilibrated with 20 mu potassium phosphate, pH 6.8, 0.1 M KCl. Fraction III consisted of those fractions with absorbance at 280 nm and an AW:ABD 50.070 which ha,d been pooled and concentrated. Fraction III was eluted in the void volume of the column and had a high iroll content. The average iron content was 0.12 mg per mg of pro- tein but varied between 0.08 and 0.24 mg per mg of protein for various preparations. If the lysate were subjected to gel filtra.- tion before concentrating the ferritin, the ferritin isolated had a low iron content ( 10.025 mg per mg of protein).
TABLE I Isolation of ferritin from tadpole red blood cells
- Fraction’ i Protein
) mg %
I j 185 100 II i 2.30 1.2
III / 1.25 0.68
IKIll Iron to protein
m.9 % WC/w
0.61 100 0.003 0.21 34 0.091 0.17 28 0.136
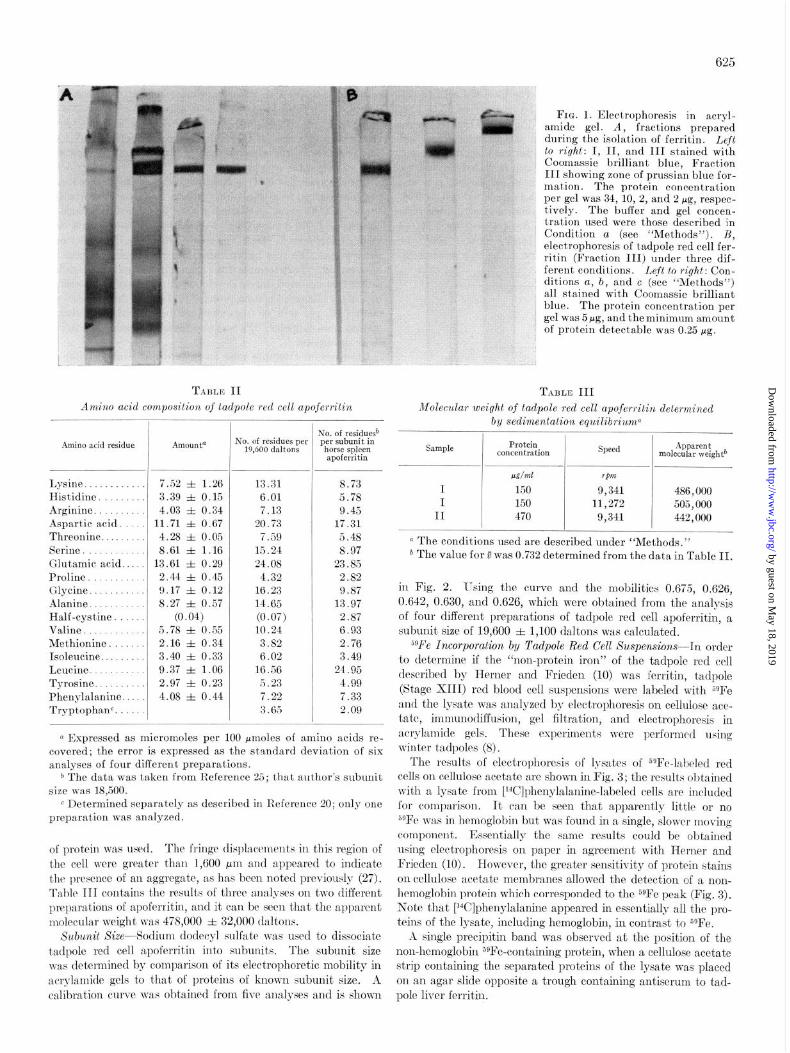
The ferritin isolated by the procedures described above was subjected to electrophoresis in acrylamide gels under three dif- ferent conditions. The results are shown in Fig. 1 and indicated the presence of one Coomassie brilliant blue staining component; the protein also stained for iron. The composition of Fractions I and II was also examined using gel electrophoresis as shown in Fig. 1.
Apoferritin was prepared by procedures similar to those de- scribed by Granick and Michaelis (23) and included exchanging the potassium ph0sphat.e buffer of Fraction III for 0.05 N so- dium acetate, pH 4.5, followed by the addition of sodium di- thionite to 3.5%. After 3 hours, under nitrogen, at room tem- perature, the iron was removed by dialysis against the same acetate buffer containing 3.57, dithionite and 0.1% cr,a’-di- pyridyl, followed by dialysis against several changes of dist,illed water. The apoferritin thus obtained had an iron content of 10.001 mg per mg of protein and an absorption spectrum typical of proteins with a peak of 280 nm. In contrast, the ferritin iso- Iated had an absorption spectrum similar to that of horse spleen ferritin (24). Apoferritin had a pattern identical with fcrritin after c?lectl,ol)horesis in acrylamide gels. These preparations were used for the studies on molecular size, subunit size, and amino acid composit~ion.
Immunological Detection oj Tadpole Fe&tin-Tadpole red cell ferritin and apoferritin were tested against arr a,ntiscrum to tad- pole liver fcrritin by tloublr diffusion in ngar. Roth proteins reacted with the antiserum; the reaction was determined to be one of identity with the antigen because no spur was det,ected when the antigen was included in t.he test. Ry contrast,, both tadpole red ccl1 ferritin and tadpole liver fcrritin precipitin bands formed spurs with t,hat of horse spleen ferritin when they were tested against horse spleen ferritin antiserum. The precilmin bands formed by all ferritins could be sta.ined for iron in contrast to that formed by apoferritin.
The minimum amount of tadpole red cell ferritin that could be detected by the antiserum to tadpoIe liver ferritin was 10.17 pg. When Fraction I was used as the antigen, the minimum amount of protein required to detect a reaction was 119 pg. Therefore, the amount of ferritin in Fraction I can be estimated to be approximat,ely 0.9% of the total protein.
rlmino Acid Composition-The results of the amino acid anal- ysis of tadpole red cell apoferritin are shown in Ta.ble 11. There was no apparent change in the composition of the hydrolyaste between 22 and 48 hours at 110”; and therefore, both sets of results were averaged. The absence of the oxidation product,s of cystine and methionine in the hydrolysates indicated that oxygen had been rffectively rcmovcd by the evacuation pro- cctlurc bofon: hydrolysis. The data in Table II reprc’scnts tho analysis of six hydrolysates prepared from four different ~m~plcs of a.pofcrritin. A recent analysis of the arnino acid composit,ion of horse spleen apoferritin reported by Crichton (25) has been included in Table II for comparison.
Molecular Size-The apparent molecular weight of tadpole red cell apoferritin was determined by sedimentation equilib- rium studies. Speeds of 9,341 and 11,272 rpm were used, and the concentration of protein ranged from 150 to 470 pg per ml. A partial specific volume was calculated from the amino acid composition (26) and was found to be 0.732. The slope of t,he line produced by plotting the log of the fringe displacement versus (dist,ance)2 was obtained both graphically and by linear regression analysis with similar results. There were no apparent deviations from linearity with the exception of three measure- me& near the bottom of the cell when the higher coucentrat,ion a Described in the text.
by guest on May 18, 2019
http://ww
w.jbc.org/
Dow
nloaded from
625
FIG. 1. Electrophoresis in acryl- amide gel. A, fractions prepared during the isolation of ferritin. Left
TABLE II TABLE III Amino acid composition oj tadpole red cell apojerritin iWolecuiar weight of tadpole red cell apojerritin determined
by sedimentation equilibriu.ma
Amino acid residue
Lysine Histidine . . Arginine. Aspartic acid. Threonine Serine Glutamic acid.. Proline. Glycine Alanine Half-cystine Valine. Methionine Isoleucine Lcucine Tyrosine. Phenylalanine.. Tryptophan”.
-
Amount”
7.52 f 1.26 3.39 * 0.15 4.03 zk 0.34
11.71 f 0.67 4.28 f 0.05 8.61 f 1.16
13.61 f 0.29 2.44 f 0.45 9.17 f 0.12 8.27 f 0.57
(0.04) 5.78 f 0.55 2.16 f 0.34 3.40 zk 0.33 9.37 f 1.06 2.97 f 0.23 4.08 f 0.44
No. of residues per 19,600 daltons
________
13.31 6.01 7.13
20.73 7.59
15.24 24.08
4.32 16.23 14.65 (0.07) 10.24 3.82 6.02
16.56 t5.23 7.22 3.65
No. of residue$ per subunit in
horse spleen apoferritin
8.73 5.78 9.45
17.31 5.48 8.97
23.85 2.82 9.87
13.97 2.87 6.93 2.76 3.49
24.95 4.99 7.33 2.09
Q Expressed as micromoles per 100 pmoles of amino acids re- covered; the error is expressed as the standard deviation of six analyses of four different preparations.
b The data was taken from Reference 25; that author’s subunit size was 18,500.
c Determined separately as described in Reference 20; only one preparation was analyzed.
of protein was used. The fringe dixplacemeuts in this region of the cell were greater than 1,600 pm and appeared to iudicate the presence of an aggregate, as has been noted previously (27). Table III contains the results of three ana,lyses on two different preparatjions of apoferritin, and it can be seen that the apparent molecular weight was 478,000 f 32,000 dalt’ons.
The results of electrophorcsis of lysntts of ““Fe-labeled red cells on ccllulosc acetate arc shown in Fig. 3; the results obtained with a lysatc from [14C]phenylalanine-labelrd cells are included for comparison. It can be seen that apparently little or no jgFe was in hemoglobin but was found in a single, slower moving component. Essentially the same results could be obtained using electrophoresis on paper in agreement with Herner and Frieden (10). However, the greater sensitivity of protein stains on cellulose acetate membranes allowed the detection of a non- hemoglobin protein which corresponded to the 5sFe peak (Fig. 3). Note that [Wlphenylalanine appeared in essentially all the pro- teins of the lysate, including hemoglobin, in contrast to SgFe.
Xubunit Xize-Sodium dodecyl sulfat)e was used to dissociate A single precipitin band was observed at the position of the tadpole red cell apoferritin into subunits. The subunit size non-hemoglobin “gFe-containing protein, when a cellulose acetate was determined by comparison of its electrophoretic mobility in strip containing the separated proteins of the lysate was placed acrylamide gels to that of proteins of known subunit size. A on an agar slide opposite a trough containing antiserum to tad- calibrxtion curve was obtained from five analyses and is shown uole liver ferritin.
to right: I, II, and III stained wiih Coomassie brilliant blue, Fraction III showing zone of prussian blue for- mation. The protein concentration per gel was 34, 10, 2, and 2 pg, respec- tively. The buffer and gel concen- tration used were those described in Condition a (see “Methods”). B, electrophoresis of tadpole red cell fer- ritin (Fraction III) under three dif- ferent conditions. Left to right: Con- ditions a, b, and c (see “Methods”) all stained with Coomassie brilliant blue. The protein concentration per gel was 5 pg, and the minimum amount of protein detect’able was 0.25 pg.
Simply Protein concentration Speed Apparent
molecular weighta ~__
MT/ml em
I 150 9,341 486,000 I 150 11,272 505,000
II 470 9,341 442,000
a The conditions used are described under “Methods.” b The value for ii was 0.732 determined from the data in Table II.
in Fig. 2. I-sing the curve and the mobilities 0.675, 0.626, 0.642, 0.630, and 0.626, which were obtained from the analysis of four different preparations of tadpole red cell apoferritin, a subunit size of 19,600 f 1,100 daltons was calculated.
5gFe Incorporation by Tadpole Red Cell Suspensions--In order to determine if the “non-protein iron” of the tadpole red cell described by Herner and Frieden (10) was ferritin, tadpole (Stage XIII) red blood cell suspensions were labeled with 5gFe and the lysate was analyzed by electrophoresis on cellulose ace- tate, immunodiffusion, gel filtration, and rlectrophoresis in acrylamidc gels. These experiments were performed using winter tadpoles (8).
by guest on May 18, 2019
http://ww
w.jbc.org/
Dow
nloaded from

626
Application of lysat.es of 59Fe-labeled tadpole red cells to col- umns of Sephadex G-100 resulted in the recovery of 85 to 95% of the radioactivity in the void volume (Fig. 4). There was essen- tially no radioactivity in the region where hemoglobin was eluted. The material isolated from the void volume of such columns consisted of an iron protein which migrated like tadpole red cell ferritin during electrophoresis in acrylamide gels and which gave a reaction of identity with tadpole red cell or liver ferritin when tested using double diffusion in agar; a cross reac- tion was obtained using horse spleen ferritin and horse spleen ferritin antiserum. The precipitin bands formed could be stained for iron. In order to determine if the 5gFe was specifi-
‘Ok-----T h 8 SERUM ALBUMIN
OVALBUMIN
PAPAIN
CYTOCHROME \ 1
I 1 I\ I 0.2 0.4 0.6 0.8 1.0
ELECTROPHORETIC MOBILITY
FIG. 2. Sodium dodecyl sulfate acrylamide gel electrophoresie of protein standards. Each point represents the average of five determinations. For the procedure used, see “Methods.”
PONCEAU S
BENZIDINE H202
ORlOIN
FIG. 3. Electrophoresis of lysates of 59Fe and [14C]phenylala- nine-labeled tadpole red cells on cellulose acetate, pH 8.9 (see “Methods”). The scan of radioactivity shows a single peak of 59Fe which corresponds to a non-hemoglobin protein band when the strip is stained with ponceau S and compared with a strip stained with benzidine-H202. [WJPhenylalanine appears in all proteins. The scan for l*C (---) is superimposed on the scan for 59Fe (+-) and the representation of the stained strips is be- low the scan; the upper strip represents staining with ponceau S and the lower strip staining with benzidine-H202.
cally incorporated into the iron protein and not nonspecifically bound, @Fe-labeled tadpole red cells were incubated for 60 mm in medium with lOO-fold excess of unlabeled iron and the lysate of the cells was analyzed by gel filtration on Sephadex G-100. The results were the same as those in Fig. 4; the 5gFe was not displaced from the iron protein.
59Fe Incorporation by Frog Red Cell Xuspensions-Red cell sus- pensions derived from adult frogs (winter or summer) or froglets (State XXIV) were incubated with jgFe-labeled homologous plasma, and the lysates were analyzed by gel filtration on col- umns of Sephadex G-100. The results, shown in Fig. 5, demon- strated that 5gFe was incorporated into hemoglobin as well as into ferritin. To determine if the change in SgFe red cell incorpo- ration that occurred during development might only be a reflec- tion of the change in plasma proteins tha.t occurs during develop- ment (28), red cells of frogs were incubated with 5gFe-labeled plasma from tadpoles; 59Fe was also found in hemoglobin under these conditions.
Unsuccessful attempts were made to demonstrate ferritiu as prussian blue staining material in lysatcs of frog red cells sub-
- 1.2 4 1.2
‘0 x 1.0 I.0 i
2 0.6 0.8 :
c 0.6 s
0.6 QI
s o* ; 0.4 0.4 1
: a
0 0.2 0.2
2 a 0.0 0.0
14 16 22 26 30 34 36
FRACTION NUMBER
FIG. 4. Gel filtration of a lysate of S9Fe-labeled tadpole red blood cells. ,4 bed of Sephadex G-100 (0.7 X 75 cm) was used (see “Methods”). The radioactivity appears as a single peak which corresponds to ferritin; there is essentially no radioactivity in the hemoglobin (&Q) peak. l - - -0, radioactivity; O--O, absorbance at 280 nm; O---O, absorbance at 540 nm.
1.4
m no 1.2
2 1.0 a
2 0.8
5 0.6
F 2 0.4
0 2 0.2
a
4 18 22 26 30 34
0.7
0.6
FRACTION NUMBER
FIG. 5. Gel filtration of a lysate of 59Fe-labeled frog and froglet (Stage XXIV) red blood cells. A bed of Sephadex G-100 (0.7 X 70 cm) was used (see “Methods”). The radioactivity appears both in ferritin and in hemoglobin; it is possible to see the peak for the hemoglobin dimer as well as the main hemoglobin peak. Compare to Fig. 4. l - - -0, radioactivity; O--O, absorbance at 280 nm; O--O, absorbance at 540 nm.
by guest on May 18, 2019
http://ww
w.jbc.org/
Dow
nloaded from

jetted to acrylamide gel electrophoresis; protein concentrations used were three times higher than that needed for tadpole red cell lysates. However, ferritin could be detected in frog red cell lysates using the antiserum to tadpole liver ferritin. The mini- mum amount of protein required was 1215 pg. Since 50.17 pg of ferritin could be detected with this antiserum, the concen- tration of ferritin in the lysate was approximately 0.08% of the total protein.
DISCUSSION
The isolation procedure described has provided enough eryth- roid cell ferritin so that the apoprotein could be characterized and compared to apoferritin from the classical source, horse spleen. Erythroid cell apoferritin is similar to horse spleen apo- ferritin in terms of molecular weight and number of subunits. The reported size of the molecule from horse spleen ranges from 440,000 to 480,000 daltons (29, 30) while that of the amphibian erythroid cell molecule was determined to be 478,000 daltons (Table III). Horse spleen apoferritin has a reported subunit size of 18,000 to 19,000 daltons (27, 30), and the number of sub- units is 23 to 25. The subunit size of amphibian erythroid apo- ferritin was determined to be 19,600 (Fig. 2), and the number of subunits appears to be approximately 24. Isolated erythroid cell ferritin had an iron content which varied from 8 to 24% with an average value of 12%. The accepted value for fully satu- rated ferritin is 20 to 23% (I), but can vary from 6 t,o 26% (31). Using a different procedure, Brown and Caston (32) isolated ferritin from frog liver with an iron content of 15%.
Proline is present in small amounts in horse spleen apoferritin (1 to 2%) ; Listowsky et al. (33) have correlated this observation with the apparently large amount of 4 helix in apoferritin. The proline content of amphibian erythroid cell apoferritin was 2.20/,, in agreement with the value for horse spleen apoferritin. A notable difference in the amino acid composition of apoferritin from horse spleen and amphibian erythroid cell is the amount of cysteine. The spleen protein has 2.9 moles per mole of subunit while the erythroid cell protein had SO.07 mole per mole of sub- unit. However, there are two other tadpole red cell proteins with little or no cysteine; hemoglobin (5-7), and an abundant non-hemoglobin protein of unknown function (8). The lack of cysteine in the apoferritin may be characteristic of t,adpole red cell apoferritin.
When lysates of 59Fe-labeled tadpole red cells were studied, it was observed that essentially all the 5gFe was in ferritin since all the radioactivity was found in a single component which be- haved like ferritin during both electrophoresis and gel filtration; the protein which corresponded to the ‘9Fe component also appeared to be immunologically identical with ferritin and gave a prussian blue stain. Therefore, the “non-protein iron” de- scribed by Herner and Frieden (10) appears to be ferritin.
It is not clear what role erythroid cell ferritin plays in cell metabolism, and there is some dispute as to whether ferritin iron is a precursor of hemoglobin or simply a reservoir for excess iron, or both (2). Ferritin is normally found associated with the im- mature erythroid cell when it is still in the marrow (2,34). How- ever, in amphibia, ferritin is relatively abundant in circulating red blood cells of the tadpole (approximately 0.9% of the soluble protein) and decreases during development so that it is not de- tectable in the circulating red cell of the adult frog except by immunological techniques (approximately 0.08 7” of the soluble nmt,ein) or with @Fe. Since high ervthroid ferritin levels are
627
found in the early stages of maturation (2, 34), tadpole red cells appear to be released into the circulation at a different stage of maturat.ion than frog red cells; this observation may be related t,o the change in the site of erythropoietic mat.uration from the tadpole liver to the frog marrow (35).
The results presented here show that suspensions of tadpole red cells can incorporate amino acids into hemoglobin (Fig. 3) without incorporating exogenous iron into hemoglobin, in con- trast to red cell suspensions of frogs and many other animals. One possible reason for the large intracellular iron pool indicated by this observation and by the large amount, of ferritin may be the fact that two serum proteins involved in iron utilization, ceruloplasmin (ferroxidase) and transferrin, are present in rela- tively small amounts in premetamorphic tadpole serum (36).
Ackrwwledgments-The study reported here was greatly aided by the technical assistance of Mrs. Susan Douthit. Drs. Evan E. Jones and James A. Knopp generously provided advice and facilities for the sedimentation studies. The author is grateful to Dr. H. Robert Horton for the use of his amino acid analyzer and to Dr. Garland 12. Pardue of the North Carolina Cooperative Fishery Unit for the use of a pond.
REFERENCFS i
1. GIlhNICIi, S. (1940) Chem. Eev. 38, 379 2. SHWP, M., TOFF, H., YAMADA, H., AND GATSUZDA, T. G. (1972)
Brit. J. Haematol. 22, 377 3. ALFREY, C. P., LYNCH, E. C., AND WHITELY, C. E. (1967) J.
Lab. C&n. Med. 70, 419 4. EYL~R, E. H., AND MATIOLI, G. (1965) Xature 208, 661 5. TRADER, C. D., AND FI~IEDEN, E. (1966) J. Biol. Chem. 241,
357 6. Moss, B., BND INGRAM, V. M. (1968) J. n!fol. Biol. 32, 481 7. AGQARWAL, S. J., AND RIGGS, A. (1969) J. Biol. Chem. 244,
2372 8. THEIL, E. C. (1967) Biochim. Biophys. Acta 138, 175 9. MANIATIS, G. M., AND INGRAM, V. M. (1971) J. Cell Biol. 49,
10. HERNER, A. E., AND FRIEDEN, E. (1961) Arch. Biochem. Bio- phys. 96, 25
11. RUGH, R. (1948) Experimental Embryology, p. 73, Burgess, Minneapolis
12. 13.
SACHS, D. H., AND PHNTER, E. (1972) Scie)lce 176, 781 BALLENTINE, R., AND BURFORD, D. D. (1957) Methods Enzymol.
3, 1017 14.
15. 16.
LOWRY, 0. H., ROSEHROUGH, N. J., FARR, A. L., AND RAN- DALL, 12. J. (1951) J. Biol. Chem. 193, 265
DAVIS, B. J. (1964) Ann. N. Y. Acad. Sri. 121, 404 WILLIAMS, D. E., AND REISFELD, R. A. (1964) Ann. IV. Y.
Acad. Sci. 121, 373 17.
18. 19.
CHRAMBACH, A., RICISFELD, R. A., WYICOFF, M., IND Z.~CIXRI, J. (1967) Anal. Riochem. 20, 150
W~x~l-,n, K., AND OSBORN, M. (19G9) J. Hiol. Chem. 244, 4406 ~PACKM~N, D. H., MOORE, S., AND STEIN, W. H. (1958) Anal.
Chem. 30, 1190 20. HARRISON, P.M., AND HOFMANN, T. (1961) Biochem. J. 80, 38~
21. YPHANTIS, II. A. (1964) Biochemistru 3. 297 22. BROWN, B. K. (1967) A&hods Enzykol: 11, 917 23. GRANICK, S., AND MICHAELIS, L. (1943) J. Biol. Chem. 147, 91 24. DRYSDALE, J. W., AND MUNRO, H. N. (1965) Biochem. J. 95,
851 25. 26.
CI~ICHTON, R. R. (1969) Biochim. Biophys. Acta 194, 34 COHN, E. J., AND EDSALL, J. (1943) Proteins, Amino Acids and
Peptides, p. 372, Rheinhold Publishing Corporation, New York
27.
28.
29.
BRYCE, C. F. A., AND CRICHTON, R. R. (1971) J. Biol. Chem. 248, 4198
HI”RNER, A. E., AND FRIEDEN, E. (1960) J. Biol. Ch.em. 235, 2845
HARRISON, P. M. (1963) J. Mol. Biol. 6, 404
380
by guest on May 18, 2019
http://ww
w.jbc.org/
Dow
nloaded from

628
30. BJORK, I., AND FISH, W. W. (1971) Biochemistry 10, 2844 34. &hTIOLI, G., .4x1) EYLAR, E. II. (1964) Proc. Nat. Acad. Sci. 31. LINDER, M., Mumo, H. N., AND MORRIS, H. P. (1970) Cancer U. S. A. 62, 508
Kes. 30, 2231 35. MANIATIS, G. M., AND INGRAM, V. M. (1971) J. Cell Biol. 49, 32. BROWN, D. D., AND CASTON, J. D. (1962) Develop. Biol. 6,445 372 33. LISTOWSKY, I., BETHXIL, J. J., AND ENGLARD, 8. (1967) Bio- 36. FRIEDEN, E., EATON, D. N., TRIPP, M. J., AND EATON, J. M.
chemistry 6, 1311 (1972) Fed. Proe. 31, 1539
by guest on May 18, 2019
http://ww
w.jbc.org/
Dow
nloaded from
Elizabeth C. TheilAmphibian Red Blood Cell Ferritin
1973, 248:622-628.J. Biol. Chem.
http://www.jbc.org/content/248/2/622Access the most updated version of this article at
Alerts:
When a correction for this article is posted•
When this article is cited•
to choose from all of JBC's e-mail alertsClick here
http://www.jbc.org/content/248/2/622.full.html#ref-list-1
This article cites 0 references, 0 of which can be accessed free at
by guest on May 18, 2019
http://ww
w.jbc.org/
Dow
nloaded from