amn healthcare investor...
TRANSCRIPT

The Innovator in Healthcare Workforce Solutions and Staffing Services
AMN Healthcare Investor PresentationQ4 2014
Forward-Looking Statements
This investor presentation contains “forward-looking statements” within the meaning of Section 27A of the Securities Act of 1933, as amended, and Section 21E of the Securities Exchange Act of 1934, as amended. The Company bases these forward-looking statements on its current beliefs, expectations, estimates, forecasts and projections about future events and the industry in which it operates. Forward-looking statements are identified by words such as “believe,” “anticipate,” “expect,” “intend,” “plan,” “will,” “should,” “would,” “project,” “may,” variations of such words and other similar expressions. In addition, statements that refer to performance; plans, objectives and strategies for future operations; and other characterizations of future events or circumstances, are forward-looking statements.
The Company’s actual results could differ materially from those discussed in, or implied by, these forward-looking statements. Factors that could cause actual results to differ from those discussed in or implied by the forward-looking statements contained in this presentation are set forth in the Company's Annual Report on Form 10-K for the year ended December 31, 2014 and its quarterly and other periodic reports, its current reports and its other filings with the SEC. Developments subsequent to this presentation are likely to cause these statements to become outdated with the passage of time. This presentation was first made publicly available at www.amnhealthcare.com on March 5, 2015.
2

Key Investor Highlights
• Market leader in healthcare staffing and physician search
• Innovator in healthcare workforce solutions: MSP, VMS, RPO, Consulting
• Recent acquisitions: Onward Healthcare, Locum Leaders, Medefis, Avantas
• Strong demand environment
• Long-term growth supported by aging population, clinical labor shortage
• Scalable, efficient operating model
• Strong cash flow and balance sheet
33
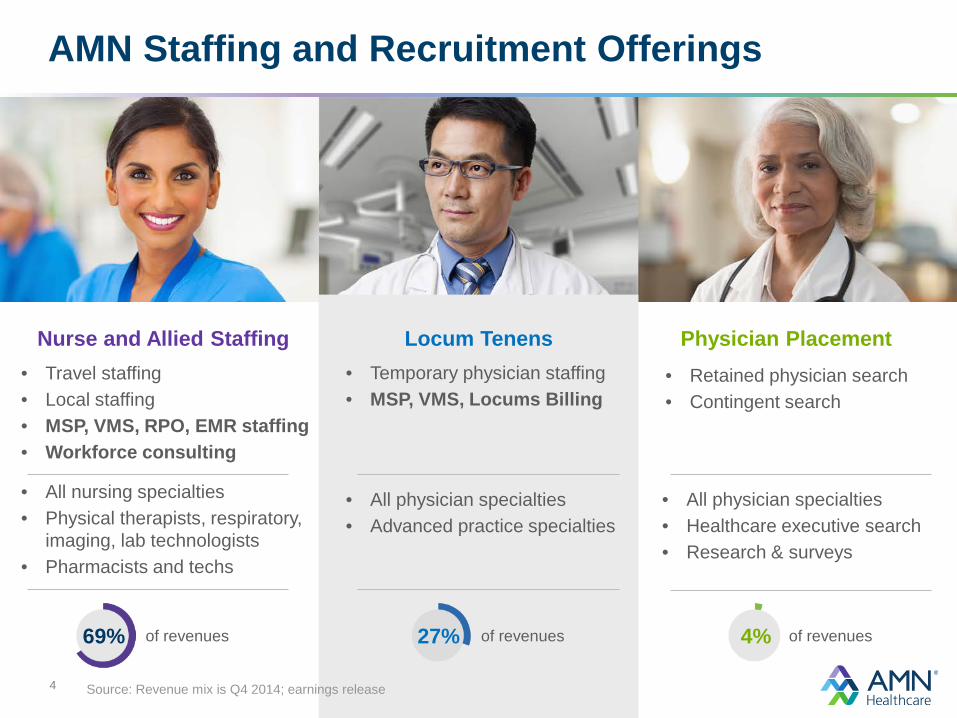
AMN Staffing and Recruitment Offerings
• All nursing specialties• Physical therapists, respiratory,
imaging, lab technologists• Pharmacists and techs
• Temporary physician staffing• MSP, VMS, Locums Billing
• Retained physician search• Contingent search
Nurse and Allied Staffing Locum Tenens Physician Placement
Source: Revenue mix is Q4 2014; earnings release
of revenues69% of revenues27% of revenues4%
• Travel staffing• Local staffing• MSP, VMS, RPO, EMR staffing• Workforce consulting
• All physician specialties• Advanced practice specialties
• All physician specialties• Healthcare executive search• Research & surveys
4
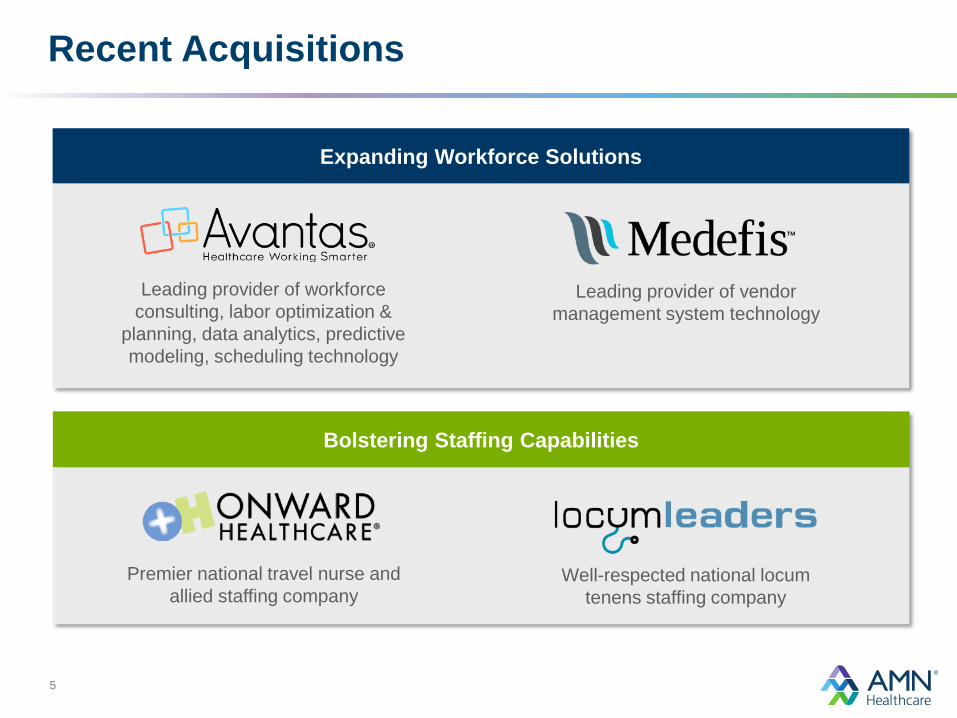
Bolstering Staffing Capabilities
Expanding Workforce Solutions
Recent Acquisitions
Premier national travel nurse and allied staffing company
Leading provider of workforce consulting, labor optimization &
planning, data analytics, predictive modeling, scheduling technology
Leading provider of vendor management system technology
Well-respected national locum tenens staffing company
5
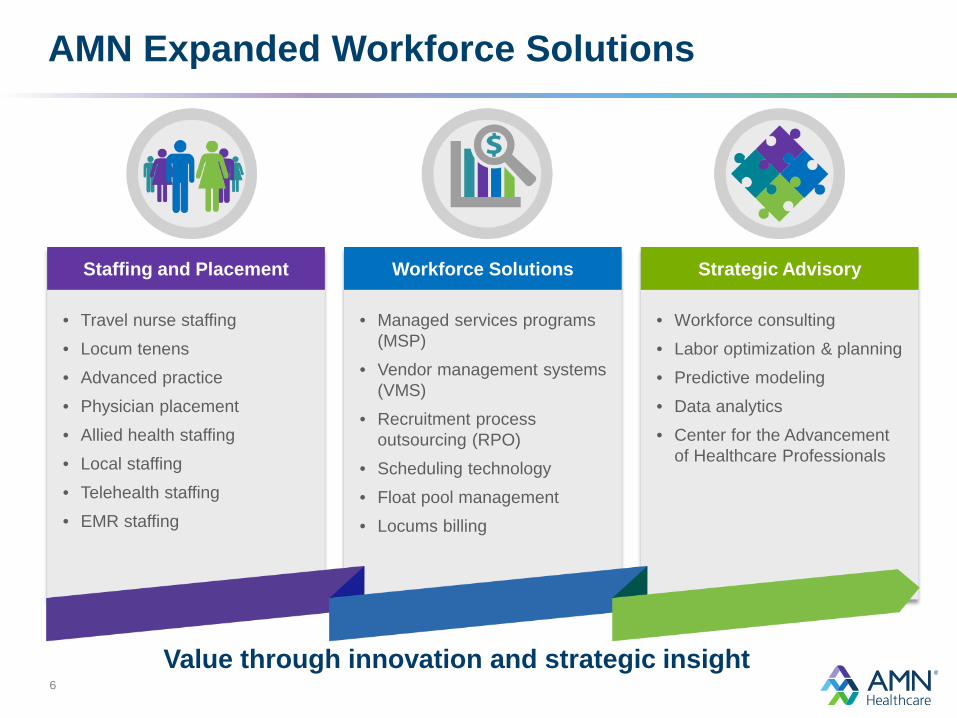
Staffing and Placement
• Travel nurse staffing
• Locum tenens
• Advanced practice
• Physician placement
• Allied health staffing
• Local staffing
• Telehealth staffing
• EMR staffing
Workforce Solutions
• Managed services programs (MSP)
• Vendor management systems (VMS)
• Recruitment process outsourcing (RPO)
• Scheduling technology
• Float pool management
• Locums billing
Strategic Advisory
• Workforce consulting
• Labor optimization & planning
• Predictive modeling
• Data analytics
• Center for the Advancement of Healthcare Professionals
AMN Expanded Workforce Solutions
Value through innovation and strategic insight6
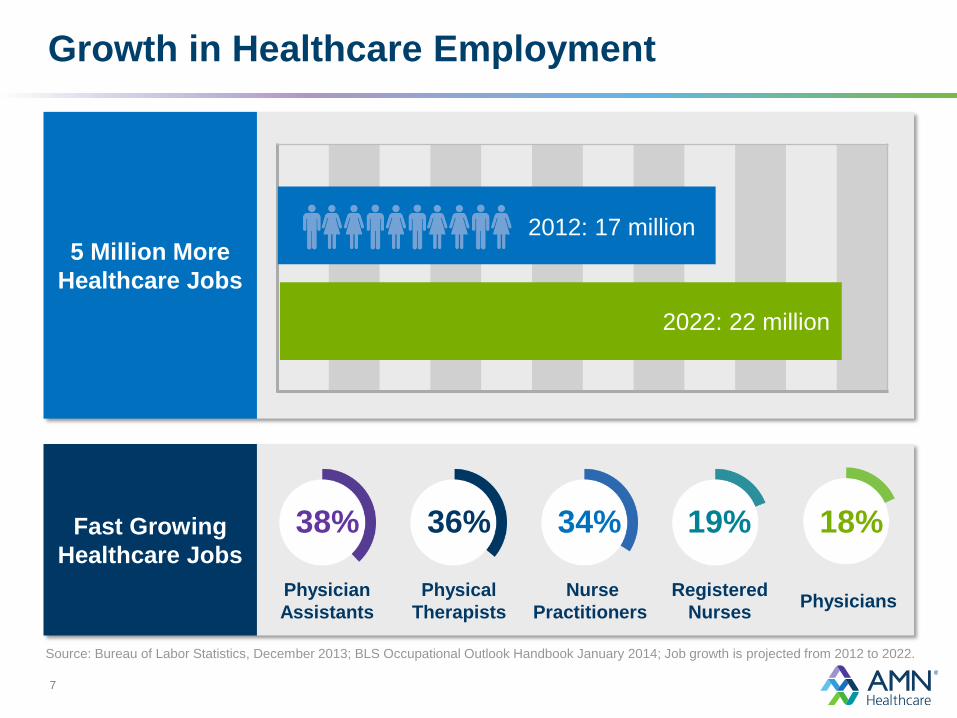
5 Million More Healthcare Jobs
Fast GrowingHealthcare Jobs
Growth in Healthcare Employment
Source: Bureau of Labor Statistics, December 2013; BLS Occupational Outlook Handbook January 2014; Job growth is projected from 2012 to 2022.
NursePractitioners
RegisteredNurses
PhysicianAssistants
PhysicalTherapists Physicians
2012: 17 million
2022: 22 million
38% 36% 34% 18%19%
7
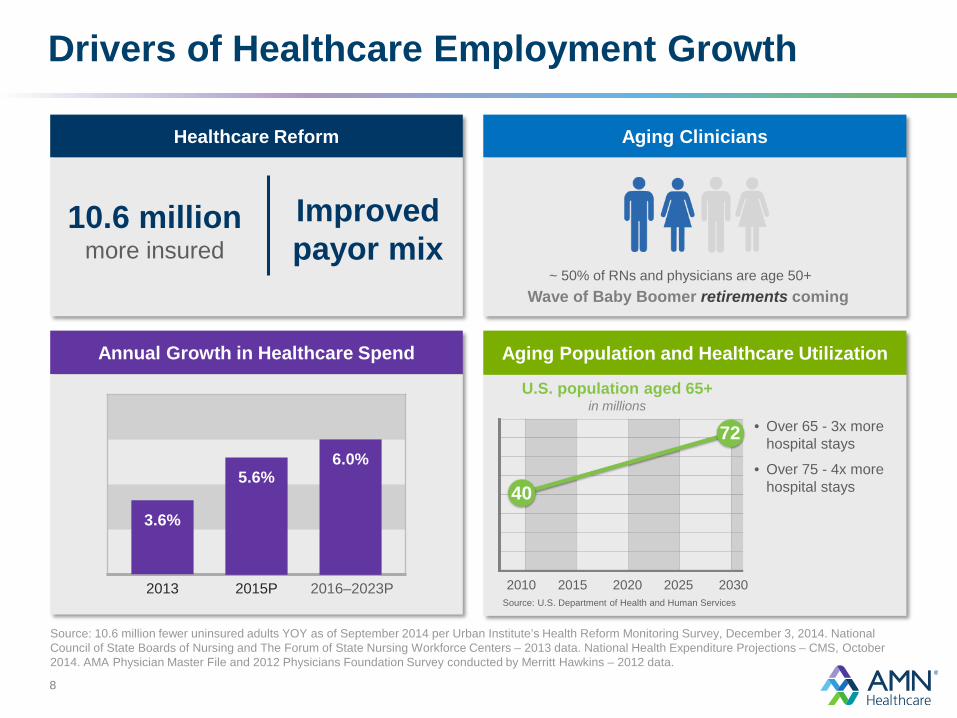
Healthcare Reform
Improvedpayor mix
10.6 millionmore insured
Aging Clinicians
Wave of Baby Boomer retirements coming~ 50% of RNs and physicians are age 50+
Annual Growth in Healthcare Spend Aging Population and Healthcare Utilization
Drivers of Healthcare Employment Growth
Source: 10.6 million fewer uninsured adults YOY as of September 2014 per Urban Institute’s Health Reform Monitoring Survey, December 3, 2014. National Council of State Boards of Nursing and The Forum of State Nursing Workforce Centers – 2013 data. National Health Expenditure Projections – CMS, October 2014. AMA Physician Master File and 2012 Physicians Foundation Survey conducted by Merritt Hawkins – 2012 data.
• Over 65 - 3x more hospital stays
• Over 75 - 4x more hospital stays
2016–2023P
3.6%
5.6%6.0%
2013 2010 2015 2020 2025 2030Source: U.S. Department of Health and Human Services
2015P
6.0%5.6%
3.6%40
72
U.S. population aged 65+in millions
8
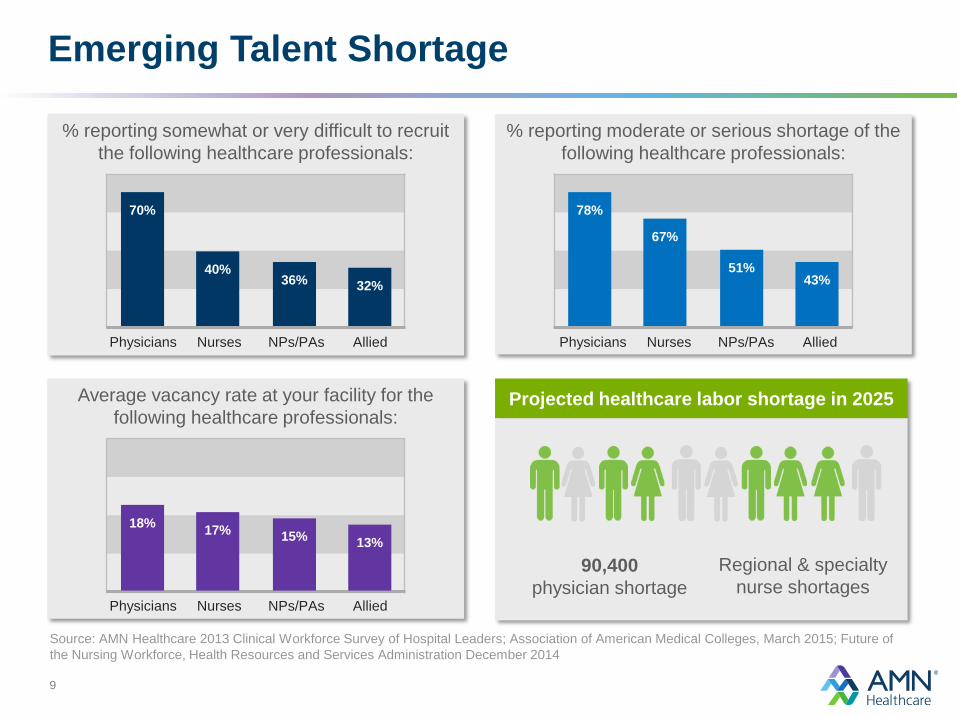
% reporting moderate or serious shortage of thefollowing healthcare professionals:
Projected healthcare labor shortage in 2025
% reporting somewhat or very difficult to recruit the following healthcare professionals:
Average vacancy rate at your facility for thefollowing healthcare professionals:
Emerging Talent Shortage
Source: AMN Healthcare 2013 Clinical Workforce Survey of Hospital Leaders; Association of American Medical Colleges, March 2015; Future of the Nursing Workforce, Health Resources and Services Administration December 2014
Physicians Nurses AlliedNPs/PAs Physicians Nurses AlliedNPs/PAs
Physicians Nurses AlliedNPs/PAs
90,400 physician shortage
18% 17% 15% 13%
78%
67%
51%43%
70%
40%36% 32%
Regional & specialty nurse shortages
9
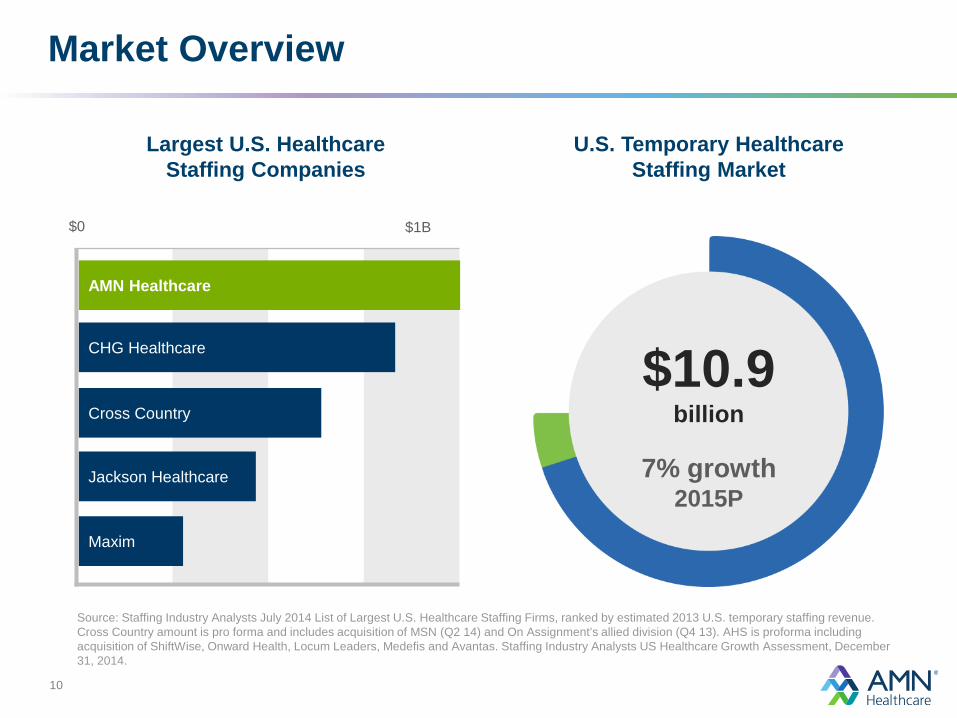
Market Overview
Largest U.S. Healthcare Staffing Companies
Source: Staffing Industry Analysts July 2014 List of Largest U.S. Healthcare Staffing Firms, ranked by estimated 2013 U.S. temporary staffing revenue. Cross Country amount is pro forma and includes acquisition of MSN (Q2 14) and On Assignment’s allied division (Q4 13). AHS is proforma including acquisition of ShiftWise, Onward Health, Locum Leaders, Medefis and Avantas. Staffing Industry Analysts US Healthcare Growth Assessment, December 31, 2014.
$1B$0
7% growth 2015P
AMN Healthcare
CHG Healthcare
Cross Country
Jackson Healthcare
Maxim
U.S. Temporary Healthcare Staffing Market
$10.9billion
10
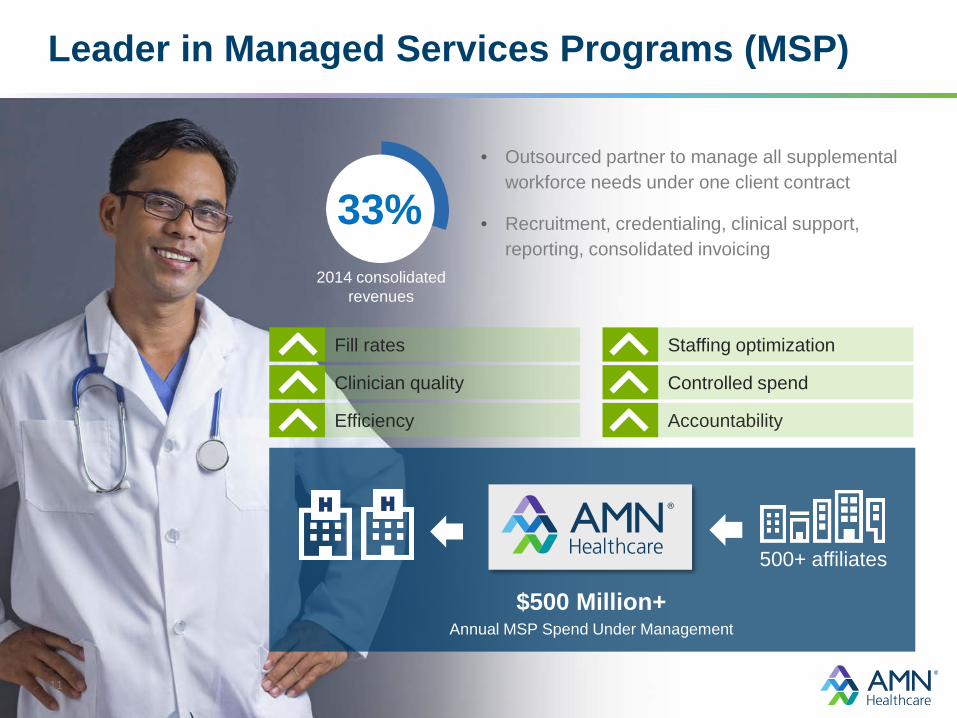
Leader in Managed Services Programs (MSP)
• Outsourced partner to manage all supplemental workforce needs under one client contract
• Recruitment, credentialing, clinical support, reporting, consolidated invoicing
2014 consolidated revenues
$500 Million+ Annual MSP Spend Under Management
33%
11
500+ affiliates
Fill rates
Clinician quality
Efficiency
Staffing optimization
Controlled spend
Accountability
11
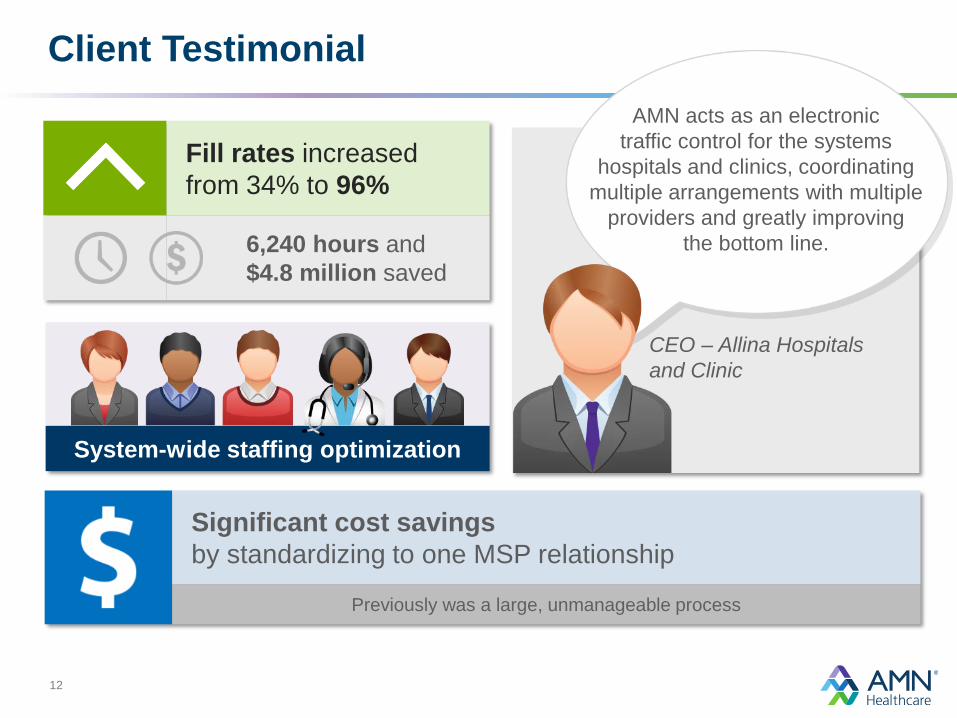
Fill rates increasedfrom 34% to 96%
Client TestimonialAMN acts as an electronic
traffic control for the systemshospitals and clinics, coordinating
multiple arrangements with multipleproviders and greatly improving
the bottom line.
CEO – Allina Hospitalsand Clinic
6,240 hours and$4.8 million saved
System-wide staffing optimization
Significant cost savingsby standardizing to one MSP relationship
Previously was a large, unmanageable process
12
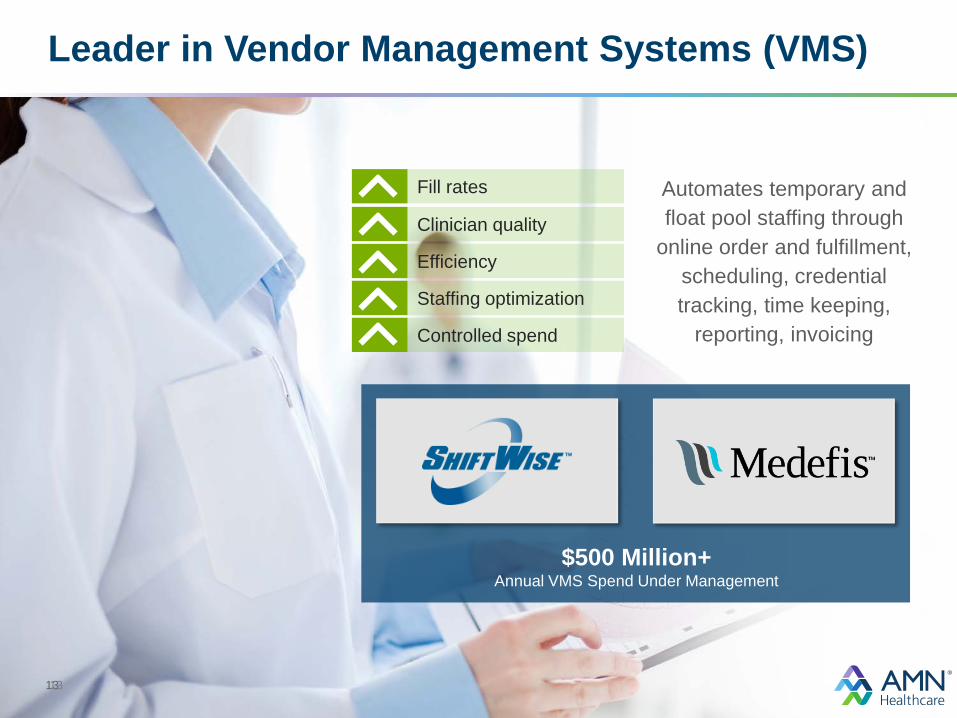
Leader in Vendor Management Systems (VMS)
Automates temporary and float pool staffing through
online order and fulfillment, scheduling, credential tracking, time keeping,
reporting, invoicing
13
Fill rates
Clinician quality
Efficiency
Staffing optimization
Controlled spend
$500 Million+ Annual VMS Spend Under Management
13
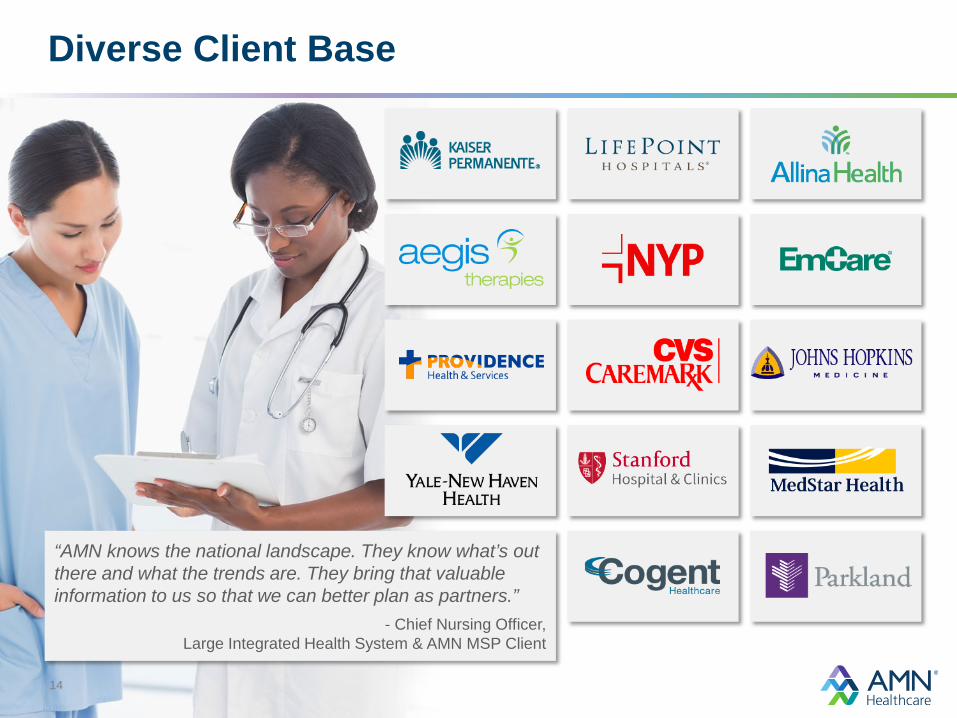
Diverse Client Base
“AMN knows the national landscape. They know what’s out there and what the trends are. They bring that valuable information to us so that we can better plan as partners.”
- Chief Nursing Officer,Large Integrated Health System & AMN MSP Client
14
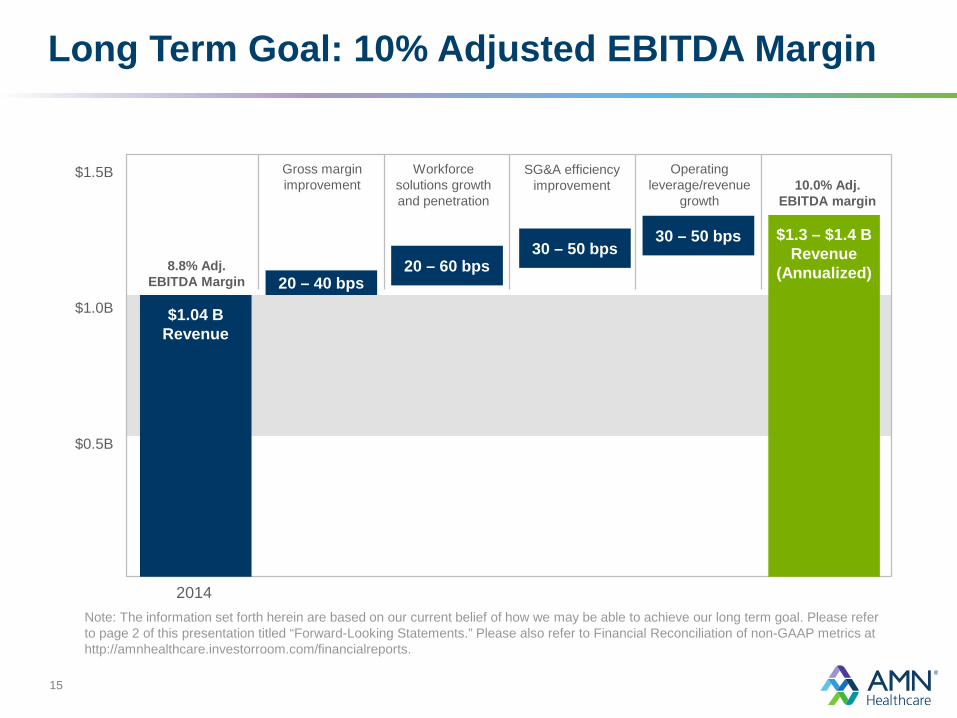
Long Term Goal: 10% Adjusted EBITDA Margin
Note: The information set forth herein are based on our current belief of how we may be able to achieve our long term goal. Please refer to page 2 of this presentation titled “Forward-Looking Statements.” Please also refer to Financial Reconciliation of non-GAAP metrics athttp://amnhealthcare.investorroom.com/financialreports.
2014
$1.04 B Revenue
20 – 40 bps
30 – 50 bps20 – 60 bps
30 – 50 bps $1.3 – $1.4 BRevenue
(Annualized)8.8% Adj.EBITDA Margin
10.0% Adj.EBITDA margin
Operatingleverage/revenue
growth
Workforcesolutions growthand penetration
SG&A efficiencyimprovement
Gross marginimprovement
$0.5B
$1.0B
$1.5B
15
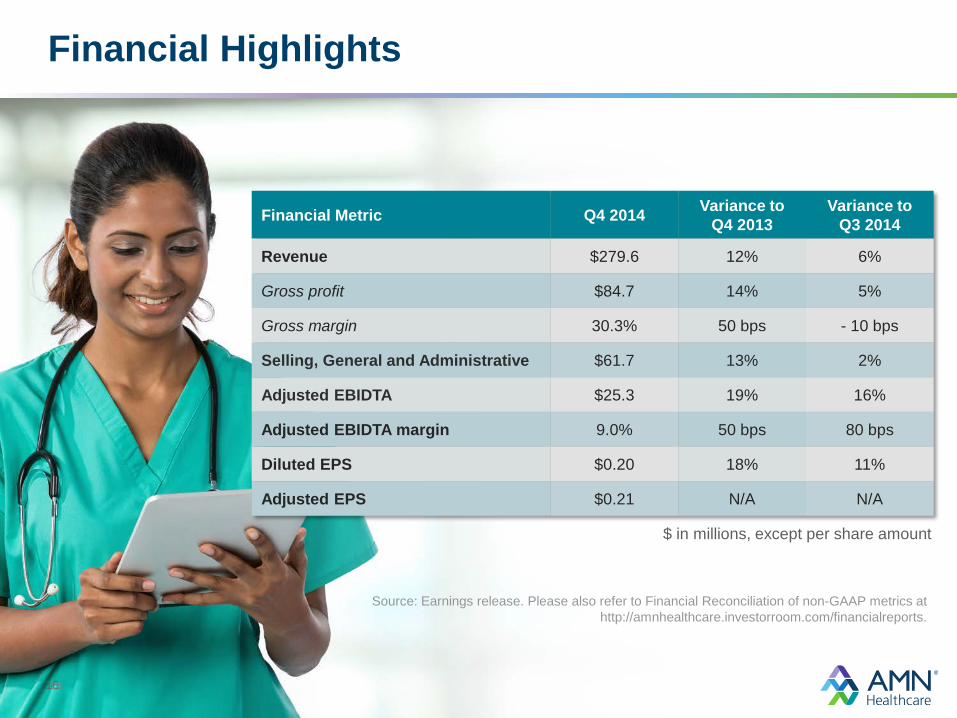
Financial Metric Q4 2014 Variance toQ4 2013
Variance toQ3 2014
Revenue $279.6 12% 6%
Gross profit $84.7 14% 5%
Gross margin 30.3% 50 bps - 10 bps
Selling, General and Administrative $61.7 13% 2%
Adjusted EBIDTA $25.3 19% 16%
Adjusted EBIDTA margin 9.0% 50 bps 80 bps
Diluted EPS $0.20 18% 11%
Adjusted EPS $0.21 N/A N/A
Financial Highlights
$ in millions, except per share amount
Source: Earnings release. Please also refer to Financial Reconciliation of non-GAAP metrics athttp://amnhealthcare.investorroom.com/financialreports.
1616
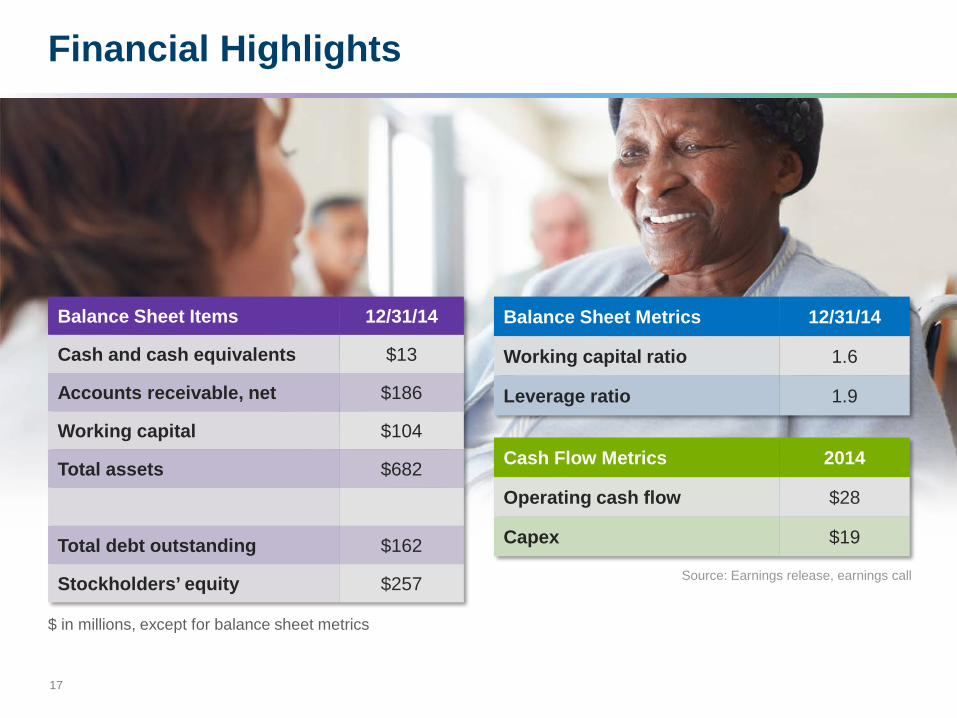
Cash Flow Metrics 2014
Operating cash flow $28
Capex $19
Balance Sheet Items 12/31/14
Cash and cash equivalents $13
Accounts receivable, net $186
Working capital $104
Total assets $682
Total debt outstanding $162
Stockholders’ equity $257
Balance Sheet Metrics 12/31/14
Working capital ratio 1.6
Leverage ratio 1.9
Financial Highlights
Source: Earnings release, earnings call
$ in millions, except for balance sheet metrics
17
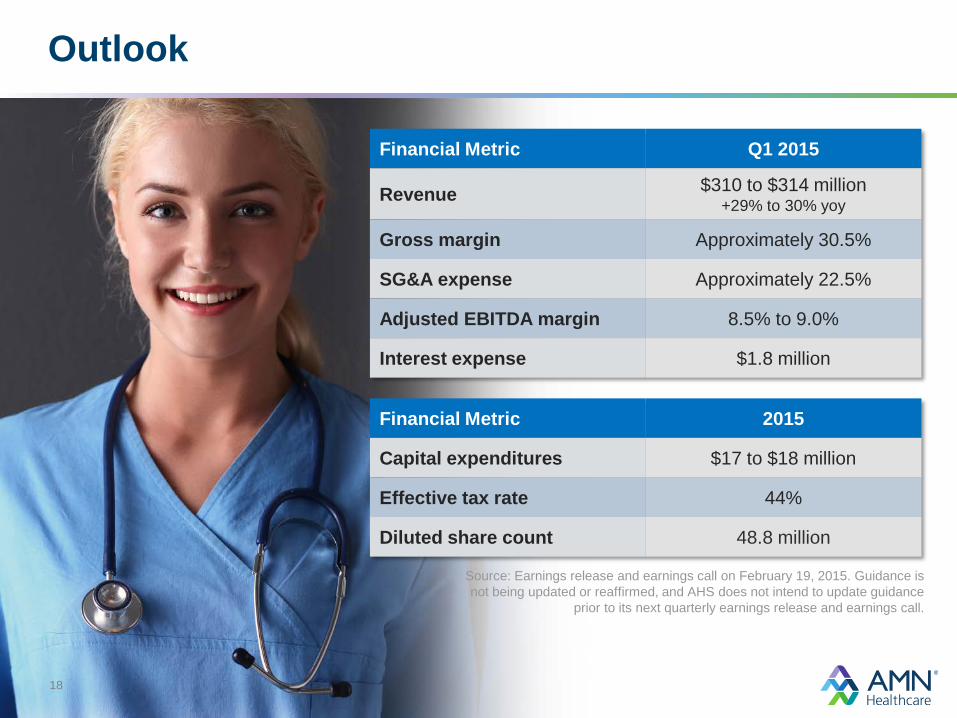
Outlook
Source: Earnings release and earnings call on February 19, 2015. Guidance is not being updated or reaffirmed, and AHS does not intend to update guidance
prior to its next quarterly earnings release and earnings call.
Financial Metric Q1 2015
Revenue $310 to $314 million+29% to 30% yoy
Gross margin Approximately 30.5%
SG&A expense Approximately 22.5%
Adjusted EBITDA margin 8.5% to 9.0%
Interest expense $1.8 million
Financial Metric 2015
Capital expenditures $17 to $18 million
Effective tax rate 44%
Diluted share count 48.8 million
18

The Innovator in Healthcare Workforce Solutions and Staffing Services
Thank You