ammoniumtolerance -...
TRANSCRIPT
AMMONIUMTOLERANCEIN LIVER DISEASE: OBSERVATIONSBASEDON CATHETERIZATION OF THE HEPATIC VEINS
BY LAURENSP. WHITE,1 ELIZABETH A. PHEAR,2 W. H. J. SUMMERSKILL,AND SHEILA SHERLOCKWITH THE TECHNICAL ASSISTANCE OF
MARJORIECOLE
(From the Department of Medicine, Post-Graduate Medical School, London, England)
(Submitted for publication June 28, 1954; accepted October 13, 1954)
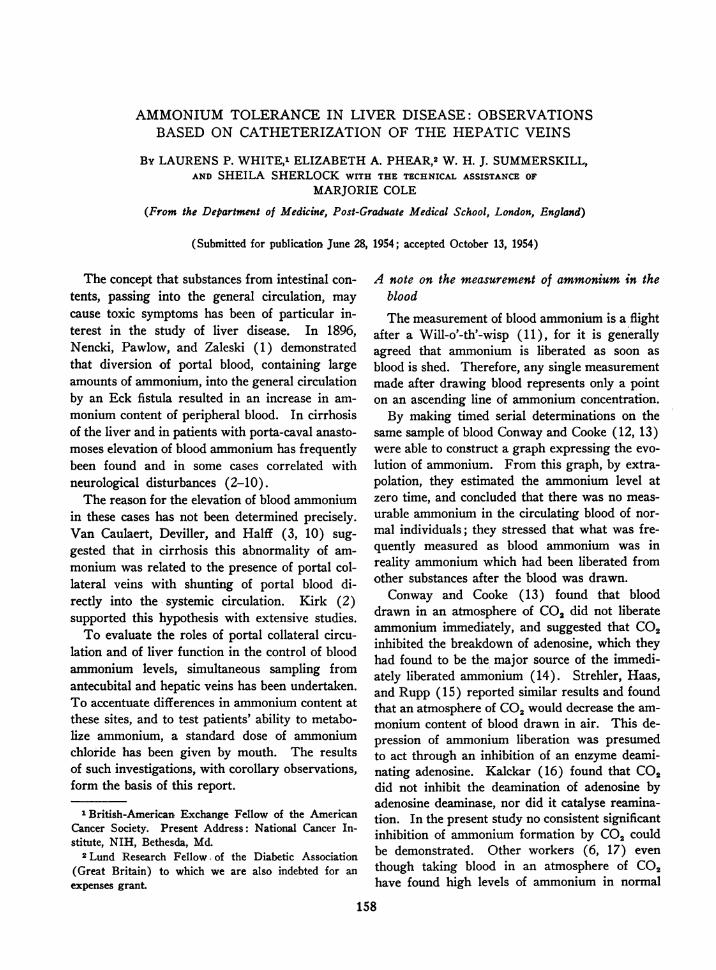
The concept that substances from intestinal con-tents, passing into the general circulation, maycause toxic symptoms has been of particular in-terest in the study of liver disease. In 1896,Nencki, Pawlow, and Zaleski (1) demonstratedthat diversion of portal blood, containing largeamounts of ammonium, into the general circulationby an Eck fistula resulted in an increase in am-monium content of peripheral blood. In cirrhosisof the liver and in patients with porta-caval anasto-moses elevation of blood ammonium has frequentlybeen found and in some cases correlated withneurological disturbances (2-10).
The reason for the elevation of blood ammoniumin these cases has not been determined precisely.Van Caulaert, Deviller, and Halff (3, 10) sug-gested that in cirrhosis this abnormality of am-monium was related to the presence of portal col-lateral veins with shunting of portal blood di-rectly into the systemic circulation. Kirk (2)supported this hypothesis with extensive studies.
To evaluate the roles of portal collateral circu-lation and of liver function in the control of bloodammonium levels, simultaneous sampling fromantecubital and hepatic veins has been undertaken.To accentuate differences in ammonium content atthese sites, and to test patients' ability to metabo-lize ammonium, a standard dose of ammoniumchloride has been given by mouth. The resultsof such investigations, with corollary observations,form the basis of this report.
1British-American. Exchange Fellow of the AmericanCancer Society. Present Address: National Cancer In-stitute, NIH, Bethesda, Md.
2Lund Research Fellow, of the Diabetic Association(Great Britain) to which we are also indebted for anexpenses grant.
A note on the measurement of ammonium in theblood
The measurement of blood ammonium is a flightafter a Will-o'-th'-wisp (11), for it is generallyagreed that ammonium is liberated as soon asblood is shed. Therefore, any single measurementmade after drawing blood represents only a pointon an ascending line of ammonium concentration.
By making timed serial determinations on thesame sample of blood Conway and Cooke (12, 13)were able to construct a graph expressing the evo-lution of ammonium. From this graph, by extra-polation, they estimated the ammonium level atzero time, and concluded that there was no meas-urable ammonium in the circulating blood of nor-mal individuals; they stressed that what was fre-quently measured as blood ammonium was inreality ammonium which had been liberated fromother substances after the blood was drawn.
Conway and Cooke (13) found that blooddrawn in an atmosphere of CO2 did not liberateammonium immediately, and suggested that CO2inhibited the breakdown of adenosine, which theyhad found to be the major source of the immedi-ately liberated ammonium (14). Strehler, Haas,and Rupp (15) reported similar results and foundthat an atmosphere of CO2would decrease the am-monium content of blood drawn in air. This de-pression of ammonium liberation was presumedto act through an inhibition of an enzyme deami-nating adenosine. Kalckar (16) found that CO2did not inhibit the deamination of adenosine byadenosine deaminase, nor did it catalyse reamina-tion. In the present study no consistent significantinhibition of ammonium formation by CO2 couldbe demonstrated. Other workers (6, 17) eventhough taking blood in an atmosphere of CO2have found high levels of ammonium in normal
158

AMMONIUMTOLERANCEIN LIVER DISEASE
blood, suggesting that CO2 failed to inhibit am-monium liberation. Wewere also unable to sup-press ammonium liberation by AgNO3 whichZittle (18) found completely inhibited adenosinedeaminase. Accordingly, in the results reportedhere blood was drawn in air, and no attempt toinhibit ammonium liberation was made.
In the present study the technique of serial am-monium determinations on the same blood samplehas been used. Each determination was timedfrom the moment of beginning the collection ofblood until an aliquot was pipetted into the diffu-sion chamber. Six analyses were made on eachsample, and a graph was constructed expressingthe changing concentration of ammonium. Theextrapolated zero-time ammonium was deter-mined, and the observations on 21 control sub-jects without hepatic disease (including 15 nor-mals) supported Conway's conclusion that in thefasting subject without liver disease there is nomeasurable free ammonium in the circulatingblood (Figure 1).
This method of performing ammonium deter-minations made it very obvious that substancesother than ammonium were being measured.The nature of these compounds is not known, al-though adenosine may be one. The present dataagain demonstrated that, whatever the sources of
.70 SccL C' 49R.H a
o*60-/P.v.
4 5.50-
*.40-
*-10-*'
0 2 345 6 7Tlime from shedding blood (minutes)
FIG. 1. DEMONSTRATION OF THE CHANGING AM-MONIUMCONTENTOF A SINGLE BLOODSPECIMEN, PLOTTEDAGAINST TIME FROM SHEDDING
This chart is representative of others in patients with-out liver disease. RHD signifies Rheumatic HeartDisease.
what was measured as ammonium, the liberationwas very rapid. Three minutes after the sheddingof blood most of the ammonium was present assuch, and repeated determinations after this timeshowed only a slow rise. Accordingly, for thepurposes of the present paper the level of am-monium three minutes after shedding of blood hasbeen taken as the ammonium content of the speci-men. This leaves the question of zero-time am-monium, and rate of liberation to a day when moreis known of the sources of blood ammonium andfactors affecting its liberation.
It is emphasized that blood ammonia is an er-roneous expression since at the pH of blood lessthan 1 per cent of ammonia is present in solu-tion as such, the largest amount being in the ion-ized NH,+ form.
METHODS
Ammonium in blood was determined by a slight modi-fication of Conway's microdiffusion technique (12).Scrupulously washed Conway units were prepared withthe central absorbing chamber containing 0.7 ml. 1/4000N HCI, with Tashiro's reagent as indicator. The outerring contained 1.0 ml. saturated boiled K,CO,. Five-tenths ml. blood was added to the outer chamber froman accurately calibrated straight pipette. The timing ofthe blood samples was started with the first appearanceof blood in the syringe, and ended when delivery fromthe pipette was completed. The lid, greased with para-ffin-mineral oil mixture was applied, the unit rotated,and then put aside to incubate for 15 minutes at 15° C.Barium hydroxide, 0.00025 N, delivered from a hori-zontal pyrex, micrometer driven burette, was used totitrate excess acid. The Ba(OH), was kept in a pyrexbottle stoppered with a soda lime trap to exclude CO*.Using this technique titrations of blanks and standardswere made with less than 2 per cent error.
After titration of bloods, and simultaneously runstandards ((NH4)2SO4 solution, 0.5 ,ug. ammonium ni-trogen per ml.) and blanks (reboiled distilled water),the calculated ammonium content of the blood was cor-rected by a factor of 1.11, given by Conway (12) tocorrect for the difference in liberation of NH, by K,CO,from blood and water. Results were then plotted againstthe recorded time intervals as ,ug. NH4.nitrogen per ml.
A check was kept on two time intervals; the first theelapsed time between drawing the blood and pipettinginto the units, and the second the fifteen-minute incuba-tion period. The latter was chosen as convenient for ourpurposes, yet well below the time when ammonium may beliberated from glutamine.
As a check on NH4Cl absorption, as well as to meas-ure the most important end product of NH, metabolism,blood urea determinations were made by a sensitive
159
L. P. WhITE, P. A. PREAR, W. SI. J. SUMMERSKILL, AND S. SHERLOCX
technique, accurate to 1 per cent (12). Blood gluta-mine measurements were made by the method of Boul-anger and Osteux (19) accurate to 10 per cent.
For the ammonium tolerance test ammonium chloride,3.0 gm. was given by mouth in gelatin capsules, and al-most invariably provoked nausea, rarely vomiting.
Blood samples were taken simultaneously from an
antecubital vein and through a catheter passed underfluoroscopic control into an hepatic vein. Specimenswere drawn during the control period and 30, 60, and120 minutes after NH4C1 ingestion. Blood was col-lected in clean dry syringes without hemostasis. Boiled,NH, free potassium oxalate was used as the anticoagu-lant, as heparin was found to liberate NH, in the Con-way unit.
Urine collections were made on 12 patients to meas-
ure NH, and urea output before and after NH,CI in-gestion. The inability to obtain adequate urine flow,especially in cirrhotic patients, vitiated the significanceof the measurements, and the effort was abandoned.
On nine occasions renal vein blood was obtained bycatheterization. Blood was also taken from abdominalwall collateral veins in two patients with cirrhosis, andfrom various portal vein radicles in four patients atlaparotomy, performed to explore the biliary system inthree and for sub-total gastrectomy in one.
PATIENTS
The patients were divided by diagnosis into severalgroups.
I. No liver disease, 11 cases. These were hospitalstaff, 5, and patients suffering from chronic pulmonaryor cardiac disease, who had normal liver function tests.They were studied at the time of cardiac catheterizationfor other purposes.
II. Acute vtirus hepatitis, 6 cases. This included bothmild and severe cases. Two were again investigatedduring convalescence.
III. Cirrhosis, 26 patients. No distinction was made inthis group between biliary cirrhosis (3 cases) and portalcirrhosis (23 cases). All of these patients had definiteevidence of portal collateral vessels, demonstrated bycontrast radiography, esophagoscopy, and/or portal venog-raphy (20). Three other patients who had cirrhosiswithout demonstrable portal collateral vessels were alsostudied.
IV. Miscellaneous, 8 cases. This diverse group in-cluded two with obstructive jaundice due to carcinoma,two with nephritis (one of whom was uremic), two withhepatosplenomegaly and normal liver function tests, one
of whom had a normal liver biopsy. The other had ab-dominal tuberculosis. One patient presented the Chiarisyndrome with invasion of the inferior vena cava andhepatic veins by renal carcinoma. One patient had a
thrombosed portal vein following pylephlebitis, withesophageal varices and a normal liver by biopsy andfunction tests.
One patient with cirrhosis and two with normal liverfunction received no NHICI, but had serial determinations
of blood ammonium throughout the day while fasting toinvestigate diurnal variation.
The neurological signs and symptoms associated withliver disease have been extensively reviewed and are notdescribed here. Of the patients investigated ten had sachneurological changes associated with hepatitis or cirrhosisand are fully described elsewhere (9).
RESULTS
The mean "three-minute" fasting blood am-monium value in 21 control patients without liverdisease was 0.79 ,ug. per ml., Standard Deviation0.09.
In two patients with renal disease and normalliver function tests and one patient with cirrhosisand esophageal varices, one-half to two hourlyblood samples were taken throughout the daywhile the patient fasted, and the fluctuation ofammonium levels was found not to exceed 0.1 ,ug.per ml. in antecubital or hepatic vein blood.
In seven resting control subjects simultaneousartery and vein blood samples were obtained froman extremity, and no significant difference in am-monium content at these two sites was observed.Other workers have reported similar results (21,22).
In five patients the values for portal venousblood ammonium, obtained at laparotomy or fromabdominal wall collaterals, averaged 2.7 timesthose for peripheral blood (Table I). In a fur-ther patient (Ru) blood from a gastric vein was
TABLE I
Ammoniumcontent of portal vein blood, with comparison ofperipheral vein ammonium level, before and
after NH4C7ingestion *
Portal PeripheralPatient Diagnosis vein vein
Br Cirrhosis 2.65 1.12To Cirrhosis 2.75 1.04Ne Cirrhosis 4.27 1.06Me Cirrhosis with
Eck fistula 4.39 2.53Sw Cirrhosis 3.67 0.89
Average 3.55 1.33Ru Carcinoma
(Blood fromgastric vein) 0.58
After 3.0 gm. NHjCl by mouthTo Control 2.26 1.04
60 minutes 6.48 2.75
Ne Control 4.27 1.0760 minutes 6.83 1.52
* Ammoniumexpressed as ,ug. NH- Nitrogen per ml.
16O
AMMONIUMTOLERANCEIN LIVER DISEASE
TABLE II
Ammoniumcontent of renal vein blood, with comparisonof peripheral vein ammonium level *
Renal PeripheralPatient Diagnosis vein vein
Th Tuberculosis 1.01 0.51Me Cirrhosis 1.21 0.79Pe Cirrhosis 1.35 0.99Da Cirrhosis 1.42 0.94Me Cirrhosis with
Eck fistula 1.42 2.03Ea Cirrhosis 3.10 2.22El Cirrhosis 2.87 2.21Sw Cirrhosis 0.71 0.81Au Hepatitis 3.07 1.96
Average 1.82 1.39
* Expressed as pg. NH4* Nitrogen per ml.
found'to have a low NH4 content. NH4C1 givenby mouth to two patients with abdominal wallportal collaterals caused a rise in ammonium inperipheral vein blood, as well as in the portalcollateral. In the latter the rise was to a higherabsolute level, but in terms of per cent was notgreatly different (Table I).
In nine patients (eight with liver disease, onewith normal function tests) renal vein ammoniumvalues averaged 30 per cent higher than peripheralvein (Table II). The height of the values wasexaggerated because of the inclusion of patientswith severe liver disease. Two patients with liver
3.00-
2.002
1.00-
- Normal. 11 cases--- Hepatitis, 5 cases
0,~
e.
O.../ Pv
H.v.
0 30 60 90 120Minutes after oral NH4CL.
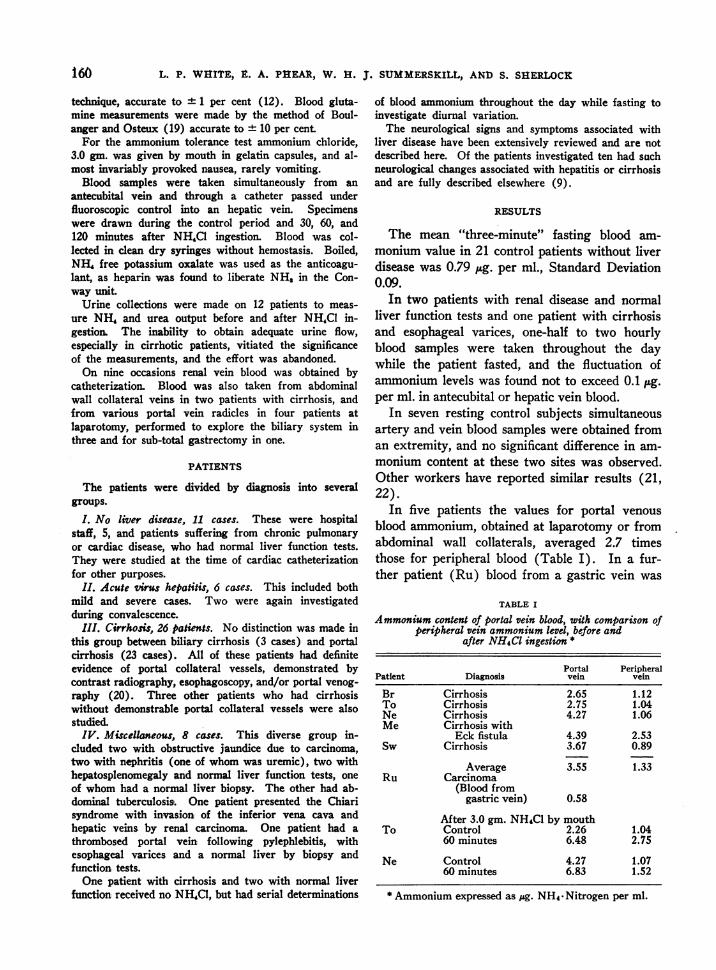
FIG. 2. AMMONIUMTOLERANCETESTS, 3.0 gm. NH4aCBY MOUTH, COMPARINGCONTROLPATIENTS (NoRMALs)WITH PATIENTS WITH HEPATITIS
P.V.-peripheral vein H.V.-hepatic vein.
disease had values in the renal vein lower than inperipheral vein blood. In one of these the periph-eral vein ammonium was abnormally high.
Ammonium tolerance tests
Controls. In eleven control subjects the meanvalue of ammonium in peripheral vein blood wasslightly above that of the hepatic vein. After theingestion of NH4C1 the ammonium content ofperipheral vein blood rose moderately with arapid subsequent decline. The hepatic vein levelrose more slowly, and continued to rise for alonger period. Both returned to control levels
- Normal. II cases-- Cirrhosis. 26 cases
'-".,
0 3O 60 90 120Minutes after oral NH4CL.
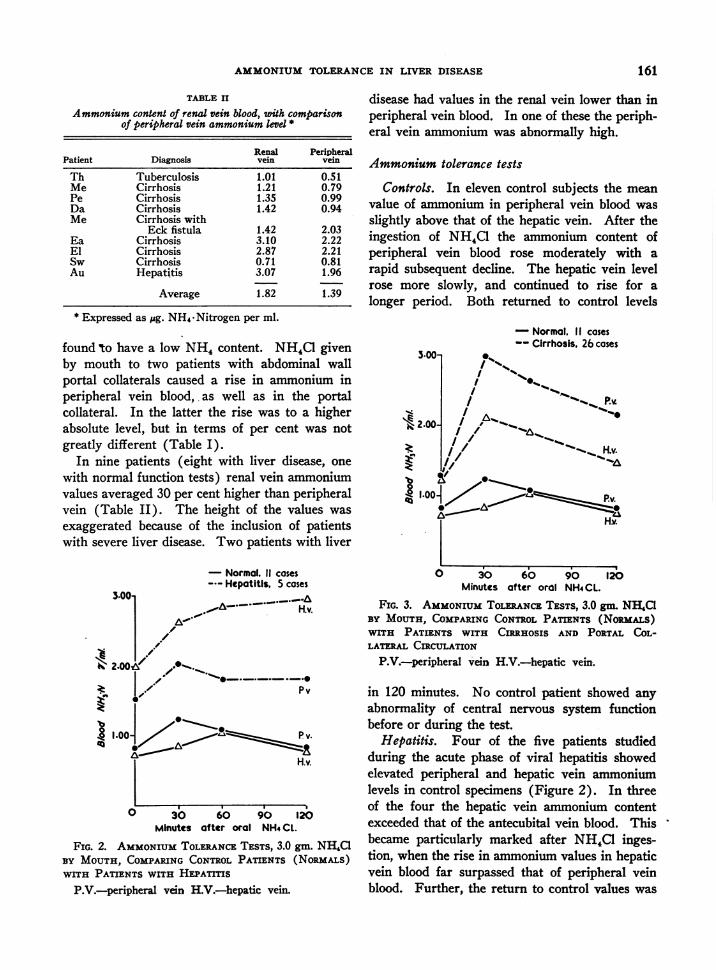
FIG. 3. AMMONIUMTOLERANCETESTS, 3.0 gm. NH,C1BY MOUTH, COMPARINGCONTROLPATIENTS (NoRIALs)WITH PATIENTS WITH CtRnHOSIS AND PORTAL COL-LATERAL CIRCULATION
P.V.-peripheral vaein H.V.-hepatic vein.
in 120 minutes. No control patient showed anyabnormality of central nervous system functionbefore or during the test.
Hepatitis. Four of the five patients studiedduring the acute phase of viral hepatitis showedelevated peripheral and hepatic vein ammoniumlevels in control specimens (Figure 2). In threeof the four the hepatic vein ammonium contentexceeded that of the antecubital vein blood. Thisbecame particularly marked after NH,C1 inges-tion, when the rise in ammonium values in hepaticvein blood far surpassed that of peripheral veinblood. Further, the return to control values was
161

L. P. WHITE, E. A. PHEAR, W. H. J. SUMMERSKILL, AND S. SHERLOCK
delayed, and ammonium levels were above con- hepatitis, whose only abnormal liver function testtrol at 120 minutes in both peripheral and hepatic was an elevated bilirubin, but who had biopsyvein blood. The one real exception to these find- evidence of hepatitis. These data suggestedings was in a patient with mild, though acute that in patients with severe hepatitis ammonium
TABLE III
Ammoniumtolerance tests in 51 patients. 3.0 gm. NH4Cl by mouth t3jPeripheral vein Hepatic vein
Patient Zero 30 60 120 min. Zero 30 60 120 min.
Controls0.81 0.86 1.00 0.650.75 0.87 0.87 0.800.81 1.37 1.91 1.260.90 1.37 0.98 0.360.86 0.84 1.09 0.900.83 1.93 1.09 0.670.78 1.07 0.79 0.770.95 1.69 0.67 0.790.650.89 1.37 1.44 0.880.86 1.04 1.10 1.25
0.82 1.24 1.09 0.83
Hepatitis
1.021.251.961.032.36
2.84 2.81 2.451.40
1.42 1.25 1.19
1.52 2.13 1.82 1.82
0.60 0.80 1.00 0.56
0.89 0.75 1.42 0.87
0.87 0.52 0.75 0.760.72 1.12 0.63 0.670.62
0.69 1.00 1.52 1.07
0.73 0.84 1.06 0.78
1.33 4.43 5.36 4.481.25 2.552.570.87 0.81 0.65 1.483.80
1.96 2.62 2.85 2.98
0.91 0.91 0.91 1.130.49 0.88 0.85 0.18
1.051.551.182.221.422.211.991.350.730.680.771.641.041.391.561.070.991.330.841.120.890.942.031.020.961.02
Cirrhosis with portal collateral veins3.02 2.87 1.63 0.92 1.07 1.22 0.923.66 3.63 3.153.65 4.60 2.62 0.97 2.06 2.16 2.00
1.754.66 5.14 4.00
3.312.70 3.06 2.30 1.60 1.11 1.58 0.561.98 2.00 0.961.77 1.28 0.98 1.08 2.28 2.23 2.492.62 1.60 0.80 0.64 2.25 1.48 0.902.02 1.58 1.28 0.89 1.00 0.99 0.502.43 2.93 3.33
2.755.51 4.90 3.24 0.71 2.55 1.60 1.066.72 3.66 3.10 1.20 2.84 1.66 1.51
1.521.79 2.19 1.69 0.87 1.12 1.47 1.383.46 2.98 3.021.831.95 1.94 1.46 1.05 2.28 2.29 1.641.28 1.40 1.42 0.95 1.31 1.35 1.412.39 2.26 2.162.53 1.82 2.003.54 3.86 2.412.19 2.26 2.45 1.43 2.76 2.84 2.813.64 2.29 1.62 1.38 4.96 4.20 3.06
1.25 2.12 1.93 1.48
SmWhLeHyFePaCePuMcSuWa
Average
AcuteAl*LoAu*PaHa
Average
ConvalescentOFAu
ShLi*BrEl*Li*EaSi*SoWeFeBreTo*To*Be*We*NePeHaStLiSwDaMeMuMuCa
Average
162
1.27 2.97 2.63 2.17

AMMONIUMTOLERANCEIN LIVER DISEASE
TABLE III-Continued
Peripheral vein Hepatic vein
Patient Zero 30 60 120 min. Zero 30 60 120 min.
MiscellaneousObstructive jaundice
Pu 1.28 1.54 1.05 1.01 0.58 0.72 0.91 0.81Cr 1.17 1.73 1.98 0.79 0.62 1.05 0.95 0.70
NephritisCa 0.93 1.00 0.86 0.81Ba 1.10 0.81 0.73 1.24
(Uremia)Hepatosplenomegaly
Sk 0.57 1.25 0.65 1.15Th 0.51 0.90 0.80 0.64 0.40 0.75 0.76 0.60
Chiari syndromeHo* 1.52 3.50
Thrombosis, portal vein;esophageal varices
Ha 1.08 1.44 0.94 1.05 0.80 0.86 1.04 0.96
t Expressed as micrograms NH4.-Nitrogen per ml.$ All averages were first calculated excluding data where there were not simultaneous peripheral and hepatic vein
samples. As this is a result almost identical to that obtained from averaging all the data, the latter averages havebeen given.
* These patients had neurological disturbances at some time during the course of their illnesses.
from the intestine passed through the damagedliver and so reached the systemic circulation.
One patient developed a tremor after the in-gestion of NH,C1 and this symptom persisted forthree days.
Two patients in the convalescent stage of hepa-titis, with normal liver function tests were foundto have normal ammonium tolerance curves inperipheral blood.
Cirrhosis. The 26 patients who had cirrhosisand portal vein collateral circulation had higheraverage NH4 values in peripheral and hepaticvein blood in the fasting state than did controlsubjects (Figure 3, Table III). After ingestionof NH4Cl the ammonium content of peripheralvein blood rose to a very high level at 30 minutes,far exceeding the average concomitant rise inNH4 values in hepatic vein blood. Both fell ata rate equal to that of controls, but both weresignificantly above fasting values at 120 minutes.The vast increase in NH, content of peripheralvein blood could. not be accounted for, in these pa-tients, by ammonium in the hepatic vein blood, andlarge amounts must have reached the peripheralblood by portal collateral channels.
Four of these patients were studied at a timewhen tremor and mental confusion were present;during the test their symptoms were exaggerated.
Three patients with cirrhosis who did not have
demonstrable portal collateral veins, had normalammonium tolerance tests in peripheral and he-patic vein blood.
Despite the striking differences between pa-tients with cirrhosis and portal venous collateralsand patients with hepatitis, individual cases showedsome variations. In one patient with cirrhosis,large portal collateral veins and excellent liverfunction by standard tests, the ammonium con-tent of peripheral blood rose to high levels afterNH4Cl ingestion; NH4 values in hepatic veinblood increased only slightly and were below the
Bre. 9 44- Cirrhosis
30 60 90 120Minutes after oral NH4CLI
FIG. 4. AMMONIUMTOLERANCETEST, 3.0 gm. NH4aBY MOUTH, IN A SINGLE PATIENT WITH CnHOSIS,ESOPHAGEALVARICES AND GOODLivER FUNCTION
P.Vi.-peripheral vein H.V.-hepatic vein.
163
L. P. WHITE, E. A. PHEAR, W. H. J. SUMMERSKILL, AND S. SHERLOCK
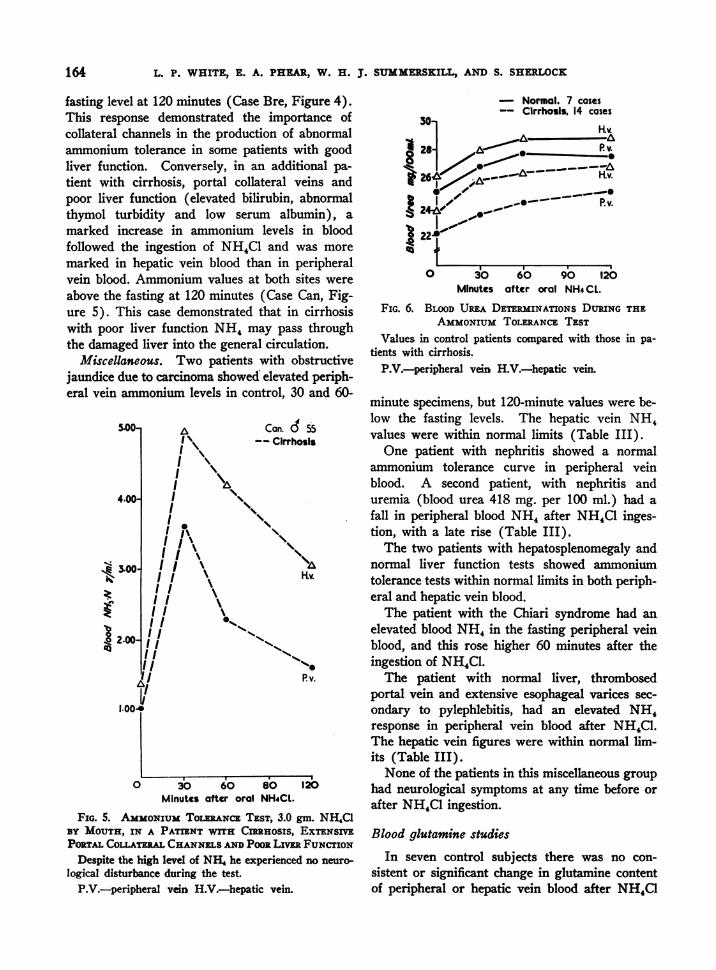
fasting level at 120 minutes (Case Bre, Figure 4).This response demonstrated the importance ofcollateral channels in the production of abnormalammonium tolerance in some patients with goodliver function. Conversely, in an additional pa-tient with cirrhosis, portal collateral veins andpoor liver function (elevated bilirubin, abnormalthymol turbidity and low serum albumin), amarked increase in ammonium levels in bloodfollowed the ingestion of NH4C1 and was moremarked in hepatic vein blood than in peripheralvein blood. Ammonium values at both sites wereabove the fasting at 120 minutes (Case Can, Fig-ure 5). This case demonstrated that in cirrhosiswith poor liver function NH4 may pass throughthe damaged liver into the general circulation.
Miscellaneous. Two patients with obstructivejaundice due to carcinoma showed elevated periph-eral vein ammonium levels in control, 30 and 60-
5.00-
4.00-
Z-1:
t 2.00-
1.004
A Cc
I \~I
II
II
I
on. d 55
Cirrhosls
1 N\I, \'
I I I-tv.I I
II
/III I11 ""s1I I
I11% '1.'I 04
II Pv.
*1
0 30 60 80 120Minutes after oral NH4CL.
FIG. 5. AMMONIUMTOLERANCETEST, 3.0 gm. NH4C1BY MOUTH, IN A PATIENT WITH CIRRHOSIS, EXTENSIVEPORTALCOLATMwLCHANNELSANDPooR LimE FUNCTION
Despite the high level of NHI he experienced no neuro-
logical disturbance during the test.
P.V.-peripheral vein H.V.-hepatic vein.
A
I
- Normal. 7 cases-- Cirrhosis. 14 cases
0 3O 60 90 120Minutes after oral NH4CL.
FIG. 6. BLOODUREA DETERMINATIONS DURING THEAMMONIUMTOLERANCETEST
Values in control patients compared with those in pa-tients with cirrhosis.
P.V.-peripheral vein H.V.-hepatic vein.
minute specimens, but 120-minute values were be-low the fasting levels. The hepatic vein NH4values were within normal limits (Table III).
One patient with nephritis showed a normalammonium tolerance curve in peripheral veinblood. A second patient, with nephritis anduremia (blood urea 418 mg. per 100 ml.) had afall in peripheral blood NH, after NH4C1 inges-tion, with a late rise (Table III).
The two patients with hepatosplenomegaly andnormal liver function tests showed ammoniumtolerance tests within normal limits in both periph-eral and hepatic vein blood.
The patient with the Chiari syndrome had anelevated blood NH4 in the fasting peripheral veinblood, and this rose higher 60 minutes after theingestion of NH4Cl.
The patient with normal liver, thrombosedportal vein and extensive esophageal varices sec-ondary to pylephlebitis, had an elevated NH4response in peripheral vein blood after NH4Cl.The hepatic vein figures were within normal lim-its (Table III).
None of the patients in this miscellaneous grouphad neurological symptoms at any time before orafter NH4C1 ingestion.
Blood glutamine studies
In seven control subjects there was no con-sistent or significant change in glutamine contentof peripheral or hepatic vein blood after NH4C1
164
165AMMONIUMTOLERANCEIN LIVER DISEASE
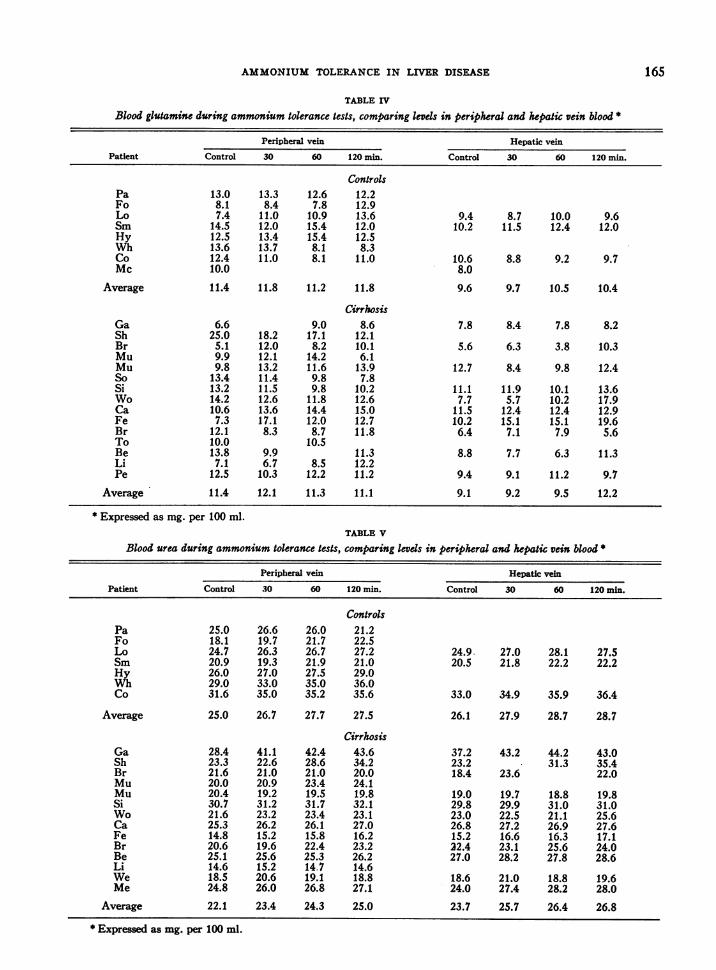
TABLE IV
Blood glutamine during ammonium tolerance tests, comparing levels in peripheral and hepatic vein blood *
Peripheral vein Hepatic vein
Patient Control 30 60 120 min. Control 30 60 120 min.
ControlsPa 13.0 13.3 12.6 12.2Fo 8.1 8.4 7.8 12.9Lo 7.4 11.0 10.9 13.6 9.4 8.7 10.0 9.6Sm 14.5 12.0 15.4 12.0 10.2 11.5 12.4 12.0Hy 12.5 13.4 15.4 12.5Wh 13.6 13.7 8.1 8.3Co 12.4 11.0 8.1 11.0 10.6 8.8 9.2 9.7Mc 10.0 8.0
Average 11.4 11.8 11.2 11.8 9.6 9.7 10.5 10.4
CirrhosisGa 6.6 9.0 8.6 7.8 8.4 7.8 8.2Sh 25.0 18.2 17.1 12.1Br 5.1 12.0 8.2 10.1 5.6 6.3 3.8 10.3Mu 9.9 12.1 14.2 6.1Mu 9.8 13.2 11.6 13.9 12.7 8.4 9.8 12.4So 13.4 11.4 9.8 7.8Si 13.2 11.5 9.8 10.2 11.1 11.9 10.1 13.6Wo 14.2 12.6 11.8 12.6 7.7 5.7 10.2 17.9Ca 10.6 13.6 14.4 15.0 11.5 12.4 12.4 12.9Fe 7.3 17.1 12.0 12.7 10.2 15.1 15.1 19.6Br 12.1 8.3 8.7 11.8 6.4 7.1 7.9 5.6To 10.0 10.5Be 13.8 9.9 11.3 8.8 7.7 6.3 11.3Li 7.1 6.7 8.5 12.2Pe 12.5 10.3 12.2 11.2 9.4 9.1 11.2 9.7
Average 11.4 12.1 11.3 11.1 9.1 9.2 9.5 12.2
* Expressed as mg. per 100 ml.TABLE V
Blood urea during ammonium tolerance tests, comparing levds in peripheral and hepatic vein blood *
Peripheral vein Hepatic veinPatient Control 30 60 120 min. Control 30 60 120 min.
ControlsPa 25.0 26.6 26.0 21.2Fo 18.1 19.7 21.7 22.5Lo 24.7 26.3 26.7 27.2 24.9. 27.0 28.1 27.5Sm 20.9 19.3 21.9 21.0 20.5 21.8 22.2 22.2Hy 26.0 27.0 27.5 29.0Wh 29.0 33.0 35.0 36.0Co 31.6 35.0 35.2 35.6 33.0 34.9 35.9 36.4
Average 25.0 26.7 27.7 27.5 26.1 27.9 28.7 28.7
CirrhosisGa 28.4 41.1 42.4 43.6 37.2 43.2 44.2 43.0Sh 23.3 22.6 28.6 34.2 23.2 31.3 35.4Br 21.6 21.0 21.0 20.0 18.4 23.6 22.0Mu 20.0 20.9 23.4 24.1Mu 20.4 19.2 19.5 19.8 19.0 19.7 18.8 19.8Si 30.7 31.2 31.7 32.1 29.8 29.9 31.0 31.0Wo 21.6 23.2 23.4 23.1 23.0 22.5 21.1 25.6Ca 25.3 26.2 26.1 27.0 26.8 27.2 26.9 27.6Fe 14.8 15.2 15.8 16.2 15.2 16.6 16.3 17.1Br 20.6 19.6 22.4 23.2 22.4 23.1 25.6 24.0Be 25.1 25.6 25.3 26.2 27.0 28.2 27.8 28.6Li 14.6 15.2 14.7 14.6We 18.5 20.6 19.1 18.8 18.6 21.0 18.8 19.6Me 24.8 26.0 26.8 27.1 24.0 27.4 28.2 28.0
Average 22.1 23.4 24.3 25.0 23.7 25.7 26.4 26.8
* Expressed as mg. per 100 ml.

L. P. WHITE, E. A. PHEAR, W. H. J. SUMMERSKILL, AND S. SHERLOCK
ingestion (Table IV). Similarly, in fourteen pa-tients with cirrhosis there was no consistent re-sponse in blood glutamine to the administrationof NH,Cl by mouth. Individual cases variedwidely, but averages showed no significant dif-ferences. Values below those of peripheral veinblood were obtained in two patients from renalvein blood.
Blood urea studies
Blood urea increased in seven control subjectsand in fourteen patients with cirrhosis afterNH4C1 ingestion (Table V). Quantitatively thetotal rise was equal in the two groups, and the rateof rise was similar (Figure 6).
DISCUSSION
The data presented suggest two main sourcesof what is presently measured as blood ammoniumin resting subjects: 1) The gastrointestinal tract;and 2) the kidneys. These results agree withpreviously published observations (1, 2, 21, 22).
The proof that a substance, or substances, fromintestinal contents may provoke systemic dis-turbances must rest on three factors: 1) Thatthe material must be absorbed in sufficient quan-tity from the intestine; 2) that it must then enterthe general circulation in abnormal amounts; and3) provoke toxic manifestations.
The data reported here confirm that NH4C1fulfills the first two of these requirements in pa-tients with severe liver disease. The high fastinglevel of ammonium in portal blood and its rapidrise after an oral dose of NH4Cl prove its rapidabsorption (23).
The small increase in peripheral blood ammon-ium levels after NH4Cl ingestion in control sub-jects is in marked contrast to results observed inpatients with liver disease. In patients with se-vere acute hepatitis, or cirrhosis with poor liverfunction, the normal high gradient between am-monium content of portal and hepatic venousblood is diminished, and large amounts of am-monium reach the general circulation through theliver. In patients with good liver function, butwith extensive portal collateral circulation, highperipheral blood ammonium levels may follow theingestion of NH4C1. In these patients, however,the NH. gradient from portal to hepatic venous
blood is normal, indicating that ammonium en-tered the peripheral circulation through someroute other than hepatic veins, probably throughthe portal collateral channels. In patients withpoor liver function and portal collateral veins bothroutes exist, and high levels of ammonium arefound in peripheral blood. These results dem-onstrate the pathways taken by ammonium fromintestine to peripheral blood, and confirm forNH4Cl the second of the above factors.
Evidence was also obtained for the third fac-tor, that NH4Cl is, in fact, toxic. Five patientsshowed accentuation of neurological disturbancesduring the NH4Cl tolerance test. Such symptomswere found only in those patients in whom theNH, levels remained elevated for a considerableperiod. Not all of the patients with prolongedhigh peripheral blood ammonium levels developedneurological symptoms, and such disturbances oc-curred in others when blood ammoniumi was onlymoderately elevated (9). There was no evidenceof acidosis in any patient (9).
It is, at present, impossible to state that am-monium itself is the toxic substance, or to explainthe mechanism of toxicity. It is certain that am-monium, or some material derived from it, canproduce toxic changes in the central nervous sys-tem. Other nitrogenous substances may have asimilar effect (6).
The rise in ammonium level of hepatic veinblood after an oral dose of NH4Cl is a sensitiveindex of the capacity of the liver to metabolizeammonium, and therefore of hepatocellular func-tion.
The present investigation cast no light on themetabolic abnormality in these patients. In thepatients with portal collateral veins, the shuntingof blood away from the normal site of ammoniummetabolism could itself be responsible for highNH4 levels in peripheral blood. In the presenceof poor liver function, however, some abnormalityin the metabolism of NH4 in the liver is obvious.Little can be deduced of the role of glutaminesynthesis in this mechanism from the present data.Glutamine is, however, quantitatively of minor im-portance as an end product of ammonium metabo-lism. Of far more importance is urea, the forma-tion of which is primarily an hepatic function (24,25). In these studies no difference between nor-
166

AMMONIUMTOLERANCEIN LIVER DISEASE
mal and cirrhotic subjects was found in the abilityto synthesize urea.
Ammonium tolerance tests in the miscellaneousgroup of patients demonstrated an abnormal re-sponse in two patients with obstructive jaundiceand one patient with the Chiari syndrome. Noexplanation is apparent for this abnormality inobstructive jaundice. The essentially normal re-sponse in the one patient with thrombosed portalvein, esophageal varices and good liver functionmust be regarded as unexplained, except insofaras all biological material varies in response.
CONCLUSIONS
1. In resting patients without liver disease thereis no measurable ammonium in the circulatingperipheral blood. Three minutes after sheddingof blood appreciable amounts of ammonium haveappeared, and this represents what is usuallycalled blood ammonium.
2. Fifty-one ammonium tolerance tests haveshown that patients with severe liver disease, fol-lowing an oral dose of 3.0 gm. of ammoniumchloride, exhibited an abnormally elevated am-monium content of peripheral vein blood.
3. Hepatic vein catheterization demonstratedthat this abnormality was related to the failureof the liver to metabolize ammonium normallyand/or to the presence of portal collateral veins,diverting high ammonium content portal bloodaround the liver.
4. Five of the patients with abnormal am-monium tolerance tests showed neurological symp-toms during the test.
REFERENCES
1. Nencki, M., Pawlow, J. P., and Zaleski, J., Ueberden Ammoniakgehalt des Blutes und der Organedie Hernstoffbildung bei den Siiugetieren. Arch.f. exper. Path. u Pharmakol., 1895, 37, 26.
2. Kirk, E., Amino acid and ammonia metabolism inliver diseases. Acta med. Scandinav., 1936, Suppl.LXXVII, 1.
3. Van Caulaert, C., Deviller, Ch., and Halff, M., LeTaux de l'Ammoniemie dans certaines affectionshepatiques. Compt. rend. Soc. de biol., 1932, 111,735.
4. Stokes, J. F., Owen, J. R., and Holmes, E. G., Neuro-logical complications of infective hepatitis. Brit.Med. J., 1945, II, 642.
5. Walshe, J. M., Observations on the symptomatologyand pathogenesis of hepatic coma. Quart. J. Med.,1951, 20, 421.
6. Phillips, G. B., Schwartz, R., Gabuzda, G. J., Jr., andDavidson, C. S., The syndrome of impending he-patic coma in patients with cirrhosis of the livergiven certain nitrogenous substances. New Eng-land J. Med., 1952, 247, 239.
7. Adams, R. D., and Foley, J. M., The neurologicaldisorder associated with liver disease. ResearchPubl., A. Res. Nerv. & Ment. Dis., 1953, 32, 198.
8. McDermott, W. V., Jr., and Adams, R. D., Episodicstupor associated with an Eck fistula in the humanwith particular reference to the metabolism ofammonia. J. Clin. Invest., 1954, 33, 1.
9. Sherlock, S., Summerskill, W. H. J., White, L. P.,and Phear, E. A., Portal-systemic encephalopathy:neurological complications of liver disease. Lancet,1954, II, 453.
10. Van Caulaert,. C., Deviller, Ch., and Halff, M.,Troubles Provoques par l'Ingestion de Sels Am-moniacaux chez l'Homme Atteint de Cirrhose deLaennec. Compt. rend. Soc. de biol., 1932, 111,739.
11. Herrick, R., The Night Piece, to Julia. 1591-1678.12. Conway, E. J., Microdiffusion Analysis and Volu-
metric Error. 3rd Ed., London, Crosby, Lock-wood and Son, 1950.
13. Conway, E. J., and Cooke, R., Blood ammonia.Biochem. J., 1939, 33, 457.
14. Conway, E. J., and Cooke, R., Blood ammonia andthe deaminases of adenosine and adenylic acid.Nature, 1938, 142, 720.
15. Strehler, E., Haas, J., and Rupp, F., Der Einfluss vonCO2 auf den Ammoniakgehalt des Blutes in Vitro.Biochem. Ztschr., 1942, 313, 170.
16. Kalckar, H. M., Differential spectrophotometry ofpurine compounds by means of specific enzymes.III. Studies of the enzymes of purine metabolism.J. Biol. Chem., 1947, 167, 461.
17. Traeger, H. S., Gabuzda, G. J., Jr., Ballou, A. N.,and Davidson, C. S., Blood "ammonia" concen-tration in liver disease, and liver coma. Metabo-lism, 1954, 3, 99.
18. Zittle, C. A., Adenosine deaminase from calf in-testinal mucosa. J. Biol. Chem., 1946, 166, 499.
19. Boulanger, P., and Osteux, R., Methode de Dosage dela Glutamine dans le Plasma Sanguin. Bull. Soc.chim. biol., 1949, 31, 1290.
20. Atkinson, M., Barnett, E., Sherlock, S., and Steiner,R., The clinical investigation of the portal venouscirculation with particular reference to trans-splenic portal venography. Quart. J. Med., 1955.In press.
21. Nash, T. P., Jr., and Benedict, S. R., The ammoniacontent of the blood, and its bearing on the mecha-nism of acid neutralization in the animal organism.J. Biol. Chem., 1921, 48, 463.
167
L. P. WHITE, E. A. PHEAR, W. H. J. SUMMERSKILL, AND S. SHERLOCK
22. Parnas, J. K., and Klisiecki, A., t'ber den Ammoni-akgehalt und die Ammoniakbildung im Blute. VI.Mitteilung: Experimentelle Untersuchungen iuberdie Faktoren welche den Ammoniakgehalt deskreisenden Blutes Beeinflussen, und uber die Lo-kalisation der Ammoniakbildung und des Ammoni-akschwundes beim Kaninchent Biochem Ztschr.,1926, 173, 224.
23. McDonald, I. W., The absorption of ammonia from
the rumen of the sheep. Biochem. J., 1948, 42,584.
24. Krebs, H. A., Urea synthesis in The Enzymes, ed.by Sumner, J. B., and Myrback, K., New York,Academic Press, 1952, vol. 2, part 2, p. 866.
25. Ratner, S., Urea formation in Symposium on Phos-phorus Metabolism, ed by McElroy, W. D., andGlass, B., Baltimore, Johns Hopkins Press, 1951,vol. 1, p. 601.
SPECIAL NOTICE TO SUBSCRIBERSPost Offices will no longer forward the Journal when you move.Please notify The Journal of Clinical Investigation, Business
Office, 622 West 168th Street, New York 32, N. Y. at once whenyou have a change of address, and do not omit the zone number ifthere is one.
168