ammonium removal from wastewater by liquid-liquid contactors
TRANSCRIPT

Màster en Recerca en Enginyeria de Processos Químics
Ammoniun removal from
wastewater by liquid-liquid
membrane contactors
Author: Aurora Alcaraz Segura
Supervisor: César Valderrama
Universidad Politécnica de Catalunya
December 2012

Ammonium removal from wastewater by liquid-liquid membrane contactors 1
Abstract
Removal of ammonia from wastewater generated in a waste treatment plant by a membrane
contactor was studied at lab scale. The treated wastewater will be applied in the Hydrogen
and Oxygen production by electrolysis via renewable energies. The aim of this study relies
on fulfill the process requirements in the electrolysis, since the water used in the electrolysis
process must be almost pure water due to efficiency process of Hydrogen and Oxygen
production decreases with the ions in the dissolution.
The residual ammonium concentration of the aqueous stream feeding the membrane
distillation step ranging between 1 to 5 ppm is not removed and arrives to the electrolysis
step generating an increase in the conductivity. So the use of a liquid-liquid membrane
contactor is proposed to reduce ammonium (NH+4) concentration before membranes
distillation step.
The experimental set-up was performed by a contactor (Liqui-cel X30 HF (Celgard, USA))
which works in close and open loop mode configuration. In close circuit, it was used a tank of
10 liters to storage ammonium solution and in open circuit it was used 25 liters as initial
ammonium volume. A pump (Cole Parmer instrument) was used to feed the contactor from
the tank. An aqueous ammonium solution with a low concentration is in the inner side of the
membrane contactor (Lumen) and sulphuric acid solution goes in the outside of the
membrane contactor (Shell). The pH plays a very important role in the chemical equilibrium;
for that reason is motorized during the experiments.
On the other hand, it has been carried out the simulation of a mathematical model used by
various authors to validate the experimental results by COMSOL Multiphysics program.


Index
1. Index of Tables .............................................................................................................. 5
2. Index of Figures ............................................................................................................ 7
3. Notations ....................................................................................................................... 9
4. Introduction ................................................................................................................. 11
4.1 Aqueous solution chemistry of the system NH3 - NH4+ - H2O ............................ 12
5. Membrane processes for the removal of ammonium and ammonia ....................... 14
5.1 Introduction .......................................................................................................... 14
5.2 Membrane process .............................................................................................. 14
6. Membrane contactors ................................................................................................. 16
6.1 Hollow fiber membrane modules ........................................................................ 18
6.1.1 Longitudinal flow modules .......................................................................... 18
6.1.2 Cross-flow modules ..................................................................................... 18
6.1.3 Coiled modules ............................................................................................. 19
7. Applications of membranes contactors ................................................................... 20
8. Membrane contactors for ammonium removal ......................................................... 25
8.1 Mass transfer in membrane contactors ............................................................. 25
8.2 Mathematical model development for the removal of ammonium from aqueous
solution using contactors .............................................................................................. 27
8.2.1 Close loop operation mode .......................................................................... 27
8.2.2 Open loop operation mode .......................................................................... 33
9. Objectives and Methodology ..................................................................................... 33
9.1 Objectives ............................................................................................................ 33
9.2 Methodology ........................................................................................................ 34
9.2.1 Reagents ....................................................................................................... 34
9.2.2 Membrane contactors .................................................................................. 34
9.2.3 Experimental procedure ............................................................................... 35
9.2.4 Monitoring protocol ...................................................................................... 37
10. Results and discussion .......................................................................................... 39
10.1 Results and discussion for close loop operation mode ................................... 42
10.2 Results and discussion for open loop operation mode .................................... 47
11. Conclusions............................................................................................................. 56
12. Annex ....................................................................................................................... 57
12.1 Annex 1. Summary of the experimental results ................................................. 58
12.2 Annex 2. Graphics of experimental results ........................................................ 59
12.3 Annex 3. Poster exhibited in Milan COMSOL Congress in October 2012 ........ 61
12.4 Annex 4. . Paper exhibited in Milan COMSOL Congress in October 2012 ....... 62
13. References ............................................................................................................... 71
Ammonium removal from wastewater by liquid-liquid membrane contactors 5
1. Index of Tables
Table 1. Membrane process ................................................................................................ 15
Table 2 Advantages and disadvantages of membrane contactors. ...................................... 17
Table 3. Specifications of the hollow fiber membrane contactor ........................................... 34
Table 4. Operation conditions in the experiments ................................................................ 35
Table 5.Summary of the experiments at conditions evaluated ............................................. 38
Table 6. Model equations and boundary conditions ............................................................. 39
Table 7. Initial values of parameters to be estimated ........................................................... 40
Table 8. Nominal values of membrane contactor parameters .............................................. 41
Table 9. Experimental results and RMSD with variable pH in close loop configuration with
flow rate 0.26 l/min and initial concentration of ammonium of 15 ppm .................................. 43
Table 10. Experimental results and RMSD with variable initial concentration in close loop
configuration with flow rate 0.26 l/min and pH 10.4 .............................................................. 44
Table 11. Experimental results and RMSD with variable flow rate in close loop configuration
with initial concentration of ammonium of 15 ppm and pH 10.1 ............................................ 46
Table 12. Optimal work conditions in close loop configuration ............................................. 46
Table 13. Experimental results and RMSD with variable pH in open loop configuration with
flow rate 0.26 l/min and initial concentration of ammonium 5 ppm........................................ 48
Table 14. Experimental results and RMSD with variable flow rate in open loop configuration
with initial concentration of ammonium of 5 ppm and pH 9.9................................................ 50
Table 15. Experimental results and RMSD with variable initial concentration of ammonium in
open loop configuration ........................................................................................................ 51
Table 16. Optimal work conditions in open loop configuration .............................................. 51
Table 17. Experimental results and RMSD with variable initial concentration of ammonium in
open loop configuration with wastewater.............................................................................. 54

6 Ammonium removal from wastewater by liquid-liquid membrane contactors
Table 18. Parameters estimated for close and open loop configuration model ..................... 54
Table 19. Characteristics parameters for close and open loop configuration model ............. 55

Ammonium removal from wastewater by liquid-liquid membrane contactors 7
2. Index of Figures
Figure 1. Pilot plant developed for Greenlysis project (CETaqua) ........................................ 11
Figure 2. Equilibrium Ammonia-Ammonium dependent of pH .............................................. 13
Figure 3. Membrane contactor ............................................................................................. 16
Figure 4. Longitudinal flow membrane contactor module scheme ........................................ 18
Figure 5. Cross-flow membrane contactor module scheme.................................................. 19
Figure 6. Coiled membrane contactor module scheme ........................................................ 20
Figure 7. Principle of pertraction .......................................................................................... 22
Figure 8. Principle of emulsion pertaction ............................................................................ 23
Figure 9. Principle membrane gas absortion ........................................................................ 24
Figure 10. Transport steps for separation of NH3 molecules through the HFMC ................. 25
Figure 11. Principle of the extraction process ...................................................................... 26
Figure 12. Experimental setup ............................................................................................. 27
Figure 13. Concentration profile for the species j at a particular time when it moves from
lumen side towards shell side through a microporous hydrophobic membrane .................... 32
Figure 14. a) Cross section of a membrane module showing the fibers. b) Hollow fiber with
the transport phenomena. c) Membrane contactor. d) Side view of the entrance to the hollow
fibers. ................................................................................................................................... 35
Figure 15. Membrane contactor operated by liquid-liquid extraction (Close loop configuration)
............................................................................................................................................ 36
Figure 16. Membrane contactor for the removal of dissolved ammonia (Open loop
configuration) ....................................................................................................................... 36
Figure 17. Influence of feed solution pH on the fractional removal in the close loop
configuration, with flow rate 0.26 l/min and initial ammonium concentration of 15 ppm.
Comparison between simulated values and experimental data. ........................................... 42

8 Ammonium removal from wastewater by liquid-liquid membrane contactors
Figure 18. Influence of initial ammonium concentration in fractional removal in the close loop
configuration with flow rate 0.26 l/min and pH 10.4. Comparison between simulated values
and experimental data. ........................................................................................................ 43
Figure 19. . Influence of flow rate on the fractional removal in the close loop configuration
with Initial concentration of ammonium 15 ppm and pH 10.1. Comparison between simulated
values and experimental data. ............................................................................................. 45
Figure 20. Influence of feed solution pH on the variation in fractional removal in the open loop
configuration with Q = 0.26 l/min and initial concentration of ammonium 5 ppm. Experimental
values .................................................................................................................................. 47
Figure 21. Influence of flow rate on the variation in fractional removal in the open loop
configuration with pH 9.9 and initial concentration of ammonium 5 ppm. Experimental values
............................................................................................................................................ 48
Figure 22. Influence of flow rate on the variation in fractional removal in the open loop
configuration with pH 9.9 and initial concentration of ammonium 5 ppm. Comparison between
simulated values and experimental data. ............................................................................. 49
Figure 23. Influence of initial concentration on the variation in fractional removal in the open
loop configuration with pH 9.9 and Q = 0.26 l/min. Experimental values .............................. 50
Figure 24. Influence of initial concentration on the variation in fractional removal in the open
loop configuration with wastewater with Q = 0.26 l/min and pH 9.8. Experimental values .... 52

Ammonium removal from wastewater by liquid-liquid membrane contactors 9
3. Notations
b Membrane thickness (m)
C Concentration (mol/m3)
d Diameter (m)
D Diffusivity (m2/s)
H Henry’s constant (Pa m3/mol)
k Mass transfer coefficient (m/s)
Kb Ionization equilibrium constant of ammonia
L Length of the module (m)
M Molecular weight (g/mol)
N Number of fibers
p Partial pressure (Pa)
Q Feed flow rate (m3/s)
r Radial coordinate (m)
R Radius of the lumen (m)
Rg Universal gas constant (J/mol K)
Rj Rate of generation of component j due to chemical reaction (mol/s m3)
t Time (s)
T Temperature (K)
U Velocity inside the fiber (m/s)
V Volume of feed tank (m3)
Z Axial coordinate (m)
Subscript
0 Initial
a Ammonia
am Ammonium
air Air
c Combined
g Gas
I Inner
int Liquid-gas interface
j Combined ammonia and ammonium
10 Ammonium removal from wastewater by liquid-liquid membrane contactors
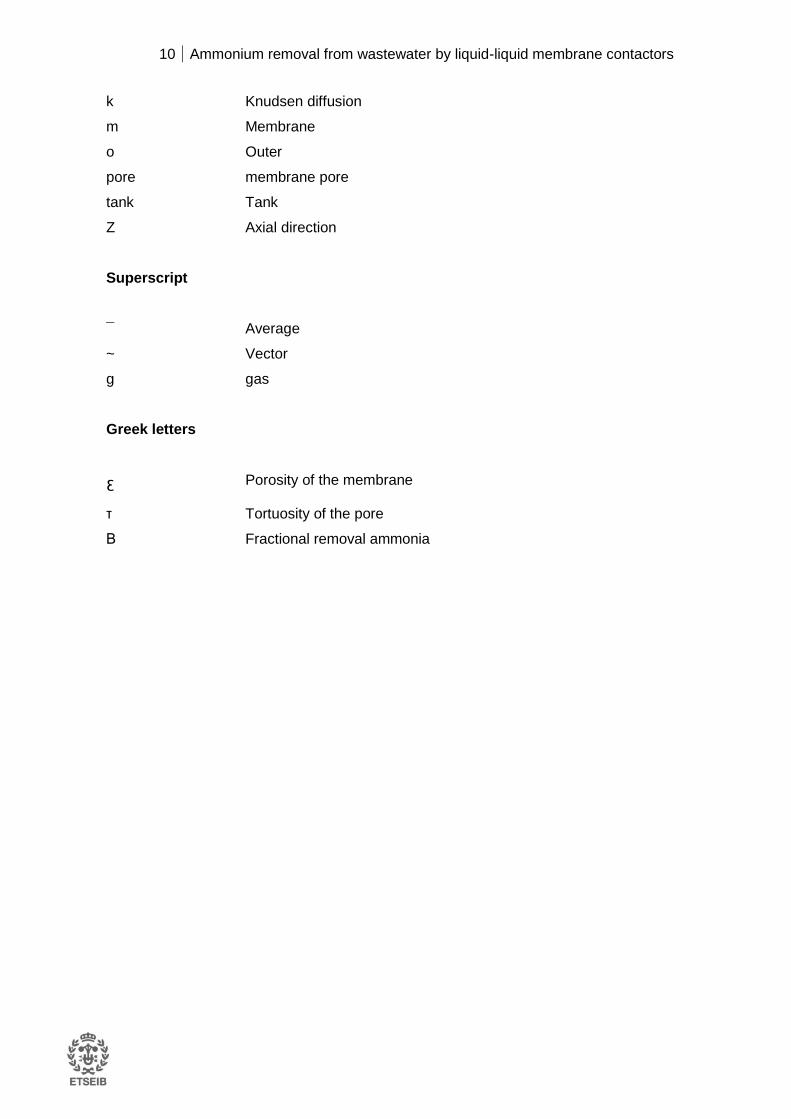
k Knudsen diffusion
m Membrane
o Outer
pore membrane pore
tank Tank
Z Axial direction
Superscript
¯ Average
~ Vector
g gas
Greek letters
Ɛ Porosity of the membrane
τ Tortuosity of the pore
Β Fractional removal ammonia
Ammonium removal from wastewater by liquid-liquid membrane contactors 11
4. Introduction
This Master project has been development inside the European project Greenlysis
"Hydrogen and Oxygen production by electrolysis via renewable energies to reduce
environmental footprint of a waste water treatment plant (WWTP)." The project is devoted to
the use of renewable energy to produce Hydrogen and Oxygen from water, using treated
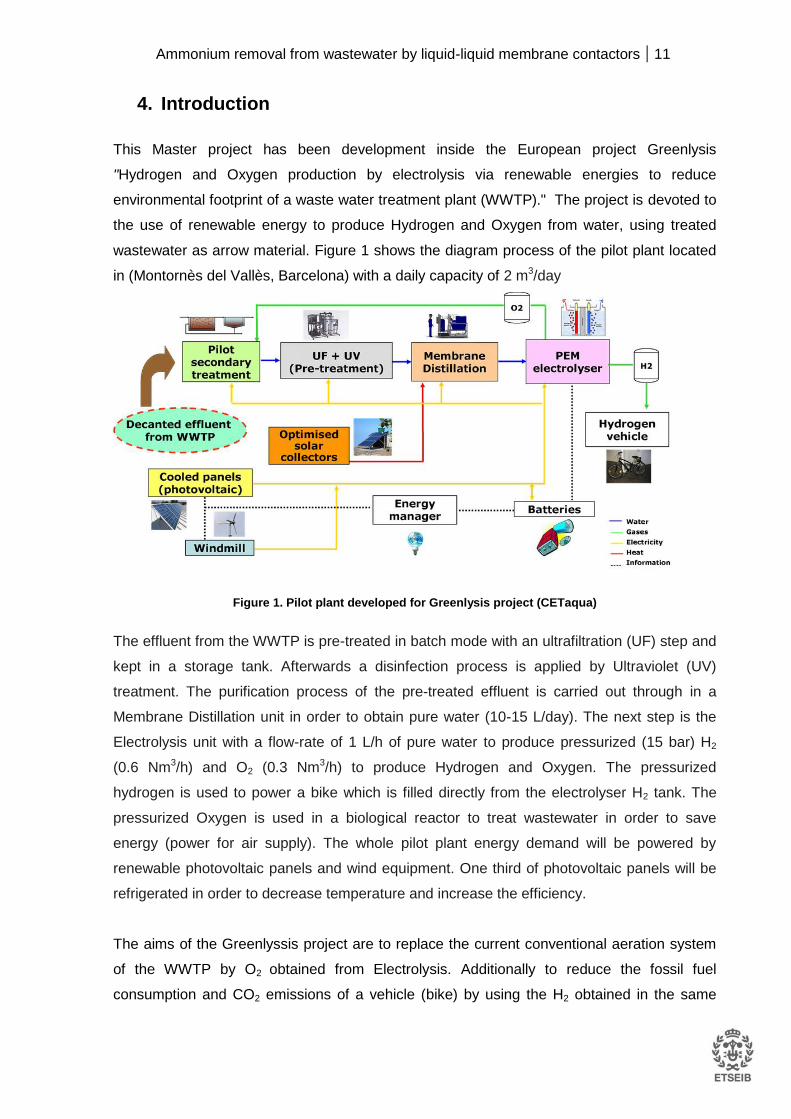
wastewater as arrow material. Figure 1 shows the diagram process of the pilot plant located
in (Montornès del Vallès, Barcelona) with a daily capacity of 2 m3/day
Figure 1. Pilot plant developed for Greenlysis project (CETaqua)
The effluent from the WWTP is pre-treated in batch mode with an ultrafiltration (UF) step and
kept in a storage tank. Afterwards a disinfection process is applied by Ultraviolet (UV)
treatment. The purification process of the pre-treated effluent is carried out through in a
Membrane Distillation unit in order to obtain pure water (10-15 L/day). The next step is the
Electrolysis unit with a flow-rate of 1 L/h of pure water to produce pressurized (15 bar) H2
(0.6 Nm3/h) and O2 (0.3 Nm3/h) to produce Hydrogen and Oxygen. The pressurized
hydrogen is used to power a bike which is filled directly from the electrolyser H2 tank. The
pressurized Oxygen is used in a biological reactor to treat wastewater in order to save
energy (power for air supply). The whole pilot plant energy demand will be powered by
renewable photovoltaic panels and wind equipment. One third of photovoltaic panels will be
refrigerated in order to decrease temperature and increase the efficiency.
The aims of the Greenlyssis project are to replace the current conventional aeration system
of the WWTP by O2 obtained from Electrolysis. Additionally to reduce the fossil fuel
consumption and CO2 emissions of a vehicle (bike) by using the H2 obtained in the same
12 Ammonium removal from wastewater by liquid-liquid membrane contactors
step. Additionally the pilot plant is operated by photovoltaic and wind energy which leads to a
significant reduction in greenhouse gasses (GHG) emissions.
The aim of this Master project relies on a process requirement of the Greenlysis project.
Thus, the conductivity of the Electrolysis input stream should be lowest than 1 μS·cm-1.
However, the residual ammonium concentration of the aqueous stream feeding the
membrane distillation step ranging between 1 to 5 ppm is not remove and arrive to the
Electrolysis step generating an increase in the conductivity go to values of 10-20 μS·cm-1 . It
makes that efficiency of Electrolysis unit be lower. Then is necessary to remove or reduce
the ammonium concentration in aqueous stream leaving the UF unit before Membranes
distillation step in terms of suitable conductivity for the Electrolysis unit.
4.1 Aqueous solution chemistry of the system NH3 - NH4+ - H2O
Ammonia is a colorless gas with a characteristic odor, very soluble in water. Its aqueous
solutions are alkaline and have a corrosive effect in front to metals and tissue (Busca and
Pistarino 2003). The pH in an aqueous solution of 0.1 M is 11.2, which is characteristic of a
weak base (pKa = 9.3).
Ammonia in water exists in free and ionic forms under equilibrium:
HNHNH 34 (Eq. 1)
The Henry’s law constant and equilibrium dissociation constant for the NH4+ - NH3 - water
system can be expressed as follows:
(Eq.2)
(Eq. 3)
The Henry’s constant, HNH3, can be interpreted as the physical solubility parameter, which
reflects the level of the free form of the gas dissolved in the water but does not represent its
subsequent fate on dissolution. On the other hand, kb is the dissociation equilibrium constant
for dissolved ammonia, which represents the level of NH4+ ions.
Equations (2) and (3) can be rearranged to obtain an expression for NH4+ concentration in
term Henry’s law constant, dissociation constant, gas partial pressure and protons
concentration, obtaining the equation 3 (Agrahari et al., 2012):
a
NHNH
a k
pHH
k
NHHNH 333
4
(Eq. 4)
3
3
3 aq
NH
NH
NHH
p
4
3
NH
HNHka
Ammonium removal from wastewater by liquid-liquid membrane contactors 13
The total concentration of ammonia can be written as the sum of the molar concentrations of
ionic and free form of NH3:
a
NHNHTK
HpHNHNHNH
33433
(Eq.5)
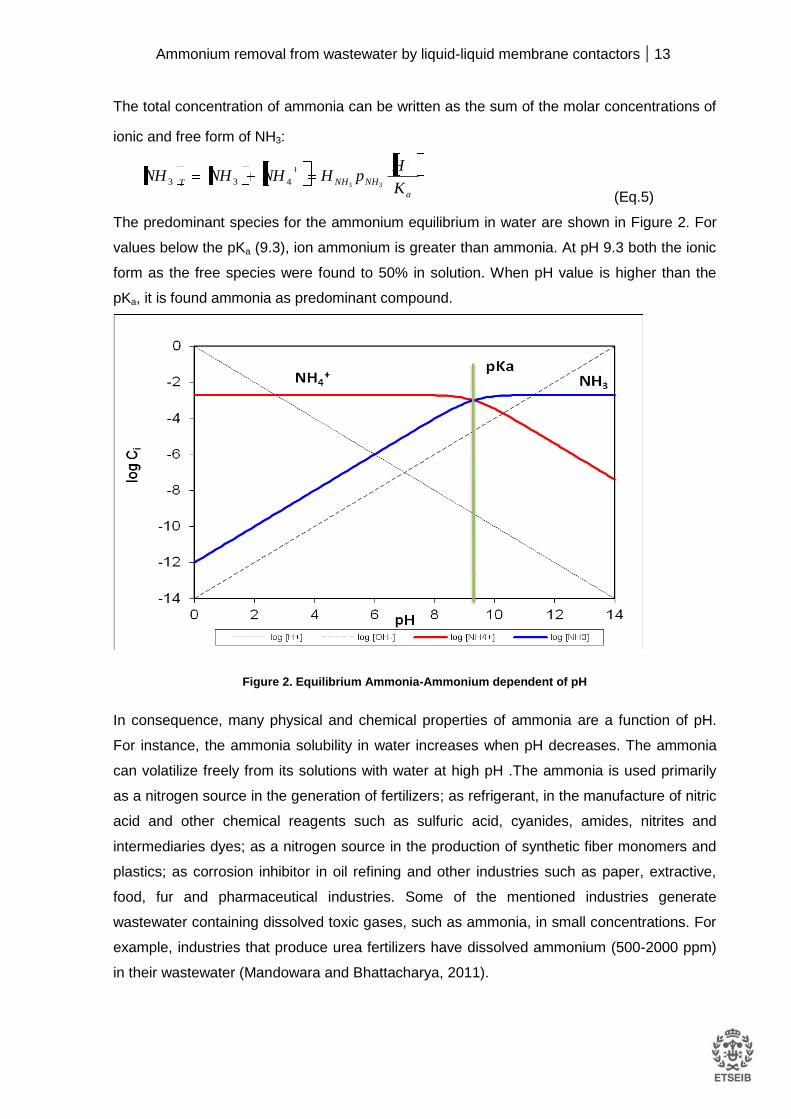
The predominant species for the ammonium equilibrium in water are shown in Figure 2. For
values below the pKa (9.3), ion ammonium is greater than ammonia. At pH 9.3 both the ionic
form as the free species were found to 50% in solution. When pH value is higher than the
pKa, it is found ammonia as predominant compound.
Figure 2. Equilibrium Ammonia-Ammonium dependent of pH
In consequence, many physical and chemical properties of ammonia are a function of pH.
For instance, the ammonia solubility in water increases when pH decreases. The ammonia
can volatilize freely from its solutions with water at high pH .The ammonia is used primarily
as a nitrogen source in the generation of fertilizers; as refrigerant, in the manufacture of nitric
acid and other chemical reagents such as sulfuric acid, cyanides, amides, nitrites and
intermediaries dyes; as a nitrogen source in the production of synthetic fiber monomers and
plastics; as corrosion inhibitor in oil refining and other industries such as paper, extractive,
food, fur and pharmaceutical industries. Some of the mentioned industries generate
wastewater containing dissolved toxic gases, such as ammonia, in small concentrations. For
example, industries that produce urea fertilizers have dissolved ammonium (500-2000 ppm)
in their wastewater (Mandowara and Bhattacharya, 2011).
14 Ammonium removal from wastewater by liquid-liquid membrane contactors
Due to use of this compound to industrial, domestic and agriculture sector, ammonia is one
of the major inorganic pollutants in the water. Then the removal of this substance is due to
two main reasons (Jorgense and Wheatley, 2003; Moazed, 2008):
Its extreme toxicity to marine life (concentrations below 0.01 ppm have negative
effects on fish, while 0.1 ppm can be lethal to other species) (Mandowara and
Bhattacharya, 2011).
It can be bio-oxidized by nitrifying organisms to nitrites and nitrates.
This project also takes into account a third reason for removal. As has been mentioned
above, the ammonia impact in higher conductivity which is not desired for electrolysis step in
the hydrolysis process for producing hydrogen and oxygen, which makes necessary to
remove this compound.
5. Membrane processes for the removal of ammonium and
ammonia
5.1 Introduction
Several techniques are available for the removal of dissolved ammonia, such as air stripping,
break-point chlorination, selective ion exchange, biological nitrification and denitrification and
adsorption (Sarioglu, 2005). Removal by conventional extraction or stripping processes may
not be suitable for low-concentration wastewater. Break-point chlorination suffers from
several disadvantages including large treatment volume, associated risk, difficulty of pH
control, and high chemical costs. The ion-exchange process requires expensive organic
resins and large quantities of eluent solution (Sarioglu, 2005). Biological nitrification and
denitrification are slow processes and require large treatment vessels. Therefore, most of the
available treatment processes are not particularly effective at low concentrations. Some of
the advances made in membrane processes in last two decades allow considering this
technique as potential attractive for ammonia removal.
5.2 Membrane process
Commercially, membrane filtration has a great acceptance as an important step in many of
the process in several industries, as well as in water purification (Scott, 1998). Very specific
separations have been obtained at ambient temperature with no phase change which makes
membrane filtration a cost-effective separation method compared to others such as vacuum

Ammonium removal from wastewater by liquid-liquid membrane contactors 15
filtration, and spray drying. The hydrostatic pressure is most often the driving force, but can
also be electrical potential, concentration gradient, or temperature.
The processes collected in Table 1 represent the majority of commercial membrane
separation technologies that could be used for NH3 / NH4+ removal:
Table 1. Membrane process (Baker, 2000)
However, a number of processes are still in the laboratory or early commercial stage and
may yet become important. One of this processes are membrane contactors. In the
membrane separation processes the membrane acts as a selective barrier allowing relatively
free passage of one component while retaining another. In membrane contactors the
membrane function is to provide an interface between two phases but not to control the rate
of passage of permeates across the membrane (Baker, 2000). Due to many advantages
offered by these devices, contactors are considered as a potential technology for ammonia
removal from water.
16 Ammonium removal from wastewater by liquid-liquid membrane contactors
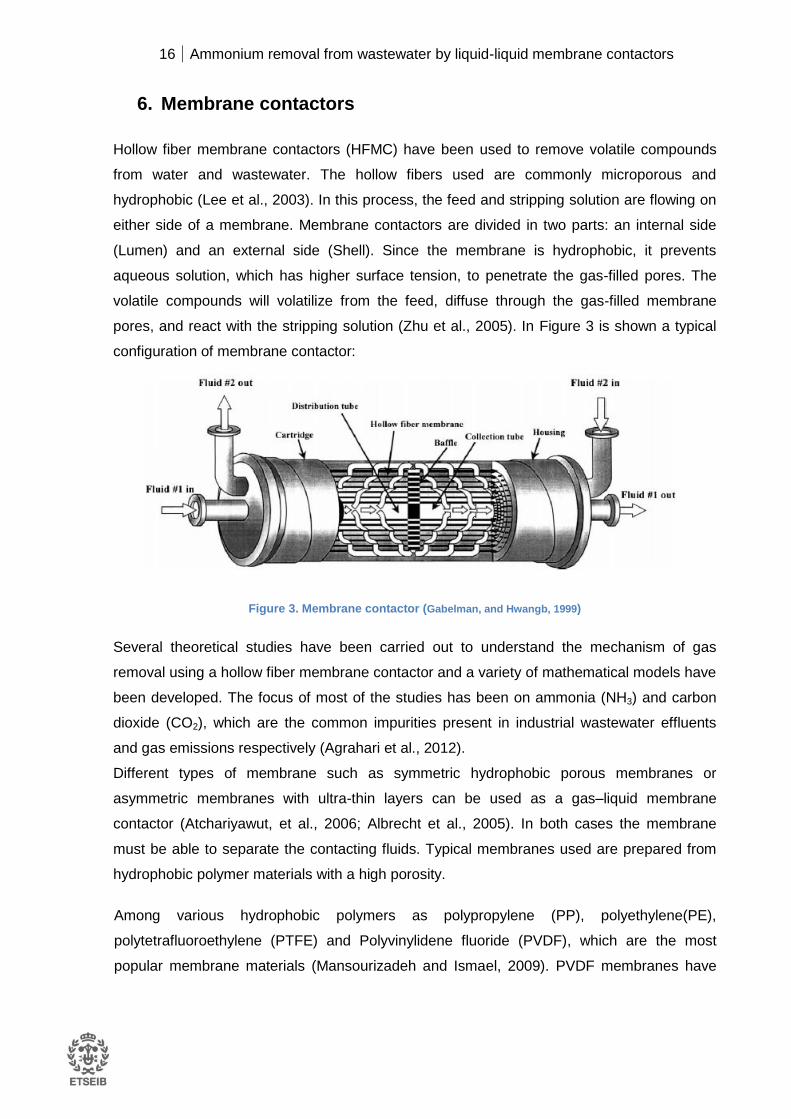
6. Membrane contactors
Hollow fiber membrane contactors (HFMC) have been used to remove volatile compounds
from water and wastewater. The hollow fibers used are commonly microporous and
hydrophobic (Lee et al., 2003). In this process, the feed and stripping solution are flowing on
either side of a membrane. Membrane contactors are divided in two parts: an internal side
(Lumen) and an external side (Shell). Since the membrane is hydrophobic, it prevents
aqueous solution, which has higher surface tension, to penetrate the gas-filled pores. The
volatile compounds will volatilize from the feed, diffuse through the gas-filled membrane
pores, and react with the stripping solution (Zhu et al., 2005). In Figure 3 is shown a typical
configuration of membrane contactor:
Figure 3. Membrane contactor (Gabelman, and Hwangb, 1999)
Several theoretical studies have been carried out to understand the mechanism of gas
removal using a hollow fiber membrane contactor and a variety of mathematical models have
been developed. The focus of most of the studies has been on ammonia (NH3) and carbon
dioxide (CO2), which are the common impurities present in industrial wastewater effluents
and gas emissions respectively (Agrahari et al., 2012).
Different types of membrane such as symmetric hydrophobic porous membranes or
asymmetric membranes with ultra-thin layers can be used as a gas–liquid membrane
contactor (Atchariyawut, et al., 2006; Albrecht et al., 2005). In both cases the membrane
must be able to separate the contacting fluids. Typical membranes used are prepared from
hydrophobic polymer materials with a high porosity.
Among various hydrophobic polymers as polypropylene (PP), polyethylene(PE),
polytetrafluoroethylene (PTFE) and Polyvinylidene fluoride (PVDF), which are the most
popular membrane materials (Mansourizadeh and Ismael, 2009). PVDF membranes have
Ammonium removal from wastewater by liquid-liquid membrane contactors 17
excellent chemical and thermal resistance which makes them suitable for most of the
corrosive chemicals and organic compounds such as acids, alkaline, oxidant and halogens.
The main advantages and disadvantages of hollow fibers contactors are summarized on
Table 2.
Table 2 Advantages and disadvantages of membrane contactors. (Baker, 2000)
18 Ammonium removal from wastewater by liquid-liquid membrane contactors
6.1 Hollow fiber membrane modules
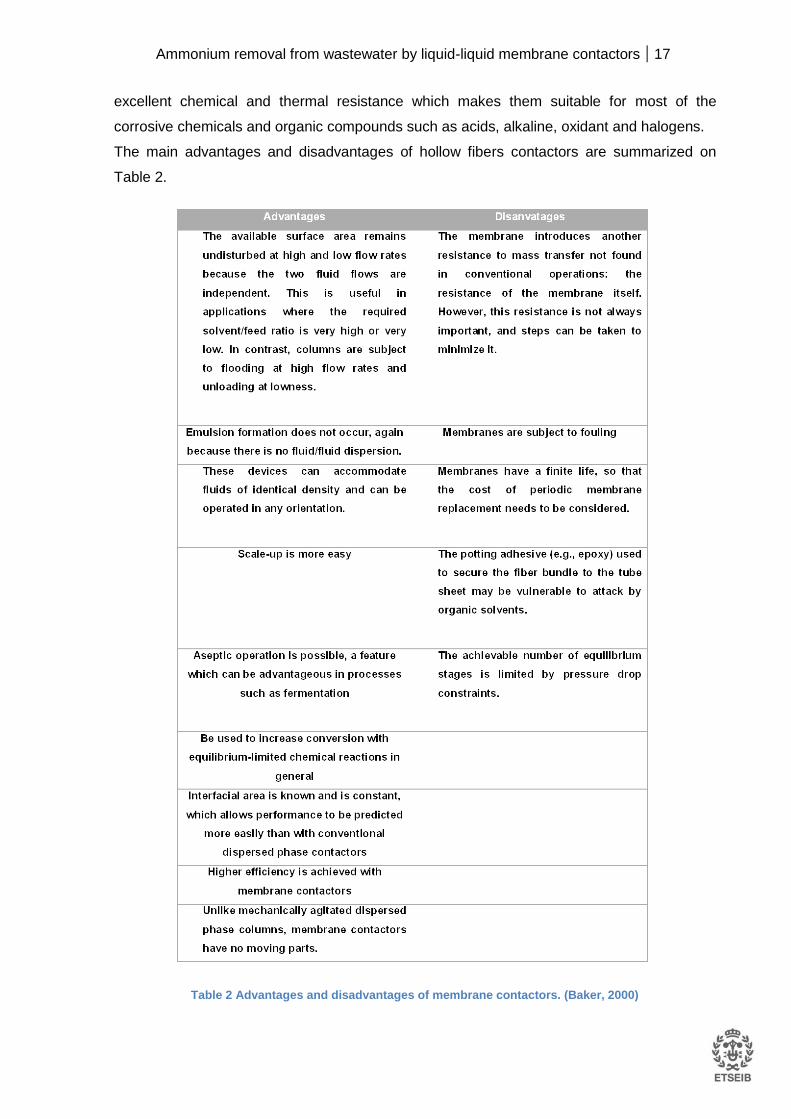
6.1.1 Longitudinal flow modules
In these modules, the gas and liquid phases flow in parallel to each other on the opposite
side of the fibers (Figure 4). The flows can be co-current or counter-current. Most of the
researches on the membrane gas absorption in laboratory scale have conducted on this kind
of membrane module (Kim and Yang, 2000; Lee et al, 2001; Dindore et al., 2004; Yang and
Cussler, 1986) studied and discussed the construction of the parallel and cross-flow
modules. They reported the results of experiments made with these modules, and described
the mechanism responsible for controlling the mass transfer in the various cases. Finally,
they discussed the correlations that can be inferred from their experiments, and compare
these with correlations previously reported for analogous heat and mass transfer problems.
Their discussion provides a basis for designing hollow fiber membrane modules for
contacting both gases and liquids in other situations.
Figure 4. Longitudinal flow membrane contactor module scheme
The simplicity in manufacturing, well known fluid dynamics in shell and tube side and
easiness of mass transfer estimation are the advantages of this module, while the main
disadvantages is the moderate efficiency in mass transfer compared with the cross-flow
module (Mansourizadeh and Ismael, 2009).
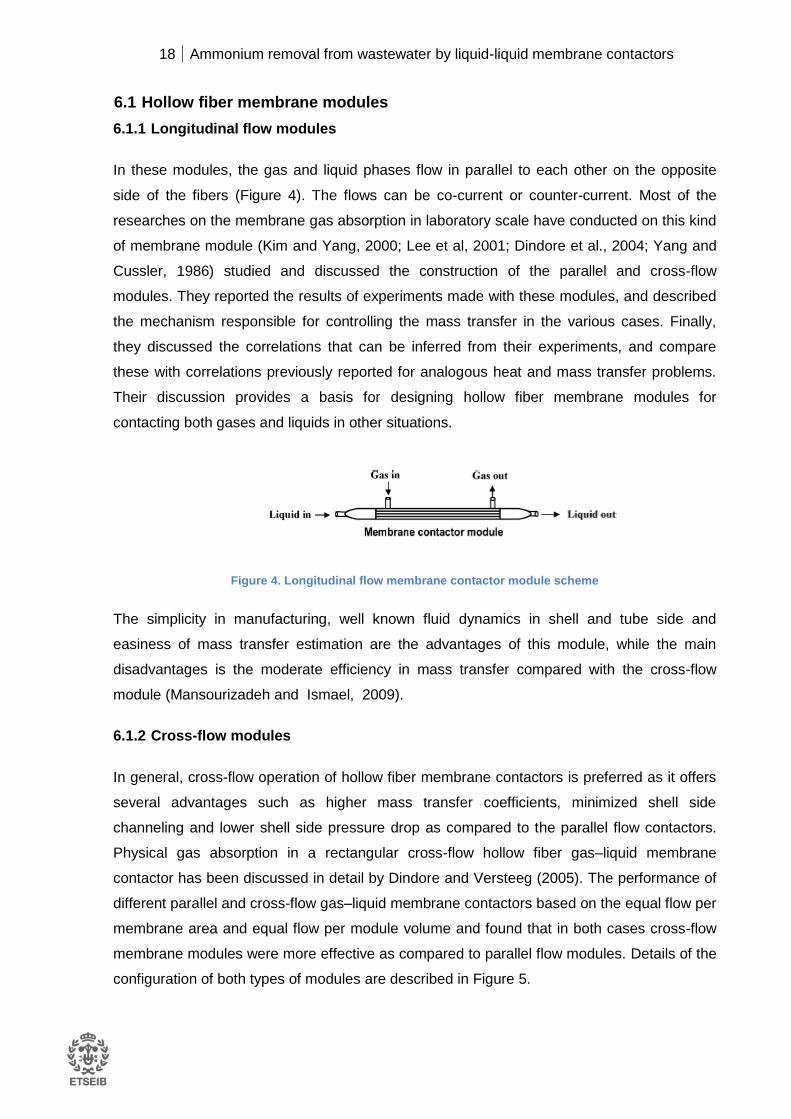
6.1.2 Cross-flow modules
In general, cross-flow operation of hollow fiber membrane contactors is preferred as it offers
several advantages such as higher mass transfer coefficients, minimized shell side
channeling and lower shell side pressure drop as compared to the parallel flow contactors.
Physical gas absorption in a rectangular cross-flow hollow fiber gas–liquid membrane
contactor has been discussed in detail by Dindore and Versteeg (2005). The performance of
different parallel and cross-flow gas–liquid membrane contactors based on the equal flow per
membrane area and equal flow per module volume and found that in both cases cross-flow
membrane modules were more effective as compared to parallel flow modules. Details of the
configuration of both types of modules are described in Figure 5.
Ammonium removal from wastewater by liquid-liquid membrane contactors 19
Figure 5. Cross-flow membrane contactor module scheme (Dindore and Versteeg, 2005)
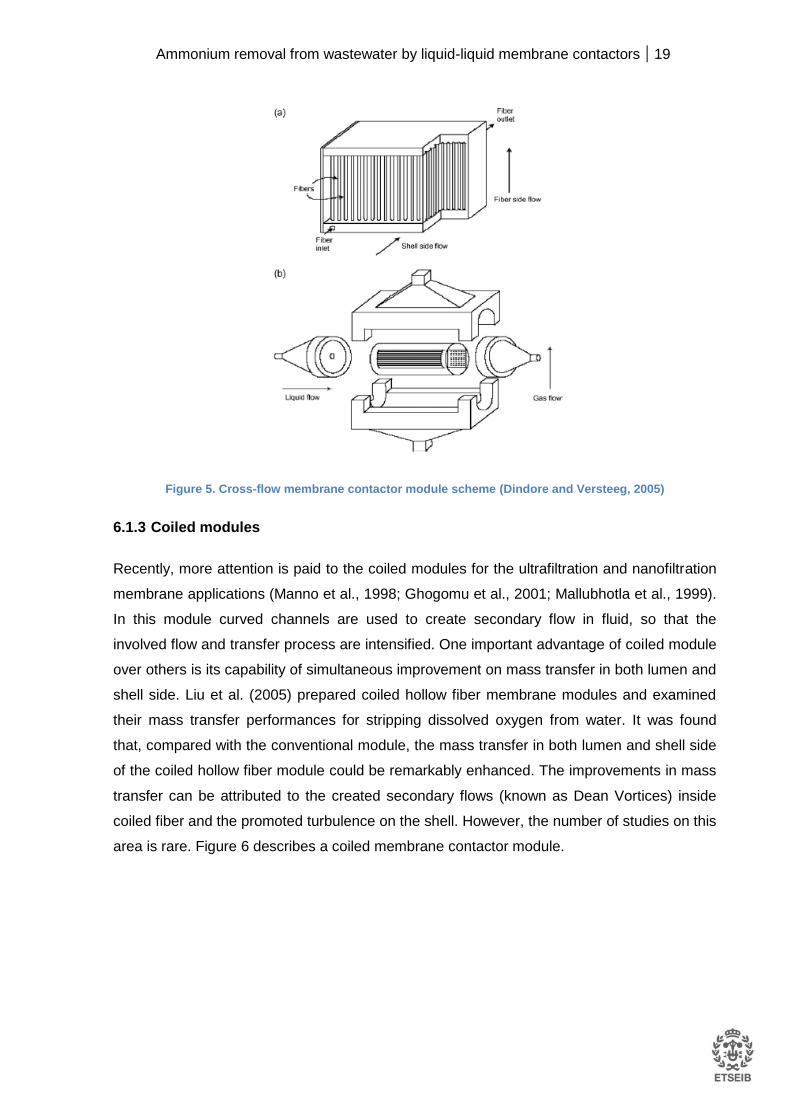
6.1.3 Coiled modules
Recently, more attention is paid to the coiled modules for the ultrafiltration and nanofiltration
membrane applications (Manno et al., 1998; Ghogomu et al., 2001; Mallubhotla et al., 1999).
In this module curved channels are used to create secondary flow in fluid, so that the
involved flow and transfer process are intensified. One important advantage of coiled module
over others is its capability of simultaneous improvement on mass transfer in both lumen and
shell side. Liu et al. (2005) prepared coiled hollow fiber membrane modules and examined
their mass transfer performances for stripping dissolved oxygen from water. It was found
that, compared with the conventional module, the mass transfer in both lumen and shell side
of the coiled hollow fiber module could be remarkably enhanced. The improvements in mass
transfer can be attributed to the created secondary flows (known as Dean Vortices) inside
coiled fiber and the promoted turbulence on the shell. However, the number of studies on this
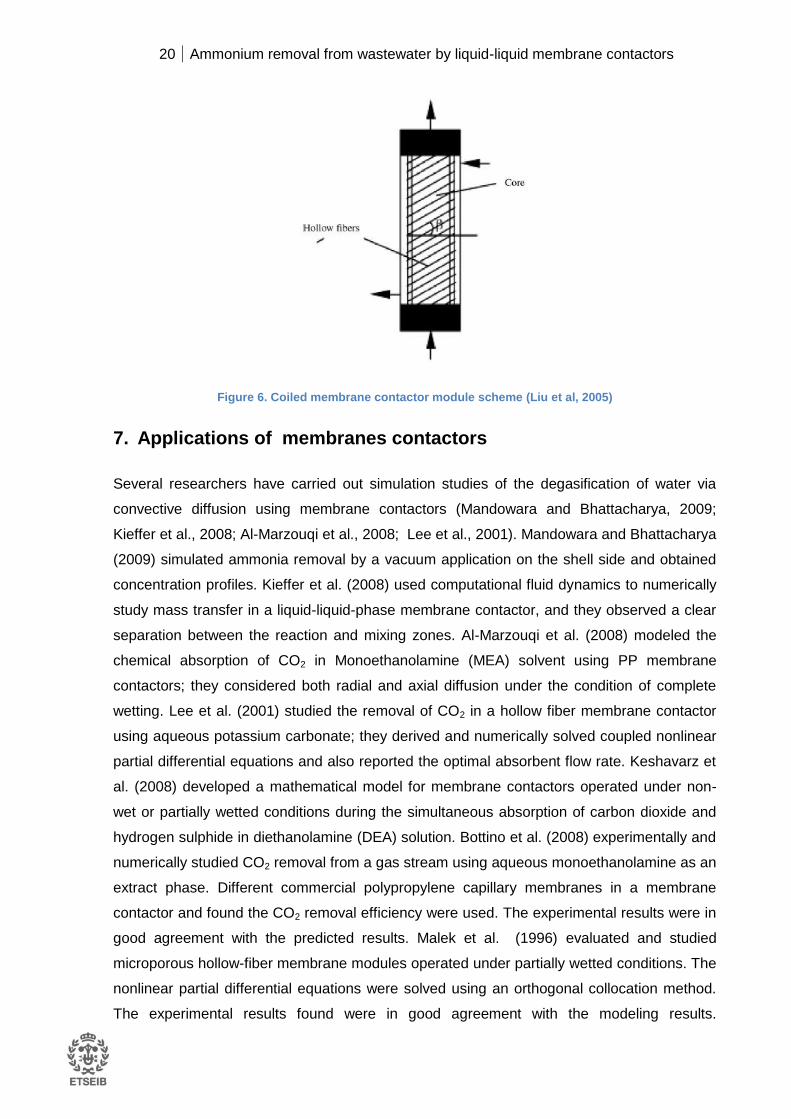
area is rare. Figure 6 describes a coiled membrane contactor module.
20 Ammonium removal from wastewater by liquid-liquid membrane contactors
Figure 6. Coiled membrane contactor module scheme (Liu et al, 2005)
7. Applications of membranes contactors
Several researchers have carried out simulation studies of the degasification of water via
convective diffusion using membrane contactors (Mandowara and Bhattacharya, 2009;
Kieffer et al., 2008; Al-Marzouqi et al., 2008; Lee et al., 2001). Mandowara and Bhattacharya
(2009) simulated ammonia removal by a vacuum application on the shell side and obtained
concentration profiles. Kieffer et al. (2008) used computational fluid dynamics to numerically
study mass transfer in a liquid-liquid-phase membrane contactor, and they observed a clear
separation between the reaction and mixing zones. Al-Marzouqi et al. (2008) modeled the
chemical absorption of CO2 in Monoethanolamine (MEA) solvent using PP membrane
contactors; they considered both radial and axial diffusion under the condition of complete
wetting. Lee et al. (2001) studied the removal of CO2 in a hollow fiber membrane contactor
using aqueous potassium carbonate; they derived and numerically solved coupled nonlinear
partial differential equations and also reported the optimal absorbent flow rate. Keshavarz et
al. (2008) developed a mathematical model for membrane contactors operated under non-
wet or partially wetted conditions during the simultaneous absorption of carbon dioxide and
hydrogen sulphide in diethanolamine (DEA) solution. Bottino et al. (2008) experimentally and
numerically studied CO2 removal from a gas stream using aqueous monoethanolamine as an
extract phase. Different commercial polypropylene capillary membranes in a membrane
contactor and found the CO2 removal efficiency were used. The experimental results were in
good agreement with the predicted results. Malek et al. (1996) evaluated and studied
microporous hollow-fiber membrane modules operated under partially wetted conditions. The
nonlinear partial differential equations were solved using an orthogonal collocation method.
The experimental results found were in good agreement with the modeling results.

Ammonium removal from wastewater by liquid-liquid membrane contactors 21
McDermott et al. (2007) studied the vacuum-assisted removal of volatile and semi-volatile
organic contaminants from water using hollow-fiber-based membrane contactors. They used
a hybrid numerical-analytical approach and investigated the main factors controlling the
removal characteristics, e.g., the Henry’s law coefficient, gas-side diffusion resistance, and
aqueous diffusion limitation.
Although it is difficult to introduce new technologies in industry there is still a large demand
for new improved processes, especially in the field of separation technology. Stringent
demands are put onto these new separation technologies in order to compete with the
existing proven technologies and in order to meet stricter product quality requirements,
environmental legislation, energy efficiency demands and last but not least needs for cost
reduction (Klaassen et al., 2005). In order to meet these ever increasing needs there is a
tendency to combine processes to a hybrid process. In a membrane contactor membrane
separation is not only combined with an phase contacting process like extraction or
absorption but both processes are fully integrated and incorporated into one piece of
equipment. In this way advantages of both processes can be fully exploited (Klaassen et al,
2005). The membrane offers a flexible modular efficient device with a low volume and weight
so that it can be easily integrated in existing installations. The extraction or absorption
process can offer a very high selectivity and a high driving force for transport even at very
low concentrations. Applications of membrane contactors are of interest for the chemical,
petrochemical, pharmaceutical and galvanic industry for both water and gas treatment as
end of pipe technology but also for product recovery and as integrated process solution
(Klaassen et al., 2008).
The industrial reference installations, in the field of pertraction, emulsion pertraction and
membrane gas absorption, help to gain confidence of end users in the membrane contactor
technology.

22 Ammonium removal from wastewater by liquid-liquid membrane contactors
Pertraction technology
Pertraction is a non-dispersive membrane based liquid–liquid extraction process. Nonpolar
organic substances such as aromatics or chlorinated hydrocarbons can be recovered from
process or wastewater flows by pertraction. The organic components are removed from the
water by extraction into an organic extractant, which is immiscible with water. The extractant
is flowing at one side of the membrane and the water phase at the other side. The role of the
membrane is to keep the phases separated and to provide a suitable interface between the
two phases. The membrane itself has no selectivity. The process selectivity must come from
the extractant. The interface between wastewater and extractant is immobilized using a
hydrophobic microporous hollow fiber membrane by means of a small trans-membrane
pressure gradient (0.1 bar) (Kiani et al., 1984; Klassen et al., 1994b, Klaassen, 1998), as can
be seen in Figure 7. Contrary to conventional extraction processes there is no direct mixing
of extractant in the wastewater stream.
Figure 7. Principle of pertraction
Pertraction is especially suitable for removal of hydrophobic organic compounds like
aromatic and aliphatic organics, chlorinated solvents (e.g., carbon tetrachloride, chloroform,
tetrachloroethene and trichloroethene), PCB’s, di- and tri-chlorobenzene, pesticides and
higher polycyclic hydrocarbons (Klaassen et al, 2005).
Water streams containing these hydrocarbons can be found at many places:
Effluents/process streams from pharmaceutical, off shore, automotive, paint,
petrochemical and chemical-plants.
Water originating from tank cleaning and tank storage.
Effluents from garages dry cleaning and wood preservation.
Contaminated ground water.
Landfill leachate from sites containing chemical wastes.

Ammonium removal from wastewater by liquid-liquid membrane contactors 23
Emulsion pertraction technology
Emulsion pertraction is a combined extraction and regeneration process suitable for selective
removal of heavy metals like copper, zinc, iron, chromium, cadmium or lead from aqueous
solutions. The heavy metals can be recovered in a concentrated solution. Lifetime extension
of bath liquids is an industrial application for emulsion pertraction. The principle of emulsion
pertraction is also used by Commodore Separation Technologies for the recovery of Cr(VI)
from waste water (Ho and Poddar, 2001). Water phase is kept apart from the emulsion
phase by a hydrophobic microporous membrane. Emulsion pertraction is a process evolved
from a combination of permeation through membranes and solvent extraction. (Klaassen et
al., 1996). The emulsion phase consists of an organic solvent with a dissolved extractant as
continuous phase with aqueous droplets of strip liquid dispersed in it. In Figure 8 it can see
the principle of emulsion pertraction. The metal to be removed from the water phase is bound
by the extractant present in the pores of the membrane. At the other side of the membrane
the strip liquid continuously regenerates the extractant. In this way an optimal driving force
for transport is maintained in the membrane contactor. The strip liquid is dispersed in the
organic phase. There is no need to make this dispersion very suitable because the
hydrophobic nature of the membrane keeps the waste water and aqueous strip liquid always
separated.
Figure 8. Principle of emulsion pertaction

24 Ammonium removal from wastewater by liquid-liquid membrane contactors
Membrane gas absorption technology
Membrane gas absorption is a gas-liquid contacting operation (Zhang and Cussler, 1985;
Klaassen et al., 1996; Feron et al., 1997). The essential element in the membrane gas
absorption process is a microporous hydrophobic hollow fiber membrane. The gas stream is
fed along one side of the membrane at the same time an absorption solution is flowing at the
other side of the membrane. The absorption liquid is chosen in such a way that it has a high
affinity for components that must be removed from the gas stream. These components will
diffuse through the gas filled pores of the membrane to the other side of the membrane
where they are absorbed in a liquid phase. Absorption in the liquid phase takes place either
by physical absorption or by a chemical reaction. This determines the selectivity of the
process. The membrane used gives no contribution to the selectivity: the membrane’s role is
to keep the two phases separated and to provide a large contacting surface area. The
process is illustrated in Figure 9 (Klaassen et al, 2005).
Figure 9. Principle membrane gas absortion
Membrane gas absorption can be applied for removal of those components from a gas
stream where a suitable absorption liquid is available. An absorption liquid has a high affinity
for the components to be removed and does not wet the membrane. The majority of
absorbents used in conventional gas absorption processes can also be used for membrane
gas absorption. Applications (Klaassen et al., 1996, Feron et al., 1997, Klaassen and
Jansen, 2001) for the use of membrane gas absorption are listed below:
Ammonium removal from wastewater by liquid-liquid membrane contactors 25
Flue-gas and off-gas containing e.g., SO2, HCl, NH3 or H2S can be treated to meet
emission standards in many industrial situations.
Recovery and re-use of CO2 from flue gas, biogas and off-gases in horticultural
industry, beverage production and other industrial applications.
Upgrading and desulphurization of biogas from anaerobic digesters and landfills.
Acid gas removal and dehydration of natural gas.
Acid gas removal from fuel gas mixtures.
Mercury removal from natural gas, flue gas or glycol overheads.
Olefin-paraffin separation in petrochemical industry.
Indoor air treatment for e.g., tobacco smoke components.
8. Membrane contactors for ammonium removal
8.1 Mass transfer in membrane contactors
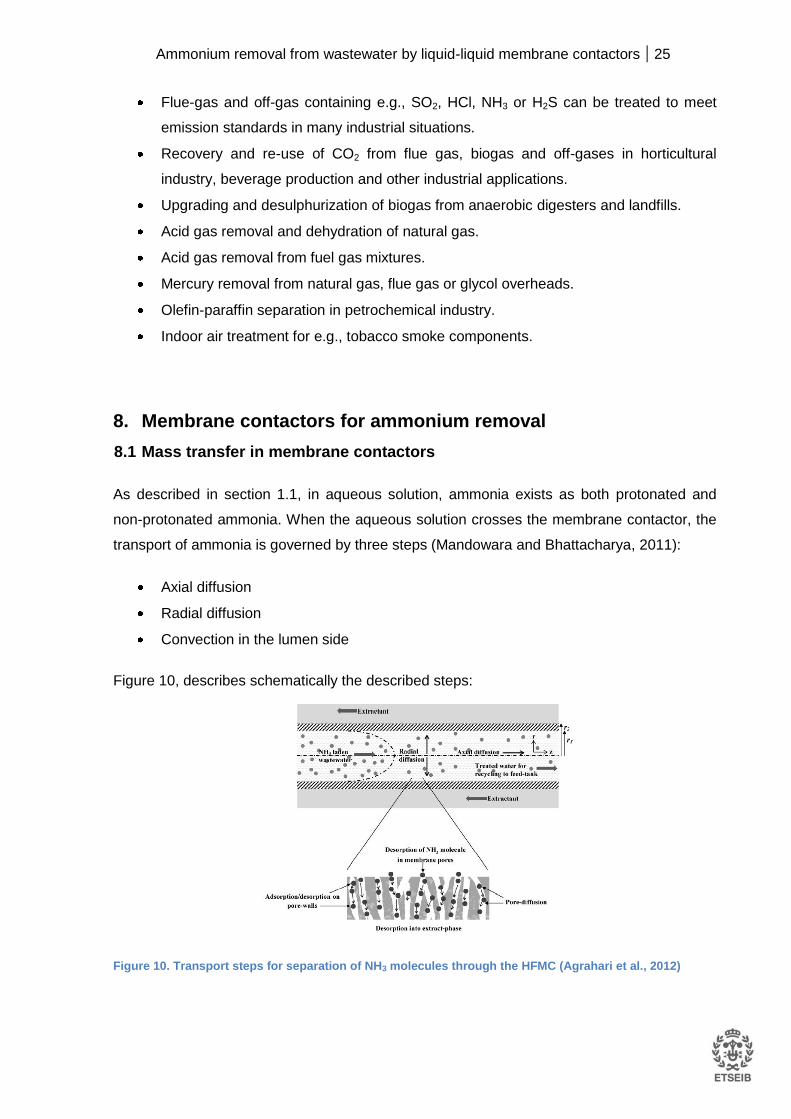
As described in section 1.1, in aqueous solution, ammonia exists as both protonated and
non-protonated ammonia. When the aqueous solution crosses the membrane contactor, the
transport of ammonia is governed by three steps (Mandowara and Bhattacharya, 2011):
Axial diffusion
Radial diffusion
Convection in the lumen side
Figure 10, describes schematically the described steps:
Figure 10. Transport steps for separation of NH3 molecules through the HFMC (Agrahari et al., 2012)

26 Ammonium removal from wastewater by liquid-liquid membrane contactors
The first step is radial diffusion of ammonia to the internal surface of hollow fiber and
ammonia gas molecules transfer from the aqueous solution to the membrane pores. The
second step is the diffusion of ammonia in gaseous form inside the pore. Finally, it reaches
the interface located at the pore exit of the hydrophobic membrane and instantaneously
reacts with the receiving phase, typically sulphuric acid for ammonia extraction. Ammonia is
highly soluble in sulphuric acid present at the shell side. No reaction zone is formed; it reacts
only at the interface. This behavior can be seen in Figure 11. (Mandowara and Bhattacharya,
2011)
Figure 11. Principle of the extraction process (Hasanoglu et al., 2010)
There are few studies on ammonia removal from wastewater. Zhu et al. (2005) reported a
study on the effect of the pH and the viscosity of the wastewater containing ammonia on the
mass transfer in hydrophobic hollow fiber membrane contactors. They carried out the
experiments at 20ºC at different feed solution pH values from 9 to 13 with ammonia
concentration varying from 50 to 10000 mg·L-1. They concluded that the removal of ammonia
was a function of solution pH, increasing with the increase of pH. When working at high pH
the removal was greater. Thus, for a pH above 11 was reached an ammonium removal of
98% in 40 minutes while for pH values of 10 and 9 removal was 60 and 25% respectively in
the same period of time. Tan et al. (2006) reported an ammonia removal with the same
behavior with the highest extraction at pH=11. The maximum removal of ammonia was
achieved above pH 11.

Ammonium removal from wastewater by liquid-liquid membrane contactors 27
8.2 Mathematical model development for the removal of ammonium from
aqueous solution using contactors
8.2.1 Close loop operation mode
Figure 12 shows a schematically set up of close loop operation mode.
Figure 12. Experimental setup (Lincon et al, 2012)
The hollow fibers modules describe in literature are generally configured in parallel and the
gas and liquid flow on the opposite sides of the membrane. The gas phase flowed either
outside (shell) or inside (lumen) of the hollow fiber membrane (Mansourizadeh, et al., 2009).
Under these conditions the following assumptions have been made by differents authors
(Mansourizadeh et al., 2009; Rezakazemi et al., 2012; Agrahari et al., 2012; Mandowara and
Bhattacharya, 2009; Klaassen et al., 2005) were considered:
Unsteady state and isothermal conditions.
Laminar flow for both streams in the hollow fiber membrane contactor
(HFMC).
Henry's law is applicable for feed-membrane interface (thermodynamic
equilibrium).
No pore blockage occurs.
Non-wetted mode for the membrane is assumed; in which the feed aqueous
solution do not fills the membrane pores (since the HFMC is hydrophobic; it
prevents passage of feed aqueous solution through the pores).
There is no reaction zone (the reaction of ammonia with the sulfuric acid is
fast (instantaneous) and always occurs in excess).
Flow rates of both ammonia solution and sulfuric acid are constant.
Feed tank operates at the perfect mixing mode.

28 Ammonium removal from wastewater by liquid-liquid membrane contactors
The transport of both ammonia and ammonium ions in the lumen is expressed through a
convective-diffusive equation (Mandowara and Bhattacharya, 2009):
jjjj
jRCDCU
t
C2~
(Eq. 6)
Where
Cj concentration of ammonia and ammonium ions (mol·m-3)
D diffusivity of the component in water (m2·s-1)
Rj rate of generation due to the chemical reaction (mol·s-1·m-3)
U velocity vector (m·s-1)
In this process there is no chemical reaction in the lumen side, so the symmetry assumed
inside the lumen is cylindrical (Mandowara and Bhattacharya, 2011):
0Cj
(Eq. 7)
0jR (Eq. 8)
Further, Ur (Radial velocity), which is due to the diffusion of ammonia in the radial direction,
also becomes zero. This is because the rate of diffusion of ammonia in water is negligible
and the flow is in the Z direction (Mandowara and Bhattacharya, 2009). Now, the equation 6
can be modified as follows:
2
21
Z
C
r
Cr
rrD
Z
CU
t
C jj
j
j
z
j
(Eq. 9)
Where the velocity distribution in the lumen side under laminar flow conditions can be written
(Kreulen et al., 1993) as
2
12)(R
rUrU z
(Eq. 10)
Ammonium removal from wastewater by liquid-liquid membrane contactors 29
Where
r radial coordinate (m)
R radius of the lumen (m)
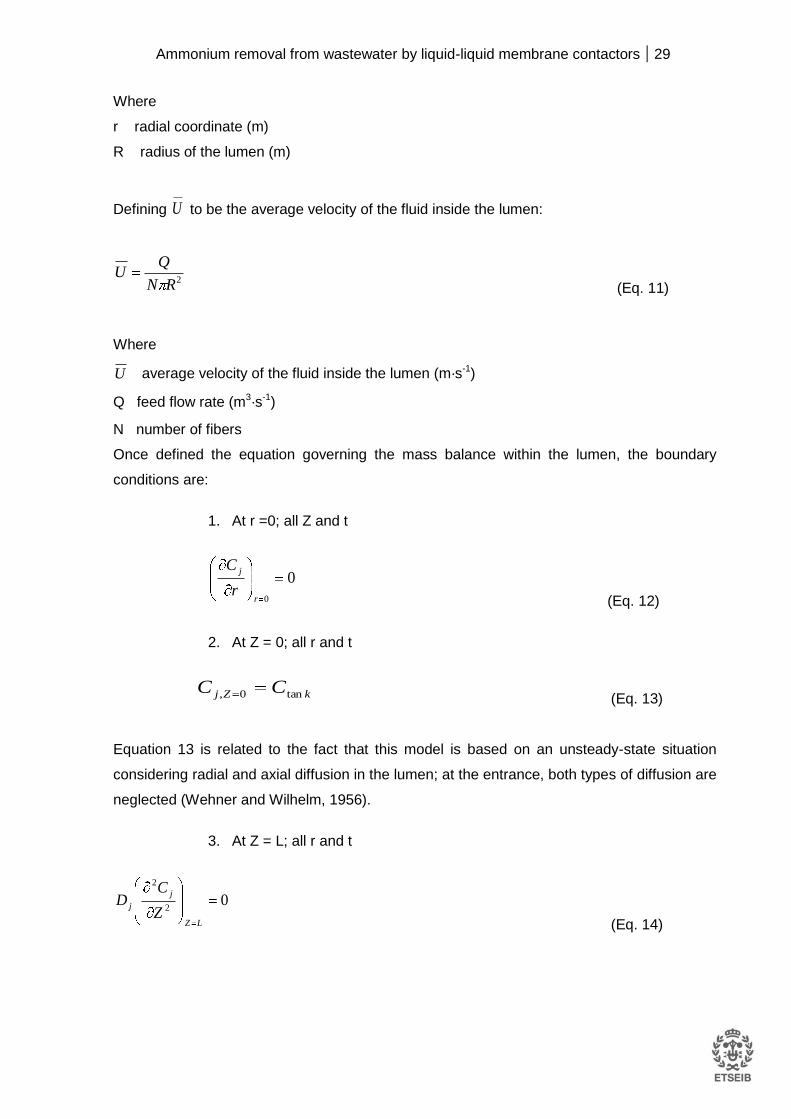
Defining U to be the average velocity of the fluid inside the lumen:
2RN
QU
(Eq. 11)
Where
U average velocity of the fluid inside the lumen (m·s-1)
Q feed flow rate (m3·s-1)
N number of fibers
Once defined the equation governing the mass balance within the lumen, the boundary
conditions are:
1. At r =0; all Z and t
0
0r
j
r
C
(Eq. 12)
2. At Z = 0; all r and t
kZj CC tan0, (Eq. 13)
Equation 13 is related to the fact that this model is based on an unsteady-state situation
considering radial and axial diffusion in the lumen; at the entrance, both types of diffusion are
neglected (Wehner and Wilhelm, 1956).
3. At Z = L; all r and t
02
2
LZ
j
jZ
CD
(Eq. 14)

30 Ammonium removal from wastewater by liquid-liquid membrane contactors
Equation 14 shows that the diffusion of ammonia at the exit of the lumen (in Z-direction) to be
negligible in comparison to its movement in the same direction due to flow.
4. At r = R, all Z and t
TR
pk
r
CD
g
ag
poreg
Rr
j
j
int,
,
(Eq. 15)
It can be seen that the flux of ammonia in aqueous phase equals the flux of the gaseous
ammonia diffused through the pore as defines equation 15. The concentration of ammonia at
the pore exit is assumed to be negligible. This is because an instantaneous reaction between
acid and ammonia takes place at the pore exit.
Additionally mass transfer coefficient inside the pore, kg, pore (m/s) can be defined as:
bDk porecaporeg ,,,
(Eq. 16)
Where
Da, c, pore diffusivity of ammonia (m2·s-1)
ε porosity of the membrane (dimensionless)
tortuosity of the pore (dimensionless)
b membrane thickness (m)
This correlation was estimated by Mandowara and Battacharya (2009), where the tortuosity
is given by (Bottino et al., 2008):
2
1
(Eq. 17)
Diffusivity is calculated (porecaD ,,
) by:
airaporeakporeca DDD ,,,,,
111
(Eq. 18)

Ammonium removal from wastewater by liquid-liquid membrane contactors 31
Where
Da,c,pore diffusivity of ammonia in the pore (m2·s-1)
Dk,a, pore Knudsen diffusion (m2·s-1)
Da,ai diffusivity of ammonia in the air (m2·s-1)
Further, the Knudsen diffusion poreakD ,,
is given by
2/1
,,
8
3 a
gpore
poreakM
TRdD
(Eq. 19)
Where
dpore diameter of pore (m)
Rg universal gas constant (J·mol-1·K-1)
T temperature (K)
Ma molecular weight of ammonia (g·mol-1)
As previously defined, Cj is the concentration of ammonia and ammonium ions (mol·m-3):
43 NHNHC j (Eq. 20)
Where
3NH
concentration of ammonia (mol·m-3)
4NH concentration of ammonium (mol·m-3)
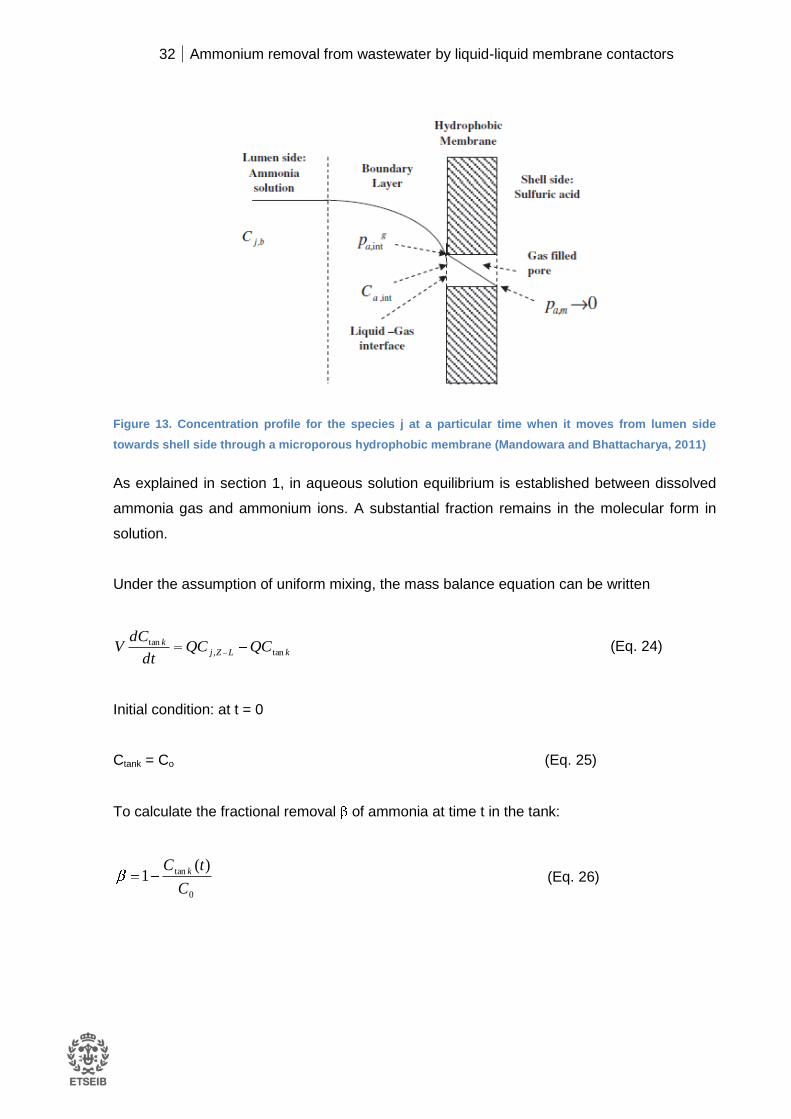
In the other hand, at the liquid-gas interface located at the pore interface (Figure 13), Henry’s
law may be applicable (Tan et al., 2006):
int3int, NHHP aag
(Eq. 21)
Where
Ha Henry’s constant (Pa ·m3·mol-1)
[NH3]int concentration of ammonia at liquid-gas interface (mol·m-3)
32 Ammonium removal from wastewater by liquid-liquid membrane contactors
Figure 13. Concentration profile for the species j at a particular time when it moves from lumen side
towards shell side through a microporous hydrophobic membrane (Mandowara and Bhattacharya, 2011)
As explained in section 1, in aqueous solution equilibrium is established between dissolved
ammonia gas and ammonium ions. A substantial fraction remains in the molecular form in
solution.
Under the assumption of uniform mixing, the mass balance equation can be written
kLZjk QCQC
dt
dCV tan,
tan (Eq. 24)
Initial condition: at t = 0
Ctank = Co (Eq. 25)
To calculate the fractional removal of ammonia at time t in the tank:
0
tan )(1
C
tC k (Eq. 26)
Ammonium removal from wastewater by liquid-liquid membrane contactors 33
8.2.2 Open loop operation mode
For open loop operation configuration was used the same model but boundary conditions
were modified:
1. At steady state in the Eq. 9
0t
C j (Eq. 26)
2. At Z = 0; all r and t
Cj, Z=0 = Ctank (Eq. 27)
In open loop operation mode the initial ammonia concentration is the same that the
concentration tank.
9. Objectives and Methodology
9.1 Objectives
The aim of this master project is the elimination of ammonia from the stream entering the
Membranes distillation in Greenlysis pilot plant. For this purpose liquid-liquid contactors will
used considering the advantages offered by this technology compared to conventional
techniques as has been summarized in state of the art.
The main objective is to investigate and evaluate the hollow fiber membrane contactors
performance for ammonia removal from aqueous solutions under different processing
conditions and to define the operational parameters necessary to remove ammonia
efficiently. The parameters to be evaluated are
Initial concentrations of the ammonia and sulfuric acid solutions
the pH of the ammonia feed solution
the flow-rate feed stream
Use of different types of water: Tap water, MilliQ and wastewater from the pilot plant.
Modeling the ammonium removal by membrane contactors by numerical solution of
the governing equations.
34 Ammonium removal from wastewater by liquid-liquid membrane contactors
9.2 Methodology
9.2.1 Reagents
The feeding solution was prepared by dissolving ammonium chloride in 10 L of water for
concentrations between 5 and 15 ppm. NaOH solutions were used to achieve pH values
higher than the usual value of pKa and shift the equilibrium to the predominant free molecular
NH3. To keep constant pH value during all experimental time a borax buffer was used. The
receiving solution was prepared dissolving 5 ml of H2SO4 98-99% v/v in 5 L of water.
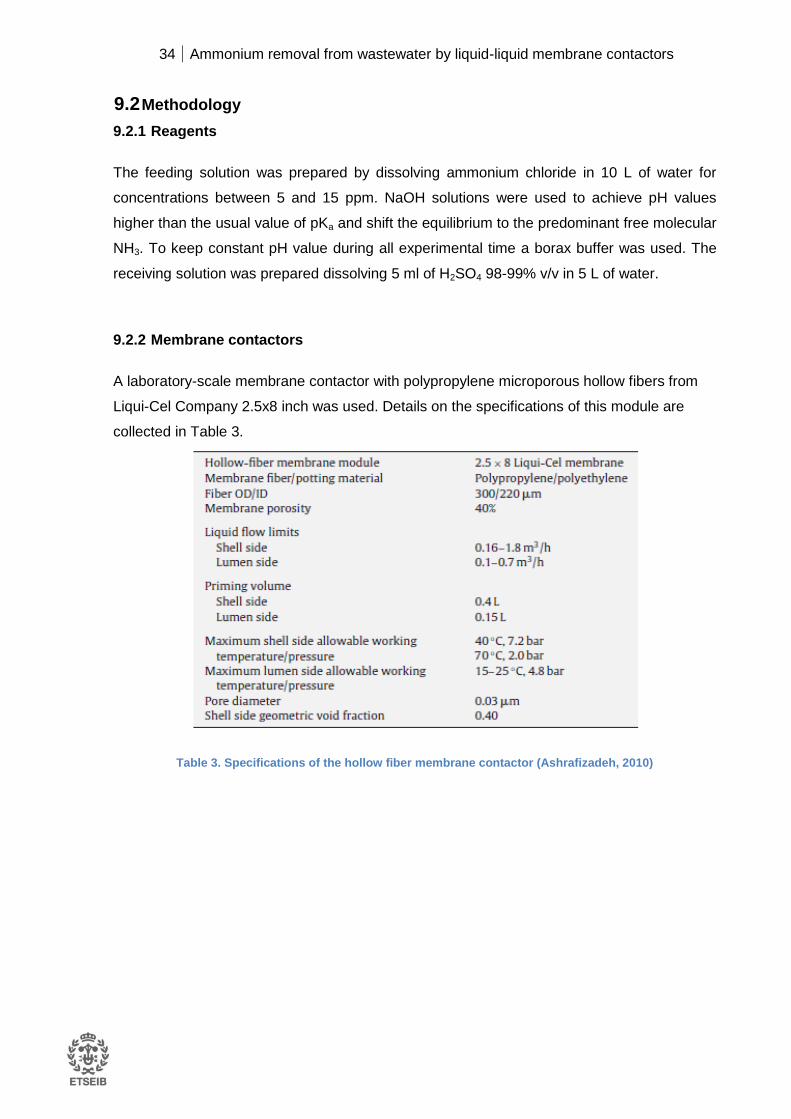
9.2.2 Membrane contactors
A laboratory-scale membrane contactor with polypropylene microporous hollow fibers from
Liqui-Cel Company 2.5x8 inch was used. Details on the specifications of this module are
collected in Table 3.
Table 3. Specifications of the hollow fiber membrane contactor (Ashrafizadeh, 2010)

Ammonium removal from wastewater by liquid-liquid membrane contactors 35
Figure 14 shows the internal structure of the membrane contactor.
Figure 14. a) Cross section of a membrane module showing the fibers. b) Hollow fiber with the transport
phenomena. c) Membrane contactor. d) Side view of the entrance to the hollow fibers. (Licon et al, 2012)
9.2.3 Experimental procedure
The operating conditions of the close and open loop mode have been summarized in Table
4.
Parameter Interval of values Unit
Temperature 18-22 ºC
Flow rate 0.16-0.26 l/min
pH feed solution 9.27-10.4 -
pH receiving solution 1.88-2 -
Ammonia concentration in the feed 5-25 ppm
Table 4. Operation conditions in the experiments

36 Ammonium removal from wastewater by liquid-liquid membrane contactors
Experimental configurations:
Figure 15. Membrane contactor operated by liquid-liquid extraction (Close loop configuration)
(Mandowara and Bhattacharya, 2011)
Figure 15 shows the setup for ammonia removal in close loop configuration. The ammonia
feed solution is pumped through the lumen of the hollow-fiber membrane, while the stripping
solution containing sulfuric acid is pumped into the shell side of the hollow-fiber membrane.
Both solutions are recycled to their respective reservoirs (Licon et al, 2012)
Figure 16. Membrane contactor for the removal of dissolved ammonia (Open loop configuration)
(Mandowara and Bhattacharya, 2009)
Figure 16 shows the setup for ammonia removal in open loop configuration. The process is
similar, but the ammonia feed solution is not recycled.
At the end of the experiment, the shell-side flow and the tube-side flow were stopped. The
system was properly shut down and thoroughly cleaned by passing deionized water through
both sides to remove the remaining solution.

Ammonium removal from wastewater by liquid-liquid membrane contactors 37
9.2.4 Monitoring protocol
The procedure for sampling in closed circuit was as follows:
1. At regular time intervals (10 minutes) 5mL samples were taken from the tank of feed
solution. In total, 18 samples were collected by each experiment..
2. The pH was measured by pH meter GLP22 Crison, Spain.
3. The samples were prepared for determined the ammonia concentration by ion
exchange chromatography.
The procedure for sampling in open circuit was as follows:
1. For the first experiments in open loop configuration, samples were taken every 5
minutes, obtaining 21 samples for each experiment. Once evolution was determined,
the samples were taken every 10 minutes, reducing the number of samples to 10-13
for experiment depending on the flow rate.
2. The pH was measured by pH meter GLP22 Crison, Spain.
3. The samples were prepared for determined the ammonia concentration by ion
exchange chromatography.
38 Ammonium removal from wastewater by liquid-liquid membrane contactors
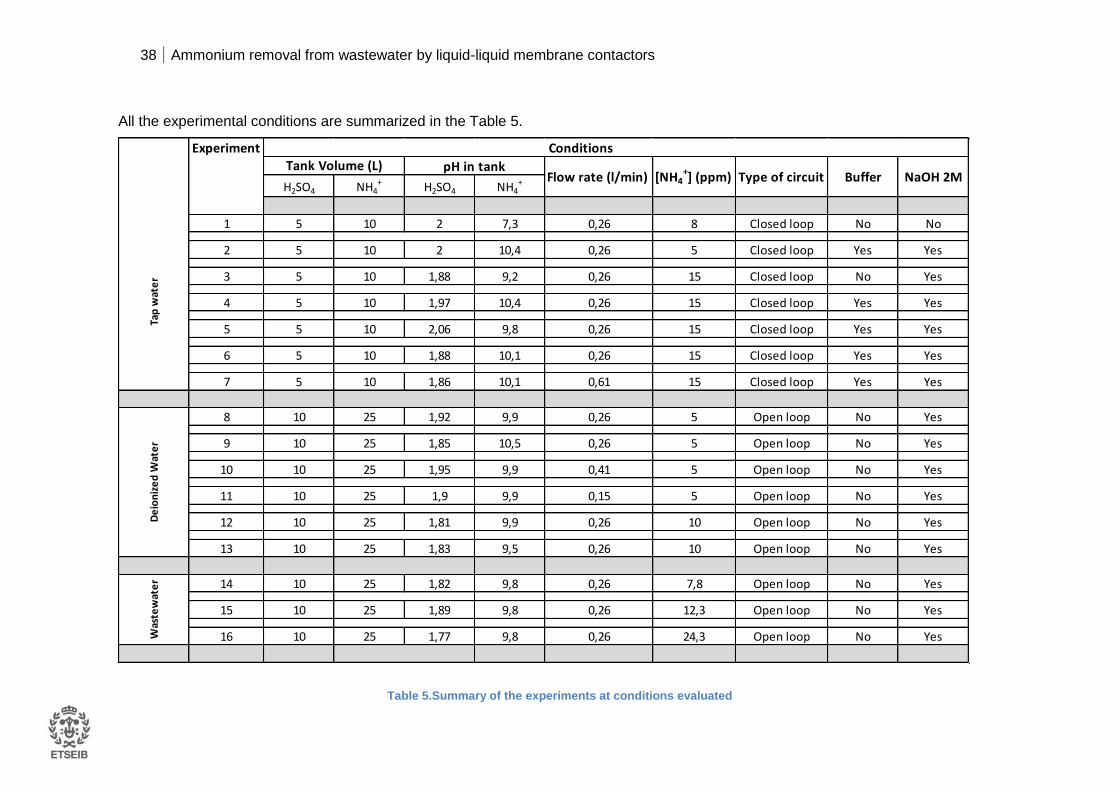
All the experimental conditions are summarized in the Table 5.
Table 5.Summary of the experiments at conditions evaluated
Experiment
H2SO4 NH4+ H2SO4 NH4
+
1 5 10 2 7,3 0,26 8 Closed loop No No
2 5 10 2 10,4 0,26 5 Closed loop Yes Yes
3 5 10 1,88 9,2 0,26 15 Closed loop No Yes
4 5 10 1,97 10,4 0,26 15 Closed loop Yes Yes
5 5 10 2,06 9,8 0,26 15 Closed loop Yes Yes
6 5 10 1,88 10,1 0,26 15 Closed loop Yes Yes
7 5 10 1,86 10,1 0,61 15 Closed loop Yes Yes
8 10 25 1,92 9,9 0,26 5 Open loop No Yes
9 10 25 1,85 10,5 0,26 5 Open loop No Yes
10 10 25 1,95 9,9 0,41 5 Open loop No Yes
11 10 25 1,9 9,9 0,15 5 Open loop No Yes
12 10 25 1,81 9,9 0,26 10 Open loop No Yes
13 10 25 1,83 9,5 0,26 10 Open loop No Yes
14 10 25 1,82 9,8 0,26 7,8 Open loop No Yes
15 10 25 1,89 9,8 0,26 12,3 Open loop No Yes
16 10 25 1,77 9,8 0,26 24,3 Open loop No YesWas
tew
ate
r
BufferType of circuit[NH4+] (ppm)Flow rate (l/min)
pH in tankD
eio
niz
ed
Wat
er
NaOH 2M
Tap
wat
er
Tank Volume (L)Conditions
Ammonium removal from wastewater by liquid-liquid membrane contactors 39
10. Results and discussion
The evolution of the different parameters evaluated on each experiment is collected in Annex
1. The quantification of the efficiency (% removal NH4+) of the liquid-liquid membrane
contactors on ammonia removal was calculated by using equation 28:
100)(%
)0(
)()0(
4
4
44
tNH
tNHtNH
C
CCNHremoval
(Eq. 28)
Where
)0(4 tNHC
is the total ammonium concentration at t=o
)(4 tNHC
is the total ammonium concentration at time (t)
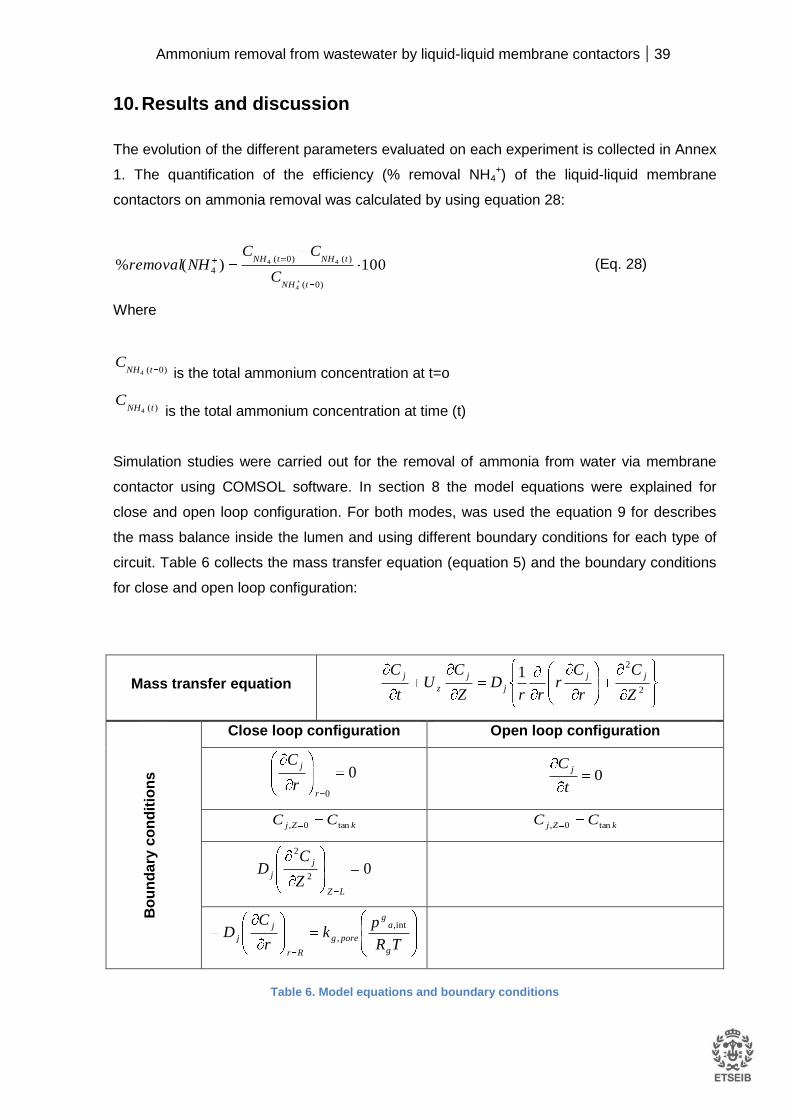
Simulation studies were carried out for the removal of ammonia from water via membrane
contactor using COMSOL software. In section 8 the model equations were explained for
close and open loop configuration. For both modes, was used the equation 9 for describes
the mass balance inside the lumen and using different boundary conditions for each type of
circuit. Table 6 collects the mass transfer equation (equation 5) and the boundary conditions
for close and open loop configuration:
Mass transfer equation 2
21
Z
C
r
Cr
rrD
Z
CU
t
C jj
j
j
z
j
Bo
un
da
ry c
on
dit
ion
s
Close loop configuration Open loop configuration
0
0r
j
r
C 0
t
C j
kZj CC tan0,
kZj CC tan0,
02
2
LZ
j
jZ
CD
TR
pk
r
CD
g
ag
poreg
Rr
j
j
int,
,
Table 6. Model equations and boundary conditions

40 Ammonium removal from wastewater by liquid-liquid membrane contactors
The mathematical model and the experimental results enabled to obtain the next
characteristics parameters of the membrane.
Inner radius of the lumen, di (m)
Length of the fiber, L (m)
Diffusivity of ammonia, Da, air (m2/s)
Diffusivity in water, Dj (m2/s)
Dissociation constant of ammonia, Kb
It has been used the values stated in Mandowara (2011) as initial values to perform the non-
linear least squares method in order to estimate them, since the experimental module and
close loop configuration is the same used in the presented study. Table 7 shows the nominal
values of these parameters. Then the diffusion coefficient (Da,c,pore) and mass transfer
coefficient (ka, g, pore) where calculated with the obtained data by the equations 16-19.
Parameter Value
Inner radius of the lumen, di (m) 1.1 · 10-4
Length of the fibre, L (m) 0,2
Diffusivity in water, Dj (m2/s) 1.76 · 10-9
Diffusivity in air, Da,air (m2/s) 1.89 · 10-5
Dissociation constant of ammonia,Kb 1.744 · 10-5
Table 7. Initial values of parameters to be estimated
Ammonium removal from wastewater by liquid-liquid membrane contactors 41
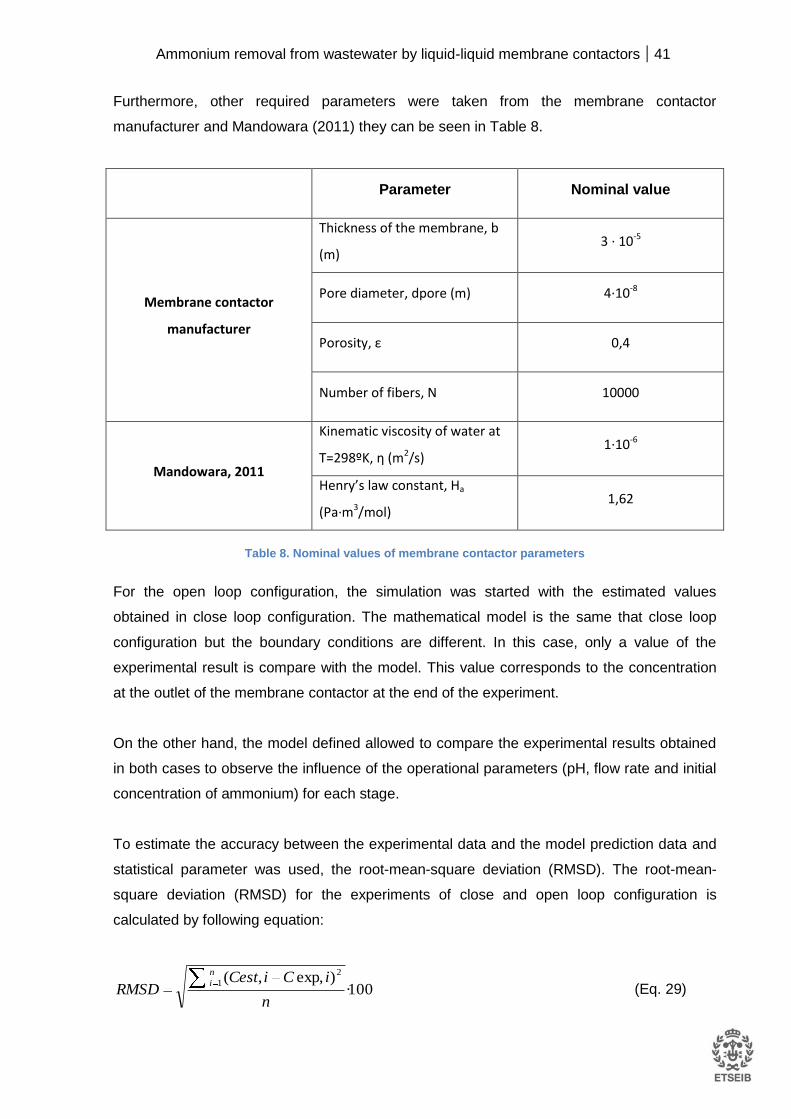
Furthermore, other required parameters were taken from the membrane contactor
manufacturer and Mandowara (2011) they can be seen in Table 8.
Parameter Nominal value
Membrane contactor
manufacturer
Thickness of the membrane, b
(m) 3 · 10-5
Pore diameter, dpore (m) 4·10-8
Porosity, ε 0,4
Number of fibers, N 10000
Mandowara, 2011
Kinematic viscosity of water at
T=298ºK, η (m2/s) 1·10-6
Henry’s law constant, Ha
(Pa·m3/mol) 1,62
Table 8. Nominal values of membrane contactor parameters
For the open loop configuration, the simulation was started with the estimated values
obtained in close loop configuration. The mathematical model is the same that close loop
configuration but the boundary conditions are different. In this case, only a value of the
experimental result is compare with the model. This value corresponds to the concentration
at the outlet of the membrane contactor at the end of the experiment.
On the other hand, the model defined allowed to compare the experimental results obtained
in both cases to observe the influence of the operational parameters (pH, flow rate and initial
concentration of ammonium) for each stage.
To estimate the accuracy between the experimental data and the model prediction data and
statistical parameter was used, the root-mean-square deviation (RMSD). The root-mean-
square deviation (RMSD) for the experiments of close and open loop configuration is
calculated by following equation:
100·)exp,,( 2
1
n
iCiCestRMSD
n
i (Eq. 29)

42 Ammonium removal from wastewater by liquid-liquid membrane contactors
Cta
nk/C
o
10.1 Results and discussion for close loop operation mode
The experiments performed in closed loop configuration were performed by using tap water
and most of these experiments were carried out in order to optimize the experimental
conditions for close loop configuration.
The effect of the feed solution pH was evaluated at pH ranged from 9.3 to 10.4. The
ammonium removal was observed at pH values below the pKa as can be seen in Figure 17.
The experiment performed at pH 9.3 observed a low (10%) removal efficiency compared to
higher removals obtained for the experiments at pH 10.4 and 10.1 with removals above 90%.
Then, the following experiments were carried out at pH values above pKa.
Figure 17. Influence of feed solution pH on the fractional removal in the close loop configuration, with
flow rate 0.26 l/min and initial ammonium concentration of 15 ppm. Comparison between simulated
values and experimental data.
Table 9 shows the influence of the pH in the ammonia removal process. In values above
pH=10 the removal efficiency is higher than 99%. The increases of pH increases the
percentage of the NH3 in the aqueous feed solution concentration as could be seen in
section 4.1 (Figure 2). The root-mean-square deviations (RMSD) determine the agreement
between the mathematical model and the experimental data. The values observed were
below 6% indicating the good fitting of the experimental data to the mathematical model.
Time (s)
Ammonium removal from wastewater by liquid-liquid membrane contactors 43
Time (s)
Flow rate
(l/min) [NH4
+] (ppm) Type of circuit
0.26 15 Close loop
Experiment pH (NH4+) % Removal
Removal Time
(min) RMSD (%)
3 9.3 15 180 1.37
4 10.4 100 140 3.47
6 10.1 100 150 5.39
Table 9. Experimental results and RMSD with variable pH in close loop configuration with flow rate 0.26
l/min and initial concentration of ammonium of 15 ppm
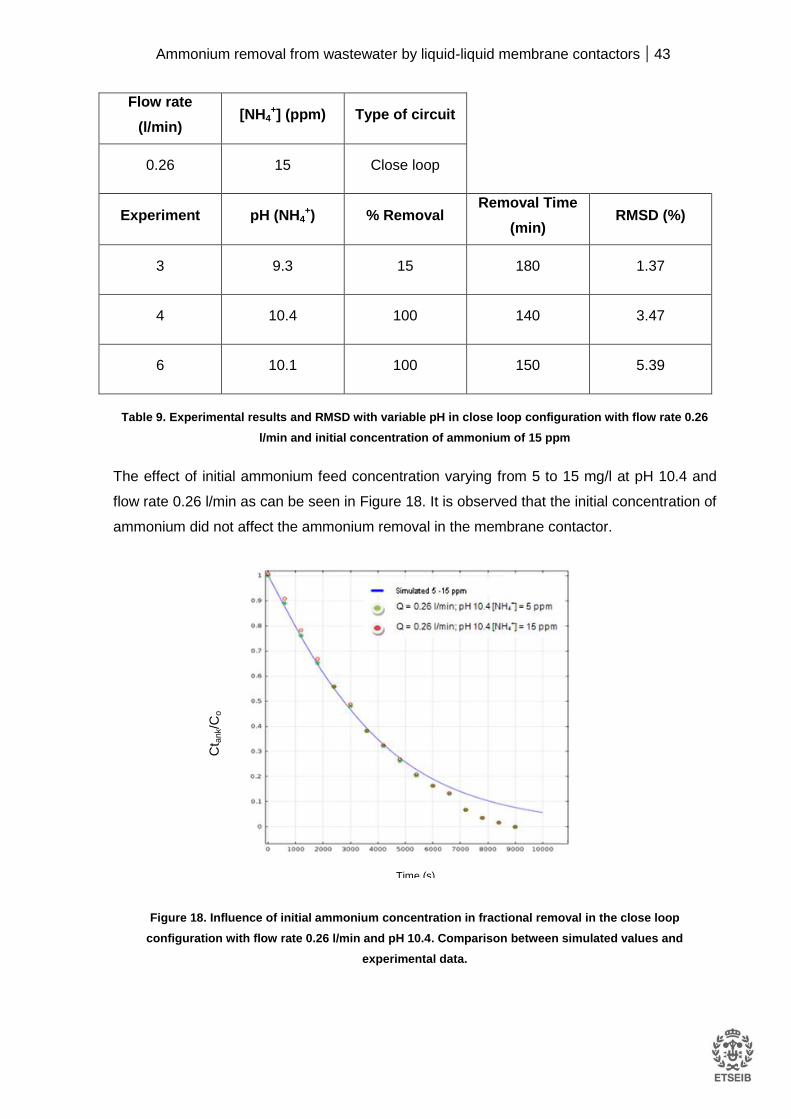
The effect of initial ammonium feed concentration varying from 5 to 15 mg/l at pH 10.4 and
flow rate 0.26 l/min as can be seen in Figure 18. It is observed that the initial concentration of
ammonium did not affect the ammonium removal in the membrane contactor.
Figure 18. Influence of initial ammonium concentration in fractional removal in the close loop
configuration with flow rate 0.26 l/min and pH 10.4. Comparison between simulated values and
experimental data.
Ct a
nk/C
o

44 Ammonium removal from wastewater by liquid-liquid membrane contactors
The initial concentration of ammonia is a parameter that not has influences in the removal
process. This behavior is predicted by the fact that the diffusivity coefficient is a weak
function of ammonia concentration, especially in the dilute range. The resistance offered by
the overall process to the ammonia removal becomes independent of the initial ammonia
concentration. The small difference that can be observed in Figure 18 between the
experimental and predicted values is probably due to the evaporation of ammonia from the
feed tank during the experimentation.
Table 10 shows the experimental conditions and the results of the influence of initial
concentration in the ammonium removal. It is observed that NH4+ concentration in the
aqueous feed is not an influence factor in the ammonium removal process. In Table 10 can
be seen the deviation between the experimental data with the mathematical model (<5%).
Flow rate
(l/min) pH (NH4
+) Type of circuit
0.26 10.4 Close loop
Experiment [NH4+] (ppm) % Removal
Removal Time
(min) RMSD (%)
2 5 100 150 4.10
4 15 100 150 3.80
Table 10. Experimental results and RMSD with variable initial concentration in close loop configuration
with flow rate 0.26 l/min and pH 10.4
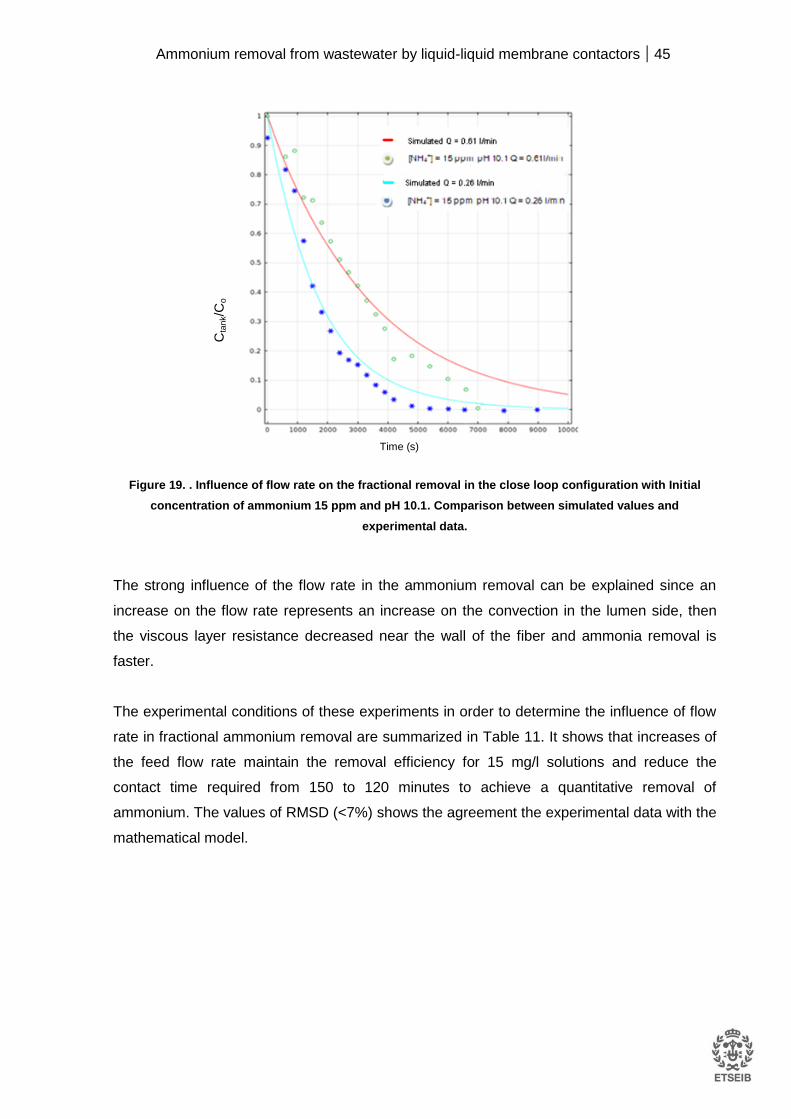
Finally, in order to determine the influence of flow rate in the ammonia removal in a close
loop configuration a comparison of simulation and experimental results is reported in Figure
19. The experiments had been carried out with initial concentration of ammonium of 15 ppm
and pH 10.1. The flow rate had been varied from 0.26 l/min to 0.61 l/min. It is observed that
this parameter has strong influence in the removal ammonium time. When increases the flow
rate the removal time decreases.
Ammonium removal from wastewater by liquid-liquid membrane contactors 45
Figure 19. . Influence of flow rate on the fractional removal in the close loop configuration with Initial
concentration of ammonium 15 ppm and pH 10.1. Comparison between simulated values and
experimental data.
The strong influence of the flow rate in the ammonium removal can be explained since an
increase on the flow rate represents an increase on the convection in the lumen side, then
the viscous layer resistance decreased near the wall of the fiber and ammonia removal is
faster.
The experimental conditions of these experiments in order to determine the influence of flow
rate in fractional ammonium removal are summarized in Table 11. It shows that increases of
the feed flow rate maintain the removal efficiency for 15 mg/l solutions and reduce the
contact time required from 150 to 120 minutes to achieve a quantitative removal of
ammonium. The values of RMSD (<7%) shows the agreement the experimental data with the
mathematical model.
Cta
nk/C
o
Time (s)

46 Ammonium removal from wastewater by liquid-liquid membrane contactors
[NH4+] (ppm) pH (NH4
+) Type of circuit
15 10.1 Close loop
Experiment Flow rate
(l/min) % Removal
Removal Time
(min) RMSD (%)
6 0.26 100 150 5.60
7 0.61 100 120 6.80
Table 11. Experimental results and RMSD with variable flow rate in close loop configuration with initial
concentration of ammonium of 15 ppm and pH 10.1
According to the obtained results it is possible to define the optimal experimental conditions
for ammonium removal in close loop configuration. These conditions are summarized in
Table 12.
Close loop configuration pH [NH4+] Flow rate (l/min)
Optimal conditions >9.3
<10.5 0.61
Table 12. Optimal work conditions in close loop configuration
All experiments of close loop configuration are summarized in the Annex 2.
Ammonium removal from wastewater by liquid-liquid membrane contactors 47
10.2 Results and discussion for open loop operation mode
Based on the results obtained in closed circuit experiments, in open loop configuration were
performed in order to evaluate the influence of pH, initial concentration and flow rate in the
ammonium removal.
The experiments in open loop configuration were performed by using deionized water and
wastewater from the pilot plant. The most of the experiments with deionized water were
performed in order to optimize the experimental conditions in open loop configuration. Then,
considering these conditions were carried out the experimental with wastewater from the
plant to achieve maximum ammonium removal.
Experiment results by using Deionized water
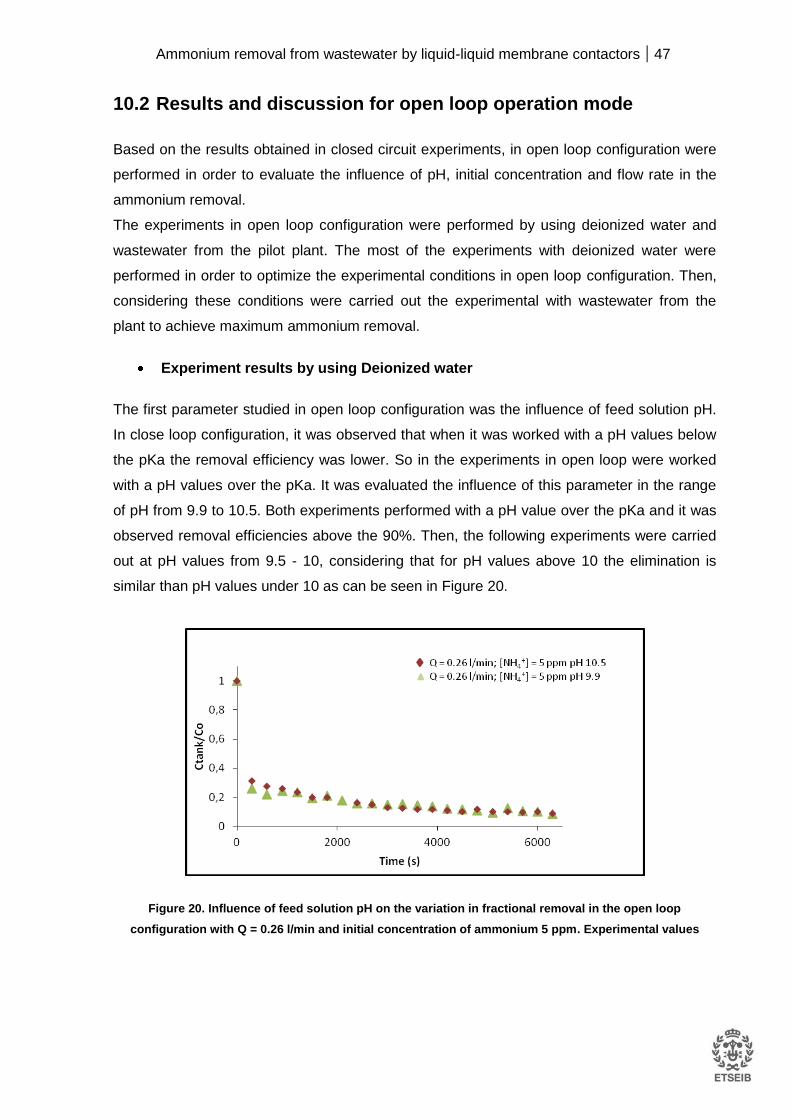
The first parameter studied in open loop configuration was the influence of feed solution pH.
In close loop configuration, it was observed that when it was worked with a pH values below
the pKa the removal efficiency was lower. So in the experiments in open loop were worked
with a pH values over the pKa. It was evaluated the influence of this parameter in the range
of pH from 9.9 to 10.5. Both experiments performed with a pH value over the pKa and it was
observed removal efficiencies above the 90%. Then, the following experiments were carried
out at pH values from 9.5 - 10, considering that for pH values above 10 the elimination is
similar than pH values under 10 as can be seen in Figure 20.
Figure 20. Influence of feed solution pH on the variation in fractional removal in the open loop
configuration with Q = 0.26 l/min and initial concentration of ammonium 5 ppm. Experimental values

48 Ammonium removal from wastewater by liquid-liquid membrane contactors
The experimental conditions and the results in open loop configuration with flow rate (0.26
l/min) and ammonia concentration (5 mg/l) removal ratio of ammonium achieved values of
91-92 % as can be seen in Table 13. The root-mean-square deviation (RMSD) which can be
seen in Table 13 belongs to the experimental data deviate from the mathematical model for
the experiments compared.
Flow rate
(l/min) [NH4
+] (ppm) Type of circuit
0.26 5 Open loop
Experiment pH (NH4+) % Removal
Removal Time
(min) RMSD (%)
8 9.9 92 105
2.70
9 10.5 91 105
Table 13. Experimental results and RMSD with variable pH in open loop configuration with flow rate 0.26
l/min and initial concentration of ammonium 5 ppm
The influence of flow rate in the ammonium removal efficiency in open loop configuration is
shown in Figure 21. The experiments were performed with pH 9.9 and initial concentration of
ammonia of 5 ppm. The behavior observed was the decreases ammonia removal when the
flow rate increases. This is due to increment of residential time inside the membrane
contactor.
¸
Figure 21. Influence of flow rate on the variation in fractional removal in the open loop configuration with
pH 9.9 and initial concentration of ammonium 5 ppm. Experimental values
Ammonium removal from wastewater by liquid-liquid membrane contactors 49
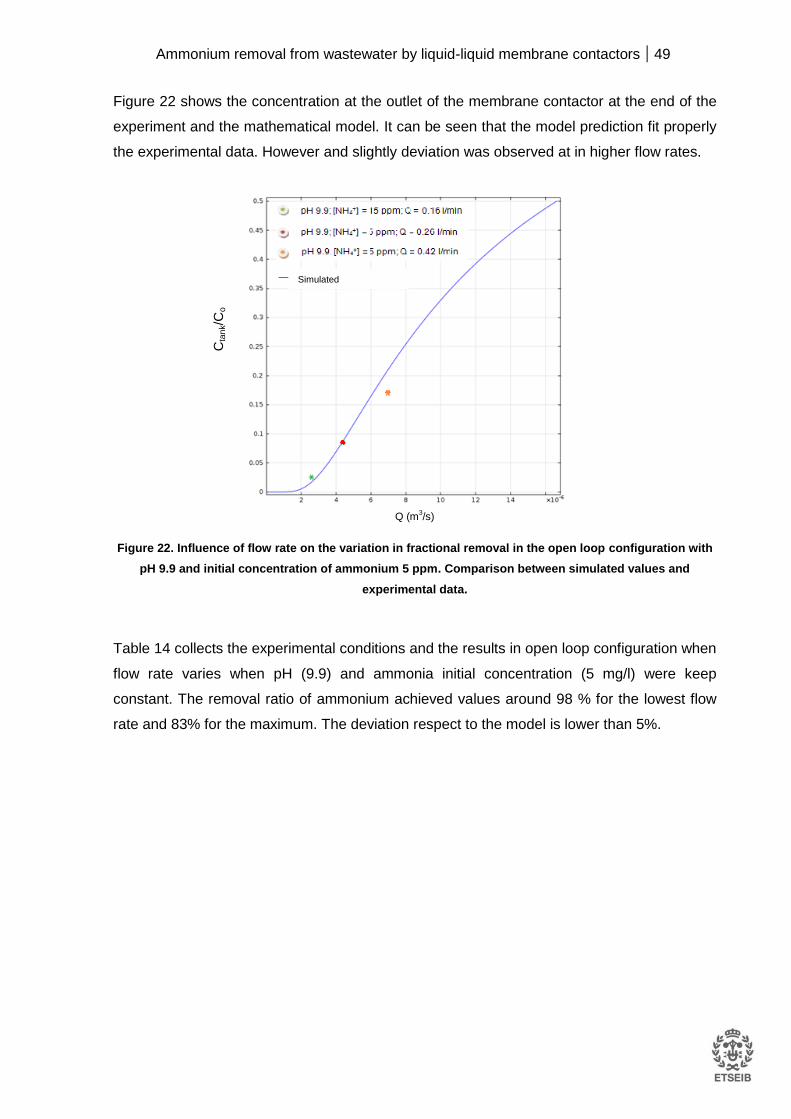
Figure 22 shows the concentration at the outlet of the membrane contactor at the end of the
experiment and the mathematical model. It can be seen that the model prediction fit properly
the experimental data. However and slightly deviation was observed at in higher flow rates.
Figure 22. Influence of flow rate on the variation in fractional removal in the open loop configuration with
pH 9.9 and initial concentration of ammonium 5 ppm. Comparison between simulated values and
experimental data.
Table 14 collects the experimental conditions and the results in open loop configuration when
flow rate varies when pH (9.9) and ammonia initial concentration (5 mg/l) were keep
constant. The removal ratio of ammonium achieved values around 98 % for the lowest flow
rate and 83% for the maximum. The deviation respect to the model is lower than 5%.
Simulated
Q (m3/s)
Cta
nk/C
o

50 Ammonium removal from wastewater by liquid-liquid membrane contactors
pH (NH4+) [NH4
+] (ppm) Type of circuit
9.9 5 Open loop
Experiment Flow rate
(l/min) % Removal
Removal Time
(min) RMSD (%)
11 0.16 98 100
2.29 8 0.26 92 105
10 0.42 83 60
Table 14. Experimental results and RMSD with variable flow rate in open loop configuration with initial
concentration of ammonium of 5 ppm and pH 9.9
The influence of initial concentration of ammonium has been seen in Figure 23. The
experiments have been performed with a constant flow rate (0.26 l/min) and pH of 9.9.The
experimental results of higher initial concentration of ammonium does not show a clear
tendency, but it was observed at the end of the experiment that the removal efficiency is
higher (92%) for the 5 ppm of initial concentration. Then, in open loop configuration, the
influence of the initial concentration in the removal process is a key parameter to be
considered.
Figure 23. Influence of initial concentration on the variation in fractional removal in the open loop
configuration with pH 9.9 and Q = 0.26 l/min. Experimental values

Ammonium removal from wastewater by liquid-liquid membrane contactors 51
The increase of concentration from 5 mg/l to 10 mg/l at constant pH and flow rate decreases
the removal efficiency from 92% to 88% as can be seen in Table 15. The root-mean-square
deviations (RMSD) which also are summarized in Table 15 showed values below 5% which
indicates that model prediction fit properly the experimental data.
pH (NH4+)
Flow rate
(l/min) Type of circuit
9.9 0.26 Open loop
Experiment [NH4+] (ppm) % Removal
Removal Time
(min) RMSD (%)
8 5 92 105
3.04
12 10 88 110
Table 15. Experimental results and RMSD with variable initial concentration of ammonium in open loop
configuration
The optimal parameters for ammonium removal in open loop configuration it can be seen in
Table 16.
Open loop configuration pH [NH4+] Flow rate (l/min)
Optimal conditions >9.3
<10 0.16
Table 16. Optimal work conditions in open loop configuration
As was observed in open loop configuration, the optimum pH value should be above the
pKa. On the other hand, the flow rate, in this case, should below compared to close loop
configuration, in order to increase the residence time and then the removal of ammonium is
favored.
52 Ammonium removal from wastewater by liquid-liquid membrane contactors
Experiment results by using Wastewater
Once the optimal parameters for the efficiency of ammonium removal were determined the
pilot plant wastewater was used in the following experiments. The pH of the feed solution
was the optimum (9.3 - 10), while the flow used was 0.26 l/min although the optimum flow is
lower, the difference in the removal of ammonium was not significant as reported in Figure
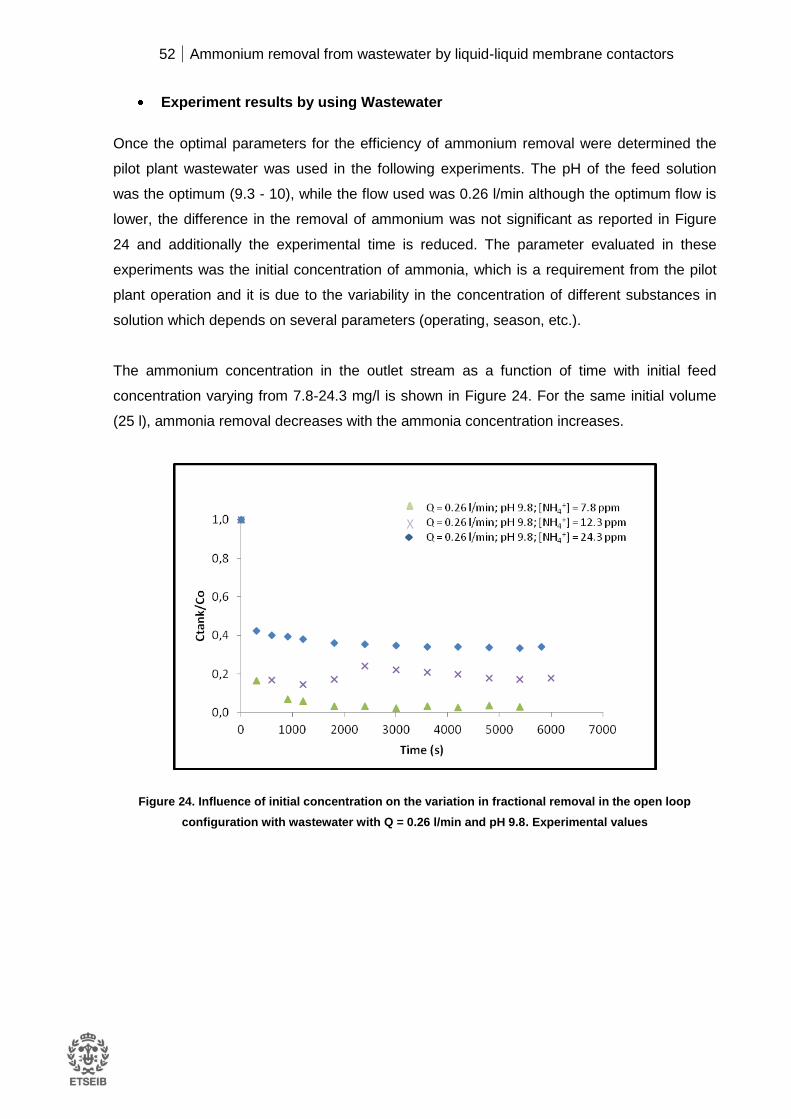
24 and additionally the experimental time is reduced. The parameter evaluated in these
experiments was the initial concentration of ammonia, which is a requirement from the pilot
plant operation and it is due to the variability in the concentration of different substances in
solution which depends on several parameters (operating, season, etc.).
The ammonium concentration in the outlet stream as a function of time with initial feed
concentration varying from 7.8-24.3 mg/l is shown in Figure 24. For the same initial volume
(25 l), ammonia removal decreases with the ammonia concentration increases.
Figure 24. Influence of initial concentration on the variation in fractional removal in the open loop
configuration with wastewater with Q = 0.26 l/min and pH 9.8. Experimental values

Ammonium removal from wastewater by liquid-liquid membrane contactors 53
The concentration at the outlet of the membrane contactor at the end of the experiment and
the mathematical model prediction are shown in Figure 25. It can be observed that model
description is quite good when compared to the experimental data and an slightly deviation is
observed at higher flow rate as was observed previously in section 10.1. The general
deviation of this parameter can be seen in Table 17.
Figure 25. Influence of flow rate on the variation in fractional removal in open loop configuration with Q =
0.26 l/min and pH 9.8. Comparison between simulated values and experimental data.
Table 17 shows the experimental conditions and the results of the experiments with
wastewater. The increase of concentration from 7.8 mg/l to 24.3 mg/l at constant pH and flow
rate decreases the removal efficiency from 97% to 66%. The deviation with the mathematical
model is >5%. One reason may be the existence of other species in solution because it was
worked wastewater from the plant and the mathematical model was designed for the
deionized water.
Ctank (ppm)
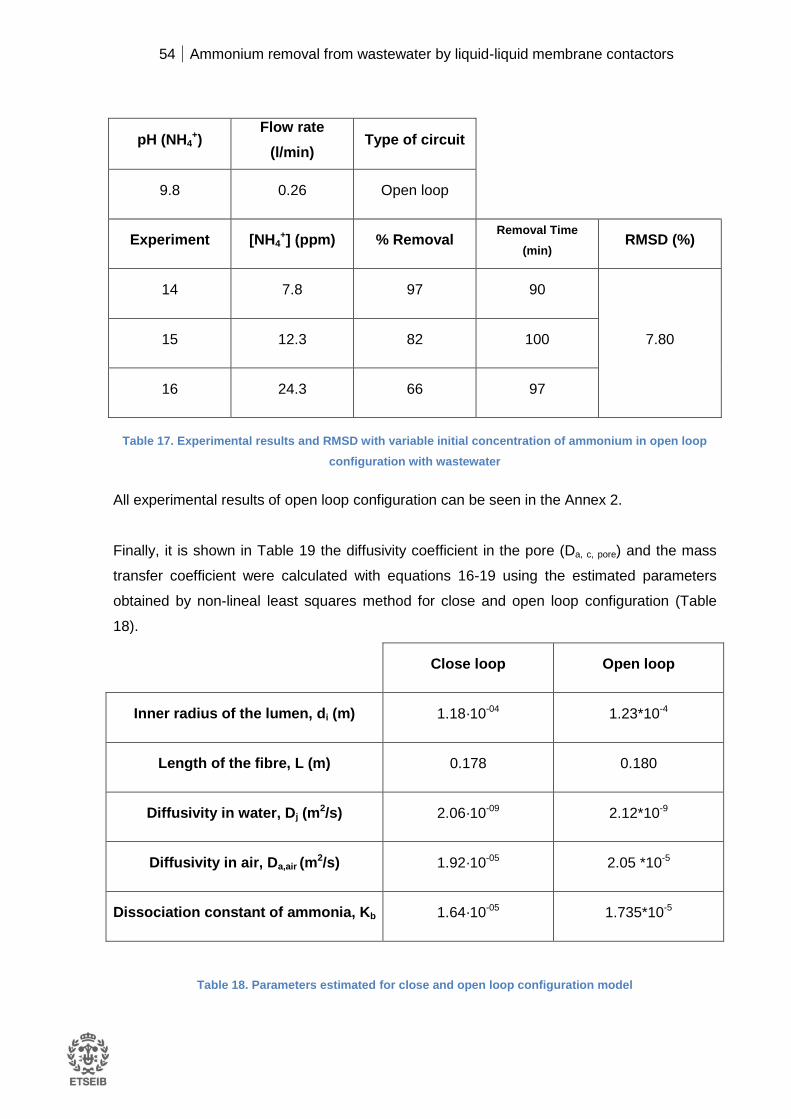
54 Ammonium removal from wastewater by liquid-liquid membrane contactors
pH (NH4+)
Flow rate
(l/min) Type of circuit
9.8 0.26 Open loop
Experiment [NH4+] (ppm) % Removal
Removal Time
(min) RMSD (%)
14 7.8 97 90
7.80 15 12.3 82 100
16 24.3 66 97
Table 17. Experimental results and RMSD with variable initial concentration of ammonium in open loop
configuration with wastewater
All experimental results of open loop configuration can be seen in the Annex 2.
Finally, it is shown in Table 19 the diffusivity coefficient in the pore (Da, c, pore) and the mass
transfer coefficient were calculated with equations 16-19 using the estimated parameters
obtained by non-lineal least squares method for close and open loop configuration (Table
18).
Close loop Open loop
Inner radius of the lumen, di (m) 1.18·10-04 1.23*10-4
Length of the fibre, L (m) 0.178 0.180
Diffusivity in water, Dj (m2/s) 2.06·10-09 2.12*10-9
Diffusivity in air, Da,air (m2/s) 1.92·10-05 2.05 *10-5
Dissociation constant of ammonia, Kb 1.64·10-05 1.735*10-5
Table 18. Parameters estimated for close and open loop configuration model
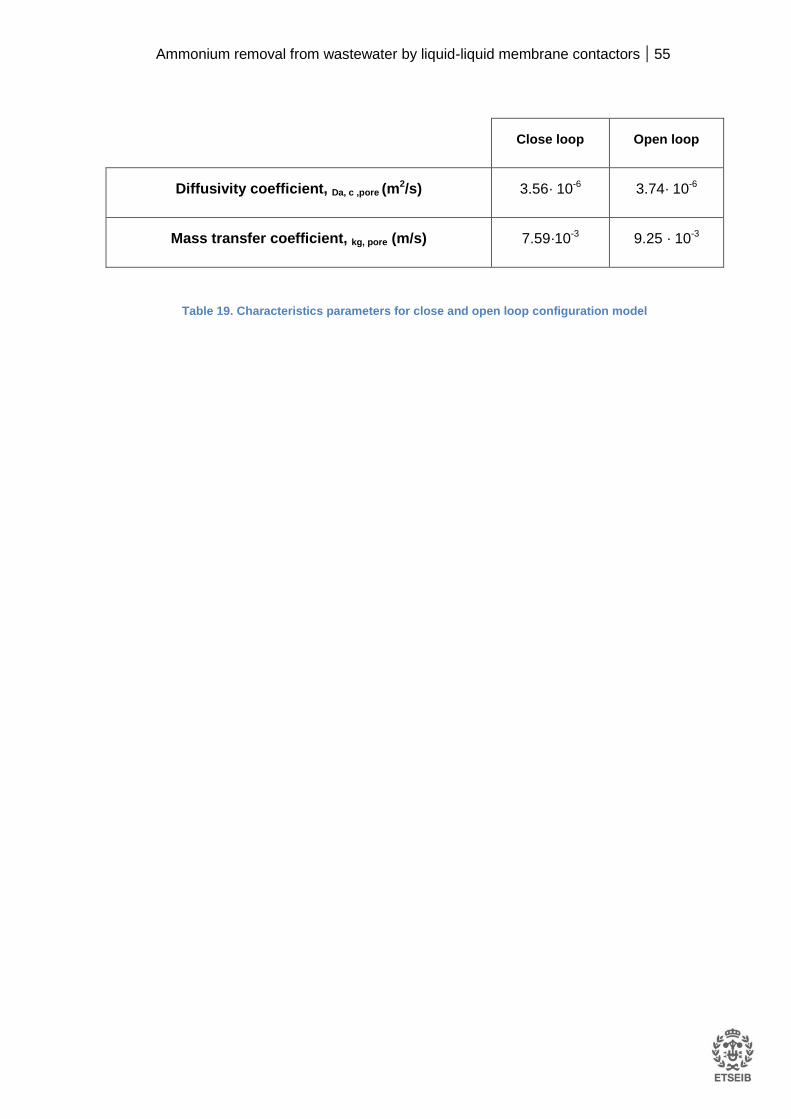
Ammonium removal from wastewater by liquid-liquid membrane contactors 55
Close loop Open loop
Diffusivity coefficient, Da, c ,pore (m2/s) 3.56· 10-6 3.74· 10-6
Mass transfer coefficient, kg, pore (m/s) 7.59·10-3 9.25 · 10-3
Table 19. Characteristics parameters for close and open loop configuration model

56 Ammonium removal from wastewater by liquid-liquid membrane contactors
11. Conclusions
The experiments results obtained with close loop configuration indicate that the optimum pH
values for operation must be above the pKa (NH3 / NH4+). For this pH values removal is
quantitative (>99%). On the other hand, when working with a pH below the pKa, the removal
efficiency of the process decreases below to 10-15% even for low flow rates. For this reason,
the use of a buffer solution is required to keep the pH and additives of small amount of a
strong base as NaOH will be enough to achieve these buffering conditions.
Other parameter that was studied is the initial concentration of ammonium in the feed
solution. Increasing the initial concentration does not show influence in the removal
efficiency, however it is increased the time to achieve the quantitative removal.
From the point of view of the flow rate, when this parameter was increased, the removal
efficiency was not affected and the time to reach quantitative removal of ammonium was
reduced.
In open loop configuration, experiments showed that the pH feed solution must be above the
pKa, but in this cases, the use so concentrate buffer solutions is not required. Removal
efficiency of ammonium reached values around 90-92%. An increase of the initial ammonium
concentration represents a decrease in the ammonium removal efficiency.
Finally, the maximum removal efficiency in open loop configuration was obtained when pH is
above the pKa in a solution and the flow rate is maintained as low as possible.
The proposed model can describe properly the experimental data, especially in close loop
configuration and some deviation were observed in open loop configuration. However it can
be considered a powerful tool to predict the ammonium removal by membrane contactors
under different experimental conditions.
Due to obtained results, the use of liquid-liquid membrane contactor technology can be a
good alternative to solve the problem of the conductivity in the electrolysis process within the
European project Greenlysis "Hydrogen and Oxygen production by electrolysis via renewable
energies to reduce environmental footprint of a waste water treatment plant (WWTP)."
Ammonium removal from wastewater by liquid-liquid membrane contactors 57
12. Annex
12.1 Annex 1. Summary of the experimental results
12.2 Annex 2. Graphics of experimental results
12.3 Annex 3. Poster exhibited in Milan COMSOL Congress in October 2012
12.4 Annex 4. Paper exhibited in Milan COMSOL Congress in October 2012
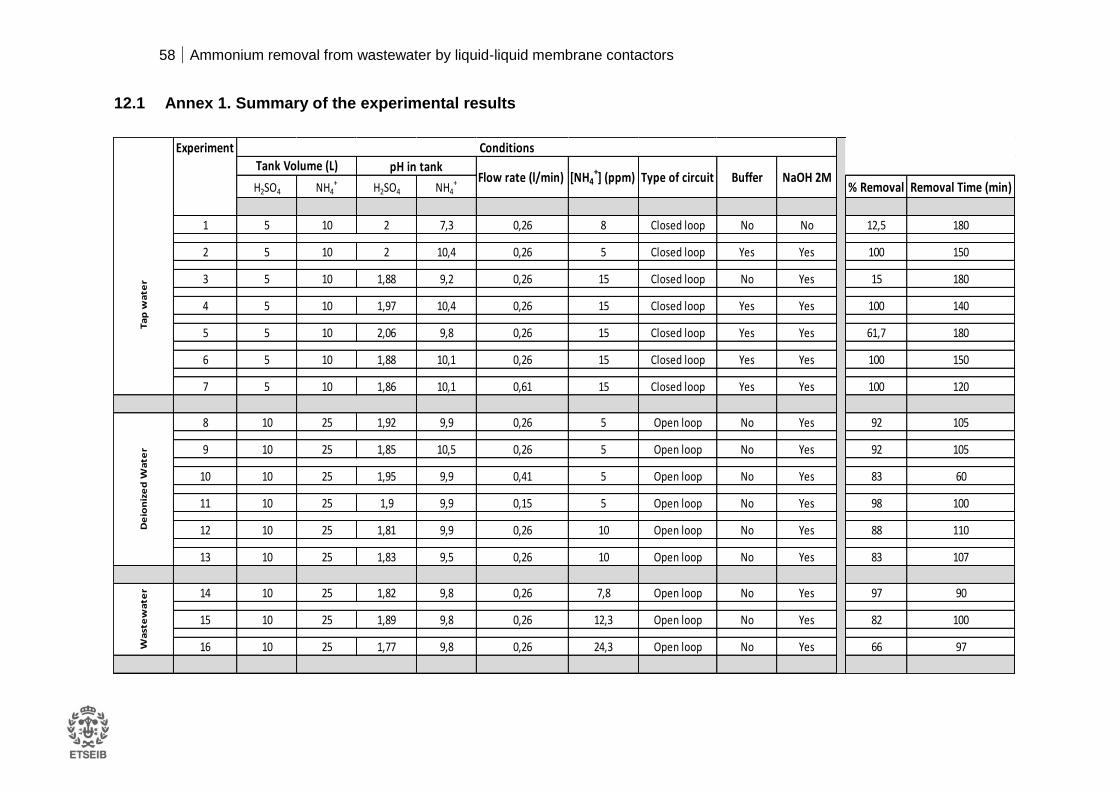
58 Ammonium removal from wastewater by liquid-liquid membrane contactors
12.1 Annex 1. Summary of the experimental results
Experiment
H2SO4 NH4+ H2SO4 NH4
+ % Removal Removal Time (min)
1 5 10 2 7,3 0,26 8 Closed loop No No 12,5 180
2 5 10 2 10,4 0,26 5 Closed loop Yes Yes 100 150
3 5 10 1,88 9,2 0,26 15 Closed loop No Yes 15 180
4 5 10 1,97 10,4 0,26 15 Closed loop Yes Yes 100 140
5 5 10 2,06 9,8 0,26 15 Closed loop Yes Yes 61,7 180
6 5 10 1,88 10,1 0,26 15 Closed loop Yes Yes 100 150
7 5 10 1,86 10,1 0,61 15 Closed loop Yes Yes 100 120
8 10 25 1,92 9,9 0,26 5 Open loop No Yes 92 105
9 10 25 1,85 10,5 0,26 5 Open loop No Yes 92 105
10 10 25 1,95 9,9 0,41 5 Open loop No Yes 83 60
11 10 25 1,9 9,9 0,15 5 Open loop No Yes 98 100
12 10 25 1,81 9,9 0,26 10 Open loop No Yes 88 110
13 10 25 1,83 9,5 0,26 10 Open loop No Yes 83 107
14 10 25 1,82 9,8 0,26 7,8 Open loop No Yes 97 90
15 10 25 1,89 9,8 0,26 12,3 Open loop No Yes 82 100
16 10 25 1,77 9,8 0,26 24,3 Open loop No Yes 66 97Wa
ste
wa
ter
BufferType of circuit[NH4+] (ppm)Flow rate (l/min)
pH in tank
De
ion
ize
d W
ate
r
NaOH 2M
Ta
p w
ate
r
Tank Volume (L)Conditions

Ammonium removal from wastewater by liquid-liquid membrane contactors 59
12.2 Annex 2. Graphics of experimental results
Experiment
Graphics
1
Comparison
3-6
Comparison
2,4
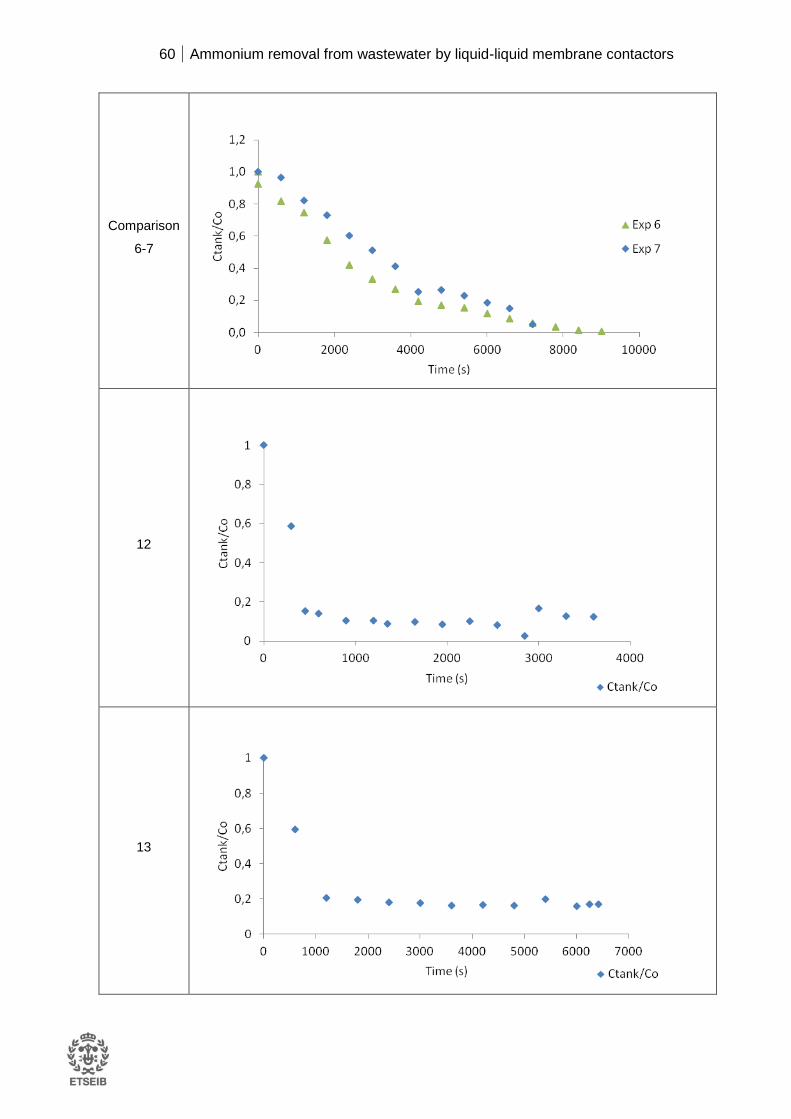
60 Ammonium removal from wastewater by liquid-liquid membrane contactors
Comparison
6-7
12
13
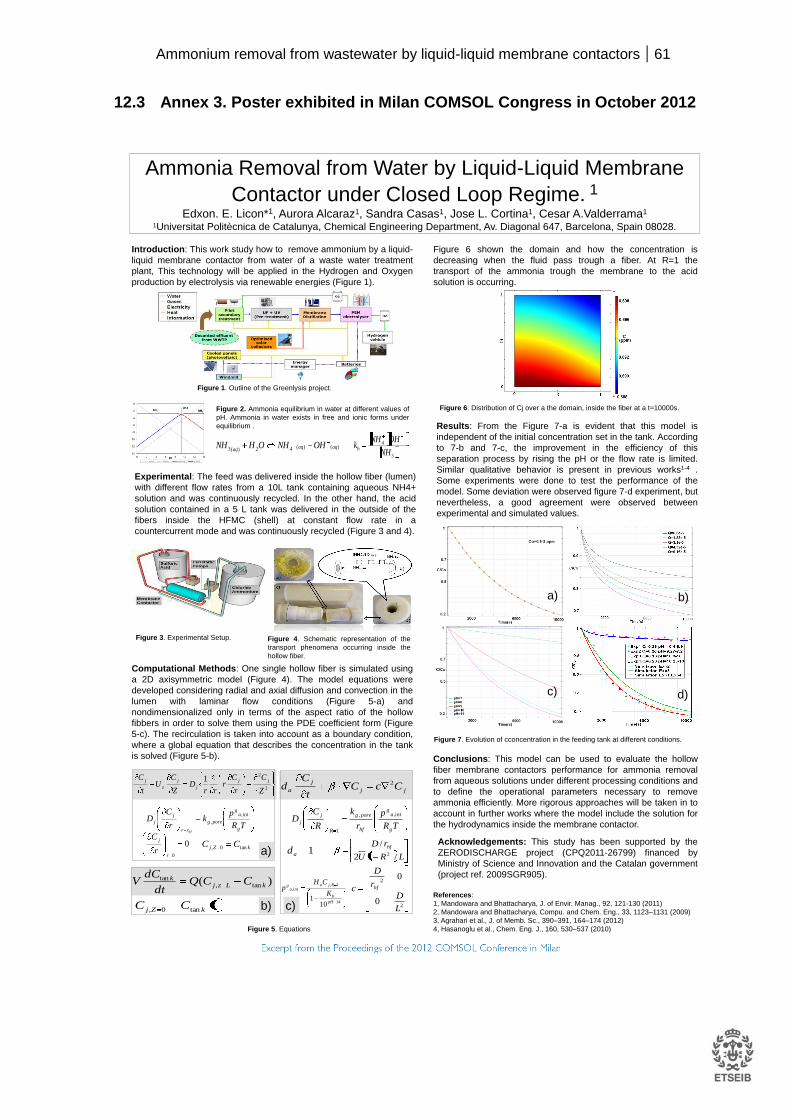
Ammonium removal from wastewater by liquid-liquid membrane contactors 61
12.3 Annex 3. Poster exhibited in Milan COMSOL Congress in October 2012
Computational Methods: One single hollow fiber is simulated using
a 2D axisymmetric model (Figure 4). The model equations were
developed considering radial and axial diffusion and convection in the
lumen with laminar flow conditions (Figure 5-a) and
nondimensionalized only in terms of the aspect ratio of the hollow
fibbers in order to solve them using the PDE coefficient form (Figure
5-c). The recirculation is taken into account as a boundary condition,
where a global equation that describes the concentration in the tank
is solved (Figure 5-b).
Ammonia Removal from Water by Liquid-Liquid Membrane
Contactor under Closed Loop Regime. 1
Edxon. E. Licon*1, Aurora Alcaraz1, Sandra Casas1, Jose L. Cortina1, Cesar A.Valderrama1
1Universitat Politècnica de Catalunya, Chemical Engineering Department, Av. Diagonal 647, Barcelona, Spain 08028.
Introduction: This work study how to remove ammonium by a liquid-
liquid membrane contactor from water of a waste water treatment
plant, This technology will be applied in the Hydrogen and Oxygen
production by electrolysis via renewable energies (Figure 1).
Results: From the Figure 7-a is evident that this model is
independent of the initial concentration set in the tank. According
to 7-b and 7-c, the improvement in the efficiency of this
separation process by rising the pH or the flow rate is limited.
Similar qualitative behavior is present in previous works1-4 .
Some experiments were done to test the performance of the
model. Some deviation were observed figure 7-d experiment, but
nevertheless, a good agreement were observed between
experimental and simulated values.
Conclusions: This model can be used to evaluate the hollow
fiber membrane contactors performance for ammonia removal
from aqueous solutions under different processing conditions and
to define the operational parameters necessary to remove
ammonia efficiently. More rigorous approaches will be taken in to
account in further works where the model include the solution for
the hydrodynamics inside the membrane contactor.
References:
1, Mandowara and Bhattacharya, J. of Envir. Manag., 92, 121-130 (2011)
2, Mandowara and Bhattacharya, Compu. and Chem. Eng., 33, 1123–1131 (2009)
3, Agrahari et al., J. of Memb. Sc., 390–391, 164–174 (2012)
4, Hasanoglu et al., Chem. Eng. J., 160, 530–537 (2010)
Figure 4. Schematic representation of the
transport phenomena occurring inside the
hollow fiber.
Figure 6. Distribution of Cj over a the domain, inside the fiber at a t=10000s.
Acknowledgements: This study has been supported by the
ZERODISCHARGE project (CPQ2011-26799) financed by
Ministry of Science and Innovation and the Catalan government
(project ref. 2009SGR905).
Figure 7. Evolution of cconcentration in the feeding tank at different conditions.
a)
c)
b)
d)
kZj CC tan0,
jj
j
a CcCt
Cd 2
2
2
0
0
L
D
r
D
c hf
LRU
rD hf
/12
/2
TR
p
r
k
R
CD
g
ag
hf
poreg
R
j
j
int,,
1
14
1,int,
101
pH
b
Rjaa
g
K
CHp
1ad
2
21
Z
C
r
Cr
rrD
Z
CU
t
C jj
j
j
z
j
0
0r
j
r
C
TR
pk
r
CD
g
ag
poreg
rr
j
j
hf
int,
,
)( tan,tan
kLzjk CCQ
dt
dCV
tCC kZj tan0,
a)
c)b)
Figure 1. Outline of the Greenlysis project.
)()(42)(3 aqaqaqOHNHOHNH
3
4
NH
OHNHkb
Figure 2. Ammonia equilibrium in water at different values of
pH. Ammonia in water exists in free and ionic forms under
equilibrium .
Experimental: The feed was delivered inside the hollow fiber (lumen)
with different flow rates from a 10L tank containing aqueous NH4+
solution and was continuously recycled. In the other hand, the acid
solution contained in a 5 L tank was delivered in the outside of the
fibers inside the HFMC (shell) at constant flow rate in a
countercurrent mode and was continuously recycled (Figure 3 and 4).
Figure 3. Experimental Setup.
Figure 5. Equations
Figure 6 shown the domain and how the concentration is
decreasing when the fluid pass trough a fiber. At R=1 the
transport of the ammonia trough the membrane to the acid
solution is occurring.

62 Ammonium removal from wastewater by liquid-liquid membrane contactors
12.4 Annex 4. . Paper exhibited in Milan COMSOL Congress in October 2012
Ammonia Removal from Water by Liquid-Liquid Membrane
Contactor under Closed Loop Regime.
E. Licon*1, S. Casas1, A. Alcaraz1, J.L. Cortina1, C. Valderrama1
1Universitat Politècnica de Catalunya, Barcelona, Spain
*Corresponding author: Av. Diagonal 647 Edif. H 4th floor Barcelona, Spain 08028,
Abstract: Ammonia separation from water by a membrane contactor was simulated on
transient state and compared with experimental data. Aqueous low concentrated solution of
ammonium with high pH has been pumped inside a hydrophobic hollow fiber (lumen), sulfuric
acid solution in the outside part and the feeding solutions are in closed loop configuration. In
order to simulate the separation process, the model equations were developed considering
radial-axial diffusion and convection in the lumen with a well-developed parabolic velocity
profile. The model proposed shows minimal deviations when is compared against
experimental data. This study shows that the most important parameters to control during the
operation are the flow rate and the pH, mainly the last one, due to high dependence in
chemical equilibrium of ammonium reaction to ammonia.
Keywords: Ammonia removal, Membrane
contactor, recirculation.
1. Introduction
In this Study, water of a waste water treatment
plant was used to remove ammonium by a
liquid-liquid membrane contactor. This
technology will be applied in the Hydrogen and
Oxygen production by electrolysis via
renewable energies, an outline of the process
is shown in Appendix. The aim of this work
relies on fulfill the process requirements in the
electrolysis, since the efficiency of this step is
inversely proportionally to conductivity. The
ammonia concentration before membrane
distillation step is usually between 1-5 ppm
with not variations after this process. Then to
use a liquid-liquid membrane contactor is
proposed to reduce ammonium (NH+4
)
concentration before Membranes distillation
step.
1.1 Ammonia-Ammonium equilibrium
Ammonia is a colorless gas with a
characteristic odor, very soluble in water.
Its aqueous solutions are alkaline and
have a corrosive effect in front to metals
and tissue. Ammonia in water exists in
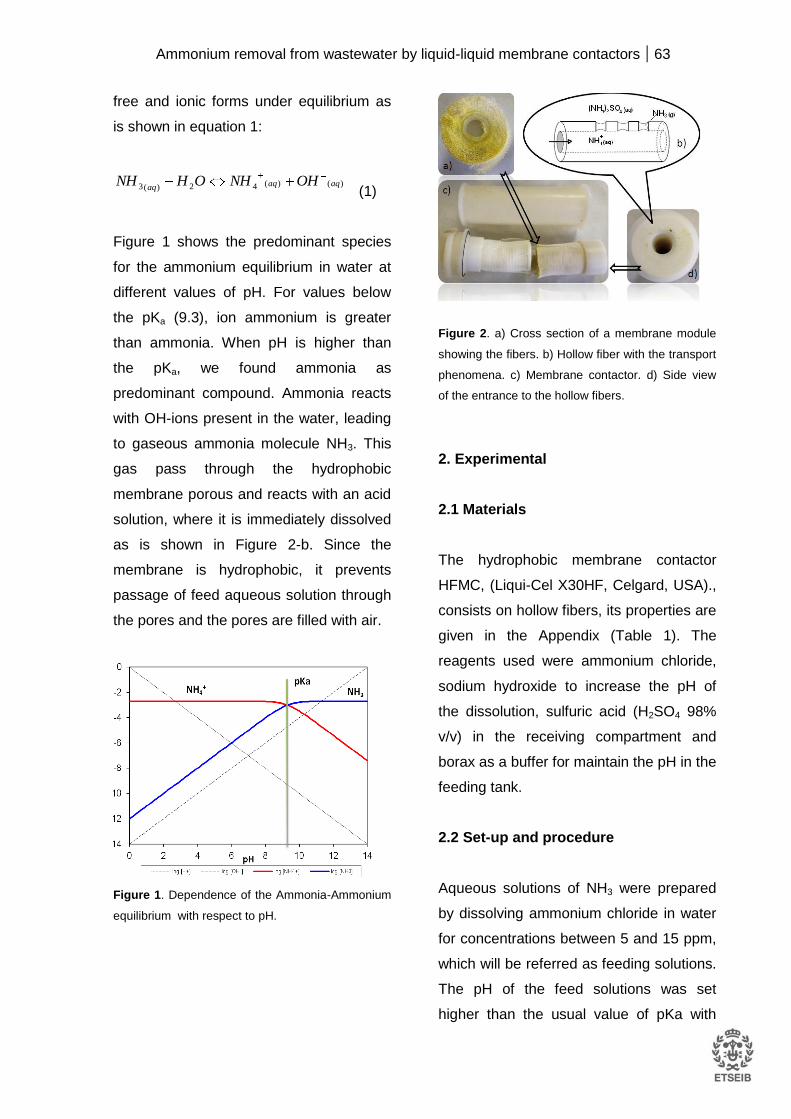
Ammonium removal from wastewater by liquid-liquid membrane contactors 63
free and ionic forms under equilibrium as
is shown in equation 1:
(1)
Figure 1 shows the predominant species
for the ammonium equilibrium in water at
different values of pH. For values below
the pKa (9.3), ion ammonium is greater
than ammonia. When pH is higher than
the pKa, we found ammonia as
predominant compound. Ammonia reacts
with OH-ions present in the water, leading
to gaseous ammonia molecule NH3. This
gas pass through the hydrophobic
membrane porous and reacts with an acid
solution, where it is immediately dissolved
as is shown in Figure 2-b. Since the
membrane is hydrophobic, it prevents
passage of feed aqueous solution through
the pores and the pores are filled with air.
Figure 1. Dependence of the Ammonia-Ammonium
equilibrium with respect to pH.
Figure 2. a) Cross section of a membrane module
showing the fibers. b) Hollow fiber with the transport
phenomena. c) Membrane contactor. d) Side view
of the entrance to the hollow fibers.
2. Experimental
2.1 Materials
The hydrophobic membrane contactor
HFMC, (Liqui-Cel X30HF, Celgard, USA).,
consists on hollow fibers, its properties are
given in the Appendix (Table 1). The
reagents used were ammonium chloride,
sodium hydroxide to increase the pH of
the dissolution, sulfuric acid (H2SO4 98%
v/v) in the receiving compartment and
borax as a buffer for maintain the pH in the
feeding tank.
2.2 Set-up and procedure
Aqueous solutions of NH3 were prepared
by dissolving ammonium chloride in water
for concentrations between 5 and 15 ppm,
which will be referred as feeding solutions.
The pH of the feed solutions was set
higher than the usual value of pKa with
)()(42)(3 aqaqaqOHNHOHNH
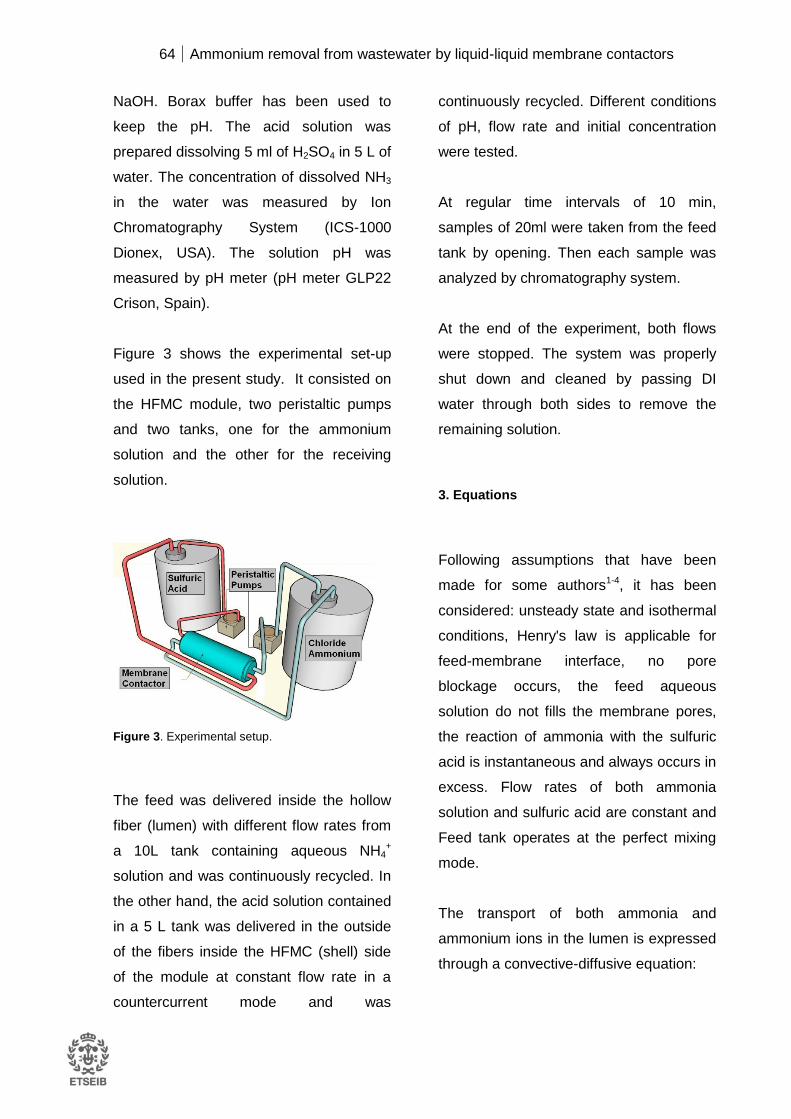
64 Ammonium removal from wastewater by liquid-liquid membrane contactors
NaOH. Borax buffer has been used to
keep the pH. The acid solution was
prepared dissolving 5 ml of H2SO4 in 5 L of
water. The concentration of dissolved NH3
in the water was measured by Ion
Chromatography System (ICS-1000
Dionex, USA). The solution pH was
measured by pH meter (pH meter GLP22
Crison, Spain).
Figure 3 shows the experimental set-up
used in the present study. It consisted on
the HFMC module, two peristaltic pumps
and two tanks, one for the ammonium
solution and the other for the receiving
solution.
Figure 3. Experimental setup.
The feed was delivered inside the hollow
fiber (lumen) with different flow rates from
a 10L tank containing aqueous NH4+
solution and was continuously recycled. In
the other hand, the acid solution contained
in a 5 L tank was delivered in the outside
of the fibers inside the HFMC (shell) side
of the module at constant flow rate in a
countercurrent mode and was
continuously recycled. Different conditions
of pH, flow rate and initial concentration
were tested.
At regular time intervals of 10 min,
samples of 20ml were taken from the feed
tank by opening. Then each sample was
analyzed by chromatography system.
At the end of the experiment, both flows
were stopped. The system was properly
shut down and cleaned by passing DI
water through both sides to remove the
remaining solution.
3. Equations
Following assumptions that have been
made for some authors1-4, it has been
considered: unsteady state and isothermal
conditions, Henry's law is applicable for
feed-membrane interface, no pore
blockage occurs, the feed aqueous
solution do not fills the membrane pores,
the reaction of ammonia with the sulfuric
acid is instantaneous and always occurs in
excess. Flow rates of both ammonia
solution and sulfuric acid are constant and
Feed tank operates at the perfect mixing
mode.
The transport of both ammonia and
ammonium ions in the lumen is expressed
through a convective-diffusive equation:
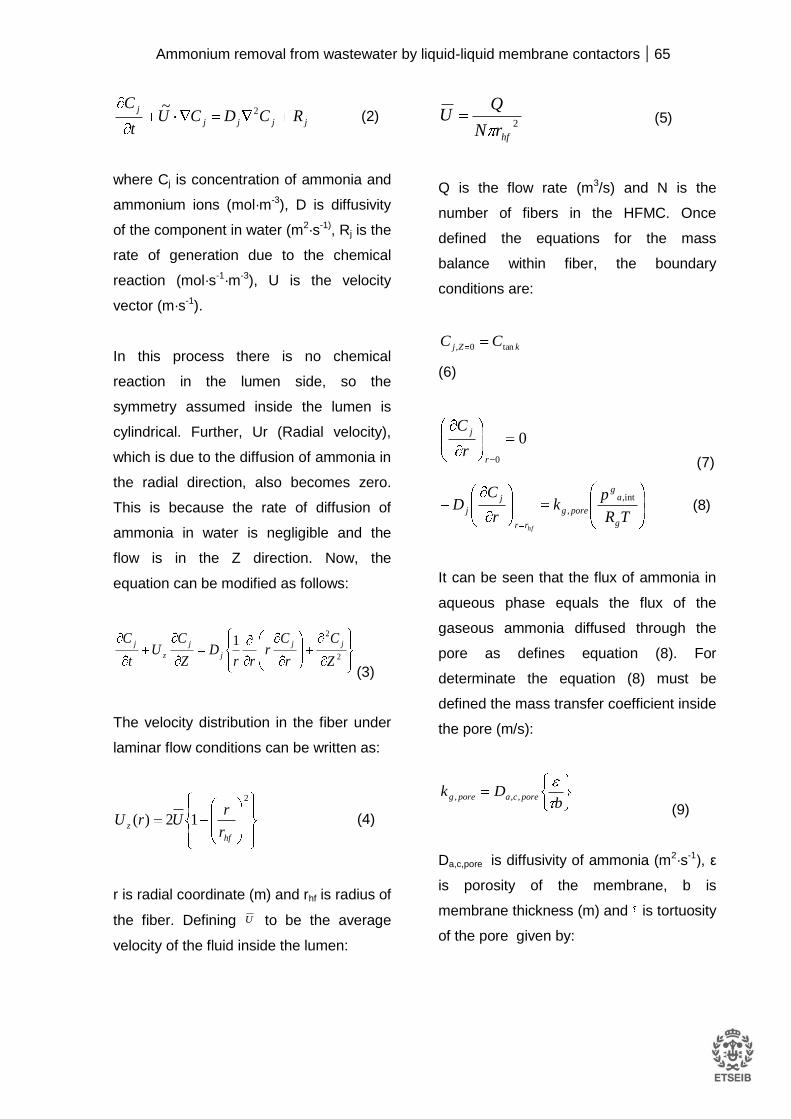
Ammonium removal from wastewater by liquid-liquid membrane contactors 65
jjjj
jRCDCU
t
C2~
(2)
where Cj is concentration of ammonia and
ammonium ions (mol·m-3), D is diffusivity
of the component in water (m2·s-1), Rj is the
rate of generation due to the chemical
reaction (mol·s-1·m-3), U is the velocity
vector (m·s-1).
In this process there is no chemical
reaction in the lumen side, so the
symmetry assumed inside the lumen is
cylindrical. Further, Ur (Radial velocity),
which is due to the diffusion of ammonia in
the radial direction, also becomes zero.
This is because the rate of diffusion of
ammonia in water is negligible and the
flow is in the Z direction. Now, the
equation can be modified as follows:
(3)
The velocity distribution in the fiber under
laminar flow conditions can be written as:
2
12)(hf
zr
rUrU (4)
r is radial coordinate (m) and rhf is radius of
the fiber. Defining to be the average
velocity of the fluid inside the lumen:
2
hfrN
QU (5)
Q is the flow rate (m3/s) and N is the
number of fibers in the HFMC. Once
defined the equations for the mass
balance within fiber, the boundary
conditions are:
(6)
(7)
TR
pk
r
CD
g
ag
poreg
rr
j
j
hf
int,
, (8)
It can be seen that the flux of ammonia in
aqueous phase equals the flux of the
gaseous ammonia diffused through the
pore as defines equation (8). For
determinate the equation (8) must be
defined the mass transfer coefficient inside
the pore (m/s):
(9)
Da,c,pore is diffusivity of ammonia (m2·s-1), ε
is porosity of the membrane, b is
membrane thickness (m) and is tortuosity
of the pore given by:
2
21
Z
C
r
Cr
rrD
Z
CU
t
C jj
j
j
z
j
U
kZj CC tan0,
0
0r
j
r
C
bDk porecaporeg ,,,

66 Ammonium removal from wastewater by liquid-liquid membrane contactors
(10)
Diffusivity of ammonia in the pore is
calculated by:
(11)
Dk,a, pore is Knudsen diffusion (m2·s-1), Da,air
is diffusivity of ammonia in the air (m2·s-1).
Further, the Knudsen diffusion is given by:
(12)
dpore is diameter of pore (m),. Rg is
universal gas constant (J·mol-1·K-1), T is
temperature (K) and Ma is molecular
weight of ammonia (g·mol-1). As
previously defined, Cj is the concentration
of ammonia and ammonium ions (mol·m-
3):
43 NHNHC j (13)
Where [NH3] is concentration of ammonia
(mol·m-3) and [NH4+] is concentration of
ammonium. On the other hand, at the
liquid-gas interface located at the pore
interface, Henry’s law may be applicable:
(14)
Ha is Henry’s constant (Pa ·m3·mol-1) and
[NH3]int is concentration of ammonia at
liquid-gas interface (mol·m-3). As explained
at the previous section 1.1, in aqueous
solution equilibrium is established between
dissolved ammonia gas and ammonium
ions, where according to equation (1) the
ionization constant of ammonia is.
(15)
Since the pH is maintained during the
process, the concentration of OH- is kept
constant in the lumen and is given by
(16)
Substituting the equation 16 in equation 15
it is observed that kb is a function of pH. At
higher pH values, the kb will be smaller
and the equilibrium move towards the
formation of ammonium. By the other
hand, a mass balance over ammonia tank
under the assumption of uniform mixing
can be written:
)( tan,tan
kLzjk CCQ
dt
dCV
(18)
Initial Condition: at t= 0
kCC tan0
(19)
4. Use of COMSOL Multiphysics
One single hollow fiber is simulated using a 2D
axisymmetric model. The equations were
nondimensionalized only in terms of the aspect
2
1
airaporeakporeca DDD ,,,,,
111
2/1
,,
8
3 a
gpore
poreakM
TRdD
int3int, NHHP aag
3
4
NH
OHNHkb
1410 pHOH

Ammonium removal from wastewater by liquid-liquid membrane contactors 67
ratio of the fiber, then in order to solve
equation (3) using the PDE coefficient form the
coordinates are Z=z/L and R=r/rhf., where L
and rhf are the hollow fiber length and radius
respectively. The coefficient values for the
settings of the coefficient form would be:
Diffusion coefficient:
2
2
0
0
L
D
r
D
c hf (20)
Convection coefficient
LRU
rD hf
/12
/2
(21)
Mass coefficient
1ad
(22)
In order to obtain the transport phenomena in
the boundary condition equal to R=1, a flux
boundary condition is set:
TR
p
r
k
R
CD
g
ag
hf
poreg
R
j
j
int,,
1
(23)
The partial pressure of ammonia in the
interface is according to equations 9-16:
14
1,int,
101
pH
b
Rjaa
g
K
CHp (24)
Recirculation is taken into account as a
boundary condition in Z=1, where equation
(18) is taken in to account as a global equation
that describes the concentration in the tank:
tCC kZj tan0, (25)
The pH of the solution in the tank was
considered as a time dependant function, fitted
in a previous step in MATLAB from
experimental results with the equation (26),
see Figure 3.
2/34
2/3
00
10*58.6)(
t
tpHpHpHtpH end (26)
Figure 4. Evolution of pH in an experiment without
buffer solution.
5. Results:
In the Figure 5 is shown how the concentration
is decreasing when the fluid pass the lumen of
a fiber, at R=1 the transport of the ammonia
trough the membrane to the acid solution is
occurring. Different simulations have been
done.
From the Figure 6 is evident that this model is
independent of the initial concentration set in
the tank with ammonium chloride. According to
Figure 7 and Figure 8, the improvement in the
efficiency of this separation process by rising
the pH or the flow rate is limited by some
extend and this information can be used to
optimize resources and energy needed to
carry out the operation. This information is in
agreement with the results obtained in

68 Ammonium removal from wastewater by liquid-liquid membrane contactors
previous works done before without the use of
COMSOL1,2
Figure 5. Distribution of Cj over plane inside the
fiber for a t=10000 seconds.
Figure 6. Normalized concentration evolution in the
feeding tank at different initial concentrations from
0.5 ppm of ammonium to 3with a Q=4.392e-6 m3/s
and pH=10.3.
Figure 7. Normalized concentration evolution in the
feeding tank at different pH at Q= 4.392e-6 m3/s and
Co=15 ppm.
Figure 8. Normalized concentration evolution in the
feeding tank at different flow rates (Q in m3/s)
Co=15ppm and pH=10.3.
Some experiments were done to test the
performance of the model. In Figure 6 is shown
the evolution of the tank concentration under
different experimental conditions in terms of
flow rate and initial pH, as well as the predicted
values. In the experiment 2 a poor removal of
NH+4
was obtained because no buffer solution
was added and pH was not constant. Next
experiments were made with initial buffered
solution. The experiment 1 and 4 were
performed under same conditions but the
solutions were prepared on tap water and
distillate water, respectively Some deviation
were observed in tap water experiment, but
nevertheless, a good agreement were
observed between experimental and simulated
values.

Ammonium removal from wastewater by liquid-liquid membrane contactors 69
Figure 9. Comparison of the evolution in different
experiments of the concentration in the feeding tank
with its respective simulation.
6. Conclusions
The use a liquid-liquid membrane contactor to
improve the water quality used in the
production of hydrogen is a good option. When
the process is carry out in closed loop there
are no emotions to the atmosphere and this
contributes to make the process safe and
environmentally friendly.
This model can be used to evaluate the hollow
fiber membrane contactors performance for
ammonia removal from aqueous solutions
under different processing conditions and to
define the operational parameters necessary to
remove ammonia efficiently.
The membrane contactor model proposed is
suitable for prediction of ammonium removal in
view the minimal deviations when compared to
the experimental data. The most important
parameters to control during the experiment
are the flow rate and the pH, mainly the last
one, due to the high dependence in the
chemical equilibrium of ammonium reaction to
ammonia.
Finally, the use of COMSOL makes easier and
faster to solve the equations proposed in the
model for liquid-liquid contactor.
More rigorous approaches will be taken in to
account in further works where the model
include the solution for the hydrodynamics
inside the membrane contactor and open loop
regime will be evaluated.
7. References
1. Mandowara and Bhattacharya, Simulation
studies of ammonia removal from water in a
membrane contactor under liquid-liquid
extraction mode, Journal of Environmental
Management, 92, 121-130 (2011)
2. Mandowara and Bhattacharya, Membrane
contactor as degasser operated under vacuum
for ammonia removal from water: A numerical
simulation of mass transfer under laminar flow
conditions, Computers and Chemical
Engineering, 33, 1123–1131 (2009)
3. Agrahari et al., Model prediction and
experimental studies on the removal of
dissolved NH3 from water applying hollow fiber
membrane contactor, Journal of Membrane
Science, 390–391, 164–174 (2012)
4. Hasanoglu et al., Ammonia removal from
wastewater streams through membrane
contactors: Experimental and theoretical
analysis of operation parameters and
configuration, Chemical Engineering Journal,
160, 530–537 (2010)
8. Acknowledgements
This study has been supported by the
ZERODISCHARGE project (CPQ2011-26799)
financed by Ministry of Science and Innovation
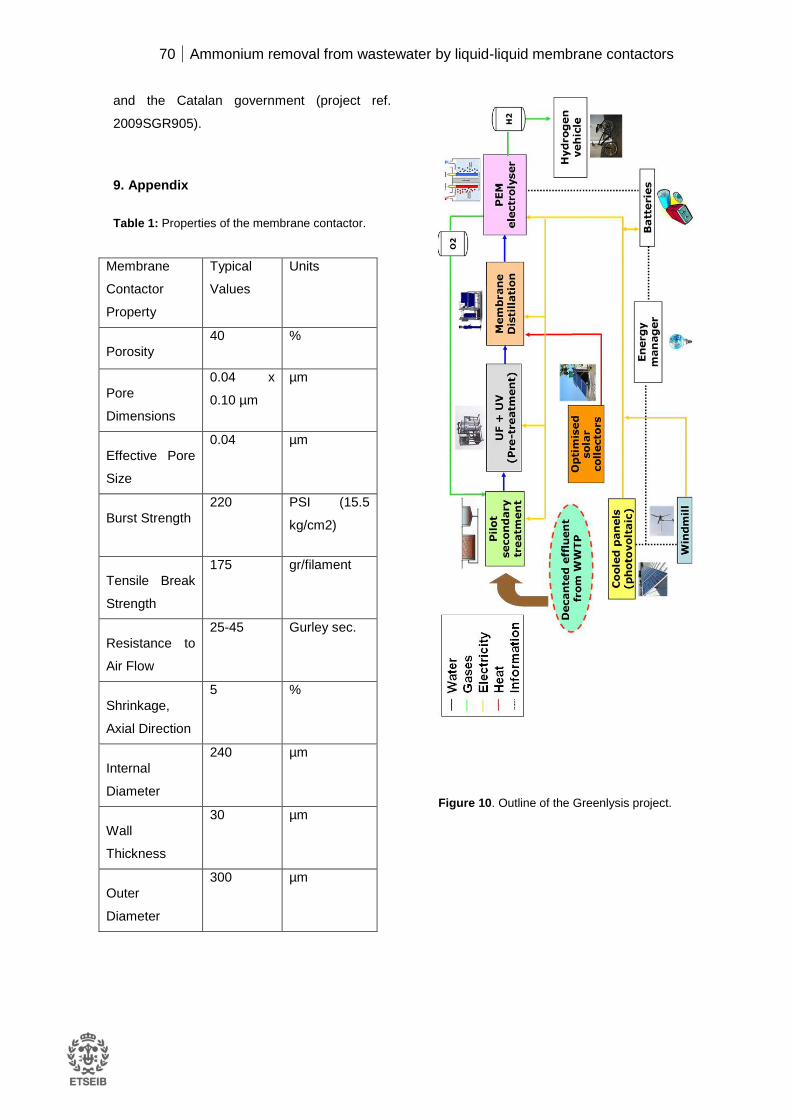
70 Ammonium removal from wastewater by liquid-liquid membrane contactors
and the Catalan government (project ref.
2009SGR905).
9. Appendix
Table 1: Properties of the membrane contactor.
Membrane
Contactor
Property
Typical
Values
Units
Porosity
40 %
Pore
Dimensions
0.04 x
0.10 µm
µm
Effective Pore
Size
0.04 µm
Burst Strength
220 PSI (15.5
kg/cm2)
Tensile Break
Strength
175 gr/filament
Resistance to
Air Flow
25-45 Gurley sec.
Shrinkage,
Axial Direction
5 %
Internal
Diameter
240 µm
Wall
Thickness
30 µm
Outer
Diameter
300 µm
Figure 10. Outline of the Greenlysis project.

Ammonium removal from wastewater by liquid-liquid membrane contactors 71
13. References
Agrahari G., Shukla S., Verma N., Bhattacharya P., 2012. Model prediction and
experimental studies on the removal of dissolved NH3 from water applying hollow fiber
membrane contactor. Journal of Membrane Science 390–391, 164–174.
Albrecht W., Hilke R., Kneifel K., Weigel Th., Peinemann K.V., 2005. Selection of
microporous hydrophobic membranas for use in gas/liquid contactors: an experimental
approach. Journal of Membrane Science 263, 66-76
Al-Marzouqi M., El-Naas M., Marzouk S., Abdullatif N., 2008. Modeling of chemical
absorption of CO2 in membrane contactors. Separation and Purification Technology 62,
499–506
Ashrafizadeh S.N., Khorasani Z., 2010. Ammonia removal from aqueous solutions using
hollow-fiber membrane contactors Chemical Engineering Journal. 162, 242-249
Atchariyawut S., Fena C., Jiraratananon R., Liang D.T., 2006. Effect of membrana
structure on mass-transfer in the membrane gas-liquid contacting process using
microporous PVDF hollow fibers. Journal of Membrane Science 285, 272-281
Baker R. W., 2000. Membrane technology and applications. McGraw-Hill. 189-210
Baset D.C., 1985. Poly (vinylidene fluoride), development in crystalline polymers. Applied
Science, vol. 1
Bottino A., Capannelli G., Comite A., Di Felice R., Firpo R., 2008. CO2 removal from a
gas stream by membrane contactor. Separation and Purification Technology 59, 85-90

72 Ammonium removal from wastewater by liquid-liquid membrane contactors
Bottino A., Capannelli G., Comite A., Firpo R., Felice R.D., Pinacci P., 2006. Separation
of carbon dioxide from flue gases using membrane contactors, Desalination 200, 609–
611.
Busca G. and Pistarino C., 2003. Abatement of ammonia and amines from waste gases:
a summary. Journal of Loss Prevention in the Process Industries 16, 157–163.
Dindore V.Y., Brilman D.W.F., Feron P.H.M., Versteeg G.F., 2004. CO2 absorption at
elevated pressures using a hollow fiber membrane contactor, Journal of Membrane
Science 235, 99–109.
Dindore V.Y., Versteeg G.F., 2005. Gas–liquid mass transfer in a cross-flow hollow fiber
module: analytical model and experimental validation, International Journal of Heat and
Mass Transfer 48, 3352–3362.
Feron, P.H.M., Jansen, A.E. and Klaassen, R., 1997, Membrane gas absorption: a new
membrane technology for gas separation and purification, 6th Aachener Membran
Kolloquium, 3–5
Gabelmana A., Hwangb S., 1999. Hollow fiber membrane contactors. Journal of
Membrane Science 159, 61-106
Ghogomu J.N., Guigui C., Rouch J.C., Clifton M.J., Aptel P., 2001. Hollow-fiber
membrane module design: comparison of different curved geometries with Dean vortices,
Journal of Membrane Science 181, 71–80.
Ho, W.S.W. and Poddar, T.K., 2001. New membrane technology for removal and
recovery of chromium from waste waters, Environmental Progress, 20(1): 44–52.
Jorgense TC, Wheatley LR, 2003. Ammonia removal from wastewater by ion exchange in
the presence of organics contaminants, Water Research. 37, 1723-1728
Ammonium removal from wastewater by liquid-liquid membrane contactors 73
Keshavarz P., Ayatollahi S., Fathikalajahi J., 2008. Mathematical modeling of gas–liquid
membrane contactors using random distribution of fibers. Journal of Membrane Science
325, 98–108
Kiani A., Prasad R., Bhave R.R., Sirkar K.K., 1984.Solvent extraction with immobilized
interfaces in a microporous hydrophobic membrane, Journal of Membrane Science 20,
125–145
Kim Y.S., Yang S.M., 2000, Absorption of carbon dioxide through hollow fiber
membranas using various aqueous absorbents, Separation and Purification Technology
21, 101–109
Klaassen R., Feron P., Jansen A., 2008. Membrane contactor applications. Desalination
224, 81–87
Klaassen R., Jansen A.E., Bult B.A., Oesterholt F., Schneider J., 1994b. Removal of
hydrocarbons from waste water by pertraction, Proc. 7th International Symposium on
Synthetic Membranes in Science and Industry, Tübingen, Germany, 316–319.
Klaassen, R. and Jansen A.E., 2001, The membrane contactor: environmental
applications and possibilities, Environmental Progress 20(1) 37–43.
Klaassen, R., Feron, P. H. M. and Jansen, A. E., 1996. Membrane gas absorption
environmental applications, Proceedings ICOM. 96, 916–917.
Klaassen, R.,1998. Vom Abwasser zum Wertstoff, Chemie Umwelt Technik 24–28.
Klassen R., Feron P., Jansen A., 2005. Membrane contactors in industrial applications.
Chemical Engineering Research and Design 83, 234–246

74 Ammonium removal from wastewater by liquid-liquid membrane contactors
Kreulen H., Smolders C., Versteeg G.F., Van Swaaij W.P.M.,, 1993. Microporous hollow
fiber membrane modules as gas–liquid contactors. Part 1. Physical mass transfer
processes: a specific application: Mass transfer in highly viscous liquids, Journal of
Membrane Science 78, 197–216.
Lee K., Yeon S., Sea B., Park Y.,2004. Hollow Fiber Membrane Contactor Hybrid
System for CO2 Recovery. Studies in Surface Science and Catalysis 153, 423-428
Lee Y., Noble R., Yeom B., Park Y., Lee K., 2001. Analysis of CO2 removal by hollow
fiber membrane contactors. Journal of Membrane Science 194, 57–67
Lee Y., Noble R.D., Yeon B.Y., Park Y.I., Lee K.H., 2001. Analysis of CO2 removal by
hollow fiber membrane contactors, Journal of Membrane Science 194, 57–67
Licon E., Casas S., Alcaraz A., Cortina J.L., Valderrama C., 2012, Ammonia Removal
from Water by Liquid-Liquid Membrane Contactor under Closed Loop Regime,
Proceedings of the European Comsol Conference held in Milan October 2012
Liu L., Li L., Ding Z., Ma R., Yang Z., 2005. Mass transfer enhancement in coiled hollow
fiber membrane modules, Journal of Membrane Science 264, 113–121.
Mallubhotla H., Schmidt M., Lee K.H., Belfort G.,1999. Flux enhancement during Dean
vortex tubular membrane nanofilltration: 13. effects of concentration and solute type,
Journal of Membrane Science 153, 259–269.
Mandowara A., Bhattacharya P, 2009. Membrane contactor as degasser operated under
vacuum for ammonia removal from water: A numerical simulation of mass transfer under
laminar flow conditions. Computers and Chemical Engineering 33, 1123–1131
Ammonium removal from wastewater by liquid-liquid membrane contactors 75
Mandowara A., Bhattacharya P., 2011. Journal of Environmental Management 92, 121-
130.
Manno P., Moulin P., Rouch J.C., et al.,1998. Mass transfer improvement in the
helicallywound hollowfiber ultrafiltration modules Yeast suspensions, Separation and
Purification Techno14, 175–182.
Mansourizadeh A., Ismael A.F., 2009. Hollow fiber gas-liquid membrana contactors for
acid gas capture: A review. Journal of Hazardous Materials 171, 38-53
McDermott C., Tarafder S., Kolditz O., Schüth C., 2007. Journal of Membrane Science
292, 17–28
Moazed H., 2008. Ammonium ion removal from wastewater by a natural resin. Journal
Environmental Science Technology. 1, 11-18
Rezakazemi M., Shirazian S., Ashrafizadeh S., 2012. Simulation of ammonia removal
from industrial wastewater streams by means of a hollow-fiber membrane contactor.
Desalination. 285, 383-392
Sarioglu, M. 2005. Removal of ammoniumfrom municipal wastewater using natural
Turkish (Dogantepe) zeolite. Separation and purification Technology 41, 1-11.
Scott K., 1998. Section 4 - Air and gas filtration and cleaning. Handbook of Industrial
Membranes (Second Edition), 309-327.
Tan X., Tan S.P., Teo W.K., Li K., 2006. Polyvinylidene fluoride (PVDF) hollow fibre
membranes for ammonia removal from water. Journal of Membrane Science 271, 59-68.
Tan X., Tan S.P., Teo W.K., Lia L., 2006. Polyvinylidene fluoride (PVDF) hollow fibre
membranes for ammonia removal from water, Journal of Membrane Science 271, 59–68.

76 Ammonium removal from wastewater by liquid-liquid membrane contactors
Wehner J.F., Wilhelm R.H., 1956. Boundary conditions of flow reactor. Chemical
Engineering Science 6, 89-93
Wickramasinghe S.R., Semmens M.J., Cussler E.L., 1998. Mass transfer in various
hollow fiber geometries, Journal of Membrane Science 69, 235–250.
Yang M.C., Cussler E.L.,1986. Designing hollow-fiber contactors, AIChE Journal 32,
1910–1916.
Zhang Q., Cussler E.L., 1985. Microporous hollow fibres for gas absorption I. Mass
transfer in the liquid, Journal of Membrane Science 23, 321–332.
Zhu Z., Hao Z., Shen Z., Chen J., 2005. Modified modeling of the effect of pH and
viscosity on the mass transfer in hidrophopic hollow fiber membranas contactors, Journal
of Membrane Science 250, 269-276
Zhu Z., Hao Z., Shen Z., Chen J., 2005. Modified modeling of the effect of pH and
viscosity on the mass transfer in hydrophobic hollow fiber membrane contactors, Journal
of Membrane Science 250, 269–276.

Ammonium removal from wastewater by liquid-liquid membrane contactors 77