ammonia removal from food waste digestate using gas stripping
TRANSCRIPT

AD Workshop - Optimising Processes for the Stable Digestion of Food Waste
Ammonia removal from food wastedigestate using gas stripping
Dr Sonia [email protected]
Dr Mark [email protected]
Contents• Introduction
• Ammonia removal scenarios
• Batch ammonia stripping from food waste digestate
• Integrating ammonia stripping with anaerobic digestion
• Part 1 - Ammonia release during hydrolysis
• Part 2 - Side-stream ammonia removal
• Modelling ammonia removal during anaerobic digestion
• Conclusions
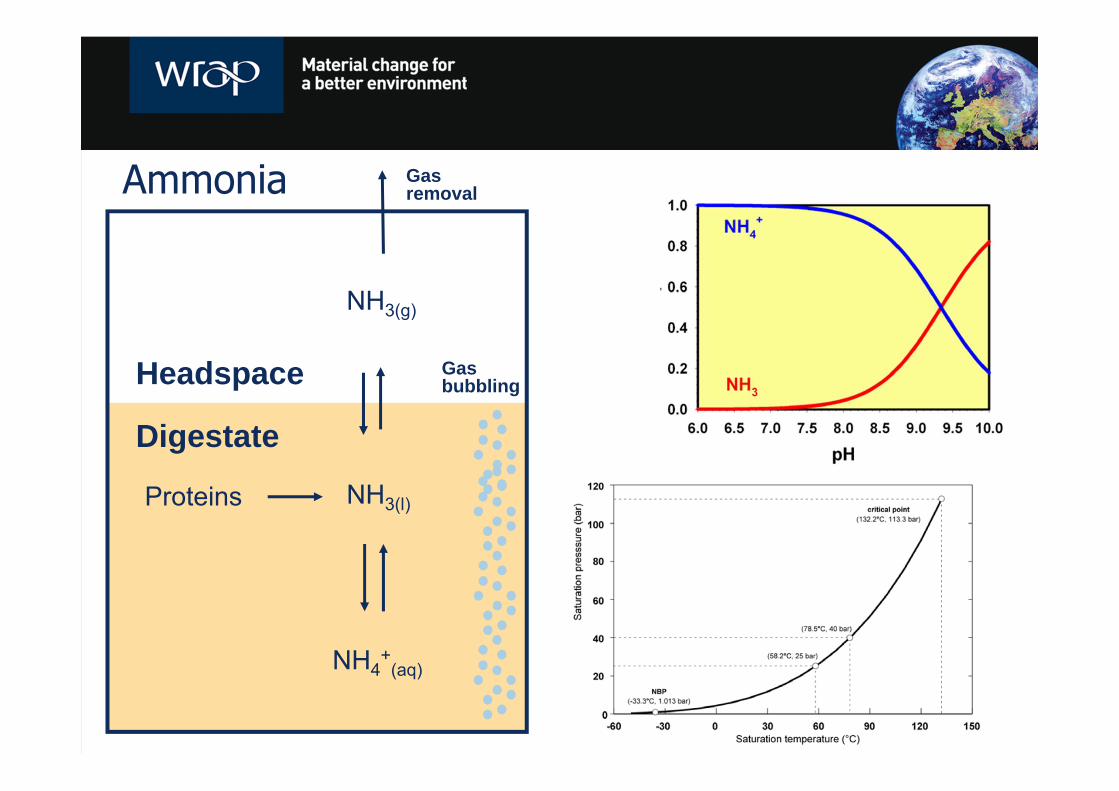
Ammonia
Proteins
Digestate
Headspace
NH3(l)
NH4+
(aq)
NH3(g)
Gas bubbling
Gas removal

Introduction• Why remove ammonia?
• Reduced toxicity on acetoclastic methanogens• Valuable product
• Why gas stripping?• Easy to integrate with AD plants, proven chemical technology
• How can gas stripping be used?• 4 scenarios identified: side-stream, post-hydrolysis, in situ and post-
digestion
• Results presented in 3 sections1. Batch ammonia stripping from digestate2. Integration of ammonia stripping with anaerobic digestion3. Modelling the performance of a combined ammonia and anaerobic
digestion process

Ammonia removal scenario 1‘Post-digestion’
mesophilic digester (35°C)
mixing tank
pasteuriser (70
°C)
ammonia capture
food waste
recycleddigestate
digestate
removedammonia
biogas

Ammonia removal scenario 2‘in situ’
gas-mixed mesophilic
digester (35°C)
mixing tank
pasteuriser (70
°C)ammonia capture
foodwaste
digestate
biogas
removedammonia

Ammonia removal scenario 3‘Side-stream’ biogas
gas-mixed mesophilic digester (35°C)
mixing tank
pasteuriser (70
°C)
ammonia capture
foodwaste
digestate
removedammonia
Stripping reactor

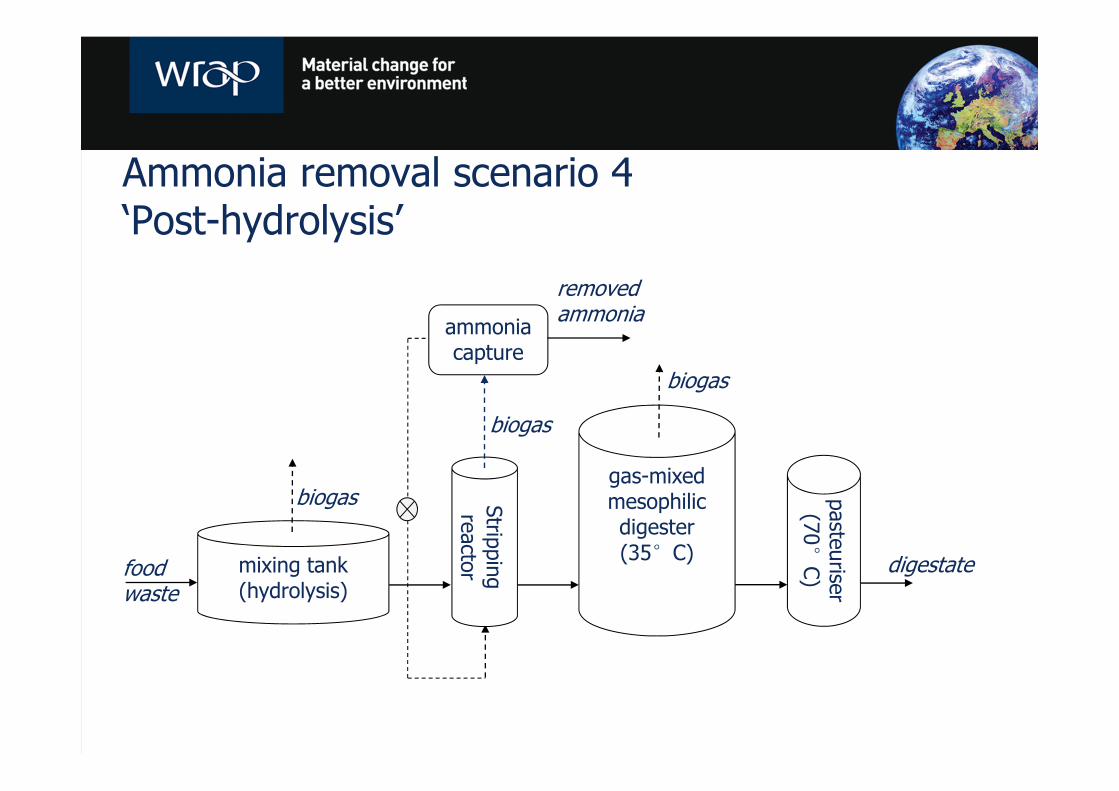
Ammonia removal scenario 4‘Post-hydrolysis’
gas-mixed mesophilic digester (35°C)mixing tank
(hydrolysis)
pasteuriser (70
°C)
ammonia capture
foodwaste
digestate
biogas
removedammonia
Stripping reactor
biogas
biogas

Batch ammonia stripping from food waste digestate

Objectives• To understand kinetics of ammonia removal with regard to
important process characteristics
• Temperature (35-70°C)
• pH (unmodified or with NaOH to increase to 10-14.5)
• Gas flow rate (0.125-0.70 l l-1 min-1)
• To collect data on removal of ammonia from ‘real’ food waste digestate which is applicable to all scenarios
• To gain some qualitative understanding of how (removed) ammonia could be captured
• 2 digestate samples used from AD plants feeding both commercial and domestic source-separated food waste

Experimental setup

Initial findings• Confirmation of theoretical framework
• Nitrogen strips carbon dioxide and causes pH decrease• With biogas stripping, temperature and flow rate both increase
ammonia removal rate
• A complex system• Ammonia removal causes pH to decrease• VFA concentration changes pH behaviour as ammonia is
removed• pH changes ammonia removal behaviour• No ammonia removal below pH of ~7.5• If ammonia removal ceases, water removal through evaporation
can cause an increase in ammonia concentration

Results – ammonia removal kinetics
y = 7797e‐0.031xR² = 0.9642
0
1000
2000
3000
4000
5000
6000
7000
8000
9000
0 20 40 60 80 100 120 140
Ammon
ia co
nc. (mg/l)
Time (hrs)
y = 7797e‐0.031xR² = 0.9642
0
1000
2000
3000
4000
5000
6000
7000
8000
9000
0 20 40 60 80 100 120 140
Ammon
ia co
nc. (mg/l)
Time (hrs)
Curve fitted in the form C=C0et/τ where τis the decay constant
τ = 1/0.031 = 32.3 hours

Run # Reactor # Temperature (°C)
Flow Rate ( l l-1 min-1)
Alkali addition
Length of Run (hrs)
Initial Final Time constant
(hrs)
r2 % Ammonia Removed
Digestate 1 pH Ammonia (mg/l)
pH Ammonia (mg/l)
0.1 2 35 0.375 N 306.25 8.43 7189 8.87 4318 575.4 0.98 45%1.1 1 55 0.125 N 120.07 8.46 7479 8.89 6155 699.6 0.91 21%2.1 1 70 0.125 N 97.50 8.70 7743 8.49 446 30.7 0.96 96%3.1 1 70 0.125 N 118.50 8.49 7798 9.36 285 31.3 0.96 96%4.1 1 70 0.375 N 30.00 8.50 7764 8.86 1090 15.1 0.99 89%5.1 1 70 0.25 N 63.48 8.65 7810 8.89 497 22.1 0.99 95%6.1 1 70 0.375 N 28.83 8.50 7847 8.99 1585 17.7 1.00 83%7.2 2 70 0.5 N 24.40 8.59 8076 9.04 1963 17.5 1.00 80%8.2 2 70 0.625 N 44.68 8.62 8245 7.98 773 17.7 0.97 95%9.2 2 70 0.375 Y 6.25 12.18 6783 10.99 1539 4.2 1.00 78%
10.1 1 70 0.75 N 22.72 8.45 8821 9.03 6925 17.8 0.97 -10.2 2 70 0.75 N 52.00 8.45 8821 8.01 470 17.1 0.97 96%11.1 1 70 0.125 Y 64.88 10.19 7815 10.36 1706 45.2 0.93 78%11.2 2 70 0.125 Y 89.80 10.19 7815 10.12 551 36.0 0.91 93%12.1 1 70 0.25 Y 55.10 10.25 8134 10.30 235 15.3 0.96 97%12.2 2 70 0.25 Y 55.30 10.25 8134 10.18 202 15.0 1.00 98%13.1 1 70 0.25 Y 71.78 11.43 5816 11.18 357 27.8 0.73 95%13.2 2 70 0.375 Y 71.85 10.32 6232 10.41 191 8.2 0.74 98%14.1 1 70 0.375 Y 22.78 13.86 5404 11.28 281 7.8 0.96 95%14.2 2 70 0.375 Y 22.88 13.86 5404 11.36 391 8.9 0.95 94%
Digestate 215.1 1 70 0.125 N 98.48 8.20 5978 8.57 1389 64.2 0.99 81%15.2 2 70 0.25 N 98.48 8.20 5978 7.63 1302 66.9 0.98 88%16.1 1 70 0.375 N 52.87 8.13 5834 8.82 1701 41.8 1.00 82%16.2 2 70 0.5 N 52.87 8.13 5834 8.13 1664 36.0 0.95 82%17.1 1 70 0.625 N 48.50 8.24 5849 7.86 1395 33.4 0.98 85%17.2 2 70 0.75 N 45.33 8.24 5948 7.85 1937 37.8 0.80 90%18.1 1 70 0.375 Y 18.75 12.24 4328 11.18 537 9.2 0.99 91%18.2 2 70 0.5 Y 18.75 12.24 4328 11.28 458 8.6 0.98 93%19.1 1 70 0.375 Y 11.17 9.15 5258 9.96 2587 15.7 0.99 49%19.2 2 70 0.5 Y 11.17 9.06 5045 9.93 2214 13.0 0.98 64%20.1 1 70 0.5 Y 6.33 14.56 4764 12.08 1044 4.1 1.00 78%20.2 2 70 0.625 Y 6.33 14.61 4976 11.84 940 3.7 0.99 83%
35/55°C gives decay constant 500-700 hours
70°C gives decay constant 17-31 hours
70°C + pH modification gives decay constant ~4 hours

Results – effect of gas flow rate (no pH modification)
0.125-0.375 l l-1 min-1 results in an increase in ammonia removal rate
Further increase in gas flow rate does not deliver any process advantage
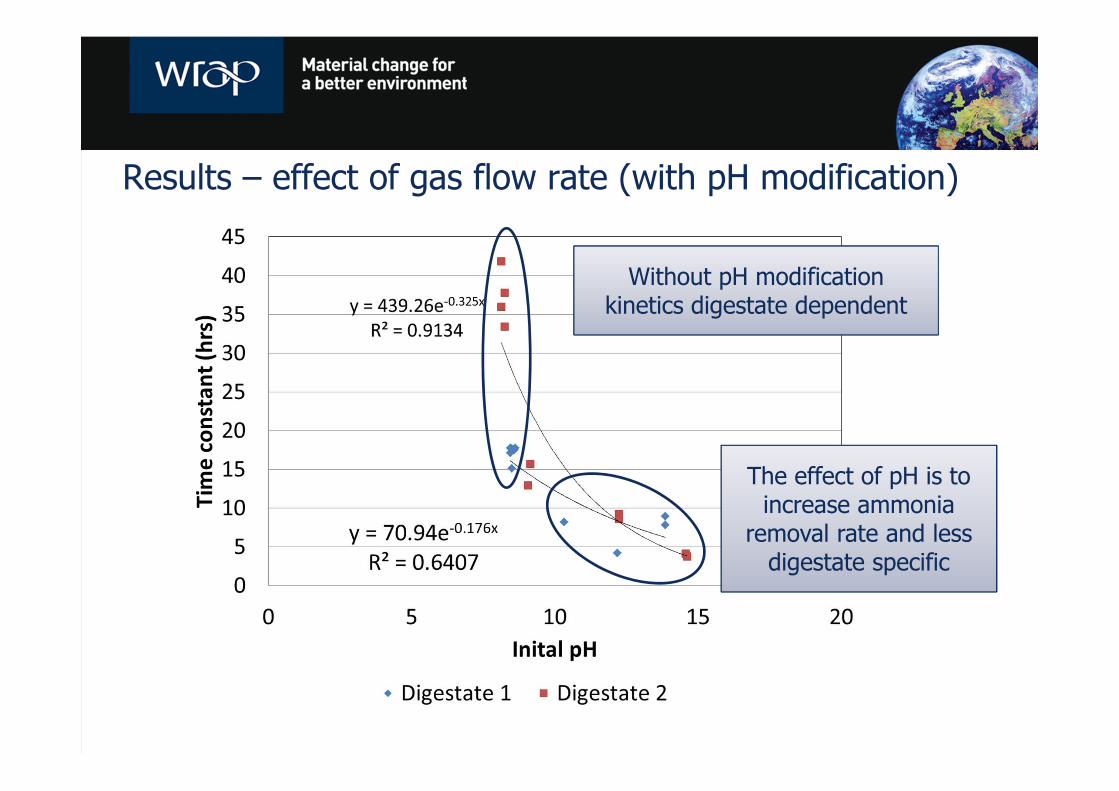
Results – effect of gas flow rate (with pH modification)
Without pH modification kinetics digestate dependent
The effect of pH is to increase ammonia
removal rate and less digestate specific

Results – effect of VFA concentration
VFA spiked sample had reduced ammonia removal
Lower initial pH with VFA
pH downswing seen in initial experiments
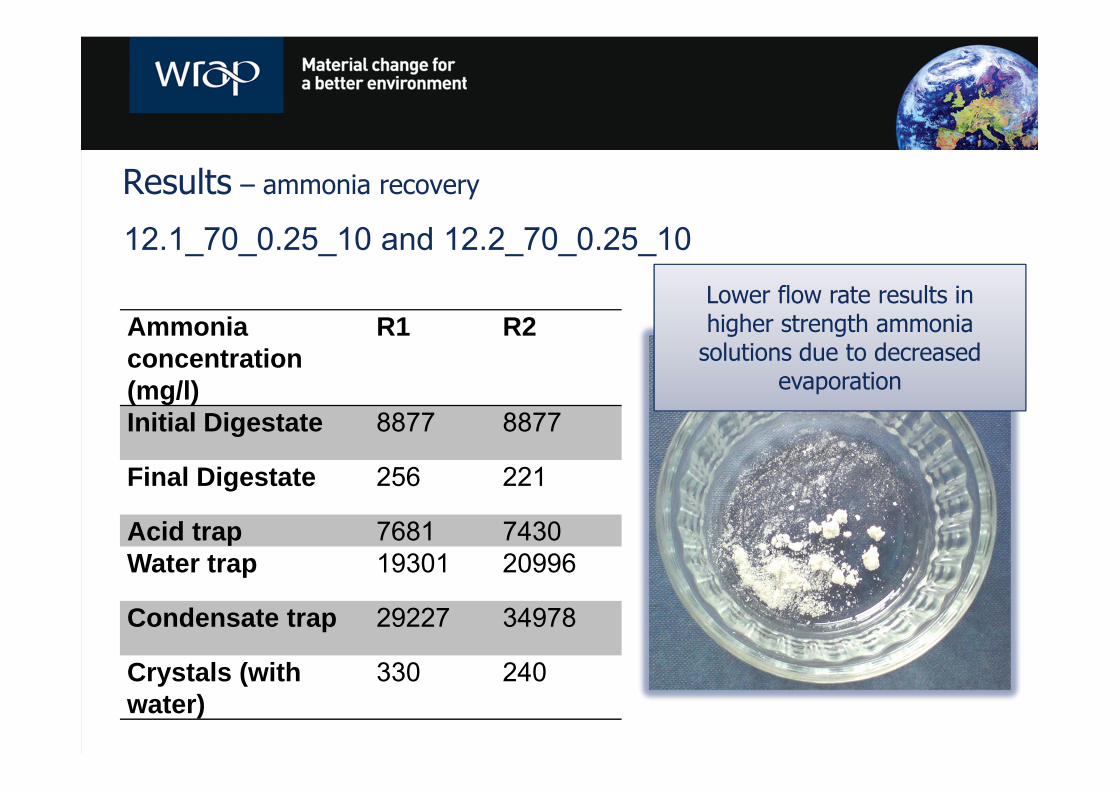
Results – ammonia recovery
12.1_70_0.25_10 and 12.2_70_0.25_10
Ammonia concentration (mg/l)
R1 R2
Initial Digestate 8877 8877
Final Digestate 256 221
Acid trap 7681 7430Water trap 19301 20996
Condensate trap 29227 34978
Crystals (with water)
330 240
Lower flow rate results in higher strength ammonia
solutions due to decreased evaporation
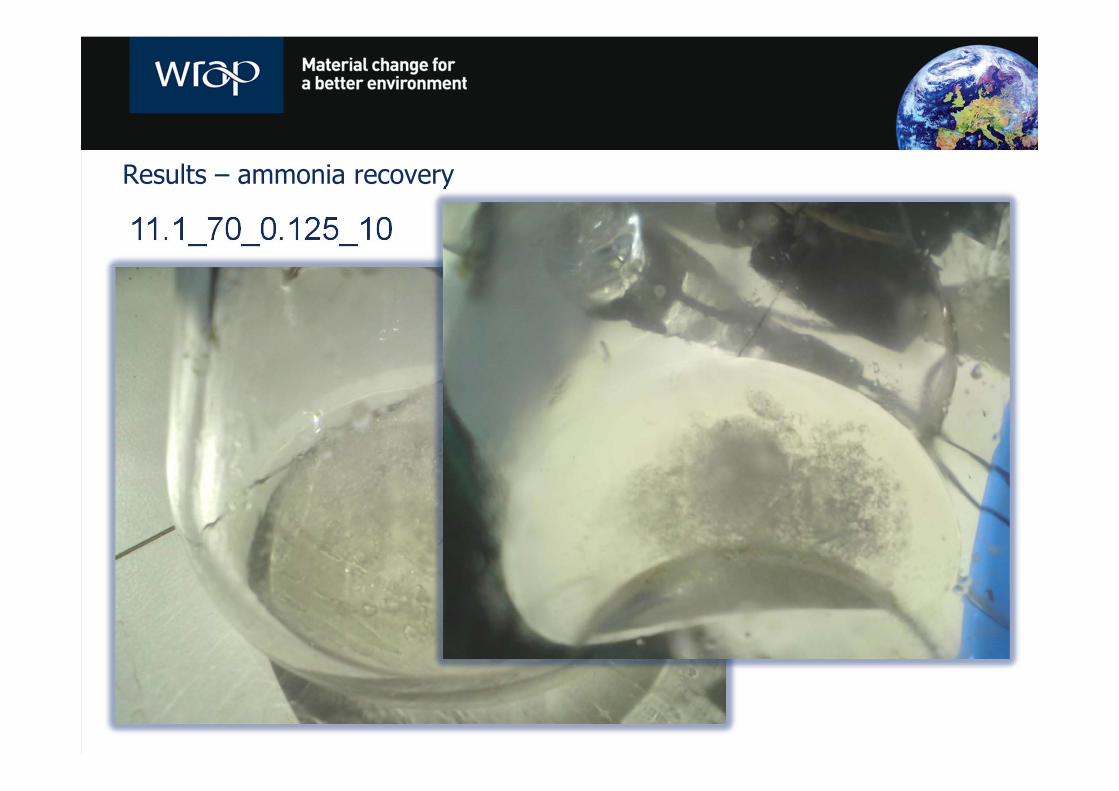
Results – ammonia recovery
11.1_70_0.125_10

Outcomes – batch ammonia removal• Increasing pH, temperature and gas flow rate increase the rate of
removal of ammonia
• ...but above 0.375 l l-1 min-1 further increase in flow rate realises no benefits (and causes more evaporation)
• Moving from ‘AD’ temperatures (35/55°C) to 70°C greatly decreases time needed for ammonia removal, which with pH modification can be reduced to around 4 hours
• Ammonia removal from two digestates shows different behaviour except at high pH
• VFA can reduce the effectiveness of ammonia stripping
• Ammonia readily ‘trapped’ using condensation or water bubbling

Integrating ammonia stripping with AD

Integrating ammonia stripping with AD
Part 1Ammonia released during
semi-continuous anaerobic hydrolysis
Ammonia removal scenario 4‘Post-hydrolysis’
gas-mixed mesophilic digester (35°C)mixing tank
(hydrolysis)
pasteuriser (70
°C)
ammonia capture
foodwaste
digestate
biogas
removedammonia
Stripping reactor
biogas
biogas
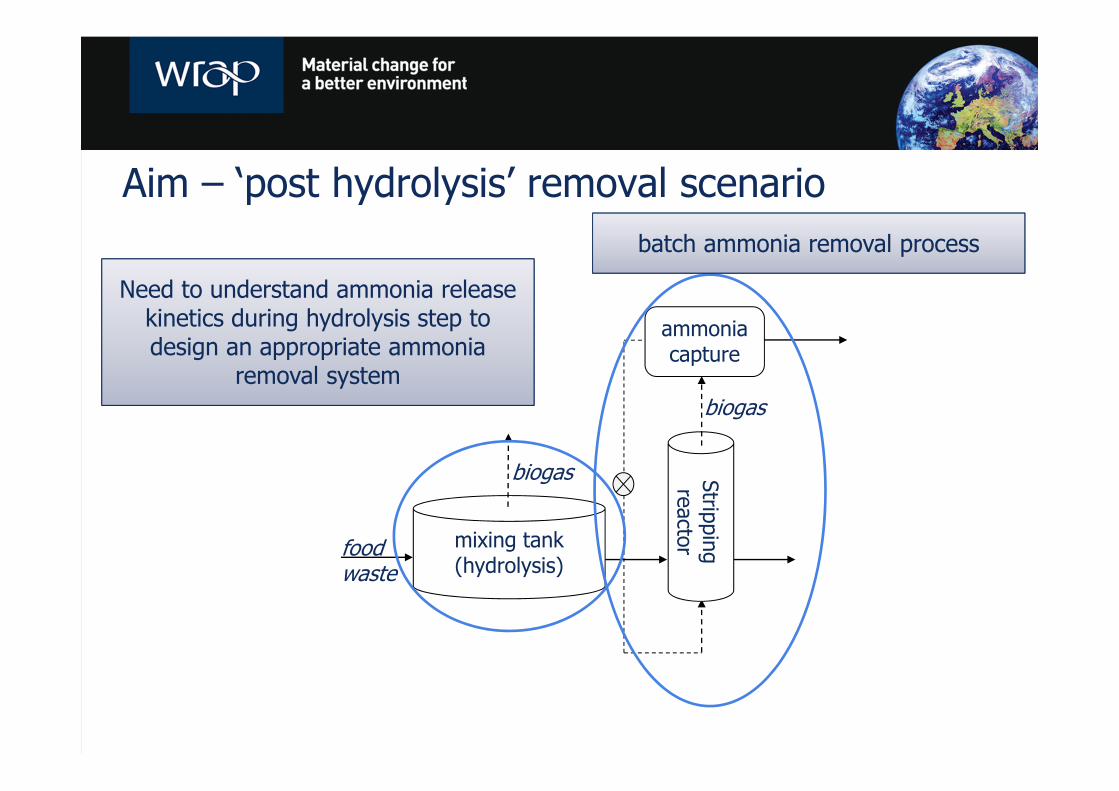
Aim – ‘post hydrolysis’ removal scenario
mixing tank (hydrolysis)
ammonia capture
foodwaste
biogasStripping reactor
biogas
batch ammonia removal process
Need to understand ammonia release kinetics during hydrolysis step to design an appropriate ammonia
removal system

Experimental setup• 8 x 600 ml working volume, stirred mesophilic digesters fed on
homogenised food waste
• Retention times from 2-10 daysRetention time (d)
# digesters Digestate removed daily (g)
Food waste added daily (g)
10 2 60 608 2 75 757 2 85 856 2 100 1005 2 120 1204 2 150 1503 2 200 2002 2 300 300
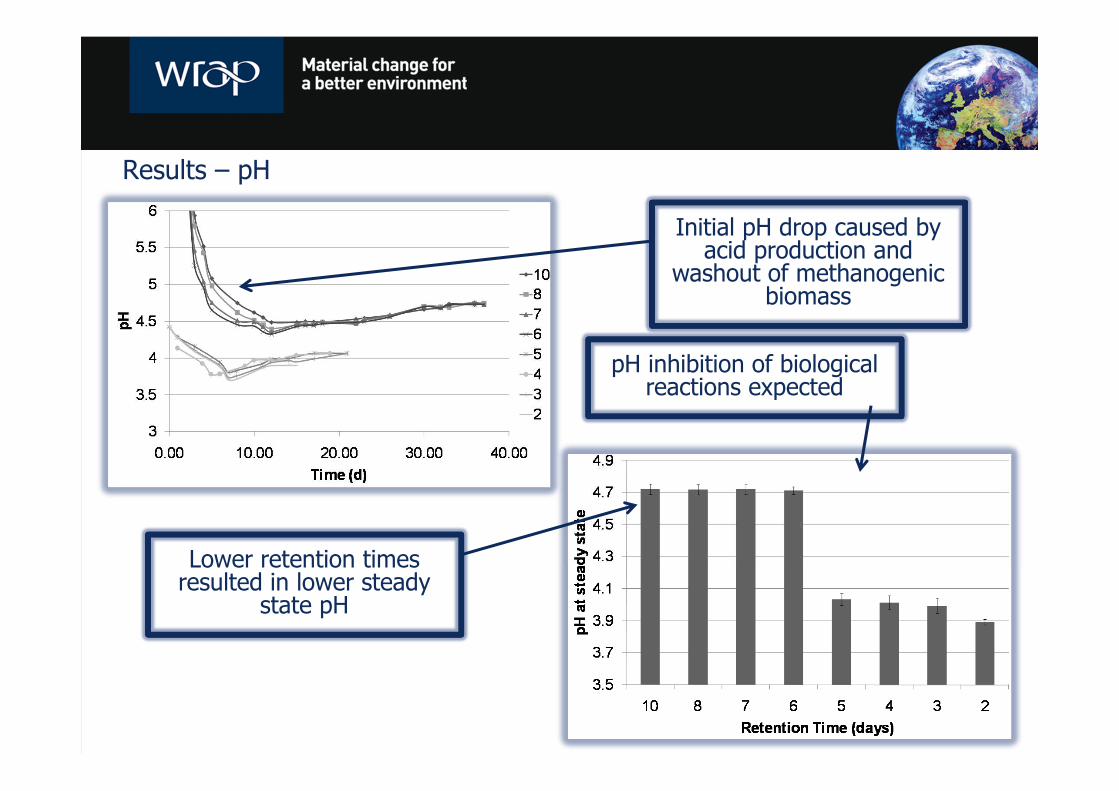
Results – pH
Initial pH drop caused by acid production and
washout of methanogenic biomass
Lower retention times resulted in lower steady
state pH
pH inhibition of biological reactions expected

Results – gas production
biogas was found to be CO2 and increased with shorter retention time
Specific gas production is similar suggesting an
inhibition of the hydrolysis process

Results – ammoniaInitially higher
ammonia production (higher pH)
As pH decreases ammonia production
decreases
Similar ammonia concentration at all
retention times which supports that biological
hydrolysis/fermentation is inhibited
Only ~ 15% of the total ammonia in the food waste is
being released
Outcomes – ammonia released during hydrolysis
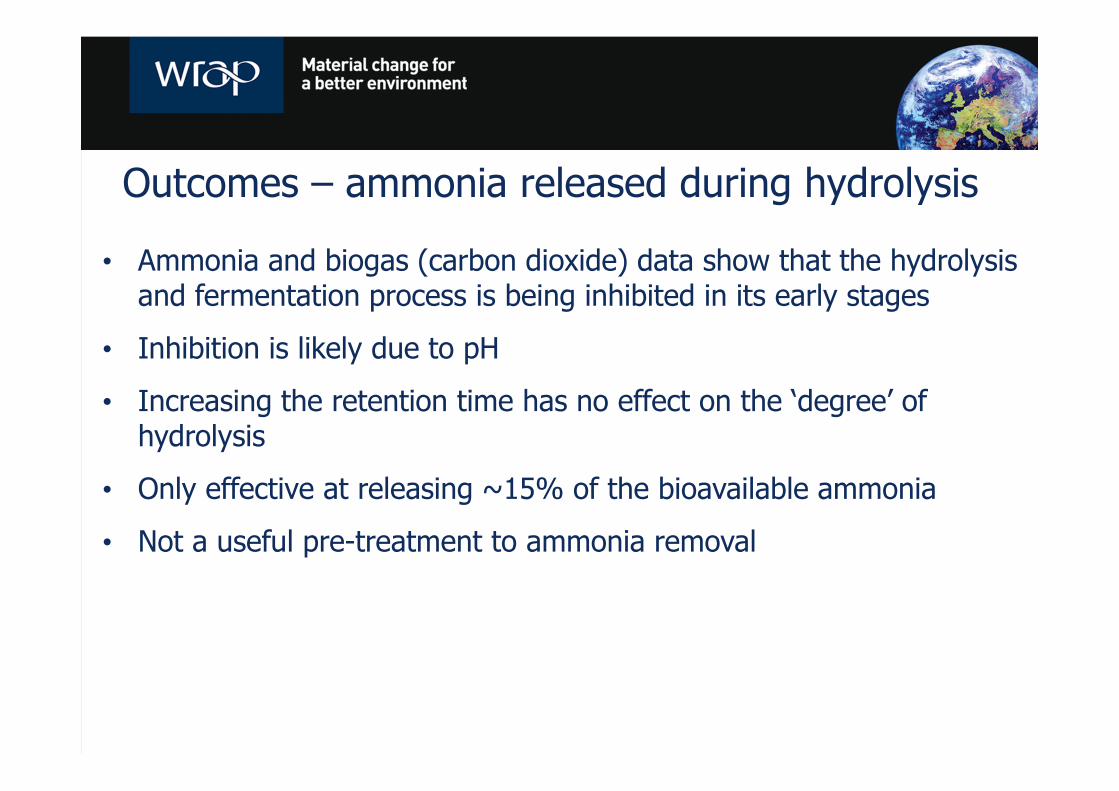
• Ammonia and biogas (carbon dioxide) data show that the hydrolysis and fermentation process is being inhibited in its early stages
• Inhibition is likely due to pH
• Increasing the retention time has no effect on the ‘degree’ of hydrolysis
• Only effective at releasing ~15% of the bioavailable ammonia
• Not a useful pre-treatment to ammonia removal

Integrating ammonia stripping with AD
Part 2AD of food waste with side-stream
ammonia removal

Experimental setup
3.6-litre digester (mesophilic)
0.36-litre stripping reactor
continuous circulation of biogas
pump
water trap (100ml DI water, thermophilic only)
acid trap (100ml 40% H2SO4)
daily transfer of digestate
excess digestate
2gVS/ld food waste biogas
stripping system digester system

Experimental setup – ammonia stripping system
Mesophilic 0.36-litre stripping reactors
Thermophilic 0.36-litre stripping reactors
Pump
SM1SM2
ST1ST2
Water traps
Acid traps

Results – methane production
Transient behaviour throughout experiment
Initially thermophilic stripping caused instability
Later thermophilic stripping shows process advantage (hydrolysis?
population selection?)
Mesophilic stripping destabilises process
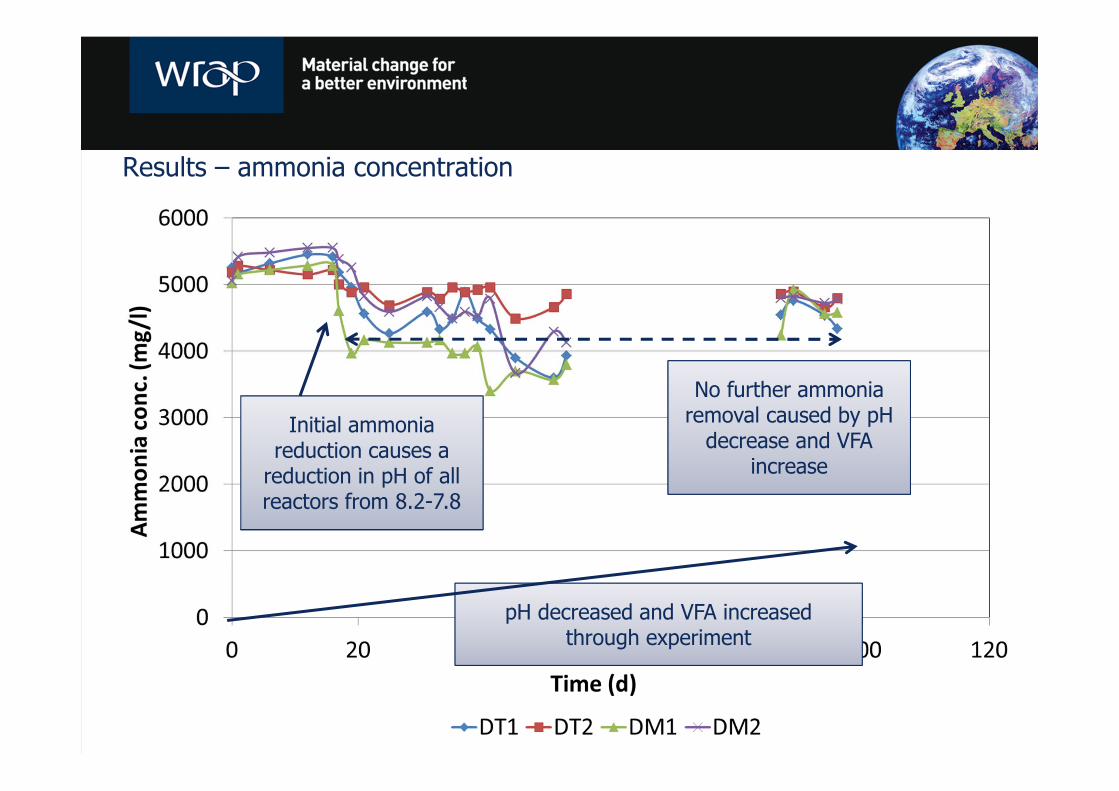
Results – ammonia concentration
Initial ammonia reduction causes a
reduction in pH of all reactors from 8.2-7.8
No further ammonia removal caused by pH
decrease and VFA increase
pH decreased and VFA increased through experiment
Outcomes – side-stream ammonia removal
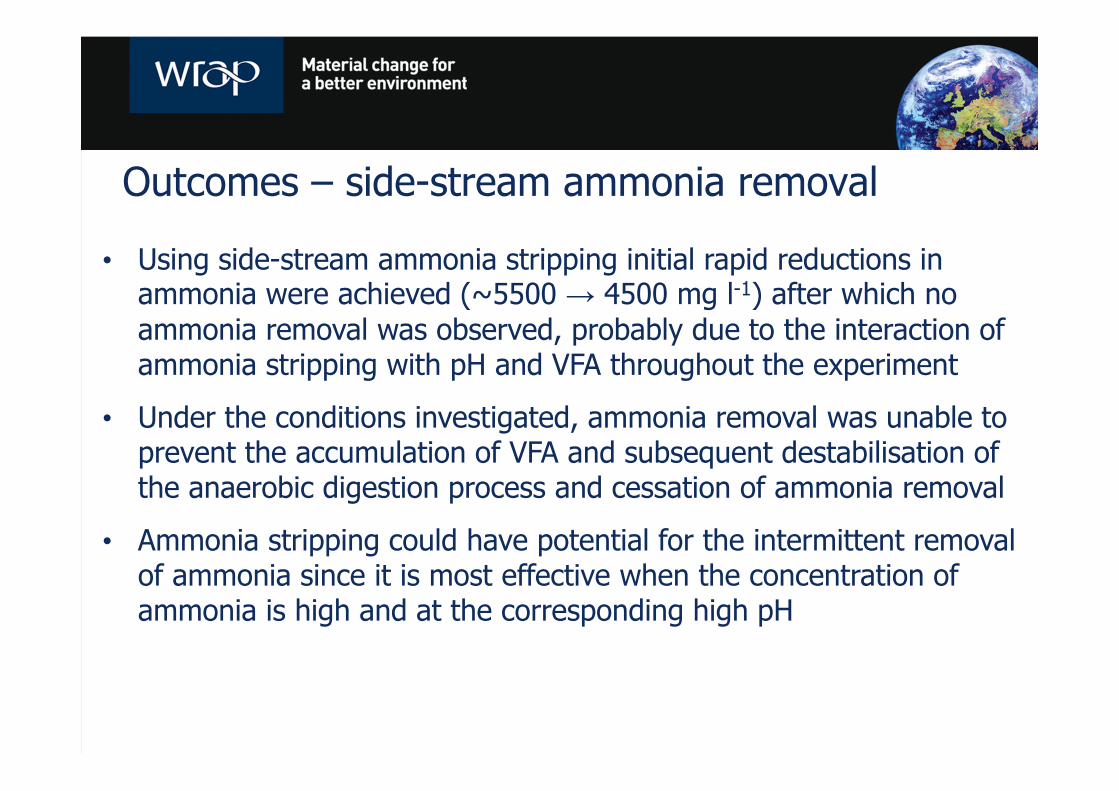
• Using side-stream ammonia stripping initial rapid reductions in ammonia were achieved (~5500 → 4500 mg l-1) after which no ammonia removal was observed, probably due to the interaction of ammonia stripping with pH and VFA throughout the experiment
• Under the conditions investigated, ammonia removal was unable to prevent the accumulation of VFA and subsequent destabilisation of the anaerobic digestion process and cessation of ammonia removal
• Ammonia stripping could have potential for the intermittent removal of ammonia since it is most effective when the concentration of ammonia is high and at the corresponding high pH

Modelling the integration of ammonia removal and food waste AD

Objectives
• Use experimental data from batch ammonia removal work to simulate removal of ammonia from a full anaerobic digestion process
• Model two of the most promising ammonia removal scenarios
• Post digestion – 70°C, 0.375 l l-1 min-1 and with pH modification
• In situ ammonia removal during mesophilic anaerobic digestion
• Both scenarios modelled under a modest and high rate loading condition (2 and 5 g VS l-1 day-1) and for a freshly inoculated and mature digester (initial ammonia conc 500 mg l-1 and 6000 mg l-1)
• Requires some simplifying assumptions regarding the way ammonia is released during digestion and to what concentration (see report).
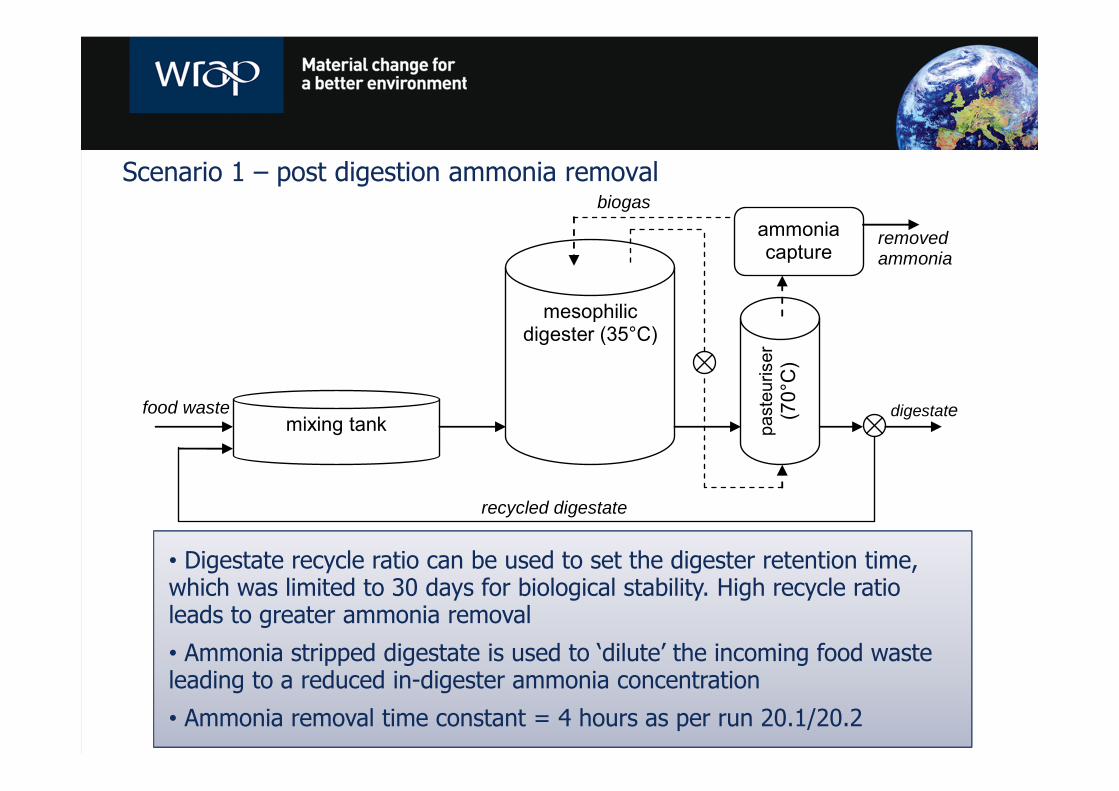
Scenario 1 – post digestion ammonia removal
mesophilic digester (35°C)
mixing tank past
euris
er
(70°
C)
ammonia capture
food waste
recycled digestate
digestate
removed ammonia
biogas
• Digestate recycle ratio can be used to set the digester retention time, which was limited to 30 days for biological stability. High recycle ratio leads to greater ammonia removal
• Ammonia stripped digestate is used to ‘dilute’ the incoming food waste leading to a reduced in-digester ammonia concentration
• Ammonia removal time constant = 4 hours as per run 20.1/20.2
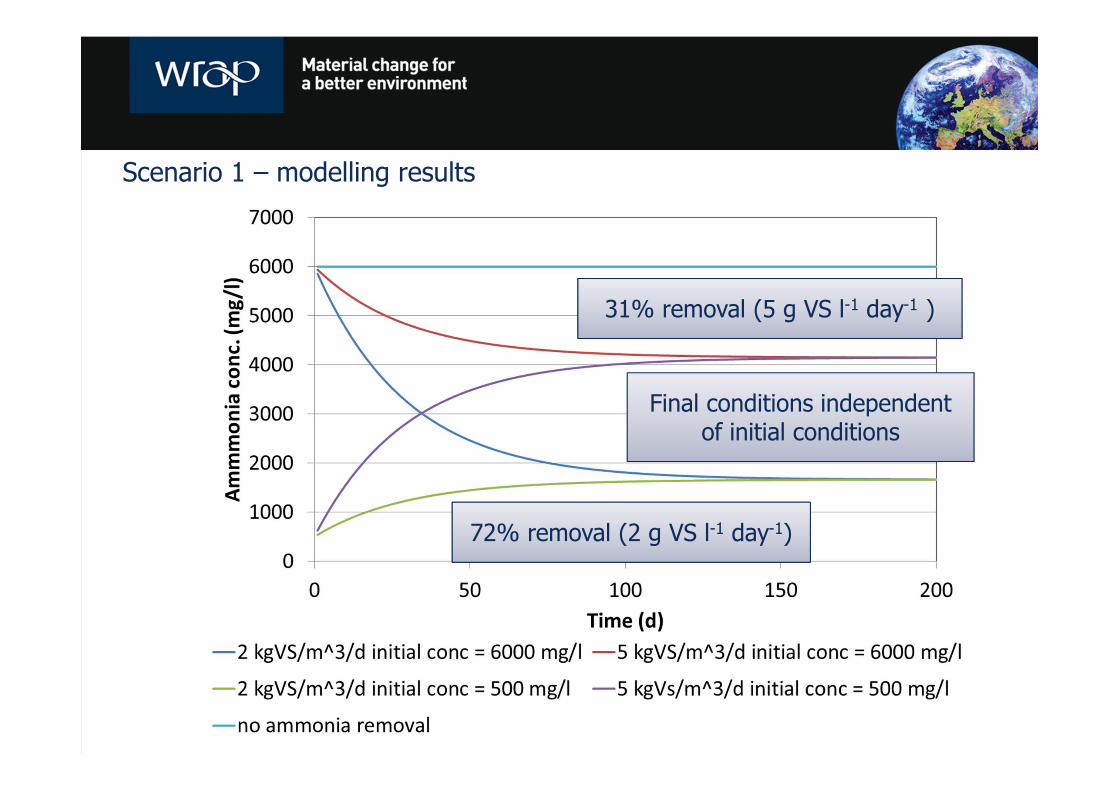
Scenario 1 – modelling results
31% removal (5 g VS l-1 day-1 )
72% removal (2 g VS l-1 day-1)
Final conditions independent of initial conditions
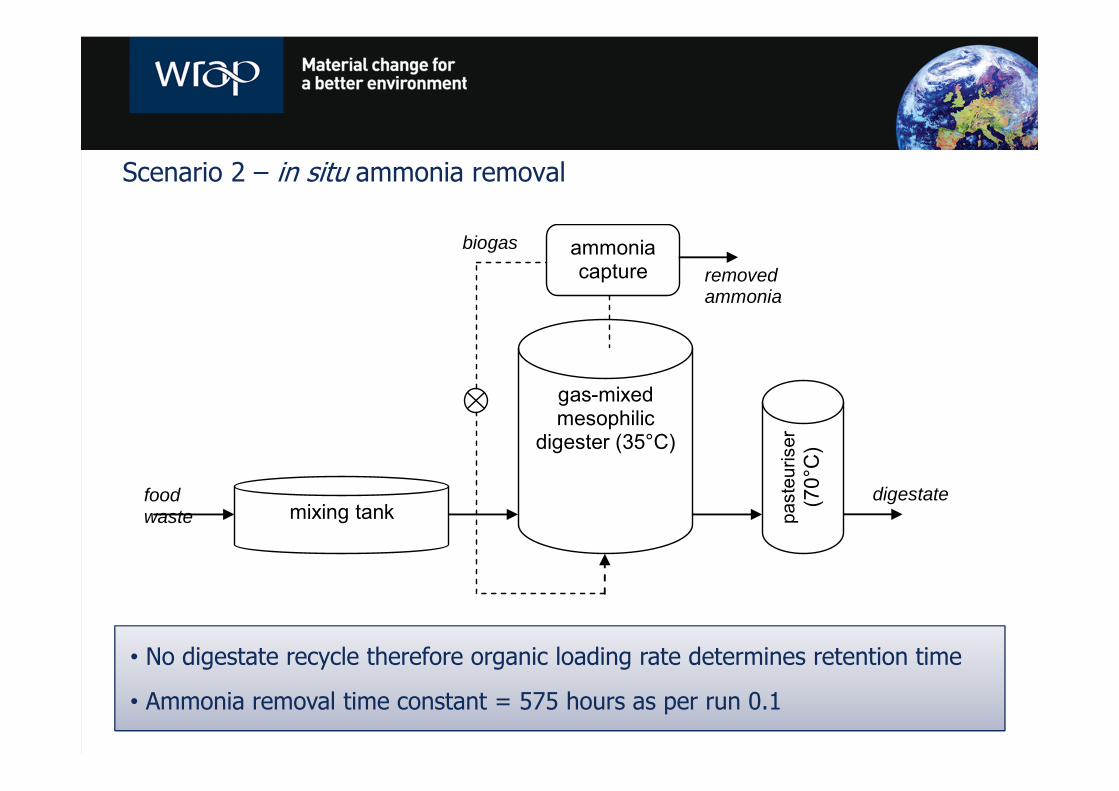
Scenario 2 – in situ ammonia removal
gas-mixed mesophilic
digester (35°C)
mixing tank past
euris
er
(70°
C)
ammonia capture
food waste
digestate
biogas
removed ammonia
• No digestate recycle therefore organic loading rate determines retention time
• Ammonia removal time constant = 575 hours as per run 0.1
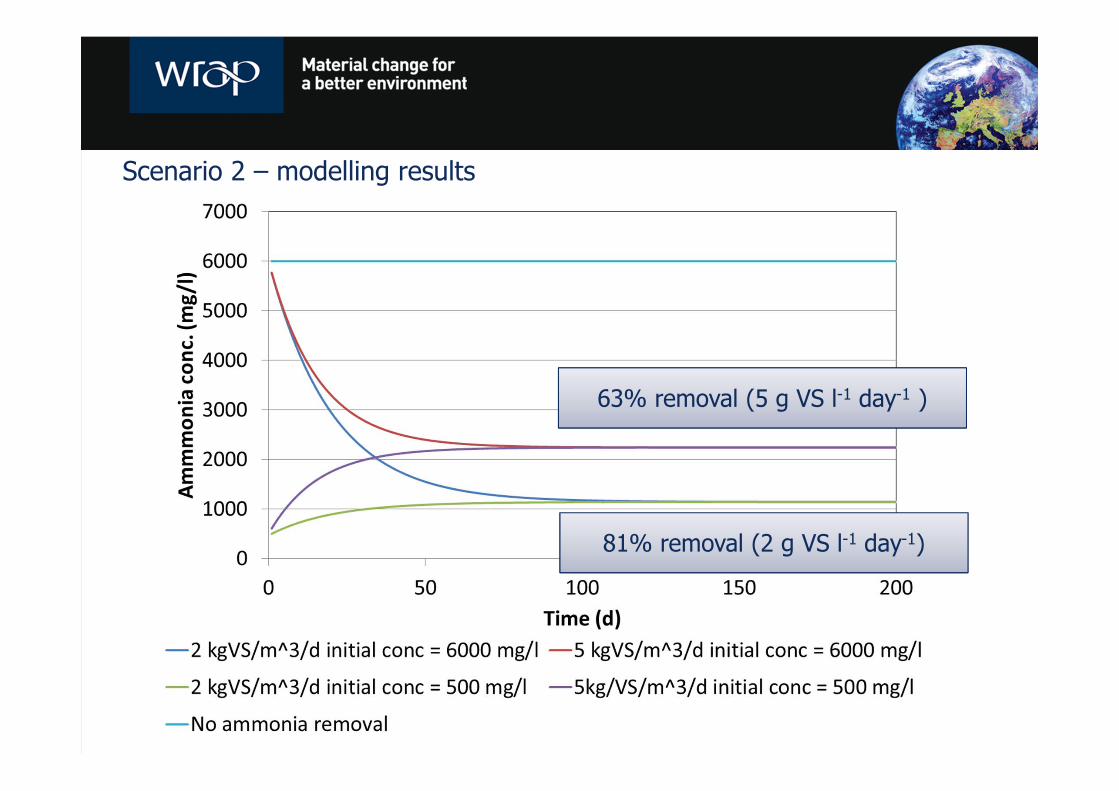
Scenario 2 – modelling results
81% removal (2 g VS l-1 day-1)
63% removal (5 g VS l-1 day-1 )
Outcomes – ammonia removal modelling
• In situ ammonia stripping at mesophilic conditions results in a lower in-digester ammonia concentration despite the much lower rate of ammonia removal
• Post digestion ammonia removal not effective at removing ammonia from the digester in a high rate system since there is a limitation on the ammonia of digestate that can be recycled
• An energetic analysis is needed:
• Post digestion is ‘heat hungry’ - excess digestate is pasteurised
• In situ is ‘pumping hungry’ - 30 x the gas pumping cost

Conclusions - Ammonia removal from food wastedigestate using gas stripping

Main conclusions• Ammonia removal by gas stripping took place with decay constants
of 4-700 hours in the envelope of conditions investigated in this project
• Low pH (<7.5) and high VFA can both severely limit the ammonia stripping performance
• Preliminary laboratory investigation into the integration of ammonia stripping as a post-hydrolysis or side-stream process showed insufficient ammonia removal for stable anaerobic digestion
• Modelling the ammonia removal process during anaerobic digestion showed in situ ammonia stripping to be a promising treatment option in decreasing in-digester ammonia concentrations, especially at a high organic loading rate

Thank you for your attention!