amicrofluidic(system(for(the(capture( andexpansionof ... · 1" "...
TRANSCRIPT

1
Worcester Polytechnic Institute
A Microfluidic System for the Capture and Expansion of Metastatic Cancer
Cells
Connor Haley, Ian Maitland, Stuart Sundseth, Stephen Petry Advisor: Professor Sakthikumar Ambady Co-‐advisor: Professor Dirk Albrecht
April 30, 2015
This report represents the work of WPI undergraduate students submitted to the faculty as evidence of
completion of a degree requirement. WPI routinely publishes these reports on its website without editorial or peer review. For more information about the projects program at WPI, please see
http://www.wpi.edu/academics/ugradstudies/project-‐learning.html

2
Table of Contents
AUTHORSHIP PAGE 5
ACKNOWLEDGEMENTS 6
ABSTRACT 7
LIST OF FIGURES 8
LIST OF TABLES 9
CHAPTER 1: INTRODUCTION 10
CHAPTER 2: BACKGROUND 14
2.1 MICROFLUIDICS 14
2.2 SINGLE CELL CAPTURE 15
2.3 3D GELS AND 3D CULTURE 17
2.4 CANCER CELL METASTASIS 21
CHAPTER 3: PROJECT STRATEGY 23
3.1 INITIAL CLIENT STATEMENT 23
3.2 REVISED CLIENT STATEMENT 24
3.3 PRIMARY OBJECTIVES 24
3.4 SECONDARY OBJECTIVES 26
CHAPTER 4: DESIGN ALTERNATIVES 28
4.1 NEEDS ANALYSIS 28
4.2 DESIGN FUNCTIONS AND CONSTRAINTS 29
4.2.1 DESIGN FUNCTIONS 29
4.2.2 DESIGN CONSTRAINTS 31
4.3 FEASIBILITY STUDIES AND EXPERIMENTS 32
4.3.1 CROSS SECTION OF DEVICES 32
4.3.2 BRDU PROLIFERATION ASSAY 33
4.3.3 MITOMYCIN SCRATCH ASSAY 34

3
4.4 CONCEPTUAL DESIGNS 35
4.5 PRELIMINARY AND ALTERNATIVE DESIGNS 37
4.5.1 FIRST ITERATION MIGRATION DEVICE 37
4.5.2 FIRST ITERATION CAPTURE DEVICE 38
4.5.3 SECOND ITERATION MIGRATION DEVICE 39
4.6 OPTIMIZATION 40
4.7 WATER MODELING 41
4.8 PRELIMINARY DATA 43
4.8.1 CROSS SECTION OF DEVICES 43
4.8.2 BRDU PROLIFERATION ASSAY 45
4.8.3 MITOMYCIN SCRATCH ASSAY 46
CHAPTER 5: DESIGN VERIFICATION RESULTS 50
5.1 PRELIMINARY RESULTS – MIGRATION DEVICE 50
5.2 PRELIMINARY RESULTS – CAPTURE DEVICE 53
CHAPTER 6: DISCUSSION 55
6.1 MICROFLUIDIC DEVICE FABRICATION 55
6.2 HYDROGEL BARRIER FORMATION 56
6.3 CELL MIGRATION THROUGH BARRIER 57
6.4 SINGLE CELL CAPTURE 57
6.5 DESIGN CONSIDERATIONS 58
6.5.1 ECONOMICS 58
6.5.2 ENVIRONMENTAL IMPACT 58
6.5.3 SOCIETAL INFLUENCE 58
6.5.4 POLITICAL RAMIFICATIONS 58
6.5.5 ETHICAL CONCERNS 59
6.5.6 HEALTH AND SAFETY ISSUES 59
6.5.7 MANUFACTURABILITY 59
6.5.8 SUSTAINABILITY 59
6.6 FINANCIAL CONSIDERATIONS 60

4
CHAPTER 7: FINAL DESIGN AND VALIDATION 62
7.1 FINAL ITERATION MIGRATION DEVICE, X-‐DESIGN 62
7.2 SINGLE CELL CAPTURE FINAL ITERATION 64
7.3 X-‐DESIGN VALIDATION 65
7.3.1 HYDROGEL BARRIER FORMATION 65
7.3.2 CELL MIGRATION THROUGH BARRIER 67
7.4 SINGLE CELL CAPTURE VALIDATION 70
CHAPTER 8: CONCLUSIONS AND FUTURE RECOMMENDATIONS 73
8.1 PROJECT CONCLUSIONS 73
8.2 FUTURE RECOMMENDATIONS 74
8.2.1 3D MICROFLUIDICS 74
8.2.2 DEVELOP A CONTROLLED FLOW SYSTEM 75
8.2.3 SINGLE CELL ROBOTIC EXTRACTION 75
8.2.4 TESTING OF CHEMOATTRACTANT GRADIENT 76
8.2.5 VALIDATION OF METASTATIC MARKERS 76
8.2.6 PERSONALIZED MEDICINE 76
REFERENCES 78
GLOSSARY 83
APPENDICES 85
APPENDIX A: SOP FOR MICROFLUIDIC DEVICE FABRICATION 85
APPENDIX B: FULL PHOTOMASK DESIGNS 100
APPENDIX C: SOP FOR BRDU ASSAY 103
APPENDIX D: SOP FOR PLASMA BONDING DEVICES 104
APPENDIX E: SOP FOR HYDROGEL BARRIER FORMATION 105
APPENDIX F: BME EDUCATIONAL OBJECTIVES 106

5
Authorship Page
This project report, titled A Microfluidic System for the Capture and Expansion of Metastatic
Cancer Cells was created with equal, cohesive efforts by Connor Haley, Ian Maitland, Stephen
Petry, and Stuart Sundseth. Each student deserves to earn equal credit for the authorship of
this report.

6
Acknowledgements
The team would like to thank the project’s co-‐advisors Professor Ambady and Professor
Albrecht for all of their support throughout the duration of the project. The team would also
like to thank Lab Manager Lisa Wall and WPI Graduate Students, Laura Aurilio and Ross Lagoy,
for their assistance with microfluidic fabrication.

7
Abstract
Understanding metastatic cancer cells is important to increasing the cancer survival rate.
Microfluidic fabrication allows us to create diminutive environments to perform experiments
on individual cells. This project was aimed at developing a design for a microfluidic device that
has the potential to separate metastatic and non-‐metastatic cancer cells via chemotaxis
through a hydrogel basement membrane mimic. The team’s device allows for the isolation and
expansion of metastatic cancer cells within micron-‐sized wells for further analysis.

8
List of Figures
Figure 2.1: Cell Migration in Microfluidic Device ....................................................................................... 19 Figure 2.2: Cell Migration through Hydrogel Barrier ................................................................................. 20 Figure 3.2: Ranked Objectives Tree ........................................................................................................... 26 Figure 4.1: Hydrogel Retention Posts Cross Section……………………………………………………………………………….33 Figure 4.2: Cell Capture Wells Cross Section ............................................................................................. 33 Figure 4.3: Migration Device Conceptual Design ....................................................................................... 35 Figure 4.4: Single Cell Capture Device Conceptual Design ........................................................................ 36 Figure 4.5: Migration Device First Iteration ............................................................................................... 37 Figure 4.6: Capture Device First Iteration .................................................................................................. 38 Figure 4.7: Migration Device Second Iteration .......................................................................................... 39 Figure 4.8: 1mm Device Model of Hydrogel Barrier Using Water and Green Dye .................................... 41 Figure 4.9: 4mm Device Model of Hydrogel Barrier Using Water and Green Dye .................................... 42 Figure 4.10: 4mm Device Model of Failed Hydrogel Barrier ...................................................................... 43 Figure 4.11: Hydrogel barrier Retention Posts Cross Section .................................................................... 44 Figure 4.12: Single Cell Capture Wells Cross Section ................................................................................. 44 Figure 4.13: BrdU Proliferation Data ......................................................................................................... 45 Figure 4.14: NIH/3T3 Scratch Assay 0 Hours ............................................................................................. 46 Figure 4.15: NIH/3T3 Scratch Assay 50 Hours ........................................................................................... 47 Figure 4.16: PANC-‐1 Scratch Assay 0 Hours ............................................................................................... 47 Figure 4.17: PANC-‐1 Scratch Assay 50 Hours ............................................................................................. 48 Figure 4.18: A172 Scratch Assay 0 Hours ................................................................................................... 48 Figure 4.19: A172 Scratch Assay 50 Hours ................................................................................................. 49 Figure 5.1: Possible outcomes of hydrogel barrier formation ................................................................... 51 Figure 5.2: Hydrogel Barrier Before Seeding………………………………………………………………………………………….52 Figure 5.3 -‐ Hydrogel Barrier after Seeding (0 hours) ................................................................................ 52 Figure 5.4: Hydrogel barrier 24 hours……………………………………………………………………………………………………53 Figure 5.5 -‐ Hydrogel barrier 72 hours ...................................................................................................... 53 Figure 5.6: 100um Microwell Array 0 hours after Seeding ........................................................................ 54 Figure 5.7: 50um Microwell array 0 Hours after Seeding .......................................................................... 54 Figure 7.1: Migration Device, Final Design: X-‐Design ................................................................................ 62 Figure 7.2: X-‐Design Close Up .................................................................................................................... 63 Figure 7.3: Capture Device, Final Design ................................................................................................... 64 Figure 7.4: X-‐Design Barrier Formation Step 1……………………………………………………………………………………….65 Figure 7.5: X-‐Design Barrier Formation Step 2 .......................................................................................... 65 Figure 7.6: X-‐Design Barrier Formation Step 3……………………………………………………………………………………….66 Figure 7.7: X-‐Design Barrier Formation Step 4……………………………………………………………………………………….66 Figure 7.8: PANC1 Cells in Hydrogel Barrier at 0 Hours ............................................................................. 67 Figure 7.9: PANC1 Cells in Hydrogel Barrier, 14 Hours .............................................................................. 68 Figure 7.10: PANC1 Cells in Hydrogel Barrier, 22 Hours ............................................................................ 69 Figure 7.11: Micro-‐Well Array, Empty Wells ............................................................................................. 70 Figure 7.12: Micro-‐well Array, Multiple Cells ............................................................................................ 71 Figure 7.13: Micro-‐well Array, Single Cell .................................................................................................. 72

9
List of Tables Table 3.1: Pairwise Comparison Chart……………………………………………………………………………………………………25
Table 4.1: Mitomycin Experimental Layout……………………………………………………………………………………………33
Table 6.1: Cost to Produce a Single Silicon Wafer Mold…………………………………………………………………………59
Table 6.2: Costs to Produce a Single PDMS Device…………………………………………………………………………………59

10
Chapter 1: Introduction
Since the year 2000, over 10 million new cases of cancer have been diagnosed and over
5 million people die from cancer each year1. The average percentage of adults diagnosed with
cancer is approximately 1.5% of the population in North America and Europe, making the
disease extremely prevalent2. Metastasis of cancer refers to the spreading of cancer cells from
a tumor in one part of the body to locations all over the body through the bloodstream. Over
90% of all cancer morbidity and mortality is associated with metastasis, making it an ideal
target for treatment of the disease3. This indicates that reducing or inhibiting metastasis would
lead to a significant increase in survival rate and a significant reduction in patient suffering. The
most recent advancements in metastasis inhibition involve interfering with signaling pathways
in the tumor that dictate whether a primary cancer cell will metastasize4. While this method
shows promising results, an effective treatment is still out of reach as all models for this line of
study are in vitro and have not been tested in humans.
One factor involved in inhibiting or encouraging cell growth and migration is the matrix
on which the cells are growing. There is significant evidence suggesting that the stiffness of the
matrix affects the ability of cells to migrate and chemically communicate with each other5.
Additionally tumors have been found to alter their stiffness relative to the surrounding tissue,
and behave differently when this stiffness was artificially changed6,7. This implies that matrix
stiffness plays a large role in the development and spreading of tumors, and that studying how
stiffness affects metastasis of cancer tumors could lead to new therapy or treatments for
cancer patients.
Metastasis does not randomly occur in every cancer cell; only a select number of cells
with specific properties will metastasize, suggesting that studying tumors on the cellular level
would be beneficial8. It has also been shown that single cells do not necessarily represent the
properties of the entire cell population9. Additionally, most single cell assays are achieved
through microfluidic processes and allow for testing of thousands of cells with only minimal
reagent use and culture time, which is a significant improvement over population based
assays9. Currently, metastatic cells are studied through staining of a tissue biopsy10. However
this method does not allow researchers to perform cell specific assays due to the collection of
11
both metastatic and non-‐metastatic cells, or for the same reason differentiate gene expression
between the cell types. Consequently there is a need for a cheap and efficient method to
isolate metastatic cancer cells for gene expression studies in single cells and clonal expansion
for personalized cancer treatments.
Due to the metastatic nature of cancer, the migration of cancer cells throughout the
body is perhaps one of the deadliest parts of this disease. In order to test the ability of the cells
to navigate through various tissues, the team will design a microfluidic device with the function
of measuring the amount of time taken for cancer cells to cross a hydrogel at different degrees
of stiffness; individual cells will then be captured for single cell expansion and testing. These are
the primary objectives to achieve for this project.
The first step to completing the goal of the project is to pass a number of cells through a
hydrogel barrier. A chemotactic agent was used to induce chemotaxis in cancer cells across a
hydrogel barrier. The stiffness of this barrier can be changed between tests in order to test a
range of tissue stiffness. With time lapse imaging the team was be able to record how long it
takes for the cells to migrate through the hydrogel. This time is related to the ease of migration
through tissues in the body, therefore giving the user an idea of which areas of the body the
specific cancer line will migrate through easiest, and therefore which areas are most
susceptible to metastatic growth.
As single cells migrate through the hydrogel they will be separated and deposited in
wells for expansion and testing. Since one single cell can be responsible for metastatic growth,
separating the more metastatic cells for testing allows us to figure out what drugs are more
likely to combat these cells.
In order to be successful in this project and produce an effective device, the team must
lay out numerous goals, and have a strategy for reaching them. The first main goal for this
project was to develop a design for a microfluidic device. The team’s strategy for completing
this involved research as well as discussions with the client in order to revise the initial client
statement. What the group hopes to determine are the general and second layer objectives,
functions, and constraints. The general and second layer objectives drive the characteristics of
the device (safe, precise, durable etc.). Identifying the functions of the device allow the team to
12
accurately determine every precise task the device must accomplish. Recognizing the
constraints of the design permits the team to realistically define the design space of the
project. Without constraints, the team could design impractical devices.
Once the team has fully defined the design space, conceptual and preliminary designs
was developed that achieve the functions in multiple ways. These alternative designs will then
be evaluated in order to arrive at a final design. The most popular and effective evaluation
method is the Pugh Concept Selection Method11. This method involves comparing each
alternative design to a baseline, rather than to each other. After evaluating the designs, the
team will have a final design to move forward with to production.
The second main goal of the project is to successfully test the device. To do this, the
team will examine its ability to meet each of the functions individually. Thus the device will be
tested to determine a success rate for isolating single cells, expanding single cells in culture,
fabricating a hydrogel barrier for migration, encouraging cell migration, and measuring cell
migration.
In order to determine the success of single cell capture, the capture area will be
examined with a microscope shortly after seeding. Capture areas will have no cells, a single cell,
or multiple cells. By taking the ratio between wells with single cells to wells with multiple cells,
a success rate for single cell capture can be obtained. A capture area being empty does not
necessarily imply a failure, as this could be cause by overall low cell number.
After cells have been seeded in the capture areas, the ability of the cells to proliferate
will be examined. Cells will be cultured in an incubator with medium for at least 3 days.
Afterwards, cells will be stained with DAPI/Propidium Iodide to show relative numbers of live
and dead cells. The size of the cell colonies in relation to time points shortly after seeding will
also be examined.
The device’s ability to create a hydrogel barrier will be evaluated by adding a
fluorescently labeled die to the gel before fabrication. The hydrogel will be flowed into the
barrier area and allowed to crosslink. The hydrogels ability to be confined within the barrier
area can easily be seen under fluorescent microscopy.

13
Once the device is functioning, the chemotactic agent’s ability to induce cell migration
through the hydrogel barrier will be examined by performing the experiment with varying
concentrations of chemotactic agent on the downstream side of the barrier, eventually running
the experiment with low levels of chemotactic agent. The number of cells successfully migrated
through the barrier at different levels of chemotactic agent will disclose the effect of the agent
on cell migration. If each feature of the microfluidic device is functional during the
experimentation, the overall project will be a success.
Various techniques have been developed in order to isolate tumor cells from the blood,
but these processes are difficult due to metastatic cancers being admixed with the blood’s
components. This makes the isolation and characterization of these target cells a major
challenge to overcome12. Another issue lies in the genetic nature of cancer. As an example,
pancreatic cancer exhibits approximately 50 mutations in its 20,000 genes which define it as a
cancer cell. However these 50 changes that lead to cancer are not consistent, meaning no two
instances of cancer are the same13. Understanding this variation is crucial when trying to assess
how quickly cancer can spread through the body.
In order to evaluate how varying stiffness affects cancer cell proliferation, a system that
mimics the stiffness of natural tissues needs to be developed that permits cancer cell
migration. The goal of this project is to design a microfluidic system that isolates and expands
single cancer cells from tumor biopsies within a three-‐dimensional, stiffness-‐gradient
containing, cell-‐encapsulating hydrogel. The process of photolithography will be employed to
create the mold for the microfluidic system. Once the cancer cells isolated within the hydrogel
wells, a chemotactic agent will be utilized to encourage the cancer cell migration. The team will
record this migration and draw conclusions on the cancer’s metastatic factors based on the
stiffness of the gel it traveled through.

14
Chapter 2: Background
The goal of this project was to design and fabricate a microfluidic device which allows
for the isolation and expansion of metastatic cancer cells. To assist in the understanding of this
project, this chapter reviews topics such as microfluidics, single cell capture, 3D gels and 3D cell
culture, and cancer cell metastasis.
2.1 Microfluidics
Microfluidics is defined as the science of liquid flow through channels of micrometer
size. Thus when one designs a microfluidic system, the process involves the fabrication of
fluidic channels and chambers with linear dimensions14. The size of microfluidic devices plays a
key role in their usefulness for studying biological systems. Since the fluidic systems operate on
the micro-‐scale, scientists are able to record greater quantitative measurements and
manipulate single cells via precisely calculated liquid flow. An additional advantage of the
device’s size is the fact that they require minimal resources to fabricate, making the process
relatively inexpensive. The use of the experimental samples within the device is also minimized,
allowing for high-‐throughput analysis of cells or molecules depending on the experimental
purposes14. The invention and recent developments of soft lithography contributed to the
increased interest and feasibility of microfluidics. Soft lithography refers to techniques that
create conformable photomasks which can be used to replicate the design for a microfluidic
device onto a soft elastomeric material, most prevalently polydimethylsiloxane14. Another
advantage of microfluidics is the ability to manipulate the cellular micro-‐environment with the
generation of several types of chemical and physical gradients. This allows for the study of
biological processes such as chemotaxis and morphogenesis15.
A crucial facet of cellular microfluidics is being able to culture the cells within the
device. The manipulation of biological systems is dependent on understanding intercellular
molecular interactions and mechanisms present in the cellular microenvironment16,17. In order
to achieve control of this environment, cell cultivation can be used to mimic cell-‐cell matrix
interactions by creating chemical gradients utilizing various growth factors and hormones18.

15
2.2 Single Cell Capture
The study of single cells provides the opportunity to better understand the unique
properties of a small percentage of cells within a population. Single cells can exhibit
phenotypes and gene expression that are different from the majority of the colony. These
differences can also result in functional changes such as metastatic cancer cells within a
tumor19. The ability to isolate these specific cells allows assays to be performed without
interference from normal cells in the population. Analyzing cells on an individual level gives a
more accurate representation of cell-‐to-‐cell variations instead of the average behavior of all the
cells in the colony20. As a result of this, if single cells are expanded, they yield a population with
uniform cell properties that can be used for a variety of purposes21.
Another benefit to using microfluidic devices to isolate cells is the reduced cost of
materials both to fabricate the device and to run the experiment. A reduced amount of
reagents and media can be used to assay the same number of cells, increasing the efficiency of
experiments significantly. Additionally, due to their small size and relative ease of fabrication,
microfluidic devices can be mass produced and used for large parallel analysis at a lower cost
than traditional methods.
The efficiency of microfluidic devices is further improved by the large number of cells
that are able to be assayed at once on such a small area. In a recent study, 1,518/1,700
chambers in a cell trapping device were filled with cells before undergoing RT-‐qPCR analysis.
The ability to collect hundreds of data points in a single experiment is extremely beneficial to
researchers with a limited budget22.
A variety of methods have been developed to manipulate cells on a microfluidic
platform. Optical trapping uses a focused laser beam and a microscope lens. Particles become
trapped in the focal point of the beam or are repelled from it23.
Arrays of microwells are also used to trap single cells. Cells are flowed into the chamber
and allowed to sediment into the wells. The current standard for single cell trapping efficiency
using this method is 30-‐40%. These arrays are often fabricated through soft lithography and
each well contains enough room for only one cell. There are three main uses for microwell
arrays: first, fabrication of 3D environment to mimic in vivo conditions, second, culture of small
16
colonies for drug screening, and third, analysis of rare single cells using live microscopy. Even
with their low trapping efficiency, microwell arrays still provide high throughput experiments
due to the small area used by the arrays and several microwell array devices have already been
patented25.
Another form of cell manipulation is cell separation, or cell sorting. This method takes
advantage of the hydrodynamic properties of particles in laminar flow. Cells are either flowed
through a spiral channel where larger cells will move to the outside of the channel while
smaller cells remain in the center, or they are flowed through a flow fractionation system in
which smaller cells are pulled to the outside of the stream by the shape of the channels
disrupting the flow. This method is useful for separating rare cells from a large sample, or for
sorting cells based on size26.
Cell separation can also be achieved through crossflow filtration. In this technique, the
cell sample is flowed through one channel that is separated from another channel by a semi-‐
permeable membrane. When a buffer is flowed through the second channel, diffusion of small
cells and particles will occur across the membrane27.
Cells can also be isolated in droplets for drug assays, or to culture cells in low volume
conditions to increase concentration of a molecule released by the cell. Media with cells is
flowed through a narrow channel that crosses another channel that contains an oil and
surfactant mixture being pulse-‐flowed with a syringe pump. Droplets formed this way have a
33% single cell trapping efficiency, but are produced at 100 droplets per second28. These
droplets can be used to assay cells as if they were in a microwell array, but are unique in that
individual cell protein expression can be measured from the droplet fluid29.
The polar nature of the cell membrane makes electrical manipulation a viable option.
Electrodes are used to create an electric field to either trap or direct cells. Cells can be
electroporated, or even lysed using a strong enough field. Similarly two cells can be fused using
this method. When combined with imaging software, electrical manipulation can be used to
autonomously sort or trap cells with speed of light reactions29. Arrays of micro-‐electrodes on a
surface can act as attachment sites for cells that can be turned on or off. This allows for better
control over individual cells and easy release of cells once attached30.
17
2.3 3D Gels and 3D Culture
In recent years many researchers have attempted to alter the conditions of cell culture
experiments to more closely resemble in vivo conditions. The main reason for this change is
that ordinary cell culture dishes are made of stiff plastic, which does not correctly mimic tissue
found in the body. Also in vivo substrates provide physical and chemical cues to cells promoting
proliferation or other cell functions. An effective alternative to culture on a plastic dish is to use
hydrogels31. A hydrogel is a cross-‐linked network of proteins or polymers that provide a more
realistic substrate for cell culture. Hydrogels have high water content, and allow for exchange
of oxygen, nutrients, growth factors, or waste between cells and culture medium32.
In addition to allowing for medium exchange and reduced stiffness, hydrogels also allow
for 3D culture. Instead of being restricted to a 2D surface as on a culture plate, in hydrogels,
cells are free to proliferate and migrate in 3-‐dimensional space, similar to in vivo. It has been
reported that studying cell behavior on a 2D surface is not sufficient, and that 3D culture offers
a much more realistic cell environment32. Similarly, the same cell type can behave drastically
different on one substrate versus another. Human breast epithelial cells were found to behave
similarly to breast cancer cells when cultured on a 2D culture plate, but later returned to
normal behavior in a 3D hydrogel culture system33. Additionally, murine embryonic stem cells
produce substantially more collagen when grown in 3D conditions versus 2D34. In order to
ensure that a culture system accurately represents the in vivo characteristics of a cell, it is
important for the cell culture substrate to closely mimic that found in the body.
The broad range of hydrogels can be divided into two groups: synthetic and biologic.
Synthetic hydrogels can be made of polymers such as poly(vinyl alcohol)35, poly(2-‐hydroxy ethyl
methacrylate)36, poly(ethylene glycol)37. Synthetic hydrogels produce a network of cross-‐linked
fibers providing a framework for cell growth, and allow cells to produce and lay down native
ECM materials to replace the synthetic hydrogel over time38. Synthetic hydrogels also offer
consistent production and reproducible characteristics32. However, synthetic hydrogels do not
offer any biological features to promote cell growth. They are passive to cell proliferation,
unlike biologic hydrogels, which actively support cell growth32. Biologic hydrogels are made of
naturally occurring polymers or proteins in the body, such as collagen39, fibrin40, or hyaluronic
18
acid41. Advantages of biological hydrogels include active support of cell growth and an even
more in vivo-‐like substrate. Disadvantages include variability between batches, risk of
contamination and degradation, and complexity; it is difficult to determine which biological
factors may be causing cell functions, and tuning of mechanical and biological factors is
difficult32.
The stiffness of Matrigel, a biologic hydrogel, was measured using atomic force
microscopy to be roughly 450 Pa42. This is consistent for most hydrogels, and is much more
representative of actual tissue compared to plastic dishes with a measured stiffness of more
than 100,000 Pa43 and ranging to giga pascals. The stiffness of a hydrogel can be adjusted
simply by increasing or decreasing the amount of crosslinking agent. The interaction between a
hydrogel and its surroundings can also play a role in determining stiffness. A hydrogel bonded
to a glass slide will form a type of boundary layer at the interface at which the stiffness of the
hydrogel will be very close to that of the glass. At increasing distances away from the glass
slide, the stiffness of the gel decreases44. Aside from stiffness, the diffusivity of the hydrogel
can greatly affect cell viability. Hydrogels with high diffusivity allow for rapid transfer of
nutrients and oxygen to the cells from the media and CO2 and waste to the media from the
cells. The diffusivity of a 24 kDa protein through a collagen-‐based hydrogel was measured to be
6.8 x 10-‐7 cm/second. Also, the diffusivity was consistent throughout the hydrogel, generating a
constant gradient45. The porosity of a gel, or the amount of empty space within it, can have a
dramatic effect on the gels ability to trap and hold growth factors or even cells. Collagen
hydrogels have been shown to contain pores up to 200 microns in diameter, and thus large
cells would be trapped in each pore46.
Due to the fact that hydrogels are a much better representation of native tissue, they
are good models for studying cell migration. The high water content, stiffness, porosity and
geometries of hydrogels can allow for cells to move through them as they would in vivo. In
Figure 2.1 cells were suspended in an Agarose gel in the center channel. A chemotactic agent
was then added to the top channel and allowed to diffuse to the middle channel, and form a
gradient through the hydrogel. In response to this gradient, cells were found to migrate
through the hydrogel towards the higher concentration in the upper channel47.

19
Figure 2.1: Cell Migration in Microfluidic Device
Hydrogels have also been used as barriers for cell migration, as in Figure 2.2. Three
channels (middle, far left and far right in the figure) were separated by a collagen hydrogel
barrier. A hydrogel barrier was created in the device by flowing un-‐crosslinked hydrogel into
separate channels, ending in the white boxes shown. The gel was kept from flowing into the
cell channels by the addition of small posts (small white squares). Cells seeded in the middle
channel were made to migrate due to the presence of a chemotactic agent gradient inside the
hydrogel48. This device demonstrates a cell’s ability locate a chemotactic agent gradient within
a hydrogel, and begin migration through the same hydrogel in response.

20
Figure 2.2: Cell Migration through Hydrogel Barrier
The physical and biochemical characteristics of a hydrogel can also have an effect on cell
migration. A stiffness gradient was created by bonding one side of a Matrigel hydrogel to a
glass plate. As stated above, the stiffness would be inversely proportional to the distance away
from the glass slide. Glioblastoma cells were then seeded throughout the gel, at different
stiffness, and allowed to migrate. It was reported that the cells migrated 4 times faster through
stiff gel compared to softer gel44. It has also been shown that making biochemical modifications
can induce and direct cell migration in Agarose gel. Rat dorsal root ganglia cells were able to
migrate easily through Agarose gel channels modified with oligopeptides49. Moving forward,
the team will need to consider factors such as synthetic versus biologic, stiffness, diffusivity,
porosity, and biochemical markers in the use of a hydrogel as a barrier to cell migration.

21
2.4 Cancer Cell Metastasis
Cancer cell metastasis occurs when tumor cells begin to migrate from their primary
tumor site and travel throughout the body. Metastasis in a cancer cell is one of the defining
factors in determining the malignancy of a tumor50. When a cancerous growth attains a certain
size, its cells can migrate throughout the body causing even more tumors. Thus what was once
just a growth in one organ system is now a widespread complication, increasing the chance of
multiple organ failure. Certain areas of the body are more susceptible to metastatic cancer than
others and this is due to the ease of cell transport to these areas as well as the tissue stiffness.
The tissues most likely to be targets of metastasis are the bone, liver, brain, and lung51.
When a cell breaks off of a growth, it can travel around the body via three different
ways: haematogenous, lymphatic, and transcoelomic. Haematogenous and lymphatic travel
refer to a cancer cell using the circulatory or lymphatic system respectively to travel throughout
the body, whereas transcoelomic migration involves cells moving through extracellular matrix
(ECM) to a new location. Although cells can travel in this space, little is known about the
mechanisms which affect migration and it is this type of metastasis that is the focus of this
study52.
Transcoelomic migration as a mechanism allows for cells to navigate the extracellular
matrix. However, the tissues that a cell may migrate through all have varying degrees of
stiffness and this tissue stiffness plays a major part in the migration of those cells53. A cell may
be better equipped to move through one tissue as compared to another, thus dictating the
cell’s destination. This is a large part of why certain tissues are more susceptible to metastasis
than others, and it is this factor that the group is looking to test.
Cells move throughout the body in reaction to different stimuli. These stimuli may be
internal, a gene inducing contraction or expansion, or external, a chemical signal that the cell
can sense. The latter is called chemotaxis and refers to the cells ability to sense chemicals
within their local area. It is this mechanism that the team will be utilizing to induce migration
via the application of a chemotactic agent. A chemotactic agent is a chemical that promotes
chemotaxis54.

22
Previous studies have shown that cells can migrate through and grow in certain
hydrogels55. These gels can be made of many different materials but the team plans on using
collagen for this migration study. This gel can also be made at different degrees of stiffness,
allowing for a tunable stiffness. By having a tunable stiffness, the device can simulate the
stiffness of different tissues, thus creating a model for testing how certain cancer cells will
migrate through different tissues. It has been shown previously that cancer cells migrate
differently depending on the stiffness of the hydrogel so it is important that this mechanism be
variable for testing purposes56.

23
Chapter 3: Project Strategy
Here the group discussed various aspects of the project such as the initial client statement,
revised client statement, and primary and secondary objectives. These aspects are analyzed in order to
determine how they will influence the design process.
3.1 Initial Client Statement
The team was given the following initial Client Statement in order to define project objectives,
constraints, and functions.
The aim of this project is to develop an efficient device or system to isolate and expand
single cells from tissue biopsies. The device should be able to trap and expand single
cells in micron sized hydrogels of varying stiffness representing different tissues. Ideally,
the device also should allow placement and/or arrangement of cell laden microgels to
produce precise geometries that can facilitate organ engineering, tissue engineering
and the study and analysis of cell-‐cell interactions.
The needs of this project are
1. Use of a microfluidic or a similar device
2. Choice of biocompatible gel material(s) with the following properties
a. suitability for use in microfluidics
b. fast gelling to trap single cells in the devices

24
c. allow precise placement/arrangement of cell laden microgels to produce geometries
for studying cell-‐cell interactions, development of organoids or tissue engineered
products.
d. allow real-‐time monitoring of cells.
3.2 Revised Client Statement
After meeting with the team’s project advisors to clarify the initial client statement and discuss
the project objectives and constraints, the team revised the initial client statement as follows:
The aim of this project is to develop an efficient device to isolate and expand single cells
from large cancer cell populations. The device should be able to create a hydrogel barrier
mimicking a basement membrane. Ideally, the device should allow for the testing of metastatic
cancer cells that have been isolated due to migration.
3.3 Primary Objectives
Through further discussion with the client about the initial client statement, and in
order to better define the direction of the project, the team developed four main objectives for
the device. These are Reliable, Marketable, Reproducible, and Efficient. These four objectives
were identified as the most important attributes of the device. In order for the device to be
successful, it must meet all of these objectives.
In order for the device to be reliable, it must be able to withstand any forces,
temperatures, or pressures exerted without failing. All physical features of the device such as
channel walls, posts, wells, reservoirs, capture points, etc., must be sturdy enough to run an
experiment without them failing.
To fulfill the second objective of being marketable, the device must be something that
can be translated to the market. The team hopes that the device will eventually be successful
enough to be valuable. A marketable device is one that adds a new technology to the field, and

25
is therefore innovative. The device must also be easy to use, as a complicated protocol will
decrease the likelihood of the device’s success.
An important attribute for the device to have is to be efficient. The device must allow
for “high-‐throughput” testing, meaning it must accommodate high volumes of cells in short
time periods. It must also be efficient from a cost of materials and manufacture standpoint.
Finally, using the device and the performing the experiment must be time effective.
The final objective of the device is reproducibility. The device must function the same
way each time it is used. In the case of single cell capture, the capture areas must capture one
and only one cell repeatedly. The device must be able to produce a gel barrier precisely and
accurately. The reproducibility of the device is important because it will give weight to any
experiments done and results gathered from the device.
Based on client feedback, the four objectives were evaluated using a Pairwise
Comparison Chart (PCC). A PCC is effective for identifying which objectives are more important
than others. Each objective is compared to each other objective; if objective A is more
important than objective B, A receives a score of 1. If A and B are of equal importance, A
receives .5 points. If B is more important than A, A receives 0 points. A PCC completed by the
team and the team’s advisor is shown in Error! Reference source not found.. The total score
for each objective is in the far right column.
Marketable Reliable Reproducible Efficient Total
Marketable X 0 0 .5 .5
Reliable 1 X 0 .5 1.5
Reproducible 1 1 X 1 3
Efficient .5 .5 0 X 1
Table 3.1: Pairwise Comparison Chart

26
According on the table, the team’s objectives in order of importance are: Reproducible,
Reliable, Efficient, and Marketable. Based on this evaluation, the most important feature of the
device must be its ability to perform the same function repeatedly. This is because if the device
were not reproducible, and results collected would not be viable.
3.4 Secondary Objectives
Figure 3.1: Ranked Objectives Tree
The secondary objectives were ranked by the client and team within the category of
each primary objective as seen in Figure 3.1. “Produces consistent results” was ranked as the
most important secondary objective because if the device cannot produce reproducible data, it
will not be useful for any type of research which is its intended purpose. In order to produce
these reproducible results the device must have consistent flow with no leakage or unintended
pressure fluctuations. After these most important objectives comes efficiency specifications
such as high throughput, short time to operate, and low cost which all increase the usefulness
of the device but are not critical to its function. Lastly, objectives of low importance are listed

27
such as “easy to use” and “aesthetically pleasing” which are related to marketing of the device
and not related to changing its usefulness or function.

28
Chapter 4: Design Alternatives
Presented here are the preliminary developments of the group’s design including needs,
functions, feasibility studies, conceptual and preliminary designs, optimization, modeling and
preliminary data.
4.1 Needs Analysis
Through discussions between group members and advisors as well as early
presentations to both the group’s advisors and outside faculty, the group identified and
evaluated the needs of the project. Identification of needs is a crucial step towards determining
design functions and constraints. The preliminary needs of the project are as follows:
• Develop a microfluidic system to create a 3D hydrogel barrier that mimics the basement
membrane found in vivo.
• The barrier must be made of a biocompatible hydrogel.
• The hydrogel must be easily incorporated into the microfluidic system before the gel
crosslinks.
• Gel should crosslink quickly once inside the device to prevent leakage.
• The stiffness of the gel should be controlled in order to quantify cell migration in
response to changes in ECM stiffness.
• The gel must maintain structural viability throughout the entire experiment.
• Cells should be kept viable within the device for the duration of the experiment.
• Cells should be isolated based on their ability to migrate through the hydrogel barrier.
• Once cells breach the barrier, they must be isolated and captured as single cells.
• Isolated cells should be expanded in culture to allow for identification of gene
expression and drug efficacy studies.

29
• Allow for real time continuous imaging of device.
The above needs were then compared with the project objectives to classify them as
either specific needs the device must meet, or as ones that are desired but not necessary. This
evaluation in junction with the needs listed above reveals that the team’s design must develop
a reproducible 3D hydrogel barrier mimicking the basement membrane, induce cell migration
through the barrier reliably, maintain cell viability throughout the experiment, and efficiently
capture those cells that breach the barrier.
In addition to identifying the most important needs, the analysis also identified those
needs that are not absolutely crucial to the success of the project. These non-‐crucial needs
include: growth of isolated cells into larger populations, continuous imaging of the device in
use, and tunable hydrogel stiffness. The reason for the classification of the first non-‐crucial
need is that based on the financial and temporal limitations of this project, the group identified
this need as one that would require a disproportionate level of resources for its completion.
The second non-‐crucial need was identified as such due to the ability of time-‐lapse
photography to capture any migration of the cells through the barrier, as they would be moving
slowly. The third non-‐crucial need was recognized due to the fact that multiple devices could be
used simultaneously in order to study the effects of different stiffness.
4.2 Design Functions and Constraints
Following identification of the crucial and non-‐crucial needs of this project, the group
then developed the functions of the device to further drive the design, and constraints in order
to ensure all designs met the manufacturing and monetary limits of the project.
4.2.1 Design Functions
In order for this device to successfully isolate and capture metastatic cancer cells there
are several key functions it must perform. Apart from the basic functions necessary for any cell
culture system, it must also be capable of measuring cell migration.
30
Hydrogel Barrier Formation
The most important function for the success of this device is its ability to fabricate a
hydrogel barrier mimicking a basement membrane found in vivo. Therefore, the device must be
capable of manipulating and controlling a liquid hydrogel into the shape of a 3D barrier. After
this is accomplished, the device must maintain the liquid hydrogel in this 3D shape and form
while the hydrogel is cross-‐linked to form a solid barrier. Should the device succeed at this
function, a 3D hydrogel barrier mimicking the basement membrane will be reproducibly
fabricated.
Cell/Chemoattractant Seeding
Following the hydrogel barrier formation, the device must be used to isolate metastatic
cells from non-‐metastatic cells. To do this, the device must be capable of seeding large
numbers of cells in media along one side of the barrier without compromising barrier integrity.
A similar process must then be undertaken to seed media containing a chemoattractant on the
opposite side of barrier while still maintaining the 3D structure of the basement membrane
mimic. After succeeding at this function, the device will be able to induce cell migration
thought the barrier.
Single Cell Capture
After cells successfully breach the hydrogel barrier, they must be isolated and captured
as single cells. The design for single cell capture must ensure that cells are in an area conducive
to proper cell growth, while at the same time completely sequestered from all other cells. Each
individual cell must have its own nutrient supply and 3D space in order to proliferate. A
successful single capture device will allow for the production of more homogeneous cell
populations.
31
4.2.2 Design Constraints
After looking through the revised client statement, the group has determined that there
are several constraints that must be taken into consideration during the design of the device.
These constraints are:
• The device must not exceed a 4” diameter
• The microfluidic channels in the device must not exceed a depth of 100 μm.
• The total cost for all materials and processes must not exceed the project budget of
$532.
• The hydrogel used must solidify within the barrier area of the device, and not before, in
order to not block the channels.
• The device must be able to function in an incubator in order to keep cells alive during
testing.
• Each experiment must not exceed 3 days in order to ensure that the cells do not perish
during the test.
The methodology for developing microfluidic devices involves using photolithography.
This process etches a design onto a photoresist, which is bound to a silicon wafer. The
laboratory where the devices will be manufactured can only produce 100um deep channels on
a 4” inch wafer. The designed device must fit within these spatial parameters.
The total budget of this project provided by the Biomedical Engineering Department at
WPI is $632. Before the project began, $100 was taken from the total budget in order to pay for
the materials of the lab space such as media, FBS, PDMS etc. This leaves the group with $532
for all other materials.

32
The device will use hydrogels at varying degrees of stiffness to test migration speed. In
order to use this material efficiently, the group will need to tune the amount of time it takes for
the hydrogel to form in the device. This is essential to the function of the device because the
gel is an integral portion of testing and must function accordingly.
The device will require the passage and growth of cells within it. This means that the
device must be able to be placed in an incubator at 37oC and 5% CO2. In conjunction with this,
the testing of the device must not exceed the average life span of the cell types used. If it takes
too long to acquire the desired data, the cells could die before testing is complete.
4.3 Feasibility Studies and Experiments
In preparation for using hydrogel retention posts as a main design feature within the
microfluidic devices as well as the cell types that were chosen to test the design, certain studies
and experiments are needed to determine the success of the final microfluidic devices.
4.3.1 Cross Section of Devices
In order to determine if the microfluidic features had fully developed on the silicon
wafer and thus were being transferred onto the PDMS devices, a feature verification study
designed by the group was conducted. Once the photolithographic procedure was complete
and a silicon wafer with microfluidic features was produced, the group poured PDMS over the
wafer to create the microfluidic devices. From there the group determined which design
features were the most significant, these being the hydrogel retention posts as well as the cell
capture wells. A razor blade was used to cut a 1 mm slice off each device where the features
were most prominent. The location of the slices that were taken can be seen in Figure 4.1 and
Figure 4.2. The slices were then placed on a hemocytometer to provide a scale for the features
and the slices were images using a microscope.

33
Figure 4.1: Hydrogel Retention Posts Cross Section Figure 4.2: Cell Capture Wells Cross Section
4.3.2 BrdU Proliferation Assay
After the group had chosen the cells types that would be tested within the microfluidic
devices, it was determined that their proliferative abilities needed to be evaluated. To knock
down the proliferation of the cell, the group chose to treat the cells with mitomycin-‐C, a
compound used as a chemotherapeutic agent as it crosslinks the DNA of cells thus halting their
division. To monitor instances of cell proliferation, the group chose to perform a cell
proliferation assay using bromo-‐deoxyuridine (BrdU). BrdU is an analog of thymidine, which
means it can replace it as new DNA is synthesized in replicating cells. Anti-‐BrdU antibodies are
then used to detect the incorporated chemical by using immunohistochemistry techniques and
thus it can be determined if the cells are proliferating. Since mitomycin-‐C was used to halt cell
proliferation, the group wished to determine which if the chosen cells were able to resist the
crosslinkage. Before the assay was performed, a 6x3 array of 24-‐well plate was seeded with the
three cell types the group chose. The cells were treated with a range of concentrations of
mitomycin-‐C from 5 μg/mL to 25 μg/mL in increments of five with a control in complete media
for three hours as shown in Table 4.1 below.

34
NIH/3T3,
5 ug/mL
NIH/3T3,
10 ug/mL
NIH/3T3,
15 ug/mL
NIH/3T3,
20 ug/mL
NIH/3T3,
25 ug/mL
NIH/3T3,
Control
PANC-‐1,
5 ug/mL
PANC-‐1,
10 ug/mL
PANC-‐1,
15 ug/mL
PANC-‐1,
20 ug/mL
PANC-‐1,
25 ug/mL
PANC-‐1,
Control
A172,
5 ug/mL
A172,
10 ug/mL
A172,
15 ug/mL
A172,
20 ug/mL
A172,
25 ug/mL
A172,
5 Control
Unused Unused Unused Unused Unused Unused
Table 4.1: Mitomycin Experimental Layout
The cell assay was performed according to the following protocol outlined in Appendix C.
4.3.3 Mitomycin Scratch Assay
Once the group had assessed the proliferative ability of the chosen cells, the next step
was to measure their migratory ability. To do this, the group employed a scratch assay. This
was done by first plating the three cell types in one row of a 6-‐well plate in complete media.
Once the cells had grown to confluency, they were treated for 3 hours with complete media
containing Mitomycin-‐C at a concentration of 15 ug/mL. After the elapsed period, the media
was changed back to complete cell media and a line with a marker was drawn on the bottom of
each well as a point of reference. A P-‐1000 micropipette tip was then used to scratch away the
cells along the drawn line and leave empty space on the well. The cell’s migration with
reference to the drawn line was imaged over a period of 50 hours.

35
4.4 Conceptual Designs
After identifying the objectives the team wanted to meet and functions that the device
should perform a conceptual design for both the migration device and the single cell capture
device.
Figure 4.3: Migration Device Conceptual Design
The migration device concept can be seen in Figure 4.3 above. The device would isolate
metastatic cells by inducing their migration through a hydrogel barrier with a chemoattractant
on the other side. After the metastatic cells travel through the barrier they would be collected
and transferred as a suspension to the single cell capture device.

36
Figure 4.4 – Single Cell Capture Device Conceptual Design
The single cell capture concept can be seen in Figure 4.4 above. This device would consist of an
array of microwells cast in PDMS. The isolated cells from the migration device would be seeded
on top of the wells and allowed to settle. Once the cells have attached, loose cells would be
washed away with PBS, leaving behind single metastatic cells in wells than can then be
removed for expansion, or studied as part of a drug screening.

37
4.5 Preliminary and Alternative Designs
After developing the conceptual designs, the group brainstormed ways to transfer these
designs into actual devices. Presented in this section are the details of the preliminary designs.
4.5.1 First Iteration Migration Device
In order to gather a better understanding of how the team would achieve cellular
migration across a hydrogel as well as single cell capture, the team designed their first
photomask with several varied parameters.
Figure 4.5: Migration Device First Iteration

38
Figure SEQ Figure \* ARABIC 1
The first design of the team’s migration device, shown in Figure 4.5 has a 4mm long and
200µm wide channel for the hydrogel to flow through as well as 200µm by 50 µm retention
posts spaced 100 µm apart to keep the hydrogel in place. The design also featured six 2 mm
inlet and outlet ports for the loading of cells and chemotactic agents. The other designs on the
first wafer were similar to this initial design, but with various changes in certain parameters for
testing purposes. The different parameters the team tested in addition to the first design
include: 12mm, 7mm, and 1mm long hydrogel channels, 400 µm, 100 µm, and 50 µm wide
hydrogel channels, 200 µm and 50 um spacing between retention posts, and 100 um by 50 µm
posts. Two iterations also had horizontal posts in the middle of the hydrogel channel in order to
allow for the possibility of two different hydrogels
being flowed in from either side.
4.5.2 First Iteration Capture Device
The initial design of the single cell capture device consisted of 100 µm by 100 µm square
wells shown in other dimensions the team tested were 50 µm, 25 µm, and 10 µm wells. Each
Figure 4.6: Capture Device First Iteration

39
well was separated by a distance equal to its width. The intent of the wells was to seed a low
density solution of cells on top of the device, allow the cells to settle into the wells, and then
wash any excess cells off the top with PBS.
4.5.3 Second Iteration Migration Device
After testing the first design, the team determined that they needed to revise both the
migration and single cell capture devices. For both of the initial devices, the dimensions
prevented certain features from developing during the photolithography process.
Figure 4.7: Migration Device Second Iteration

40
Our second design of the migration device focused on the 1mm and 4mm long hydrogel
barrier channels with a 200 µm width. In order to ensure that all features would develop, no
posts had dimensions under 100 µm. The primary device for the second design, seen in Figure
4.7, has several key differences. The most notable is the centering of the hydrogel channel and
the addition of an inlet and outlet channel on the right side of the device. The hydrogel
retention post sizes the team tested were 200 µm by 100 µm, 100 µm by 200 µm, and 200 by
200 µm.
Along with these altered dimensions, two “fail-‐safe” devices were also included. These
two devices were a 1mm and 4mm device with very small openings in the hydrogel barrier
channel in order to ensure that the hydrogel would form properly and remain rigid during the
cell loading procedure. The 1mm “fail-‐safe” device only had a 200 µm gap for the cells to pass
through while the 4 mm “fail-‐safe” device had three 200 µm gaps.
4.6 Optimization
Immediate problems with the first design were noted after fabricating the first iteration
of devices. The design called for a barrier retention post width of 50um. These features were
too small to be fully developed during the photolithography process, and so the posts were too
short to contact the glass slide. This could allow for fluid to leak underneath the posts and they
could not serve their function. To correct this, the second design increased the barrier
retention post width to 200um to allow for full development of the posts. Additionally, to
further increase the ability of the development solution to penetrate the small posts, the
photoresist height was changed from 100um to 40um.
It was also noted that the inlet for the chemoattractant did not have an outlet to allow
for removal and collection of the metastatic cells that migrate through the barrier. An outlet
would also provide symmetry to the device so that either side of the barrier could be used for
cells or a chemoattractant. For these reasons, an outlet was added to the right side of the
device and the inlet channel was moved to make the device provide symmetrical flow along
either side of the barrier.
41
The final optimization of the first iteration of devices was to reduce the length of the
barrier from 4mm to 1mm on all devices. While theoretically the length of the channel should
not affect the barrier formation, because the 4mm barrier is longer, it allows for more
opportunities for failure. Thus to increase the output efficiency of the barrier formation
process, the barrier length was shortened to 1mm.
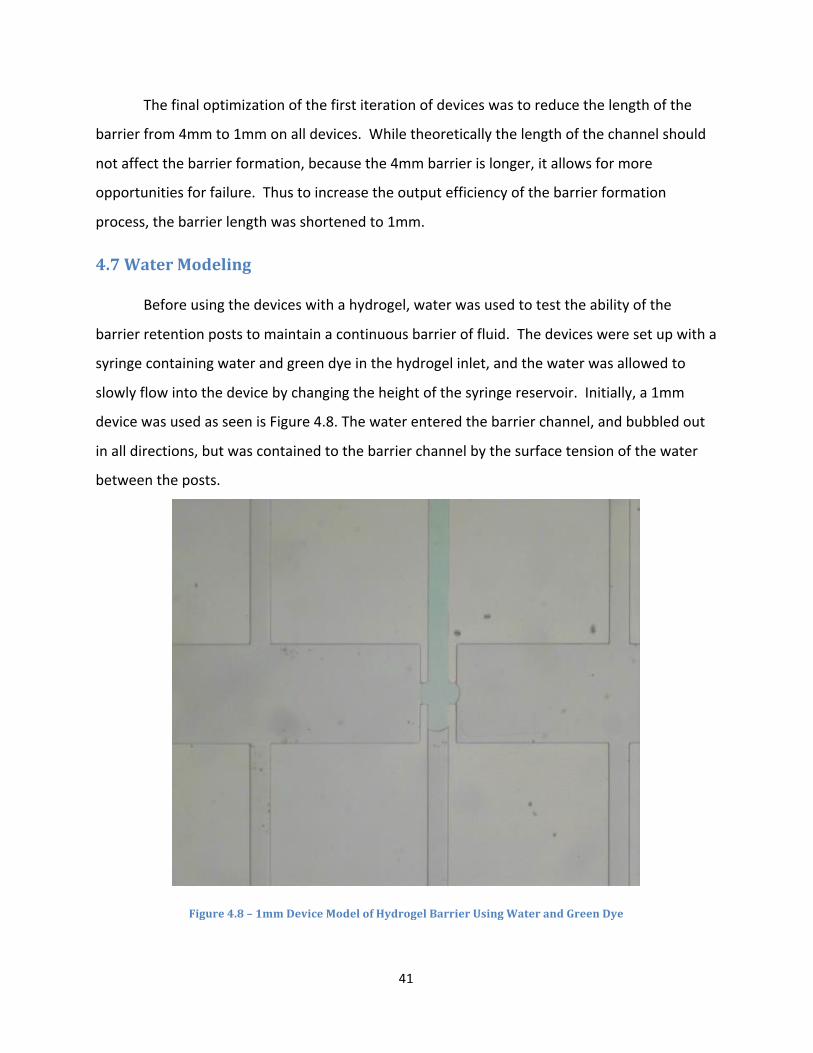
4.7 Water Modeling
Before using the devices with a hydrogel, water was used to test the ability of the
barrier retention posts to maintain a continuous barrier of fluid. The devices were set up with a
syringe containing water and green dye in the hydrogel inlet, and the water was allowed to
slowly flow into the device by changing the height of the syringe reservoir. Initially, a 1mm
device was used as seen is Figure 4.8. The water entered the barrier channel, and bubbled out
in all directions, but was contained to the barrier channel by the surface tension of the water
between the posts.
Figure 4.8 – 1mm Device Model of Hydrogel Barrier Using Water and Green Dye

42
Figure 4.9 – 4mm Device Model of Hydrogel Barrier Using Water and Green Dye
Using the same procedure, water barriers of 4 mm were also successfully created,
shown in Figure 4.9 above. The surface tension of the water combined with the capillary action
of the hydrogel retention posts was able to control the advancing water through the hydrogel
barrier area and into the hydrogel outlet. Barriers were successfully formed in devices in which
the distance between the hydrogel retention posts was 100 micrometers, as above. Any device
with a retention post spacing of more than 100um was unable to maintain a barrier as seen is
Figure 4.10 below. The space between the posts was too great to for the surface tension of the
water to hold itself in place, and the water bubbled out before it formed a complete barrier.

43
Figure 4.10 – 4mm Device Model of Failed Hydrogel Barrier
4.8 Preliminary Data
Data obtained from feasibility studies and experiments are included in this section of
the report. Quantitative and qualitative results are included for the cross sections of the
microfluidic devices, cell proliferation assay using 5’ bromo-‐deoxyuridine (BrdU), and the
mitomycin-‐C scratch assay.
4.8.1 Cross Section of Devices
The images collected by way of bright-‐field microscopy are pictured below in Figure
4.12 and Figure 4.13.

44
Figure 4.11: Hydrogel barrier Retention Posts Cross Section
Figure 4.12: Single Cell Capture Wells Cross Section
These features were developed to be at a 40 μm thickness from the bottom of the
device. Using the hemocytometer array within the images of the cross sections as a reference
point, the group was able to determine that the features of the fabricated microfluidic devices
were fully developed and operable for experimentation.

45
4.8.2 BrdU Proliferation Assay
The BrdU stained cells were imaged by way of fluorescent microscopy. Since the cells
were stained for Hoechst and BrdU, two images of each well containing cells were taken
exhibiting each fluorescence. The number of fluorescing cells from the identical pictures were
counted using ImageJ imaging software. The number of cells fluorescing BrdU were compared
to the total number of cells fluorescing Hoechst as a percentage, thus showing the number of
cells proliferating when treated with mitomycin-‐C the results are shown in Figure 4.13 below.
Figure 4.13: BrdU Proliferation Data
As expected, the control cell the group chose, NIH/3T3 cells, was the especially
successful at being treated with mitomycin. Across all the concentration treatments the cells
remain relatively non-‐proliferative. The same can be said for the A172 cells, as they were also
relatively non-‐proliferative, with a stronger result from the Control group. On the other hand
PANC-‐1 cells can be seen to be increasingly resistant to the mitomycin treatment.
0
5
10
15
20
25
30
35
5 10 15 20 25 Control
Cells Expressing BrdU
(% of Total)
Concentration of Mitomycin (ug/mL)
BrdU Staining Data
NIH/3T3
PANC1
A172

46
4.8.3 Mitomycin Scratch Assay
Each of the three cell types were imaged over a period of 50 hours, and the results of
this assay can be seen in Figure 4.14 through Figure 4.19 below.
Figure 4.14: NIH/3T3 Scratch Assay 0 Hours
200 μm

47
Figure 4.15: NIH/3T3 Scratch Assay 50 Hours
Figure 4.16: PANC-‐1 Scratch Assay 0 Hours
200 μm
200 μm

48
Figure 4.17: PANC-‐1 Scratch Assay 50 Hours
Figure 4.18: A172 Scratch Assay 0 Hours
200 μm
200 μm

49
Figure 4.19: A172 Scratch Assay 50 Hours
This experiment determined that over a period of 50 hours, mitomycin treated PANC-‐1 cells
migrate the farthest distance of approximately 500 μm. A172 cells migrated a total of 300 μm,
while NIH/3T3 cells migrated only 200 μm.
200 μm

50
Chapter 5: Design Verification Results
Following the completion of successful feasibility studies, the group began testing the
prototypes of the migration and capture devices. The data of these tests are presented here.
5.1 Preliminary Results – Migration Device
After initial modeling and feasibility experiments were performed, the second
iteration of devices were used to form barriers using collagen. It was quickly noted that
the barriers were extremely unstable and difficult to form without failure. The
uncrosslinked collagen acted much more viscous than the water that was used during
initial tests. After a number of attempts to make barriers in the devices, 3 main outcomes
were identified: 1: A successful continuous barrier is formed as expected with no collagen
leaking from the channel. 2: A continuous barrier is formed, but collagen begins to leak at
some point, causing a section of the barrier to be extremely wide. 3: The barrier fails to
flow all the way to the outlet channel, or fills the entire chamber around the barrier
channel. These scenarios can be seen in Figure 5.1. This is usually due to one of two failure
mechanisms of the barrier. The first is a phenomenon where, as the collagen flow reaches
the entrance to the barrier channel, it begins to “grab” onto the walls of the chamber before
it “grabs” the barrier posts. This causes a large bulge of collagen to form that usually
expands when pressure is applied, preventing the collagen from continuing to flow through
the barrier channel. The second failure identified is simply a failure of the surface tension
of the collagen solution to hold it between the barrier posts. This results in a bulge of
collagen forming somewhere along the barrier and then expanding to fill the chamber.
Often the pressure failure can be caused by a blockage in the barrier channel that causes

51
back pressure in the system. Square barrier posts also performed better than rotated or
regular posts. The devices that performed with the least failures were ones with 100um
barrier post spacing, and 1mm barrier length.
Successful Barrier Successful Barrier with Defect
Pressure Failure Wall-‐Grab Failure
Figure 5.1 -‐ Possible outcomes of hydrogel barrier formation
After a successful 1mm barrier was formed, it was allowed to crosslink in an
incubator at 37C overnight and cells were seeded onto the barrier by flowing a cell
suspension of 1million cells/mL along the left side of the barrier. The hydrogel barrier was
imaged before cell seeding, shown in Figure 5.2. The two bubbles on either side of the
barrier occurred during the hydrogel barrier formation and did not affect the performance

52
of the barrier. Cells can be seen in the barrier in Figure 5.3 immediately after being seeded
from the chamber on the left. Figure 5.4 shows cells in the hydrogel 24 hours after initial
seeding. Figure 5.5 shows cells in the hydrogel 72 hours after initial seeding. By this point,
a void in the collagen is visible between the 2nd and 3rd Hydrogel Retention Posts on the
left side. Cells are visible in this void, as well as “upward” into the hydrogel. Little to no
migration of the cells was observed over the course of 72 hours. Cells that were initially in
the barrier did not display a net movement in any direction. After 72 hours, the cells began
to die due to lack of media, and the experiment was stopped.
Figure 5.2 -‐ Hydrogel Barrier Before Seeding Figure 5.3 -‐ Hydrogel Barrier after Seeding (0 hours)

53
Figure 5.4 -‐ Hydrogel barrier 24 hours after seeding Figure 5.5 -‐ Hydrogel barrier 72 hours after seeding
5.2 Preliminary Results – Capture Device
In order to test the single cell capture device, PANC-1 cells were diluted in suspension to
100,000 cells/mL and a 70ul drop was pipetted on top of each microwell array. After PANC-‐1
cells were seeded onto the microwell arrays, they were imaged to determine the location of
cells on the array both before and after washing with PBS. The only viable arrays from the
initial wafer were the 50 and 100 um sizes due to the difficulties in developing smaller
features. Both sizes trapped mostly no cells or groups of more than one cell in each well.
The 100um wells contained more groups of cells than the 50um wells, seen in Figure 5.6.
Wells with only one cell were scarce in both arrays, and often had more cells sitting beside
the rim of the well. Additionally, the 50um wells appeared to connect to each other at the
points where the wells come closest as seen in Figure 5.7. Overall, the trapping efficiency
of wells made with the original wafer was extremely poor.

54
Figure 5.6 -‐ 100um Microwell Array 0 hours after Seeding
Figure 5.7 -‐ 50um Microwell array 0 Hours after Seeding

55
Chapter 6: Discussion
Here the group presents the analysis of results from device fabrication, hydrogel barrier
formation testing in 4 millimeter and 1 millimeter devices, as well as the initial data from single
cell capture tests.
6.1 Microfluidic Device Fabrication
The initial designs the group created contained many dimensions less than 100 μm;
such as the width of the hydrogel retention posts and single cells capture wells. Due to the
microfluidic device fabrication process, these features were often not developed. The last step
of the fabrication process involves SU-‐8 developer washing away all un-‐cross-‐linked
photoresist. In the case of the hydrogel retention posts, the developer must wash out a hole in
the photoresist, so the PDMS can fill it in, creating a post. The retention posts of the first
iteration of devices were not properly developed, and the devices were unable to meet any of
the desired functions. This failure to fabricate posts can be seen in the cross sectional pictures
shown previously.
In the second iteration of devices, these small dimensions were changed so that the
hydrogel retention posts could be properly developed. In addition to altering crucial
dimensions, the height at which the photoresist was crated was also changed. In devices with
higher photoresist heights, such as the first iterations, it is more difficult for the developer to
create full 3D features. By shortening the height of the photoresist, it is much easier for the
developer to wash away all un-‐cross-‐linked photoresist to form full 3D hydrogel retention
posts. These full hydrogel retention posts can be seen in the cross sections of the second
iteration devices shown previously.
It is also important to note that during the development of the first iteration devices,
the developer was left on the wafer in an attempt to fully develop the hydrogel retention posts.
As a result of this, the more sensitive features such as micro-‐wells were overdeveloped. In
order to create a PDMS well, a photoresist post must be created to form a negative mold. With
excessive exposure to the SU-‐8 developer, these photoresist posts begin to get worn down,
materializing in micro wells without full the proper depth. This is evidenced by the cross

56
sections of initial micro-‐wells shown above. As with the hydrogel retention posts, reducing the
height of the photoresist allowed for proper development, as seen in the cross sectional photos
of the second iteration of micro-‐wells shown previously.
6.2 Hydrogel Barrier Formation
The results from flowing liquid collagen through the early iteration barrier devices were
shown previously. These devices failed to create full 3D barriers in a majority of the tests. The
two main modes of failure of the barriers were leakage in between hydrogel retention posts, or
wall grabbing along the horizontal PDMS sections of the cell chamber. Additionally, many
barriers that were formed and cured successfully were then destroyed during removal of inlet
blocking posts, or during the cell seeding process.
Liquid hydrogel was able to flow out from in between the hydrogel retention posts for
two reasons. First, the posts were often far enough apart that the surface tension was not able
to hold the collagen back. Second, the barrier channel was too long, and as the leading edge of
liquid collagen advanced down the posts, higher and higher pressure was required. This
resulted in increased pressure near the origin of the barrier, and this was often the site of
leakage from in between posts. In order to reduce the frequency of these failures in the final
design, the overall length of the barrier was reduced, and the distance between hydrogel
retention posts was minimized while still allowing space for cells to pass through.
A frequent failure mode for many hydrogel barrier devices was large bubbles of liquid
hydrogel flowing into the large cell and chemoattractant areas. This was caused by the
hydrogel adhering to the wall of the cell of chemoattractant chamber rather than the hydrogel
retention posts. Because the wall formed a 90-‐degree angle with the barrier channel, the
resultant hydrogel bubble formed only a quarter circle, greatly reducing the surface tension.
The group found that these quarter circle bubbles were much less effective at resisting leakage.
In order to reduce wall grabbing in the final device, the walls of the cell and chemoattractant
chambers were recessed so the liquid hydrogel was unable to contact it.
In the rare occasion that the first or second iteration devices produced 3D hydrogel
barriers they were very likely to be destroyed during the removal of the inlet/outlet blocking
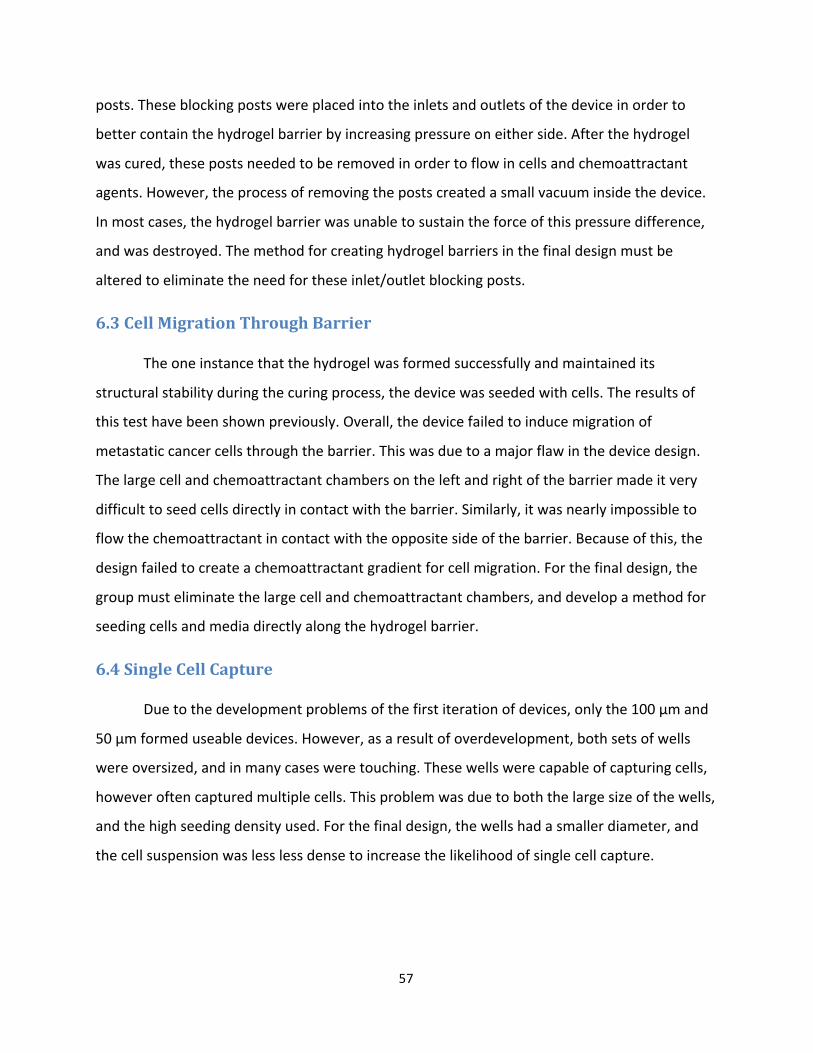
57
posts. These blocking posts were placed into the inlets and outlets of the device in order to
better contain the hydrogel barrier by increasing pressure on either side. After the hydrogel
was cured, these posts needed to be removed in order to flow in cells and chemoattractant
agents. However, the process of removing the posts created a small vacuum inside the device.
In most cases, the hydrogel barrier was unable to sustain the force of this pressure difference,
and was destroyed. The method for creating hydrogel barriers in the final design must be
altered to eliminate the need for these inlet/outlet blocking posts.
6.3 Cell Migration Through Barrier
The one instance that the hydrogel was formed successfully and maintained its
structural stability during the curing process, the device was seeded with cells. The results of
this test have been shown previously. Overall, the device failed to induce migration of
metastatic cancer cells through the barrier. This was due to a major flaw in the device design.
The large cell and chemoattractant chambers on the left and right of the barrier made it very
difficult to seed cells directly in contact with the barrier. Similarly, it was nearly impossible to
flow the chemoattractant in contact with the opposite side of the barrier. Because of this, the
design failed to create a chemoattractant gradient for cell migration. For the final design, the
group must eliminate the large cell and chemoattractant chambers, and develop a method for
seeding cells and media directly along the hydrogel barrier.
6.4 Single Cell Capture
Due to the development problems of the first iteration of devices, only the 100 μm and
50 μm formed useable devices. However, as a result of overdevelopment, both sets of wells
were oversized, and in many cases were touching. These wells were capable of capturing cells,
however often captured multiple cells. This problem was due to both the large size of the wells,
and the high seeding density used. For the final design, the wells had a smaller diameter, and
the cell suspension was less less dense to increase the likelihood of single cell capture.

58
6.5 Design Considerations
In this section the team discusses the economic, environmental, societal, political,
ethical, health and safety, manufacturability, and sustainability issues the team foresees for this
project and the device.
6.5.1 Economics
With further experimentation and revision, this design could become a patented device
used for migration assays of cancer cells. The device would provide an alternative to current
techniques of diagnosing tumors as malignant versus benign. Additionally, the device could be
one of the first used to provide patient-‐to-‐patient personalized cancer treatment. Each biopsy
could be analyzed and the proper drug could be administered.
6.5.2 Environmental Impact
The hydrogel and PDMS used to create the devices is biodegradable and non-‐toxic and
does not pose an environmental threat. The use of cancer cells in the device will remain safe so
long as the device is kept in a lab and proper safety precautions are taken. The manufacture of
the silicon wafer necessary for device fabrication requires the use of toxic chemicals SU-‐8
developer and TFOCS. These chemicals should not pose an environmental threat as long as they
are used in a proper fume hood.
6.5.3 Societal Influence
Ideally, the device will be used to learn more about cancer cell metastasis, as well as
develop personalized medicine techniques based on drug efficacy studies. If this is successful,
the number of cancer-‐related mortalities can decrease, and the overall health of the population
can increase.
6.5.4 Political Ramifications
With the possibility to revolutionize the field of cancer research as well as that of
personalized medicine, there are many stakeholders on either side. If the device is successful,

59
current methods could become obsolete and stakeholders in these methods could lose
influence.
6.5.5 Ethical Concerns
With the primary use of this device being cancer cell migration research and prevention,
the ethical concerns will be minimal. However, the possibility of using a single cell capture
device for other purposes such as stem cell research or genetics could be more controversial.
The ethics of these types of studies must be dealt with on a case-‐by-‐case basis.
6.5.6 Health and Safety Issues
Because the device will be primarily used with highly aggressive cancer cells, proper lab
technique and personal protection equipment must be used at all times. All cell culture
operations must be performed inside a biosafety hood, and then transferred to an incubator.
After the experiment is concluded, the device should be cleaned using 10% bleach to kill any
remaining cells. The glass slide of the device should be disposed of properly to prevent injury.
6.5.7 Manufacturability
The device could be manufactured as used in this project; a PDMS mold bonded to a
glass slide. The device would be packaged in this form, and individual users would form the
hydrogel. This manufacturing method would result in the most stable devices, and in the
greatest numbers. Alternatively, the device could be packaged and shipped following formation
of the hydrogel. Using this method, some devices would be wasted due to unsuccessful
hydrogel barriers, though all devices received by the user would be fully functional. For either
method to be effective, the photolithography process would need to be revamped to produce
more devices per batch.
6.5.8 Sustainability
The glass slides and PDMS used to fabricate the devices are readily available. The
collagen hydrogel used to create the hydrogel barrier is soured naturally and so depends on the
harvesting from sources.

60
6.6 Financial Considerations
In this section the team analyses the full cost of production of a single microfluidic
device. This includes the cost to manufacture a silicon wafer mold and the hydrogel barrier. The
cost to produce a single wafer mold is outlined below in Table 6.1.
Table 6.1: Cost to Produce a Single Silicon Wafer Mold
Based on this pricing information, the total cost to produce a wafer mold is
approximately $65. It should be noted that once a wafer is produced, it can be used to produce
a large number of actual devices, thereby reducing the cost per device of the wafer. Next, the
cost of forming the PDMS device complete with hydrogel barrier and FBS gradient was
calculated. This information can be seen in Table 6.2.
PDMS Device Costs
Material Unit Cost Units used Total Cost
PDMS 1.1 lb $60.00 .018 lb $0.98
Glass Slide 72 $5.60 1 $0.08
Media 500 mL $30.00 2 mL $0.12
Collagen 35 mL $320.00 1 mL $9.14
FBS 50 mL $39.00 .33 mL $0.26
Table 6.2: Costs to Produce a Single PDMS Device
Silicon Wafer Costs
Material Unit Cost Units used Total Cost
Photomask 1 $20.00 1 $20
Silicon Wafer 10 $300.00 1 $30
SU-‐8 Photoresist 1 Liter $600.00 .01 L $6
SU-‐8 Developer 1 Liter $450.00 .02 L $9

61
Based on these pricing calculations, the cost to produce a PDMS device complete with
hydrogel barrier and FBS gradient is $10.58. This price does not include the cost of producing
the initial wafer, because many multiple devices can be molded from the wafer, effectively
reducing the cost per device.
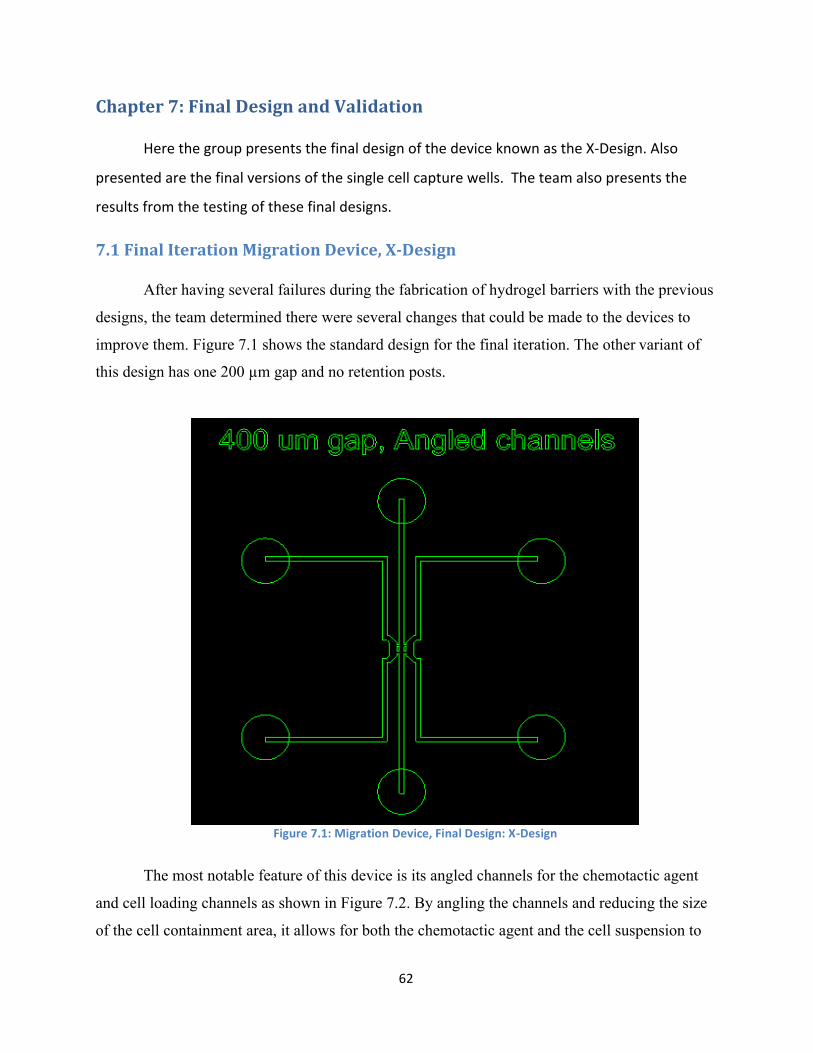
62
Chapter 7: Final Design and Validation
Here the group presents the final design of the device known as the X-‐Design. Also
presented are the final versions of the single cell capture wells. The team also presents the
results from the testing of these final designs.
7.1 Final Iteration Migration Device, X-‐Design
After having several failures during the fabrication of hydrogel barriers with the previous
designs, the team determined there were several changes that could be made to the devices to
improve them. Figure 7.1 shows the standard design for the final iteration. The other variant of
this design has one 200 µm gap and no retention posts.
The most notable feature of this device is its angled channels for the chemotactic agent
and cell loading channels as shown in Figure 7.2. By angling the channels and reducing the size
of the cell containment area, it allows for both the chemotactic agent and the cell suspension to
Figure 7.1: Migration Device, Final Design: X-‐Design

63
be immediately seeded onto the hydrogel barrier. In previous designs, the cells would enter the
rectangular chamber to the left of the hydrogel, and then just flow out of the inlet without ever
reaching the barrier. This allows for guaranteed access to the chemotactic agent for each cell on
the left of the barrier.
Figure 7.2: X-‐Design Close Up

64
7.2 Single Cell Capture Final Iteration
Our initial attempts at single cell capture proved difficult due to problems with
developing the smaller features. In order to overcome this, the second design included circular
wells that were spaced 150 µm apart regardless of well dimension. Figure 7.3 shows the more
successful single cell capture device containing 30 µm diameter wells. The team also tested 50
µm, 40 µm, and 20 µm circular wells. It was determined that circular wells would be more
efficient than the previous designs square wells, because cells are roughly spherical.
Figure 7.3: Capture Device, Final Design

65
7.3 X-‐Design Validation
Following the testing of the initial iterations, the design was revised as previously
outlined. Presented here are the results from further testing of the final iterations of the
hydrogel barrier device.
7.3.1 Hydrogel Barrier Formation
The revised design was profoundly more effective at producing a successful hydrogel
barrier compared with the first two iterations. The liquid hydrogel was contained within the
barrier channel during 90% (9 of 10) of trials. This represents a substantial increase in the
efficacy of the device, and meets the primary function of forming a 3D hydrogel barrier. The
hydrogel formation process can be seen in Figure 7.4 through Figure 7.5.
Figure 7.4: X-‐Design Barrier Formation Step 1 Figure 7.5: X-‐Design Barrier Formation Step 2
Figure 7.4 shows the liquid collagen flowing into the device from the top inlet. The collagen has
reached the first void and is bubbling out in all directions equally. Based on the precise
dimensions and geometries of the design, the liquid collagen adheres to the hydrogel retention
post, seen in Figure 7.5. Due to capillary action, the collagen is drawn through the barrier
channel, while not leaking out from in between the posts. Also, the surface tension of the liquid
collagen is great enough to retain the barrier.

66
Figure 7.6: X-‐Design Barrier Formation Step 3 Figure 7.7: X-‐Design Barrier Formation Step 4
While the pressure is held constant, the liquid hydrogel continues through the barrier
channel. Figure 7.6 shows the hydrogel bubbling out in all directions similar to the process that
occurred at the first void. Finally, the collagen forms a full barrier by capillary action in Figure
7.7.
The X-‐Design was able to stop the phenomenon of wall grabbing seen in the previous
devices. In the 10 devices tested, 0 failed due to wall grabbing. Additionally, the distance
between the hydrogel retention posts was able to properly contain the liquid hydrogel long
enough for it to cure. 180-‐degree bubbles of liquid collagen can be seen above, being retained
by their own surface tension. Capillary action was also effective at drawing the liquid collagen
down through the hydrogel outlet, to form a full 3D barrier.

67
7.3.2 Cell Migration Through Barrier
Following successful hydrogel barrier formations, cells were seeded along the left side
of the device as outlined previously. Figure 5 shows the same barrier from Figure 4, but at a
higher magnification. Cells can be seen along the left side of the barrier, as well as in the
barrier. These cells that are in the barrier arrived there during the seeding process due to
pressure differences. While this should issue should be resolved for future use, it did not affect
the validity of the data collected. At t = 0 hours, two single cells can be seen near the hydrogel
retention post on the left, as well as near the post on the right. The red circles in Figure 7.8
highlight these cells.
Figure 7.8: PANC1 Cells in Hydrogel Barrier at 0 Hours

68
The cells were then imaged frequently to monitor their migration. At t = 14 hours, the
single cell originally located in the circle on the left has migrated down and to the right in
response to the FBS chemical gradient. By contrast, the cell in the circle on the right has not
migrated at all but rather has begun to proliferate. Figure 7.9 depicts this contrast between the
migratory cell on the left and the non-‐migratory cell on the right.
Figure 7.9: PANC1 Cells in Hydrogel Barrier, 14 Hours

69
At t = 22 hours, the migratory cell on the left has continued its migration down and to
the right as seen in Figure 7.10. Again, in contrast, the non-‐migratory cell on the right has not
been able to move through the barrier, and as a result has proliferated in the same area shown
by the red circle. This is proof of concept data that the group’s device is capable of
distinguishing between metastatic cancer cells and non-‐metastatic ones. The more metastatic
cancer cells were able to borough through the barrier, and isolate themselves based on their
own migration.
Figure 7.10: PANC1 Cells in Hydrogel Barrier, 22 Hours

70
7.4 Single Cell Capture Validation
In order to validate the group’s final design for single cell capture, the procedure
outlined previously was followed. An area of the micro-‐well array that was a good
representation of the whole array was then imaged. The green arrows in Figure 7.11 highlight
those cells that do not contain any cells after the procedure was complete. For this test, the
number of wells containing 0 cells was 62%. In the case of single cell capture, capturing no cells
in a well is a failure.
Figure 7.11: Micro-‐Well Array, Empty Wells
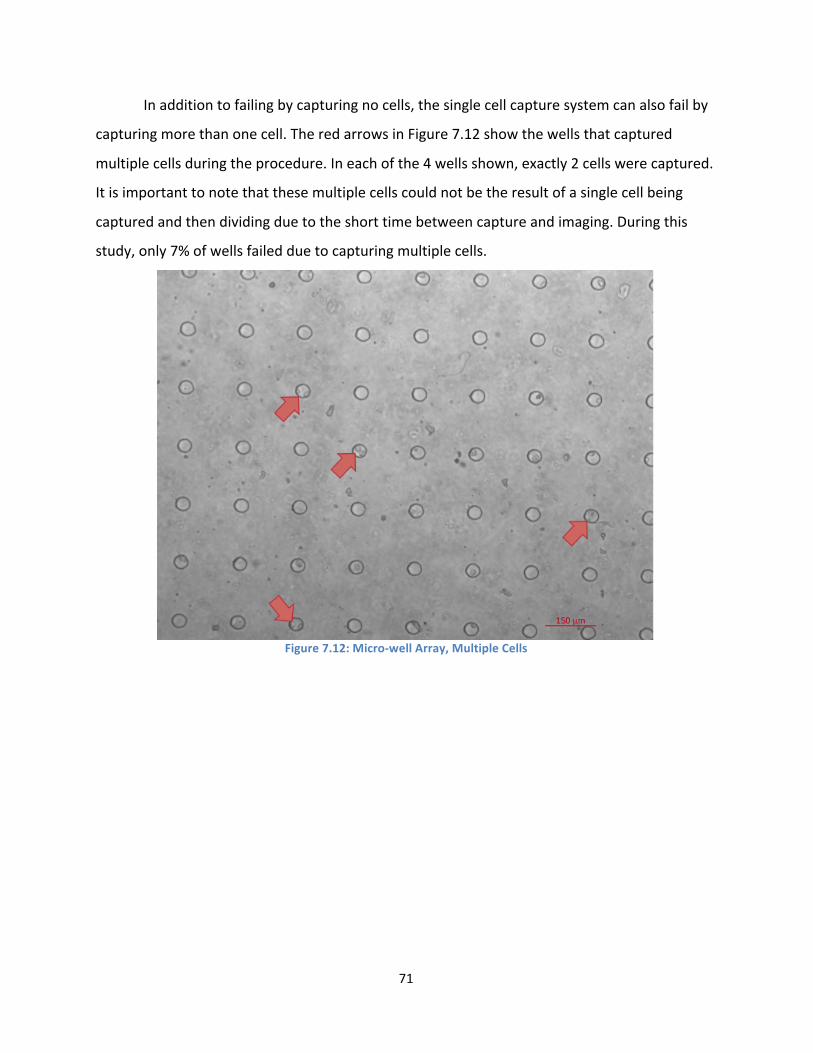
71
In addition to failing by capturing no cells, the single cell capture system can also fail by
capturing more than one cell. The red arrows in Figure 7.12 show the wells that captured
multiple cells during the procedure. In each of the 4 wells shown, exactly 2 cells were captured.
It is important to note that these multiple cells could not be the result of a single cell being
captured and then dividing due to the short time between capture and imaging. During this
study, only 7% of wells failed due to capturing multiple cells.
Figure 7.12: Micro-‐well Array, Multiple Cells

72
Lastly, the blue arrows in Figure 7.13 show all the wells that successfully captured and
isolated a single cell. In this experiment, over 30% of wells captured single cells. This represents
a significant improvement over the initial iterations and proves the feasibility of capturing and
isolating single cells by this method.
Figure 7.13: Micro-‐well Array, Single Cell
73
Chapter 8: Conclusions and Future Recommendations
A microfluidic device for the capture and isolation of metastatic cancer cells has been
fully designed, developed, and prototyped, and proof of concept data has been collected. In
this section the group summarizes the achievements of this project compared with the initial
goals, and suggests means and methods to improve upon the design for future works.
8.1 Project Conclusions
The initial goals set by the group at the beginning of this project include creating a
basement membrane mimic in a microfluidic device using a hydrogel, induce migration of
cancer cells through that mimic by using a chemoattractant agent, and finally capture and
isolate single metastatic cells that are able to breach the barrier.
Through several iterations, the group was able to develop a microfluidic design that was
effective at forming microfluidic basement membrane mimics. The key features of this design
that the group developed include recessed cell chamber walls in order to prevent wall
grabbing, and angled channels in order to directly seed cells onto the barrier. Additionally,
through experimentation, the group refined the method of forming the hydrogel barrier.
Initially, many barriers failed due to a flawed procedure. Flaws in this procedure included
pressure spikes upon cutting the hydrogel inlet tubing, and the creation of slight vacuums on
either side of the barrier during blocking post removal. This procedure was improved to include
a 5-‐minute curing period on a hot plate in order to partially cure the gel prior to cutting the
hydrogel inlet tube. This addition was successful in greatly reducing the number of barriers that
were destroyed because of inlet tubing cutting. Lastly, the group revised the method to not
include the inlet/outlet blocking posts, thereby further reducing the number of barriers that
were destroyed. Overall, the improvements made by the group to the design and methods
resulted in successful basement membrane mimics being formed in 90% (9 of 10) of tested
devices.
Over the course of this project, migration was induced through a successful hydrogel a
single time. Due to the rarity of successful barriers, the group was not able to perform

74
numerous experiments on the migration of cells through them. Often, barriers that had been
successfully formed and maintained their structure through the fabrication process were
destroyed during the seeding process due to media flowing through the collagen. Despite these
setbacks, the team was able to use this device to induce migration through the barrier in the
direction of the higher chemoattractant agent concentration.
The task of single cell capture and expansion is a particularly difficult one. In most cases,
any device that would result in capturing a single cell would not allow any room for expansion.
Essentially, any device small enough to capture a single cell is not large enough to allow it to
grow. To solve this problem, the team developed micro-‐well arrays of single cell capture wells
with a range of diameters. Although the initial devices had manufacturing issues, later
iterations were successfully fabricated and tested. Through testing, the team identified wells
with a 30 μm diameter as the most successful at capturing single cells. Wells with larger
diameters often captured multiple cells, and wells with smaller diameters captured no cells at
all. In addition to design alterations, the team also made changes to the method of seeding
cells. The most important improvement was the lowering of the density of cells in the
suspension. Overall, the success rate of the team’s device at capturing single cells was 30%.
8.2 Future Recommendations
In the future, the group would like to see improvements made to the design and
methods of this project in order to increase the efficiency and produce better results. The
group believes that with modifications and future testing, the device could be a powerful
cancer metastasis assay tool.
8.2.1 3D Microfluidics
The use of complex 3D microfluid devices gives more power to the engineer to create
more useful devices. However, the necessary materials and equipment to fabricate these
devices is very expensive, and well outside the means of this project. For future work, the team
recommends exploring the possibility of fabricating 3D and multilayered microfluidic devices.
By using these types of devices, future teams would be able to combine the Migration Device

75
and the Capture Device into a single device. This would make the device easier to use, and
more controlled. Alternatively, 3D microfluidics open up more possibilities for increasingly
complex single cell capture devices. The group originally developed a design for a multilayered
device that would capture single cells using suction. Future teams could use 3D microfluidics to
prototype this design and test it.
8.2.2 Develop a Controlled Flow System
When fabricating the hydrogel barrier inside the device, many variables can affect the
success of the flow and the integrity of the barrier. Currently, lowering and raising the reservoir
syringe control the flow of collagen into the channel. This could be improved by determining
the ideal flow rate for barrier formation and then using a precise syringe pump to ensure that
the flow is constant. Another problem with the current system is the removal of the inlet tube
that delivers the collagen to the barrier channel. The current standard is for the tube to be cut
or removed by hand, which often causes pressure spikes inside the device that forces the
collagen out of the barrier channel. To solve this, a controlled removal method must be
developed that either does not introduce extra pressure to the system or relieves the pressure
as it creates it so as not to disrupt the hydrogel barrier. The final variable step in the barrier
formation process is the application of heat to crosslink the hydrogel after it has been flowed
into the barrier channel. The current method is to remove the inlet tube and transfer the
device to an incubator for 90 minutes. This movement and handling of the device can also
disrupt the hydrogel barrier, causing it to leak out from between the hydrogel retention
posts. There is a need for a direct heating element that the device can rest on during the
flowing process so that the hydrogel can be immediately cross-‐linked under heat without the
need to touch or move the device. Overall, the process of forming the hydrogel barrier needs to
be standardized once the optimal parameters have been established. All of this would allow for
a much greater success rate when forming the hydrogel barriers.
8.2.3 Single Cell Robotic Extraction
Although the team succeeded in capturing single cells, there is still a need for a method
of extraction. They propose a robotic system for integration with their single cell capture wells.
76
The robotic system should be able to use images of the single cell capture wells, either
autonomously or with an operator, to determine where single cells are located. Once the
location is determined, the system should be able to precisely extract the single cell with an
affixed micropipette, punching through the PDMS if necessary, and then depositing them in a
desired receptacle for further study and growth. Since the single cell capture wells can be
redesigned at different dimensions, they could be designed to better suit the need of the
extraction method, such as increasing the distance between wells to allow for more space for
the robotic arm.
8.2.4 Testing of Chemoattractant Gradient
Due to the rarity of successful hydrogel barriers previously mentioned, the group was
not able to test the chemoattractant agent in depth. Future teams should use fluorescently
labeled proteins in order to quantify the gradient formed by the chemoattractant agent in the
barrier, as well as determine how often the media should be changed. Further, the group
would like to test the effect of different types of chemoattractants on the migration of cells.
Ideally, an agent should be used that best represents the characteristics in vivo.
8.2.5 Validation of Metastatic Markers
Because the group was not able to induce a cell to breach completely through the
barrier, they were not capable of testing the migratory cells for metastatic gene expression.
Ideally, future teams would be able to run large numbers of cells through the device, capture
migratory cells that have breached the barrier, grow them in culture, and test them for the
prevalence of metastatic gene expression. Based on the group’s hypothesis, the cells that are
able to breach the barrier will have a higher percentage of metastatic markers compared with
the larger population.
8.2.6 Personalized Medicine
The team believes that their devices show promise for clinical applications, particularly
in the personalized medicine field. Since the devices allow for the separation of migratory
cancer cells from non-‐migratory cancer cells, it would be feasible to separate migratory cancer

77
cells from non-‐migratory cancer cells. Thus if you took a biopsy of a tumor, you could use the
device to test the metastatic nature of the cancer cells within that tumor, and if you isolated
those cells with the single cell capture device, you could then test which drugs would best treat
a patients metastatic cancer growths. Similarly, if a tumor does prove to have metastatic
properties, the stiffness of the hydrogel within the device could be altered to reflect different
tissues within the body. This could give doctors an idea of where a patient’s cancer is most
likely to metastasize to.

78
References
1. Ferlay, J., Shin, H.R., Bray, F., Forman, D., Mathers, C., Parkin, D. “Estimates of worldwide burden of cancer in 2008: GLOBOCAN 2008” International Journal of Cancer. 15 December 2010: vol. 127, no. 12, 2893-‐2917.
2. Pisani, P., Bray, F., Parkin, D. “Estimates of the world-‐wide prevalence of cancer for 25
sites in the adult population.” International Journal of Cancer. January 2002: vol.97, no.1, 72-‐81.
3. Saxe, Charles. “Unlocking the Mysteries of Metastasis” American Cancer Society. 23 January, 2013.
4. Porporato, P.E., Payen, V.E., Pérez-‐Escuredo, J., De Saedeleer, C.J., Danhier, P., Copetti, T., Dhup, S., Tardy, M., Vazeille, T., Bouzin, C., Feron, O., Michiels, C., Gallez, B., Sonveaux, P. “A Mitochondrial Switch Promotes Tumor Metastasis” Cell Reports. 7 August 2014: vol. 8, no. 3, 754-‐756.
5. Discher, D., Janmey, P., Wang, Y. “Tissue Cells Feel and Respond to the Stiffness of their Substrate” Science. 18 November, 2005: vol. 310, no. 5751, 1139-‐1143.
6. Huang, S., Ingber, D. “Cell tension, matrix mechanics, and cancer development” Cancer Cell. September 2005: vol. 8, no. 3, 175-‐176.
7. Levental, K., Yu, H., Kass, L., Lakins, J., Egeblad, M., Erler, J., Fong, S., Csiszar, K., Giaccia, A., Weninger, W., Yamauchi, M., Gasser, D., Weaver, V. “Matrix Crosslinking Forces Tumor Progression by Enhancing Integrin Signaling” Cell. 25 November 2009: vol. 139, no. 5, 891-‐906.
8. Poste, G., Fidler, I.J., “The pathogenesis of cancer metastasis” Nature. 1980: 139-‐146.
9. Brehm-‐Stecher, B.F., Johnson, E.A. “Single-‐Cell Microbiology: Tools, Technologies, and Applications” Microbiology and Molecular Biology Reviews. September 2004: vol. 68, no.3, 538-‐559.
79
10. Chambers, A., Groom, A., & MacDonald, I. (2002). Metastasis: dissemination and
growth of cancer cells in metastatic sites. Nature Reviews Cancer, 2(8), 563-‐-‐572.
11. Zenios, S., Makower, J., Yock, P. Biodesign: The Process of Innovating Medical
Technologies. September 2009.
12. Yu, M., Stott, S., Toner, M., Maheswaran, S., & Haber, D. (2011). Circulating tumor cells: Approaches to isolation and characterization. The Journal of Cell Biology, 192(3), 373-‐382. Retrieved September 19, 2014, from http://jcb.rupress.org/content/192/3/373.full
13. Sian, J., Xiaosong, Z., & Parrsons, D. (2008). Core Signaling Pathways in Human Pancreatic Cancers Revealed by Global Genomic Analyses. Science, 321(5897), 1801-‐1806. Retrieved September 18, 2014, from http://www.ncbi.nlm.nih.gov/pmc/articles/PMC2848990/
14. Streets, A., & Huang, Y. (2013). Chip in a lab: Microfluidics for next generation life science research. Biomicrofluidics, (7).
15. Kim, S., Kim, H., & Jeon, N. (2010). Biological Applications Of Microfluidic Gradient Devices.The Royal Society of Chemistry.
16. Breslauer, D., Lee, P., & Lee, L. (2006). Microfluidics-‐based systems biology. Molecular BioSystems, DOI: 10.1039/b515632g.
17. Meyvantsson, I., & Beebe, D. (2008). Cell Culture Models in Microfluidic Systems. Annual Review of Analytical Chemistry, 423-‐449.
18. Tehranirokh, M., Kouzani, A., Francis, P., & Kanwar, J. (2013). Microfluidic devices for cell cultivation and proliferation. Biomicrofluidics.
19. Shalek, A., Satija, R., & Adiconis, X. (2013). Single-‐cell transcriptomics reveals bimodality
in expression and splicing in immune cells. Nature, 498.
20. Wang, D., S. (2010). Single cell analysis: the new frontier in 'omics'. Trends in Biotechnology, 28, 281-‐290.
21. Charon, L., Wheeler, A., & Lilge, L. (2007). Single Cell Analysis in Microfluidic Devices.

80
22. White, A., Vaninsberghe, M., Petriv, O., Hamidi, M., Sikorski, D., Marra, M., Hansen, C. (2010). High-‐Throughput Microfluidic Single Cell RT-‐qPCR. Proceedings of the National Academy of Sciences, 108(34).
23. Yun, H., Kim, K., & Lee, W. (2013). Cell Manipulation in Microfluidics. Biofabrication, 5.
24. Charnley, M., Textor, M., Khademhosseini, A., & Lutolf, M. (2009). Integration Column:
Microwell Arrays for Mammalian Cell Culture. Integrative Biology, 1, 625-‐634.
25. Lueerssen, D., & Malleo, D. US Patent (2012).
26. Moon, H., Kwon, K., Hyun, K., Sim, T., Park, J., Lee, J., & Jung, H. (2013). Continual Collection and Re-‐Separation of Circulation Tumor Cells from Blood Using a Multi-‐Stage Multi-‐Orifice Flow Fractionation. Biomicrofluidics, 7.
27. Chen, X., Cui, D., Liu, C., & Li, H. (2007). Microfluidic chip for blood cell separation and
collection based on crossflow filtration. Sensors and Actuators, 130, 216-‐221.
28. Brouzes, E., Medkova, M., Savenelli, N., Marran, D., Twardowski, M., Hutchison, J Samuels, M. (2009). Droplet Microfluidic Technology for Single-‐Cell High-‐Throughput Screening (Vol. 106): Proceedings of the National Academy of Sciences.
29. Mazutis, L., Gilbert, J., Ung, W., Weitz, D., Griffiths, A., & Heyman, J. (2013). Single-‐Cell
Analysis and Sorting Using Droplet Based Microfluidics. Nature Protocols, 8(5), 870-‐891.
30. Toriello, N., Douglas, E., & Mathies, R. (2005). Microfluidic Device for Electric Field Driven Single-‐Cell Capture and Activation. Analytical Chemistry, 77.
31. Justice B.A., 3D Cell Culture Opens New Dimensions in Cell-‐Based Assays, Drug
Discovery Today, Volume 14, January 2009
32. Tibbitt M.W., Anseth K.S. Hydrogels as Extracellular Matrix Mimics for 3D Cell Culture. Biotechnol Bioeng 2009.
33. Petersen OW, Ronnovjessen L, Howlett AR, Bissell MJ. Interaction with basement-‐
membrane serves to rapidly distinguish growth and differentiation pattern of normal and malignant human breast epithelial cells. Proc Natl Acad Sci USA 1992
34. Tanaka H, Murphy CL, Murphy C, Kimura M, Kawai S, Polak JM. Chondrogenic
differentiation of murine embryonic stem cells: Effects of culture conditions and dexamethasone. J Cell Biochem 2004
35. Martens P, Anseth KS. Characterization of hydrogels formed from acrylate modified
poly(vinyl alcohol) macromers. Polymer 2000

81
36. Chirila TV, Constable IJ, Crawford GJ, Vijayasekaran S, Thompson DE, Chen YC, Fletcher
WA, Griffin BJ. Poly(2-‐hydroxyethel methacrylate) sponges as implant materials: In vivo and in vitro evaluation of cellular invasion. Biomaterials 1993
37. Sawhney AS, Pathak CP, Hubbell JA. Bioerodible hydrogels based on photopolymerized
poly(ethylene glycol)-‐co-‐poly(a-‐hydroxy acid) diacrylate macromers. Macromolecules 1993
38. Bryant SJ, Anseth KS. Hydrogel properties influence ECM production by chondrocytes
photoencapsulated in poly(ethylene glycol) hydrogels. J Biomed Mater Res 2002
39. Butcher JT, Nerem RM. Porcine aortic valve interstitial cells in three-‐dimensional culture: Comparison of phenotype with aortic smooth muscle cells. J Heart Valve Dis 2004
40. Eyrich D, Brandl F, Appel B, Wiese H, Maier G, Wenzel M, Staudenmaier R, Goepferich A,
Blunk T. Long-‐term stable fibrin gels for cartilage engineering. Biomaterials 2007
41. Masters KS, Shah DN, Walker G, Leinwand LA, Anseth KS. Designing scaffolds for valvular interstitial cells: Cell adhesion and function on naturally derived materials. J Biomed Mater Res A 2004
42. Soofi SS, Last JA, Liliensiek SJ, Nealey PF, Murphy CJ . The elastic modulus of Matrigel
(TM) as determined by atomic force microscopy. Journal of Structural Biology 2009
43. Buxboim A, Rajagopal K, Brown AE, Discher DE How deeply cells feel: methods for thin gels. J Phys Condens Matter 2010
44. Rao SS, Bentil S, DeJesus J. Inherent Interfacial Mechanical Gradients in 3D Hydrogels
Influence Tumor Cell Behavior. PlosOne 2012
45. Rossof WJ, McAllister R, Esrick MA, Goodhill GJ, Urbach JS. Generating Controlled Molecular Gradients in 3D gels. Wiley 2005
46. Odedra D, Chiu LY, Shoichet M, Radisic M. Endothelial cells guided by immobilized
gradients of vascular endothelial growth factor on porous collagen scaffolds. Acta Biomaterialia 2011
47. Cheng SY, Heilman S, Wasserman M. A hydrogel-‐based microfluidic device for the
studies of directed cell migration. Lab Chip, 2007
48. Chung S, Sudo R, Mack PJ. Cell migration into scaffolds under co-‐culture conditions in a microfluidic platform. Lab Chip 2008.

82
49. Luo Y, Shoichet M. A photolabile hydrogel for guided three-‐dimensional cell growth and
migration. Nature Materials 2004.
50. Coghlin, C., & Murray, G. (2010). Current and emerging concepts in tumour metastasis. The Journal of Pathology.
51. Langley, R., & Fidler, I. (2011). The Seed And Soil Hypothesis Revisited -‐ The Role Of
Tumor-‐stroma Interactions In Metastasis To Different Organs. International Journal of Cancer.
52. Tan, D., Agarwal, R., & Kaye, S. (2006). Mechanisms of transcoelomic metastasis in ovarian cancer. The Lancet Oncology.
53. Nelson, C., & Tien, J. (2006). Microstructured extracellular matrices in tissue engineering
and development. Current Opinion in Biotechnology.
54. Tayalia, P., Mazur, E., & Mooney, D. (2011). Controlled architectural and chemotactic studies of 3D cell migration. Biomaterials.
55. Ehrbar, M., Sala, A., Lienemann, P., Ranga, A., Mosiewicz, K., Bittermann, A Lutolf, M.
(2011). Elucidating The Role Of Matrix Stiffness In 3D Cell Migration And Remodeling.Biophysical Journal.
56. Rao, S., Bentil, S., Dejesus, J., Larison, J., Hissong, A., Dupaix, R Gasset, M. (2012). Inherent Interfacial Mechanical Gradients in 3D Hydrogels Influence Tumor Cell Behaviors. PLoS ONE.

83
Glossary
Basement Membrane Mimic A hydrogel barrier that resembles the basement
membrane found in vivo.
Migration Device The microfluidic device used to form a basement
membrane mimic and induce migration.
Capture Device A microfluidic device used to capture and isolate
single cells.
Hydrogel Retention Posts Posts constructed of PDMS that form the barrier
channel and restrict the liquid hydrogel from leaking.
Wall Grabbing The phenomenon of liquid collagen adhering to the
PDMS walls, creating large bubbles in the device.
Crosslinking The process by which a liquid hydrogel forms
covalent bonds to form a networked gel.
Hydrogel A gel composed of polymers suspended in water.
Microfluidics The science of fluid flow in channels of micron size.
PDMS Polydimethylsiloxane is a frequently used organic
polymer, often used to make molds.
Cell Seeding (Migration Device) The process of flowing a cell suspension into a
microfluidic channel in order to precisely place the
cells along the hydrogel barrier.

84
Cell Seeding (Capture Device) The process of covering a micro-‐well array in a low
density cell suspension and allowing the cells to
settle into wells.
Inlet/Outlet Blocking Posts Solid metal posts that were inserted into the excess
inlets and outlets in order to maintain pressure
during the flowing of hydrogel.
85
Appendices
Appendix A: SOP for Microfluidic Device Fabrication
Photolithography using SU8 Photoresist STANDARD OPERATING PROCEDURE
Dirk Albrecht, PhD
1. MICROFABRICATION LAB Location
Gateway Park 0122, BME MicroFabrication Laboratory (BME-MFL), WPI Access
Prof. Dirk Albrecht, Dept. of Biomedical Engineering (508-831-4859, [email protected]). Technical Contact
Prof. Dirk Albrecht, [email protected] Laura Aurilio, [email protected]
Emergency Contact Document Revision
26-Mar-14 v.2 DRA/LA 2. INTRODUCTION Photolithography is a standard procedure to transfer patterns onto the wafers in the microfabrication process. This Standard Operating Procedure(SOP) provides information on the photolithography process that has been developed at the MicroFabrication Laboratory. There are multiple steps involved in the photolithography process: wafer dehydration, photoresist spincoat, pre-bake, exposure, post-exposure bake, development, inspection, (optional: processing, e.g. etching), and postprocessing (typically hard-bake and fluorination, or resist stripping). Each procedure will be discussed in the following sections. Optional processing steps are addressed in separate SOPs. 3. LOCATION OF EQUIPMENT, ACCESSORIES, TOOLS, AND SUPPLIES The Photoresist Spin Coater (Laurell WS-650MZ-23NPP), UV exposure unit (UV-KUB), hot plates (PMC Dataplate 720 and 732), and wafer inspection stereomicroscope (Zeiss Stemi 2000) are located in room 0122 of the BME MicroFabrication Laboratory (BME-MFL) in the Gateway Park I building at WPI, 60 Prescott St. Currently, the large 10" hotplate for dehydration bake (120 ºC) and the UV exposure unit are location in a Labconco cleanhood. The two smaller 7" hotplates for pre- and post-bakes (65 ºC and 95 ºC) and the photoresist spinner are located opposite in the fume hood. The stereo microscope is located on the stainless steel bench in the rear of the room.

86
4. PERSONAL SAFETY AND CLEANROOM ATTIRE Personal protective equipment including a disposable cleanroom coat and nitrile gloves are required for routine operation in this facility. Shoe-covers must be worn before entering the room 0122 and are available in the adjacent room 0123. Step on the sticky mat before entering 0122 only with shoe-covers on, not regular shoes. Avoid stepping on the sticky mat upon exit, to avoid unnecessary soiling.

87
5. MATERIAL COMPATIBILITIES 6. PRIMARY HAZARDS AND WARNINGS The primary hazards associated with photolithography are the chemicals, including photoresists, developer solvents, cleaning and etching solutions including acids and reactive chemicals. Therefore, safe chemical handling and storage measures must be adopted. Details on chemical storage, handling and disposal are described in the MSDS binder. Hotplate temperatures up to 200 ºC may be required with risk of burns. UV exposure of photoresists take place within a sealed LED illumination unit and do not pose an exposure risk. [However, this is new technology, and be aware that most microfabrication facilities use a mercury (Hg) arc lamp a source of ultraviolet radiation during exposure that may not be fully enclosed. Ultraviolet radiation can cause burns of the skin or of the outer layers of the eye. In these systems, the user must avoid looking directly at the UV source and avoid exposure to reflected or diffused UV from the lamp. In addition, an Hg arc lamp operates at high voltage and the user should make sure that the power supply and illuminator are covered properly, and that cables are properly connected.] 7. OPERATIONAL PROCEDURE CHECKLISTS This Standard Operating Procedure(SOP) provides information on the photolithography process that has been developed at the MicroFabrication Laboratory. Each step involves using different equipment and it is important that user is familiar with the location of the equipment and all of its key components. Preliminary Setup. Determine photolithography parameters Before beginning any photolithography process, the entire procedure must be planned. The primary determinants to spin speeds and duration of baking and development steps are the photoresist material and the desired resist thickness. Refer to the photoresist spec sheets for more information, such as, for SU-8 2000 series: http://www.microchem.com/pdf/SU-82000DataSheet2025thru2075Ver4.pdf For example, for a 80µm thick process using SU8 2035, we find the following information from the datasheet above:
1. Spin speed: 1600 rpm (Figure 1) 2. Soft-bake times: 3 min @ 65 °C; 9 min @ 95 °C (Table 2) 3. Exposure energy: 215 mJ/cm2 (Table 3) 4. Relative dose: 1x (Table 4) 5. Post-exposure bake: 2 min @ 65 °C; 7 min @ 95 °C (Table 5) 6. Development time: 7 min (Table 6)
The bake times directly relate to the experimental plan, but the UV exposure time must be calculated from the exposure energy, relative dose, the illumination intensity, and an empirical correction factor. The illumination intensity of the UV-KUB should be stabel at 23.4 mW/cm2, and the correction factor is 1.5 due to the narrow spectrum of UV exposure at 365 nm. For example, from the data above, the UV exposure time should be:
215 mJ/cm2 x 1 (multiplier) x 1.5 (correction factor) / 23.4 mW/cm2 = 13.8 s

88
Procedure 1. Dehydration Bake The dehydration bake removes residual water molecules from the wafer surface by heating up the wafer on a hot plate or convection oven. Removing residual moisture increases the adhesion of the photoresist on the substrate. This step uses the large 10" PMC Dataplate hot plate in the clean hood that can be seen in Figure 1. Figure 1. Hot plate front panel 1. Turn on the blower and light on the cleanhood. Let it run for a few minutes before working inside. 2. Power on the PMC Dataplate hot plate in the Figure 1: 10" PMC Dataplate 732 clean hood. Ensure the hotplate surface is clean. 3. Set the desired temperature to 120 °C. Press the following buttons in order: [SET], "Plate Temp" [1], [1], [2], [0], [ENT]. The display cycles between the set temperature and current temperature about once per second. 4. Place a clean new wafer onto the hotplate surface. The whole wafer should
completely fit on the hotplate surface so that heat can conduct evenly to the wafer. 5. Once the plate reaches the desired temperature, heat for 5 min. To set a timer, press the following buttons in order:
[SET], "Timer (h:m)" [4], [5], [ENT]. Or: [SET], "Timer (m:s)" [5], [5], [0], [0], [ENT].
6. Carefully remove from the hotplate with wafer tweezers and allow to cool to room temperature. The wafer is now ready for the next procedure.
Figure 2: Hot Plate Front Panel Procedure 2. Spin-coating Spin-coating is a step to apply photoresist onto the wafer. This section will outline the steps of spin coating SU-8, a common type of negative photoresist that is used in the MicroFabrication Laboratory. The procedure is similar for AZ1512, a positive photoresist, except it is deposited via syringe rather than pouring due to its lower viscosity. This step uses the Laurell spin-coater in the fume hood which can be seen in Figure 3.
Figure 3: Laurell spin-coater

89
Preparation stage:
1. Turn on the spin coater using the left power strip switch under the fume hood (Figure 4). If the display does not light up, turn on the unit power
switch at the back of the unit. Figure 4: Spin-coater Power Strip
Figure 5: Dataplate Hot Plates 2. Turn on the two 7" Dataplate hotplates (Figure 5) using the right power strip switch under the fume hood (Figure 6), and set the left one to 65 °C and the right one to 95 °C as in Proc 1, Step 2 above. (Note, the "5" button sticks on one hotplate so use 96 °C if necessary). If foil is absent, damaged, or dirty, replace with new foil.
Figure 6: Hot Plate Power Strip 3. Press [Select Process] and choose the appropriate spin program according to your desired parameters. If none exist yet, you must enter a new spin program. Refer to the User Manual or Appendix 1 for programming. If you make any changers or additions, note your changes in the MFL logbook.
Edit Program 10
Step:001/002 Vac↓req Step:002/002 Vac↓req Time:00:10.0 Cpm:00 Time:00:30.0 Cpm:00 Rpm : +00500 Loop:000 Rpm : +01600 Loop:000 Acel: 0100 Goto:001 Acel: 0300 Goto:001 Valv: Valv: Sens: Sens:
The first step is a slow ramp to 500 rpm at 100 rpm/s and is designed to slowly spread the resist across the wafer. The second step spins faster to determine the final resist film thickness. Only the spin speed (in rpm) needs to be changed for different resist thicknesses; all other parameters should remain unchanged.
4. Remove the spin-coater lid and verify the presence of a foil liner. If the foil is not present, line the bowl with foil to catch photoresist that is removed from the wafer during spinning. Ensure that the bowl periphery is covered above the height of the chuck and wafer, and also completely covering the bottom to the chuck. Rotate the chuck and ensure that the foil does not touch the chuck or impede rotation.

90
5. Select [Run Mode].
6. Turn on the N2 supply, seen in Figure 7, by opening the main tank valve (marked in red). Ensure an output pressure of 60-70 psi. If the display reads "Need CDA," open the round valve attached to the pressure regulator (outlined in green). Open the vacuum valve by aligning the black handle with the tubing (outlined in yellow).
Figure 7: N2 Supply Tank Valves
7. Make sure that the wafer is clean and dry. Visible dust on the wafer can be removed by gently blowing the wafer using the nitrogen gun (Figure 8), which is located on the right side of the fume hood.
Figure 8: N2 Gun
8. Position the 4" wafer alignment tool against the chuck, and using wafer tweezers or your gloved hand, touching only the edge, place the wafer on the chuck aligning to the marks on the alignment tool (Figure 9).
Figure 9: Spin coating set-up
9. Before removing the alignment tool, press the [Vacuum] button. A hiss should be audible, and the display should change from "Need vacuum" to "Ready". The wafer should now be held down on the chuck.
10. Test your alignment by beginning the spin program. Press [START] and observe the edge of the wafer as it turns. It should wobble less than 5 mm. If not, press [STOP], then [Vacuum] to release the vacuum, realign, and return to step 8. Reset the spin program if necessary by pressing [Edit Mode] then [Run Mode] and ensuring the display reads "Ready".
Coating Stage: 1. Ensure the wafer is centered and the spin-coater is programmed and ready to spin.
2. For SU8 2035 photoresists and similar high-viscosity materials, pour the resist directly from a 50 mL conical tube. It will flow very slowly. Pour approximately 8-10 mL of resist onto the wafer in one continuous motion, with the tube far enough to avoid contact with the wafer but
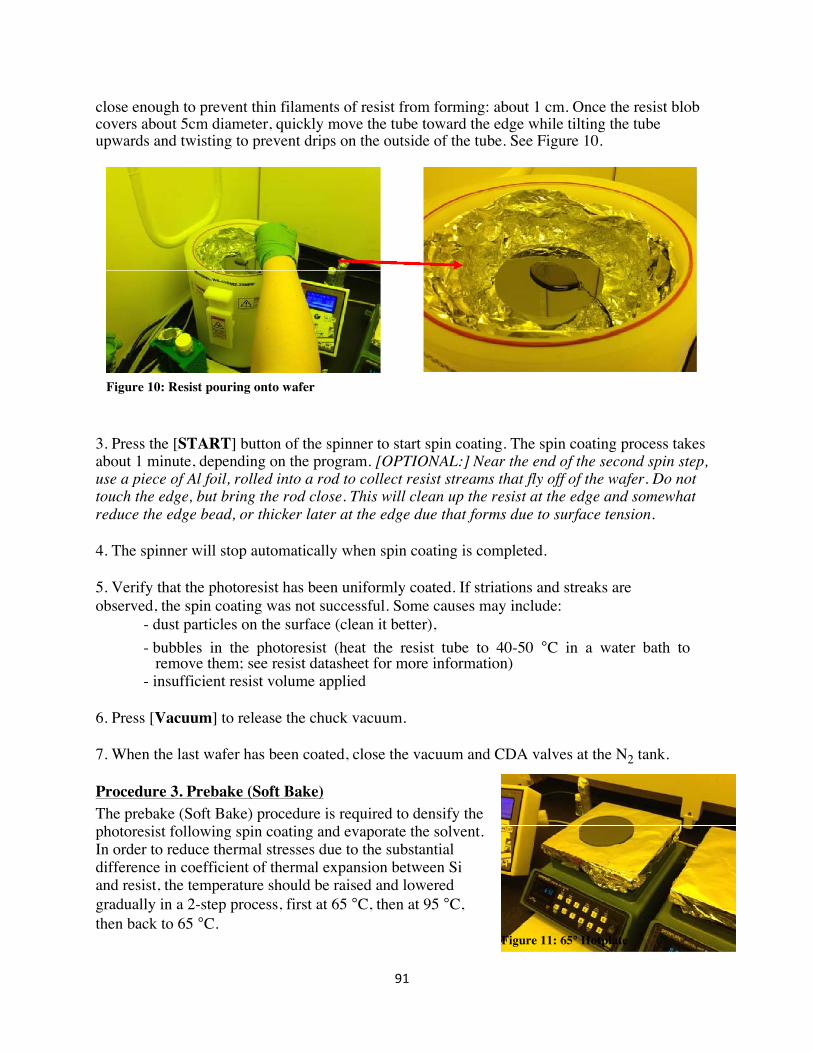
91
close enough to prevent thin filaments of resist from forming: about 1 cm. Once the resist blob covers about 5cm diameter, quickly move the tube toward the edge while tilting the tube upwards and twisting to prevent drips on the outside of the tube. See Figure 10.
Figure 10: Resist pouring onto wafer 3. Press the [START] button of the spinner to start spin coating. The spin coating process takes about 1 minute, depending on the program. [OPTIONAL:] Near the end of the second spin step, use a piece of Al foil, rolled into a rod to collect resist streams that fly off of the wafer. Do not touch the edge, but bring the rod close. This will clean up the resist at the edge and somewhat reduce the edge bead, or thicker later at the edge due that forms due to surface tension. 4. The spinner will stop automatically when spin coating is completed. 5. Verify that the photoresist has been uniformly coated. If striations and streaks are observed, the spin coating was not successful. Some causes may include:
- dust particles on the surface (clean it better), - bubbles in the photoresist (heat the resist tube to 40-50 °C in a water bath to
remove them; see resist datasheet for more information) - insufficient resist volume applied
6. Press [Vacuum] to release the chuck vacuum. 7. When the last wafer has been coated, close the vacuum and CDA valves at the N2 tank. Procedure 3. Prebake (Soft Bake) The prebake (Soft Bake) procedure is required to densify the photoresist following spin coating and evaporate the solvent. In order to reduce thermal stresses due to the substantial difference in coefficient of thermal expansion between Si and resist, the temperature should be raised and lowered gradually in a 2-step process, first at 65 °C, then at 95 °C, then back to 65 °C.
Figure 11: 65° Hotplate

92
This step uses the two 7" Dataplate hotplates in the fume hood. 1. Use the "removal tool" to transfer the wafer from the spinner chuck to the 65 °C hotplate (See Figure 11). Set the timer for the desired time at this temperature, and cover the wafer with a foil tent (Figure 13).
2. Transfer the wafer from the 65 °C hotplate to the 95 °C hotplate (Figure 12). Set the timer for the desired time at this temperature and cover with a foil tent (Figure 13). Use wafer tweezers to lift up the edge, but don't grab the wafer edge, since the resist is still very soft. Instead, slide the "removal tool" underneath and lift.
Figure 12: 95° Hotplate 3. Return the wafer to the 65 °C hotplate for 3 minutes, covered, then transfer it to the clean hood to cool to room temperature. Be sure to place your hand underneath as you move the wafer from the fume hood to clean hood: if you drop it, it'll shatter.
Figure 13: Foil Tent Procedure 4. UV exposure The UV exposure procedure exposes the photoresist layer to collimated 365 nm UV light via an LED source through a photomask. A negative resist becomes crosslinked and insoluble in developer when exposed, whereas a positive photoresist becomes soluble in developer when exposed. This procedure assumes that a transparency photomask will be used in direct contact with the resist layer. This step uses the UV-KUB exposure system in the clean hood (Figure 14). Preparation stage: (this can be done during the prebake procedure 3)
1. Turn on the UV-KUB via the power switch at the back left, just above the power cord. Press the silver power button on the front panel, lower right. The touchscreen should light up and display "UV-KUB"
2. Touch the screen to reach the main menu. Touch [Settings] and [Drawer] to unlock the drawer. Wave your hand near the door sensor at the lower left to open the drawer. If there is a wafer or mask present, remove them. Place the 4"x 5" glass slide on the tray and wave near the door sensor to close it. Figure 14: UV KUB

93
3. Return to the [Settings] menu (touch the [X] in the upper right of the screen). Touch [Illumination] to calibrate the UV intensity. It should display about 23.4 mW/cm2 through the glass plate. If not, adjust your exposure time calculations in "Preliminary Setup". See Figure 15.
Figure 15: UV Intensity Calibration
4. Return to the main menu and select [Full Surface] then [New cycle] then [Continuous]
Figure 16: Set-up for exposure (Figure 16).
5. Program the desired exposure duration and intensity. Enter the time using the touchscreen numbers, then a unit ([h], [m], [s] for hours, minutes, seconds), then [v] to confirm. Note that decimal values are not permitted, so round to the nearest second. Next enter the intensity in %, usually 100%, and [v] to confirm (Figure 17).
Figure 17: Duration and Intensity
6. Test the exposure by touching [Insolate]. The drawer will open (Figure 18). Wave it closed. The display should read "Loading in Progress". Touch the screen to start the exposure. Verify that the countdown timer begins at the proper duration.
Figure 18: Insolate

94
7. The exposure will end automatically and alert with a loud beep (silence by touching the screen). The drawer will open automatically. Remove the glass slide if present.
Mask alignment stage: 1. Transfer the room temperature, resist-coated wafer to the UV-KUB tray, centering it in the circular pattern (Figure 19).
2. Observe the position of any defects in the resist layer. You will try to rotate your photomask such that these defects are removed during development; i.e. they are covered with black mask regions if a negative resist, or are covered with clear mask region if a positive resist.
Figure 19: Loaded Wafer 3. Cut out the photomask circle using scissors, taking care not to kink the transparency film. Ensure it is free of dust, and gently wipe with a lint-free cleanroom wipe or blow with the N2 gun if necessary.
4. Place the photomask over the resist-coated wafer and orient it such that any defects will be removed during development (Figure 20).
Figure 20: Photomask placed on top of wafer
5. Place the 4" x 5" glass slide over the wafer and mask to keep it flat and in direct contact. First tilt the 5" side to the back corner supports, then gently move it toward you so it rests on the bottom tray surface. Finally, gently lower the glass plate onto the wafer, ensuring it is fully covering the mask and wafer, and that it did not move the mask while lowering (Figure 21).
Figure 21: Slowly lower glass on top of photomask and wafer combination
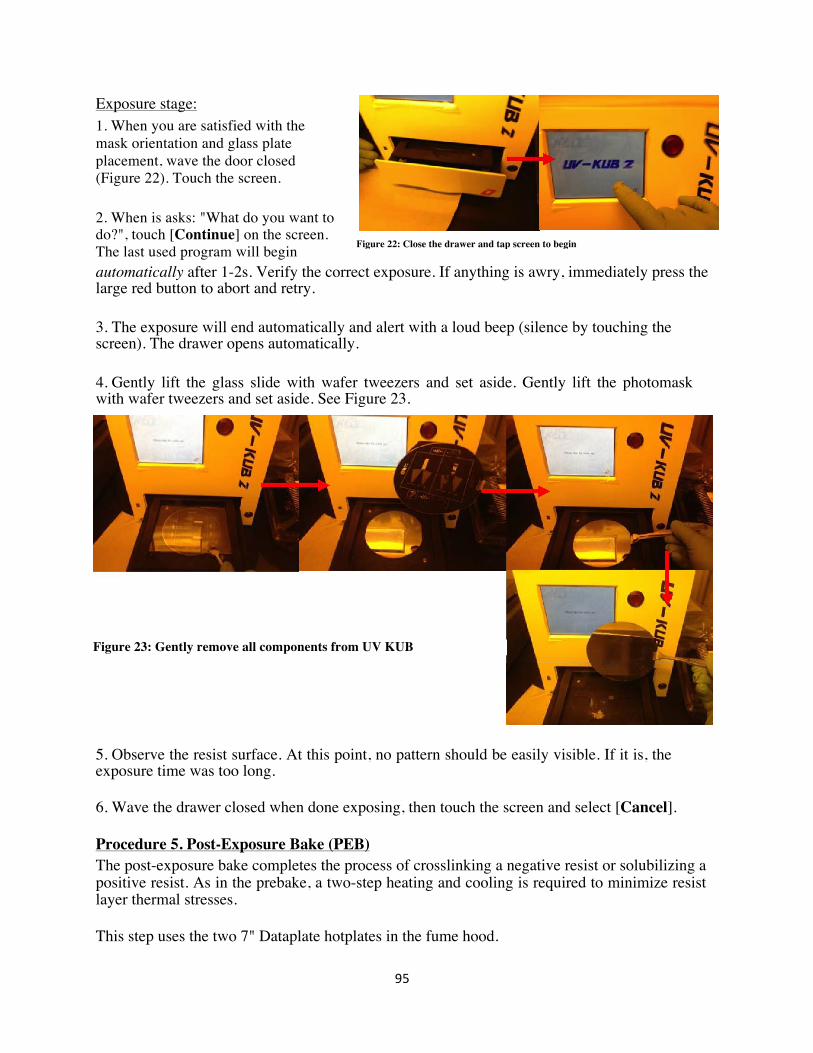
95
Exposure stage: 1. When you are satisfied with the mask orientation and glass plate placement, wave the door closed (Figure 22). Touch the screen. 2. When is asks: "What do you want to do?", touch [Continue] on the screen. The last used program will begin automatically after 1-2s. Verify the correct exposure. If anything is awry, immediately press the large red button to abort and retry. 3. The exposure will end automatically and alert with a loud beep (silence by touching the screen). The drawer opens automatically. 4. Gently lift the glass slide with wafer tweezers and set aside. Gently lift the photomask with wafer tweezers and set aside. See Figure 23. Figure 23: Gently remove all components from UV KUB 5. Observe the resist surface. At this point, no pattern should be easily visible. If it is, the exposure time was too long. 6. Wave the drawer closed when done exposing, then touch the screen and select [Cancel]. Procedure 5. Post-Exposure Bake (PEB) The post-exposure bake completes the process of crosslinking a negative resist or solubilizing a positive resist. As in the prebake, a two-step heating and cooling is required to minimize resist layer thermal stresses. This step uses the two 7" Dataplate hotplates in the fume hood.
Figure 22: Close the drawer and tap screen to begin
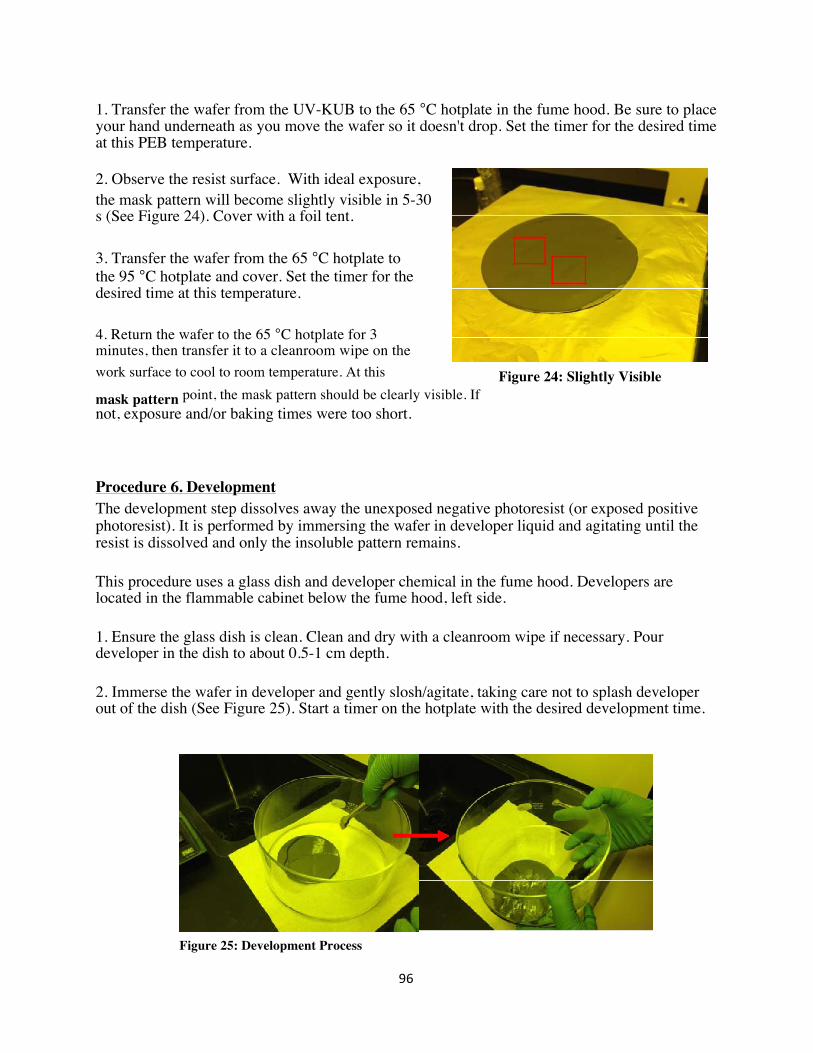
96
1. Transfer the wafer from the UV-KUB to the 65 °C hotplate in the fume hood. Be sure to place your hand underneath as you move the wafer so it doesn't drop. Set the timer for the desired time at this PEB temperature. 2. Observe the resist surface. With ideal exposure, the mask pattern will become slightly visible in 5-30 s (See Figure 24). Cover with a foil tent. 3. Transfer the wafer from the 65 °C hotplate to the 95 °C hotplate and cover. Set the timer for the desired time at this temperature. 4. Return the wafer to the 65 °C hotplate for 3 minutes, then transfer it to a cleanroom wipe on the work surface to cool to room temperature. At this Figure 24: Slightly Visible mask pattern point, the mask pattern should be clearly visible. If not, exposure and/or baking times were too short. Procedure 6. Development The development step dissolves away the unexposed negative photoresist (or exposed positive photoresist). It is performed by immersing the wafer in developer liquid and agitating until the resist is dissolved and only the insoluble pattern remains. This procedure uses a glass dish and developer chemical in the fume hood. Developers are located in the flammable cabinet below the fume hood, left side. 1. Ensure the glass dish is clean. Clean and dry with a cleanroom wipe if necessary. Pour developer in the dish to about 0.5-1 cm depth. 2. Immerse the wafer in developer and gently slosh/agitate, taking care not to splash developer out of the dish (See Figure 25). Start a timer on the hotplate with the desired development time.
Figure 25: Development Process
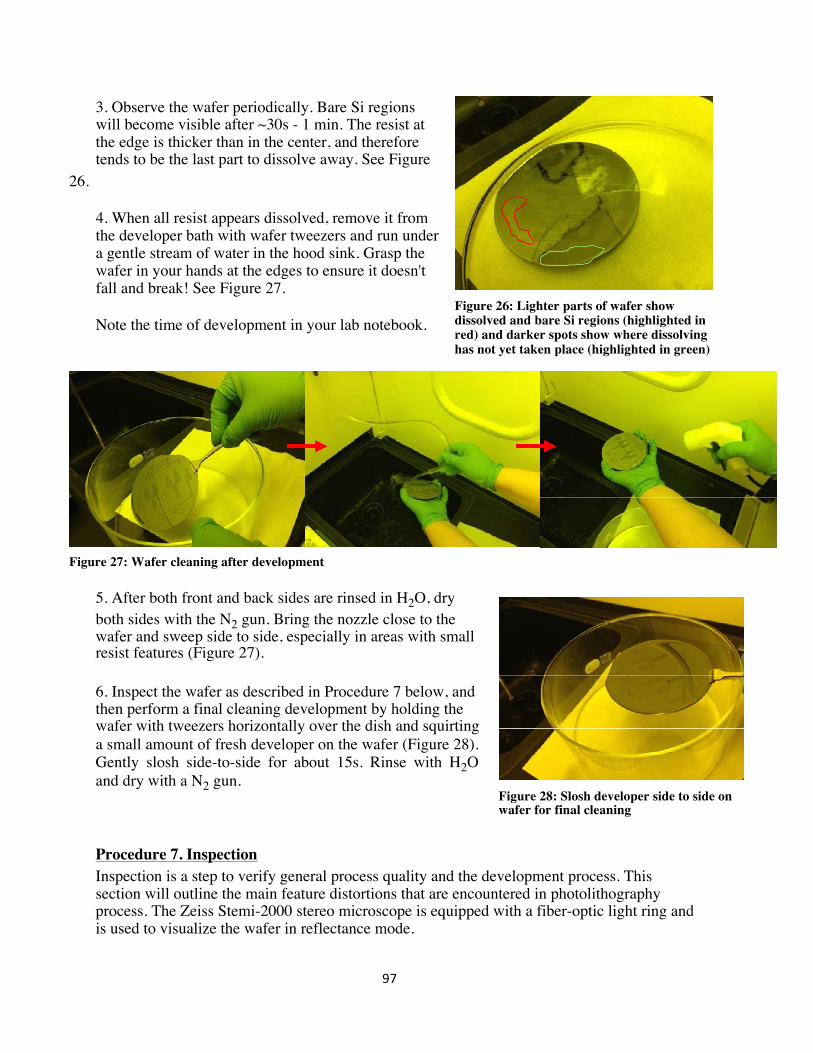
97
3. Observe the wafer periodically. Bare Si regions will become visible after ~30s - 1 min. The resist at the edge is thicker than in the center, and therefore tends to be the last part to dissolve away. See Figure
26.
4. When all resist appears dissolved, remove it from the developer bath with wafer tweezers and run under a gentle stream of water in the hood sink. Grasp the wafer in your hands at the edges to ensure it doesn't fall and break! See Figure 27.
Note the time of development in your lab notebook.
Figure 27: Wafer cleaning after development
Figure 26: Lighter parts of wafer show dissolved and bare Si regions (highlighted in red) and darker spots show where dissolving has not yet taken place (highlighted in green)
5. After both front and back sides are rinsed in H2O, dry both sides with the N2 gun. Bring the nozzle close to the wafer and sweep side to side, especially in areas with small resist features (Figure 27). 6. Inspect the wafer as described in Procedure 7 below, and then perform a final cleaning development by holding the wafer with tweezers horizontally over the dish and squirting a small amount of fresh developer on the wafer (Figure 28). Gently slosh side-to-side for about 15s. Rinse with H2O and dry with a N2 gun.
Figure 28: Slosh developer side to side on wafer for final cleaning
Procedure 7. Inspection Inspection is a step to verify general process quality and the development process. This section will outline the main feature distortions that are encountered in photolithography process. The Zeiss Stemi-2000 stereo microscope is equipped with a fiber-optic light ring and is used to visualize the wafer in reflectance mode.

98
After initial development and rinsing, the wafer will appear dirty (see Figure 29). This is OK! It is due to the resist that has dissolved in the developer and will be cleaned to a shiny surface after brief wash with fresh developer. Also, sharp corners and large resist fields will likely display surface cracks. This is also OK! It is due to the thermal stresses during bakes, which were minimized by gradual heating and cooling but not fully eliminated. These cracks will be eliminated with the Post-bake, Procedure 8.
Figure 29: Dirty Wafer 1. Development time. Pay attention to the smallest features in the resist pattern. Lines should be sharp, with no evidence of resist material in regions where it should be removed. If not,
development is incomplete. Return the wafer to the developer bath and repeat for ~30s, then rinse, dry, and reinspect. Instead, if the resist layer that should remain looks especially cloudy or rough, the wafer may be over-developed. Additionally, overdevelopment may narrow a resist feature or widen a resist "hole", and underdevelopment may do the opposite as in Figure 30.
Figure 30: Under-development and Over-development.
2. Bake times and temperatures. The extent to which a feature deviates from its ideal size is a function of the exposure time, prebake temperature, prebake time, development temperature and development time. Any of these parameters could be the cause for overdevelopment or underdevelopment and it is therefore important that one understand some important troubleshooting techniques. The key idea troubleshoot the distorted feature is to observe the effect of changing a parameter while holding the other parameters at constant. The following example illustrates this idea. Figure 31 shows the changes in feature size as the exposure time is increased, while holding the other parameters at constant. It can be observed that by changing the exposure time while holding the other parameters at constant, there is a time window where the feature size is optimal, i.e. between 15s and 25s in this example. If the changing of this parameter does not produce the desired feature size, the problems are most likely to be caused by other parameters or combinations of several parameters. Repeated troubleshooting with other parameters should be carried out.
Figure 31:Changes in feature size due to increasing exposure time
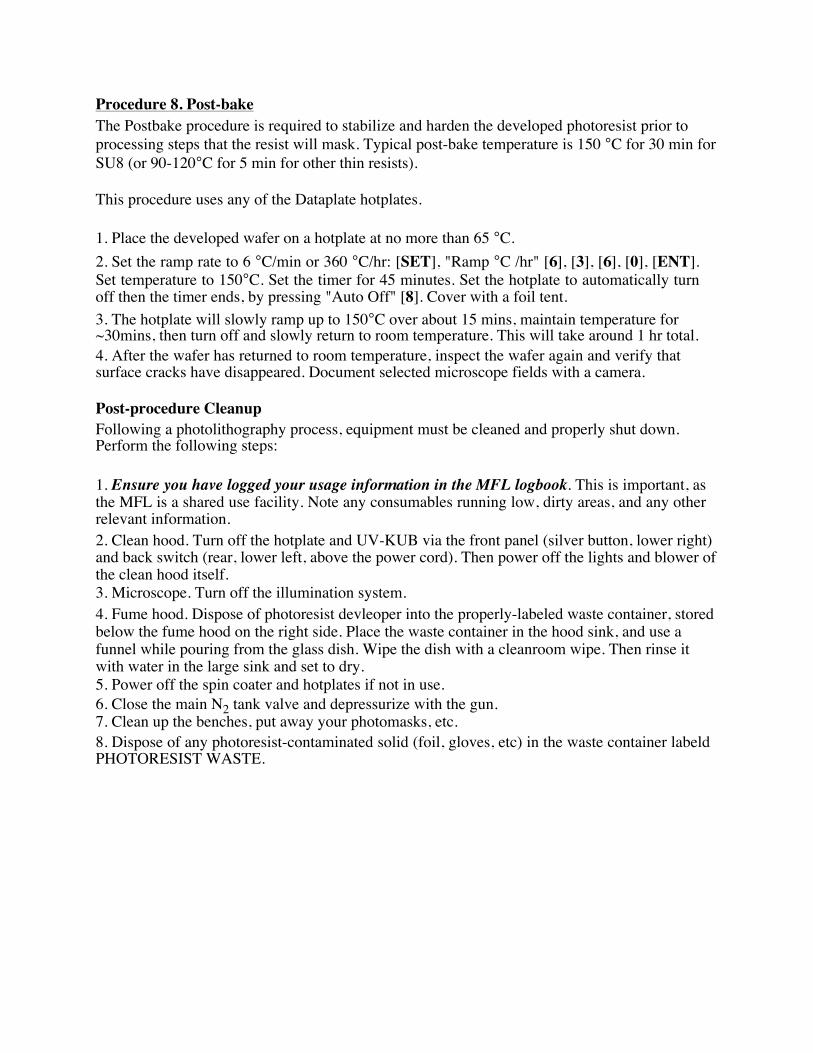
Procedure 8. Post-bake The Postbake procedure is required to stabilize and harden the developed photoresist prior to processing steps that the resist will mask. Typical post-bake temperature is 150 °C for 30 min for SU8 (or 90-120°C for 5 min for other thin resists). This procedure uses any of the Dataplate hotplates. 1. Place the developed wafer on a hotplate at no more than 65 °C. 2. Set the ramp rate to 6 °C/min or 360 °C/hr: [SET], "Ramp °C /hr" [6], [3], [6], [0], [ENT]. Set temperature to 150°C. Set the timer for 45 minutes. Set the hotplate to automatically turn off then the timer ends, by pressing "Auto Off" [8]. Cover with a foil tent. 3. The hotplate will slowly ramp up to 150°C over about 15 mins, maintain temperature for ~30mins, then turn off and slowly return to room temperature. This will take around 1 hr total. 4. After the wafer has returned to room temperature, inspect the wafer again and verify that surface cracks have disappeared. Document selected microscope fields with a camera. Post-procedure Cleanup Following a photolithography process, equipment must be cleaned and properly shut down. Perform the following steps: 1. Ensure you have logged your usage information in the MFL logbook. This is important, as the MFL is a shared use facility. Note any consumables running low, dirty areas, and any other relevant information. 2. Clean hood. Turn off the hotplate and UV-KUB via the front panel (silver button, lower right) and back switch (rear, lower left, above the power cord). Then power off the lights and blower of the clean hood itself. 3. Microscope. Turn off the illumination system. 4. Fume hood. Dispose of photoresist devleoper into the properly-labeled waste container, stored below the fume hood on the right side. Place the waste container in the hood sink, and use a funnel while pouring from the glass dish. Wipe the dish with a cleanroom wipe. Then rinse it with water in the large sink and set to dry. 5. Power off the spin coater and hotplates if not in use. 6. Close the main N2 tank valve and depressurize with the gun. 7. Clean up the benches, put away your photomasks, etc. 8. Dispose of any photoresist-contaminated solid (foil, gloves, etc) in the waste container labeld PHOTORESIST WASTE.

100
Appendix B: Full Photomask Designs

101
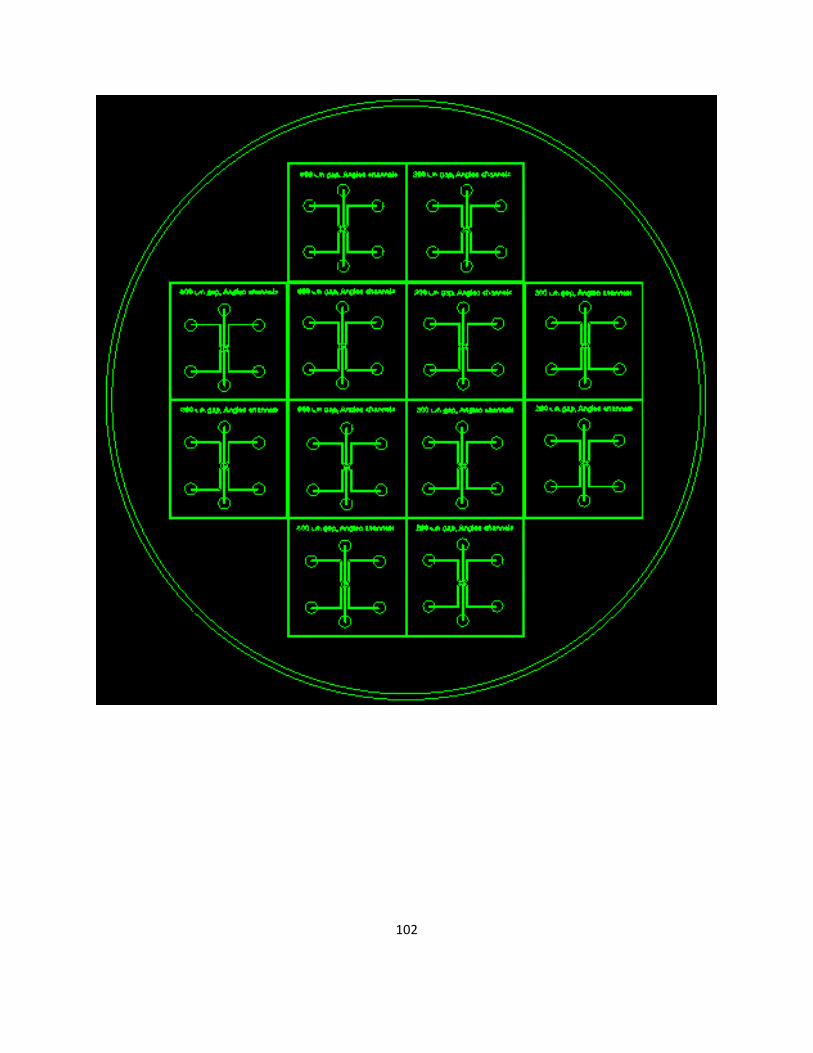
102

103
Appendix C: SOP for BrdU Assay
Hydrogel Barrier Formation in a Migration Device Standard Operating Procedure
Team 42 MQP Materials: BrdU Stock Solution (refrigerated) DPBS + Calcium DPBS Ice Cold Methanol 24 Well Plate Tween-‐20 Hoechst 33342 Procedure:
1. Add 1.0 μl of BrdU stock solution per ml of culture medium to cells being assayed and incubate for 4 hours or the time required by the experimental protocol.
2. Aspirate culture medium and wash cells in 2X in DPBS+. 3. Aspirate DPBS+ and add ice cold (-‐20C) methanol (1.0 ml/well for 24-‐well
plate). Incubate for 10 min at -‐20C 4. Aspirate methanol and wash with 1.0 ml PBS for 10 min (plates can be stored
at 4C with PBS in wells if analysis is not to be done right away. 5. Aspirate PBS and add 1.5 N HCl (0.5 ml/well for 24-‐well or 0.25 ml/well for
48-‐well plate) and incubate at RT for 20 min. 6. Wash 3x with PBS, 5 min each 7. If cells were cultured with serum, blocking is not necessary. If cultured in
serum-‐free system, block at RT for at least 15 min with 5% FBS in PBS+0.05% Tween-‐20.
8. Dilute anti-‐BrdU antibody 1:100 in PBS +0.05% Tween-‐20. 9. Add antibody solution at 150 μl/well for 24-‐well plate or 75 μl/well for 48-‐
well plate) and incubate at RT for 30 min. 10. Aspirate antibody solution and wash 3X with PBS for 5 min each. 11. Add fluorescent dye conjugated secondary antibody diluted 1:500 in
PBS+0.05% Tween-‐20 (150 μl/well for 24-‐well plate or 75 μl/well for 48-‐well plate) and incubate at RT for 30 min.
12. Wash 3X with PBS without Tween. 13. Add 0.5 μg/ml Hoechst 33342 to last wash (stock is 1 mg/ml) and incubate
for 10 min at RT 14. Aspirate Hoechst solution, wash with PBS and add PBS (1.0 ml/well for 24-‐
well or 0.5 ml/well for 48-‐well plate). 15. Cells are ready for observation by fluorescence microscopy. Plates can be
stored at 4C wrapped in foil to protect from light.
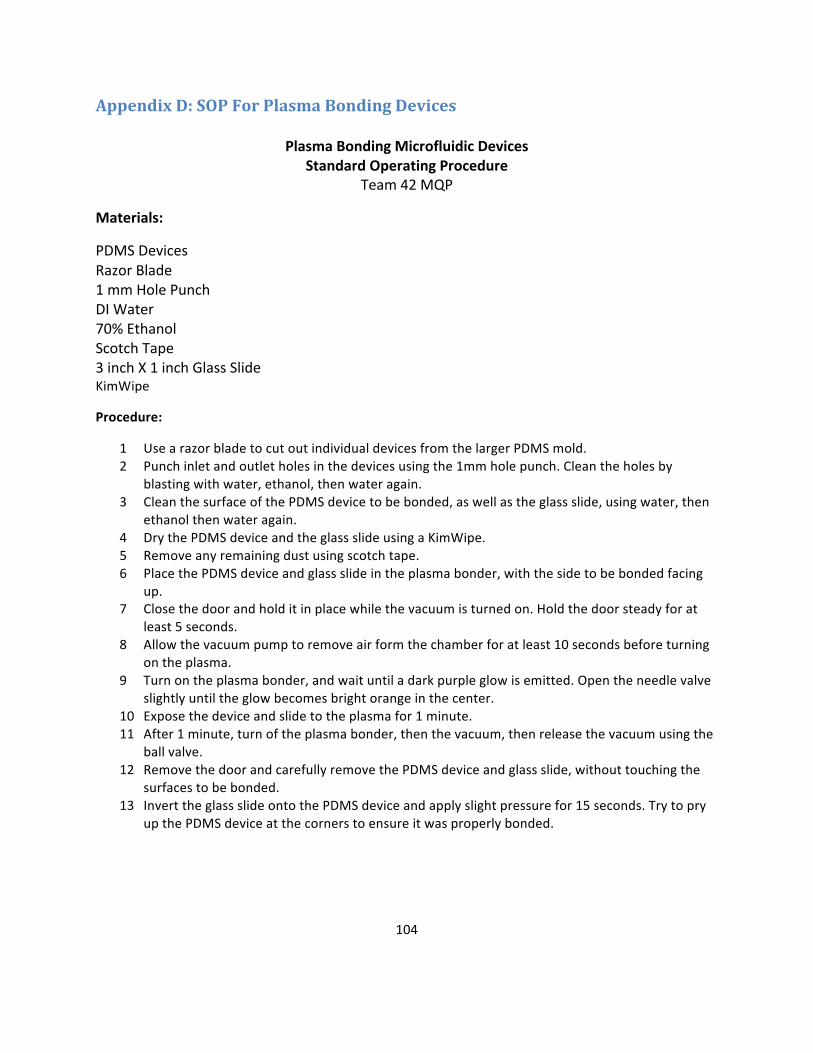
104
Appendix D: SOP For Plasma Bonding Devices
Plasma Bonding Microfluidic Devices Standard Operating Procedure
Team 42 MQP
Materials:
PDMS Devices Razor Blade 1 mm Hole Punch DI Water 70% Ethanol Scotch Tape 3 inch X 1 inch Glass Slide KimWipe
Procedure:
1 Use a razor blade to cut out individual devices from the larger PDMS mold. 2 Punch inlet and outlet holes in the devices using the 1mm hole punch. Clean the holes by
blasting with water, ethanol, then water again. 3 Clean the surface of the PDMS device to be bonded, as well as the glass slide, using water, then
ethanol then water again. 4 Dry the PDMS device and the glass slide using a KimWipe. 5 Remove any remaining dust using scotch tape. 6 Place the PDMS device and glass slide in the plasma bonder, with the side to be bonded facing
up. 7 Close the door and hold it in place while the vacuum is turned on. Hold the door steady for at
least 5 seconds. 8 Allow the vacuum pump to remove air form the chamber for at least 10 seconds before turning
on the plasma. 9 Turn on the plasma bonder, and wait until a dark purple glow is emitted. Open the needle valve
slightly until the glow becomes bright orange in the center. 10 Expose the device and slide to the plasma for 1 minute. 11 After 1 minute, turn of the plasma bonder, then the vacuum, then release the vacuum using the
ball valve. 12 Remove the door and carefully remove the PDMS device and glass slide, without touching the
surfaces to be bonded. 13 Invert the glass slide onto the PDMS device and apply slight pressure for 15 seconds. Try to pry
up the PDMS device at the corners to ensure it was properly bonded.

105
Appendix E: SOP for Hydrogel Barrier Formation
Hydrogel Barrier Formation in a Migration Device Standard Operating Procedure
Team 42 MQP Materials: 6 blocking pins 1mL PureCol collagen (frozen) 1 Syringe without plunger (3mL) 1 Syringe with plunger (1mL) 1 3-‐way valve 1ft Tygon tubing with metal inlet pin 1 migration device Procedure:
1. Incubate the migration device to be used in a 650 C oven overnight to restore its hydrophilic properties.
2. Attach both syringes and the Tygon tubing to the 3-‐way valve. 3. Insert blocking pins into each of the holes on the migration device except the hydrogel inlet and
outlet. 4. Load 1mL PureCol collagen into the 3mL syringe 5. Prime the syringes to remove bubbles by repeatedly drawing collagen into the 1mL syringe and
then expelling it using the plunger until no bubbles are observed in either syringe or the valve itself.
6. Prime the tubing by allowing the collgen to flow through it until a drop is observed at the end of the tubing, then stop the flow by turning the valve control knob.
7. Insert the inlet tube into the inlet hole in the migration device and place under a microscope to observe the flow.
8. Open the valve to allow the collagen to flow through the tubing and into the device. 9. Raise the syringe setup above the level of the device until the collagen has almost reached the
barrier channel, then lower the syringe until a very slow flowrate is observed. 10. Allow the collagen to slowly flow through the channel, contacting each pair of posts as it travels. 11. Once the collagen has flowed about 500um into the hydrogel outlet channel, stop the flow by
lowering the syringe to the same level as the device. 12. Cut the inlet tube close to the device with scissors using a smooth motion and minimally
compressing the tube during the cut. 13. Transfer the device to a 370 C incubator for 90 minutes. 14. Carefully remove the blocking pins from the other channel inlets and outlets. The device can
now be loaded with chemicals or cells and used for migration assays.

106
Appendix F: BME Educational Objectives
An ability to design a system, component, or process to meet desired needs within realistic constraints such as economic, environmental, social, political, ethical, health and safety, manufacturability, and sustainability (ABET 3c) while incorporating appropriate engineering standards (ABET Criterion 5) I. multiple realistic constraints (economic, environmental, social, political, ethical, health
and safety, manufacturability) – page(s) 57-‐58 II. appropriate engineering standards -‐ page(s) 36-‐38
4. An ability to function on multidisciplinary teams (3d). page(s) N/A 6. An understanding of professional and ethical responsibilities (3f) I. Professional – page(s) 49-‐52 II. Ethical – page(s) 58
7. An ability to communicate effectively (3g). pages 54-‐59 8. The broad education necessary to understand the impact of engineering solutions in a global, economic, environmental, and societal context (3h). I. Economic – page(s) 59 II. Environmental – page(s) 57
10. A knowledge of contemporary issues (3j). page(s) 10-‐13, 73-‐75