amewu a. mensah
TRANSCRIPT
Ener
gie
& U
mw
elt
Ener
gy &
Env
iron
men
t
104
Energie & Umwelt / Energy & EnvironmentBand / Volume 104ISBN 978-3-89336-698-9
Mitg
lied
der
Hel
mho
ltz-G
emei
nsch
aft
Mitg
lied
der
Hel
mho
ltz-G
emei
nsch
aft
Water and Organic Nitrate Detection in an AMS: Laboratory Characterization and Application to Ambient Measurements
Amewu A. Mensah
Amew
u A
. Men
sah
Wat
er a
nd O
rgan
ic N
itrat
e D
etec
tion
in a
n A
MS

Schriften des Forschungszentrums JülichReihe Energie & Umwelt / Energy & Environment Band / Volume 104


Forschungszentrum Jülich GmbHInstitute of Energy and Climate Research (IEK)Troposphere (IEK-8)
Water and Organic Nitrate Detection in an AMS: Laboratory Characterization and Application to Ambient Measurements
Amewu A. Mensah
Schriften des Forschungszentrums JülichReihe Energie & Umwelt / Energy & Environment Band / Volume 104
ISSN 1866-1793 ISBN 978-3-89336-698-9

Bibliographic information published by the Deutsche Nationalbibliothek.The Deutsche Nationalbibliothek lists this publication in the Deutsche Nationalbibliografie; detailed bibliographic data are available in the Internet at http://dnb.d-nb.de.
Publisher and Forschungszentrum Jülich GmbHDistributor: Zentralbibliothek 52425 Jülich Phone +49 (0) 24 61 61-53 68 · Fax +49 (0) 24 61 61-61 03 e-mail: [email protected] Internet: http://www.fz-juelich.de/zb Cover Design: Grafische Medien, Forschungszentrum Jülich GmbH
Printer: Grafische Medien, Forschungszentrum Jülich GmbH
Copyright: Forschungszentrum Jülich 2011
Schriften des Forschungszentrums JülichReihe Energie & Umwelt / Energy & Environment Band / Volume 104
D 38 (Diss., Köln, Univ., 2010)
ISSN 1866-1793ISBN 978-3-89336-698-9
The complete volume ist freely available on the Internet on the Jülicher Open Access Server (JUWEL) at http://www.fz-juelich.de/zb/juwel
Neither this book nor any part of it may be reproduced or transmitted in any form or by any means, electronic or mechanical, including photocopying, microfilming, and recording, or by any information storage and retrieval system, without permission in writing from the publisher.


Berichterstatter: PD Dr. Andreas Hofzumahaus, FZ Jülich
Prof. Dr. Andreas Wahner, FZ Jülich
Tag der mündlichen Prüfung: 21.04.2010

Abstract V
AbstractAtmospheric aerosols were studied by three different means. Laboratory
experiments determined the relative ionization efficiency of water (RIEH2O) in an Aerodyne
Aerosol Mass Spectrometers (AMS), simulation chamber experiments gave insight to the
reaction products of biogenic volatile organic compounds (BVOC) oxidation products, and
the findings were applied to two field campaign measurements at Cabauw, NL, in May
2008 and February 2009. Knowing the liquid water content of aerosol particles is vital for
the assessment of their climate forcing potential. A value of 2 for RIEH2O was determined
by studying oxalate salts with different amounts of crystal water. BVOCs contribute much
more to the global budget of VOCs than anthropogenic ones but oxidation products in
terms of secondary organic aerosol often correlate to anthropogenic tracers such as NOx
from fossil fuel burning. In atmospheric simulation chamber experiments, organic nitrates
from BVOC-NO3 oxidation showed higher vapor pressures than pure organic compounds
produced in the same reactions. Organic nitrates comprised up to approx. 41 % of the
particulate phase. A specific fragmentation ratio of nitrate (NO2+/NO+) of 0.1 was found by
high resolution AMS analysis differing strongly from the value of 0.4 known for the most
abundant ambient NO3 specie (NH4NO3). Ambient average particulate mass loadings were
9.72 µg/m3 dominated by organics (40 %) in 2008 and 5.62 µg/m3 dominated by nitrate
(42 %) in 2009. Data comparison to collocated instruments showed good agreement.
Positive Matrix Factorization analysis of the particulate organic fraction distinguished semi
and low volatile oxygenated organic aerosol (OOA) as well as hydrocarbon like organic
aerosol (HOA) in both campaigns. An additional highly oxygenated OA with a mass
spectrum very similar to fulvic acid was found in 2008. The average contribution of
organic nitrate to the particulate nitrate mass was 34.9 % in 2008 and 5.2 % in 2009.

VI Kurzzusammenfassung
KurzzusammenfassungAtmosphärische Aerosolpartikel wurden mit Hilfe eines
Aerosolmassenspektrometers untersucht. Der Flüssigwassergehalt atmosphärischer
Aerosolpartikel spielt eine zentrale Rolle in ihrer Klimawirksamkeit. Durch Untersuchung
des Kristallwassergehaltes von Oxalsäuresalzen wurde die relative Ionisierungseffizienz
von Wasser mit einem Wert von 2 bestimmt. Global dominieren biogene flüchtige
organische Substanzen (BVOC) das VOC-Budget. Ihre Oxidationsprodukte in Form von
sekundären organischen Aerosolen können starke Korrelationen zu anthropogenen
Spurenstoffen, z.B. NOx aufweisen. In der Atmosphärensimulationskammer SAPHIR
wurden BVOCs mit NO3 oxidiert. Die in diesen Reaktionen entstandenen organischen
Nitrate wiesen einen deutlich höheren Dampfdruck auf als die gleichzeitig erzeugten rein
organischen Verbindungen. Der Beitrag der Organonitrate zur gesamten partikulären
Masse war ~ 41 %. Das spezifische Fragmentierungsmuster der Organonitrate von NO2+ zu
NO+ (0,1) unterscheidet sich signifikant von dem von Nitraten aus NH4NO3 (0,4). Die in
den Laborstudien gewonnenen Erkenntnisse wurden bei der Analyse von Felddaten zweier
Kampagnen in Cabauw, NL (Mai 2008 und Februar 2009) angewendet. Die mittlere
Partikelbeladung betrug 9,72 µg/m3 in 2008 und 5,62 µg/m3 in 2009. 2008 wurde die
Zusammensetzung der Partikel von organischen Verbindungen dominiert (40 %), 2009 von
Nitrat (42 %). Vergleiche mit unabhängigen Methoden ergaben gute Übereinstimmungen.
Der organische Anteil der Partikel wurde mithilfe der Methode der positiven
Matrixfaktorisierung untersucht. Für beide Messperioden war der organische Beitrag in
niedervolatile und semivolatile oxidierte sowie kohlenwasserstoffartige organische
Verbindungen unterteilt. Zusätzlich wurde 2008 eine Komponente gefunden, die der
Fulvinsäure stark ähnelt. Die Untersuchung des Fragmentierungsverhaltens des
partikulären Nitrates ergab einen mittleren Beitrag organischer Nitrate von 34,9 % für
2008 und 5,2 % für 2009.

Table of Contents1. Introduction........................................................................................................ 1
2. The Aerosol Mass Spectrometer........................................................................ 7
2.1. Set Up of the AMS.....................................................................................8
2.2. Identification of Chemical Compounds in the AMS ...............................10
2.3. Quantification in the AMS.......................................................................13
2.4. Data Acquisition Modes ..........................................................................17
3. Laboratory Experiment - RIE of Water ........................................................... 21
3.1. Set-Up ......................................................................................................22
3.2. Materials and Methods.............................................................................23
3.3. Results......................................................................................................25
3.3.1. Physical Properties..............................................................................25
3.3.2. Water Content of Oxalate Particles.....................................................28
3.3.3. Analysis of OxAc Contamination .......................................................31
3.4. Summary and Conclusions ......................................................................34
4. Chamber Study - Organic Nitrate Detection in an AMS................................. 37
4.1. SAPHIR ...................................................................................................38
4.2. Experiments .............................................................................................39
4.3. Results......................................................................................................42
4.3.1. Vapor Pressure of Organic Nitrates ....................................................45
4.3.2. Nitrate Fragmentation Ratio................................................................48
4.4. Summary and Conclusions ......................................................................49
5. Ambient Measurements at Cabauw, NL.......................................................... 51
5.1. Cabauw - CESAR Tower.........................................................................51
5.2. Measurement Results ...............................................................................54
5.3. Instrument Comparisons ..........................................................................59
5.3.1. SMPS ..................................................................................................59
5.3.2. MARGA..............................................................................................62
5.3.3. MARGA-Sizer ....................................................................................64
5.4. PMF Analysis of the Organic Particulate Aerosol...................................66
5.5. Organic Nitrates in Ambient Measurements ...........................................73
5.6. Summary and Conclusions ......................................................................78
6. Summary.......................................................................................................... 81
7. Literature.......................................................................................................... 85
VIII Table of Contents
Appendix ..................................................................................................................93
A.1 Data Analysis .......................................................................................... 93
A.1.1 Software used ..................................................................................... 93
A.1.2 m/z Fitting........................................................................................... 93
A.1.3 Baseline .............................................................................................. 93
A.1.4 DC marker .......................................................................................... 93
A.1.5 Fragmentation Wave........................................................................... 94
A.1.6 High Resolution Fitting ...................................................................... 95
A.2 AMS Data................................................................................................ 96
A.2.1 Batch Diurnals .................................................................................... 96
A.2.2 Size Distributions ............................................................................... 98
A.3 Comparison ........................................................................................... 104
A.3.1 SMPS................................................................................................ 104
A.3.2 MARGA 2008 .................................................................................. 105
A.3.3 MARGA 2009 .................................................................................. 106
A.3.4 MARGA Sizer .................................................................................. 107
A.4 PMF Data .............................................................................................. 110

List of AbbreviationsAB Air Beam
ACCENT Atmospheric Composition Change the European NeTwork ofexcellence, http://www.accent-network.org/farcry_accent/
AmOx Ammonium Oxalate
AMS Aerodyne Aerosol Mass Spectrometer
a.s.l. above sea level
BC Black Carbon
BVOC Biogenic Volatile Organic Compounds
amu atomic mass unit
BWP Beam Width Probe
C Average Mass Loading
CE Collection Efficiency
CESAR Cabauw Experimental Site for Atmospheric Research,
CL Chemiluminescence
CPC Condensational Particle Counter
dm mobility diameter
dva vacuum aerodynamic diameter
DMA Differential Mobility Analyzer
Eb(dva) effect of particle phase on collection efficiency
EL(dva) effect of the Liu-type aerodynamic lens on collection efficiency
ES(dva) effect of particle size on collection efficiency
ECN Energy Research Centre of the Netherlands, The Netherlands,http://www.ecn.nl/nl/
EI Electron Impact ionization
EMEP European Monitoring and Evaluation Programme,http://www.emep.int/
EUCAARI European Integrated project on Aerosol Cloud Climate Air QualityInteractions, http://www.atm.helsinki.fi/eucaari/
FWHM Full Width Half Maximum
GHG Green House Gases
HR-ToF High-Resolution Time of Flight
I Ion Count Rate
ICG-2 Institut für Chemie und Dynamik der Geosphäre, Troposphäre,Jülich, Germany, http://www.fz-juelich.de/icg/icg-2/
IE Ionization Efficiency

X List of Abbreviations
List of Abbreviations (continued)IMPACT Intensive Measurement Period At Cabauw Tower
IPCC Intergovernmental Panel On Climate Change;http://www.ipcc.ch/
KNMI Royal Netherlands Meteorological Institute, The Netherlands,http://www.knmi.nl/
KOx Potassium Oxalate
LED Light Emitting Diode
MAAP Multi Angle Absorption Photometer
MARGA Measuring AeRosol and GAses
MF Mass Fraction
MS Mass Spectrometer
MS Mass Spectrum
MW Molecular Weight
m/z mass to charge ratio
NA Avogadro Constant = 6.022 · 1023 mol-1
NaOx Sodium Oxalate
NIST National Institute for Standards and Technology
NOx NO + NO2
OM Organic Matter
OxAc Oxalic Acid
PILS Particle Into Liquid Sampler
PM Particulate Matter
POA Primary Organic Aerosol
ppb Parts per billion (10-9)
ppm Parts per million (10-6)
ppt Parts per trillion (10-12)
PSL Polystyrene Latex Spheres
PToF Particle Time of Flight
PTR-TD-MS Proton-Transfer-Reaction Thermo-Desorption MassSpectrometer
PulsedCRDS Pulsed Cavity Ring-Down Spectrometer
Q Volumetric Flow Rate
Q-MS Quadrupole Mass Spectrometer
ρ Density

List of Abbreviations XI
List of Abbreviations (continued)RH Relative Humidity
RIE Relative Ionization Efficiency
RP Resolving Power
SAPHIR Simulation of Atmospheric PHoto oxidation In a large Reactionchamber
SJAC Steam Jet Aerosol Collector
SMPS Scanning Mobility Particle Sizer
SOA Secondary Organic Aerosol
TD-LIF Thermal Dissociation Laser Induced Fluorescence
TNO Built Environment and Geosciences Airquality & Climate,Uetrecht, The Netherlands, http://www.tno.nl/index.cfm
toc total organic carbon
UMR Unit Mass Resolution
WAD Wet Annular Denuder
WSOC Water Soluble Organic Carbon
VOC Volatile Organic Compounds


1. Introduction
Aerosols are defined as suspended particulate matter (PM), which can be solid or
liquid in addition to the surrounding gas phase. The aerosol particles are characterized by
their size, composition and shape. The size, mostly referred to as the particle diameter,
spans over several orders of magnitude from a few nanometers to several micrometers
(Figure 1.1). There is no clear definition of a lower size limit due to floating transition
from molecules to small particles in the size range below 10 nm. Particles much larger than
several micrometers are too large to stay suspended and fall out of the gas phase within a
short time. Atmospheric particles are generally classified as nucleation, accumulation, or
coarse mode particles (Figure 1.1), which can be determined by size distribution
measurements.
Figure 1.1 Size ranges, size definitions and corresponding examples of atmospheric aerosol particlesadopted from [Hinds, 1999].
Aerosol particles directly and indirectly affect the global climate. Depending on
their optical properties, particles can scatter or absorb long and short wave radiation. This
has an impact on visibility (global dimming [Nazarenko and Menon, 2005; Ramanathan et
al., 2007; Romanou et al., 2007]) and can have cooling or heating effects on the

2 Chapter 1: Introduction
atmosphere. They also exhibit a range of indirect effects such as altering the properties of
clouds or acting as surface for heterogeneous reactions. Their most important impact an
cloud properties is acting as cloud condensation nuclei (CCN). Changes in particle number
concentration and size distribution alter cloud albedo [Norris and Wild, 2007] and can
cause suppression or enhancement of rain [Nober et al., 2003; Tao et al., 2007; Vaughan T.
J. Phillips, 2002]. A property determining the direct and indirect climate effects of
particles is the ability to take up water referred to as hygroscopicity of the particle.
Hygroscopicity is used as an indirect measure of the particles liquid water content in
atmospheric studies [Ehn et al., 2007; Hämeri et al., 2001; Jimenez et al., 2009; Neusüß et
al., 2002; Saxena and Hildemann, 1996]. Direct measurements of the particles liquid water
content, which are hard to achieve up to now, would improve the understanding of aerosol
particles impact on the global climate significantly. The IPCC report 2007 [IPCC, 2007]
identifies aerosol particles as the major uncertainty in the prediction of future climatic
conditions. Furthermore, aerosol particles are associated with health hazards such as
increased cardiopulmonary [Moolgavkar et al., 1994] or lung cancer mortality [Pope et
al., 2002].
While the large size range that is covered by atmospheric aerosol particles opens a
wide field of complexity on its own, further complexity is added by the compositional
variability of the particles. Apart from the above mentioned water, the major constituents
found in atmospheric aerosol particles are sulfate, nitrate, ammonium, minerals, black
carbon (BC) and organic components often referred to as organic matter (OM) [Rogge et
al., 1993]. The fractional abundance of the individual constituents is strongly dependent on
the particles origin and process of formation.

Chapter 1: Introduction 3
Figure 1.2 Aerosol mass spectrometric measurements of the fine particulate aerosol fraction. Colors forthe study labels indicate the type of sampling location: urban areas (blue), <100 milesdownwind of major cites (black), and rural/remote areas >100 miles downwind (pink). Piecharts show the average mass concentration and chemical composition: organic matter(organics, green), sulfate (red), nitrate (blue), and ammonium (orange) [Zhang et al., 2007].
Figure 1.2 (taken from [Zhang et al., 2007]) shows the average mass concentrations
of aerosol particles in the fine mode determined by aerosol mass spectrometric
measurements across the Northern Hemisphere. The fractional abundance of sulfate (red),
nitrate (blue), ammonium (orange), and organics (OM, green) is given in the pie charts. As
can be seen, OM accounts for a significant fraction in all measurements independent of
location.
While it is comparatively easy to get insights to the physical properties such as the
size distribution or refractive index of aerosol particles, compositional analysis especially
of the organic fraction is still very challenging. Organic aerosols can be separated into
primary (POA) and secondary (SOA) depending on their process of formation (Figure 1.3).
POA consists of particles that are directly emitted into the atmosphere such as black carbon
from anthropogenic combustion processes or plant debris from biogenic sources. SOA in
contrast is formed by gas to particle conversion of semi and low volatile organic
compounds (VOC) after their oxidation. The global VOC budget is dominated by biogenic
emissions, which are estimated to be at the order of 1150 Tg C/a and therefore almost a
tenfold of anthropogenic emissions [Guenther et al., 1995].

4 Chapter 1: Introduction
Figure 1.3 Sources of organic aerosol particles. Emission rates are taken from [Guenther et al., 1995].
VOCs are primarily oxidized by hydroxy radicals (•OH), ozone (O3) and nitrate
radicals (•NO3) in the tropospheric atmosphere. From these three oxidants, only NO3 is
considered to be mainly of anthropogenic origin. This is due to the fact that the nitrate
radical is formed by oxidation of NO2 with ozone (equation (1.1a)) and the educt NO2 is
part of NOx (= NO + NO2) which is strongly associated with anthropogenic emissions
[Finlayson-Pitts and Pitts, 2000].
2332 ONOONO +→+ (1.1a)
5223 ONNONO ↔+ (1.1b)
At high NO3 concentrations further addition of NO2 leads to N2O5 which
decomposes in case of NO3 depletion (equation (1.1b)). NO3 is rapidly photolyzed by
sunlight causing it to reach significant oxidation potential only during night times. This is
contrary to OH, which is only active during daytime, since it is produced from the reaction
of water vapor with exited oxygen atoms and the exited oxygen atoms in turn are produced
by photolysis of ozone at wavelengths below 360 nm. Ozone itself can be found at
significant concentrations both under day or night conditions. When VOCs are oxidized
compounds of high, semi, and low volatility are formed. While high volatile compounds
remain in the gas phase, low and semi volatile compounds lay the basis for SOA particles
by gas to particle conversion (upper part of Figure 1.3). Low volatile compounds

Chapter 1: Introduction 5
condensate on preexisting or nucleate to form new particles and semi volatile compounds
partition between gas and particulate phase.
In the light of the high biogenic contribution to VOC (BVOC) emissions [Guenther
et al., 1995] and high rate coefficients of VOCs with NO3 [Atkinson, 1997; Atkinson and
Arey, 2003] the oxidation of BVOCs by NO3 might lead to a significant contribution to the
total SOA budget [Fry et al., 2009]. Still, most studies on atmospheric SOA formation
from the oxidation of VOCs focus on OH and O3 oxidation and only a limited number of
studies investigate the NO3 oxidation of VOCs and subsequent SOA formation, some of
which are [Griffin et al., 1999; Hallquist et al., 1999; Hoffmann et al., 1997; Skov et al.,
1992]. The deficit of knowledge on this reaction scheme causes this SOA production
pathway to be neglected in most global models. The discrepancies between measured and
modeled SOA budgets as reported by [Hallquist et al., 2009; Kanakidou et al., 2005;
Volkamer et al., 2006] might be reduced by implementation of the NO3 + BVOC reaction
into global models [Fry et al., 2009].
The statements of the last two paragraphs indicate that the investigation of aerosol
particles in the whole extend of their physical and chemical properties is challenging.
Laboratory, simulation chamber, and field measurements allow the experimental
investigation of aerosol particles with increasing dimension of scale and complexity. Small
scale laboratory experiments on the one hand allow for the best investigation of singular,
clearly defined processes and properties. Field measurements on the other side give
insights to the real atmospheric particle behavior but the interpretation of the findings are
difficult to decouple from meteorological aspects such as transport, precipitation or
temperature. An intermediate position between field and laboratory in terms of complexity
and scale is taken by simulation chambers. Experiments in simulation chambers are
performed in a controlled environment, but the conditions can be set to be close to the real
atmosphere. Knowledge gained in laboratory or simulation chamber experiments is applied
to field measurements and questions that arise at field measurements can be investigated in
detail in chamber/laboratory experiments.
In the present work aerosol mass spectrometry (AMS, detailed description in
chapter 2) was used to investigate the chemical composition of aerosol particles in
laboratory (chapter 3), simulation chamber (chapter 4) and field studies (chapter 5). The
relative ionization efficiency of water (RIEH2O) in an AMS was determined in laboratory
experiments (chapter 3). The knowledge of the RIEH2O is an important step on the way to

6 Chapter 1: Introduction
measure the particles liquid water content directly and thereby increase the understanding
of particle-gas phase interactions and the impact of aerosol particles on the global climate.
The SOA and organic nitrates produced by NO3 oxidation of three different BVOCs in an
atmospheric simulation chamber were investigated towards their physical and chemical
properties (chapter 4). Furthermore, a detection scheme for organic nitrates by mass
spectrometric measurements was developed. The findings gained from these two studies
performed under controlled laboratory conditions were applied to two field measurement
datasets collected at Cabauw, The Netherlands, a representative measurement site for
Western Europe (chapter 5). Atmospheric particles water and organic nitrate content were
investigated.

2. The Aerosol Mass Spectrometer
The first step in investigating aerosol particles is the decision on the right sampling
and analyzing technique. Offline and online techniques exist for the chemical investigation
of OA. The collection of aerosol particles on filters and subsequent extraction and analysis
of the particles is an offline technique. Extraction and analysis can be for example the
dissolution of the collected particles in an organic solvent followed by gas
chromatographic/mass spectrometric analysis of the eluent. If high particle loads are
sampled, only parts of the filter are needed for an analysis allowing to address several
different questions by one probe. The disadvantage of offline measurements is a generally
low time resolution ranging from hours to days. Since atmospheric situations can change
very rapidly, this causes the investigation of an averaged sample. Furthermore, the
handling and storage of the samples can analysis cause contamination, evaporation of semi
volatile components, or aging and alteration due to chemical reactions during storage.
Online sampling techniques minimized the alteration of the sampling probe since the probe
is analyzed almost instantaneously after sampling. Analytical difficulties arise since only
low mass loadings can be sampled if sampling intervals range from seconds to a few
minutes. This becomes clear when considering the low ambient concentrations of aerosol
particles compared to has phase concentrations. Particle concentrations typically range
from few microgram per meters cubed in remote areas like Hyttiälä, FIN [Zhang et al.,
2007] to about 100 µg/m3 in polluted areas like Mexico City, MX [Aiken et al., 2009]
while gaseous nitrogen alone has a concentration of 950 � 106 µg/m3 in the air. Therefore,
when applying online techniques only a limited number of questions can be addressed.
Online instruments generally need to be transportable, i.e. of limited size and mass, thereby
limiting the analyzing techniques to the ones that do not require an entire laboratory set up.
A commercially available online instrument is the Aerodyne Aerosol Mass Spectrometer
(AMS). It is a very powerful instrument that allows to address the questions of aerosol
particles mass, size distribution, composition, shape and even partly volatility. Additionally
high time resolution can be achieved with the AMS. Two types of this instrument were
used for the investigation of aerosol particles presented in this work. The set-up
(chapter 2.1), working principle (chapter 2.2 and 2.3), and operation (chapter 2.4) will be
presented in the upcoming sections.
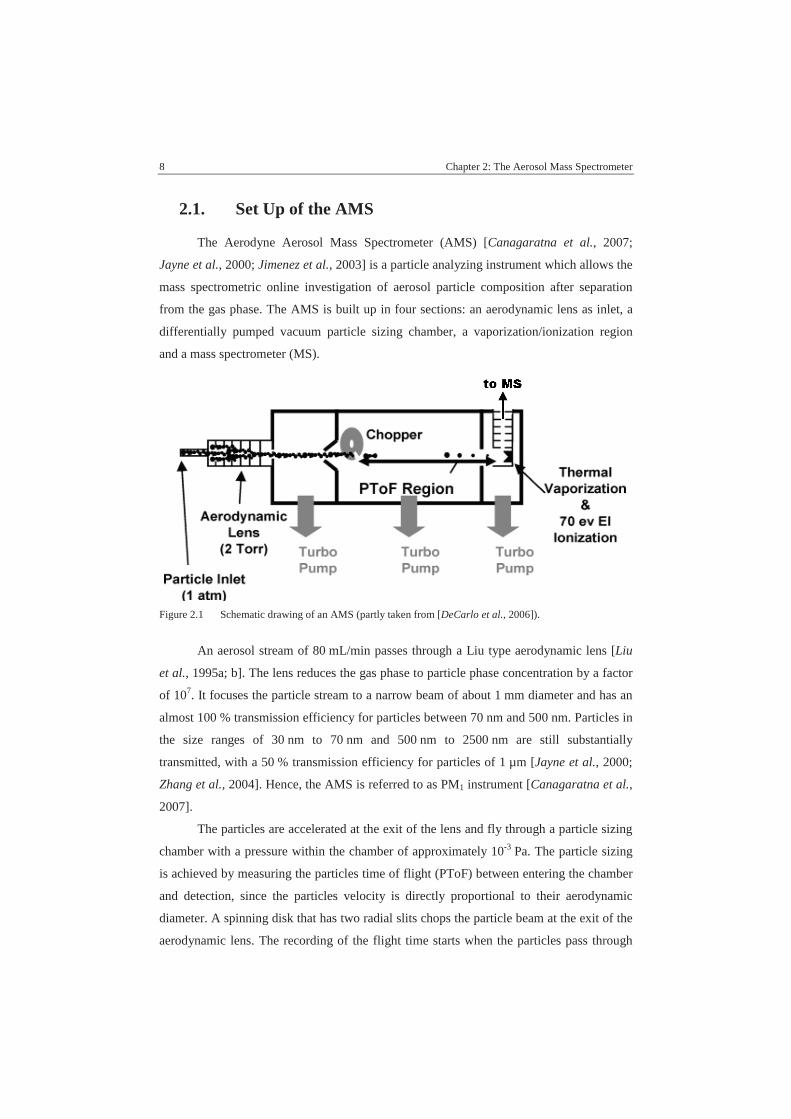
8 Chapter 2: The Aerosol Mass Spectrometer
2.1. Set Up of the AMS
The Aerodyne Aerosol Mass Spectrometer (AMS) [Canagaratna et al., 2007;
Jayne et al., 2000; Jimenez et al., 2003] is a particle analyzing instrument which allows the
mass spectrometric online investigation of aerosol particle composition after separation
from the gas phase. The AMS is built up in four sections: an aerodynamic lens as inlet, a
differentially pumped vacuum particle sizing chamber, a vaporization/ionization region
and a mass spectrometer (MS).
Figure 2.1 Schematic drawing of an AMS (partly taken from [DeCarlo et al., 2006]).
An aerosol stream of 80 mL/min passes through a Liu type aerodynamic lens [Liu
et al., 1995a; b]. The lens reduces the gas phase to particle phase concentration by a factor
of 107. It focuses the particle stream to a narrow beam of about 1 mm diameter and has an
almost 100 % transmission efficiency for particles between 70 nm and 500 nm. Particles in
the size ranges of 30 nm to 70 nm and 500 nm to 2500 nm are still substantially
transmitted, with a 50 % transmission efficiency for particles of 1 µm [Jayne et al., 2000;
Zhang et al., 2004]. Hence, the AMS is referred to as PM1 instrument [Canagaratna et al.,
2007].
The particles are accelerated at the exit of the lens and fly through a particle sizing
chamber with a pressure within the chamber of approximately 10-3 Pa. The particle sizing
is achieved by measuring the particles time of flight (PToF) between entering the chamber
and detection, since the particles velocity is directly proportional to their aerodynamic
diameter. A spinning disk that has two radial slits chops the particle beam at the exit of the
aerodynamic lens. The recording of the flight time starts when the particles pass through

Chapter 2: The Aerosol Mass Spectrometer 9
one of the slits, detected by an LED and a photodiode, and ends when ion signal is
detected.
After passing through the PToF chamber the particle beam strikes a conic tungsten
surface, the so called vaporizer. The vaporizer consists of porous tungsten and has an
inverted conical shape, to achieve optimum particle collection efficiency. The temperature
of the vaporizer can be modulated from about 150 °C to about 950 °C and is chosen such
that maximum signal is obtained. In general, the vaporizer is operated at approximately
600°C causing the non-refractory components of the particles to flash evaporate on the
surface [Jayne et al., 2000].
The evaporated molecules are ionized by 70 eV Electron Impact (EI). The required
electrons are emitted by a filament that is located millimeters beside the vaporizer. The
ionized molecules are then extracted into the MS for compositional analysis. EI ionization
is a standard ionization method. Acquired mass spectra can therefore be compared to data
base spectra like the public available data base from the National Institute for Standards
and Technology (NIST). One must keep in mind, that the flash evaporation of the particles
introduces additional internal energy which in turn leads to a high degree of fragmentation
when the molecules are ionized.
A Quadrupole AMS (Q-AMS) and a High Resolution Time of Flight AMS
(HR-ToF-AMS) were used in this work. The major difference between these two
instruments is the mass spectrometer. The quadrupole mass spectrometer (Q-MS)
consecutively scans a defined range of mass to charge ratios (m/z's) with only a narrow
mass range reaching the detector at a given time. The scan of a mass range of 300 m/z's
requires about 300 ms [Drewnick et al., 2007]. Opposite to this, the HR-ToF mass
spectrometer acquires all m/z's in one ion extraction, which occurse about every 30 µs in
V-mode and ever 50 µs in W-mode. V- and W- mode refer to the flight path of the ions
within the MS. V-mode is a single reflection flight path and W-mode is a triple reflection
flight path of 1.3 m and 2.9 m, respectively [DeCarlo et al., 2006] resulting in a high mass
resolution. The resolving power (RP) of the MS is defined as the ratio of the nominal mass
(m) to the full width of the signal at half maximum (Δm):
m
mRP
Δ= . (2.1)
A resolving power of about 2000 and 4000 is achieved in V-mode and W-mode,
respectively, while the Q-MS achieves a resolving power of about 100 [DeCarlo et al.,

10 Chapter 2: The Aerosol Mass Spectrometer
2006]. Figure 2.2 (taken from [DeCarlo et al., 2006]) shows the mass spectrometric signals
of different AMS types at m/z 43 and m/z 44 in comparison. The resolving power of the
HR-ToF-MS allows a clear separation of individual ions (dotted line V-mode and thin
black line W-mode) in contrast to the signal of the Q-MS (thick black line) as shown in the
inset for m/z 43.
Figure 2.2 Display of the resolving power of different AMS types taken from [DeCarlo et al., 2006].
2.2. Identification of Chemical Compounds in the AMS
Electron impact (EI) ionization is an ionization method that causes fragmentation of
the molecules due to the high energy of the electrons (70 eV), which is significantly higher
than the average ionization energy of molecules like water (12.62 eV). An assignment of
the resulting fragments to parenting ions is possible when the fragmentation pattern of the
ions is know [McLafferty and Turecek, 1993]. This in turn allows for assumptions on the
parenting ion on the basis of the detected fragments. The fragmentation pattern of a
molecule depends not only on the ionization method but on the entire scheme of
molecule/ion production. Though basic patterns are always valid for a specific ionization
method, the fragmentation patterns of individual instruments need to be determined. In the

Chapter 2: The Aerosol Mass Spectrometer 11
case of the AMS, the combination of flash evaporation and EI ionization causes a higher
degree of fragmentation than can be found in standard mass spectrometric data base. Still,
constant instrument performance results in constant fragmentation pattern of the parenting
ions. The total amount of the parenting ion can be determined by investigation of the major
fragments. In contrast to mass spectra obtained with a HR-ToF-AMS, only Unit Mass
Resolution (UMR) mass spectra can be obtained with a Q-AMS. Its limited resolving
power inhibits to resolve the contributions of different species to the signal on a single m/z
(Figure 2.2). This limitation demands for a technique to attribute fractions of the signal to
different species and is achieved by the application of the so called fragmentation table.
The fragmentation table consists of rows representing the m/z's and columns representing
the individual species (Table 2.1).
Table 2.1 Part of the AMS fragmentation table (taken from [Allan et al., 2004]).
Though the concentration of the gas phase is reduced by a factor of 107 within the
aerodynamic lens, significant concentrations of the major gas phase species are still
detected in the AMS. The sum of these species is called Air Beam (AB). Gas phase species
like oxygen and water in the form of relative humidity contribute to the signal on m/z 16.
At the same time, the major fragment of particulate ammonium generated in an AMS is
detected on m/z 16 (NH2+), which can be read from the row corresponding to m/z 16 in the
fragmentation table in Table 2.1. To account for interferences or specific measurement

12 Chapter 2: The Aerosol Mass Spectrometer
conditions the contribution of the individual species needs to be determined. Results of
laboratory experiments on the fragmentation behavior of compounds are used in the case
of particulate interferences. The contribution of gas phase components to the signal on a
specific m/z can be determined by the analysis of particle free air. In general, a particle
filter (e.g. HEPA) is placed into the sampling line to attain particle free air. If in this
particle free air signal on e.g. m/z 16 is taken as a positive or negative mass loading of a
particulate species like ammonium, the contribution of the interfering gas phase species
(here e.g. O16, frag_O16) needs to be corrected.
As discussed in chapter 1, aerosol particles can be composed of a huge variety of
individual substances. Some of the "species" of interest detected in an AMS are water
(H2O), ammonium (NH4), nitrate (NO3), sulfate (SO4), and organic matter (OM) called
organics (Org). Note, that in aerosol and especially the AMS community the notation
deviates from IUPAC suggestions, i.e. molecules like NH4 or NO3 are not presented as
ions but as "species". NO3 detected in the AMS might originate from HNO3, nitrate salts or
organic nitrate. The vaporizing, ionization, and detection scheme does not allow a direct
determination of the origin without further analysis. The major ion fragments of these
substances as they are detected in an AMS are listed in Table 2.2.
Table 2.2 List of species and major detected ion fragments in an AMS. Bold face denotes these ions,which are preferentially used for species detection and further mass determination (taken from[Canagaratna et al., 2007]).
Chapter 2: The Aerosol Mass Spectrometer 13
2.3. Quantification in the AMS
The measured particulate aerosol mass concentration (C) of the AMS [Jimenez et
al., 2003] can be calculated as:
IIEN
MW
QCEC
111
A
= . (2.2)
The average mass concentration (C [µg/m3]) depends on the collection efficiency
(CE, explained in detail at the end of this chapter), the volumetric flow rate (Q [m3/s]) into
the instrument, the average molecular weight (MW [µg/mol]) and ionization efficiency (IE)
of the compounds in the particle, and the ion count rate (I [s-1]) detected in the mass
spectrometer. NA is the Avogadro constant. While CE and IE account for the systematic
error in C, the statistical error is caused by the counting statistics of I. The bulk mass
loading is the sum over the mass loadings of individual components of the aerosol
particles. The mass concentration of a specific compound like nitrate can be written as:
�
=
=46,30A
NO
NONO
3
3
3
111f
fIN
MW
QIECEC . (2.3)
Here, the individual ionization efficiency (IENO3), molecular weight (MWNO3) and
ion counts of the compounds fragments (If) are taken into account. A compound is detected
as fragments on specific m/z's as a result of the vaporization and ionization scheme of the
AMS. Each compound has a specific ionization pattern, which allows the calculation of the
total amount on the basis of the most prominent ions. The most prominent ions of e.g.
nitrate are the NO+ ion on m/z 30 and the NO2+ ion on m/z 46 (Table 2.2).
For quantitative measurements with the AMS the ionization efficiency (IE) needs to
be determined. The IE of the instrument is determined by a calibration with ammonium
nitrate particles [Drewnick et al., 2004; Jayne et al., 2000]. In the standard calibration
procedure dried and size selected ammonium nitrate particles are measured with the AMS
and a condensational particle counter (CPC) in parallel. Taking the bulk density of
ammonium nitrate, the size, and the number of the particles, the total mass of aerosol
particles introduced into the AMS can be calculated. This value is compared to the
detected ion signal of the mass spectrometer. A scaling factor is introduced to link the
amount of molecules introduced into the AMS with the ion count per molecule detected by

14 Chapter 2: The Aerosol Mass Spectrometer
the AMS. The scaling factor, the so called IE, is in general at the order of
10-6 ions/molecule.
The ammonium nitrate calibration allows the determination of the mass of different
compounds as nitrate equivalent mass. The actual mass of the compound of interest can be
determined, when the compounds specific ionization efficiency is known. In practice,
ionization efficiencies relative to the nitrate IENO3 are used. These ionization efficiencies
are called relative ionization efficiencies (RIE). The RIE of NH4 (RIENH4), which is
determined during the standard IE calibration, is generally about 4. I.e., the ionization
efficiency of NH4 is four times higher than the ionization efficiency of nitrate. By
application of the relative ionization efficiency, the absolute amount of a specific
compound can be determined with the AMS. The determination of the RIE for individual
species is an ongoing process in the AMS community. Up to now the RIE of some species
measured by the AMS are still not known. In these cases the RIE is set to 1 and the
detected masses are reported as nitrate equivalent masses.
To assure correct size distribution measurements, the AMS size detection needs to
be calibrated. All calibrations performed for the work presented here were performed with
Polystyrene Latex Spheres (PSL, Duke Scientific Corporation, Palo Alto CA) of different
sizes over the size range of interest, i.e. 8 sizes between 81 nm and 596 nm. Aqueous
solutions of the PSLs were nebulized by a constant output atomizer (TSI 3076), the
produced particles are dried by silica gel and introduced into the AMS. Flight velocities of
the individual PSLs were fitted to their diameter to yield a calibration curve according to
equation (2.4).
b
D
d
vvvv ������
+
−+=
*1
)(
va
lensgaslens
(2.4)
Here, v is the measured flight velocity of the particles, vlens the velocity of the
largest particles, that are transmitted through the lens, vgas the maximal velocity of gas
molecules behind the lens, dva the aerodynamic vacuum diameter of the particles, and D*
and b are fitted coefficients. An example of calibration data and the corresponding fit curve
is given in Figure 2.3. The black line represents the fit curve obtained from size calibration
measurements with PSLs on 28.04.08. The corresponding data is not shown to increase
clarity. Superimposed on the fit curve are calibration data obtained from measurements on
01.05.08 (black upright diamonds), 03.05.08 (green squares), and 08.05.08 (red lying
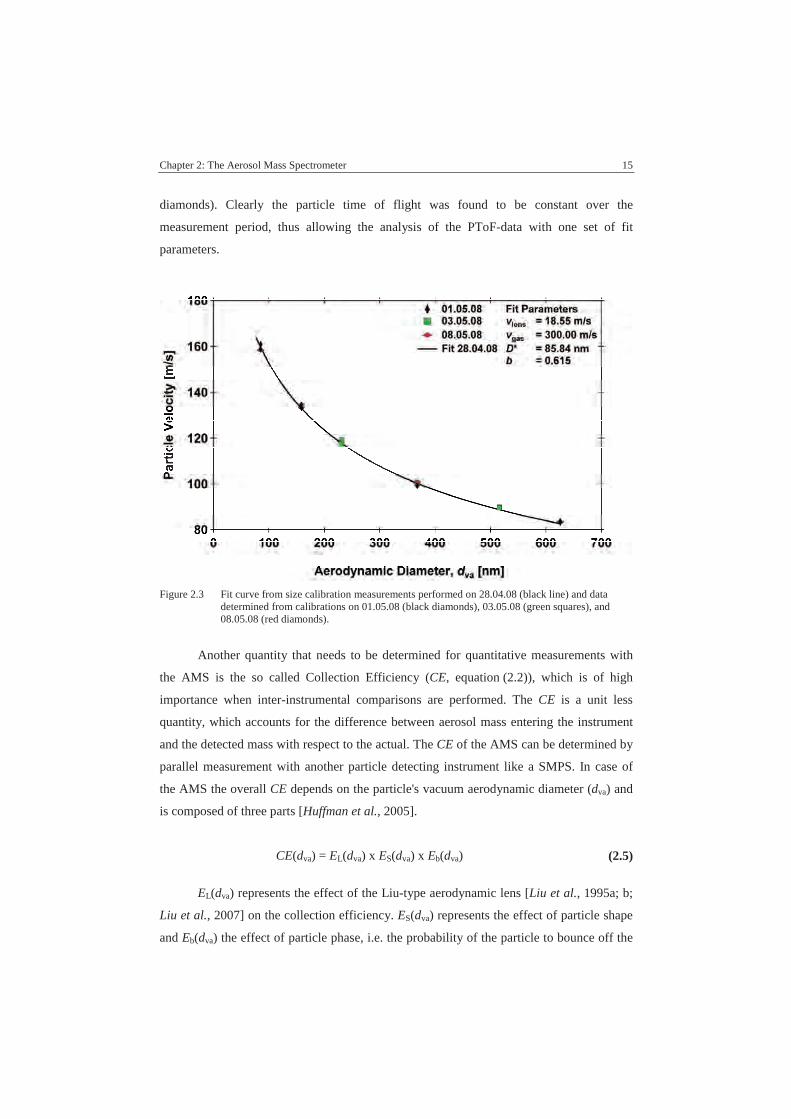
Chapter 2: The Aerosol Mass Spectrometer 15
diamonds). Clearly the particle time of flight was found to be constant over the
measurement period, thus allowing the analysis of the PToF-data with one set of fit
parameters.
Figure 2.3 Fit curve from size calibration measurements performed on 28.04.08 (black line) and datadetermined from calibrations on 01.05.08 (black diamonds), 03.05.08 (green squares), and08.05.08 (red diamonds).
Another quantity that needs to be determined for quantitative measurements with
the AMS is the so called Collection Efficiency (CE, equation (2.2)), which is of high
importance when inter-instrumental comparisons are performed. The CE is a unit less
quantity, which accounts for the difference between aerosol mass entering the instrument
and the detected mass with respect to the actual. The CE of the AMS can be determined by
parallel measurement with another particle detecting instrument like a SMPS. In case of
the AMS the overall CE depends on the particle's vacuum aerodynamic diameter (dva) and
is composed of three parts [Huffman et al., 2005].
CE(dva) = EL(dva) x ES(dva) x Eb(dva) (2.5)
EL(dva) represents the effect of the Liu-type aerodynamic lens [Liu et al., 1995a; b;
Liu et al., 2007] on the collection efficiency. ES(dva) represents the effect of particle shape
and Eb(dva) the effect of particle phase, i.e. the probability of the particle to bounce off the

16 Chapter 2: The Aerosol Mass Spectrometer
vaporizer prior to total evaporation. In practice, the CE is highly sensitive to the physical
state of the particles. While the CE of waxy to liquid particles ranges from 0.9 to 1.0, solid
particles can have a CE of less than 0.25. The physical state of the particles is not only a
question of ambient humidity but also of composition. The investigation of laboratory
generated dried and internally mixed ammonium nitrate and ammonium sulfate aerosol
particles showed changing CE depending on the particle composition [Matthew et al.,
2008]. The CE ranged from 0.3 for pure ammonium sulfate to 1.0 for pure ammonium
nitrate. The CE was constantly around 0.3 for ammonium nitrate mass fractions below
50%. From this point the CE increased constantly with increasing ammonium nitrate ratio
to 1.0.
A CE dependence on particle composition was also found in field measurements
[Crosier et al., 2007; Quinn et al., 2006]. Crosier evaluated the following formula:
582.0NOSO
SO975.0 1
32
4
24 ⋅���
�����+
−= −−
−
CE . (2.6)
Opposite to the laboratory results of constant CE for ammonium sulfate dominated
particles, the CE in Crosier's equation increases constantly from 0.4 for pure ammonium
sulfate to 1.0 for pure ammonium nitrate particles. A constant CE of 0.5 is commonly used
for field measurement datasets [Drewnick et al., 2004; Drewnick et al., 2007; Hogrefe et
al., 2004].
Within the present work, a CE was determined for the field dataset presented in
chapter 5. By comparison of the AMS measurements to the results of a collocated SMPS in
May 2008 a CE dependence on the nitrate concentration of the particles was found.
Chapter 2: The Aerosol Mass Spectrometer 17
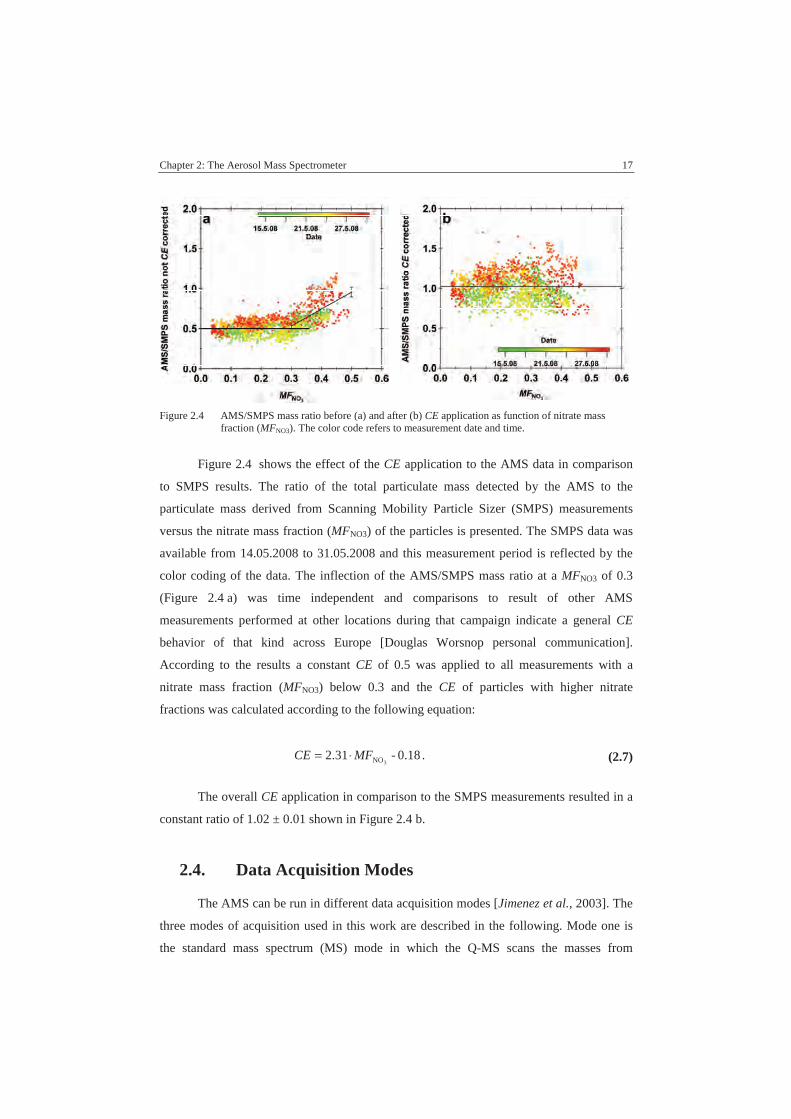
Figure 2.4 AMS/SMPS mass ratio before (a) and after (b) CE application as function of nitrate massfraction (MFNO3). The color code refers to measurement date and time.
Figure 2.4 shows the effect of the CE application to the AMS data in comparison
to SMPS results. The ratio of the total particulate mass detected by the AMS to the
particulate mass derived from Scanning Mobility Particle Sizer (SMPS) measurements
versus the nitrate mass fraction (MFNO3) of the particles is presented. The SMPS data was
available from 14.05.2008 to 31.05.2008 and this measurement period is reflected by the
color coding of the data. The inflection of the AMS/SMPS mass ratio at a MFNO3 of 0.3
(Figure 2.4 a) was time independent and comparisons to result of other AMS
measurements performed at other locations during that campaign indicate a general CE
behavior of that kind across Europe [Douglas Worsnop personal communication].
According to the results a constant CE of 0.5 was applied to all measurements with a
nitrate mass fraction (MFNO3) below 0.3 and the CE of particles with higher nitrate
fractions was calculated according to the following equation:
0.18-2.313NOMFCE ⋅= . (2.7)
The overall CE application in comparison to the SMPS measurements resulted in a
constant ratio of 1.02 ± 0.01 shown in Figure 2.4 b.
2.4. Data Acquisition Modes
The AMS can be run in different data acquisition modes [Jimenez et al., 2003]. The
three modes of acquisition used in this work are described in the following. Mode one is
the standard mass spectrum (MS) mode in which the Q-MS scans the masses from

18 Chapter 2: The Aerosol Mass Spectrometer
1 atomic mass unit (amu) to 300 amu with one amu resolution. As already mentioned in
the beginning of this chapter, the HR-ToF-AMS does not scan the individual m/z's but
acquires an entire mass spectrum at every single ion extraction. The single mass spectra are
averaged over some period of time defined as saving interval. This mode is used to acquire
mass spectra of the bulk aerosol particle phase. The AMS produces two different kinds of
mass spectra, open and closed spectra. The open spectrum reflects the entire aerosol
stream. To record the closed spectrum, a chopper is placed into the aerosol stream,
hindering the particulate phase to be detected. The remaining gas phase and background
contaminations are recorded. By subtracting the closed from the open spectrum, a
differential spectrum excluding possible internal contaminations can be obtained.
The second measurement mode is the Particle Time-of-Flight (PToF) mode. This
mode is used to acquire size resolved data with a detection range spanning from a few
nanometers to about 2000 nm. The detection range allows not only the detection of
particles but also the detection of gas phase molecules, the so called air beam. The size of a
particle is determined by its flight time between entrance into the sizing chamber of the
AMS and detection of molecular fragments in the MS. Size distributions of the major
inorganic particle components ammonium, nitrate, sulfate and chloride as well as all
organic components combined (organics) can be recorded. Opposite to the MS mode, in
which the quadrupole scans the masses in general from m/z 10 to 300, the detected masses
have to be preselected in the PToF mode. The major fragments of the components of
interest are selected, i.e. m/z 30 and m/z 46 for NO3 or m/z 48 and m/z 64 for SO4 (Table
2.2). Again, no selection of individual masses needs to be done in case of the
HR-ToF-AMS, since all masses are detected simultaneously at every single extraction.
The third mode is the Beam Width Probe (BWP) [Huffman et al., 2005]. When a
particle stream exits the aerodynamic lens into the vacuum/particle sizing chamber, it is
focused to a beam of approximately 1 mm. Still, Brownian motion and imperfect focusing
causes the beam to broaden on its way to the vaporizer due to small radial velocity
components. Additional lift forces cause the broadening to be more pronounced for
irregularly shaped particles than for spherical particles [Liu et al., 1995b]. By measuring
the beam divergence the particles non-sphericity can be determined [DeCarlo et al., 2004].
In the BWP a thin vertical wire of 0.5 mm diameter is placed in front of the vaporizer at
different positions. The diameter of the wire is small compared to the diameter of the
vaporizer of 3.8 mm. Still, the wire shields the vaporizer partly as it is placed into the
aerosol stream. It can be precisely placed at different positions. The aerosol stream has a

Chapter 2: The Aerosol Mass Spectrometer 19
radial intensity distribution with its maximum at the center, causing different grades of
reduction in signal intensity depending on the position of the BWP wire. A central position
results in maximum signal reduction of up to 70 % for spherical particles like 350 nm
PSLs.

3. Laboratory Experiment - RIE of Water
The water content of an aerosol particle determines its physical and chemical
properties to a large extent. Nevertheless direct measurements of particulate water are
rarely performed and in many cases indirect measures such as the hygroscopic growth
factor are used to infer a particles ability to take up water and act as cloud condensation
nuclei (CCN). The water content of a particle determines for example the physical state,
i.e. whether a particle is solid or liquid, the refractive index or the potential to act as a
chemical reaction vessel. Regarding the significance of water not only for the particle itself
but also for the particles climate forcing potency, it is desirable to have an option to
directly determine the particle’s water content. In order to be able to do so with an AMS
the RIEH2O, interferences from other compounds, and possible loss processes during
particle sampling need to be quantified.
The experimental determination of the relative ionization efficiency of water
(RIEH2O) in an AMS, which is unknown up to now, will be presented in the following.
Three oxalic acid salts with different thermodynamically stable crystal water contents were
used for the investigation. The selected oxalates are optimal for the purpose of determining
the RIE of water since they have a defined crystal water content that does not evaporate
upon fast pressure reduction [Baxter and Lansing, 2002], thus minimizing the risk of water
being lost during sampling. Furthermore, the oxalate ion has a simple fragmentation
pattern facilitating a good interpretation of the mass spectra and the mass signal of the
oxalate fraction can be used as internal standard. The findings are applied to oxalic acid, an
important substance in the atmosphere [Sun and Ariya, 2006] and a prominent reference
substance in laboratory experiments for CCN research [Koehler et al., 2006].

22 Chapter 3: Laboratory Experiment - RIE of Water
3.1. Set-Up
Figure 3.1 Schematic drawing of the experimental set-up: a) aerosol preparation part, b) aerosolconditioning part and c) aerosol analysis part.
The experiments were conducted under controlled laboratory conditions. A
TSI 3076 constant output atomizer (Figure 3.1 a) was used to produce the aerosol. It was
run with clean filtered synthetic air (Linde, Lipur 6.0), which had a relative humidity (RH)
of less then 0.2 % at room temperature. To allow the freshly produced particles to
coagulate and discharge, the aerosol stream was led into a conditioning unit (Figure 3.1 b).
The conditioning unit was a glass tube with a diameter of 12 cm and a length of 24 cm,
causing a residence time of about 4 min for the aerosol. Next, the aerosol was led into an
expansion/dilution tube from which only parts of the aerosol stream were extracted at a
flow rate of approximately 680 mL/min. For drying purposes, the aerosol stream first
passed through a drying tube filled with silica gel (Sorbsil C Chamaeleo, dried at 100°C)
and then through a Gore-Tex drying tube (Figure 3.1 b). The Gore-Tex was flushed in
counter flow (ca. 600 mL/min) with clean and filtered dry synthetic air (RH < 0.2 %). The
RH of the aerosol stream was monitored by a HMP235 Vaisala and never exceeded 0.2 %
at the inlet of the analyzing instruments. Stainless steel tubing of 6 mm inner diameter was
used to connect the individual parts of the experimental set-up.
The analytical instrumentation consisted of a Condensational Particle Counter
(CPC, TSI 3022A), a Scanning Mobility Particle Sizer (SMPS, TSI 3071) and an Aerodyne
Quadrupole Aerosol Mass Spectrometer (Q-AMS, [Jayne et al., 2000], Figure 3.1 c). The
aerosol particle concentration was measured with the CPC at a flow rate of 300 mL/min.
The particle size distribution was measured by the SMPS at an aerosol flow rate of
Chapter 3: Laboratory Experiment - RIE of Water 23
300 mL/min and a sheath flow of 3 L/min in these experiments. An additional Differential
Mobility Analyzer (DMA 3071) was used to size select oxalate particles in some
experiments. The chemical composition of the aerosol particles was measured by the
Q-AMS. The Q-AMS was run at an aerosol flow rate of 80 mL/min. The standard saving
interval for all experiments was 5 min.
3.2. Materials and Methods
The salts used to investigate the relative ionization efficiency of water (RIEH2O) in
an Q-AMS were sodium oxalate (Na2(CO2)2, NaOx), potassium oxalate (K2(CO2)2•1H2O,
KOx) and ammonium oxalate ((NH4)2(CO2)2•1H2O, AmOx). Oxalic acid (H2(CO2)2•2H2O,
OxAc) was used to apply our findings. All salts were bought from Merck in a purity grade
of “puriss. p.a.” � 99.9 %. Aqueous solutions of different concentrations were produced in
measuring cylinders (1 L, Schott).
MilliQ water of a resistance of 18.2 MΩ and a total organic carbon content (toc) of
4-10 ppb was produced in a Millipore apparatus (Gradient A10). The apparatus was fed
with high grade de-ionized water. It was observed that the toc level within the pure water
and the particle concentration after nebulizing pure water could be significantly reduced, if
the UV lamp was allowed to run for at least 30 min prior to water withdrawal. Therefore,
the UV lamp was lit approximately 1 hour before water withdrawal. All containers were
rinsed three times with the solution/water supposed to be stored in there before actual
filling.
Each investigation of a single oxalate consisted of two experimental parts. The
properties of the background were determined in the first experimental part. The
background was defined as mass spectrometric signals originating from the gas phase or
particulate impurities. The particulate impurities might be taken up by the clean air by
passing through the experimental set-up or by nebulizing the pure MilliQ water. The first
experimental part itself consisted of three steps. First step was the investigation of the
synthetic air straight from the source. No particulate contaminations could be detected.
Second step was the investigation of the air after passing through the entire aerosol
preparation system (part a and b in Figure 3.1). Less then 100 particles/cm³ were recorded
in these measurements. Third step was the investigation of the aerosol produced by
atomizing the pure water, which was used do prepare the actual oxalate solution of interest.
The particle concentration and size distribution measurements performed by the SMPS
24 Chapter 3: Laboratory Experiment - RIE of Water
determined a particle concentration of 104 to 105 particles/cm3 originating from nebulizing
pure MilliQ water. All particles were in the size range below 100 nm and the mode
diameter was below 14 nm. Since the mode diameter was significantly above 100 nm in all
oxalate experiments, contaminations arising from the MilliQ water or the instrumental
setup and the background contamination could be neglected in the further analysis.
The second experimental part was the actual analysis of the oxalate particles. The
particles shape and compositions were investigated. The Q-AMS was run in the three
different data acquisition modes discussed above (chapter 2.4.) First, mass spectra of the
entire size distribution were recorded for approximately one hour. Q-AMS saving intervals
were 5 min, CPC saving intervals 10 sec and the SMPS recorded the size distribution from
14 nm to 560 nm within 5 min. The CPC and the SMPS were run in parallel to the Q-AMS
during all experimental parts. Second, the BWP mode was run to get insights to the particle
shape. The wire passed through 7 equidistant positions. In-stream positions were alternated
with the out-of-stream starting position. An entire cycle had a duration of 65 min. Five to
seven complete cycles were run for each oxalate. Third, PToF measurements of particles
were performed. The size resolved measurements were used to derive aerosol particle
densities from combined Q-AMS and SMPS measurements.
The mass determination of individual components takes place by application of a
fragmentation wave table ([Allan et al., 2004], see chapter 2.2). Several inorganic species,
gas phase components, and organics are considered. The fragmentation wave table is based
on the fragmentation pattern of the individual species. In our case water, ammonium, and
organic were the compounds of interest. The ammonium ion yields ion signal on the mass
to charge ratios (m/z) 15, 16 and 17. The major fragment is detected on m/z 16. The
contribution of ammonium to the signals on m/z 15 and 17 is determined relative to the
signal intensity on m/z 16. The water molecule yields ion signal on the mass to charge
ratios 16 to 20, with the major signal on m/z 18. The contribution to the other m/z's is
determined relative to the major ion signal. Though ammonium and water contribute partly
to the total signal on the mass to charge ratios 16 and 17, the two compounds can be
separated by the fact of their different major ions and fragmentation patterns. The defined
composition and known fragmentation pattern of inorganic species result in a limited
amount of ions contributing to the signal on a well known number of mass to charge ratios.
The fragmentation wave table was adapted to the specific object of investigation.
The details of this adaptation will be given in chapter 3.3.2.

Chapter 3: Laboratory Experiment - RIE of Water 25
3.3. Results
3.3.1. Physical Properties
The physical properties of the oxalate particles were determined to assure that the
investigated particles were dry and probably in their thermodynamically stable state and
therefore contain the expected amount of crystal water. The particles shapes and densities
were used as evidences.
It was important to assure that the particles were absolutely dry under the
experimental conditions. Though the RH of the overall aerosol stream was below 0.2 %
right at the entrance of the Q-AMS, the particles might have enclosed some residual water.
If residual water was left in the particles, the detected water amount would not solely
depend on the crystal water content of the individual oxalates. Additionally, the particles
could keep the spherical shape of the original solution droplets, when their efflorescence is
hindered by residual water. As mentioned in chapter 2.4 and 3.1, the BWP is a tool to
investigate the shape of aerosol particles.
Figure 3.2: Beam Width Probe results for the organic fraction of oxalate particles (colored lines) and NO3of NH4NO3 (grey line). Shown is the measured signal intensity as a function of wire position(4 = center position).

26 Chapter 3: Laboratory Experiment - RIE of Water
The measured signal intensity as function of wire position for the organic fraction
of the four oxalates (colored lines) and the nitrate fraction of NH4NO3 (grey line) is shown
in Figure 3.2. The lines represent the Gaussian fit curves determined from the
measurements on 7 equidistant wire positions labeled on the x-axis. The single data points
are not presented for increased clarity. The full width at half maximum (FWHM) gives
information on the spericity of the particles. As can be seen, the fit curves representing the
organic fraction of the oxalates are very similar but much broader than the fit curve of the
nitrate signal detected for NH4NO3. Ammonium nitrate was chosen as reference since it is
a well known AMS calibration substance that encounters a high degree of detectability and
focusability [Jayne et al., 2000]. The broad distribution of the oxalate signal with
significant contribution at wire positions close to the edge of the vaporizer, indicates that
the oxalate particles were not well focused to a narrow beam due to their shape i.e., the
particles were not spherical. This in turn is evidence, that the particles were dry. Note, that
the shift of minima position along the x-axis is not of scientific significance concerning the
shape of particles and is therefore not further discussed.
Particle density was measured to further support that the investigated particles were
in their thermodynamically stable state. The effective density (ρeff) of aerosol particles can
be determined by parallel measurement of the particle size with an AMS and an SMPS
[DeCarlo et al., 2004]:
0m
vaeff ρρ
d
d= . (3.1)
The AMS determines the condensed phase mass and the aerodynamic diameter
(dva) of the particles. In contrast, the SMPS determines the condensed phase volume and
the mobility diameter (dm) of the particles. The ratio of these two diameters multiplied with
unity density (ρ0) yields the effective density of the aerosol particles (ρeff). Since dva is not
only a function of particle size but also of particle morphology, ρeff might differ from the
bulk components density if the particle is irregularly shaped or bears internal voids. For the
four oxalates investigated the densities determined by equation (3.1) were compared to the
bulk densities.

Chapter 3: Laboratory Experiment - RIE of Water 27
Table 3.1: a) Effective densities from combined SMPS (dm) and AMS (dva) measurements. b) Measuredmass ratios of water to organics and ammonium to organics (chapter 3.3.2). c) Chemicalformulas of the substances.
a) Density [g/cm3] b) Ratio MeasuredOxalate
Lit* Our Data � Δ [%] H2O/Org NH4/Orgc) Formula
NaOx 2.34 2.13 -9 -- -- Na2C2O4
KOx 2.13 2.12 -0.5 0.20 -- K2C2O4 • 1 H2O
AmOx 1.50 1.23 -18 0.20 0.39 (NH4)2C2O4 • 1 H2O
OxAc 1.65 1.78 +8 0.16 0.09 H2C2O4 • 2 H2O
*[Lide, 2009], � In density determinations of dried ammonium sulfate particles of different sizes performedaccording to the routine presented here, a maximal error of 6 % was found [Reimer, 2007].
The results of the density measurements are given in Table 3.1. Comparison to the
literature data [Lide, 2009] show the largest discrepancy of 18 % for AmOx. The lowest
discrepancy of only 0.5 % is found for KOx. NaOx shows a discrepancy of 9 %. Since the
RH of the aerosol stream was below 0.2 % the particles were believed to be dry and the
slightly reduced measured densities to originate either from the non-sphericity of the
particles already determined by the BWP. The oxalates under investigation have
orthorhombic or monoclinic crystal lattices where either the largest lattice constant is about
twice the other two or two lattice constants are about twice as large as the smallest one
[Ahmed and Cruickshank, 1953; Jeffrey and Parry, 1954; Mielniczek-Brzóska and
Sangwal, 1995]. This enables prolate crystals or oblate structures, respectively, both with
shape factors of about 1.1 [Johnson et al., 1987]. On the other hand, we must state that the
median deviation of 9 % with respect to the bulk densities is within the uncertainties of this
kind of density measurements.
However, the effective density determined for OxAc is higher than the literature
value which cannot be explained by the shape factor mentioned above. This topic will be
discussed in more detail in chapter 3.3.3.

28 Chapter 3: Laboratory Experiment - RIE of Water
3.3.2. Water Content of Oxalate Particles
Figure 3.3 Mass spectra and detected mass loadings for (a) sodium oxalate, (b) potassium oxalate, (c)ammonium oxalate and (d) oxalic acid.
Figure 3.3 a to d show the mass spectra of the investigated oxalates at a vaporizer
temperature of 600°C. The color coding in the mass spectra reflects the contribution of
different components to the signal intensity at the individual mass to charge ratios (m/z).
Organics are green, ammonium is orange and water is blue. The spectra are normalized to
the organic signal at m/z 44.
Sodium oxalate (Figure 3.3 a) contains no crystal water so no particulate water
should be detected by the AMS (Table 3.1). The standard fragmentation wave table
assumes a relative humidity of about 60 % and denotes an according contribution of gas
phase water to the detected background gas phase. Due to the measured RH of less than
0.2 % in these experiments, the air fragmentation wave had to be adjusted to yield zero
detectable gas phase water. Since no inorganic compound beside sodium is supposed to be

Chapter 3: Laboratory Experiment - RIE of Water 29
part of the aerosol particles, the organic fragmentation wave was adjusted. All signals
beside the ones for water and ammonium were attributed to organics.
In contrast to compounds like organics, ammonium, and water, which can be
detected at the standard AMS operating temperature of approximately 600 °C, sodium can
only be detected at higher operating temperatures of approximately 900 °C. At
temperatures above 700 °C the oven material starts to vaporize. The oven is composed of
tungsten and several other metals including sodium and potassium. As a result the detected
sodium mass is a mixture of particle and oven material. Consequently, sodium can not be
easily detected quantitatively in an AMS. Thus, sodium oxalate contains no internal
standard. Nevertheless, it provides a measure to create a fragmentation wave for the
organics signal to be expected for oxalates.
Potassium oxalate (Figure 3.3 b) contains one unit of crystal water per molecular
unit. The data from these measurements will be used to determine the relative ionization
efficiency of water (RIEH2O). RIEH2O quantifies the difference of the ionization efficiency
of water compared to the ionization efficiency of nitrate (IENO3, chapter 2.3). For a
quantification of the water content of particles both RIEH2O and IENO3 need to be taken into
account as shown in equation (3.2):
�
=
=18A
OH
NOOHOH
2
32
2
1111f
fIN
MW
QCEIERIEC . (3.2)
Based on the chemical structure of potassium oxalate the molar mass ratio of water
to organic is MW(H2O)/MW(Ox) = 0.20. The application of the new fragmentation wave
table generated for sodium oxalate yields a detected water to organic mass ratio of 0.4
when no RIEH2O is applied. Therefore, the RIEH2O is determined to be 2. The new RIEH2O
will be applied to all upcoming analysis. As in the case of sodium, potassium cannot be
used as internal standard.
Ammonium oxalate like potassium oxalate contains one unit of crystal water per
molecular unit. Ammonium and water were clearly detected and separated by the Q-AMS
(Figure 3.3 c). The molar mass ratio of water to organic is MW(H2O)/MW(Ox) = 0.20 and
the molar mass ratio of ammonium to organic is 2xMW(NH4)/MW(Ox) = 0.41. The
detected molar mass ratio of water to organic is 0.20 and of ammonium to organic is 0.39
when the optimized fragmentation wave table and the new RIEH2O are applied.
The substance used to apply our findings from the oxalate salts was oxalic acid.
One mol of oxalic acid contains two moles of crystal water. Figure 3.3 d shows the mass

30 Chapter 3: Laboratory Experiment - RIE of Water
spectrum of oxalic acid. A molar mass ratio of water to organics of only 0.16 is determined
instead of the expected ratio of 0.41. Additionally, a significant amount of ammonium is
detected. Since the adjusted fragmentation wave table worked well for the three oxalate
salts, the detected ammonium signal might arise from a contamination of the oxalic acid.
This point is further examined in the upcoming sections.
Figure 3.4. Data and fit curves of the correlation of water and ammonium to organic in (a) sodium oxalate,(b) potassium oxalate, (c) ammonium oxalate and (d) oxalic acid normalized to the maximumorganic mass.
Figure 3.4 a to d show the ratio of water and ammonium, respectively, to organics.
Organics, ammonium, and water mass loadings were divided by the maximal organics
mass loading in each experiment to normalize the date and simplify the reading of the
ratios. Additionally, linear fit curves through the data are included as guidance of the eye.
The data is normalized to the maximum organic mass to investigate, if the ratio depends is
mass loading dependent.
Chapter 3: Laboratory Experiment - RIE of Water 31
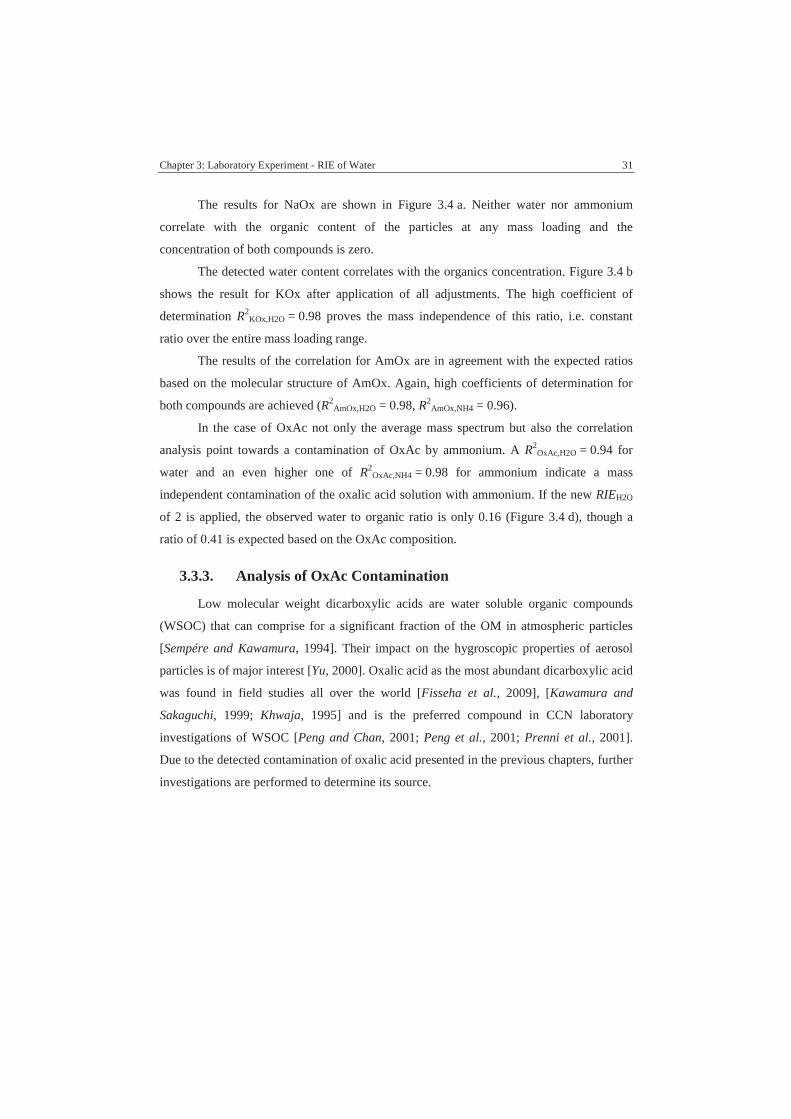
The results for NaOx are shown in Figure 3.4 a. Neither water nor ammonium
correlate with the organic content of the particles at any mass loading and the
concentration of both compounds is zero.
The detected water content correlates with the organics concentration. Figure 3.4 b
shows the result for KOx after application of all adjustments. The high coefficient of
determination R2KOx,H2O = 0.98 proves the mass independence of this ratio, i.e. constant
ratio over the entire mass loading range.
The results of the correlation for AmOx are in agreement with the expected ratios
based on the molecular structure of AmOx. Again, high coefficients of determination for
both compounds are achieved (R2AmOx,H2O = 0.98, R2
AmOx,NH4 = 0.96).
In the case of OxAc not only the average mass spectrum but also the correlation
analysis point towards a contamination of OxAc by ammonium. A R2OxAc,H2O = 0.94 for
water and an even higher one of R2OxAc,NH4 = 0.98 for ammonium indicate a mass
independent contamination of the oxalic acid solution with ammonium. If the new RIEH2O
of 2 is applied, the observed water to organic ratio is only 0.16 (Figure 3.4 d), though a
ratio of 0.41 is expected based on the OxAc composition.
3.3.3. Analysis of OxAc Contamination
Low molecular weight dicarboxylic acids are water soluble organic compounds
(WSOC) that can comprise for a significant fraction of the OM in atmospheric particles
[Sempére and Kawamura, 1994]. Their impact on the hygroscopic properties of aerosol
particles is of major interest [Yu, 2000]. Oxalic acid as the most abundant dicarboxylic acid
was found in field studies all over the world [Fisseha et al., 2009], [Kawamura and
Sakaguchi, 1999; Khwaja, 1995] and is the preferred compound in CCN laboratory
investigations of WSOC [Peng and Chan, 2001; Peng et al., 2001; Prenni et al., 2001].
Due to the detected contamination of oxalic acid presented in the previous chapters, further
investigations are performed to determine its source.

32 Chapter 3: Laboratory Experiment - RIE of Water
Figure 3.5. Size resolved particle composition of oxalic acid.
Figure 3.5 shows the average mass distribution of water, ammonium and organic of
OxAc. The distributions of these three compounds are similar, peaking at the same vacuum
aerodynamic particle diameter (134 nm). That means the signals of the different
components originate from internally mixed aerosol particles. This finding supports the
assumption of an ammonium contamination of OxAc.
The average mass spectrum, the mass dependent analysis, and the size resolved
measurements all indicate a contamination of OxAc with ammonium. The Q-MS has the
ability to scan a wide range of mass to charge ratios in one amu resolution. Therefore, it is
not possible to separate ammonium and water directly with the quadrupole AMS used in
the preceding analysis.
A High-Resolution Time-of-Flight Aerosol Mass Spectrometer (Aerodyne HR-ToF
AMS [Canagaratna et al., 2007; Drewnick et al., 2005]) was used to get further insights to
the exact loadings of water, ammonium and organics in OxAc. The overall set-up of the
HR-ToF AMS is identical to the set-up of the Q-AMS. The major difference is the
employed mass spectrometer with a resolving power of up to 4000. The HR-ToF AMS
allows a clear separation of the ammonium and water signals at the according m/z's (Figure
3.6). Shown are the high resolution mass spectra of OxAc (lower panel) and AmOx (upper
panel) for comparison.

Chapter 3: Laboratory Experiment - RIE of Water 33
Figure 3.6: High resolution analysis of oxalic acid (lower panel) and ammonium oxalate (upper panel).
A series of experiments shows that even OxAc solutions produced with OxAc
taken from factory sealed containers can be contaminated with ammonium. The
ammonium contamination increases for both, solid OxAc and OxAc solution after storage
for about 1 day in screw cap containers. This means that even the OxAc salt itself absorbs
ammonium from the air and partly implements it into its molecular structure, resulting in a
molecular mixture of AmOx and OxAc.
Since OxAc implements ammonium from air by unknown processes, the exact
composition of different OxAc solutions will differ, depending on the degree of
contamination. In our case presented here, an ammonium to oxalate mass ratio of 0.09 and
a water to oxalate mass ratio of 0.16 were determined. Assuming a mixture of pure
ammonium oxalate and oxalic acid, different rough calculations on the basis of ammonium
and water, respectively can be performed to determine the contribution of each compound.
Calculations on the basis of ammonium would result in a 22.5 % contribution of
AmOx to the investigated OxAc aerosol particles. Consequently, 77.5 % of the aerosol
particles should be OxAc. This assumption would result in a water to organic mass ratio of
0.35, which is about double the amount actually detected.
If the detected water to organic mass ratio is taken as basis for the composition
calculations, only 28.75 % of the aerosol particles should originate from OxAc, which in
turn demands an ammonium to organic mass ratio of 0.29. This value is more than three
times higher than the detected ammonium ratio.

34 Chapter 3: Laboratory Experiment - RIE of Water
Both calculations point towards a significant water deficit in the investigated
aerosol particles. Hence, a mixture of OxAc and AmOx side by side is very unlikely. An
explanation for the water deficit can be a ternary mixture of AmOx, the standard di-
hydrated OxAc and a crystal water-free OxAc modification. Based on the ammonium and
water abundance in the investigated OxAc particles, about 25 % would be AmOx, another
25 % would be the standard OxAc and the remaining 50 % would be the water-free OxAc
modification. The water-free OxAc modification has a bulk density of 1.9 g/cm3 [Lide,
2009], which is higher than the density of AmOx (1.50 g/cm3) and OxAc (1.65 g/cm3).
This approach would also explain the high measured effective density of 1.78 g/cm3 for
OxAc particles presented in chapter 3.3.1 The integration of gas phase ammonium or
ammonia into the OxAc crystal or solution seems to result in a complex mixed crystal
system which potentially will influence the particles ability to take up water and act as
CCN.
3.4. Summary and Conclusions
Oxalic acid and three of its salts were analyzed with a Quadrupole Aerosol Mass
Spectrometer to determine the relative ionization efficiency (RIE) of water within this kind
of instrument. Knowledge of the RIE is the basis for the quantitative determination of a
particulate phase species. Due to their simple fragmentation pattern and their defined
crystal water content, the sodium, potassium and ammonium salts of oxalate served as
ideal substances to investigate this topic. Combined size and mass resolved measurements
were performed to determine the effective density of the different aerosol particles,
complying with the bulk densities of the substances within 9 %. The aerosol beam
divergence was used to investigate the particles morphology. The results confirmed that
the particles shape deviated significantly from spheres and in combination with the
measured relative humidity of the overall aerosol stream, which was below 0.2 %, dry
crystalline particles were assumed in further investigations on.
The RIE of particulate water in an AMS was found to be 2. This finding was
consistent for the two crystal water containing oxalate salts. The new RIEH2O can always be
applied to the detected water signal, since the detection after vaporization and the
fragmentation of the water ion is source independent [Allan et al., 2004]. The analysis of
oxalic acid revealed a significant contamination of the solid acid as well as its solutions
with ammonium incorporated from the gas phase. Application of the new RIEH2O resulted
in a water deficit within the molecular structure of the oxalic acid aerosol particles. The

Chapter 3: Laboratory Experiment - RIE of Water 35
detected water deficit leads to the assumption that a complex mixed crystal system of
oxalic acid and ammonium oxalate is formed as soon as oxalic acid is exposed to
ammonium or ammonia containing air. Extraordinary diligence in the handling of oxalic
acid is required to assure the investigation of pure oxalic acid. The processes leading to the
contamination of oxalic acid with ammonium and the degree of contamination depending
on the experimental conditions need to be investigated in the future.
For an accurate determination of the water content of atmospheric aerosol particles
with an AMS the loss processes in the aerodynamic lens and interferences form other
substances must be known and are a topic of further investigations. Still, the knowledge of
the correct RIEH2O is already essential for the investigation of the two open questions
mentioned above. The new RIEH2O will be applied to field measurement data presented in
chapter 5.


4. Chamber Study - Organic Nitrate Detection in
an AMS
The reaction scheme of BVOC + anthropogenic associated NO3 is another
important building block on the way to fully understand secondary organic aerosol (SOA)
formation. While gas phase and particulate SOA is dominated by biogenic carbon, SOA
formation can be strongly correlated to anthropogenic tracers such as NOx [Finlayson-Pitts
and Pitts, 2000]. The contribution of fossil and contemporary carbon to the organic and
total carbon budget of aerosols can be determined by radiocarbon analysis (14C) [Weber et
al., 2007]. The fossil carbon fraction originating from anthropogenic use of fossil energy
sources such as fuel, coal, and gas is depleted in the heavy 14C isotope compared to
contemporary carbon originating from biogenic sources. The contribution of fossil carbon
to the total carbon budget can be as low as 0 % in remote areas in the summer time and
range up to 50 % in urban areas in the winter time [Schichtel et al., 2008; Weber et al.,
2007]. The oxidation of mainly anthropogenic produced NO2 with O3 leads to NO3, hence
NO3 can be considered as anthropogenic oxidant. The NO3 oxidation of VOCs is a
dominant oxidation and SOA formation pathway in night time chemistry. NO3 causes an
even shorter live time of e.g. β-pinene than OH radicals during day time due to its high
average concentration in the night time of about 10 ppt [Geyer et al., 2003] and usually
larger rate coefficients with BVOC. Kanakidou et al. [Kanakidou et al., 2005] report a
significant gap between measured and modeled global particulate SOA concentrations. The
above biogenic - anthropogenic cross reaction might contribute to the closure of that gap
but even more explain the high modern carbon content of aerosols and the correlation with
anthropogenic tracers.
The connecting link between isolated laboratory experiments and complex field
measurements are simulation chamber studies. Laboratory experiment results can be
investigated in an up-scaled but controlled environment. Depending on the chamber
facilities, conditions close to the real atmosphere in terms of oxidants, VOCs, and particle
concentrations can be achieved. Some chambers even allow the investigation of aging
processes over several days. The closed and controlled environment reduces the
complexity significantly compared to field studies. The type of reactions, the reactivity, the
speed, and the degree of the reaction processes can be controlled to a certain level by
setting the experimental parameters. Still, not all reactions, pathways, and results that have

38 Chapter 4: Chamber Study - Organic Nitrate Detection in an AMS
been observed in chamber studies so far are fully understood. In other words, the boundary
conditions/sources and sinks are known and set, but chamber studies results still reveal an
enormous complexity. They are a tool for atmospheric investigation combining an up-
scaled laboratory experiment and down-scaled field measurements at the same time.
4.1. SAPHIR
The SAPHIR (Simulation of Atmospheric PHoto chemistry In a large Reaction
chamber) chamber is an atmospheric simulation chamber, located at the
Forschungszentrum Jülich ICG-2. It is a large flourine-ethene-propene (FEP) bag of
cylindrical shape with a diameter of 5 m and a length of 18 m resulting in a volume of
about 270 m3 (Figure 4.1). The FEP foil has about 85 % light transmission for visible,
UV-A and UV-B light so that photolytic production or degradation of substances can be
investigated. The chamber is equipped with movable blinds, which can be closed to
simulate night time conditions and opened to simulate daytime chemistry including OH
radical formation and oxidation. The chamber is operated with high purity (6.0) synthetic
air, which allows VOC and oxidants concentration to be as low as a few ppb or even down
to ppt concentrations. Its size and the fact that real sunlight can be used for the reactions
generate an environment very close to boundary layer of the troposphere.
Figure 4.1 SAPHIR chamber
The chamber is equipped with a wide range of field proven instruments to measure
gas and particulate phase components. The instruments of interest in the discussed

Chapter 4: Chamber Study - Organic Nitrate Detection in an AMS 39
experiments are presented in chapter 4.2. Further details on the chamber are given by
[Schlosser et al., 2007].
The SAPHIR chamber was the venue of the ACCENT (Atmospheric Composition
Change - The European Network of Excellence) NO3-N2O5 intercomparison workshop in
summer 2007. The main idea of this workshop was to compare ten different instruments
for NO3 and/or N2O5 measurement facilitating different measurement techniques [Dorn et
al., 2009; Fuchs et al., 2009]. A lot of other interesting topics could be investigated within
that framework. SOA formation from the reaction of BVOC with NO3 was investigated
[Fry et al., 2009; Rollins et al., 2009] and the mass spectrometric results will be presented
in the following.
4.2. Experiments
The NO3 oxidation of isoprene, limonene and β-pinene (Table 4.1) was investigated
during the ACCENT NO3-N2O5 inter-comparison workshop. Isoprene is the most abundant
non-methane BVOC in the atmosphere with a production rate of about 550 Tg C/a.
[Guenther et al., 2006]. Therefore isoprene comprises almost 50 % of the total global
non-methane BVOC (~1150 Tg C/a) [Guenther et al., 1995]. Limonene and β-pinene are
among the most abundant BVOC within the group of monoterpenes, which account for
about 11 % of the non-methane BVOCs. Furthermore, both limonene and b-pinene are
fully described by the Master Chemical Mechanism (MCM v3, [Saunders et al., 2003])
allowing for a good comparison of the experimental results with theory.
Table 4.1 Molecular structure of limonene, isoprene, and β-pinene.
isoprene limonene β-pinene
The production and composition of particulate SOA was investigated in 4 separate
experiments while the concentration of several gas phase components was monitored. Gas

40 Chapter 4: Chamber Study - Organic Nitrate Detection in an AMS
phase NO3 concentrations presented here were measured by a Pulsed Cavity Ring-Down
Spectrometer (PulsedCRDS, [Dubé et al., 2006]). Since, this campaign was aimed to
compare different NO3/N2O5 instruments and measurement techniques, NO3 concentration
was determined by several instrument. The results of the individual instruments agreed
well [Dorn et al., 2009]. O3 and VOC concentrations were also measured by more than one
instrument, and again the results agreed well. Therefore, only these instruments, which
data was used for the upcoming analysis are presented here. The O3 concentration was
measured by chemiluminescence (ECO Physics CLD AL 700, [Ridley et al., 1992]) and
the VOC concentrations were measured by Proton Transfer Reaction Mass Spectrometry
(PTR-MS, [Lindinger et al., 1998]). The total gas and particulate phase alkyl nitrate
concentration was determined by NO2-Thermal Dissociation - Laser Induced Fluorescence
(NO2-TD-LIF, [Day et al., 2002; Day et al., 2009]) by detection of NO2 from the stepwise
dissociation of peroxynitrates, alkyl and multifunctional nitrates, and nitric acid. The
NO2-TD-LIF is equipped with four ovens operating at different temperatures (ambient
temperature, 180 °C, 350 °C and 600 °C). Total dissociation of gaseous and semivolatile
aerosol phase nitrates is expected [Fry et al., 2009]. Aerosol particle properties were
measured by an SMPS, a CPC, and a High-Resolution Time of Flight Aerosol Mass
Spectrometer (HR-ToF AMS) [Canagaratna et al., 2007; Jayne et al., 2000].
The NO3 oxidation of the three BVOCs was performed in four separate experiments
(see Table 4.2 for details). One experiment was the oxidation of limonene under dry
condition with two BVOC additions. The particles generated during the first limonene
oxidation served as organic seed particles when limonene was added 8.5 h after the first
injection. The same holds for the isoprene experiment, since isoprene was also added twice
with more then 8.5 h between both injections. Additionally, (NH4)2SO4 seed aerosol
particles were introduced into the chamber 54 min before the first isoprene injection. The
relative humidity was set to 57 % for this experiment. Two β-pinene experiments were
performed; one in dry conditions and one at 50 % RH. β-pinene was only added once in
both experiments and no inorganic seed particles were used. The actual oxidant NO3 was
produced according to equation (1.1 a). In case of a NO3 depletion, N2O5 decomposes and
serves as an additional NO3 source (equation (1.1 b)). The detailed list of BVOC and
oxidant additions for the four experiments is given in Table 4.2 a) to d).
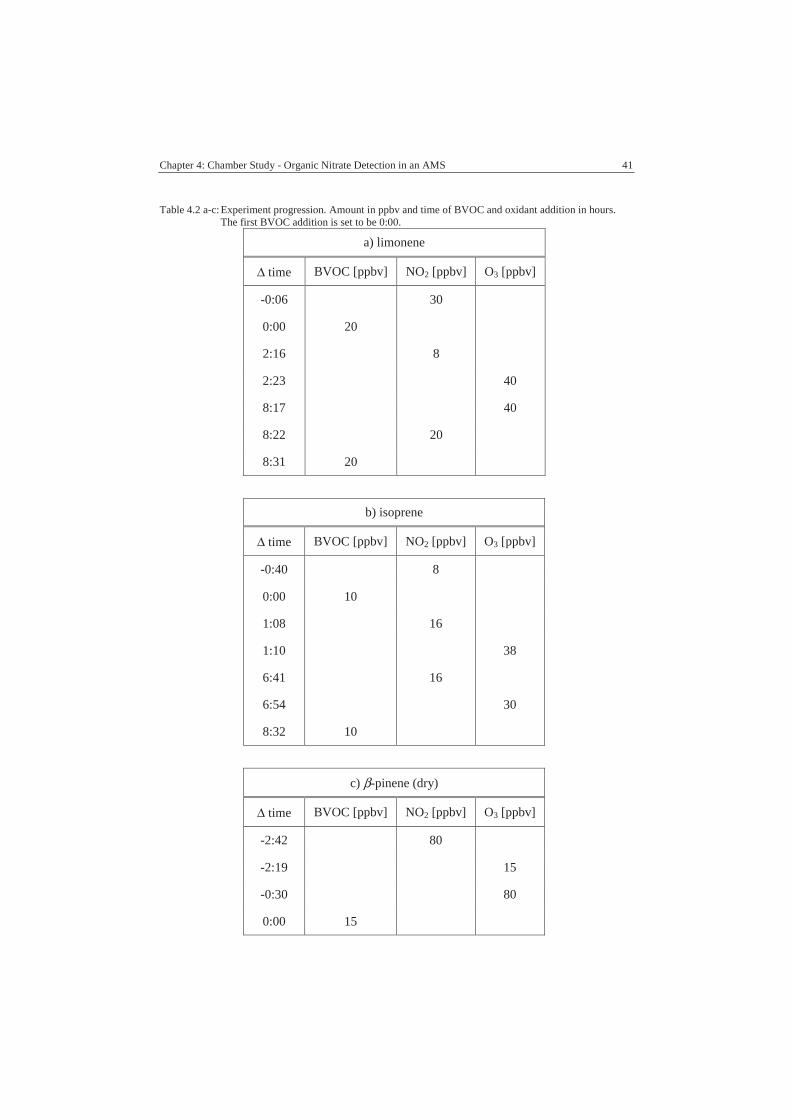
Chapter 4: Chamber Study - Organic Nitrate Detection in an AMS 41
Table 4.2 a-c:Experiment progression. Amount in ppbv and time of BVOC and oxidant addition in hours.The first BVOC addition is set to be 0:00.
a) limonene
Δ time BVOC [ppbv] NO2 [ppbv] O3 [ppbv]
-0:06 30
0:00 20
2:16 8
2:23 40
8:17 40
8:22 20
8:31 20
b) isoprene
Δ time BVOC [ppbv] NO2 [ppbv] O3 [ppbv]
-0:40 8
0:00 10
1:08 16
1:10 38
6:41 16
6:54 30
8:32 10
c) β-pinene (dry)
Δ time BVOC [ppbv] NO2 [ppbv] O3 [ppbv]
-2:42 80
-2:19 15
-0:30 80
0:00 15
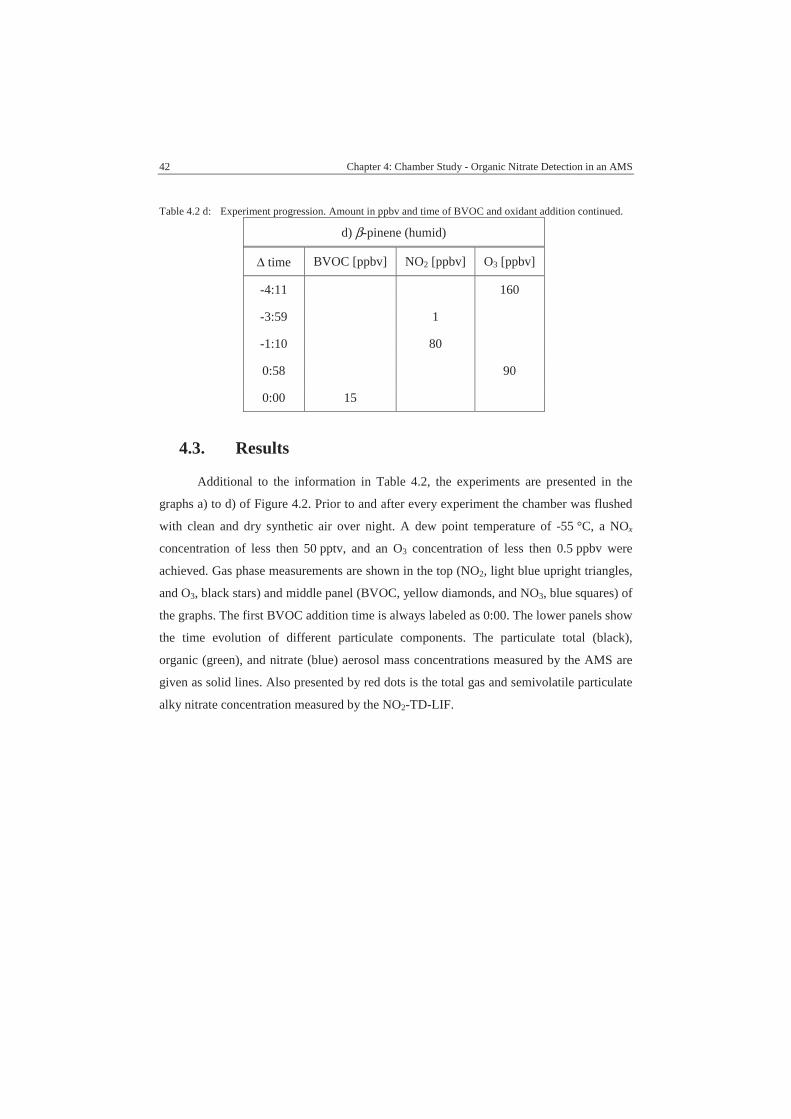
42 Chapter 4: Chamber Study - Organic Nitrate Detection in an AMS
Table 4.2 d: Experiment progression. Amount in ppbv and time of BVOC and oxidant addition continued.
d) β-pinene (humid)
Δ time BVOC [ppbv] NO2 [ppbv] O3 [ppbv]
-4:11 160
-3:59 1
-1:10 80
0:58 90
0:00 15
4.3. Results
Additional to the information in Table 4.2, the experiments are presented in the
graphs a) to d) of Figure 4.2. Prior to and after every experiment the chamber was flushed
with clean and dry synthetic air over night. A dew point temperature of -55 °C, a NOx
concentration of less then 50 pptv, and an O3 concentration of less then 0.5 ppbv were
achieved. Gas phase measurements are shown in the top (NO2, light blue upright triangles,
and O3, black stars) and middle panel (BVOC, yellow diamonds, and NO3, blue squares) of
the graphs. The first BVOC addition time is always labeled as 0:00. The lower panels show
the time evolution of different particulate components. The particulate total (black),
organic (green), and nitrate (blue) aerosol mass concentrations measured by the AMS are
given as solid lines. Also presented by red dots is the total gas and semivolatile particulate
alky nitrate concentration measured by the NO2-TD-LIF.

Chapter 4: Chamber Study - Organic Nitrate Detection in an AMS 43
Figure 4.2 a-bTime series of NO3 oxidation experiment of limonene (a) and isoprene (b). Top panel in bothgraphs: NO2 (light blue triangles) and O3 (black stars) concentrations. Middle panel graph a:Gas phase NO3 (blue squares) and limonene concentration (yellow diamonds). Middle panel ingraph b: Gas phase NO3 (blue squares) and isoprene concentration (yellow diamonds). Bottompanel in both graphs: Total aerosol (black line, only in a), particulate organic (green) andnitrate mass (blue line), and total alky nitrate concentration (red dots).

44 Chapter 4: Chamber Study - Organic Nitrate Detection in an AMS
Figure 4.2 c-dTime series of NO3 oxidation experiment of β-pinene dry (c) and humid (d). Top panel in bothgraphs: NO2 (light blue triangles) and O3 (black stars) concentrations. Middle panel in bothgraphs: Gas phase NO3 (blue squares) and β-pinene concentration (yellow diamonds). Bottompanel in both graphs: Total aerosol (black line), particulate organic (green) and nitrate mass(blue line), and total alky nitrate concentration (red dots).
The average particulate SOA mass yields (Y, equation (4.1)) ranged from 10 % for
isoprene up to 50 % for both β-pinene experiments:

Chapter 4: Chamber Study - Organic Nitrate Detection in an AMS 45
Y=mass
�BVOC
mass�
SOA . (4.1)
Here, ΔSOA is the measured in SOA mass loading and ΔBVOC the total reacted
BVOC. The mass yield of limonene + NO3 was found to depend sharply on the existence
of seed particles. While the mass yield was only 25 % in the absence of seed particles, Y
was 85 % in the presence of seed particles [Fry et al., in preparation]. Different yields were
also observed for the isoprene experiment depending on the degree of oxidation. The
degree of oxidation was called first generation, if only one double bond was oxidized and
second generation, when both double bonds were oxidized (see Table 4.1). Y of the first
generation products was < 0.7 %, while Y of the second generation products was 14 %
[Rollins et al., 2009]. The mass yield in both β-pinene experiments was ~50 % indicating
the independence of the particle formation from the RH.
For isoprene and limonene, which both have two double bonds (Table 4.1), the
results indicate that mainly second order oxidation products are the components which
actually nucleate/condensate. The products resulting from the oxidation of the first double
bond seem to be too volatile to condensate. A significant condensation of SOA products
can only be observed after the oxidation of both double bonds, here called second order
oxidation [Rollins et al., 2009]. The particle formation in both β-pinene experiments was
prompt after the VOC addition to the reaction chamber (Figure 4.2 c and d). That indicates
vapor pressures of the first order oxidation products to be low enough to promote
nucleation and particle growth [Fry et al., 2009].
The AMS analysis of the experiments revealed two interesting facts. First, the here
investigated organic nitrates have a higher vapor pressure than the other particulate
secondary organic components produced during the reactions (chapter 4.3.1). Second, the
fragmentation pattern of organic nitrate differs significantly from the fragmentation pattern
of nitrate from NH4NO3 (chapter 4.3.2).
4.3.1. Vapor Pressure of Organic Nitrates
The only particulate species detected in the AMS analysis of all BVOC-NO3
oxidation experiments were organics and nitrate. No ammonium, sulfate or chloride could
be detected except for the isoprene experiment, when (NH4)2SO4 was added as seed
particles. This result was expected since the experiments were conducted in the controlled
environment of the SAPHIR chamber.

46 Chapter 4: Chamber Study - Organic Nitrate Detection in an AMS
Figure 4.3 Mass of detected organics and nitrate (top panel), ratio of particulate organic to nitrate (middlepanel), and fragmentation ratio of particulate nitrate into NO2
+ and NO+ (bottom panel) vs.vaporizer temperature
The vaporizer temperature was modulated in the two β-pinene experiments to
investigate the temperature dependence of different compounds within the particulate
aerosol phase. The temperature was decreased stepwise from 580 °C to 150 °C and
towards the end of the experiment raised again to 580 °C. The high temperatures at the end
of the experiment were applied to ensure, that the findings were due to the thermogramm
and not due to aging processes in the chemical composition of the aerosol particles. Figure
4.3 (upper panel) shows detected organic (green upright triangles) and nitrate (blue
downwards triangles) mass in dependence of the vaporizer temperature for the dry
β-pinene experiment. The detected mass of both species decreases with decreasing
vaporizer temperature. The detected organic mass decreases significantly below 350 °C.
Further insight can be gained from the detected organic to nitrate mass ratio. A clear
temperature dependence of that ratio can be seen for temperatures below 350 °C (Figure
4.3 middle panel). No significant difference can be observed between the dry (dark blue
dots) and the humid (light blue rightwards triangles) β-pinene experiment. The ratio is
constant for temperatures above 350 °C and decreases significantly for temperatures below
this 350 °C. The ratio went up to the starting value when the temperature was raised back
to 580°C at the end of the experiments. That means that at lower temperatures the nitrate
containing fraction is more efficiently vaporized and therefore more efficiently detected

Chapter 4: Chamber Study - Organic Nitrate Detection in an AMS 47
than the average organic fraction of the particles. Derived vapor pressures and molecular
masses of organic nitrates are given in [Fry et al., 2009] and [Rollins et al., 2009] and in
[Fry et al., in preparation]
Table 4.3 Table of organic nitrate species molecular weight (MW) and vapor pressures (pvap) inferredfrom the measurements. Also given are atmospheric lifetimes of the respective BVOC in thepresence of the major atmospheric oxidants (taken from [Atkinson and Arey, 2003])
atmos. lifetime for reaction with*Experiment MW [g/mole] pvap [Pa]
NO3 O3 OH
Limonene - - 5 min 2.0 h 49 min
Isoprene 226 5 – 10 � 10-5 1.6 h 1.3 d 1.4 h
β-pinene dry 229 5.33 � 10-4 27 min 1.1 d 1.8 h
β-pinene humid 215 - 231 6.67 � 10-4 27 min 1.1 d 1.8 h
Organic nitrates seem to have a higher vapor pressure, easily evaporating even at
low temperatures like 150 °C without any changes in composition. This finding is
supported by the temperature independence of the nitrate fragmentation ratio. The ratio is
constant over the entire temperature range of the vaporizer investigated in these
experiments (bottom panel in Figure 4.3), indicating that the evaporating nitrate containing
fraction does not change in composition, but the composition of the entire organic fraction
changes. That means that the remaining detected organic fraction is depleted by low
volatile components.
The amount of organic nitrate in the particulate phase was estimated in two ways
for the β-pinene experiments. Both are based on the assumption that organic nitrates were
the only detected species at the lowest AMS vaporizer temperature (145 °C). In the first
approach the molecular weights of these species were inferred based on the AMS
measured ratio of organics to nitrate and the nitrate molecular weight (MW = 62 g/mole)
Using the derived molecular weight of 215 g/mole- 231 g/mole a contribution of 32 % -
41 % of organic nitrates to the total aerosol mass was obtained. In the second approach, the
ratio of mass measured by the AMS to mass derived from SMPS measurements calculated
for the time period during which the AMS vaporizer temperature was set to 145 °C. The
mass from SMPS measurements was derived by transferring size into volume distributions
and multiplication of the resulting volume with a density of 1.6 g/cm3. The density was
determined by parallel mass (AMS) and size (SMPS) distribution measurements as

48 Chapter 4: Chamber Study - Organic Nitrate Detection in an AMS
described in chapter 3.3.1. With the underlying assumption that the AMS measured
organic nitrate only while the SMPS detected the total SOA in this period, the organic
nitrate mass fraction was determined to be 39 %, well in agreement with the first approach.
4.3.2. Nitrate Fragmentation Ratio
The major fragments of the nitrate ion detected in the AMS are NO2+ on m/z 46 and
NO+ on m/z 30. The parenting NO3+ ion on m/z 62 is almost not existent due to the
vaporizing/ionizing scheme of the AMS. Opposite to the water ion, which fragmentation
pattern is independent of its origin (vapor, particulate phase or product of decomposition)
[Allan et al., 2004], the fragmentation of the nitrate ion is known to depend on the nitrate
origin [Alfarra, 2004]. Nitrate originating from ammonium nitrate has an average
NO2+/NO+ ratio of about 0.40 (red square in the bottom panel of Figure 4.3 and red line
Figure 4.4) as determined in independent measurements of NH4NO3.
Figure 4.4 NO2+ versus NO+ signal intensity for NO3 from NH4NO3 (red line) and from high resolution
analysis of the dry β-pinene experiment (blue dots).
Opposite to this, we found a ratio of about 0.1 for organic nitrate in all BVOC-NO3
oxidation experiments [Fry et al., 2009; Fry et al., in preparation; Rollins et al., 2009],
which was independent from the BVOC and the operating temperature of the vaporizer
(bottom panel of Figure 4.3). The NO2+/NO+ ratio is also presented in Figure 4.4. The red
line represents the average ratio for NH4NO3. Also shown is data from high resolution
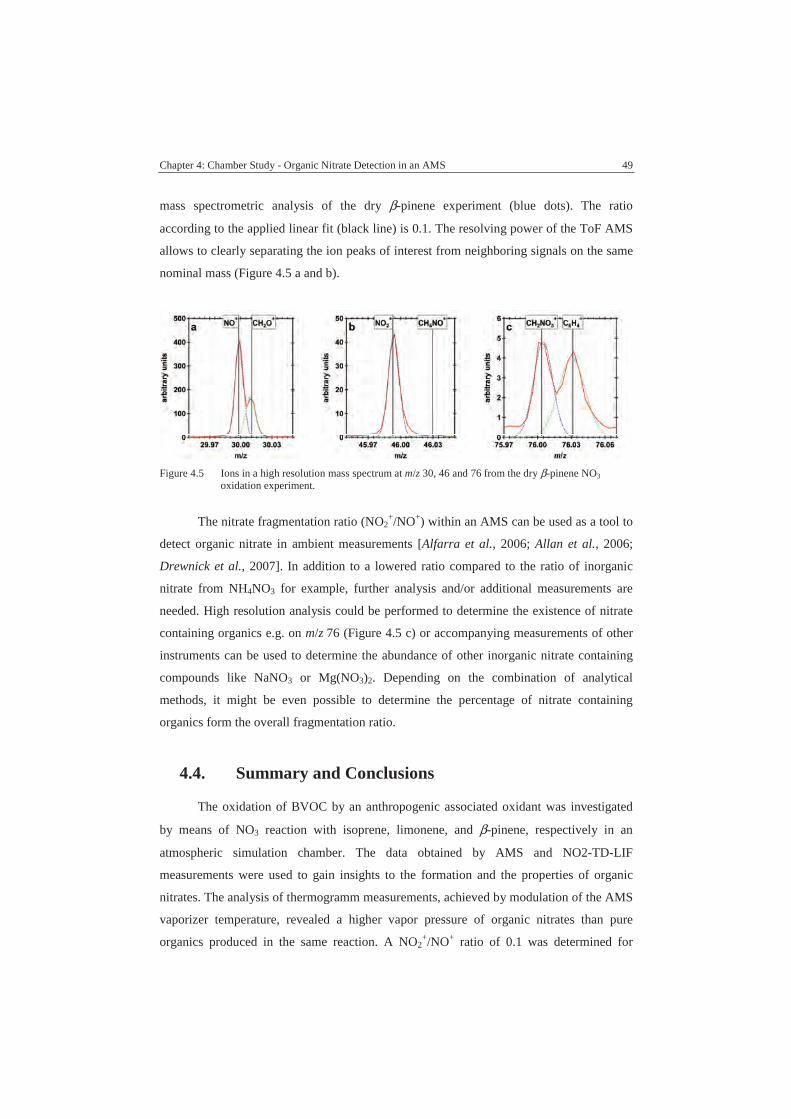
Chapter 4: Chamber Study - Organic Nitrate Detection in an AMS 49
mass spectrometric analysis of the dry β-pinene experiment (blue dots). The ratio
according to the applied linear fit (black line) is 0.1. The resolving power of the ToF AMS
allows to clearly separating the ion peaks of interest from neighboring signals on the same
nominal mass (Figure 4.5 a and b).
Figure 4.5 Ions in a high resolution mass spectrum at m/z 30, 46 and 76 from the dry β-pinene NO3oxidation experiment.
The nitrate fragmentation ratio (NO2+/NO+) within an AMS can be used as a tool to
detect organic nitrate in ambient measurements [Alfarra et al., 2006; Allan et al., 2006;
Drewnick et al., 2007]. In addition to a lowered ratio compared to the ratio of inorganic
nitrate from NH4NO3 for example, further analysis and/or additional measurements are
needed. High resolution analysis could be performed to determine the existence of nitrate
containing organics e.g. on m/z 76 (Figure 4.5 c) or accompanying measurements of other
instruments can be used to determine the abundance of other inorganic nitrate containing
compounds like NaNO3 or Mg(NO3)2. Depending on the combination of analytical
methods, it might be even possible to determine the percentage of nitrate containing
organics form the overall fragmentation ratio.
4.4. Summary and Conclusions
The oxidation of BVOC by an anthropogenic associated oxidant was investigated
by means of NO3 reaction with isoprene, limonene, and β-pinene, respectively in an
atmospheric simulation chamber. The data obtained by AMS and NO2-TD-LIF
measurements were used to gain insights to the formation and the properties of organic
nitrates. The analysis of thermogramm measurements, achieved by modulation of the AMS
vaporizer temperature, revealed a higher vapor pressure of organic nitrates than pure
organics produced in the same reaction. A NO2+/NO+ ratio of 0.1 was determined for

50 Chapter 4: Chamber Study - Organic Nitrate Detection in an AMS
organic nitrate from high resolution analysis of the nitrate fragmentation pattern. This
value is significantly lower than the ratio of 0.4 which is found for nitrate originating from
NH4NO3, the atmospherically most abundant nitrate compound. Both findings were
independent of BVOC and RH conditions. The contribution of organic nitrates to the total
particulate mass was estimated to be 32 % - 41 % for both β-pinene experiments. The
specific fragmentation ratio of organic nitrate will be applied to ambient measurement to
detect and investigate the abundance of organic nitrate in the atmosphere (chapter 5.5).
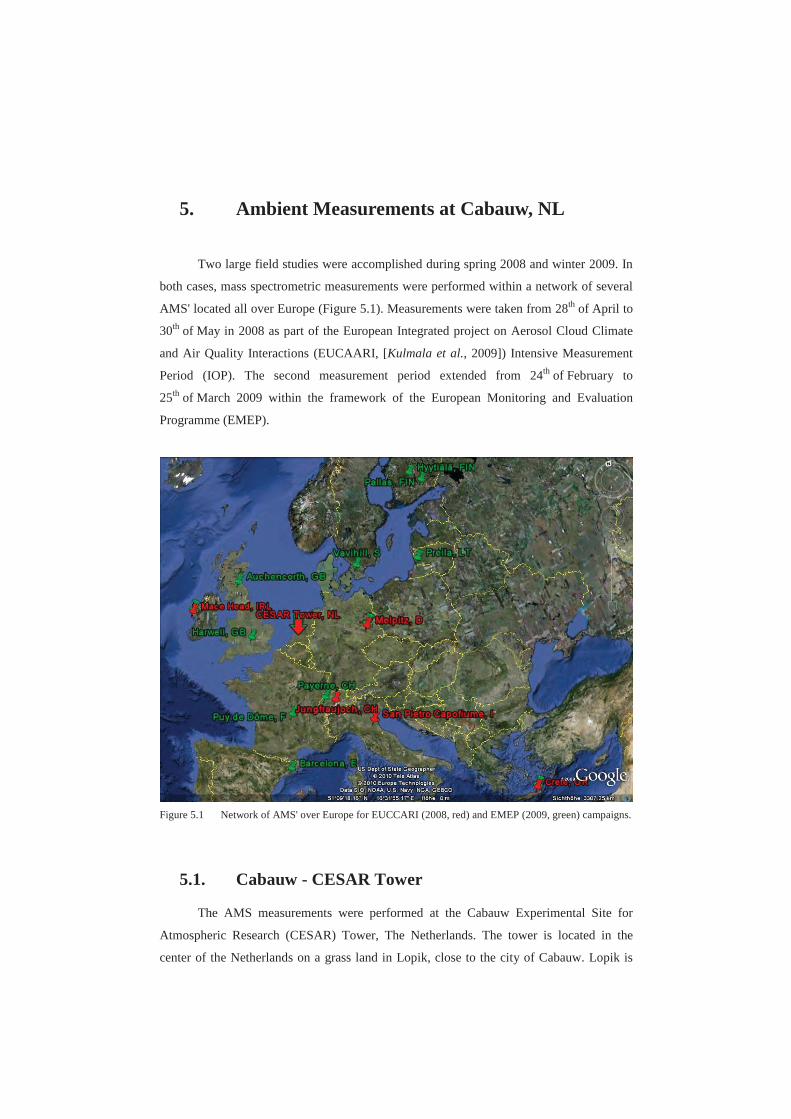
5. Ambient Measurements at Cabauw, NL
Two large field studies were accomplished during spring 2008 and winter 2009. In
both cases, mass spectrometric measurements were performed within a network of several
AMS' located all over Europe (Figure 5.1). Measurements were taken from 28th of April to
30th of May in 2008 as part of the European Integrated project on Aerosol Cloud Climate
and Air Quality Interactions (EUCAARI, [Kulmala et al., 2009]) Intensive Measurement
Period (IOP). The second measurement period extended from 24th of February to
25th of March 2009 within the framework of the European Monitoring and Evaluation
Programme (EMEP).
Figure 5.1 Network of AMS' over Europe for EUCCARI (2008, red) and EMEP (2009, green) campaigns.
5.1. Cabauw - CESAR Tower
The AMS measurements were performed at the Cabauw Experimental Site for
Atmospheric Research (CESAR) Tower, The Netherlands. The tower is located in the
center of the Netherlands on a grass land in Lopik, close to the city of Cabauw. Lopik is
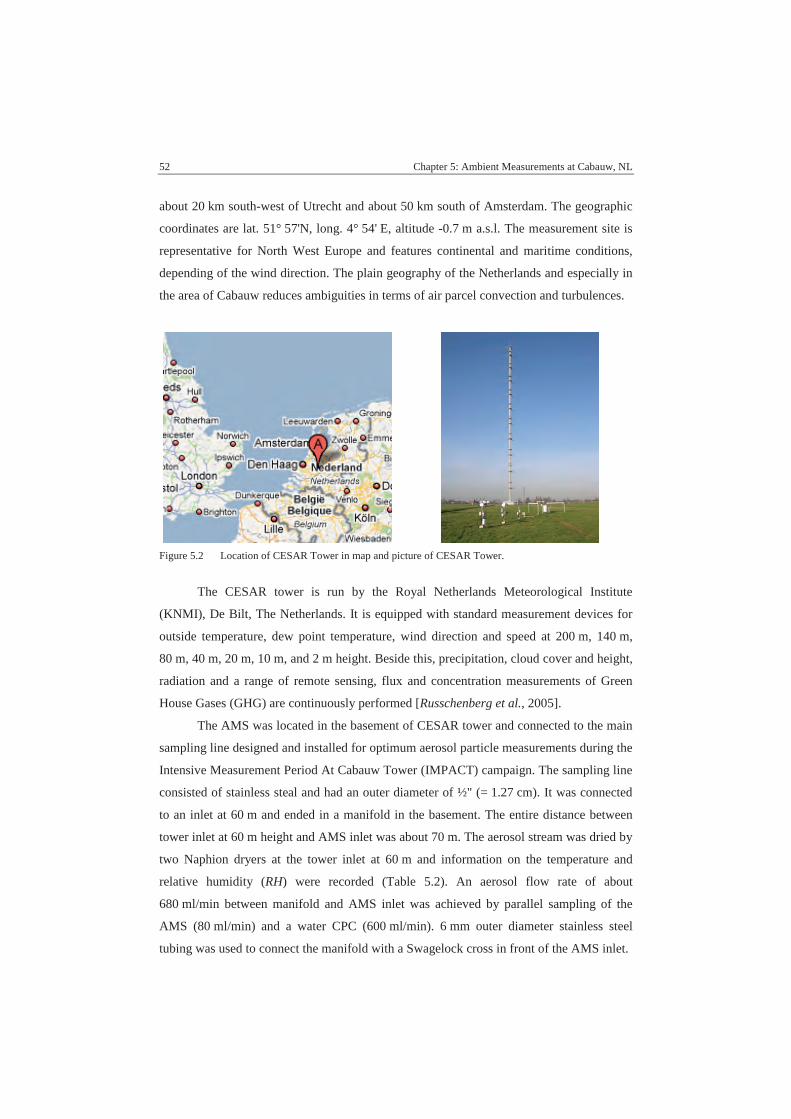
52 Chapter 5: Ambient Measurements at Cabauw, NL
about 20 km south-west of Utrecht and about 50 km south of Amsterdam. The geographic
coordinates are lat. 51° 57'N, long. 4° 54' E, altitude -0.7 m a.s.l. The measurement site is
representative for North West Europe and features continental and maritime conditions,
depending of the wind direction. The plain geography of the Netherlands and especially in
the area of Cabauw reduces ambiguities in terms of air parcel convection and turbulences.
Figure 5.2 Location of CESAR Tower in map and picture of CESAR Tower.
The CESAR tower is run by the Royal Netherlands Meteorological Institute
(KNMI), De Bilt, The Netherlands. It is equipped with standard measurement devices for
outside temperature, dew point temperature, wind direction and speed at 200 m, 140 m,
80 m, 40 m, 20 m, 10 m, and 2 m height. Beside this, precipitation, cloud cover and height,
radiation and a range of remote sensing, flux and concentration measurements of Green
House Gases (GHG) are continuously performed [Russchenberg et al., 2005].
The AMS was located in the basement of CESAR tower and connected to the main
sampling line designed and installed for optimum aerosol particle measurements during the
Intensive Measurement Period At Cabauw Tower (IMPACT) campaign. The sampling line
consisted of stainless steal and had an outer diameter of ½" (= 1.27 cm). It was connected
to an inlet at 60 m and ended in a manifold in the basement. The entire distance between
tower inlet at 60 m height and AMS inlet was about 70 m. The aerosol stream was dried by
two Naphion dryers at the tower inlet at 60 m and information on the temperature and
relative humidity (RH) were recorded (Table 5.2). An aerosol flow rate of about
680 ml/min between manifold and AMS inlet was achieved by parallel sampling of the
AMS (80 ml/min) and a water CPC (600 ml/min). 6 mm outer diameter stainless steel
tubing was used to connect the manifold with a Swagelock cross in front of the AMS inlet.

Chapter 5: Ambient Measurements at Cabauw, NL 53
Standard data acquisition included average mass spectra in V- and W-mode
(chapter 2.4). Size distribution data was only acquired in V-mode, because the aerosol
particulate loading was too low to get a good signal to noise ratio in W-mode. V- and W-
mode were alternated and saved every five minutes. The vaporizer temperature was set to
about 580 °C throughout both sampling periods. The AMS was run on remote control to
enable permanent control of the instrument performance. Size and ionization efficiency
calibrations were performed once a week and filter measurements were performed to
determine the gas phase background signal (chapter 2.3).
In 2008 air was sampled through one HEPA filter for about half an hour after size
and IE calibration. Two HEPA filters in a row were used to reduce the average particle
loading controlled by the CPC during filter measurement from about 20 particles/cm3 in
2008 to 0 particles/cm3 in 2009. Additionally, an electronic 4-port valve was used to allow
for automated filter sampling by remote controlled valve switching. Therefore, filter
measurements could be performed at least every second day. The filter sampling time
ranged from 15 to 20 min, to ensure that one entire V- and W-mode measurement were
included and to minimize interruption of ambient measurements.
Due to the fact that CESAR tower is a permanent monitoring site and the
campaigns were conducted European wide a whole range of instruments were collocated
and even airborne measurements were performed. Only the instruments which data will be
presented here are listed in Table 5.1
Table 5.1 Table of collocated instruments at CESAR Tower which data will be presented within thiswork.
Instrument Inlet Height Aerosol Phase Type of data Operator
SMPS (3034) 60 m Particle Size Distribution TNO
MARGA/MARGA Sizer �
4 m Gas + Particle Mass Loading ofInorganic Species ECN
MAAP (5012) Particle Black Carbon TNO
� only 2008

54 Chapter 5: Ambient Measurements at Cabauw, NL
5.2. Measurement Results
Figure 5.3 Campaign overview on the measurements from May 2008 (a) and March 2009 (b). Top panelin both graphs: Wind directions measured at 40 m height of the tower. Middle panel: Timeseries of AMS organic (Org), ammonium (NH4), nitrate (NO3), sulfate (SO4), chloride (Cl) andtotal (Total) mass. Bottom panel in both graphs: Time series of the fractional abundance of theindividual species.
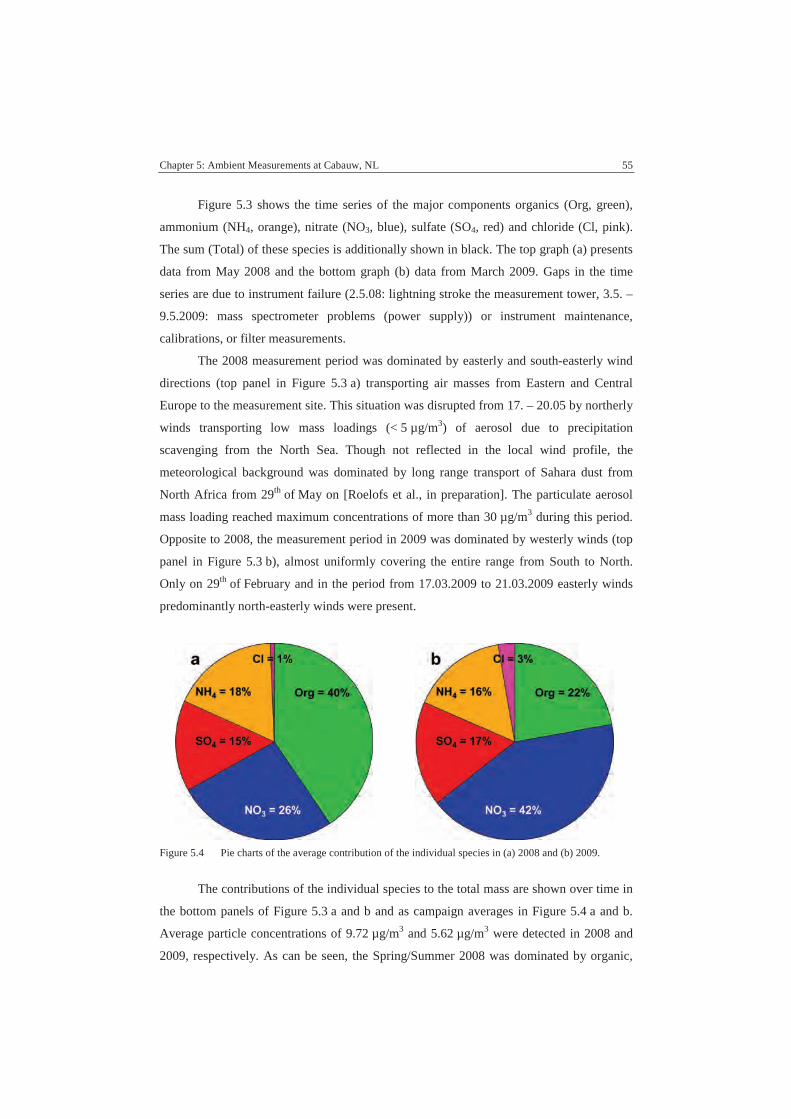
Chapter 5: Ambient Measurements at Cabauw, NL 55
Figure 5.3 shows the time series of the major components organics (Org, green),
ammonium (NH4, orange), nitrate (NO3, blue), sulfate (SO4, red) and chloride (Cl, pink).
The sum (Total) of these species is additionally shown in black. The top graph (a) presents
data from May 2008 and the bottom graph (b) data from March 2009. Gaps in the time
series are due to instrument failure (2.5.08: lightning stroke the measurement tower, 3.5. –
9.5.2009: mass spectrometer problems (power supply)) or instrument maintenance,
calibrations, or filter measurements.
The 2008 measurement period was dominated by easterly and south-easterly wind
directions (top panel in Figure 5.3 a) transporting air masses from Eastern and Central
Europe to the measurement site. This situation was disrupted from 17. – 20.05 by northerly
winds transporting low mass loadings (< 5 µg/m3) of aerosol due to precipitation
scavenging from the North Sea. Though not reflected in the local wind profile, the
meteorological background was dominated by long range transport of Sahara dust from
North Africa from 29th of May on [Roelofs et al., in preparation]. The particulate aerosol
mass loading reached maximum concentrations of more than 30 µg/m3 during this period.
Opposite to 2008, the measurement period in 2009 was dominated by westerly winds (top
panel in Figure 5.3 b), almost uniformly covering the entire range from South to North.
Only on 29th of February and in the period from 17.03.2009 to 21.03.2009 easterly winds
predominantly north-easterly winds were present.
Figure 5.4 Pie charts of the average contribution of the individual species in (a) 2008 and (b) 2009.
The contributions of the individual species to the total mass are shown over time in
the bottom panels of Figure 5.3 a and b and as campaign averages in Figure 5.4 a and b.
Average particle concentrations of 9.72 µg/m3 and 5.62 µg/m3 were detected in 2008 and
2009, respectively. As can be seen, the Spring/Summer 2008 was dominated by organic,

56 Chapter 5: Ambient Measurements at Cabauw, NL
while the winter 2009 was on average dominated by nitrate. Especially in 2008 a
pronounced anti correlated fractional abundances of sulfate and nitrate was noticeable. The
scavenged background situation was characterized by a high fractional abundance of
sulfate and a very low fractional abundance of nitrate all over the period. The Sahara dust
period towards end of May 2008 was dominated by a high nitrate contribution.
Table 5.2 Table of temperature [°C] and relative humidity [%] measured in the sampling line in 2008and 2009.
T [°C] RH [%]Year
min. max. ave. min. max. ave.
2008 22.7 29.4 26.5 12.7 42.2 23.1
2009 16.5 22.4 18.5 23.2 57.4 37.3
RH and temperature were measured by a Vaisala (HMP 235) that was placed into
the aerosol stream of the parallel sampling CPC close to the inlet of the AMS in 2008. This
data reflects the actual temperature and RH of the aerosol stream in the basement. In 2009
temperature and RH data were collected by TNO (Built Environment and Geosciences
Airquality & Climate, Uetrecht, The Netherlands) measured with a similar Vaisala at the
tower inlet at 60 m height. Due to a positive temperature gradient between 60 m inlet and
basement, the RH values are upper limits and the temperature values are lower limits in
2009 (Table 5.2).
Figure 5.5 shows the detected particulate water (lower panel) as well as the RH and
temperature (upper panel) for the measurement campaigns in 2008 (a) and 2009 (b) at
CESAR tower. In both years, the aerosol stream was dried by two naphion dryers at the
inlet at 60 m height. Therefore, the reported RH values do not reflect the ambient RH. The
RH time series were incorporated into the fragmentation wave of water in the
fragmentation wave table (chapter 2.3) to apply a time dependent correction of the
interfering signal contribution from gas phase water (RH) to the total water signal detected
by the AMS. Furthermore, the new relative ionization efficiency of water (RIEH2O) as
determined in chapter 3 was applied. Due to the set-up of the AMS with an aerodynamic
lens as inlet and the vacuum (10-3 Pa) in the particle sizing chamber, semi-volatile
components can be lost prior to their detection. Therefore, the reported water amounts
must be considered as residual water that did not evaporate in the inlet and/or the sizing

Chapter 5: Ambient Measurements at Cabauw, NL 57
chamber. The average detected residual water in 2008 was 0.64 µg/m3 and 0.31 µg/m3 in
2009. These amounts correspond to 6.6 % and 5.5 % of the average particulate mass
reported for the corresponding year.
Figure 5.5 Particulate water detected by the AMS (bottom panel) and relative humidity and temperature(both top panel) at CESAR tower during the measurement campaigns in 2008 (a) and 2009 (b).
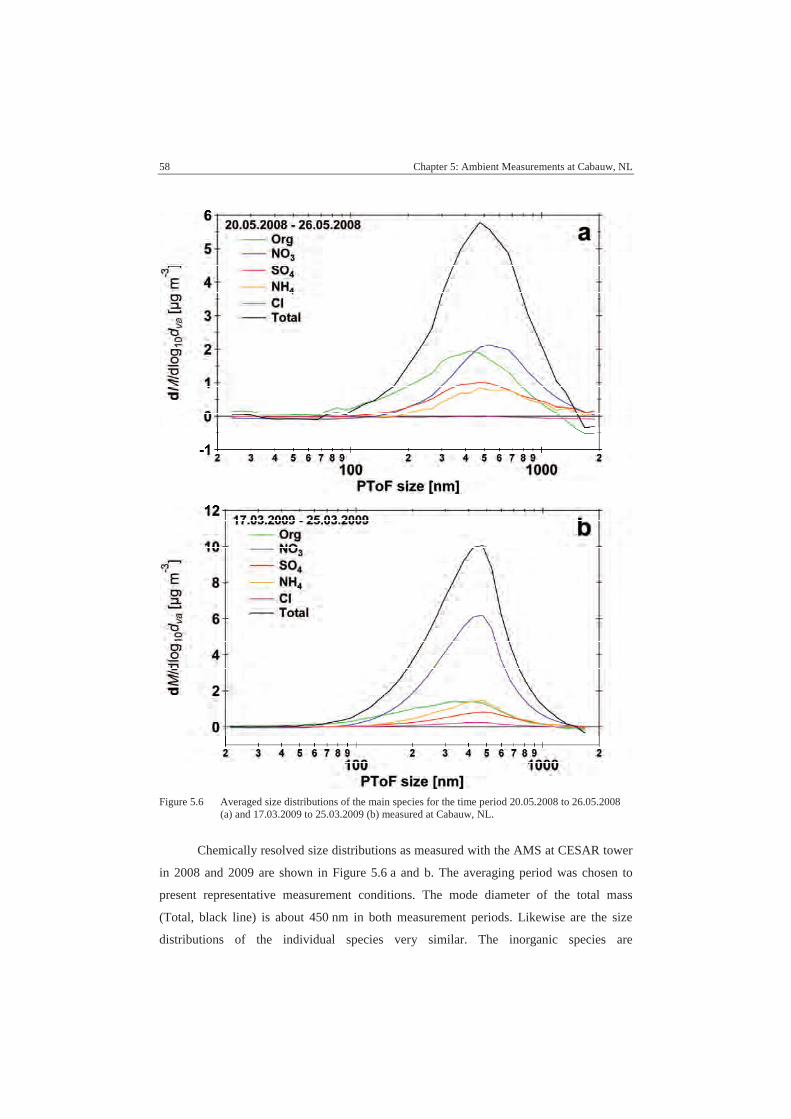
58 Chapter 5: Ambient Measurements at Cabauw, NL
Figure 5.6 Averaged size distributions of the main species for the time period 20.05.2008 to 26.05.2008(a) and 17.03.2009 to 25.03.2009 (b) measured at Cabauw, NL.
Chemically resolved size distributions as measured with the AMS at CESAR tower
in 2008 and 2009 are shown in Figure 5.6 a and b. The averaging period was chosen to
present representative measurement conditions. The mode diameter of the total mass
(Total, black line) is about 450 nm in both measurement periods. Likewise are the size
distributions of the individual species very similar. The inorganic species are

Chapter 5: Ambient Measurements at Cabauw, NL 59
predominately detected in the larger size fraction while organic show a much broader size
distribution extending into size fractions below 100 nm.
For details on the data analysis and additional AMS results see
Appendix A.1 and A.2.
5.3. Instrument Comparisons
5.3.1. SMPS
An SMPS (TSI 3034) attached to the same sampling line as the AMS was operated
by TNO from 14th of May 2008 to End of May 2008. Size distributions of the particles in
the range from 9.36 nm to 515.6 nm diameter were measured separated into 70 log10 equal
size bins. From the measured SMPS number distributions the aerosol mass was determined
according to the following steps. The number distribution is transferred into a volume
distribution which together with information on the particle density obtained by the AMS
yields the particle mass. In each measurement interval the fractional abundance of the
individual species determined by the AMS was used to calculate the particle density. The
mass of ammonium, nitrate, sulfate, and organics accounted on average for 99 % and 97 %
of the total particulate mass detected by the AMS in 2008 and 2009, respectively (Figure
5.4). Assumptions on the species sources need to be drawn to actually calculate the
density. If no further knowledge on the detailed composition is available, the most likely
substances present in atmospheric particles are taken as reference. The density of the
particles is then calculated with respect to the bulk densities of the reference substances
(Table 5.3).
Table 5.3 Densities used to derive the particulate mass loading from SMPS measurements.
Compound Density [g/cm3]
NH4NO3 1.72*
(NH4)2SO4 1.77*
organics 1.40#
Cl- 1.00♣
*[Lide, 2009] #[Hallquist et al., 2009] ♣[see text for explanation]

60 Chapter 5: Ambient Measurements at Cabauw, NL
The chloride detected in the AMS needs to flash evaporate at a vaporizer
temperature of about 600 °C. Hence, the probability that this chloride origins from an
inorganic salt is very small. Especially in field campaigns, the source of the detected
chloride is hard to determine. We set the density of the remaining chloride fraction to
1 g/cm3 and expect only a minor impact on the average particle density in view of the low
fractional abundance of 1 % and 3 %, respectively, in the two measurement periods.
Figure 5.7 Time series of AMS and mass derived from SMPS measurements in 2008.
The chronological sequence of the total particulate mass loading of the AMS (black
dots) and the mass loading derived from these SMPS measurements (red dots) is shown in
Figure 5.7. The measurements show very good quantitative and qualitative agreement,
since even small temporal loading variations are visible in both time series. Correlating the
SMPS derived mass to the total AMS mass results in a slope of 0.93 (R2 = 0.87, black solid
line, Figure 5.8). The data is colored by time showing a scatter around unity (black dotted
line) for almost the entire measurement period. High mass loadings (above 20 µg/m3) were
measured during the Sahara dust event. Since dust particles are expected in the coarse
particle range (> 1 µm), this event exemplifies the different cut off sizes of SMPS and
AMS. While the upper measurement range was 515.6 nm for the SMPS, the AMS is a PM1
instrument. The size distribution of the SMPS data is presented in Appendix A.3.1.
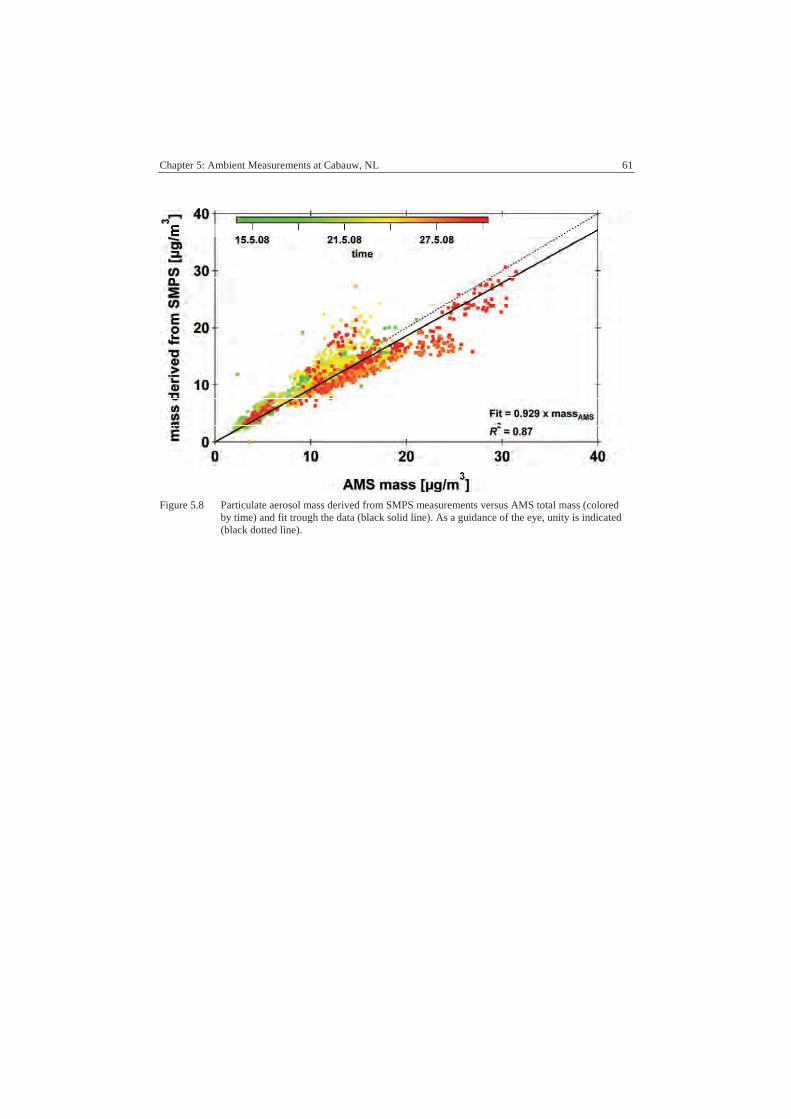
Chapter 5: Ambient Measurements at Cabauw, NL 61
Figure 5.8 Particulate aerosol mass derived from SMPS measurements versus AMS total mass (coloredby time) and fit trough the data (black solid line). As a guidance of the eye, unity is indicated(black dotted line).

62 Chapter 5: Ambient Measurements at Cabauw, NL
5.3.2. MARGA
Figure 5.9 Time series of AMS (colored lines) and MARGA (black lines) chloride, ammonium, sulfateand nitrate mass in 2008 (a) and 2009 (b).
During the campaigns in 2008 and 2009 an instrument for Measuring AeRosols and
GAses (MARGA) was deployed at the ground floor of CESAR tower. Here the first long
term parallel measurement of the AMS and MARGA is presented. The MARGA
instrument was attached to a separate inlet at 4 m height and sampled at ambient RH and
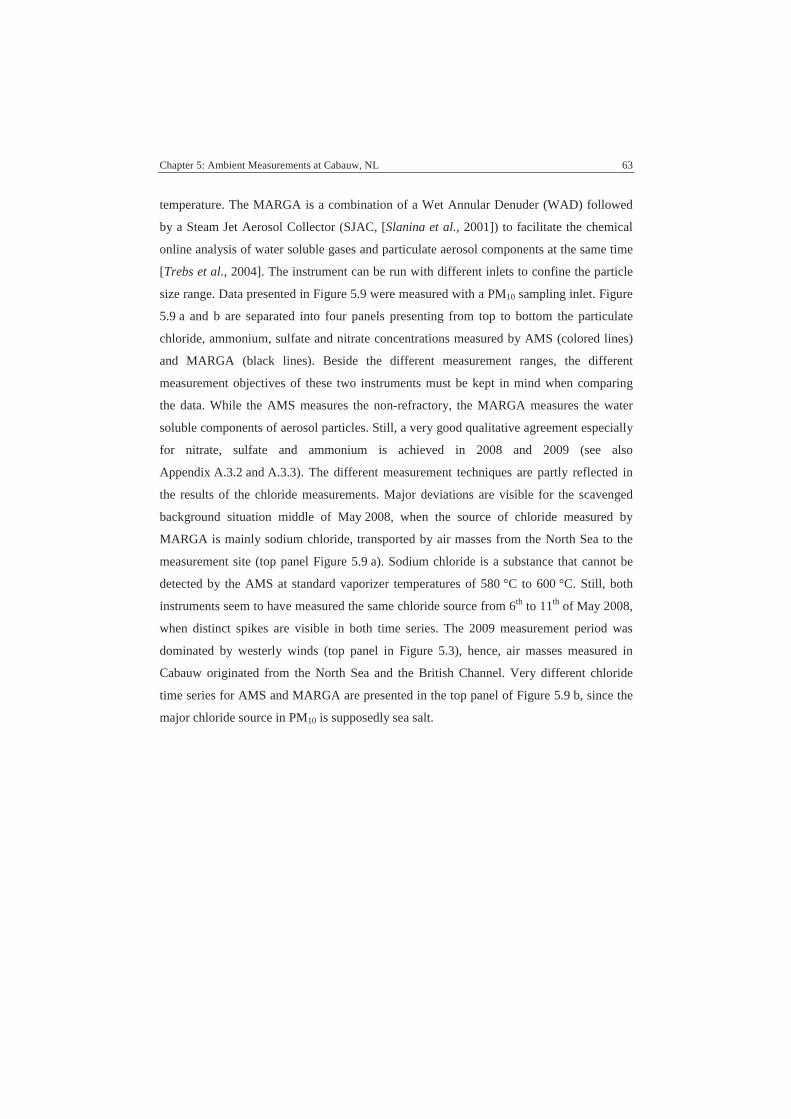
Chapter 5: Ambient Measurements at Cabauw, NL 63
temperature. The MARGA is a combination of a Wet Annular Denuder (WAD) followed
by a Steam Jet Aerosol Collector (SJAC, [Slanina et al., 2001]) to facilitate the chemical
online analysis of water soluble gases and particulate aerosol components at the same time
[Trebs et al., 2004]. The instrument can be run with different inlets to confine the particle
size range. Data presented in Figure 5.9 were measured with a PM10 sampling inlet. Figure
5.9 a and b are separated into four panels presenting from top to bottom the particulate
chloride, ammonium, sulfate and nitrate concentrations measured by AMS (colored lines)
and MARGA (black lines). Beside the different measurement ranges, the different
measurement objectives of these two instruments must be kept in mind when comparing
the data. While the AMS measures the non-refractory, the MARGA measures the water
soluble components of aerosol particles. Still, a very good qualitative agreement especially
for nitrate, sulfate and ammonium is achieved in 2008 and 2009 (see also
Appendix A.3.2 and A.3.3). The different measurement techniques are partly reflected in
the results of the chloride measurements. Major deviations are visible for the scavenged
background situation middle of May 2008, when the source of chloride measured by
MARGA is mainly sodium chloride, transported by air masses from the North Sea to the
measurement site (top panel Figure 5.9 a). Sodium chloride is a substance that cannot be
detected by the AMS at standard vaporizer temperatures of 580 °C to 600 °C. Still, both
instruments seem to have measured the same chloride source from 6th to 11th of May 2008,
when distinct spikes are visible in both time series. The 2009 measurement period was
dominated by westerly winds (top panel in Figure 5.3), hence, air masses measured in
Cabauw originated from the North Sea and the British Channel. Very different chloride
time series for AMS and MARGA are presented in the top panel of Figure 5.9 b, since the
major chloride source in PM10 is supposedly sea salt.

64 Chapter 5: Ambient Measurements at Cabauw, NL
5.3.3. MARGA-Sizer
Figure 5.10 Time series of AMS and MARGA Sizer (0.56 µm channel) chloride, ammonium, sulfate andnitrate mass.
An enhanced version of the MARGA is the MARGA Sizer [ten Brink et al., 2007],
which was deployed at CESAR tower during May 2008. The instrument was located
beside the MARGA and used the same tower inlet at 4 m height, sampling the aerosol at
atmospheric temperature and RH. Key difference between the MARGA and MARGA
Sizer is a pre-separator of parallel mounted impactors for size classification defining the
measurement range of the particles by different cut off sizes. During May 2008 the
MARGA Sizer was operated with impactors of the following cut off sizes: 0.18 µm,
0.32 µm, 0.56 µm, 1.00 µm, and 2.00 µm. Measurements through the different size classes
were alternated, resulting in a semi-continuous measurement but gaining insights to the
size distribution of the individual species. Additionally to the five impactor inlets, an inlet
equipped with a particle filter was used to perform blank measurements and determine the
background concentration of the compounds. The set up of the MARGA Sizer after the
size-classification was identical to the MARGA set up, i.e. the aerosol stream passed
through a wet annular denuder to remove the water soluble gas phase species and was then
led through a SJAC for subsequent chemical analysis of the aerosol particles. Figure 5.10
shows the time series of particulate chloride, ammonium, sulfate and nitrate (from top to
bottom) measured by the AMS (colored lines) and the MARGA Sizer (black lines)

Chapter 5: Ambient Measurements at Cabauw, NL 65
presenting the results of the 0.56 µm channel. Additionally to the good qualitative
agreement like in the comparison to the MARGA results (chapter 5.3.2) very good
quantitative agreement is achieved for data size selected by the 0.56 µm impactor. Since
the AMS is a PM1 instrument best quantitative agreement was expected to the data
obtained through the 1.00 µm channel. In fact, the measurement results of the 1.00 µm
channel are on average a factor of two higher than the AMS results. Up to now, this
discrepancy could not be resolved and further parallel measurements of the two
instruments are needed in the future to clarify the causes of this observation.
Correlations to the 0.56 µm channel of the individual species (Figure 5.11 colored
by time) show ratios ranging from 1.18 and 1.16 for nitrate and sulfate, respectively to 0.84
and 0.79 for chloride and ammonium, respectively. Correlations to the other sampling
channels are presented in Appendix A.3.4.
Figure 5.11 Correlation of MARGA Sizer (0.56 µm channel) and AMS for (a) nitrate, (b) sulfate, (c)ammonium and (d) chloride.
66 Chapter 5: Ambient Measurements at Cabauw, NL
5.4. PMF Analysis of the Organic Particulate Aerosol
Positive Matrix Factorization (PMF, [Paatero and Tapper, 1994; Paatero, 1997]) is
a variant of factor analysis that is a common analysis tool in atmospheric research for
investigating big datasets of long term measurements (of several months) originating from
different instruments [Reff et al., 2007]. PMF is based on mass conservation and requires
no a priori information. The constraint to positive solutions allows a good application to
real datasets. Due to the combination of a large m/z space (in general 300 and more) and
high time resolution, AMS measurements generate huge datasets even in UMR. Other
statistical approaches such as multivariate linear regression models have been applied to
deconvolve AMS mass spectra [Zhang et al., 2005] but PMF is becoming a more and more
prominent analysis technique in the AMS community [Aiken et al., 2009; Huffman et al.,
2009; Lanz et al., 2007; Ulbrich et al., 2009].
The matrix (Xij) of a dataset can be expressed as the product of a matrix (Gip) and a
matrix (Fpj) plus a residuum matrix (Eij) containing the residuals not included in G � F:
ijpjip EFGX +⋅=ij (5.1)
In the case of AMS data generally the organic fraction of the mass spectra is
analyzed by PMF. The rows of the matrix (Xij) represent the averaged mass spectra
obtained at each single measurement point and the columns represent the time series of the
individual m/z measured. The rows of the Fpj matrix are the factor profiles and the columns
of matrix Gip are the time series of the factors representing the contribution of each factor
to the solution at that point in time. A scheme of the PMF concept is shown in Figure 5.12
to illustrate the application to AMS datasets.

Chapter 5: Ambient Measurements at Cabauw, NL 67
Figure 5.12 Schematic of PMF factorization of an AMS dataset. The time series of the factors make up thematrix G and the mass spectra of the factors make up the matrix F (taken from [Ulbrich et al.,2009]).
The application of PMF analysis to the organic fraction of AMS mass spectra can
be used for source apportionment of organic aerosol which is an important part of field
data interpretation. The determination of factors i.e. sources must be based on on
mathematical considerations such as a minimum residual but also on characteristics of the
factors in our case mass spectra. If too few factors are chosen, the characteristics of several
sources might be merged in one factor/MS. Too many factors can cause the splitting of a
real factor into artificial factors, which cannot be assigned to a specific source. Each factor
needs to be validated based on the knowledge of the mass spectrum characteristics and/or
by correlation of the time dependence to so called tracers. Tracers are time series of
compounds measured by the AMS itself e.g. the time series of NO3, SO4, NH4, and Cl or
data of gas phase species like O3, SO2, CO, and NOx, or particulate species like black
carbon (BC) or elemental carbon (EC) acquired by collocated instruments. The major
sources of ambient organic aerosol (OA) are strongly dependent on the measurement
environment, but generally oxidized organic aerosol (OOA) and hydrocarbon-like organic
aerosol (HOA) are detected. These two classes themselves can be divided into sub classes.
OOA for example can be divided into general sub classes such as highly oxidized OA
(OOA-1 or low-volatile (LV-OA) and less oxidized OA (OOA-2 or semi-volatile (SV-OA)
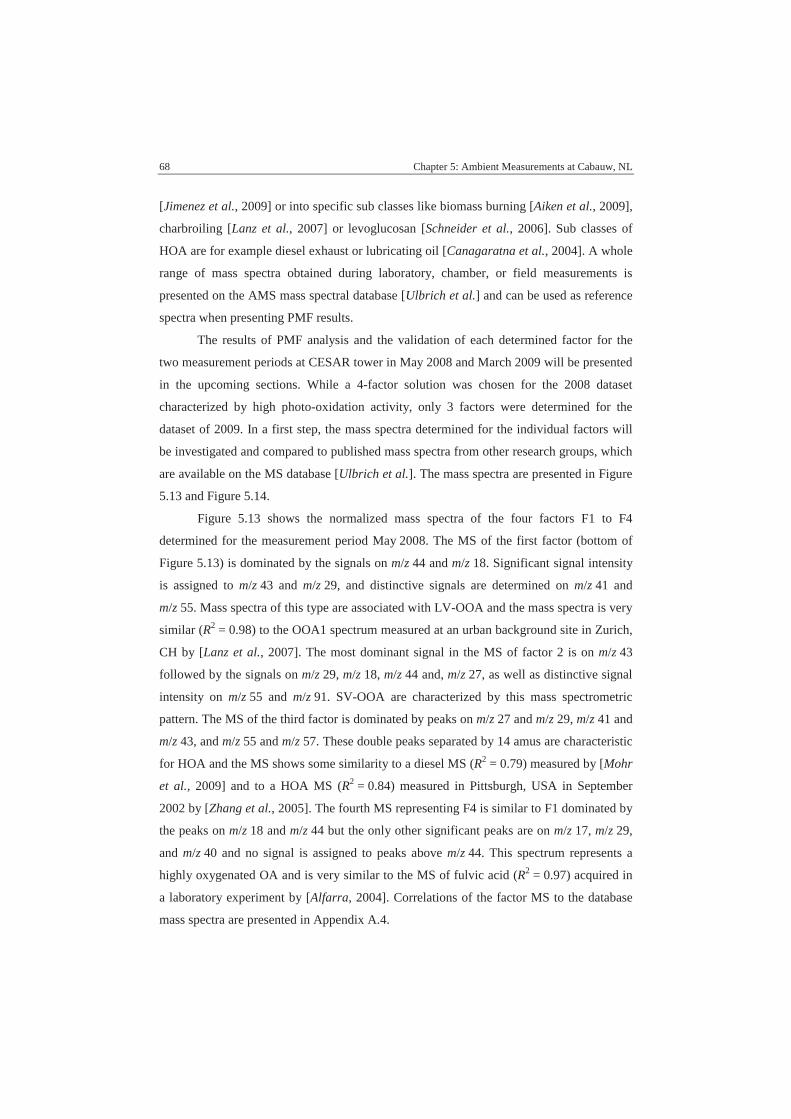
68 Chapter 5: Ambient Measurements at Cabauw, NL
[Jimenez et al., 2009] or into specific sub classes like biomass burning [Aiken et al., 2009],
charbroiling [Lanz et al., 2007] or levoglucosan [Schneider et al., 2006]. Sub classes of
HOA are for example diesel exhaust or lubricating oil [Canagaratna et al., 2004]. A whole
range of mass spectra obtained during laboratory, chamber, or field measurements is
presented on the AMS mass spectral database [Ulbrich et al.] and can be used as reference
spectra when presenting PMF results.
The results of PMF analysis and the validation of each determined factor for the
two measurement periods at CESAR tower in May 2008 and March 2009 will be presented
in the upcoming sections. While a 4-factor solution was chosen for the 2008 dataset
characterized by high photo-oxidation activity, only 3 factors were determined for the
dataset of 2009. In a first step, the mass spectra determined for the individual factors will
be investigated and compared to published mass spectra from other research groups, which
are available on the MS database [Ulbrich et al.]. The mass spectra are presented in Figure
5.13 and Figure 5.14.
Figure 5.13 shows the normalized mass spectra of the four factors F1 to F4
determined for the measurement period May 2008. The MS of the first factor (bottom of
Figure 5.13) is dominated by the signals on m/z 44 and m/z 18. Significant signal intensity
is assigned to m/z 43 and m/z 29, and distinctive signals are determined on m/z 41 and
m/z 55. Mass spectra of this type are associated with LV-OOA and the mass spectra is very
similar (R2 = 0.98) to the OOA1 spectrum measured at an urban background site in Zurich,
CH by [Lanz et al., 2007]. The most dominant signal in the MS of factor 2 is on m/z 43
followed by the signals on m/z 29, m/z 18, m/z 44 and, m/z 27, as well as distinctive signal
intensity on m/z 55 and m/z 91. SV-OOA are characterized by this mass spectrometric
pattern. The MS of the third factor is dominated by peaks on m/z 27 and m/z 29, m/z 41 and
m/z 43, and m/z 55 and m/z 57. These double peaks separated by 14 amus are characteristic
for HOA and the MS shows some similarity to a diesel MS (R2 = 0.79) measured by [Mohr
et al., 2009] and to a HOA MS (R2 = 0.84) measured in Pittsburgh, USA in September
2002 by [Zhang et al., 2005]. The fourth MS representing F4 is similar to F1 dominated by
the peaks on m/z 18 and m/z 44 but the only other significant peaks are on m/z 17, m/z 29,
and m/z 40 and no signal is assigned to peaks above m/z 44. This spectrum represents a
highly oxygenated OA and is very similar to the MS of fulvic acid (R2 = 0.97) acquired in
a laboratory experiment by [Alfarra, 2004]. Correlations of the factor MS to the database
mass spectra are presented in Appendix A.4.

Chapter 5: Ambient Measurements at Cabauw, NL 69
Figure 5.13 Normalized mass spectra of the four factors F1 to F4 (from bottom to top) determined by PMFanalysis of the organic fraction of the 2008 measurements at CESAR tower.
The three PMF mass spectra determined for the March 2009 measurement period at
CESAR tower are presented in Figure 5.14. Factor 1 exhibits a MS which resembles fulvic
acid (R2 = 0.90) and is highly similar (R2 = 0.98) to the OOA MS determined for
wintertime measurements in Zurich, CH by [Lanz et al., 2008]. Alike the MS of factor 3 in

70 Chapter 5: Ambient Measurements at Cabauw, NL
2008, the MS of factor 2 in 2009 corresponds to HOA, dominated by the double peak
pattern on m/z 27 and m/z 29, m/z 41 and m/z 43, and m/z 55 and m/z 57. Quite some
similarity is given to the mass spectra representing HOA in the publication of [Lanz et al.,
2008] (R2 = 0.88) and [Zhang et al., 2005] (R2 = 0.94), respectively. The MS of factor 3
reflects a so far non specific OOA with major signal intensities on m/z 18 and m/z 44 and
significant contributions on m/z 29, m/z 43, m/z 27, m/z 41, and m/z 55. Distinctive peaks
are further assigned to m/z 55, m/z 69, and m/z 91. This MS shows no distinct similarity to
any MS available on the MS database, but further analysis of the time series will give
insights to the origin of this factor. Correlations of the factor MS to the database mass
spectra are presented in Appendix A.4.
Figure 5.14 Normalized mass spectra of the three factors F1 to F3 (from bottom to top) determined by PMFanalysis of the organic fraction of the 2009 measurements at CESAR tower
Chapter 5: Ambient Measurements at Cabauw, NL 71
As already mention in the beginning of this section, the time series of the factors
need to be investigated towards correspondence to specific tracers. While LV-OOA is
generally associated with the particulate sulfate fraction, SV-OOA is associated with the
particulate nitrate fraction both measured by the AMS [Lanz et al., 2007]. The HOA time
series shows generally a similar trend as gas phase CO, NOx or particulate black carbon
(BC) representing combustion sources of primary OA (POA). The time series of the PMF
factors and specific tracers are presented in Figure 5.15 for 2008 and in Figure 5.16 for
2009. In Figure 5.15 the time series of the four factors F1 to F4 (from bottom to top) are
given together with corresponding tracers. The time series of Factor 1 (black line, bottom
of Figure 5.15) corresponds well with the time series of particulate sulfate measured by the
AMS (red line and axis) as expected for LV-OOA. The time series of the second organic
factor determined by PMF analysis corresponds well with a specific particulate nitrate
fraction (turquoise line and axis), which is associated with organic nitrate. A detailed
explanation on the determination of organic nitrate from field data will be given in
chapter 5.5. The time series of the third factor of the 2008 measurements is very similar to
the time trace of BC (brown line and axis), which is expected for HOA. BC data was
obtained from Multi Angle Absorption Photometer (MAAP 5012, [Petzold and
Schönlinner, 2004]) operated by TNO. Attention must be paid to the potential
misinterpretation of brown carbon as black carbon [Andreae and Gelencsér, 2006]. Brown
carbon is light absorbing organic particulate matter like humic acid which is often found in
biomass burning plumes [Gustafsson et al., 2009]. The MS of F3 was correlated to the MS
of humic acid obtained from laboratory measurements [Alfarra, 2004] and available on the
MS database. An extreme low coefficient of determination (R2 = 0.089) was found. This
was expected, since significant biomass burning activity is very unlikely for the Cabauw
area in particular and Western Europe in general. Neither other species measured by the
AMS nor compounds determined by auxiliary measurements of collocated instruments
provide corresponding tracers to the time series of the fourth factor, which MS resembles a
highly oxygenated OA such as fulvic acid.
The time series of the three factors determined for the March 2009 measurement
period are presented in Figure 5.16. Factor 1 which was characterized based on the MS as
highly oxygenated OA reveals a temporal evolution, which is similar to the time series of
particulate nitrate (dark blue line and axis) measured by the AMS itself. Though factor 2 is
clearly representing HOA none of the typical tracers such as NOx, CO or BC have a similar
time trace. The time series of the third factor matches very well to the time series of the

72 Chapter 5: Ambient Measurements at Cabauw, NL
specific nitrate fraction, which is associated with organic nitrate. Details on organic nitrates
will be given in the following chapter.
Each factor determined by PMF for 2008 and 2009 could be validated by the
characteristics of the mass spectra and/or the similar temporal behavior towards
corresponding tracers.
Figure 5.15 Time series of the PMF factors F1 to F4 (from bottom to top) determined for the organic massfraction of the 2008 measurement period at CESAR tower. Factors (black lines, left axis) andthe according tracers (colored lines, right axes matching the respective trace in terms of color)are given.
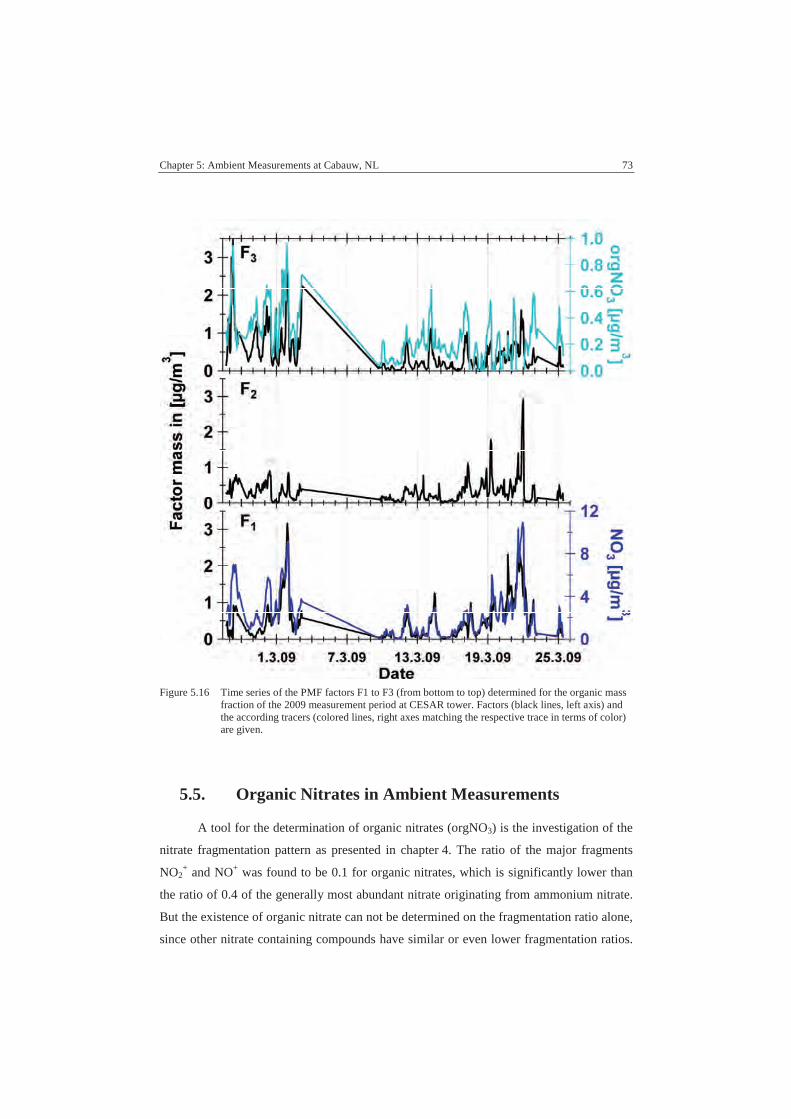
Chapter 5: Ambient Measurements at Cabauw, NL 73
Figure 5.16 Time series of the PMF factors F1 to F3 (from bottom to top) determined for the organic massfraction of the 2009 measurement period at CESAR tower. Factors (black lines, left axis) andthe according tracers (colored lines, right axes matching the respective trace in terms of color)are given.
5.5. Organic Nitrates in Ambient Measurements
A tool for the determination of organic nitrates (orgNO3) is the investigation of the
nitrate fragmentation pattern as presented in chapter 4. The ratio of the major fragments
NO2+ and NO+ was found to be 0.1 for organic nitrates, which is significantly lower than
the ratio of 0.4 of the generally most abundant nitrate originating from ammonium nitrate.
But the existence of organic nitrate can not be determined on the fragmentation ratio alone,
since other nitrate containing compounds have similar or even lower fragmentation ratios.

74 Chapter 5: Ambient Measurements at Cabauw, NL
The fragmentation ratios of magnesium, sodium, and calcium nitrate in comparison to
organic nitrate and ammonium nitrated are presented in Table 5.4.
Table 5.4 Table of nitrate fragmentation ratios partly taken from [Alfarra, 2004]*.
Substance NO2+/NO+ ratio
NH4NO3 0.4
orgNO3 0.1
Mg(NO3)2 0.09*
NaNO3 0.03*
Ca(NO3)2 0.02*
For the data collected at Cabauw, the nitrate fragmentation ratio was derived from
high resolution analysis. The resolving power of the ToF AMS allows the clear separation
of the ion peaks of interest from neighboring signals (Figure 4.5). Average nitrate
fragmentation ratios of 0.31 and 0.33 were determined for May 2008 and March 2009,
respectively. The ratio is clearly correlated to the fractional nitrate abundance (NO3/Total)
and exhibits a diurnal pattern in 2008. The fractional abundance of nitrate in turn is mainly
driven by the abundance of ammonium nitrate, which is temperature dependent due to its
high vapor pressure. The temperature variations between night and day in 2008 and the
overall lower ambient temperatures in the winter/spring measurement period in 2009 are
reflected in the NO3/Total ratio. An interesting behavior of the nitrate fraction can be
observed during the scavenged background situation from 17th of May to 21st of May 2008
with a nitrate fragmentation ratio of only 0.1. NH4NO3 is highly water soluble and can be
easily washed out from the gas phase. Since the aerosol is the coexistence of gas and
particulate phase by definition, the particulate concentration of volatile and semi volatile
components is strongly driven by their gas phase concentration. A gas phase depletion of
NH4NO3 causes a concentration gradient between gas and particulate phase. This gradient
in turn leads to evaporation of NH4NO3 from the particulate aerosol phase and
consequently to degradation within the particles causing the less volatile nitrate fraction in
the form of organic nitrate to dominate in the particulate phase.
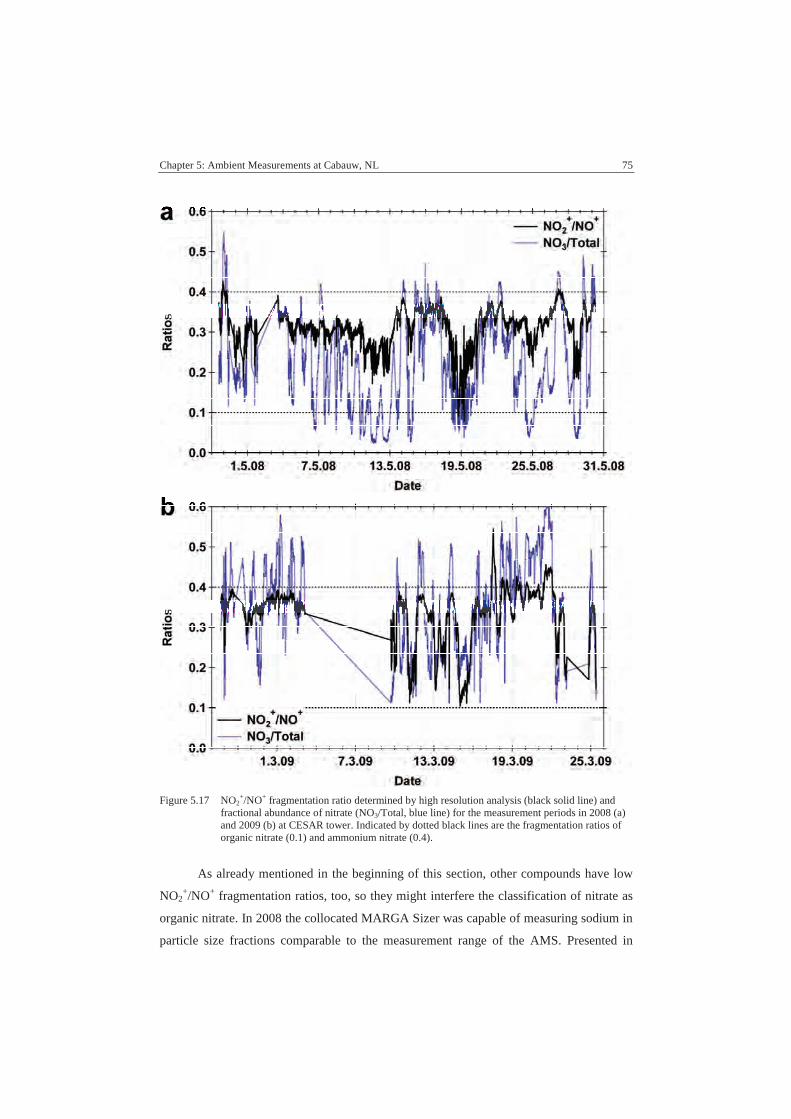
Chapter 5: Ambient Measurements at Cabauw, NL 75
Figure 5.17 NO2+/NO+ fragmentation ratio determined by high resolution analysis (black solid line) and
fractional abundance of nitrate (NO3/Total, blue line) for the measurement periods in 2008 (a)and 2009 (b) at CESAR tower. Indicated by dotted black lines are the fragmentation ratios oforganic nitrate (0.1) and ammonium nitrate (0.4).
As already mentioned in the beginning of this section, other compounds have low
NO2+/NO+ fragmentation ratios, too, so they might interfere the classification of nitrate as
organic nitrate. In 2008 the collocated MARGA Sizer was capable of measuring sodium in
particle size fractions comparable to the measurement range of the AMS. Presented in

76 Chapter 5: Ambient Measurements at Cabauw, NL
Table 5.5 are the molar concentrations of sodium, nitrate, ammonium and sulfate measured
by the MARGA Sizer over the entire May 2008. Since special interest exists regarding the
scavenged background period the concentrations for this time period are given in brackets.
Table 5.5 Molar concentrations of different species determined for the 0.56 µm, 1 µm, and 2 µmchannel of the MARGA Sizer in May 2008. Concentrations representing only the scavengedbackground period are given in brackets.
Concentration [mol/m3]Species
0.56 µm channel 1 µm cannel 2 µm cannel
Na 2.3 · 10-9 (2.4 · 10-9) 2.3 · 10-9 (2.6 · 10-9) 2.8 · 10-9 (3.5 · 10-9)
NO3 2.9 · 10-8 (1.4 · 10-8) 4.8 · 10-8 (2.0 · 10-8) 5.1 · 10-8 (2.4 · 10-8)
NH4 4.9 · 10-8 (2.4 · 10-8) 7.8 · 10-8 (3.5 · 10-8) 9.5 · 10-8 (4.2 · 10-8)
SO4 1.3 · 10-8 (8.0 · 10-9) 1.8 · 10-8 (9.8 · 10-9) 2.1 · 10-8 (1.2 · 10-8)
The AMS is a so called PM1 instrument, so the results of the 1 µm channel should
be representative. Beside the fact, that there is not enough sodium to account for the nitrate
concentration, there is no correlation between sodium and nitrate in this time range
(slope = -0.003 ± 0.002).
A nitrate fragmentation ratio of 0.4 which indicates the abundance of pure NH4NO3
is reached on the 27.05.2007 between 02:00 h and 11:30 h. This period coincides with the
arrival of Sahara dust from Northern Africa. The aerosol particles composition is
dominated by nitrate (45%) followed by organics (22%), ammonium (21%) and sulfate
(12%). This indicates that the nitrate transported to the Cabauw measurement site is
dominated by inorganic NH4NO3. The Sahara dust transport is interrupted for one day at
the 28.05.2008 due to meteorological conditions. This fact is clearly reflected by the sharp
drop of the nitrate fragmentation ratio from 28.05.2008 10:00 h to 29.05.2008 01:00 h.
The behavior of the NO2+/NO+ fragmentation pattern in 2009 can not be as easily
interpreted as in 2008 as the AMS results generally lack the structured behavior of 2008. A
NO2+/NO+ ratio as low as 0.1 is determined for the nights of the 11th and 15th of March
2009. However, ratios above 0.4, which is up to now the highest fragmentation ratio
known for nitrate, were measured repeatedly between 17th and 22nd of March. This fact
cannot be explained by any auxiliary measurements and needs to be investigated by
measurement of further nitrate containing compounds in the future.

Chapter 5: Ambient Measurements at Cabauw, NL 77
Nevertheless, PMF analysis of the organic fractions yielded a factor which time
series was very similar to the temporal abundance of organic nitrate for each measurement
period (Figure 5.15 and Figure 5.16). The concentration of organic nitrate was calculated
on the assumption that the entire nitrate consists solely of ammonium and organic nitrate.
The contribution of the two nitrate specie was determined from the NO2+/NO+ ratio at each
measuring time according to equation (5.2). Fragmentation ratios as given in Table 5.4.
were used for the calculation.
( ) ( ) ( )334 OrgNO2NONH2measured2 /NONO/NONO/NONO ++++++ ⋅+⋅= ba (5.2)
The fraction of organic nitrate within the particulate nitrate mass (factor b in
equation (5.2)) over time for the measurements at CESAR tower are shown in Figure
5.18 a (2008) and b (2009). The average organic nitrate mass concentration of 0.5 µg/m3 in
2008 corresponds to 34.9 % of the average nitrate and 5.2% of the average total mass in
this measurement period. In 2009 an average organic nitrate concentration of 0.2 µg/m3
was detected, which correspond to 9.7 % of the nitrate and 3.6 % of the total mass.
Figure 5.18 Fraction of organic nitrate in the particulate nitrate mass (OrgNO3/NO3) determined at CESARtower in May 2008 (a) and March 2009 (b).

78 Chapter 5: Ambient Measurements at Cabauw, NL
The contribution spans over the entire range from 0 to 1 in both years with an
average contribution of 30 % in 2008 and 22 % in 2009. Maximal contributions are
reached on 18.05.2008 and 15.03.2009 when almost the entire nitrate mass consists of
organic nitrate.
Figure 5.19 Diurnal averages of organic nitrate concentration (green, left axis) and fraction of organicnitrate in the nitrate mass (black, right axis) in May 2008 (a) and February 2009 (b).
In 2008 the average diurnal profile of the organic nitrate mass shows a maximum
during night/early morning (green line on left axis) but the maximum contribution of
organic nitrate to the nitrate mass is reached during evening hours (black line, right axis) as
can be seen in Figure 5.19 a. The average diurnal profile of organic nitrate in 2009 not
dominated by a diurnal pattern but rather by single events between 10.03.2009 and
16.03.2009. In contrast to 2008, not only the organic nitrate mass but also the fraction of
organic nitrate within the total nitrate mass shows a minimum during midday.
5.6. Summary and Conclusions
Extensive AMS measurements over the course of several weeks were performed at
CESAR tower, NL in May 2008 and February 2009. While the measurement period in
2008 was dominated by organics (40 %), nitrate was the dominant species detected in 2009
(42 %). In both years, nitrate was the most abundant inorganic specie detected in AMS and
MARGA PM10 measurements. The phenomenon of high nitrate fractional abundances is
not only typical for the measurement location [ten Brink et al., 2009] but is known to
occur all over Europe [Putaud et al., 2004; ten Brink et al., 1997]. The average aerosol
particulate mass loading was 9.72 µg/m3 in 2008 and 5.62 µg/m3 in 2009, which is in good
Chapter 5: Ambient Measurements at Cabauw, NL 79
agreement with PM2.5 concentrations determined at different rural European locations [Van
Dingenen et al., 2004]. The first application of the new RIEH2O for the determination
residual particulate water in ambient aerosol particles is presented. Concentrations of
0.64 µg/m3 and 0.31 µg/m3 in 2008 and 2009, respectively, were found. Size resolved mass
distribution measurements of the individual species detected in the AMS indicate a mode
diameter at 400 nm to 500 nm for the total mass as well as for the inorganic species. The
mass distribution of organics is much broader and extents into size ranges below 100 nm,
Similar size distributions with inorganic species dominating in the larger size fraction and
a bimodal behavior of organics is often the case in AMS measurements independent of
location [Alfarra et al., 2004; Allan et al., 2003]. Comparison of AMS total mass to mass
derived from SMPS measurements show high qualitative and quantitative agreement. The
data of a collocated MARGA (PM10) shows very good agreement within the comparability
of the two measurement techniques. In 2008 an additional MARGA Sizer was operated at
CESAR tower. Mass concentrations a factor of 2 higher than the AMS total mass loading
were found for data measured through the PM1 channel. Best quantitative agreement was
obtained to the data sampled through the PM0.56 channel but the correlation factors were
better for the PM1 channel. Since this data present the first comparison of AMS and
MARGA Sizer of ambient aerosol particles, further parallel sampling campaigns are
needed to investigate the presented discrepancy. PMF analysis was performed on the
organic mass fractions determined in 2008 and 2009. While the 2008 organics could be
characterized by 4 factors (LV-OOA, SV-OOA, HOA, and a fulvic acid like OOA) only
three factors were needed to characterize the 2009 organics (LV-OOA, HOA, and an
undefined OOA). The findings on the specific fragmentation ratio of organic nitrate gained
by analysis of BVOC oxidation with NO3 in an atmospheric simulation chamber
(chapter 4) were applied to the two field datasets. A significant amount of organic nitrate
was detected, with average contributions to the particulate nitrate of 30 % in 2008 and
22 % in 2009. Additionally, a PMF factor highly correlated to the time series of organic
nitrate was determined for each measurement period.


6. Summary
Atmospheric aerosol particles currently comprise the major uncertainty in the
assessment of future global climate. The scientific understanding of their physical,
chemical and climate impact properties is still not sufficient. Atmospheric particles are
composed of a huge variety of compounds, of which nitrate, sulfate, and ammonium are
generally the major inorganic contributors to the fine fraction. The fractional abundance of
organics compounds can account for 20 % to more than 80 % of the ambient particle mass,
but the determination of individual organic species is still challenging even with the latest
experimental techniques. The Aerodyne Aerosol Mass Spectrometer (AMS) is a
commercially available online PM1 instrument that facilitates the mass spectrometric and
size resolved investigation of aerosol particles in the first instance but insights to the
particles morphology and volatility can be gained additionally. Two different versions of
the AMS a Quadrupol (Q-AMS) and a High Resolution Time of Flight (HR-ToF-AMS)
instrument were used for the characterization and investigation of atmospheric particles
presented in this thesis.
Atmospheric aerosols were investigated on three different scales of complexity and
size. Laboratory experiments were performed to determine the relative ionization
efficiency of water (RIEH2O) in an AMS (chapter 3), simulation chamber experiments gave
insight to the reaction products of BVOC-NO3 oxidation products (chapter 4), and two
field campaigns were used to apply the findings from the previous experiments (chapter 5).
The RIEH2O was determined by measuring the crystal water content of different
oxalate salts. Sodium, potassium, and ammonium oxalate were investigated and a RIEH2O
of 2 was determined (chapter 3.3.2). When this finding was applied to oxalic acid a
considerable ammonium contamination was revealed even if oxalic acid was directly taken
from factory sealed containers (chapter 3.3.3). Special care should be paid to the
experimental conditions when oxalic acid is used. Further investigations are needed to
determine the nature and processes leading to this contamination.
Isoprene, limonene, and β-pinene were separately oxidized by NO3 in the
"Simulation of Atmospheric PHoto oxidation In a large Reaction" (SAPHIR) chamber at
Forschungszentrum Jülich, Germany. The volatility of oxidation products was investigated
by modulation of the AMS vaporizer temperature. While the detected mass loading of
organics decreased with decreasing vaporizer temperature, the detected nitrate mass
loading was not affected. It was therefore concluded that organic nitrates have a higher

82 Chapter 6: Summary
vapor pressure in comparison to the other organic oxidation products formed in the
reactions (chapter 4.3.1). Organic nitrates were estimated to account for up to 41 % of the
particulate phase. High resolution analysis of the organic nitrates revealed a characteristic
nitrate fragmentation pattern. The ratio of NO2+ ions to NO+ ions was found to be 0.1
(chapter 4.3.2), which is significantly lower than the ratio found for nitrate originating
from NH4NO3, the major source of particulate nitrate in the troposphere. This
fragmentation ratio can be used to determine and quantify the amount of organic nitrate in
ambient measurements and successful application is presented (chapter 5.5).
In May 2008 and February 2009 ambient aerosol measurements were performed at
the Cabauw Experimental Site for Atmospheric Research (CESAR) Tower, The
Netherlands. Each campaign lasted three to four weeks. A high resolution AMS was
deployed to measure dried aerosol particles which were sampled from an inlet at 60 m
height. An average particle concentration of 9.72 µg/m3 dominated by organics (40 %) was
detected in May 2008. Particles in 2009 were dominated by nitrate (42 %) and had an
average mass concentration of 5.62 µg/m3. Investigations of the amount of residual water
with application of the new RIEH2O gave concentrations of 0.64 µg/m3 and 0.31 µg/m3 in
2008 and 2009, respectively. A mode diameter ranging between 400 nm and 500 nm was
found for the total mass and the inorganic species by chemically resolved size distribution
measurements. In contrast to the inorganic species, organics showed a much broader
distribution. Beside slightly lower modal diameters (300 nm – 400 nm), the distribution
curve showed pronounced tailing towards sizes below 100 nm (chapter 5.2) indicative of
new particle formation. The AMS measurement results were compared to a range of
collocated instruments. Size distribution data measured by a SMPS were available for the
second half of May 2008. Mass concentrations were derived from this data and good
agreement was found to the total AMS mass (R2 = 0.87) (chapter 5.3.1). Comparison the
mass loadings of the inorganic species to data from a Measuring AeRosol and GAses
(MARGA, PM10) instrument showed high qualitative agreement in both years
(chapter 5.3.2). In 2008, an enhanced version of the MARGA called MARGA Sizer was
additionally deployed at CESAR tower. Interestingly, best quantitative agreement was
found to the data obtained through the PM0.56, though best agreement was expected for the
PM1 sampling channel since the AMS is referred to as PM1 instrument (chapter 5.3.3).
This issue needs to be further investigated. The organic particulate fraction detected by the
AMS was investigated by Positive Matrix Factorization. Four different organic fractions
could be determined for the May 2008 campaign and three for February 2009. In both

Chapter 6: Summary 83
years a low volatile (LV) a semi volatile (SV) oxygenated organic aerosol (OOA) fraction
as well as a hydrocarbon-like (HOA) fraction were determined. The mass spectrum of the
forth factor in May 2008 showed high correlation to fulvic acid (R2 = 0.97) and represents
a highly oxygenated organic aerosol (chapter 5.4). The amount of organic nitrate in the
ambient aerosol particles was determined by usage of the specific fragmentation pattern of
nitrate as found in the simulation chamber experiments. After ruling out possible
interferences from other inorganic nitrate species such as sodium, calcium, or magnesium
nitrate, the contribution of organic nitrate to the particulate nitrate mass was found to be on
average 34.9 % and 5.2 % in 2008 and 2009, respectively (chapter 5.5).
The combination of laboratory, simulation chamber, and field measurements for the
investigation of atmospheric particles was presented in this thesis. It was shown that
specific features determined in isolated laboratory or simulation chamber studies could be
successfully applied to ambient measurements. On the basis of this thesis the need for the
determination of further s is given, since only the knowledge of the individual RIEs allow
the absolute mass determination of individual species with an AMS. The high resolution
analysis of specific fragmentation patterns allows the detection and quantification of
important sub-species such as organic nitrate in ambient datasets. This approach is worth
following for sub-division of other species such as sulfate. The scientific knowledge on the
characteristics, composition, and behavior of atmospheric aerosol particles is still limited
and demands for further extensive investigation.


7. Literature
Ahmed, F. R., and D. W. J. Cruickshank (1953), A refinement of the crystal structureanalyses of oxalic acid dihydrate, Acta Crystallographica, 6(5), 385-392.
Aiken, A. C., et al. (2009), Mexico City aerosol analysis during MILAGRO using highresolution aerosol mass spectrometry at the urban supersite (T0) -- Part 1: Fine particlecomposition and organic source apportionment, Atmos. Chem. Phys., 9(17), 6633-6653.
Alfarra, M. R. (2004), Insights Into Athmospheric Organic Aerosols Using An AerosolMass Spectrometer, 2000 pp, University of Manchester, Manchester.Alfarra, M. R., et al. (2004), Characterization of urban and rural organic particulate in theLower Fraser Valley using two Aerodyne Aerosol Mass Spectrometers, AtmosphericEnvironment
The Pacific 2001 Air Quality Study, 38(34), 5745-5758.
Alfarra, M. R., et al. (2006), A mass spectrometric study of secondary organic aerosolsformed from the photooxidation of anthropogenic and biogenic precursors in a reaction
chamber, Atmospheric Chemistry and Physics, 6(12), 5279 - 5293.
Allan, J. D., et al. (2003), Quantitative sampling using an Aerodyne aerosol massspectrometer - 2. Measurements of fine particulate chemical composition in two U.K.cities, Journal of Geophysical Research-Atmospheres, 108(D3).
Allan, J. D., et al. (2004), A generalised method for the extraction of chemically resolvedmass spectra from Aerodyne aerosol mass spectrometer data, Journal of Aerosol Science,35(7), 909-922.
Allan, J. D., et al. (2006), Size and composition measurements of background aerosol andnew particle growth in a Finnish forest during QUEST 2 using an Aerodyne Aerosol MassSpectrometer, Atmos. Chem. Phys., 6(2), 315-327.
Andreae, M. O., and A. Gelencsér (2006), Black carbon or brown carbon? The nature oflight-absorbing carbonaceous aerosols, Atmos. Chem. Phys., 6(10), 3131-3148.
Atkinson, R. (1997), Gas-Phase Tropospheric Chemistry of Volatile Organic Compounds:1. Alkanes and Alkenes, Journal of Physical and Chemical Reference Data, 26(2), 215-290.
Atkinson, R., and J. Arey (2003), Gas-phase tropospheric chemistry of biogenic volatileorganic compounds: a review, Atmospheric Environment, 37(Supplement 2), 197-219.
Baxter, G. P., and J. E. Lansing (2002), The Aqueous Pressure of Some Hydrated Crystals.Oxalic Acid, Strontium Chloride and Sodium Sulfate, Journal of the American ChemicalSociety, 42(3), 419-426.
Canagaratna, M. R., et al. (2004), Chase Studies of Particulate Emissions from in-use NewYork City Vehicles, Aerosol Science and Technology, 38(6), 555 - 573.
Canagaratna, M. R., et al. (2007), Chemical and microphysical characterization of ambientaerosols with the aerodyne aerosol mass spectrometer, Mass Spectrometry Reviews, 26(2),185-222.
86 Chapter 7: Literature
Crosier, J., et al. (2007), Chemical composition of summertime aerosol in the Po Valley(Italy), northern Adriatic and Black Sea, Quarterly Journal of the Royal MeteorologicalSociety, 133(S1), 61-75.
Day, D. A., et al. (2002), A thermal dissociation laser-induced fluorescence instrument forin situ detection of NO2, peroxy nitrates, alkyl nitrates, and HNO3, J. Geophys. Res., 107.
Day, D. A., et al. (2009), Observations of NOx, � PNs, � ANs, and HNO3 at a Rural Site inthe California Sierra Nevada Mountains: summertime diurnal cycles, Atmos. Chem. Phys.,9(14), 4879-4896.
DeCarlo, P., et al. (2004), Particle Morphology and Density Characterization by CombinedMobility and Aerodynamic Diameter Measurements. Part 1: Theory, Aerosol Science andTechnology, 38(12), 1185 - 1205.
DeCarlo, P. F., et al. (2006), Field-Deployable, High-Resolution, Time-of-Flight AerosolMass Spectrometer, Anal. Chem.
Dorn, H. P., et al. (2009), Intercomparison of NO3 measurement techniques at thesimulation chamber SAPHIR, Atmos. Chem. Phys., in preparation.
Drewnick, F., et al. (2004), Measurement of Ambient Aerosol Composition During thePMTACS-NY 2001 Using an Aerosol Mass Spectrometer. Part I: Mass Concentrations,Aerosol Science and Technology, 38(12 supp 1), 92 - 103.
Drewnick, F., et al. (2005), A New Time-of-Flight Aerosol Mass Spectrometer (TOF-AMS): Instrument Description and First Field Deployment, Aerosol Science &Technology, 39(7), 637-658.
Drewnick, F., et al. (2007), Measurement of Ambient, Interstitial, and Residual AerosolParticles on a Mountaintop Site in Central Sweden using an Aerosol Mass Spectrometerand a CVI, Journal of Atmospheric Chemistry, 56(1), 1-20.
Dubé, W. P., et al. (2006), Aircraft instrument for simultaneous, in situ measurement ofNO3 and N2O5 via pulsed cavity ring-down spectroscopy, Review of ScientificInstruments, 77(3), 034101-034111.
Ehn, M., et al. (2007), Hygroscopic properties of ultrafine aerosol particles in the borealforest: diurnal variation, solubility and the influence of sulfuric acid, AtmosphericChemistry and Physics, 7(1), 211 - 222.
Finlayson-Pitts, B. J., and J. N. Pitts (2000), Chemistry of the Upper and LowerTroposphere, Academic Press, San Diego, USA.
Fisseha, R., et al. (2009), Determination of primary and secondary sources of organic acidsand carbonaceous aerosols using stable carbon isotopes, Atmospheric Environment, 43(2),431-437.Fry, J. L., et al. (2009), Organic nitrate and secondary organic aerosol yield from NO3oxidation of � -pinene evaluated using a gas-phase kinetics/aerosol partitioning model,Atmos. Chem. Phys., 9(4), 1431-1449.
Fry, J. L., et al. (in preparation), Chemical production and loss of limonene secondaryorganic aerosol (SOA) by reaction with NO3, Atmos. Chem. Phys.
Fuchs, H., et al. (2009), Intercomparison of measurements of NO2 concentrations in theatmosphere simulation chamber SAPHIR during the NO3Comp campaign, Atmos. Meas.Tech. Discuss., 2(5), 2539-2586.

Chapter 7: Literature 87
Geyer, A., et al. (2003), Nighttime formation of peroxy and hydroxyl radicals during theBERLIOZ campaign: Observations and modeling studies, J. Geophys. Res., 108.
Griffin, R. J., et al. (1999), Organic aerosol formation from the oxidation of biogenichydrocarbons, Journal of Geophysical Research-Atmospheres, 104(D3), 3555-3567.
Guenther, A., et al. (1995), A global model of natural volatile organic compoundemissions, J. Geophys. Res., 100(D5), 8873 - 8892.
Guenther, A., et al. (2006), Estimates of global terrestrial isoprene emissions usingMEGAN (Model of Emissions of Gases and Aerosols from Nature), Atmos. Chem. Phys.,6(11), 3181-3210.
Gustafsson, O., et al. (2009), Brown Clouds over South Asia: Biomass or Fossil FuelCombustion?, Science, 323(5913), 495-498.
Hallquist, M., et al. (1999), Aerosol and Product Yields from NO3 Radical-InitiatedOxidation of Selected Monoterpenes, Environmental Science & Technology, 33(4), 553-559.
Hallquist, M., et al. (2009), The formation, properties and impact of secondary organicaerosol: current and emerging issues, Atmos. Chem. Phys., 9(14), 5155-5235.
Hämeri, K., et al. (2001), Hygroscopic and CCN properties of aerosol particles in borealforests, Tellus B, 53(4), 359-379.
Hinds, W. C. (1999), Aerosol Technology, John Wiley & Sons, New York.
Hoffmann, T., et al. (1997), Formation of organic aerosols from the oxidation of biogenichydrocarbons, Journal of Atmospheric Chemistry, 26(2), 189-222.
Hogrefe, O., et al. (2004), Development, Operation and Applications of an AerosolGeneration, Calibration and Research Facility Aerosol Science and Technology, 38(12supp 1), 196 - 214.
Huffman, J. A., et al. (2005), Design, Modeling, Optimization, and Experimental Tests of aParticle Beam Width Probe for the Aerodyne Aerosol Mass Spectrometer., Aerosol Science& Technology, 39(12), 1143-1163.
Huffman, J. A., et al. (2009), Chemically-resolved aerosol volatility measurements fromtwo megacity field studies, Atmos. Chem. Phys., 9(18), 7161-7182.
IPCC (2007), Intergovernmental Panel on Climate Change: Climate Change 2007: ThePhysical Science Basis, Cambrige University Press, UK, 2007.
Jayne, J. T., et al. (2000), Development of an aerosol mass spectrometer for size andcomposition analysis of submicron particles, Aerosol Science and Technology, 33(1-2), 49-70.
Jeffrey, G. A., and G. S. Parry (1954), The Crystal Structure of Sodium Oxalate, Journal ofthe American Chemical Society, 76(21), 5283-5286.
Jimenez, J. L., et al. (2003), Ambient aerosol sampling using the Aerodyne Aerosol MassSpectrometer, Journal of Geophysical Research-Atmospheres, 108(D7).
Jimenez, J. L., et al. (2009), Evolution of Organic Aerosols in the Atmosphere, Science,326(5959), 1525-1529.
Johnson, D. L., et al. (1987), Drag on non-spherical, orthotropic aerosol particles, Journalof Aerosol Science, 18(1), 87-97.

88 Chapter 7: Literature
Kanakidou, M., et al. (2005), Organic aerosol and global climate modelling: a review,Atmos. Chem. Phys., 5(4), 1053-1123.
Kawamura, K., and F. Sakaguchi (1999), Molecular distributions of water solubledicarboxylic acids in marine aerosols over the Pacific Ocean including tropics, J. Geophys.Res., 104(D 3), 3501 - 3509.
Khwaja, H. A. (1995), Atmospheric concentrations of carboxylic acids and relatedcompounds at a semiurban site, Atmospheric Environment, 29(1), 127-139.
Koehler, K. A., et al. (2006), Water activity and activation diameters from hygroscopicitydata - Part II: Application to organic species, Atmospheric Chemistry and Physics, 6, 795-809.
Kulmala, M., et al. (2009), Introduction: European Integrated Project on Aerosol CloudClimate and Air Quality interactions (EUCAARI) - integrating aerosol research from nanoto global scales, Atmos. Chem. Phys., 9(8), 2825-2841.
Lanz, V. A., et al. (2007), Source apportionment of submicron organic aerosols at an urbansite by factor analytical modelling of aerosol mass spectra, Atmos. Chem. Phys., 7(6),1503-1522.
Lanz, V. A., et al. (2008), Source Attribution of Submicron Organic Aerosols duringWintertime Inversions by Advanced Factor Analysis of Aerosol Mass Spectra,Environmental Science & Technology, 42(1), 214-220.
Lide, D. R. (Ed.) (2009), CRC Handbook of Chemistry and Physics, 89 ed., CRCPress/Taylor and Francis, Boca Ralton.
Lindinger, W., et al. (1998), Proton-transfer-reaction mass spectrometry (PTR-MS): on-line monitoring of volatile organic compounds at pptv levels, Chemical Society Reviews,27(5), 347-354.
Liu, P., et al. (1995a), Generating Particle Beams of Controlled Dimensions andDivergence: ΙΙ. Experimental Evaluation of Particle Motion in Aerodynamic Lenses andNozzle Expansions, Aerosol Science & Technology, 22(3), 314-324.
Liu, P., et al. (1995b), Generating Particle Beams of Controlled Dimensions andDivergence: Ι. Theory of Particle Motion in Aerodynamic Lenses and Nozzle Expansions,Aerosol Science & Technology, 22(3), 293-313.
Liu, P. S. K., et al. (2007), Transmission Efficiency of an Aerodynamic Focusing LensSystem: Comparison of Model Calculations and Laboratory Measurements for theAerodyne Aerosol Mass Spectrometer, Aerosol Science and Technology, 41(8), 721 - 733.
Matthew, B. M., et al. (2008), Collection Efficiencies in an Aerodyne Aerosol MassSpectrometer as a Function of Particle Phase for Laboratory Generated Aerosols, AerosolScience and Technology, 42(11), 884 - 898.
McLafferty, F. W., and F. Turecek (1993), Interpretation of Mass Spectra, UniversityScience Books, Sausolito.
Mielniczek-Brzóska, E., and K. Sangwal (1995), Study of the Growth Morphology ofAmmonium Oxalate Monohydrate Crystals Obtained from Aqueous Solutions, CrystalResearch and Technology, 30(6), 807-811.
Mohr, C., et al. (2009), Characterization of Primary Organic Aerosol Emissions from MeatCooking, Trash Burning, and Motor Vehicles with High-Resolution Aerosol MassSpectrometry and Comparison with Ambient and Chamber Observations, EnvironmentalScience & Technology, 43(7), 2443-2449.
Chapter 7: Literature 89
Moolgavkar, S. H., et al. (1994), Air Pollution and Mortality, The New England Journal ofMedicine, 330(17), 1237-1238.
Nazarenko, L., and S. Menon (2005), Varying trends in surface energy fluxes andassociated climate between 1960 and 2002 based on transient climate simulations,Geophysical Research Letters, 32(22).
Neusüß, C., et al. (2002), Characterization and parameterization of atmospheric particlenumber-, mass-, and chemical-size distributions in central Europe during LACE 98 andMINT, J. Geophys. Res., 107(D21).
Nober, F. J., et al. (2003), Sensitivity of the global circulation to the suppression ofprecipitation by anthropogenic aerosols, Global and Planetary Change
Evaluation, Intercomparison and Application of Global Climate Models, 37(1-2), 57-80.
Norris, J. R., and M. Wild (2007), Trends in aerosol radiative effects over Europe inferredfrom observed cloud cover, solar "dimming" and solar "brightening", Journal ofGeophysical Research-Atmospheres, 112(D8).
Paatero, P., and U. Tapper (1994), Positive matrix factorization: A non-negative factormodel with optimal utilization of error estimates of data values, Environmetrics, 5(2), 111-126.
Paatero, P. (1997), Least squares formulation of robust non-negative factor analysis,Chemometrics and Intelligent Laboratory Systems, 37(1), 23-35.
Peng, C., and C. K. Chan (2001), The water cycles of water-soluble organic salts ofatmospheric importance, Atmospheric Environment, 35(7), 1183-1192.
Peng, C., et al. (2001), The Hygroscopic Properties of Dicarboxylic and MultifunctionalAcids: Measurements and UNIFAC Predictions, Environmental Science & Technology,35(22), 4495-4501.
Petzold, A., and M. Schönlinner (2004), Multi-angle absorption photometry - a newmethod for the measurement of aerosol light absorption and atmospheric black carbon,Journal of Aerosol Science, 35(4), 421-441.
Pope , C. A., et al. (2002), Lung Cancer, Cardiopulmonary Mortality, and Long-termExposure to Fine Particulate Air Pollution, JAMA, 287(9), 1132-1141.
Prenni, A. J., et al. (2001), The Effects of Low Molecular Weight Dicarboxylic Acids onCloud Formation, The Journal of Physical Chemistry A, 105(50), 11240-11248.
Putaud, J.-P., et al. (2004), A European aerosol phenomenology--2: chemicalcharacteristics of particulate matter at kerbside, urban, rural and background sites inEurope, Atmospheric Environment, 38(16), 2579-2595.
Quinn, P. K., et al. (2006), Impacts of sources and aging on submicrometer aerosolproperties in the marine boundary layer across the Gulf of Maine, Journal of GeophysicalResearch, 111(D23).
Ramanathan, V., et al. (2007), Atmospheric brown clouds: Hemispherical and regionalvariations in long-range transport, absorption, and radiative forcing, Journal ofGeophysical Research-Atmospheres, 112(D22).
Reff, A., et al. (2007), Receptor modeling of ambient particulate matter data using positivematrix factorization: Review of existing methods, Journal of the Air & Waste ManagementAssociation, 57(2), 146-154.

90 Chapter 7: Literature
Reimer, D. (2007), Umgang mit dem Quadrupol-Aerosolmassenspektrometer unAerosolkammer-Untersuchungen, Praktikumsbericht (Spezialpraktikum),Forschungszentrum Jülich, ICG-2, Jülich.
Ridley, B. A., et al. (1992), A Small High-Sensitivity, Medium-Response Ozone DetectorSuitable for Measurements from Light Aircraft, Journal of Atmospheric and OceanicTechnology, 9(2), 142-148.
Roelofs, G.-J., et al. (in preparation), Simulation of aerosol optical thickness duringIMPACT (MAY 2008, The Netherlands) with ECHAM5/HAM
Rogge, W. F., et al. (1993), Quantification of urban organic aerosols at a molecular level:Identification, abundance and seasonal variation, Atmospheric Environment. Part A.General Topics, 27(8), 1309-1330.
Rollins, A. W., et al. (2009), Isoprene oxidation by nitrate radical: alkyl nitrate andsecondary organic aerosol yields, Atmos. Chem. Phys., 9(18), 6685-6703.
Romanou, A., et al. (2007), 20th century changes in surface solar irradiance in simulationsand observations, Geophysical Research Letters, 34(5).
Russchenberg, H., et al. (2005), Ground-Based Atmospheric Remote Sensing in theNetherlands: European Outlook, The Institute of Electronics, Information andCommunication Engineers, E88–B(6).
Saunders, S. M., et al. (2003), Protocol for the development of the Master ChemicalMechanism, MCM v3 (Part A): tropospheric degradation of non-aromatic volatile organiccompounds, Atmos. Chem. Phys., 3(1), 161-180.
Saxena, P., and L. M. Hildemann (1996), Water-soluble organics in atmospheric particles:A critical review of the literature and application of thermodynamics to identify candidatecompounds, Journal of Atmospheric Chemistry, 24(1), 57-109.
Schichtel, B. A., et al. (2008), Fossil and contemporary fine particulate carbon fractions at12 rural and urban sites in the United States, J. Geophys. Res., 113.
Schlosser, E., et al. (2007), Intercomparison of Two Hydroxyl Radical MeasurementTechniques at the Atmosphere Simulation Chamber SAPHIR, Journal of AtmosphericChemistry, 56(2), 187-205.
Schneider, J., et al. (2006), Mass spectrometric analysis and aerodynamic properties ofvarious types of combustion-related aerosol particles, International Journal of MassSpectrometry, 258(1-3), 37-49.
Sempére, R., and K. Kawamura (1994), Comparative distributions of dicarboxylic acidsand related polar compounds in snow, rain and aerosols from urban atmosphere,Atmospheric Environment, 28(3), 449-459.Skov, H., et al. (1992), Products and mechanisms of the reactions of the nitrate radical(NO3) with isoprene, 1,3-butadiene and 2,3-dimethyl-1,3-butadiene in air, AtmosphericEnvironment. Part A. General Topics, 26(15), 2771-2783.
Slanina, J., et al. (2001), The continuous analysis of nitrate and ammonium in aerosols bythe steam jet aerosol collector (SJAC): extension and validation of the methodology,Atmospheric Environment, 35(13), 2319-2330.
Sun, J., and P. A. Ariya (2006), Atmospheric organic and bio-aerosols as cloudcondensation nuclei (CCN): A review, Atmospheric Environment, 40(5), 795-820.
Chapter 7: Literature 91
Tao, W. K., et al. (2007), Role of atmospheric aerosol concentration on deep convectiveprecipitation: Cloud-resolving model simulations, Journal of Geophysical Research-Atmospheres, 112(D24).
ten Brink, H., et al. (2007), An instrument for semi-continuous monitoring of the size-distribution of nitrate, ammonium, sulphate and chloride in aerosol, AtmosphericEnvironment, 41(13), 2768-2779.
ten Brink, H., et al. (2009), Monitoring of the ratio of nitrate to sulphate in size-segregatedsubmicron aerosol in the Netherlands, Atmospheric Research, 92(2), 270-276.
ten Brink, H. M., et al. (1997), Composition/size of the light-scattering aerosol in theNetherlands, Atmospheric Environment, 31(23), 3955-3962.
Trebs, I., et al. (2004), Real-time measurements of ammonia, acidic trace gases and water-soluble inorganic aerosol species at a rural site in the Amazon Basin, Atmos. Chem. Phys.,4(4), 967-987.
Ulbrich, I. M., et al. http://cires.colorado.edu/jimenez-group/AMSsd/
Ulbrich, I. M., et al. (2009), Interpretation of organic components from Positive MatrixFactorization of aerosol mass spectrometric data, Atmos. Chem. Phys., 9(9), 2891-2918.
Van Dingenen, R., et al. (2004), A European aerosol phenomenology--1: physicalcharacteristics of particulate matter at kerbside, urban, rural and background sites inEurope, Atmospheric Environment, 38(16), 2561-2577.
Vaughan T. J. Phillips, T. W. C., Alan M. Blyth, John Latham, (2002), The influence ofaerosol concentrations on the glaciation and precipitation of a cumulus cloud, QuarterlyJournal of the Royal Meteorological Society, 128(581), 951-971.
Volkamer, R., et al. (2006), Secondary organic aerosol formation from anthropogenic airpollution: Rapid and higher than expected, Geophysical Research Letters, 33.
Weber, R. J., et al. (2007), A study of secondary organic aerosol formation in theanthropogenic-influenced southeastern United States, J. Geophys. Res., 112.
Yu, S. (2000), Role of organic acids (formic, acetic, pyruvic and oxalic) in the formation ofcloud condensation nuclei (CCN): a review, Atmospheric Research, 53(4), 185-217.
Zhang, Q., et al. (2005), Deconvolution and Quantification of Hydrocarbon-like andOxygenated Organic Aerosols Based on Aerosol Mass Spectrometry, Environ. Sci.Technol., 39(13), 4938-4952.
Zhang, Q., et al. (2007), Ubiquity and dominance of oxygenated species in organicaerosols in anthropogenically-influenced Northern Hemisphere midlatitudes, Geophys.Res. Lett., 34(13).
Zhang, X., et al. (2004), Numerical Characterization of Particle Beam Collimation: Part IIIntegrated Aerodynamic-Lens-Nozzle System, Aerosol Science and Technology, 38(6),619 - 638.


Appendix
A.1 Data Analysis
A.1.1 Software used
2008: Squirrel 1.44, Pika 1.06, PMF 2.03A
2009: Squirrel 1.47, Pika 1.06, PMF 2.03A
A.1.2 m/z Fitting
List of masses (Diff spectra) used in 2008 and 2009:
C+, N+, O+, O2+, Ar+, 182W+, 184W+, 186W+
A.1.3 Baseline
Mass defect wave set to CH
R0 = 420
Table A 1 Changed center peak positions in baseline correction in 2008 and 2009 (*only).
m/z m/z m/z
79.0650 130.0500 150.1300
80.000 132.0500 242.000
81.0300 133.025 244.0600
85.0180 134.0300 246.0600
87.0050 136.0300 474.3850
98.0400 138.0400
127.0400* 149.0500
A.1.4 DC marker
Region 1: 166 µs – 1250 µs
Region 2: 4980 µs – 5520 µs
DC marker for m/z 30 set to region 2 only

94 Appendix A.1
A.1.5 Fragmentation Wave
Table A 2 Fragmentation wave correction factors applied in 2008.
m/z frag_air frag_CO2 frag_O16 frag_RH frag_organic
16 0.82153
18 2.83e-4*RH
29 0.923995
33 33, -frag_air[33]
34 34, -frag_air[34]
40 1.20714 40, -frag_air[40]
44 0.977237
Table A 3 Fragmentation wave correction factors applied in 2009.
m/z frag_air frag_CO2 frag_O16 frag_RH frag_organic
16 0.92068
18 1.22e-4*RH
29 0.926238
33 33, -frag_air[33]
34 34, -frag_air[34]
40 1.23229 40, -frag_air[40]
44 1.07484

Appendix A.1 95
A.1.6 High Resolution Fitting
2008:
peak width fitting on C+, N+, O+, O2+, and Ar+
peak shape:
V-mode: Ar+ (28.04.-13.05.) and O+ (13.05.-30.05)
W-mode: Ar+ (28.04.-26.05.) and O+ (26.05.-30.05)
Table A 4 Peak width and peak shape parameters for 2009
17.0
3.09
–25
.03.
09
C,C
H,O
H,C
2H,N
2,O
2,
Ar,
SO,S
O2,
C8H
5O3,
W18
2
(1.0
56+
0.01
27m
/z)
C,C
H,O
H,C
2H,N
2,O
2,
Ar,
SO,S
O2,
W18
2
(1.1
643
+0.
0194
m/z
)
left
win
g:C
;CH
;
OH
;C2H
;N2;O
2;Ar;S
O;S
O2
right
win
g:C
;CH
;OH
;C2H
;
N2;O
2
left
win
g:C
;CH
;OH
;C2H
;
O2;A
r;SO
;SO
2;W18
2
right
win
g:C
;OH
;N2;
O2;A
r
09.0
3.09
–17
.03.
09
C,C
H,O
H,C
2H,N
2,O
2,
Ar,
SO,S
O2,
C8H
5O3,
W18
2
(1.0
527
+0.
0126
m/z
)
C,C
H,O
H,C
2H,N
2,O
2,
Ar,
SO,S
O2,
W18
2
(1.1
696
+0.
0182
m/z
)
left
win
g:C
;CH
;OH
;C2H
;
O2;A
r;SO
;W18
2
right
win
g:C
;CH
;OH
;C2H
;
N2;O
2;W18
2;
left
win
g:C
;OH
;C2H
;
O2;A
r;SO
;W18
2;
right
win
g:C
;CH
;OH
;
C2H
;N2;
O2;A
r;SO
2
24.0
2.09
–03
-03-
09:
C,C
H,O
H,C
2H,N
2,O
2,
Ar,
SO,S
O2,
C8H
5O3,
W18
2
(0.9
692
+0.
0158
m/z
)
C,C
H,O
H,C
2H,N
2,O
2,
Ar,
SO,S
O2,
W18
2
(1.1
019
+0.
0188
m/z
)
aver
age
ofal
lmas
ses
forb
oth
win
gs
left
win
g:C
;CH
;OH
;C2H
;
O2;A
r;SO
;W18
2
right
win
g:C
;CH
;OH
;N2;
O2;A
r;SO
;SO
2
V W V W
wee
k
W I D T H S H A P E
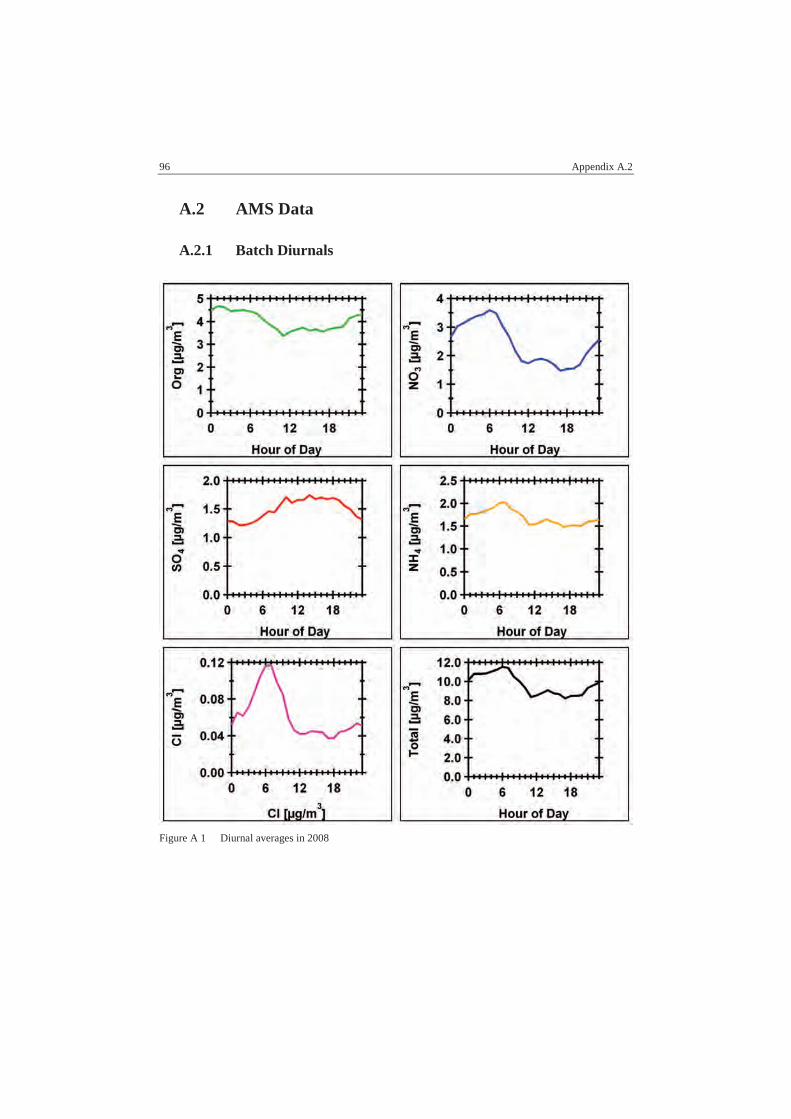
96 Appendix A.2
A.2 AMS Data
A.2.1 Batch Diurnals
Figure A 1 Diurnal averages in 2008

Appendix A.2 97
Figure A 2 Diurnal averages in 2009

98 Appendix A.2
A.2.2 Size Distributions
Figure A 3 Size distribution image plots of organic and nitrate in 2008.

Appendix A.2 99
Figure A 4 Size distribution image plots of sulfate and ammonium in 2008.

100 Appendix A.2
Figure A 5 Size distribution image plots of chloride and total in 2008.
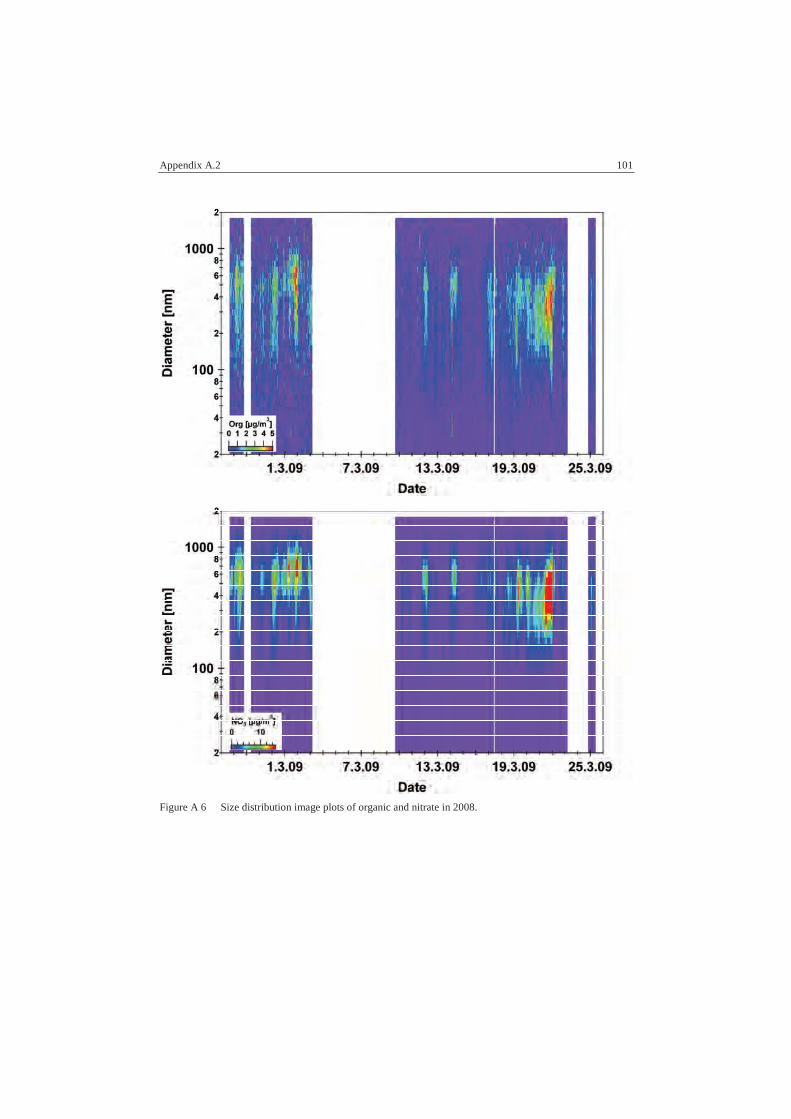
Appendix A.2 101
Figure A 6 Size distribution image plots of organic and nitrate in 2008.
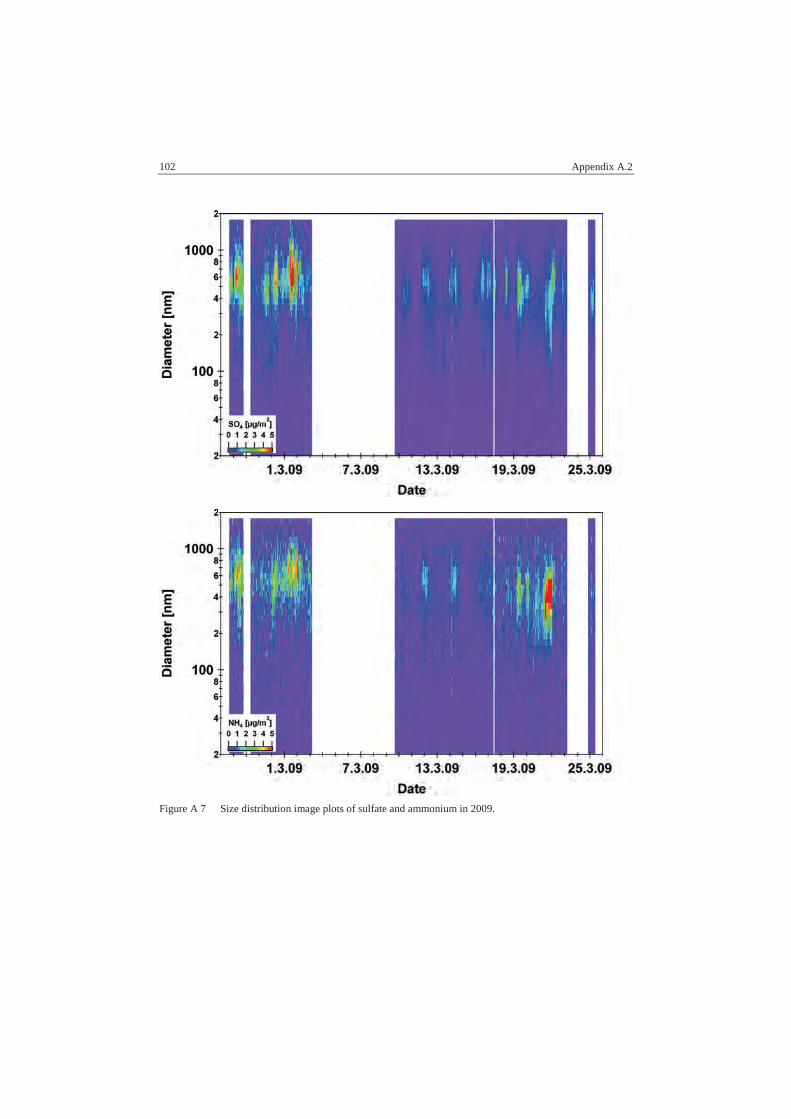
102 Appendix A.2
Figure A 7 Size distribution image plots of sulfate and ammonium in 2009.
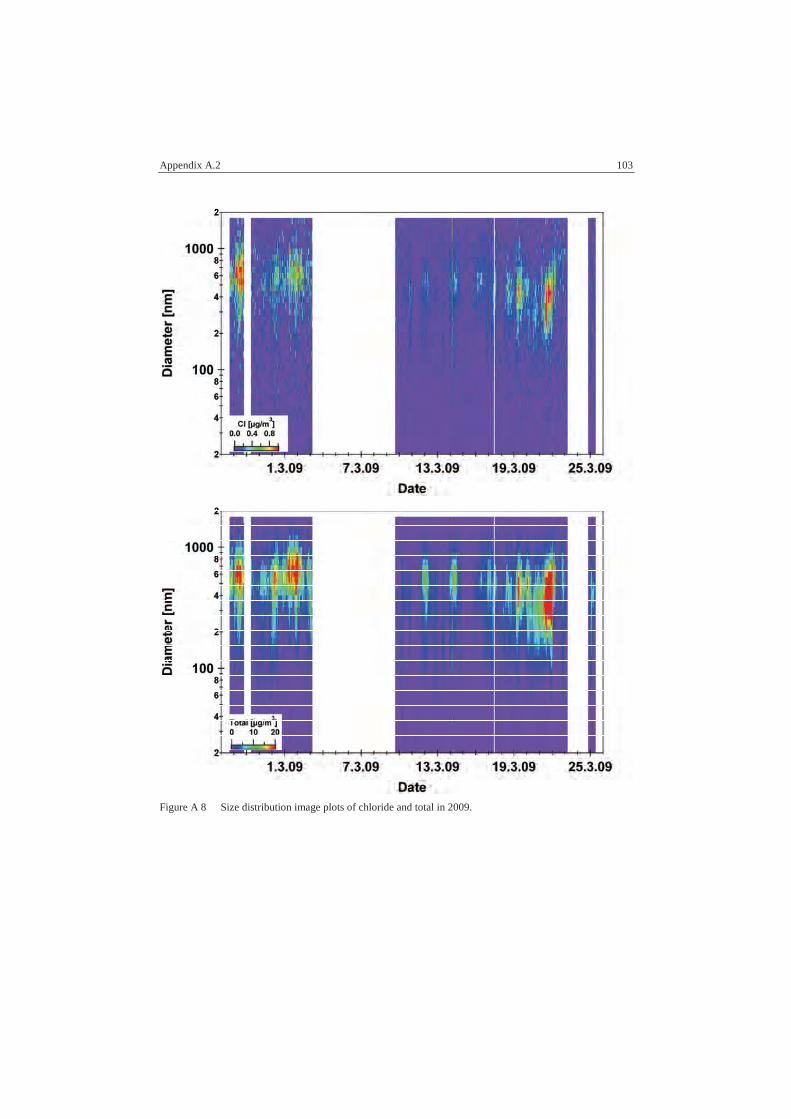
Appendix A.2 103
Figure A 8 Size distribution image plots of chloride and total in 2009.
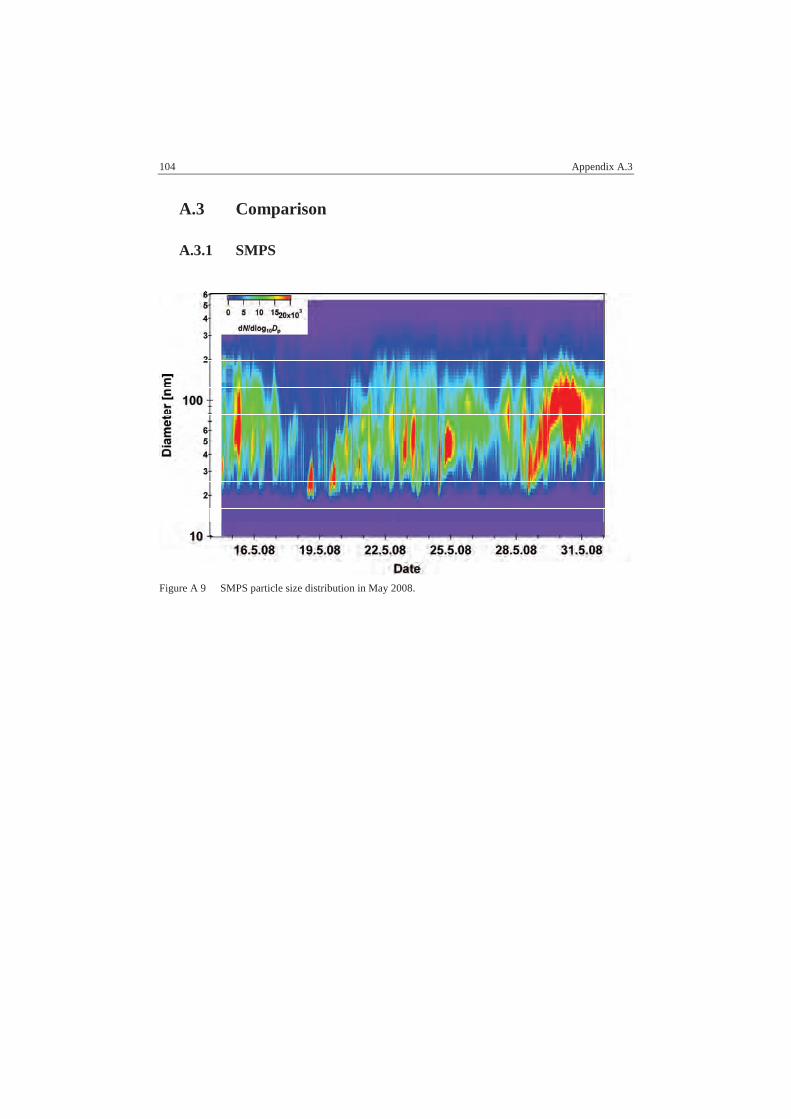
104 Appendix A.3
A.3 Comparison
A.3.1 SMPS
Figure A 9 SMPS particle size distribution in May 2008.

Appendix A.3 105
A.3.2 MARGA 2008
Figure A 10 Correlation AMS inorganic species to MARGA data in 2008.

106 Appendix A.3
A.3.3 MARGA 2009
Figure A 11 Correlation AMS inorganic species to MARGA data in 2009.

Appendix A.3 107
A.3.4 MARGA Sizer
Figure A 12 Correlation AMS inorganic species to MARGA Sizer PM(0.18 µm) data in 2008.

108 Appendix A.3
Figure A 13 Correlation AMS inorganic species to MARGA Sizer PM(0.32 µm) data in 2008.
Figure A 14 Correlation AMS inorganic species to MARGA Sizer PM(1.00 µm) data in 2008.

Appendix A.3 109
Figure A 15 Correlation AMS inorganic species to MARGA Sizer PM(2.00 µm) data in 2008.

110 Appendix A.4
A.4 PMF Data
Figure A 16 Correlation of PMF factor 1 MS to OOA1 MS from [Lanz et al., 2008] (top) and factor 3 MSto HOA MS from [Zhang et al., 2005] in 2008.
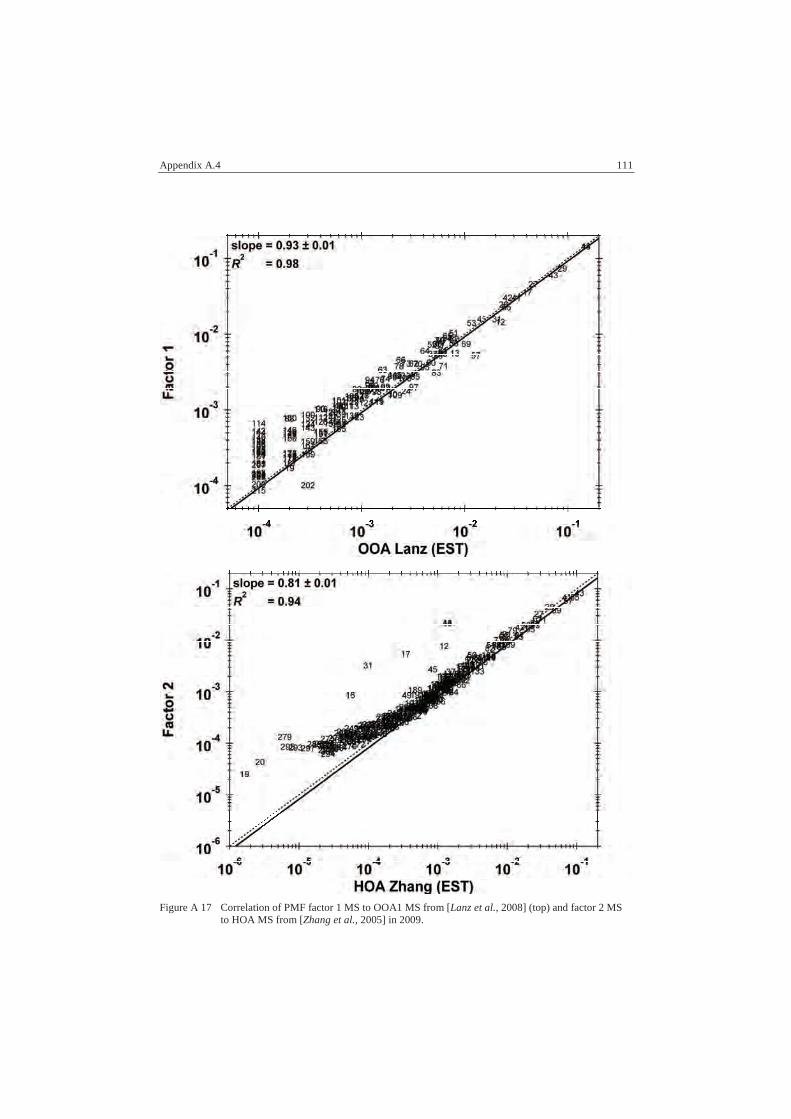
Appendix A.4 111
Figure A 17 Correlation of PMF factor 1 MS to OOA1 MS from [Lanz et al., 2008] (top) and factor 2 MSto HOA MS from [Zhang et al., 2005] in 2009.


Erklärung
ErklärungIch versichere, dass ich die von mir vorgelegte Dissertation selbständig angefertigt,
die benutzten Quellen und Hilfsmittel vollständig angegeben und die Stellen der Arbeit –
einschließlich Tabellen, Karten und Abbildungen – die anderen Werken im Wortlaut oder
dem Sinn nach entnommen sind, in jedem Einzelfall als Entlehnung kenntlich gemacht
habe; dass diese Dissertation noch keiner anderen Fakultät oder Universität zur Prüfung
vorgelegen hat; dass sie – abgesehen von unten angegebenen Teilpublikationen – noch
nicht veröffentlicht worden ist sowie, dass ich eine solche Veröffentlichung vor Abschluss
des Promotionsverfahrens nicht vornehmen werde. Die Bestimmungen dieser
Promotionsordnung sind mir bekannt. Die von mir vorgelegte Dissertation ist von
PD Dr. Andreas Hofzumahaus am Forschungszentrum Jülich, ICG-2: Troposphäre betreut
worden.
Teilpublikationen:
Fry et al. (2009), Organic nitrate and secondary organic aerosol yield from NO3
oxidation of β-pinene evaluated using a gas-phase kinetics/aerosol partitioning model,
Atmospheric Chemistry and Physics, 9 (4), 1431-1449.
Rollins et al. (2009), Isoprene oxidation by nitrate radical: alkyl nitrate and
secondary organic aerosol yields, Atmospheric Chemistry and Physics, 9 (18), 6685-6703.
Köln, den 25.02.2010
Amewu Mensah

Danksagung
DanksagungAngesichts der vorangegangenen Seiten gilt mein erster Dank PD Astrid Kiendler-
Scharr. Sie hat mich weit über das normale Mass hinaus unterstützt, motiviert und geleitet.
Vielen, vielen Dank für dein Verständnis und deine Unterstützung.
Ich danke meinen beiden Prüfern Herrn PD Andreas Hofzumahaus für die
angenehme Betreuung als Doktorvater und Herrn Prof. Andreas Wahner nicht nur für die
Übernahme des Koreferats sondern auch in seiner Funktion als Institutsdirektor.
Ein grosser Dank geht an die Christiane Nüsslein-Volhard-Stiftung, deren
Stipendiatin ich sein durfte. Ich möchte mich nicht nur für die finanzielle Unterstützung,
die die Organisation des Alltages als Doktorandin mit Kind wesentlich erleichtert hat,
sondern auch für die Möglichkeit sich mit anderen motivierten Wissenschaftlerinnen
austauschen zu können bedanken.
Ich bedanke mich bei der Hetero-Gruppe für die schöne und wissenschaftlich stets
anregende Zeit, ganz besonders bei Achim, Angela, Ralf, Thomas und meinen beiden
Bürogenossen Thorsten und Bettina.
Ich danke Frau Berger für ihre Fürsorglichkeit und Sorgfältigkeit, dem IT-Team,
hier im Besonderen Helga London und Michael Decker, für viel Hilfsbereitschaft und
Geduld und den Mitarbeitern der Werkstätten für ihre tatkräftige Unterstützung.
Dem gesamten ICG-2 nunmehr IEK-8 danke ich für die tolle Zusammenarbeit und
das angenehme Arbeitsklima.
Meine grosse Bewunderung gilt meinen Beifahrern Anke und Miikka für ihre
Unerschrockenheit und unerwähnt darf auch nicht die Jülicher Kantine mit ihrem Personal
bleiben, die so hervorragend für mein leibliches Wohl gesorgt hat.
Ich danke meinen Eltern, ohne die ich jetzt nicht dort wäre, wo ich jetzt bin. Meiner
kleinen Familie Stephan, Romeo und Fiona gilt mein ganz besonderer Dank, die ihr mich
jeder auf seine Weise bei dem Unterfangen Doktorarbeit unterstützt und begleitet habt.
Nochmals möchte ich meinen Dank an meine Studienkollegen aller Generationen
äussern. Ich habe im Laufe meines Studiums sehr liebe und interessante Menschen kennen
gelernt. Ich danke der deutschen Gesellschaft, die mein Studium finanziert und mir damit
unabhängig von meiner Herkunft eine hervorragende Ausbildung ermöglicht hat.


Schriften des Forschungszentrums Jülich Reihe Energie & Umwelt / Energy & Environment
1. Einsatz von multispektralen Satellitenbilddaten in der Wasserhaushalts- und Stoffstrommodellierung – dargestellt am Beispiel des Rureinzugs-gebietes von C. Montzka (2008), XX, 238 Seiten ISBN: 978-3-89336-508-1
2. Ozone Production in the Atmosphere Simulation Chamber SAPHIR by C. A. Richter (2008), XIV, 147 pages ISBN: 978-3-89336-513-5
3. Entwicklung neuer Schutz- und Kontaktierungsschichten für Hochtempe-ratur-Brennstoffzellen von T. Kiefer (2008), 138 Seiten ISBN: 978-3-89336-514-2
4. Optimierung der Reflektivität keramischer Wärmedämmschichten aus Yttrium-teilstabilisiertem Zirkoniumdioxid für den Einsatz auf metallischen Komponenten in Gasturbinen von A. Stuke (2008), X, 201 Seiten ISBN: 978-3-89336-515-9
5. Lichtstreuende Oberflächen, Schichten und Schichtsysteme zur Verbes-serung der Lichteinkopplung in Silizium-Dünnschichtsolarzellen von M. Berginski (2008), XV, 171 Seiten ISBN: 978-3-89336-516-6
6. Politikszenarien für den Klimaschutz IV – Szenarien bis 2030 hrsg.von P. Markewitz, F. Chr. Matthes (2008), 376 Seiten ISBN 978-3-89336-518-0
7. Untersuchungen zum Verschmutzungsverhalten rheinischer Braunkohlen in Kohledampferzeugern von A. Schlüter (2008), 164 Seiten ISBN 978-3-89336-524-1
8. Inorganic Microporous Membranes for Gas Separation in Fossil Fuel Power Plants by G. van der Donk (2008), VI, 120 pages ISBN: 978-3-89336-525-8
9. Sinterung von Zirkoniumdioxid-Elektrolyten im Mehrlagenverbund der oxidkeramischen Brennstoffzelle (SOFC) von R. Mücke (2008), VI, 165 Seiten ISBN: 978-3-89336-529-6
10. Safety Considerations on Liquid Hydrogen by K. Verfondern (2008), VIII, 167 pages ISBN: 978-3-89336-530-2
Schriften des Forschungszentrums Jülich Reihe Energie & Umwelt / Energy & Environment
11. Kerosinreformierung für Luftfahrtanwendungen von R. C. Samsun (2008), VII, 218 Seiten ISBN: 978-3-89336-531-9
12. Der 4. Deutsche Wasserstoff Congress 2008 – Tagungsband hrsg. von D. Stolten, B. Emonts, Th. Grube (2008), 269 Seiten ISBN: 978-3-89336-533-3
13. Organic matter in Late Devonian sediments as an indicator for environ-mental changes by M. Kloppisch (2008), XII, 188 pages ISBN: 978-3-89336-534-0
14. Entschwefelung von Mitteldestillaten für die Anwendung in mobilen Brennstoffzellen-Systemen von J. Latz (2008), XII, 215 Seiten ISBN: 978-3-89336-535-7
15. RED-IMPACT Impact of Partitioning, Transmutation and Waste Reduction Technologies on the Final Nuclear Waste Disposal SYNTHESIS REPORT ed. by W. von Lensa, R. Nabbi, M. Rossbach (2008), 178 pages ISBN 978-3-89336-538-8
16. Ferritic Steel Interconnectors and their Interactions with Ni Base Anodes in Solid Oxide Fuel Cells (SOFC) by J. H. Froitzheim (2008), 169 pages ISBN: 978-3-89336-540-1
17. Integrated Modelling of Nutrients in Selected River Basins of Turkey Results of a bilateral German-Turkish Research Project project coord. M. Karpuzcu, F. Wendland (2008), XVI, 183 pages ISBN: 978-3-89336-541-8
18. Isotopengeochemische Studien zur klimatischen Ausprägung der Jünge-ren Dryas in terrestrischen Archiven Eurasiens von J. Parplies (2008), XI, 155 Seiten, Anh. ISBN: 978-3-89336-542-5
19. Untersuchungen zur Klimavariabilität auf dem Tibetischen Plateau - Ein Beitrag auf der Basis stabiler Kohlenstoff- und Sauerstoffisotope in Jahrringen von Bäumen waldgrenznaher Standorte von J. Griessinger (2008), XIII, 172 Seiten ISBN: 978-3-89336-544-9

Schriften des Forschungszentrums Jülich Reihe Energie & Umwelt / Energy & Environment
20. Neutron-Irradiation + Helium Hardening & Embrittlement Modeling of 9%Cr-Steels in an Engineering Perspective (HELENA) by R. Chaouadi (2008), VIII, 139 pages ISBN: 978-3-89336-545-6
21. in Bearbeitung
22. Verbundvorhaben APAWAGS (AOEV und Wassergenerierung) – Teilprojekt: Brennstoffreformierung – Schlussbericht von R. Peters, R. C. Samsun, J. Pasel, Z. Porš, D. Stolten (2008), VI, 106 Sei-ten ISBN: 978-3-89336-547-0
23. FREEVAL Evaluation of a Fire Radiative Power Product derived from Meteosat 8/9 and Identification of Operational User Needs Final Report project coord. M. Schultz, M. Wooster (2008), 139 pages ISBN: 978-3-89336-549-4
24. Untersuchungen zum Alkaliverhalten unter Oxycoal-Bedingungen von C. Weber (2008), VII, 143, XII Seiten ISBN: 978-3-89336-551-7
25. Grundlegende Untersuchungen zur Freisetzung von Spurstoffen, Heiß-gaschemie, Korrosionsbeständigkeit keramischer Werkstoffe und Alkali-rückhaltung in der Druckkohlenstaubfeuerung von M. Müller (2008), 207 Seiten ISBN: 978-3-89336-552-4
26. Analytik von ozoninduzierten phenolischen Sekundärmetaboliten in Nicotiana tabacum L. cv Bel W3 mittels LC-MS von I. Koch (2008), III, V, 153 Seiten ISBN 978-3-89336-553-1
27. IEF-3 Report 2009. Grundlagenforschung für die Anwendung (2009), ca. 230 Seiten ISBN: 978-3-89336-554-8
28. Influence of Composition and Processing in the Oxidation Behavior of MCrAlY-Coatings for TBC Applications by J. Toscano (2009), 168 pages ISBN: 978-3-89336-556-2
29. Modellgestützte Analyse signifikanter Phosphorbelastungen in hessi-schen Oberflächengewässern aus diffusen und punktuellen Quellen von B. Tetzlaff (2009), 149 Seiten ISBN: 978-3-89336-557-9

Schriften des Forschungszentrums Jülich Reihe Energie & Umwelt / Energy & Environment
30. Nickelreaktivlot / Oxidkeramik – Fügungen als elektrisch isolierende Dich-tungskonzepte für Hochtemperatur-Brennstoffzellen-Stacks von S. Zügner (2009), 136 Seiten ISBN: 978-3-89336-558-6
31. Langzeitbeobachtung der Dosisbelastung der Bevölkerung in radioaktiv kontaminierten Gebieten Weißrusslands – Korma-Studie von H. Dederichs, J. Pillath, B. Heuel-Fabianek, P. Hill, R. Lennartz (2009), Getr. Pag. ISBN: 978-3-89336-532-3
32. Herstellung von Hochtemperatur-Brennstoffzellen über physikalische Gasphasenabscheidung von N. Jordán Escalona (2009), 148 Seiten ISBN: 978-3-89336-532-3
33. Real-time Digital Control of Plasma Position and Shape on the TEXTOR Tokamak by M. Mitri (2009), IV, 128 pages ISBN: 978-3-89336-567-8
34. Freisetzung und Einbindung von Alkalimetallverbindungen in kohle-befeuerten Kombikraftwerken von M. Müller (2009), 155 Seiten ISBN: 978-3-89336-568-5
35. Kosten von Brennstoffzellensystemen auf Massenbasis in Abhängigkeit von der Absatzmenge von J. Werhahn (2009), 242 Seiten ISBN: 978-3-89336-569-2
36. Einfluss von Reoxidationszyklen auf die Betriebsfestigkeit von anodenge-stützten Festoxid-Brennstoffzellen von M. Ettler (2009), 138 Seiten ISBN: 978-3-89336-570-8
37. Großflächige Plasmaabscheidung von mikrokristallinem Silizium für mikromorphe Dünnschichtsolarmodule von T. Kilper (2009), XVII, 154 Seiten ISBN: 978-3-89336-572-2
38. Generalized detailed balance theory of solar cells by T. Kirchartz (2009), IV, 198 pages ISBN: 978-3-89336-573-9
39. The Influence of the Dynamic Ergodic Divertor on the Radial Electric Field at the Tokamak TEXTOR von J. W. Coenen (2009), xii, 122, XXVI pages ISBN: 978-3-89336-574-6

Schriften des Forschungszentrums Jülich Reihe Energie & Umwelt / Energy & Environment
40. Sicherheitstechnik im Wandel Nuklearer Systeme von K. Nünighoff (2009), viii, 215 Seiten ISBN: 978-3-89336-578-4
41. Pulvermetallurgie hochporöser NiTi-Legierungen für Implanat- und Dämpfungsanwendungen von M. Köhl (2009), XVII, 199 Seiten ISBN: 978-3-89336-580-7
42. Einfluss der Bondcoatzusammensetzung und Herstellungsparameter auf die Lebensdauer von Wärmedämmschichten bei zyklischer Tempera-turbelastung von M. Subanovic (2009), 188, VI Seiten ISBN: 978-3-89336-582-1
43. Oxygen Permeation and Thermo-Chemical Stability of Oxygen Permeation Membrane Materials for the Oxyfuel Process by A. J. Ellett (2009), 176 pages ISBN: 978-3-89336-581-4
44. Korrosion von polykristallinem Aluminiumoxid (PCA) durch Metalljodidschmelzen sowie deren Benetzungseigenschaften von S. C. Fischer (2009), 148 Seiten ISBN: 978-3-89336-584-5
45. IEF-3 Report 2009. Basic Research for Applications (2009), 217 Seiten ISBN: 978-3-89336-585-2
46. Verbundvorhaben ELBASYS (Elektrische Basissysteme in einem CFK-Rumpf) - Teilprojekt: Brennstoffzellenabgase zur Tankinertisierung - Schlussbericht von R. Peters, J. Latz, J. Pasel, R. C. Samsun, D. Stolten (2009), xi, 202 Seiten ISBN: 978-3-89336-587-6
47. Aging of 14C-labeled Atrazine Residues in Soil: Location, Characterization and Biological Accessibility by N. D. Jablonowski (2009), IX, 104 pages ISBN: 978-3-89336-588-3
48. Entwicklung eines energetischen Sanierungsmodells für den europäi-schen Wohngebäudesektor unter dem Aspekt der Erstellung von Szenari-en für Energie- und CO2 - Einsparpotenziale bis 2030 von P. Hansen (2009), XXII, 281 Seiten ISBN: 978-3-89336-590-6

Schriften des Forschungszentrums Jülich Reihe Energie & Umwelt / Energy & Environment
49. Reduktion der Chromfreisetzung aus metallischen Interkonnektoren für Hochtemperaturbrennstofzellen durch Schutzschichtsysteme von R. Trebbels (2009), iii, 135 Seiten ISBN: 978-3-89336-591-3
50. Bruchmechanische Untersuchung von Metall / Keramik-Verbundsystemen für die Anwendung in der Hochtemperaturbrennstoffzelle von B. Kuhn (2009), 118 Seiten ISBN: 978-3-89336-592-0
51. Wasserstoff-Emissionen und ihre Auswirkungen auf den arktischen Ozonverlust Risikoanalyse einer globalen Wasserstoffwirtschaft von T. Feck (2009), 180 Seiten ISBN: 978-3-89336-593-7
52. Development of a new Online Method for Compound Specific Measure-ments of Organic Aerosols by T. Hohaus (2009), 156 pages ISBN: 978-3-89336-596-8
53. Entwicklung einer FPGA basierten Ansteuerungselektronik für Justageeinheiten im Michelson Interferometer von H. Nöldgen (2009), 121 Seiten ISBN: 978-3-89336-599-9
54. Observation – and model – based study of the extratropical UT/LS by A. Kunz (2010), xii, 120, xii pages ISBN: 978-3-89336-603-3
55. Herstellung polykristalliner Szintillatoren für die Positronen-Emissions-Tomographie (PET) von S. K. Karim (2010), VIII, 154 Seiten ISBN: 978-3-89336-610-1
56. Kombination eines Gebäudekondensators mit H2-Rekombinatorelementen in Leichwasserreaktoren von S. Kelm (2010), vii, 119 Seiten ISBN: 978-3-89336-611-8
57. Plant Leaf Motion Estimation Using A 5D Affine Optical Flow Model by T. Schuchert (2010), X, 143 pages ISBN: 978-3-89336-613-2
58. Tracer-tracer relations as a tool for research on polar ozone loss by R. Müller (2010), 116 pages ISBN: 978-3-89336-614-9

Schriften des Forschungszentrums Jülich Reihe Energie & Umwelt / Energy & Environment
59. Sorption of polycyclic aromatic hydrocarbon (PAH) to Yangtze River sediments and their components by J. Zhang (2010), X, 109 pages ISBN: 978-3-89336-616-3
60. Weltweite Innovationen bei der Entwicklung von CCS-Technologien und Möglichkeiten der Nutzung und des Recyclings von CO2
Studie im Auftrag des BMWi von W. Kuckshinrichs et al. (2010), X, 139 Seiten ISBN: 978-3-89336-617-0
61. Herstellung und Charakterisierung von sauerstoffionenleitenden Dünnschichtmembranstrukturen von M. Betz (2010), XII, 112 Seiten ISBN: 978-3-89336-618-7
62. Politikszenarien für den Klimaschutz V – auf dem Weg zum Strukturwan-del, Treibhausgas-Emissionsszenarien bis zum Jahr 2030 hrsg. von P. Hansen, F. Chr. Matthes (2010), 276 Seiten ISBN: 978-3-89336-619-4
63. Charakterisierung Biogener Sekundärer Organischer Aerosole mit Statis-tischen Methoden von C. Spindler (2010), iv, 163 Seiten ISBN: 978-3-89336-622-4
64. Stabile Algorithmen für die Magnetotomographie an Brennstoffzellen von M. Wannert (2010), ix, 119 Seiten ISBN: 978-3-89336-623-1
65. Sauerstofftransport und Degradationsverhalten von Hochtemperatur-membranen für CO2-freie Kraftwerke von D. Schlehuber (2010), VII, 139 Seiten ISBN: 978-3-89336-630-9
66. Entwicklung und Herstellung von foliengegossenen, anodengestützten Festoxidbrennstoffzellen von W. Schafbauer (2010), VI, 164 Seiten ISBN: 978-3-89336-631-6
67. Disposal strategy of proton irradiated mercury from high power spallation sources by S. Chiriki (2010), xiv, 124 pages ISBN: 978-3-89336-632-3
68. Oxides with polyatomic anions considered as new electrolyte materials for solid oxide fuel cells (SOFCs) by O. H. Bin Hassan (2010), vii, 121 pages ISBN: 978-3-89336-633-0

Schriften des Forschungszentrums Jülich Reihe Energie & Umwelt / Energy & Environment
69. Von der Komponente zum Stack: Entwicklung und Auslegung von HT-PEFC-Stacks der 5 kW-Klasse von A. Bendzulla (2010), IX, 203 Seiten ISBN: 978-3-89336-634-7
70. Satellitengestützte Schwerewellenmessungen in der Atmosphäre und Perspektiven einer zukünftigen ESA Mission (PREMIER) von S. Höfer (2010), 81 Seiten ISBN: 978-3-89336-637-8
71. Untersuchungen der Verhältnisse stabiler Kohlenstoffisotope in atmo-sphärisch relevanten VOC in Simulations- und Feldexperimenten von H. Spahn (2010), IV, 210 Seiten ISBN: 978-3-89336-638-5
72. Entwicklung und Charakterisierung eines metallischen Substrats für na-nostrukturierte keramische Gastrennmembranen von K. Brands (2010), vii, 137 Seiten ISBN: 978-3-89336-640-8
73. Hybridisierung und Regelung eines mobilen Direktmethanol-Brennstoff-zellen-Systems von J. Chr. Wilhelm (2010), 220 Seiten ISBN: 978-3-89336-642-2
74. Charakterisierung perowskitischer Hochtemperaturmembranen zur Sau-erstoffbereitstellung für fossil gefeuerte Kraftwerksprozesse von S.A. Möbius (2010) III, 208 Seiten ISBN: 978-3-89336-643-9
75. Characterization of natural porous media by NMR and MRI techniques: High and low magnetic field studies for estimation of hydraulic properties by L.-R. Stingaciu (2010), 96 pages ISBN: 978-3-89336-645-3
76. Hydrological Characterization of a Forest Soil Using Electrical Resistivity Tomography by Chr. Oberdörster (2010), XXI, 151 pages ISBN: 978-3-89336-647-7
77. Ableitung von atomarem Sauerstoff und Wasserstoff aus Satellitendaten und deren Abhängigkeit vom solaren Zyklus von C. Lehmann (2010), 127 Seiten ISBN: 978-3-89336-649-1
Schriften des Forschungszentrums Jülich Reihe Energie & Umwelt / Energy & Environment
78. 18th World Hydrogen Energy Conference 2010 – WHEC2010 Proceedings Speeches and Plenary Talks ed. by D. Stolten, B. Emonts (2010) ISBN: 978-3-89336-658-3
78-1. 18th World Hydrogen Energy Conference 2010 – WHEC2010 Proceedings Parallel Sessions Book 1: Fuel Cell Basics / Fuel Infrastructures ed. by D. Stolten, T. Grube (2010), ca. 460 pages ISBN: 978-3-89336-651-4 78-2. 18th World Hydrogen Energy Conference 2010 – WHEC2010 Proceedings Parallel Sessions Book 2: Hydrogen Production Technologies – Part 1 ed. by D. Stolten, T. Grube (2010), ca. 400 pages ISBN: 978-3-89336-652-1 78-3. 18th World Hydrogen Energy Conference 2010 – WHEC2010 Proceedings Parallel Sessions Book 3: Hydrogen Production Technologies – Part 2 ed. by D. Stolten, T. Grube (2010), ca. 640 pages ISBN: 978-3-89336-653-8 78-4. 18th World Hydrogen Energy Conference 2010 – WHEC2010 Proceedings Parallel Sessions Book 4: Storage Systems / Policy Perspectives, Initiatives and Cooperations ed. by D. Stolten, T. Grube (2010), ca. 500 pages ISBN: 978-3-89336-654-5 78-5. 18th World Hydrogen Energy Conference 2010 – WHEC2010 Proceedings Parallel Sessions Book 5: Stategic Analysis / Safety Issues / Existing and Emerging Markets ed. by D. Stolten, T. Grube (2010), ca. 530 pages ISBN: 978-3-89336-655-2 78-6. 18th World Hydrogen Energy Conference 2010 – WHEC2010 Proceedings Parallel Sessions Book 6: Stationary Applications / Transportation Applications ed. by D. Stolten, T. Grube (2010), ca. 330 pages ISBN: 978-3-89336-656-9

Schriften des Forschungszentrums Jülich Reihe Energie & Umwelt / Energy & Environment
78 Set (complete book series)
18th World Hydrogen Energy Conference 2010 – WHEC2010 Proceedings ed. by D. Stolten, T. Grube, B. Emonts (2010) ISBN: 978-3-89336-657-6
79. Ultrafast voltex core dynamics investigated by finite-element micromag-netic simulations by S. Gliga (2010), vi, 144 pages ISBN: 978-3-89336-660-6
80. Herstellung und Charakterisierung von keramik- und metallgestützten Membranschichten für die CO2-Abtrennung in fossilen Kraftwerken von F. Hauler (2010), XVIII, 178 Seiten ISBN: 978-3-89336-662-0
81. Experiments and numerical studies on transport of sulfadiazine in soil columns by M. Unold (2010), xvi, 115 pages ISBN: 978-3-89336-663-7
82. Prompt-Gamma-Neutronen-Aktivierungs-Analyse zur zerstörungsfreien Charakterisierung radioaktiver Abfälle von J.P.H. Kettler (2010), iv, 205 Seiten ISBN: 978-3-89336-665-1
83. Transportparameter dünner geträgerter Kathodenschichten der oxidkera-mischen Brennstoffzelle von C. Wedershoven (2010), vi, 137 Seiten ISBN: 978-3-89336-666-8
84. Charakterisierung der Quellverteilung von Feinstaub und Stickoxiden in ländlichem und städtischem Gebiet von S. Urban (2010), vi, 211 Seiten ISBN: 978-3-89336-669-9
85. Optics of Nanostructured Thin-Film Silicon Solar Cells by C. Haase (2010), 150 pages ISBN: 978-3-89336-671-2
86. Entwicklung einer Isolationsschicht für einen Leichtbau-SOFC-Stack von R. Berhane (2010), X, 162 Seiten ISBN: 978-3-89336-672-9
87. Hydrogen recycling and transport in the helical divertor of TEXTOR by M. Clever (2010), x, 172 pages ISBN: 978-3-89336-673-6

Schriften des Forschungszentrums Jülich Reihe Energie & Umwelt / Energy & Environment
88. Räumlich differenzierte Quantifizierung der N- und P-Einträge in Grund-wasser und Oberflächengewässer in Nordrhein-Westfalen unter besonde-rer Berücksichtigung diffuser landwirtschaftlicher Quellen von F. Wendland et. al. (2010), xii, 216 Seiten ISBN: 978-3-89336-674-3
89. Oxidationskinetik innovativer Kohlenstoffmaterialien hinsichtlich schwe-rer Lufteinbruchstörfälle in HTR´s und Graphitentsorgung oder Aufarbei-tung von B. Schlögl (2010), ix, 117 Seiten ISBN: 978-3-89336-676-7
90. Chemische Heißgasreinigung bei Biomassenvergasungsprozessen von M. Stemmler (2010), xv, 196 Seiten ISBN: 978-3-89336-678-1
91. Untersuchung und Optimierung der Serienverschaltung von Silizium-Dünnschicht-Solarmodulen von S. Haas (2010), ii, 202 Seiten ISBN: 978-3-89336-680-4
92. Non-invasive monitoring of water and solute fluxes in a cropped soil by S. Garré (2010), xxiv, 133 pages ISBN: 978-3-89336-681-1
93. Improved hydrogen sorption kinetics in wet ball milled Mg hydrides by L. Meng (2011), II, 119 pages ISBN: 978-3-89336-687-3
94. Materials for Advanced Power Engineering 2010 ed. by J. Lecomte-Beckers, Q. Contrepois, T. Beck and B. Kuhn (2010), 1327 pages ISBN: 978-3-89336-685-9
95. 2D cross-hole MMR – Survey design and sensitivity analysis for cross-hole applications of the magnetometric resistivity by D. Fielitz (2011), xvi, 123 pages ISBN: 978-3-89336-689-7
96. Untersuchungen zur Oberflächenspannung von Kohleschlacken unter Vergasungsbedingungen von T. Melchior (2011), xvii, 270 Seiten ISBN: 978-3-89336-690-3
97. Secondary Organic Aerosols: Chemical Aging, Hygroscopicity, and Cloud Droplet Activation by A. Buchholz (2011), xiv, 134 pages ISBN: 978-3-89336-691-0
Schriften des Forschungszentrums Jülich Reihe Energie & Umwelt / Energy & Environment
98. Chrom-bezogene Degradation von Festoxid-Brennstoffzellen von A. Neumann (2011), xvi, 218 Seiten ISBN: 978-3-89336-692-7
99. Amorphous and microcrystalline silicon applied in very thin tandem solar cells by S. Schicho (2011), XII, 190 pages ISBN: 978-3-89336-693-4
100. Sol-gel and nano-suspension electrolyte layers for high performance solid oxide fuel cells by F. Han (2011), iv, 131 pages ISBN: 978-3-89336-694-1
101. Impact of different vertical transport representations on simulating processes in the tropical tropopause layer (TTL) by F. Plöger (2011), vi, 104 pages ISBN: 978-3-89336-695-8
102. Untersuchung optischer Nanostrukturen für die Photovoltaik mit Nah-feldmikroskopie von T. Beckers (2011), xiii, 128 Seiten ISBN: 978-3-89336-696-5
103. Impact of contamination on hydrogenated amorphous silicon thin films & solar cells by J. Wördenweber (2011), XIV, 138 pages ISBN: 978-3-89336-697-2
104. Water and Organic Nitrate Detection in an AMS: Laboratory Characteriza-tion and Application to Ambient Measurements by A. Mensah (2011), XI, 111 pages ISBN: 978-3-89336-698-9


Ener
gie
& U
mw
elt
Ener
gy &
Env
iron
men
t
104
Energie & Umwelt / Energy & EnvironmentBand / Volume 104ISBN 978-3-89336-698-9
Mitg
lied
der
Hel
mho
ltz-G
emei
nsch
aft
Mitg
lied
der
Hel
mho
ltz-G
emei
nsch
aft
Water and Organic Nitrate Detection in an AMS: Laboratory Characterization and Application to Ambient Measurements
Amewu A. Mensah
Amew
u A
. Men
sah
Wat
er a
nd O
rgan
ic N
itrat
e D
etec
tion
in a
n A
MS