ameron international corporation - securities and exchange
TRANSCRIPT

United StatesSECURITIES AND EXCHANGE COMMISSION
Washington, D.C. 20549
FORM 10-K
xxxx ANNUAL REPORT PURSUANT TO SECTION 13 OR 15(d) OF THE SECURITIES
EXCHANGE ACT OF 1934
For the fiscal year ended November 30, 2010
OR ¨̈̈̈ TRANSITION REPORT PURSUANT TO SECTION 13 OR 15(d) OF THE SECURITIES EXCHANGE
ACT OF 1934Commission File Number 1-9102
AMERON INTERNATIONAL CORPORATION
(Exact name of registrant as specified in its charter)
245 South Los Robles AvenuePasadena, CA 91101-3638
(Address and Zip Code of principal executive offices)Registrant's telephone number, including area code: (626) 683-4000
SECURITIES REGISTERED PURSUANT TO SECTION 12(b) OF THE ACT:
SECURITIES REGISTERED PURSUANT TO SECTION 12(g) OF THE ACT: None
Indicate by check mark if the registrant is a well-known seasoned issuer, as defined in Rule 405 of the Securities Act. Yes ¨̈̈̈ No xxxx Indicate by check mark if the registrant is not required to file reports pursuant to Section 13 or Section 15(d) of the Act. Yes ¨̈̈̈ No xxxx Indicate by check mark whether the registrant (1) has filed all reports required to be filed by Section 13 or 15(d) of the Securities Exchange Act of 1934 during the preceding 12 months (or for such shorter period that the registrant was required to file such reports), and (2) has been subject to such filing requirements for the past 90 days. Yes xxxx No ¨̈̈̈ Indicate by check mark whether the registrant has submitted electronically and posted on its corporate Web site, if any, every Interactive Data File required to be submitted and posted pursuant to Rule 405 of Regulation S-T (§232.405 of this chapter) during the preceding 12 months (or for such shorter period that the registrant was required to submit and post such files). Yes xxxx No ¨̈̈̈ Indicate by check mark if disclosure of delinquent filers pursuant to Item 405 of Regulation S-K is not contained herein, and will not be contained, to the best of registrant's knowledge, in definitive proxy or information statements incorporated by reference in Part III of this Form 10-K or any amendment to this Form 10-K. xxxx
Delaware 77-0100596 (State of Incorporation) (I.R.S. Employer Identification No.)
Title of each class Name of each exchange on which
registeredCommon Stock $2.50 par value New York Stock Exchange


Indicate by check mark whether the registrant is a large accelerated filer, an accelerated filer, a non-accelerated filer or a smaller reporting company. See the definitions of “large accelerated filer,” “accelerated filer” and “smaller reporting company” in Rule 12b-2 of the Exchange Act.
Indicate by check mark whether the registrant is a shell company (as defined in Rule 12b-2 of the Act). Yes ¨̈̈̈ No x The aggregate market value of voting and non-voting common equity held by non-affiliates was approximately $591 million on May 28, 2010, based upon the last reported sales price of such stock on the New York Stock Exchange on that date. On January 20, 2011 there were 9,251,105 shares of Common Stock, $2.50 par value, outstanding. No other class of Common Stock exists.
DOCUMENTS INCORPORATED BY REFERENCE 1. PORTIONS OF AMERON INTERNATIONAL CORPORATION'S PROXY STATEMENT FOR THE 2011 ANNUAL MEETING OF STOCKHOLDERS (PART III)
AMERON INTERNATIONAL CORPORATION AND SUBSIDIARIES
Large accelerated filer xxxx Accelerated filer ¨̈̈̈ Non-accelerated filer ¨̈̈̈ (Do not check if a smaller reporting
company)Smaller reporting company ¨̈̈̈
2

AMERON INTERNATIONAL CORPORATION AND SUBSIDIARIES
2010 ANNUAL REPORT ON FORM 10-K
Table of Contents
PART I 4 ITEM 1 - BUSINESS 4 ITEM 1A - RISK FACTORS 8 ITEM 1B - UNRESOLVED STAFF COMMENTS 10 ITEM 2 - PROPERTIES 10 ITEM 3 - LEGAL PROCEEDINGS 12 PART II 13 ITEM 5 - MARKET FOR REGISTRANT'S COMMON EQUITY AND RELATED STOCKHOLDER MATTERS AND ISSUER PURCHASES OF EQUITY SECURITIES 13 ITEM 6 - SELECTED FINANCIAL DATA 15 ITEM 7 - MANAGEMENT'S DISCUSSION AND ANALYSIS OF FINANCIAL CONDITION AND RESULTS OF OPERATIONS 16 ITEM 7A - QUANTITATIVE AND QUALITATIVE DISCLOSURES ABOUT MARKET RISK 30 ITEM 8 - FINANCIAL STATEMENTS AND SUPPLEMENTARY DATA 31 ITEM 9 - CHANGES IN AND DISAGREEMENTS WITH ACCOUNTANTS ON ACCOUNTING AND FINANCIAL DISCLOSURE 69 ITEM 9A - CONTROLS AND PROCEDURES 69 ITEM 9B - OTHER INFORMATION 69 PART III 70 ITEM 10 - DIRECTORS, EXECUTIVE OFFICERS AND CORPORATE GOVERNANCE 70 ITEM 11 - EXECUTIVE COMPENSATION * 71 ITEM 12 - SECURITY OWNERSHIP OF CERTAIN BENEFICIAL OWNERS AND MANAGEMENT AND RELATED STOCKHOLDER MATTERS * 71 ITEM 13 - CERTAIN RELATIONSHIPS AND RELATED TRANSACTIONS, AND DIRECTOR INDEPENDENCE * 71 ITEM 14 - PRINCIPAL ACCOUNTING FEES AND SERVICES * 71 PART IV 71 ITEM 15 - EXHIBITS, FINANCIAL STATEMENT SCHEDULES 71 * (Contained in the Company’s Proxy Statement which is incorporated herein by reference.)
Table of Contents 3

PART I
AMERON INTERNATIONAL CORPORATION
AMERON INTERNATIONAL CORPORATION, a Delaware corporation, and its consolidated subsidiaries are collectively referred to herein as "Ameron," the "Company," the "Registrant" or the "Corporation" unless the context clearly indicates otherwise. The business of the Company is divided into business segments, as described in Item 1(c)(1), herein. Substantially all activities relate to the manufacture of highly-engineered products for sale to the industrial, chemical, energy and construction markets. All references to "the year" or "the fiscal year" pertain to the 12 months ended November 30, 2010. All references to the "Proxy Statement" pertain to the Company's Proxy Statement to be filed on or about March 1, 2011 in connection with the 2011 Annual Meeting of Stockholders. ITEM 1 - BUSINESS (a) GENERAL DEVELOPMENT OF BUSINESS. Although the Company's antecedents date back to 1907, the Company evolved directly from the merger of two separate firms in 1929, resulting in the incorporation of American Concrete Pipe Company on April 22, 1929. Various name changes occurred between that time and 1942, at which time the Company's name became American Pipe and Construction Co. By the late 1960's the Company was almost exclusively engaged in manufacturing and had expanded its product lines to include not only concrete and steel pipe but also high-performance protective coatings, ready-mix concrete, aggregates and fiberglass pipe and fittings. In 1970, the Company's name was changed to Ameron, Inc. In the meantime, other manufactured product lines were added, including concrete and steel poles for street and area lighting and steel poles for traffic signals. In 1996, the Company's name was changed to Ameron International Corporation. In 2006, the Company sold its Performance Coatings & Finishes business (“Coatings Business”). Also in 2006, the Company began manufacturing large, steel towers that are used with wind turbines for generating electricity. In 2010, the Company sold its partial ownership in TAMCO, a mini-mill manufacturer of construction rebar. (b) FINANCIAL INFORMATION AS TO INDUSTRY SEGMENTS. Financial information on segments and affiliates may be found in Notes (1), (6) and (18) of the Notes to Consolidated Financial Statements, under Item 8, herein. (c) NARRATIVE DESCRIPTION OF BUSINESS. (1) For operational and geographical convenience, the Company is organized into divisions. These divisions are combined into groups serving various industry segments, as follows: a) The Fiberglass-Composite Pipe Group develops, manufactures and markets filament-wound and molded fiberglass pipe and fittings. These products are used by a wide range of process industries, including industrial, petroleum, chemical processing and petrochemical industries, for service station piping systems, aboard marine vessels and offshore oil platforms, and are marketed as an alternative to metallic piping systems which ultimately fail under corrosive operating conditions. These products are marketed directly, as well as through manufacturers' representatives, distributors and licensees. Competition is based upon quality, price and service. Manufacture of these products is carried out in the Company's plant in Burkburnett, Texas, by its wholly-owned domestic subsidiary, Centron International Inc. ("Centron"), at its plant in Mineral Wells, Texas, by wholly-owned subsidiaries in the Netherlands, Brazil, Singapore and Malaysia, and by an affiliate in Saudi Arabia.
AMERON INTERNATIONAL CORPORATION AND SUBSIDIARIES
Table of Contents 4
b) The Water Transmission Group supplies products and services used in the construction of water pipelines, lining and wind towers. Five pipe manufacturing plants are located in Arizona and California. Also included within this group is American Pipe & Construction International, a wholly-owned subsidiary, with two plants in Colombia, and Tubos Y Activos, a wholly-owned subsidiary, with a plant in Mexico. These plants manufacture concrete cylinder pipe, prestressed concrete cylinder pipe, steel pipe and reinforced concrete pipe for water transmission, storm and industrial waste water and sewage collection. Products are marketed directly using the Company's own personnel, typically through competitive bidding. Customers include local, state and federal agencies, developers and general contractors. Normally, no one customer or group of customers for the Company’s water pipe products will account for sales equal to or greater than 10 percent of the Company's consolidated revenue. However, occasionally, when more than one unusually large project is in progress, combined sales to U.S., state or local government agencies and/or general contractors for those agencies can reach those proportions. Besides competing with several other welded-steel pipe and concrete pipe manufacturers located in the market area, alternative products such as ductile iron, plastic, and clay pipe compete with the Company's concrete and steel pipe products; but ordinarily these other materials do not offer the full diameter range produced by the Company. Principal methods of competition are price, delivery schedule and service. The Company's technology is used in the Middle East through affiliated companies. This segment also includes the manufacturing and marketing, on a worldwide basis directly and through manufacturers' representatives, of polyvinyl chloride and polyethylene sheet lining for the protection of concrete pipe and cast-in-place concrete structures from the corrosive effects of sewer gases, acids and industrial chemicals. Competition is based upon quality, price and service. Manufacture of this product is carried out in the Company's plant in Brea, California. Additionally, the Company manufactures large-diameter towers for the U.S. wind-energy market at one of its California plants. Wind towers are sold to wind turbine manufacturers based on price, quality and availability. In 2009, Siemens Power Generation, Inc. purchased $66.4 million of wind towers from the Company, which was approximately 12% of the Company’s total consolidated sales and almost all of the Company’s wind tower sales. c) The Infrastructure Products Group supplies ready-mix concrete, crushed and sized basaltic aggregates, dune sand, concrete pipe and box culverts, primarily to the construction industry in Hawaii, and manufactures and markets concrete and steel poles for highway, street and outdoor area lighting and for traffic signals nationwide. Ample raw materials are typically available locally in Hawaii. As to rock products, the Company has exclusive rights to quarries containing many years' reserves. There is only one major source of supply for cement in Hawaii. Within the market area there are competitors for each of the segment's products. No single competitor offers the full range of products sold by the Company in Hawaii. An appreciable portion of the segment's business in Hawaii is obtained through competitive bidding. Sales of poles are nationwide, but with a stronger concentration in the western and southeastern U.S. Marketing of poles is handled by the Company's own sales force and by outside sales agents. Competition for poles is mainly based on price and quality, but with some consideration for service and delivery. Poles are manufactured in two plants in California, as well as in plants in Washington, Oklahoma and Alabama. d) As of November 30, 2010, the Company has two significant partially-owned affiliated companies ("affiliates"): Ameron Saudi Arabia, Ltd. ("ASAL") and Bondstrand, Ltd. ("BL"). ASAL, owned 30% by the Company, manufactures and sells concrete pressure pipe to customers in Saudi Arabia. BL, owned 40% by the Company, manufactures and sells glass reinforced epoxy pipe and fittings in Saudi Arabia. ASAL is included in the Water Transmission Group, and BL is included in the Fiberglass-Composite Pipe Group. Additionally, the Company also owned 50% of TAMCO, a steel mini-mill operating in California, which was sold on October 21, 2010. TAMCO is not included in the three operating groups. e) Except as individually outlined in the above descriptions of industry segments, the following comments or situations currently apply to all segments and applied during the three years ended November 30, 2010: (i) Raw material supplies are periodically constrained due to industry capacities. However, because of the number of manufacturing locations and the variety of raw materials essential to the business, no critical situations exist with respect to supply of materials. The Company has multiple sources for raw materials. The effects of increases in costs of energy are being mitigated to the extent practical through conservation and through addition or substitution of equipment to manage the use and reduce consumption of energy.
AMERON INTERNATIONAL CORPORATION AND SUBSIDIARIES
Table of Contents 5

(ii) The Company owns certain patents and trademarks, both U.S. and foreign, related to its products. The Company licenses its patents, trademarks, know-how and technical assistance to several of its subsidiary and affiliated companies and to third-party licensees, both in the U.S. and abroad. These patents, trademarks, and licenses do not constitute a material portion of the Company's total business. No franchises or concessions exist. (iii) Many of the Company's products are used in connection with capital goods, water and sewage transmission and construction of capital facilities. Weather conditions can cause favorable or adverse effects on general sales volume and earnings. Normally, sales volume and earnings will be lowest in the first fiscal quarter. Seasonal effects typically accelerate or slow the business volume and normally do not bring about severe changes in full-year activity. (iv) With respect to working capital items, the Company does not encounter any requirements which are not common to other companies engaged in similar industries. No unusual amounts of inventory are required to meet seasonal delivery requirements. In 2010, all of the Company's industry segments turned inventory between four and six times annually. At November 30, 2010, average days' sales in accounts receivable ranged between 35 and 157 for all segments. Excluding $25.1 million of unbilled receivables of the Water Transmission Group, the November 30, 2010 average days’ sales ranged between 35 and 91 for all segments. Due to the percentage-of-completion method of accounting used by the Water Transmission Group, which is outlined in Item 7, herein, accounts receivable, which include unbilled receivables, of the Water Transmission Group may be outstanding longer than if the percentage-of-completion method is not used. (v) Order backlogs at November 30, 2010 and 2009 by industry segment are shown below. Approximately 98% of the November 30, 2010 backlog is expected to be converted to sales during 2011. The Fiberglass-Composite Pipe Group’s backlog increased $7.9 million primarily due to expanding demand for onshore oilfield and ship construction piping. The Water Transmission Group’s backlog decreased $17.3 million due to large-diameter wind tower production in 2010 and the corresponding lack of new wind tower orders. The wind tower backlog at November 30, 2010 was $3.4 million, a decrease of $25.5 million from November 30, 2009. The decrease in the wind tower backlog reflects the weak demand and challenging market conditions in the wind energy industry. Excluding wind towers, Water Transmission Group’s backlog increased $8.2 million due to the timing of projects for water and sewer pipe infrastructure replacement. The backlog decreased at Infrastructure Products Group due to a continuing decline in commercial and residential construction markets in Hawaii and throughout the U.S.
(vi) Except for the sales of the Company’s investment in TAMCO and the Coatings Business, the introduction of the wind tower product line and the expansion of the Fiberglass-Composite Pipe Group in Brazil, there were no significant changes in the industries and localities in which the Company operated in recent years. The Company is not aware of any other changes in the competitive situation which would be material to an understanding of the Company’s businesses. (vii) Sales contracts in all of the Company's business segments normally consist of purchase orders, which in some cases are issued pursuant to master purchase agreements. Contracts seldom involve commitments of more than one year by the Company. In those instances when the Company commits to sell products under longer-term contracts, the Company will typically contractually arrange to fix a portion of its associated costs. Payment is normally due from 30 to 60 days after shipment, with progress payments prior to shipment in some circumstances. The Company does not typically extend long-term credit to purchasers of its products. For 2010, excluding the effect of unbilled receivables related to the percentage-of-completion method of accounting, trade receivables turned approximately an average of five times.
AMERON INTERNATIONAL CORPORATION AND SUBSIDIARIES
(In thousands) 2010 2009 Fiberglass-Composite Pipe Group $ 72,280 $ 64,405 Water Transmission Group 71,022 88,296 Infrastructure Products Group 20,253 23,046
Total $ 163,555 $ 175,747
Table of Contents 6

(viii) A number of the Company's operations operate outside the U.S. and are affected by changes in foreign exchange rates. Sales, profits, assets and liabilities could be materially impacted by changes in foreign exchange rates. From time to time, the Company borrows in various currencies to reduce the level of net assets subject to changes in foreign exchange rates or purchases foreign exchange forward and option contracts to hedge firm commitments, such as receivables and payables, denominated in foreign currencies. The Company does not typically hedge forecasted sales or items subject to translation adjustments, such as intercompany transactions of a long-term investment nature. (2) a) Costs during each of the last three years for research and development were $2.8 million in 2010, $6.0 million in 2009, and $4.3 million in 2008. Such costs, which are included in selling, general and administrative expenses, relate primarily to the development, design and testing of products, and are expensed as incurred. b) The Company's business is not dependent on any single customer or few customers, the loss of any one or more of whom would have a material adverse effect on its business, except as described above. c) For many years the Company consistently installed or improved devices to control or eliminate the discharge of pollutants into the environment. Accordingly, in 2010, compliance with federal, state, and locally-enacted provisions relating to protection of the environment did not have, and is not expected to have, a material effect upon the Company's capital expenditures, earnings, or competitive position. d) At year-end the Company and its consolidated subsidiaries employed approximately 2,300 persons. Of those, approximately 900 were covered by labor union contracts. One bargaining agreement is currently being renegotiated and is expected to be completed during 2011. No other bargaining agreements are subject to renegotiation in 2011. (d) FINANCIAL INFORMATION ABOUT FOREIGN AND DOMESTIC OPERATIONS. Aggregate sales from foreign operations as a percent of total sales were 35.0%, 31.4% and 31.3%, respectively, for the years ended November 30, 2010, 2009 and 2008. Financial information about foreign and domestic operations may be found in Note (18) of the Notes to Consolidated Financial Statements, under Item 8, herein. (e) AVAILABLE INFORMATION (1) The Company's Internet address is www.ameron.com (2) The Company makes available free of charge through its Internet website, its annual report on Form 10-K, quarterly reports on Form 10-Q, current reports on Form 8-K and amendments to those reports as soon as reasonably practicable after the Company electronically files such material with, or furnishes it to, the Securities and Exchange Commission (the "Commission"). FORWARD-LOOKING AND CAUTIONARY STATEMENTS All statements and assumptions contained in this Annual Report on Form 10-K and in the documents attached or incorporated by reference that do not directly and exclusively relate to historical facts constitute “forward-looking statements” within the meaning of the Safe Harbor provisions of the Private Securities Litigation Reform Act of 1995. These statements represent current expectations and beliefs of the Company, and no assurance can be given that the results described in such statements will be achieved.
AMERON INTERNATIONAL CORPORATION AND SUBSIDIARIES
Table of Contents 7

Forward-looking information contained in these statements include, among other things, statements with respect to the Company’s financial condition, results of operations, cash flows, business strategies, operating efficiencies or synergies, competitive positions, growth opportunities, plans and objectives of management, and other matters. Such statements are subject to numerous assumptions, risks, uncertainties and other factors, many of which are outside of the Company’s control, which could cause actual results to differ materially from the results described in such statements. These factors include without limitation those listed below under Item 1A, Risk Factors. Forward-looking statements in this Annual Report on Form 10-K speak only as of the date of this Annual Report, and forward-looking statements in documents attached or incorporated by reference speak only as to the date of those documents. The Company does not undertake any obligation to update or release any revisions to any forward-looking statement or to report any events or circumstances after the date of this Annual Report or to reflect the occurrence of unanticipated events, except as required by law. ITEM 1A - RISK FACTORS The following information should be read in conjunction with Management's Discussion and Analysis (“MD&A”), under Item 7, herein, and the Consolidated Financial Statements and related Notes, under Item 8, herein. The Company's businesses routinely encounter and address risks, some of which could cause the Company's future results to be materially different than presently anticipated. Discussion about the important operational risks that the Company's businesses encounter can also be found in the MD&A section and in the business descriptions in Item 1, herein. a) The general economic conditions and the availability of third-party financing could affect demand for the Company’s products. The Company’s products are sold into the capital goods industry. The markets served by the Company and its affiliates could be severely impacted by a general economic slowdown. The availability of financing for customers or for projects could impact the overall level of demand for the Company’s products and the timing of new orders. Additionally, existing orders in backlog are subject to cancellation or delays if customers are unable to obtain anticipated financing or if economic conditions worsen. b) The primary markets for the Company's products are cyclical and dependent on factors that may not necessarily correspond to general economic cycles. The Company's Water Transmission Group sells piping products for public works projects, which are typically dependent on taxes and fees for funding. The Fiberglass-Composite Pipe Group's performance is closely linked to the level of oil and energy prices and the corresponding impact on oil production, processing and transport. The Infrastructure Products Group is dependent on the level of construction, especially the level of construction in Hawaii and construction of new homes for the sale of concrete poles throughout the U.S. Therefore, the Company's activities can be materially impacted by changes in interest rates, construction cycles, changes in oil prices and constraints on governmental budgets and spending. c) The availability and price of key raw materials can fluctuate dramatically, and an increase could affect sales and profitability. The Company consumes significant amounts of steel, cement, epoxy resin and fiberglass. The availability of these raw materials is subject to periodic shortages, and future allocations may not be sufficient to prevent disruption to sales of the Company and its subsidiaries. Additionally, significant increases in the cost of these raw materials could lead to significantly lower operating margins if the Company is unable to recover these cost increases through price increases to its customers. The Company purchases cement in Hawaii from a single source under a long-term purchase agreement. Obtaining cement from an alternative source could be disruptive and/or costly. d) Labor disruptions or labor shortages could materially impact the Company’s operations, its ability to fill orders and its profitability. The Company's businesses are involved with heavy-duty manufacturing and materials handling. Labor is a key component of such operations, and disruptions, such as disputes and strikes, could have a material impact on the Company and its subsidiaries. Additionally, shortages of skilled labor could periodically impact the Company's costs and profitability.
AMERON INTERNATIONAL CORPORATION AND SUBSIDIARIES
Table of Contents 8

e) Claims associated with the Company's product performance can be large and could materially impact the Company's results and cash flow. The Company sells products that may be essential to the use of large, multi-million-dollar, infrastructure projects, such as water and sewer systems, offshore platforms, marine vessels, petrochemical plants, roads, and large construction projects. Additionally, the Company sells products used in critical applications, such as to protect against corrosion or to convey hazardous materials. Use of the Company's products in such applications could expose the Company to large potential product liability risks which are inherent in the design, manufacture and sale of such products. Successful claims against the Company could materially and adversely affect its reputation, financial condition and results of operations. f) A significant part of the Company's assets and profits are located or generated outside the U.S., with an associated foreign exchange and country risk. The Company and its subsidiaries operate in several countries outside the U.S. A significant change in the value of foreign currencies, political stability, trade restrictions, the impact of foreign government regulations, or economic cycles in foreign countries could materially impact the Company. g) The returns from the Company's investment in wind tower manufacturing are dependent on a limited number of customers and future demand which could be impacted by changes in project financing, government policy, energy prices or tax incentives. The Company completed a major expansion program to enhance its capabilities to produce wind towers used for wind-generated electricity in 2009. The current demand for wind-generated power is driven by regulation, energy prices and tax incentives. The demand for wind towers could subside if the tax incentives are not renewed, if project financing availability does not improve and/or if prices for competing fuels fall so that wind energy is less competitive. Additionally, the Company’s entry into this market may not meet forecasted expectations due to entry costs and competitive pressures. h) The Company's quarterly results are subject to significant fluctuation, which could affect the Company's stock price. The Company's sales and net income can fluctuate significantly from quarter to quarter due to production and delivery schedules of major orders and the seasonal variation in demand for certain of the Company's products, particularly in the Water Transmission Group. Operating results in any quarterly period are not necessarily indicative of results for any future quarterly period, and comparisons between periods may not be meaningful. The Company sells products which are installed outdoors; and, therefore, demand for the Company's products can be affected by weather conditions. i) Limits on the Company's ability to significantly influence or control partially-owned affiliates could restrict the future operation of such affiliates and the amount of cash available to the Company from such affiliates. Without significant influence or control, the Company cannot solely dictate the dividend or operating policies of affiliates without the cooperation of the respective affiliate partners. j) The Company’s relatively low trading volume could limit a shareholder's ability to trade the Company's shares. The Company's shares are traded on the New York Stock Exchange; however, the average trading volume can be relatively low. As a result, shareholders could have difficulty in selling or buying a large number of the Company's shares in the manner or at a price that might otherwise be possible if the shares were more actively traded. k) Tax law changes relative to foreign-based income could significantly impact the Company’s profitability. The Company maintains substantial accumulated earnings outside the U.S. A change in tax laws that requires U.S. income tax on unrepatriated foreign earnings could result in a significant reduction in the Company’s net income and cash flow.
l) Significant changes in investment performance or assumptions could have a material effect on the valuation of obligations, the funded status, cost and required contributions associated with pension plans. The Company’s pension cost and funding requirements are materially affected by the discount rate used to value pension obligations, the level of plan assets available to fund those obligations and the expected long-term rate of return on plan assets. The Company’s pension plans are supported by pension fund investments which can be volatile and subject to financial market risk. Significant changes in investment performance or changes in the portfolio mix of invested assets could result in corresponding increases and decreases in the valuation of plan assets or changes of the expected future rate of return on plan assets. A change in the discount rate can result in a significant increase or decrease in the valuation of pension obligations, affecting the current funded status of the pension plans. Changes in the expected return on plan assets, changes in the discount rate or changes in the current funded status could result in significant changes in the future net periodic pension cost and cash flow to fund pension obligations.
AMERON INTERNATIONAL CORPORATION AND SUBSIDIARIES
Table of Contents 9

m) The Company is dependent on information systems and information technology, and a major interruption could adversely impact operations and the Company’s results. The Company uses critical information systems to operate, monitor and manage business on a day-to-day basis. Any disruption to these information systems could adversely impact operations and result in increased costs, the inability to maintain financial controls or issue financial reports. Information systems could be interrupted, delayed, or damaged by any number of factors, including natural disasters, telecommunications failures, acts of war or terrorism, computer viruses, physical or electronic security breaches. These or other events could cause loss of critical data, or prevent the Company from meeting its operating and financial commitments. n) The Company could be aversely affected by its personnel not adhering to policies and procedures. The Company operates a diverse set of businesses in various parts of the world. Policies and procedures are established and maintained to promote an effective internal control environment. While management is responsible for establishing and maintaining adequate internal controls, there can be no assurances that non-compliant acts by the Company’s personnel or others will not adversely impact the Company’s operating results or financial condition. o) Failure to comply with federal, state, local or foreign governmental requirements, could affect the Company’s reputation, results and cash flows. The Company and those representing the Company, such as employees or agents, are subject to U.S. federal, state, local and foreign laws and regulations that affect the Company’s businesses. The Company and its representatives are subject to a variety of environmental, health, and safety laws and regulations, laws relating to trade sanctions and export controls, and the U.S. Foreign Corrupt Practices Act and similar worldwide anti-corruption laws, which generally prohibit companies and their representatives and intermediaries from making improper payments to government officials for the purpose of obtaining or retaining business. Failure to comply with such laws or regulations, whether actual or alleged, could expose the Company to fines, penalties or potential litigation liabilities, including costs, settlements and judgments, any of which could adversely affect the Company’s business, financial condition and results of operations. In addition, the Company is required to obtain and maintain federal, state, and local government permits and approvals to operate its businesses. Any of these permits or approvals may be subject to denial, revocation or modification under various circumstances. Failure to obtain or comply with, or the loss or modification of, the conditions of permits or approvals may subject the Company to penalties or other liabilities or to cease operations, which could have a material adverse impact on our business, financial condition, and result of operations. ITEM 1B - UNRESOLVED STAFF COMMENTS None. ITEM 2 - PROPERTIES (a) The location and general character of principal plants and other materially important physical properties used in the Company's operations are tabulated below. Property is owned in fee simple except where otherwise indicated by footnote. In addition to the property shown, the Company owns vacant land adjacent to or in the proximity of some of its operating locations and holds this property available for use when it may be needed to accommodate expanded or new operations. The Company also has a property formerly used in the Coatings Business that is being held for sale. Listed properties do not include any temporary project sites which are generally leased for the duration of the respective projects or leased or owned warehouses that could be easily replaced. With the exception of the Kailua, Oahu property, shown under the Infrastructure Products Group industry segment, there are no material leases with respect to which expiration or inability to renew would have a material adverse effect on the Company's operations. The lease term on the Kailua property extends to 2052. Kailua is the principal source of quarried rock and aggregates for the Company's operations on Oahu, Hawaii, and rock reserves are believed to be adequate for its requirements during the term of the lease. (b) The Company believes that its existing facilities are adequate for current and presently foreseeable operations. Because of the cyclical nature of certain of the Company's operations and the substantial amounts involved in some individual orders, the level of utilization of particular facilities may vary significantly from time to time in the normal course of operations.
AMERON INTERNATIONAL CORPORATION AND SUBSIDIARIES
Table of Contents
10

* Leased** Held for Sale
AMERON INTERNATIONAL CORPORATION AND SUBSIDIARIES
Division - Location DescriptionFIBERGLASS-COMPOSITE PIPE GROUP
Fiberglass Pipe Division - USA
Houston, TX *OfficeBurkburnett, TX Office, Plant
Centron International, Inc.
Mineral Wells, TX Office, PlantAmeron B.V.
Geldermalsen, the Netherlands Office, PlantAmeron (Pte) Ltd.
Singapore *Office, PlantAmeron Malaysia Sdn. Bhd.
Malaysia *Office, PlantAmeron Polyplaster
Betim, Brazil Office, PlantAmeron Brazil
Betim, Brazil Office, Plant WATER TRANSMISSION GROUP
Rancho Cucamonga, CA *OfficeRancho Cucamonga, CA Office, PlantFontana, CA Office, PlantLakeside, CA Office, PlantPhoenix, AZ Office, PlantTracy, CA Office, Plant
Protective Linings Division
Brea, CA Office, PlantTubos Y Activos
Mexicali, Mexico *Office, PlantAmerican Pipe & Construction International
Bogota, Colombia Office, PlantCali, Colombia Office, Plant
INFRASTRUCTURE PRODUCTS GROUP
Hawaii Division
Honolulu, Oahu, HI *Office, PlantKailua, Oahu, HI *Plant, QuarryBarbers Point, Oahu, HI Office, PlantPuunene, Maui, HI *Office, Plant, Quarry
Pole Products Division
Ventura, CA *OfficeFillmore, CA Office, PlantOakland, CA *PlantEverett, WA *Office, PlantTulsa, OK *Office, PlantAnniston, AL *Office, Plant
CORPORATE
Corporate Headquarters
Pasadena, CA *OfficeHull, UK **Office, Plant
Corporate Research & Engineering
Long Beach, CA *OfficeSouth Gate, CA Office, Laboratory
Table of Contents
11

ITEM 3 - LEGAL PROCEEDINGS In 2004, Sable Offshore Energy Inc. ("Sable"), as agent for certain owners of the Sable Offshore Energy Project, brought an action against various coatings suppliers and application contractors, including the Company and its subsidiary, Ameron B.V., in the Supreme Court of Nova Scotia, Canada. Sable seeks damages allegedly sustained by it resulting from performance problems with several coating systems used on the Sable Offshore Energy Project, including coatings products furnished by the Company and Ameron B.V. All of the co-defendants, other than the Company, Ameron B.V. and an unaffiliated licensee of the Company, have since settled. Sable's originating notice and statement of claim alleged a claim for damages in an unspecified amount. Sable later alleged that its claim for damages against all defendants was approximately 440 million Canadian dollars. More recently, however, Sable sent the Company a revised claim which included an alternative method for calculating damages. Although Sable did not specify an aggregate claim amount under its alternative method, that method if adopted would appear to substantially reduce the amount of damages. The Company contests any claim amount and is vigorously defending itself on the merits in this action. This matter is in discovery, and no trial date has yet been established. Based upon the information available at this time, the Company is not able to estimate the possible range of loss with respect to this case.
In 2004, BP America Production Company (“BP America”) brought an action against the Company in the 24th Judicial District Court, Parish of Jefferson, Louisiana in connection with fiberglass pipe sold by the Company for installation in four offshore platforms constructed for BP America. The plaintiff seeks damages allegedly sustained by it resulting from claimed defects in such pipe. BP America’s petition as filed alleged a claim against the Company for rescission, products liability, negligence, breach of contract and warranty and for damages in an amount of not less than $20 million; but BP America has since reduced its claim to $12.9 million. The Company contests this amount. This matter is in discovery, and no trial date has yet been established. The Company intends to vigorously defend itself in this action. Based upon the information available to it at this time, the Company is not able to estimate the possible range of loss with respect to this case.
In 2006, the Cawelo, California Water District (“Cawelo”) brought an action against the Company in the Superior Court, Kern County, California in connection with concrete pipe sold by the Company in 1995 for a wastewater recovery pipeline. Cawelo seeks damages allegedly sustained by it resulting from the failure of such pipe in 2004. Cawelo’s petition as filed alleged a claim against the Company for products liability, negligence, breach of express warranty and breach of written contract and for damages in an amount of not less than $8 million, an amount which the Company contested. On December 3, 2010, the Company settled this case subject to court approval for a net payment of $.1 million by the Company. On December 27, 2010, the Court issued an order finding the settlement by the Company to be in good faith and dismissing a cross-complaint against the Company by a surety of a non-settling defendant. The order remains subject to possible appeal. The terms of the settlement will not have a material effect on the Company’s financial condition or results of operations.
In August 2010, Petroleum Polymer Company LLC ("PPC") brought an action against Ameron (Pte) Ltd. ("Ameron Pte"), an indirect subsidiary of the Company, in the Primary Court of Oman. The complaint alleged that Ameron Pte breached the terms of a purchase agreement for its supply of fiberglass pipe to PPC for use in an oil extraction project in Oman. PPC's primary allegation is that a component supplied by Ameron Pte failed during testing, resulting in a failure of the pipe system. PPC asserted damages totaling approximately $20 million, including alleged claims for the cost of replacing damaged pipe, recovery of penalties incurred due to the resulting delay in the project, and lost future opportunities. Ameron Pte contests any claim amount and intends to vigorously defend itself in this action. Based upon the information available to it at this time, the Company is able to neither estimate the possible range of loss with respect to this case nor the timing of substantive judicial proceedings.
The Company is a defendant in a number of asbestos-related personal injury lawsuits. These cases generally seek unspecified damages for asbestos-related diseases based on alleged exposure to products previously manufactured by the Company and others. As of November 30, 2010, the Company was a defendant in 14 asbestos-related cases, compared to 20 cases as of November 30, 2009. During the year ended November 30, 2010, there were ten new asbestos-related cases, 11 dismissed cases, five settled cases and no judgments. The Company incurred net expenses of $.1 million, $.3 million and $.2 million, and recovered less than $.1 million, $.1 million and $.2 million, during the years ended November 30, 2010, 2009 and 2008, respectively. Based upon the information available to it at this time, the Company is not able to estimate the possible range of loss with respect to these cases.
AMERON INTERNATIONAL CORPORATION AND SUBSIDIARIES
Table of Contents
12

In December 2008, the Company received from the U.S. Treasury Department’s Office of Foreign Assets Control (“OFAC”) a Requirement to Furnish Information regarding transactions involving Iran. With the assistance of outside counsel, the Company conducted an internal inquiry and continues to cooperate fully with OFAC on this matter. Based upon the information available to it at this time, the Company is not able to predict the outcome of this matter. If the Company violated governmental regulations, material fines and penalties could be imposed.
The Company is subject to federal, state and local laws and regulations concerning the environment and is currently participating in administrative proceedings at several sites under these laws. While the Company finds it difficult to estimate with any certainty the total cost of remediation at the several sites, on the basis of currently available information and reserves provided, the Company believes that the outcome of such environmental regulatory proceedings will not have a material effect on the Company's financial position, cash flows, or results of operations. In addition, certain other claims, suits and complaints that arise in the ordinary course of business have been filed or are pending against the Company. Management believes that these matters are either adequately reserved, covered by insurance, or would not have a material effect on the Company's financial position, cash flows or results of operations if disposed of unfavorably.
PART II
ITEM 5 - MARKET FOR REGISTRANT'S COMMON EQUITY, RELATED STOCKHOLDER MATTERS AND ISSUER PURCHASES OF EQUITY SECURITIES The Common Stock, $2.50 par value, of the Company, its only outstanding class of common equity, is traded on the New York Stock Exchange (“NYSE”), the only exchange on which it is presently listed. On January 10, 2011, there were 866 stockholders of record of such stock, based on the information provided by the Company’s transfer agent, Computershare. Information regarding incentive stock compensation plans may be found in Note (13) of the Notes to Consolidated Financial Statements, under Item 8, herein. Dividends have been paid each quarter during 2010 and 2009. Information as to the amount of dividends paid during the reporting period and the high and low prices of the Company's Common Stock during such period are set out in Supplementary Data - Quarterly Financial Data (Unaudited) following the Notes to Consolidated Financial Statements, under Item 8, herein. Normal dividends of $.30 per share per quarter are expected to be paid in the future. Terms of lending agreements which place restrictions on cash dividends are discussed in Management's Discussion and Analysis of Financial Condition and Results of Operations, under Item 7, and Note (11) of the Notes to Consolidated Financial Statements, under Item 8, herein. STOCK PRICE PERFORMANCE GRAPH The following line graph compares the yearly changes in the cumulative total return of the Company’s Common Stock against the cumulative total return of the NYSE (New York Stock Exchange) Market Value Index and the Peer Group Composite Index described below for the period of the Company’s five fiscal years commencing December 1, 2005 and ended November 30, 2010. The comparison assumes $100 invested in stock on December 1, 2005. Total return assumes reinvestment of dividends. The Company’s stock price performance over the years indicated below does not necessarily track the operating performance of the Company nor is it necessarily indicative of future stock price performance. The 2010 Peer Group Composite Index is comprised of the following companies: Ameron, Dresser-Rand Group, Inc., Gibraltar Industries, Inc., Insituform Technologies, Inc., Lufkin Industries Inc., Martin Marietta Material, Inc., National Oilwell Varco, Inc., Northwest Pipe Co., Texas Industries Inc., Trinity Industries, Inc., Valmont Industries, Inc. and Vulcan Materials Co. The Company modified the 2009 Peer Group Composite Index to include Insituform Technologies, Inc., replacing Schnitzer Steel Industries, Inc. in the 2010 Peer Group Composite Index, to reflect the sale of TAMCO in 2010.
AMERON INTERNATIONAL CORPORATION AND SUBSIDIARIES
Table of Contents
13

ISSUER PURCHASES OF EQUITY SECURITIES
(1) On October 22, 2010, the Company announced that its Board of Directors approved the purchase of up to $50.0 million of the Company’s Common Stock beginning in 2011. (2) Does not include shares that may be repurchased by the Company to pay taxes applicable to the vesting of restricted stock.
AMERON INTERNATIONAL CORPORATION AND SUBSIDIARIES
11/30/05 11/30/06 11/30/07 11/30/08 11/30/09 11/30/10 Ameron $ 100.00 $ 169.51 $ 240.92 $ 124.66 $ 134.53 $ 177.58 NYSE Market Value Index 100.00 119.92 134.59 78.50 102.30 109.65 Peer Group Composite Index (2010) 100.00 124.94 174.57 92.49 115.60 143.07 Peer Group Composite Index (2009) 100.00 124.64 176.81 92.43 116.42 144.67
(c) (d) Number of Shares Maximum Number
(a) (b) (or Units) Purchased (or Approximate Dollar Value
in millions) Total Number of Average Price As Part of Publicly of Shares (or Units) that May Shares (or Units) Paid per Announced Plans or Yet Be Purchased Under Period Purchased Share (or Unit) Programs Plans or Programs (1,2) 8/30/10 thru 9/26/10 - - - $ - 9/27/10 thru 10/31/10 - - - 50.0 11/1/10 thru 11/30/10 - - - 50.0
Table of Contents
14

ITEM 6 - SELECTED FINANCIAL DATA SELECTED CONSOLIDATED FINANCIAL INFORMATION
(1) Amounts adjusted based on adoption of two-class computation method (see Note (1) of the Notes to Consolidated Financial Statements, under Item 8, herein).(2) Includes special dividend of $3.00 per share, paid on November 30, 2010.(3) Amounts include both continuing and discontinued operations.
AMERON INTERNATIONAL CORPORATION AND SUBSIDIARIES
Year ended November 30, (Dollars in thousands, except per share data) 2010 2009 2008 2007 2006 PER COMMON SHARE DATA (1) Basic earnings per share allocated to Common Stock:
Income from continuing operations $ 5.11 $ 3.52 $ 6.37 $ 6.70 $ 5.66 (Loss)/income from discontinued operations, net of
taxes (.11) .09 - .68 .25 Net income 5.00 3.61 6.37 7.38 5.91
Diluted earnings per share allocated to Common Stock:
Income from continuing operations 5.11 3.52 6.35 6.69 5.60 (Loss)/income from discontinued operations, net of
taxes (.11) .09 - .67 .24 Net income 5.00 3.61 6.35 7.36 5.84
Weighted-average shares (basic) 9,205,439 9,166,558 9,124,557 9,029,487 8,731,839 Weighted-average shares (diluted) 9,220,211 9,184,771 9,169,056 9,090,846 8,871,695 Dividends (2) 4.20 1.20 1.15 .90 .80 Stock price - high 75.84 89.00 130.51 109.60 80.01 Stock price - low 54.73 41.86 33.30 64.35 44.66 Price/earnings ratio (range) 15-11 25-12 20-5 15-9 14-8
OPERATING RESULTS Sales $ 503,259 $ 546,944 $ 667,543 $ 631,010 $ 549,180 Gross profit 127,924 145,452 153,621 146,029 132,389 Interest income/(expense), net (22) 588 1,533 1,927 (1,682)Provision for income taxes (29,709) (15,517) (16,955) (10,359) (10,905)Equity in (loss)/earnings of affiliate, net of taxes (1,206) (5,512) 10,337 15,383 13,550 Income from continuing operations 47,268 32,483 58,592 61,140 50,060 (Loss)/income from discontinued operations, net of
taxes (1,014) 817 - 6,099 2,140 Net income 46,254 33,300 58,592 67,239 52,200 Net income/sales 9.2% 6.1% 8.8% 10.7% 9.5%Return on average equity 9.3% 6.9% 12.7% 16.6% 15.8%
FINANCIAL CONDITION AT YEAR-END (3) Working capital $ 322,456 $ 287,467 $ 297,445 $ 314,339 $ 280,467 Property, plant and equipment, net 244,198 238,508 206,162 173,731 134,470 Investments
Equity method affiliate - 30,626 14,428 14,677 14,501 Cost method affiliates 3,784 3,784 3,784 3,784 3,784
Total assets 781,569 762,549 726,322 705,812 616,351 Long-term debt, less current portion 23,424 30,933 35,989 57,593 72,525
CASH FLOW (3) Expenditures for property, plant and equipment $ 30,965 $ 46,874 $ 60,697 $ 47,697 $ 35,519 Depreciation and amortization 26,539 22,108 20,409 17,034 17,440
Table of Contents
15
ITEM 7 - MANAGEMENT'S DISCUSSION AND ANALYSIS OF FINANCIAL CONDITION AND RESULTS OF OPERATIONS Ameron International Corporation ("Ameron", the "Company", the “Registrant” or the “Corporation”) is a multinational manufacturer of highly-engineered products and materials for the chemical, industrial, energy, transportation and infrastructure markets. Ameron is a leading producer of water transmission lines; fiberglass-composite pipe for transporting oil, chemicals and corrosive fluids and specialized materials; and products used in infrastructure projects. The Company operates businesses in North America, South America, Europe and Asia. The Company has three reportable segments. The Fiberglass-Composite Pipe Group manufactures and markets filament-wound and molded composite fiberglass pipe, tubing, fittings and well screens. The Water Transmission Group manufactures and supplies concrete and steel pressure pipe, concrete non-pressure pipe, protective linings for pipe and fabricated steel products, such as large-diameter wind towers. The Infrastructure Products Group consists of two operating segments, which are aggregated: the Hawaii Division which manufactures and sells ready-mix concrete, sand and aggregates, concrete pipe and culverts and the Pole Products Division which manufactures and sells concrete and steel lighting and traffic poles. The markets served by the Fiberglass-Composite Pipe Group are worldwide in scope. The Water Transmission Group serves primarily the western U.S. for pipe and sells wind towers primarily west of the Mississippi River. The Infrastructure Products Group's quarry and ready-mix business operates exclusively in Hawaii, and poles are sold throughout the U.S. Ameron also participates in various affiliate companies, directly in Saudi Arabia, and indirectly in Egypt.
During the fourth quarter of 2010, the Company sold its 50% ownership in TAMCO, a steel mini-mill operating in California. The Company reports its investment in TAMCO using the equity method of accounting.
During the third quarter of 2006, the Company sold its Performance Coatings & Finishes business ("Coatings Business"). The results from this segment are reported as discontinued operations for all the reporting periods. Accordingly, the following discussions generally reflect summary results from continuing operations unless otherwise noted. However, the net income and net income per share discussions include the impact of discontinued operations.
CRITICAL ACCOUNTING POLICIES AND ESTIMATES
Management's Discussion and Analysis of Liquidity and Capital Resources and Results of Operations are based upon the Company's consolidated financial statements, which are prepared in accordance with accounting principles generally accepted in the United States of America. The preparation of these financial statements requires Management to make certain estimates and assumptions that affect the reported amounts of assets, liabilities, revenues and expenses, and related disclosure of contingent assets and liabilities during the reporting periods. Management bases its estimates on historical experience and on various other assumptions that are believed to be reasonable under the circumstances, the results of which form the basis for making judgments about the carrying values of assets and liabilities that are not readily apparent from other sources. Actual results could differ from those estimates.
A summary of the Company's significant accounting policies is provided in Note (1) of the Notes to Consolidated Financial Statements, under Item 8, herein. In addition, Management believes the following accounting policies affect the more significant estimates used in preparing the consolidated financial statements.
The consolidated financial statements include the accounts of Ameron and all wholly-owned subsidiaries. All material intercompany accounts and transactions are eliminated. The functional currencies for the Company's foreign operations are the applicable local currencies. The translation from the applicable foreign currencies to U.S. dollars is performed for balance sheet accounts using current exchange rates in effect at the balance sheet date and for revenue and expense accounts using a weighted-average exchange rate during the period. The resulting translation adjustments are recorded in accumulated other comprehensive income/(loss). The Company advances funds to certain foreign subsidiaries that are not expected to be repaid in the foreseeable future. Translation adjustments arising from these advances are also included in accumulated other comprehensive income/(loss). The timing of repayments of intercompany advances could materially impact the Company's consolidated financial statements. Additionally, earnings of foreign subsidiaries are often permanently reinvested outside the U.S. Unforeseen repatriation of such earnings could result in significant unrecognized U.S. tax liability. Gains or losses resulting from foreign currency transactions are included in other income, net.
AMERON INTERNATIONAL CORPORATION AND SUBSIDIARIES
Table of Contents
16

Revenue for the Fiberglass-Composite Pipe and Infrastructure Products segments is recognized when risk of ownership and title pass, primarily at the time goods are shipped, provided that an agreement exists between the customer and the Company, the price is fixed or determinable and collection is reasonably assured. Revenue is recognized for the Water Transmission Group primarily under the percentage-of-completion method, typically based on completed units of production, since products are manufactured under enforceable and binding construction contracts, typically are designed for specific applications, are not interchangeable between projects, and are not manufactured for stock. Revenue for the period is determined by multiplying total estimated contract revenue by the percentage of completion of the contract and then subtracting the amount of previously recognized revenue. Cost of earned revenue is computed by multiplying estimated contract completion cost by the percentage of completion of the contract and then subtracting the amount of previously recognized cost. In some cases, if products are manufactured for stock or are not related to specific construction contracts, revenue is recognized under the same criteria used by the other two segments. Revenue under the percentage of completion method is subject to a greater level of estimation, which affects the timing of revenue recognition, costs and profits. Estimates are reviewed on a consistent basis and are adjusted periodically to reflect current expectations. Costs attributable to unpriced change orders are treated as costs of contract performance in the period, and contract revenue is recognized if recovery is probable. Disputed or unapproved change orders are treated as claims. Recognition of amounts of additional contract revenue relating to claims occurs when amounts have been received or awarded with recognition based on the percentage-of-completion methodology.
The Company expenses environmental clean-up costs related to existing conditions resulting from past or current operations on a site-by-site basis. Liabilities and costs associated with these matters, as well as other pending litigation and asserted claims arising in the ordinary course of business, require estimates of future costs and judgments based on the knowledge and experience of Management and its legal counsel. When the Company's exposures can be reasonably estimated and are probable, liabilities and expenses are recorded. The ultimate resolution of any such exposure to the Company may differ from expectations due to subsequent developments.
Inventories are stated at the lower of cost or market with cost determined principally on the first-in, first-out ("FIFO") method. Certain steel inventories used by the Water Transmission Group are valued using the last-in, first-out ("LIFO") method. Significant changes in steel levels or steel prices could materially impact the Company's financial statements. Reserves are established for excess, obsolete and rework inventories based on estimates of salability and forecasted future demand. Management records an allowance for doubtful accounts receivable based on historical experience and expected trends. A significant reduction in demand or a significant worsening of customer credit quality could materially impact the Company’s consolidated financial statements.
Investments in unconsolidated affiliates over which the Company has significant influence are accounted for under the equity method of accounting, whereby the investment is carried at the cost of acquisition, including subsequent capital contributions and loans from the Company, plus the Company's equity in undistributed earnings or losses since acquisition. Investments in affiliates which the Company does not have the ability to exert significant influence over the investees' operating and financing activities are accounted for under the cost method of accounting. The Company's former investment in TAMCO, a steel mini-mill in California, is accounted for under the equity method. Investments in Ameron Saudi Arabia, Ltd. and Bondstrand, Ltd. are accounted for under the cost method due to Management's current assessment of the Company's influence over these affiliates. The Company’s investment in TAMCO was sold in October 2010.
Property, plant and equipment is stated on the basis of cost and depreciated principally using a straight-line method based on the estimated useful lives of the related assets, generally three to 40 years. The Company reviews long-lived assets for impairment whenever events or changes in circumstances indicate that the carrying value of such assets may not be recoverable. If the estimated future, undiscounted cash flows from the use of an asset are less than its carrying value, a write-down is recorded to reduce the related asset to estimated fair value. Actual cash flows may differ significantly from estimated cash flows. Additionally, current estimates of future cash flows may differ from subsequent estimates of future cash flows. Changes in estimated or actual cash flows could materially impact the Company's consolidated financial statements.
AMERON INTERNATIONAL CORPORATION AND SUBSIDIARIES
Table of Contents
17

The Company is self insured for a portion of the losses and liabilities primarily associated with workers' compensation claims and general, product and vehicle liability. Losses are accrued based upon the Company's estimates of the aggregate liability for claims incurred using historical experience and certain actuarial assumptions followed in the insurance industry. The estimate of self-insurance liability includes an estimate of incurred but not reported claims, based on data compiled from historical experience. Actual experience could differ significantly from these estimates and could materially impact the Company's consolidated financial statements. The Company typically purchases varying levels of third-party insurance to cover losses subject to retention levels (deductibles or primary self insurance) and aggregate limits. Currently, the Company's retention levels are $1.0 million per workers' compensation claim, $.1 million per general, property or product liability claim, and $.25 million per vehicle liability claim.
When accounting for pension and other postretirement benefits, assumptions are made regarding the valuation of benefit obligations and the performance of plan assets that are controlled and invested by third-party custodians. Delayed recognition of differences between actual results and expected or estimated results is a guiding principle of these standards. Such delayed recognition provides a gradual recognition of benefit obligations and investment performance over the working lives of the employees who benefit under the plans, based on various assumptions. Assumed discount rates are used to calculate the present values of benefit payments which are projected to be made in the future, including projections of increases in employees' annual compensation and health care costs. Management also projects the future returns on invested assets based principally on prior performance. These projected returns reduce the net benefit costs the Company records in the current period. Actual results could vary significantly from projected results, and such deviations could materially impact the Company's consolidated financial statements. Management consults with the Company’s actuaries when determining these assumptions. Program changes, including termination, freezing of benefits or acceleration of benefits, could result in an immediate recognition of unrecognized benefit obligations; and such recognition could materially impact the Company's consolidated financial statements.
For pension and other postretirement benefits accounting, the discount rate is based on market interest rates. At November 30, 2010, the Company decreased the annual discount rate from 5.70% to 5.30% as a result of the then-current market interest rates on long-term, fixed-income debt securities of highly-rated corporations. In estimating the expected return on assets, the Company considers past performance and future expectations for various types of investments, as well as the expected long-term allocation of assets. At November 30, 2010, the Company maintained the long-term annual rate of return on assets assumption of 8.50% reflecting current expectations for future returns in the investment markets. In projecting the rate of increase in compensation levels, the Company considers movements in inflation rates as reflected by market interest rates. At November 30, 2010, the Company decreased the assumed annual rate of compensation from 4.25% to 3.50%. In selecting the rate of increase in health care costs, the Company considers past performance and forecasts of future health care cost trends. At November 30, 2010, the Company raised the annual rate of increase in health care costs to 10.00%, from 9.00% in 2009, decreasing ratably until reaching 5.00% in 2015 and beyond.
Different assumptions would impact the Company’s projected benefit obligations and annual net periodic benefit costs related to pensions and the accrued other benefit obligations and benefit costs related to postretirement benefits. The following reflects the impact associated with a change in certain assumptions:
AMERON INTERNATIONAL CORPORATION AND SUBSIDIARIES
1% Increase 1% Decrease Increase/ Increase/ Increase/ Increase/ (Decrease) (Decrease) (Decrease) (Decrease) in Benefit in Benefit in Benefit in Benefit (In thousands) Obligations Costs Obligations Costs Discount rate:
Pensions $ (29,440) $ (3,387) $ 35,977 $ 3,506 Other postretirement benefits (382) (13) 440 11
Expected rate of return on assets N/A (1,725) N/A 1,725 Rate of increase in compensation levels 3,071 692 (2,746) (620)Rate of increase in health care costs 150 17 (133) (14)
Table of Contents
18

Additional information regarding pensions and other postretirement benefits is disclosed in Note (16) of Notes to Consolidated Financial Statements, under Item 8, herein.
Fair value is the price that would be received to sell an asset or paid to transfer a liability in an orderly transaction between market participants at the measurement date (exit price). The Company utilizes market data or assumptions that the Company believes market participants would use in pricing assets or liabilities, including assumptions about risk and the risks inherent in the inputs to valuation techniques. These inputs can be readily observable, market corroborated or generally unobservable. The Company primarily applies the market approach for recurring fair value measurements and endeavors to utilize the best available information. Accordingly, the Company utilizes valuation techniques that maximize the use of observable inputs and minimize the use of unobservable inputs. The Company classifies fair value balances based on the observability of those inputs. The ultimate exit price could be significantly different than currently estimated by the Company.
Management incentive compensation is accrued based on current estimates of the Company's ability to achieve short-term and long-term performance targets. The Company’s actual performance and incentive compensation payouts could be significantly different than currently estimated by the Company.
Deferred income tax assets and liabilities are computed for differences between the financial statement and income tax bases of assets and liabilities. Such deferred income tax asset and liability computations are based on enacted tax laws and rates applicable to periods in which the differences are expected to reverse. Valuation allowances are established, when necessary, to reduce deferred income tax assets to the amounts expected to be realized. Quarterly income taxes are estimated based on the mix of income by jurisdiction forecasted for the full fiscal year. The Company believes that it has adequately provided for tax-related matters. Actual income, the mix of income by jurisdiction and income taxes could be significantly different than currently estimated.
The amount of income taxes the Company pays is subject to ongoing audits by federal, state and foreign tax authorities. The Company’s estimate of the potential outcome of any uncertain tax issue is subject to Management’s assessment of relevant risks, facts, and circumstances existing at that time, with a more-likely-than-not threshold for financial statement recognition and measurement of tax positions taken or expected to be taken in a tax return. A liability is recorded for the difference between the measured benefit recognized and the tax position taken or expected to be taken on the tax return. To the extent that the Company’s assessment of such tax positions changes, the change in estimate is recorded in the period in which the determination is made. The Company reports tax-related interest and penalties as a component of income tax expense.
LIQUIDITY AND CAPITAL RESOURCES
The following discussion of liquidity and capital resources combines the impact of both continuing and discontinued operations unless otherwise noted.
As of November 30, 2010, the Company's working capital, including cash and cash equivalents and current portion of long-term debt, totaled $322.5 million, an increase of $35.0 million from working capital of $287.5 million as of November 30, 2009. The increase in working capital resulted primarily from higher cash and cash equivalents and inventory and lower accrued liabilities, partially offset by lower receivables and higher trade payables and income taxes payable. Inventories and payables rose due to the anticipated level of sales in 2011, while receivables fell due to the lower level of sales activity during 2010. Income taxes payable increased due to higher pretax income. Cash and cash equivalents totaled $236.7 million as of November 30, 2010, compared to $181.1 million as of November 30, 2009.
AMERON INTERNATIONAL CORPORATION AND SUBSIDIARIES
Table of Contents
19

Net cash of $52.2 million was generated from operating activities in 2010, compared to $125.9 million generated in 2009. In 2010, cash from operating activities included net income of $46.3 million, less non-cash adjustments (depreciation, amortization, deferred income taxes, loss from affiliate, gain from sale of assets, stock compensation expense and the non-cash write-down of assets) of $18.7 million, plus changes in operating assets and liabilities of $24.6 million. In 2009, cash from operating activities included net income of $33.3 million, plus similar non-cash adjustments of $45.3 million, plus changes in operating assets and liabilities of $47.2 million. In 2008, cash from operating activities included net income of $58.6 million, plus similar non-cash adjustments (other than write-down of assets) of $22.5 million, plus changes in operating assets and liabilities of $7.4 million. Compared to 2009, non-cash adjustments in 2010 were lower due primarily to the sale of the Company’s ownership of TAMCO; and the net operating assets were lower primarily due to a leveling of business activity. The $73.7 million decline in net cash from operations from 2009 to 2010 was due to a sharp decline in business activity from 2008 to 2009, which did not repeat in 2010. In addition, cash from operations increased $37.4 million in 2009, compared to 2008, due to this economic slowdown.
Net cash provided by investing activities totaled $49.5 million in 2010, compared to net cash used in investing activities of $69.9 million in 2009 and $59.1 million in 2008. In 2010, net cash provided by investing activities consisted of gross proceeds from the sale of the Company’s investment in TAMCO of $78.1 million, other asset sales of $.9 million and a $1.5 million net repayment of loans by TAMCO; offset by capital expenditures of $31.0 million. In addition to normal replacement and upgrades of machinery and equipment, the Company expanded fiberglass pipe plants in Texas and Brazil in 2010 and 2009. Normal replacement expenditures are typically equal to depreciation. In 2009, net cash used in investing activities consisted of capital expenditures of $46.9 million, and $25.0 million of capital and loans to TAMCO. Net cash used in investing activities in 2009 was offset by proceeds of $2.0 million from the sale of assets. In 2008, net cash used in investing activities included capital expenditures of $60.7 million, which included the normal replacement and upgrades of machinery, the expansion of a wind tower manufacturing facility and expenditures for construction of new fiberglass pipe plants in Brazil. Net cash used in investing activities in 2008 was offset by proceeds of $1.6 million from the sale of assets. During the year ending November 30, 2011, the Company anticipates spending between $40.0 and $50.0 million on capital expenditures. Capital expenditures are expected to be funded by existing cash balances, cash generated from operations or additional borrowings.
During 2010, the Company received $1.5 million in loan repayments from TAMCO as part of a $40.0 million senior secured credit facility provided by TAMCO’s shareholders. During 2009, the Company contributed capital of $10.0 million to TAMCO. As of November 30, 2009, TAMCO had borrowed $30.0 million under the facility, of which $15.0 million was provided by the Company. On October 21, 2010, the Company sold its ownership in TAMCO which included the extinguishment of the senior secured credit facility.
Net cash used in financing activities totaled $47.4 million during 2010, compared to $28.8 million in 2009. Net cash used in 2010 consisted of net payment of debt of $8.0 million, payment of Common Stock dividends of $38.7 million and treasury stock purchases of $1.1 million (related to the payment of taxes associated with the vesting of restricted shares), offset by $.4 million provided by the issuance of Common Stock. The 2010 Common Stock dividends included a special dividend of $3.00 per share, totaling $27.6 million, which was paid on November 30, 2010. Net cash used in 2009 consisted of net payment of debt of $16.5 million, payment of Common Stock dividends of $11.1 million, payments for debt issuance costs of $1.1 million and similar treasury stock purchases of $1.0 million. Also in 2009, the Company recognized tax benefits related to stock-based compensation of $.8 million. Net cash used in 2008 consisted of net payments of debt of $21.1 million, payment of Common Stock dividends of $10.5 million and similar treasury stock purchases of $2.6 million. Also in 2008, the Company received $.4 million from the issuance of Common Stock related to exercised stock options and recognized tax benefits related to stock-based compensation of $1.3 million.
AMERON INTERNATIONAL CORPORATION AND SUBSIDIARIES
Table of Contents
20

The Company maintains a $100.0 million revolving credit facility with six banks (the “Revolver”). Under the Revolver, the Company may, at its option, borrow up to the available amount at floating interest rates (at a rate of LIBOR plus a spread ranging from 2.75% to 3.75%, based on the Company’s financial condition and performance) or utilize for letters of credit, at any time until August 2012, when all borrowings under the Revolver must be repaid and letters of credit cancelled. At November 30, 2010, $82.8 million was available under the Revolver.
The Company’s lending agreements contain various restrictive covenants, including the requirement to maintain specified amounts of net worth and restrictions on cash dividends, borrowings, liens, investments, capital expenditures, guarantees, and financial covenants. The Company is required to maintain consolidated net worth of $375.5 million plus 50% of net income and 75% of proceeds from any equity issued after November 30, 2008. The Company's consolidated net worth exceeded the covenant amount by $142.4 million as of November 30, 2010. The Company is required to maintain a consolidated leverage ratio of consolidated funded indebtedness to earnings before interest, taxes, depreciation and amortization ("EBITDA") of no more than 2.50 times. At November 30, 2010, the Company maintained a consolidated leverage ratio of .58 times EBITDA. Lending agreements require the Company to maintain qualified consolidated tangible assets at least equal to the outstanding secured funded indebtedness. At November 30, 2010, qualifying tangible assets equaled 5.52 times funded indebtedness. Under the most restrictive fixed charge coverage ratio, the sum of EBITDA and rental expense less cash taxes must be at least 1.50 times the sum of interest expense, rental expense, dividends and scheduled funded debt payments. At November 30, 2010, the Company maintained such a fixed charge coverage ratio of 2.04 times. Under the most restrictive provisions of the Company's lending agreements, $8.6 million of retained earnings were not restricted at November 30, 2010, as to the declaration of cash dividends or the repurchase of Company stock. In addition, the Company has received consents from its lenders to purchase up to $50.0 million of the Company’s Common Stock. At November 30, 2010, the Company was in compliance with all covenants of its various lending agreements.
Cash and cash equivalents at November 30, 2010 totaled $236.7 million, an increase of $55.6 million from November 30, 2009. At November 30, 2010, the Company had total debt outstanding of $31.1 million, compared to $38.3 million at November 30, 2009, and $111.3 million in unused committed and uncommitted credit lines available from foreign and domestic banks. The Company's highest borrowing and the average borrowing levels during 2010 were $39.5 million and $37.9 million, respectively.
Cash balances are held throughout the world, including $65.3 million held outside of the U.S. at November 30, 2010. Most of the amounts held outside of the U.S. could be repatriated to the U.S. but, under current law, would be subject to U.S. federal income taxes, less applicable foreign tax credits. The Company currently plans to indefinitely maintain significant cash balances outside the U.S.
The Company also owns life insurance policies on current and former executives. The fair value of these policies is equal to the cash surrender value as determined by the insurance companies, which totaled $27.5 million, as of November 30, 2010.
The Company contributed $12.0 million to the U.S. defined-benefit pension plan and $2.2 million to the non-U.S. defined-benefit pension plans in 2010. The Company expects to contribute approximately $11.4 million to its U.S. defined-benefit pension plan and $1.4 million to the non-U.S. defined-benefit pension plans in 2011.
Management believes that cash flow from operations and current cash balances, together with currently available lines of credit, will be sufficient to meet operating requirements in 2011. Cash available from operations could be affected by a general economic downturn or a decline or adverse changes in the Company's business, such as a loss of customers, competitive pricing pressures or significant raw material price increases.
AMERON INTERNATIONAL CORPORATION AND SUBSIDIARIES
Table of Contents
21

The Company's contractual obligations and commercial commitments at November 30, 2010 are summarized as follows (in thousands):
(a) Future interest payments related to debt obligations, excluding the Revolver.(b) The Company has no capitalized lease obligations, unconditional purchase obligations or standby repurchases obligations. (c) Not included are standby letters of credit totaling $16,067 supporting industrial development bonds with principal of $15,700. The principal amount of the industrial development bonds is included in long-term debt. The standby letters of credit are issued under the Revolver. RESULTS OF OPERATIONS: 2010 COMPARED WITH 2009
General
Net income totaled $46.3 million, or $5.00 per diluted share, on sales of $503.3 million in the year ended November 30, 2010, compared to $33.3 million, or $3.61 per diluted share, on sales of $546.9 million in 2009. A sales increase by the Fiberglass-Composite Pipe Group partially offset larger declines by the Water Transmission and Infrastructure Products Groups. The Fiberglass-Composite Pipe Group benefited from increased demand in energy markets, but income decreased due to lower margins. Water Transmission Group’s sales and income declined primarily due to lower wind tower sales. Infrastructure Products Group’s profits were lower as sales continued to be impacted by weak construction spending. Net income increased in 2010 due primarily to the gain on the sale of the Company’s investment in TAMCO, the Company’s 50%-owned steel mini-mill, and lower equity in TAMCO’s losses.
Sales
Sales decreased $43.7 million, or 8.0%, in 2010, compared to 2009. Sales declined due to depressed conditions in wind energy markets and softness in water pipe markets which impacted the Water Transmission Group and continued weakness in most construction markets in Hawaii and in pole demand which impacted the Infrastructure Products Group, partially offset by increased demand in the Fiberglass-Composite Pipe Group.
AMERON INTERNATIONAL CORPORATION AND SUBSIDIARIES
Payments Due by Period Less than After 5 Contractual Obligations Total 1 year 1-3 years 3-5 years years Long-term debt $ 31,148 $ 7,724 $ 7,724 $ - $ 15,700 Interest payments on debt (a) 1,565 727 472 144 222 Operating leases 33,464 4,888 4,244 2,549 21,783 Pension funding 12,800 12,800 - - - Uncertain tax positions 917 917 - - - Total contractual obligations (b) $ 79,894 $ 27,056 $ 12,440 $ 2,693 $ 37,705
Commitments Expiring Per Period Less than After Contractual Commitments Total 1 year 1-3 years 3-5 years 5 years Standby letters of credit (c) $ 1,145 $ 1,145 $ - $ - $ - Total commercial commitments $ 1,145 $ 1,145 $ - $ - $ -
Table of Contents
22

Fiberglass-Composite Pipe's sales increased $18.6 million, or 8.3%, in 2010, compared to 2009. Sales of operations in the U.S. increased $19.4 million primarily due to demand in key onshore oilfield and mining markets. Sales of Asian operations decreased $8.8 million, in spite of the weaker U.S. dollar, due to the decline in marine and offshore markets. European-originated sales decreased $5.6 million primarily due to softer market conditions in industrial and oilfield markets. Sales of Brazilian operations increased $13.6 million due to the startup of a new onshore oilfield pipe plant, growth in the municipal water market and the rising value of the Brazilian currency. Orders for marine and offshore projects continue to soften; however, looking forward, the Fiberglass-Composite Pipe Group continues to see strong demand due primarily to energy-related projects.
Water Transmission Group's sales decreased $39.4 million, or 22.2%, in 2010, compared to 2009. The decrease was largely due to lower wind tower sales and partly due to weaker cyclical demand for water pipe in the western U.S. As of November 30, 2010, the wind tower backlog totaled $3.4 million, from $28.9 million at the end of 2009, due to production throughout 2010 and the lack of new orders. Until the wind energy markets improve and more financing becomes available to the wind energy industry, the Group's wind tower activity is expected to remain depressed. Near term, the water pipe business is also expected to continue to experience soft market demand. The timing of bid activity has been negatively affected by the economy, municipal budgets and availability of financing. The Company continues to monitor a number of major wind tower and pipe projects; however, it remains uncertain when owners, water agencies and municipalities will proceed with these projects.
Infrastructure Products' sales decreased $23.0 million, or 15.9%, in 2010, compared to 2009. Both the Hawaii Division and the Pole Products Division had lower sales in 2010. The Hawaii Division continued to experience lower demand for aggregates and ready-mix concrete on both Oahu and Maui as construction spending remained weak due to the recessionary economy. Construction related to military and governmental spending provided a stable base of business, while all other sectors declined. The decline in U.S. housing markets and reduced demand for concrete lighting poles for new construction and steel traffic poles impacted the Pole Products Division. The Infrastructure Products Group is expected to continue to be affected by the slowdown in construction spending in Hawaii and the low level of residential construction spending throughout the U.S. Demand for Pole Products Division’s decorative concrete poles for residential lighting applications appears to have stabilized. However, major recoveries of the residential construction markets and the Infrastructure Products Group are not expected in the near term.
Gross Profit
Gross profit in 2010 was $127.9 million, or 25.4% of sales, compared to $145.5 million, or 26.6% of sales, in 2009. Gross profit decreased $17.5 million, primarily due to lower sales, lower margins and higher last-in, first-out (“LIFO”) reserves related to steel used by the Water Transmission Group.
Fiberglass-Composite Pipe Group's gross profit decreased $2.9 million in 2010, compared to 2009. Profit margins decreased to 37.1% in 2010, compared to 41.4% in 2009. Margins were lower due to higher raw material costs and changes in product mix, with completion of higher-margin projects from Asia and an increase in lower-margin sales from Brazil. Higher sales increased gross profit by $7.7 million, offset by unfavorable product mix and operating efficiencies of $10.6 million.
Water Transmission Group's gross profit decreased $4.5 million in 2010, compared to 2009, due to lower sales. Profit margins increased to 12.1% in 2010, compared to 11.9% in 2009. Overall, gross profit margins remained stable as lower raw material costs were offset by unfavorable plant efficiencies. The decline in the Group’s gross profits was primarily related to wind towers. As a result of the depressed market for wind towers, Management performed an impairment analysis at the end of the third quarter of 2010 of certain wind tower assets. Based on internal and third-party forecasts, the estimated future undiscounted cash flows of the wind tower facility exceed the carrying value of the related long-lived assets. However, if market conditions do not improve as expected, this could indicate a potential impairment of the Company’s long-lived assets used for the production of wind towers. No events or circumstances occurred since August 29, 2010, that indicates that the carrying amounts of these assets may not be recoverable.
AMERON INTERNATIONAL CORPORATION AND SUBSIDIARIES
Table of Contents
23
Gross profit in the Infrastructure Products Group decreased $4.5 million in 2010, compared to 2009. Profit margins remained steady at 19.2%. The decline in gross profit was related to lower sales.
Consolidated gross profit was $6.1 million lower in 2010 than in 2009 due to unfavorable reserves in 2010 associated with LIFO accounting of certain steel inventories used by the Water Transmission Group due primarily to an increase in steel prices. LIFO reserves are not allocated to the operating segments.
Selling, General and Administrative Expenses
Selling, general and administrative ("SG&A") expenses totaled $101.8 million, or 20.2% of sales, in 2010, compared to $100.0 million, or 18.3% of sales, in 2009. The $1.8 million increase was due to higher pension expense of $4.7 million, higher expenses of international operations related to changes in foreign exchange rates of $1.8 million, higher depreciation expense of $1.0 million, higher severance of $.8 million, and higher compensation expense of $.5 million, offset by lower insurance costs of $4.5 million, lower legal and professional fees of $1.2 million and lower other expenses of $1.3 million.
Gain from Sale of Investment in Affiliate
The sale of the Company’s 50% ownership of TAMCO was completed on October 21, 2010. The Company sold its TAMCO investment and extinguished all outstanding debt owed by TAMCO to the Company under a shareholder loan. The Company received $78.1 million of gross proceeds after estimated working capital adjustments of $.7 million and before closing costs of approximately $2.1 million, recognizing a pretax gain of $48.4 million.
Other Income, Net
Other income, net, totaled $3.6 million in 2010, compared to $7.4 million in 2009. The decrease in other income was due primarily to lower dividends from affiliates of $2.9 million and lower scrap inventory sales of $1.2 million, partially offset by foreign currency transactions of $.6 million.
Interest Income, Net
Net interest income totaled $22,000 in 2010, compared to $.6 million in 2009. The decline was primarily due to an increase of $.4 million in interest expense and higher bank fees. Interest income decreased by $.2 million in 2010 due to lower investment yields on short-term investments.
AMERON INTERNATIONAL CORPORATION AND SUBSIDIARIES
Table of Contents
24

Provision for Income Taxes
Income taxes increased to $29.7 million in 2010, from $15.5 million in 2009. The effective tax rate on income from continuing operations increased to 38.0% in 2010, from 29.0% in 2009. The effective rate in 2010 was reduced by a $.6 million decrease in the valuation allowance for deferred assets related to delayed bonuses and restricted stock. The decrease represented a correction of an amount recorded in 2009. The effective tax rate in 2009 was reduced by tax benefits of $1.2 million associated with the adjustment to a deferred tax liability related to earnings and profits from the Company’s former New Zealand subsidiary. The $1.2 million adjustment represented a correction of an amount recorded in prior period financial statements. Management believes these corrections to be immaterial to prior interim and annual financial statements. For both 2009 and 2010, the Company provided a full valuation allowance for the net operating loss carry-overs of its foreign subsidiaries except its subsidiary in the Netherlands. In 2009, the Company released $1.3 million of valuation allowance for deferred tax assets related to the Netherlands subsidiary as a result of higher profitability in 2008 and projected future profitability. In 2010, the fourth-quarter tax rate was significantly higher than the statutory rate due, in part, to an increase in the valuation allowance related to the Netherlands subsidiary of $3.1 million as a result of a revision to profitability projections. During the fourth quarter of 2010, the Company implemented a plan to repatriate $44.2 million of the undistributed earnings of its subsidiary in Singapore at a relatively low tax rate due to the realization of previously unrecognized foreign tax credits. The net tax expense in 2010 related to this repatriation was $1.7 million. Equity in Loss of Affiliate, Net of Taxes
Equity in loss of affiliate, which consists of the Company’s share of the net loss of TAMCO, decreased to a loss of $1.2 million in 2010, compared to a loss of $5.5 million in 2009. Equity income is shown net of income taxes at an effective rate of 7.8% in 2010 and 2009, respectively, reflecting the dividend exclusion provided to the Company under tax laws. TAMCO’s losses were due to the collapse of infrastructure spending for steel rebar in California, Arizona and Nevada which began in late 2008. During 2010, the Company recognized losses for TAMCO until the sale of its 50% ownership on October 21, 2010.
(Loss)/Income from Discontinued Operations, Net of Taxes
In 2006, the Company completed the sale of the Coatings Business to PPG Industries, Inc. ("PPG"). As part of the sale, PPG agreed to pay to the Company future dividends from Oasis-Ameron, Ltd. (“OAL”), a former affiliate of the Company held by the Coatings Business, up to the amount of OAL’s unremitted earnings at the time of the sale of the Coatings Business to PPG. In 2009, the Company recorded $1.2 million, net of tax, from PPG in exchange for any claims on OAL’s dividends. Also in 2009, the Company wrote down by $.4 million, net of tax, real property located in Hull, England formerly used by the Coatings Business and currently held for sale. In 2010, the Company further wrote down the property by an additional $1.0 million, net of tax. The real property write-downs were due to declining real estate values. RESULTS OF OPERATIONS: 2009 COMPARED WITH 2008
General
Net income totaled $33.3 million, or $3.61 per diluted share, on sales of $546.9 million in the year ended November 30, 2009, compared to $58.6 million, or $6.35 per diluted share, on sales of $667.5 million in 2008. The Fiberglass-Composite Pipe Group had lower sales and profits due primarily to continued soft market conditions and foreign exchange. Water Transmission Group’s sales declined due to weak demand, but profitability improved due principally to better project cost control and plant efficiencies. The Infrastructure Products Group had lower sales and income due to the decline in both the Pole Products Division and the Hawaii Division associated with continued weak construction spending throughout the U.S. Equity in earnings of TAMCO decreased by $15.8 million in 2009, compared to 2008, due to the decline in the steel rebar market in California, Arizona and Nevada.
AMERON INTERNATIONAL CORPORATION AND SUBSIDIARIES
Table of Contents
25

Sales
Sales decreased $120.6 million, or 18.1%, in 2009, compared to 2008. Sales decreased due to generally weaker economic conditions affecting all of the Company’s businesses. Fiberglass-Composite Pipe's sales decreased $48.7 million, or 17.8%, in 2009, compared to 2008. Sales from operations in the U.S. decreased $21.7 million in 2009 primarily due to weaker oilfield piping demand and weak industrial markets. Sales from Asian subsidiaries decreased $13.7 million in 2009, driven by weaker conditions in Middle Eastern industrial markets and the impact of foreign exchange. Sales from European operations decreased $8.7 million in 2009 primarily due to softer market conditions in Europe, North Africa and Russia and weaker foreign currencies in 2009 than in 2008. Sales from Brazilian operations decreased $4.6 million in 2009, due to the impact of foreign exchange, project delays in municipal water markets, and a halt in activity in the pulp and paper market. Worldwide demand declined in key onshore oilfield, chemical and industrial market segments. However, marine and offshore markets remained strong, sustained by new vessel construction at Asian shipyards.
Water Transmission Group's sales decreased $38.0 million, or 17.7%, in 2009, compared to 2008. The sales decrease was primarily due to weaker demand for water pipe in the western United States and completion of large orders in Colombia during 2008. Wind tower sales remained steady in 2009, compared to prior year.
Infrastructure Products' sales decreased $34.8 million, or 19.4%, in 2009, compared to 2008. The Company’s Hawaii Division had lower sales as residential and commercial construction markets in Hawaii contracted. Demand for aggregates and ready-mix concrete on both Oahu and Maui declined as construction spending continued to soften due to the recessionary economy. Military and governmental spending held steady in Hawaii. The Pole Products Division continued to be impacted by the decline in U.S. housing markets and reduced demand for concrete lighting poles and steel traffic poles. Gross Profit
Gross profit in 2009 was $145.5 million, or 26.6% of sales, compared to $153.6 million, or 23.0% of sales, in 2008. Gross profit decreased $8.2 million in 2009, compared to 2008, due to lower sales offset by better cost control, improved plant efficiencies, lower LIFO reserves, favorable product mix and lower raw material costs.
Fiberglass-Composite Pipe Group's gross profit decreased $14.8 million in 2009, compared to 2008. Profit margins improved to 41.4% in 2009, compared to 39.5% in 2008. Margins were higher in 2009 due to favorable product mix, plant efficiencies and lower raw material costs. Decreased sales, from lower volume and prices, reduced gross profit by $19.2 million, offset by favorable product mix and operating efficiencies of $4.4 million in 2009.
Water Transmission Group's gross profit increased $17.3 million in 2009, compared to 2008. Profit margins increased to 11.9% in 2009, compared to 1.8% in 2008. Improved profit margins resulted from plant efficiencies with the completion of newly-constructed wind tower facility, cost controls and completion of low-margin pipe projects in 2008.
Gross profit in the Infrastructure Products Group decreased $11.5 million in 2009, compared to 2008. Profit margins declined to 19.2% in 2009, compared to 21.9% in 2008. Margins were lower in 2009 due to pricing pressures related to challenging market conditions. Lower sales negatively impacted gross profit by $7.6 million in 2009, while lower margins primarily related to unfavorable plant utilization decreased gross profit by an additional $3.9 million in 2009.
Consolidated gross profit was $2.1 million higher in 2009 than in 2008 due to decreased reserves in 2009 associated with LIFO accounting of certain steel inventories used by the Water Transmission Group due to lower LIFO inventory quantities and a decrease in steel prices.
AMERON INTERNATIONAL CORPORATION AND SUBSIDIARIES
Table of Contents
26

Selling, General and Administrative Expenses
SG&A totaled $100.0 million, or 18.3% of sales, in 2009, compared to $98.2 million, or 14.7% of sales, in 2008. The $1.8 million increase in SG&A was due to higher pension expense of $8.0 million, higher legal expenses of $1.9 million, due primarily to the U.S. Treasury Department’s Office of Foreign Assets Control (“OFAC”) inquiry, offset by lower stock compensation costs of approximately $2.2 million, favorable foreign exchange impact of $1.8 million, lower insurance premiums of $1.6 million and lower other expenses of $2.5 million.
Other Income, Net
Other income totaled $7.4 million in 2009, compared to $8.2 million in 2008. The decrease in other income in 2009 was due primarily to higher dividends from affiliates of $.8 million, higher gains on asset sales of $.5 million, and lower foreign currency losses of $.2 million, more than offset by $.5 million lower royalties and $1.8 million lower scrap inventory sales.
Interest
Net interest totaled $.6 million in 2009, compared to $1.5 million in 2008. Interest income was $1.1 million in 2009, a decrease of $2.7 million compared to 2008, due to lower interest rates on short-term investments. Interest expense declined from $.5 million in 2009 to $2.3 million in 2008, due to lower debt levels. Provision for Income Taxes
Income taxes decreased to $15.5 million in 2009, from $17.0 million in 2008. The effective tax rate on income from continuing operations increased to 29.0% in 2009, from 26.0% in 2008. The effective tax rate in 2009 was reduced by tax benefits of $1.2 million associated with the adjustment to a deferred tax liability related to earnings and profits from the Company’s former New Zealand subsidiary. The effective tax rate in 2008 was reduced by tax benefits of $2.9 million associated with tax years no longer subject to audit and settlement of the 2005-2006 Internal Revenue Service (“IRS”) examinations. For both 2008 and 2009, the Company provided a full valuation allowance for the net operating loss carry-overs of its foreign subsidiaries except its subsidiary in the Netherlands. The Company released $1.3 million in 2009 and $1.1 million in 2008 of valuation allowance for deferred tax assets related to the Netherlands subsidiary due to profitability in 2008 and projected future profitability.
Equity in Earnings of Affiliate, Net of Taxes
Equity in earnings of affiliate, which consists of the Company’s share of the net income or loss of TAMCO, decreased to a loss of $5.5 million in 2009, compared to income of $10.3 million in 2008. Equity income is shown net of income taxes at an effective rate of 7.8% and 9.6% in 2009 and 2008, respectively. The decline in TAMCO’s earnings was due to the collapse of infrastructure spending for steel rebar in California, Arizona and Nevada. TAMCO halted production in the first quarter of 2009 and had limited production during the remainder of 2009.
Income from Discontinued Operations, Net of Taxes
Income from discontinued operations totaled $.8 million in 2009, net of taxes.
AMERON INTERNATIONAL CORPORATION AND SUBSIDIARIES
Table of Contents
27

OFF-BALANCE SHEET FINANCING
The Company does not have any off-balance sheet financing, other than listed in the Liquidity and Capital Resources section herein. All of the Company's subsidiaries are included in the financial statements, and the Company does not have relationships with any special purpose entities.
CONTINGENCIES
In 2004, Sable Offshore Energy Inc. ("Sable"), as agent for certain owners of the Sable Offshore Energy Project, brought an action against various coatings suppliers and application contractors, including the Company and its subsidiary, Ameron B.V., in the Supreme Court of Nova Scotia, Canada. Sable seeks damages allegedly sustained by it resulting from performance problems with several coating systems used on the Sable Offshore Energy Project, including coatings products furnished by the Company and Ameron B.V. All of the co-defendants, other than the Company, Ameron B.V. and an unaffiliated licensee of the Company, have since settled. Sable's originating notice and statement of claim alleged a claim for damages in an unspecified amount. Sable later alleged that its claim for damages against all defendants was approximately 440.0 million Canadian dollars. More recently, however, Sable sent the Company a revised claim which included an alternative method for calculating damages. Although Sable did not specify an aggregate claim amount under its alternative method, that method if adopted would appear to substantially reduce the amount of damages. The Company contests any claim amount and is vigorously defending itself on the merits in this action. This matter is in discovery, and no trial date has yet been established. Based upon the information available at this time, the Company is not able to estimate the possible range of loss with respect to this case.
In 2004, BP America Production Company (“BP America”) brought an action against the Company in the 24th Judicial District Court, Parish of Jefferson, Louisiana in connection with fiberglass pipe sold by the Company for installation in four offshore platforms constructed for BP America. The plaintiff seeks damages allegedly sustained by it resulting from claimed defects in such pipe. BP America’s petition as filed alleged a claim against the Company for rescission, products liability, negligence, breach of contract and warranty and for damages in an amount of not less than $20.0 million; but BP America has since reduced its claim to $12.9 million. The Company contests this amount. This matter is in discovery, and no trial date has yet been established. The Company intends to vigorously defend itself in this action. Based upon the information available to it at this time, the Company is not able to estimate the possible range of loss with respect to this case.
In 2006, the Cawelo, California Water District (“Cawelo”) brought an action against the Company in the Superior Court, Kern County, California in connection with concrete pipe sold by the Company in 1995 for a wastewater recovery pipeline. Cawelo seeks damages allegedly sustained by it resulting from the failure of such pipe in 2004. Cawelo’s petition as filed alleged a claim against the Company for products liability, negligence, breach of express warranty and breach of written contract and for damages in an amount of not less than $8 million, an amount which the Company contested. On December 3, 2010, the Company settled this case subject to court approval for a net payment of $.1 million by the Company. On December 27, 2010, the Court issued an order finding the settlement by the Company to be in good faith and dismissing a cross-complaint against the Company by a surety of a non-settling defendant. The order remains subject to possible appeal. The terms of the settlement will not have a material effect on the Company’s financial condition or results of operations.
In August 2010, Petroleum Polymer Company LLC ("PPC") brought an action against Ameron (Pte) Ltd. ("Ameron Pte"), an indirect subsidiary of the Company, in the Primary Court of Oman. The complaint alleged that Ameron Pte breached the terms of a purchase agreement for its supply of fiberglass pipe to PPC for use in an oil extraction project in Oman. PPC's primary allegation is that a component supplied by Ameron Pte failed during testing, resulting in a failure of the pipe system. PPC asserted damages totaling approximately $20.0 million, including alleged claims for the cost of replacing damaged pipe, recovery of penalties incurred due to the resulting delay in the project, and lost future opportunities. Ameron Pte contests any claim amount and intends to vigorously defend itself in this action. Based upon the information available to it at this time, the Company is able to neither estimate the possible range of loss with respect to this case nor the timing of substantive judicial proceedings.
AMERON INTERNATIONAL CORPORATION AND SUBSIDIARIES
Table of Contents
28

The Company is a defendant in a number of asbestos-related personal injury lawsuits. These cases generally seek unspecified damages for asbestos-related diseases based on alleged exposure to products previously manufactured by the Company and others. As of November 30, 2010, the Company was a defendant in 14 asbestos-related cases, compared to 20 cases as of November 30, 2009. During the year ended November 30, 2010, there were ten new asbestos-related cases, 11 dismissed cases, five settled cases and no judgments. The Company incurred net expenses of $.1 million, $.3 million and $.2 million, and recovered less than $.1 million, $.1 million and $.2 million, during the years ended November 30, 2010, 2009 and 2008, respectively. Based upon the information available to it at this time, the Company is not able to estimate the possible range of loss with respect to these cases.
In December 2008, the Company received from the U.S. Treasury Department’s Office of Foreign Assets Control (“OFAC”) a Requirement to Furnish Information regarding transactions involving Iran. With the assistance of outside counsel, the Company conducted an internal inquiry and continues to cooperate fully with OFAC on this matter. Based upon the information available to it at this time, the Company is not able to predict the outcome of this matter. If the Company violated governmental regulations, material fines and penalties could be imposed.
The Company is subject to federal, state and local laws and regulations concerning the environment and is currently participating in administrative proceedings at several sites under these laws. While the Company finds it difficult to estimate with any certainty the total cost of remediation at the several sites, on the basis of currently available information and reserves provided, the Company believes that the outcome of such environmental regulatory proceedings will not have a material effect on the Company's financial position, cash flows, or results of operations.
In addition, certain other claims, suits and complaints that arise in the ordinary course of business have been filed or are pending against the Company. Management believes that these matters are either adequately reserved, covered by insurance, or would not have a material effect on the Company's financial position, cash flows or results of operations if disposed of unfavorably.
NEW ACCOUNTING PRONOUNCEMENTS
In June 2008, the Financial Accounting Standards Board (“FASB”) issued guidance requiring unvested instruments granted in share-based payment transactions that contain nonforfeitable rights to dividends or dividend equivalents to be accounted for as participating securities subject to the two-class method of computing earnings per share. All earnings per share data for periods prior to adoption are required to be adjusted retrospectively. The Company adopted the guidance as of December 1, 2009, and the adoption did not have a material effect on the Company’s consolidated financial statements. See Note (1) of the Notes to Consolidated Financial Statements, under Item 8, herein, for a reconciliation of net income allocated to Common Stock using the two-class method.
In December 2008, the FASB issued revised guidance for employers’ disclosures about postretirement benefit plan assets effective for fiscal years ending after December 15, 2009. The FASB requires an employer to disclose investment policies and strategies, categories, fair value measurements, and significant concentration of risk among its postretirement benefit plan assets. The Company adopted the revised guidance as of November 30, 2010. Adoption did not have a material effect on the Company’s consolidated financial statements.
In June 2009, the FASB issued guidance to revise the approach to determine when a variable interest entity (“VIE”) should be consolidated. The new consolidation model for VIE’s considers whether the Company has the power to direct the activities that most significantly impact the VIE’s economic performance and shares in the significant risks and rewards of the entity. The guidance on VIE’s requires companies to continually reassess VIE’s to determine if consolidation is appropriate and provide additional disclosures. The Company adopted the guidance as of December 1, 2009, and adoption did not have a material effect on the Company’s consolidated financial statements.
In January 2010, the FASB required new disclosures about fair value of financial instruments for interim and annual reporting periods. These new disclosures were effective for interim and annual reporting periods beginning after December 15, 2009, except for disclosures about purchases, sales, issuances and settlements of Level 3 financial instruments, which are effective for interim and annual reporting periods in fiscal years beginning after December 15, 2010. Adoption is not expected to have a material effect on the Company’s consolidated financial statements.
AMERON INTERNATIONAL CORPORATION AND SUBSIDIARIES
Table of Contents
29

ITEM 7A - QUANTITATIVE AND QUALITATIVE DISCLOSURES ABOUT MARKET RISK Foreign Currency Risk
The Company operates internationally, giving rise to exposure to market risks from changes in foreign exchange rates. From time to time, the Company borrows in various currencies to reduce the level of net assets subject to changes in foreign exchange rates or purchases foreign exchange forward and option contracts to hedge firm commitments, such as receivables and payables, denominated in foreign currencies. The Company does not use the contracts for speculative or trading purposes. At November 30, 2010, the Company had four foreign currency forward contracts expiring at various dates through February 14, 2011 with a fair value loss of less than $.1 million. Such instruments are carried at fair value, with related adjustments recorded in other income.
Debt Risk
The Company can have variable-rate, short-term and long-term debt as well as fixed-rate, long-term debt. The fair value of the Company's fixed-rate debt is subject to changes in interest rates. The estimated fair value of the Company's variable-rate debt approximates the carrying value of such debt since the variable interest rates are market-based and the Company believes such debt could be refinanced on materially similar terms. The Company is subject to the availability of credit to support new requirements and to refinance long-term and short-term debt.
At November 30, 2010, the estimated fair value of notes payable by the Company's wholly-owned subsidiary in Singapore totaling approximately $15.4 million, with a fixed rate of 4.25% per annum, was $16.4 million. These notes must be repaid in installments of approximately $7.7 million per year. The Company had $7.2 million of variable-rate industrial development bonds payable at an interest rate of .49% per annum at November 30, 2010, payable in 2016. The Company also had $8.5 million of variable-rate industrial development bonds payable at an interest rate of .49% per annum at November 30, 2010, payable in 2021. The industrial revenue bonds are supported by standby letters of credit issued under the Revolver, which has a scheduled maturity of August 2012.
AMERON INTERNATIONAL CORPORATION AND SUBSIDIARIES
Total Outstanding As of November 30, 2010 Expected Maturity Date Recorded Fair (Dollars in thousands) 2011 2012 2013 2014 2015 Thereafter Value Value Liabilities: Long-term debt: Fixed-rate secured notes, payable in Singapore dollars $ 7,724 $ 7,724 $ - $ - $ - $ - $ 15,448 $ 16,445 Average interest rate 4.25 % 4.25 % - - - - 4.25 % Variable-rate industrial development bonds, payable in U.S. dollars - - - - - 7,200 7,200 7,200 Average interest rate - - - - - .49 % .49 % Variable-rate industrial development bonds, payable in U.S. dollars - - - - - 8,500 8,500 8,500 Average interest rate - - - - - .49 % .49 %
Table of Contents
30

ITEM 8 - FINANCIAL STATEMENTS AND SUPPLEMENTARY DATA CONSOLIDATED STATEMENTS OF INCOME
The accompanying notes are an integral part of these consolidated financial statements.
AMERON INTERNATIONAL CORPORATION AND SUBSIDIARIES
Year ended November 30, (Dollars in thousands, except per share data) 2010 2009 2008 Sales $ 503,259 $ 546,944 $ 667,543 Cost of sales (375,335) (401,492) (513,922)Gross profit 127,924 145,452 153,621 Selling, general and administrative expenses (101,751) (99,976) (98,166)Other income, net 3,631 7,448 8,222 Gain from sale of investment in affiliate 48,401 - - Interest income, net (22) 588 1,533
Income from continuing operations before income taxes and equity in (loss)/earnings of affiliate 78,183 53,512 65,210
Provision for income taxes (29,709) (15,517) (16,955)Income from continuing operations before equity in (loss)/earnings of affiliate 48,474 37,995 48,255
Equity in (loss)/earnings of affiliate, net of taxes (1,206) (5,512) 10,337 Income from continuing operations 47,268 32,483 58,592 (Loss)/income from discontinued operations, net of taxes (1,014) 817 - Net income $ 46,254 $ 33,300 $ 58,592 Basic earnings per share allocated to Common Stock (see Note 1):
Income from continuing operations $ 5.11 $ 3.52 $ 6.37 (Loss)/income from discontinued operations, net of taxes (.11) .09 - Net income $ 5.00 $ 3.61 $ 6.37
Diluted earnings per share allocated to Common Stock (see Note 1):
Income from continuing operations $ 5.11 $ 3.52 $ 6.35 (Loss)/income from discontinued operations, net of taxes (.11) .09 - Net income $ 5.00 $ 3.61 $ 6.35
Weighted-average shares (basic) 9,205,439 9,166,558 9,124,557 Weighted-average shares (diluted) 9,220,211 9,184,771 9,169,056
Table of Contents
31

CONSOLIDATED BALANCE SHEETS - ASSETS
The accompanying notes are an integral part of these consolidated financial statements.
AMERON INTERNATIONAL CORPORATION AND SUBSIDIARIES
As of November 30, (Dollars in thousands) 2010 2009 ASSETS
Current assets Cash and cash equivalents $ 236,737 $ 181,114 Receivables, less allowances of $3,848 in 2010 and $5,351 in 2009 129,855 151,210 Inventories 69,381 62,700 Deferred income taxes 22,441 19,795 Prepaid expenses and other current assets 10,862 11,585
Total current assets 469,276 426,404
Investments
Equity method affiliate - 30,626 Cost method affiliates 3,784 3,784
Property, plant and equipment
Land 46,132 46,029 Buildings 103,438 100,583 Machinery and equipment 371,153 345,604 Construction in progress 31,048 32,306
Total property, plant and equipment at cost 551,771 524,522
Accumulated depreciation (307,573) (286,014)
Total property, plant and equipment, net 244,198 238,508 Deferred income taxes 11,289 14,321 Goodwill and intangible assets, net of accumulated amortization of $1,293 in 2010 and $1,257 in 2009 2,061 2,088 Other assets 50,961 46,818
Total assets $ 781,569 $ 762,549
Table of Contents
32

CONSOLIDATED BALANCE SHEETS - LIABILITIES AND STOCKHOLDERS' EQUITY
The accompanying notes are an integral part of these consolidated financial statements.
AMERON INTERNATIONAL CORPORATION AND SUBSIDIARIES
As of November 30, (Dollars in thousands, except per share data) 2010 2009 LIABILITIES AND STOCKHOLDERS' EQUITY
Current liabilities Current portion of long-term debt $ 7,724 $ 7,366 Trade payables 49,881 44,052 Accrued liabilities 64,533 77,515 Income taxes payable 24,682 10,004
Total current liabilities 146,820 138,937
Long-term debt, less current portion 23,424 30,933 Deferred income taxes 2,691 1,710 Other long-term liabilities 100,667 99,379
Total liabilities 273,602 270,959
Commitments and contingencies
Stockholders' equity
Common Stock, par value $2.50 per share, authorized 24,000,000 shares, outstanding 9,249,105 shares in 2010 and 9,209,836 shares in 2009, net of treasury shares 30,047 29,920
Additional paid-in capital 60,986 59,531 Retained earnings 507,625 500,224 Accumulated other comprehensive loss (33,663) (42,036)Treasury Stock (2,769,637 shares in 2010 and 2,758,356 shares in 2009) (57,028) (56,049)
Total stockholders' equity 507,967 491,590
Total liabilities and stockholders' equity $ 781,569 $ 762,549
Table of Contents
33
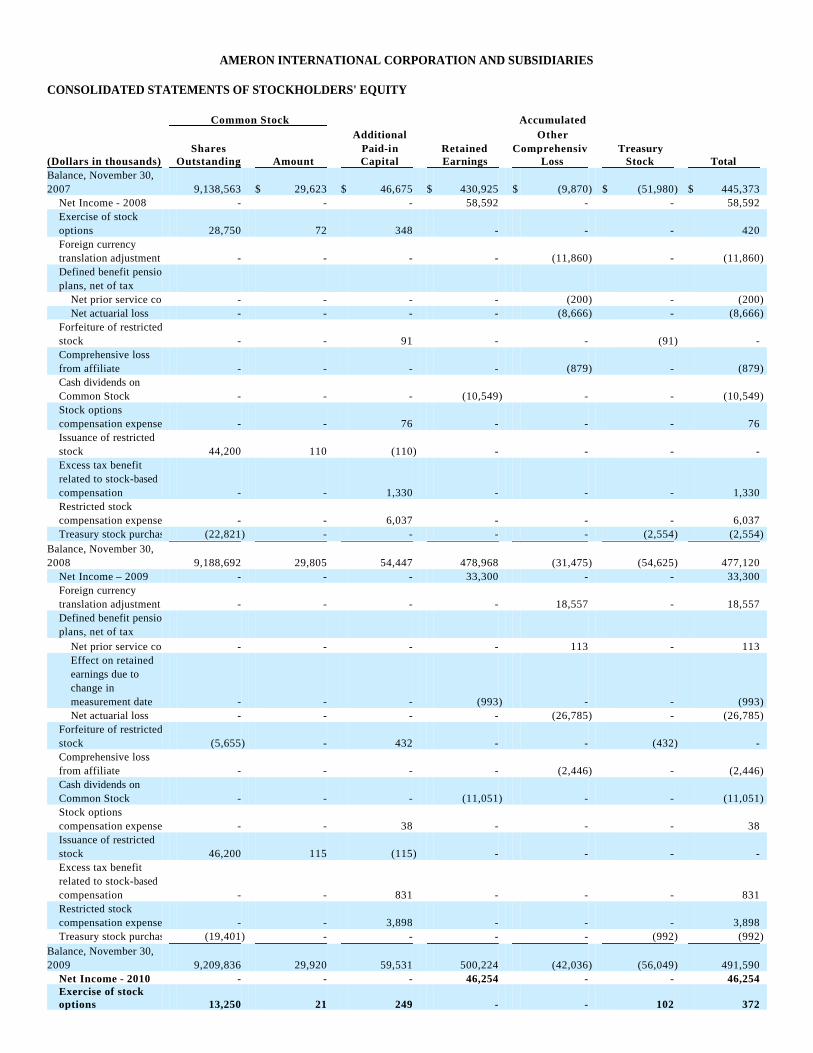
CONSOLIDATED STATEMENTS OF STOCKHOLDERS' EQUITY
AMERON INTERNATIONAL CORPORATION AND SUBSIDIARIES
Common Stock Accumulated Additional Other Shares Paid-in Retained Comprehensive Treasury
(Dollars in thousands) Outstanding Amount Capital Earnings Loss Stock Total Balance, November 30, 2007 9,138,563 $ 29,623 $ 46,675 $ 430,925 $ (9,870) $ (51,980) $ 445,373
Net Income - 2008 - - - 58,592 - - 58,592 Exercise of stock options 28,750 72 348 - - - 420 Foreign currency translation adjustment - - - - (11,860) - (11,860)Defined benefit pension plans, net of tax
Net prior service cost - - - - (200) - (200)Net actuarial loss - - - - (8,666) - (8,666)
Forfeiture of restricted stock - - 91 - - (91) - Comprehensive loss from affiliate - - - - (879) - (879)Cash dividends on Common Stock - - - (10,549) - - (10,549)Stock options compensation expense - - 76 - - - 76 Issuance of restricted stock 44,200 110 (110) - - - - Excess tax benefit related to stock-based compensation - - 1,330 - - - 1,330 Restricted stock compensation expense - - 6,037 - - - 6,037 Treasury stock purchase (22,821) - - - - (2,554) (2,554)
Balance, November 30, 2008 9,188,692 29,805 54,447 478,968 (31,475) (54,625) 477,120
Net Income – 2009 - - - 33,300 - - 33,300 Foreign currency translation adjustment - - - - 18,557 - 18,557 Defined benefit pension plans, net of tax
Net prior service cost - - - - 113 - 113 Effect on retained earnings due to change in measurement date - - - (993) - - (993) Net actuarial loss - - - - (26,785) - (26,785)
Forfeiture of restricted stock (5,655) - 432 - - (432) - Comprehensive loss from affiliate - - - - (2,446) - (2,446)Cash dividends on Common Stock - - - (11,051) - - (11,051)Stock options compensation expense - - 38 - - - 38 Issuance of restricted stock 46,200 115 (115) - - - - Excess tax benefit related to stock-based compensation - - 831 - - - 831 Restricted stock compensation expense - - 3,898 - - - 3,898 Treasury stock purchase (19,401) - - - - (992) (992)
Balance, November 30, 2009 9,209,836 29,920 59,531 500,224 (42,036) (56,049) 491,590
Net Income - 2010 - - - 46,254 - - 46,254 Exercise of stock options 13,250 21 249 - - 102 372

The accompanying notes are an integral part of these consolidated financial statements.
Foreign currency translation adjustment - - - - 3,551 - 3,551 Defined benefit pension plans, net of tax
Net prior service cost - - - - 453 - 453 Net actuarial loss - - - - (102) - (102)
Forfeiture of restricted stock (6,000) (15) 15 - - - - Reclassification adjustment upon sale of investment, net of tax - - - - 4,471 - 4,471 Cash dividends on Common Stock - - - (38,853) - - (38,853)Stock options compensation expense - - 25 - - - 25 Issuance of restricted stock 48,300 121 (121) - - - - Tax deficiency related to stock-based compensation - - (693) - - - (693)Restricted stock compensation expense - - 1,980 - - - 1,980 Treasury stock purchase (16,281) - - - - (1,081) (1,081)
Balance, November 30, 2010 9,249,105 $ 30,047 $ 60,986 $ 507,625 $ (33,663) $ (57,028) $ 507,967
Table of Contents
34

CONSOLIDATED STATEMENTS OF COMPREHENSIVE INCOME
The accompanying notes are an integral part of these consolidated financial statements.
AMERON INTERNATIONAL CORPORATION AND SUBSIDIARIES
Year ended November 30, (In thousands) 2010 2009 2008 Net income $ 46,254 $ 33,300 $ 58,592
Foreign currency translation adjustment 3,551 18,557 (11,860)Defined benefit pension plans, net of tax
Net prior service cost 453 113 (200)Net actuarial loss (102) (26,785) (8,666)
Comprehensive gain/(loss) from affiliate, net of tax - (2,446) (879)Reclassification adjustment upon sale of investment, net of tax 4,471 - -
Comprehensive income $ 54,627 $ 22,739 $ 36,987
Table of Contents
35

CONSOLIDATED STATEMENTS OF CASH FLOWS
The accompanying notes are an integral part of these consolidated financial statements.
AMERON INTERNATIONAL CORPORATION AND SUBSIDIARIES
Year ended November 30, (In thousands) 2010 2009 2008 OPERATING ACTIVITIES
Net income $ 46,254 $ 33,300 $ 58,592 Adjustments to reconcile net income to net cash provided by operating activities:
Depreciation 26,506 22,072 20,320 Amortization 33 36 89 (Benefit)/provision for deferred income taxes (717) 13,334 (3,509)Loss/(earnings in excess of distributions) from affiliates 1,308 5,978 (630)(Gain)/loss from sale of property, plant and equipment (410) (451) 68 Gain from sale of investment in affiliate (48,401) - - Stock compensation expense 2,005 3,936 6,113 Non-cash write-down of assets held for sale, net of taxes 1,014 415 -
Changes in operating assets and liabilities: Receivables, net 21,958 34,343 1,381 Inventories (9,170) 35,910 3,846 Prepaid expenses and other current assets 847 (1,118) 1,802 Other assets (673) (7,719) (5,473)Trade payables 3,985 (10,675) 8,688 Accrued liabilities and income taxes payable 4,032 (5,317) (6,129)Other long-term liabilities and deferred income taxes 3,593 1,813 3,272
Net cash provided by operating activities 52,164 125,857 88,430 INVESTING ACTIVITIES
Proceeds from sale of property, plant and equipment 947 1,951 1,575 Proceeds from sale of investment in affiliate 78,067 - - Additions to property, plant and equipment (30,965) (46,874) (60,697)Investment in affiliate - (10,000) - Loan repayment from/(loan to) affiliate, net 1,500 (15,000) - Net cash provided by/(used in) investing activities 49,549 (69,923) (59,122)
FINANCING ACTIVITIES Issuance of debt - 463 - Repayment of debt (7,968) (16,985) (21,126)Debt issuance costs - (1,049) - Dividends on Common Stock (38,722) (11,051) (10,549)Issuance of Common Stock 372 - 420 Excess tax benefits related to stock-based compensation - 831 1,330 Purchase of treasury stock (1,081) (992) (2,554)Net cash used in financing activities (47,399) (28,783) (32,479)
Effect of exchange rate changes on cash and cash equivalents 1,309 10,402 (8,701)
Net change in cash and cash equivalents 55,623 37,553 (11,872)Cash and cash equivalents at beginning of year 181,114 143,561 155,433 Cash and cash equivalents at end of year $ 236,737 $ 181,114 $ 143,561
Table of Contents
36

NOTES TO CONSOLIDATED FINANCIAL STATEMENTS NOTE 1 - SUMMARY OF SIGNIFICANT ACCOUNTING POLICIES
Principles of Consolidation
The consolidated financial statements include the accounts of Ameron International Corporation and all wholly-owned subsidiaries ("Ameron" or the "Company"). All material intercompany accounts and transactions have been eliminated.
Reclassifications
Certain prior-year balances have been reclassified to conform with the current-year presentation.
Use of Estimates
The preparation of financial statements in conformity with United States Generally Accepted Accounting Principles (“GAAP”) requires Management to make certain estimates and assumptions that affect the reported amounts of assets and liabilities and disclosure of contingent assets and liabilities and the reported amounts of revenues and expenses. Significant estimates include revenue and costs recorded under percentage-of-completion accounting, assumptions related to benefit plans and reserves associated with management incentives, receivables, inventories, income taxes, self insurance and environmental and legal contingencies. Actual results could differ from those estimates.
Revenue Recognition
Revenue for the Fiberglass-Composite Pipe and Infrastructure Products segments is recognized when risk of ownership and title pass, primarily at the time goods are shipped, provided that an agreement exists between the customer and the Company, the price is fixed or determinable and collection is reasonably assured. Revenue is recognized for the Water Transmission Group primarily under the percentage-of-completion method, typically based on completed units of production, since products are manufactured under enforceable and binding construction contracts, are typically designed for specific applications, are not interchangeable between projects, and are not manufactured for stock. In those cases in which products are manufactured for stock or are not related to specific construction contracts, revenue is recognized under the same criteria used by the other two segments. Revenue under the percentage-of-completion method is subject to a greater level of estimation, which affects the timing of revenue recognition, costs and profits. Estimates are reviewed on a consistent basis and are adjusted periodically to reflect current expectations. Costs attributable to unpriced change orders are treated as costs of contract performance in the period, and contract revenue is recognized if recovery is probable. Disputed or unapproved change orders are treated as claims. Recognition of amounts of additional contract revenue relating to claims occurs when amounts have been received or awarded with recognition based on the percentage-of-completion methodology.
Research and Development Costs
Research and development costs, which relate primarily to the development, design and testing of products, are expensed as incurred. Such costs, which are included in selling, general and administrative expenses, were $2,759,000 in 2010, $5,969,000 in 2009, and $4,347,000 in 2008.
Environmental Clean-up Costs and Other Claims
The Company expenses environmental clean-up costs related to existing conditions resulting from past or current operations on a site-by-site basis. Liabilities and costs associated with these matters, as well as other pending litigation and asserted claims arising in the ordinary course of business, require estimates of future costs and judgments based on the knowledge and experience of Management and the Company’s legal counsel. When the Company's exposures can be reasonably estimated and are probable, liabilities and expenses are recorded.
AMERON INTERNATIONAL CORPORATION AND SUBSIDIARIES
Table of Contents
37

Income Taxes
Deferred income tax assets and liabilities are computed for differences between the financial statement and income tax bases of assets and liabilities. Such deferred income tax asset and liability computations are based on enacted tax laws and rates applicable to periods in which the differences are expected to reverse. Valuation allowances are established to reduce deferred income tax assets to the amounts expected to be realized.
The Company is subject to income taxes in the U.S. and in numerous foreign jurisdictions. Judgments, estimates and assumptions are required in determining tax return reporting positions and in calculating provisions for income taxes, which are based on interpretations of tax regulations and accounting pronouncements. Liabilities are established for uncertain tax positions when it is more likely than not that such positions will be challenged and may not be sustained upon review by taxing authorities. These liabilities are established through the income tax provisions and are recorded as liabilities on the consolidated balance sheets. These liabilities are recalculated as governing laws and facts and circumstances change, such as the closing of a tax audit or the expiration of the statute of limitations for a specific exposure.
Earnings Per Share
Basic and diluted net income per share are computed using the two-class method which allocates earnings to both Common Stock and participating securities. Under the two-class method, unvested restricted Common Stock with non-forfeitable rights to dividends are considered participating securities. Dividends from such participating securities are excluded from net income allocated to Common Stock for purposes of the two-class method calculation.
Basic shares are computed on the basis of the weighted-average number of shares of Common Stock outstanding during the periods presented. Diluted shares are computed on the basis of the weighted-average number of shares of Common Stock outstanding plus the effect of outstanding stock options and restricted stock using the treasury stock method. Stock options and restricted stock of 19,286, 39,483 and 58,802 shares are excluded from the below calculation for the years ended November 30, 2010, 2009 and 2008, respectively, as inclusion would be anti-dilutive.
AMERON INTERNATIONAL CORPORATION AND SUBSIDIARIES
Table of Contents
38

Following is a reconciliation of net income allocated to Common Stock, using the two-class method, and the weighted-average number of shares used in the computation of basic and diluted earnings per share allocated to Common Stock:
AMERON INTERNATIONAL CORPORATION AND SUBSIDIARIES
(Dollars in thousands, except per share data) 2010 2009 2008 Numerator for basic earnings per share:
Income from continuing operations $ 47,268 $ 32,483 $ 58,592 Less: income from continuing operations allocated to participating securities (212) (217) (423)Income from continuing operations allocated to Common Stock 47,056 32,266 58,169
(Loss)/income from discontinued operations (1,014) 817 -
Net income allocated to Common Stock $ 46,042 $ 33,083 $ 58,169
Numerator for diluted earnings per share:
Income from continuing operations $ 47,268 $ 32,483 $ 58,592 Less: income from continuing operations allocated to participating securities (188) (185) (328)Income from continuing operations allocated to Common Stock 47,080 32,298 58,264
(Loss)/income from discontinued operations (1,014) 817 -
Net income allocated to Common Stock $ 46,066 $ 33,115 $ 58,264
Denominator for basic and diluted earnings per share:
Weighted-average shares outstanding, basic 9,205,439 9,166,558 9,124,557 Dilutive effect of stock options and restricted stock 14,772 18,213 44,499 Weighted-average shares outstanding, diluted 9,220,211 9,184,771 9,169,056
Basic earnings per share allocated to Common Stock:
Income from continuing operations $ 5.11 $ 3.52 $ 6.37 (Loss)/income from discontinued operations, net of taxes (.11) .09 - Net income $ 5.00 $ 3.61 $ 6.37
Diluted earnings per share allocated to Common Stock:
Income from continuing operations $ 5.11 $ 3.52 $ 6.35 (Loss)/income from discontinued operations, net of taxes (.11) .09 - Net income $ 5.00 $ 3.61 $ 6.35
Table of Contents
39
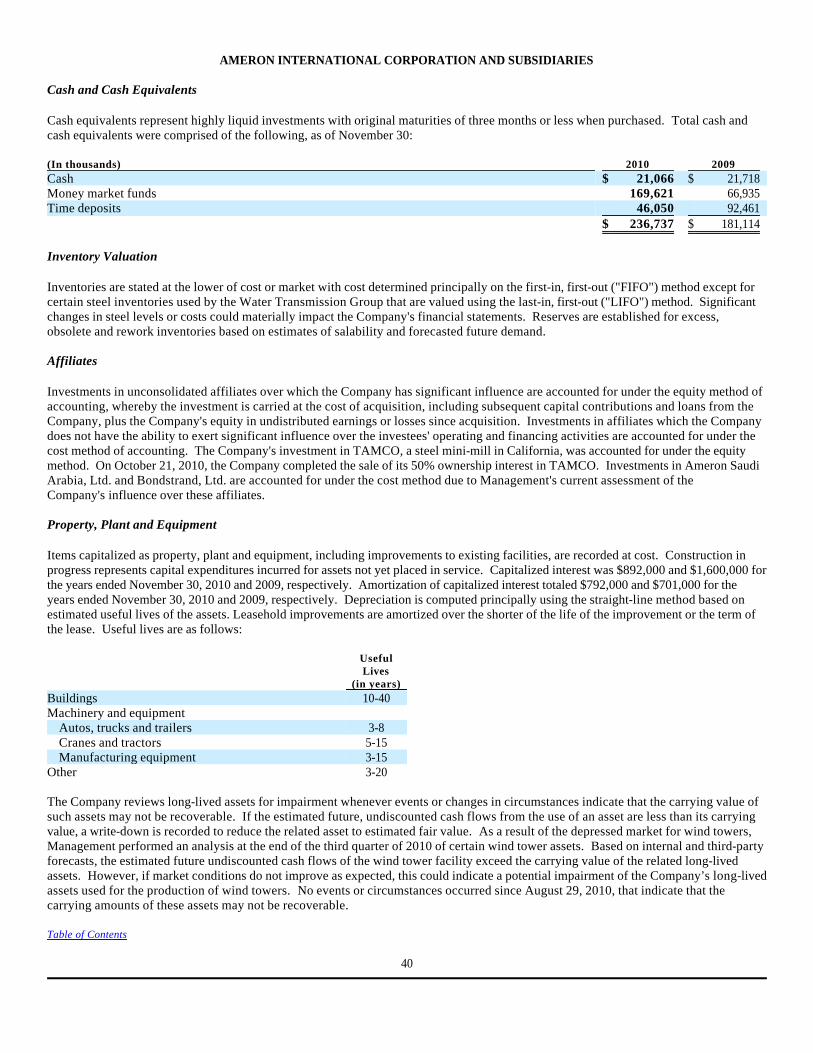
Cash and Cash Equivalents
Cash equivalents represent highly liquid investments with original maturities of three months or less when purchased. Total cash and cash equivalents were comprised of the following, as of November 30:
Inventory Valuation
Inventories are stated at the lower of cost or market with cost determined principally on the first-in, first-out ("FIFO") method except for certain steel inventories used by the Water Transmission Group that are valued using the last-in, first-out ("LIFO") method. Significant changes in steel levels or costs could materially impact the Company's financial statements. Reserves are established for excess, obsolete and rework inventories based on estimates of salability and forecasted future demand.
Affiliates
Investments in unconsolidated affiliates over which the Company has significant influence are accounted for under the equity method of accounting, whereby the investment is carried at the cost of acquisition, including subsequent capital contributions and loans from the Company, plus the Company's equity in undistributed earnings or losses since acquisition. Investments in affiliates which the Company does not have the ability to exert significant influence over the investees' operating and financing activities are accounted for under the cost method of accounting. The Company's investment in TAMCO, a steel mini-mill in California, was accounted for under the equity method. On October 21, 2010, the Company completed the sale of its 50% ownership interest in TAMCO. Investments in Ameron Saudi Arabia, Ltd. and Bondstrand, Ltd. are accounted for under the cost method due to Management's current assessment of the Company's influence over these affiliates.
Property, Plant and Equipment
Items capitalized as property, plant and equipment, including improvements to existing facilities, are recorded at cost. Construction in progress represents capital expenditures incurred for assets not yet placed in service. Capitalized interest was $892,000 and $1,600,000 for the years ended November 30, 2010 and 2009, respectively. Amortization of capitalized interest totaled $792,000 and $701,000 for the years ended November 30, 2010 and 2009, respectively. Depreciation is computed principally using the straight-line method based on estimated useful lives of the assets. Leasehold improvements are amortized over the shorter of the life of the improvement or the term of the lease. Useful lives are as follows:
The Company reviews long-lived assets for impairment whenever events or changes in circumstances indicate that the carrying value of such assets may not be recoverable. If the estimated future, undiscounted cash flows from the use of an asset are less than its carrying value, a write-down is recorded to reduce the related asset to estimated fair value. As a result of the depressed market for wind towers, Management performed an analysis at the end of the third quarter of 2010 of certain wind tower assets. Based on internal and third-party forecasts, the estimated future undiscounted cash flows of the wind tower facility exceed the carrying value of the related long-lived assets. However, if market conditions do not improve as expected, this could indicate a potential impairment of the Company’s long-lived assets used for the production of wind towers. No events or circumstances occurred since August 29, 2010, that indicate that the carrying amounts of these assets may not be recoverable.
AMERON INTERNATIONAL CORPORATION AND SUBSIDIARIES
(In thousands) 2010 2009 Cash $ 21,066 $ 21,718 Money market funds 169,621 66,935 Time deposits 46,050 92,461 $ 236,737 $ 181,114
Useful Lives
(in years)Buildings 10-40 Machinery and equipment
Autos, trucks and trailers 3-8 Cranes and tractors 5-15 Manufacturing equipment 3-15
Other 3-20
Table of Contents
40
Goodwill and Intangible Assets
Intangible assets are amortized on a straight-line basis over periods ranging from three to 15 years.
The cost of an acquired business is allocated to the acquired net assets based on the estimated fair values at the date of acquisition. The excess of the cost of an acquired business over the aggregate fair value is recorded as goodwill. Goodwill is not amortized, but instead tested for impairment at least annually. Such tests require Management to make estimates about future cash flows and other factors to determine the fair value of the respective assets.
The Company reviews the recoverability of intangible assets for impairment whenever events or changes in circumstances indicate that the carrying value of such assets may not be recoverable. If the estimated, future, undiscounted cash flows from the use of an asset are less than its carrying value, a write-down is recorded to reduce the related asset to estimated fair value.
Self Insurance
The Company typically utilizes third-party insurance subject to varying retention levels (deductibles or primary self insurance) and aggregate limits. The Company is self insured for a portion of the losses and liabilities primarily associated with workers' compensation claims and general, product and vehicle liability. Losses are accrued based upon the Company's estimates of the aggregate liability for claims incurred using historical experience and certain actuarial assumptions followed in the insurance industry. The estimate of self-insurance liability includes an estimate of incurred but not reported claims, based on data compiled from historical experience.
Foreign Currency Translation
The functional currencies for the Company's foreign operations are the applicable local currencies. The translation from the applicable foreign currencies to U.S. dollars is performed for balance sheet accounts using current exchange rates in effect at the balance sheet date and for revenue and expense accounts using a weighted-average exchange rate during the period. The resulting translation adjustments are recorded in accumulated other comprehensive income/(loss). Translation adjustments arising from intercompany advances that are permanent in nature are also included in accumulated other comprehensive income/(loss). Gains or losses resulting from foreign currency transactions are included in other income, net.
Derivative Financial Instruments and Risk Management
The Company operates internationally, giving rise to exposure to market risks from changes in foreign exchange rates. From time to time, derivative financial instruments, primarily foreign exchange contracts, are used by the Company to reduce those risks. The Company does not hold or issue financial or derivative financial instruments for trading or speculative purposes. As of November 30, 2010 and 2009, the Company had foreign currency forward contracts with fair value losses of $16,000 and $16,000, respectively. The Company does not apply hedge accounting for these derivative financial instruments. Net changes in fair values of the underlying instruments are recognized in earnings.
Fair Value of Financial Instruments
The fair value of financial instruments, other than long-term debt or derivatives, approximates the carrying value because of the short-term nature of such instruments.
AMERON INTERNATIONAL CORPORATION AND SUBSIDIARIES
Table of Contents
41

Concentration of Credit Risk
Financial instruments that subject the Company to credit risk consist primarily of cash equivalents, trade accounts receivable, and forward foreign exchange contracts. The Company records an allowance for doubtful accounts based on historical experience and expected trends. Credit risk with respect to trade accounts receivable is generally distributed over a large number of entities comprising the Company's customer base and is geographically dispersed. The Company performs ongoing credit evaluations of its customers, maintains an allowance for doubtful accounts and, in certain limited instances, maintains credit insurance. The Company actively evaluates the creditworthiness of the financial institutions with which it conducts business. If the financial condition of the Company’s customers were to deteriorate, resulting in an inability to make payment, additional allowances may be required.
No customer individually accounted for 10% or more of total consolidated sales in 2010 or 10% or more of gross accounts receivable as of November 30, 2010 and 2009, respectively. In 2009, one customer individually accounted for approximately 12% of the Company’s total consolidated sales.
Other Comprehensive Loss
The components of accumulated other comprehensive loss at November 30, were as follows:
New Accounting Pronouncements
In June 2008, the Financial Accounting Standards Board (“FASB”) issued guidance requiring unvested instruments granted in share-based payment transactions that contain nonforfeitable rights to dividends or dividend equivalents to be accounted for as participating securities subject to the two-class method of computing earnings per share. All earnings per share data for periods prior to adoption are required to be adjusted retrospectively. The Company adopted the guidance as of December 1, 2009, and the adoption did not have a material effect on the Company’s consolidated financial statements. See above for a reconciliation of net income allocated to Common Stock using the two-class method.
In December 2008, the FASB issued revised guidance for employers’ disclosures about postretirement benefit plan assets effective for fiscal years ending after December 15, 2009. The FASB requires an employer to disclose investment policies and strategies, categories, fair value measurements, and significant concentration of risk among its postretirement benefit plan assets. The Company adopted the revised guidance as of November 30, 2010. Adoption did not have a material effect on the Company’s consolidated financial statements.
In June 2009, the FASB issued guidance to revise the approach to determine when a variable interest entity (“VIE”) should be consolidated. The new consolidation model for VIE’s considers whether the Company has the power to direct the activities that most significantly impact the VIE’s economic performance and shares in the significant risks and rewards of the entity. The guidance on VIE’s requires companies to continually reassess VIE’s to determine if consolidation is appropriate and provide additional disclosures. The Company adopted the guidance as of December 1, 2009, and adoption did not have a material effect on the Company’s consolidated financial statements.
AMERON INTERNATIONAL CORPORATION AND SUBSIDIARIES
2010 2009 Tax Tax (In thousands) Before Tax Benefit Net of Tax Before Tax Benefit Net of Tax Foreign currency translation adjustment $ 18,375 $ - $ 18,375 $ 14,825 $ - $ 14,825 Comprehensive loss from TAMCO - - - (4,849) 378 (4,471)Defined benefit pension plans
Net actuarial loss (87,582) 37,008 (50,574) (88,588) 38,116 (50,472)Net prior service cost (1,704) 240 (1,464) (2,143) 225 (1,918)
Accumulated other comprehensive loss $ (70,911) $ 37,248 $ (33,663) $ (80,755) $ 38,719 $ (42,036)
Table of Contents
42

In January 2010, the FASB required new disclosures about fair value of financial instruments for interim and annual reporting periods. These new disclosures were effective for interim and annual reporting periods beginning after December 15, 2009, except for disclosures about purchases, sales, issuances and settlements of Level 3 financial instruments, which are effective for interim and annual reporting periods in fiscal years beginning after December 15, 2010. Adoption is not expected to have a material effect on the Company’s consolidated financial statements.
Supplemental Cash Flow Information
NOTE 2 - DISCONTINUED OPERATIONS
In 2006, the Company completed the sale of its Performance Coatings & Finishes business (the "Coatings Business") to PPG Industries, Inc. ("PPG"). As part of the sale, PPG agreed to pay to the Company future dividends from Oasis-Ameron, Ltd. (“OAL”), a former affiliate of the Company held by the Coatings Business, up to the amount of OAL’s unremitted earnings at the time of the sale of the Coatings Business to PPG. In 2009, the Company recorded $1,232,000, net of tax, from PPG in exchange for any claims on OAL’s dividends. Also in 2009, the Company wrote down by $415,000, net of tax, real property located in Hull, England, formerly used by the Coatings Business and currently held for sale. In 2010, the Company wrote down the property by an additional $1,014,000, net of tax. The real property write downs were due to declining real estate values.
Results of discontinued operations were as follows for the year ended November 30:
NOTE 3 - OTHER INCOME, NET
Other income, net was as follows for the year ended November 30:
AMERON INTERNATIONAL CORPORATION AND SUBSIDIARIES
(In thousands) 2010 2009 2008 Interest paid $ 1,119 $ 1,926 $ 3,256 Income taxes paid, net $ 11,249 10,179 14,862
(In thousands) 2010 2009 2008 Revenue from discontinued operations $ - $ - $ - (Loss)/income from discontinued operations, before income taxes $ (1,014) $ 985 $ - Income taxes on income from discontinued operations - (168) - (Loss)/income from discontinued operations, net of taxes (1,014) 817 -
(In thousands) 2010 2009 2008 Dividends from affiliates-cost method $ 1,899 $ 4,764 $ 4,010 Royalties, fees and other income 747 884 1,361 Gain/(loss) on sale of property, plant and equipment 410 451 (68)Foreign currency loss (519) (1,109) (1,339)Other 1,094 2,458 4,258 $ 3,631 $ 7,448 $ 8,222
Table of Contents
43

NOTE 4 - RECEIVABLES
Receivables were as follows at November 30:
The Company’s provision for bad debts was $1,004,000 in 2010, $1,487,000 in 2009, and $4,419,000 in 2008. Trade receivables included unbilled receivables related to the percentage-of-completion method of revenue recognition of $25,054,000 and $33,705,000 at November 30, 2010 and 2009, respectively.
NOTE 5 – INVENTORIES
Inventories were as follows at November 30:
Certain steel inventories used by the Water Transmission Group are valued using the LIFO method. Inventories valued using the LIFO method comprised 8.7% and 14.8% of consolidated inventories at November 30, 2010 and 2009, respectively. During 2010, the LIFO reserve increased $2,114,000 primarily due to the rise in steel prices subject to valuation using the LIFO method. During 2009, the LIFO reserve decreased $3,984,000 due to lower steel prices, offset by a decrease in steel inventory. If inventories valued using the LIFO method were valued using the FIFO method, total inventories would have increased by $6,036,000 and increased by $3,922,000 at November 30, 2010 and 2009, respectively.
NOTE 6 - AFFILIATES
Investments, advances and equity in undistributed earnings of affiliates were as follows at November 30:
The Company's ownership of affiliates at November 30, 2010 is summarized below:
AMERON INTERNATIONAL CORPORATION AND SUBSIDIARIES
(In thousands) 2010 2009 Trade $ 119,954 $ 121,822 Affiliates 1,231 960 Other 12,518 33,779 Allowances (3,848) (5,351) $ 129,855 $ 151,210
(In thousands) 2010 2009 Finished products $ 35,332 $ 30,100 Materials and supplies 25,053 22,952 Products in process 8,996 9,648 $ 69,381 $ 62,700
(In thousands) 2010 2009 Investment--equity method affiliate $ - $ 30,626 Investments--cost method affiliates 3,784 3,784 $ 3,784 $ 34,410
OwnershipProducts Affiliates InterestFiberglass pipe Bondstrand, Ltd. 40%Concrete pipe Ameron Saudi Arabia, Ltd. 30%
Table of Contents
44

On October 21, 2010 the Company completed the sale of its 50% ownership interest in TAMCO. The Company sold its TAMCO investment and extinguished all outstanding debt owed by TAMCO to the Company under a shareholder loan for gross proceeds of $78,067,000 after estimated working capital adjustments of $697,000 and before closing costs of approximately $2,128,000, recognizing an estimated pretax gain of $48,401,000. Under the terms of the sale, an additional $5,000,000 is to be held in escrow for a period of time to cover potential working capital adjustments and potential indemnification obligations related to the transaction.
Investments in affiliates and the amount of undistributed earnings were as follows:
The Company provides for income taxes on the undistributed earnings of its affiliates to the extent such earnings are included in the consolidated statements of income.
The Company recorded its investment in TAMCO based on audited financial statements as of November 30, 2009 and unaudited financial statements as of October 20, 2010, the date immediately prior to the sale of the Company’s investment in TAMCO. Condensed financial data of TAMCO, an investment which was accounted for under the equity method, were as follows:
Financial condition as of:
The Company’s basis in TAMCO was $32,668,000 at the time of sale, and included accumulated other comprehensive loss, net of tax, of $4,471,000.
AMERON INTERNATIONAL CORPORATION AND SUBSIDIARIES
Fiberglass Concrete (In thousands) Pipe Pipe TAMCO Total Cost $ 3,784 $ - $ - $ 3,784 Investment, November 30, 2010 $ 3,784 $ - $ - $ 3,784 2010 Dividends $ 1,899 $ - $ - $ 1,899 Cost and outstanding loans $ 3,784 $ - $ 33,482 $ 37,266 Accumulated comprehensive loss from affiliate - - (4,849) (4,849)Accumulated equity in undistributed earnings - - 1,993 1,993 Investment, November 30, 2009 $ 3,784 $ - $ 30,626 $ 34,410 2009 Dividends $ 4,764 $ - $ - $ 4,764
October 20, November 30, (In thousands) 2010 2009 Current assets $ 45,856 $ 47,858 Noncurrent assets 48,006 51,010 $ 93,862 $ 98,868 Current liabilities $ 8,923 $ 6,993 Noncurrent liabilities 41,623 45,155 Stockholders' equity 43,316 46,720 $ 93,862 $ 98,868
Table of Contents
45

Results of operations for the periods:
Equity earnings from TAMCO for the periods:
Ameron sales to affiliates totaled $2,328,000 in 2010, $4,459,000 in 2009, and $4,365,000 in 2008.
NOTE 7 - OTHER ASSETS
Other assets were as follows at November 30:
The Company owns life insurance policies on certain current and former executives. The fair value of these policies is equal to the cash surrender value as determined by the insurance companies.
NOTE 8 - ACCRUED LIABILITIES
Accrued liabilities were as follows at November 30:
Deferred revenue is related to unearned billings in the Company’s Fiberglass-Composite Pipe Group and prepayments made by customers to the Company’s Water Transmission Group.
AMERON INTERNATIONAL CORPORATION AND SUBSIDIARIES
December 1, 2009 Year Ended Year Ended to November 30, November 30, (In thousands) October 20, 2010 2009 2008 Net sales $ 99,168 $ 85,740 $ 365,957 Gross profit/(loss) 2,108 (12,740) 49,927 Net (loss)/income (2,615) (11,955) 22,877
December 1, 2009 Year Ended Year Ended to November 30, November 30, (In thousands) October 20, 2010 2009 2008 Equity in (loss)/earnings of TAMCO before income taxes $ (1,308) $ (5,978) $ 11,438 Less provisions for income taxes 102 466 (1,101)Equity in (loss)/earnings of TAMCO, net $ (1,206) $ (5,512) $ 10,337
(In thousands) 2010 2009 Cash surrender value of insurance policies $ 27,541 $ 26,121 Restricted cash 5,000 - Assets held for sale 934 2,051 Other 17,486 18,646 $ 50,961 $ 46,818
(In thousands) 2010 2009 Self insurance reserves $ 24,715 $ 37,393 Compensation and benefits 21,019 20,333 Deferred revenue 4,611 1,960 Product warranties and guarantees 3,214 3,396 Taxes (other than income taxes) 2,867 3,170 Reserves for pending claims and litigation 2,040 2,339 Commissions and royalties 542 2,283 Interest 33 33 Other 5,492 6,608 $ 64,533 $ 77,515
Table of Contents
46
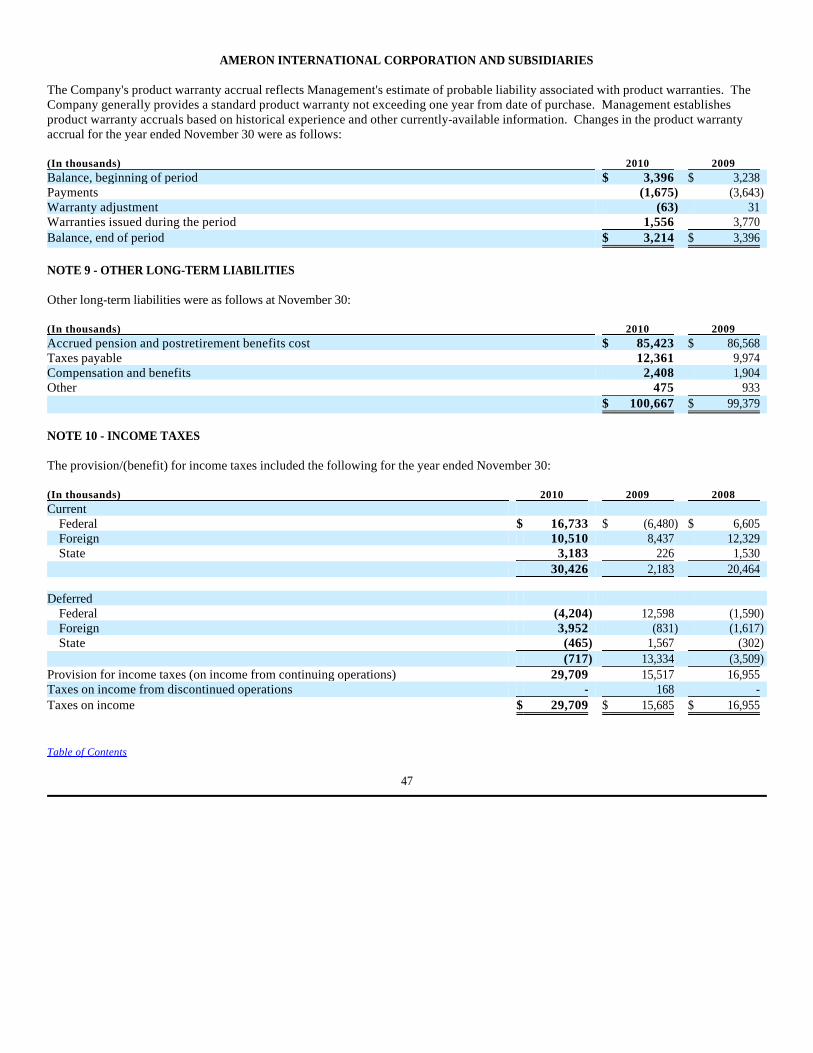
The Company's product warranty accrual reflects Management's estimate of probable liability associated with product warranties. The Company generally provides a standard product warranty not exceeding one year from date of purchase. Management establishes product warranty accruals based on historical experience and other currently-available information. Changes in the product warranty accrual for the year ended November 30 were as follows:
NOTE 9 - OTHER LONG-TERM LIABILITIES
Other long-term liabilities were as follows at November 30:
NOTE 10 - INCOME TAXES
The provision/(benefit) for income taxes included the following for the year ended November 30:
AMERON INTERNATIONAL CORPORATION AND SUBSIDIARIES
(In thousands) 2010 2009 Balance, beginning of period $ 3,396 $ 3,238 Payments (1,675) (3,643)Warranty adjustment (63) 31 Warranties issued during the period 1,556 3,770 Balance, end of period $ 3,214 $ 3,396
(In thousands) 2010 2009 Accrued pension and postretirement benefits cost $ 85,423 $ 86,568 Taxes payable 12,361 9,974 Compensation and benefits 2,408 1,904 Other 475 933 $ 100,667 $ 99,379
(In thousands) 2010 2009 2008 Current
Federal $ 16,733 $ (6,480) $ 6,605 Foreign 10,510 8,437 12,329 State 3,183 226 1,530
30,426 2,183 20,464 Deferred
Federal (4,204) 12,598 (1,590)Foreign 3,952 (831) (1,617)State (465) 1,567 (302)
(717) 13,334 (3,509)Provision for income taxes (on income from continuing operations) 29,709 15,517 16,955 Taxes on income from discontinued operations - 168 - Taxes on income $ 29,709 $ 15,685 $ 16,955
Table of Contents
47

Deferred income tax assets/(liabilities) consisted of the following as of November 30:
As of November 30, 2010, the Company had foreign net operating loss carry-overs of approximately $29,132,000. A full valuation allowance has been provided against these net operating losses except for $9,969,000 of net operating losses generated by the Company’s subsidiary in the Netherlands (these net operating loss carry-overs expire between 2012 and 2019). The Company assessed its ability to realize deferred tax assets (including its net operating losses in the Netherlands) and determined certain deferred tax assets were realizable and others were not realizable. The valuation allowance increased by $3,118,000 in 2010, compared to 2009, primarily due to certain deferred tax assets expiring unused in the Netherlands during their carry-over periods. In 2009, the Company released $1,269,000 of valuation allowance for deferred tax assets related to the Netherlands subsidiary as a result of higher profitability in 2008 and projected future profitability. The Company’s subsidiary in the Netherlands with net operating losses of $9,969,000 is projecting future taxable income and has an ongoing tax planning strategy to prevent a substantial portion of these net operating loss carry-overs from expiring unutilized. The balance of the valuation allowance applies to certain foreign deferred tax assets and certain other deferred tax assets that will likely not result in a tax benefit. The tax effects of the changes to the valuation allowance related to the Company's foreign subsidiaries are included in foreign earnings taxed at different rates in the table below.
The tax provision from continuing operations represents effective tax rates of 38.0%, 29.0% and 26.0% of income from continuing operations before income taxes for the years ended November 30, 2010, 2009 and 2008, respectively. A reconciliation of income taxes provided at the effective income tax rate and the amount computed at the federal statutory income tax rate of 35.0% is as follows for the year ended November 30:
AMERON INTERNATIONAL CORPORATION AND SUBSIDIARIES
(In thousands) 2010 2009 Current deferred income taxes
Self-insurance and claims reserves $ 10,431 $ 11,157 Employee benefits 4,278 3,889 Inventories 3,009 2,335 Accounts receivable 717 801 Valuation allowances (2,916) (2,536)Other 6,922 4,149
Net current deferred income tax assets 22,441 19,795 Noncurrent deferred income taxes
Net operating loss carry-overs 7,960 8,031 Pension benefit costs 26,288 26,782 Investments 3,813 3,752 Employee benefits 2,012 1,788 Valuation allowances (7,261) (4,523)Property, plant and equipment (27,161) (25,368)Other 2,947 2,149
Net noncurrent deferred income tax assets 8,598 12,611 Net deferred income tax assets $ 31,039 $ 32,406
Table of Contents
48

In 2010, the Company recorded a tax benefit of $599,000 associated with a decrease in the valuation allowance for deferred assets related to delayed bonuses and restricted stock and a $361,000 decrease in current taxes payable related to the same issue. These 2010 adjustments represent corrections of amounts recorded in 2009. In 2009, the Company recorded a tax benefit of $1,199,000 (included in foreign earnings taxed at different rates) associated with the adjustment to a deferred tax liability related to earnings and profits from the Company’s New Zealand subsidiary. The $1,199,000 adjustment in 2009 represents a correction of an amount recorded in prior period financial statements. Management believes these corrections to be immaterial to prior interim and annual financial statements.
During the fourth quarter of 2010, the Company implemented a plan to repatriate $44,190,000 of the undistributed earnings of its subsidiary in Singapore due to the realization of previously unrecognized foreign tax credits. The net tax expense in 2010 related to this repatriation was $1,713,000, which is net of a $1,509,000 deferred tax benefit that the Company will realize in connection with its 2011 federal income tax return as a result of the repatriation plan. This net tax expense is included in foreign earnings taxed at different rates in the table above. The Company intends to permanently reinvest the remaining undistributed earnings of its Singapore subsidiary in the Singapore business as well as in future growth in other locations outside the United States. The Company also intends to permanently reinvest its unrepatriated earnings from all other foreign subsidiaries. The cumulative amount of undistributed earnings of foreign subsidiaries was $116,426,000 at November 30, 2010. Because such earnings are expected to be reinvested indefinitely no deferred tax liability has been recognized with regard to the remittance of such earnings. Any additional U.S. income tax on the unremitted foreign earnings, if repatriated, may be offset in whole or in part by foreign tax credits. The 2010 repatriation plan previously mentioned, which was an exception to the Company’s repatriation policy, was implemented at an unusually low tax rate and was intended to take advantage of certain tax laws that may unfavorably change in 2011.
AMERON INTERNATIONAL CORPORATION AND SUBSIDIARIES
(In thousands) 2010 2009 2008 Domestic pretax income $ 30,368 $ 661 $ 9,883 Foreign pretax income 47,815 52,851 55,327 Pretax income from continuing operations 78,183 53,512 65,210 Pretax income from discontinued operations (1,014) 985 - $ 77,169 $ 54,497 $ 65,210 Taxes at federal statutory rate $ 27,364 $ 18,728 $ 22,823 State taxes, net of federal tax benefit 1,767 1,165 798 Foreign earnings taxed at different rates, including withholding taxes 2,137 (6,341) (4,010)Percentage depletion (739) (722) (587)Non-deductible compensation (356) 2,005 2,462 Research and development credits (36) (453) (398)Section 199 deduction - - (521)Settlement of tax examinations - (187) (2,920)Other, net (428) 1,322 (692)Provision for income taxes (on income from continuing operations) 29,709 15,517 16,955 Taxes on income from discontinued operations - 168 - Taxes on income $ 29,709 $ 15,685 $ 16,955
Table of Contents
49

A reconciliation of unrecognized tax benefits follows:
At November 30, 2010, the total amount of gross unrecognized tax benefits, excluding interest, was $11,452,000. This amount is not reduced for offsetting benefits in other tax jurisdictions and for the benefit of future tax deductions that would arise as a result of settling such liabilities as recorded. Of this amount, $5,869,000 would reduce the Company’s income tax expense and effective tax rate, after giving effect to offsetting benefits from other tax jurisdictions and resulting future deductions. At November 30, 2009, the total amount of gross unrecognized tax benefits, excluding interest, was $9,230,000. The Company anticipates that it is reasonably possible that unrecognized tax benefits may change within the succeeding 12 months as a result of the expiration of certain state and foreign statutes of limitations for examination and the settlement of certain state audits. The Company estimates that these events could reasonably result in a possible decrease in unrecognized tax benefits of $917,000.
The Company accrues interest and penalties related to unrecognized tax benefits as income tax expense. Accruals totaling $1,153,000 were recorded as a liability in the Company’s consolidated balance sheet at November 30, 2010, compared to $1,030,000 as of November 30, 2009.
NOTE 11 - DEBT
Short-term borrowings consist of loans payable under bank credit lines. There were no short-term borrowings outstanding at November 30, 2010 and at November 30, 2009.
Domestically, as of November 30, 2010, the Company maintained a $100,000,000 revolving credit facility with six banks (the "Revolver"). At November 30, 2010, $17,212,000 of the Revolver was utilized for standby letters of credit; therefore, $82,788,000 was available. Under the Revolver, the Company may, at its option, borrow at floating interest rates (LIBOR plus a spread ranging from 2.75% to 3.75% based on the Company’s financial condition and performance) or utilize for letters of credit, at any time until August 2012, when all borrowings under the Revolver must be repaid and letters of credit cancelled.
Foreign subsidiaries also maintain unsecured revolving credit facilities and short-term facilities with banks. Foreign subsidiaries may borrow in various currencies, at interest rates based upon specified margins over money market rates. Existing foreign credit facilities permit short-term borrowings up to $12,400,000. At November 30, 2010, there were no borrowings under these facilities.
The Company intends for short-term borrowing, if any, under bank facilities utilized by the Company and its foreign subsidiaries to be refinanced on a long-term basis via the Revolver.
AMERON INTERNATIONAL CORPORATION AND SUBSIDIARIES
(In thousands) 2010 2009 2008 Unrecognized tax benefits at the beginning of the year $ 9,230 $ 7,416 $ 13,102 Increases for positions taken in current year 2,789 1,983 1,157 Increases for positions taken in prior years 173 1,137 658 Decreases for positions taken in prior years (45) (244) (6,557)Decreases for settlements with taxing authorities (50) (502) (145)Decreases for lapses in the applicable statute of limitations (645) (560) (799)Unrecognized tax benefits at the end of the year $ 11,452 $ 9,230 $ 7,416
Table of Contents
50

Long-term debt consisted of the following as of November 30:
Future maturities of long-term debt were as follows as of November 30, 2010 (in thousands):
The Company's lending agreements contain various restrictive covenants, including the requirement to maintain specified amounts of net worth and restrictions on cash dividends, borrowings, liens, investments, capital expenditures, guarantees, and financial covenants. The Company is required to maintain consolidated net worth of $375,500,000 plus 50% of net income and 75% of proceeds from any equity issued after November 30, 2008. The Company's consolidated net worth exceeded the covenant amount by $142,417,000 as of November 30, 2010. The Company is required to maintain a consolidated leverage ratio of consolidated funded indebtedness to earnings before interest, taxes, depreciation and amortization ("EBITDA") of no more than 2.50 times. At November 30, 2010, the Company maintained a consolidated leverage ratio of .58 times EBITDA. Lending agreements require that the Company maintain qualified consolidated tangible assets at least equal to the outstanding secured funded indebtedness. At November 30, 2010, qualifying tangible assets equaled 5.52 times funded indebtedness. Under the most restrictive fixed charge coverage ratio, the sum of EBITDA and rental expense less cash taxes must be at least 1.50 times the sum of interest expense, rental expense, dividends and scheduled funded debt payments. At November 30, 2010, the Company maintained such a fixed charge coverage ratio of 2.04 times. Under the most restrictive provisions of the Company's lending agreements, $8,562,000 of retained earnings was not restricted, at November 30, 2010, as to the declaration of cash dividends or the repurchase of Company stock. In addition, the Company has received consents from its lenders to purchase up to $50.0 million of the Company’s Common Stock. At November 30, 2010, the Company was in compliance with all financial covenants.
The Revolver and the 4.25% term notes are collateralized by substantially all of the Company's assets. The industrial revenue bonds are supported by standby letters of credit that are issued under the Revolver. The interest rate on the industrial development bonds is based on the Securities Industry and Financial Markets Association (“SIFMA”) index plus a spread of approximately .20%. Certain note agreements contain provisions regarding the Company's ability to grant security interests or liens in association with other debt instruments. If the Company grants such a security interest or lien, then such notes will be collateralized equally and ratably as long as such other debt shall be collateralized.
AMERON INTERNATIONAL CORPORATION AND SUBSIDIARIES
(In thousands) 2010 2009 Fixed-rate notes, at 4.25%, payable in Singapore dollars, in annual principal installments of $7,724 $ 15,448 $ 22,098 Variable-rate industrial development bonds:
Payable in 2016 (.49% at November 30, 2010) 7,200 7,200 Payable in 2021 (.49% at November 30, 2010) 8,500 8,500
Variable-rate bank revolving credit facility - 501 31,148 38,299 Less current portion (7,724) (7,366) $ 23,424 $ 30,933
Year ending November 30, Amount 2011 $ 7,724 2012 7,724 2013 - 2014 - 2015 - Thereafter 15,700 $ 31,148
Table of Contents
51

Interest income and expense were as follows for the year ended November 30:
Estimated fair value of the Company's debt is prepared in accordance with the FASB’s fair value disclosure requirements. These requirements establish an enhanced framework for measuring the fair value of financial instruments including a disclosure hierarchy based on the inputs used to measure fair value. The estimated fair value amounts were determined by the Company using available market information and appropriate valuation methodologies. Considerable judgment is required to develop the estimated fair value, thus the estimates provided herein are not necessarily indicative of the amounts that could be realized in a current market exchange.
The Company uses a discounted cash flow technique that incorporates a market interest yield curve with adjustments for duration, optionality and risk profile to determine fair value. The estimated fair value of the Company's fixed-rate, long-term debt is based on U.S. government notes at the respective date, plus an estimated spread for similar securities with similar credit risks and remaining maturities.
NOTE 12 - LEASE COMMITMENTS
The Company leases facilities and equipment under non-cancelable operating leases. Rental expense under long-term operating leases of real property, vehicles and other equipment was $5,176,000 in 2010, $4,752,000 in 2009, and $4,633,000 in 2008. Future rental commitments were as follows as of November 30, 2010 (in thousands):
Future rental commitments for leases are not reduced by minimum non-cancelable sublease rentals, which aggregated $1,188,000 at November 30, 2010.
AMERON INTERNATIONAL CORPORATION AND SUBSIDIARIES
(In thousands) 2010 2009 2008 Interest income $ 917 $ 1,130 $ 3,871 Interest expense (939) (542) (2,338)Interest income, net $ (22) $ 588 $ 1,533
Carrying Fair (In thousands) Amount Value November 30, 2010 Fixed-rate, long-term debt $ 15,448 $ 16,445 Variable-rate, long-term debt 15,700 15,700 November 30, 2009 Fixed-rate, long-term debt 22,098 22,741 Variable-rate, long-term debt 16,201 16,201
Year ending November 30, Amount 2011 $ 4,888 2012 2,867 2013 1,377 2014 1,261 2015 1,288 Thereafter 21,783 $ 33,464
Table of Contents
52

NOTE 13 - INCENTIVE STOCK COMPENSATION PLANS
As of November 30, 2010, the Company had outstanding grants under the following share-based compensation plans:
· 2001 Stock Incentive Plan ("2001 Plan") - The 2001 Plan was terminated in 2004, except as to the outstanding stock options and restricted stock grants. Prior to termination, a total of 380,000 new shares of Common Stock were made available for awards to key employees and non-employee directors. Non-employee directors were granted options under the 2001 Plan to purchase the Company's Common Stock at prices not less than 100% of market value on the date of grant. Such options vested in equal annual installments over four years. Such options terminate ten years from the date of grant. At November 30, 2010, there were 6,000 shares subject to such stock options.
· 2004 Stock Incentive Plan ("2004 Plan") - The 2004 Plan serves as the successor to the 2001 Plan and supersedes that plan. A total of 525,000 new shares of Common Stock were made available for awards to key employees and non-employee directors and may include, but are not limited to, stock options and restricted stock grants. Non-employee directors were granted options under the 2004 Plan to purchase the Company's Common Stock at prices not less than 100% of market value on the date of grant. Such options vest in equal annual installments over four years and terminate ten years from the date of grant. At November 30, 2010, there were 15,052 shares subject to such stock options. Key employees and non-employee directors were granted restricted stock under the 2004 Plan. Such restricted stock typically vests in equal annual installments over three years. During 2010, the Company granted 11,500 restricted shares to key employees with a fair value on the grant date of $781,000 and 10,800 restricted shares to non-employee directors with a fair value on the grant date of $684,000. During 2009, the Company granted 16,200 restricted shares to key employees with a fair value on the grant date of $806,000 and 12,000 restricted shares to non-employee directors with a fair value on the grant date of $575,000. In 2007, the Company agreed to provide to a key employee 18,000 shares of Common Stock to be granted and fully vested each February of 2008, 2009 and 2010. The fair value of those 54,000 shares on the date promised was $5,395,000. Additionally in 2007, the key employee received a grant of performance stock units, pursuant to which from 8,000 to 24,000 shares of the Company’s Common Stock could potentially be issued depending on the price of the Common Stock on the date the award vests, no later than November 30, 2010. In April 2010, the key employee was issued 8,000 shares in connection with the performance stock units. A lattice model was used with volatility rate of 38% and risk free rate of 4.04% in determining the fair value of the performance stock units. The volatility rate was calculated based on historical trading data with the anticipated life of 2.5 years. The risk-free rate was based on the contemporary yield curve between the two and three year rate. The fair value of the performance stock units on the grant date was $2,055,000, which was recognized ratably as stock compensation expense through March 31, 2010. In addition to the above, in 2001, non-employee directors were granted options to purchase the Company's Common Stock at prices not less than 100% of market value on the date of grant. Such options vested in equal annual installments over four years and terminate ten years from the date of grant. At November 30, 2010, there were 2,000 shares subject to such stock options.
The Company's income before income taxes and equity in loss of affiliate for the year ended November 30, 2010 included compensation expense of $2,005,000, related to stock-based compensation arrangements, compared to $3,936,000 in 2009 and $6,113,000 in 2008. Tax benefit related to this expense was $782,000 in 2010, compared to $1,535,000 in 2009 and $2,384,000 in 2008. There were no capitalized share-based compensation costs for the three years ended November 30, 2010.
Tax benefits and excess tax benefits resulting from the exercise of stock options are reflected as financing cash flows in the Company’s statements of cash flows. The Company recognized a tax deficiency of $693,000 for the year ended November 30, 2010 and excess tax benefits totaled $831,000 and $1,330,000 in 2009 and 2008, respectively.
AMERON INTERNATIONAL CORPORATION AND SUBSIDIARIES
Table of Contents
53

The following table summarizes the stock option activity for the year ended November 30, 2010:
Current Year Stock-Based Compensation
In 2010 and 2009, no options were granted, forfeited, or expired. For the year ended November 30, 2010, 13,250 options were exercised. The aggregate intrinsic value in the table above represents the total pretax intrinsic value, which is the difference between the closing price of the Company’s Common Stock on the last trading day of 2010 and the exercise price times the number of shares that would have been received by the option holders if they exercised their options on November 30, 2010. This amount will change based on the fair market value of the Company's Common Stock. The aggregate intrinsic value of stock options exercised in 2010 was $500,000, and $2,414,000 in 2008. No stock options were exercised in 2009.
As of November 30, 2010, there was $1,007,000 of total unrecognized compensation cost related to stock-based compensation arrangements. That cost is expected to be recognized over a weighted-average period of three years.
In 2010, 2009, and 2008, respectively, 22,300, 28,200, and 26,200 shares of restricted stock were granted. The weighted-average, grant-date fair value per share of such stock was $65.67, $48.98, and $101.18, respectively. The fair value of restricted stock which vested and stock promised in 2007 which was granted in 2010, 2009, and 2008 was $3,381,000, $2,678,000, and $5,844,000, respectively. In 2010, 2009 and 2008, 6,000, 5,655 and 1,667 shares of restricted stock were forfeited, with a fair value of $286,000, $432,000 and $91,000, respectively.
Net cash proceeds from stock options exercised were $372,000 in 2010 and $420,000 in 2008. No stock options were exercised in 2009. The Company's policy is to issue shares from its authorized shares upon the exercise of stock options.
NOTE 14 - GOODWILL
During 2010, the Company completed the required goodwill impairment test. No impairment losses were identified as a result of these tests. Changes in the Company’s carrying amount of goodwill by business segment were as follows:
AMERON INTERNATIONAL CORPORATION AND SUBSIDIARIES
Weighted- Weighted- Average Average Remaining Aggregate Number of Exercise Price Contractual Intrinsic Value Options Options per Share Term (Years) (in thousands) Outstanding at November 30, 2009 36,302 $ 37.61
Granted - - Exercised (13,250) 28.11
Outstanding at November 30, 2010 23,052 43.07 3.58 $ 755 Options exercisable at November 30, 2010 21,151 37.84 3.25 $ 755
Foreign Foreign Currency Currency November 30, Translation November 30, Translation November 30, (In thousands) 2008 Adjustments 2009 Adjustments 2010 Fiberglass-Composite Pipe $ 1,440 $ - $ 1,440 $ - $ 1,440 Water Transmission 360 6 366 5 371 Infrastructure Products 201 - 201 - 201 $ 2,001 $ 6 $ 2,007 $ 5 $ 2,012
Table of Contents
54

NOTE 15 - COMMITMENTS AND CONTINGENCIES
In 2004, Sable Offshore Energy Inc. ("Sable"), as agent for certain owners of the Sable Offshore Energy Project, brought an action against various coatings suppliers and application contractors, including the Company and its subsidiary, Ameron B.V., in the Supreme Court of Nova Scotia, Canada. Sable seeks damages allegedly sustained by it resulting from performance problems with several coating systems used on the Sable Offshore Energy Project, including coatings products furnished by the Company and Ameron B.V. All of the co-defendants, other than the Company, Ameron B.V. and an unaffiliated licensee of the Company, have since settled. Sable's originating notice and statement of claim alleged a claim for damages in an unspecified amount. Sable later alleged that its claim for damages against all defendants was approximately 440,000,000 Canadian dollars. More recently, however, Sable sent the Company a revised claim which included an alternative method for calculating damages. Although Sable did not specify an aggregate claim amount under its alternative method, that method if adopted would appear to substantially reduce the amount of damages. The Company contests any claim amount and is vigorously defending itself on the merits in this action. This matter is in discovery, and no trial date has yet been established. Based upon the information available at this time, the Company is not able to estimate the possible range of loss with respect to this case.
In 2004, BP America Production Company (“BP America”) brought an action against the Company in the 24th Judicial District Court, Parish of Jefferson, Louisiana in connection with fiberglass pipe sold by the Company for installation in four offshore platforms constructed for BP America. The plaintiff seeks damages allegedly sustained by it resulting from claimed defects in such pipe. BP America’s petition as filed alleged a claim against the Company for rescission, products liability, negligence, breach of contract and warranty and for damages in an amount of not less than $20,000,000; but BP America has since reduced its claim to $12,900,000. The Company contests this amount. This matter is in discovery, and no trial date has yet been established. The Company intends to vigorously defend itself in this action. Based upon the information available to it at this time, the Company is not able to estimate the possible range of loss with respect to this case.
In 2006, the Cawelo, California Water District (“Cawelo”) brought an action against the Company in the Superior Court, Kern County, California in connection with concrete pipe sold by the Company in 1995 for a wastewater recovery pipeline. Cawelo seeks damages allegedly sustained by it resulting from the failure of such pipe in 2004. Cawelo’s petition as filed alleged a claim against the Company for products liability, negligence, breach of express warranty and breach of written contract and for damages in an amount of not less than $8,000,000, an amount which the Company contested. On December 3, 2010, the Company settled this case subject to court approval for a net payment of $100,000 by the Company. On December 27, 2010, the Court issued an order finding the settlement by the Company to be in good faith and dismissing a cross-complaint against the Company by a surety of a non-settling defendant. The order remains subject to possible appeal. The terms of the settlement will not have a material effect on the Company’s financial condition or results of operations.
In August 2010, Petroleum Polymer Company LLC ("PPC") brought an action against Ameron (Pte) Ltd. ("Ameron Pte"), an indirect subsidiary of the Company, in the Primary Court of Oman. The complaint alleged that Ameron Pte breached the terms of a purchase agreement for its supply of fiberglass pipe to PPC for use in an oil extraction project in Oman. PPC's primary allegation is that a component supplied by Ameron Pte failed during testing, resulting in a failure of the pipe system. PPC asserted damages totaling approximately $20,000,000, including alleged claims for the cost of replacing damaged pipe, recovery of penalties incurred due to the resulting delay in the project, and lost future opportunities. Ameron Pte contests any claim amount and intends to vigorously defend itself in this action. Based upon the information available to it at this time, the Company is able to neither estimate the possible range of loss with respect to this case nor the timing of substantive judicial proceedings.
The Company is a defendant in a number of asbestos-related personal injury lawsuits. These cases generally seek unspecified damages for asbestos-related diseases based on alleged exposure to products previously manufactured by the Company and others. As of November 30, 2010, the Company was a defendant in 14 asbestos-related cases, compared to 20 cases as of November 30, 2009. During the year ended November 30, 2010, there were ten new asbestos-related cases, 11 dismissed cases, five settled cases and no judgments. The Company incurred net expenses of $98,000, $272,000 and $234,000, and recovered $28,000, $138,000 and $151,000, during the years ended November 30, 2010, 2009 and 2008, respectively. Based upon the information available to it at this time, the Company is not able to estimate the possible range of loss with respect to these cases.
AMERON INTERNATIONAL CORPORATION AND SUBSIDIARIES
Table of Contents
55

In December 2008, the Company received from the U.S. Treasury Department’s Office of Foreign Assets Control (“OFAC”) a Requirement to Furnish Information regarding transactions involving Iran. With the assistance of outside counsel, the Company conducted an internal inquiry and continues to cooperate fully with OFAC on this matter. Based upon the information available to it at this time, the Company is not able to predict the outcome of this matter. If the Company violated governmental regulations, material fines and penalties could be imposed.
The Company is subject to federal, state and local laws and regulations concerning the environment and is currently participating in administrative proceedings at several sites under these laws. While the Company finds it difficult to estimate with any certainty the total cost of remediation at the several sites, on the basis of currently available information and reserves provided, the Company believes that the outcome of such environmental regulatory proceedings will not have a material effect on the Company's financial position, cash flows, or results of operations. In addition, certain other claims, suits and complaints that arise in the ordinary course of business have been filed or are pending against the Company. Management believes that these matters are either adequately reserved, covered by insurance, or would not have a material effect on the Company's financial position, cash flows or results of operations if disposed of unfavorably.
NOTE 16 - EMPLOYEE BENEFIT PLANS
The Company has a qualified, defined benefit, noncontributory pension plan for certain U.S. employees. The Company’s subsidiary in the Netherlands provides defined retirement benefits to eligible employees. The Company also provides health and life insurance to a limited number of eligible retirees and eligible survivors of retirees.
The Company’s defined benefit pension and other postretirement benefit costs and obligations are dependent on assumptions used by actuaries in calculating such amounts. These assumptions, which are reviewed annually, include discount rates, long-term expected rates of return on plan assets and expected rates of increase in compensation and health care costs. Assumed discount rates, based on market interest rates on long-term fixed income debt securities of highly-rated corporations, are used to calculate the present value of benefit payments which are projected to be made in the future, including projections of increases in employees’ annual compensation and health care costs. A decrease in the discount rate would increase the Company’s obligation and expense. The long-term expected rate of return on plan assets is based principally on prior performance and future expectations for various types of investments as well as the expected long-term allocation of assets. Changes in the allocation of plan assets would impact the expected rate of return. The expected rate of increase in compensation is based upon movements in inflation rates as reflected by market interest rates. Benefits paid to participants are based upon age, years of credited service and average compensation or negotiated benefit rates.
Assets of the Company’s U.S. defined benefit plan are invested in a directed trust. Assets in the trust are invested in domestic and foreign equity securities of corporations (including $5,664,000 of the Company’s Common Stock at November 30, 2010), U.S. government obligations, derivative securities, corporate bonds and money market funds. The subsidiary in the Netherlands contracts with third-party insurance companies to pay benefits to retirees.
AMERON INTERNATIONAL CORPORATION AND SUBSIDIARIES
Table of Contents
56

PENSION BENEFITS
The following sets forth the change in benefit obligation, change in plan assets, funded status and amounts recognized in the balance sheets as of November 30, 2010 and 2009 for the Company's U.S. and non-U.S. defined benefit retirement plans:
In 2009, the Company changed the U.S. defined benefit plan measurement date from October 1 to November 30 to match its fiscal year-end. The changes shown above for 2009 include 14 months, while the changes for 2010 include 12 months.
AMERON INTERNATIONAL CORPORATION AND SUBSIDIARIES
U.S. Pension Benefits Non-U.S. Pension Benefits (In thousands) 2010 2009 2010 2009
Change in Benefit Obligation Projected benefit obligation-beginning of year $ 210,862 $ 175,373 $ 48,831 $ 34,111 Service cost 3,630 3,439 376 342 Interest cost 11,630 14,706 2,257 2,335 Participant contributions - - 186 188 Curtailments (512) - - - Actuarial loss/(gain) 8,027 31,393 4,185 6,590 Foreign currency exchange rate changes - - (6,153) 6,430 Benefit payments (12,670) (14,049) (1,519) (1,165)Projected benefit obligation-end of year $ 220,967 $ 210,862 $ 48,163 $ 48,831 Accumulated Benefit Obligation $ 213,240 $ 202,227 $ 45,811 $ 46,545 Change in Plan Assets Plan assets at fair value-beginning of year $ 134,168 $ 140,447 $ 42,356 $ 32,554 Actual return on plan assets 13,089 (766) 3,149 3,181 Foreign currency exchange rate changes - - (5,261) 5,860 Employer contributions 12,032 8,536 2,248 1,738 Participant contributions - - 186 188 Benefit payments (12,670) (14,049) (1,519) (1,165)Plan assets at fair value-end of year $ 146,619 $ 134,168 $ 41,159 $ 42,356 Funded Status $ (74,348) $ (76,694) $ (7,004) $ (6,475) Balance Sheet Amounts Noncurrent assets $ - $ - $ - $ - Current liabilities (23) (30) - - Noncurrent liabilities (74,325) (76,664) (7,004) (6,475)Net amount recognized $ (74,348) $ (76,694) $ (7,004) $ (6,475)
Table of Contents
57

The pretax amounts recognized in accumulated other comprehensive loss/(gain) included the following as of November 30, 2010:
The pretax amounts recognized in accumulated other comprehensive loss/(gain) included the following as of November 30, 2009:
The Company’s estimate of 2011 amortization of amounts included in accumulated other comprehensive loss was as follows at November 30, 2010:
The Company contributed $12,032,000 to the U.S. pension plan and $2,248,000 to the non-U.S. pension plans in 2010. The Company expects to contribute approximately $11,400,000 to its U.S. pension plan and $1,400,000 to the non-U.S. pension plans in 2011.
Expected future pension benefit payments, which reflect expected future service, were as follows as of November 30, 2010, in thousands:
AMERON INTERNATIONAL CORPORATION AND SUBSIDIARIES
Pension Benefits U.S.
Postretirement (In thousands) U.S. Non-U.S. Benefits Net actuarial loss/(gain) $ 88,886 $ (1,991) $ 687 Prior service cost 153 1,089 462 Net amount recognized $ 89,039 $ (902) $ 1,149
Pension Benefits U.S.
Postretirement (In thousands) U.S. Non-U.S. Benefits Net actuarial loss/(gain) $ 93,825 $ (5,446) $ 209 Prior service cost 207 1,564 372 Net amount recognized $ 94,032 $ (3,882) $ 581
Pension Benefits U.S.
Postretirement (In thousands) U.S. Non-U.S. Benefits Net actuarial loss $ 9,978 $ 14 $ 22 Prior service cost 43 270 36 Net transition asset - - 46 Net amount recognized $ 10,021 $ 284 $ 104
U.S. Pension Non-U.S. Pension
Year ending November 30, Benefits Benefits 2011 $ 13,089 $ 1,411 2012 13,560 1,525 2013 13,855 1,677 2014 14,220 1,811 2015 14,466 1,888 2016 - 2020 74,861 11,254
Table of Contents
58

Net periodic benefit costs for the Company's defined benefit retirement plans for 2010, 2009 and 2008 included the following components:
The above table includes net periodic cost for 12 months for all periods. Additionally in 2009, the Company recorded to retained earnings two months of net periodic cost of $1,631,000 ($993,000 net of tax) relating to the change in measurement date for the Company’s U.S. defined benefit plan.
The following table provides the weighted-average assumptions used to compute the actuarial present value of projected benefit obligations:
The following table provides the weighted-average assumptions used to compute the actuarial net periodic benefit cost:
The respective discount rates were determined by projecting the plan’s expected future benefit payments as defined for the projected benefit obligation, discounting those expected payments using a theoretical zero-coupon spot yield curve derived from high-quality corporate bonds currently available as of the plan measurement date, and solving for the single equivalent discount rate that resulted in the same projected benefit obligation.
AMERON INTERNATIONAL CORPORATION AND SUBSIDIARIES
U.S. Pension Benefits Non-U.S. Pension Benefits (In thousands) 2010 2009 2008 2010 2009 2008
Service cost $ 3,630 $ 3,439 $ 2,974 $ 376 $ 342 $ 439 Interest cost 11,630 14,706 11,553 2,257 2,335 2,541 Expected return on plan assets (11,377) (13,768) (15,713) (1,593) (1,571) (1,692)Amortization of unrecognized prior service cost 52 81 117 277 286 306 Curtailment 3 - - - - - Amortization of accumulated loss/(gain) 10,741 7,010 1,134 (141) (439) - Net periodic cost adjustment to retained earnings, pre-tax - (1,631) - - - - Net periodic cost $ 14,679 $ 9,837 $ 65 $ 1,176 $ 953 $ 1,594
U.S. Pension Benefits Non-U.S. Pension Benefits 2010 2009 2008 2010 2009 2008
Weighted-average discount rate 5.30% 5.70% 7.29% 4.75% 5.20% 6.70%Rate of increase in compensation levels 3.00% 3.50% 4.25% 2.25% 2.25% 2.25%
U.S. Pension Benefits Non-U.S. Pension Benefits 2010 2009 2008 2010 2009 2008
Weighted-average discount rate 5.70% 7.29% 6.15% 5.20% 6.70% 5.60%Expected long-term rate of return on plan assets 8.50% 8.50% 8.75% 4.10% 4.90% 4.80%Rate of increase in compensation levels 3.50% 4.25% 3.65% 2.25% 2.25% 2.00%
Table of Contents
59

The respective expected long-term rates of return on plan assets were determined based on historical and expected future returns of the various asset classes in which the Company expected the pension funds to be invested. The expected returns by asset class were as follows, as of November 30, 2010:
The Company’s investment policy includes a mandate to diversify assets by investing in a variety of asset classes. At November 30, 2010, the plan’s assets were invested in a variety of funds representing standard equity and debt security classes. No significant changes in the asset allocations are expected during the upcoming year.
The following table shows the Company's target allocation for the U.S. defined benefit pension plan, along with the actual allocations for the U.S. and non-U.S. plans, as of November 30:
Approximately 9% of the Company’s employees are covered by union-sponsored, collectively-bargained, multi-employer pension plans. Related to these plans, the Company contributed and charged to expense $1,500,000, $800,000, and $1,300,000 in 2010, 2009, and 2008, respectively. These contributions are determined in accordance with the provisions of negotiated labor contracts and generally are based on the number of hours worked. The Company has no intention of withdrawing from any of these plans, nor is there any intention to terminate such plans.
The Company provides to certain employees a savings plan under Section 401(k) of the U.S. Internal Revenue Code. The savings plan allows for deferral of income through contributions to the plan, with certain restrictions. Company matching contributions are in the form of cash. In 2010, 2009, and 2008, the Company recorded expense for matching contributions of $517,000, $488,000, and $296,000, respectively.
POSTRETIREMENT BENEFITS
The following sets forth the change in benefit obligation, change in plan assets, funded status and amounts recognized in the balance sheets as of November 30, 2010 and 2009 for the Company's U.S. postretirement health care and life insurance benefits.
AMERON INTERNATIONAL CORPORATION AND SUBSIDIARIES
U.S.
Pension Non-U.S. Pension
Benefits Benefits Equity securities 10% 7%Debt securities 5% 4%Real estate - 7%Other - 3%
U.S. Pension Benefits Non-U.S. Pension Benefits Target 2010 2009 2010 2009 Domestic equities 65% 61% 61% 7% 8% International equities 10% 10% 11% 9% 10% Fixed-income securities 25% 29% 28% 84% 82%Total 100% 100% 100% 100% 100%
Table of Contents
60
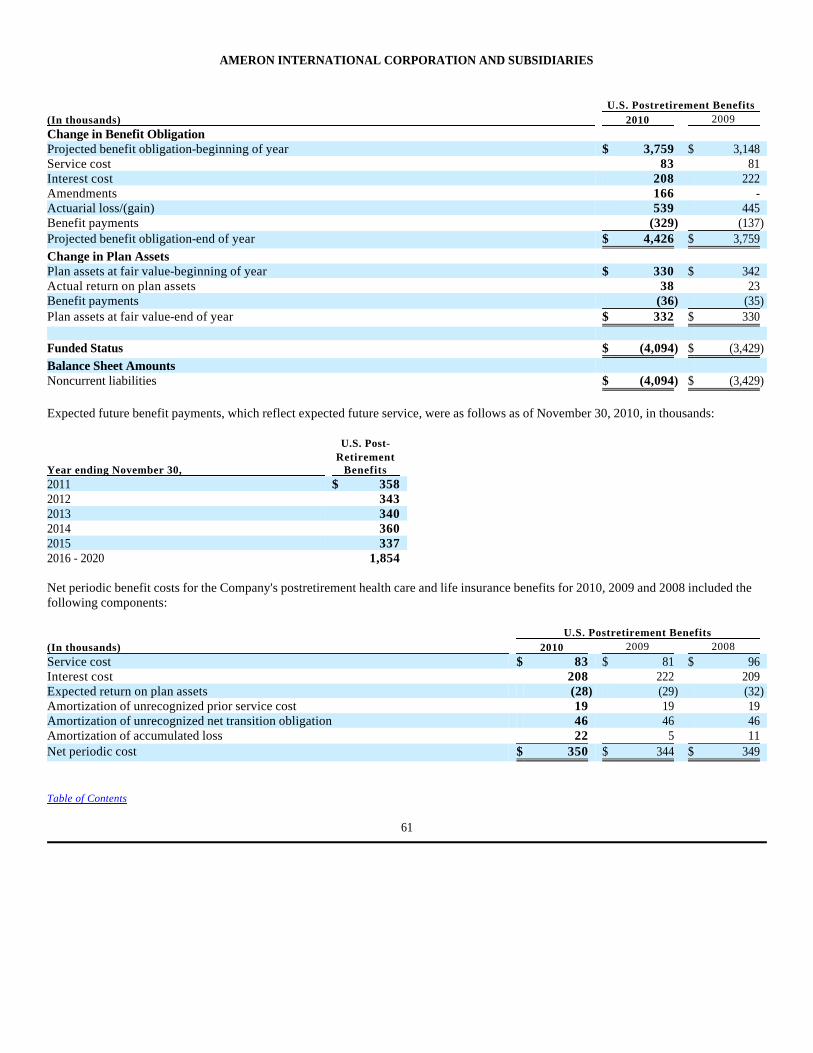
Expected future benefit payments, which reflect expected future service, were as follows as of November 30, 2010, in thousands:
Net periodic benefit costs for the Company's postretirement health care and life insurance benefits for 2010, 2009 and 2008 included the following components:
AMERON INTERNATIONAL CORPORATION AND SUBSIDIARIES
U.S. Postretirement Benefits (In thousands) 2010 2009
Change in Benefit Obligation Projected benefit obligation-beginning of year $ 3,759 $ 3,148 Service cost 83 81 Interest cost 208 222 Amendments 166 - Actuarial loss/(gain) 539 445 Benefit payments (329) (137)Projected benefit obligation-end of year $ 4,426 $ 3,759 Change in Plan Assets Plan assets at fair value-beginning of year $ 330 $ 342 Actual return on plan assets 38 23 Benefit payments (36) (35)Plan assets at fair value-end of year $ 332 $ 330 Funded Status $ (4,094) $ (3,429)Balance Sheet Amounts Noncurrent liabilities $ (4,094) $ (3,429)
U.S. Post- Retirement Year ending November 30, Benefits 2011 $ 358 2012 343 2013 340 2014 360 2015 337 2016 - 2020 1,854
U.S. Postretirement Benefits (In thousands) 2010 2009 2008
Service cost $ 83 $ 81 $ 96 Interest cost 208 222 209 Expected return on plan assets (28) (29) (32)Amortization of unrecognized prior service cost 19 19 19 Amortization of unrecognized net transition obligation 46 46 46 Amortization of accumulated loss 22 5 11 Net periodic cost $ 350 $ 344 $ 349
Table of Contents
61

The following table provides the weighted-average assumptions used to compute the actuarial present value of projected benefit obligations:
The following table provides the weighted-average assumptions used to compute the actuarial net periodic benefit cost:
The assumed health care cost trend increased to 10% in 2010, and the rate is assumed to decline gradually to 5% by 2015 and beyond. The effect of a one-percentage-point change in the assumed health care cost trend would have changed the amounts of the benefit obligation and the sum of the service cost and interest cost components of postretirement benefit expense for 2010, as follows:
The Company provides life insurance to eligible executives with life insurance protection equal to three times base salary. Upon retirement, the executive is provided with life insurance protection equal to final base salary. There were no expenses related to this plan in 2010, 2009 or 2008.
The Company has severance agreements with certain key employees that could provide benefits upon termination of up to three times total annual compensation of such employees, plus a pro rata portion of their current year’s annual bonus.
INVESTMENTS
All investments are stated at fair value or amounts that closely approximate fair value. Fair value is the price that would be received to sell an asset or paid to transfer a liability in an orderly transaction between market participants at the measurement date (exit price).
The Company utilizes market data or assumptions that the Company believes market participants would use in pricing the asset or liability, including assumptions about risk and the risks inherent in the inputs to the valuation technique. These inputs can be readily observable, market corroborated or generally unobservable.
The Company primarily applies the income and market approach for recurring fair value measurements and endeavors to utilize the best available information. Accordingly, the Company utilizes valuation techniques that maximize the use of observable inputs and minimize the use of unobservable inputs. The Company is able to classify fair value balances based on the observability of those inputs.
A fair value hierarchy prioritizes the inputs used to measure fair value. The hierarchy gives the highest priority to unadjusted quoted prices in active markets for identical assets or liabilities (Level 1 measurement) and the lowest priority to unobservable inputs (Level 3 measurement). Level 2 measurements utilize observable inputs in markets other than active markets.
AMERON INTERNATIONAL CORPORATION AND SUBSIDIARIES
U.S. Postretirement Benefits 2010 2009 2008
Weighted-average discount rate 5.30% 5.70% 7.29%Rate of increase in compensation levels 3.00% 3.50% 4.25%
U.S. Postretirement Benefits 2010 2009 2008
Weighted-average discount rate 5.70% 7.29% 6.15%Rate of increase in compensation levels 3.50% 4.25% 3.65%
1% 1% (In thousands) Increase Decrease Effect on total of service and interest cost components of net periodic expense $ 17 $ (14)Effect on postretirement benefit obligation 150 (133)
Table of Contents
62

Following is a description of the valuation methodologies used for pension assets measured at fair value. There have been no changes in the methodologies used at November 30, 2010 and 2009.
Common stocks: Valued at the closing price reported on the active market on which the individual securities are traded.
Mutual funds: Valued at the net asset value (“NAV”) of shares held by the plan at the valuation date.
Common/collective trusts: Valued by the sponsor of the trust based on aggregate value of all assets in the collective trust at the valuation date. Unit value of a fund is determined by dividing net assets at fair value by the fund’s units outstanding at the valuation date.
Insurance contracts: Insurance contracts primarily include the contracts used by the non-U.S. plan and other postretirement benefit plan to pay benefits. These contracts are valued by the counterparty insurance companies. Insurance contracts also consist of one participating insurance contract held in the U.S. plan that is valued by discounting the related cash flows (i.e., expected dividends) as determined by the plan’s actuary. The plan has no future liability related to the contract, and the total value of the contract in excess of the value of the expected dividends is excluded from the plan’s assets.
The preceding methods described may produce fair values that may not be indicative of net realizable values or reflective of future fair value. Furthermore, although the Company believes the valuation methods used by the plan’s trustees are appropriate and consistent with other market participants, the use of different methodologies or assumptions to determine the fair value of certain financial instruments could result in a different fair value measurement at the valuation date.
The following table presents by level, within the fair value hierarchy, the Company’s pension and postretirement benefit plan assets at fair value as of November 30, 2010:
The following table presents by level, within the fair value hierarchy, the Company’s plan assets at fair value as of November 30, 2009:
AMERON INTERNATIONAL CORPORATION AND SUBSIDIARIES
(In thousands) Level 1 Level 2 Level 3 Total Mutual funds:
Equity funds $ 20,007 $ - $ - $ 20,007 Bond funds 18,847 - - 18,847
Total mutual funds $ 38,854 $ - $ - $ 38,854 Common/collective trusts - 101,487 - 101,487 Common stocks (Ameron) 5,664 - - 5,664 Insurance contracts - - 42,105 42,105 Plan assets at fair value $ 44,518 $ 101,487 $ 42,105 $ 188,110
(In thousands) Level 1 Level 2 Level 3 Total Mutual funds:
Equity funds $ 18,591 $ - $ - $ 18,591 Bond funds 16,628 - - 16,628
Total mutual funds $ 35,219 $ - $ - $ 35,219 Common/collective trusts - 93,778 - 93,778 Common stocks (Ameron) 4,557 - - 4,557 Insurance contracts - - 43,300 43,300 Plan assets at fair value $ 39,776 $ 93,778 $ 43,300 $ 176,854
Table of Contents
63

The following table sets forth a summary of changes in the fair value of the Company’s Level 3 assets for the year ended November 30, 2010:
NOTE 17 - CAPITAL STOCK
The Company is incorporated in Delaware. The articles of incorporation authorize 24,000,000 shares of $2.50 par value Common Stock, 1,000,000 shares of $1.00 par value preferred stock and 100,000 shares of $1.00 par value series A junior participating cumulative preferred stock. The preferred stock may be issued in series, with the rights and preferences of each series to be established by the Board of Directors. As of November 30, 2010, no shares of preferred stock or series A junior participating cumulative preferred stock were outstanding.
As of November 30, 2010, 9,249,105 shares of Common Stock were issued and outstanding, including 43,682 restricted shares. Restrictions limit the sale and transfer of these shares. As of November 30, 2009, 9,209,836 shares were issued, including 53,881 restricted shares. On each anniversary of the grant date, a percentage of the shares (determined at the time of the grant) become unrestricted. The restrictions are scheduled to lapse as follows: 21,421 shares will become unrestricted in 2011, 14,831 shares in 2012 and 7,430 shares in 2013.
NOTE 18 - SEGMENT INFORMATION
The Company has determined it has four operating and three reportable segments: Fiberglass-Composite Pipe, Water Transmission and Infrastructure Products. The Fiberglass-Composite Pipe Group manufactures and markets filament-wound and molded composite fiberglass pipe, tubing, fittings and well screens. The Water Transmission Group manufactures and supplies concrete and steel pressure pipe, concrete non-pressure pipe, protective linings for pipe, and fabricated products including wind towers. The Infrastructure Products Group consists of two operating segments, the Pole Products and Hawaii Divisions, and manufactures and sells ready-mix concrete, sand and aggregates, concrete pipe and culverts, and concrete and steel lighting and traffic poles. In the prior periods, the Company included a fourth reportable segment, Performance Coatings & Finishes, which was sold August 1, 2006. The results from this segment are reported as discontinued operations for all reporting periods. Each of these segments has a dedicated management team and is managed separately, primarily because of differences in products. TAMCO, the Company's equity method investment which was sold in October of 2010, is not included in any of these segments. The Company’s Chief Operating Decision Maker is the Chief Executive Officer who primarily reviews sales and income before interest, income taxes and equity in earnings of affiliate for each operating segment in making decisions about allocating resources and assessing performance. The Company allocates certain selling, general and administrative expenses to operating segments utilizing assumptions believed to be appropriate in the circumstances. Costs of shared services (e.g., costs of Company-wide insurance programs or benefit plans) are allocated to the operating segments based on revenue, wages or net assets employed. Other items not related to current operations or of an unusual nature, such as adjustments to reflect inventory balances of certain steel inventories under the LIFO method, certain unusual legal costs and expenses, interest expense and income taxes, are not allocated to the reportable segments.
The markets served by the Fiberglass-Composite Pipe Group are worldwide in scope. The Water Transmission Group serves primarily the western U.S. The Infrastructure Products Group's quarry and ready-mix business operates exclusively in Hawaii, and poles are sold throughout the U.S. Sales to any individual customer did not exceed 10% of consolidated sales in 2010 or in 2008. In 2009, Siemens Power Generation, Inc. purchased $66,400,000 of wind towers from the Company, which was approximately 12% of the Company’s total consolidated sales and almost all of the Company’s wind tower sales.
AMERON INTERNATIONAL CORPORATION AND SUBSIDIARIES
(In thousands)
Balance, November 30, 2009 $ 43,300 Actual return on plan assets 3,188 Unrealized gains/(loss), net (4,445)Exchange rate 62
Balance, November 30, 2010 $ 42,105
Table of Contents
64

The following table presents information related to each operating segment included in, and in a manner consistent with, internal management reports. Inter-segment sales were not significant. Total assets by segment are those assets that are used exclusively by such segment. Unallocated assets are principally cash, corporate property and equipment, and investments. Long-lived assets consist of all long-term assets, excluding investments, goodwill, intangible assets, and deferred tax assets.
AMERON INTERNATIONAL CORPORATION AND SUBSIDIARIES
SEGMENT INFORMATION Fiberglass- Water Infrastructure Discontinued
(In thousands) Composite
Pipe Transmission Products Other Operations Eliminations Total 2010 Sales $ 244,084 $ 137,920 $ 121,267 $ - $ - $ (12) $ 503,259 Income/(loss) from continuing operations before income taxes and equity in loss of affiliate 62,118 (1,055) 10,341 6,779 - - 78,183 Equity in loss of affiliate, net of taxes - - - (1,206) - - (1,206)Income from affiliates - cost method (included above) 1,899 - - - - - 1,899 Investments 3,784 - - - - - 3,784 Long-lived assets 91,379 95,472 63,410 44,070 828 - 295,159 Total assets 335,135 182,576 92,729 343,070 - (171,941) 781,569 Capital expenditures 16,762 8,103 5,285 815 - - 30,965 Depreciation and amortization 8,841 10,392 6,659 647 - - 26,539 2009 Sales $ 225,444 $ 177,281 $ 144,235 $ - $ - $ (16) $ 546,944 Income/(loss) from continuing operations before income taxes and equity in loss of affiliate 68,172 1,941 13,216 (29,817) - - 53,512 Equity in loss of affiliate, net of taxes - - - (5,512) - - (5,512)Income from affiliates - cost method (included above) 4,764 - - - - - 4,764 Investments Equity method affiliate - - - 30,626 - - 30,626 Cost method affiliates 3,784 - - - - - 3,784 Long-lived assets 81,915 98,147 66,232 37,088 1,944 - 285,326 Total assets 314,980 191,981 95,311 307,071 - (146,794) 762,549 Capital expenditures 27,473 13,109 4,256 2,036 - - 46,874 Depreciation and amortization 6,639 9,631 5,187 651 - - 22,108 2008 Sales $ 274,129 $ 215,308 $ 179,059 $ - $ - $ (953) $ 667,543 Income/(loss) from continuing operations before income taxes and equity in earnings of affiliate 80,994 (9,212) 25,535 (32,107) - - 65,210 Equity in earnings of affiliate, net of taxes - - - 10,337 - - 10,337 Income from affiliates - cost method (included above) 2,514 1,496 - - - - 4,010 Investments Equity method affiliate - - - 14,428 - - 14,428 Cost method affiliates 3,784 - - - - - 3,784 Long-lived assets 52,314 94,518 60,581 37,131 (107) - 244,437 Total assets 303,672 235,664 107,792 227,399 144 (148,349) 726,322 Capital expenditures 23,269 25,457 10,548 1,897 (474) - 60,697 Depreciation and amortization 5,833 7,729 5,987 860 - - 20,409

Table of Contents
65
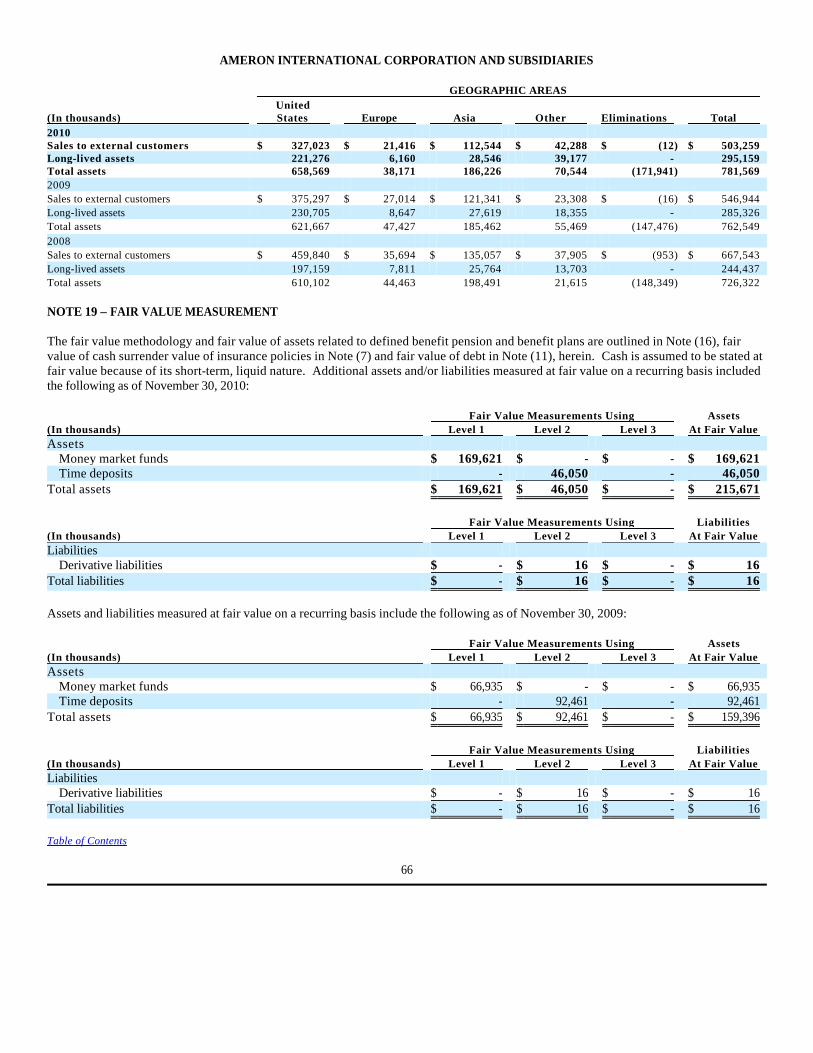
NOTE 19 – FAIR VALUE MEASUREMENT
The fair value methodology and fair value of assets related to defined benefit pension and benefit plans are outlined in Note (16), fair value of cash surrender value of insurance policies in Note (7) and fair value of debt in Note (11), herein. Cash is assumed to be stated at fair value because of its short-term, liquid nature. Additional assets and/or liabilities measured at fair value on a recurring basis included the following as of November 30, 2010:
Assets and liabilities measured at fair value on a recurring basis include the following as of November 30, 2009:
AMERON INTERNATIONAL CORPORATION AND SUBSIDIARIES
GEOGRAPHIC AREAS United (In thousands) States Europe Asia Other Eliminations Total 2010 Sales to external customers $ 327,023 $ 21,416 $ 112,544 $ 42,288 $ (12) $ 503,259 Long-lived assets 221,276 6,160 28,546 39,177 - 295,159 Total assets 658,569 38,171 186,226 70,544 (171,941) 781,569 2009 Sales to external customers $ 375,297 $ 27,014 $ 121,341 $ 23,308 $ (16) $ 546,944 Long-lived assets 230,705 8,647 27,619 18,355 - 285,326 Total assets 621,667 47,427 185,462 55,469 (147,476) 762,549 2008 Sales to external customers $ 459,840 $ 35,694 $ 135,057 $ 37,905 $ (953) $ 667,543 Long-lived assets 197,159 7,811 25,764 13,703 - 244,437 Total assets 610,102 44,463 198,491 21,615 (148,349) 726,322
Fair Value Measurements Using Assets (In thousands) Level 1 Level 2 Level 3 At Fair Value Assets
Money market funds $ 169,621 $ - $ - $ 169,621 Time deposits - 46,050 - 46,050
Total assets $ 169,621 $ 46,050 $ - $ 215,671
Fair Value Measurements Using Liabilities (In thousands) Level 1 Level 2 Level 3 At Fair Value Liabilities
Derivative liabilities $ - $ 16 $ - $ 16 Total liabilities $ - $ 16 $ - $ 16
Fair Value Measurements Using Assets (In thousands) Level 1 Level 2 Level 3 At Fair Value Assets
Money market funds $ 66,935 $ - $ - $ 66,935 Time deposits - 92,461 - 92,461
Total assets $ 66,935 $ 92,461 $ - $ 159,396
Fair Value Measurements Using Liabilities (In thousands) Level 1 Level 2 Level 3 At Fair Value Liabilities
Derivative liabilities $ - $ 16 $ - $ 16 Total liabilities $ - $ 16 $ - $ 16
Table of Contents
66

Cash Equivalents
Cash equivalents are comprised of money market funds and time deposits. The net carrying amount of cash equivalents approximates fair value due to the short-term nature of these instruments.
Derivatives
The Company and its subsidiaries complete transactions in currencies other than their functional currencies. The Company’s primary objective with respect to currency risk is to reduce net income volatility that would otherwise occur due to exchange-rate fluctuations. In order to minimize the risk of gain or loss due to exchange rates, the Company may from time to time use foreign currency derivatives. As of November 30, 2010, the Company held four foreign currency forward contracts comprised of two foreign currency contracts aggregating in the amount of $11,000,000 U.S. dollars, hedging Singapore dollars; one contract in the amount of $1,250,000 Singapore dollars, hedging Malaysian Ringgit; and one contract in the amount of $388,000 U.S. dollars, hedging Euros. As of November 30, 2009, the Company held one foreign currency forward contract aggregating $6,000,000 U.S. dollars, hedging Singapore dollars, and two contracts aggregating $660,000 U.S. dollars, hedging Euros compared to holding one foreign currency forward contract aggregating $500,000, hedging U.S. dollars to Singapore dollars, and two contracts aggregating $769,000, hedging U.S. dollars to Euros at November 30, 2008. Such instruments had a combined fair value loss of $16,000 as of November 30, 2010 and 2009, based on quotations from financial institutions. Derivatives are recorded as receivables and or liabilities on the balance sheet, and the related gains and losses are recognized as other income, net on the income statement.
SUPPLEMENTARY DATA - QUARTERLY FINANCIAL DATA (UNAUDITED)
Summarized quarterly financial data for the years ended November 30, 2010 and 2009, follow:
The Company traditionally experiences lower sales during the first fiscal quarter because of seasonal patterns associated with weather and contractor schedules.
AMERON INTERNATIONAL CORPORATION AND SUBSIDIARIES
(In thousands, except per share data) First
Quarter Second
Quarter Third
Quarter Fourth
Quarter 2010 Sales $ 109,018 $ 136,544 $ 134,199 $ 123,498 Gross profit 29,446 35,331 32,646 30,501 Income from continuing operations, net of taxes 1,083 9,549 8,902 27,734 Loss from discontinued operations, net of taxes - - - (1,014)Net income 1,083 9,549 8,902 26,720 Diluted earnings per share allocated to Common Stock (see Note 1):
Income from continuing operations, net of taxes .12 1.03 .96 2.99 Loss from discontinued operations, net of taxes - - - (.11)Net income .12 1.03 .96 2.88
Stock price per share-high 71.71 72.67 65.60 75.84 Stock price per share-low 54.73 62.15 56.14 56.36 Dividends per share .30 .30 .30 3.30 2009 Sales $ 146,002 $ 132,920 $ 131,378 $ 136,644 Gross profit 34,921 36,550 35,618 38,363 Income from continuing operations, net of taxes 3,826 9,426 5,948 13,283 Income from discontinued operations, net of taxes - - - 817 Net income 3,826 9,426 5,948 14,100 Diluted earnings per share allocated to Common Stock (see Note 1):
Income from continuing operations, net of taxes .41 1.02 .64 1.44 Income from discontinued operations, net of taxes - - - .09 Net income .41 1.02 .64 1.53
Stock price per share-high 66.25 60.21 79.20 89.00 Stock price per share-low 44.84 41.86 50.81 56.96 Dividends per share .30 .30 .30 .30
Table of Contents
67

REPORT OF INDEPENDENT REGISTERED PUBLIC ACCOUNTING FIRM
To the Board of Directors and Stockholders of Ameron International CorporationIn our opinion, the accompanying consolidated balance sheets and the related consolidated statements of income, of stockholders' equity, of comprehensive income, and of cash flows present fairly, in all material respects, the financial position of Ameron International Corporation and its subsidiaries at November 30, 2010 and 2009, and the results of their operations and their cash flows for each of the three years in the period ended November 30, 2010 in conformity with accounting principles generally accepted in the United States of America. In addition, in our opinion, the financial statement schedule listed in the accompanying index appearing under Item 15(a)(2) presents fairly, in all material respects, the information set forth therein when read in conjunction with the related consolidated financial statements. Also in our opinion, the Company maintained, in all material respects, effective internal control over financial reporting as of November 30, 2010, based on criteria established in Internal Control - Integrated Framework issued by the Committee of Sponsoring Organizations of the Treadway Commission (COSO). The Company's management is responsible for these financial statements and financial statement schedule, for maintaining effective internal control over financial reporting and for its assessment of the effectiveness of internal control over financial reporting, included in the accompanying Management's Report on Internal Control over Financial Reporting. Our responsibility is to express opinions on these financial statements, on the financial statement schedule, and on the Company's internal control over financial reporting based on our integrated audits. We conducted our audits in accordance with the standards of the Public Company Accounting Oversight Board (United States). Those standards require that we plan and perform the audits to obtain reasonable assurance about whether the financial statements are free of material misstatement and whether effective internal control over financial reporting was maintained in all material respects. Our audits of the financial statements included examining, on a test basis, evidence supporting the amounts and disclosures in the financial statements, assessing the accounting principles used and significant estimates made by management, and evaluating the overall financial statement presentation. Our audit of internal control over financial reporting included obtaining an understanding of internal control over financial reporting, assessing the risk that a material weakness exists, and testing and evaluating the design and operating effectiveness of internal control based on the assessed risk. Our audits also included performing such other procedures as we considered necessary in the circumstances. We believe that our audits provide a reasonable basis for our opinions.
As discussed in Note 16 to the consolidated financial statements, the Company changed the manner in which it accounts for defined benefit pension and other postretirement benefit plans in 2009.
A company’s internal control over financial reporting is a process designed to provide reasonable assurance regarding the reliability of financial reporting and the preparation of financial statements for external purposes in accordance with generally accepted accounting principles. A company’s internal control over financial reporting includes those policies and procedures that (i) pertain to the maintenance of records that, in reasonable detail, accurately and fairly reflect the transactions and dispositions of the assets of the company; (ii) provide reasonable assurance that transactions are recorded as necessary to permit preparation of financial statements in accordance with generally accepted accounting principles, and that receipts and expenditures of the company are being made only in accordance with authorizations of management and directors of the company; and (iii) provide reasonable assurance regarding prevention or timely detection of unauthorized acquisition, use, or disposition of the company’s assets that could have a material effect on the financial statements.
Because of its inherent limitations, internal control over financial reporting may not prevent or detect misstatements. Also, projections of any evaluation of effectiveness to future periods are subject to the risk that controls may become inadequate because of changes in conditions, or that the degree of compliance with the policies or procedures may deteriorate.
/s/ PricewaterhouseCoopers LLPLos Angeles, CaliforniaJanuary 31, 2011
AMERON INTERNATIONAL CORPORATION AND SUBSIDIARIES
Table of Contents
68
ITEM 9 - CHANGES IN AND DISAGREEMENTS WITH ACCOUNTANTS ON ACCOUNTING AND FINANCIAL DISCLOSURE None. ITEM 9A - CONTROLS AND PROCEDURES Evaluation of Disclosure Controls and Procedures. Management established disclosure controls and procedures to ensure that material information relating to the Company, including its consolidated subsidiaries, is made known to the officers who certify the Company's financial reports and to other members of senior management and the Board of Directors.
The Company carried out an evaluation, under the supervision and with the participation of the Company's Management, including the Company's Chief Executive Officer and Chief Financial Officer, of the effectiveness of the design and operation of the Company's disclosure controls and procedures as of November 30, 2010 pursuant to Exchange Act Rule 13a-14. Based upon that evaluation, the Chief Executive Officer and Chief Financial Officer concluded that the Company's disclosure controls and procedures (as defined in Rules 13a-15(e) and 15d-15(e) under the Securities Exchange Act of 1934) are effective. Disclosure controls and procedures are the controls and other procedures of an issuer that are designed to ensure that information required to be disclosed by the issuer in the reports filed or submitted by it under the Securities Exchange Act of 1934, as amended (Exchange Act), is recorded, processed, summarized and reported, within the time periods specified in the Securities and Exchange Commission’s rules and forms. Disclosure controls and procedures include, without limitation, controls and procedures designed to ensure that information required to be disclosed by an issuer in its Exchange Act reports is accumulated and communicated to the issuer’s management, including its principal executive and financial officers, as appropriate to allow timely decisions regarding required disclosure. No changes were made in the Company's internal control over financial reporting during the fiscal quarter ended November 30, 2010 that have materially affected, or are reasonably likely to materially affect, the Company's internal control over financial reporting.
Management's Report on Internal Control Over Financial Reporting. Management is responsible for establishing and maintaining adequate internal control over financial reporting, as such term is defined in Exchange Act Rule 13a-15(f) and 15d-15(f). Under the supervision and with the participation of Management, including the principal executive officer and principal financial officer, Management conducted an evaluation of the effectiveness of internal control over financial reporting based on the framework in Internal Control - Integrated Framework issued by the Committee of Sponsoring Organizations of the Treadway Commission. Based on Management's evaluation under the framework in Internal Control - Integrated Framework, Management concluded that internal control over financial reporting was effective as of November 30, 2010. The effectiveness of the Company’s internal control over financial reporting as of November 30, 2010 was audited by PricewaterhouseCoopers LLP, an independent registered public accounting firm, as stated in their report which appears herein. ITEM 9B - OTHER INFORMATION The following is provided per the requirements of the Dodd-Frank Act, Section 1503:
The Company operates two mines that are subject to the Federal Mine Safety and Health Act of 1977 (the “FMSHA”), which is administered by the Mine Safety and Health Administration (“MSHA”). During the year ended November, 30 2010, the Company’s Kapaa Quarry & Mill mine, on Oahu, Hawaii, was issued eight citations under Section 104 of the FMSHA and four citations under Section 104(d) of the FMSHA; and a total of $68,020 in assessments were proposed by the MSHA. During the year ended November 30, 2010, the Company’s Puunene Camp 10 Quarry, on Maui, Hawaii, was issued two citations under Section 104 of the FMSHA; and a total of $7,507 in assessments were proposed by the MSHA. The Company believes that all conditions for which citations were received have been abated. The Company had no mine-related fatalities in the year ended November 30, 2010. As of November 30, 2010, all citations referenced above were being contested by the Company.
AMERON INTERNATIONAL CORPORATION AND SUBSIDIARIES
Table of Contents
69

PART III
ITEM 10 - DIRECTORS, EXECUTIVE OFFICERS AND CORPORATE GOVERNANCE Information with respect to the directors, the Audit Committee of the Board of Directors, and the audit committee financial expert, is contained in the Company's Proxy Statement. Such information is incorporated herein by reference. The Board of Directors of the Company has a separately-designated standing audit committee established in accordance with section 3(a)(58)(A) of the Securities Exchange Act. The members of that audit committee are identified in the Company's Proxy Statement under the section captioned "The Board and Its Committees." Such information is incorporated herein by reference. The Board of Directors has determined that one of the members of its Audit Committee, William D. Horsfall, is an audit committee financial expert as defined in Item 407(d)(5) of Regulation S-K.
Executive Officers of the Registrant
The following sets forth information with respect to individuals who served as executive officers as of November 30, 2010 and who are not directors of the Company. All executive officers are appointed by the Board of Directors to serve at the discretion of the Board of Directors.
All of the executive officers named above have held high-level managerial or executive positions with the Company for more than the past five years, except James L. Balas, Leonard J. McGill and Christine Stanley. James L. Balas joined the Company and was appointed Vice President, Controller on April 6, 2009. Prior to joining the Company, he was Chief Financial Officer of Solar Integrated Technologies from 2008 to 2009 and Vice President of Finance from 2006 to 2008. Previously he was Director of Finance and Corporate Development of Keystone Automotive Industries from 2003 to 2006. Leonard J. McGill joined the Company on May 3, 2010 and was appointed Senior Vice President, Secretary & General Counsel on June 23, 2010. Prior to joining the Company, since 2005, he was Senior Vice President, General Counsel & Secretary of Fleetwood Enterprises, Inc., which filed for Chapter 11 bankruptcy protection in May 2009. Mark J. Nowak was appointed Vice President, Special Projects in April 2010. He served as Vice President; Group President, Fiberglass-Composite Pipe Group since March 2008; Group President, Fiberglass-Composite Pipe Group since March 2004 and President, Fiberglass-Composite Pipe Division-USA since April 2003. Christine Stanley was appointed Vice President-Operations Compliance on September 24, 2008, after serving as Group Executive since 2006. Prior to 2006, she served as Vice President of Technology of the worldwide Performance Coatings & Finishes Group and held numerous senior technology and manufacturing management positions.
AMERON INTERNATIONAL CORPORATION AND SUBSIDIARIES
Name Age Title and Year Elected as OfficerJames L. Balas 40 Vice President, Controller 2009 Ralph S. Friedrich 63 Senior Vice President-Technology 2003 Leonard J. McGill 53 Senior Vice President, Secretary & General Counsel 2010 James R. McLaughlin 63 Senior Vice President, Corporate Development & Treasurer 1997 Mark J. Nowak 56 Vice President, Special Projects 2008 Terrence P. O'Shea 64 Vice President-Human Resources 2003 Christine Stanley 52 Vice President-Operations Compliance 2008 Gary Wagner 59 Senior Vice President, Finance and Administration & Chief Financial Officer 1990
Table of Contents
70

The Company has adopted a Code of Business Conduct and Ethics (the "Ethics Code") that applies to directors, officers and employees of the Company, including its principal executive officer, principal financial officer, principal accounting officer or controller, or persons performing similar functions. Copies of the Ethics Code, as well as each of the Company's Corporate Governance Guidelines and charters of the Audit, the Compensation and the Nominating & Corporate Governance committees of its Board of Directors are available on the Company's website, located at www.ameron.com, and are available in print to stockholders upon written request to the Secretary of the Company at the Company's headquarters address. ITEM 11 - EXECUTIVE COMPENSATION * ITEM 12 - SECURITY OWNERSHIP OF CERTAIN BENEFICIAL OWNERS AND MANAGEMENT AND RELATED STOCKHOLDER MATTERS * ITEM 13 - CERTAIN RELATIONSHIPS AND RELATED TRANSACTIONS, AND DIRECTOR INDEPENDENCE * ITEM 14 - PRINCIPAL ACCOUNTING FEES AND SERVICES * * The information required by Items 11, 12, 13 and 14 is contained in the Company's Proxy Statement. Such information is incorporated herein by reference.
PART IV ITEM 15 - EXHIBITS, FINANCIAL STATEMENT SCHEDULES (a) (1) CONSOLIDATED FINANCIAL STATEMENTS:
The following financial statements are included in this Annual Report on Form 10-K in Item 8, herein:
(2) FINANCIAL STATEMENT SCHEDULES
The following additional financial data should be read in conjunction with the Consolidated Financial Statements. Schedules not included with this additional financial data are omitted because they are either not applicable, not required, not significant, or the required information is provided in the Consolidated Financial Statements under Financial Statements and Supplementary Data, under Item 8, herein.
AMERON INTERNATIONAL CORPORATION AND SUBSIDIARIES
Consolidated Statements of Income for the years ended November 30, 2010, 2009 and 2008.Consolidated Balance Sheets as of November 30, 2010 and 2009.Consolidated Statements of Stockholders' Equity for the years ended November 30, 2010, 2009 and 2008.Consolidated Statements of Comprehensive Income for the years ended November 30, 2010, 2009 and 2008.Consolidated Statements of Cash Flows for the years ended November 30, 2010, 2009 and 2008.Notes to Consolidated Financial StatementsReport of Independent Registered Public Accounting Firm
SCHEDULE NO. DESCRIPTION OF SCHEDULEII Valuation and Qualifying Accounts and Reserves
Table of Contents
71

(3) EXHIBITS:
The following exhibits are filed with this Annual Report on Form 10-K:
AMERON INTERNATIONAL CORPORATION AND SUBSIDIARIES
EXHIBIT NO. DESCRIPTION OF EXHIBIT3.1 Restated Certificate of Incorporation, effective May 4, 2009 (incorporated by reference to the Company’s Quarterly
Report on Form 10-Q for the period ended May 31, 2009)3.2 Bylaws of Ameron International Corporation, amended and restated effective August 4, 2010 (incorporated by
reference to Exhibit 3.2 to the Company’s Current Report on 8-K filed August 10, 2010). 4.1 Note Purchase Agreement dated November 25, 2005, re: SGD 51,000,000 4.25% Senior Secured Notes due November
25, 2012 (incorporated by reference to Exhibit 4.3 to the Company’s Annual Report on Form 10-K for the year ended November 30, 2008)
4.2 Agreement to furnish to the Securities and Exchange Commission upon request a copy of instruments defining the rights of holders of certain long-term debt of the Company and consolidated subsidiaries (incorporated by reference to Exhibit 4.4 to the Company’s Annual Report on Form 10-K for the year ended November 30, 2008)
10.1 Seventh Amendment to Credit Agreement dated August 28, 2009, amending and restating such Credit Agreement in its entirety (incorporated by reference to Exhibit 10.1 to the Company’s Quarterly Report on Form 10-Q for the period ended August 30, 2009)
10.2 Eighth Amendment to Credit Agreement dated as of October 21, 2010 (incorporated by reference to Exhibit 10.1 to the Company’s Current Report on Form 8-K dated October 21, 2010)
10.3 Amended and Restated Employment Agreement between James S. Marlen and the Company (incorporated by reference to Exhibit 10(1) to the Company’s Annual Report on Form 10-K for the year ended November 30, 2003)**
10.4 First Amendment to Amended and Restated Employment Agreement between James S. Marlen and the Company (incorporated by reference to Exhibit 99.1 to the Company’s Current Report on Form 8-K dated September 21, 2007)**
10.5 Second Amendment to Amended and Restated Employment Agreement between James S. Marlen and the Company (incorporated by reference to Exhibit 99.1 to the Company’s Current Report on Form 8-K dated March 22, 2010)**
10.6 Performance Stock Unit Agreement between James S. Marlen and the Company (incorporated by reference to Exhibit 99.2 to the Company’s Current Report on Form 8-K dated September 21, 2007)**
10.7 Change of Control Agreement between Javier Solis and the Company (incorporated by reference to Exhibit 10(2) to the Company’s Annual Report on Form 10-K for the year ended November 30, 1998)**
10.8 Amendment to Change of Control Agreement between Javier Solis and the Company (incorporated by reference to Exhibit 10.3 to the Company’s Current Report on Form 8-K dated December 17, 2008)**
10.9 Change of Control Agreement between Gary Wagner and the Company (incorporated by reference to Exhibit 10(3) to the Company’s Annual Report on Form 10-K for the year ended November 30, 1998)**
10.10 Amendment to Change of Control Agreement between Gary Wagner and the Company (incorporated by reference to Exhibit 10.1 to the Company’s Current Report on Form 8-K dated December 17, 2008)**
10.11 Change of Control Agreement between James R. McLaughlin and the Company (incorporated by reference to Exhibit 10(5) to the Company’s Annual Report on Form 10-K for the year ended November 30, 2000)**
10.12 Amendment to Change of Control Agreement between James R. McLaughlin and the Company (incorporated by reference to Exhibit 10.2 to the Company’s Current Report on Form 8-K dated December 17, 2008)**
10.13 Letter Agreement dated October 19, 2009 between the Company and James R. McLaughlin (incorporated by reference to Exhibit 10.1 to the Company's Current Report on Form 8-K dated October 19, 2009)**
10.14 Change of Control Agreement between Stephen E. Johnson and the Company (incorporated by reference to Exhibit 10.4 to the Company’s Current Report on Form 8-K dated December 17, 2008)**
10.15 2001 Stock Incentive Plan (incorporated by reference to Exhibit 2 to the Company’s Proxy Statement for the Annual Meeting of Stockholders held on March 21, 2001)**
10.16 Amended and Restated 2004 Stock Incentive Plan dated June 23, 2010 (incorporated by reference to Exhibit 10.1 to the Company’s Current Report on 8-K filed June 25, 2010).**
10.17 Key Executive Long-Term Cash Incentive Plan (incorporated by reference to Exhibit C to the Company’s Proxy Statement for the Annual Meeting of Stockholders held on March 26, 2008)**
10.18 Form of Restricted Stock Agreement for Employees (incorporated by reference to Exhibit 99.1 to the Company’s Current Report on Form 8-K dated January 27, 2006)**
10.19 Form of Restricted Stock Agreement for Non-Employee Directors (incorporated by reference to Exhibit 99.1 to the Company’s Current Report on Form 8-K dated March 23, 2006)**
10.20 Stock Ownership Requirements and Retention Policy (incorporated by reference to Exhibit 10.2 to the Company’s Current Report on 8-K filed June 25, 2010).**
10.21 Change of Control Agreement between Ameron International Corporation and Leonard J. McGill, effective June 23, 2010 (incorporated by reference to Exhibit 10.3 to the Company’s Current Report on 8-K filed June 25, 2010).**
10.22 Stock Purchase Agreement dated September 14, 2010 among Ameron International Corporation, Mitsui & Co. (U.S.A.), Inc., Tokyo Steel Manufacturing Co., Ltd. and Gerdau Ameristeel US Inc. relating to the sale of TAMCO (incorporated by reference to Exhibit 10.1 to the Company’s Current Report on 8-K filed September 16, 2010).
21 Subsidiaries of the Registrant *23.1 Consent of PricewaterhouseCoopers LLP *

23.2 Consent of PricewaterhouseCoopers LLP regarding TAMCO *31.1 Section 302 Certification of Chief Executive Officer *31.2 Section 302 Certification of Chief Financial Officer *32 Section 906 Certification of Chief Executive Officer and Chief Financial Officer *
99.1 Unaudited TAMCO Financial Statements as of October 20, 2010 and the period from December 1, 2009 through October 20, 2010, and the audited TAMCO Financial Statements for each of the two years in the period ended November 30, 2009 and associated Report of Independent Registered Public Accounting Firm.*
101 The following materials from the Company’s Annual Report on Form 10-K for the year ended November 30, 2010 formatted in Extensible Business Reporting Language (“XBRL”): (i) the Consolidated Statements of Income, (ii) the Consolidated Balance Sheets, (iii) the Consolidated Statements of Stockholders’ Equity, (iv) the Consolidated Statements of Comprehensive Income, (v) the Consolidated Statements of Cash Flows and (vi) the Notes to Consolidated Financial Statements.
* Filed herewith ** Compensatory plan or arrangement
Table of Contents
72

AMERON INTERNATIONAL CORPORATION AND CONSOLIDATED SUBSIDIARIES
SCHEDULE II - VALUATION AND QUALIFYING ACCOUNTS AND RESERVES
FOR THE YEAR ENDED NOVEMBER 30, 2010(In thousands)
* Translation adjustment.
FOR THE YEAR ENDED NOVEMBER 30, 2009(In thousands)
* Translation adjustment.
FOR THE YEAR ENDED NOVEMBER 30, 2008(In thousands)
* Translation adjustment.
AMERON INTERNATIONAL CORPORATION AND SUBSIDIARIES
Additions Deductions, Balance at Charged to Payments Balance Beginning Costs and And Reclassifications at End of Classification of Year Expenses Write-offs and Other Year Allowance for doubtful accounts $ 5,351 $ 1,004 $ (2,649) $ 142 * $ 3,848 Valuation allowance for deferred tax assets 7,073 4,285 - (1,181) 10,177
Additions Deductions, Balance at Charged to Payments Balance Beginning Costs and And Reclassifications at End of Classification of Year Expenses Write-offs and Other Year Allowance for doubtful accounts $ 7,009 $ 1,487 $ (2,191) $ (954) * $ 5,351 Valuation allowance for deferred tax assets 10,248 (1,579) - (1,596) 7,073
Additions Deductions, Balance at Charged to Payments Balance Beginning Costs and And Reclassifications at End of Classification of Year Expenses Write-offs and Other Year Allowance for doubtful accounts $ 6,235 $ 4,419 $ (3,533) $ (112) * $ 7,009 Valuation allowance for deferred tax assets 15,611 24 - (5,387) 10,248
Table of Contents
73

SIGNATURES
Pursuant to the requirements of Section 13 or 15(d) of the Securities Exchange Act of 1934, the Registrant has duly caused this report to be signed on its behalf by the undersigned, thereunto duly authorized.
AMERON INTERNATIONAL CORPORATION
Date: January 31, 2011
Pursuant to the requirements of the Securities Exchange Act of 1934, this report has been signed below by the following persons on behalf of the Registrant and in the capacities and on the dates indicated.
AMERON INTERNATIONAL CORPORATION AND SUBSIDIARIES
By: /s/ Gary Wagner
Chief Financial Officer
Date: 1-31-11 /s/ James S. Marlen Director, Chairman of the Board, President James S. Marlen and Chief Executive Officer (Principal Executive Officer) Date: 1-31-11 /s/ Gary Wagner Senior Vice President, Finance and Administration, Gary Wagner and Chief Financial Officer (Principal Financial & Accounting Officer) Date: 1-31-11 /s/David Davenport Director David Davenport Date: 1-31-11 /s/J. Michael Hagan Director J. Michael Hagan Date: 1-31-11 /s/Terry L.Haines Director Terry L. Haines Date: 1-31-11 /s/William D. Horsfall Director William D. Horsfall Date: 1-31-11 /s/John E. Peppercorn Director John E. Peppercorn Date: 1-31-11 /s/Barry L. Williams Director Barry L. Williams

EXHIBIT 21
SUBSIDIARIES OF THE REGISTRANT Parents None.
Names of other consolidated subsidiaries and subsidiaries not consolidated and fifty-percent or less owned companies are omitted because when considered in the aggregate as a single subsidiary they do not constitute a significant subsidiary.
Jurisdiction of Percent ofSubsidiaries Consolidated Incorporation Stock OwnedAmerican Pipe & Construction International California 100Ameron B.V. the Netherlands 100Ameron Malaysia Sdn. Bhd. Malaysia 100Ameron (Pte) Ltd. Singapore 100
Ameron (UK) Limited United Kingdom 100
Centron International, Inc. Delaware 100Island Ready-Mix Concrete, Inc. Hawaii 100Ameron Polyplaster Industria E Comercio Ltda (“Polyplaster”) Brazil 100Ameron Brasil Industria E Comercio De Tubos Ltda (“Ameron Brazil”) Brazil 100Tubos California Corporation California 100Tubos Y Activos, S. de R.L. de C.V. Mexico 100
Subsidiaries Not Consolidated and Fifty-Percent or Less Owned Companies Bondstrand, Ltd. Saudi Arabia 40Ameron Saudi Arabia, Ltd. Saudi Arabia 30

EXHIBIT 23.1
CONSENT OF INDEPENDENT REGISTERED PUBLIC ACCOUNTING FIRM
We hereby consent to the incorporation by reference in the Registration Statements on Form S-8 (No. 333-114534, No. 033-59697, No. 333-36497 and No. 333-61816) of Ameron International Corporation of our report dated January 31, 2011 relating to the financial statements, financial statement schedule and the effectiveness of internal control over financial reporting, which appears in this Form 10-K.
/s/ PricewaterhouseCoopers LLPLos Angeles, CaliforniaJanuary 31, 2011

EXHIBIT 23.2
CONSENT OF INDEPENDENT REGISTERED PUBLIC ACCOUNTING FIRM
We hereby consent to the incorporation by reference in the Registration Statements on Form S-8 (No. 333-114534, No. 033-59697, No. 333-36497 and No. 333-61816) of Ameron International Corporation of our report dated January 25, 2010 relating to the financial statements of TAMCO, which appears on this Form 10-K.
/s/ PricewaterhouseCoopers LLPOrange County, CaliforniaJanuary 31, 2011

EXHIBIT 31.1
SECTION 302 CERTIFICATION OF CHIEF EXECUTIVE OFFICER I, James S. Marlen, certify that: 1. I have reviewed this report on Form 10-K of Ameron International Corporation; 2. Based on my knowledge, this report does not contain any untrue statement of a material fact or omit to state a material fact necessary to make the statements made, in light of the circumstances under which such statements were made, not misleading with respect to the period covered by this report; 3. Based on my knowledge, the financial statements, and other financial information included in this report, fairly present in all material respects the financial condition, results of operations and cash flows of the Registrant as of, and for, the periods presented in this report; 4. The Registrant's other certifying officers and I are responsible for establishing and maintaining disclosure controls and procedures (as defined in Exchange Act Rules 13a-15(e) and 15d-15(e)) and internal control over financial reporting (as defined in Exchange Act Rules 13a-15(f) and 15d-15(f)) for the Registrant and have: a) designed such disclosure controls and procedures, or caused such disclosure controls and procedures to be designed under our supervision, to ensure that material information relating to the Registrant, including its consolidated subsidiaries, is made known to us by others within those entities, particularly during the period in which this report is being prepared; b) designed such internal control over financial reporting, or caused such internal control over financial reporting to be designed under our supervision, to provide reasonable assurance regarding the reliability of financial reporting and the preparation of financial statements for external purposes in accordance with generally accepted accounting principles; c) evaluated the effectiveness of the Registrant's disclosure controls and procedures; and presented in this report our conclusions about the effectiveness of the disclosure controls and procedures, as of the end of the period covered by this report based on such evaluation, and; d) disclosed in this report any change in the Registrant's internal control over financial reporting that occurred during the Registrant's most recent fiscal quarter (the Registrant's fourth fiscal quarter in the case of an annual report) that has materially affected, or is reasonably likely to materially affect, the Registrant's internal control over financial reporting; and 5. The Registrant's other certifying officers and I have disclosed, based on our most recent evaluation of internal control over financial reporting, to the Registrant's auditors and the audit committee of Registrant's board of directors (or persons performing the equivalent functions): a) all significant deficiencies and material weaknesses in the design or operation of internal control over financial reporting which are reasonably likely to adversely affect the Registrant's ability to record, process, summarize and report financial information; and b) any fraud, whether or not material, that involves management or other employees who have a significant role in the Registrant's internal control over financial reporting. January 31, 2011 /s/ James S. Marlen James S. Marlen Chairman, President & Chief Executive Officer
EXHIBIT 31.2
SECTION 302 CERTIFICATION OF CHIEF FINANCIAL OFFICER I, Gary Wagner, certify that: 1. I have reviewed this report on Form 10-K of Ameron International Corporation; 2. Based on my knowledge, this report does not contain any untrue statement of a material fact or omit to state a material fact necessary to make the statements made, in light of the circumstances under which such statements were made, not misleading with respect to the period covered by this report; 3. Based on my knowledge, the financial statements, and other financial information included in this report, fairly present in all material respects the financial condition, results of operations and cash flows of the Registrant as of, and for, the periods presented in this report; 4. The Registrant's other certifying officers and I are responsible for establishing and maintaining disclosure controls and procedures (as defined in Exchange Act Rules 13a-15(e) and 15d-15(e)) and internal control over financial reporting (as defined in Exchange Act Rules 13a-15(f) and 15d-15(f)) for the Registrant and have: a) designed such disclosure controls and procedures, or caused such disclosure controls and procedures to be designed under our supervision, to ensure that material information relating to the Registrant, including its consolidated subsidiaries, is made known to us by others within those entities, particularly during the period in which this report is being prepared; b) designed such internal control over financial reporting, or caused such internal control over financial reporting to be designed under our supervision, to provide reasonable assurance regarding the reliability of financial reporting and the preparation of financial statements for external purposes in accordance with generally accepted accounting principles; c) evaluated the effectiveness of the Registrant's disclosure controls and procedures; and presented in this report our conclusions about the effectiveness of the disclosure controls and procedures, as of the end of the period covered by this report based on such evaluation, and; d) disclosed in this report any change in the Registrant's internal control over financial reporting that occurred during the Registrant's most recent fiscal quarter (the Registrant's fourth fiscal quarter in the case of an annual report) that has materially affected, or is reasonably likely to materially affect, the Registrant's internal control over financial reporting; and 5. The Registrant's other certifying officers and I have disclosed, based on our most recent evaluation of internal control over financial reporting, to the Registrant's auditors and the audit committee of Registrant's board of directors (or persons performing the equivalent functions): a) all significant deficiencies and material weaknesses in the design or operation of internal control over financial reporting which are reasonably likely to adversely affect the Registrant's ability to record, process, summarize and report financial information; and b) any fraud, whether or not material, that involves management or other employees who have a significant role in the Registrant's internal control over financial reporting. January 31, 2011 /s/ Gary Wagner Gary Wagner Senior Vice President-Chief Financial Officer
EXHIBIT 32
CERTIFICATION OF CHIEF EXECUTIVE OFFICER AND CHIEF FINANCIAL OFFICER
PURSUANT TO 18 U.S.C. ss.1350, AS ADOPTED PURSUANT TO SECTION 906 OF THE
SARBANES-OXLEY ACT OF 2002* In connection with the report of Ameron International Corporation (the "Company") on Form 10-K for the fiscal year ended November 30, 2010 as filed with the Securities and Exchange Commission on the date hereof (the "Report"), I, James S. Marlen, Chairman, President and Chief Executive Officer of the Company and I, Gary Wagner, Chief Financial Officer of the Company, certify, pursuant to 18 U.S.C. ss.1350, as adopted pursuant to Section 906 of the Sarbanes-Oxley Act of 2002, that: 1. The Report fully complies with the requirements of Section 13(a) or 15(d) of the Securities Act of 1934; and 2. The information contained in the Report fairly presents, in all material respects, the financial condition and results of operations of the Company.
* A signed original of this written statement required by Section 906 has been provided to Ameron International Corporation and will be retained by Ameron International Corporation and furnished to the Securities and Exchange Commission or its staff upon request.
/s/ James S. Marlen James S. Marlen
Chairman, President & Chief Executive OfficerJanuary 31, 2011
/s/ Gary Wagner Gary Wagner
Senior Vice President-Chief Financial Officer January 31, 2011

EXHIBIT 99.1
TAMCO FINANCIAL STATEMENTS Exhibit 99.1 is the unaudited TAMCO Financial Statements as of October 20, 2010 and the period from December 1, 2009 through October 20, 2010, and the audited TAMCO Financial Statements for each of the two years in the period ended November 30, 2009 and associated Report of Independent Registered Public Accounting Firm.

TAMCOFinancial StatementsFor the Period December 1, 2009 to October 20, 2010, and the Years Ended November 30, 2009 and November 30, 2008

TAMCOIndexFor the Period December 1, 2009 to October 20, 2010, and the Years Ended November 30, 2009 and November 30, 2008
Page(s)Report of Independent Auditors 1Financial Statements
Balance Sheets 2Statements of Income (Loss) and Comprehensive Income (Loss) 3Statements of Shareholders’ Equity 4Statements of Cash Flows 5Notes to Financial Statements 6–21

Report of Independent Auditors To the Board of Directors and Shareholders of TAMCO In our opinion, the accompanying balance sheet and the related statements of income (loss) and comprehensive income (loss), of shareholders' equity and of cash flows present fairly, in all material respects, the financial position of TAMCO at November 30, 2009, and the results of its operations and its cash flows for each of the two fiscal years in the period ended November 30, 2009, in conformity with accounting principles generally accepted in the United States of America. These financial statements are the responsibility of the Company’s management. Our responsibility is to express an opinion on these financial statements based on our audits. We conducted our audits of these statements in accordance with auditing standards generally accepted in the United States of America. Those standards require that we plan and perform the audit to obtain reasonable assurance about whether the financial statements are free of material misstatement. An audit includes examining, on a test basis, evidence supporting the amounts and disclosures in the financial statements, assessing the accounting principles used and significant estimates made by management, and evaluating the overall financial statement presentation. We believe that our audits provide a reasonable basis for our opinion. As discussed in Note 3 to the financial statements, the Company adopted a new standard to account for the financial and non-financial assets and liabilities using fair value and disclosed the use of fair value measures for recognition and disclosure purposes in the fiscal years ended November 30, 2008 and 2009. Also, as discussed in Note 6 to the financial statements, for the fiscal year ended November 30, 2009, the Company changed the measurement date used to account for its defined benefit pension plans.
/s/ PricewaterhouseCoopers LLPOrange County, California January 25, 2010
1

TAMCOBalance SheetsOctober 20, 2010 and November 30, 2009
(in thousands, except share amounts) 2010 2009 (Unaudited) Assets Current assets
Cash $ 2,116 $ 1,421 Restricted cash 1,073 2,857 Trade and other receivables, net of allowances of $451 and $430 in 2010 and 2009, respectively 8,001 3,815 Due from shareholders 86 38 Inventories 30,979 29,909 Deferred tax assets (Note 7) 908 935 Income tax refund receivable (Note 7) 1,723 7,975 Prepaid expenses and tooling 970 908
Total current assets 45,856 47,858 Property, plant and equipment
Land 1,191 1,191 Processing facilities and equipment 104,770 104,770 Construction in process 16,262 14,497
Total property, plant and equipment 122,223 120,458 Less: Accumulated depreciation and amortization (81,540) (77,851)
Property, plant and equipment, net 40,683 42,607 Deferred tax assets (Note 7) 719 1,104 Other assets (Note 2) 6,604 7,299
Total assets $ 93,862 $ 98,868 Liabilities and Shareholders' Equity Current liabilities
Borrowings under line of credit (Note 5) $ - $ - Trade payables 6,852 5,590 Other accrued liabilities 2,071 1,403
Total current liabilities 8,923 6,993 Long-term liabilities
Borrowings from shareholders (Note 5) 27,000 30,000 Other long-term liabilities (Notes 2 and 6) 14,623 15,155
Total long-term liabilities 41,623 45,155 Commitments and contingencies (Note 8) Shareholders' equity
Common stock, $100 par value; 220,000 shares authorized, issued and outstanding 39,482 39,482 Retained earnings 14,320 16,935 Accumulated other comprehensive loss (10,486) (9,697)
Total shareholders' equity 43,316 46,720 Total liabilities and shareholders' equity $ 93,862 $ 98,868
The accompanying notes are an integral part of these financial statements.
2

TAMCOStatements of Income (Loss) and Comprehensive Income (Loss)For the Period December 1, 2009 to October 20, 2010, and the Years Ended November 30, 2009 and November 30, 2008
(in thousands) 2010 2009 2008 (Unaudited) Revenue Gross sales $ 99,825 $ 86,390 $ 368,605 Cash discounts allowed (657) (650) (2,648)
Total revenue 99,168 85,740 365,957 Cost of sales 94,889 96,539 300,493 Lower of cost or market adjustment - 51 9,842 Loading and freight 2,171 1,890 5,695
Total costs of sales 97,060 98,480 316,030 Gross (loss) profit 2,108 (12,740) 49,927
General and administrative expenses 5,092 7,529 8,913 (Loss) income from operations (2,984) (20,269) 41,014
Other expenses (income), net Interest 967 933 1,713 Other 292 (1,091) 1,824
Total other expenses 1,259 (158) 3,537 (Loss) income before income taxes (4,243) (20,111) 37,477
Benefit from (provision for) income taxes (Note 7) 1,628 8,156 (14,600)Net (loss) income (2,615) (11,955) 22,877
Other comprehensive income (loss) Defined benefit pension plans
Net pension loss during period (1,122) (9,691) (2,812)Amortization of prior service costs included in net periodic pension cost 1 5 6
Total defined benefit pension plans (1,121) (9,686) (2,806)Unrealized gain (loss) on investments - 19 (32)
Total other comprehensive (loss) income, before tax (1,121) (9,667) (2,838)Benefit from (provision for) income taxes related to other comprehensive income 332 4,019 1,081
Total other comprehensive (loss) income, net of tax (789) (5,648) (1,757)Comprehensive (loss) income $ (3,404) $ (17,603) $ 21,120
The accompanying notes are an integral part of these financial statements.
3

TAMCOStatements of Shareholders’ Equity
For the Period December 1, 2009 to October 20, 2010, and the Years Ended November 30, 2009 and November 30, 2008
Accumulated Other Comprehensive Loss, Common Stock Retained Net of Tax
(in thousands, except shares) Shares Amount Earnings Pension Other Total Balances at November 30, 2007 220,000 $ 19,482 $ 27,905 $ (2,292) $ - $ 45,095 Net income - - 22,877 - - 22,877 Net pension loss during period - - - (1,738) - (1,738)Unrealized loss on investments - - - - (19) (19)Dividends to shareholders - - (21,615) - - (21,615)Balances at November 30, 2008 220,000 19,482 29,167 (4,030) (19) 44,600 Net loss - - (11,955) - (11,955)Net pension loss during period - - - (5,660) - (5,660)Adoption of new measurement date for defined benefit pension plans - - (277) - - (277)Unrealized gain on investments - - - - 12 12 Shareholder contribution (Note 4) - 20,000 - - - 20,000 Balances at November 30, 2009 220,000 39,482 16,935 (9,690) (7) 46,720 Net loss (2,615) (2,615)Net pension loss during period - - - (789) - (789)
Balances at October 20, 2010 (Unaudited) 220,000 $ 39,482 $ 14,320 $ (10,479) $ (7) $ 43,316
The accompanying notes are an integral part of these financial statements.
4
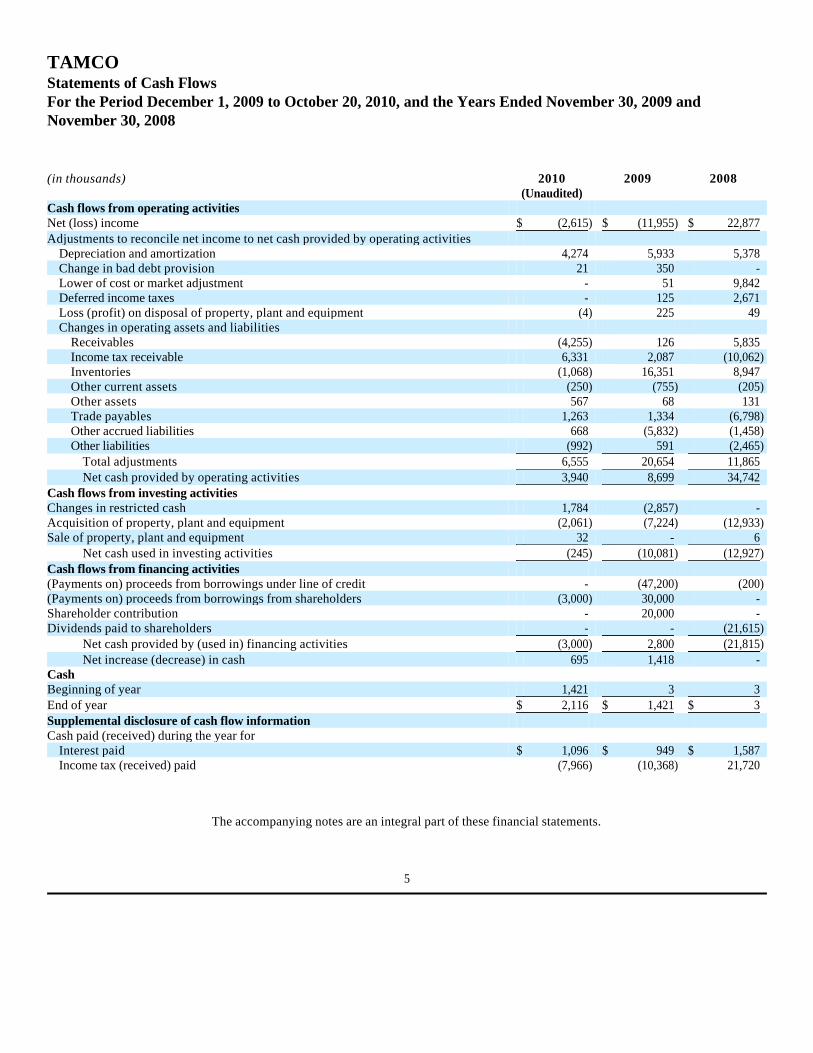
TAMCOStatements of Cash FlowsFor the Period December 1, 2009 to October 20, 2010, and the Years Ended November 30, 2009 and November 30, 2008
(in thousands) 2010 2009 2008 (Unaudited) Cash flows from operating activities Net (loss) income $ (2,615) $ (11,955) $ 22,877 Adjustments to reconcile net income to net cash provided by operating activities
Depreciation and amortization 4,274 5,933 5,378 Change in bad debt provision 21 350 - Lower of cost or market adjustment - 51 9,842 Deferred income taxes - 125 2,671 Loss (profit) on disposal of property, plant and equipment (4) 225 49 Changes in operating assets and liabilities
Receivables (4,255) 126 5,835 Income tax receivable 6,331 2,087 (10,062)Inventories (1,068) 16,351 8,947 Other current assets (250) (755) (205)Other assets 567 68 131 Trade payables 1,263 1,334 (6,798)Other accrued liabilities 668 (5,832) (1,458)Other liabilities (992) 591 (2,465)
Total adjustments 6,555 20,654 11,865 Net cash provided by operating activities 3,940 8,699 34,742
Cash flows from investing activities Changes in restricted cash 1,784 (2,857) - Acquisition of property, plant and equipment (2,061) (7,224) (12,933)Sale of property, plant and equipment 32 - 6
Net cash used in investing activities (245) (10,081) (12,927)Cash flows from financing activities (Payments on) proceeds from borrowings under line of credit - (47,200) (200)(Payments on) proceeds from borrowings from shareholders (3,000) 30,000 - Shareholder contribution - 20,000 - Dividends paid to shareholders - - (21,615)
Net cash provided by (used in) financing activities (3,000) 2,800 (21,815)Net increase (decrease) in cash 695 1,418 -
Cash Beginning of year 1,421 3 3 End of year $ 2,116 $ 1,421 $ 3 Supplemental disclosure of cash flow information Cash paid (received) during the year for
Interest paid $ 1,096 $ 949 $ 1,587 Income tax (received) paid (7,966) (10,368) 21,720
The accompanying notes are an integral part of these financial statements.
5

Description of the BusinessTAMCO (the "Company"), a California corporation, was formed in 1974 and was owned by Ameron International Corporation (“Ameron”) (a 50% shareholder), Mitsui & Co. (U.S.A.), Inc. ("Mitsui") (a 25% shareholder) and Tokyo Steel Mfg. Co., Ltd. ("Tokyo Steel") (a 25% shareholder) until October 21, 2010. TAMCO’s operations consist of the manufacture and sale of steel reinforcing bar. The Company sells product within California, Nevada and Arizona.
For the years ended, November 30, 2009 and 2008, the Company qualified as a significant subsidiary of Ameron; and as a result, audited financial statements are presented for those periods. For the period from December 1, 2009 to October 20, 2010 ("2010 Period"), the Company did not meet the criteria of a significant subsidiary; and, therefore, this period has not been audited.
Liquidity and market riskScrap prices continue to be volatile and cyclical as a result of demand sensitivity. The fall in scrap metal prices in late fiscal year 2008 continues to have an impact on rebar prices and thus the Company's operating results have experienced a reduction in revenues.
During fiscal year 2009, the Company paid down, in full, its Bank of America business loan agreement. In replacement of the loan agreement, the Company obtained financing from its shareholders of $40,000,000 due in early fiscal year 2011 (Note 5). As of October 20, 2010, the Company has borrowed $27,000,000 against the shareholder facility. The shareholder agreement does not carry any significant covenants for which the Company must comply.
Fiscal Year-End The Company’s fiscal year ends on the Sunday nearest November 30. The actual fiscal year end for 2009 and 2008 was November 29 and November 30, respectively. For clarity of presentation, the financial statements refer to the year-end as November 30 for 2009 and 2008.
Revenue RecognitionRevenue is recognized when all of the following criteria are met: (1) persuasive evidence of an arrangement exists, (2) the sales price is fixed or determinable, (3) collectability is reasonably assured and (4) products have been shipped and the customer has taken ownership and assumed risk of loss. A substantial portion of the Company’s product sales are on FOB shipping point terms where product title passes to the customer at the time it is shipped from the Company’s premises. Products sales on FOB destination terms are not recognized until delivered to the customer.
Shipping and Handling CostsShipping and handling costs typically are charged to customers and are included within sales. Shipping and handling costs charged to customers were $1,077,000, $1,053,000 and $3,344,000 in 2010, 2009 and 2008, respectively.
Other Expenses (Income)Other expenses (income) on the statements of income and comprehensive income primarily consist of rental income and interest expense, predominantly relating to the Company's borrowings. In fiscal 2008, the Company charged off $2,486,000 in costs related to the cancellation of capital projects. In addition, in fiscal year 2009, the Company received $782,000 in settlement income from its natural gas antitrust litigation.
TAMCONotes to Financial StatementsFor the Period December 1, 2009 to October 20, 2010, and the Years Ended November 30, 2009 and November 30, 2008
1. Description of the business and market risk
2. Summary of Significant Accounting Policies
6

Income TaxesThe Company accounts for income taxes using the asset and liability method to compute the differences between the tax basis of assets and liabilities and the related financial amounts, using the enacted tax laws. Valuation allowances are established, when necessary, to reduce deferred tax assets that are not expected to be realized.
Restricted CashThe Company has restricted cash held in Treasury bills as collateral against the Company's existing letters of credit totaling $1,073,000 as of October 20, 2010. The collateral was not required prior to 2009 as the collateral was included as part of the business loan agreement with Bank of America. Under the terms of the Company's new shareholder debt agreement, the collateral for these letters is not included (Note 5). The Treasury bills have a maturity of one month for which the Company renews when they come due.
The Company considers all highly liquid investments with original maturities of three months or less, when purchased, to be cash equivalents. The carrying amount of these assets approximates fair value due to the short-term maturities of these bills.
InventoriesInventories are stated at the lower of cost or market, with cost determined using the first-in, first-out method. Inventories consisted of the following at October 20, 2010 and November 30, 2009 (in thousands):
The Company currently buys its scrap metal at market prices. Due to the nature of this commodity market, the Company is vulnerable to price changes due to shifts in supply and demand. These changes in raw material prices may not necessarily be passed on to the end users and, therefore, could impact operating results.
Due to the decline in steel prices in fiscal years 2009 and 2008, the Company wrote down its inventories by $51,000 and $9,842,000, respectively, in a lower of cost or market adjustment. No lower of cost or market adjustments were taken as of the 2010 Period. Property, Plant and EquipmentItems capitalized as property, plant and equipment, including improvements to existing facilities, are recorded at cost. Construction in process represents capital expenditures incurred for assets not yet placed in service.
TAMCONotes to Financial StatementsFor the Period December 1, 2009 to October 20, 2010, and the Years Ended November 30, 2009 and November 30, 2008
2010 2009 (Unaudited) Rebar $ 15,481 $ 11,899 Billets 5,520 5,202 Scrap metal 2,450 3,401 Supplies and spare parts 7,528 9,407 $ 30,979 $ 29,909
7

Depreciation is computed using the straight-line method based on estimated useful lives of the assets. Leasehold improvements are amortized over the shorter of the life of the improvement or the term of the lease. Useful lives are as follows:
Depreciation expense was $3,958,000, $5,021,000 and $4,984,000 for the 2010 Period and the fiscal years ended November 30, 2009 and November 30, 2008, respectively.
Prepaid expenses, tooling and other assetsThe Company emits nitrogen oxides ("NOx") as part of its manufacturing process. The Company is allocated a certain amount of NOx emissions credits each year at no cost. If this allocation is not adequate, the Company may purchase additional NOx emissions credits on the open market at prevailing prices. The Company purchases these intangible assets and records the net book value in prepaid expenses and tooling and other assets on the balance sheet. The assets are amortized using a straight-line method over the allocated emission period, which is typically one year. The total net book value of these assets as of October 20, 2010 and November 30, 2009 was $347,000 and $602,000, respectively. Amortization for these credits was $316,000, $342,000 and $394,000, respectively for the 2010 Period and the fiscal years ended November 30, 2009 and November 30, 2008.
During 2007, the Company purchased $5,796,000 in perpetual NOx credits. No credits were purchased in fiscal years 2008, 2009 and the 2010 Period. These assets are not available for use until July 2011 and have been recorded at cost within other assets on the balance sheet. The Company intends to amortize these credits over an estimated useful life of 15 years beginning in 2011.
The Company maintains marketable securities as collateral against a deferred compensation plan held for senior members of management. These securities are recorded as other assets on the balance sheet. As of October 20, 2010 and November 30, 2009, the value of the securities was $346,000 and $492,000, respectively.
Other Long-Term Liabilities Other long-term liabilities consist of the noncurrent portions of pension liabilities and workers’ compensation liabilities.
Concentration of Credit Risk and Major CustomersFinancial instruments that subject the Company to credit risk consist primarily of accounts receivable. The Company performs ongoing credit evaluations of its customers and provides for estimated credit losses. Two customers each accounted for greater than 10% of total net sales for the 2010 Period and the fiscal years ended November 30, 2009 and November 30, 2008. These two customers accounted for approximately 48%, 49% and 40% of total net sales for the 2010 Period and fiscal years ended November 30, 2009 and November 30, 2008, respectively.
Use of EstimatesThe preparation of financial statements in conformity with accounting principles generally accepted in the United States of America requires management to make estimates and assumptions that affect the reported amounts of assets and liabilities and disclosure of contingent assets and liabilities at the date of the financial statements and the reported amounts of revenues and expenses during the reporting period. Actual results could differ from those estimates.
TAMCONotes to Financial StatementsFor the Period December 1, 2009 to October 20, 2010, and the Years Ended November 30, 2009 and November 30, 2008
Processing facilities 20 to 25 yearsEquipment 3 to 25 years
8

ReclassificationCertain prior year amounts have been reclassified to conform to current year presentation. These changes had no significant impact on the previously reported balance sheet, statement of operations or statement of cash flows.
Recent Accounting Pronouncements In June 2006, the Financial Accounting Standards Board ("FASB") issued a new interpretation for the accounting of uncertainty in income taxes. The new interpretation prescribes detailed guidance for the financial statement recognition, measurement and disclosure of uncertain tax positions recognized in an enterprise’s financial statements in accordance with historical guidance on accounting for income taxes. Tax positions must meet a more-likely-than-not recognition threshold at the effective date to be recognized upon the adoption of this new interpretation and in subsequent periods. On December 30, 2008, the FASB deferred the adoption of this interpretation for most nonpublic enterprises to fiscal years beginning after December 15, 2008. The Company, pursuant to this deferral, has elected to defer its application until the fiscal year beginning December 1, 2009. The Company's policy for evaluating uncertain tax positions prior to the adoption of this new interpretation has been to provide for income taxes based on positions taken on the Company's tax return with valuation allowances established for uncertain positions based on the guidance established for the accounting for contingencies. The adoption of this new interpretation did not have a material effect on the Company's financial position, results of operations or cash flows.
In December 2008, the FASB issued a new standard amending previous guidance on employer's disclosures about pensions and other postretirement benefits specifically the disclosures over plan assets. The new standard includes a technical amendment to previous guidance that requires a nonpublic entity to disclose net periodic benefit cost for each annual period for which a statement of income is presented. The new standard is effective for fiscal years ending after December 15, 2009. Upon initial application, the provisions of this standard are not required for earlier periods that are presented for comparative purposes. Earlier application of these provisions is permitted. The adoption of this new interpretation did not have a material effect on the Company's financial position, results of operations or cash flows.
In fiscal year 2008, the Company adopted a new standard to account for financial assets and liabilities using fair value. The standard addresses how companies should measure fair value for recognition or disclosure purposes under generally accepted accounting principles. In accordance with the guidance on the effective date of the standard, the Company deferred the adoption of accounting for non-financial assets and liabilities using fair value on a nonrecurring basis until fiscal year 2009.
TAMCONotes to Financial StatementsFor the Period December 1, 2009 to October 20, 2010, and the Years Ended November 30, 2009 and November 30, 2008
3. Fair Value Measurements
9
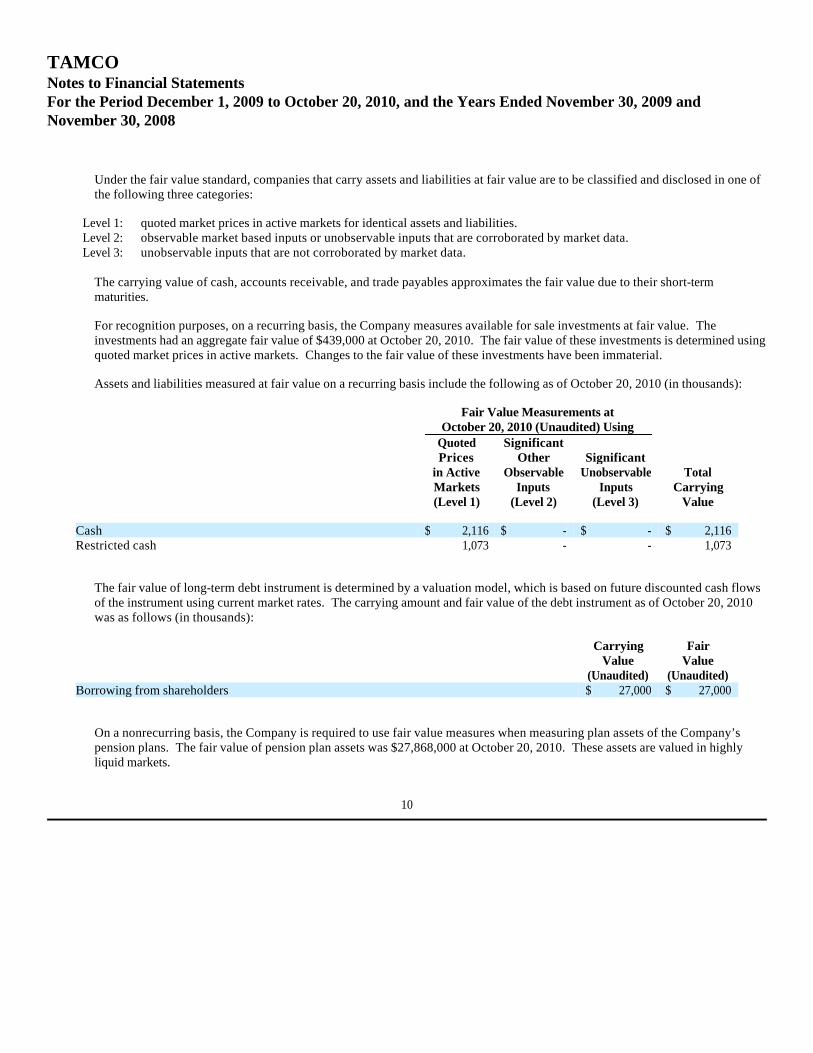
Under the fair value standard, companies that carry assets and liabilities at fair value are to be classified and disclosed in one of the following three categories:
The carrying value of cash, accounts receivable, and trade payables approximates the fair value due to their short-term maturities.
For recognition purposes, on a recurring basis, the Company measures available for sale investments at fair value. The investments had an aggregate fair value of $439,000 at October 20, 2010. The fair value of these investments is determined using quoted market prices in active markets. Changes to the fair value of these investments have been immaterial.
Assets and liabilities measured at fair value on a recurring basis include the following as of October 20, 2010 (in thousands):
The fair value of long-term debt instrument is determined by a valuation model, which is based on future discounted cash flows of the instrument using current market rates. The carrying amount and fair value of the debt instrument as of October 20, 2010 was as follows (in thousands):
On a nonrecurring basis, the Company is required to use fair value measures when measuring plan assets of the Company’s pension plans. The fair value of pension plan assets was $27,868,000 at October 20, 2010. These assets are valued in highly liquid markets.
TAMCONotes to Financial StatementsFor the Period December 1, 2009 to October 20, 2010, and the Years Ended November 30, 2009 and November 30, 2008
Level 1: quoted market prices in active markets for identical assets and liabilities.Level 2: observable market based inputs or unobservable inputs that are corroborated by market data.Level 3: unobservable inputs that are not corroborated by market data.
Fair Value Measurements at October 20, 2010 (Unaudited) Using
Quoted Significant Prices Other Significant in Active Observable Unobservable Total Markets Inputs Inputs Carrying (Level 1) (Level 2) (Level 3) Value Cash $ 2,116 $ - $ - $ 2,116 Restricted cash 1,073 - - 1,073
Carrying Fair Value Value (Unaudited) (Unaudited) Borrowing from shareholders $ 27,000 $ 27,000
10

Additionally, on a nonrecurring basis, the Company uses fair value measures when analyzing asset impairment. Long-lived tangible assets are reviewed for impairment whenever events or changes in circumstances indicate that the carrying amount of an asset may not be recoverable. If it is determined such indicators are present and the review indicates that the assets will not be fully recoverable, based on undiscounted estimated cash flows over the remaining amortization periods, their carrying values are reduced to estimated fair value. Estimated fair value is determined primarily using the anticipated cash flows discounted at a rate commensurate with the risk involved.
On February 13, 2009, the Company received a cash contribution from its shareholders Ameron, Mitsui and Tokyo Steel for $10,000,000, $5,000,000 and $5,000,000, respectively. The contributions are included in common stock as additional paid in capital on the balance sheet.
During 1992, the Company entered into a lease agreement with Ameron for certain land, buildings, structures and other improvements. The lease was originally a ten-year lease agreement and was renewable for a ten-year period. The lease was renewed on November 1, 2002 and is set to expire on October 31, 2012. The lease also contains a purchase option equal to the fair market value of the leased assets at the end of the initial lease term or at the end of the related renewal period. Total lease charges were $458,000, $516,000 and $511,000 for the 2010 Period and the fiscal years ended November 30, 2009 and November 20, 2008, respectively. The Company also reimbursed Ameron $39,000 for legal services in 2009.
In November 2004, Ameron began leasing four acres from the Company on a month-to-month basis. Total lease income was $63,000, $69,000 and $67,000 for the 2010 Period and the fiscal years ended November 30, 2009 and November 30, 2008, respectively.
The Company pays for certain utility costs and charges Ameron for Ameron's share. During the 2010 Period and the fiscal years ended November 30, 2009 and November 30, 2008, Ameron reimbursed the Company approximately $480,000, $508,000 and $607,000, respectively, for Ameron's share of such costs.
Amounts due from related parties (shareholders) to the Company total $86,000, $38,000 and $46,000 as of October 20, 2010, November 30, 2009 and November 30, 2008, respectively.
The Company had a loan balance payable to Ameron, Mitsui and Tokyo Steel of $13,500,000, $6,750,000 and $6,750,000 at October 20, 2010 and $15,000,000, $7,500,000 and $7,500,000, respectively, at November 30, 2009. Loan interest paid to Ameron, Mitsui and Tokyo Steel was $548,000, $274,000 and $274,000 for the 2010 Period and $69,000, $34,000 and $34,000 for fiscal year ending November 30, 2009.
The Company currently insures for workers' compensation through an affiliate of Mitsui.
TAMCONotes to Financial StatementsFor the Period December 1, 2009 to October 20, 2010, and the Years Ended November 30, 2009 and November 30, 2008
4. Shareholder Contribution and Related Party Transactions
11

On July 28, 2009, the Company entered into a business loan agreement (the "New Agreement") with its shareholders for a $40,000,000 credit facility. The interest rate on borrowings is based on the three-month LIBOR rate plus a 3.25% applicable margin. The New Agreement has a maturity of January 31, 2011 with an option, solely at the Company's request, to extend to January 31, 2012. All amounts under the New Agreement are collateralized by substantially all of the Company's assets. The New Agreement does not contain any other significant financial or non-financial covenant requirements.
As of October 20, 2010, total borrowings against the credit facility totaled $27,000,000 with an unused borrowing base of $13,000,000.
Additionally, at October 20, 2010 the Company had outstanding letters of credit of $965,000, collateralized by Treasury bills (Note 2), of $1,073,000.
Defined Benefit PlansThe Company has two defined benefit plans covering substantially all of its employees. The plan covering hourly employees provides pension benefits that are based on a flat-dollar benefit (as defined in the plan) per month based on years of service and a one-time payment of $4,500 to active employees upon retirement. The salaried plan is a step-rate plan, which provides for an amount equal to 1.35% of final average pay up to covered compensation, plus 1.95% of final average pay in excess of this covered compensation, times years of service (not to exceed 30 years).
The Company’s funding policy generally is to contribute annually at least the minimum amount that can be deducted for federal income tax purposes while ensuring that the requirements of applicable provisions and regulations are met. Contributions are intended to provide not only for benefits attributed to service to date, but also for those expected to be earned in the future.
The Company’s pension plans are accounted for based on various assumptions and discount rates as described below. The actuarial assumptions used could change in the near term due to changes in expected future trends and other factors, which, depending on the nature of the changes, could cause increases or decrease in the liabilities accrued.
During fiscal year 2007, the Company adopted the balance sheet recognition and disclosure provisions under the new accounting guidance for employer accounting over defined benefit pension plans and other postretirement plans. The new standard requires employers to recognize, on a prospective basis, the funded status of their defined benefit pension and other postretirement plans on their balance sheet. Additionally the standard requires the recognition, as a component of other comprehensive loss, net of tax, the gains or losses and prior service costs or credits that arise during the period but are not recognized as components of net periodic benefit costs.
TAMCONotes to Financial StatementsFor the Period December 1, 2009 to October 20, 2010, and the Years Ended November 30, 2009 and November 30, 2008
5. Business Loan Agreement
6. Pension and 401(k) Retirement Plans
12

The new standard also requires employers to measure plan assets and benefit obligations as of the date of the employer's fiscal year-end statement of financial position. The measurement date provisions of the new standard were adopted in fiscal year 2009. The adoption of the new measurement date provision caused a reduction to retained earnings of $277,000.
Included in accumulated other comprehensive income of approximately $16,305,000 ($9,690,000 net of tax) at November 30, 2009 are unrecognized actuarial losses of approximately $16,301,000 and prior service costs of approximately $4,000 that have not yet been recognized in net periodic pension cost. Of this amount, the Company expects to recognize approximately $1,322,000 ($786,000 net of tax) in net periodic pension cost during the fiscal year ended November 30, 2010.
Pension cost for the 2010 Period and the fiscal years ended November 30, 2009 and November 30, 2008 was approximately$1,525,000, $2,203,000 and $354,000, respectively, which includes amortization of prior service costs over periods ranging from 15 to 30 years.
Components of net periodic pension cost for the 2010 Period and the fiscal years ended November 30, 2009 and November 30, 2008 were as follows (in thousands):
TAMCONotes to Financial StatementsFor the Period December 1, 2009 to October 20, 2010, and the Years Ended November 30, 2009 and November 30, 2008
2010 2009 2008 Salaried Hourly Salaried Hourly Salaried Hourly (Unaudited) Components of net periodic pension cost Service cost $ 408 $ 166 $ 366 $ 210 $ 385 $ 388 Interest cost 1,019 1,009 1,023 1,082 890 955 Expected return on market-related value of plan assets (1,002) (1,086) (898) (922) (1,119) (1,217)Amortization of unrecognized prior service cost - 1 - 3 - 6 Curtailment - - - 469 - - Amortization of accumulated losses 636 684 366 504 22 44
Net periodic pension cost $ 1,061 $ 774 $ 857 $ 1,346 $ 178 $ 176
13

The projected benefit obligation was determined based on employee data as of November 30, 2010, November 30, 2009 and August 31, 2008.
The weighted average assumptions used to determine net periodic pension cost for the 2010 Period and the fiscal years ended November 30, 2009 and November 30, 2008, were as follows:
The assumed discount rate represents the market rate for long-term corporate high quality corporate bonds. The assumed expected rate of return on plan assets represents an estimate of long-term returns on an investment portfolio consisting of a mixture of equities and debt investments. When determining the expected return on plan assets, the Company considers long-term rates of return on asset classes (both historical and forecasted) in which the Company expects the pension funds to be invested.
TAMCONotes to Financial StatementsFor the Period December 1, 2009 to October 20, 2010, and the Years Ended November 30, 2009 and November 30, 2008
2010 2009 2008 Salaried Hourly Salaried Hourly Salaried Hourly (Unaudited) Discount rate 5.50% 5.50% 7.00% 7.00% 6.25% 6.25%Rate of increase in compensation levels 3.75% N/A 3.75% N/A 3.75% N/A Expected long-term rate of return on plan assets 8.50% 8.50% 8.50% 8.50% 8.50% 8.50%
14

Components of the change in projected benefit obligation, change in plan assets and funded status of the pension plans for the 2010 Period and the fiscal years ended November 30, 2009 and November 30, 2008 are as follows (in thousands):
The assumptions used to determine the projected benefit obligation for the 2010 Period and the fiscal years ended November 30, 2009 and November 30, 2008 are as follows:
TAMCONotes to Financial StatementsFor the Period December 1, 2009 to October 20, 2010, and the Years Ended November 30, 2009 and November 30, 2008
2010 2009 2008 Salaried Hourly Salaried Hourly Salaried Hourly (Unaudited) Change in projected benefit obligation Projected benefit obligation, beginning of year $ 18,955 $ 18,827 $ 14,547 $ 15,219 $ 14,627 $ 15,720 Service cost 408 166 468 296 385 388 Interest cost 1,019 1,009 1,270 1,342 890 955 Actuarial (gain) loss 905 2,004 4,007 2,584 (819) (978)Curtailment (gain) loss - - (425) 451 - - Benefits paid (851) (893) (912) (1,065) (536) (866)
Projected benefit obligation, end of year $ 20,436 $ 21,113 $ 18,955 $ 18,827 $ 14,547 $ 15,219 Change in plan assets Fair value of plan assets, beginning of year $ 11,535 $ 12,207 $ 12,153 $ 13,910 $ 13,557 $ 14,748 Actual return on plan assets 1,204 1,351 (945) (1,226) (1,168) (1,172)Employer contribution 1,235 2,080 1,240 588 300 1,200 Administrative expenses - - - - - - Benefits paid (851) (893) (913) (1,065) (536) (866)
Fair value of plan assets, end of year $ 13,123 $ 14,745 $ 11,535 $ 12,207 $ 12,153 $ 13,910 Funded status Deficiency of plan assets over projected benefit obligations $ (7,313) $ (6,368) $ (7,420) $ (6,620) $ (2,394) $ (1,309)
Funded status, end of year $ (7,313) $ (6,368) $ (7,420) $ (6,620) $ (2,394) $ (1,309)Amounts recognized on the balance sheet consist of Accrued pension liability $ (7,313) $ (6,368) $ (7,420) $ (6,620) $ (2,394) $ (1,309)Accumulated other comprehensive loss 8,471 8,955 8,404 7,901 3,138 3,482
Net amount recognized $ 1,158 $ 2,587 $ 984 $ 1,281 $ 744 $ 2,173 Accumulated benefit obligation $ 18,651 $ 21,102 $ 17,342 $ 17,214 $ 13,210 $ 15,195
15

The Company contributed approximately $3,315,000, $1,828,000 and $1,500,000 to the pension plans during the 2010 Period and the fiscal years ended November 30, 2009 and November 30, 2008, respectively.
In accordance with its investment strategy to obtain long-term growth, the Company's target allocations are established to maintain a mix of 60% to 70% equities, 25% to 35% debt securities, 2% to 8% real estate, and 0% to 5% other investments. The Company’s pension plan weighted-average asset allocations by asset category are as follows at October 20, 2010, November 30, 2009 and November 2008:
The Company’s pension plan assets are externally managed by investment managers who are selected by the Company’s Pension Committee. The Pension Committee selects investment managers using a total return investment approach whereby a mix of equity and debt security investments are used to maximize the long-term rate of return on plan assets. The intent of this strategy is to minimize plan expenses by outperforming plan liabilities over the long run. Risk tolerance is established through careful consideration of plan liabilities, plan funded status, and the Company’s financial condition. The investment portfolio contains a diversified blend of equity and debt security investments. Furthermore, equity investments are diversified across geography and market capitalization through investments in US large cap stocks, US mid cap, US small cap stocks, and international securities. Investment risk is measured and monitored on an ongoing basis through annual liability measures, periodic asset/liability studies, and semi-annual investment portfolio reviews.
TAMCONotes to Financial StatementsFor the Period December 1, 2009 to October 20, 2010, and the Years Ended November 30, 2009 and November 30, 2008
2010 2009 2008 Salaried Hourly Salaried Hourly Salaried Hourly (Unaudited) Discount rate 5.25% 5.25% 5.50% 5.50% 7.00% 7.00%Rate of increase in compensation levels 3.75% N/A 3.75% N/A 3.75% N/A
2010 2009 2008 Salaried Hourly Salaried Hourly Salaried Hourly (Unaudited) Equity securities 61% 61% 71% 71% 70% 68%Debt securities 36% 36% 27% 26% 28% 26%Real estate 3% 3% 2% 3% 2% 3%Other (cash equivalents) 0% 0% 0% 0% 0% 3% 100% 100% 100% 100% 100% 100%
16

The following benefit payments, which reflect expected future service, as appropriate, are expected to be paid over the next ten years as follows (in thousands):
Curtailments on defined benefit plansDuring October 2008, the Company reduced its hourly work force by approximately 100 employees. The reduction in labor force resulted in a corresponding reduction in the Company's future pension obligation and therefore was considered a curtailment to the Hourly Pension Plan. The Company accounted for the curtailment in the Hourly Pension Plan in accordance with the standard over employer accounting for settlements and curtailments of defined benefit pension plans and for termination benefits. As a result of the curtailment, the Company recognized a curtailment loss of $5,000 in the fiscal year ended November 30, 2008. Because of the timing of the curtailment and in accordance with the new accounting guidance for employer accounting over defined benefit pension plans and other postretirement plans, changes in the plan assets and pension liabilities arising from curtailment were measured at October 31, 2008 and recorded in the Company's fiscal year ended November 30, 2009 as follows (in thousands):
TAMCONotes to Financial StatementsFor the Period December 1, 2009 to October 20, 2010, and the Years Ended November 30, 2009 and November 30, 2008
Salaried Hourly Years ending November 30, (Unaudited) 2011 $ 950 $ 1,035 2012 1,015 1,068 2013 1,064 1,111 2014 1,107 1,151 2015 1,240 1,174 2016-2020 6,429 6,400
Before
Curtailment Effect of
Curtailment After
Curtailment Assets and obligations Projected benefit obligation $ 13,739 $ (22) $ 13,717 Plan assets at fair value 10,534 - 10,534
Funded status 3,205 (22) 3,183 Amounts in accumulated other comprehensive income Net loss (5,278) 22 (5,256)Prior service cost (26) 5 (21) (5,304) 27 (5,277)Accrued (prepaid) pension cost before SFAS No. 158 $ (2,099) $ 5 $ (2,094)
17
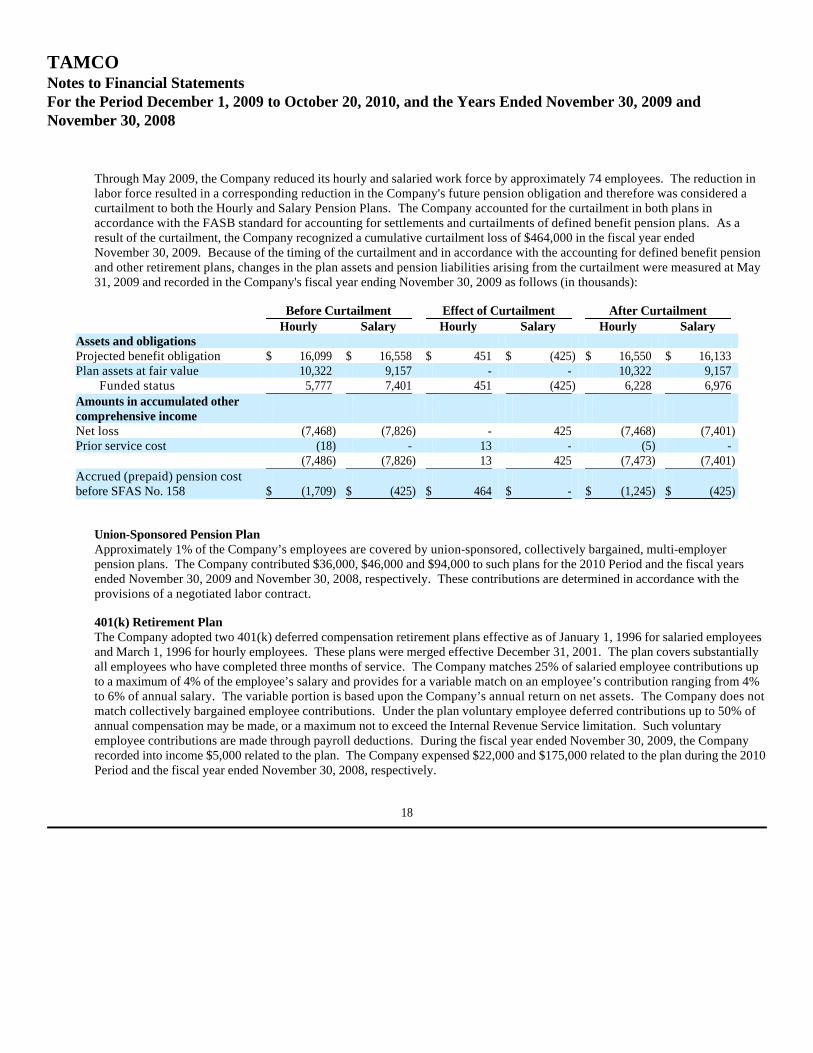
Through May 2009, the Company reduced its hourly and salaried work force by approximately 74 employees. The reduction in labor force resulted in a corresponding reduction in the Company's future pension obligation and therefore was considered a curtailment to both the Hourly and Salary Pension Plans. The Company accounted for the curtailment in both plans in accordance with the FASB standard for accounting for settlements and curtailments of defined benefit pension plans. As a result of the curtailment, the Company recognized a cumulative curtailment loss of $464,000 in the fiscal year ended November 30, 2009. Because of the timing of the curtailment and in accordance with the accounting for defined benefit pension and other retirement plans, changes in the plan assets and pension liabilities arising from the curtailment were measured at May 31, 2009 and recorded in the Company's fiscal year ending November 30, 2009 as follows (in thousands):
Union-Sponsored Pension Plan Approximately 1% of the Company’s employees are covered by union-sponsored, collectively bargained, multi-employer pension plans. The Company contributed $36,000, $46,000 and $94,000 to such plans for the 2010 Period and the fiscal years ended November 30, 2009 and November 30, 2008, respectively. These contributions are determined in accordance with the provisions of a negotiated labor contract.
401(k) Retirement PlanThe Company adopted two 401(k) deferred compensation retirement plans effective as of January 1, 1996 for salaried employees and March 1, 1996 for hourly employees. These plans were merged effective December 31, 2001. The plan covers substantially all employees who have completed three months of service. The Company matches 25% of salaried employee contributions up to a maximum of 4% of the employee’s salary and provides for a variable match on an employee’s contribution ranging from 4% to 6% of annual salary. The variable portion is based upon the Company’s annual return on net assets. The Company does not match collectively bargained employee contributions. Under the plan voluntary employee deferred contributions up to 50% of annual compensation may be made, or a maximum not to exceed the Internal Revenue Service limitation. Such voluntary employee contributions are made through payroll deductions. During the fiscal year ended November 30, 2009, the Company recorded into income $5,000 related to the plan. The Company expensed $22,000 and $175,000 related to the plan during the 2010 Period and the fiscal year ended November 30, 2008, respectively.
TAMCONotes to Financial StatementsFor the Period December 1, 2009 to October 20, 2010, and the Years Ended November 30, 2009 and November 30, 2008
Before Curtailment Effect of Curtailment After Curtailment Hourly Salary Hourly Salary Hourly Salary Assets and obligations Projected benefit obligation $ 16,099 $ 16,558 $ 451 $ (425) $ 16,550 $ 16,133 Plan assets at fair value 10,322 9,157 - - 10,322 9,157
Funded status 5,777 7,401 451 (425) 6,228 6,976 Amounts in accumulated other comprehensive income Net loss (7,468) (7,826) - 425 (7,468) (7,401)Prior service cost (18) - 13 - (5) - (7,486) (7,826) 13 425 (7,473) (7,401)Accrued (prepaid) pension cost before SFAS No. 158 $ (1,709) $ (425) $ 464 $ - $ (1,245) $ (425)
18

Deferred income taxes are recorded under the asset and liability method of accounting for income taxes, which requires the recognition of deferred income taxes, based upon the tax consequences of “temporary differences” by applying enacted statutory tax rates applicable to future years to differences between the financial statements carrying amounts and the tax basis of existing assets and liabilities.
The components of the (benefit from) provision for income taxes for the 2010 Period and the fiscal years ended November 30, 2009 and November 30, 2008 (in thousands):
The effective tax rate differs from the US federal statutory tax rate of 35% primarily due to state income taxes, net of federal benefits:
TAMCONotes to Financial StatementsFor the Period December 1, 2009 to October 20, 2010, and the Years Ended November 30, 2009 and November 30, 2008
7. Income Taxes
2010 2009 2008 (Unaudited) Current Federal $ (1,709) $ (8,226) $ 8,968 State 1 (55) 2,961 (1,708) (8,281) 11,929 Deferred Federal 454 1,844 2,302 State (374) (1,719) 369 80 125 2,671 $ (1,628) $ (8,156) $ 14,600
2010 2009 (Unaudited) Provision at the federal statutory rate 35.00% 35.00%State income taxes, net of federal benefit 5.71% 5.73%Meals and entertainment (0.11)% (0.06)%Fuel tax credit 0.00% 0.04%Lobbyist expense 0.00% (0.01)%Other (2.24)% (0.14)% 38.36% 40.56%
19

The components of the Company’s deferred tax assets (liabilities) as of October 20, 2010 and November 30, 2009 are as follows (in thousands):
The Company has a California net operating loss carryforward of $24,353,490 as of October 20, 2010. The net operating loss will expire in fiscal year 2031. If certain substantial changes in the Company's ownership occur, there would be an annual limitation on the amount of the carryforward that can be utilized.
The Company has a federal net operating loss of $5,239,355 as of October 20, 2010. The net operating loss is being carried back to be utilized in the November 30, 2008 period.
At October 20, 2010, November 30, 2009, and November 30 2008, the deferred tax provision reflected in other comprehensive income was $331,000, $4,019,000 and $1,081,000, respectively.
No valuation allowance has been established for deferred tax assets as the Company's management has determined that the deferred tax assets are fully realizable based upon forecasted profitability.
TAMCONotes to Financial StatementsFor the Period December 1, 2009 to October 20, 2010, and the Years Ended November 30, 2009 and November 30, 2008
2010 2009 (Unaudited) Deferred tax asset Reserve for contingencies $ 320 $ - Accrued liabilities 467 552 Reserve for inventories 137 424 Bad debts 198 189 Additional pension liability 6,757 7,116 Net Operating Loss 2,153 1,697 Other 5 149
Deferred tax asset 10,037 10,127 Deferred tax liability Depreciation (5,779) (6,272)State Tax (801) (702)Pension reserve (1,852) (1,114)
Deferred tax liability (8,432) (8,088) $ 1,605 $ 2,039
20
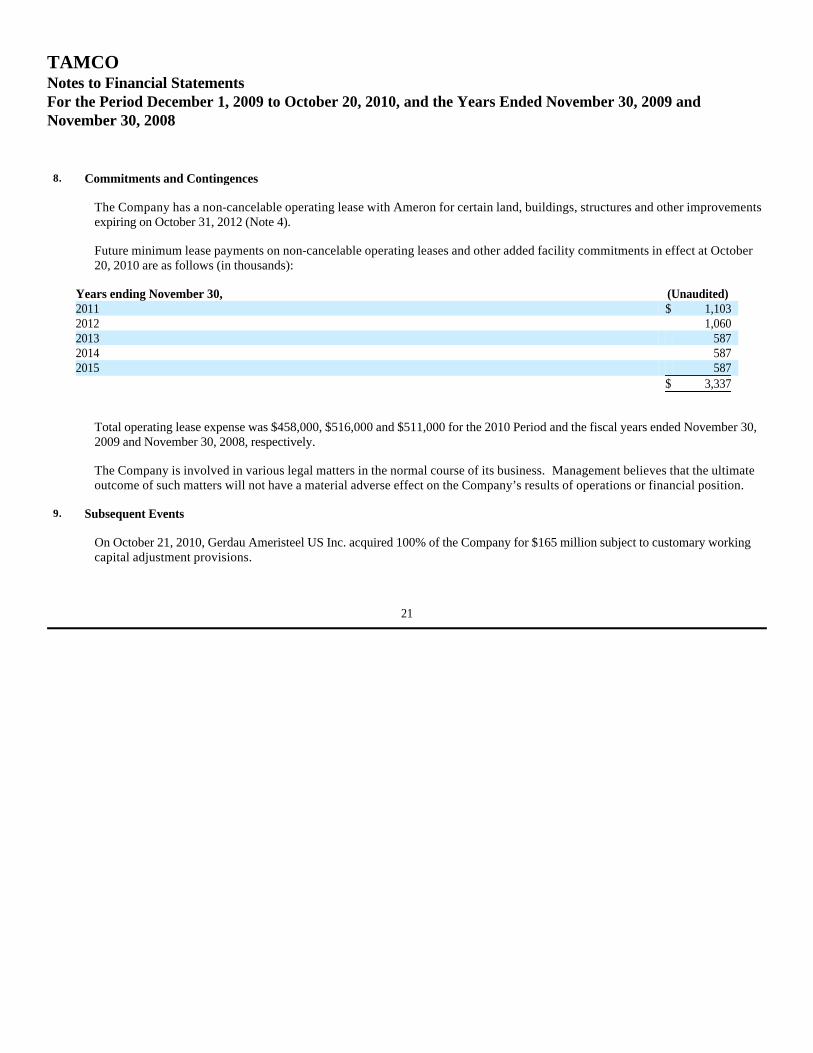
The Company has a non-cancelable operating lease with Ameron for certain land, buildings, structures and other improvements expiring on October 31, 2012 (Note 4).
Future minimum lease payments on non-cancelable operating leases and other added facility commitments in effect at October 20, 2010 are as follows (in thousands):
Total operating lease expense was $458,000, $516,000 and $511,000 for the 2010 Period and the fiscal years ended November 30, 2009 and November 30, 2008, respectively.
The Company is involved in various legal matters in the normal course of its business. Management believes that the ultimate outcome of such matters will not have a material adverse effect on the Company’s results of operations or financial position.
On October 21, 2010, Gerdau Ameristeel US Inc. acquired 100% of the Company for $165 million subject to customary working capital adjustment provisions.
TAMCONotes to Financial StatementsFor the Period December 1, 2009 to October 20, 2010, and the Years Ended November 30, 2009 and November 30, 2008
8. Commitments and Contingences
Years ending November 30, (Unaudited) 2011 $ 1,103 2012 1,060 2013 587 2014 587 2015 587 $ 3,337
9. Subsequent Events
21