ameriprise financial annual...
TRANSCRIPT

Ameriprise FinancialAnnual Report

GAAP 2015 2014 2013
Net revenues $12,170 $12,268 $11,199
Net income from continuing operations attributable to Ameriprise Financial
$1,562 $1,621 $1,337
Earnings from continuing operations per diluted share attributable to Ameriprise Financial common shareholders
$8.48 $8.31 $6.46
Return on equity from continuing operations excluding accumulated other comprehensive income, net of tax
21.4% 21.5% 17.2%
Shareholders’ equity $7,217 $8,124 $8,192
Shareholders’ equity excluding accumulated other comprehensive income, net of tax
$6,964 $7,462 $7,597
This Annual Report to Shareholders contains certain non-GAAP financial measures that management believes best reflect the underlying performance of our operations. Reconciliations of non-GAAP measures to the most directly comparable GAAP measure are on page 16.
2015 Ameriprise Financial Consolidated Highlights
(In millions, except per share and as noted)
Operating 2015 2014 2013
Net revenues $11,734 $11,591 $10,857
Earnings $1,716 $1,662 $1,460
Earnings per diluted share
$9.32 $8.52 $7.05
Return on equity excluding accumulated other comprehensive income, net of tax
24.3% 23.0% 19.7%
2015 2014 2013
Assets under management and administration (in billions) $777 $806 $771
Weighted average common shares outstanding — diluted 184.2 195.0 207.1
Cash dividends paid per common share $2.59 $2.26 $2.01
Common stock shares repurchased 13.9 11.8 17.8

(continued on next page)
Dear fellow shareholders,Ten years ago, Ameriprise Financial debuted as an independent public company with a new brand and a proud legacy of serving clients’ long-term financial needs. From the strength of our reputation to our growth in assets and increasingly global reach, Ameriprise has flourished. We are guided by our vision to become the most respected and referred financial services firm, our consistent long-term strategy and the client-centric values that define us.
JAMES M. CRACCHIOLOCHAIRMAN AND CHIEF EXECUTIVE OFFICER
Annual Report 2015 | 1

2 | Annual Report 2015
Operating earnings per diluted share
$5.59
$7.05
$8.52
$9.32
$5.17
Operating return on equity, ex. AOCI
Our strength comes from our people —individuals who care deeply about our clients and the company
I frequently hear from employees and advisors about their proudest moments from the past decade. Their comments are consistent: We serve clients the right way and for the long-term, earn trust and confidence, and make our communities better places. The moment raised most often is how we handled the 2008 financial crisis and stood by clients when other firms couldn’t — because we had our own financial plan, made good decisions, managed
conditions. Revenue growth was tempered as assets under management and administration declined due to higher equity market volatility, and client activity naturally slowed. Given that we operate in markets around the world, the strong U.S. dollar also impacted the value of non-dollar assets for U.S. reporting purposes. And we continued to manage the persistent pressure of extremely low interest rates. However, we offset these market headwinds because of our consistent and prudent expense management and strong financial foundation, which enable us to continue to invest for growth and return capital to shareholders at a differentiated level.
risk well and invested for the future. This is good perspective when considering how far Ameriprise has come in the last ten years, and as we reflect on our 2015 results.
In this, my annual letter to shareholders, I will update you on our progress and reinforce why I believe we are well-situated to navigate a more challenging operating environment and help our clients realize their financial goals today and in the future.
Delivering solid results
Ameriprise delivered solid business results in 2015, a period characterized by difficult market
For the year, operating earnings grew 3% to $1.7 billion and operating earnings per share increased 9% to a record $9.32. In fact, with the strength of our business model and capital management, we’re generating one of the highest returns in the industry — operating return on equity, excluding accumulated other comprehensive income grew to a record 24.3%, up 130 basis points from a year ago.
Few financial services companies have the ability to invest strongly in the business while delivering this level of return and maintaining significant capital flexibility. For the fifth consecutive year, we returned more than 100% of our operating
2015
2014
2013
2012
2011
16.2%
19.7%
23.0%
24.3%
16.0%
2015
2014
2013
2012
2011

Annual Report 2015 | 3
$681
$771
$806
$777
$631
$353
$409
$444
$447
$310
Assets under management and administration $ in billions
Ameriprise advisor client assets $ in billions
earnings to shareholders through increased dividends and ongoing share repurchases. In 2015, we committed $2.1 billion to dividends and share repurchases, including raising our quarterly dividend 16%. In fact, we’ve increased our dividend ten times since becoming a public company in 2005, all while maintaining a strong and prudent excess capital position.
Though the total shareholder return of Ameriprise Financial common stock declined during the year, over the past decade long-term shareholders have been rewarded with one of the best returns in financial services.
Advice & Wealth Management — satisfying clients’ needs, providing strong service and attracting high-quality advisors
Our Advice & Wealth Management business is one of the largest in the United States. The opportunity for Ameriprise is significant given the continued transition of baby boomers to retirement, younger generations accumulating wealth, and the acute need for personal financial advice. Ameriprise is strongly situated to provide more Americans with the financial advice and solutions they need to achieve their financial goals.
Key to our ability to grow and preserve shareholder value across market cycles is our steadfast focus on our clients — both retail and institutional. They are at the heart of our diversified business model. Our Advice & Wealth Management business, which is complemented by our Protection and Annuity businesses, serves client needs for a lifetime — from cash and liquidity to growing and preserving wealth and ultimately leaving a legacy. At the same time, our Asset Management business is large and diversified with a broad and high-performing product line to serve individual and institutional investors globally.
We’ve long held the position as the leading financial planning company in the United States. We have more certified financial planners than any other firm and are a leader in retirement planning.
Our actions define our reputation, and I’m pleased that Ameriprise is recognized as a trusted financial services firm. We earned the highest forgiveness rating for investment firms in an industry survey — the third consecutive year that we have earned the top spot.
We know our personal and comprehensive approach to serving clients is ideal for helping people confidently navigate not only a volatile
2015
2014
2013
2012
2011
2015
2014
2013
2012
2011

4 | Annual Report 2015
$396
$440
$496
$514
$384
Operating net revenue per advisor$ in thousands
market environment but also each life stage. Our client satisfaction remains very strong, and as we seek to serve more clients, we have an excellent story to tell.
Last fall, we launched our new Be Brilliant.SM
brand platform. Our advertising speaks directly to our target market — mass affluent and affluent consumers who value advice and the benefits of a personal relationship with a trusted advisor. It illustrates the everyday moments of brilliance clients can realize by working with the right advisor and the right firm. Ameriprise Financial brand awareness is near an all-time
understand actions they can implement, which leads to higher client satisfaction, more referrals and increased advisor productivity.
In 2015, we began to extend our Confident Retirement approach beyond those investing for and living in retirement to younger generations who are focused on building their wealth. These individuals — Generations X and Y — represent more than half of our target market and many are looking to work with an advisor who will meet with them personally. This reinforces the power of the human perspective and interaction when making saving, investing and retirement planning
high, and advisors and clients are inspired by our message. We are complementing our broadcast presence with a strong digital presence, and advisors are building on our Be Brilliant. brand platform in their local communities and online to engage prospects and clients at the grass-roots level.
The long-term, personal relationships our advisors establish with clients are an important differentiator for us. This is reinforced by our Confident Retirement® approach. It simplifies investing for retirement and helps clients
decisions. We believe this is a large opportunity for us, and we are introducing this expanded approach to our entire advisor force in 2016.
Our advisor force is experienced and motivated — a powerful distribution platform in the U.S. More than 9,700 dedicated financial advisors serve clients across the country. We have long maintained excellent advisor satisfaction and retention rates that reflect the leadership, capabilities and support we provide to help them serve clients well and grow their practices.
$125
$154
$175
$180
$103
Client assets in fee-based investment advisory accounts$ in billions
2015
2014
2013
2012
2011
2015
2014
2013
2012
2011
(continued on page 8)

Annual Report 2015 | 5
Be C urious.Be I n spired. Be There.
A pow erful n ew b ran d pl atform
Be F ree.
O ur Be Bril l ian t. campaig n l aun ched n ation al l y in S eptemb er w ith prime- time TV spots, hun dreds of thousan ds of view s on Y ouTub e, en g ag in g on l in e ads an d rel evan t con ten t. O ur Be Bril l ian t. b ran d pl atform is more than j ust a tag l in e — it il l ustrates the every day momen ts of b ril l ian ce cl ien ts can real iz e b y w ork in g w ith the rig ht advisor an d the right firm.

6 | Annual Report 2015
Celebrating a decade of progress
Oct. 3 First day of trading for AMP on the NYSE
Debuted Dream > Plan > Track >® client experience
Entered the FORTUNE® 500 at 297
Declined government bail-out
Announced philanthropic partnership:
Strategic acquisition:
$446
$344$429
$647
$466
$428
2005 2006 2007 2008 2009 2010
Introduced new brands:
Strategic acquisitions:
$ in billions
— Assets under management & administration (2005 and 2006 represent assets owned, managed and administered)
Advanced $700 million to meet clients’ immediate cash needs during fi nancial crisis
Began MORE WITHIN REACH® brand platform
Launched suite of Ameriprise and RiverSource advice-based solutions

Annual Report 2015 | 7
Rolled out new Ameriprise Brokerage platform
Introduced Ameriprise mobile app
Introduced new global asset management brand:
10-year anniversary of Ameriprise Financial
$631
$681
$771$806
$777
2011 2012 2013 2014 2015
120-year anniversary of our founding fi rm, Investors Syndicate
Launched Total View, a client account aggregation tool
®
Leaving a legacy
Preparing for the unexpected
Ensuring lifestyle
Covering essentials
Launched:
At Ameriprise Financial, we’ve been putting clients fi rst for more than a century. It’s hat our business as founded on meeting clients’ needs for a lifetime. We embrace this trust, and in 2005 we began a new chapter in our history by effectively executing one of the largest spin-offs in U.S. history, establishing Ameriprise as an independent, publicly traded company. Our independence unleashed our ability to reali e our full potential as a diversifi ed
fi nancial services leader. Over the past decade, we grew considerably and expanded our reach consistent with the principles that guide the advice e provide to retail clients
e had our o n fi nancial plan, managed risk well, maintained a long-term perspective and invested for the future. We have accomplished a tremendous amount in the past decade; we are proud of our service to our clients and are ell-positioned to continue our progress.
Launched Confi dent Retirement® approach
Logged 26+ million visits to ameriprise.com and record-breaking 2.2 million advisor websites visited
A decade as Ameriprise Financial, a 120-year legacy of putting clients fi rst
Repositioned Ameriprise Bank
Named one of the country’s most civic-minded companies

8 | Annual Report 2015
Through our investments in technology, advisors can share information with clients more easily and securely, and process business even faster. We continue to see good advisor uptake of the tools we’ve put in place, including eFile delivery, money movement systems and our paperless office.
We also enhanced our digital presence, including incorporating responsive design within ameriprise.com making it easy for clients to access their information from multiple types of devices. And e further strengthened our ealth
results in our Advice & Wealth Management business. In 2015, client net inflo s in fee-based investment advisory accounts were more than $11 billion and overall advisor productivity reached an all-time high of $514,000 in operating net revenue per advisor. Operating revenues and earnings were up nicely, even in a more challenging environment. And as we grow the business and navigate the environment, we continue to manage expenses prudently operating margin in Advice & Wealth Management increased 60 basis points last year to a competitive 1 .1 .
management platform, including enhancing our research function and adding to our growing managed account product line.
Advisors recognize the strength of the Ameriprise value proposition. In 2015, 34 experienced, highly productive advisors oined the firm bringing our three-year total to nearly 1,000 advisors hich has added thousands of ne client relationships and significant assets to the firm.
The combination of personal client relationships, broad capabilities and strong reputation translated into strong metrics and financial
Annuities and Protection — providing important solutions within our Confident Retirement® approach and strengthening asset persistency
From helping clients maintain their lifestyles in retirement to preparing for the unexpected and leaving a legacy e help protect assets and retirement income. For shareholders, our Annuity and Protection businesses are solid and stable
ith strong risk characteristics that generate attractive returns across market cycles and contribute to our ability to retain client assets over time.
O ur Confident Retirement® approach
Our exclusive Confident Retirement approach brings together our capabilities to help address a critical consumer need planning and preparing for retirement. It links together dreams, goals, recommendations, product solutions and action steps in a ay that’s easy for people to understand. Using the approach, clients ork ith their advisors to address four key retirement needs: covering essentials, ensuring lifestyle, preparing for the unexpected and leaving a legacy. ®
Leaving a legacy
Preparing for the unexpected
Ensuring lifestyle
Covering essentials

Annual Report 2015 | 9
In Annuities, we offer our products to Ameriprise clients — people we know well. As more clients move to retirement, the unique benefits annuities can provide — access to lifetime guaranteed income — are central to meeting client needs. Variable annuity sales have been steady with good receptivity to the launch of our SecureSource 4® and SecureSource 4 Plus® riders, as well as ongoing sales of variable annuities without living benefits. This has helped offset some of the pressure from lower equity markets on annuity account balances and the outflows from a closed book of variable annuities
We did experience higher life insurance claims in 2015 that increased expenses, but the business remains sound.
In Auto and Home, we continue to earn high policyholder satisfaction and have strong relationships with our affinity partners. We’ve built a direct business and are focused on providing an excellent experience for policyholders while strengthening the financial performance of the business. Like others in the industry, we experienced higher auto liability expenses during the year. In addition, we also
sold through third parties. In fixed annuities, the business is performing as expected, but new sales are low given persistently low interest rates.
Protecting our clients’ wealth is an important part of an advice relationship and the value our advisors provide. We’ve built a strong life and health insurance business and are generating steady sales of indexed universal life insurance — a solution that offers clients market upside for their cash value coupled with downside protection, which our clients are finding increasingly attractive given market volatility.
had increased expenses related to claims for prior periods and added to reserves. To address this underperformance, we added resources and are enhancing pricing, underwriting and claims management. While we are seeing some initial improvement, we recognize that it will take time for the benefits to be fully realized. We believe the actions we’re taking are the right ones to get the Auto and Home business back on track.

10 | Annual Report 2015
Asset Management — generating competitive fi nancial results and executing our strategy to gain market share and profi table fl ows
With $472 billion in client assets under management, we have an at-scale business with a diversifi ed base of assets and earnings. We’ve grown through steady investments in the business and strategic acquisitions to establish Ameriprise as a top 30 global asset manager.
As a result of our strategic, former-parent relationships formed as part of our acquisitions, we manage large pools of assets that form a stable base, understanding that over time we
It was also a year when active managers outperformed for investors. Our talented equity and fi xed income investment teams in the U.S., London and Singapore delivered strong investment performance across style and capitalization. Recently, FE Trustnet, a U.K. trade publication, named Columbia Threadneedle as the top-performing U.K. fund group over the past decade.
Maintaining a broad and high-performing product line is essential to meeting our clients’ needs and growing assets under management. In 2015, we took steps to streamline our retail product
will experience a level of outfl ows consistent with the structure of the books. At the same time, we’re growing our higher-fee, third-party businesses as we focus on serving more individual and institutional clients in key markets globally.
In 2015, we formally brought together the capabilities, resources and reach of Columbia Management and Threadneedle Investments and introduced a new brand for the business: Columbia Threadneedle Investments®. This was a logical and important next step in bringing our full capabilities to bear in the marketplace.
lines while also launching new products in the traditional, alternative, global and ESG product categories. This included launching the Columbia Global Unconstrained Fund, our fi rst Asian equity funds for the local market, the Columbia U.S. Social Bond Fund and the Threadneedle Ethical U.K. Equity Fund.
In U.S. retail, we signifi cantly enhanced product, marketing and sales leadership and the initial results are encouraging — in 2015 we increased gross sales and gained market share in key intermediary channels at a time when industry gross sales were down. However, this progress

Annual Report 2015 | 11
was muted from a fl ows perspective given continued outfl ows in the Acorn® Fund. The fund’s short-term performance has improved as a result of the enhancements we’ve made, including adding an experienced lead portfolio manager who came on board at the end of the year.
In European retail, we’re building on our leadership position in the U.K. where we are a top fi ve provider and expanding our presence in key markets on the continent, including Italy. In addition to new product launches, we added key talent to our European and U.K. equities
This includes third party institutional, where it was a challenging year for the industry given geopolitical and other market-driven pressures. While we were not immune to these pressures, the institutional business remains strong. We are generating good performance in equity, fi xed income and alternative strategies, as well as within our multi-asset solutions business. Our pipeline of new sales opportunities is strong. I believe that we have the capabilities, consultant relationships and deep understanding of institutional client needs to move the business to a tier one position.
teams. And while the market environment dampened retail fl ows in the region at mid-year, fl ows rebounded in the fourth quarter as market conditions improved.
Outside of our core growth markets of the U.S. and U.K./Europe, we’re targeting specifi c markets where we can serve more individual and institutional clients and gain share — Asia, the Middle East and other regions are attractive long-term opportunities for us as we expand our distribution capabilities and investors’ understanding of Columbia Threadneedle.
In terms of fi nancials, the decline in assets under management pressured revenues, but consistent with our expense discipline, we managed expenses well, delivered good earnings and generated a competitive adjusted net pretax operating margin of more than 38%.
We have built a strong and profi table asset management business — a long-term growth driver for Ameriprise. We are focused on generating profi table net infl ows, and I am confi dent that we have the right strategy and team in place to execute our long-term growth agenda.
54%37%
2%2%
5%
56%35%
2% 7%
Equity
Fixed income
Money market
Alternative
Hybrid and other
AUM by asset type
Retail
Institutional
Alternative
Owned Assets
AUM by client type
$472b $472b
Data as of Dec. 31, 2015

12 | Annual Report 2015
Evolving our business mix — differentiated by our capital strength, flexibility and return
Consistent with our long-term strategy, we are orchestrating a strategic transformation led by our more fee-based, less capital-demanding businesses of Advice & Wealth Management and Asset Management, complemented by the strength and stability of our Protection and Annuity businesses. It’s a powerful model anchored by a strong financial foundation. As we’ve grown, we have invested strongly in the business, returned significant capital to shareholders through share repurchases and dividends and maintained more than $2 billion in excess capital, ample liquidity and a high-quality, diversified investment portfolio.
As we’ve grown over the past 10 years, we’ve orchestrated a strategic transformation of Ameriprise to generate more of our operating earnings from our fee-based, less capital-demanding businesses — Advice & Wealth Management and Asset Management. In 2015, these two businesses accounted for 66% of our pretax operating earnings, and we believe as we grow our earnings over time we can increase their contribution to more than 70%.
Maintaining a strong financial foundation is essential to continue this transition. Our capital strength and quality reflects our commitment to our management principles of prudent risk management. And as we seek growth opportunities, Ameriprise has the capital flexibility, as well as management experience, to identify and integrate strategic acquisitions effectively to complement organic growth.
Dividends/share repurchases $ in millions
Dividends paid Common stock share repurchases
$1,6
74$4
74
$1,3
72
$435
$1,4
81
$411
$1,3
40
$314
$1,4
56
$212
2011 2012 2013 2014 2015 Advice & Wealth Management and Asset Management Annuities & Protection
(Data excludes Corporate & Other segment results)
2013: $2.2 billion
2011: $1.9 billion
2015: $2.5 billion
57%48% 66%
Percent of pretax operating earnings from our fee-based, less capital-demanding businesses

Annual Report 2015 | 13
Benefiting from our client-focused culture
At Ameriprise, our values guide our actions. We have leading employee engagement and some of the best employee satisfaction levels across industries. And our advisor satisfaction and retention rates have consistently remained strong.
Our commitment to strengthening communities is central to our culture. Our employees volunteer thousands of hours of their time and our charitable giving rates are among the highest in the industry. We strive to make a difference. Hunger relief is a particular focus, and since 2009 we have provided more than 58 million meals and 196,000 volunteer hours to Feeding America and other hunger-
relief organizations. We also proudly support the men and women in the U.S. military. In 2015, we were recognized as a Yellow Ribbon Company by the state of Minnesota, and for the second consecutive year, Ameriprise earned the Military Friendly designation for helping transitioning service members seeking employment.
I am grateful to work with people who care about the good we can do for others, both at work and in our communities.
Together with our people, in 2015 Ameriprise contributed:
11.5 millionmeals
173Grants
80,000hours
$13 milliondonated
Our Values:
Client Focused
Integrity Always
Excellence in all we do
Respect for individuals and for the communities in which we live and work

14 | Annual Report 2015
wealth, educating their children and preparing for retirement. Receiving high-quality, personalized financial advice is essential for all investors. That’s what we do.
Regulators are also considering how investors receive advice, and in the U.S., the Department of Labor will soon introduce a third standard of care for retirement accounts. The industry, including Ameriprise, offered extensive perspective and input to inform the rule.
As of this writing, we don’t know the specifics of the final rule, but we do know that it will affect investors and the industry. We built our business over decades to deliver appropriate advice to clients, and we have long served them under a fiduciary standard while maintaining a strong compliance culture and infrastructure. We have been preparing to manage the changes just as we have with other new regulations; we have the resources, infrastructure and capabilities to ensure strong implementation. Importantly, our leadership team is focused on helping guide
Looking ahead
Global equity market declines and heightened volatility at the start of 2016 have renewed investor fears and worries about the state of the global economy. We live in an increasingly interconnected world, and that is certainly true with markets, economies and central banks.
People around the world are confronting similar questions about risk and reward. They need well-informed advice and solutions when considering investment strategies to achieve their goals — growing and preserving their hard-earned
advisors and clients through these changes. We believe that our financial advice value proposition — satisfying clients’ needs for the long term — has been and will continue to be highly relevant and sought after.
Whether it is a difficult and volatile market environment, regulatory changes or other headwinds, I am confident that the strength of our client relationships and the flexibility of our business model will continue to differentiate Ameriprise.
Annual Report 2015 | 15
In closing, I share in my colleagues’ pride of our first decade as Ameriprise Financial and the more than a century of our legacy that we hold dear. We successfully executed one of the largest spin-offs in U.S. history; navigated the financial crisis better than most — without government support; stood behind and advocated for our clients; delivered appropriate products and solutions to help meet their long-term goals; and invested strongly in the business to deliver long-term value to our shareholders.
We strengthened Ameriprise as a U.S. wealth management leader; established the firm as a global asset manager; and differentiated our insurance and annuity businesses through their risk management and focused distribution.
Ameriprise is one of the strongest financial services firms in the industry with a legacy of performance across market cycles. The stage is set for the future, and I’m energized about the opportunity to realize our full potential.
Thank you
To our more than 20,000 employees and advisors, thank you for your hard work, energy and enthusiasm. We appreciate all you do to serve our clients every day.
To our clients, thank you for entrusting your assets to Ameriprise. We greatly value your business.
To my fellow members of the Ameriprise Financial board of directors, thank you for your counsel and support. We benefit from your perspective.
And finally, to you, our shareholders, thank you for your trust and confidence in Ameriprise. We will continue to do all we can to reward it.
Sincerely,
Jim Cracchiolo Chairman and Chief Executive Officer

16 | Annual Report 2015
This report is not a solicitation for any of the products or services mentioned. Investment products, including shares of mutual funds, are not FDIC or otherwise federally insured, are not deposits or obligations, or guaranteed by any financial institution, and involve investment risks, including possible loss of principal and fluctuation in value.
Past performance does not guarantee future results. Actual results may vary materially from our plans, estimates and beliefs. Please review carefully the discussion captioned “Forward-Looking Statements” contained in Part II, Item 7 in our Annual Report on Form 10-K for the year ended Dec. 31, 2015.
The following describes the principal subsidiaries that conduct the financial planning, asset accumulation and income, and protection businesses of Ameriprise Financial, Inc. Columbia Mutual Funds are distributed by Columbia Management Investment Distributors, Inc., member FINRA, and managed by Columbia Management Investment Advisers, LLC. Threadneedle International Limited is an FCA- and an SEC-registered investment adviser and an affiliate of Columbia Management Investment Advisers, LLC, based in the U.K. RiverSource insurance and annuity products are issued by RiverSource Life Insurance
Company and, in New York, by RiverSource Life Insurance Co. of New York, Albany, NY, and distributed by RiverSource Distributors, Inc. Auto and home insurance is underwritten by IDS Property Casualty Insurance Company, or in certain states, Ameriprise Insurance Company. Personal trust services are offered through Ameriprise National Trust Bank. Ameriprise Financial Services, Inc. Member FINRA and SIPC. Investment advisory services and products are made available through Ameriprise Financial Services, Inc., a registered investment adviser.
Columbia Threadneedle Investments is the global brand name of the Columbia and Threadneedle group of companies.
Sources: Financial planning leadership: Ameriprise helped pioneer the financial planning process more than 30 years ago. We have more CERTIFIED FINANCIAL PLANNERTM professionals than any other company in the U.S. based on data provided by the CFP Board of Standards, as of Dec. 31, 2015. Trust and forgiveness – temkinratings.com. Top 30 global asset manager – P&I/Towers Watson World 500 – Nov. 2, 2015, data as of year-end 2014. Top 5 provider in U.K. – Investment Association, retail AUM as of Sept. 2015.
($ in millions) 2015 2014 2013Total net revenues $12,170 $12,268 $11,199 Less: Revenues attributable to the CIEs 446 651 345 Less: Net realized investment gains 4 37 7
Less: Market impact on indexed universal life benefits 7 (11) (10) Less: Market impact of hedges on investments (21) – –Operating total net revenues $11,734 $11,591 $10,857
(1) Adjustments reflect the trailing twelve months’ sum of after-tax net realized investment gains/losses, net of deferred sales inducement costs (“DSIC”) and deferred acquisition costs (“DAC’) amortization, unearned revenue amortization and the reinsurance accrual; the market impact on variable annuity guaranteed benefits, net of hedges and the related DSIC and DAC amortization; the market impact on indexed universal life benefits, net of hedges and the related DAC amortization, unearned revenue amortization, and the reinsurance accrual; the market impact of hedges to offset interest rate changes on unrealized gains or losses for certain investments; and integration/restructuring charges. After-tax is calculated using the statutory tax rate of 35%.(2) Amounts represent the five-point average of quarter-end balances.(3) Operating return on equity excluding accumulated other comprehensive income/loss (AOCI) is calculated using the trailing twelve months of earnings excluding the after-tax net realized investment gains/losses, net of DSIC and DAC amortization, unearned revenue amortization and the reinsurance accrual; market impact on variable annuity guaranteed benefits, net of hedges and related DSIC and DAC amortization; the market impact on indexed universal life benefits, net of hedges and related DAC amortization, unearned revenue amortization, and the reinsurance accrual; the market impact of hedges to offset interest rate changes on unrealized gains or losses for certain investments; integration/restructuring charges; and discontinued operations in the numerator, and Ameriprise Financial shareholders’ equity excluding AOCI; the impact of consolidating investment entities; and the assets and liabilities held for sale using a five-point average of quarter-end equity in the denominator. After-tax is calculated using the statutory tax rate of 35%.
Per Diluted Share($ in millions, except per share amounts) 2015 2014 2013 2012 2011 2015 2014 2013 2012 2011Net income attributable to Ameriprise Financial $1,562 $1,619 $1,334 $1,029 $1,116 $8.48 $8.30 $6.44 $4.62 $4.53 Less: Income (loss) from discontinued operations, net of tax – (2) (3) (2) (60) – (0.01) (0.02) (0.01) (0.24)Net income from continuing operations attributable to Ameriprise Financial 1,562 1,621 1,337 1,031 1,176 8.48 8.31 6.46 4.63 4.77 Less: Net realized investment gains, net of tax(1) 3 24 5 5 4 0.02 0.12 0.02 0.02 0.01 Add: Integration/restructuring charges, net of tax(1) 3 – 9 46 62 0.02 – 0.04 0.21 0.25 Add: Market impact on variable annuity guaranteed benefits, net of tax(1) 139 61 111 173 40 0.75 0.31 0.53 0.77 0.16 Add: Market impact on indexed universal life benefits, net of tax(1) 1 4 8 – – 0.01 0.02 0.04 – – Add: Market impact of hedges on investments, net of tax(1) 14 – – – – 0.08 – – – – Operating earnings $1,716 $1,662 $1,460 $1,245 $1,274 $9.32 $8.52 $7.05 $5.59 $5.17 (1) Calculated using the statutory tax rate of 35%.
($ in millions) 2015Asset Management operating total net revenues $3,254
Less: Distribution pass through revenues 862 Less: Subadvisory and other pass through revenues 407
Asset Management adjusted operating revenues $1,985 Asset Management pretax operating earnings $761
Less: Operating net investment income 23 Add: Amortization of intangibles 27
Asset Management adjusted operating earnings $765 Asset Management adjusted net pretax operating margin
38.5%
($ in millions) 2015 2014 2013 2012 2011Net income attributable to Ameriprise Financial
$1,562 $1,619 $1,334 $1,029 $1,116
Less: Income (loss) from discontinued operations, net of tax
– (2) (3) (2) (60)
Net income from continuing operations attributable to Ameriprise Financial
1,562 1,621 1,337 1,031 1,176
Less: Adjustments(1) (154) (41) (123) (214) (98)Operating earnings $1,716 $1,662 $1,460 $1,245 $1,274
Ameriprise Financial shareholders’ equity(2) $7,808 $8,270 $8,582 $9,071 $9,169 Less: Assets and liabilities held for sale(2) – – – – 30 Less: Accumulated other comprehensive income (loss), net of tax "AOCI"(2) 516 734 821 1,001 701
Ameriprise Financial shareholders’ equity from continuing operations excluding AOCI(2)
7,292 7,536 7,761 8,070 8,438
Less: Equity impacts attributable to the consolidated investment entities(2) 216 311 333 397 478
Operating equity(2) $7,076 $7,225 $7,428 $7,673 $7,960
Return on equity from continuing operations, excluding AOCI
21.4% 21.5% 17.2% 12.8% 13.9%
Operating return on equity, excluding AOCI(3) 24.3% 23.0% 19.7% 16.2% 16.0%

Annual Report 2015 | 17
Ameriprise Financial, Inc.2015 Form 10-K


UNITED STATESSECURITIES AND EXCHANGE COMMISSION
WASHINGTON, D.C. 20549
FORM 10-K
� ANNUAL REPORT PURSUANT TO SECTION 13 OR 15(d) OF THE SECURITIESEXCHANGE ACT OF 1934
For the Fiscal Year Ended December 31, 2015
OR
� TRANSITION REPORT PURSUANT TO SECTION 13 OR 15(d) OF THE SECURITIESEXCHANGE ACT OF 1934
For the Transition Period from to
Commission File No. 1-32525
AMERIPRISE FINANCIAL, INC.(Exact name of registrant as specified in its charter)
Delaware 13-3180631
(State or other jurisdiction of incorporation or organization) (I.R.S. Employer Identification No.)
1099 Ameriprise Financial Center, Minneapolis, Minnesota 55474
(Address of principal executive offices) (Zip Code)
Registrant’s telephone number, including area code: (612) 671-3131
Securities registered pursuant to Section 12(b) of the Act:
Title of each class Name on each exchange on which registered
Common Stock (par value $.01 per share) The New York Stock Exchange, Inc.
Securities registered pursuant to Section 12(g) of the Act: None
Indicate by check mark if the registrant is a well-known seasoned issuer, as defined in Rule 405 of the Securities Act. Yes � No �
Indicate by check mark if the registrant is not required to file reports pursuant to Section 13 or Section 15(d) of theExchange Act. Yes � No �
Indicate by check mark whether the registrant (1) has filed all reports required to be filed by Section 13 or 15(d) of the SecuritiesExchange Act of 1934 during the preceding 12 months (or for such shorter period that the registrant was required to file such reports),and (2) has been subject to such filing requirements for the past 90 days. Yes � No �
Indicate by check mark whether the registrant has submitted electronically and posted on its corporate Web site, if any, every InteractiveData File required to be submitted and posted pursuant to Rule 405 of Regulation S-T (§ 232.405 of this chapter) during the preceding12 months (or for such shorter period that the registrant was required to submit and post such files). Yes � No �
Indicate by check mark if disclosure of delinquent filers pursuant to Item 405 of Regulation S-K is not contained herein, and will not becontained, to the best of registrant’s knowledge, in definitive proxy or information statements incorporated by reference in Part III of thisForm 10-K or any amendment to this Form 10-K. �
Indicate by check mark whether the registrant is a large accelerated filer, an accelerated filer, a non-accelerated filer, or a smallerreporting company. See the definitions of ‘‘large accelerated filer,’’ ‘‘accelerated filer’’ and ‘‘smaller reporting company’’ in Rule 12b-2 ofthe Exchange Act.
Large Accelerated Filer � Accelerated Filer �Non-Accelerated Filer (Do not check if a smaller reporting company) � Smaller reporting company �
Indicate by check mark whether the registrant is a shell company (as defined in Rule 12b-2 of the Exchange Act). Yes � No �
The aggregate market value, as of June 30, 2015, of voting shares held by non-affiliates of the registrant was approximately $22.3 billion.
Indicate the number of shares outstanding of each of the registrant’s classes of common stock, as of the latest practicable date.
Class Outstanding at February 12, 2016
Common Stock (par value $.01 per share) 168,970,804 shares
DOCUMENTS INCORPORATED BY REFERENCE
Part III: Portions of the registrant’s Proxy Statement to be filed with the Securities and Exchange Commission in connection with theAnnual Meeting of Shareholders to be held on April 27, 2016 (‘‘Proxy Statement’’).

AMERIPRISE FINANCIAL, INC.FORM 10-K
INDEXPART I.
Item 1. Business . . . . . . . . . . . . . . . . . . . . . . . . . . . . . . . . . . . . . . . . . . . . . . . . . . . . . . 1
Item 1A. Risk Factors . . . . . . . . . . . . . . . . . . . . . . . . . . . . . . . . . . . . . . . . . . . . . . . . . . . . 24
Item 1B. Unresolved Staff Comments . . . . . . . . . . . . . . . . . . . . . . . . . . . . . . . . . . . . . . . . . . 40
Item 2. Properties . . . . . . . . . . . . . . . . . . . . . . . . . . . . . . . . . . . . . . . . . . . . . . . . . . . . . 40
Item 3. Legal Proceedings . . . . . . . . . . . . . . . . . . . . . . . . . . . . . . . . . . . . . . . . . . . . . . . . 41
Item 4. Mine Safety Disclosures . . . . . . . . . . . . . . . . . . . . . . . . . . . . . . . . . . . . . . . . . . . . 41
PART II.
Item 5. Market for Registrant’s Common Equity, Related Stockholder Matters and Issuer Purchases ofEquity Securities . . . . . . . . . . . . . . . . . . . . . . . . . . . . . . . . . . . . . . . . . . . . . . . . . 42
Item 6. Selected Financial Data . . . . . . . . . . . . . . . . . . . . . . . . . . . . . . . . . . . . . . . . . . . . 43
Item 7. Management’s Discussion and Analysis of Financial Condition and Results of Operations . . . . 44
Item 7A. Quantitative and Qualitative Disclosures About Market Risk . . . . . . . . . . . . . . . . . . . . . . . 86
Item 8. Financial Statements and Supplementary Data . . . . . . . . . . . . . . . . . . . . . . . . . . . . . . 93
Item 9. Changes in and Disagreements With Accountants on Accounting and Financial Disclosure . . . 169
Item 9A. Controls and Procedures . . . . . . . . . . . . . . . . . . . . . . . . . . . . . . . . . . . . . . . . . . . . 169
Item 9B. Other Information . . . . . . . . . . . . . . . . . . . . . . . . . . . . . . . . . . . . . . . . . . . . . . . . 169
PART III.
Item 10. Directors, Executive Officers and Corporate Governance . . . . . . . . . . . . . . . . . . . . . . . . . 170
Item 11. Executive Compensation . . . . . . . . . . . . . . . . . . . . . . . . . . . . . . . . . . . . . . . . . . . . 172
Item 12. Security Ownership of Certain Beneficial Owners and Management and Related StockholderMatters . . . . . . . . . . . . . . . . . . . . . . . . . . . . . . . . . . . . . . . . . . . . . . . . . . . . . . 172
Item 13. Certain Relationships and Related Transactions, and Director Independence . . . . . . . . . . . . 173
Item 14. Principal Accountant Fees and Services . . . . . . . . . . . . . . . . . . . . . . . . . . . . . . . . . . . 173
PART IV.
Item 15. Exhibits and Financial Statement Schedules . . . . . . . . . . . . . . . . . . . . . . . . . . . . . . . . 173
Signatures . . . . . . . . . . . . . . . . . . . . . . . . . . . . . . . . . . . . . . . . . . . . . . . . . . . . . . . . . . . . 174
Schedule I — Condensed Financial Information of Registrant . . . . . . . . . . . . . . . . . . . . . . . . . . . . F- 2
Exhibit Index . . . . . . . . . . . . . . . . . . . . . . . . . . . . . . . . . . . . . . . . . . . . . . . . . . . . . . . . . . . E-1

PART I.
Item 1. Business
OverviewAmeriprise Financial, Inc. is a diversified financial services company with a more than 120 year history of providingfinancial solutions to help clients confidently achieve their financial objectives. Ameriprise is a holding companyincorporated in Delaware that primarily engages in business through its subsidiaries. Accordingly, references to‘‘Ameriprise,’’ ‘‘Ameriprise Financial,’’ the ‘‘Company,’’ ‘‘we,’’ ‘‘us,’’ and ‘‘our’’ may refer to Ameriprise Financial, Inc.exclusively, to our entire family of companies, or to one or more of our subsidiaries. Our headquarters is located at55 Ameriprise Financial Center, Minneapolis, Minnesota 55474. We also maintain executive offices in New York City.
We offer a broad range of products and services designed to achieve the financial objectives of individual and institutionalclients. We are America’s leader in financial planning and a leading global financial institution with $776.7 billion in assetsunder management and administration as of December 31, 2015. Our strategy is centered on helping our clientsconfidently achieve their goals by providing advice and by managing and protecting their assets and income. We utilize twogo-to-market approaches in carrying out this strategy: Wealth Management and Asset Management.
Our wealth management capabilities are centered on the long-term, personal relationships between our clients and ourfinancial advisors (our ‘‘advisors’’). Through our advisors, we offer financial planning, products and services designed to beused as solutions for our clients’ cash and liquidity, asset accumulation, income, protection, and estate and wealth transferneeds. Our focus on personal relationships, as demonstrated by our exclusive Confident Retirement� approach to financialplanning, allows us to address the evolving financial and retirement-related needs of our clients. Over the years we haveevolved our target market to move more upmarket as the needs of our clients have evolved. We currently view our primarytarget market segment as the mass affluent and affluent (which we define as households with investable assets of morethan $100,000), and increasingly those with $500,000 to $5,000,000 in investable assets. The financial productsolutions we offer through our advisors include both our own products and services and the products of other companies.Our advisor network is the primary channel through which we offer our own life and disability income insurance and annuityproducts and services.
Our network of approximately 9,800 advisors is the primary means through which we engage in our wealth managementactivities. We offer our advisors training, tools, leadership, marketing programs and other field and centralized support toassist them in serving their clients. We believe that our nationally recognized brand and practice vision, local marketing andfield support, integrated operating platform, practice expansion and succession opportunities and comprehensive set ofproducts and solutions constitute a compelling value proposition for financial advisors, as evidenced by our strong advisorretention rate and our ability to attract and retain experienced and productive advisors. We have and will continue to investin and develop capabilities and tools designed to maximize advisor productivity and client satisfaction.
We are in a compelling position to capitalize on significant demographic and market trends driving increased demand forfinancial advice and solutions. In the U.S., the ongoing transition of baby boomers into retirement, as well as recenteconomic and financial market crises, continues to drive demand for financial advice and solutions. In addition, theamount of investable assets held by mass affluent and affluent households, our target market, has grown and accounts forover half of U.S. investable assets. We believe our differentiated financial planning model, broad range of products andsolutions, and demonstrated financial strength throughout the economic and market uncertainty of recent years, will helpus capitalize on these trends.
Our asset management capabilities (represented by the Columbia Threadneedle Investments� brand) are increasingly globalin scale, with Columbia Management as the primary provider of products and services in the U.S. and Threadneedle as theprimary provider of products and services outside of the U.S. On March 30, 2015, we launched the new ColumbiaThreadneedle Investments brand, which represents the combined capabilities, resources and reach of both firms. While thegroup now operates under one brand, established investment teams, strategies and processes remain in place at bothfirms and did not change as a result of the new brand, nor did existing funds or client portfolios and mandates. Inaddition, there was no change to the corporate structure or regulated entities as a result of the new brand. We offer abroad spectrum of investment advice and products to individual, institutional and high-net worth investors. Theseinvestment products are primarily provided through third parties, though we also provide our asset management productsthrough our advisor channel. Our underlying asset management philosophy is based on delivering consistently strong,competitive investment performance. The quality and breadth of our asset management capabilities are demonstrated by116 of our mutual funds being rated as four- and five-star funds by Morningstar.
We are positioned to continue to grow our assets under management and to strengthen our asset management offeringsto existing and new clients. Our asset management capabilities are well positioned to address mature markets in the U.S.and Europe. We also have the capability to leverage existing strengths to effectively expand into new global and emerging
1

23FEB201602040848
markets. In the past few years, we have expanded beyond our traditional strengths in the U.S. and UK to gather assets inContinental Europe, Asia, Australia, the Middle East, South America and Africa. In addition, we continue to pursueopportunities to leverage the collective capabilities of our global asset management business in order to enhance ourcurrent range of investment solutions, to develop new solutions that are responsive to client demand in an increasinglycomplex marketplace and to maximize the distribution capabilities of our global business.
Financial markets and macroeconomic conditions have had and will continue to have a significant impact on our operatingand performance results. In addition, the business and regulatory environment in which we operate remains subject toelevated uncertainty and change. To succeed, we expect to continue focusing on our key strategic objectives. The successof these and other strategies may be affected by the factors discussed below in Item 1A of this Annual Report onForm 10-K — ‘‘Risk Factors’’, and other factors as discussed herein.
The financial results from the businesses underlying our go-to-market approaches are reflected in our five operatingsegments:
• Advice & Wealth Management;
• Asset Management;
• Annuities;
• Protection; and
• Corporate & Other.
As a diversified financial services firm, we believe our ability to gather assets across the enterprise is best measured by ourassets under management and administration metric. At December 31, 2015, we had $776.7 billion in assets undermanagement and administration compared to $806.2 billion as of December 31, 2014. For a more detailed discussion ofassets under management and administration see ‘‘Management’s Discussion and Analysis of Financial Condition andResults of Operations’’ included in Part II, Item 7 of this Annual Report on Form 10-K. The following chart shows ourcurrent business mix through the contributions of each segment to our pretax operating earnings (excluding Corporate &Other segment) as well as a historical comparison that reflects how we have executed on our strategy to shift our businessmix toward higher growth areas in Advice & Wealth Management and Asset Management.
4%49%
8%
39%
12%
2009 2015
66%
31%
35%
7%
27%
Annuities Protection Advice & WealthManagement
AssetManagement
2

7MAR200813502855
24FEB201622585442
23FEB201600065239
Our Principal BrandsWe utilize multiple brands for the products and services offered by our businesses. We believe that using distinct brands forthese products and services allows us to differentiate them in the marketplace.
We use the Ameriprise Financial� brand as our enterprise brand, as well asthe name of our advisor network and certain of our retail products andservices. The retail products and services that use the Ameriprise Financialbrand include those that we provide through our advisors (e.g., financialplanning, investment advisory accounts and retail brokerage services) andproducts and services that we market directly to consumers or throughaffinity groups (e.g., personal auto and home insurance).
On March 30, 2015, we launched a new global brand — the ColumbiaThreadneedle Investments� brand, which represents the combinedcapabilities, resources and reach of Columbia Management andThreadneedle. This new brand is intended to reinforce the strength of bothfirms in their established markets of the UK, Europe and the U.S. and tohelp us grow our presence in key markets including Asia Pacific, LatinAmerica, Africa and the Middle East.
We use our RiverSource� brand for our annuity and protection productsissued by the RiverSource Life companies, including our life and disabilityincome insurance products.
History and DevelopmentOur company has a more than 120 year history of providing financial solutions designed to help clients achieve theirfinancial objectives. Our earliest predecessor company, Investors Syndicate, was founded in 1894 to provide face-amountcertificates to consumers with a need for conservative investments. By 1937, Investors Syndicate had expanded itsproduct offerings through Federal Housing Authority mortgages, and later, mutual funds, by establishing Investors Mutual,one of the pioneers in the mutual fund industry. In 1949, Investors Syndicate was renamed Investors DiversifiedServices, Inc., or IDS. In 1957, IDS added life insurance products, and later, annuity products, through IDS Life InsuranceCompany (now known as ‘‘RiverSource Life Insurance Company’’). In 1972, IDS began to expand its network by deliveringinvestment products directly to clients of unaffiliated financial institutions. IDS also introduced its comprehensive financialplanning processes to clients, integrating the identification of client needs with the products and services to address thoseneeds in the 1970s, and it introduced fee-based planning in the 1980s.
In 1979, IDS became a wholly owned subsidiary of Alleghany Corporation pursuant to a merger. In 1983, our companywas formed as a Delaware corporation in connection with American Express’ acquisition of IDS Financial Services fromAlleghany Corporation in 1984. We changed our name to ‘‘American Express Financial Corporation’’ (‘‘AEFC’’) and beganmarketing our products and services under the American Express brand in 1994. To provide retail clients with a morecomprehensive set of products and services, we significantly expanded our offering of non-proprietary mutual funds in thelate 1990s. And in 2003, we acquired the business of Threadneedle Asset Management Holdings.
On September 30, 2005, American Express consummated a distribution of the shares of AEFC to American Expressshareholders, at which time we became an independent, publicly traded company and changed our name to ‘‘AmeripriseFinancial, Inc.’’ In 2008, we completed the acquisitions of H&R Block Financial Advisors, Inc. and J. & W. Seligman & Co.Incorporated. In 2010, we completed the acquisition of the long-term asset management business of ColumbiaManagement from Bank of America, which significantly enhanced the scale and performance of our retail mutual fund andinstitutional asset management businesses.
In 2006, we sold our large-scale retirement plan recordkeeping business to Wachovia Bank, N.A. (now Wells FargoBank, N.A.). We initiated the disposition of our institutional trust and custody business in 2008 to J.P. Morgan ChaseBank, N.A. and completed that restructuring in early 2009. In 2011, we completed the sale of Securities AmericaFinancial Corporation and its subsidiaries (‘‘Securities America’’) to Ladenburg Thalmann Financial Services, Inc.
In January 2013, we completed the conversion of our federal savings bank subsidiary, Ameriprise Bank, FSB (‘‘AmeripriseBank’’), to a limited powers national trust bank now known as Ameriprise National Trust Bank. In connection with thisconversion, we terminated deposit-taking and credit-originating activities of Ameriprise Bank.
3

23FEB201602043433
Our OrganizationThe following is a depiction of the organizational structure for our company, showing the primary subsidiaries through whichwe operate our businesses. The current legal entity names are provided for each subsidiary.
Ameriprise Financial, Inc.
Threadneedle AssetManagementHoldings Sàrl
ColumbiaManagement
Investment Advisers,LLC
AmeripriseInternational
HoldingsGmbH
AmeripriseAsset Management
Holdings GmbH
ColumbiaManagementInvestment
Distributors, Inc.
Ameriprise TrustCompany
Ameriprise NationalTrust Bank
AMPF HoldingCorporation
American EnterpriseInvestment
Services Inc.
AmeripriseFinancial
Services, Inc.
IDS PropertyCasualty Insurance
Company
AmeripriseCertificateCompany
RiverSourceDistributors, Inc.
RiverSourceLife Insurance
Company
RiverSource LifeInsurance Co. of
New York
J. & W. Seligman& Co. Incorporated
ColumbiaManagement
Investment ServicesCorp.
The following is a brief description of the business conducted by each subsidiary noted above.
Subsidiary Name Description of Business
Ameriprise International Holdings GmbH A holding company based in Switzerland for various companies engagedin our overseas business, including our Threadneedle group of companies(defined below)
Threadneedle Asset Management Holdings A holding company based in Luxembourg for the EMEA region group ofSarl companies that provide investment management products and services
Ameriprise Asset Management A holding company based in Switzerland for our non-EMEA region groupHoldings GmbH of companies that provide investment management products and
services. We refer to the group of companies in this entity andThreadneedle Asset Management Holdings Sarl as ‘‘Threadneedle’’ andThreadneedle is our primary provider of non-U.S. investment managementproducts and services.
Columbia Management Investment The investment adviser for the majority of funds in the ColumbiaAdvisers, LLC (‘‘Columbia Management’’) Management family of funds (‘‘Columbia Management funds’’) and to
U.S. and non-U.S. institutional accounts and private funds
J. & W. Seligman & Co. Incorporated A holding company for Columbia Management Investment(‘‘Seligman’’) Distributors, Inc. and certain other subsidiaries within our Asset
Management segment
Columbia Management Investment Broker-dealer subsidiary that serves as the principal underwriter andDistributors, Inc. distributor for Columbia Management funds
Columbia Management Investment A transfer agent that processes client transactions for ColumbiaServices Corp. Management funds and Ameriprise face-amount certificates
4

Subsidiary Name Description of Business
AMPF Holding Corporation A holding company for certain of our retail brokerage and advisorysubsidiaries, including AFSI (defined below) and AEIS (defined below)
American Enterprise Investment Our registered clearing broker-dealer subsidiary, brokerage transactions forServices Inc. (‘‘AEIS’’) accounts introduced by AFSI are executed, cleared and settled through
AEIS
Ameriprise Financial Services, Inc. (‘‘AFSI’’) A registered broker-dealer and registered investment adviser, and ourprimary financial planning and retail distribution subsidiary
RiverSource Distributors, Inc. (‘‘RiverSource A broker-dealer subsidiary that serves as the principal underwriter and/orDistributors’’) distributor for our RiverSource annuities and insurance products sold
through AFSI and third-party channels
RiverSource Life Insurance Company Conducts its insurance and annuity business in states other than New(‘‘RiverSource Life’’) York
RiverSource Life Insurance Co. of New Conducts its insurance and annuity businesses in the State of New York.York (‘‘RiverSource Life of NY’’) RiverSource Life of NY is a wholly owned subsidiary of RiverSource Life.
We refer to RiverSource Life and RiverSource Life of NY as the‘‘RiverSource Life companies.’’
IDS Property Casualty Insurance Company Provides personal auto, home and umbrella insurance products.(‘‘IDS Property Casualty’’ or ‘‘Ameriprise Ameriprise Insurance Company, a wholly owned subsidiary of IDS PropertyAuto & Home’’) Casualty, is also licensed to provide these products.
Ameriprise Certificate Company Issues a variety of face-amount certificates
Ameriprise Trust Company (‘‘ATC’’) Provides trust services to individuals and businesses
Ameriprise National Trust Bank (formerly Offers personal trust and related servicesAmeriprise Bank, FSB)
Our Segments — Advice & Wealth ManagementOur Advice & Wealth Management segment provides financial planning and advice, as well as full-service brokerageservices, primarily to retail clients through our financial advisors. These services are centered on long-term, personalrelationships between our advisors and our clients and focus on helping clients confidently achieve their financial goals.Our financial advisors provide a distinctive approach to financial planning and have access to a broad selection of bothaffiliated and non-affiliated products to help clients meet their financial needs.
A significant portion of revenues in this segment is fee-based, driven by the level of client assets, which is impacted byboth market movements and net asset flows. We also earn net investment income on owned assets primarily fromcertificate products. This segment earns revenues (distribution fees) for providing non-affiliated products and intersegmentrevenues (distribution fees) for providing our affiliated products and services to our retail clients. Intersegment expenses forthis segment include expenses for investment management services provided by our Asset Management segment. Allintersegment activity is eliminated in our consolidated results.
Our Financial Advisor PlatformWe provide financial planning, advice and brokerage services to clients through our nationwide financial advisor network.Advisors can choose to affiliate with us in two ways, with each affiliation offering different levels of support andcompensation. The affiliation options are:
• Employee Advisors. Under this affiliation, an advisor is an employee of our company and receives a higher levelof support, including leadership, training, office space and staff support. We pay compensation that iscompetitive with other employee advisor models, which is generally lower than that of our franchisee advisorsgiven the higher level of support we provide our employee advisors. Employee advisors are also employed inthe Ameriprise Advisor Center (‘‘AAC’’), our dedicated platform for remote-based sales and service toAmeriprise retail customers through a team model.
5

• Franchisee Advisors. Under this affiliation, an advisor is an independent contractor franchisee who affiliateswith our company and has the right to use the Ameriprise brand. We pay our franchisee advisors a higherpayout rate than our employee advisors as they are responsible for paying their own overhead, staffcompensation and other business expenses. In addition, our franchisee advisors pay a franchise associationfee and other fees in exchange for the support we offer and the right to use our brand name. The support weoffer to our franchisee advisors includes generalist and specialist leadership support, technology platforms andtools, training and marketing programs.
We are committed to providing our advisors with the resources and support necessary to manage and grow their practices.Our platform offers advisors the flexibility of operating on a commission-based brokerage basis as well as on a fee-basedadvisory basis. Advisors have access to training and materials reflecting our differentiated financial planning model andConfident Retirement planning approach, our nationally recognized brand and ‘‘Be Brilliant’’ advertising campaign, localmarketing support capabilities and our full range of proprietary and non-proprietary product solutions. Our demonstratedfinancial strength as well as our dedication to our clients also benefits our advisor practices. We expect to continue toinvest in the capabilities of and support provided to our advisor platform, with the goal of continuing to increase advisorproductivity and improving on our ability to attract and retain advisors.
Our nationwide advisor network consisted of approximately 9,800 advisors as of December 31, 2015, which includes over2,000 employee advisors and over 7,700 independent franchisees or employees or contractors of franchisees. Of theseadvisors, 55.3% had been with us for more than 10 years, with an average tenure of over 20 years. Among advisors whohave been with us for more than 10 years, we have a retention rate of over 95%. We believe our strong advisor retentionrate, as well as our ability to recruit experienced advisors, speaks to the value proposition we offer our advisors.
Our advisors can offer clients a diversified set of cash and liquidity management, asset accumulation, income, protection,and estate and wealth transfer products and services, as well as a broad selection of financial products from otherunaffiliated companies, as described below.
Brokerage and Investment Advisory Services
Individual and Family Financial ServicesOur personalized financial planning approach is designed to focus on all aspects of our clients’ finances. Afterunderstanding our clients’ needs, our advisors seek to identify solutions to address those needs across four cornerstones:cash and liabilities, investments, protection and taxes. We believe this approach helps our clients build a solid financialfoundation, persevere through difficult economies and challenging markets, and ultimately achieve their financial goals. Weoffer a broad array of products and services in each of these categories, including those carrying the Ameriprise Financial,Columbia Management or RiverSource name, as well as solutions offered by unaffiliated firms.
Our advisors deliver financial solutions to our advisory clients principally by building long-term personal relationshipsthrough financial planning that is responsive to clients’ evolving needs, in part through our exclusive Confident Retirementapproach, which involves a comprehensive assessment of retirement income sources and assets, a client’s plans andgoals for retirement and an analysis of what is needed to fund the four principal types of expenses and liabilitiesencountered during retirement: covering essentials, ensuring lifestyle, preparing for the unexpected and leaving a legacy.Once we identify a financial planning client’s objectives, we then recommend a solution set consisting of actions and offerproducts to address these objectives with clients accepting what they determine to be an appropriate range and level ofrisk. Our financial planning relationships with our clients are characterized by an ability to understand their specific needs,which enables us to help them meet those needs, achieve high overall client satisfaction and retention, hold moreproducts in their accounts and increase our assets under management.
Our financial planning clients pay a fee for the receipt of financial planning services. This fee is based on the complexity ofa client’s financial and life situation and his or her advisor’s experience. Some of our clients may elect to pay aconsolidated, asset-based advisory account advisory fee for financial planning and managed account services andadministration. If clients elect to implement their financial plan with our company, we and our advisors generally receive asales commission and/or sales load and other revenues for the products that they purchase from us. These commissions,sales loads and other revenues are separate from, and in addition to, the financial planning and advisory fees we and ouradvisors may receive.
Brokerage and Other Products and ServicesWe offer our retail and institutional clients a variety of brokerage and other investment products and services.
Our Ameriprise ONE� Financial Account is a single integrated financial management brokerage account that enables clientsto access a single cash account to fund a variety of financial transactions, including investments in mutual funds,individual securities, cash products and margin lending.
6

We provide securities execution and clearing services for our retail and institutional clients through our registered broker-dealer subsidiaries. Clients can use our online brokerage service to purchase and sell securities, obtain independentresearch and information about a wide variety of securities, and use self-directed asset allocation and other financialplanning tools. We offer exchange traded mutual funds, 529 plans, public non-exchange traded real estate investmenttrusts, structured notes, private equity and other alternative investments issued by unaffiliated companies. We also offertrading and portfolio strategy services across a number of fixed income categories, including treasuries, municipals,corporate, mortgage- and asset-backed securities on both a proprietary and agency basis.
Ameriprise may from time-to-time participate in syndicate offerings of closed-end funds and preferred securities.Syndicates are groups of investment banks and broker-dealers that jointly underwrite and distribute new security offeringsto the investing public. Our clients may purchase for their own account the closed-end fund shares and preferred stock ofsuch primary offerings in which we participate.
Fee-based Investment Advisory AccountsIn addition to purchases of mutual funds and other securities on a stand-alone basis, clients may purchase mutual fundsand other securities in connection with investment advisory fee-based account programs or services. We currently offerboth discretionary and non-discretionary investment advisory accounts. In a discretionary advisory account, we (or anunaffiliated investment advisor) choose the underlying investments in the portfolio on behalf of the client, whereas in anon-discretionary advisory account, clients choose the underlying investments in the portfolio based on their financialadvisor’s recommendation. Investors in discretionary and non-discretionary advisory accounts generally pay a fee (forinvestment advice and other services) based on the assets held in that account as well as any related fees or costsassociated with the underlying securities held in that account (e.g., underlying mutual fund operating expenses, investmentadvisory or related fees, Rule 12b-1 fees, etc.). A significant portion of our affiliated mutual fund sales are made throughadvisory accounts. Client assets held in affiliated mutual funds in an advisory account generally produce higher revenues tous than client assets held in affiliated mutual funds on a stand-alone basis because, as noted above, we receive aninvestment advisory fee based on the asset values of the assets held in an advisory account in addition to revenues wenormally receive for investment management and/or distribution of the funds included in the account.
We offer several types of investment advisory accounts. For example, we sponsor (i) Ameriprise Strategic Portfolio Service(‘‘SPS’’) Advantage, a non-discretionary investment advisory account service, (ii) SPS — Advisor, a discretionary investmentadvisory account service, (iii) Ameriprise Separate Accounts (a separately managed account (‘‘SMA’’) program), adiscretionary investment advisory account service through which clients invest in strategies managed by us or by affiliatedand non-affiliated investment managers, as well as a similar program on an accommodation basis where clients transferassets to us and do not maintain an investment management relationship with the manager of those assets, and(iv) Active Portfolios� investments, a discretionary mutual fund investment advisory account service that offers a number ofstrategic target allocations based on different risk profiles and tax sensitivities. Additionally, we offer discretionaryinvestment advisory account services through which clients may invest in SMAs, mutual funds and exchange traded funds.
Mutual Fund Offerings (Unaffiliated and Affiliated)In addition to the Columbia Management family of funds (discussed below in ‘‘Our Segments — Asset Management —Product and Service Offerings — U.S. Registered Funds’’), we offer mutual funds from nearly 300 unaffiliated mutual fundfamilies representing more than 3,500 mutual funds on our brokerage platform and as part of our investment advisoryaccounts to provide our clients a broad choice of investment products. In 2015, retail sales of other companies’ mutualfunds accounted for the majority of our total retail mutual fund sales.
Mutual fund families of other companies generally pay us a portion of the revenue generated from the sales of those fundsand from the ongoing management of fund assets attributable to our clients’ ownership of shares of those funds. Thesepayments enable us to offer a broad and robust product set to our clients and provide beneficial client services, tools andinfrastructure such as our website and online brokerage platform. We also receive administrative services fees from mostmutual funds sold through our advisor network.
Insurance and AnnuitiesWe offer insurance and annuities issued by the RiverSource Life companies (discussed below in ‘‘Business — OurSegments — Annuities’’ and in ‘‘Business — Our Segments — Protection’’). The RiverSource insurance solutions availableto our retail clients include variable, indexed and fixed universal life insurance, traditional term life insurance and disabilityincome insurance. RiverSource annuities include fixed annuities, as well as variable annuities that allow our clients tochoose from a number of underlying investment options, including volatility management options, and to purchase certainguaranteed benefit riders. In addition to RiverSource insurance and annuity products, our advisors offer products ofunaffiliated carriers on a limited basis, including variable annuities, life insurance and long term care insurance productsissued by a select number of unaffiliated insurance companies.
7

We receive a portion of the revenue generated from the sale of life and disability insurance policies of unaffiliatedinsurance companies. We are paid distribution fees on annuities sales of unaffiliated insurance companies based on aportion of the revenue generated from such sales and asset levels. These insurance companies may also pay us anadministrative service fee in connection with the sale of their products.
Banking ProductsWhile we have changed our banking operations and products in recent years (as discussed above in ‘‘Business — Historyand Development’’), we continue to offer consumer deposit and credit products through relationships with well-known andrespected financial services companies. In connection with the sale of the Ameriprise Bank credit card account portfolio toBarclays in 2012, we entered into a co-branding agreement with Barclays pursuant to which Barclays will continue to issueAmeriprise-branded credit cards. We also entered into a referral agreement with a third party to source mortgages andrelated products. Finally, the cash management features of the Ameriprise ONE Financial Account remain supported by ourbrokerage platform, and our clients continue to have access to a variety of other cash solutions, including AmeripriseCertificates, FDIC-insured Brokered CDs issued by third-party banks and deposits placed at third-party banks throughAmeriprise Insured Money Market Account (AIMMA) brokerage sweep accounts.
Ameriprise National Trust Bank continues to provide personal trust, custodial, agency and investment management servicesto help meet estate and wealth transfer needs of our advisors’ individual and corporate clients. The performance of suchpersonal trust services may involve our investment products. Ameriprise National Trust Bank generally receives an asset-based fee for investment advice and other services based on assets managed or custodied, as well as related fees andcosts.
Face-Amount CertificatesWe issue different types of face-amount certificates through Ameriprise Certificate Company, a wholly owned subsidiary ofAmeriprise Financial that is registered as an investment company under the Investment Company Act of 1940(‘‘Investment Company Act’’). Owners of our certificates invest funds and are entitled to receive at maturity or at the endof a stated term, a determinable amount of money equal to their aggregate investments in the certificate plus interest atrates we determine, less any withdrawals and early withdrawal penalties. For certain types of certificate products, the rateof interest is calculated in whole or in part based on any upward movement in a broad-based stock market index up to amaximum return, where the maximum is a fixed rate for a given term, but can be changed at our discretion for prospectiveterms. In 2015, we launched a new product that offers the ability to step up to a higher interest rate based upon thethen-current new purchase rate for the same term as the current certificate.
At December 31, 2015, we had $4.8 billion in total certificate reserves underlying our certificate products. Our earningsare based upon the difference, or ‘‘spread,’’ between the interest rates credited to certificate holders and the interestearned on the certificate assets invested. A portion of these earnings is used to compensate the various affiliated entitiesthat provide management, administrative and other services to our company for these products. In times of weakperformance in the equity markets, certificate sales are generally stronger. In 2015, advisors’ cash sales of our certificateswere $3.1 billion.
Financial Wellness ProgramWe provide workplace financial planning and educational programs to employees of major corporations, small businessesand school district employees through our Financial Wellness Program. In addition, we provide training and support tofinancial advisors working on-site at company locations to present educational seminars, conduct one-on-one meetingsand participate in client educational events. We also provide financial advice service offerings, such as financial planningand executive financial services, tailored to discrete employee segments.
Strategic Alliances and Other Marketing ArrangementsWe use strategic marketing alliances, local marketing programs for our advisors, and on-site workshops through ourBusiness Alliances group to generate new clients for our financial planning and other financial services. An importantaspect of our strategy is to create alliances that help us generate new financial services clients within our target marketsegment — the mass affluent and affluent, and increasingly those with $500,000 to $5,000,000 in investable assets. Ouralliance arrangements are generally for a limited duration of one to five years with an option to renew. Additionally, thesetypes of marketing arrangements typically provide that either party may terminate the agreements on short notice, usuallywithin sixty days. We compensate our alliance partners for providing opportunities to market to their clients.
Our Segments — Asset ManagementOur Asset Management segment provides investment management and advice and investment products to retail, high networth and institutional clients on a global scale through Columbia Threadneedle Investments, a new brand launched onMarch 30, 2015 that represents the combined capabilities, resources and reach of Columbia Management and
8

Threadneedle. Although the group now operates under one brand, established investment teams, strategies and processesin place at both firms will not change as a result of the new brand, nor will existing funds or client portfolios andmandates. Columbia Management and Threadneedle have been increasingly working together over the past few years toincrease the breadth and depth of their offerings to clients. Clients benefit from the depth of our combined research ideasand insights, trading techniques and portfolio strategies. In this regard, Columbia Management and Threadneedle areincreasingly leveraging their combined global investment management and research capabilities through research sharingand, for certain assets, through the use of sub-advisory and personnel sharing arrangements within the global assetmanagement business.
Columbia Management primarily provides products and services in the U.S., and Threadneedle primarily provides productsand services internationally. As noted above, we refer to the group of companies in Ameriprise Asset ManagementHoldings GmbH and Threadneedle Asset Management Holdings Sarl as ‘‘Threadneedle.’’ We provide U.S. retail clients withproducts through unaffiliated third-party financial institutions and through our Advice & Wealth Management segment, andwe provide institutional products and services through our institutional sales force. International retail products are primarilydistributed through third-party financial institutions and unaffiliated financial advisors. Retail products include U.S. mutualfunds and their non-U.S. equivalents, exchange-traded funds (‘‘ETFs’’) and variable product funds underlying insurance andannuity separate accounts. Institutional asset management services are designed to meet specific client objectives andmay involve a range of products, including those that focus on traditional asset classes, separately managed accounts,collateralized loan obligations (‘‘CLOs’’), hedge fund or alternative strategies, collective funds and property funds. CLOs,hedge fund or alternative strategies and certain private funds are often classified as alternative assets. Our AssetManagement segment also provides all intercompany asset management services for Ameriprise Financial subsidiaries. Thefees for such services are reflected within the Asset Management segment results through intersegment transfer pricing.Intersegment expenses for this segment include distribution expenses for services provided by our Advice & WealthManagement, Annuities and Protection segments. All intersegment activity is eliminated in our consolidated results.
Revenues in the Asset Management segment are primarily earned as fees based on managed asset balances, which areimpacted by market movements, net asset flows, asset allocation and product mix. We may also earn performance feesfrom certain accounts where investment performance meets or exceeds certain pre-identified targets. At December 31,2015, our Asset Management segment had $471.9 billion in managed assets worldwide.
Managed assets include managed external client assets and managed owned assets. Managed external client assetsinclude client assets for which we provide investment management services, such as the assets of the ColumbiaManagement and Threadneedle fund families and the assets of institutional clients. Managed external client assets alsoinclude assets managed by sub-advisers we select. Our external client assets are not reported on our ConsolidatedBalance Sheets, although certain investment funds marketed to investors may be consolidated at certain times. SeeNote 2 to our Consolidated Financial Statements included in Part II, Item 8 of this Annual Report on Form 10-K foradditional information on consolidation principles. Managed owned assets include certain assets on our ConsolidatedBalance Sheets (such as the assets of the general account and the variable product funds held in the separate accountsof our life insurance subsidiaries) for which the Asset Management segment provides management services and receivesmanagement fees. For additional details regarding our assets under management and administration, see ‘‘Management’sDiscussion and Analysis of Financial Condition and Results of Operations’’ included in Part II, Item 7 of this Annual Reporton Form 10-K.
Investment Management CapabilitiesThe investment management activities of Columbia Management and Threadneedle are conducted through investmentmanagement teams located in multiple locations, including Boston, Charlotte, Chicago, Kuala Lumpur, Los Angeles,London, Minneapolis, New York, Menlo Park, Portland and Singapore. Each investment management team may focus onparticular investment strategies, asset types, products and on services offered and distribution channels utilized.
Our investment management capabilities span a broad range of asset classes and investment styles. The portfoliosunderlying our product and service offerings may focus on providing solutions to investors through one or more U.S. ornon-U.S. equity, fixed income, bank loan, property, multi-asset allocation, alternative (including liquid alternatives) or otherasset classes, and the strategies utilized in the management of such portfolios varies depending on the needs and desiredoutcomes or objectives of individual and institutional investors. We continually assess these capabilities to help ensure ourability to provide product and services offerings that are responsive to the evolving needs of our clients.
Product and Service OfferingsWe offer a broad spectrum of investment management and advice and products to individual, institutional and high-networth investors. In an effort to address changing market conditions and the evolving needs of investors, we may from timeto time develop and offer new retail and institutional investment products with new and/or innovative investment strategies,including U.S. mutual funds and their non-U.S. equivalents, ETFs, separately managed accounts, hedge or alternativefunds and other private funds, CLOs, and collective funds. The following is an overview of our Asset Management offerings.
9

As discussed previously, Columbia Management and Threadneedle are increasingly leveraging their combined globalinvestment management and research capabilities to support and expand our product and service offerings.
U.S. Registered FundsWe provide investment advisory, distribution and other services to the Columbia Management family of funds. TheColumbia Management family of funds includes retail mutual funds, exchange-listed ETFs and U.S. closed-end funds andvariable product funds. Retail mutual funds are available through unaffiliated third-party financial institutions and theAmeriprise financial advisor network. Variable product funds are available as underlying investment options in variableannuity and variable life insurance products, including RiverSource products. The Columbia Management family of fundsincludes domestic and international equity funds, fixed income funds, cash management funds, balanced funds, specialtyfunds, absolute return and other alternative funds and asset allocation funds, including fund-of-funds, with a variety ofinvestment objectives. The Columbia Management family of funds also uses sub-advisers to diversify the product offeringsit makes available to investors on its variable product platform. At December 31, 2015, our U.S. retail mutual funds, ETFsand U.S. closed-end funds had total managed assets of $148.6 billion in 138 funds. The variable insurance trust funds(‘‘VIT Funds’’) that we manage had total managed assets at December 31, 2015 of $69.8 billion in 73 funds.
Columbia Management serves as investment manager for most of our U.S. mutual funds as well as our exchange-listedETFs and U.S. closed-end funds. Columbia Wanger Asset Management, LLC (‘‘Columbia Wanger’’), a subsidiary ofColumbia Management, also serves as investment manager for certain funds. In addition, several of our subsidiariesperform related services for the funds, including distribution, accounting, administrative and transfer agency services.Columbia Management and Columbia Wanger perform investment management services pursuant to contracts with theU.S. registered funds that are subject to renewal by the fund boards within two years after initial implementation, andthereafter, on an annual basis.
We earn management fees for managing the assets of the Columbia Management family of mutual funds based on theunderlying asset values. We also earn fees by providing related services to the Columbia Management family of funds.
Non-U.S. FundsThreadneedle offers a fund product range that includes different risk-return options across regions, markets, asset classesand product structures, which include retail funds that are similar to U.S. mutual funds. These funds are marketed tonon-U.S. persons and the majority are often referred to as UCITS products (Undertakings for Collective Investment inTransferable Securities). UCITS and other funds offered by Threadneedle typically are structured as Open Ended InvestmentCompanies (‘‘OEICs’’) in the UK, Societes d’Investissement A Capital Variable (‘‘SICAVs’’) in Luxembourg, as well as unittrusts. Threadneedle also sponsors, manages and offers UK property funds that invest in UK real estate. The majority ofthese offerings are registered in and distributed across multiple jurisdictions. At December 31, 2015, our non-U.S. retailfunds had total managed assets of $45.4 billion in 178 funds.
Threadneedle Asset Management Ltd. serves as investment manager for most of our non-U.S. fund products and earnsmanagement fees based on underlying asset values for managing the assets of these funds. Certain Threadneedle affiliatesalso earn fees by providing ancillary services to the funds. In addition, certain non-U.S. funds or portions of the portfoliosunderlying such funds may receive sub-advisory services, including services provided by both Columbia Managementpersonnel and other unaffiliated advisers.
Separately Managed AccountsWe provide investment management services to a range of clients globally, including pension, profit-sharing, employeesavings, sovereign wealth funds and endowment funds, accounts of large- and medium-sized businesses and governmentalclients, as well as the accounts of high-net-worth individuals and smaller institutional clients, including tax-exempt andnot-for-profit organizations. Our services include investment of funds on a discretionary or non-discretionary basis andrelated services including trading, cash management and reporting. We offer various fixed income, equity and alternativeinvestment strategies for our institutional clients with separately managed accounts. Columbia Management andThreadneedle distribute products of the other, including Threadneedle’s offering various investment strategies of ColumbiaManagement to non-U.S. clients and Columbia Management’s offering of certain investment strategies of Threadneedle toU.S. clients.
For our investment management services, we generally receive fees based on the market value of managed assetspursuant to contracts the client can terminate on short notice. Clients may also pay us fees based on the performance oftheir portfolio. At December 31, 2015, Columbia Management managed a total of $41.6 billion in assets under this rangeof services and Threadneedle managed $94.3 billion.
10

Management of Owned AssetsWe provide investment management services and recognize management fees for certain assets on our ConsolidatedBalance Sheets, such as the assets held in the general account of our RiverSource Life companies and assets held byAmeriprise Certificate Company. Our fixed income team manages the general account assets to produce a consolidatedand targeted rate of return on investments based on a certain level of risk. Our fixed income and equity teams alsomanage separate account assets. The Asset Management segment’s management of owned assets for AmeripriseFinancial subsidiaries is reviewed by the boards of directors and staff functions of the applicable subsidiaries consistentwith regulatory investment requirements. At December 31, 2015, the Asset Management segment managed $34.5 billionof owned assets.
Management of Collateralized Loan Obligations (‘‘CLOs’’)Columbia Management has a dedicated team of investment professionals who provide collateral management services tospecial purpose vehicles which primarily invest in syndicated bank loans and issue multiple tranches of securitiescollateralized by the assets of each pool to provide investors with various maturity and credit risk characteristics. Forcollateral management of CLOs, we earn fees based on the par value of assets and, in certain instances, we may alsoreceive performance-based fees. At December 31, 2015, we managed $7.1 billion of assets related to CLOs.
Private FundsWe also provide investment management and related services to private, pooled investment vehicles organized as limitedpartnerships, limited liability companies or foreign (non-U.S.) entities. These funds are currently exempt from registrationunder the Investment Company Act under either Section 3(c)(1) or Section 3(c)(7) or related interpretative relief and areorganized as U.S. and non-U.S. funds. These funds are subject to local regulation in the jurisdictions where they areformed or marketed. For investment management services, we generally receive fees based on the market value of assetsunder management, and we may also receive performance-based fees. As of December 31, 2015 we managed$465 million in private fund assets.
Ameriprise Trust Company — Collective Funds and Separately Managed AccountsCollective funds are investment funds sponsored by ATC (our Minnesota-chartered trust company) that are exempt fromregistration with the Securities and Exchange Commission (‘‘SEC’’) and offered to certain qualified institutional clients suchas retirement, pension and profit-sharing plans. Columbia Management currently serves as investment manager to ATCwith respect to a series of ATC collective funds covering a broad spectrum of investment strategies for which ATC serves astrustee. ATC receives fees for its investment management services to the collective funds and Columbia Managementreceives fees from ATC pursuant to an agreement with ATC for the investment management services provided by ColumbiaManagement. The fees payable to ATC and Columbia Management are generally based upon a percentage of assets undermanagement. In addition to its collective funds, ATC serves as investment manager to separately managed accounts forqualified institutional clients.
As of December 31, 2015, we managed $6.3 billion of ATC Funds and separate accounts for ATC clients. This amountdoes not include the Columbia Management family of funds held in other retirement plans because these assets areincluded under assets managed for institutional and retail clients and within the ‘‘Product and Service Offerings — U.S.Registered Funds’’ section above.
Sub-advised AccountsIn addition to providing sub-advisory services and investment support pursuant to personnel sharing arrangements on anintercompany basis within the global asset management business, we act as sub-adviser for certain U.S. and non-U.S.funds, private banking individually managed accounts, common trust funds and other portfolios sponsored or advised byother firms. As with our affiliated funds, we earn management fees for these sub-advisory services based on the underlyingasset value of the funds and accounts we sub-advise. As of December 31, 2015, we managed over $26.3 billion inassets in a sub-advisory capacity.
DistributionWe maintain distribution teams and capabilities that support the sales, marketing and support of the products and servicesof our global asset management business. These distribution activities are generally organized into two major categories:retail distribution and institutional/high net worth distribution.
Retail DistributionColumbia Management Investment Distributors, Inc. acts as the principal underwriter and distributor of our ColumbiaManagement family of funds. Pursuant to distribution agreements with the funds, we offer and sell fund shares on acontinuous basis and pay certain costs associated with the marketing and selling of shares. We earn commissions for
11

distributing the Columbia Management funds through sales charges (front-end or back-end loads) on certain classes ofshares and distribution (12b-1) and servicing-related fees based on a percentage of fund assets, and receive intersegmentallocation payments. This revenue is impacted by overall asset levels and mix of the funds.
Columbia Management fund shares are sold through both our Advice & Wealth Management segment and throughunaffiliated third-party financial intermediaries, including U.S. Trust and Bank of America from whom we acquired ColumbiaManagement in 2010. Fees and reimbursements paid to such intermediaries may vary based on sales, redemptions, assetvalues, asset allocation, product mix, and marketing and support activities provided by the intermediary. Intersegmentdistribution expenses for services provided by our Advice & Wealth Management Segment are eliminated in ourconsolidated results.
Threadneedle funds are sold primarily through financial intermediaries and institutions, including banks, life insurancecompanies, independent financial advisers, wealth managers and platforms offering a variety of investment products.Threadneedle also distributes to direct clients. Various Threadneedle affiliates serve as the distributors of these fundofferings and are authorized to engage in such activities in numerous countries across Europe, the Middle East, theAsia-Pacific region and Africa. Certain Threadneedle fund offerings, such as its UCITS products, may be distributed on across-border basis while others are distributed exclusively in local markets.
Institutional and High Net Worth DistributionWe offer separately managed account services and certain funds to high net worth clients and to a variety of institutionalclients, including pension plans, employee savings plans, foundations, sovereign wealth funds, endowments, corporations,banks, trusts, governmental entities, high-net-worth individuals and not-for-profit organizations. We provide investmentmanagement services for insurance companies, including our insurance subsidiaries. We also provide, primarily throughATC and one of our broker-dealer subsidiaries, a variety of services for our institutional clients that sponsor retirementplans. We have dedicated institutional and sub-advisory sales teams that market directly to such institutional clients. Weconcentrate on establishing strong relationships with institutional clients and leading global and national consultancy firmsacross North America, Europe, the Middle East, Asia and Australia.
Our Segments — AnnuitiesOur Annuities segment provides RiverSource variable and fixed annuity products to individual clients. Our solutions in thissegment and our Protection segment help us deliver on our Confident Retirement approach as well as provide certainproducts to unaffiliated advisors and financial institutions.
The RiverSource Life companies provide variable annuity products through our advisors, and our fixed annuity products aredistributed through both affiliated and unaffiliated advisors and financial institutions. These products are designed to helpindividuals address their asset accumulation and income goals. Revenues for our variable annuity products are primarilyearned as fees based on underlying account balances, which are impacted by both market movements and net assetflows. Revenues for our fixed annuity products are primarily earned as net investment income on assets supporting fixedaccount balances, with profitability significantly impacted by the spread between net investment income earned andinterest credited on the fixed account balances. We also earn net investment income on owned assets supporting reservesfor immediate annuities and for certain guaranteed benefits offered with variable annuities and on capital supporting thebusiness. Intersegment revenues for this segment reflect fees paid by our Asset Management segment for marketingsupport and other services provided in connection with the availability of VIT Funds under the variable annuity contracts.Intersegment expenses for this segment include distribution expenses for services provided by our Advice & WealthManagement segment, as well as expenses for investment management services provided by our Asset Managementsegment. All intersegment activity is eliminated in our consolidated results.
Our annuity products include deferred variable and fixed annuities as well as immediate annuities. The relative proportionbetween fixed and variable annuity sales is generally driven by the relative performance of the equity and fixed incomemarkets. Fixed sales are generally stronger when yields available in the fixed income markets are relatively high than whenyields are relatively low. Variable sales are generally stronger in times of superior performance in equity markets than intimes of weak performance in equity markets. The relative proportion between fixed and variable annuity sales is alsoinfluenced by product design and other factors. In addition to the revenues we generate on these products, we also receivefees charged on assets allocated to our separate accounts to cover administrative costs and a portion of the managementfees from the underlying investment accounts in which assets are invested, as discussed below under ‘‘Variable Annuities.’’Investment management performance is critical to the profitability of our RiverSource annuity business.
Variable AnnuitiesA variable annuity provides a contractholder with investment returns linked to underlying investment accounts of thecontractholder’s choice. These underlying investment options may include the VIT Funds previously discussed (see‘‘Business — Our Segments — Asset Management — Product and Service Offerings — U.S. Registered Funds,’’ above) as
12

well as variable portfolio funds of other companies. RiverSource variable annuity products in force offer a fixed accountinvestment option with guaranteed minimum interest crediting rates ranging up to 5% at December 31, 2015.
Contract purchasers can choose to add optional benefit provisions to their contracts to meet their needs, includingguaranteed minimum death benefit (‘‘GMDB’’), guaranteed minimum withdrawal benefit (‘‘GMWB’’) and guaranteedminimum accumulation benefit (‘‘GMAB’’) provisions. Approximately 99% of RiverSource Life’s overall variable annuityassets include either an optional or a standard GMDB provision and approximately 60% of RiverSource Life’s overallvariable annuity assets include a GMWB or GMAB provision. In general, these features can help protect contractholdersand beneficiaries from a shortfall in death or living benefits due to a decline in the value of their underlying investmentaccounts.
In 2015, we introduced the SecureSource 4� and SecureSource 4 Plus� living benefit riders, optional GMWB riders thatcan be added to new purchases of RiverSource variable annuities for a fee. These benefits ensure a specified withdrawalamount annually for life. These two riders offer clients a choice between lower fees and the opportunity for higherguaranteed income growth. Clients who purchase these benefits are invested in one or more of four of our PortfolioStabilizer (managed volatility) funds of funds that are designed to pursue total return while seeking to mitigate exposure tomarket volatility. Clients purchasing a new variable annuity with the optional GMAB living benefit rider are also invested inone or more of four of our Portfolio Stabilizer funds of funds. Columbia Management serves as investment advisor for thefunds of funds and all of the underlying funds in which the funds of funds invest.
Our Portfolio Navigator (traditional asset allocation) funds are available for our variable annuities, but as of April 2012,were no longer available for sale with a living benefit rider. Portfolio Navigator funds allow clients to allocate their contractvalue to one of five funds of funds, each of which invests in various underlying funds. Portfolio Navigator funds aredesigned to allow a contract purchaser to select investment options based on the purchaser’s investment time horizon, risktolerance and investment goals and tailor the performance of annuities and life insurance policies to their specific needsand keep investment allocations on track over time. Columbia Management serves as investment adviser for the funds offunds and all of the underlying funds in which the Portfolio Navigator funds of funds invest. Our Portfolio Stabilizer funds offunds offering is available for new sales of variable annuities sold without a living benefit rider.
Variable annuity clients who have not elected a living benefit rider may enroll in the Income Guide service, which aidsclients in managing income through an adaptive withdrawal strategy.
The general account assets of our life insurance subsidiaries support the contractual obligations under the guaranteedbenefit the Company offers (see ‘‘Business — Our Segments — Asset Management — Product and Service Offerings —Management of Owned Assets’’ above). As a result, we bear the risk that protracted under-performance of the financialmarkets could result in guaranteed benefit payments being higher than what current account values would support. Ourexposure to risk from guaranteed benefits generally will increase when equity markets decline. Similarly, our guaranteedbenefit reserves will generally increase when interest rates decline.
RiverSource variable annuities provide us with fee-based revenue in the form of mortality and expense risk fees, marketingsupport and administrative fees, fees charged for optional features elected by the contractholder, and other contractcharges. We receive marketing support payments from the VIT Funds underlying our variable annuity products as well asRule 12b-1 distribution and servicing-related fees from the VIT Funds and the underlying funds of other companies. Inaddition, we receive marketing support payments from other companies’ funds included as investment options in ourRiverSource variable annuity products.
Fixed AnnuitiesRiverSource fixed annuity products provide a contractholder with cash value that increases by a fixed or indexed interestrate. We periodically reset rates at our discretion subject to certain policy terms establishing guaranteed minimum interestcrediting rates. Our earnings from fixed annuities are based upon the spread between rates earned on assets purchasedwith fixed annuity deposits and the rates at which interest is credited to our RiverSource fixed annuity contracts.RiverSource fixed annuity contracts in force provide guaranteed minimum interest crediting rates ranging from 1% to 5% atDecember 31, 2015. New contracts issued provide guaranteed minimum interest rates in compliance with state laws. In2007, we discontinued new sales of equity indexed annuities, although we continue to service existing policies.
DistributionOur RiverSource Distributors subsidiary is a registered broker-dealer that serves both as the principal underwriter anddistributor of RiverSource variable and fixed annuities through AFSI and as the distributor of fixed annuities through third-party channels such as banks and broker-dealer networks. Our advisors are the largest distributors of RiverSource annuityproducts, although they can offer variable annuities from selected unaffiliated insurers as well.
13

In 2015, we had total cash sales for fixed annuity products through third-party channels of $9 million. As of December 31,2015, we had distribution agreements for RiverSource fixed annuity products in place with more than 118 third-partyfirms.
Liabilities and Reserves for AnnuitiesWe maintain adequate financial reserves to cover the risks associated with guaranteed benefit provisions added to variableannuity contracts in addition to liabilities arising from fixed and variable annuity base contracts. You can find a discussionof liabilities and reserves related to our annuity products in Part II, Item 7A of this Annual Report on Form 10-K —‘‘Quantitative and Qualitative Disclosures About Market Risk’’, as well as in Note 2, Note 10, Note 11 and Note 16 to ourConsolidated Financial Statements included in Part II, Item 8 of this Annual Report on Form 10-K.
Financial Strength RatingsOur insurance company subsidiaries that issue RiverSource annuity products receive ratings from independent ratingorganizations. Ratings are important to maintain public confidence in our insurance subsidiaries and our protection andannuity products. For a discussion of the financial strength ratings of our insurance company subsidiaries, see the ‘‘OurSegments — Protection — Financial Strength Ratings’’ section, below.
Our Segments — ProtectionOur Protection segment provides a variety of products to address the protection and risk management needs of our retailclients, including life, disability income and property casualty insurance. These products are designed to provide a lifetimeof solutions that allow clients to protect income, grow assets and give to loved ones or charity.
Life and disability income products are primarily provided through our advisors. Our property casualty products are soldprimarily through affinity relationships. We issue insurance policies through our life insurance subsidiaries and the PropertyCasualty companies (as defined below under ‘‘Ameriprise Auto & Home Insurance Products’’). The primary sources ofrevenues for this segment are premiums, fees and charges we receive to assume insurance-related risk. We earn netinvestment income on owned assets supporting insurance reserves and capital supporting the business. We also receivefees based on the level of assets supporting variable universal life separate account balances. This segment earnsintersegment revenues from fees paid by our Asset Management segment for marketing support and other servicesprovided in connection with the availability of VIT Funds under the variable universal life contracts. Intersegment expensesfor this segment include distribution expenses for services provided by our Advice & Wealth Management segment, as wellas expenses for investment management services provided by our Asset Management segment. All intersegment activity iseliminated in consolidation.
RiverSource Insurance ProductsThrough the RiverSource Life companies, we issue both variable and fixed (including indexed) universal life insurance,traditional life insurance and disability income insurance. Universal life insurance is a form of permanent life insurancecharacterized by flexible premiums, flexible death benefits and unbundled pricing factors (i.e., mortality, interest andexpenses). Variable universal life insurance combines the premium and death benefit flexibility of universal life withunderlying fund investment flexibility and the risks associated therewith. Traditional life insurance refers to whole and termlife insurance policies. While traditional life insurance typically pays a specified sum to a beneficiary upon death of theinsured for a fixed premium, we also offer a term life insurance product that will generally pay the death benefit in theform of a monthly income stream to a date specified at issue. We also offer a chronic care rider, AdvanceSource� rider, onour new permanent insurance products. This rider allows its policyholder to accelerate a portion of the life insurance deathbenefit in the event of a qualified chronic care need.
Our sales of RiverSource individual life insurance in 2015, as measured by scheduled annual premiums, lump sum andexcess premiums and single premiums, consisted of 83% fixed universal life, 14% variable universal life and 3% traditionallife. Our RiverSource Life companies issue only non-participating life insurance policies that do not pay dividends topolicyholders from the insurer’s earnings.
Assets supporting policy values associated with fixed account life insurance and annuity products, as well as those assetsassociated with fixed account investment options under variable insurance and annuity products (collectively referred to asthe ‘‘fixed accounts’’), are part of the RiverSource Life companies’ general accounts. Under fixed accounts, theRiverSource Life companies bear the investment risk. More information on the RiverSource Life companies’ generalaccounts is found under ‘‘Business — Our Segments — Asset Management — Product and Service Offerings —Management of Owned Assets’’ above.
14

Variable Universal Life InsuranceVariable universal life insurance provides life insurance coverage along with investment returns linked to underlyinginvestment accounts of the policyholder’s choice. Investment options may include VIT Funds discussed above, PortfolioNavigator funds of funds, as well as variable portfolio funds of other companies. Our Portfolio Stabilizer funds of fundsoffering is available for new sales of variable universal life insurance products. RiverSource variable universal life insuranceproducts in force offer a fixed account investment option with guaranteed minimum interest crediting rates ranging from2% to 4.5% at December 31, 2015.
Fixed Universal Life Insurance and Traditional Whole Life InsuranceFixed universal life and traditional whole life insurance policies do not subject the policyholder to the investment risksassociated with variable universal life insurance.
RiverSource fixed universal life insurance products provide life insurance coverage and cash value that increases by a fixedinterest rate. The rate is periodically reset at the discretion of the issuing company subject to certain policy terms relativeto minimum interest crediting rates. RiverSource fixed universal life insurance policies in force provide guaranteed minimuminterest crediting rates ranging from 2% to 5% at December 31, 2015. Certain fixed universal life policies offered byRiverSource Life provide secondary guarantee benefits. The secondary guarantee ensures that, subject to specifiedconditions, the policy will not terminate and will continue to provide a death benefit even if there is insufficient policy valueto cover the monthly deductions and charges.
RiverSource indexed universal life insurance (‘‘IUL’’) provides lifetime insurance protection and efficient asset growththrough index-linked interest crediting, without the impact of negative market returns. IUL is similar to universal lifeinsurance in that it provides life insurance coverage and cash value that increases as a result of credited interest as wellas a minimum guaranteed credited rate of interest. Unlike universal life insurance, the rate of credited interest above theminimum guarantee for funds allocated to the indexed account is linked to the performance of the S&P 500 Index�(subject to a cap and floor) or a blended multi-index account option comprised of the S&P 500 Index, the MSCI� EAFEIndex and MSCI EM Index.
In 2013, we introduced RiverSource TrioSourceSM universal life insurance with long term care benefits. The base feature ofthe RiverSource TrioSource product is a fixed universal life insurance policy that provides a guaranteed death benefit and aguaranteed return of premium.
In 2009, we discontinued new sales of traditional whole life insurance, however, we continue to service existing policies.Our in-force traditional whole life insurance policies combine a death benefit with a cash value that generally increasesgradually over a period of years.
Term Life InsuranceTerm life insurance provides a death benefit, but it does not build up cash value. The policyholder chooses the term ofcoverage with guaranteed premiums at the time of issue. During the chosen term, we cannot raise premium rates even ifclaims experience deteriorates. At the end of the chosen term, coverage may continue with higher premiums until themaximum age is attained, or the policy expires with no value. We also offer a term life insurance product that pays thedeath benefit in the form of a monthly income stream.
Disability Income InsuranceDisability income insurance provides monthly benefits to individuals who are unable to earn income either at theiroccupation at time of disability (‘‘own occupation’’) or at any suitable occupation (‘‘any occupation’’) for premiumpayments that are guaranteed not to change. Depending upon occupational and medical underwriting criteria, applicantsfor disability income insurance can choose ‘‘own occupation’’ and ‘‘any occupation’’ coverage for varying benefit periods. Insome states, applicants may also choose various benefit provisions to help them integrate individual disability incomeinsurance benefits with Social Security or similar benefit plans and to help them protect their disability income insurancebenefits from the risk of inflation.
Long Term Care InsuranceAs of December 31, 2002, the RiverSource Life companies discontinued underwriting stand-alone long term careinsurance. However, our advisors sell long term care insurance issued by other companies.
In 2004, the RiverSource Life companies began to file for approval to implement rate increases on most of their existingblocks of nursing home-only indemnity long term care insurance policies. Implementation of these rate increases began inearly 2005 and continues. We have received approval for some or all requested increases in the 50 states whereincreases have been requested, with an average approved cumulative rate increase of 113.3% of premium on all suchpolicies where an increase was requested.
15

In 2007, the RiverSource Life companies began to file for approval to implement rate increases on most of their existingblocks of comprehensive reimbursement long term care insurance policies. Implementation of these rate increases beganin late 2007 and continues. We have received approval for some or all requested increases in 48 states, with an averageapproved cumulative rate increase of 55% of premium on all such policies where an increase was requested.
We intend to seek additional rate increases with respect to these and other existing blocks of long term care insurancepolicies, subject to regulatory approval.
Ameriprise Auto & Home Insurance ProductsWe offer personal auto, home, umbrella and specialty insurance products through IDS Property Casualty and its subsidiary,Ameriprise Insurance Company (the ‘‘Property Casualty companies’’). We offer a range of coverage options under eachproduct category. Our Property Casualty companies provide personal auto, home and umbrella coverage to clients in43 states and the District of Columbia.
Distribution and Marketing ChannelsOur Property Casualty companies do not have field agents — we use co-branded direct marketing to sell our personalauto, home and umbrella insurance products through alliances with commercial institutions and affinity groups, and directlyto our clients and the general public. We also receive referrals through our financial advisor network. Our Property Casualtycompanies’ multi-year contract with Costco Wholesale Corporation and Costco’s affiliated insurance agency expires onMarch 31, 2020. Costco members represented 62% of all new policy sales of our Property Casualty companies in 2015.Among our other alliances, we market our property casualty products to customers of Ford Motor Credit Company and offerpersonal home insurance products to customers of the Progressive Group.
We offer RiverSource life insurance products almost exclusively through our advisors. Our advisors offer insurance productsissued predominantly by the RiverSource Life companies, though they may also offer insurance products of unaffiliatedcarriers, subject to certain qualifications.
ReinsuranceWe reinsure a portion of the insurance risks associated with our life, disability income, long term care and propertycasualty insurance products through reinsurance agreements with unaffiliated reinsurance companies. We use reinsuranceto limit losses, reduce exposure to large and catastrophic risks and provide additional capacity for future growth. Tomanage exposure to losses from reinsurer insolvencies, we evaluate the financial condition of reinsurers prior to enteringinto new reinsurance treaties and on a periodic basis during the terms of the treaties. Our insurance companies remainprimarily liable as the direct insurers on all risks reinsured.
We also reinsure a portion of the risks associated with our personal auto, home and umbrella insurance products throughreinsurance agreements with unaffiliated reinsurance companies.
See Note 7 to our Consolidated Financial Statements included in Part II, Item 8 of this Annual Report on Form 10-K foradditional information on reinsurance.
Liabilities and ReservesWe maintain adequate financial reserves to cover the insurance risks associated with the insurance products we issue.Generally, reserves represent estimates of the invested assets that our insurance companies need to hold to provideadequately for future benefits and expenses and applicable state insurance laws generally require us to assess and submitan opinion regarding the adequacy of our reserves on an annual basis. For a discussion of liabilities and reserves related toour insurance products, see Note 2 to our Consolidated Financial Statements included in Part II, Item 8 of this AnnualReport on Form 10-K.
Financial Strength RatingsIndependent rating organizations evaluate the financial soundness and claims-paying ability of insurance companiescontinually, and they base their ratings on a number of different factors, including market position in core products andmarket segments, risk-adjusted capitalization and the quality of the company’s investment portfolios. More specifically, theratings assigned are developed from an evaluation of a company’s balance sheet strength, operating performance andbusiness profile. Balance sheet strength reflects a company’s ability to meet its current and ongoing obligations to itscontractholders and policyholders and includes analysis of a company’s capital adequacy. The evaluation of operatingperformance centers on the stability and sustainability of a company’s sources of earnings. The business profile componentof the rating considers a company’s mix of business, market position and depth and experience of management.
16

Our insurance subsidiaries’ ratings are important to maintain public confidence in our protection and annuity products. Welist our ratings on our website at ir.ameriprise.com. For the most current ratings information, please see the individualrating agency’s website.
Our Segments — Corporate & OtherOur Corporate & Other segment consists of net investment income or loss on corporate level assets, including excesscapital held in our subsidiaries and other unallocated equity and other revenues as well as unallocated corporate expenses.
CompetitionWe operate in a highly competitive global industry. As a diversified financial services firm, we compete directly with a varietyof financial institutions, including registered investment advisors, securities brokers, asset managers, banks and insurancecompanies. Our competitors may have greater financial resources, broader and deeper distribution capabilities andproducts and services than we do. We compete directly with these for the provision of products and services to clients, aswell as for our financial advisors and investment management personnel. Certain of our competitors offer web-basedfinancial services and discount brokerage services, usually with lower levels of service, to individual clients.
Our Advice & Wealth Management segment competes with securities broker-dealers, independent broker-dealers, financialplanning firms, registered investment advisors, insurance companies and other financial institutions to attract and retainfinancial advisors and their clients. Competitive factors influencing our ability to attract and retain financial advisors includecompensation structures, brand recognition and reputation, product offerings and technology and service capabilities andsupport. Further, our financial advisors compete for clients with a range of other advisors, broker-dealers and directchannels, including wirehouses, regional broker-dealers, independent broker-dealers, insurers, banks, asset managers,registered investment advisers and direct distributors. Competitive factors influencing our ability to attract and retain clientsinclude quality of advice provided, price, reputation, advertising and brand recognition, product offerings and technologyand service quality.
Our Asset Management segment competes on a global basis to acquire and retain managed and administered assetsagainst a substantial number of firms, including those in the categories listed above. Such competitors may have achievedgreater economies of scale, offer a broader array of products and services, offer products with a stronger performancerecord and have greater distribution capabilities. Competitive factors influencing our performance in this industry includeinvestment performance, product offerings and innovation, product ratings, fee structures, advertising, service quality, brandrecognition and reputation and the ability to attract and retain investment personnel. The ability to create and maintain anddeepen relationships with distributors and clients also plays a significant role in our ability to acquire and retain managedand administered assets. The impact of these factors on our business may vary from country to country and certaincompetitors may have certain competitive advantage in certain jurisdictions.
Competitors of our Annuities and Protection segments consist of both stock and mutual insurance companies. Competitivefactors affecting the sale of annuity and insurance products (including property casualty insurance products) includedistribution capabilities, price, product features, hedging capability, investment performance, commission structure,perceived financial strength, claims-paying ratings, service, advertising, brand recognition and financial strength ratingsfrom rating agencies such as A.M. Best.
TechnologyWe have an integrated customer management system that serves as the hub of our technology platform. In addition, wehave specialized product engines that manage various accounts and over the years, we have updated our platform toinclude new product lines. We also use a proprietary suite of processes, methods and tools for our financial planningservices. We update our technological capabilities regularly to help maintain an adaptive platform design that aims toenhance the productivity of our advisors to allow for faster, lower-cost responses to emerging business opportunities,compliance requirements and marketplace trends.
We have developed and maintain a comprehensive business continuity plan that covers different business disruptions ofvarying severity and scope and addresses, among other things, the loss of a geographic area, building, staff, data systemsand/or telecommunications capabilities. We review and test our business continuity plan periodically and update it asnecessary. We require our key technology vendors and service providers to do the same.
Geographic PresenceFor years ended December 31, 2015, 2014 and 2013, approximately 89%, 89% and 89%, respectively, of our long-livedassets were located in the United States and approximately 91%, 89% and 92%, respectively, of our net revenues weregenerated in the United States. The majority of our foreign operations are conducted through Threadneedle, as describedin this Annual Report on Form 10-K under ‘‘Business — Our Segments — Asset Management.’’
17

EmployeesAt December 31, 2015, we had approximately 13,000 employees, including over 2,000 employee advisors (which doesnot include our franchisee advisors, who are not employees of our company, but includes advisors employed in the AAC).We are not subject to collective bargaining agreements, and we believe that our employee relations are strong.
Intellectual PropertyWe rely on a combination of contractual rights and copyright, trademark, patent and trade secret laws to establish andprotect our intellectual property. In the United States and other jurisdictions, we have established and registered or filedapplications to register certain service marks and brand names that we consider important to the marketing of ourproducts and services, including but not limited to Ameriprise Financial, Columbia Management, Threadneedle, RiverSourceand Columbia Threadneedle Investments. We have in the past and will in the future take action to establish and protectour intellectual property.
RegulationVirtually all aspects of our business, including the activities of the parent company and our subsidiaries, are subject tovarious federal, state and foreign laws and regulations. These laws and regulations provide broad regulatory, administrativeand enforcement powers to supervisory agencies and other bodies, including U.S. federal and state regulatory agencies,foreign government agencies or regulatory bodies and U.S. and foreign securities exchanges. The costs of complying withsuch laws and regulations can be significant, and the consequences for the failure to comply may include civil or criminalcharges, fines, censure, the suspension of individual employees, restrictions on or prohibitions from engaging in certainlines of business (or in certain states or countries), revocation of certain registrations as well as reputational damage. Wehave made and expect to continue to make significant investments in our compliance processes, enhancing policies,procedures and oversight to monitor our compliance with the numerous legal and regulatory requirements applicable to ourbusiness.
The regulatory environment in which our businesses operate remains subject to change and heightened regulatory scrutiny.Regulatory developments, both in and outside of the U.S., have resulted or are expected to result in greater regulatoryoversight and internal compliance obligations for firms across the financial services industry. In addition, we continue tosee enhanced legislative and regulatory interest regarding retirement investing, and we will continue to closely review andmonitor any legislative or regulatory proposals and changes. These legal and regulatory changes have impacted and may inthe future impact the manner in which we are regulated and the manner in which we operate and govern our businesses.
The discussion and overview set forth below provides a general framework of the laws and regulations impacting ourbusinesses. Certain of our subsidiaries may be subject to one or more elements of this regulatory framework depending onthe nature of their business, the products and services they provide and the geographic locations in which they operate. Tothe extent the discussion includes references to statutory and regulatory provisions, it is qualified in its entirety byreference to these statutory and regulatory provisions and is current only as of the date of this report.
18

24FEB201611142871
Our Regulators
Broker-dealers registered under the Exchange Act
➢ American Enterprise Investment Services, Inc. (clearing B-D)➢ Ameriprise Financial Services, Inc. (introducing B-D)➢ Columbia Management Investment Distributors, Inc. (limited purpose B-D)➢ RiverSource Distributors, Inc. (limited purpose B-D)
➢ Ameriprise Financial Services, Inc.➢ Columbia Management Investment Advisers, LLC➢ Columbia Wanger Asset Management, LLC➢ Threadneedle International Ltd (FCA is primary regulator)
➢ Ameriprise Trust Company➢ Ameriprise National Trust Bank
Entity
➢ RiverSouce Life Insurance Company➢ RiverSouce Life Insurance Co. of New York➢ Ameriprise Captive Insurance Company
➢ IDS Property Casualty Insurance Company:Ameriprise Auto & Home Insurance Agency, Inc.; andAmeriprise Insurance Company
Entity
➢ Threadneedle International Ltd➢ Threadneedle Pensions Ltd➢ Threadneedle Investments Singapore (Pte.) Ltd.➢ Threadneedle Asset Management Malaysia➢ Threadneedle Asset Management Holdings SARL➢ Threadneedle Portfolio Services Hong Kong Limited
EntityFinancial Conduct Authority (FCA)FCA; Prudential Regulatory AuthorityMonetary Authority of SingaporeSecurities Commission MalaysiaCommission de Surveillance du Secteur FinancierSecurities Futures Commission
RegulatorUnited KingdomUnited KingdomSingaporeMalaysiaLuxembourgHong Kong
Jurisdiction
Minnesota Department of Commerce is domiciliary regulatorNew York State Department of Financial Services is domiciliary regulatorState of Vermont Department of Banking, Insurance, Securities and Health CareAdministration is domiciliary regulatorWisconsin Office of the Commissioner of Insurance is domiciliary regulator
Regulator
Minnesota Dept of CommerceOffice of the Comptroller of theCurrency
Regulator
➢ Ameriprise Enterprise Investment Services, Inc.
➢ Ameriprise Financial Services, Inc.➢ Columbia Management Investment Advisers, LLC➢ Threadneedle International Ltd
➢ Ameriprise Certificate Company➢ In addition, we advise numerous ‘40 Act funds
EntityCommodity Futures TradingCommission (CFTC): Options ClearingCorporationCFTC; National Futures Association(NFA)CFTC; NFA
CFTC; NFA
Regulator
Investment Companies registered under theInvestment Company Act
Commodities, Futures and Options RegulatorsInvestment Advisers regulated by the SEC
Trust-related entities
Primary State Regulators for Insurance Companies/Agencies
Primary International Regulators
In addition to the regulators summarized above, we are also subject to regulation by self-regulatory organizations such asthe Financial Industry Regulatory Authority (‘‘FINRA’’), as well as various federal and state securities, insurance andfinancial regulators (such as regulatory agencies and bodies like the U.S. Department of Labor) in the U.S. and foreignjurisdictions where we do business.
Advice and Wealth Management RegulationCertain of our subsidiaries are registered with the SEC as broker-dealers under the Securities Exchange Act of 1934(‘‘Exchange Act’’) and with certain states, the District of Columbia and other U.S. territories. Our broker-dealer subsidiariesare also members of self-regulatory organizations, including FINRA, and are subject to the regulations of theseorganizations. The SEC and FINRA have stringent rules with respect to the net capital requirements and the marketing andtrading activities of broker-dealers. Our broker-dealer subsidiaries, as well as our financial advisors and other personnel,must obtain all required state and FINRA licenses and registrations to engage in the securities business and take certainsteps to maintain such registrations in good standing. SEC regulations also impose notice requirements and capitallimitations on the payment of dividends by a broker-dealer to a parent.
Our financial advisors are representatives of a dual registrant that is registered both as an investment adviser under theInvestment Advisers Act of 1940 (‘‘Advisers Act’’) and as a broker-dealer. Our advisors are subject to various regulationsthat impact how they operate their practices, including those related to supervision, sales methods, trading practices,record-keeping and financial reporting. In addition, because our independent contractor advisor platform is structured as afranchise system, we are also subject to Federal Trade Commission and state franchise requirements. As a result of the2010 Dodd-Frank Wall Street Reform and Consumer Protection Act (‘‘Dodd-Frank Act’’), our financial advisors may in thefuture become subject to a fiduciary standard of conduct in connection with their broker-dealer activities that is no lessstringent than what is currently applied to investment advisers under the Advisers Act. As noted earlier, we continue to seeenhanced legislative and regulatory interest regarding retirement investing and financial advisors, including proposed rules,regulatory priorities or general discussion around transparency and disclosure in advisor compensation and recruiting,identifying and managing conflicts of interest and enhanced data collection.
19

Our financial advisors service clients who hold assets in IRAs and employer-sponsored retirement plan accounts. TheEmployee Retirement Income Security Act of 1974, as amended (‘‘ERISA’’) and related provisions of the Internal RevenueCode impose duties on persons who are fiduciaries under ERISA, and prohibit certain transactions (absent an exemption)involving the assets of IRA and ERISA plan clients and certain transactions by the fiduciaries to the plans and IRAs. TheDepartment of Labor continues to pursue regulations that would significantly expand the scope of who is considered anERISA fiduciary and what activity constitutes acting as an ERISA fiduciary, while prohibiting certain additional types oftransactions conducted by persons who are considered fiduciaries. These regulations focus on conflicts of interest relatedto investment recommendations made by financial advisors or registered investment advisors to clients holding qualifiedaccounts and other types of ERISA clients as well as how financial advisors are able to discuss IRA rollovers. OnJanuary 29, 2016, after a lengthy public comment period and public hearing, the Department of Labor sent a proposedfiduciary rule to the Office of Management and Budget where the rule remains confidential until the final rule is publishedin the Federal Register. We continue to review and analyze the potential impact of the proposed regulations on our clientsand prospective clients, as well as the potential impact on our business. We cannot predict how any final regulations maydiffer from the proposed regulations.
Other agencies, exchanges and self-regulatory organizations of which certain of our broker-dealer subsidiaries aremembers, and subject to applicable rules and regulations of, include the Commodities Futures Trading Commission(‘‘CFTC’’) and the National Futures Association (‘‘NFA’’). Effective in August 2014, AFSI changed its registration from aFutures Commission Merchant to a Commodity Trading Advisor with the CFTC. In addition, certain subsidiaries may also beregistered as insurance agencies and subject to the regulations described in the following sections.
Asset Management RegulationIn the U.S., certain of our asset management subsidiaries are registered as investment advisers under the Advisers Act andsubject to regulation by the SEC. The Advisers Act imposes numerous obligations on registered investment advisers,including fiduciary duties, disclosure obligations and record-keeping, and operational and marketing restrictions. Ourregistered investment advisers may also be subject to certain obligations of the Investment Company Act based on theirstatus as investment advisers to investment companies that we, or third parties, sponsor. As an outcome of theDodd-Frank Act, Congress is considering whether to increase the frequency of examinations of SEC-registered investmentadvisers, including the authorization of one or more self-regulatory organizations to examine, subject to SEC oversight,SEC-registered investment advisers. On December 11, 2015, the SEC approved a proposed rule designed to enhanceinvestor protection by limiting the use of derivatives by mutual funds, closed-end funds and ETFs, and requiring new riskmanagement measures with respect to derivatives. Comments on the proposed rules are currently due at the end of thefirst quarter of 2016. We are currently assessing the impact of the proposed rule on our business, particularly with respectto mutual funds and ETFs managed by Columbia Management. The timing of the final rules and implementationtimeframes are currently unclear. As noted earlier, we continue to see enhanced legislative and regulatory interestregarding financial services in the U.S. through rules (and those yet to be implemented), regulatory priorities or generaldiscussion around risk retention requirements, expanded reporting requirements and transfer agent regulation.
Aspects of the regulation applicable to our Advice & Wealth Management segment also apply to our Asset Managementsegment. For example, Columbia Management Investment Distributors, Inc. is registered with the CFTC and NFA as well asregistered as a broker-dealer for the limited purpose of acting as the principal underwriter and distributor for ColumbiaManagement funds. Additionally, ERISA and the U.S. Department of Labor’s proposed fiduciary rule impacts our globalasset management business and we continue to review and analyze the potential impact of the proposed regulations onour clients and prospective clients, as well as the potential impact on our business across each of our business lines.
In connection with rules adopted by the CFTC, certain of our subsidiaries are registered with the CFTC as a commoditytrading advisor and commodity pool operator and are also members of the NFA. These rules adopted by the CFTCeliminated or limited previously available exemptions and exclusions from many CFTC requirements and impose additionalregistration and reporting requirements for operators of certain registered investment companies and certain other pooledvehicles that use or trade in futures, swaps and other derivatives that are subject to CFTC regulation.
Outside of the U.S., our Threadneedle group is primarily authorized to conduct its financial services business in the UKunder the Financial Services and Markets Act 2000. Threadneedle is currently regulated by the Financial Conduct Authority(‘‘FCA’’) and the Prudential Regulation Authority (‘‘PRA’’). FCA and PRA rules impose certain capital, operational andcompliance requirements and allow for disciplinary action in the event of noncompliance.
In addition to the above, certain of our asset management subsidiaries, such as Threadneedle’s UK and other Europeansubsidiaries, are required to comply with pan-European directives issued by the European Commission, as adopted by E.U.member states. For example, Threadneedle and certain of our other asset management subsidiaries are required to complywith the Markets in Financial Instruments Directive (‘‘MiFID’’), Alternative Investment Fund Managers Directive (‘‘AIFMD’’)and European Market Infrastructure Regulation (‘‘EMIR’’). These regulations are impacting the way we manage assets andplace, settle and report on trades for our clients, as well as market to clients and prospects. EMIR is the EU equivalent of
20

Title VII Dodd-Frank (and provides a framework for the regulation of over the counter and exchange-traded derivativemarkets). EMIR is being implemented in a number of phases that began in August 2012. Similar to the developments inthe U.S., we continue to see enhanced legislative and regulatory interest regarding financial services through internationalmarkets, including in the European Union where we have a substantial asset management business. These non-U.S. rules(and those yet to be implemented), proposed rules, regulatory priorities or general discussions may impact us directly orindirectly, including as a regulated entity or as a service provider to, or a business receiving services from or engaging intransactions with, regulated entities. For example, within the EU and the UK we have been, or will be, addressingSolvency II, UCITS V, Market Abuse Directive II, Markets in Financial Instruments Directive II and Market Abuse Regulation,Transparency Directive II, the FCA’s Asset Management Market Survey and Asset Management Senior Managers Regimeand a financial transaction tax.
In Singapore, our asset management subsidiary Threadneedle Investments Singapore (Pte.) Ltd. (‘‘ThreadneedleSingapore’’) is regulated by the Monetary Authority of Singapore (‘‘MAS’’) under the Securities and Futures Act.Threadneedle Singapore holds a capital markets services license with MAS, and employees of Threadneedle Singaporeengaging in regulated activities are also required to be licensed. MAS rules impose certain capital, operational andcompliance requirements and allow for disciplinary action in the event of noncompliance.
Threadneedle companies and activities are also subject to other local country regulations in Europe, Dubai, Hong Kong,Luxembourg, Malaysia, Taiwan, the U.S., South Korea, South America and Australia. Additionally, many of our subsidiaries,including Columbia Management, are also subject to foreign, state and local laws with respect to advisory services that areoffered and provided by these subsidiaries, including services provided to government pension plans.
Other Securities RegulationAmeriprise Certificate Company is regulated as an investment company under the Investment Company Act. As a registeredinvestment company, Ameriprise Certificate Company must observe certain governance, disclosure, record-keeping,operational and marketing requirements. Ameriprise Certificate Company pays dividends to the parent company and issubject to capital requirements under applicable law and understandings with the SEC and the Minnesota Department ofCommerce (Banking Division).
ATC is primarily regulated by the Minnesota Department of Commerce (Banking Division) and is subject to capital adequacyrequirements under Minnesota law. It may not accept deposits or make personal or commercial loans. As a provider ofproducts and services to tax-qualified retirement plans and IRAs, certain aspects of our business, including the activities ofour trust company, fall within the compliance oversight of the U.S. Departments of Labor and Treasury, particularlyregarding the enforcement of ERISA, and the tax reporting requirements applicable to such accounts. ATC, as well as ourinvestment adviser subsidiaries, may be subject to ERISA, and the regulations thereunder, insofar as they act as a‘‘fiduciary’’ under ERISA with respect to certain ERISA clients.
Protection and Annuities RegulationOur insurance subsidiaries are subject to supervision and regulation by states and other territories where they aredomiciled or otherwise licensed to do business. The primary purpose of this regulation and supervision is to protect theinterests of contractholders and policyholders. In general, state insurance laws and regulations govern standards ofsolvency, capital requirements, the licensing of insurers and their agents, premium rates, policy forms, the nature of andlimitations on investments, periodic reporting requirements and other matters. In addition, state regulators conduct periodicexaminations into insurer market conduct and compliance with insurance and securities laws. The Minnesota Departmentof Commerce, the Wisconsin Office of the Commissioner of Insurance, and the New York State Department of FinancialServices (the ‘‘Domiciliary Regulators’’) regulate certain of the RiverSource Life companies, and the Property Casualtycompanies depending on each company’s state of domicile. In addition to being regulated by their Domiciliary Regulators,our RiverSource Life companies and Property Casualty companies are regulated by each of the insurance regulators in thestates where each is authorized to transact business. Financial regulation of our RiverSource Life companies and PropertyCasualty companies is extensive, and their financial transactions (such as intercompany dividends and investment activity)may be subject to pre-approval and/or continuing evaluation by the Domiciliary Regulators.
Aspects of the regulation applicable to our Advice & Wealth Management segment also apply to our Annuities andProtection segments. For example, RiverSource Distributors is registered with the CFTC and NFA as well as registered as abroker-dealer for the limited purpose of acting as the principal underwriter and/or distributor for our RiverSource annuitiesand insurance products sold through AFSI and third-party channels. Additionally, ERISA and the U.S. Department of Labor’sproposed fiduciary rule impacts our insurance business and we continue to review and analyze the potential impact of theproposed regulations on our clients and prospective clients, as well as the potential impact on our business across each ofour business lines.
Virtually all states require participation in insurance guaranty associations, which assess fees to insurance companies inorder to fund claims of policyholders and contractholders of insolvent insurance companies subject to statutory limits.
21

These assessments are generally based on a member insurer’s proportionate share of all premiums written by memberinsurers in the state during a specified period prior to an insurer’s insolvency. See Note 23 to our Consolidated FinancialStatements included in Part II, Item 8 of this Annual Report on Form 10-K for additional information regarding guarantyassociation assessments.
Certain variable annuity and variable life insurance policies offered by the RiverSource Life companies constitute and areregistered as securities under the Securities Act of 1933, as amended. As such, these products are subject to regulationby the SEC and FINRA. Securities regulators have recently increased their focus on the adequacy of disclosure regardingcomplex investment products, including variable annuities and life insurance, and have announced that they will continueto review actions by life insurers to improve profitability and reduce risks under in force annuity and insurance productswith guaranteed benefits.
The Dodd-Frank Act created the Federal Insurance Office (‘‘FIO’’) within the Department of Treasury. The FIO does not havesubstantive regulatory responsibilities, though it is tasked with monitoring the insurance industry and the effectiveness ofits regulatory framework and providing periodic reports to the President and Congress.
RiverSource Life owns a block of residential mortgage loans. As an owner and servicer of residential mortgages,RiverSource Life must comply with applicable federal and state lending and foreclosure laws and is subject to thejurisdiction of the federal Consumer Finance Protection Bureau and certain state regulators relative to these mortgageloans.
Each of our insurance subsidiaries is subject to risk-based capital (‘‘RBC’’) requirements designed to assess the adequacyof an insurance company’s total adjusted capital in relation to its investment, insurance and other risks. The NationalAssociation of Insurance Commissioners (‘‘NAIC’’) has established RBC standards that all state insurance departmentshave adopted. The RBC requirements are used by the NAIC and state insurance regulators to identify companies that meritregulatory actions designed to protect policyholders. Our RiverSource Life companies and Property Casualty companies aresubject to various levels of regulatory intervention should their total adjusted statutory capital fall below defined RBC actionlevels. At the ‘‘company action level,’’ defined as total adjusted capital level between 100% and 75% of the RBCrequirement, an insurer must submit a plan for corrective action with its primary state regulator. The level of regulatoryintervention is greater at lower levels of total adjusted capital relative to the RBC requirement. RiverSource Life,RiverSource Life of NY, IDS Property Casualty and Ameriprise Insurance Company maintain capital levels well in excess ofthe company action level required by state insurance regulators as noted below as of December 31, 2015:
Company Action Total % of CompanyEntity Level RBC Adjusted Capital Action Level RBC
(in millions, except percentages)RiverSource Life $ 589 $ 3,800 645%RiverSource Life of NY 44 333 748IDS Property Casualty 121 684 563Ameriprise Insurance Company 1 46 8,701
Ameriprise Financial, as a direct and indirect owner of its insurance subsidiaries, is subject to the insurance holdingcompanies laws of the states where its insurance subsidiaries are domiciled. These laws generally require insuranceholding companies to register with the insurance department of the insurance company’s state of domicile and to providecertain financial and other information about the operations of the companies within the holding company structure.
As part of its Solvency Modernization Initiative, in 2010 the NAIC adopted revisions to its Insurance Holding CompanySystem Regulatory Act (‘‘Holding Company Act’’) to enhance insurer group supervision and create a new Risk Managementand Own Risk and Solvency Assessment (‘‘ORSA’’) Model Act. The Holding Company Act revisions focus on the overallinsurance holding company system, establish a framework of regulator supervisory colleges, enhancements to corporategovernance, and require the annual filing of an Enterprise Risk Management Report. The ORSA Model Act requires that aninsurer create and file, annually, its Own Risk Solvency Assessment, which is a complete self-assessment of its riskmanagement functions and capital adequacy. These laws have now been enacted by the domiciliary states of RiverSourceLife and the Property Casualty companies: Minnesota, New York and Wisconsin. The reports have been completed and filedas required by the laws and regulations of those states.
Federal Banking RegulationIn January 2013, Ameriprise Bank received approval for and completed the conversion from a federal savings bank to alimited powers national trust bank, which was renamed Ameriprise National Trust Bank. As a limited powers nationalassociation, Ameriprise National Trust Bank remains subject to supervision under various laws and regulations enforced bythe OCC, including those related to capital adequacy, liquidity and conflicts of interest, and to a limited extent, by theFDIC.
22

Following the conversion of Ameriprise Bank, Ameriprise Financial deregistered as a savings and loan holding company andis no longer subject to consolidated regulation or supervision by the Federal Reserve System (‘‘FRB’’) as such, nor is itsubject to the additional FRB requirements applicable to financial holding companies.
Parent Company RegulationAmeriprise Financial is a publicly traded company that is subject to SEC and New York Stock Exchange (‘‘NYSE’’) rules andregulations regarding public disclosure, financial reporting, internal controls and corporate governance. The adoption of theSarbanes-Oxley Act of 2002 as well as the implementation of the Dodd-Frank Act have significantly enhanced these rulesand regulations.
We have operations in a number of geographical regions outside of the U.S. through Threadneedle and certain of our othersubsidiaries. We monitor developments in European Union (‘‘EU’’) legislation, as well as in the other markets in which weoperate, to ensure that we comply with all applicable legal requirements, including EU directives applicable to financialinstitutions as implemented in the various member states. Because of the mix of business activities we conduct, weassess the impact of, and monitor our status under, the EU Financial Conglomerates Directive, which contemplates thatcertain financial conglomerates involved in banking, insurance and investment activities among other things, implementmeasures to prevent excessive leverage and multiple leveraging of capital and maintain internal control processes toaddress risk concentrations as well as risks arising from significant intragroup transactions.
Privacy, Environmental Laws and USA Patriot ActMany aspects of our business are subject to comprehensive legal requirements by a multitude of different functionalregulators concerning the use and protection of personal information, including client and employee information. Thisincludes rules adopted pursuant to the Gramm-Leach-Bliley Act, the Fair and Accurate Credit Transactions Act, the HealthInsurance Portability and Accountability Act (‘‘HIPAA’’), the Health Information Technology for Economic and Clinical Health(‘‘HITECH’’) Act, an ever increasing number of state laws, EU data protection legislation as domestically implemented inthe respective EU member states, and data protection rules in the other regions outside the U.S. and the EU in which weoperate. We have also implemented policies and procedures in response to such requirements. We continue our efforts tosafeguard the data entrusted to us in accordance with applicable laws and our internal data protection policies, includingtaking steps to reduce the potential for identity theft or other improper use or disclosure of personal information, whileseeking to collect only the data that is necessary to properly achieve our business objectives and to best serve our clients.
As the owner and operator of real property, we are subject to federal, state and local environmental laws and regulations.We periodically conduct environmental reviews on our own real estate as well as investment real estate to assess andensure our compliance with these laws and regulations.
The Uniting and Strengthening America by Providing Appropriate Tools Required to Intercept and Obstruct Terrorism Act,commonly referred to as the USA Patriot Act, was enacted in October 2001 in the wake of the September 11th terroristattacks. The USA Patriot Act broadened existing anti-money laundering legislation and the extraterritorial jurisdiction of theUnited States substantially. In response, we enhanced our existing anti-money laundering programs and developed newprocedures and programs. For example, we implemented a customer identification program applicable to many of ourbusinesses and enhanced our ‘‘know your customer’’ and ‘‘due diligence’’ programs. In addition, we will continue tocomply with anti-money laundering legislation in the UK derived from applicable EU directives and international initiativesadopted in other jurisdictions in which we conduct business.
Securities Exchange Act Reports and Additional InformationWe maintain an Investor Relations website at ir.ameriprise.com. Investors can also access the website through our mainwebsite at ameriprise.com by clicking on the ‘‘Investor Relations’’ link located at the bottom of our homepage. We use ourInvestor Relations website to announce financial and other information to investors and to make available SEC filings,press releases, public conference calls and webcasts. Investors and others interested in the company are encouraged tovisit the investor relations website from time to time, as information is updated and new information is posted. The websitealso allows users to sign up for automatic notifications in the event new materials are posted. The information found onthe website is not incorporated by reference into this report or in any other report or document the Company furnishes orfiles with the SEC.
Segment Information and Classes of Similar ServicesYou can find financial information about our operating segments and classes of similar services in Note 25 to ourConsolidated Financial Statements included in Part II, Item 8 of this Annual Report on Form 10-K.
23

Item 1A. Risk Factors
Our operations and financial results are subject to various risks and uncertainties, including those described below, thatcould have a material adverse effect on our business, financial condition or results of operations and could cause thetrading price of our common stock to decline. We believe that the following information identifies the material factorsaffecting our company based on the information we currently know. However, the risks and uncertainties our companyfaces are not limited to those described below. Additional risks and uncertainties not presently known to us or that wecurrently believe to be immaterial may also adversely affect our business.
Risks Relating to Our Business and Operations
Our financial condition and results of operations may be adversely affected by market fluctuations and byeconomic, political and other factors.Our financial condition and results of operations may be materially affected by market fluctuations and by economic andother factors. Such factors, which can be global, national or local in nature, include: (i) political, social, economic andmarket conditions; (ii) the availability and cost of capital; (iii) the level and volatility of equity prices, commodity prices andinterest rates, currency values and other market indices; (iv) technological changes and events; (v) U.S. and foreigngovernment fiscal and tax policies; (vi) U.S. and foreign government ability, real or perceived, to avoid defaulting ongovernment securities; (vii) the availability and cost of credit; (viii) inflation; (ix) investor sentiment and confidence in thefinancial markets; (x) terrorism and armed conflicts; and (xi) natural disasters such as weather catastrophes andwidespread health emergencies. Furthermore, changes in consumer economic variables, such as the number and size ofpersonal bankruptcy filings, the rate of unemployment, decreases in property values, and the level of consumer confidenceand consumer debt, may substantially affect consumer loan levels and credit quality, which, in turn, could impact clientactivity in all of our businesses. These factors also may have an impact on our ability to achieve our strategic objectives.
Declines and volatility in U.S. and global market conditions have impacted our businesses in the past and may do soagain. Our businesses have been, and in the future may be, adversely affected by U.S. and global capital market andcredit crises, the repricing of credit risk, equity market volatility and decline and stress or recession in the U.S. and globaleconomies generally. Each of our segments operates in these markets with exposure for us and our clients in securities,loans, derivatives, alternative investments, seed capital and other commitments. It is difficult to predict when, how longand to what extent the aforementioned adverse conditions may exist, which of our markets, products and businesses willbe directly affected in terms of revenues, management fees and investment valuations and earnings, and to what extentour clients may seek to bring claims arising out of investment performance that is affected by these conditions. As aresult, these factors could materially adversely impact our financial condition and results of operations.
Our revenues are largely dependent upon the level and mix of assets we have under management and administration,which are subject to fluctuation based on market conditions and client activity. Downturns and volatility in equity marketscan have, and have had, an adverse effect on the revenues and returns from our asset management services, retailadvisory accounts and variable annuity contracts. Because the profitability of these products and services depends on feesrelated primarily to the value of assets under management, declines in the equity markets will reduce our revenuesbecause the value of the investment assets we manage will be reduced. In addition, market downturns and volatility maycause, and have caused, potential new purchasers of our products to limit purchases of or to refrain from purchasingproducts such as mutual funds, OEICs, variable annuities and variable universal life insurance. Downturns may also causecurrent shareholders in our mutual funds, OEICs, SICAVs, unit trusts and investment trusts, contractholders in our annuityproducts and policyholders in our protection products to withdraw cash values from those products.
Some of our variable annuity products contain guaranteed minimum death benefits and guaranteed minimum withdrawaland accumulation benefits. A significant equity market decline or volatility in equity markets could result in guaranteedminimum benefits being higher than what current account values would support, which would adversely affect our financialcondition and results of operations. Although we have hedged a portion of the guarantees for the variable annuity contractsto mitigate the financial loss of equity market declines or volatility, there can be no assurance that such a decline orvolatility would not materially impact the profitability of certain products or product lines or our financial condition or resultsof operations. Further, the cost of hedging our liability for these guarantees has increased as a result of low interest ratesand volatility in the equity markets. In addition, heightened volatility creates greater uncertainty for future hedgingeffectiveness.
We believe that investment performance is an important factor in the success of many of our businesses. Poor investmentperformance could impair our revenues and earnings, as well as our prospects for growth. A significant portion of ourrevenue is derived from investment management agreements with the Columbia Management family of mutual funds thatare terminable on 60 days’ notice. In addition, although some contracts governing investment management services aresubject to termination for failure to meet performance benchmarks, institutional and individual clients can terminate their
24

relationships with us or our financial advisors at will or on relatively short notice. Our clients can also reduce the aggregateamount of managed assets or shift their funds to other types of accounts with different rate structures, for any number ofreasons, including investment performance, changes in prevailing interest rates, changes in investment preferences,changes in our (or our advisors’) reputation in the marketplace, changes in client management or ownership, loss of keyinvestment management personnel and financial market performance. A reduction in managed assets, and the associateddecrease in revenues and earnings, could have a material adverse effect on our business. Moreover, if our money marketfunds experience a decline in market value, we may choose to contribute capital to those funds without consideration,which would result in a loss.
During periods of unfavorable or stagnating market or economic conditions, the level of individual investor participation inthe global markets may also decrease, which would negatively impact the results of our retail businesses. Concerns aboutcurrent market and economic conditions, declining real estate values and decreased consumer confidence have caused,and in the future may cause, some of our clients to reduce the amount of business they do with us. Fluctuations in globalmarket activity could impact the flow of investment capital into or from assets under management and the way customersallocate capital among money market, equity, fixed maturity or other investment alternatives, which could negatively impactour Asset Management, Advice & Wealth Management and Annuities businesses. If we are unable to offer appropriateproduct alternatives which encourage customers to continue purchasing in the face of actual or perceived market volatility,our sales and management fee revenues could decline. Uncertain economic conditions and heightened market volatilitymay also increase the likelihood that clients or regulators present or threaten legal claims, that regulators may increasethe frequency and scope of their examinations of us or the financial services industry generally, and that lawmakers mayenact new requirements or taxation which can have a material impact on our revenues, expenses or statutory capitalrequirements.
Changes in interest rates and prolonged periods of low interest rates may adversely affect our financialcondition and results of operations.Certain of our insurance and annuity products and certain of our investment products are sensitive to interest ratefluctuations, and future impacts associated with such variations may differ from our historical costs. In addition, interestrate fluctuations could result in fluctuations in the valuation of certain minimum guaranteed benefits contained in some ofour variable annuity products. Although we typically hedge to mitigate some of the effect of such fluctuations, significantchanges in interest rates could have a material adverse impact on our results of operations.
During periods of increasing market interest rates, we offer higher crediting rates on interest-sensitive products, such asfixed universal life insurance, fixed annuities and face-amount certificates, and we increase crediting rates on in-forceproducts to keep these products competitive. Because yields on invested assets may not increase as quickly as currentinterest rates, we may have to accept a lower spread and thus lower profitability or face a decline in sales and greater lossof existing contracts and related assets. In addition, increases in market interest rates may cause increased policysurrenders, withdrawals from life insurance policies and annuity contracts and requests for policy loans, as policyholdersand contractholders seek to shift assets to products with perceived higher returns. This process may lead to an earlier thanexpected outflow of cash from our business. These withdrawals and surrenders may require investment assets to be sold ata time when the prices of those assets are lower because of the increase in market interest rates, which may result inrealized investment losses. Also, increases in market interest rates may result in extension of certain cash flows fromstructured mortgage assets. Increases in crediting rates, as well as surrenders and withdrawals, could have an adverseeffect on our financial condition and results of operations. An increase in policy surrenders and withdrawals also mayrequire us to accelerate amortization of deferred acquisition costs (‘‘DAC’’) or other intangibles or cause an impairment ofgoodwill, which would increase our expenses and reduce our net earnings.
During periods of falling interest rates or stagnancy of low interest rates, our spread may be reduced or could becomenegative, primarily because some of our products have guaranteed minimum crediting rates. Due to the long-term natureof the liabilities associated with certain of our businesses, such as long term care and fixed universal life with secondaryguarantees as well as fixed annuities and guaranteed benefits on variable annuities, sustained declines in or stagnancy oflow long-term interest rates may subject us to reinvestment risks and increased hedging costs. In addition, reduced ornegative spreads may require us to accelerate amortization of DAC, which would increase our expenses and reduce our netearnings.
Interest rate fluctuations also could have an adverse effect on the results of our investment portfolio. During periods ofdeclining market interest rates or stagnancy of low interest rates, the interest we receive on variable interest rateinvestments decreases. In addition, during those periods, we are forced to reinvest the cash we receive as interest orreturn of principal on our investments in lower-yielding high-grade instruments or in lower-credit instruments to maintaincomparable returns. Issuers of certain callable fixed income securities also may decide to prepay their obligations in orderto borrow at lower market rates which increases the risk that we may have to reinvest the cash proceeds of thesesecurities in lower-yielding or lower-credit instruments.
25

Adverse capital and credit market conditions may significantly affect our ability to meet liquidity needs, ouraccess to capital and our cost of capital.The capital and credit markets may experience, and have experienced, varying degrees of volatility and disruption. In somecases, the markets have exerted downward pressure on availability of liquidity and credit capacity for certain issuers. Weneed liquidity to pay our operating expenses, interest expenses and dividends on our capital stock. Without sufficientliquidity, we could be required to curtail our operations and our business would suffer.
Our liquidity needs are satisfied primarily through our reserves and the cash generated by our operations. We believe thelevel of cash and securities we maintain when combined with expected cash inflows from investments and operations, isadequate to meet anticipated short-term and long-term benefit and expense payment obligations. In the event currentresources are insufficient to satisfy our needs, we may access financing sources such as bank debt. The availability ofadditional financing would depend on a variety of factors such as market conditions, the general availability of credit, thevolume of trading activities, the overall availability of credit to the financial services industry, our credit ratings and creditcapacity, as well as the possibility that our shareholders, customers or lenders could develop a negative perception of ourlong- or short-term financial prospects if we incur large investment losses or if the level of our business activity decreasesdue to a market downturn. Similarly, our access to funds may be rendered more costly or impaired if regulatory authoritiesor rating organizations take actions against us.
Disruptions, uncertainty or volatility in the capital and credit markets may also limit our access to capital required tooperate our business. Such market conditions may limit our ability to satisfy statutory capital requirements, generate feeincome and market-related revenue to meet liquidity needs and access the capital necessary to grow our business. Assuch, we may be forced to delay raising capital, issue different types of capital than we would otherwise, less effectivelydeploy such capital, or bear an unattractive cost of capital which could decrease our profitability and significantly reduceour financial flexibility.
A downgrade or a potential downgrade in our financial strength or credit ratings could adversely affect ourfinancial condition and results of operations.Financial strength ratings, which various ratings organizations publish as a measure of an insurance company’s ability tomeet contractholder and policyholder obligations, are important to maintain public confidence in our products, the ability tomarket our products and our competitive position. A downgrade in our financial strength ratings, or the announcedpotential for a downgrade, could have a significant adverse effect on our financial condition and results of operations inmany ways, including: (i) reducing new sales of insurance and annuity products and investment products; (ii) adverselyaffecting our relationships with our advisors and third-party distributors of our products; (iii) materially increasing thenumber or amount of policy surrenders and withdrawals by contractholders and policyholders; (iv) requiring us to reduceprices for many of our products and services to remain competitive; and (v) adversely affecting our ability to obtainreinsurance or obtain reasonable pricing on reinsurance.
A downgrade in our credit ratings could also adversely impact our future cost and speed of borrowing and havean adverse effect on our financial condition, results of operations and liquidity.In view of the difficulties experienced in recent years by many financial institutions, including our competitors in theinsurance industry, the ratings organizations have heightened the level of scrutiny that they apply to such institutions andhave requested additional information from the companies that they rate. They may increase the frequency and scope oftheir credit reviews, adjust upward the capital and other requirements employed in the ratings organizations’ models formaintenance of ratings levels, or downgrade ratings applied to particular classes of securities or types of institutions.
Ratings organizations may also become subject to tighter laws, regulations or scrutiny governing ratings, which may in turnimpact ratings assigned to financial institutions.
We cannot predict what actions rating organizations may take, or what actions we may take in response to the actions ofrating organizations, which could adversely affect our business. As with other companies in the financial services industry,our ratings could be changed at any time and without any notice by the ratings organizations.
Intense competition and the economics of changes in our product revenue mix and distribution channels couldnegatively impact our ability to maintain or increase our market share and profitability.Our businesses operate in intensely competitive industry segments. We compete based on a number of factors, includingname recognition, service, the quality of investment advice, investment performance, product offerings and features, price,perceived financial strength, claims-paying ability and credit ratings. Our competitors include broker-dealers, banks, assetmanagers, insurers and other financial institutions. Certain of our competitors offer web-based financial services anddiscount brokerage services to individual clients. Many of our businesses face competitors that have greater market share,offer a broader range of products, have greater financial resources, or have higher claims-paying ability or credit ratingsthan we do. Some of our competitors may possess or acquire intellectual property rights that could provide a competitiveadvantage to them in certain markets or for certain products, which could make it difficult for us to introduce new products
26

and services. Some of our competitors’ proprietary products or technology could be similar to our own, and this couldresult in disputes that could impact our financial condition or results of operations. In addition, over time certain sectors ofthe financial services industry have become considerably more concentrated, as financial institutions involved in a broadrange of financial services have been acquired by or merged into other firms. This convergence could result in ourcompetitors gaining greater resources, and we may experience pressures on our pricing and market share as a result ofthese factors and as some of our competitors seek to increase market share by reducing prices.
The offerings available to our advisor network include not only products issued by our RiverSource Life companies, but alsoproducts issued by unaffiliated insurance companies. As a result of this and further openings of our advisor network to theproducts of other companies, we could experience lower sales of our companies’ products, higher surrenders, or otherdevelopments which might not be fully offset by higher distribution revenues or other benefits, possibly resulting in anadverse effect on our results of operations. In addition, some of our products, such as certain products of our PropertyCasualty companies, are made available through alliances with unaffiliated third parties. We could experience lower salesor incur higher distribution costs or other developments which could have an adverse effect on our results of operations ifalliance relationships are discontinued or if the terms of our alliances change.
We face intense competition in attracting and retaining key talent.Our continued success depends to a substantial degree on our ability to attract and retain qualified people. We aredependent on our network of advisors for a significant portion of the sales of our mutual funds, annuities, face-amountcertificates and insurance products. In addition, the investment performance of our asset management products andservices and the retention of our products and services by our clients are dependent upon the strategies and decisioning ofour portfolio managers and analysts. The market for these financial advisors and portfolio managers is extremelycompetitive, as are the markets for qualified and skilled executives and marketing, finance, legal, compliance and otherprofessionals. If we are unable to attract and retain qualified individuals or our recruiting and retention costs increasesignificantly, our financial condition and results of operations could be materially adversely impacted.
The impairment or negative performance of other financial institutions could adversely affect us.We have exposure to many different industries and counterparties, and we routinely execute transactions withcounterparties in the financial services industry, including broker-dealers, commercial banks, investment banks, hedgefunds, insurers, reinsurers, investment funds and other institutions. The operations of U.S. and global financial servicesinstitutions are interconnected and a decline in the financial condition of one or more financial services institutions mayexpose us to credit losses or defaults, limit our access to liquidity or otherwise disrupt the operations of our businesses.While we regularly assess our exposure to different industries and counterparties, the performance and financial strength ofspecific institutions are subject to rapid change, the timing and extent of which cannot be known.
Many transactions with and investments in the products and securities of other financial institutions expose us to creditrisk in the event of default of our counterparty. With respect to secured transactions, our credit risk may be exacerbatedwhen the collateral we hold cannot be realized upon or is liquidated at prices insufficient to recover the full amount of theloan or derivative exposure due to it. We also have exposure to financial institutions in the form of unsecured debtinstruments, derivative transactions (including with respect to derivatives hedging our exposure on variable annuitycontracts with guaranteed benefits), reinsurance, repurchase and underwriting arrangements and equity investments. Therecan be no assurance that any such losses or impairments to the carrying value of these assets would not materially andadversely impact our business and results of operations.
Downgrades in the credit or financial strength ratings assigned to the counterparties with whom we transact or otheradverse reputational impacts to such counterparties could create the perception that our financial condition will beadversely impacted as a result of potential future defaults by such counterparties. Additionally, we could be adverselyaffected by a general, negative perception of financial institutions caused by the downgrade or other adverse impact to thereputation of other financial institutions. Accordingly, ratings downgrades or other adverse reputational impacts for otherfinancial institutions could affect our market capitalization and could limit access to or increase our cost of capital.
A number of the products and services we make available to our clients are those offered by third parties, for which wemay generate revenue based on the level of assets under management, the number of client transactions or otherwise.The poor performance of such products and services, or negative perceptions of the firms offering such products andservices, may adversely impact our sales of such products and services and reduce our revenue. In addition, such failuresor poor performance of products and services offered by other financial institutions could adversely impact consumerconfidence in products and services that we offer. Negative perceptions of certain financial products and services, or thefinancial industry in general, may increase the number of withdrawals and redemptions or reduce purchases made by ourclients, which would adversely impact the levels of our assets under management, revenues and liquidity position.
27

A drop in our investment performance as compared to that of our competitors could negatively impact ourrevenues and profitability.Investment performance is a key competitive factor for our retail and institutional asset management products andservices. Strong investment performance helps to ensure the retention of our products and services by our clients andcreates new sales of products and services. It may also result in higher ratings by ratings services such as Morningstar orLipper, which may compound the foregoing effects. Strong investment performance and its effects are important elementsto our stated goals of growing assets under management and achieving economies of scale.
There can be no assurance as to how future investment performance will compare to our competitors or that historicalperformance will be indicative of future returns. Any drop or perceived drop in investment performance as compared to ourcompetitors could cause a decline in sales of our mutual funds and other investment products, an increase in redemptionsand the termination of institutional asset management relationships. These impacts may reduce our aggregate amount ofassets under management and reduce management fees. Poor investment performance could also adversely affect ourability to expand the distribution of our products through unaffiliated third parties. Further, any drop in market share ofmutual funds sales by our advisors may further reduce profits as sales of other companies’ mutual funds are less profitablethan sales of our proprietary funds.
We may not be able to maintain our unaffiliated third-party distribution channels or the terms by whichunaffiliated third parties sell our products.We distribute certain of our investment products and fixed annuities through unaffiliated third-party advisors and financialinstitutions. Maintaining and deepening relationships with these unaffiliated distributors is an important part of our growthstrategy, as strong third-party distribution arrangements enhance our ability to market our products and to increase ourassets under management, revenues and profitability. There can be no assurance that the distribution relationships wehave established will continue, as our distribution partners may cease to operate or otherwise terminate their relationshipwith us. Any such reduction in access to third-party distributors may have a material adverse effect on our ability to marketour products and to generate revenue in our Asset Management and Annuities segments.
Access to distribution channels is subject to intense competition due to the large number of competitors and products inthe investment advisory and annuities industries. Relationships with distributors are subject to periodic negotiation thatmay result in increased distribution costs and/or reductions in the amount of our products marketed. Any increase in thecosts to distribute our products or reduction in the type or amount of products made available for sale may have amaterial effect on our revenues and profitability.
We face risks arising from acquisitions and divestitures.We have made acquisitions and divestitures in the past and may pursue similar strategic transactions in the future. Risksin acquisition transactions include difficulties in the integration of acquired businesses into our operations and controlenvironment, difficulties in assimilating and retaining employees and intermediaries, difficulties in retaining the existingcustomers of the acquired entities, assumed or unforeseen liabilities that arise in connection with the acquired businesses,the failure of counterparties to satisfy any obligations to indemnify us against liabilities arising from the acquiredbusinesses, and unfavorable market conditions that could negatively impact our growth expectations for the acquiredbusinesses. Fully integrating an acquired company or business into our operations may take a significant amount of time.Risks in divestiture transactions include difficulties in the separation of the disposed business, retention or obligation toindemnify certain liabilities, the failure of counterparties to satisfy payment obligations, unfavorable market conditions thatmay impact any earnout or contingency payment due to us and unexpected difficulties in losing employees of the disposedbusiness. We cannot assure you that we will be successful in overcoming these risks or any other problems encounteredwith acquisitions, divestitures and other strategic transactions. These risks may prevent us from realizing the expectedbenefits from acquisitions or divestitures and could result in the failure to realize the full economic value of a strategictransaction or the impairment of goodwill and/or intangible assets recognized at the time of an acquisition. These riskscould be heightened if we complete a large acquisition or multiple acquisitions within a short period of time.
Third-party defaults, bankruptcy filings, legal actions and other events may limit the value of or restrict ouraccess and our clients’ access to cash and investments.Capital and credit market volatility can exacerbate, and has exacerbated, the risk of third-party defaults, bankruptcy filings,foreclosures, legal actions and other events that may limit the value of or restrict our access and our clients’ access tocash and investments. Although we are not required to do so, we have elected in the past, and we may elect in thefuture, to compensate clients for losses incurred in response to such events, provide clients with temporary credit orliquidity or other support related to products that we manage, or provide credit liquidity or other support to the financialproducts we manage. Any such election to provide support may arise from factors specific to our clients, our products orindustry-wide factors. If we elect to provide additional support, we could incur losses from the support we provide and incuradditional costs, including financing costs, in connection with the support. These losses and additional costs could bematerial and could adversely impact our results of operations. If we were to take such actions we may also restrict or
28

otherwise utilize our corporate assets, limiting our flexibility to use these assets for other purposes, and may be required toraise additional capital.
Defaults in our fixed maturity securities portfolio or consumer credit holdings could adversely affect ourearnings.Issuers of the fixed maturity securities that we own may default on principal and interest payments. As of December 31,2015, 6% of our invested assets had ratings below investment-grade. Moreover, economic downturns and corporatemalfeasance can increase the number of companies, including those with investment-grade ratings, which default on theirdebt obligations. Default-related declines in the value of our fixed maturity securities portfolio or consumer credit holdingscould cause our net earnings to decline and could also cause us to contribute capital to some of our regulatedsubsidiaries, which may require us to obtain funding during periods of unfavorable market conditions.
Our valuation of fixed maturity and equity securities may include methodologies, estimations and assumptionswhich are subject to differing interpretations and could result in changes to investment valuations that maymaterially adversely impact our results of operations or financial condition.Fixed maturity, equity, trading securities and short-term investments, which are reported at fair value on the consolidatedbalance sheets, represent the majority of our total cash and invested assets. The determination of fair values bymanagement in the absence of quoted market prices is based on: (i) valuation methodologies; (ii) securities we deem tobe comparable; and (iii) assumptions deemed appropriate given the circumstances. The fair value estimates are made at aspecific point in time, based on available market information and judgments about financial instruments, includingestimates of the timing and amounts of expected future cash flows and the credit standing of the issuer or counterparty.Factors considered in estimating fair value include: coupon rate, maturity, estimated duration, call provisions, sinking fundrequirements, credit rating, industry sector of the issuer, interest rates, credit spreads, and quoted market prices ofcomparable securities. The use of different methodologies and assumptions may have a material effect on the estimatedfair value amounts.
During periods of market disruption, including periods of significantly rising or high interest rates and rapidly widening creditspreads or illiquidity, it may be difficult to value certain of our securities. There may be certain asset classes that were inactive markets with significant observable data that become illiquid due to the financial environment. In such cases, thevaluation of certain securities may require additional subjectivity and management judgment. As such, valuations mayinclude inputs and assumptions that are less observable and may require greater estimation as well as valuation methodsthat are more sophisticated, which may result in values less than the value at which the investments may be ultimatelysold. Further, rapidly changing and unexpected credit and equity market conditions could materially impact the valuation ofsecurities as reported within our consolidated financial statements and the period-to-period changes in value could varysignificantly. Decreases in value may have a material adverse effect on our results of operations or financial condition.
The determination of the amount of allowances and impairments taken on certain investments is subject tomanagement’s evaluation and judgment and could materially impact our results of operations or financialposition.The determination of the amount of allowances and impairments vary by investment type and is based upon our periodicevaluation and assessment of inherent and known risks associated with the respective asset class. Such evaluations andassessments are revised as conditions change and new information becomes available. Management updates itsevaluations regularly and reflects changes in allowances and impairments in operations as such evaluations are revised.Historical trends may not be indicative of future impairments or allowances.
The assessment of whether impairments have occurred is based on management’s case-by-case evaluation of theunderlying reasons for the decline in fair value that considers a wide range of factors about the security issuer or borrower,and management uses its best judgment in evaluating the cause of the decline in the estimated fair value of the securityor loan and in assessing the prospects for recovery. Inherent in management’s evaluation of the security or loan areassumptions and estimates about the operations of the issuer and its future earnings potential.
Some of our investments are relatively illiquid.We invest a portion of our owned assets in certain privately placed fixed income securities, mortgage loans, policy loansand limited partnership interests, all of which are relatively illiquid. These asset classes represented 18% of the carryingvalue of our investment portfolio as of December 31, 2015. If we require significant amounts of cash on short notice inexcess of our normal cash requirements, we may have difficulty selling these investments in a timely manner or be forcedto sell them for an amount less than we would otherwise have been able to realize, or both, which could have an adverseeffect on our financial condition and results of operations.
29

The failure of other insurers could require us to pay higher assessments to state insurance guaranty funds.Our insurance companies are required by law to be members of the guaranty fund association in every state where theyare licensed to do business. In the event of insolvency of one or more unaffiliated insurance companies, our insurancecompanies could be adversely affected by the requirement to pay assessments to the guaranty fund associations.Uncertainty and volatility in the U.S. economy and financial markets in recent years, plus the repercussions of aheightened regulatory environment, have weakened or may weaken the financial condition of numerous insurers, includinginsurers currently in receiverships, increasing the risk of triggering guaranty fund assessments. For more informationregarding assessments from guaranty fund associations, see Note 23 to our Consolidated Financial Statements included inPart II, Item 8 of this Annual Report on Form 10-K.
If the counterparties to our reinsurance arrangements or to the derivative instruments we use to hedge ourbusiness risks default or otherwise fail to fulfill their obligations, we may be exposed to risks we had sought tomitigate, which could adversely affect our financial condition and results of operations.We use reinsurance to mitigate our risks in various circumstances as described in Item 1 of this Annual Report onForm 10-K — ‘‘Business — Our Segments — Protection — Reinsurance.’’ Reinsurance does not relieve us of our directliability to our policyholders and contractholders, even when the reinsurer is liable to us. Accordingly, we bear credit andperformance risk with respect to our reinsurers. A reinsurer’s insolvency or its inability or unwillingness to make paymentsunder the terms of our reinsurance agreement could have a material adverse effect on our financial condition and resultsof operations. See Notes 2 and 7 to our Consolidated Financial Statements included in Part II, Item 8 of this AnnualReport on Form 10-K.
In addition, we use a variety of derivative instruments (including options, forwards, and interest rate and currency swaps)with a number of counterparties to hedge business risks. The amount and breadth of exposure to derivative counterparties,as well as the cost of derivative instruments, have increased significantly in connection with our strategies to hedgeguaranteed benefit obligations under our variable annuity products. If our counterparties fail to honor their obligationsunder the derivative instruments in a timely manner, our hedges of the related risk will be ineffective. That failure couldhave a material adverse effect on our financial condition and results of operations. This risk of failure of our hedgetransactions from counterparty default may be increased by capital market volatility.
We provide investment securities as collateral to our derivative counterparties which they may sell, pledge, orrehypothecate. We have exposure, under the relevant arrangement, if the collateral is not returned to us to the extent thatthe fair value of the collateral exceeds our liability. Additionally, we may also accept investment securities as collateral fromour derivative counterparties, which we may sell, pledge, or rehypothecate. If the counterparties that we pledge thecollateral to are not able to return these investment securities under the terms of the relevant arrangements, we would berequired to deliver alternative investments or cash to our derivative counterparty, which could impact our liquidity and couldadversely impact our financial condition or results of operations.
If our reserves for future policy benefits and claims or for future certificate redemptions and maturities areinadequate, we may be required to increase our reserve liabilities, which would adversely affect our results ofoperations and financial condition.We establish reserves as estimates of our liabilities to provide for future obligations under our insurance policies, annuitiesand investment certificate contracts. Reserves do not represent an exact calculation but, rather, are estimates of contractbenefits and related expenses we expect to incur over time. The assumptions and estimates we make in establishingreserves require certain judgments about future experience and, therefore, are inherently uncertain. We cannot determinewith precision the actual amounts that we will pay for contract benefits, the timing of payments, or whether the assetssupporting our stated reserves will increase to the levels we estimate before payment of benefits or claims. We monitor ourreserve levels continually. If we were to conclude that our reserves are insufficient to cover actual or expected contractbenefits, we would be required to increase our reserves and incur income statement charges for the period in which wemake the determination, which would adversely affect our results of operations and financial condition. For moreinformation on how we set our reserves, see Note 2 to our Consolidated Financial Statements included in Part II, Item 8 ofthis Annual Report on Form 10-K.
Morbidity rates, mortality rates or the severity or frequency of other insurance claims that differ significantlyfrom our pricing expectations could negatively affect profitability.We set prices for RiverSource life insurance and some annuity products based upon expected claim payment patterns,derived from assumptions we make about our policyholders and contractholders, including morbidity and mortality rates.The long-term profitability of these products depends upon how our actual experience compares with our pricingassumptions. For example, if morbidity rates are higher, or mortality rates are lower, than our pricing assumptions, wecould be required to make greater payments under disability income insurance policies, chronic care riders and immediateannuity contracts than we had projected. The same holds true for long term care policies we previously underwrote to theextent of the risks that we retained. If mortality rates are higher than our pricing assumptions, we could be required to
30

make greater payments under our life insurance policies and annuity contracts with guaranteed minimum death benefitsthan we have projected.
The risk that our claims experience may differ significantly from our pricing assumptions is particularly significant for ourlong term care insurance products notwithstanding our ability to implement future price increases with regulatory approvals.As with life insurance, long term care insurance policies provide for long-duration coverage and, therefore, our actualclaims experience will emerge over many years. However, as a relatively new product in the market, long term careinsurance does not have the extensive claims experience history of life insurance and, as a result, our ability to forecastfuture claim rates for long term care insurance is more limited than for life insurance. We have sought to moderate theseuncertainties to some extent by partially reinsuring long term care policies at the time the policies were underwritten andby limiting our present long term care insurance offerings to policies underwritten fully by unaffiliated third-party insurers,and we have also implemented rate increases on certain in-force policies as described in Item 1 of this Annual Report onForm 10-K — ‘‘Business — Our Segments — Protection — RiverSource Insurance Products — Long Term CareInsurance.’’ We may be required to implement additional rate increases in the future and may or may not receiveregulatory approval for the full extent and timing of any rate increases that we may seek.
Unexpected changes in the severity or frequency of claims may affect the profitability of our auto and home insurancebusiness. Recorded claim reserves in the auto and home insurance business are based on our best estimates of losses,both reported and incurred but not reported (‘‘IBNR’’) claims, after considering known facts and interpretations ofcircumstances. Internal factors are considered including our experience with similar cases, actual claims paid, historicaltrends involving claim payment patterns, pending levels of unpaid claims, loss management programs, product mix andcontractual terms. External factors are also considered, such as court decisions and changes in law, regulatoryrequirements, litigation trends, and price levels of medical services, auto and home repairs, and other economicconditions. Because reserves are estimates of the unpaid portion of losses that have occurred, including IBNR losses, theestablishment of appropriate reserves, including reserves for catastrophes, is an inherently uncertain and complex process.Increases in claim severity or frequency can also arise from unexpected events that are inherently difficult to predict.Although we pursue various loss management initiatives in our auto and home insurance business in order to mitigatefuture increases in claim severity, there can be no assurances that these initiatives will successfully identify or reduce theeffect of future increases in claim severity or frequency. To address adverse trends in claims we may seek additional rateincreases for our auto and home insurance business in the future and may or may not receive regulatory approval for thefull extent and timing of any rate increases that we may seek.
We may face losses if there are significant deviations from our assumptions regarding the future persistency ofour insurance policies and annuity contracts.The prices and expected future profitability of our life insurance and deferred annuity products are based in part uponassumptions related to persistency, which is the probability that a policy or contract will remain in force from one period tothe next. Economic and market dislocations may occur and future consumer persistency behaviors could vary materiallyfrom the past. The effect of persistency on profitability varies for different products. For most of our life insurance anddeferred annuity products, actual persistency that is lower than our persistency assumptions could have an adverse impacton profitability, especially in the early years of a policy or contract, primarily because we would be required to acceleratethe amortization of expenses we deferred in connection with the acquisition of the policy or contract.
For our long term care insurance and universal life insurance policies with secondary guarantees, as well as variableannuities with guaranteed minimum withdrawal benefits, actual persistency that is higher than our persistency assumptionscould have a negative impact on profitability. If these policies remain in force longer than we assumed, we could berequired to make greater benefit payments than we had anticipated when we priced or partially reinsured these products.Some of our long term care insurance policies have experienced higher persistency and poorer loss experience than wehad assumed, which led us to increase premium rates on certain policies.
Because our assumptions regarding persistency experience are inherently uncertain, reserves for future policy benefits andclaims may prove to be inadequate if actual persistency experience is different from those assumptions. Although some ofour products permit us to increase premiums during the life of the policy or contract, we cannot guarantee that theseincreases would be sufficient to maintain profitability. Additionally, some of these pricing changes require regulatoryapproval, which may not be forthcoming. Moreover, many of our products do not permit us to increase premiums or limitthose increases during the life of the policy or contract, while premiums on certain other products (primarily long term careinsurance) may not be increased without prior regulatory approval. Significant deviations in experience from pricingexpectations regarding persistency could have an adverse effect on the profitability of our products.
31

We may be required to accelerate the amortization of DAC, which would increase our expenses.DAC represent the portion of costs which are incremental and direct to the acquisition of new or renewal business,principally direct sales commissions and other distribution and underwriting costs that have been deferred on the sale ofannuity, life and disability income insurance and, to a lesser extent, direct marketing expenses for personal auto and homeinsurance, and distribution expenses for certain mutual fund products. For annuity and universal life products, DAC areamortized based on projections of estimated gross profits over amortization periods equal to the approximate life of thebusiness. For other insurance products, DAC are generally amortized as a percentage of premiums over amortizationperiods equal to the premium-paying period. For certain mutual fund products, we generally amortize DAC over fixedperiods on a straight-line basis, adjusted for redemptions.
Our projections underlying the amortization of DAC require the use of certain assumptions, including interest margins,mortality rates, persistency rates, maintenance expense levels and customer asset value growth rates for variable products.We periodically review and, where appropriate, adjust our assumptions. When we change our assumptions, we may berequired to accelerate the amortization of DAC or to record a charge to increase benefit reserves.
For more information regarding DAC, see Part II, Item 7 of this Annual Report on Form 10-K under the heading‘‘Management’s Discussion and Analysis of Financial Condition and Results of Operations — Critical Accounting Policiesand Estimates — Deferred Acquisition Costs.’’
Misconduct by our employees and advisors is difficult to detect and deter and could harm our business, resultsof operations or financial condition.Misconduct by our employees and advisors could result in violations of law, regulatory sanctions and/or serious reputationalor financial harm. Misconduct can occur in each of our businesses and could include: (i) binding us to transactions thatexceed authorized limits; (ii) hiding unauthorized or unsuccessful activities resulting in unknown and unmanaged risks orlosses; (iii) improperly using, disclosing or otherwise compromising confidential information; (iv) recommending transactionsthat are not suitable; (v) engaging in fraudulent or otherwise improper activity, including the misappropriation of funds;(vi) engaging in unauthorized or excessive trading to the detriment of customers; or (vii) otherwise not complying with laws,regulations or our control procedures.
We cannot always deter misconduct by our employees and advisors, and the precautions we take to prevent and detectthis activity may not be effective in all cases. Preventing and detecting misconduct among our franchisee advisors who arenot employees of our company presents additional challenges. We also cannot assure you that misconduct by ouremployees and advisors will not lead to a material adverse effect on our business, results of operations or financialcondition.
A failure to protect our reputation could adversely affect our businesses.Our reputation is one of our most important assets. Our ability to attract and retain customers, investors, employees andadvisors is highly dependent upon external perceptions of our company. Damage to our reputation could cause significantharm to our business and prospects and may arise from numerous sources, including litigation or regulatory actions, failingto deliver minimum standards of service and quality, compliance failures, any perceived or actual weakness in our financialstrength or liquidity, technological, cybersecurity, or other security breaches (including attempted breaches) resulting inimproper disclosure of client or employee personal information, unethical behavior and the misconduct of our employees,advisors and counterparties. Negative perceptions or publicity regarding these matters could damage our reputation amongexisting and potential customers, investors, employees and advisors. Reputations may take decades to build, and anynegative incidents can quickly erode trust and confidence, particularly if they result in adverse mainstream and socialmedia publicity, governmental investigations or litigation. Adverse developments with respect to our industry may also, byassociation, negatively impact our reputation or result in greater regulatory or legislative scrutiny or litigation against us.
Our reputation is also dependent on our continued identification of and mitigation against conflicts of interest. As we haveexpanded the scope of our businesses and our client base, we increasingly have to identify and address potential conflictsof interest, including those relating to our proprietary activities and those relating to our sales of non-proprietary productsfrom manufacturers that have agreed to provide us marketing, sales and account maintenance support. For example,conflicts may arise between our position as a provider of financial planning services and as a manufacturer and/ordistributor or broker of asset accumulation, income or insurance products that one of our advisors may recommend to afinancial planning client. We have procedures and controls that are designed to identify, address and appropriately discloseperceived conflicts of interest. However, identifying and appropriately addressing conflicts of interest is complex, and ourreputation could be damaged if we fail, or appear to fail, to address conflicts of interest appropriately.
In addition, the SEC and other federal and state regulators have increased their scrutiny of potential conflicts of interest. Itis possible that potential or perceived conflicts could give rise to litigation or enforcement actions. It is possible also thatthe regulatory scrutiny of, and litigation in connection with, conflicts of interest will make our clients less willing to enterinto transactions in which such a conflict may occur, and will adversely affect our businesses.
32

Our operational systems and networks have been, and will continue to be, subject to evolving cybersecurity orother technological risks, which could result in the disclosure of confidential client information, loss of ourproprietary information, damage to our reputation, additional costs to us, regulatory penalties and other adverseimpacts.Our business is reliant upon internal and third-party personnel and technology systems and networks to process, transmitand store information, including sensitive client and proprietary information, and to conduct many of our business activitiesand transactions with our clients, advisors, vendors and other third parties. Maintaining the integrity of these systems andnetworks is critical to the success of our business operations, including the retention of our advisors and clients, and tothe protection of our proprietary information and our clients’ personal information. To date, we have not experienced anymaterial breaches of or interference with our systems and networks, however, we routinely encounter and address suchthreats. For example, in past years we and other financial institutions experienced distributed denial of service attacksintended to disrupt our clients’ online access. While we were able to detect and respond to these incidents without loss ofclient assets or information, we implemented additional security capabilities and will continue to assess our ability tomonitor and respond to such threats. In addition to the foregoing, our experiences with cybersecurity and technologythreats have included phishing scams, introductions of malware, attempts at electronic break-ins, and unauthorizedpayment requests. Any such breaches or interference (including attempted breaches or interference) by third parties or byour advisors or employees that may occur in the future could have a material adverse impact on our business, financialcondition or results of operations.
We are subject to international, federal and state regulations, and in some cases contractual obligations, that require us toestablish and maintain policies and procedures designed to protect sensitive client, employee, contractor and vendorinformation. We have implemented and maintain security measures designed to protect against breaches of security andother interference with our systems and networks resulting from attacks by third parties, including hackers, and fromemployee, advisor or service provider error or malfeasance. We also contractually require third-party vendors who, in theprovision of services to us, are provided with access to our systems and information pertaining to our business or ourclients, to meet certain information security standards. Changes in our client base, the mix of assets under managementor administration and business model or technology platform changes, such as an evolution to accommodate mobilecomputing, virtual interface and multi-device functionality, may also require corresponding changes in our systems,networks and data security measures. In addition, the increasing reliance on technology systems and networks and theoccurrence and potential adverse impact of attacks on such systems and networks, both generally and in the financialservices industry, have enhanced government and regulatory scrutiny of the measures taken by companies to protectagainst cybersecurity threats. As these threats, and government and regulatory oversight of associated risks, continue toevolve, we may be required to expend additional resources to enhance or expand upon the security measures we currentlymaintain.
Despite the measures we have taken and may in the future take to address and mitigate cybersecurity and technologyrisks, we cannot assure you that our systems and networks will not be subject to attacks, breaches or interference. Anysuch event may result in operational disruptions as well as unauthorized access to or the disclosure or loss of ourproprietary information or our clients’ personal information, which in turn may result in legal claims, regulatory scrutiny andliability, reputational damage, the incurrence of costs to eliminate or mitigate further exposure, the loss of clients oradvisors or other damage to our business. While we maintain cyber liability insurance that provides both third-party liabilityand first-party liability coverages, this insurance may not be sufficient to protect us against all cybersecurity-related losses.In addition, the trend toward broad consumer and general public notification of such incidents could exacerbate the harmto our business, financial condition or results of operations. Even if we successfully protect our technology infrastructureand the confidentiality of sensitive data, we may incur significant expenses in connection with our responses to any suchattacks as well as the adoption, implementation and maintenance of appropriate security measures. We could also sufferharm to our business and reputation if attempted security breaches are publicized. We cannot be certain that advances incriminal capabilities, discovery of new vulnerabilities, attempts to exploit vulnerabilities in our systems or third-partysystems we use, data thefts, physical system or network break-ins or inappropriate access, or other developments will notcompromise or breach the technology or other security measures protecting the networks and systems used in connectionwith our business.
Protection from system interruptions and operating errors is important to our business. If we experience asustained interruption to our telecommunications or data processing systems, or other failure in operationalexecution, it could harm our business.Operating errors and system or network interruptions could delay and disrupt our ability to develop, deliver or maintain ourproducts and services, causing harm to our business and reputation and resulting in loss of our advisors, clients orrevenue. Interruptions could be caused by operational failures arising from service provider, employee or advisor error ormalfeasance, interference by third parties, including hackers, our implementation of new technology, as well as from ourmaintenance of existing technology. Our financial, accounting, data processing or other operating systems and facilitiesmay fail to operate or report data properly, experience connectivity disruptions or otherwise become disabled as a result of
33

events that are wholly or partially beyond our control, adversely affecting our ability to process transactions or provideproducts and services to our clients. These interruptions can include fires, floods, earthquakes and other natural disasters,power losses, equipment failures, attacks by third parties, failures of internal or vendor personnel, software, equipment orsystems and other events beyond our control. Although we have developed and maintain a comprehensive businesscontinuity plan and require our key technology vendors and service providers to do the same, there are inherent limitationsin such plans and they might not, despite testing and monitoring, operate as designed. Further, we cannot control theexecution of any business continuity plans implemented by our service providers.
We rely on third-party service providers and vendors for certain communications, technology and business functions, andwe face the risk of operational failure (including, without limitation, failure caused by an inaccuracy, untimeliness or otherdeficiency in data reporting), termination or capacity constraints of any of the clearing agents, exchanges, clearing housesor other third-party service providers that we use to facilitate or are component providers to our securities transactions andother product manufacturing and distribution activities. For example, most of our applications run on a technologyinfrastructure managed on an outsourced basis by IBM since 2002. Under this arrangement, IBM is responsible for allmainframe, mid-range, computing network and storage operations, which includes a portion of our web hosting operations,and we are subject to the risks of any operational failure, termination or other restraints in this arrangement. These risksare heightened by our deployment in response to both investor interest and evolution in the financial markets ofincreasingly sophisticated products, such as those which incorporate automatic asset re-allocation, long/short tradingstrategies or multiple portfolios or funds, and business-driven hedging, compliance and other risk management orinvestment or financial management strategies. Any such failure, termination or constraint could adversely impact ourability to effect transactions, service our clients, manage our exposure to risk, or otherwise achieve desired outcomes.
Risk management policies and procedures may not be fully effective in identifying or mitigating risk exposure inall market environments or against all types of risk, including employee and financial advisor misconduct.We have devoted significant resources to develop our risk management policies and procedures and will continue to do so.Nonetheless, our policies and procedures to identify, monitor and manage risks may not be fully effective in mitigating ourrisk exposure in all market environments or against all types of risk. Many of our methods of managing risk and exposuresare based upon our use of observed historical market behavior or statistics based on historical models. During periods ofmarket volatility or due to unforeseen events, the historically-derived correlations upon which these methods are basedmay not be valid. As a result, these methods may not predict future exposures accurately, which could be significantlygreater than what our models indicate. This could cause us to incur investment losses or cause our hedging and other riskmanagement strategies to be ineffective. Other risk management methods depend upon the evaluation of informationregarding markets, clients, catastrophe occurrence or other matters that are publicly available or otherwise accessible tous, which may not always be accurate, complete, up-to-date or properly evaluated.
Moreover, we are subject to the risks of errors and misconduct by our employees and advisors, such as fraud,non-compliance with policies, recommending transactions that are not suitable, and improperly using or disclosingconfidential information. These risks are difficult to detect in advance and deter, and could harm our business, results ofoperations or financial condition. We are further subject to the risk of nonperformance or inadequate performance ofcontractual obligations by third-party vendors of products and services that are used in our businesses. Management ofoperational, legal and regulatory risks requires, among other things, policies and procedures to record properly and verify alarge number of transactions and events, and these policies and procedures may not be fully effective in mitigating our riskexposure in all market environments or against all types of risk. Insurance and other traditional risk-shifting tools may beheld by or available to us in order to manage certain exposures, but they are subject to terms such as deductibles,coinsurance, limits and policy exclusions, as well as risk of counterparty denial of coverage, default or insolvency.
As a holding company, we depend on the ability of our subsidiaries to transfer funds to us to pay dividends andto meet our obligations.We act as a holding company for our subsidiaries, through which substantially all of our operations are conducted.Dividends from our subsidiaries and permitted payments to us under our intercompany arrangements with our subsidiariesare our principal sources of cash to pay shareholder dividends and to meet our other financial obligations. Theseobligations include our operating expenses and interest and principal on our borrowings. If the cash we receive from oursubsidiaries pursuant to dividend payment and intercompany arrangements is insufficient for us to fund any of theseobligations, we may be required to raise cash through the incurrence of additional debt, the issuance of additional equityor the sale of assets. If any of this happens, it could adversely impact our financial condition and results of operations.
Insurance and securities laws and regulations regulate the ability of many of our subsidiaries (such as our insurance andbrokerage subsidiaries and our face-amount certificate company) to pay dividends or make other permitted payments. SeeItem 1 of this Annual Report on Form 10-K — ‘‘Regulation’’ as well as the information contained in Part II, Item 7 underthe heading ‘‘Management’s Discussion and Analysis of Financial Condition and Results of Operations — Liquidity andCapital Resources.’’ In addition to the various regulatory restrictions that constrain our subsidiaries’ ability to pay dividends
34

or make other permitted payments to our company, the rating organizations impose various capital requirements on ourcompany and our insurance company subsidiaries in order for us to maintain our ratings and the ratings of our insurancesubsidiaries. The value of assets on the company-level balance sheets of our subsidiaries is a significant factor indetermining these restrictions and capital requirements. As asset values decline, our and our subsidiaries’ ability to paydividends or make other permitted payments can be reduced. Additionally, the various asset classes held by oursubsidiaries, and used in determining required capital levels, are weighted differently or are restricted as to the proportionin which they may be held depending upon their liquidity, credit risk and other factors. Volatility in relative asset valuesamong different asset classes can alter the proportion of our subsidiaries’ holdings in those classes, which could increaserequired capital and constrain our and our subsidiaries’ ability to pay dividends or make other permitted payments. Theregulatory capital requirements and dividend-paying ability of our subsidiaries may also be affected by a change in the mixof products sold by such subsidiaries. For example, fixed annuities typically require more capital than variable annuities,and an increase in the proportion of fixed annuities sold in relation to variable annuities could increase the regulatorycapital requirements of our life insurance subsidiaries. This may reduce the dividends or other permitted payments whichcould be made from those subsidiaries in the near term without the rating organizations viewing this negatively. Further, thecapital requirements imposed upon our subsidiaries may be impacted by heightened regulatory scrutiny and intervention,which could negatively affect our and our subsidiaries’ ability to pay dividends or make other permitted payments.Additionally, in the past we have found it necessary and advisable to provide support to certain of our subsidiaries in orderto maintain adequate capital for regulatory or other purposes and we may provide such support in the future. The provisionof such support could adversely affect our excess capital, liquidity, and the dividends or other permitted payments receivedfrom our subsidiaries.
The operation of our business in foreign markets and our investments in non-U.S. denominated securities andinvestment products subjects us to exchange rate and other risks in connection with international operationsand earnings and income generated overseas.While we are a U.S.-based company, a significant portion of our business operations occurs outside of the U.S. and someof our investments are not denominated in U.S. dollars. As a result, we are exposed to certain foreign currency exchangerisks that could reduce U.S. dollar equivalent earnings as well as negatively impact our general account and otherproprietary investment portfolios. Appreciation of the U.S. dollar could unfavorably affect net income from foreignoperations, the value of non-U.S. dollar denominated investments and investments in foreign subsidiaries. In comparison,depreciation of the U.S. dollar could positively affect our net income from foreign operations and the value of non-U.S.dollar denominated investments, though such depreciation could also diminish investor, creditor and rating organizations’perceptions of our company compared to peer companies that have a relatively greater proportion of foreign operations orinvestments.
We may seek to mitigate these risks by employing various hedging strategies including entering into derivative contracts.Currency fluctuations, including the effect of changes in the value of U.S. dollar denominated investments that vary fromthe amounts ultimately needed to hedge our exposure to changes in the U.S. dollar equivalent of earnings and equity ofthese operations, may adversely affect our results of operations, cash flows or financial condition.
In addition, conducting and increasing our international operations subjects us to new risks that, generally, we have notfaced in the U.S., including: (i) unexpected changes in foreign regulatory requirements, (ii) difficulties in managing andstaffing international operations, (iii) potentially adverse tax consequences, including the complexities of foreign valueadded tax systems and restrictions on the repatriation of earning, (iii) the localization of our solutions and related costs,(iv) the burdens of complying with a wide variety of foreign laws and different legal standards, including laws andregulations; (v) increased financial accounting and reporting burdens and complexities; and (vi) political, social andeconomic instability abroad. The occurrence of any one of these risks could negatively affect our international businessand, consequently, our results of operations generally. Additionally, operating in international markets also requiressignificant management attention and financial resources. We cannot be certain that the investment and additionalresources required in establishing, acquiring or integrating operations in other countries will produce desired levels ofrevenues or profitability.
The occurrence of natural or man-made disasters and catastrophes could adversely affect our results ofoperations and financial condition.The occurrence of natural disasters and catastrophes, including earthquakes, hurricanes, floods, tornadoes, fires,blackouts, severe winter weather, explosions, pandemic disease and man-made disasters, including acts of terrorism,insurrections and military actions, could adversely affect our results of operations or financial condition. Such disasters andcatastrophes may damage our facilities, preventing our employees and financial advisors from performing their roles orotherwise disturbing our ordinary business operations and by impacting insurance claims, as described below. Theseimpacts could be particularly severe to the extent they affect our computer-based data processing, transmission, storageand retrieval systems and destroy or release valuable data. Such disasters and catastrophes may also impact us indirectly
35

by changing the condition and behaviors of our customers, business counterparties and regulators, as well as by causingdeclines or volatility in the economic and financial markets.
The potential effects of natural and man-made disasters and catastrophes on certain of our businesses include but are notlimited to the following: (i) a catastrophic loss of life may materially increase the amount of or accelerate the timing inwhich benefits are paid under our insurance policies; (ii) significant widespread property damage may materially increasethe amount of claims submitted under our property casualty insurance policies; (iii) an increase in claims and any resultingincrease in claims reserves caused by a disaster may harm the financial condition of our reinsurers, thereby impacting thecost and availability of reinsurance and the probability of default on reinsurance recoveries; and (iv) declines and volatilityin the financial markets may decrease the value of our assets under management and administration, which could harmour financial condition and reduce our management fees.
We cannot predict the timing and frequency with which natural and man-made disasters and catastrophes may occur, norcan we predict the impact that changing climate conditions may have on the frequency and severity of natural disasters oron overall economic stability and sustainability. As such, we cannot be sure that our actions to identify and mitigate therisks associated with such disasters and catastrophes, including predictive modeling, establishing liabilities for expectedclaims, acquiring insurance and reinsurance and developing business continuity plans, will be effective.
Legal, Regulatory and Tax Risks
Legal and regulatory actions are inherent in our businesses and could result in financial losses or harm ourbusinesses.We are, and in the future may be, subject to legal and regulatory actions in the ordinary course of our operations, bothdomestically and internationally. Actions brought against us may result in awards, settlements, penalties, injunctions orother adverse results, including reputational damage. In addition, we may incur significant expenses in connection with ourdefense against such actions regardless of their outcome. Various regulatory and governmental bodies have the authorityto review our products and business practices and those of our employees and independent financial advisors and to bringregulatory or other legal actions against us if, in their view, our practices, or those of our employees or advisors, areimproper. Pending legal and regulatory actions include proceedings relating to aspects of our businesses and operationsthat are specific to us and proceedings that are typical of the industries and businesses in which we operate. Some ofthese proceedings have been brought on behalf of various alleged classes of complainants. In certain of these matters, theplaintiffs are seeking large and/or indeterminate amounts, including punitive or exemplary damages. See Item 3 of thisAnnual Report on Form 10-K — ‘‘Legal Proceedings.’’ In or as a result of turbulent times, the volume of claims andamount of damages sought in litigation and regulatory proceedings generally increase.
Our businesses are regulated heavily, and changes to the laws and regulations applicable to our businesses mayhave an adverse effect on our operations, reputation and financial condition.Virtually all aspects of our business, including the activities of our parent company and our various subsidiaries, are subjectto various federal, state and international laws and regulations. For a discussion of the regulatory framework in which weoperate, see Item 1 of this Annual Report on Form 10-K — ‘‘Business — Regulation.’’ Compliance with these applicablelaws and regulations is time-consuming and personnel-intensive, and we have invested and will continue to investsubstantial resources to ensure compliance by our parent company and our subsidiaries, directors, officers, employees,registered representatives and agents. Any enforcement actions, investigations or other proceedings brought against us orour subsidiaries, directors, employees or advisors by our regulators may result in fines, injunctions or other disciplinaryactions that could harm our reputation or impact our results of operations. Further, any changes to the laws andregulations applicable to our businesses, as well as changes to the interpretation and enforcement of such laws andregulations, may affect our operations and financial condition. Such changes may impact our operations and profitabilityand the practices of our advisors, including with respect to the scope of products and services provided, the manner inwhich products and services are marketed and sold and the incurrence of additional costs of doing business. Ongoingchanges to regulation and oversight of the financial industry may produce results, the full impact of which cannot beimmediately ascertained. In addition, we expect the worldwide demographic trend of population aging will causepolicymakers to continue to focus on the framework of U.S. and non-U.S. retirement systems, which may drive additionalchanges regarding the manner in which individuals plan for and fund their retirement, the extent of governmentinvolvement in retirement savings and funding, the regulation of retirement products and services and the oversight ofindustry participants. For example, we continue to see enhanced legislative and regulatory interest regarding retirementinvesting, financial advisors and investment professionals, and we will continue to closely review and monitor any legislativeor regulatory proposals and changes. Any incremental requirements, costs and risks imposed on us in connection withsuch current or future legislative or regulatory changes may constrain our ability to market our products and services topotential customers, and could negatively impact our profitability and make it more difficult for us to pursue our growthstrategy.
36

Certain examples of legislative and regulatory changes that may impact our businesses are described below. Some of thechanges resulting from rules and regulations called for under the Dodd-Frank Act could present operational challenges andincrease costs. For example, in the area of derivatives, higher margin and capital requirements, coupled with morerestrictive collateral rules, could impact our ability to effectively manage and hedge risk. Ultimately these complexities andincreased costs could have an impact on our ability to offer cost-effective and innovative insurance products to our clients.
As a result of our deregistration as a savings and loan holding company, we are no longer subject to regulation, supervisionand examination as such by the Board of Governors for the FRB. However, the Dodd-Frank Act authorizes the FinancialStability Oversight Committee (‘‘FSOC’’) to designate certain non-bank institutions as systemically important financialinstitutions subject to regulation as such by the FRB. In the event we are so designated in the future, we would again besubject to enhanced supervision and prudential standards, including requirements related to risk-based capital, leverage,liquidity, credit exposure, stress-testing, resolution plans, early remediation, and certain risk management requirements.Any such designation could cause us to alter our business practices or otherwise adversely impact our results of operation.
In September 2013, at the FSOC’s request, the OFR issued a report entitled ‘‘Asset Management and Financial Stability’’discussing whether the asset-management industry of selected firms should be subject to enhanced prudential standardsand functional supervision. Although the report remains under significant scrutiny, the scope of the FSOC’s focus on theasset management industry continues to evolve, and our asset management businesses are currently under the illustrativeassets under management thresholds mentioned in the report as possible triggers for increased supervision, potentialimpacts on our asset management businesses could include additional reporting requirements, redemption restrictions,imposition of standardized risk management practices, imposition of securities lending and cash collateral reinvestmentpractices, personnel compensation restrictions, and consolidated supervision of asset managers and their parentcompanies, any of which could adversely affect our results of operations.
Any mandated reductions or restructuring of the fees we charge for our products and services resulting from regulatoryinitiatives or proceedings could reduce our revenues and/or earnings. Fees paid by mutual funds in accordance with plansand agreements of distribution adopted under Rule 12b-1 promulgated under the Investment Company Act and by othersources of managed products are commonly found as a means for product manufacturers and distribution platforms toaddress the costs of these products and investor education. The SEC has in the past and could again propose measuresthat would establish a new framework to repeal Rule 12b-1. Certain industry-wide reduction or restructuring of Rule 12b-1fees, or other servicing fees, could impact our ability to distribute our own mutual funds and/or the fees we receive fordistributing other companies’ mutual funds, which could, in turn, impact our revenues and/or earnings.
On April 20, 2015, the Department of Labor proposed regulations seeking to change the definition of who is an investmentadvice fiduciary under ERISA and how such advice can be provided to account holders in 401(k) plans and IRAs and othertypes of ERISA clients. On January 29, 2016, after a lengthy public comment period and public hearing, the Department ofLabor sent a proposed fiduciary rule to the Office of Management and Budget where the rule remains confidential until thefinal rule is published in the Federal Register. These regulations focus on conflicts of interest related to investmentrecommendations made by financial advisors or registered investment advisors to clients holding qualified accounts andother types of ERISA clients as well as how financial advisors are able to discuss IRA rollovers. Qualified accounts,specifically IRAs, make up a significant portion of our assets under management and administration. We are continuing toreview and analyze the potential impact of the proposed regulations on our clients and prospective clients as well as thepotential impact on our business. We cannot predict how any final regulations may differ from the proposed regulation. Iffinal regulations were to be issued with provisions substantially similar to the proposed regulations, they could impact howwe receive fees, how we compensate our advisors, how we are able to retain advisors, and how we design our investmentsand services for qualified accounts, any of which could negatively impact our results of operations.
Our insurance companies are subject to state regulation and must comply with statutory reserve and capital requirements.State regulators, as well as the NAIC, continually review and update these requirements and other requirements relating tothe business operations of insurance companies, including their underwriting and sales practices and their use of affiliatedcaptive insurers. Changes in these requirements that are made for the benefit of the consumer sometimes lead toadditional expense for the insurer and, thus, could have a material adverse effect on our financial condition and results ofoperations. In December 2012, the NAIC adopted a new reserve valuation manual that applies principles-based reservestandards to life insurance products. The valuation manual becomes the effective reserve valuation method for theRiverSource Life companies when adopted by 42 jurisdictions that account for at least 75% of U.S. insurance premiumscombined and by Minnesota and New York. To date, 39 states have adopted the valuation manual, which does not includeMinnesota or New York. A three-year transition period is available to defer implementation of this reserve standard. Therequirement for principles-based life insurance reserves may result in statutory reserves being more sensitive to changes ininterest rates, policyholder behavior and other market factors. It is not possible at this time to estimate the potentialimpact of future changes in statutory reserve and capital requirements on our insurance businesses. Further, we cannotpredict the effect that proposed federal legislation may have on our businesses or competitors, such as the option offederally chartered insurers, a mandated federal systemic risk regulator, future initiatives of the FIO within the Department
37

of the Treasury or by any of the Domiciliary Regulators or the International Association of Insurance Supervisors withrespect to insurance holding company supervision, capital standards or systemic risk regulation. For additional discussionon the role and activities of the FIO, see the information provided under the heading ‘‘Regulation — Insurance Regulation’’contained in Part I, Item 1 of this Annual Report on Form 10-K.
Changes in the supervision and regulation of the financial industry, both domestically and internationally, couldmaterially impact our results of operations, financial condition and liquidity.The Dodd-Frank Act, enacted into law in 2010 called for sweeping changes in the supervision and regulation of thefinancial services industry designed to provide for greater oversight of financial industry participants, reduce risk in bankingpractices and in securities and derivatives trading, enhance public company corporate governance practices and executivecompensation disclosures, and provide greater protections to individual consumers and investors. Certain elements of theDodd-Frank Act became effective immediately, though the details of other provisions remain subject to additional studiesand will not be known until regulatory agencies adopt final rules. The full impact of the Dodd-Frank Act on our company,the financial industry and the economy cannot be known until the rules and regulations called for under the Act have beenfinalized, and, in some cases, implemented over time.
Accordingly, while certain elements of these reforms have yet to be finalized and implemented, the Act has impacted andis expected to further impact the manner in which we market our products and services, manage our company and itsoperations and interact with regulators, all of which could materially impact our results of operations, financial conditionand liquidity. Certain provisions of the Dodd-Frank Act that may impact our business include but are not limited to theestablishment of a fiduciary standard for broker-dealers, the resolution authority granted to the FDIC, changes in regulatoryoversight and greater oversight over derivatives instruments and trading. We will need to respond to changes to theframework for the supervision of U.S. financial institutions, including the actions of the FSOC. To the extent the Dodd-FrankAct or other new regulation of the financial services industry impacts the operations, financial condition, liquidity andcapital requirements of unaffiliated financial institutions with whom we transact business, those institutions may seek topass on increased costs, reduce their capacity to transact, or otherwise present inefficiencies in their interactions with us.
It is uncertain whether the Dodd-Frank Act, the rules and regulations developed thereunder, or any future legislationdesigned to stabilize the financial markets, the economy generally, or provide better protections to consumers, will havethe intended effect. Any new domestic or international legislation or regulatory changes could require us to change certainbusiness practices, impose additional costs, or otherwise adversely affect our business operations, regulatory reportingrelationships, results of operations or financial condition. Consequences may include substantially higher compliance costsas well as material effects on fee rates, interest rates and foreign exchange rates, which could materially impact ourinvestments, results of operations and liquidity in ways that we cannot predict. In addition, prolonged government supportfor, and intervention in the management of, private institutions could distort customary and expected commercial behavioron the part of those institutions, adversely impacting us.
In recent years, other national and international authorities have also proposed measures intended to increase theintensity of regulation of financial institutions, requiring greater coordination among regulators and efforts to harmonizeregulatory regimes. These measures have included enhanced risk-based capital requirements, leverage limits, liquidity andtransparency requirements, single counterparty exposure limits, governance requirements for risk management, stress-testrequirements, debt-to-equity limits for certain companies, early remediation procedures, resolution and recovery planningand guidance for maintaining appropriate risk culture. Our international operations and our worldwide consolidatedoperations are subject to the jurisdiction of certain of these non-U.S. authorities and may be materially adversely affectedby their actions and decisions. Potential measures taken by foreign and international authorities also include thenationalization or expropriation of assets, the imposition of limits on foreign ownership of local companies, changes in laws(including tax laws and regulations) and in their application or interpretation, imposition of large fines, political instability,dividend limitations, price controls, changes in applicable currency, currency exchange controls, or other restrictions thatprevent us from transferring funds from these operations out of the countries in which they operate or converting localcurrencies we hold to U.S. dollars or other currencies. Any of these changes or actions may negatively affect our business.A further result of our non-U.S. operations is that we are subject to regulation by non-U.S. regulators and U.S. regulatorssuch as the Department of Justice and the SEC with respect to the Foreign Corrupt Practices Act of 1977. We expect thescope and extent of regulation outside the U.S., as well as general regulatory oversight, to continue to increase.
We may not be able to protect our intellectual property and may be subject to infringement claims.We rely on a combination of contractual rights and copyright, trademark, patent and trade secret laws to establish andprotect our intellectual property. Although we use a broad range of measures to protect our intellectual property rights,third parties may infringe or misappropriate our intellectual property. We may have to litigate to enforce and protect ourcopyrights, trademarks, patents, trade secrets and know-how or to determine their scope, validity or enforceability, whichrepresents a diversion of resources that may be significant in amount and may not prove successful. The loss of
38
intellectual property protection or the inability to secure or enforce the protection of our intellectual property assets couldhave a material adverse effect on our business and our ability to compete.
We also may be subject to costly litigation in the event that another party alleges our operations or activities infringe uponor constitute misappropriation of such other party’s intellectual property rights. Third parties may have, or may eventuallybe issued, patents or other protections that could be infringed by our products, methods, processes or services or couldotherwise limit our ability to offer certain product features. Any party that holds such a patent could make a claim ofinfringement against us. We may also be subject to claims by third parties for breach of copyright, trademark, licenseusage rights, or misappropriation of trade secret rights. Any such claims and any resulting litigation could result insignificant liability for damages. If we were found to have infringed or misappropriated a third-party patent or otherintellectual property rights, we could incur substantial liability, and in some circumstances could be enjoined from providingcertain products or services to our customers or utilizing and benefiting from certain methods, processes, copyrights,trademarks, trade secrets or licenses, or alternatively could be required to enter into costly licensing arrangements withthird parties, all of which could have a material adverse effect on our business, results of operations and financialcondition.
Changes in and the adoption of accounting standards or inaccurate estimates or assumptions in applyingaccounting policies could have a material impact on our financial statements.Our accounting policies and methods are fundamental to how we record and report our financial condition and results ofoperations. Some of these policies require use of estimates and assumptions that may affect the reported value of ourassets or liabilities and results of operations and are critical because they require management to make difficult,subjective, and complex judgments about matters that are inherently uncertain. If those assumptions, estimates orjudgments were incorrectly made, we could be required to correct and restate prior period financial statements.
We prepare our financial statements in accordance with U.S. generally accepted accounting principles. From time to time,the Financial Accounting Standards Board, the SEC and other regulators may change the financial accounting andreporting standards governing the preparation of our financial statements. In some cases, we could be required to apply anew or revised standard retroactively, resulting in our restating prior period financial statements. These changes are difficultto predict, and could impose additional governance, internal control and disclosure demands. It is possible that suchchanges could have a material adverse effect on our financial condition and results of operations.
Changes in U.S. federal income or estate tax law could make some of our products less attractive to clients.Many of the products we issue or on which our businesses are based (including both insurance products andnon-insurance products) receive favorable treatment under current U.S. federal income or estate tax law. Changes in U.S.federal income or estate tax law could reduce or eliminate the tax advantages of certain of our products and thus makesuch products less attractive to clients.
Changes in corporate tax laws and regulations and in the interpretation of such laws and regulations, as well as adversedeterminations regarding the application of such laws and regulations, could adversely affect our earnings.
We are subject to the income tax laws of the U.S., its states and municipalities and those of the foreign jurisdictions inwhich we have significant business operations. These tax laws are complex and may be subject to different interpretations.We must make judgments and interpretations about the application of these inherently complex tax laws when determiningthe provision for income taxes and must also make estimates about when in the future certain items affect taxable incomein the various tax jurisdictions. Disputes over interpretations of the tax laws may be settled with the taxing authority uponexamination or audit. In addition, changes to the Internal Revenue Code, administrative rulings or court decisions couldincrease our provision for income taxes and reduce our earnings.
It is possible there will be corporate tax reform in the next few years. While impossible to predict, corporate tax reform islikely to include a reduction in the corporate tax rate coupled with reductions in tax preferred items. Potential tax reformmay also affect the U.S. tax rules regarding international operations. Any changes could have a material impact on ourincome tax expense and deferred tax balances.
Risks Relating to Our Common Stock
The market price of our shares may fluctuate.The market price of our common stock may fluctuate widely, depending upon many factors, some of which may be beyondour control, including: (i) changes in expectations concerning our future financial performance and the future performanceof the financial services industry in general, including financial estimates and recommendations by securities analysts;(ii) differences between our actual financial and operating results and those expected by investors and analysts; (iii) ourstrategic moves and those of our competitors, such as acquisitions, divestitures or restructurings; (iv) changes in theregulatory framework of the financial services industry and regulatory action; (v) changes in and the adoption of accounting
39

standards and securities and insurance rating agency processes and standards applicable to our businesses and thefinancial services industry; and (vi) changes in general economic or market conditions.
Stock markets in general have experienced volatility that has often been unrelated to the operating performance of aparticular company. These broad market fluctuations may adversely affect the trading price of our common stock.
Provisions in our certificate of incorporation and bylaws and of Delaware law may prevent or delay anacquisition of our company, which could decrease the market value of our common stock.Our certificate of incorporation and bylaws and Delaware law contain provisions intended to deter coercive takeoverpractices and inadequate takeover bids by making them unacceptably expensive to the raider and to encourageprospective acquirers to negotiate with our board of directors rather than to attempt a hostile takeover. These provisionsinclude, among others: (i) elimination of the right of our shareholders to act by written consent; (ii) rules regarding howshareholders may present proposals or nominate directors for election at shareholder meetings, either directly or throughproxies; (iii) the right of our board of directors to issue preferred stock without shareholder approval; and (iv) limitations onthe rights of shareholders to remove directors.
Delaware law also imposes some restrictions on mergers and other business combinations between us and anyholder of 15% or more of our outstanding common stock.We believe these provisions protect our shareholders from coercive or otherwise unfair takeover tactics by requiringpotential acquirers to negotiate with our board of directors and by providing our board of directors time to assess anyacquisition proposal. They are not intended to make our company immune from takeovers. However, these provisions applyeven if the offer may be considered beneficial by some shareholders and could delay or prevent an acquisition that ourboard of directors determines is not in the best interests of our company and our shareholders.
The issuance of additional shares of our common stock or other equity securities may result in a dilution ofinterest or adversely affect the price of our common stock.Our certificate of incorporation allows our directors to authorize the issuance of additional shares of our common stock, aswell as other forms of equity or securities that may be converted into equity securities, without shareholder approval. Wehave in the past and may in the future issue additional equity or convertible securities in order to raise capital, inconnection with acquisitions or for other purposes. Any such issuance may result in a significant dilution in the interests ofour current shareholders and adversely impact the market price of our common stock.
Item 1B. Unresolved Staff Comments
None.
Item 2. Properties
We operate our business from two principal locations, both of which are located in Minneapolis, Minnesota: the AmeripriseFinancial Center, an 848,000 square foot building that we lease, and our 885,000 square foot Client Service Center,which we own. Our lease term for the Ameriprise Financial Center began in November 2000 and extends for 20 years, withseveral options to extend the term. Our aggregate annual rent for the Ameriprise Financial Center is $15 million.Ameriprise Financial, Inc. also: (i) owns the 171,000 square foot Oak Ridge Conference Center, a training facility andconference center in Chaska, Minnesota, which can also serve as a disaster recovery site, if necessary; and (ii) owns a99,000 square foot service center in Las Vegas, Nevada that houses certain Ameriprise Advisor Center, Ameriprise Auto &Home Insurance, service delivery, technology and human resources employees.
Ameriprise Auto and Home Insurance leases approximately 132,000 square feet at its corporate headquarters in DePere,Wisconsin, a suburb of Green Bay. The lease has a twenty-year term expiring in 2024 with an option to renew the lease forup to six renewal terms of five years each. Ameriprise Auto and Home Insurance also leases a 34,000 square foot officespace in Phoenix, Arizona with a lease term expiring in 2019.
Threadneedle moved to new office space in London in early 2015 where it occupies approximately 65,000 square feet ofa shared building under a lease expiring in 2029. In addition, Threadneedle also leases an office in Swindon, UK where itoccupies approximately 8,000 square feet. Threadneedle also leases property in a number of other cities to support itsglobal operations, including in Chile, Denmark, Dubai, France, Germany, Geneva, Netherlands, Hong Kong, Luxembourg,Malaysia, Singapore, Spain, Taiwan and South Korea.
Columbia Management leases offices in Boston containing approximately 156,000 square feet under a lease that expiresin 2021 and facilities in New York City containing approximately 90,000 square feet under a lease expiring in 2019. In
40

addition, Seligman occupies a space of approximately 11,000 square feet in Menlo Park, California under a lease thatexpires in 2023, and Columbia Wanger leases 48,000 square feet in Chicago, Illinois under a lease that expires in 2019.
AFSI leases offices containing approximately 12,000 square feet in Troy, Michigan, under a lease expiring in 2017.
Generally, we lease the premises we occupy in other locations, including the executive offices that we maintain in New YorkCity and branch offices for our employee advisors throughout the United States. In Gurgaon, India we lease officescontaining approximately 106,000 square feet which are used primarily in the support of our businesses in the UnitedStates. We believe that the facilities owned or occupied by our company suit our needs and are well maintained.
Item 3. Legal Proceedings
For a discussion of material legal proceedings, see Note 23 to our Consolidated Financial Statements included in Part II,Item 8 of this Annual Report on Form 10-K, which is incorporated herein by reference.
Item 4. Mine Safety Disclosures
Not applicable.
41

PART II.Item 5. Market for Registrant’s Common Equity, Related Stockholder Matters andIssuer Purchases of Equity Securities
Our common stock trades principally on The New York Stock Exchange under the trading symbol AMP. As of February 12,2016, we had approximately 15,429 common shareholders of record. Price and dividend information concerning ourcommon shares may be found in Note 26 to our Consolidated Financial Statements included in Part II, Item 8 of thisAnnual Report on Form 10-K. Information regarding our equity compensation plans can be found in Part III, Item 12 of thisAnnual Report on Form 10-K. Information comparing the cumulative total shareholder return on our common stock to thecumulative total return for certain indices is set forth under the heading ‘‘Performance Graph’’ provided in our 2015 AnnualReport to Shareholders and is incorporated herein by reference.
We are primarily a holding company and, as a result, our ability to pay dividends in the future will depend on receivingdividends from our subsidiaries. For information regarding our ability to pay dividends, see the information set forth underthe heading ‘‘Management’s Discussion and Analysis of Financial Condition and Results of Operations — Liquidity andCapital Resources’’ contained in Part II, Item 7 of this Annual Report on Form 10-K.
Share RepurchasesThe following table presents the information with respect to purchases made by or on behalf of Ameriprise Financial, Inc.or any ‘‘affiliated purchaser’’ (as defined in Rule 10b-18(a)(3) under the Securities Exchange Act of 1934), of our commonstock during the fourth quarter of 2015:
(a) (b) (c) (d)Total Number of
Shares Purchased as Approximate Dollar ValueTotal Number part of Publicly of Shares that May Yet Be
of Shares Average Price Announced Plans Purchased Under the PlansPeriod Purchased Paid Per Share or Programs(1) or Programs(1)
October 1 to October 31, 2015Share repurchase program(1) 1,224,152 $ 111.86 1,224,152 $ 416,551,831Employee transactions(2) 9,567 $ 114.05 N/A N/A
November 1 to November 30, 2015Share repurchase program(1) 1,215,928 $ 115.10 1,215,928 $ 276,592,969Employee transactions(2) 14,615 $ 116.21 N/A N/A
December 1 to December 31, 2015Share repurchase program(1) 1,599,649 $ 108.08 1,599,649 $ 2,603,697,324Employee transactions(2) 1,709 $ 110.79 N/A N/A
TotalsShare repurchase program(1) 4,039,729 $ 111.34 4,039,729Employee transactions(2) 25,891 $ 115.05 N/A
4,065,620 4,039,729
N/A Not applicable.(1) On April 28, 2014, we announced that our Board of Directors authorized us to repurchase up to $2.5 billion worth of our common
stock through April 28, 2016. On December 7, 2015, we announced that our Board of Directors authorized us to repurchase up toan additional $2.5 billion worth of our common stock through December 31, 2017. The share repurchase programs do not requirethe purchase of any minimum number of shares, and depending on market conditions and other factors, these purchases may becommenced or suspended at any time without prior notice. Acquisitions under the share repurchase programs may be made in theopen market, through privately negotiated transactions or block trades or other means.
(2) Includes restricted shares withheld pursuant to the terms of awards under the Company’s share-based compensation plans to offsettax withholding obligations that occur upon vesting and release of restricted shares. The value of the restricted shares withheld is theclosing price of common stock of Ameriprise Financial, Inc. on the date the relevant transaction occurs. Also includes shares withheldpursuant to the net settlement of Non-Qualified Stock Option (‘‘NQSO’’) exercises to offset tax withholding obligations that occur uponexercise and to cover the strike price of the NQSO. The value of the shares withheld pursuant to the net settlement of NQSOexercises is the closing price of common stock of Ameriprise Financial, Inc. on the day prior to the date the relevant transactionoccurs.
42

Item 6. Selected Financial Data
The following table sets forth selected consolidated financial information derived from our audited Consolidated FinancialStatements as of December 31, 2015, 2014, 2013, 2012 and 2011 and for the five-year period ended December 31,2015. The selected financial data presented below should be read in conjunction with our Consolidated FinancialStatements and Notes included elsewhere in this report and ‘‘Management’s Discussion and Analysis of FinancialCondition and Results of Operations.’’
Years Ended December 31,
2015 2014 2013 2012 2011
(in millions, except per share data)Income Statement Data:Total net revenues $ 12,170 $ 12,268 $ 11,199 $ 10,217 $ 10,192Total expenses 10,028 9,721 9,229 8,979 8,745
Income from continuing operations $ 1,687 $ 2,002 $ 1,478 $ 903 $ 1,070Loss from discontinued operations, net of tax — (2) (3) (2) (60)
Net income 1,687 2,000 1,475 901 1,010Less: Net income (loss) attributable to noncontrolling
interests 125 381 141 (128) (106)
Net income attributable to Ameriprise Financial $ 1,562 $ 1,619 $ 1,334 $ 1,029 $ 1,116
Earnings Per Share Attributable to AmeripriseFinancial, Inc. Common Shareholders:Basic
Income from continuing operations $ 8.60 $ 8.46 $ 6.58 $ 4.71 $ 4.87Loss from discontinued operations — (0.01) (0.02) (0.01) (0.25)
Net income $ 8.60 $ 8.45 $ 6.56 $ 4.70 $ 4.62
DilutedIncome from continuing operations $ 8.48 $ 8.31 $ 6.46 $ 4.63 $ 4.77Loss from discontinued operations — (0.01) (0.02) (0.01) (0.24)
Net income $ 8.48 $ 8.30 $ 6.44 $ 4.62 $ 4.53
Cash Dividends Declared Per Common Share $ 2.59 $ 2.26 $ 2.01 $ 1.15 $ 1.15
December 31,
2015 2014 2013 2012 2011
(in millions)Balance Sheet Data:Investments(1) $ 34,144 $ 35,582 $ 35,735 $ 36,877 $ 39,953Separate account assets 80,349 83,256 81,223 72,397 66,780Total assets 145,259 148,810 144,576 134,729 132,307Policyholder account balances, future policy benefits
and claims 29,699 30,350 29,620 31,217 31,710Separate account liabilities 80,349 83,256 81,223 72,397 66,780Customer deposits 8,634 7,664 7,062 6,526 9,850Long-term debt(1) 2,707 3,062 2,720 2,403 2,393Short-term borrowings 200 200 500 501 504Total liabilities 136,854 139,505 135,344 125,017 122,613Total Ameriprise Financial, Inc. shareholders’ equity 7,217 8,124 8,192 9,092 8,988Noncontrolling interests’ equity 1,188 1,181 1,040 620 706(1) Represents amounts before consolidated investment entities, as reported on our Consolidated Balance Sheets.
43

Item 7. Management’s Discussion and Analysis of Financial Condition and Resultsof Operations
The following discussion and analysis of our consolidated financial condition and results of operations should be read inconjunction with the ‘‘Forward-Looking Statements,’’ our Consolidated Financial Statements and Notes that follow and the‘‘Consolidated Five-Year Summary of Selected Financial Data’’ and the ‘‘Risk Factors’’ included in our Annual Report onForm 10-K. References to ‘‘Ameriprise Financial,’’ ‘‘Ameriprise,’’ the ‘‘Company,’’ ‘‘we,’’ ‘‘us,’’ and ‘‘our’’ refer to AmeripriseFinancial, Inc. exclusively, to our entire family of companies, or to one or more of our subsidiaries.
OverviewAmeriprise Financial is a diversified financial services company with a more than 120 year history of providing financialsolutions. We offer a broad range of products and services designed to achieve the financial objectives of individual andinstitutional clients. We are America’s leader in financial planning and a leading global financial institution with more than$776 billion in assets under management and administration as of December 31, 2015. For additional discussion of ourbusinesses, see Part I, Item 1 of this Annual Report on Form 10-K.
The financial results from the businesses underlying our go-to-market approaches are reflected in our five operatingsegments:
• Advice & Wealth Management;
• Asset Management;
• Annuities;
• Protection; and
• Corporate & Other.
Our operating segments are aligned with the financial solutions we offer to address our clients’ needs. The products andservices we provide retail clients and, to a lesser extent, institutional clients, are the primary source of our revenues andnet income. Revenues and net income are significantly affected by investment performance and the total value andcomposition of assets we manage and administer for our retail and institutional clients as well as the distribution fees wereceive from other companies. These factors, in turn, are largely determined by overall investment market performance andthe depth and breadth of our individual client relationships.
Financial markets and macroeconomic conditions have had and will continue to have a significant impact on our operatingand performance results. In addition, the business and regulatory environment in which we operate remains subject toelevated uncertainty and change. To succeed, we expect to continue focusing on our key strategic objectives. The successof these and other strategies may be affected by the factors discussed in Item 1A of this Annual Report on Form 10-K —‘‘Risk Factors.’’
Equity price, credit market and interest rate fluctuations can have a significant impact on our results of operations,primarily due to the effects they have on the asset management and other asset-based fees we earn, the ‘‘spread’’income generated on our fixed annuities, fixed insurance, deposit products and the fixed portion of variable annuities andvariable insurance contracts, the value of deferred acquisition costs (‘‘DAC’’) and deferred sales inducement costs(‘‘DSIC’’) assets, the values of liabilities for guaranteed benefits associated with our variable annuities and the values ofderivatives held to hedge these benefits.
Earnings, as well as operating earnings, will continue to be negatively impacted by the ongoing low interest rateenvironment. In addition to continuing spread compression in our interest sensitive product lines, a sustained low interestrate environment may result in increases to our reserves and changes in various rate assumptions we use to amortize DACand DSIC, which may negatively impact our operating earnings. For additional discussion on our interest rate risk, seeItem 7A. ‘‘Quantitative and Qualitative Disclosures About Market Risk.’’
In the third quarter of the year, we conduct our annual review of life insurance and annuity valuation assumptions relativeto current experience and management expectations. To the extent that expectations change as a result of this review, weupdate valuation assumptions and the impact is reflected as part of our annual review of life insurance and annuityvaluation assumptions and modeling changes (‘‘unlocking’’). The favorable unlocking impact in 2015 primarily reflectedimproved policyholder behavior, an update to market-related inputs related to our living benefit valuation and modelchanges that more than offset the difference between our previously assumed interest rates versus the continued lowinterest rate environment. In addition, our annual review of our closed long term care business resulted in no lossrecognition as better-than-expected premium increases, which were reflected in our projections, offset higher morbidity andlower interest rates. The unfavorable unlocking impact in 2014 primarily reflected lower than previously assumed interest
44

rates, partially offset by a benefit from updating our variable annuity living benefit withdrawal utilization assumption. Seeour Consolidated and Segment Results of Operations sections below for the pretax impacts on our revenues and expensesattributable to unlocking and additional discussion of the drivers of the unlocking impact.
We consolidate certain collateralized loan obligations (‘‘CLOs’’) and property funds for which we provide asset managementservices. These entities are defined as consolidated investment entities (‘‘CIEs’’). While the consolidation of the CIEsimpacts our balance sheet and income statement, our exposure to these entities is unchanged and there is no impact tothe underlying business results. For further information on CIEs, see Note 4 to our Consolidated Financial Statements.Changes in the valuation of the CIE assets and liabilities impact pretax income. The net income (loss) of the CIEs isreflected in net income (loss) attributable to noncontrolling interests. The results of operations of the CIEs are reflected inthe Corporate & Other segment. On a consolidated basis, the management fees we earn for the services we provide to theCIEs and the related general and administrative expenses are eliminated and the changes in the assets and liabilitiesrelated to the CIEs, primarily syndicated loans and debt, are reflected in net investment income. We continue to includethe fees from these entities in the management and financial advice fees line within our Asset Management segment.
While our consolidated financial statements are prepared in accordance with U.S. generally accepted accounting principles(‘‘GAAP’’), management believes that operating measures, which exclude net realized investment gains or losses, net ofthe related DSIC and DAC amortization, unearned revenue amortization and the reinsurance accrual; the market impact onvariable annuity guaranteed benefits, net of hedges and the related DSIC and DAC amortization; the market impact onindexed universal life benefits, net of hedges and the related DAC amortization, unearned revenue amortization and thereinsurance accrual; the market impact of hedges to offset interest rate changes on unrealized gains or losses for certaininvestments; integration and restructuring charges; income (loss) from discontinued operations; and the impact ofconsolidating CIEs, best reflect the underlying performance of our core operations and facilitate a more meaningful trendanalysis. Management uses certain of these non-GAAP measures to evaluate our financial performance on a basiscomparable to that used by some securities analysts and investors. Also, certain of these non-GAAP measures are takeninto consideration, to varying degrees, for purposes of business planning and analysis and for certain compensation-relatedmatters. Throughout our Management’s Discussion and Analysis, these non-GAAP measures are referred to as operatingmeasures. These non-GAAP measures should not be viewed as a substitute for U.S. GAAP measures.
It is management’s priority to increase shareholder value over a multi-year horizon by achieving our on-average, over-timefinancial targets.
Our financial targets are:
• Operating total net revenue growth of 6% to 8%,
• Operating earnings per diluted share growth of 12% to 15%, and
• Operating return on equity excluding accumulated other comprehensive income (‘‘AOCI’’) of 19% to 23%.
The following tables reconcile our GAAP measures to operating measures:
Years EndedDecember 31,
2015 2014
(in millions)Total net revenues $ 12,170 $ 12,268Less: Revenue attributable to CIEs 446 651Less: Net realized investment gains 4 37Less: Market impact on indexed universal life benefits 7 (11)Less: Market impact of hedges on investments (21) —
Operating total net revenues $ 11,734 $ 11,591
45

Per Diluted ShareYears Ended Years Ended
December 31, December 31,
2015 2014 2015 2014
(in millions, except per share amounts)Net income $ 1,687 $ 2,000Less: Net income attributable to noncontrolling interests 125 381
Net income attributable to Ameriprise Financial 1,562 1,619 $ 8.48 $ 8.30Less: Loss from discontinued operations, net of tax — (2) — (0.01)
Net income from continuing operations attributable to Ameriprise Financial 1,562 1,621 8.48 8.31Add: Integration/restructuring charges, net of tax(1) 3 — 0.02 —Add: Market impact on variable annuity guaranteed benefits, net of tax(1) 139 61 0.75 0.31Add: Market impact on indexed universal life benefits, net of tax(1) 1 4 0.01 0.02Add: Market impact of hedges on investments, net of tax(1) 14 — 0.08 —Less: Net realized investment gains, net of tax(1) 3 24 0.02 0.12
Operating earnings $ 1,716 $ 1,662 $ 9.32 $ 8.52
Weighted average common shares outstanding:Basic 181.7 191.6Diluted 184.2 195.0
(1) Calculated using the statutory tax rate of 35%.
The following table reconciles the trailing twelve months’ sum of net income attributable to Ameriprise Financial tooperating earnings and the five-point average of quarter-end equity to operating equity:
Years EndedDecember 31,
2015 2014
(in millions)Net income attributable to Ameriprise Financial $ 1,562 $ 1,619Less: Loss from discontinued operations, net of tax — (2)
Net income from continuing operations attributable to Ameriprise Financial 1,562 1,621Less: Adjustments(1) (154) (41)
Operating earnings $ 1,716 $ 1,662
Total Ameriprise Financial, Inc. shareholders’ equity $ 7,808 $ 8,270Less: AOCI, net of tax 516 734
Total Ameriprise Financial, Inc. shareholders’ equity, excluding AOCI 7,292 7,536Less: Equity impacts attributable to CIEs 216 311
Operating equity $ 7,076 $ 7,225
Return on equity from continuing operations, excluding AOCI 21.4% 21.5%Operating return on equity, excluding AOCI(2) 24.3% 23.0%(1) Adjustments reflect the trailing twelve months’ sum of after-tax net realized investment gains/losses, net of DSIC and DAC
amortization, unearned revenue amortization and the reinsurance accrual; the market impact on variable annuity guaranteed benefits,net of hedges and related DSIC and DAC amortization; the market impact on indexed universal life benefits, net of hedges and therelated DAC amortization, unearned revenue amortization, and the reinsurance accrual; the market impact of hedges to offset interestrate change on unrealized gains or losses for certain investments; and integration and restructuring charges. After-tax is calculatedusing the statutory tax rate of 35%.
(2) Operating return on equity, excluding AOCI, is calculated using the trailing twelve months of earnings excluding the after-tax netrealized investment gains/losses, net of DSIC and DAC amortization, unearned revenue amortization and the reinsurance accrual;market impact on variable annuity guaranteed benefits, net of hedges and related DSIC and DAC amortization; the market impact onindexed universal benefits, net of hedges and the related DAC amortization, unearned revenue amortization, and the reinsuranceaccrual; the market impact of hedges to offset interest rate change on unrealized gains or losses for certain investments; integrationand restructuring charges; and discontinued operations in the numerator, and Ameriprise Financial shareholders’ equity, excludingAOCI and the impact of consolidating investment entities using a five-point average of quarter-end equity in the denominator. After-taxis calculated using the statutory rate of 35%.
Critical Accounting Policies and EstimatesThe accounting and reporting policies that we use affect our Consolidated Financial Statements. Certain of our accountingand reporting policies are critical to an understanding of our consolidated results of operations and financial condition and,in some cases, the application of these policies can be significantly affected by the estimates, judgments and assumptionsmade by management during the preparation of our Consolidated Financial Statements. The accounting and reportingpolicies and estimates we have identified as fundamental to a full understanding of our consolidated results of operations
46

and financial condition are described below. See Note 2 to our Consolidated Financial Statements for further informationabout our accounting policies.
Valuation of InvestmentsThe most significant component of our investments is our Available-for-Sale securities, which we carry at fair value withinour Consolidated Balance Sheets. The fair value of our Available-for-Sale securities at December 31, 2015 was primarilyobtained from third-party pricing sources. For a discussion on our accounting policies related to the valuation of ourinvestments and other-than-temporary impairments, see Note 2 and Note 14 to our Consolidated Financial Statements.
Deferred Acquisition CostsWe incur costs in connection with acquiring new and renewal insurance and annuity businesses. The portion of these costswhich are incremental and direct to the acquisition of a new or renewal insurance policy or annuity contract are deferred.Significant costs capitalized include sales based compensation related to the acquisition of new and renewal insurancepolicies and annuity contracts, medical inspection costs for successful sales, and a portion of employee compensation andbenefit costs based upon the amount of time spent on successful sales. Sales based compensation paid to advisors andemployees and third-party distributors is capitalized. Employee compensation and benefits costs which are capitalizedrelate primarily to sales efforts, underwriting and processing. All other costs which are not incremental direct costs ofacquiring an insurance policy or annuity contract are expensed as incurred.
We monitor principal DAC amortization assumptions, such as persistency, mortality, morbidity, interest margin, variableannuity benefit utilization and maintenance expense levels each quarter and, when assessed independently, each couldimpact our DAC balance.
The analysis of the DAC balance and the corresponding amortization is a dynamic process that considers all relevantfactors and assumptions described previously. Unless management identifies a significant deviation over the course of thequarterly monitoring, management reviews and updates these DAC amortization assumptions annually in the third quarterof each year.
Non-Traditional Long-Duration ProductsFor our non-traditional long-duration products (including variable and fixed annuity contracts, universal life (‘‘UL’’) andvariable universal life (‘‘VUL’’) insurance products), our DAC balance at any reporting date is based on projections thatshow management expects there to be estimated gross profits (‘‘EGPs’’) after that date to amortize the remaining balance.These projections are inherently uncertain because they require management to make assumptions about financialmarkets, mortality levels and contractholder and policyholder behavior over periods extending well into the future.Projection periods used for our annuity products are typically 30 to 50 years and for our UL insurance products 50 years orlonger. Management regularly monitors financial market conditions and actual contractholder and policyholder behaviorexperience and compares them to its assumptions.
EGPs vary based on persistency rates (assumptions at which contractholders and policyholders are expected to surrender,make withdrawals from and make deposits to their contracts), mortality levels, client asset value growth rates (based onequity and bond market performance), variable annuity benefit utilization and interest margins (the spread between earnedrates on invested assets and rates credited to contractholder and policyholder accounts). When assumptions are changed,the percentage of EGPs used to amortize DAC might also change. A change in the required amortization percentage isapplied retrospectively; an increase in amortization percentage will result in a decrease in the DAC balance and anincrease in DAC amortization expense, while a decrease in amortization percentage will result in an increase in the DACbalance and a decrease in DAC amortization expense. The impact on results of operations of changing assumptions can beeither positive or negative in any particular period and is reflected in the period in which such changes are made.
The client asset value growth rates are the rates at which variable annuity and VUL insurance contract values invested inseparate accounts are assumed to appreciate in the future. The rates used vary by equity and fixed income investments.Management reviews and, where appropriate, adjusts its assumptions with respect to client asset value growth rates on aregular basis. The long-term client asset value growth rates are based on assumed gross annual returns of 9% for equityfunds and 6% for fixed income funds. We typically use a five-year mean reversion process as a guideline in settingnear-term equity fund growth rates based on a long-term view of financial market performance as well as recent actualperformance. The suggested near-term equity fund growth rate is reviewed quarterly to ensure consistency withmanagement’s assessment of anticipated equity market performance.
47

A decrease of 100 basis points in various rate assumptions is likely to result in an increase in DAC amortization and anincrease in benefits and claims expense from variable annuity guarantees. The following table presents the estimatedimpact to current period pretax income:
Estimated Impact toPretax Income(1)
(in millions)Decrease in future near- and long-term fixed income returns by 100 basis points $ (62)
Decrease in future near-term equity fund growth returns by 100 basis points $ (41)Decrease in future long-term equity fund growth returns by 100 basis points (32)
Decrease in future near- and long-term equity fund growth returns by 100 basis points $ (73)
(1) An increase in the above assumptions by 100 basis points would result in an increase to pretax income for approximately the sameamount.
An assessment of sensitivity associated with changes in any single assumption would not necessarily be an indicator offuture results.
Traditional Long-Duration ProductsFor our traditional long-duration products (including traditional life, disability income (‘‘DI’’) and long term care (‘‘LTC’’)insurance products), our DAC balance at any reporting date is based on projections that show management expects thereto be adequate premiums after the date to amortize the remaining balance. These projections are inherently uncertainbecause they require management to make assumptions over periods extending well into the future. These assumptionsinclude interest rates, premium rate increases, persistency rates and mortality and morbidity rates and are not modified(unlocked) unless recoverability testing deems to be inadequate. Projection periods used for our traditional life insuranceare up to 30 years. Projection periods for our LTC insurance products are often 50 years or longer and projection periodsfor our DI products can be up to 45 years.
For traditional life and DI insurance products, the assumptions provide for adverse deviations in experience and are revisedonly if management concludes experience will be so adverse that DAC are not recoverable. If management concludes thatDAC are not recoverable, DAC are reduced to the amount that is recoverable based on best estimate assumptions andthere is a corresponding expense recorded in our Consolidated Statements of Operations.
The assumptions for LTC insurance products include interest rates, premium rate increases, persistency rates and morbidityrates. These assumptions are management’s best estimate from previous loss recognition and thus no longer provide foradverse deviations in experience.
Policyholder Account Balances, Future Policy Benefits and ClaimsWe establish reserves to cover the risks associated with non-traditional and traditional long-duration products and short-duration products. Reserves for non-traditional long-duration products include the liabilities related to guaranteed benefitprovisions added to variable annuity contracts, variable and fixed annuity contracts and UL and VUL policies and theembedded derivatives related to variable annuity contracts, equity indexed annuities (‘‘EIA’’) and indexed universal life(‘‘IUL’’) insurance. Reserves for traditional long-duration products are established to provide adequately for future benefitsand expenses for term life, whole life, DI and LTC insurance products. Reserves for short-duration products are establishedto provide adequately for incurred losses primarily related to auto and home policies.
The establishment of reserves is an estimation process using a variety of methods, assumptions and data elements. Ifactual experience is better than or equal to the results of the estimation process, then reserves should be adequate toprovide for future benefits and expenses. If actual experience is worse than the results of the estimation process,additional reserves may be required.
Changes in future policy benefits and claims are reflected in earnings in the period adjustments are made. Whereapplicable, benefit amounts expected to be recoverable from reinsurance companies who share in the risk are separatelyrecorded as reinsurance recoverable within receivables.
Non-Traditional Long-Duration ProductsLiabilities for fixed account values on variable and fixed deferred annuities and UL and VUL policies are equal toaccumulation values, which are the cumulative gross deposits and credited interest less withdrawals and various charges.
A portion of our UL and VUL policies have product features that result in profits followed by losses from the insurancecomponent of the contract. These profits followed by losses can be generated by the cost structure of the product orsecondary guarantees in the contract. The secondary guarantee ensures that, subject to specified conditions, the policy willnot terminate and will continue to provide a death benefit even if there is insufficient policy value to cover the monthly
48

deductions and charges. The liability for these future losses is determined by estimating the death benefits in excess ofaccount value and recognizing the excess over the estimated life based on expected assessments (e.g. cost of insurancecharges, contractual administrative charges, similar fees and investment margin). See Note 11 to our ConsolidatedFinancial Statements for information regarding the liability for contracts with secondary guarantees.
Liabilities for EIA are equal to the host contract values covering guaranteed benefits and the fair value of embedded equityoptions. Liabilities for indexed accounts of IUL products are equal to the accumulation of host contract values coveringguaranteed benefits and the fair value of embedded equity options.
The majority of the variable annuity contracts offered by us contain guaranteed minimum death benefit (‘‘GMDB’’)provisions. When market values of the customer’s accounts decline, the death benefit payable on a contract with a GMDBmay exceed the contract accumulation value. We also offer variable annuities with death benefit provisions that gross upthe amount payable by a certain percentage of contract earnings which are referred to as gain gross-up (‘‘GGU’’) benefits.In addition, we offer contracts with guaranteed minimum withdrawal benefit (‘‘GMWB’’) and guaranteed minimumaccumulation benefit (‘‘GMAB’’) provisions and, until May 2007, we offered contracts containing guaranteed minimumincome benefit (‘‘GMIB’’) provisions.
The GMDB and GGU liability is determined by estimating the expected value of death benefits in excess of the projectedcontract accumulation value and recognizing the excess over the estimated life based on expected assessments(e.g., mortality and expense fees, contractual administrative charges and similar fees).
If elected by the contract owner and after a stipulated waiting period from contract issuance, a GMIB guarantees aminimum lifetime annuity based on a specified rate of contract accumulation value growth and predetermined annuitypurchase rates. The GMIB liability is determined each period by estimating the expected value of annuitization benefits inexcess of the projected contract accumulation value at the date of annuitization and recognizing the excess over theestimated life based on expected assessments.
The liability for the life contingent benefits associated with GMWB provisions is determined by estimating the expectedvalue of benefits that are contingent upon survival after the account value is equal to zero and recognizing the benefitsover the estimated life based on expected assessments (e.g., mortality and expense fees, contractual administrativecharges and similar fees).
In determining the liabilities for GMDB, GGU, GMIB and the life contingent benefits associated with GMWB, we projectthese benefits and contract assessments using actuarial models to simulate various equity market scenarios. Significantassumptions made in projecting future benefits and assessments relate to customer asset value growth rates, mortality,persistency, benefit utilization and investment margins and are consistent with those used for DAC valuation for the samecontracts. As with DAC, management reviews, and where appropriate, adjusts its assumptions each quarter. Unlessmanagement identifies a material deviation over the course of quarterly monitoring, management reviews and updatesthese assumptions annually in the third quarter of each year. The amounts in the table above in ‘‘Deferred AcquisitionCosts’’ include the estimated impact to benefits and claims expense related to variable annuity guarantees resulting from adecrease of 100 basis points in various rate assumptions.
The fair value of embedded derivatives related to GMAB and the non-life contingent benefits associated with GMWBprovisions fluctuates based on equity, interest rate and credit markets which can cause these embedded derivatives to beeither an asset or a liability. See Note 14 to our Consolidated Financial Statements for information regarding the fair valuemeasurement of embedded derivatives.
Liabilities for fixed annuities in a benefit or payout status are based on future estimated payments using establishedindustry mortality tables and interest rates, ranging from 2.75% to 9.38% at December 31, 2015, depending on year ofissue, with an average rate of approximately 4.45%.
Traditional Long-Duration ProductsThe liabilities for traditional long-duration products include liabilities for unpaid amounts on reported claims, estimates ofbenefits payable on claims incurred but not yet reported and estimates of benefits that will become payable on term life,whole life, DI and LTC policies as claims are incurred in the future.
Liabilities for unpaid amounts on reported life insurance claims are equal to the death benefits payable under the policies.Liabilities for unpaid amounts on reported DI and LTC claims include any periodic or other benefit amounts due andaccrued, along with estimates of the present value of obligations for continuing benefit payments. These amounts arecalculated based on claim continuance tables which estimate the likelihood an individual will continue to be eligible forbenefits. The discount rates used to calculate present values are based on average interest rates earned on assetssupporting the liability for unpaid amounts and were 5% and 6.25% for DI and LTC claims, respectively, at December 31,2015. Anticipated claim continuance rates are based on established industry tables, adjusted as appropriate for ourexperience.
49

Liabilities for estimated benefits payable on claims that have been incurred but not yet reported are based on periodicanalysis of the actual time lag between when a claim occurs and when it is reported.
Liabilities for estimates of benefits that will become payable on future claims on term life, whole life, DI and LTC policiesare based on the net level premium method, using anticipated premium payments, mortality and morbidity rates, policypersistency and interest rates earned on assets supporting the liability. Anticipated mortality and morbidity rates are basedon established industry mortality and morbidity tables, with modifications based on our experience. Anticipated premiumpayments and persistency rates vary by policy form, issue age, policy duration and certain other pricing factors. Anticipatedinterest rates for term and whole life ranged from 3.25% to 10% at December 31, 2015, depending on policy form, issueyear and policy duration. Anticipated interest rates for DI policies ranged from 4% to 7.5% at December 31, 2015,depending on policy form, issue year and policy duration. Anticipated interest rates for LTC policy reserves can vary by planand year and ranged from 6.37% to 9.4% at December 31, 2015.
For term life, whole life, DI and LTC polices, we utilize best estimate assumptions as of the date the policy is issued withprovisions for the risk of adverse deviation, as appropriate. After the liabilities are initially established, managementperforms premium deficiency tests annually in the third quarter of each year using best estimate assumptions withoutprovisions for adverse deviation. If the liabilities determined based on these best estimate assumptions are greater thanthe net reserves (i.e., GAAP reserves net of any DAC balance), the existing net reserves are adjusted by first reducing theDAC balance by the amount of the deficiency or to zero through a change to current period earnings. If the deficiency ismore than the DAC balance, then the net reserves are increased by the excess through a charge to current periodearnings. If a premium deficiency is recognized, the assumptions are locked in and used in subsequent valuations. Theassumptions for LTC insurance products are management’s best estimate from previous loss recognition and thus nolonger provide for adverse deviations in experience.
Short-Duration ProductsThe liabilities for short-duration products primarily include auto and home reserves comprised of amounts determined fromloss reports on individual claims, as well as amounts based on historical loss experience for losses incurred but not yetreported. Such liabilities are based on estimates. Our methods for making such estimates and for establishing the resultingliabilities are continually reviewed, and any adjustments are reflected in earnings in the period such adjustments are made.
Derivative Instruments and Hedging ActivitiesWe use derivative instruments to manage our exposure to various market risks. All derivatives are recorded at fair value.The fair value of our derivative instruments is determined using either market quotes or valuation models that are basedupon the net present value of estimated future cash flows and incorporate current market observable inputs to the extentavailable.
For further details on the types of derivatives we use and how we account for them, see Note 2, Note 14 and Note 16 toour Consolidated Financial Statements. For discussion of our market risk exposures and hedging program and relatedsensitivity testing, see Item 7A. ‘‘Quantitative and Qualitative Disclosures About Market Risk.’’
Income Tax AccountingInherent in the provision for income taxes are estimates and judgments regarding the tax treatment of certain items.Estimates and judgments are re-evaluated on a continual basis as regulatory and business factors change. In the eventthat the ultimate tax treatment of items differs from our estimates, we may be required to significantly change theprovision for income taxes recorded in our Consolidated Financial Statements.
We are required to establish a valuation allowance for any portion of our deferred tax assets that management believes willnot be realized. Significant judgment is required in determining if a valuation allowance should be established, and theamount of such allowance if required. Factors used in making this determination include estimates relating to theperformance of the business. Consideration is given to, among other things in making this determination, (i) future taxableincome exclusive of reversing temporary differences and carryforwards, (ii) future reversals of existing taxable temporarydifferences, (iii) taxable income in prior carryback years, and (iv) tax planning strategies. Management may need to identifyand implement appropriate planning strategies to ensure our ability to realize our deferred tax assets and reduce thelikelihood of the establishment of a valuation allowance with respect to such assets.
See Note 2 and Note 21 to our Consolidated Financial Statements for additional information on our accounting policies forincome taxes and our valuation allowance.
Recent Accounting PronouncementsFor information regarding recent accounting pronouncements and their expected impact on our future consolidated resultsof operations and financial condition, see Note 3 to our Consolidated Financial Statements.
50

Sources of Revenues and Expenses
Management and Financial Advice FeesManagement and financial advice fees relate primarily to fees earned from managing mutual funds, separate account andwrap account assets and institutional investments, as well as fees earned from providing financial advice, administrativeservices (including transfer agent and administration fees earned from providing services to retail mutual funds) and othercustodial services. Management and financial advice fees include performance-based incentive management fees, whichwe may receive on certain management contracts. Management and financial advice fees also include mortality andexpense risk fees.
Distribution FeesDistribution fees primarily include point-of-sale fees (such as mutual fund front-end sales loads) and asset-based fees(such as 12b-1 distribution and shareholder service fees). Distribution fees also include amounts received under marketingsupport arrangements for sales of mutual funds and other companies’ products, such as through our wrap accounts, aswell as surrender charges on fixed and variable universal life insurance and annuities.
Net Investment IncomeNet investment income primarily includes interest income on fixed maturity securities classified as Available-for-Sale,mortgage loans, policy and certificate loans, other investments, cash and cash equivalents and investments of CIEs; thechanges in fair value of trading securities, certain derivatives and certain assets and liabilities of CIEs; the pro rata share ofnet income or loss on equity method investments; and realized gains and losses on the sale of securities and charges forother-than-temporary impairments of investments related to credit losses.
PremiumsPremiums include premiums on auto and home insurance, traditional life and health (DI and LTC) insurance and immediateannuities with a life contingent feature and are net of reinsurance premiums.
Other RevenuesOther revenues primarily include variable annuity guaranteed benefit rider charges and fixed and variable universal lifeinsurance charges, which consist of cost of insurance charges (net of reinsurance premiums and cost of reinsurance for ULinsurance products) and administrative charges. We also record revenue related to consolidated property funds managedby Threadneedle. These revenues represent rental income of managed properties and changes in the fair value of realestate held in consolidated property funds.
For discussion of our accounting policies on revenue recognition, see Note 2 to our Consolidated Financial Statements.
Banking and Deposit Interest ExpenseBanking and deposit interest expense primarily includes interest expense related to investment certificates. The changes infair value of stock market certificate embedded derivatives and the derivatives hedging stock market certificates areincluded within banking and deposit interest expense.
Distribution ExpensesDistribution expenses primarily include compensation paid to our financial advisors, registered representatives, third-partydistributors and wholesalers, net of amounts capitalized and amortized as part of DAC. The amounts capitalized andamortized are based on actual distribution costs. The majority of these costs, such as advisor and wholesalercompensation, vary directly with the level of sales. Distribution expenses also include marketing support and otherdistribution and administration related payments made to affiliated and unaffiliated distributors of products provided by ouraffiliates. The majority of these expenses vary with the level of sales, or assets held, by these distributors, and theremainder is fixed. Distribution expenses also include wholesaling costs.
Interest Credited to Fixed AccountsInterest credited to fixed accounts represents amounts earned by contractholders and policyholders on fixed account valuesassociated with fixed and variable universal life and annuity contracts. The changes in fair value of equity indexed annuityand IUL embedded derivatives and the derivatives hedging these products are included within interest credited to fixedaccounts.
Benefits, Claims, Losses and Settlement ExpensesBenefits, claims, losses and settlement expenses consist of amounts paid and changes in liabilities held for anticipatedfuture benefit payments under insurance policies and annuity contracts, along with costs to process and pay such
51

amounts. Amounts are net of benefit payments recovered or expected to be recovered under reinsurance contracts.Benefits under variable annuity guarantees include the changes in fair value of GMWB and GMAB embedded derivativesand the derivatives hedging these benefits, as well as the changes in fair value of derivatives hedging GMDB provisions.Benefits, claims, losses and settlement expenses also include amortization of DSIC.
Amortization of DACDirect sales commissions and other costs capitalized as DAC are amortized over time. For annuity and UL contracts, DACare amortized based on projections of estimated gross profits over amortization periods equal to the approximate life of thebusiness. For other insurance products, DAC are generally amortized as a percentage of premiums over amortizationperiods equal to the premium-paying period.
Interest and Debt ExpenseInterest and debt expense primarily includes interest on corporate debt and debt of CIEs, the impact of interest ratehedging activities and amortization of debt issuance costs.
General and Administrative ExpenseGeneral and administrative expense includes compensation, share-based awards and other benefits for employees (otherthan employees directly related to distribution, including financial advisors), professional and consultant fees, informationtechnology, facilities and equipment, advertising and promotion, legal and regulatory and corporate related expenses.
Assets Under Management and AdministrationAssets under management (‘‘AUM’’) include external client assets for which we provide investment management services,such as the assets of the Columbia Management funds and Threadneedle funds, assets of institutional clients and assetsof clients in our advisor platform held in wrap accounts as well as assets managed by sub-advisers selected by us. AUMalso includes certain assets on our Consolidated Balance Sheets for which we provide investment management servicesand recognize management fees in our Asset Management segment, such as the assets of the general account and thevariable product funds held in the separate accounts of our life insurance subsidiaries and CIEs. These assets do notinclude assets under advisement, for which we provide model portfolios but do not have full discretionary investmentauthority. Corporate & Other AUM primarily includes former bank assets that are managed within our Corporate & Othersegment.
Assets under administration (‘‘AUA’’) include assets for which we provide administrative services such as client assetsinvested in other companies’ products that we offer outside of our wrap accounts. These assets include those held inclients’ brokerage accounts. We generally record revenues received from administered assets as distribution fees. We donot exercise management discretion over these assets and do not earn a management fee. These assets are not reportedon our Consolidated Balance Sheets. AUA also includes certain assets on our Consolidated Balance Sheets for which wedo not provide investment management services and do not recognize management fees, such as investments innon-affiliated funds held in the separate accounts of our life insurance subsidiaries. These assets do not include assetsunder advisement, for which we provide model portfolios but do not have full discretionary investment authority.
The following table presents detail regarding our AUM and AUA:
December 31,
2015 2014 Change
(in billions)Assets Under Management and Administration
Advice & Wealth Management AUM $ 179.5 $ 174.1 $ 5.4 3%Asset Management AUM 471.9 505.6 (33.7) (7)Corporate & Other AUM 0.7 0.8 (0.1) (13)Eliminations (23.1) (21.9) (1.2) (5)
Total Assets Under Management 629.0 658.6 (29.6) (4)Total Assets Under Administration 147.7 147.6 0.1 —
Total AUM and AUA $ 776.7 $ 806.2 $ (29.5) (4)%
Total AUM decreased $29.6 billion, or 4%, to $629.0 billion as of December 31, 2015 compared to $658.6 billion as ofDecember 31, 2014 due to a $33.7 billion decrease in Asset Management AUM driven by net outflows, retail funddistributions and a negative impact of foreign currency translation and a $5.4 billion increase in Advice & WealthManagement AUM driven by wrap account net inflows, partially offset by market depreciation. See our segment results ofoperations discussion below for additional information on changes in our AUM.
52

Consolidated Results of OperationsYear Ended December 31, 2015 Compared to Year Ended December 31, 2014The following table presents our consolidated results of operations:
Years EndedDecember 31,
2015 2014 Change
(in millions)Revenues
Management and financial advice fees $ 5,950 $ 5,810 $ 140 2%Distribution fees 1,847 1,894 (47) (2)Net investment income 1,688 1,741 (53) (3)Premiums 1,455 1,385 70 5Other revenues 1,260 1,466 (206) (14)
Total revenues 12,200 12,296 (96) (1)Banking and deposit interest expense 30 28 2 7
Total net revenues 12,170 12,268 (98) (1)
ExpensesDistribution expenses 3,276 3,236 40 1Interest credited to fixed accounts 668 713 (45) (6)Benefits, claims, losses and settlement expenses 2,261 1,982 279 14Amortization of deferred acquisition costs 354 367 (13) (4)Interest and debt expense 387 328 59 18General and administrative expense 3,082 3,095 (13) —
Total expenses 10,028 9,721 307 3Income from continuing operations before income tax provision 2,142 2,547 (405) (16)Income tax provision 455 545 (90) (17)
Income from continuing operations 1,687 2,002 (315) (16)Loss from discontinued operations, net of tax — (2) 2 NM
Net income 1,687 2,000 (313) (16)Less: Net income attributable to noncontrolling interests 125 381 (256) (67)
Net income attributable to Ameriprise Financial $ 1,562 $ 1,619 $ (57) (4)%
NM Not Meaningful.
OverallIncome from continuing operations before income tax provision decreased $405 million, or 16%, to $2.1 billion for theyear ended December 31, 2015 compared to $2.5 billion for the prior year primarily reflecting a $256 million decrease innet income from CIEs, a negative market impact on variable annuity guaranteed benefits (net of hedges and the relatedDSIC and DAC amortization), a $42 million benefit in the prior year from policyholder movement of investments in PortfolioNavigator (traditional asset allocation) funds under certain in force variable annuities with living benefit guarantees to thePortfolio Stabilizer (managed volatility) funds compared to a $6 million benefit for the current year, an increase in provisionfor estimated losses for our auto and home business, higher life and LTC insurance claims, fixed annuity net outflows, anegative impact of foreign exchange, asset management net outflows, a decrease in net realized investment gains, theunfavorable market impact of hedges on investments and the impact on DAC and DSIC from actual versus expectedmarket performance, partially offset by the favorable impact of unlocking, higher asset management performance fees,wrap account net inflows, market appreciation, and lower performance-based compensation expense.
The market impact on variable annuity guaranteed benefits (net of hedges and the related DSIC and DAC amortization)was an expense of $214 million for the year ended December 31, 2015 compared to an expense of $94 million for theprior year. The impact on DAC and DSIC from actual versus expected market performance based on our view of bond andequity performance was an expense of $19 million for the year ended December 31, 2015 reflecting unfavorable equitymarket returns compared to a benefit of $26 million for the prior year reflecting favorable equity market and bond fundreturns.
53
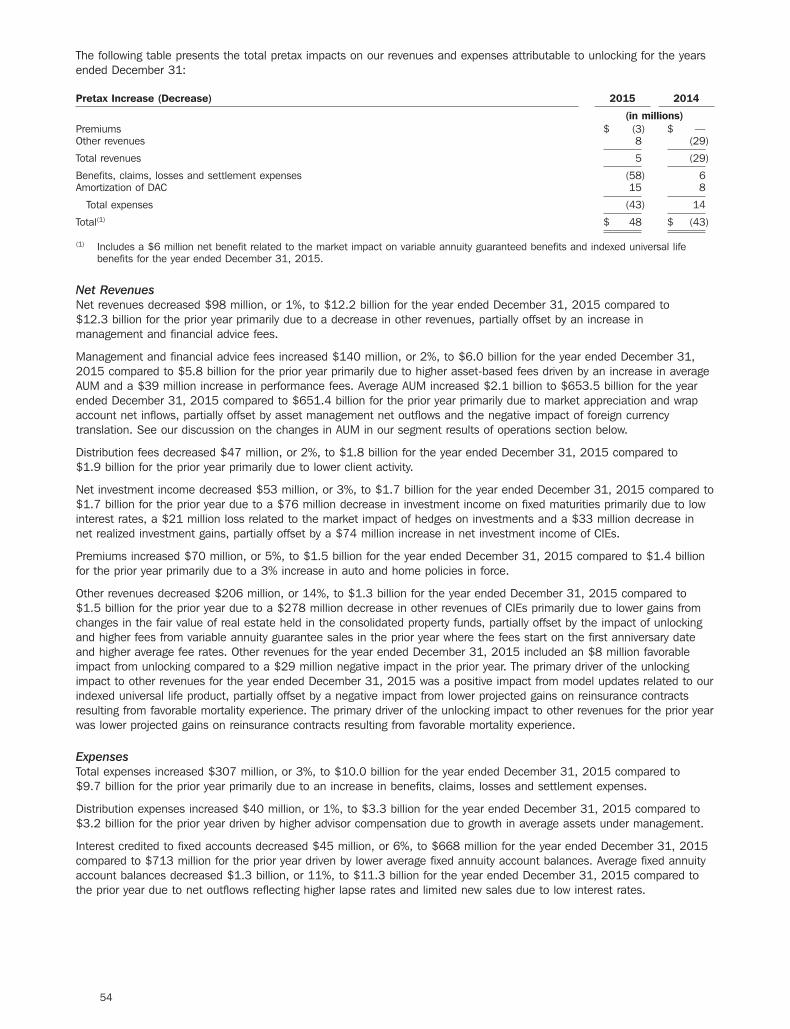
The following table presents the total pretax impacts on our revenues and expenses attributable to unlocking for the yearsended December 31:
Pretax Increase (Decrease) 2015 2014
(in millions)Premiums $ (3) $ —Other revenues 8 (29)
Total revenues 5 (29)
Benefits, claims, losses and settlement expenses (58) 6Amortization of DAC 15 8
Total expenses (43) 14
Total(1) $ 48 $ (43)
(1) Includes a $6 million net benefit related to the market impact on variable annuity guaranteed benefits and indexed universal lifebenefits for the year ended December 31, 2015.
Net RevenuesNet revenues decreased $98 million, or 1%, to $12.2 billion for the year ended December 31, 2015 compared to$12.3 billion for the prior year primarily due to a decrease in other revenues, partially offset by an increase inmanagement and financial advice fees.
Management and financial advice fees increased $140 million, or 2%, to $6.0 billion for the year ended December 31,2015 compared to $5.8 billion for the prior year primarily due to higher asset-based fees driven by an increase in averageAUM and a $39 million increase in performance fees. Average AUM increased $2.1 billion to $653.5 billion for the yearended December 31, 2015 compared to $651.4 billion for the prior year primarily due to market appreciation and wrapaccount net inflows, partially offset by asset management net outflows and the negative impact of foreign currencytranslation. See our discussion on the changes in AUM in our segment results of operations section below.
Distribution fees decreased $47 million, or 2%, to $1.8 billion for the year ended December 31, 2015 compared to$1.9 billion for the prior year primarily due to lower client activity.
Net investment income decreased $53 million, or 3%, to $1.7 billion for the year ended December 31, 2015 compared to$1.7 billion for the prior year due to a $76 million decrease in investment income on fixed maturities primarily due to lowinterest rates, a $21 million loss related to the market impact of hedges on investments and a $33 million decrease innet realized investment gains, partially offset by a $74 million increase in net investment income of CIEs.
Premiums increased $70 million, or 5%, to $1.5 billion for the year ended December 31, 2015 compared to $1.4 billionfor the prior year primarily due to a 3% increase in auto and home policies in force.
Other revenues decreased $206 million, or 14%, to $1.3 billion for the year ended December 31, 2015 compared to$1.5 billion for the prior year due to a $278 million decrease in other revenues of CIEs primarily due to lower gains fromchanges in the fair value of real estate held in the consolidated property funds, partially offset by the impact of unlockingand higher fees from variable annuity guarantee sales in the prior year where the fees start on the first anniversary dateand higher average fee rates. Other revenues for the year ended December 31, 2015 included an $8 million favorableimpact from unlocking compared to a $29 million negative impact in the prior year. The primary driver of the unlockingimpact to other revenues for the year ended December 31, 2015 was a positive impact from model updates related to ourindexed universal life product, partially offset by a negative impact from lower projected gains on reinsurance contractsresulting from favorable mortality experience. The primary driver of the unlocking impact to other revenues for the prior yearwas lower projected gains on reinsurance contracts resulting from favorable mortality experience.
ExpensesTotal expenses increased $307 million, or 3%, to $10.0 billion for the year ended December 31, 2015 compared to$9.7 billion for the prior year primarily due to an increase in benefits, claims, losses and settlement expenses.
Distribution expenses increased $40 million, or 1%, to $3.3 billion for the year ended December 31, 2015 compared to$3.2 billion for the prior year driven by higher advisor compensation due to growth in average assets under management.
Interest credited to fixed accounts decreased $45 million, or 6%, to $668 million for the year ended December 31, 2015compared to $713 million for the prior year driven by lower average fixed annuity account balances. Average fixed annuityaccount balances decreased $1.3 billion, or 11%, to $11.3 billion for the year ended December 31, 2015 compared tothe prior year due to net outflows reflecting higher lapse rates and limited new sales due to low interest rates.
54

Benefits, claims, losses and settlement expenses increased $279 million, or 14%, to $2.3 billion for the year endedDecember 31, 2015 compared to $2.0 billion for the prior year primarily reflecting the following items:
• The year ended December 31, 2015 included a $58 million benefit from unlocking compared to a $6 million expensein the prior year. The unlocking impact for the year ended December 31, 2015 primarily reflected an update tomarket-related inputs related to our living benefit valuation and a benefit from model changes that more than offsetthe difference between our previously assumed interest rates versus the continued low interest rate environment. Theunlocking impact for the prior year reflected lower than previously assumed interest rates, partially offset by a benefitfrom updating our variable annuity living benefit withdrawal utilization assumption.
• A $106 million increase related to our auto and home business due to an increase in the provision for estimatedlosses reflecting the impact of growth in exposures due to a 3% increase in policies in force, higher 2015 accidentyear loss ratio assumptions and prior year development. In 2015, we increased our claims reserves $57 millionprimarily related to the 2014 and prior accident years auto liability coverages. This increase was driven by elevatedfrequency and severity experience for auto injury claims, as well as a lower than expected level of impact in improvingthe outcome of 2014 and prior accident year existing claims. Auto and home losses for the prior year included a$30 million increase to prior accident year loss reserves resulting from adverse development in the 2013 and prioraccident years auto liability coverage and a $60 million increase to loss reserves for estimated losses includingincurred but not reported (‘‘IBNR’’) claims resulting from further adverse loss development observed primarily in the2014 auto book of business. Catastrophe losses were $72 million for the year ended December 31, 2015 comparedto $66 million for the prior year.
• A $17 million increase in expense related to higher reserve funding driven by the impact of higher fees from variableannuity guarantee sales in the prior year where the fees start on the first anniversary date.
• An increase in expenses compared to the prior year due to a $50 million benefit for the year ended December 31,2014 from policyholder movement of investments in Portfolio Navigator funds under certain in force variable annuitieswith living benefit guarantees to the Portfolio Stabilizer funds compared to a $7 million benefit for the year endedDecember 31, 2015.
• A $20 million increase in life insurance claims compared to the prior year primarily due to larger claims.
• A $19 million increase in LTC claims compared to the prior year primarily due to an increase in the number of openclaims and an update in claim reserve assumptions partially offset by a higher interest rate used for LTC claims andthe release of additional LTC reserves.
• A $28 million favorable impact in 2015 from updating future experience assumptions relating to life rider benefits.
• A $78 million increase in expense compared to the prior year from the unhedged nonperformance credit spread riskadjustment on variable annuity guaranteed benefits. As the embedded derivative liability on which the nonperformancecredit spread is applied increases (decreases), the impact of the nonperformance credit spread is favorable(unfavorable) to expense. The favorable impact of the nonperformance credit spread was $68 million for the yearended December 31, 2015 compared to a favorable impact of $146 million for the prior year.
• A $60 million increase in expense from other market impacts on variable annuity guaranteed benefits, net of hedges inplace to offset those risks and the related DSIC amortization. This increase was the result of a favorable $785 millionchange in the market impact on variable annuity guaranteed living benefits reserves, an unfavorable $843 millionchange in the market impact on derivatives hedging the variable annuity guaranteed benefits and an unfavorable$2 million DSIC offset. The main market drivers contributing to these changes are summarized below:
• Interest rate impact on the variable annuity guaranteed living benefits liability net of the impact on thecorresponding hedge assets resulted in lower expense in 2015 compared to 2014.
• Equity market and volatility impacts on the variable annuity guaranteed living benefits liability net of the impacton the corresponding hedge assets resulted in an expense in 2015 compared to a benefit in 2014.
• Other unhedged items, including the difference between the assumed and actual underlying separate accountinvestment performance, fixed income credit exposures, transaction costs and various behavioral items, were anet unfavorable impact compared to the prior year.
Interest and debt expense increased $59 million, or 18%, to $387 million for the year ended December 31, 2015compared to $328 million for the prior year due to new CLOs launched in 2015.
Income TaxesOur effective tax rate on income from continuing operations including income attributable to noncontrolling interests was21.3% for the year ended December 31, 2015 compared to 21.4% for the prior year. Our effective tax rate on incomefrom continuing operations excluding income attributable to noncontrolling interests was 22.6% for the year endedDecember 31, 2015 compared to 25.2% for the prior year. The effective tax rate for the year ended December 31, 2015was lower than the statutory rate as a result of tax preferred items including the dividends received deduction and lowincome housing tax credits.
55

Results of Operations by SegmentYear Ended December 31, 2015 Compared to Year Ended December 31, 2014Operating earnings is the measure of segment profit or loss management uses to evaluate segment performance.Operating earnings should not be viewed as a substitute for GAAP income from continuing operations before income taxprovision. We believe the presentation of segment operating earnings as we measure it for management purposesenhances the understanding of our business by reflecting the underlying performance of our core operations and facilitatinga more meaningful trend analysis. See Note 25 to the Consolidated Financial Statements for further information on thepresentation of segment results and our definition of operating earnings.
The following table presents summary financial information by segment:
Years EndedDecember 31,
2015 2014
(in millions)Advice & Wealth Management
Net revenues $ 5,013 $ 4,806Expenses 4,154 4,014
Operating earnings $ 859 $ 792
Asset ManagementNet revenues $ 3,254 $ 3,320Expenses 2,493 2,532
Operating earnings $ 761 $ 788
AnnuitiesNet revenues $ 2,541 $ 2,591Expenses 1,891 1,958
Operating earnings $ 650 $ 633
ProtectionNet revenues $ 2,384 $ 2,287Expenses 2,201 2,041
Operating earnings $ 183 $ 246
Corporate & OtherNet revenues $ 3 $ 4Expenses 202 234
Operating loss $ (199) $ (230)
The following table presents the segment pretax operating impacts on our revenues and expenses attributable to unlocking:
Years Ended December 31,
2015 2014
Segment Pretax Operating Increase (Decrease) Annuities Protection Annuities Protection
(in millions)Premiums $ — $ (3) $ — $ —Other revenues — (5) — (29)
Total revenues — (8) — (29)
Benefits, claims, losses and settlement expenses (61) 6 5 1Amortization of DAC (5) 10 17 (9)
Total expenses (66) 16 22 (8)
Total $ 66 $ (24) $ (22) $ (21)
56

Advice & Wealth ManagementThe following table presents the changes in wrap account assets and average balances for the years ended December 31:
2015 2014
(in billions)Beginning balance $ 174.7 $ 153.5Net flows(1) 11.1 14.2Market appreciation (depreciation) and other(1) (5.3) 7.0
Ending balance $ 180.5 $ 174.7
Advisory wrap account assets ending balance(2) $ 178.9 $ 173.5Average advisory wrap account assets(3) $ 178.5 $ 163.9(1) Beginning April 1, 2014, net flows reflect all additions and withdrawals to and from the SPS wrap account program. Prior to April 1,
2014, additions and withdrawals to and from certain non-billable investments of this program were reflected in the Marketappreciation and other line and purchases and sales of billable investments were reported in the Net flows line. Nets flows for theSPS program are now reported on a consistent basis with our other wrap account programs.
(2) Advisory wrap account assets represent those assets for which clients receive advisory services and are the primary driver of revenueearned on wrap accounts. Clients may hold non-advisory investments in their wrap accounts that do not incur an advisory fee.
(3) Average ending balances are calculated using an average of the prior period’s ending balance and all months in the current period.
Wrap account assets increased $5.8 billion, or 3%, during the year ended December 31, 2015 due to net inflows of$11.1 billion, partially offset by market depreciation and other of $5.3 billion. Average advisory wrap account assetsincreased $14.6 billion, or 9%, compared to the prior year primarily due to net inflows and market appreciation.
The following table presents the results of operations of our Advice & Wealth Management segment on an operating basis:
Years EndedDecember 31,
2015 2014 Change
(in millions)Revenues
Management and financial advice fees $ 2,629 $ 2,413 $ 216 9%Distribution fees 2,195 2,213 (18) (1)Net investment income 146 136 10 7Other revenues 73 72 1 1
Total revenues 5,043 4,834 209 4Banking and deposit interest expense 30 28 2 7
Total net revenues 5,013 4,806 207 4
ExpensesDistribution expenses 3,081 2,943 138 5Interest and debt expense 8 6 2 33General and administrative expense 1,065 1,065 — —
Total expenses 4,154 4,014 140 3
Operating earnings $ 859 $ 792 $ 67 8%
Our Advice & Wealth Management segment pretax operating earnings, which exclude net realized investment gains orlosses, increased $67 million, or 8%, to $859 million for the year ended December 31, 2015 compared to $792 millionfor the prior year primarily due to strong growth in wrap account assets and continued expense management. Pretaxoperating margin was 17.1% for the year ended December 31, 2015 compared to 16.5% for the prior year.
Net Revenues
Net revenues exclude net realized investment gains or losses. Net revenues increased $207 million, or 4%, to $5.0 billionfor the year ended December 31, 2015 compared to $4.8 billion for the prior year primarily reflecting growth in wrapaccount assets. Operating net revenue per branded advisor increased to $514,000 for the year ended December 31,2015, up 4% from $496,000 for the prior year driven by asset growth. Total branded advisors were 9,789 atDecember 31, 2015 compared to 9,672 at December 31, 2014.
Management and financial advice fees increased $216 million, or 9%, to $2.6 billion for the year ended December 31,2015 compared to $2.4 billion for the prior year driven by growth in wrap account assets. Average advisory wrap accountassets increased $14.6 billion, or 9%, to $178.5 billion at December 31, 2015 compared to the prior year primarily dueto net inflows and market appreciation. See our discussion of the changes in wrap account assets above.
57

ExpensesTotal expenses increased $140 million, or 3%, to $4.2 billion for the year ended December 31, 2015 compared to$4.0 billion for the prior year due to a $138 million increase in distribution expenses driven by higher advisorcompensation due to growth in wrap account assets.
Asset ManagementFee waivers have been provided to the Columbia Money Market Funds (the ‘‘Funds’’) by Columbia Management andcertain other subsidiaries performing services for the Funds for the purpose of reducing the expenses charged to a Fund ina given period to maintain or improve a Fund’s net yield in that period. Our subsidiaries may enter into contractualarrangements with the Funds identifying the specific fees to be waived and/or expenses to be reimbursed, as well as thetime period for which such waivers will apply. In aggregate, we voluntarily waived fees of $8 million, $10 million and$11 million for the years ended December 31, 2015, 2014 and 2013, respectively.
The following tables present the mutual fund performance of our retail Columbia and Threadneedle funds as ofDecember 31:
ColumbiaMutual Fund Rankings in top 2 Lipper Quartiles
2015 2014
Domestic Equity Equal weighted 1 year 68% 61%3 year 68% 68%5 year 57% 57%
Asset weighted 1 year 77% 58%3 year 76% 62%5 year 74% 62%
International Equity Equal weighted 1 year 55% 50%3 year 82% 68%5 year 65% 65%
Asset weighted 1 year 33% 74%3 year 46% 45%5 year 41% 45%
Taxable Fixed Income Equal weighted 1 year 68% 50%3 year 47% 61%5 year 65% 65%
Asset weighted 1 year 73% 71%3 year 52% 83%5 year 80% 83%
Tax Exempt Fixed Income Equal weighted 1 year 83% 89%3 year 100% 100%5 year 100% 100%
Asset weighted 1 year 97% 78%3 year 100% 100%5 year 100% 100%
Asset Allocation Funds Equal weighted 1 year 90% 58%3 year 78% 64%5 year 88% 89%
Asset weighted 1 year 100% 67%3 year 79% 76%5 year 98% 97%
Number of funds with 4 or 5 Morningstar star ratings Overall 55 513 year 57 425 year 45 46
Percent of funds with 4 or 5 Morningstar star ratings Overall 54% 49%3 year 56% 40%5 year 47% 47%
Percent of assets with 4 or 5 Morningstar star ratings Overall 66% 55%3 year 66% 35%5 year 57% 54%
Mutual fund performance rankings are based on the performance of Class Z fund shares for Columbia branded mutual funds. Only fundswith Class Z shares are included. In instances where a fund’s Class Z share does not have a full five year track record (prior toSeptember 30, 2015), performance for an older share class of the same fund, typically Class A shares, is utilized for the period beforeClass Z shares were launched. No adjustments to the historical track records are made to account for differences in fund expenses
58

between share classes of a fund. Starting September 30, 2015, legacy RiverSource funds have reached 5 years of Z share performanceand will not be appended. Historical rankings will continue to be appended.
Equal Weighted Rankings in Top 2 Quartiles: Counts the number of funds with above median ranking divided by the totalnumber of funds. Asset size is not a factor.
Asset Weighted Rankings in Top 2 Quartiles: Sums the total assets of the funds with above median ranking (using Class Zand appended Class Z) divided by total assets of all funds. Funds with more assets will receive a greater share of the totalpercentage above or below median.
ThreadneedleRetail Fund Rankings in Top 2 Morningstar Quartiles or Above Index Benchmark
2015 2014
Equity Equal weighted 1 year 65% 61%3 year 74% 64%5 year 76% 83%
Asset weighted 1 year 68% 63%3 year 71% 59%5 year 84% 86%
Fixed Income Equal weighted 1 year 56% 65%3 year 45% 68%5 year 67% 68%
Asset weighted 1 year 81% 65%3 year 72% 71%5 year 61% 51%
Allocation (Managed) Funds Equal weighted 1 year 75% 57%3 year 86% 83%5 year 100% 83%
Asset weighted 1 year 86% 68%3 year 92% 93%5 year 100% 93%
The performance of each fund is measured on a consistent basis against the most appropriate benchmark — a peer group of similarfunds or an index.
Equal weighted: Counts the number of funds with above median ranking (if measured against peer group) or above index performance (ifmeasured against an index) divided by the total number of funds. Asset size is not a factor.
Asset weighted: Sums the assets of the funds with above median ranking (if measured against peer group) or above index performance (ifmeasured against an index) divided by the total sum of assets in the funds. Funds with more assets will receive a greater share of thetotal percentage above or below median or index.
Aggregated Allocation (Managed) Funds include funds that invest in other funds of the Threadneedle range including those funds thatinvest in both equity and fixed income.
Aggregated Threadneedle data includes funds on the Threadneedle platform sub-advised by Columbia as well as advisors not affiliated withAmeriprise Financial, Inc.
The following table presents ending balances and average managed assets:
Average(1)
December 31, December 31,
2015 2014 Change 2015 2014 Change
(in billions)Columbia managed assets $ 334.7 $ 361.2 $ (26.5) (7)% $ 354.0 $ 359.7 $ (5.7) (2)%Threadneedle managed assets 142.1 147.9 (5.8) (4) 147.5 150.9 (3.4) (2)Less: Sub-advised eliminations (4.9) (3.5) (1.4) (40) (5.0) (3.3) (1.7) (52)
Total managed assets $ 471.9 $ 505.6 $ (33.7) (7)% $ 496.5 $ 507.3 $ (10.8) (2)%
(1) Average ending balances are calculated using an average of the prior period’s ending balance and all months in the current period.
59

The following table presents managed asset net flows:
Years EndedDecember 31,
2015 2014 Change
(in billions)Columbia managed asset net flows $ (8.9) $ 2.3 $ (11.2) NMThreadneedle managed asset net flows (5.3) — (5.3) NMLess: Sub-advised eliminations (1.6) (0.2) (1.4) NM
Total managed asset net flows $ (15.8) $ 2.1 $ (17.9) NM
NM Not Meaningful.
The following table presents managed assets by type:
Average(1)
December 31, December 31,
2015 2014 Change 2015 2014 Change
(in billions)Equity $ 255.5 $ 278.1 $ (22.6) (8)% $ 271.5 $ 279.4 $ (7.9) (3)%Fixed income 176.6 193.4 (16.8) (9) 188.1 195.9 (7.8) (4)Money market 7.5 6.7 0.8 12 6.8 6.6 0.2 3Alternative 8.2 7.4 0.8 11 7.9 7.0 0.9 13Hybrid and other 24.1 20.0 4.1 21 22.2 18.4 3.8 21
Total managed assets $ 471.9 $ 505.6 $ (33.7) (7)% $ 496.5 $ 507.3 $ (10.8) (2)%
(1) Average ending balances are calculated using an average of the prior period’s ending balance and all months in the current period.
The following tables present the changes in Columbia and Threadneedle managed assets:
Years EndedDecember 31,
2015 2014
(in billions)Columbia Managed Assets Rollforward
Retail FundsBeginning assets $ 237.7 $ 239.4
Mutual fund inflows 35.1 36.0Mutual fund outflows (50.3) (47.4)Net VP/VIT fund flows (0.7) (0.9)
Net new flows (15.9) (12.3)Reinvested dividends 13.3 13.4
Net flows (2.6) 1.1Distributions (15.7) (15.9)Market appreciation (depreciation) and other (1.0) 13.1
Total ending assets 218.4 237.7
InstitutionalBeginning assets 80.7 75.6
Inflows 18.4 20.4Outflows (25.4) (20.2)
Net flows (7.0) 0.2Market appreciation and other 0.6 4.9
Total ending assets 74.3 80.7
AlternativeBeginning assets 6.7 5.6
Inflows 1.5 1.7Outflows (0.8) (0.7)
Net flows 0.7 1.0Market appreciation and other 0.1 0.1
Total ending assets 7.5 6.7
Affiliated General Account Assets 34.5 36.1
Total Columbia managed assets $ 334.7 $ 361.2
Total Columbia net flows $ (8.9) $ 2.3
60

Years EndedDecember 31,
2015 2014
(in billions)Threadneedle Managed Assets Rollforward
Retail FundsBeginning assets $ 46.5 $ 50.6
Mutual fund inflows 20.2 23.4Mutual fund outflows (18.8) (26.0)
Net new flows 1.4 (2.6)Reinvested dividends 0.2 0.2
Net flows 1.6 (2.4)Distributions (0.7) (0.7)Market appreciation 1.8 0.8Foreign currency translation(1) (2.2) (2.8)Other 0.4 1.0
Total ending assets 47.4 46.5
InstitutionalBeginning assets 100.7 96.1
Inflows 9.9 13.3Outflows (16.8) (10.8)
Net flows (6.9) 2.5Market appreciation 1.9 5.4Foreign currency translation(1) (4.6) (6.1)Other 2.9 2.8
Total ending assets 94.0 100.7
AlternativeBeginning assets 0.7 0.7
Inflows — —Outflows — (0.1)
Net flows — (0.1)Market appreciation — 0.1
Total ending assets 0.7 0.7
Total Threadneedle managed assets $ 142.1 $ 147.9
Total Threadneedle net flows $ (5.3) $ —(1) Amounts represent British Pound to US dollar conversion.
Total segment AUM decreased $33.7 billion, or 7%, during the year ended December 31, 2015 driven by net outflows,retail fund distributions and a negative impact of foreign currency translation, partially offset by market appreciation. Totalsegment AUM net outflows were $15.8 billion for the year ended December 31, 2015. Management expects, consistentwith prior patterns of outflows, that outflows of primarily low margin assets directly or indirectly affiliated with Threadneedleand Columbia former parent companies will continue for the foreseeable future. The overall impact to segment results isdifficult to quantify due to uncertain timing, volume and mix of the outflows.
Columbia managed assets decreased $26.5 billion, or 7%, during the year ended December 31, 2015 primarily due to netoutflows and retail fund distributions. Total Columbia net outflows were $8.9 billion for the year ended December 31,2015. Columbia retail funds decreased $19.3 billion, or 8%, during the year ended December 31, 2015 primarily due tonet outflows and distributions. Columbia retail net outflows of $2.6 billion during the year ended December 31, 2015included $1.3 billion related to a client’s decision in the third quarter to exit its portfolio due to asset allocation and$2.0 billion of outflows from a former parent affiliated distribution relationship. Underlying Columbia retail outflows werelargely driven by $8.2 billion of outflows from the Columbia Acorn� Fund, as well as market volatility that decreasedinvestor demand, offset by reinvested dividends. Columbia institutional AUM decreased $6.4 billion, or 8%, during the yearended December 31, 2015 due to net outflows of $7.0 billion primarily reflecting outflows from former parent affiliateddistribution and former parent influenced mandates.
Threadneedle managed assets decreased $5.8 billion, or 4%, during the year ended December 31, 2015 primarily due toa $6.8 billion negative impact of foreign currency translation and net outflows of $5.3 billion, partially offset by marketappreciation and other of $7.0 billion. Threadneedle institutional AUM decreased $6.7 billion, or 7%, during the yearended December 31, 2015 primarily due to a $4.6 billion negative impact of foreign currency translation and net outflowsof $6.9 billion, partially offset by market appreciation and other of $4.8 billion. Threadneedle institutional net outflowsduring the year ended December 31, 2015 included outflows of $5.0 billion from legacy insurance assets and $3.4 billionrelated to a client’s decision to exit its portfolio due to specific liquidity needs.
61

The following table presents the results of operations of our Asset Management segment on an operating basis:
Years EndedDecember 31,
2015 2014 Change
(in millions)Revenues
Management and financial advice fees $ 2,723 $ 2,791 $ (68) (2)%Distribution fees 499 493 6 1Net investment income 23 30 (7) (23)Other revenues 9 6 3 50
Total revenues 3,254 3,320 (66) (2)Banking and deposit interest expense — — — —
Total net revenues 3,254 3,320 (66) (2)
ExpensesDistribution expenses 1,091 1,148 (57) (5)Amortization of deferred acquisition costs 17 15 2 13Interest and debt expense 25 26 (1) (4)General and administrative expense 1,360 1,343 17 1
Total expenses 2,493 2,532 (39) (2)
Operating earnings $ 761 $ 788 $ (27) (3)%
Our Asset Management segment pretax operating earnings, which exclude net realized investment gains or losses,decreased $27 million, or 3%, to $761 million for the year ended December 31, 2015 compared to $788 million for theprior year due to net outflows and a $23 million negative impact of foreign exchange, partially offset by equity marketappreciation, continued expense management and a $22 million positive impact from higher performance fees, net ofrelated compensation.
Net RevenuesNet revenues, which exclude net realized investment gains or losses, decreased $66 million, or 2%, to $3.3 billion for theyear ended December 31, 2015 compared to $3.3 billion for the prior year driven by a decrease in management andfinancial advice fees.
Management and financial advice fees decreased $68 million, or 2%, to $2.7 billion for the year ended December 31,2015 compared to $2.8 billion for the prior year primarily due to lower asset-based fees driven by a decrease in averageAUM and a $53 million negative impact of foreign exchange, partially offset by a $37 million increase in performance fees.Average AUM decreased $10.8 billion, or 2%, compared to the prior year primarily due to net outflows and the negativeimpact of foreign currency translation, partially offset by market appreciation.
ExpensesTotal expenses decreased $39 million, or 2%, to $2.5 billion for the year ended December 31, 2015 compared to theprior year primarily due to a $57 million decrease in distribution expenses from lower average retail fund assets, partiallyoffset by an increase in general and administrative expense. General and administrative expense increased $17 million, or1%, to $1.4 billion for the year ended December 31, 2015 compared to $1.3 billion for the prior year primarily due to a$15 million increase in compensation related to higher performance fees, an increase in marketing costs related torebranding and costs associated with the move to a new London office, partially offset by a $20 million benefit from theimpact of foreign exchange.
62

AnnuitiesThe following table presents the results of operations of our Annuities segment on an operating basis:
Years EndedDecember 31,
2015 2014 Change
(in millions)Revenues
Management and financial advice fees $ 755 $ 756 $ (1) —%Distribution fees 364 360 4 1Net investment income 848 941 (93) (10)Premiums 107 109 (2) (2)Other revenues 467 425 42 10
Total revenues 2,541 2,591 (50) (2)Banking and deposit interest expense — — — —
Total net revenues 2,541 2,591 (50) (2)
ExpensesDistribution expenses 446 439 7 2Interest credited to fixed accounts 500 556 (56) (10)Benefits, claims, losses and settlement expenses 482 463 19 4Amortization of deferred acquisition costs 205 235 (30) (13)Interest and debt expense 38 38 — —General and administrative expense 220 227 (7) (3)
Total expenses 1,891 1,958 (67) (3)
Operating earnings $ 650 $ 633 $ 17 3%
Our Annuities segment pretax operating income, which excludes net realized investment gains or losses (net of the relatedDSIC and DAC amortization) and the market impact on variable annuity guaranteed benefits (net of hedges and the relatedDSIC and DAC amortization), increased $17 million, or 3%, to $650 million for the year ended December 31, 2015compared to $633 million for the prior year primarily due to the impact of unlocking, partially offset by the impact on DACand DSIC from actual versus expected market performance, the negative impact from fixed annuity net outflows and a$44 million benefit in the prior year from policyholder movement of investments in Portfolio Navigator funds under certainin force variable annuities with living benefit guarantees to the Portfolio Stabilizer funds compared to a $6 million benefit inthe current year.
The impact of unlocking was an increase to pretax operating income of $66 million for the year ended December 31,2015 compared to a decrease of $22 million for the prior year. The impact on DAC and DSIC from actual versus expectedmarket performance based on our view of bond and equity performance was an expense of $18 million for the year endedDecember 31, 2015 reflecting unfavorable equity market returns compared to a benefit of $24 million for the prior yearreflecting favorable equity market returns and bond fund returns.
RiverSource variable annuity account balances decreased $2.7 billion, or 4%, to $74.2 billion at December 31, 2015compared to the prior year due to net outflows of $1.2 billion and market depreciation.
RiverSource fixed annuity account balances declined $1.5 billion, or 12%, to $10.7 billion at December 31, 2015compared to the prior year reflecting limited new sales from low interest rates and higher lapse rates as a portion of thefive-year guarantee block that was re-priced during 2014 came out of its surrender charge period earlier in 2015. Giventhe current interest rate environment, our fixed annuity book is expected to gradually run off and earnings on our fixedannuity business will trend down.
Net RevenuesNet revenues, which exclude net realized investment gains or losses, decreased $50 million, or 2%, to $2.5 billion for theyear ended December 31, 2015 compared to $2.6 billion for the prior year primarily due to lower net investment income,partially offset by an increase in other revenues.
Net investment income, which excludes net realized investment gains or losses, decreased $93 million, or 10%, to$848 million for the year ended December 31, 2015 compared to $941 million for the prior year primarily reflecting lowerinvested assets due to fixed annuity net outflows.
Other revenues increased $42 million, or 10%, to $467 million for the year ended December 31, 2015 compared to$425 million for the prior year due to higher fees from variable annuity guarantee sales in the prior year where the feesstart on the first anniversary date and higher average fee rates.
63

ExpensesTotal expenses, which exclude the market impact on variable annuity guaranteed benefits (net of hedges and the relatedDSIC and DAC amortization) and the DAC and DSIC offset to net realized investment gains or losses, decreased$67 million, or 3%, to $1.9 billion for the year ended December 31, 2015 compared to $2.0 billion for the prior yearprimarily due to decreases in interest credited to fixed accounts and amortization of DAC, partially offset by an increase inbenefits, claims, losses and settlement expenses.
Interest credited to fixed accounts decreased $56 million, or 10%, to $500 million for the year ended December 31,2015 compared to $556 million for the prior year driven by lower average fixed annuity account balances. Average fixedannuity account balances decreased $1.3 billion, or 11%, to $11.3 billion for the year ended December 31, 2015compared to the prior year due to net outflows reflecting higher lapse rates and limited new sales due to low interestrates.
Benefits, claims, losses and settlement expenses, which exclude the market impact on variable annuity guaranteedbenefits (net of hedges and the related DSIC amortization) and the DSIC offset to net realized investment gains or losses,increased $19 million, or 4%, to $482 million for the year ended December 31, 2015 compared to $463 million for theprior year primarily reflecting the following items:
• The year ended December 31, 2015 included a $61 million benefit from unlocking primarily reflecting an update tomarket-related inputs related to our living benefit valuation and a benefit from model changes that more than offsetthe difference between our previously assumed interest rates versus the continued low interest rate environment. Theprior year included a $5 million expense from unlocking primarily reflecting lower than previously assumed interestrates, partially offset by a benefit from updating our variable annuity living benefit withdrawal utilization assumption.
• An increase in expenses compared to the prior year due to a $52 million benefit for the year ended December 31,2014 from policyholder movement of investments in Portfolio Navigator funds under certain in force variable annuitieswith living benefit guarantees to the Portfolio Stabilizer funds compared to a $7 million benefit for the year endedDecember 31, 2015.
• A $17 million increase in expense related to higher reserve funding driven by the impact of higher fees from variableannuity guarantee sales in the prior year where the fees start on the first anniversary date.
• A $9 million increase in expense compared to the prior year due to the impact on DSIC from actual versus expectedmarket performance based on our view of bond and equity performance. This impact was an expense of $4 million forthe year ended December 31, 2015 reflecting unfavorable equity market returns compared to a benefit of $5 millionfor the prior year reflecting favorable equity market returns and bond fund returns.
Amortization of DAC, which excludes the DAC offset to the market impact on variable annuity guaranteed benefits and theDAC offset to net realized investment gains or losses, decreased $30 million, or 13%, to $205 million for the year endedDecember 31, 2015 compared to $235 million for the prior year primarily due to the impact of unlocking, partially offsetby the impact on DAC from actual versus expected market performance based on our view of bond and equityperformance. Amortization of DAC for the year ended December 31, 2015 included a $5 million benefit from unlockingdriven by improved persistency that more than offset the difference between our previously assumed interest rates versusthe continued low interest rate environment. Amortization of DAC for the prior year included a $17 million expense fromunlocking primarily driven by lower than previously assumed interest rates, partially offset by favorable persistency andmortality experience and a benefit from updating our variable annuity living benefit withdrawal utilization assumption.
64

ProtectionThe following table presents the results of operations of our Protection segment on an operating basis:
Years EndedDecember 31,
2015 2014 Change
(in millions)Revenues
Management and financial advice fees $ 55 $ 59 $ (4) (7)%Distribution fees 97 92 5 5Net investment income 468 447 21 5Premiums 1,363 1,292 71 5Other revenues 401 397 4 1
Total revenues 2,384 2,287 97 4Banking and deposit interest expense — — — —
Total net revenues 2,384 2,287 97 4
ExpensesDistribution expenses 59 61 (2) (3)Interest credited to fixed accounts 164 153 11 7Benefits, claims, losses and settlement expenses 1,538 1,416 122 9Amortization of deferred acquisition costs 155 135 20 15Interest and debt expense 32 28 4 14General and administrative expense 253 248 5 2
Total expenses 2,201 2,041 160 8
Operating earnings $ 183 $ 246 $ (63) (26)%
Our Protection segment pretax operating income, which excludes net realized investment gains or losses (net of the relatedDAC amortization, unearned revenue amortization and the reinsurance accrual) and the market impact on indexeduniversal life benefits (net of hedges and the related DAC amortization, unearned revenue amortization and the reinsuranceaccrual), decreased $63 million, or 26%, to $183 million for the year ended December 31, 2015 compared to$246 million for the prior year primarily reflecting an increase in the provision for estimated losses for our auto and homebusiness and higher life and LTC insurance claims, partially offset by higher auto and home premiums.
During 2015, we conducted a review of our LTC reserve for unpaid amounts on reported claims based on additionalinformation we received from Genworth Financial, Inc., which reinsures 50% of our LTC business and administers all of ourclaims. Based on this information, along with a review of the discount rate, management’s best estimate for LTC claimsreserves resulted in a net $14 million increase. The most significant drivers of the reserve increase were updates to thebenefit utilization rates and claims termination rates, partially offset by a $15 million benefit from a higher discount rate.We also increased the discount rate for our disability income (‘‘DI’’) reserve for unpaid amounts on reported claims, whichresulted in a $7 million reserve decrease. In addition, results for 2015 included an $11 million unfavorable impact relatedto a reinsurance premium correction, a $13 million favorable impact related to a LTC future loss reserve adjustment and a$28 million favorable impact from updating future experience assumptions relating to life rider benefits.
Net RevenuesNet revenues, which exclude net realized investment gains or losses (net of unearned revenue amortization and thereinsurance accrual) and the unearned revenue amortization and the reinsurance accrual offset to the market impact onindexed universal life benefits, increased $97 million, or 4%, to $2.4 billion for the year ended December 31, 2015compared to $2.3 billion for the prior year primarily due to an increase in premiums.
Net investment income, which excludes net realized investment gains or losses, increased $21 million, or 5%, to$468 million for the year ended December 31, 2015 compared to $447 million for the prior year driven by higher averageinvested assets.
Premiums increased $71 million, or 5%, to $1.4 billion for the year ended December 31, 2015 compared to $1.3 billionfor the prior year primarily due to a 3% increase in auto and home policies in force.
Other revenues, which exclude the unearned revenue amortization and the reinsurance accrual offset to the market impacton indexed universal life benefits and the unearned revenue amortization and the reinsurance accrual offset to net realizedinvestment gains or losses, increased $4 million, or 1%, to $401 million for the year ended December 31, 2015compared to $397 million for the prior year due to the impact of unlocking, partially offset by a $9 million unfavorableimpact related to a reinsurance premium correction. Other revenues for the year ended December 31, 2015 included a$5 million negative impact from unlocking compared to a $29 million negative impact in the prior year. The primary driver
65

of the unlocking impact to other revenues in both periods was lower projected gains on reinsurance contracts resultingfrom favorable mortality experience.
ExpensesTotal expenses, which exclude the market impact on indexed universal life benefits (net of hedges and the related DACamortization) and the DAC offset to net realized investment gains or losses, increased $160 million, or 8%, to $2.2 billionfor the year ended December 31, 2015 compared to $2.0 billion for the prior year primarily due to increases in benefits,claims, losses and settlement expenses and amortization of DAC.
Benefits, claims, losses and settlement expenses increased $122 million, or 9%, to $1.5 billion for the year endedDecember 31, 2015 compared to $1.4 billion for the prior year primarily reflecting the following items:
• A $106 million increase related to our auto and home business due to an increase in the provision for estimatedlosses reflecting the impact of growth in exposures due to a 3% increase in policies in force, higher 2015 accidentyear loss ratio assumptions and prior year development. In 2015, we increased our claims reserves $57 millionprimarily related to the 2014 and prior accident years auto liability coverages. This increase was driven by elevatedfrequency and severity experience for auto injury claims, as well as a lower than expected level of impact in improvingthe outcome of 2014 and prior accident year existing claims. Auto and home losses for the prior year included a$30 million increase to prior accident year loss reserves resulting from adverse development in the 2013 and prioraccident years auto liability coverage and a $60 million increase to loss reserves for estimated losses including IBNRclaims resulting from further adverse loss development observed primarily in the 2014 auto book of business.Catastrophe losses were $72 million for the year ended December 31, 2015 compared to $66 million for the prioryear.
• A $20 million increase in life insurance claims compared to the prior year primarily due to larger claims.
• A $19 million increase in LTC claims compared to the prior year primarily due to an increase in the number of openclaims and an update in claim reserve assumptions partially offset by a higher interest rate used for LTC claims andthe release of additional LTC reserves.
Amortization of DAC, which excludes the DAC offset to the market impact on indexed universal life benefits and the DACoffset to net realized investment gains or losses, increased $20 million, or 15%, to $155 million for the year endedDecember 31, 2015 compared to $135 million for the prior year primarily due to the impact of unlocking. Amortization ofDAC for the year ended December 31, 2015 included a $10 million expense from unlocking primarily driven by thedifference between our previously assumed interest rates versus the continued low interest rate environment. Amortizationof DAC for the prior year included a $9 million benefit from unlocking.
Corporate & OtherThe following table presents the results of operations of our Corporate & Other segment on an operating basis:
Years EndedDecember 31,
2015 2014 Change
(in millions)Revenues
Distribution fees $ — $ 1 $ (1) NMNet investment loss (10) (6) (4) (67)%Other revenues 13 9 4 44
Total revenues 3 4 (1) (25)Banking and deposit interest expense — — — —
Total net revenues 3 4 (1) (25)
ExpensesDistribution expenses — 1 (1) NMInterest and debt expense 22 21 1 5General and administrative expense 180 212 (32) (15)
Total expenses 202 234 (32) (14)
Operating loss $ (199) $ (230) $ 31 13%
NM Not Meaningful.
Our Corporate & Other segment pretax operating loss excludes net realized investment gains or losses, the market impactof hedges to offset interest rate changes on unrealized gains or losses for certain investments, integration and restructuringcharges, and the impact of consolidating CIEs. Our Corporate & Other segment pretax operating loss decreased
66

$31 million, or 13%, to $199 million for the year ended December 31, 2015 compared to $230 million for the prior yeardue to a $32 million decrease in general and administrative expense primarily reflecting lower performance-basedcompensation expense, a cumulative adjustment to record a capital lease that had previously been incorrectly recorded asan operating lease for Ameriprise Financial Center, and a provision in the prior year related to potential resolution of aregulatory matter.
Consolidated Results of OperationsYear Ended December 31, 2014 Compared to Year Ended December 31, 2013The following table presents our consolidated results of operations:
Years EndedDecember 31,
2014 2013 Change
(in millions)Revenues
Management and financial advice fees $ 5,810 $ 5,253 $ 557 11%Distribution fees 1,894 1,771 123 7Net investment income 1,741 1,889 (148) (8)Premiums 1,385 1,282 103 8Other revenues 1,466 1,035 431 42
Total revenues 12,296 11,230 1,066 9Banking and deposit interest expense 28 31 (3) (10)
Total net revenues 12,268 11,199 1,069 10
ExpensesDistribution expenses 3,236 2,925 311 11Interest credited to fixed accounts 713 806 (93) (12)Benefits, claims, losses and settlement expenses 1,982 1,954 28 1Amortization of deferred acquisition costs 367 207 160 77Interest and debt expense 328 281 47 17General and administrative expense 3,095 3,056 39 1
Total expenses 9,721 9,229 492 5
Income from continuing operations before income tax provision 2,547 1,970 577 29Income tax provision 545 492 53 11
Income from continuing operations 2,002 1,478 524 35Loss from discontinued operations, net of tax (2) (3) 1 33
Net income 2,000 1,475 525 36Less: Net income attributable to noncontrolling interests 381 141 240 NM
Net income attributable to Ameriprise Financial $ 1,619 $ 1,334 $ 285 21%
NM Not Meaningful.
OverallIncome from continuing operations before income tax provision increased $577 million, or 29%, to $2.5 billion for the yearended December 31, 2014 compared to $2.0 billion for the prior year primarily reflecting the impact of marketappreciation, wrap account net inflows, an increase in net income from CIEs and the market impact on variable annuityguaranteed benefits (net of hedges and the related DSIC and DAC amortization), partially offset by a $109 milliondecrease from unlocking, asset management retail fund distributions and higher auto and home claim and claimadjustment expense. The market impact on variable annuity guaranteed benefits (net of hedges and the related DSIC andDAC amortization) was an expense of $94 million for the year ended December 31, 2014 compared to an expense of$170 million for the prior year, which included a $17 million benefit associated with unlocking.
The following table presents the total pretax impacts on our revenues and expenses attributable to unlocking for the yearsended December 31:
Pretax Increase (Decrease) 2014 2013
(in millions)Other revenues $ (29) $ (18)Benefits, claims, losses and settlement expenses 6 (5)Amortization of DAC 8 (79)
Total expenses 14 (84)
Total(1) $ (43) $ 66
(1) Includes a $17 million net benefit related to the market impact on variable annuity guaranteed benefits for the year endedDecember 31, 2013.
67

Net RevenuesNet revenues increased $1.1 billion, or 10%, to $12.3 billion for the year ended December 31, 2014 compared to$11.2 billion for the prior year primarily due to higher management and financial advice fees and other revenues.
Management and financial advice fees increased $557 million, or 11%, to $5.8 billion for the year ended December 31,2014 compared to $5.3 billion for the prior year primarily due to higher asset-based fees driven by an increase in averageAUM. Average AUM increased $58.0 billion, or 10%, compared to the prior year primarily due to market appreciation andwrap account net inflows. See our discussion on the changes in AUM in our segment results of operations section below.
Distribution fees increased $123 million, or 7%, to $1.9 billion for the year ended December 31, 2014 compared to$1.8 billion for the prior year due to higher client assets, as well as increased client activity.
Net investment income decreased $148 million, or 8%, to $1.7 billion for the year ended December 31, 2014 comparedto $1.9 billion for the prior year primarily due to a $96 million decrease in investment income on fixed maturities driven bylow interest rates and a $63 million decrease in net investment income of CIEs, partially offset by a $30 million increasein net realized gains primarily related to calls on fixed income securities.
Premiums increased $103 million, or 8%, to $1.4 billion for the year ended December 31, 2014 compared to $1.3 billionfor the prior year primarily due to growth in auto and home premiums driven by new policy sales growth, primarily from ouraffinity relationships with Costco and Progressive. Auto and home policies in force increased 11% compared to the prioryear.
Other revenues increased $431 million, or 42%, to $1.5 billion for the year ended December 31, 2014 compared to$1.0 billion for the prior year due to a $376 million increase in other revenues of CIEs and higher fees from variableannuity guarantee sales in the prior year where the fees start on the first anniversary date, and higher average fee rates,partially offset by the impact of unlocking. Other revenues for the year ended December 31, 2014 included a $29 millionnegative impact from unlocking compared to an $18 million negative impact in the prior year. The primary driver of theunlocking impact to other revenues in both periods was lower projected gains on reinsurance contracts resulting fromfavorable mortality experience.
ExpensesTotal expenses increased $492 million, or 5%, to $9.7 billion for the year ended December 31, 2014 compared to$9.2 billion for the prior year primarily due to increases in distribution expenses and amortization of DAC.
Distribution expenses increased $311 million, or 11%, to $3.2 billion for the year ended December 31, 2014 comparedto $2.9 billion for the prior year driven by higher advisor compensation due to growth in average assets undermanagement. See our discussion on the changes in AUM in our segment results of operations section below.
Interest credited to fixed accounts decreased $93 million, or 12%, to $713 million for the year ended December 31,2014 compared to $806 million for the prior year driven by lower average fixed annuity account balances and a loweraverage crediting rate on interest sensitive fixed annuities. Average fixed annuity account balances decreased $884 million,or 7%, to $12.7 billion for the year ended December 31, 2014 compared to the prior year due to net outflows reflectingelevated surrenders on products sold through third parties where rates have reset lower. The average fixed annuity creditingrate excluding capitalized interest decreased to 3.0% for the year ended December 31, 2014 compared to 3.6% for theprior year reflecting the re-pricing of the five-year guarantee block. See additional discussion on the re-pricing in theAnnuities segment.
Benefits, claims, losses and settlement expenses increased $28 million, or 1%, to $2.0 billion for the year endedDecember 31, 2014 compared to the prior year primarily reflecting the following items:
• The year ended December 31, 2014 included a $6 million expense from unlocking. The prior year included a$5 million benefit from unlocking, which included a $22 million benefit related to the market impact on variableannuity guaranteed benefits. The market impact on variable annuity guaranteed benefits is discussed below. Theunlocking impact for the year ended December 31, 2014 reflected lower than previously assumed interest rates,partially offset by a benefit from updating our variable annuity living benefit withdrawal utilization assumption. Theunlocking impact for the year ended December 31, 2013 reflected lower than previously assumed interest rates andchanges in assumed policyholder behavior, partially offset by the impact of variable annuity model changes.
• A $163 million increase in provision for estimated losses related to our auto and home business reflecting the impactof growth in exposures from an 11% increase in policies in force, an increase in catastrophe losses reflecting thegrowth in exposures and the extremely severe winter and spring weather during 2014, and adverse development in the2013 and prior accident years auto liability coverage observed during the first quarter of 2014 resulting in a$30 million increase to prior accident year loss reserves. Later in 2014, further adverse loss development wasobserved primarily in the 2014 auto book of business which resulted in a $60 million increase to loss reserves for
68

estimated losses including IBNR. Catastrophe losses were $66 million for the year ended December 31, 2014compared to $42 million for the prior year.
• A $26 million increase in expense related to higher reserve funding driven by the impact of higher fees from variableannuity guarantee sales in the prior year where the fees start on the first anniversary date.
• A $21 million decrease in expenses compared to the prior year from policyholder movement of investments in PortfolioNavigator (traditional asset allocation) funds under certain in force variable annuities with living benefit guarantees tothe Portfolio Stabilizer (managed volatility) funds. See additional discussion in the Annuities segment.
• A decrease in expense compared to the prior year due to an $8 million increase in disability income reserves in thesecond quarter of 2013 related to prior periods.
• A $404 million decrease in expense compared to the prior year from the unhedged nonperformance credit spread riskadjustment on variable annuity guaranteed benefits. As the embedded derivative liability on which the nonperformancecredit spread is applied increases (decreases), the impact of the nonperformance credit spread is favorable(unfavorable) to expense. In 2014, the favorable impact of the nonperformance credit spread was $146 millionprimarily driven by an increase in the embedded derivative liability. In 2013, the unfavorable impact of thenonperformance credit spread was $258 million primarily driven by a decrease in the embedded derivative liability.
• A $303 million increase in expense from other market impacts on variable annuity guaranteed benefits, net of hedgesin place to offset those risks and the related DSIC amortization. This increase was the result of an unfavorable$2.9 billion change in the market impact on variable annuity guaranteed living benefits reserves, a favorable$2.6 billion change in the market impact on derivatives hedging the variable annuity guaranteed benefits and anunfavorable $2 million DSIC offset. The main market drivers contributing to these changes are summarized below:
• Interest rates were down in 2014 and up in 2013 resulting in an unfavorable change in the variable annuityguaranteed living benefits liability, partially offset by a favorable change in the related hedge assets.
• Equity market and volatility impacts on the variable annuity guaranteed living benefits liability net of the impacton the related hedge assets resulted in a benefit in 2014 compared to an expense in 2013.
• Other unhedged items, including the difference between the assumed and actual underlying separate accountinvestment performance, fixed income credit exposures, transaction costs and various behavioral items, were anet favorable impact compared to the prior year.
Amortization of DAC increased $160 million, or 77%, to $367 million for the year ended December 31, 2014 comparedto $207 million for the prior year primarily reflecting the following items:
• Amortization of DAC for the year ended December 31, 2014 included an $8 million expense from unlocking, primarilydriven by lower than previously assumed interest rates, partially offset by favorable persistency and mortality experienceand a benefit from updating our variable annuity living benefit withdrawal utilization assumption. Amortization of DACfor the year ended December 31, 2013 included a $79 million benefit from unlocking, which included a $5 millionexpense related to the DAC offset to the market impact on variable annuity guaranteed benefits, primarily driven byhigher than previously assumed interest rates and changes in assumed policyholder behavior.
• The DAC offset to the market impact on variable annuity guaranteed benefits (net of hedges and the related DSICamortization) was a benefit of $9 million for the year ended December 31, 2014 compared to a benefit of $34 millionfor the prior year.
• A $7 million expense related to an actuarial model correction in life insurance in the fourth quarter of 2014 primarilyrelated to prior periods.
• The impact on DAC from actual versus expected market performance based on our view of bond and equityperformance was a benefit of $21 million for the year ended December 31, 2014 compared to a benefit of$26 million for the prior year. Equity market returns were favorable in both periods but less favorable in 2014 versusthe prior year. Bond fund returns were favorable in 2014 and unfavorable in the prior year.
Interest and debt expense increased $47 million, or 17%, to $328 million for the year ended December 31, 2014compared to $281 million for the prior year due to a $53 million increase in interest and debt expense of CIEs.
Income TaxesOur effective tax rate on income from continuing operations including income attributable to noncontrolling interests was21.4% for the year ended December 31, 2014 compared to 25.0% for the prior year. Our effective tax rate on incomefrom continuing operations excluding income attributable to noncontrolling interests was 25.2% for the year endedDecember 31, 2014 compared to 26.9% for the prior year. The effective tax rate for the year ended December 31, 2014
69
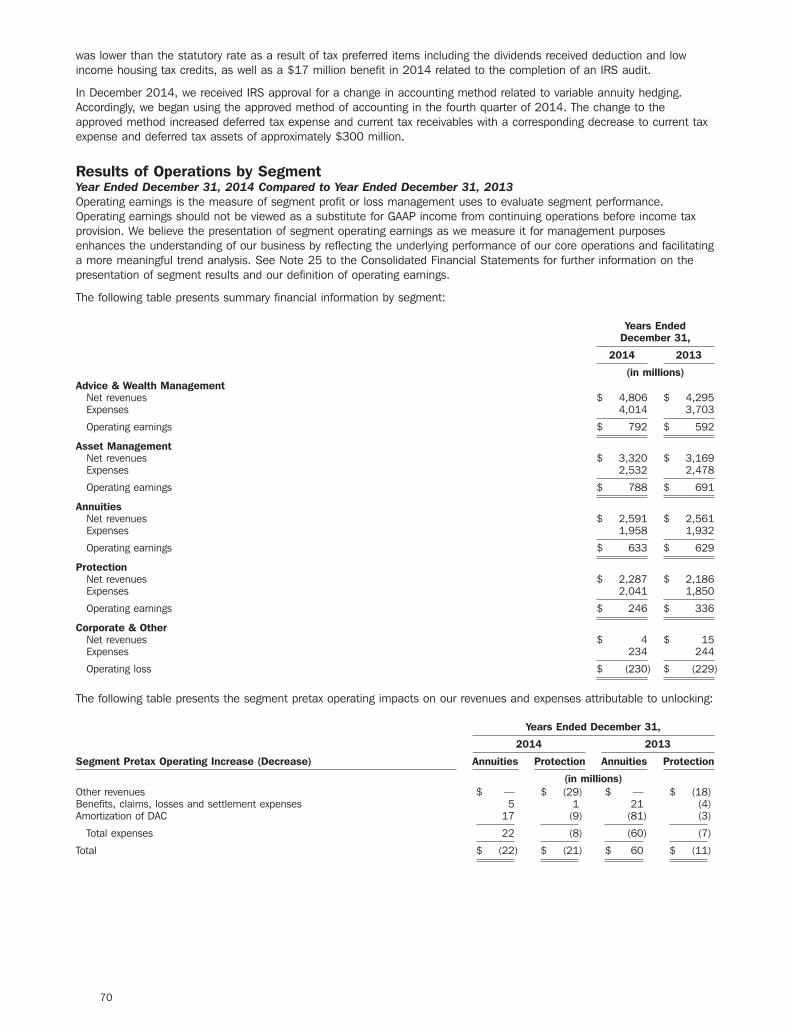
was lower than the statutory rate as a result of tax preferred items including the dividends received deduction and lowincome housing tax credits, as well as a $17 million benefit in 2014 related to the completion of an IRS audit.
In December 2014, we received IRS approval for a change in accounting method related to variable annuity hedging.Accordingly, we began using the approved method of accounting in the fourth quarter of 2014. The change to theapproved method increased deferred tax expense and current tax receivables with a corresponding decrease to current taxexpense and deferred tax assets of approximately $300 million.
Results of Operations by SegmentYear Ended December 31, 2014 Compared to Year Ended December 31, 2013Operating earnings is the measure of segment profit or loss management uses to evaluate segment performance.Operating earnings should not be viewed as a substitute for GAAP income from continuing operations before income taxprovision. We believe the presentation of segment operating earnings as we measure it for management purposesenhances the understanding of our business by reflecting the underlying performance of our core operations and facilitatinga more meaningful trend analysis. See Note 25 to the Consolidated Financial Statements for further information on thepresentation of segment results and our definition of operating earnings.
The following table presents summary financial information by segment:
Years EndedDecember 31,
2014 2013
(in millions)Advice & Wealth Management
Net revenues $ 4,806 $ 4,295Expenses 4,014 3,703
Operating earnings $ 792 $ 592
Asset ManagementNet revenues $ 3,320 $ 3,169Expenses 2,532 2,478
Operating earnings $ 788 $ 691
AnnuitiesNet revenues $ 2,591 $ 2,561Expenses 1,958 1,932
Operating earnings $ 633 $ 629
ProtectionNet revenues $ 2,287 $ 2,186Expenses 2,041 1,850
Operating earnings $ 246 $ 336
Corporate & OtherNet revenues $ 4 $ 15Expenses 234 244
Operating loss $ (230) $ (229)
The following table presents the segment pretax operating impacts on our revenues and expenses attributable to unlocking:
Years Ended December 31,
2014 2013
Segment Pretax Operating Increase (Decrease) Annuities Protection Annuities Protection
(in millions)Other revenues $ — $ (29) $ — $ (18)Benefits, claims, losses and settlement expenses 5 1 21 (4)Amortization of DAC 17 (9) (81) (3)
Total expenses 22 (8) (60) (7)
Total $ (22) $ (21) $ 60 $ (11)
70

Advice & Wealth ManagementThe following table presents the changes in wrap account assets and average balances for the years ended December 31:
2014 2013
(in billions)Beginning balance $ 153.5 $ 124.6Net flows(1) 14.2 13.1Market appreciation and other(1) 7.0 15.8
Ending balance $ 174.7 $ 153.5
Advisory wrap account assets ending balance(1) $ 173.5 $ 152.6Average advisory wrap account assets(2) $ 163.9 $ 138.2(1) Beginning April 1, 2014, net flows reflect all additions and withdrawals to and from the SPS wrap account program. Prior to April 1,
2014, additions and withdrawals to and from certain non-billable investments of this program were reflected in the Marketappreciation and other line and purchases and sales of billable investments were reported in the Net flows line. Nets flows for theSPS program are now reported on a consistent basis with our other wrap account programs.
(2) Advisory wrap account assets represent those assets for which clients receive advisory services and are the primary driver of revenueearned on wrap accounts. Clients may hold non-advisory investments in their wrap accounts that do not incur an advisory fee.
(3) Average ending balances are calculated using an average of the prior period’s ending balance and all months in the current period.
Wrap account assets increased $21.2 billion, or 14%, during the year ended December 31, 2014 due to net inflows of$14.2 billion and market appreciation and other of $7.0 billion. Average advisory wrap account assets increased$25.7 billion, or 19%, compared to the prior year primarily due to net inflows and market appreciation.
The following table presents the results of operations of our Advice & Wealth Management segment on an operating basis:
Years EndedDecember 31,
2014 2013 Change
(in millions)Revenues
Management and financial advice fees $ 2,413 $ 2,039 $ 374 18%Distribution fees 2,213 2,095 118 6Net investment income 136 127 9 7Other revenues 72 65 7 11
Total revenues 4,834 4,326 508 12Banking and deposit interest expense 28 31 (3) (10)
Total net revenues 4,806 4,295 511 12
ExpensesDistribution expenses 2,943 2,641 302 11Interest and debt expense 6 6 — —General and administrative expense 1,065 1,056 9 1
Total expenses 4,014 3,703 311 8
Operating earnings $ 792 $ 592 $ 200 34%
Our Advice & Wealth Management segment pretax operating earnings, which exclude net realized investment gains orlosses, increased $200 million, or 34%, to $792 million for the year ended December 31, 2014 compared to$592 million for the prior year primarily due to strong growth in wrap account assets and expense management. Pretaxoperating margin was 16.5% for the year ended December 31, 2014 compared to 13.8% for the prior year.
Net RevenuesNet revenues exclude net realized investment gains or losses. Net revenues increased $511 million, or 12%, to$4.8 billion for the year ended December 31, 2014 compared to $4.3 billion for the prior year primarily reflecting wrapaccount net inflows and market appreciation. Operating net revenue per branded advisor increased to $496,000 for theyear ended December 31, 2014, up 13% from $440,000 for the prior year driven by asset growth and client activity. Totalbranded advisors were 9,672 at December 31, 2014 compared to 9,716 at December 31, 2013.
Management and financial advice fees increased $374 million, or 18%, to $2.4 billion for the year ended December 31,2014 compared to $2.0 billion for the prior year driven by growth in wrap account assets. Average advisory wrap accountassets increased $25.7 billion, or 19%, to $163.9 billion at December 31, 2014 compared to the prior year primarily dueto net inflows and market appreciation. See our discussion of the changes in wrap account assets above.
71
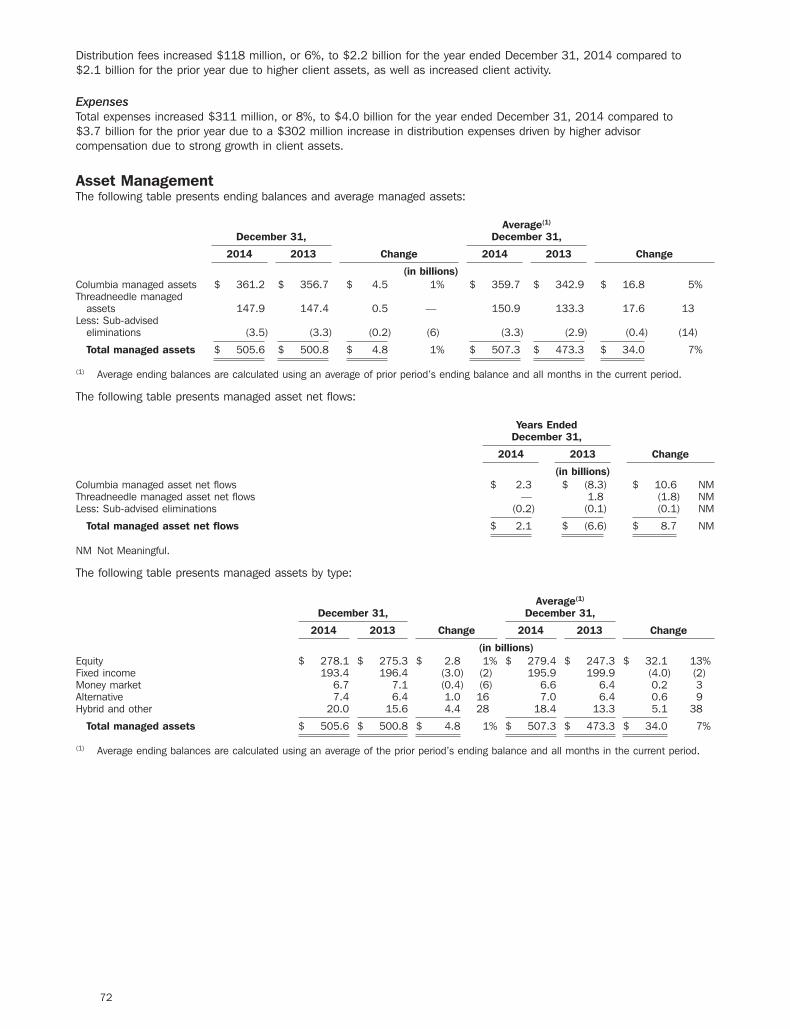
Distribution fees increased $118 million, or 6%, to $2.2 billion for the year ended December 31, 2014 compared to$2.1 billion for the prior year due to higher client assets, as well as increased client activity.
ExpensesTotal expenses increased $311 million, or 8%, to $4.0 billion for the year ended December 31, 2014 compared to$3.7 billion for the prior year due to a $302 million increase in distribution expenses driven by higher advisorcompensation due to strong growth in client assets.
Asset ManagementThe following table presents ending balances and average managed assets:
Average(1)
December 31, December 31,
2014 2013 Change 2014 2013 Change
(in billions)Columbia managed assets $ 361.2 $ 356.7 $ 4.5 1% $ 359.7 $ 342.9 $ 16.8 5%Threadneedle managed
assets 147.9 147.4 0.5 — 150.9 133.3 17.6 13Less: Sub-advised
eliminations (3.5) (3.3) (0.2) (6) (3.3) (2.9) (0.4) (14)
Total managed assets $ 505.6 $ 500.8 $ 4.8 1% $ 507.3 $ 473.3 $ 34.0 7%
(1) Average ending balances are calculated using an average of prior period’s ending balance and all months in the current period.
The following table presents managed asset net flows:
Years EndedDecember 31,
2014 2013 Change
(in billions)Columbia managed asset net flows $ 2.3 $ (8.3) $ 10.6 NMThreadneedle managed asset net flows — 1.8 (1.8) NMLess: Sub-advised eliminations (0.2) (0.1) (0.1) NM
Total managed asset net flows $ 2.1 $ (6.6) $ 8.7 NM
NM Not Meaningful.
The following table presents managed assets by type:
Average(1)
December 31, December 31,
2014 2013 Change 2014 2013 Change
(in billions)Equity $ 278.1 $ 275.3 $ 2.8 1% $ 279.4 $ 247.3 $ 32.1 13%Fixed income 193.4 196.4 (3.0) (2) 195.9 199.9 (4.0) (2)Money market 6.7 7.1 (0.4) (6) 6.6 6.4 0.2 3Alternative 7.4 6.4 1.0 16 7.0 6.4 0.6 9Hybrid and other 20.0 15.6 4.4 28 18.4 13.3 5.1 38
Total managed assets $ 505.6 $ 500.8 $ 4.8 1% $ 507.3 $ 473.3 $ 34.0 7%
(1) Average ending balances are calculated using an average of the prior period’s ending balance and all months in the current period.
72

The following tables present the changes in Columbia and Threadneedle managed assets:
Years EndedDecember 31,
2014 2013
(in billions)Columbia Managed Assets Rollforward
Retail FundsBeginning assets $ 239.4 $ 216.3
Mutual fund inflows 36.0 38.1Mutual fund outflows (47.4) (50.9)Net VP/VIT fund flows (0.9) (0.6)
Net new flows (12.3) (13.4)Reinvested dividends 13.4 9.9
Net flows 1.1 (3.5)Distributions (15.9) (11.5)Market appreciation and other 13.1 38.1
Total ending assets 237.7 239.4
InstitutionalBeginning assets 75.6 72.4
Inflows 20.4 21.6Outflows (20.2) (26.1)
Net flows 0.2 (4.5)Market appreciation and other 4.9 7.7
Total ending assets 80.7 75.6
AlternativeBeginning assets 5.6 5.7
Inflows 1.7 1.3Outflows (0.7) (1.6)
Net flows 1.0 (0.3)Market appreciation and other 0.1 0.2
Total ending assets 6.7 5.6
Affiliated General Account Assets 36.1 36.1
Total Columbia managed assets $ 361.2 $ 356.7
Total Columbia net flows $ 2.3 $ (8.3)
73

Years EndedDecember 31,
2014 2013
(in billions)Threadneedle Managed Assets Rollforward
Retail FundsBeginning assets $ 50.6 $ 39.1
Mutual fund inflows 23.4 23.3Mutual fund outflows (26.0) (18.9)
Net new flows (2.6) 4.4Reinvested dividends 0.2 0.2
Net flows (2.4) 4.6Distributions (0.7) (0.5)Market appreciation 0.8 5.6Foreign currency translation(1) (2.8) 1.1Other 1.0 0.7
Total ending assets 46.5 50.6
InstitutionalBeginning assets 96.1 87.6
Inflows 13.3 9.2Outflows (10.8) (11.8)
Net flows 2.5 (2.6)Market appreciation 5.4 6.7Foreign currency translation(1) (6.1) 1.6Other 2.8 2.8
Total ending assets 100.7 96.1
AlternativeBeginning assets 0.7 1.1
Inflows — —Outflows (0.1) (0.2)
Net flows (0.1) (0.2)Market appreciation (depreciation) 0.1 (0.2)
Total ending assets 0.7 0.7
Total Threadneedle managed assets $ 147.9 $ 147.4
Total Threadneedle net flows $ — $ 1.8(1) Amounts represent British Pound to US dollar conversion.
Total segment AUM increased $4.8 billion, or 1%, during the year ended December 31, 2014 driven by marketappreciation, partially offset by a negative impact of foreign currency translation and retail fund distributions. Total segmentAUM net inflows were $2.1 billion for the year ended December 31, 2014.
Columbia Management managed assets increased $4.5 billion, or 1%, during the year ended December 31, 2014primarily due to market appreciation, partially offset by retail fund distributions. Total Columbia Management net inflowswere $2.3 billion for the year ended December 31, 2014. Columbia Management retail funds decreased $1.7 billion, or1%, during the year ended December 31, 2014 primarily due to distributions, partially offset by market appreciation.Columbia Management retail net inflows of $1.1 billion during the year ended December 31, 2014 included $13.4 billionof reinvested dividends, partially offset by $12.3 billion of net new outflows. Columbia Management retail net new outflowsduring the year ended December 31, 2014 included $5.1 billion of outflows in the defined contribution/investment onlychannel, $1.5 billion of outflows from a former parent affiliated distribution relationship, $1.5 billion of outflows in the RIAchannel and $1.1 billion of outflows from a third party sub-advisor. Columbia Management institutional AUM increased$5.1 billion, or 7%, during the year ended December 31, 2014 due to market appreciation. Columbia Managementinstitutional net inflows of $0.2 billion for the year ended December 31, 2014 primarily reflect third party institutionalinflows, partially offset by former parent affiliated distribution and former parent influenced mandates. ColumbiaManagement alternative AUM increased $1.1 billion, or 20%, during the year ended December 31, 2014 due to netinflows of $1.0 billion reflecting the launch of three new CLOs, partially offset by a CLO liquidation.
Threadneedle managed assets were essentially flat compared to the prior year as market appreciation was offset by anegative impact of foreign currency translation. Threadneedle retail funds decreased $4.1 billion, or 8%, during the yearended December 31, 2014 primarily due to net outflows and the negative impact of foreign currency translation.Threadneedle retail net outflows were $2.4 billion reflecting approximately $4.6 billion of outflows from the U.S. equitiesproduct where we had a portfolio manager change earlier in 2014 offset by underlying net inflows. Threadneedleinstitutional AUM increased $4.6 billion, or 5%, during the year ended December 31, 2014 primarily due to net inflowsand market appreciation, partially offset by a negative impact of foreign currency translation. Threadneedle institutional net
74

inflows of $2.5 billion for the year ended December 31, 2014 included a $5.6 billion mandate from a leading UK wealthmanagement firm to manage assets in a Strategic Managed fund, partially offset by $3.4 billion of outflows from legacyinsurance assets.
The following table presents the results of operations of our Asset Management segment on an operating basis:
Years EndedDecember 31,
2014 2013 Change
(in millions)Revenues
Management and financial advice fees $ 2,791 $ 2,643 $ 148 6%Distribution fees 493 469 24 5Net investment income 30 54 (24) (44)Other revenues 6 5 1 20
Total revenues 3,320 3,171 149 5Banking and deposit interest expense — 2 (2) NM
Total net revenues 3,320 3,169 151 5
ExpensesDistribution expenses 1,148 1,112 36 3Amortization of deferred acquisition costs 15 17 (2) (12)Interest and debt expense 26 24 2 8General and administrative expense 1,343 1,325 18 1
Total expenses 2,532 2,478 54 2
Operating earnings $ 788 $ 691 $ 97 14%
NM Not Meaningful.
Our Asset Management segment pretax operating earnings, which exclude net realized investment gains or losses,increased $97 million, or 14%, to $788 million for the year ended December 31, 2014 compared to $691 million for theprior year reflecting higher average assets under management driven by equity market appreciation, partially offset by retailfund distributions and a $30 million gain on the sale of Threadneedle’s strategic business investment in Cofunds in theprior year.
Net RevenuesNet revenues, which exclude net realized investment gains or losses, increased $151 million, or 5%, to $3.3 billion for theyear ended December 31, 2014 compared to $3.2 billion for the prior year driven by an increase in management andfinancial advice fees.
Management and financial advice fees increased $148 million, or 6%, to $2.8 billion for the year ended December 31,2014 compared to $2.6 billion for the prior year primarily due to an increase in assets under management. Averageassets under management increased 7% compared to the prior year primarily driven by equity market appreciation, partiallyoffset by retail fund distributions. See our discussion above on the changes in assets under management.
Distribution fees increased $24 million, or 5%, to $493 million for the year ended December 31, 2014 compared to$469 million for the prior year primarily due to higher assets levels due to market appreciation, partially offset by retailfund distributions.
Net investment income, which excludes net realized investment gains or losses, decreased $24 million, or 44%, to$30 million for the year ended December 31, 2014 compared to $54 million for the prior year due to a $30 million gainon the sale of Threadneedle’s investment in Cofunds in the prior year.
ExpensesTotal expenses increased $54 million, or 2%, to $2.5 billion for the year ended December 31, 2014 compared to the prioryear primarily due to a $36 million increase in distribution expenses driven by higher average retail fund assets and an$18 million increase in general and administrative expense primarily driven by the negative impact of foreign exchangerates and investments in the business. The negative impact of foreign exchanges rates on expenses was more than offsetby the positive impact to revenues.
75

AnnuitiesThe following table presents the results of operations of our Annuities segment on an operating basis:
Years EndedDecember 31,
2014 2013 Change
(in millions)Revenues
Management and financial advice fees $ 756 $ 709 $ 47 7%Distribution fees 360 339 21 6Net investment income 941 1,036 (95) (9)Premiums 109 110 (1) (1)Other revenues 425 367 58 16
Total revenues 2,591 2,561 30 1Banking and deposit interest expense — — — —
Total net revenues 2,591 2,561 30 1
ExpensesDistribution expenses 439 420 19 5Interest credited to fixed accounts 556 653 (97) (15)Benefits, claims, losses and settlement expenses 463 498 (35) (7)Amortization of deferred acquisition costs 235 111 124 NMInterest and debt expense 38 37 1 3General and administrative expense 227 213 14 7
Total expenses 1,958 1,932 26 1
Operating earnings $ 633 $ 629 $ 4 1%
NM Not Meaningful.
Our Annuities segment pretax operating income, which excludes net realized investment gains or losses (net of the relatedDSIC and DAC amortization) and the market impact on variable annuity guaranteed benefits (net of hedges and the relatedDSIC and DAC amortization), increased $4 million, or 1%, to $633 million for the year ended December 31, 2014compared to $629 million for the prior year primarily due to market appreciation, as well as a benefit from policyholdermovement of investments in Portfolio Navigator funds under certain in force variable annuities with living benefitguarantees to the Portfolio Stabilizer funds, partially offset by the impact of unlocking. The impact of unlocking was adecrease to pretax operating income of $22 million for the year ended December 31, 2014 compared to an increase of$60 million for the prior year.
During the fourth quarter of 2013, we added Portfolio Stabilizer fund options for our in force variable annuities with livingbenefit guarantees. These additional investment options resulted in sizable asset movement into the managed volatilityfunds. The resulting earnings benefit for the year ended December 31, 2014 was $44 million compared to a benefit of$26 million in the prior year.
RiverSource variable annuity account balances increased 2% to $77.0 billion at December 31, 2014 compared to theprior year due to market appreciation, partially offset by net outflows of $1.7 billion.
RiverSource fixed annuity account balances declined 8% to $12.1 billion at December 31, 2014 compared to the prioryear reflecting elevated surrenders on products sold through third parties where crediting rates have reset lower. Thechange in crediting rates decreased the level of spread compression for the year ended December 31, 2014. All of thefive-year guarantee block totaling $4.1 billion was re-priced as of December 31, 2014.
Net RevenuesNet revenues, which exclude net realized investment gains or losses, increased $30 million, or 1%, to $2.6 billion for theyear ended December 31, 2014 compared to the prior year primarily due to an increase in management and financialadvice fees and other revenues partially offset by a decrease in net investment income.
Management and financial advice fees increased $47 million, or 7%, to $756 million for the year ended December 31,2014 compared to $709 million for the prior year due to higher fees on variable annuities driven by higher separateaccount balances. Average variable annuity account balances increased $4.4 billion, or 7%, from the prior year due tomarket appreciation, partially offset by net outflows.
Distribution fees increased $21 million, or 6%, to $360 million for the year ended December 31, 2014 compared to$339 million for the prior year primarily due to higher fees on variable annuities driven by higher separate accountbalances.
76

Net investment income, which excludes net realized investment gains or losses, decreased $95 million, or 9%, to$941 million for the year ended December 31, 2014 compared to $1.0 billion for the prior year primarily reflecting adecrease of approximately $39 million from lower invested assets due to fixed annuity net outflows and approximately$63 million from lower interest rates.
Other revenues increased $58 million, or 16%, to $425 million for the year ended December 31, 2014 compared to$367 million for the prior year due to higher fees from variable annuity guarantee sales in the prior year where the feesstart on the first anniversary date and higher average fee rates.
ExpensesTotal expenses, which exclude the market impact on variable annuity guaranteed benefits (net of hedges and the relatedDSIC and DAC amortization) and the DAC and DSIC offset to net realized investment gains or losses, increased$26 million, or 1%, to $2.0 billion for the year ended December 31, 2014 compared to $1.9 billion for the prior yearprimarily due to an increase in amortization of DAC, partially offset by a decrease in interest credited to fixed accounts andbenefits, claims, losses and settlement expenses.
Distribution expenses increased $19 million, or 5%, to $439 million for the year ended December 31, 2014 compared to$420 million for the prior year primarily due to higher variable annuity compensation driven by higher variable annuitycontract values.
Interest credited to fixed accounts decreased $97 million, or 15%, to $556 million for the year ended December 31,2014 compared to $653 million for the prior year driven by lower average fixed annuity account balances and a loweraverage crediting rate on interest sensitive fixed annuities. Average fixed annuity account balances decreased $884 million,or 7%, to $12.7 billion for the year ended December 31, 2014 compared to the prior year due to net outflows reflectingelevated surrenders on products sold through third parties where rates have reset lower. The average fixed annuity creditingrate excluding capitalized interest decreased to 3.0% for the year ended December 31, 2014 compared to 3.6% for theprior year reflecting the re-pricing of the five-year guarantee block.
Benefits, claims, losses and settlement expenses, which exclude the market impact on variable annuity guaranteedbenefits (net of hedges and the related DSIC amortization) and the DSIC offset to net realized investment gains or losses,decreased $35 million, or 7%, to $463 million for the year ended December 31, 2014 compared to $498 million for theprior year primarily due to a $21 million decrease in expense related to the benefit from policyholder movement ofinvestments in Portfolio Navigator funds under certain in force variable annuities with living benefit guarantees to thePortfolio Stabilizer funds and the impact of unlocking, partially offset by an increase in expense of $26 million related tohigher reserve funding driven by the impact of higher fees from variable annuity guarantee sales in the prior year where thefees start on the first anniversary date. Benefits, claims, losses and settlement expenses for the year ended December 31,2014 included a $5 million expense from unlocking primarily reflecting lower than previously assumed interest rates,partially offset by a benefit from updating our variable annuity living benefit withdrawal utilization assumption. Benefits,claims, losses and settlement expenses for the year ended December 31, 2013 included a $21 million expense fromunlocking primarily reflecting the impact of variable annuity model changes.
Amortization of DAC, which excludes the DAC offset to the market impact on variable annuity guaranteed benefits and theDAC offset to net realized investment gains or losses, increased $124 million to $235 million for the year endedDecember 31, 2014 compared to $111 million for the prior year primarily due to the impact of unlocking. Amortization ofDAC for the year ended December 31, 2014 included a $17 million expense from unlocking primarily driven by lower thanpreviously assumed interest rates, partially offset by favorable persistency and mortality experience and a benefit fromupdating our variable annuity living benefit withdrawal utilization assumption. Amortization of DAC for the year endedDecember 31, 2013 included an $81 million benefit from unlocking primarily driven by higher than previously assumedinterest rates and changes in assumed policyholder behavior.
77

ProtectionThe following table presents the results of operations of our Protection segment on an operating basis:
Years EndedDecember 31,
2014 2013 Change
(in millions)Revenues
Management and financial advice fees $ 59 $ 58 $ 1 2%Distribution fees 92 91 1 1Net investment income 447 439 8 2Premiums 1,292 1,188 104 9Other revenues 397 410 (13) (3)
Total revenues 2,287 2,186 101 5Banking and deposit interest expense — — — —
Total net revenues 2,287 2,186 101 5
ExpensesDistribution expenses 61 62 (1) (2)Interest credited to fixed accounts 153 145 8 6Benefits, claims, losses and settlement expenses 1,416 1,252 164 13Amortization of deferred acquisition costs 135 118 17 14Interest and debt expense 28 25 3 12General and administrative expense 248 248 — —
Total expenses 2,041 1,850 191 10
Operating earnings $ 246 $ 336 $ (90) (27)%
Our Protection segment pretax operating income, which excludes net realized investment gains or losses (net of the relatedDAC amortization, unearned revenue amortization and the reinsurance accrual) and the market impact on indexeduniversal life benefits (net of hedges and the related DAC amortization, unearned revenue amortization and the reinsuranceaccrual), decreased $90 million, or 27%, to $246 million for the year ended December 31, 2014 compared to$336 million for the prior year primarily due to lower auto and home earnings reflecting higher incurred losses, as well asthe impact of unlocking.
Net RevenuesNet revenues, which exclude net realized investment gains or losses (net of unearned revenue amortization and thereinsurance accrual) and the unearned revenue amortization and the reinsurance accrual offset to the market impact onindexed universal life benefits, increased $101 million, or 5%, to $2.3 billion for the year ended December 31, 2014compared to $2.2 billion for the prior year primarily due to growth in auto and home premiums partially offset by theimpact of unlocking.
Premiums increased $104 million, or 9%, to $1.3 billion for the year ended December 31, 2014 compared to $1.2 billionfor the prior year primarily due to growth in auto and home premiums driven by new policy sales growth, primarily from ouraffinity relationships with Costco and Progressive. Auto and home policies in force increased 11% compared to the prioryear.
Other revenues, which exclude the unearned revenue amortization and the reinsurance accrual offset to the market impacton indexed universal life benefits and the unearned revenue amortization and the reinsurance accrual offset to net realizedinvestment gains or losses, decreased $13 million, or 3%, to $397 million for the year ended December 31, 2014compared to $410 million for the prior year primarily due to a $29 million unfavorable impact from unlocking for the yearended December 31, 2014 compared to an $18 million unfavorable impact in the prior year. The primary driver of theunlocking impact to other revenues in both periods was lower projected gains on reinsurance contracts resulting fromfavorable mortality experience.
ExpensesTotal expenses, which exclude the market impact on indexed universal life benefits (net of hedges and the related DACamortization) and the DAC offset to net realized investment gains or losses, increased $191 million, or 10%, to$2.0 billion for the year ended December 31, 2014 compared to $1.9 billion for the prior year primarily due to higherbenefits, claims, losses and settlement expenses related to our auto and home business.
Benefits, claims, losses and settlement expenses, which exclude the market impact on indexed universal life benefits (netof hedges), increased $164 million, or 13%, to $1.4 billion for the year ended December 31, 2014 compared to$1.3 billion for the prior year due to a $163 million increase in provision for estimated losses related to our auto and
78

home business reflecting the impact of growth in exposures from an 11% increase in policies in force, an increase incatastrophe losses reflecting the growth in exposures and the extremely severe winter and spring weather during 2014,and adverse development in the 2013 and prior accident years auto liability coverage observed during the first quarter of2014 resulting in a $30 million increase to prior accident year loss reserves. Later in 2014, further adverse lossdevelopment was observed primarily in the 2014 auto book of business which resulted in a $60 million increase to lossreserves for estimated losses including IBNR. Catastrophe losses were $66 million for the year ended December 31, 2014compared to $42 million for the prior year.
Corporate & OtherThe following table presents the results of operations of our Corporate & Other segment on an operating basis:
Years EndedDecember 31,
2014 2013 Change
(in millions)Revenues
Distribution fees $ 1 $ 1 $ — —%Net investment income (loss) (6) 8 (14) NMOther revenues 9 6 3 50
Total revenues 4 15 (11) (73)Banking and deposit interest expense — — — —
Total net revenues 4 15 (11) (73)
ExpensesDistribution expenses 1 1 — —Interest and debt expense 21 33 (12) (36)General and administrative expense 212 210 2 1
Total expenses 234 244 (10) (4)
Operating loss $ (230) $ (229) $ (1) —%
NM Not Meaningful.
Our Corporate & Other segment pretax operating loss excludes net realized investment gains or losses and the impact ofconsolidating CIEs. Our Corporate & Other segment pretax operating loss was $230 million for the year endedDecember 31, 2014 compared to $229 million for the prior year. Net investment income (loss) was a loss of $6 millionfor the year ended December 31, 2014 compared to income of $8 million for the prior year due to a $13 million increasein losses associated with affordable housing partnerships. Interest and debt expense decreased $12 million, or 36%, to$21 million for the year ended December 31, 2014 compared to $33 million for the prior year primarily due to$19 million in costs in 2013 related to the early redemption of our senior notes due 2015, partially offset by expenses in2014 related to the early redemption of our senior notes due 2039. General and administrative expense for the yearended December 31, 2014 included a provision for potential resolution of a regulatory matter regarding certain historicalevents and processes at one of our ongoing lines of business, which was partially offset by lower investment spendingcompared to the prior year.
Fair Value MeasurementsWe report certain assets and liabilities at fair value; specifically, separate account assets, derivatives, embeddedderivatives, properties held by our consolidated property funds, and most investments and cash equivalents. Fair valueassumes the exchange of assets or liabilities occurs in orderly transactions and is not the result of a forced liquidation ordistressed sale. We include actual market prices, or observable inputs, in our fair value measurements to the extentavailable. Broker quotes are obtained when quotes from pricing services are not available. We validate prices obtained fromthird parties through a variety of means such as: price variance analysis, subsequent sales testing, stale price review, pricecomparison across pricing vendors and due diligence reviews of vendors. See Note 14 to the Consolidated FinancialStatements for additional information on our fair value measurements.
Fair Value of Liabilities and Nonperformance RiskCompanies are required to measure the fair value of liabilities at the price that would be received to transfer the liability toa market participant (an exit price). Since there is not a market for our obligations of our variable annuity riders andindexed universal life insurance, we consider the assumptions participants in a hypothetical market would make to reflectan exit price. As a result, we adjust the valuation of variable annuity riders and indexed universal life insurance by updatingcertain contractholder assumptions, adding explicit margins to provide for profit, risk and expenses, and adjusting the ratesused to discount expected cash flows to reflect a current market estimate of our nonperformance risk. The
79

nonperformance risk adjustment is based on observable market data adjusted to estimate the risk of our life insurancecompany subsidiaries not fulfilling these liabilities. Consistent with general market conditions, this estimate resulted in aspread over the LIBOR swap curve as of December 31, 2015. As our estimate of this spread widens or tightens, theliability will decrease or increase. If this nonperformance credit spread moves to a zero spread over the LIBOR swap curve,the reduction to net income would be approximately $220 million, net of DAC, DSIC, unearned revenue amortization, thereinsurance accrual and income taxes (calculated at the statutory tax rate of 35%), based on December 31, 2015 creditspreads.
Liquidity and Capital Resources
OverviewWe maintained substantial liquidity during the year ended December 31, 2015. At December 31, 2015 and 2014, we had$2.4 billion and $2.6 billion, respectively, in cash and cash equivalents. We have additional liquidity available through anunsecured revolving credit facility for up to $500 million that expires in May 2020. Under the terms of the creditagreement, we can increase this facility to $750 million upon satisfaction of certain approval requirements. Availableborrowings under this facility are reduced by any outstanding letters of credit. At December 31, 2015, we had nooutstanding borrowings under this credit facility and had $1 million of outstanding letters of credit. Our junior subordinatednotes due 2066 and credit facility contain various administrative, reporting, legal and financial covenants. We were incompliance with all such covenants at December 31, 2015.
In 2015, we extinguished $49 million of our junior subordinated notes due 2066 in open market transactions andrecognized a gain of less than $1 million. In November 2015, we used cash on hand to fund the repayment of$350 million of our senior notes.
We enter into short-term borrowings, which may include repurchase agreements and Federal Home Loan Bank (‘‘FHLB’’)advances, to reduce reinvestment risk. Short-term borrowings allow us to receive cash to reinvest in longer-duration assets,while paying back the short-term debt with cash flows generated by the fixed income portfolio. The balance of repurchaseagreements at both December 31, 2015 and 2014 was $50 million, which is collateralized with agency residentialmortgage backed securities and commercial mortgage backed securities from our investment portfolio. Our subsidiary,RiverSource Life Insurance Company (‘‘RiverSource Life’’), is a member of the FHLB of Des Moines, which provides accessto collateralized borrowings. As of both December 31, 2015 and 2014, we had borrowings of $150 million from the FHLB,which is collateralized with commercial mortgage backed securities. We believe cash flows from operating activities,available cash balances and our availability of revolver borrowings will be sufficient to fund our operating liquidity needs.
Dividends from SubsidiariesAmeriprise Financial is primarily a parent holding company for the operations carried out by our wholly owned subsidiaries.Because of our holding company structure, our ability to meet our cash requirements, including the payment of dividendson our common stock, substantially depends upon the receipt of dividends or return of capital from our subsidiaries,particularly our life insurance subsidiary, RiverSource Life, our face-amount certificate subsidiary, Ameriprise CertificateCompany (‘‘ACC’’), AMPF Holding Corporation, which is the parent company of our retail introducing broker-dealersubsidiary, Ameriprise Financial Services, Inc. (‘‘AFSI’’) and our clearing broker-dealer subsidiary, American EnterpriseInvestment Services, Inc. (‘‘AEIS’’), our Auto and Home insurance subsidiary, IDS Property Casualty Insurance Company(‘‘IDS Property Casualty’’), doing business as Ameriprise Auto & Home Insurance, our transfer agent subsidiary, ColumbiaManagement Investment Services Corp., our investment advisory company, Columbia Management InvestmentAdvisers, LLC, and Threadneedle Asset Management Holdings Sarl. The payment of dividends by many of our subsidiariesis restricted and certain of our subsidiaries are subject to regulatory capital requirements.
80

Actual capital and regulatory capital requirements for our wholly owned subsidiaries subject to regulatory capitalrequirements were as follows:
Regulatory CapitalActual Capital Requirements
December 31, December 31,
2015 2014 2015 2014
(in millions)RiverSource Life(1)(2) $ 3,800 $ 3,614 $ 589 $ 595
RiverSource Life of NY(1)(2) 333 312 44 59IDS Property Casualty(1)(3) 684 560 214 200
Ameriprise Insurance Company(1)(3) 46 45 2 2ACC(4)(5) 274 248 258 226Threadneedle Asset Management Holdings Sarl(6) 285 221 165 199Ameriprise National Trust Bank(7) 36 21 10 10AFSI(3)(4) 93 93 # #Ameriprise Captive Insurance Company(3) 54 61 11 10Ameriprise Trust Company(3) 27 26 22 24AEIS(3)(4) 110 117 52 49RiverSource Distributors, Inc.(3)(4) 15 13 # #Columbia Management Investment Distributors, Inc.(3)(4) 17 18 # #
# Amounts are less than $1 million.(1) Actual capital is determined on a statutory basis.(2) Regulatory capital requirement is based on the statutory risk-based capital filing.(3) Regulatory capital requirement is based on the applicable regulatory requirement, calculated as of December 31, 2015 and 2014.(4) Actual capital is determined on an adjusted GAAP basis.(5) ACC is required to hold capital in compliance with the Minnesota Department of Commerce and SEC capital requirements.(6) Actual capital and regulatory capital requirements are determined in accordance with U.K. regulatory legislation. The regulatory capital
requirements at December 31, 2015 represent calculations at September 30, 2015 of the rule based requirements, as specified byFCA regulations.
(7) Ameriprise National Trust Bank is required to maintain capital in compliance with the Office of the Comptroller of the Currency(‘‘OCC’’) regulations and policies.
In addition to the particular regulations restricting dividend payments and establishing subsidiary capitalizationrequirements, we take into account the overall health of the business, capital levels and risk management considerationsin determining a dividend strategy for payments to our parent holding company from our subsidiaries, and in deciding touse cash to make capital contributions to our subsidiaries.
During the year ended December 31, 2015, the parent holding company received cash dividends or a return of capitalfrom its subsidiaries of $1.6 billion (including $800 million from RiverSource Life) and contributed cash to its subsidiariesof $271 million (including $175 million to IDS Property Casualty). During the year ended December 31, 2014, the parentholding company received cash dividends or a return of capital from its subsidiaries of $1.9 billion (including $900 millionfrom RiverSource Life) and contributed cash to its subsidiaries of $31 million.
The following table presents the dividends that could have been paid within the limitations of the applicable regulatoryauthorities for each of the years ended December 31. Dividends in excess of these amounts required advance notice tothe applicable regulatory authorities as further described in the footnotes to the table.
2015 2014 2013
(in millions)RiverSource Life(1)(2) $ 1,412 $ 811 $ 580ACC(3) 26 26 15Columbia Management Investment Advisers, LLC 503 553 506Columbia Management Investment Services Corporation 14 7 14Threadneedle Asset Management Holdings Sarl 172 175 174Ameriprise Trust Company 6 36 2IDS Property Casualty(4) 11 53 22Ameriprise Captive Insurance Company 64 65 50RiverSource Distributors, Inc. 14 23 23AMPF Holding Corporation 572 680 473
Total dividend capacity $ 2,794 $ 2,429 $ 1,859
(1) RiverSource Life dividends in excess of statutory unassigned funds require advance notice to the Minnesota Department ofCommerce, RiverSource Life’s primary regulator, and are subject to potential disapproval. In addition, dividends whose fair marketvalue, together with that of other dividends or distributions made within the preceding 12 months, exceeds the greater of (1) theprevious year’s statutory net gain from operations or (2) 10% of the previous year-end statutory capital and surplus are referred to as
81

‘‘extraordinary dividends.’’ Extraordinary dividends also require advance notice to the Minnesota Department of Commerce, and aresubject to potential disapproval. For dividends exceeding these thresholds, RiverSource Life provided notice to the MinnesotaDepartment of Commerce and received responses indicating that it did not object to the payment of these dividends.
(2) On February 11, 2016, RiverSource Life’s board of directors declared a cash dividend of $400 million to Ameriprise Financial, Inc.payable on or after March 1, 2016, pending approval by the Minnesota Department of Commerce.
(3) The dividend capacity for ACC is based on capital held in excess of regulatory requirements.(4) The dividend capacity for IDS Property Casualty is based on the lesser of (1) 10% of the previous year-end capital and surplus or
(2) the greater of (a) net income (excluding realized gains) of the previous year or (b) the aggregate net income of the previous threeyears excluding realized gains less any dividends paid within the first two years of the three-year period. Dividends that, together withthe amount of other distributions made within the preceding 12 months, exceed this statutory limitation are referred to as‘‘extraordinary dividends’’ and require advance notice to the Office of the Commissioner of Insurance of the State of Wisconsin, theprimary state regulator of IDS Property Casualty, and are subject to potential disapproval.
The following table presents the cash dividends paid or return of capital to the parent holding company, net of cash capitalcontributions made by the parent holding company for the following subsidiaries for the years ended December 31:
2015 2014 2013
(in millions)RiverSource Life $ 800 $ 900 $ 800Ameriprise Bank, FSB(1) — 8 130ACC (3) 5 (10)Columbia Management Investment Advisers, LLC 375 362 280Columbia Management Investment Services Corporation — — 10Threadneedle Asset Management Holdings Sarl(2) — — 73Ameriprise Trust Company — 34 (8)IDS Property Casualty(3) (175) — (50)Ameriprise Holdings, Inc. — — —Ameriprise Advisor Capital, LLC (72) (31) (37)RiverSource Distributors, Inc. — 10 —Ameriprise Captive Insurance Company 15 15 —AMPF Holding Corporation 421 519 340
Total $ 1,361 $ 1,822 $ 1,528
(1) In January 2013, we completed the conversion of our federal savings bank subsidiary, Ameriprise Bank, FSB, to a limited powersnational trust bank. In connection with the discontinuance of the Ameriprise Bank’s deposit-taking and lending activities and itsconversion to a limited powers trust bank, we applied for and received approval from the OCC and the Federal Reserve System for theBank to pay to the parent holding company a dividend of $250 million, which was paid in the fourth quarter of 2012. AmeripriseBank paid an additional $130 million dividend in January 2013 upon final approval to convert Ameriprise Bank, FSB to AmeripriseNational Trust Bank.
(2) During the year ended December 31, 2014, Threadneedle Asset Management Holdings Sarl paid a $152 million dividend to theparent holding company consisting of a note receivable.
(3) During the year ended December 31, 2014, the parent holding company made a non-cash contribution of $51 million to IDSProperty Casualty consisting of securities. In January 2016, the parent holding company made cash contributions of $75 million toIDS Property Casualty, which was not made under the Capital Support Agreement described in Note 4 of the Condensed FinancialInformation of Registrant included in Part IV, Schedule 1 of this Annual Report on Form 10-K.
Dividends Paid to Shareholders and Share RepurchasesWe paid regular quarterly dividends to our shareholders totaling $474 million and $435 million for the years endedDecember 31, 2015 and 2014, respectively. On January 27, 2016, we announced a quarterly dividend of $0.67 percommon share. The dividend will be paid on February 26, 2016 to our shareholders of record at the close of business onFebruary 12, 2016.
In April 2014, our Board of Directors authorized an expenditure of up to $2.5 billion for the repurchase of shares of ourcommon stock through April 28, 2016. In December 2015, our Board of Directors authorized us to repurchase up to anadditional $2.5 billion worth of our common stock through December 31, 2017. As of December 31, 2015, the Companyhad $2.6 billion remaining under its share repurchase authorizations. We intend to fund share repurchases through existingworking capital, future earnings and other customary financing methods. The share repurchase programs do not require thepurchase of any minimum number of shares, and depending on market conditions and other factors, these purchases maybe commenced or suspended at any time without prior notice. Acquisitions under the share repurchase programs may bemade in the open market, through privately negotiated transactions or block trades or other means. During the year endedDecember 31, 2015, we repurchased a total of 13.9 million shares of our common stock at an average price of $120.77per share.
Cash FlowsCash flows of CIEs are reflected in our cash flows provided by (used in) operating activities, investing activities andfinancing activities. Cash held by CIEs is not available for general use by Ameriprise Financial, nor is Ameriprise Financial
82

cash available for general use by its CIEs. As such, the operating, investing and financing cash flows of the CIEs have noimpact to the change in cash and cash equivalents.
Operating ActivitiesNet cash provided by operating activities increased $173 million to $2.6 billion for the year ended December 31, 2015compared to $2.4 billion for the prior year primarily due to a $118 million increase in cash from changes in otherinvestments primarily related to trading securities and a $139 million reduction of income taxes paid, net, partially offsetby a $67 million increase in interest paid on CIE debt.
Net cash provided by operating activities increased $1.0 billion to $2.4 billion for the year ended December 31, 2014compared to $1.4 billion for the prior year primarily due to an $861 million increase in cash flows related to investmentproperties of CIEs due to lower purchases and higher sales of investment properties and an increase in cash from changesin our freestanding derivatives and related collateral, as well as an increase in fee revenue partially offset by relatedexpenses and a $187 million increase in income taxes paid, net.
Investing ActivitiesOur investing activities primarily relate to our Available-for-Sale investment portfolio. Further, this activity is significantlyaffected by the net flows of our investment certificate, fixed annuity and universal life products reflected in financingactivities.
Net cash used in investing activities decreased $201 million to $514 million for the year ended December 31, 2015compared to $715 million for the prior year primarily reflecting a $520 million decrease in purchases of investments byCIEs and a $131 million increase in cash flows related to other investments, partially offset by a $435 million increase inpurchases of Available-for Sale securities.
Net cash used in investing activities decreased $87 million to $715 million for the year ended December 31, 2014compared to $802 million for the prior year primarily due to a $1.7 billion decrease in cash used for purchases ofAvailable-for-Sale securities, partially offset by a $560 million decrease in proceeds from sales and maturities, sinking fundpayments and calls of Available-for-Sale securities, a $587 million decrease in proceeds from sales, maturities andrepayments of investments by CIEs and a $121 million increase in purchases of investments by CIEs.
Financing ActivitiesNet cash used in financing activities increased $661 million to $2.3 billion for the year ended December 31, 2015compared to $1.7 billion for the prior year. Net cash inflows related to investment certificates increased $407 millioncompared to the prior year due to higher proceeds from additions, partially offset by higher maturities, withdrawals andcash surrenders. Cash outflows from surrenders and other benefits of policyholder account balances increased$274 million compared to the prior year primarily reflecting higher lapse rates. Cash outflows related to the repayment oflong-term debt increased $209 million compared to the prior year primarily due to the maturity of our senior notes in2015. Cash flows for the prior year reflected a $543 million increase in cash from issuance of our unsecured senior notesdue October 2024 and a $300 million decrease in cash related to short-term borrowings as we reduced our borrowingsfrom the FHLB. Cash outflows related to the repurchase of common shares increased $164 million compared to the prioryear. Net cash inflows related to changes in debt of CIEs decreased $217 million compared to the prior year due to adecrease in borrowings of CIEs, partially offset by lower repayments of debt of CIEs.
Net cash used in financing activities increased $1.4 billion to $1.7 billion for the year ended December 31, 2014compared to $306 million for the prior year. Cash outflows from policyholder account balances increased $662 millioncompared to the prior year primarily due to higher surrenders and other benefits. Net cash inflows related to investmentcertificates decreased $248 million compared to the prior year due to higher maturities, withdrawals and cash surrenderspartially offset by higher proceeds from additions. Cash outflows from changes in short-term borrowings increased$299 million compared to the prior year as we reduced our borrowings from the FHLB during the year endedDecember 31, 2014.
83

Contractual CommitmentsThe contractual obligations identified in the table below include both our on and off-balance sheet transactions thatrepresent material expected or contractually committed future obligations. The table excludes obligations of CIEs as theyare not direct obligations of the Company and have recourse only to the assets of the CIEs. Payments due by period as ofDecember 31, 2015 were as follows:
2021 andTotal 2016 2017-2018 2019-2020 Thereafter
(in millions)Balance SheetLong-term debt(1) $ 2,655 $ 11 $ 25 $ 1,074 $ 1,545Insurance and annuities(2) 42,103 2,602 4,631 4,133 30,737Investment certificates(3) 4,835 4,560 275 — —Deferred premium options(4) 1,920 331 494 462 633Affordable housing partnerships(5) 117 67 43 2 5
Off-Balance SheetOperating lease obligations 277 56 99 59 63Purchase obligations(6) 972 269 376 276 51Interest on long-term debt(7) 1,600 135 266 202 997
Total $ 54,479 $ 8,031 $ 6,209 $ 6,208 $ 34,031
(1) See Note 13 to our Consolidated Financial Statements for more information about our long-term debt. Amounts include obligationsunder capital leases.
(2) These scheduled payments are represented by reserves of approximately $28.8 billion at December 31, 2015 and are based oninterest credited, mortality, morbidity, lapse, surrender and premium payment assumptions. Actual payment obligations may differ ifexperience varies from these assumptions. Separate account liabilities have been excluded as associated contractual obligationswould be met by separate account assets.
(3) The payments due by year are based on contractual term maturities. However, contractholders have the right to redeem theinvestment certificates earlier and at their discretion subject to surrender charges, if any. Redemptions are most likely to occur inperiods of substantial increases in interest rates.
(4) The fair value of these commitments included on the Consolidated Balance Sheets was $1.8 billion as of December 31, 2015. SeeNote 16 to our Consolidated Financial Statements for more information about our deferred premium options.
(5) Affordable housing partnership commitments are related to investments in low income housing tax credit partnerships. Call dates forthe obligations presented are either date or event specific. For date specific obligations, we are required to fund a specific amount ona stated date provided there are no defaults under the agreement. For event specific obligations, we are required to fund a specificamount of its capital commitment when properties in a fund become fully stabilized. For event specific obligations, the estimated calldate of these commitments is used in the table above.
(6) Purchase obligations include the minimum contractual amounts by period under contracts that were in effect at December 31, 2015.Many of the purchase agreements giving rise to these purchase obligations include termination clauses that may require payment oftermination fees if the agreements are terminated by us without cause prior to their stated expiration; however, the table reflects theamounts to be paid assuming the contracts are not terminated.
(7) Interest on long-term debt was estimated based on rates in effect as of December 31, 2015.
In addition to the contractual commitments outlined in the table above, we periodically fund the employees’ definedbenefit plans. We contributed $45 million and $42 million in 2015 and 2014, respectively, to our pension plans. In 2016,we expect to contribute $23 million to our pension plans and $2 million to our defined benefit postretirement plans. SeeNote 22 to our Consolidated Financial Statements for additional information.
Total loan funding commitments, which are not included in the table above due to uncertainty with respect to timing offuture cash flows, were $523 million at December 31, 2015.
For additional information relating to these contractual commitments, see Note 23 to our Consolidated FinancialStatements.
Off-Balance Sheet ArrangementsWe provide asset management services to investment entities which are considered to be VIEs, such as CLOs, hedgefunds, property funds and private equity funds, which are sponsored by us. We consolidate certain CLOs and propertyfunds. We have determined that consolidation is not required for hedge funds and private equity funds which aresponsored by us. Our maximum exposure to loss with respect to our investment in these non-consolidated entities islimited to our carrying value. We have no obligation to provide further financial or other support to these investmententities nor have we provided any support to these investment entities. See Note 4 to our Consolidated FinancialStatements for additional information on our arrangements with these investment entities.
84

Forward-Looking StatementsThis report contains forward-looking statements that reflect management’s plans, estimates and beliefs. Actual resultscould differ materially from those described in these forward-looking statements. Examples of such forward-lookingstatements include:
• statements of the Company’s plans, intentions, positioning, expectations, objectives or goals, including those relatingto asset flows, mass affluent and affluent client acquisition strategy, client retention and growth of our client base,financial advisor productivity, retention, recruiting and enrollments, the introduction, cessation, terms or pricing of newor existing products and services, acquisition integration, benefits and claims expenses, general and administrativecosts, consolidated tax rate, return of capital to shareholders, debt repayment and excess capital position and financialflexibility to capture additional growth opportunities;
• other statements about future economic performance, the performance of equity markets and interest rate variationsand the economic performance of the United States and of global markets; and
• statements of assumptions underlying such statements.
The words ‘‘believe,’’ ‘‘expect,’’ ‘‘anticipate,’’ ‘‘optimistic,’’ ‘‘intend,’’ ‘‘plan,’’ ‘‘aim,’’ ‘‘will,’’ ‘‘may,’’ ‘‘should,’’ ‘‘could,’’‘‘would,’’ ‘‘likely,’’ ‘‘forecast,’’ ‘‘on pace,’’ ‘‘project’’ and similar expressions are intended to identify forward-lookingstatements but are not the exclusive means of identifying such statements. Forward-looking statements are subject to risksand uncertainties, which could cause actual results to differ materially from such statements.
Such factors include, but are not limited to:
• conditions in the interest rate, credit default, equity market and foreign exchange environments, including changes invaluations, liquidity and volatility;
• changes in and the adoption of relevant accounting standards and securities rating agency standards and processes,as well as changes in the litigation and regulatory environment, including ongoing legal proceedings and regulatoryactions, the frequency and extent of legal claims threatened or initiated by clients, other persons and regulators, anddevelopments in regulation and legislation, including the rules and regulations implemented or to be implemented inconnection with the Dodd-Frank Wall Street Reform and Consumer Protection Act or in light of the U.S. Department ofLabor pending rule and exemptions pertaining to the fiduciary status of investment advice providers to 401(k) plans,plan sponsors, plan participants and the holders of individual retirement or health savings accounts;
• investment management performance and distribution partner and consumer acceptance of the Company’s products;
• effects of competition in the financial services industry, including pricing pressure, the introduction of new products andservices and changes in product distribution mix and distribution channels;
• changes to the Company’s reputation that may arise from employee or advisor misconduct, legal or regulatory actions,perceptions of the financial services industry generally, improper management of conflicts of interest or otherwise;
• the Company’s capital structure, including indebtedness, limitations on subsidiaries to pay dividends, and the extent,manner, terms and timing of any share or debt repurchases management may effect as well as the opinions of ratingagencies and other analysts and the reactions of market participants or the Company’s regulators, advisors,distribution partners or customers in response to any change or prospect of change in any such opinion;
• changes to the availability and cost of liquidity and the Company’s credit capacity that may arise due to shifts inmarket conditions, the Company’s credit ratings and the overall availability of credit;
• risks of default, capacity constraint or repricing by issuers or guarantors of investments the Company owns or bycounterparties to hedge, derivative, insurance or reinsurance arrangements or by manufacturers of products theCompany distributes, experience deviations from the Company’s assumptions regarding such risks, the evaluations orthe prospect of changes in evaluations of any such third parties published by rating agencies or other analysts, and thereactions of other market participants or the Company’s regulators, advisors, distribution partners or customers inresponse to any such evaluation or prospect of changes in evaluation;
• experience deviations from the Company’s assumptions regarding morbidity, mortality and persistency in certain annuityand insurance products, or from assumptions regarding market returns assumed in valuing or unlocking DAC and DSICor market volatility underlying the Company’s valuation and hedging of guaranteed benefit annuity riders, or fromassumptions regarding interest rates assumed in the Company’s loss recognition testing of its long term care business,or from assumptions regarding anticipated claims and losses relating to the Company’s automobile and homeinsurance products;
• changes in capital requirements that may be indicated, required or advised by regulators or rating agencies;
85

• the impacts of the Company’s efforts to improve distribution economics and to grow third-party distribution of itsproducts;
• the ability to pursue and complete strategic transactions and initiatives, including acquisitions, divestitures,restructurings, joint ventures and the development of new products and services;
• the ability to realize the financial, operating and business fundamental benefits of strategic transactions and initiativesthe Company has completed, is pursuing or may pursue in the future, which may be impacted by the ability to obtainregulatory approvals, the ability to effectively manage related expenses and by market, business partner and consumerreactions to such strategic transactions and initiatives;
• the ability and timing to realize savings and other benefits from re-engineering and tax planning;
• interruptions or other failures in the Company’s communications, technology and other operating systems, includingerrors or failures caused by third party service providers, interference or failures caused by third party attacks on theCompany’s systems, or the failure to safeguard the privacy or confidentiality of sensitive information and data on suchsystems; and
• general economic and political factors, including consumer confidence in the economy and the financial industry, theability and inclination of consumers generally to invest as well as their ability and inclination to invest in financialinstruments and products other than cash and cash equivalents, the costs of products and services the Companyconsumes in the conduct of its business, and applicable legislation and regulation and changes therein, including taxlaws, tax treaties, fiscal and central government treasury policy, and policies regarding the financial services industryand publicly-held firms, and regulatory rulings and pronouncements.
Management cautions the reader that the foregoing list of factors is not exhaustive. There may also be other risks thatmanagement is unable to predict at this time that may cause actual results to differ materially from those in forward-looking statements. Readers are cautioned not to place undue reliance on these forward-looking statements, which speakonly as of the date on which they are made. Management undertakes no obligation to update publicly or revise anyforward-looking statements.
Ameriprise Financial announces financial and other information to investors through the Company’s investor relationswebsite at ir.ameriprise.com, as well as SEC filings, press releases, public conference calls and webcasts. Investors andothers interested in the company are encouraged to visit the investor relations website from time to time, as information isupdated and new information is posted. The website also allows users to sign up for automatic notifications in the eventnew materials are posted. The information found on the website is not incorporated by reference into this report or in anyother report or document the Company furnishes or files with the SEC.
Item 7A. Quantitative and Qualitative Disclosures About Market Risk
Market RiskOur primary market risk exposures are interest rate, equity price, foreign currency exchange rate and credit risk. Equityprice and interest rate fluctuations can have a significant impact on our results of operations, primarily due to the effectsthey have on the asset management and other asset-based fees we earn, the spread income generated on our fixedannuities, fixed insurance, brokerage client cash balances, face-amount certificate products and the fixed portion of ourvariable annuities and variable insurance contracts, the value of DAC and DSIC assets, the value of liabilities forguaranteed benefits associated with our variable annuities and the value of derivatives held to hedge these benefits.
RiverSource Life has the following variable annuity guarantee benefits: guaranteed minimum withdrawal benefits(‘‘GMWB’’), guaranteed minimum accumulation benefits (‘‘GMAB’’), guaranteed minimum death benefits (‘‘GMDB’’) andguaranteed minimum income benefits (‘‘GMIB’’). Each of these guaranteed benefits guarantees payouts to the annuityholder under certain specific conditions regardless of the performance of the underlying invested assets.
The variable annuity guarantees continue to be managed by utilizing a hedging program which attempts to match thesensitivity of the assets with the sensitivity of the liabilities. This approach works with the premise that matchedsensitivities will produce a highly effective hedging result. Our comprehensive hedging program focuses mainly on first ordersensitivities of assets and liabilities: Equity Market Level (Delta), Interest Rate Level (Rho) and Volatility (Vega). Additionally,various second order sensitivities are managed. We use various index options across the term structure, interest rateswaps and swaptions, total return swaps and futures to manage the risk exposures. The exposures are measured andmonitored daily, and adjustments to the hedge portfolio are made as necessary.
We have a macro hedge program to provide protection against the statutory tail scenario risk arising from variable annuityreserves on our statutory surplus and to cover some of the residual risks not covered by other hedging activities. Weassess the residual risk under a range of scenarios in creating and executing the macro hedge program. As a means of
86

economically hedging these risks, we use a combination of options and/or swaps. Certain of the macro hedge derivativesused contain settlement provisions linked to both equity returns and interest rates; the remaining are interest ratecontracts or equity contracts. The macro hedge program could result in additional earnings volatility as changes in thevalue of the macro hedge derivatives, which are designed to reduce statutory capital volatility, may not be closely alignedto changes in the variable annuity guarantee embedded derivatives.
To evaluate interest rate and equity price risk we perform sensitivity testing which measures the impact on pretax incomefrom the sources listed below for a 12-month period following a hypothetical 100 basis point increase in interest rates or ahypothetical 10% decline in equity prices. The interest rate risk test assumes a sudden 100 basis point parallel shift in theyield curve, with rates then staying at those levels for the next 12 months. The equity price risk test assumes a sudden10% drop in equity prices, with equity prices then staying at those levels for the next 12 months. In estimating the valuesof variable annuity riders, equity indexed annuities, stock market certificates, indexed universal life insurance and theassociated hedge assets, we assume no change in implied market volatility despite the 10% drop in equity prices.
The following tables present our estimate of the impact on pretax income from these hypothetical market movements as ofDecember 31, 2015:
Equity Price Exposure to Pretax Income
Equity Price Decline 10% Before Hedge Impact Hedge Impact Net Impact
(in millions)Asset-based management and distribution fees(1) $ (232) $ 4 $ (228)DAC and DSIC amortization(2)(3) (107) — (107)Variable annuity riders:
GMDB and GMIB(3) (155) — (155)GMWB (406) 467 61GMAB (45) 51 6DAC and DSIC amortization(4) N/A N/A (11)
Total variable annuity riders (606) 518 (99)Macro hedge program(5) — 16 16Equity indexed annuities 1 (1) —Certificates 2 (2) —Indexed universal life insurance 19 (18) 1
Total $ (923) $ 517 $ (417)
Interest Rate Exposure to Pretax Income
Interest Rate Increase 100 Basis Points Before Hedge Impact Hedge Impact Net Impact
(in millions)Asset-based management and distribution fees(1) $ (47) $ — $ (47)Variable annuity riders:
GMDB and GMIB — — —GMWB 953 (1,032) (79)GMAB 36 (38) (2)DAC and DSIC amortization(4) N/A N/A 15
Total variable annuity riders 989 (1,070) (66)Macro hedge program(5) — 11 11Fixed annuities, fixed insurance and fixed portion of variable annuities and
variable insurance products 67 — 67Brokerage client cash balances 156 — 156Certificates — — —Indexed universal life insurance 48 1 49
Total $ 1,213 $ (1,058) $ 170
N/A Not Applicable.(1) Excludes incentive income which is impacted by market and fund performance during the period and cannot be readily estimated.(2) Market impact on DAC and DSIC amortization resulting from lower projected profits.(3) In estimating the impact on DAC and DSIC amortization resulting from lower projected profits, we have not changed our assumed
equity asset growth rates. This is a significantly more conservative estimate than if we assumed management follows its meanreversion guideline and increased near-term rates to recover the drop in equity values over a five-year period. We make this sameconservative assumption in estimating the impact from GMDB and GMIB riders.
(4) Market impact on DAC and DSIC amortization related to variable annuity riders is modeled net of hedge impact.(5) The market impact of the macro hedge program is modeled net of any related impact to DAC and DSIC amortization.
The above results compare to an estimated negative net impact to pretax income of $435 million related to a 10% equityprice decline and an estimated positive net impact to pretax income of $89 million related to a 100 basis point increasein interest rates as of December 31, 2014. The change in interest rate exposure since December 31, 2014 is primarily
87

the result of adding new interest rate derivatives to the macro hedge program during 2015 and subsequent changes inmarket rates, as well as higher brokerage client cash balances.
Net impacts shown in the above table from GMWB and GMAB riders result largely from differences between the liabilityvaluation basis and the hedging basis. Liabilities are valued using fair value accounting principles, with risk marginsincorporated in contractholder behavior assumptions and with discount rates increased to reflect a current market estimateof our risk of nonperformance specific to these liabilities. The nonperformance spread risk is not hedged.
Actual results could differ materially from those illustrated above as they are based on a number of estimates andassumptions. These include assuming that implied market volatility does not change when equity prices fall by 10%, thatmanagement does not increase assumed equity asset growth rates to anticipate recovery of the drop in equity values whenvaluing DAC, DSIC and GMDB and GMIB liability values and that the 100 basis point increase in interest rates is a parallelshift of the yield curve. Furthermore, we have not tried to anticipate changes in client preferences for different types ofassets or other changes in client behavior, nor have we tried to anticipate actions management might take to increaserevenues or reduce expenses in these scenarios.
The selection of a 100 basis point interest rate increase as well as a 10% equity price decline should not be construed asa prediction of future market events. Impacts of larger or smaller changes in interest rates or equity prices may not beproportional to those shown for a 100 basis point increase in interest rates or a 10% decline in equity prices.
Asset-Based Management and Distribution FeesWe earn asset-based management fees and distribution fees on our assets under management. At December 31, 2015,the value of our assets under management was $629.0 billion. These sources of revenue are subject to both interest rateand equity price risk since the value of these assets and the fees they earn fluctuate inversely with interest rates anddirectly with equity prices. We do not currently hedge the interest rate or equity price risk of this exposure.
DAC and DSIC AmortizationFor annuity and UL products, DAC and DSIC are amortized on the basis of estimated gross profits. Estimated gross profitsare a proxy for pretax income prior to the recognition of DAC and DSIC amortization expense. When events occur thatreduce or increase current period estimated gross profits, DAC and DSIC amortization expense is typically reduced orincreased as well, somewhat mitigating the impact of the event on pretax income.
Variable Annuity RidersThe total contract value of all variable annuities at December 31, 2015 was $74.2 billion. These contract values includeGMWB and GMAB contracts which were $40.4 billion and $4.0 billion, respectively, at December 31, 2015. AtDecember 31, 2015, reserves for GMWB were liabilities of $1.1 billion and reserves for GMAB were nil. The GMWB andGMAB reserves include the fair value of embedded derivatives, which fluctuates based on equity, interest rate and creditmarkets which can cause these embedded derivatives to be either an asset or a liability. At December 31, 2015, thereserve for GMDB and GMIB was a liability of $22 million.
Equity Price RiskThe variable annuity guaranteed benefits guarantee payouts to the annuity holder under certain specific conditionsregardless of the performance of the investment assets. For this reason, when equity prices decline, the returns from theseparate account assets coupled with guaranteed benefit fees from annuity holders may not be sufficient to fund expectedpayouts. In that case, reserves must be increased with a negative impact to earnings.
The core derivative instruments with which we hedge the equity price risk of our GMWB and GMAB provisions are longerdated put and call options; these core instruments are supplemented with equity futures and total return swaps. SeeNote 16 to our Consolidated Financial Statements for further information on our derivative instruments.
Interest Rate RiskThe GMAB and the non-life contingent benefits associated with the GMWB provisions create embedded derivatives whichare carried at fair value separately from the underlying host variable annuity contract. Changes in the fair value of theGMWB and GMAB liabilities are recorded through earnings with fair value calculated based on projected, discounted cashflows over the life of the contract, including projected, discounted benefits and fees. Increases in interest rates reduce thefair value of the GMWB and GMAB liabilities. The GMWB and GMAB interest rate exposure is hedged with a portfolio oflonger dated put and call options, interest rate swaps and swaptions. We have entered into interest rate swaps accordingto risk exposures along maturities, thus creating both fixed rate payor and variable rate payor terms. If interest rates wereto increase, we would have to pay more to the swap counterparty, and the fair value of our equity puts would decrease,resulting in a negative impact to our pretax income.
88

Fixed Annuities, Fixed Insurance and Fixed Portion of Variable Annuities and Variable Insurance ContractsOur earnings from fixed annuities, fixed insurance, and the fixed portion of variable annuities and variable insurancecontracts are based upon the spread between rates earned on assets held and the rates at which interest is credited toaccounts. We primarily invest in fixed rate securities to fund the rate credited to clients. We guarantee an interest rate tothe holders of these products. Investment assets and client liabilities generally differ as it relates to basis, repricing ormaturity characteristics. Rates credited to clients’ accounts generally reset at shorter intervals than the yield on theunderlying investments. Therefore, in an increasing interest rate environment, higher interest rates may be reflected increditing rates to clients sooner than in rates earned on invested assets, which could result in a reduced spread betweenthe two rates, reduced earned income and a negative impact on pretax income. However, the current low interest rateenvironment is resulting in interest rates below the level of some of our liability guaranteed minimum interest rates(‘‘GMIRs’’). Hence, a modest rise in interest rates would not necessarily result in changes to all the liability credited rateswhile projected asset purchases would capture the full increase in interest rates. This dynamic would result in wideningspreads under a modestly rising rate scenario given the current relationship between the current level of interest rates andthe underlying GMIRs on the business. Of the $29.7 billion in policyholder account balances, future policy benefits andclaims on our Consolidated Balance Sheet at December 31, 2015, $21.9 billion is related to liabilities created by theseproducts. We do not hedge this exposure.
As a result of the low interest rate environment, our current reinvestment yields are generally lower than the currentportfolio yield. We expect our portfolio income yields to continue to decline in future periods if interest rates remain low.The carrying value and weighted average yield of non-structured fixed maturity securities and commercial mortgage loansthat may generate proceeds to reinvest through 2017 due to prepayment, maturity or call activity at the option of theissuer, excluding securities with a make-whole provision, were $3.6 billion and 3.8%, respectively, as of December 31,2015. In addition, residential mortgage-backed securities, which are subject to prepayment risk as a result of the lowinterest rate environment, totaled $6.0 billion and had a weighted average yield of 2.7% as of December 31, 2015. Whilethese amounts represent investments that could be subject to reinvestment risk, it is also possible that these investmentswill be used to fund liabilities or may not be prepaid and will remain invested at their current yields. In addition to theinterest rate environment, the mix of benefit payments versus product sales as well as the timing and volumes associatedwith such mix may impact our investment yield. Furthermore, reinvestment activities and the associated investment yieldmay also be impacted by corporate strategies implemented at management’s discretion. The average yield for investmentpurchases during the year ended December 31, 2015 was approximately 3.0%.
The reinvestment of proceeds from maturities, calls and prepayments at rates below the current portfolio yield, which maybe below the level of some liability GMIRs, will have a negative impact to future operating results. To mitigate theunfavorable impact that the low interest rate environment has on our spread income, we assess reinvestment risk in ourinvestment portfolio and monitor this risk in accordance with our asset/liability management framework. In addition, wemay reduce the crediting rates on our fixed products when warranted, subject to guaranteed minimums. In 2014, wecompleted the process of setting lower renewal interest rates for a portion of our fixed annuities that were above theGMIRs, which helped relieve some of the spread compression caused by low rates.
The following table presents the account values of fixed annuities, fixed insurance, and the fixed portion of variableannuities and variable insurance contracts by range of GMIRs and the range of the difference between rates credited topolicyholders and contractholders as of December 31, 2015 and the respective guaranteed minimums, as well as the
89

percentage of account values subject to rate reset in the time period indicated. Rates are reset at our discretion, subjectto guaranteed minimums.
Account Values with Crediting Rates
1-49 bps 50-99 bps 100-150 bpsAt above above above
Guaranteed Guaranteed Guaranteed GuaranteedMinimum Minimum Minimum Minimum Total
(in billions, except percentages)Range of Guaranteed Minimum Crediting Rates1% - 1.99% $ 2.5 $ 0.2 $ 0.4 $ 0.1 $ 3.22% - 2.99% 0.5 — — — 0.53% - 3.99% 9.0 — — — 9.04% - 5.00% 5.5 — — — 5.5
Total $ 17.5 $ 0.2 $ 0.4 $ 0.1 $ 18.2
Percentage of Account Values That Reset In:Next 12 months(1) 100% 45% 37% 48% 97%> 12 months to 24 months(2) — 33 11 5 1> 24 months(2) — 22 52 47 2
Total 100% 100% 100% 100% 100%
(1) Includes contracts with annual discretionary crediting rate resets and contracts with twelve or less months until the crediting ratebecomes discretionary on an annual basis.
(2) Includes contracts with more than twelve months remaining until the crediting rate becomes an annual discretionary rate.
Equity Indexed AnnuitiesOur equity indexed annuity product is a single premium annuity issued with an initial term of seven years. The annuityguarantees the contractholder a minimum return of 3% on 90% of the initial premium or end of prior term accumulationvalue upon renewal plus a return that is linked to the performance of the S&P 500 Index�. The equity-linked return isbased on a participation rate initially set at between 50% and 90% of the S&P 500 Index, which is guaranteed for theinitial seven-year term when the contract is held to full term. At December 31, 2015, we had $27 million in liabilitiesrelated to equity indexed annuities. We discontinued new sales of equity indexed annuities in 2007.
Equity Price RiskThe equity-linked return to investors creates equity price risk as the amount credited depends on changes in equity prices.To hedge this exposure, we purchase futures, which generate returns to replicate what we must credit to client accounts.
Interest Rate RiskMost of the proceeds received from equity indexed annuities are invested in fixed income securities with the return onthose investments intended to fund the 3% guarantee. We earn income from the difference between the return earned oninvested assets and the 3% guarantee rate credited to customer accounts. The spread between return earned and amountcredited is affected by changes in interest rates. This risk is not currently hedged and was immaterial at December 31,2015.
Brokerage Client Cash BalancesWe pay interest on certain brokerage client cash balances and have the ability to reset these rates from time to timebased on prevailing economic and business conditions. We earn revenue to fund the interest paid from interest-earningassets or fees from off-balance sheet deposits at FDIC insured institutions, which are indexed to short-term interest rates.In general, the change in interest paid lags the change in revenues earned.
Certificate Products
Fixed Rate CertificatesWe have interest rate risk from our investment certificates generally ranging in amounts from $1,000 to $2 million withinterest crediting rate terms ranging from three to 36 months. We guarantee an interest rate to the holders of theseproducts. Payments collected from clients are primarily invested in fixed rate securities to fund the client credited rate withthe spread between the rate earned from investments and the rate credited to clients recorded as earned income. Clientliabilities and investment assets generally differ as it relates to basis, repricing or maturity characteristics. Rates credited toclients generally reset at shorter intervals than the yield on underlying investments. This exposure is not currently hedgedalthough we monitor our investment strategy and make modifications based on our changing liabilities and the expected
90

interest rate environment. Of the $8.6 billion in customer deposits at December 31, 2015, $4.3 billion related to reservesfor our fixed rate certificate products.
Stock Market CertificatesStock market certificates are purchased for amounts generally from $1,000 to $2 million for terms of 52 weeks,104 weeks or 156 weeks, which can be extended to a maximum of 15 years depending on the term. For each term thecertificate holder can choose to participate 100% in any percentage increase in the S&P 500 Index up to a maximumreturn or choose partial participation in any increase in the S&P 500 Index plus a fixed rate of interest guaranteed inadvance. If partial participation is selected, the total of equity-linked return and guaranteed rate of interest cannot exceedthe maximum return. Liabilities for our stock market certificates are included in customer deposits on our ConsolidatedBalance Sheets. At December 31, 2015, we had $557 million in reserves related to stock market certificates. The equity-linked return to investors creates equity price risk exposure. We seek to minimize this exposure with purchased futures andcall spreads that replicate what we must credit to client accounts. This risk continues to be fully hedged. Stock marketcertificates have some interest rate risk as changes in interest rates affect the fair value of the payout to be made to thecertificate holder. This risk is not currently hedged and was immaterial at December 31, 2015.
Indexed Universal LifeIUL insurance is similar to UL in many regards, although the rate of credited interest above the minimum guarantee forfunds allocated to an indexed account is linked to the performance of the specified index for the indexed account (subjectto a cap and floor). We offer an S&P 500 Index account option and a blended multi-index account option comprised of theS&P 500 Index, the MSCI� EAFE Index and MSCI EM Index. Both options offer two crediting durations, one-year andtwo-year. The policyholder may allocate all or a portion of the policy value to a fixed or any available indexed account. AtDecember 31, 2015, we had $715 million in liabilities related to the index accounts of IUL, with the vast majority in theS&P 500 Index account option.
Equity Price RiskThe equity-linked return to investors creates equity price risk as the amount credited depends on changes in equity prices.Most of the proceeds received from IUL insurance are invested in fixed income securities. To hedge the equity exposure, aportion of the investment earnings received from the fixed income securities is used to purchase call spreads whichgenerate returns to replicate what we must credit to client accounts.
Interest Rate RiskAs mentioned above, most of the proceeds received from IUL insurance are invested in fixed income securities with thereturn on those investments intended to fund the purchase of call spreads. There are two risks relating to interest rates.First, we have the risk that investment returns are such that we do not have enough investment income to purchase theneeded call spreads. Second, in the event the policy is surrendered we pay out a book value surrender amount and thereis a risk that we will incur a loss upon having to sell the fixed income securities backing the liability (if interest rates haverisen). This risk is not currently hedged.
Foreign Currency RiskWe have foreign currency risk through our net investment in foreign subsidiaries and our operations in foreign countries.We are primarily exposed to changes in British Pounds (‘‘GBP’’) related to our net investment in Threadneedle, which was535 million GBP at December 31, 2015. Our primary exposure related to operations in foreign countries is to the GBP, theEuro and the Indian Rupee. We monitor the foreign exchange rates that we have exposure to and enter into foreigncurrency forward contracts to mitigate risk when economically prudent. At December 31, 2015, the notional value ofoutstanding contracts and our remaining foreign currency risk related to operations in foreign countries were not material.
Interest Rate Risk on External DebtThe stated interest rate on the $2.4 billion of our senior unsecured notes is fixed and the stated interest rate on the$245 million of junior notes is fixed until June 1, 2016. We entered into interest rate swap agreements to effectivelyconvert the fixed interest rate on $1.1 billion of the senior unsecured notes to floating interest rates based on six-monthLIBOR. We hedged the debt in part to better align the interest expense on debt with the interest earned on cashequivalents held on our Consolidated Balance Sheets. The net interest rate risk of these items is immaterial.
Credit RiskWe are exposed to credit risk within our investment portfolio, including our loan portfolio, and through our derivative andreinsurance activities. Credit risk relates to the uncertainty of an obligor’s continued ability to make timely payments inaccordance with the contractual terms of the financial instrument or contract. We consider our total potential creditexposure to each counterparty and its affiliates to ensure compliance with pre-established credit guidelines at the time we
91

enter into a transaction which would potentially increase our credit risk. These guidelines and oversight of credit risk aremanaged through a comprehensive enterprise risk management program that includes members of senior management.
We manage the risk of credit-related losses in the event of nonperformance by counterparties by applying disciplinedfundamental credit analysis and underwriting standards, prudently limiting exposures to lower-quality, higher-yieldinginvestments, and diversifying exposures by issuer, industry, region and underlying investment type. We remain exposed tooccasional adverse cyclical economic downturns during which default rates may be significantly higher than the long-termhistorical average used in pricing.
There has been significant interest in the energy sector given oil prices. We have approximately $3.3 billion of energysector exposure. The following table presents our energy holdings by sub-sector as of December 31, 2015:
% ofTotal
Invested Amortized Fair UnrealizedAssets(1) Cost Value Gain (Loss)
(in millions, except percentages)Energy Sector — Investment Grade Corporate BondsMidstream 3.4% $ 1,237 $ 1,231 $ (6)Independent Energy 3.1 1,163 1,122 (41)Integrated Energy 1.1 378 424 46Refining 0.5 196 197 1Oil Field Services 0.4 146 128 (18)
Total 8.5% $ 3,120 $ 3,102 $ (18)
Energy Sector — High Yield Corporate Bonds/Syndicated LoansOil Field Services 0.3% $ 125 $ 103 $ (22)Independent Energy 0.1 55 44 (11)Integrated Energy — 1 1 —
Total 0.4% $ 181 $ 148 $ (33)
(1) Invested assets include cash and cash equivalents and investments (excluding CIEs).
The duration of our energy holdings is short with over 35% maturing by year end 2018. The average rating of our energyholdings is BBB. The high quality of our energy holdings is reflected in the less than 2% net unrealized loss in aggregate.Within the Midstream sub-sector, the vast majority of our exposure is with a handful of the largest U.S. pipeline operators.The rest of our energy exposure is focused on large diversified North American-based companies.
We manage our credit risk related to over-the-counter derivatives by entering into transactions with creditworthycounterparties, maintaining collateral arrangements and through the use of master netting arrangements that provide for asingle net payment to be made by one counterparty to another at each due date and upon termination. Generally, ourcurrent credit exposure on over-the-counter derivative contracts is limited to a derivative counterparty’s net positive fairvalue of derivative contracts after taking into consideration the existence of netting arrangements and any collateralreceived. This exposure is monitored and managed to an acceptable threshold level.
The counterparty risk for centrally cleared over-the-counter derivatives is transferred to a central clearing party throughcontract novation. Because the central clearing party monitors open positions and adjusts collateral requirements daily, wehave minimal credit exposure from such derivative instruments.
Exchange-traded derivatives are effected through regulated exchanges that require contract standardization and initialmargin to transact through the exchange. Because exchange-traded futures are marked to market and generally cashsettled on a daily basis, we have minimal exposure to credit-related losses in the event of nonperformance bycounterparties to such derivative instruments. Other exchange-traded derivatives would be exposed to nonperformance bycounterparties for amounts in excess of initial margin requirements only if the exchange is unable to fulfill the contract.
We manage our credit risk related to reinsurance treaties by evaluating the financial condition of reinsurance counterpartiesprior to entering into new reinsurance treaties. In addition, we regularly evaluate their financial strength during the terms ofthe treaties. As of December 31, 2015, our largest reinsurance credit risk is related to a long term care coinsurance treatywith life insurance subsidiaries of Genworth Financial, Inc. See Note 7 to our Consolidated Financial Statements foradditional information on reinsurance.
92

Ameriprise Financial, Inc.
Item 8. Financial Statements and Supplementary Data
Consolidated Financial Statements:
Report of Independent Registered Public Accounting Firm . . . . . . . . . . . . . . . . . . . . . . . . . . . . . . . . . . . . . 94
Consolidated Statements of Operations — Years ended December 31, 2015, 2014 and 2013 . . . . . . . . . . . . . 95
Consolidated Statements of Comprehensive Income — Years ended December 31, 2015, 2014 and 2013 . . . . . . 96
Consolidated Balance Sheets — December 31, 2015 and 2014 . . . . . . . . . . . . . . . . . . . . . . . . . . . . . . . . 97
Consolidated Statements of Equity — Years ended December 31, 2015, 2014 and 2013 . . . . . . . . . . . . . . . . 98
Consolidated Statements of Cash Flows — Years ended December 31, 2015, 2014 and 2013 . . . . . . . . . . . . . 99
Notes to Consolidated Financial Statements . . . . . . . . . . . . . . . . . . . . . . . . . . . . . . . . . . . . . . . . . . . . . 100
1. Basis of Presentation . . . . . . . . . . . . . . . . . . . . . . . . . . . . . . . . . . . . . . . . . . . . . . . . . . . . . 100
2. Summary of Significant Accounting Policies . . . . . . . . . . . . . . . . . . . . . . . . . . . . . . . . . . . . . . . . 100
3. Recent Accounting Pronouncements . . . . . . . . . . . . . . . . . . . . . . . . . . . . . . . . . . . . . . . . . . . . 110
4. Variable Interest Entities . . . . . . . . . . . . . . . . . . . . . . . . . . . . . . . . . . . . . . . . . . . . . . . . . . . . 112
5. Investments . . . . . . . . . . . . . . . . . . . . . . . . . . . . . . . . . . . . . . . . . . . . . . . . . . . . . . . . . . . 118
6. Financing Receivables . . . . . . . . . . . . . . . . . . . . . . . . . . . . . . . . . . . . . . . . . . . . . . . . . . . . . 121
7. Reinsurance . . . . . . . . . . . . . . . . . . . . . . . . . . . . . . . . . . . . . . . . . . . . . . . . . . . . . . . . . . . 124
8. Goodwill and Other Intangible Assets . . . . . . . . . . . . . . . . . . . . . . . . . . . . . . . . . . . . . . . . . . . . 125
9. Deferred Acquisition Costs and Deferred Sales Inducement Costs . . . . . . . . . . . . . . . . . . . . . . . . . . 126
10. Policyholder Account Balances, Future Policy Benefits and Claims and Separate Account Liabilities . . . . . 127
11. Variable Annuity and Insurance Guarantees . . . . . . . . . . . . . . . . . . . . . . . . . . . . . . . . . . . . . . . . 128
12. Customer Deposits . . . . . . . . . . . . . . . . . . . . . . . . . . . . . . . . . . . . . . . . . . . . . . . . . . . . . . . 131
13. Debt . . . . . . . . . . . . . . . . . . . . . . . . . . . . . . . . . . . . . . . . . . . . . . . . . . . . . . . . . . . . . . . . 132
14. Fair Values of Assets and Liabilities . . . . . . . . . . . . . . . . . . . . . . . . . . . . . . . . . . . . . . . . . . . . . 133
15. Offsetting Assets and Liabilities . . . . . . . . . . . . . . . . . . . . . . . . . . . . . . . . . . . . . . . . . . . . . . . 143
16. Derivatives and Hedging Activities . . . . . . . . . . . . . . . . . . . . . . . . . . . . . . . . . . . . . . . . . . . . . . 144
17. Share-Based Compensation . . . . . . . . . . . . . . . . . . . . . . . . . . . . . . . . . . . . . . . . . . . . . . . . . 148
18. Shareholders’ Equity . . . . . . . . . . . . . . . . . . . . . . . . . . . . . . . . . . . . . . . . . . . . . . . . . . . . . . 152
19. Earnings per Share Attributable to Ameriprise Financial, Inc. Common Shareholders . . . . . . . . . . . . . . 154
20. Regulatory Requirements . . . . . . . . . . . . . . . . . . . . . . . . . . . . . . . . . . . . . . . . . . . . . . . . . . . 155
21. Income Taxes . . . . . . . . . . . . . . . . . . . . . . . . . . . . . . . . . . . . . . . . . . . . . . . . . . . . . . . . . . 156
22. Retirement Plans and Profit Sharing Arrangements . . . . . . . . . . . . . . . . . . . . . . . . . . . . . . . . . . . 158
23. Commitments, Guarantees and Contingencies . . . . . . . . . . . . . . . . . . . . . . . . . . . . . . . . . . . . . . 163
24. Related Party Transactions . . . . . . . . . . . . . . . . . . . . . . . . . . . . . . . . . . . . . . . . . . . . . . . . . . 164
25. Segment Information . . . . . . . . . . . . . . . . . . . . . . . . . . . . . . . . . . . . . . . . . . . . . . . . . . . . . . 165
26. Quarterly Financial Data (Unaudited) . . . . . . . . . . . . . . . . . . . . . . . . . . . . . . . . . . . . . . . . . . . . 168
93

Report of Independent Registered Public Accounting Firm
To the Board of Directors and Shareholders of Ameriprise Financial, Inc.:
In our opinion, the accompanying consolidated balance sheets and the related consolidated statements of operations,comprehensive income, equity, and of cash flows present fairly, in all material respects, the financial position of AmeripriseFinancial, Inc. and its subsidiaries (the ‘‘Company’’) at December 31, 2015 and 2014, and the results of their operationsand their cash flows for each of the three years in the period ended December 31, 2015 in conformity with accountingprinciples generally accepted in the United States of America. Also in our opinion, the Company maintained, in all materialrespects, effective internal control over financial reporting as of December 31, 2015, based on criteria established inInternal Control — Integrated Framework, 2013 issued by the Committee of Sponsoring Organizations of the TreadwayCommission (‘‘COSO’’). The Company’s management is responsible for these financial statements, for maintaining effectiveinternal control over financial reporting and for its assessment of the effectiveness of internal control over financialreporting, included in Management’s Report on Internal Control over Financial Reporting appearing under Item 9A. Ourresponsibility is to express opinions on these financial statements and on the Company’s internal control over financialreporting based on our integrated audits. We conducted our audits in accordance with the standards of the PublicCompany Accounting Oversight Board (United States). Those standards require that we plan and perform the audits toobtain reasonable assurance about whether the financial statements are free of material misstatement and whethereffective internal control over financial reporting was maintained in all material respects. Our audits of the financialstatements included examining, on a test basis, evidence supporting the amounts and disclosures in the financialstatements, assessing the accounting principles used and significant estimates made by management, and evaluating theoverall financial statement presentation. Our audit of internal control over financial reporting included obtaining anunderstanding of internal control over financial reporting, assessing the risk that a material weakness exists, and testingand evaluating the design and operating effectiveness of internal control based on the assessed risk. Our audits alsoincluded performing such other procedures as we considered necessary in the circumstances. We believe that our auditsprovide a reasonable basis for our opinions.
A company’s internal control over financial reporting is a process designed to provide reasonable assurance regarding thereliability of financial reporting and the preparation of financial statements for external purposes in accordance withgenerally accepted accounting principles. A company’s internal control over financial reporting includes those policies andprocedures that (i) pertain to the maintenance of records that, in reasonable detail, accurately and fairly reflect thetransactions and dispositions of the assets of the company; (ii) provide reasonable assurance that transactions arerecorded as necessary to permit preparation of financial statements in accordance with generally accepted accountingprinciples, and that receipts and expenditures of the company are being made only in accordance with authorizations ofmanagement and directors of the company; and (iii) provide reasonable assurance regarding prevention or timely detectionof unauthorized acquisition, use, or disposition of the company’s assets that could have a material effect on the financialstatements.
Because of its inherent limitations, internal control over financial reporting may not prevent or detect misstatements. Also,projections of any evaluation of effectiveness to future periods are subject to the risk that controls may becomeinadequate because of changes in conditions, or that the degree of compliance with the policies or procedures maydeteriorate.
/s/ PricewaterhouseCoopers LLP
Minneapolis, MinnesotaFebruary 25, 2016
94

Ameriprise Financial, Inc.Consolidated Statements of Operations
Years Ended December 31,
2015 2014 2013
(in millions, except per share amounts)Revenues
Management and financial advice fees $ 5,950 $ 5,810 $ 5,253Distribution fees 1,847 1,894 1,771Net investment income 1,688 1,741 1,889Premiums 1,455 1,385 1,282Other revenues 1,260 1,466 1,035
Total revenues 12,200 12,296 11,230Banking and deposit interest expense 30 28 31
Total net revenues 12,170 12,268 11,199
ExpensesDistribution expenses 3,276 3,236 2,925Interest credited to fixed accounts 668 713 806Benefits, claims, losses and settlement expenses 2,261 1,982 1,954Amortization of deferred acquisition costs 354 367 207Interest and debt expense 387 328 281General and administrative expense 3,082 3,095 3,056
Total expenses 10,028 9,721 9,229
Income from continuing operations before income tax provision 2,142 2,547 1,970Income tax provision 455 545 492
Income from continuing operations 1,687 2,002 1,478Loss from discontinued operations, net of tax — (2) (3)
Net income 1,687 2,000 1,475Less: Net income attributable to noncontrolling interests 125 381 141
Net income attributable to Ameriprise Financial $ 1,562 $ 1,619 $ 1,334
Earnings per share attributable to Ameriprise Financial, Inc. common shareholdersBasic
Income from continuing operations $ 8.60 $ 8.46 $ 6.58Loss from discontinued operations — (0.01) (0.02)
Net income $ 8.60 $ 8.45 $ 6.56
DilutedIncome from continuing operations $ 8.48 $ 8.31 $ 6.46Loss from discontinued operations — (0.01) (0.02)
Net income $ 8.48 $ 8.30 $ 6.44
Cash dividends declared per common share $ 2.59 $ 2.26 $ 2.01Supplemental Disclosures:
Total other-than-temporary impairment losses on securities $ (8) $ (6) $ (11)Portion of loss recognized in other comprehensive income (loss) (before taxes) — — 2
Net impairment losses recognized in net investment income $ (8) $ (6) $ (9)
See Notes to Consolidated Financial Statements.
95

Ameriprise Financial, Inc.Consolidated Statements of Comprehensive Income
Years Ended December 31,
2015 2014 2013
(in millions)Net income $ 1,687 $ 2,000 $ 1,475Other comprehensive income (loss), net of tax:
Foreign currency translation adjustment (90) (103) 37Net unrealized gains (losses) on securities (360) 131 (657)Net unrealized gains on derivatives 1 1 1Defined benefit plans (20) (25) 45
Total other comprehensive income (loss), net of tax (469) 4 (574)
Total comprehensive income 1,218 2,004 901
Less: Comprehensive income attributable to noncontrolling interests 65 318 166
Comprehensive income attributable to Ameriprise Financial $ 1,153 $ 1,686 $ 735
See Notes to Consolidated Financial Statements.
96

Ameriprise Financial, Inc.Consolidated Balance Sheets
December 31,
2015 2014
(in millions, except shareamounts)
AssetsCash and cash equivalents $ 2,357 $ 2,638Cash of consolidated investment entities 502 390Investments 34,144 35,582Investments of consolidated investment entities, at fair value 6,570 6,148Separate account assets 80,349 83,256Receivables 5,167 4,887Receivables of consolidated investment entities (includes $70 and $49, respectively, at fair value) 107 140Deferred acquisition costs 2,725 2,608Restricted and segregated cash and investments 2,949 2,614Other assets 8,399 8,611Other assets of consolidated investment entities (includes $2,065 and $1,936, respectively, at fair
value) 2,073 1,936
Total assets $ 145,342 $ 148,810
Liabilities and EquityLiabilities:Policyholder account balances, future policy benefits and claims $ 29,699 $ 30,350Separate account liabilities 80,349 83,256Customer deposits 8,634 7,664Short-term borrowings 200 200Long-term debt 2,707 3,062Debt of consolidated investment entities (includes $6,630 and $6,030, respectively, at fair value) 7,539 6,867Accounts payable and accrued expenses 1,552 1,482Accounts payable and accrued expenses of consolidated investment entities 54 41Other liabilities 5,965 6,357Other liabilities of consolidated investment entities (includes $221 and $193, respectively, at fair
value) 238 226
Total liabilities 136,937 139,505
Equity:Ameriprise Financial, Inc.:
Common shares ($.01 par value; shares authorized, 1,250,000,000; shares issued, 322,822,746and 320,990,255, respectively) 3 3
Additional paid-in capital 7,611 7,345Retained earnings 9,551 8,469Appropriated retained earnings of consolidated investment entities 137 234Treasury shares, at cost (151,789,486 and 137,880,746 shares, respectively) (10,338) (8,589)Accumulated other comprehensive income, net of tax 253 662
Total Ameriprise Financial, Inc. shareholders’ equity 7,217 8,124Noncontrolling interests 1,188 1,181
Total equity 8,405 9,305
Total liabilities and equity $ 145,342 $ 148,810
See Notes to Consolidated Financial Statements.
97

Ameriprise Financial, Inc.Consolidated Statements of Equity
Ameriprise Financial, Inc.
AppropriatedRetained Total
Earnings of Accumulated AmeripriseNumber of Additional Consolidated Other Financial, Inc. Non-
Outstanding Common Paid-In Retained Investment Treasury Comprehensive Shareholders’ controllingShares Shares Capital Earnings Entities Shares Income Equity Interests Total
(in millions, except share data)Balances at January 1, 2013 203,942,994 $ 3 $ 6,503 $ 6,381 $ 336 $ (5,325) $ 1,194 $ 9,092 $ 620 $ 9,712Comprehensive income:
Net income — — — 1,334 — — — 1,334 141 1,475Other comprehensive income
(loss), net of tax — — — — — — (599) (599) 25 (574)
Total comprehensive income 735 166 901Net income reclassified to
appropriated retained earnings — — — — 1 — — 1 (1) —Dividends to shareholders — — — (411) — — — (411) — (411)Noncontrolling interests
investments in subsidiaries — — — — — — — — 392 392Distributions to noncontrolling
interests — — — — — — — — (161) (161)Repurchase of common shares (21,184,706) — — — — (1,735) — (1,735) — (1,735)Share-based compensation plans 9,360,019 — 426 (15) — 99 — 510 24 534
Balances at December 31,2013 192,118,307 3 6,929 7,289 337 (6,961) 595 8,192 1,040 9,232
Comprehensive income:Net income — — — 1,619 — — — 1,619 381 2,000Other comprehensive income
(loss), net of tax — — — — — — 67 67 (63) 4
Total comprehensive income 1,686 318 2,004Net loss reclassified to
appropriated retained earnings — — — — (103) — — (103) 103 —Dividends to shareholders — — — (435) — — — (435) — (435)Noncontrolling interests
investments in subsidiaries — — — — — — — — 176 176Distributions to noncontrolling
interests — — — — — — — — (465) (465)Repurchase of common shares (14,739,666) — — — — (1,717) — (1,717) — (1,717)Share-based compensation plans 5,730,868 — 416 (4) — 89 — 501 9 510
Balances at December 31,2014 183,109,509 3 7,345 8,469 234 (8,589) 662 8,124 1,181 9,305
Comprehensive income:Net income — — — 1,562 — — — 1,562 125 1,687Other comprehensive loss, net
of tax — — — — — — (409) (409) (60) (469)
Total comprehensive income 1,153 65 1,218Net loss reclassified to
appropriated retained earnings — — — — (97) — — (97) 97 —Dividends to shareholders — — — (474) — — — (474) — (474)Noncontrolling interests
investments in subsidiaries — — — — — — — — 255 255Distributions to noncontrolling
interests — — — — — — — — (415) (415)Repurchase of common shares (14,951,703) — — — — (1,815) — (1,815) — (1,815)Share-based compensation plans 2,875,454 — 266 (6) — 66 — 326 5 331
Balances at December 31,2015 171,033,260 $ 3 $ 7,611 $ 9,551 $ 137 $ (10,338) $ 253 $ 7,217 $ 1,188 $ 8,405
See Notes to Consolidated Financial Statements.
98

Ameriprise Financial, Inc.Consolidated Statements of Cash Flows
Years Ended December 31,
2015 2014 2013
(in millions)Cash Flows from Operating ActivitiesNet income $ 1,687 $ 2,000 $ 1,475Adjustments to reconcile net income to net cash provided by operating activities:
Depreciation, amortization and accretion, net 248 254 239Deferred income tax expense (benefit) (131) 228 (118)Share-based compensation 145 130 143Net realized investment gains (14) (45) (16)Net trading gains (7) (7) (7)Loss (income) from equity method investments 14 11 (31)Other-than-temporary impairments and provision for loan losses 9 7 8Net gains of consolidated investment entities (132) (378) (136)
Changes in operating assets and liabilities:Restricted and segregated cash and investments (335) (256) 93Deferred acquisition costs (7) 31 (132)Other investments, net 81 (37) (6)Policyholder account balances, future policy benefits and claims, net 494 1,120 (1,318)Derivatives, net of collateral 93 (883) 1,706Receivables (277) (423) (267)Brokerage deposits 337 378 63Accounts payable and accrued expenses 82 137 134Cash held by consolidated investment entities (107) 37 174Investment properties of consolidated investment entities (114) 258 (603)Other operating assets and liabilities of consolidated investment entities, net 95 — (38)Other, net 411 (163) 1
Net cash provided by operating activities 2,572 2,399 1,364
Cash Flows from Investing ActivitiesAvailable-for-Sale securities:
Proceeds from sales 294 516 327Maturities, sinking fund payments and calls 4,542 4,352 5,101Purchases (4,562) (4,127) (5,780)
Proceeds from sales, maturities and repayments of mortgage loans 631 585 711Funding of mortgage loans (558) (525) (630)Proceeds from sales and collections of other investments 236 207 348Purchase of other investments (306) (408) (347)Purchase of investments by consolidated investment entities (2,678) (3,198) (3,077)Proceeds from sales, maturities and repayments of investments by consolidated investment entities 2,009 2,017 2,604Purchase of land, buildings, equipment and software (133) (113) (105)Other, net 11 (21) 46
Net cash used in investing activities $ (514) $ (715) $ (802)
Cash Flows from Financing ActivitiesInvestment certificates:
Proceeds from additions $ 3,139 $ 2,482 $ 2,348Maturities, withdrawals and cash surrenders (2,509) (2,259) (1,877)
Policyholder account balances:Deposits and other additions 2,061 2,042 2,158Net transfers to separate accounts (171) (216) (116)Surrenders and other benefits (2,714) (2,440) (1,994)
Cash paid for purchased options with deferred premiums (392) (417) (396)Cash received from purchased options with deferred premiums 16 59 —Issuance of long-term debt, net of issuance costs — 543 744Repayments of long-term debt (409) (200) (350)Change in short-term borrowings, net (1) (301) (2)Dividends paid to shareholders (465) (426) (401)Repurchase of common shares (1,741) (1,577) (1,583)Exercise of stock options 16 33 118Excess tax benefits from share-based compensation 81 162 120Borrowings by consolidated investment entities 1,650 2,159 1,725Repayments of debt by consolidated investment entities (719) (1,011) (1,046)Noncontrolling interests investments in subsidiaries 255 176 392Distributions to noncontrolling interests (415) (465) (161)Other, net — (1) 15
Net cash used in financing activities (2,318) (1,657) (306)Effect of exchange rate changes on cash (21) (21) 5
Net increase (decrease) in cash and cash equivalents (281) 6 261Cash and cash equivalents at beginning of period 2,638 2,632 2,371
Cash and cash equivalents at end of period $ 2,357 $ 2,638 $ 2,632
Supplemental Disclosures:Interest paid excluding consolidated investment entities $ 186 $ 178 $ 170Interest paid by consolidated investment entities 257 190 156Income taxes paid, net 439 578 391Non-cash investing activity:
Affordable housing partnership commitments not yet remitted 45 38 96
See Notes to Consolidated Financial Statements.
99

Notes to Consolidated Financial Statements
1. Basis of Presentation
Ameriprise Financial, Inc. is a holding company, which primarily conducts business through its subsidiaries to providefinancial planning, products and services that are designed to be utilized as solutions for clients’ cash and liquidity, assetaccumulation, income, protection and estate and wealth transfer needs. The foreign operations of AmeripriseFinancial, Inc. are conducted primarily through Threadneedle Asset Management Holdings Sarl and Ameriprise AssetManagement Holdings GmbH (collectively, ‘‘Threadneedle’’).
The accompanying Consolidated Financial Statements include the accounts of Ameriprise Financial, Inc., companies inwhich it directly or indirectly has a controlling financial interest and variable interest entities (‘‘VIEs’’) in which it is theprimary beneficiary (collectively, the ‘‘Company’’). The income or loss generated by consolidated entities which will not berealized by the Company’s shareholders is attributed to noncontrolling interests in the Consolidated Statements ofOperations. Noncontrolling interests are the ownership interests in subsidiaries not attributable, directly or indirectly, toAmeriprise Financial, Inc. and are classified as equity within the Consolidated Balance Sheets. The Company, excludingnoncontrolling interests, is defined as ‘‘Ameriprise Financial.’’ All intercompany transactions and balances have beeneliminated in consolidation. See Note 4 for additional information related to VIEs.
The results of Securities America Financial Corporation and its subsidiaries (collectively, ‘‘Securities America’’) have beenpresented as discontinued operations for all prior periods presented. The Company completed the sale of SecuritiesAmerica in the fourth quarter of 2011.
The accompanying Consolidated Financial Statements are prepared in accordance with U.S. generally accepted accountingprinciples (‘‘GAAP’’). The Company evaluated events or transactions that may have occurred after the balance sheet datefor potential recognition or disclosure through the date the financial statements were issued.
In the fourth quarter of 2015, the Company recorded a capital lease that had previously been incorrectly recorded as anoperating lease for Ameriprise Financial Center. The cumulative adjustment included a capital lease asset of $70 million,net of accumulated depreciation, and a related capital lease obligation of $60 million and a $10 million increase in pretaxincome. The impact to the prior period financial statements was not material. The lease term for the Ameriprise FinancialCenter began in November 2000 and extends for 20 years, with several options to extend the term.
2. Summary of Significant Accounting Policies
Principles of ConsolidationVoting interest entities (‘‘VOEs’’) are those entities that do not qualify as a VIE. The Company consolidates VOEs in which itholds a greater than 50% voting interest. The Company generally accounts for entities using the equity method when itholds a greater than 20% but less than 50% voting interest or when the Company exercises significant influence over theentity. All other investments that are not reported at fair value as trading or Available-for-Sale securities are accounted forunder the cost method when the Company owns less than a 20% voting interest and does not exercise significantinfluence.
The Company manages certain VOE property funds that are structured as limited partnerships that are not VIEs, for whichthe Company is the general partner. As a general partner, the Company is presumed to control the limited partnershipunless the limited partners have the ability to dissolve the partnership or have substantive participating rights such as theability to remove the Company as general partner with a simple majority vote.
A VIE is an entity that either has equity investors that lack certain essential characteristics of a controlling financial interest(including substantive voting rights, the obligation to absorb the entity’s losses, or the rights to receive the entity’s returns)or has equity investors that do not provide sufficient financial resources for the entity to support its activities. An entity thatmeets one of these criteria is assessed for consolidation under one of the following models:
• If the VIE is a registered money market fund, or is an investment company, or has the financial characteristics of aninvestment company, and the following are true:
(i) the reporting entity does not have an explicit or implicit obligation to fund the investment company’s losses; and
(ii) the investment company is not a securitization entity, asset backed financing entity, or an entity previouslyconsidered a qualifying special purpose entity,
100

then, the VIE will be consolidated by the entity that determines it stands to absorb a majority of the VIE’s expectedlosses or to receive a majority of the VIE’s expected residual returns. Entities that are assessed for consolidation underthis framework include hedge funds, property funds, private equity funds and venture capital funds.
When determining whether the Company will absorb the majority of a VIE’s expected losses or receive a majority of aVIE’s expected returns, it analyzes the purpose and design of the VIE and identifies the variable interests it holdsincluding those of related parties and de facto agents of the Company. The Company then quantitatively determineswhether its variable interests will absorb a majority of the VIE’s expected losses or residual returns. If the Company willabsorb the majority of the VIE’s expected losses or residual returns, the Company consolidates the VIE.
• If the VIE does not meet the criteria above, then the VIE will be consolidated by the reporting entity that determines ithas both:
(i) the power to direct the activities of the VIE that most significantly impact the VIE’s economic performance; and
(ii) the obligation to absorb losses of the VIE that could potentially be significant to the VIE or the right to receivebenefits from the VIE that could potentially be significant to the VIE.
Entities that are assessed for consolidation under this framework include asset-backed financing entities such ascollateralized loan obligations (‘‘CLOs’’) and investments in qualified affordable housing partnerships.
When evaluating entities for consolidation under this framework, the Company considers its contractual rights indetermining whether it has the power to direct the activities of the VIE that most significantly impact the VIEs economicperformance. In determining whether the Company has this power, it considers whether it is acting as an asset managerenabling it to direct the activities that most significantly impact the economic performance of an entity or if it is acting in amore passive role such as a limited partner without substantive rights to impact the economic performance of the entity.
In determining whether the Company has the obligation to absorb losses of the VIE or the right to receive benefits from theVIE that could potentially be significant to the VIE, the Company considers an analysis of its rights to receive benefits suchas management and incentive fees and investment returns and its obligation to absorb losses associated with anyinvestment in the VIE in conjunction with other qualitative factors.
If the Company consolidates a VIE under either accounting model, it is referred to as the VIE’s primary beneficiary.
Foreign Currency TranslationNet assets of foreign subsidiaries, whose functional currency is other than the U.S. dollar, are translated into U.S. dollarsbased upon exchange rates prevailing at the end of each period. Revenues and expenses are translated at daily exchangerates during the period. The resulting translation adjustment, along with any related hedge and tax effects, are included inaccumulated other comprehensive income (‘‘AOCI’’). The determination of the functional currency is based on the primaryeconomic and other management indicators. Gains and losses from foreign currency transactions are included in theconsolidated results of operations.
Amounts Based on Estimates and AssumptionsAccounting estimates are an integral part of the Consolidated Financial Statements. In part, they are based uponassumptions concerning future events. Among the more significant are those that relate to investment securities valuationand recognition of other-than-temporary impairments, deferred acquisition costs (‘‘DAC’’) and the corresponding recognitionof DAC amortization, valuation of derivative instruments and hedging activities, litigation and claims reserves and incometaxes and the recognition of deferred tax assets and liabilities. These accounting estimates reflect the best judgment ofmanagement and actual results could differ.
Cash and Cash EquivalentsCash equivalents include time deposits and other highly liquid investments with original maturities of 90 days or less.
Investments
Available-for-Sale SecuritiesAvailable-for-Sale securities are carried at fair value with unrealized gains (losses) recorded in AOCI, net of impacts to DAC,deferred sales inducement costs (‘‘DSIC’’), unearned revenue, benefit reserves, reinsurance recoverables and incometaxes. Gains and losses are recognized on a trade date basis in the Consolidated Statements of Operations upondisposition of the securities.
101

When the fair value of an investment is less than its amortized cost, the Company assesses whether or not: (i) it has theintent to sell the security (made a decision to sell) or (ii) it is more likely than not that the Company will be required to sellthe security before its anticipated recovery. If either of these conditions exist, an other-than-temporary impairment isconsidered to have occurred and the Company recognizes an other-than-temporary impairment for the difference betweenthe investment’s amortized cost and its fair value through earnings. For securities that do not meet the above criteria andthe Company does not expect to recover a security’s amortized cost, the security is also considered other-than-temporarilyimpaired. For these securities, the Company separates the total impairment into the credit loss component and theamount of the loss related to other factors. The amount of the total other-than-temporary impairment related to credit lossis recognized in earnings. The amount of the total other-than-temporary impairment related to other factors is recognized inother comprehensive income, net of impacts to DAC, DSIC, unearned revenue, benefit reserves, reinsurance recoverablesand income taxes. For Available-for-Sale securities that have recognized an other-than-temporary impairment throughearnings, the difference between the amortized cost and the cash flows expected to be collected is accreted as interestincome if through subsequent evaluation there is a sustained increase in the cash flow expected. Subsequent increasesand decreases in the fair value of Available-for-Sale securities are included in other comprehensive income.
The Company provides a supplemental disclosure on the face of its Consolidated Statements of Operations that presents:(i) total other-than-temporary impairment losses recognized during the period and (ii) the portion of other-than-temporaryimpairment losses recognized in other comprehensive income. The sum of these amounts represents the credit-relatedportion of other-than-temporary impairments that were recognized in earnings during the period. The portion ofother-than-temporary losses recognized in other comprehensive income includes: (i) the portion of other-than-temporaryimpairment losses related to factors other than credit recognized during the period and (ii) reclassifications ofother-than-temporary impairment losses previously determined to be related to factors other than credit that aredetermined to be credit-related in the current period. The amount presented on the Consolidated Statements of Operationsas the portion of other-than-temporary losses recognized in other comprehensive income excludes subsequent increasesand decreases in the fair value of these securities.
For all securities that are considered temporarily impaired, the Company does not intend to sell these securities (has notmade a decision to sell) and it is not more likely than not that the Company will be required to sell the security beforerecovery of its amortized cost basis. The Company believes that it will collect all principal and interest due on allinvestments that have amortized cost in excess of fair value that are considered only temporarily impaired.
Factors the Company considers in determining whether declines in the fair value of fixed maturity securities areother-than-temporary include: (i) the extent to which the market value is below amortized cost; (ii) the duration of time inwhich there has been a significant decline in value; (iii) fundamental analysis of the liquidity, business prospects andoverall financial condition of the issuer; and (iv) market events that could impact credit ratings, economic and businessclimate, litigation and government actions, and similar external business factors. In order to determine the amount of thecredit loss component for corporate debt securities considered other-than-temporarily impaired, a best estimate of thepresent value of cash flows expected to be collected discounted at the security’s effective interest rate is compared to theamortized cost basis of the security. The significant inputs to cash flow projections consider potential debt restructuringterms, projected cash flows available to pay creditors and the Company’s position in the debtor’s overall capital structure.
For structured investments (e.g., residential mortgage backed securities, commercial mortgage backed securities, assetbacked securities and other structured investments), the Company also considers factors such as overall deal structureand its position within the structure, quality of underlying collateral, delinquencies and defaults, loss severities, recoveries,prepayments and cumulative loss projections in assessing potential other-than-temporary impairments of theseinvestments. Based upon these factors, securities that have indicators of potential other-than-temporary impairment aresubject to detailed review by management. Securities for which declines are considered temporary continue to bemonitored by management until management determines there is no current risk of an other-than-temporary impairment.
Other InvestmentsOther investments primarily reflect the Company’s interests in affordable housing partnerships, trading securities, seedmoney investments and syndicated loans. Affordable housing partnerships and seed money investments are accounted forunder the equity method. Trading securities primarily include common stocks and trading bonds. Trading securities arecarried at fair value with unrealized and realized gains (losses) recorded within net investment income.
Financing Receivables
Commercial Mortgage Loans, Syndicated Loans, and Consumer LoansCommercial mortgage loans, syndicated loans and consumer loans are reflected within investments at amortized cost lessthe allowance for loan losses. Syndicated loans represent the Company’s investment in below investment grade loan
102

syndications and are carried at amortized cost less the related allowance for loan losses. Interest income is accrued on theunpaid principal balances of the loans as earned.
Other LoansOther loans consist of policy and certificate loans and brokerage margin loans. When originated, policy and certificate loanbalances do not exceed the cash surrender value of the underlying products. As there is minimal risk of loss related topolicy and certificate loans, the Company does not record an allowance for loan losses. Policy and certificate loans arereflected within investments at the unpaid principal balance, plus accrued interest. The Company’s broker dealersubsidiaries enter into lending arrangements with clients through the normal course of business, which are primarily basedon customer margin levels. Margin loans are reported at the unpaid principal balance within receivables. The Companymonitors the market value of collateral supporting the margin loans and requests additional collateral when necessary inorder to mitigate the risk of loss. As there is minimal risk of loss related to margin loans, the allowance for loan losses isimmaterial.
Nonaccrual LoansGenerally, loans are evaluated for or placed on nonaccrual status when either the collection of interest or principal hasbecome 90 days past due or is otherwise considered doubtful of collection. When a loan is placed on nonaccrual status,unpaid accrued interest is reversed. Interest payments received on loans on nonaccrual status are generally applied toprincipal unless the remaining principal balance has been determined to be fully collectible.
Revolving unsecured consumer lines are charged off at 180 days past due. Closed-end consumer loans, other than loanssecured by one to four family properties, are charged off at 120 days past due and are generally not placed on nonaccrualstatus. Loans secured by one to four family properties are impaired when management determines the assets areuncollectible and commences foreclosure proceedings on the property, at which time the loan is written down to fair valueless selling costs and recorded as real estate owned in other assets. Commercial mortgage loans are evaluated forimpairment when the loan is considered for nonaccrual status, restructured or foreclosure proceedings are initiated on theproperty. If it is determined that the fair value is less than the current loan balance, it is written down to fair value lessselling costs. Foreclosed property is recorded as real estate owned in other assets. Syndicated loans are placed onnonaccrual status when management determines it will not collect all contractual principal and interest on the loan.
Allowance for Loan LossesManagement determines the adequacy of the allowance for loan losses based on the overall loan portfolio composition,recent and historical loss experience, and other pertinent factors, including when applicable, internal risk ratings,loan-to-value (‘‘LTV’’) ratios, FICO scores of the borrower, debt service coverage and occupancy rates, along with economicand market conditions. This evaluation is inherently subjective as it requires estimates, which may be susceptible tosignificant change.
The Company determines the amount of the allowance based on management’s assessment of relative risk characteristicsof the loan portfolio. The allowance is recorded for homogeneous loan categories on a pool basis, based on an analysis ofproduct mix and risk characteristics of the portfolio, including geographic concentration, bankruptcy experiences, andhistorical losses, adjusted for current trends and market conditions.
While the Company attributes portions of the allowance to specific loan pools as part of the allowance estimation process,the entire allowance is available to absorb losses inherent in the total loan portfolio. The allowance is increased throughprovisions charged to net investment income and reduced/increased by net charge-offs/recoveries.
Impaired LoansThe Company considers a loan to be impaired when, based on current information and events, it is probable the Companywill not be able to collect all amounts due (both interest and principal) according to the contractual terms of the loanagreement. Impaired loans may also include loans that have been modified in troubled debt restructurings as a concessionto borrowers experiencing financial difficulties. Management evaluates for impairment all restructured loans and loans withhigher impairment risk factors. Factors used by the Company to determine whether all amounts due on commercialmortgage loans will be collected, include but are not limited to, the financial condition of the borrower, performance of theunderlying properties, collateral and/or guarantees on the loan, and the borrower’s estimated future ability to pay based onproperty type and geographic location. The evaluation of impairment on consumer loans is primarily driven by delinquencystatus of individual loans. The impairment recognized is measured as the excess of the loan’s recorded investment over:(i) the present value of its expected principal and interest payments discounted at the loan’s effective interest rate, (ii) thefair value of collateral or (iii) the loan’s observable market price.
103

Restructured LoansA loan is classified as a restructured loan when the Company makes certain concessionary modifications to contractualterms for borrowers experiencing financial difficulties. When the interest rate, minimum payments, and/or due dates havebeen modified in an attempt to make the loan more affordable to a borrower experiencing financial difficulties, themodification is considered a troubled debt restructuring. Generally, performance prior to the restructuring or significantevents that coincide with the restructuring are considered in assessing whether the borrower can meet the new termswhich may result in the loan being returned to accrual status at the time of the restructuring or after a performanceperiod. If the borrower’s ability to meet the revised payment schedule is not reasonably assured, the loan remains onnonaccrual status.
Separate Account Assets and LiabilitiesSeparate account assets and liabilities are primarily funds held for the exclusive benefit of variable annuity contractholdersand variable life insurance policyholders, who assume the related investment risk. Income and losses on separate accountassets accrue directly to the contractholder or policyholder and are not reported in the Company’s ConsolidatedStatements of Operations. Separate account assets are recorded at fair value. Changes in the fair value of separateaccount assets are offset by changes in the related separate account liabilities.
Included in separate account assets and liabilities is the fair value of the pooled pension funds that are offered byThreadneedle.
Restricted and Segregated Cash and InvestmentsAmounts segregated under federal and other regulations are held in special reserve bank accounts for the exclusive benefitof the Company’s brokerage customers.
Land, Buildings, Equipment and SoftwareLand, buildings, equipment and internally developed or purchased software are carried at cost less accumulateddepreciation or amortization and are reflected within other assets. The Company uses the straight-line method ofdepreciation and amortization over periods ranging from three to 39 years. At December 31, 2015 and 2014, land,buildings, equipment and software were $724 million and $667 million, respectively, net of accumulated depreciation of$1.6 billion and $1.4 billion, respectively. Depreciation and amortization expense for the years ended December 31, 2015,2014 and 2013 was $150 million, $144 million and $144 million, respectively. Capitalized lease assets, net ofaccumulated depreciation, are included in land, buildings, equipment and software, and capital lease obligations areincluded in long-term debt.
Goodwill and Other Intangible AssetsGoodwill represents the amount of an acquired company’s acquisition cost in excess of the fair value of assets acquiredand liabilities assumed. The Company evaluates goodwill for impairment annually on the measurement date of July 1 andwhenever events and circumstances indicate that an impairment may have occurred, such as a significant adverse changein the business climate or a decision to sell or dispose of a reporting unit. Impairment is the amount carrying valueexceeds fair value and is evaluated at the reporting unit level. The Company assesses various qualitative factors todetermine whether impairment is likely to have occurred. If impairment were to occur, the Company would use thediscounted cash flow method, a variation of the income approach.
Intangible assets are amortized over their estimated useful lives unless they are deemed to have indefinite useful lives. TheCompany evaluates the definite lived intangible assets remaining useful lives annually and tests for impairment wheneverevents and circumstances indicate that an impairment may have occurred, such as a significant adverse change in thebusiness climate. For definite lived intangible assets, impairment to fair value is recognized if the carrying amount is notrecoverable. Indefinite lived intangibles are also tested for impairment annually or whenever circumstances indicate animpairment may have occurred.
Goodwill and other intangible assets are reflected in other assets.
Derivative Instruments and Hedging ActivitiesFreestanding derivative instruments are recorded at fair value and are reflected in other assets or other liabilities. TheCompany’s policy is to not offset fair value amounts recognized for derivatives and collateral arrangements executed withthe same counterparty under the same master netting arrangement. The accounting for changes in the fair value of aderivative instrument depends on its intended use and the resulting hedge designation, if any. The Company primarily usesderivatives as economic hedges that are not designated as accounting hedges or do not qualify for hedge accountingtreatment. The Company occasionally designates derivatives as (i) hedges of changes in the fair value of assets, liabilities,
104

or firm commitments (‘‘fair value hedges’’), (ii) hedges of a forecasted transaction or of the variability of cash flows to bereceived or paid related to a recognized asset or liability (‘‘cash flow hedges’’), or (iii) hedges of foreign currency exposuresof net investments in foreign operations (‘‘net investment hedges in foreign operations’’).
Derivative instruments that are entered into for hedging purposes are designated as such at the time the Company entersinto the contract. For all derivative instruments that are designated for hedging activities, the Company documents all ofthe hedging relationships between the hedge instruments and the hedged items at the inception of the relationships.Management also documents its risk management objectives and strategies for entering into the hedge transactions. TheCompany assesses, at inception and on a quarterly basis, whether derivatives designated as hedges are highly effective inoffsetting the fair value or cash flows of hedged items. If it is determined that a derivative is no longer highly effective as ahedge, the Company will discontinue the application of hedge accounting.
For derivative instruments that do not qualify for hedge accounting or are not designated as accounting hedges, changes infair value are recognized in current period earnings. Changes in fair value of derivatives are presented in the ConsolidatedStatements of Operations based on the nature and use of the instrument. Changes in fair value of derivatives used aseconomic hedges are presented in the Consolidated Statements of Operations with the corresponding change in thehedged asset or liability.
For derivative instruments that qualify as fair value hedges, changes in the fair value of the derivatives, as well as changesin the fair value of the hedged assets, liabilities or firm commitments, are recognized on a net basis in current periodearnings. The carrying value of the hedged item is adjusted for the change in fair value from the designated hedged risk. Ifa fair value hedge designation is removed or the hedge is terminated prior to maturity, previous adjustments to the carryingvalue of the hedged item are recognized into earnings over the remaining life of the hedged item.
For derivative instruments that qualify as cash flow hedges, the effective portion of the gain or loss on the derivativeinstruments is reported in AOCI and reclassified into earnings when the hedged item or transaction impacts earnings. Theamount that is reclassified into earnings is presented in the Consolidated Statements of Operations with the hedgedinstrument or transaction impact. Any ineffective portion of the gain or loss is reported in current period earnings as acomponent of net investment income. If a hedge designation is removed or a hedge is terminated prior to maturity, theamount previously recorded in AOCI is reclassified to earnings over the period that the hedged item impacts earnings. Forhedge relationships that are discontinued because the forecasted transaction is not expected to occur according to theoriginal strategy, any related amounts previously recorded in AOCI are recognized in earnings immediately.
For derivative instruments that qualify as net investment hedges in foreign operations, the effective portion of the changein fair value of the derivatives is recorded in AOCI as part of the foreign currency translation adjustment. Any ineffectiveportion of the net investment hedges in foreign operations is recognized in net investment income during the period ofchange.
The equity component of equity indexed annuities (‘‘EIA’’), indexed universal life (‘‘IUL’’) and stock market certificateobligations are considered embedded derivatives. Additionally, certain annuities contain guaranteed minimum accumulationbenefit (‘‘GMAB’’) and guaranteed minimum withdrawal benefit (‘‘GMWB’’) provisions. The GMAB and the non-lifecontingent benefits associated with GMWB provisions are also considered embedded derivatives.
See Note 14 for information regarding the Company’s fair value measurement of derivative instruments and Note 16 forthe impact of derivatives on the Consolidated Statements of Operations.
Deferred Acquisition CostsThe Company incurs costs in connection with acquiring new and renewal insurance and annuity businesses. The portion ofthese costs which are incremental and direct to the acquisition of a new or renewal insurance policy or annuity contractare deferred. Significant costs capitalized include sales based compensation related to the acquisition of new and renewalinsurance policies and annuity contracts, medical inspection costs for successful sales, and a portion of employeecompensation and benefit costs based upon the amount of time spent on successful sales. Sales based compensationpaid to advisors and employees and third-party distributors is capitalized. Employee compensation and benefits costs whichare capitalized relate primarily to sales efforts, underwriting and processing. All other costs which are not incremental directcosts of acquiring an insurance policy or annuity contract are expensed as incurred. The DAC associated with insurancepolicies or annuity contracts that are significantly modified or internally replaced with another contract are accounted for ascontract terminations. These transactions are anticipated in establishing amortization periods and other valuationassumptions.
The Company monitors other principal DAC amortization assumptions, such as persistency, mortality, morbidity, interestmargin, variable annuity benefit utilization and maintenance expense levels each quarter and, when assessedindependently, each could impact the Company’s DAC balances.
105

The analysis of DAC balances and the corresponding amortization is a dynamic process that considers all relevant factorsand assumptions described previously. Unless the Company’s management identifies a significant deviation over the courseof the quarterly monitoring, management reviews and updates these DAC amortization assumptions annually in the thirdquarter of each year.
Non-Traditional Long-Duration ProductsFor non-traditional long-duration products (including variable and fixed annuity contracts, universal life (‘‘UL’’) and variableuniversal life (‘‘VUL’’) insurance products), DAC are amortized based on projections of estimated gross profits (‘‘EGPs’’)over amortization periods equal to the approximate life of the business.
EGPs vary based on persistency rates (assumptions at which contractholders and policyholders are expected to surrender,make withdrawals from and make deposits to their contracts), mortality levels, client asset value growth rates (based onequity and bond market performance), variable annuity benefit utilization and interest margins (the spread between earnedrates on invested assets and rates credited to contractholder and policyholder accounts). When assumptions are changed,the percentage of EGPs used to amortize DAC might also change. A change in the required amortization percentage isapplied retrospectively; an increase in amortization percentage will result in a decrease in the DAC balance and anincrease in DAC amortization expense, while a decrease in amortization percentage will result in an increase in the DACbalance and a decrease in DAC amortization expense. The impact on results of operations of changing assumptions can beeither positive or negative in any particular period and is reflected in the period in which such changes are made.
The client asset value growth rates are the rates at which variable annuity and VUL insurance contract values invested inseparate accounts are assumed to appreciate in the future. The rates used vary by equity and fixed income investments.Management reviews and, where appropriate, adjusts its assumptions with respect to client asset value growth rates on aregular basis. The Company typically uses a five-year mean reversion process as a guideline in setting near-term equityfund growth rates based on a long-term view of financial market performance as well as recent actual performance. Thesuggested near-term equity fund growth rate is reviewed quarterly to ensure consistency with management’s assessment ofanticipated equity market performance. DAC amortization expense recorded in a period when client asset value growthrates exceed management’s near-term estimate will typically be less than in a period when growth rates fall short ofmanagement’s near-term estimate.
Traditional Long-Duration ProductsFor traditional long-duration products (including traditional life, disability income (‘‘DI’’) and long term care (‘‘LTC’’)insurance products), DAC are generally amortized as a percentage of premiums over amortization periods equal to thepremium paying period. The assumptions made in calculating the DAC balance and DAC amortization expense areconsistent with those used in determining the liabilities.
For traditional life and DI insurance products, the assumptions provide for adverse deviations in experience and are revisedonly if management concludes experience will be so adverse that DAC are not recoverable. If management concludes thatDAC are not recoverable, DAC are reduced to the amount that is recoverable based on best estimate assumptions andthere is a corresponding expense recorded in the Consolidated Statements of Operations.
The assumptions for LTC insurance products include interest rates, premium rate increases, persistency rates and morbidityrates. These assumptions are management’s best estimate from previous loss recognition and thus no longer provide foradverse deviations in experience.
Deferred Sales Inducement CostsSales inducement costs consist of bonus interest credits and premium credits added to certain annuity contract andinsurance policy values. These benefits are capitalized to the extent they are incremental to amounts that would becredited on similar contracts without the applicable feature. The amounts capitalized are amortized using the samemethodology and assumptions used to amortize DAC. DSIC is recorded in other assets, and amortization of DSIC isrecorded in benefits, claims, losses and settlement expenses.
ReinsuranceThe Company cedes significant amounts of insurance risk to other insurers under reinsurance agreements. The Companyevaluates the financial condition of its reinsurers prior to entering into new reinsurance contracts and on a periodic basisduring the contract term.
Reinsurance premiums paid and benefits received are accounted for consistently with the basis used in accounting for thepolicies from which risk is reinsured and consistently with the terms of the reinsurance contracts. Reinsurance premiumsfor traditional life, LTC, DI and auto and home, net of the change in any prepaid reinsurance asset, are reported as areduction of premiums. Fixed and variable universal life reinsurance premiums are reported as a reduction of other
106

revenues. In addition, for fixed and variable universal life insurance policies, the net cost of reinsurance ceded, whichrepresents the discounted amount of the expected cash flows between the reinsurer and the Company, is classified as anasset or contra asset and amortized over the estimated life of the policies in proportion to the estimated gross profits andis subject to retrospective adjustment in a manner similar to retrospective adjustment of DAC. The assumptions used toproject the expected cash flows are consistent with those used for DAC valuation for the same contracts. Changes in thenet cost of reinsurance are reflected as a component of other revenues. Reinsurance recoveries are reported ascomponents of benefits, claims, losses and settlement expenses.
Insurance liabilities are reported before the effects of reinsurance. Policyholder account balances, future policy benefits andclaims recoverable under reinsurance contracts are recorded within receivables.
The Company also assumes life insurance and fixed annuity risk from other insurers in limited circumstances. Reinsurancepremiums received and benefits paid are accounted for consistently with the basis used in accounting for the policies fromwhich risk is reinsured and consistently with the terms of the reinsurance contracts. Liabilities for assumed business arerecorded within policyholder account balances, future policy benefits and claims.
See Note 7 for additional information on reinsurance.
Policyholder Account Balances, Future Policy Benefits and ClaimsThe Company establishes reserves to cover the risks associated with non-traditional and traditional long-duration productsand short-duration products. Reserves for non-traditional long-duration products include the liabilities related to guaranteedbenefit provisions added to variable annuity contracts, variable and fixed annuity contracts and UL and VUL policies and theembedded derivatives related to variable annuity contracts, EIA and IUL insurance. Reserves for traditional long-durationproducts are established to provide adequately for future benefits and expenses for term life, whole life, DI and LTCinsurance products. Reserves for short-duration products are established to provide adequately for incurred losses primarilyrelated to auto and home policies.
The establishment of reserves is an estimation process using a variety of methods, assumptions and data elements. Ifactual experience is better than or equal to the results of the estimation process, then reserves should be adequate toprovide for future benefits and expenses. If actual experience is worse than the results of the estimation process,additional reserves may be required.
Changes in future policy benefits and claims are reflected in earnings in the period adjustments are made. Whereapplicable, benefit amounts expected to be recoverable from reinsurance companies who share in the risk are separatelyrecorded as reinsurance recoverable within receivables.
Non-Traditional Long-Duration ProductsLiabilities for fixed account values on variable and fixed deferred annuities and UL and VUL policies are equal toaccumulation values, which are the cumulative gross deposits and credited interest less withdrawals and various charges.
A portion of the Company’s UL and VUL policies have product features that result in profits followed by losses from theinsurance component of the contract. These profits followed by losses can be generated by the cost structure of theproduct or secondary guarantees in the contract. The secondary guarantee ensures that, subject to specified conditions,the policy will not terminate and will continue to provide a death benefit even if there is insufficient policy value to coverthe monthly deductions and charges. The liability for these future losses is determined by estimating the death benefits inexcess of account value and recognizing the excess over the estimated life based on expected assessments (e.g. cost ofinsurance charges, contractual administrative charges, similar fees and investment margin). See Note 11 for informationregarding the liability for contracts with secondary guarantees.
Liabilities for EIA are equal to the host contract values covering guaranteed benefits and the fair value of embedded equityoptions. Liabilities for indexed accounts of IUL products are equal to the accumulation of host contract values coveringguaranteed benefits and the fair value of embedded equity options.
The majority of the variable annuity contracts offered by the Company contain guaranteed minimum death benefit(‘‘GMDB’’) provisions. When market values of the customer’s accounts decline, the death benefit payable on a contractwith a GMDB may exceed the contract accumulation value. The Company also offers variable annuities with death benefitprovisions that gross up the amount payable by a certain percentage of contract earnings, which are referred to as gaingross-up (‘‘GGU’’) benefits. In addition, the Company offers contracts containing GMWB and GMAB provisions, and untilMay 2007, the Company offered contracts containing guaranteed minimum income benefit (‘‘GMIB’’) provisions.
The GMDB and GGU liability is determined by estimating the expected value of death benefits in excess of the projectedcontract accumulation value and recognizing the excess over the estimated life based on expected assessments(e.g., mortality and expense fees, contractual administrative charges and similar fees).
107

If elected by the contract owner and after a stipulated waiting period from contract issuance, a GMIB guarantees aminimum lifetime annuity based on a specified rate of contract accumulation value growth and predetermined annuitypurchase rates. The GMIB liability is determined each period by estimating the expected value of annuitization benefits inexcess of the projected contract accumulation value at the date of annuitization and recognizing the excess over theestimated life based on expected assessments.
The liability for the life contingent benefits associated with GMWB provisions is determined by estimating the expectedvalue of benefits that are contingent upon survival after the account value is equal to zero and recognizing the benefitsover the estimated life based on expected assessments (e.g., mortality and expense fees, contractual administrativecharges and similar fees).
In determining the liabilities for GMDB, GGU, GMIB and the life contingent benefits associated with GMWB, the Companyprojects these benefits and contract assessments using actuarial models to simulate various equity market scenarios.Significant assumptions made in projecting future benefits and assessments relate to customer asset value growth rates,mortality, persistency, benefit utilization and investment margins and are consistent with those used for DAC valuation forthe same contracts. As with DAC, management reviews and, where appropriate, adjusts its assumptions each quarter.Unless management identifies a material deviation over the course of quarterly monitoring, management reviews andupdates these assumptions annually in the third quarter of each year.
The fair value of embedded derivatives related to GMAB and the non-life contingent benefits associated with GMWBprovisions fluctuates based on equity, interest rate and credit markets which can cause these embedded derivatives to beeither an asset or a liability. See Note 14 for information regarding the fair value measurement of embedded derivatives.
Liabilities for fixed annuities in a benefit or payout status are based on future estimated payments using establishedindustry mortality tables and interest rates.
Traditional Long-Duration ProductsThe liabilities for traditional long-duration products include liabilities for unpaid amounts on reported claims, estimates ofbenefits payable on claims incurred but not yet reported and estimates of benefits that will become payable on term life,whole life, DI and LTC policies as claims are incurred in the future.
Liabilities for unpaid amounts on reported life insurance claims are equal to the death benefits payable under the policies.Liabilities for unpaid amounts on reported health insurance claims include any periodic or other benefit amounts due andaccrued, along with estimates of the present value of obligations for continuing benefit payments. These amounts arecalculated based on claim continuance tables which estimate the likelihood an individual will continue to be eligible forbenefits. The discount rates used to calculate present values are based on average interest rates earned on assetssupporting the liability for unpaid amounts. Anticipated claim continuance rates are based on established industry tables,adjusted as appropriate for the Company’s experience.
Liabilities for estimated benefits payable on claims that have been incurred but not yet reported are based on periodicanalysis of the actual time lag between when a claim occurs and when it is reported.
Liabilities for estimates of benefits that will become payable on future claims on term life, whole life and health insurancepolicies are based on the net level premium method, using anticipated premium payments, mortality and morbidity rates,policy persistency and interest rates earned on assets supporting the liability. Anticipated mortality and morbidity rates arebased on established industry mortality and morbidity tables, with modifications based on the Company’s experience.Anticipated premium payments and persistency rates vary by policy form, issue age, policy duration and certain otherpricing factors.
For term life, whole life, DI and LTC polices, the Company utilizes best estimate assumptions as of the date the policy isissued with provisions for the risk of adverse deviation, as appropriate. After the liabilities are initially established,management performs premium deficiency tests annually in the third quarter of each year using best estimate assumptionswithout provisions for adverse deviation. If the liabilities determined based on these best estimate assumptions are greaterthan the net reserves (i.e., GAAP reserves net of any DAC balance), the existing net reserves are adjusted by first reducingthe DAC balance by the amount of the deficiency or to zero through a change to current period earnings. If the deficiencyis more than the DAC balance, then the net reserves are increased by the excess through a charge to current periodearnings. If a premium deficiency is recognized, the assumptions are locked in and used in subsequent valuations. Theassumptions for LTC insurance products are management’s best estimate from previous loss recognition and thus nolonger provide for adverse deviations in experience.
Short-Duration ProductsThe liabilities for short-duration products primarily include auto and home reserves comprised of amounts determined fromloss reports on individual claims, as well as amounts based on historical loss experience for losses incurred but not yet
108

reported. Such liabilities are based on estimates. The Company’s methods for making such estimates and for establishingthe resulting liabilities are continually reviewed, and any adjustments are reflected in earnings in the period suchadjustments are made.
Unearned Revenue LiabilityThe Company’s fixed and variable universal life policies require payment of fees or other policyholder assessments inadvance for services to be provided in future periods. These charges are deferred as unearned revenue and amortizedusing estimated gross profits, similar to DAC. The unearned revenue liability is recorded in other liabilities and theamortization is recorded in other revenues.
For clients who pay financial planning fees prior to the advisor’s delivery of the financial plan, the financial planning feesreceived in advance are deferred as unearned revenue until the plan is delivered to the client.
Share-Based CompensationThe Company measures and recognizes the cost of share-based awards granted to employees and directors based on thegrant-date fair value of the award and recognizes the expense (net of estimated forfeitures) on a straight-line basis overthe vesting period. Excess tax benefits or deficiencies are created upon distribution or exercise of awards. Excess taxbenefits are recognized in additional paid-in-capital and excess tax deficiencies are recognized either as an offset toaccumulated excess tax benefits, if any, or in the income statement. The fair value of each option is estimated on thegrant date using a Black-Scholes option-pricing model. The Company recognizes the cost of share-based awards granted toindependent contractors and performance share units granted to the Company’s Executive Leadership Team on a fair valuebasis until fully vested.
Income TaxesThe Company’s provision for income taxes represents the net amount of income taxes that the Company expects to pay orto receive from various taxing jurisdictions in connection with its operations. The Company provides for income taxes basedon amounts that the Company believes it will ultimately owe taking into account the recognition and measurement foruncertain tax positions. Inherent in the provision for income taxes are estimates and judgments regarding the tax treatmentof certain items.
In connection with the provision for income taxes, the Consolidated Financial Statements reflect certain amounts related todeferred tax assets and liabilities, which result from temporary differences between the assets and liabilities measured forfinancial statement purposes versus the assets and liabilities measured for tax return purposes.
The Company is required to establish a valuation allowance for any portion of its deferred tax assets that managementbelieves will not be realized. Significant judgment is required in determining if a valuation allowance should be establishedand the amount of such allowance if required. Factors used in making this determination include estimates relating to theperformance of the business. Consideration is given to, among other things in making this determination: (i) future taxableincome exclusive of reversing temporary differences and carryforwards; (ii) future reversals of existing taxable temporarydifferences; (iii) taxable income in prior carryback years; and (iv) tax planning strategies. Management may need to identifyand implement appropriate planning strategies to ensure its ability to realize deferred tax assets and reduce the likelihoodof the establishment of a valuation allowance with respect to such assets. See Note 21 for additional information on theCompany’s valuation allowance.
Revenue RecognitionThe Company’s management and financial advice fees are generally recognized when earned as the service is provided. Asignificant portion of the Company’s management fees are calculated as a percentage of the fair value of its managedassets. A large majority of the Company’s managed assets are valued by third party pricing services vendors based uponobservable market data. The selection of the Company’s third party pricing service vendors and the reliability of their pricesare subject to certain governance procedures, such as exception reporting, subsequent transaction testing, and annual duediligence of the Company’s vendors, which includes assessing the vendor’s valuation qualifications, control environment,analysis of asset-class specific valuation methodologies and understanding of sources of market observable assumptions.
The Company may receive performance-based incentive management fees on certain management contracts. Performancefees are paid when specific performance hurdles are met. The Company recognizes performance fees on the date the feeis no longer subject to adjustment. Any performance fees received are not subject to repayment or any other clawbackprovisions.
Certain management and financial advice fees are charged based on an annual fee or a transaction fee. These feesinclude financial planning, certain custodial and fund administration and brokerage fees. Fees from financial planningservices are recognized when the financial plan is delivered. Annual custodial and fund administration fees are recognized
109

evenly as service is provided over the contract period. Transaction based brokerage fees are recognized on the transactiondate.
Mortality and expense risk fees are generally calculated as a percentage of the fair value of assets held in separateaccounts and recognized when assessed.
Point-of-sale fees (such as mutual fund front-end sales loads) and asset-based fees (such as 12b-1 distribution andshareholder service fees) are generally based on a contractual percentage of assets and recognized when earned. Amountsreceived under marketing support arrangements for sales of mutual funds and other companies’ products, such as throughthe Company’s wrap accounts, as well as surrender charges on fixed and variable universal life insurance and annuities,are recognized when assessed.
Interest income is accrued as earned using the effective interest method, which makes an adjustment of the yield forsecurity premiums and discounts on all performing fixed maturity securities classified as Available-for-Sale so that therelated security or loan recognizes a constant rate of return on the outstanding balance throughout its term. Realized gainsand losses on securities, other than trading securities and equity method investments, are recognized using the specificidentification method on a trade date basis.
Premiums on auto and home insurance are net of reinsurance premiums and recognized ratably over the coverage period.Premiums on traditional life, health insurance and immediate annuities with a life contingent feature are net of reinsuranceceded and recognized as revenue when due.
Variable annuity guaranteed benefit rider charges and cost of insurance charges on fixed and variable universal lifeinsurance (net of reinsurance premiums and cost of reinsurance for universal life products) are recognized as revenuewhen assessed.
3. Recent Accounting Pronouncements
Adoption of New Accounting StandardsTransfers and ServicingIn June 2014, the Financial Accounting Standards Board (‘‘FASB’’) updated the accounting standards related to transfersand servicing. The update requires repurchase-to-maturity transactions and linked repurchase financings to be accountedfor as secured borrowings consistent with the accounting for other repurchase agreements. The standard requiresdisclosures related to transfers of financial assets accounted for as sales in transactions that are similar to repurchaseagreements. The standard also requires disclosures on the remaining contractual maturity of the agreements,disaggregation of the gross obligation by class of collateral pledged and potential risks associated with the agreements andthe related collateral pledged in repurchase agreements, securities lending transactions, and repurchase-to-maturitytransactions accounted for as secured borrowings. The standard is effective for interim and annual periods beginning afterDecember 15, 2014, except for the disclosure requirements for repurchase agreements, security lending transactions andrepurchase-to-maturity transactions accounted for as secured borrowings which are effective for interim periods beginningafter March 15, 2015. The standard requires entities to present changes in accounting for transactions outstanding at theeffective date as a cumulative-effect adjustment to retained earnings as of the beginning of the period of adoption. Theadoption of the standard did not have any effect on the Company’s consolidated results of operations and financialcondition. See Note 13 and Note 15 for the required disclosures.
Receivables — Troubled Debt Restructuring by CreditorsIn January 2014, the FASB updated the accounting standard related to recognizing residential real estate obtained througha repossession or foreclosure from a troubled debtor. The update clarifies the criteria for derecognition of the loanreceivable and recognition of the real estate property. The standard is effective for interim and annual periods beginningafter December 15, 2014 and can be applied under a modified retrospective transition method or a prospective transitionmethod. The adoption of the standard did not have any effect on the Company’s consolidated results of operations andfinancial condition.
Investments — Equity Method and Joint VenturesIn January 2014, the FASB updated the accounting standard related to investments in qualified affordable housingprojects. The update allows for an accounting policy election to account for investments in qualified affordable housingprojects using the proportional amortization method if certain conditions are met. Under the proportional amortizationmethod, the investment in a qualified affordable housing project is amortized in proportion to the tax credits and other taxbenefits received. The net investment performance is recognized as a component of income tax expense (benefit). Thestandard is effective for interim and annual periods beginning after December 15, 2014 and should be appliedretrospectively to all periods presented. The Company did not elect the proportional amortization method.
110

Future Adoption of New Accounting StandardsFinancial Instruments — Recognition and Measurement of Financial Assets and Financial LiabilitiesIn January 2016, the FASB updated the accounting standards on the recognition and measurement of financialinstruments. The update requires entities to carry marketable equity securities, excluding investments in securities thatqualify for the equity method of accounting, at fair value through net income. The update affects other aspects ofaccounting for equity instruments, as well as the accounting for financial liabilities utilizing the fair value option. The updateeliminates the requirement to disclose the methods and assumptions used to estimate the fair value of financial assets orliabilities held at cost on the balance sheet and requires entities to use the exit price notion when measuring the fair valueof financial instruments. The standard is effective for interim and annual periods beginning after December 15, 2017. Earlyadoption is permitted for certain provisions. Generally, the update should be applied using a modified retrospectiveapproach by recording a cumulative-effect adjustment to equity at the beginning of the period of adoption. The Company iscurrently evaluating the impact of the standard on its consolidated results of operations and financial condition.
Insurance — Disclosure about Short-Duration ContractsIn May 2015, the FASB updated the accounting standard for short-duration insurance contracts. The update requiresenhanced disclosures about an insurance entity’s initial claim estimates and subsequent adjustments to those estimates,methodologies and judgements in estimating claims and the timing, frequency and severity of claims. The standard iseffective for annual periods beginning after December 15, 2015 and interim periods within annual periods beginning afterDecember 15, 2016. Early adoption is permitted. The disclosures should be applied retrospectively by providingcomparative disclosures for each period presented, except for those requirements that apply only to the current period.There will be no impact of the standard to the Company’s consolidated results of operations and financial condition.
Fair Value Measurement — Disclosures for Investments in Certain Entities That Calculate Net Asset Value perShare (or Its Equivalent)In May 2015, the FASB updated the accounting standards related to fair value measurement. The update applies toinvestments that are measured at net asset value (‘‘NAV’’). The standard eliminates the requirement to categorize withinthe fair value hierarchy all investments for which fair value is measured using the NAV per share as a practical expedient.In addition, the update limits disclosures to investments for which the entity elected to measure the fair value using thepractical expedient rather than all eligible investments. The standard is effective for interim and annual periods beginningafter December 15, 2015. The standard should be applied retrospectively to all periods presented and early adoption ispermitted. The Company adopted the standard on January 1, 2016. There was no impact of the standard to theCompany’s consolidated results of operations and financial condition.
Interest — Imputation of InterestIn April 2015, the FASB updated the accounting standards related to debt issuance costs. The update requires that debtissuance costs be presented on the balance sheet as a direct deduction from the carrying amount of debt. The updatedoes not impact the measurement or recognition of debt issuance costs. In August 2015, the FASB updated the guidanceto allow companies to make a policy election to exclude debt issuance costs for line-of-credit arrangements from thestandard. The standard is effective for interim and annual periods beginning after December 15, 2015. The standard is tobe applied on a retrospective basis to all periods presented. Early adoption of the standard is permitted. The Companyadopted the standard on January 1, 2016. The reclassification did not have a material impact on the Company’sconsolidated financial condition. There was no impact of the standard to the Company’s consolidated results of operations.
ConsolidationIn February 2015, the FASB updated the accounting standard for consolidation. The update changes the accounting forthe consolidation model for limited partnerships and VIEs and excludes certain money market funds from the consolidationanalysis. Specific to the consolidation analysis of a VIE, the update clarifies consideration of fees paid to a decision makerand amends the related party guidance. The standard is effective for periods beginning after December 15, 2015. Earlyadoption is permitted, including adoption in an interim period. The standard may be applied using a modified retrospectiveapproach by recording a cumulative-effect adjustment to equity at the beginning of the period of adoption or appliedretrospectively. The Company adopted the standard on January 1, 2016 using the modified retrospective approach. Theadoption resulted in the deconsolidation of several collateralized loan obligations (‘‘CLOs’’) and all property funds with adecrease of approximately $6.2 billion of assets, $4.9 billion of liabilities and $1.3 billion of equity (noncontrolling interestsand appropriated retained earnings of consolidated investment entities). Effective January 1, 2016, management fees theCompany earns for services provided to the deconsolidated CLOs and property funds are no longer eliminated inconsolidation.
In August 2014, the FASB updated the accounting standard related to consolidation of collateralized financing entities. Theupdate applies to reporting entities that consolidate a collateralized financing entity and measures all financial assets and
111

liabilities of the collateralized financing entity at fair value. The update provides a measurement alternative which wouldallow an entity to measure both the financial assets and financial liabilities at the fair value of the more observable of thefair value of the financial assets or financial liabilities. When the measurement alternative is elected, the reporting entity’snet income should reflect its own economic interests in the collateralized financing entity, including changes in the fairvalue of the beneficial interests retained by the reporting entity and beneficial interests that represent compensation forservices. If the measurement alternative is not elected, the financial assets and financial liabilities should be measuredseparately in accordance with the requirements of the fair value accounting standard. Any difference in the fair value of theassets and liabilities would be recorded to net income attributable to the reporting entity. The standard is effective forinterim and annual periods beginning after December 15, 2015 and early adoption is permitted as of the beginning of anannual period. The standard may be adopted using a modified retrospective approach by recording a cumulative-effectadjustment to equity at the beginning of the period of adoption or applied retrospectively. The Company adopted thestandard on January 1, 2016 and elected the measurement alternative using the modified retrospective approach. Theadoption of the standard did not have a material impact on the Company’s consolidated results of operations and financialcondition after the deconsolidation of several CLOs noted above.
Compensation — Stock CompensationIn June 2014, the FASB updated the accounting standards related to stock compensation. The update clarifies theaccounting for share-based payments with a performance target that could be achieved after the requisite service period.The update specifies the performance target should not be reflected in estimating the grant-date fair value of the award.Instead, the probability of achieving the performance target should impact vesting of the award. The standard is effectivefor interim and annual periods beginning after December 15, 2015 and early adoption is permitted. The Company adoptedthe standard on January 1, 2016. The adoption did not have a material impact on the Company’s consolidated results ofoperations and financial condition.
Revenue from Contracts with CustomersIn May 2014, the FASB updated the accounting standards for revenue from contracts with customers. The update providesa five step revenue recognition model for all revenue arising from contracts with customers and affects all entities thatenter into contracts to provide goods or services to their customers (unless the contracts are in the scope of otherstandards). The standard also updates the accounting for certain costs associated with obtaining and fulfilling a customercontract. In addition, the standard requires disclosure of quantitative and qualitative information that enables users offinancial statements to understand the nature, amount, timing, and uncertainty of revenue and cash flows arising fromcontracts with customers. In August 2015, the FASB updated the accounting standards to defer the effective date by oneyear. The standard is effective for interim and annual periods beginning after December 15, 2017 and early adoption ispermitted for interim and annual periods beginning after December 15, 2016. The standard may be applied retrospectivelyfor all periods presented or retrospectively with a cumulative-effect adjustment at the date of adoption. The Company iscurrently evaluating the impact of the standard on its consolidated results of operations, financial condition anddisclosures.
4. Variable Interest Entities
The Company provides asset management services to investment entities which are considered to be VIEs, such as CLOs,hedge funds, property funds and private equity funds (collectively, ‘‘investment entities’’), which are sponsored by theCompany. The Company consolidates certain CLOs and property funds (collectively, ‘‘consolidated investment entities’’). Inaddition, the Company invests in structured investments and affordable housing partnerships which are considered VIEswhich the Company does not consolidate. See Note 2 for further discussion of the Company’s accounting policy onconsolidation.
Non-Consolidated VIEsThe Company has determined that consolidation is not required for hedge funds and private equity funds which aresponsored by the Company. The Company’s maximum exposure to loss with respect to its investment in these entities islimited to its carrying value. The carrying value of the Company’s investment in these entities was $85 million and$89 million as of December 31, 2015 and 2014, respectively.
The Company manages one CLO which it does not consolidate. The Company manages the CLO and earns managementfees and incentive fees from the CLO based on the CLO’s collateral pool. Unlike the consolidated CLOs, the Company hasno investment in the CLO.
The Company has variable interests in affordable housing partnerships for which it is not the primary beneficiary andtherefore does not consolidate. The Company’s maximum exposure to loss as a result of its investment in affordable
112

housing partnerships is limited to the carrying value of these investments. The carrying value is reflected in otherinvestments and was $517 million and $504 million as of December 31, 2015 and 2014, respectively.
The Company invests in structured investments which are considered VIEs for which it is not the sponsor. These structuredinvestments typically invest in fixed income instruments and are managed by third parties and include asset backedsecurities, commercial mortgage backed securities and residential mortgage backed securities. The Company classifiesthese investments as Available-for-Sale securities. The Company has determined that it is not the primary beneficiary ofthese structures due to the size of the Company’s investment in the entities and position in the capital structure of theseentities. The Company’s maximum exposure to loss as a result of its investment in these structured investments is limitedto its carrying value. See Note 5 for additional information about these structured investments.
The Company has no obligation to provide financial or other support to the non-consolidated VIEs beyond its investmentnor has the Company provided any support to these entities. The carrying value of the Company’s investment in theseentities is included in investments on the consolidated balance sheets.
Consolidated VIEsThe consolidated CLOs are asset backed financing entities collateralized by a pool of assets, primarily syndicated loansand, to a lesser extent, high-yield bonds. Multiple tranches of debt securities are issued by a CLO, offering investorsvarious maturity and credit risk characteristics. The debt securities issued by the CLOs are non-recourse to the Company.The CLO’s debt holders have recourse only to the assets of the CLO. The assets of the CLOs cannot be used by theCompany. Scheduled debt payments are based on the performance of the CLO’s collateral pool. The Company generallyearns management fees from the CLOs based on the CLO’s collateral pool and, in certain instances, may also receiveincentive fees. The Company has invested in a portion of the unrated, junior subordinated notes of certain CLOs. Forcertain of the CLOs, the Company has determined that consolidation is required as it has power over the CLOs as collateralmanager and holds a variable interest in the CLOs for which the Company has the potential to receive benefits or thepotential obligation to absorb losses that could be significant to the CLO.
The Company provides investment advice and related services to property funds, certain of which are considered VIEs. Forinvestment management services, the Company generally earns management fees based on the market value of assetsunder management, and in certain instances may also receive performance-based fees. The Company has determined thatconsolidation is required for certain property funds managed by the Company.
During 2015, the Company consolidated two new CLOs with assets of approximately $1.3 billion and liquidated one CLOresulting in the sale of approximately $203 million in assets. During 2014, the Company consolidated three new CLOs withassets of approximately $1.7 billion and liquidated one CLO resulting in the sale of approximately $300 million in assets.
During 2015, the Company consolidated three new property funds with assets of approximately $452 million. During2014, the Company consolidated two new property funds with assets of approximately $260 million. The liquidation ofproperties may occur over several years until the fund is terminated. See the summary of changes in Level 3 assets andliabilities for gross sales and purchases of properties, within the other assets caption, for the twelve months endedDecember 31, 2015 and 2014.
Fair Value of Assets and LiabilitiesThe Company categorizes its fair value measurements according to a three-level hierarchy. See Note 14 for the definitionof the three levels of the fair value hierarchy.
113

The following tables present the balances of assets and liabilities held by consolidated investment entities measured at fairvalue on a recurring basis:
December 31, 2015
Level 1 Level 2 Level 3 Total
(in millions)Assets
Investments:Corporate debt securities $ — $ 154 $ — $ 154Common stocks 74 46 3 123Other investments 4 22 — 26Syndicated loans — 5,738 529 6,267
Total investments 78 5,960 532 6,570Receivables — 70 — 70Other assets — — 2,065 2,065
Total assets at fair value $ 78 $ 6,030 $ 2,597 $ 8,705
LiabilitiesDebt $ — $ — $ 6,630 $ 6,630Other liabilities — 221 — 221
Total liabilities at fair value $ — $ 221 $ 6,630 $ 6,851
December 31, 2014
Level 1 Level 2 Level 3 Total
(in millions)Assets
Investments:Corporate debt securities $ — $ 171 $ — $ 171Common stocks 130 40 7 177Other investments 4 25 — 29Syndicated loans — 5,287 484 5,771
Total investments 134 5,523 491 6,148Receivables — 49 — 49Other assets — 1 1,935 1,936
Total assets at fair value $ 134 $ 5,573 $ 2,426 $ 8,133
LiabilitiesDebt $ — $ — $ 6,030 $ 6,030Other liabilities — 193 — 193
Total liabilities at fair value $ — $ 193 $ 6,030 $ 6,223
The following tables provide a summary of changes in Level 3 assets and liabilities held by consolidated investment entitiesmeasured at fair value on a recurring basis:
Common Syndicated OtherStocks Loans Assets Debt
(in millions)Balance, January 1, 2015 $ 7 $ 484 $ 1,935 $ (6,030)
Total gains (losses) included in:Net income (1)(1) (24)(1) 170(2) 215(1)
Other comprehensive loss — — (154) —Purchases — 303 638 —Sales — (36) (524) —Issues — — — (1,267)Settlements — (161) — 452Transfers into Level 3 7 776 — —Transfers out of Level 3 (10) (813) — —
Balance, December 31, 2015 $ 3 $ 529 $ 2,065 $ (6,630)
Changes in unrealized gains (losses) included in income relating to assets andliabilities held at December 31, 2015 $ — $ (19)(1) $ 20(2) $ 219(1)
(1) Included in net investment income in the Consolidated Statements of Operations.(2) Included in other revenues in the Consolidated Statements of Operations.
114

CorporateDebt Common Syndicated Other
Securities Stocks Loans Assets Debt
(in millions)Balance, January 1, 2014 $ 2 $ 14 $ 368 $ 1,936 $ (4,804)
Total gains (losses) included in:Net income 1(1) 1(1) 2(1) 421(2) (34)(1)
Other comprehensive income — — — (175) —Purchases 2 — 417 289 —Sales (9) (2) (42) (547) —Issues — — — — (1,670)Settlements — — (100) — 478Transfers into Level 3 10 13 551 11 —Transfers out of Level 3 (6) (19) (712) — —
Balance, December 31, 2014 $ — $ 7 $ 484 $ 1,935 $ (6,030)
Changes in unrealized gains (losses) included in income relatingto assets and liabilities held at December 31, 2014 $ — $ — $ (3)(1) $ 362(2) $ 1(1)
(1) Included in net investment income in the Consolidated Statements of Operations.(2) Included in other revenues in the Consolidated Statements of Operations.
CorporateDebt Common Syndicated Other
Securities Stocks Loans Assets Debt
(in millions)Balance, January 1, 2013 $ 3 $ 14 $ 202 $ 1,214 $ (4,450)
Total gains (losses) included in:Net income — 1(1) (1)(1) 81(2) (53)(1)
Other comprehensive loss — — — 39 —Purchases 1 — 417 689 —Sales (1) (3) (63) (86) —Issues — — — — (1,330)Settlements (1) — (51) — 1,029Transfers into Level 3 — 21 320 8 —Transfers out of Level 3 — (19) (456) (9) —
Balance, December 31, 2013 $ 2 $ 14 $ 368 $ 1,936 $ (4,804)
Changes in unrealized gains (losses) included in income relatingto assets and liabilities held at December 31, 2013 $ — $ (2)(1) $ (2)(1) $ 67(2) $ (25)(1)
(1) Included in net investment income in the Consolidated Statements of Operations.(2) Included in other revenues in the Consolidated Statements of Operations.
Securities and loans transferred from Level 2 to Level 3 represent assets with fair values that are now based on a singlenon-binding broker quote. Securities and loans transferred from Level 3 to Level 2 represent assets with fair values thatare now obtained from a third party pricing service with observable inputs or priced in active markets. During the reportingperiods, there were no transfers between Level 1 and Level 2.
115

The following tables provide a summary of the significant unobservable inputs used in the fair value measurementsdeveloped by the Company or reasonably available to the Company of Level 3 assets and liabilities held by consolidatedinvestment entities:
December 31, 2015
Fair Value Valuation Technique Unobservable Input Range Weighted Average
(in millions)Other assets $ 2,060 Discounted cash flow/ Equivalent yield 2.6% - 11.5% 5.8%
(property funds) market comparablesExpected rental value (per $3 - $159 $ 51
square foot)CLO debt $ 6,630 Discounted cash flow Annual default rate 2.5%
Discount rate 2.0% - 11.8% 3.4%Constant prepayment rate 5.0% - 10.0% 9.9%Loss recovery 36.4% - 63.6% 62.9%
December 31, 2014
Fair Value Valuation Technique Unobservable Input Range Weighted Average
(in millions)Other assets $ 1,935 Discounted cash flow/ Equivalent yield 4.4% - 12.0% 6.5%
(property funds) market comparablesExpected rental value (per $3 - $94 $ 34
square foot)CLO debt $ 6,030 Discounted cash flow Annual default rate 2.5%
Discount rate 1.2% - 8.3% 2.4%Constant prepayment rate 5.0% - 10.0% 9.8%Loss recovery 36.4% - 63.6% 62.7%
Level 3 measurements not included in the tables above are obtained from non-binding broker quotes where unobservableinputs are not reasonably available to the Company.
Sensitivity of Fair Value Measurements to Changes in Unobservable InputsGenerally, a significant increase (decrease) in the expected rental value used in the fair value measurement of propertiesheld by property funds in isolation would result in a significantly higher (lower) fair value measurement and a significantincrease (decrease) in the equivalent yield in isolation would result in a significantly lower (higher) fair value measurement.
Generally, a significant increase (decrease) in the annual default rate and discount rate used in the fair valuemeasurement of the CLO’s debt in isolation would result in a significantly lower (higher) fair value measurement and asignificant increase (decrease) in loss recovery in isolation would result in a significantly higher (lower) fair valuemeasurement. A significant increase (decrease) in the constant prepayment rate in isolation would result in a significantlyhigher (lower) fair value measurement.
Determination of Fair ValueAssetsInvestmentsThe fair value of syndicated loans obtained from third party pricing services with multiple non-binding broker quotes as theunderlying valuation source is classified as Level 2. The fair value of syndicated loans obtained from third party pricingservices with a single non-binding broker quote as the underlying valuation source is classified as Level 3. The underlyinginputs used in non-binding broker quotes are not readily available to the Company.
In consideration of the above, management is responsible for the fair values recorded on the financial statements. Pricesreceived from third party pricing services are subjected to exception reporting that identifies loans with significant dailyprice movements as well as no movements. The Company reviews the exception reporting and resolves the exceptionsthrough reaffirmation of the price or recording an appropriate fair value estimate. The Company also performs subsequenttransaction testing. The Company performs annual due diligence of the third party pricing services. The Company’s duediligence procedures include assessing the vendor’s valuation qualifications, control environment, analysis of asset-classspecific valuation methodologies and understanding of sources of market observable assumptions and unobservableassumptions, if any, employed in the valuation methodology. The Company also considers the results of its exceptionreporting controls and any resulting price challenges that arise.
See Note 14 for a description of the Company’s determination of the fair value of corporate debt securities, U.S.government and agencies obligations, common stocks and other investments.
116

ReceivablesFor receivables of the consolidated CLOs, the carrying value approximates fair value as the nature of these assets hashistorically been short term and the receivables have been collectible. The fair value of these receivables is classified asLevel 2.
Other AssetsOther assets consist primarily of real estate held in property funds managed by Threadneedle. The fair value of theseproperties is calculated by a third party appraisal service by discounting future cash flows generated by the expectedmarket rental value for the property using the equivalent yield of a similar investment property. Inputs used in determiningthe equivalent yield and expected rental value of the property may include: rental cash flows, current occupancy, historicalvacancy rates, tenant history and assumptions regarding how quickly the property can be occupied and at what rentalrates. Management reviews the valuation report and assumptions used to ensure that the valuation was performed inaccordance with applicable independence, appraisal and valuation standards. Given the significance of the unobservableinputs to these measurements, these assets are classified as Level 3.
The CLOs hold an immaterial amount of warrants recorded in other assets. Loans within the CLOs may default and gothrough a restructuring that can result in the CLO receiving warrants for the issuer’s equity securities. Warrants areclassified as Level 2 when the price is derived from observable market data. Warrants from an issuer whose securities arenot priced in active markets are classified as Level 3.
LiabilitiesDebtThe fair value of the CLOs’ debt is determined using a discounted cash flow model. Inputs used to determine the expectedcash flows include assumptions about default, discount, prepayment and recovery rates of the CLOs’ underlying assets.Given the significance of the unobservable inputs to this fair value measurement, the fair value of the CLOs’ debt isclassified as Level 3.
Other LiabilitiesOther liabilities consist primarily of securities purchased but not yet settled held by consolidated CLOs. The carrying valueapproximates fair value as the nature of these liabilities has historically been short term. The fair value of these liabilities isclassified as Level 2.
Fair Value OptionThe Company has elected the fair value option for the financial assets and liabilities of the consolidated CLOs.Management believes that the use of the fair value option better matches the changes in fair value of assets and liabilitiesrelated to the CLOs.
The following table presents the fair value and unpaid principal balance of loans and debt for which the fair value optionhas been elected:
December 31,
2015 2014
(in millions)Syndicated loansUnpaid principal balance $ 6,635 $ 5,871Excess unpaid principal over fair value (368) (100)
Fair value $ 6,267 $ 5,771
Fair value of loans more than 90 days past due $ 24 $ 32Fair value of loans in nonaccrual status 24 32Difference between fair value and unpaid principal of loans more than 90 days past due, loans in nonaccrual
status or both 72 25
DebtUnpaid principal balance $ 7,063 $ 6,248Excess unpaid principal over fair value (433) (218)
Fair value $ 6,630 $ 6,030
Interest income from syndicated loans, bonds and structured investments is recorded based on contractual rates in netinvestment income. Gains and losses related to changes in the fair value of investments and gains and losses on sales of
117

investments are also recorded in net investment income. Interest expense on debt is recorded in interest and debtexpense with gains and losses related to changes in the fair value of debt recorded in net investment income.
Total net gains (losses) recognized in net investment income related to changes in the fair value of financial assets andliabilities for which the fair value option was elected were $(35) million, $(46) million and $28 million for the years endedDecember 31, 2015, 2014 and 2013, respectively. The majority of the syndicated loans and debt have floating rates; assuch, changes in their fair values are primarily attributable to changes in credit spreads.
Debt of the consolidated investment entities and the stated interest rates were as follows:
Carrying Value Weighted Average Interest Rate
December 31, December 31,
2015 2014 2015 2014
(in millions)Debt of consolidated CLOs due 2016-2026 $ 6,630 $ 6,030 1.6% 1.3%Floating rate revolving credit borrowings due 2017-2020 909 837 2.8 2.7
Total $ 7,539 $ 6,867
The debt of the consolidated CLOs has both fixed and floating interest rates, which range from 0% to 9.2%. The interestrates on the debt of CLOs are weighted average rates based on the outstanding principal and contractual interest rates.The carrying value of the debt of the consolidated CLOs represents the fair value of the aggregate debt. The carrying valueof the floating rate revolving credit borrowings represents the outstanding principal amount of debt of certain consolidatedproperty funds. The fair value of this debt was $909 million and $837 million as of December 31, 2015 and 2014,respectively. The property funds have entered into interest rate swaps and collars to manage the interest rate exposure onthe floating rate revolving credit borrowings. The fair value of these derivative instruments is recorded gross and was aliability of $8 million and $10 million at December 31, 2015 and 2014, respectively. The overall interest rate reflecting theimpact of the derivative contracts was 3.2% and 3.1% as of December 31, 2015 and 2014, respectively.
At December 31, 2015, future maturities of debt were as follows:
(in millions)
2016 $ 202017 482018 3792019 1,4422020 702Thereafter 5,381
Total future maturities $ 7,972
5. Investments
The following is a summary of Ameriprise Financial investments:
December 31,
2015 2014
(in millions)Available-for-Sale securities, at fair value $ 28,673 $ 30,027Mortgage loans, net 3,359 3,440Policy and certificate loans 824 806Other investments 1,288 1,309
Total $ 34,144 $ 35,582
118

The following is a summary of net investment income:
Years Ended December 31,
2015 2014 2013
(in millions)Investment income on fixed maturities $ 1,403 $ 1,479 $ 1,575Net realized gains 4 37 7Affordable housing partnerships (18) (25) (12)Other 68 93 99Consolidated investment entities 231 157 220
Total $ 1,688 $ 1,741 $ 1,889
Available-for-Sale securities distributed by type were as follows:
December 31, 2015
Gross GrossAmortized Unrealized Unrealized Noncredit
Description of Securities Cost Gains Losses Fair Value OTTI(1)
(in millions)Corporate debt securities $ 15,750 $ 894 $ (296) $ 16,348 $ 3Residential mortgage backed securities 5,933 106 (66) 5,973 (12)Commercial mortgage backed securities 2,400 70 (14) 2,456 —Asset backed securities 1,273 34 (11) 1,296 —State and municipal obligations 2,105 213 (28) 2,290 —U.S. government and agencies obligations 66 2 — 68 —Foreign government bonds and obligations 218 17 (11) 224 —Common stocks 7 11 — 18 5
Total $ 27,752 $ 1,347 $ (426) $ 28,673 $ (4)
December 31, 2014
Gross GrossAmortized Unrealized Unrealized Noncredit
Description of Securities Cost Gains Losses Fair Value OTTI(1)
(in millions)Corporate debt securities $ 15,742 $ 1,482 $ (59) $ 17,165 $ 3Residential mortgage backed securities 6,099 168 (60) 6,207 (15)Commercial mortgage backed securities 2,513 120 (3) 2,630 —Asset backed securities 1,417 59 (6) 1,470 —State and municipal obligations 2,008 257 (26) 2,239 —U.S. government and agencies obligations 43 4 — 47 —Foreign government bonds and obligations 236 21 (6) 251 —Common stocks 8 10 — 18 5
Total $ 28,066 $ 2,121 $ (160) $ 30,027 $ (7)
(1) Represents the amount of other-than-temporary impairment (‘‘OTTI’’) losses in AOCI. Amount includes unrealized gains and losses onimpaired securities subsequent to the initial impairment measurement date. These amounts are included in gross unrealized gainsand losses as of the end of the period.
As of December 31, 2015 and 2014, investment securities with a fair value of $1.0 billion and $1.3 billion, respectively,were pledged to meet contractual obligations under derivative contracts and short-term borrowings, of which $478 millionand $769 million, respectively, may be sold, pledged or rehypothecated by the counterparty.
At both December 31, 2015 and 2014, fixed maturity securities comprised approximately 84% of Ameriprise Financialinvestments. Rating agency designations are based on the availability of ratings from Nationally Recognized StatisticalRating Organizations (‘‘NRSROs’’), including Moody’s Investors Service (‘‘Moody’s’’), Standard & Poor’s Ratings Services(‘‘S&P’’) and Fitch Ratings Ltd. (‘‘Fitch’’). The Company uses the median of available ratings from Moody’s, S&P and Fitch,or, if fewer than three ratings are available, the lower rating is used. When ratings from Moody’s, S&P and Fitch areunavailable, the Company may utilize ratings from other NRSROs or rate the securities internally. As of December 31,2015 and 2014, the Company’s internal analysts rated $1.3 billion and $1.4 billion, respectively, of securities usingcriteria similar to those used by NRSROs.
119

A summary of fixed maturity securities by rating was as follows:
December 31, 2015 December 31, 2014
Percent of Percent ofAmortized Total Fair Amortized Total Fair
Ratings Cost Fair Value Value Cost Fair Value Value
(in millions, except percentages)AAA $ 7,147 $ 7,289 25% $ 7,500 $ 7,776 26%AA 1,732 1,930 7 1,581 1,799 6A 5,131 5,507 19 6,028 6,668 22BBB 12,052 12,353 43 11,187 12,025 40Below investment grade 1,683 1,576 6 1,762 1,741 6
Total fixed maturities $ 27,745 $ 28,655 100% $ 28,058 $ 30,009 100%
At December 31, 2015 and 2014, approximately 53% and 52%, respectively, of the securities rated AAA were GNMA,FNMA and FHLMC mortgage backed securities. No holdings of any other issuer were greater than 10% of total equity.
The following tables provide information about Available-for-Sale securities with gross unrealized losses and the length oftime that individual securities have been in a continuous unrealized loss position:
December 31, 2015
Less than 12 months 12 months or more Total
Number of Fair Unrealized Number of Fair Unrealized Number of Fair UnrealizedDescription of Securities Securities Value Losses Securities Value Losses Securities Value Losses
(in millions, except number of securities)Corporate debt securities 347 $ 5,150 $ (220) 48 $ 454 $ (76) 395 $ 5,604 $ (296)Residential mortgage
backed securities 123 1,869 (16) 164 1,350 (50) 287 3,219 (66)Commercial mortgage
backed securities 58 695 (13) 4 49 (1) 62 744 (14)Asset backed securities 50 455 (7) 14 254 (4) 64 709 (11)State and municipal
obligations 31 100 (1) 5 110 (27) 36 210 (28)Foreign government bonds
and obligations 9 39 (2) 15 27 (9) 24 66 (11)
Total 618 $ 8,308 $ (259) 250 $ 2,244 $ (167) 868 $ 10,552 $ (426)
December 31, 2014
Less than 12 months 12 months or more Total
Number of Fair Unrealized Number of Fair Unrealized Number of Fair UnrealizedDescription of Securities Securities Value Losses Securities Value Losses Securities Value Losses
(in millions, except number of securities)Corporate debt securities 182 $ 2,165 $ (41) 40 $ 689 $ (18) 222 $ 2,854 $ (59)Residential mortgage
backed securities 73 879 (7) 138 1,387 (53) 211 2,266 (60)Commercial mortgage
backed securities 15 173 — 12 131 (3) 27 304 (3)Asset backed securities 17 201 (2) 14 238 (4) 31 439 (6)State and municipal
obligations 11 29 (1) 10 115 (25) 21 144 (26)Foreign government bonds
and obligations 4 10 (1) 14 27 (5) 18 37 (6)
Total 302 $ 3,457 $ (52) 228 $ 2,587 $ (108) 530 $ 6,044 $ (160)
As part of Ameriprise Financial’s ongoing monitoring process, management determined that the change in gross unrealizedlosses on its Available-for-Sale securities is primarily attributable to a widening of credit spreads.
120

The following table presents a rollforward of the cumulative amounts recognized in the Consolidated Statements ofOperations for other-than-temporary impairments related to credit losses on Available-for-Sale securities for which a portionof the securities’ total other-than-temporary impairments was recognized in other comprehensive income (loss):
December 31,
2015 2014 2013
(in millions)Beginning balance $ 98 $ 147 $ 176Credit losses for which an other-than-temporary impairment was not previously recognized — — 2Credit losses for which an other-than-temporary impairment was previously recognized 2 1 7Reductions for securities sold during the period (realized) (15) (50) (38)
Ending balance $ 85 $ 98 $ 147
Net realized gains and losses on Available-for-Sale securities, determined using the specific identification method,recognized in earnings were as follows:
Years Ended December 31,
2015 2014 2013
(in millions)Gross realized gains $ 33 $ 53 $ 17Gross realized losses (19) (8) (1)Other-than-temporary impairments (8) (6) (9)
Total $ 6 $ 39 $ 7
Other-than-temporary impairments for the years ended December 31, 2015 and 2014 primarily related to credit losses oncorporate debt securities and non-agency residential mortgage backed securities. Other-than-temporary impairments for theyear ended December 31, 2013 primarily related to credit losses on non-agency residential mortgage backed securities.
See Note 18 for a rollforward of net unrealized investment gains (losses) included in AOCI.
Available-for-Sale securities by contractual maturity at December 31, 2015 were as follows:
Amortized Cost Fair Value
(in millions)Due within one year $ 1,485 $ 1,496Due after one year through five years 6,754 7,053Due after five years through 10 years 5,382 5,371Due after 10 years 4,518 5,010
18,139 18,930Residential mortgage backed securities 5,933 5,973Commercial mortgage backed securities 2,400 2,456Asset backed securities 1,273 1,296Common stocks 7 18
Total $ 27,752 $ 28,673
Actual maturities may differ from contractual maturities because issuers may have the right to call or prepay obligations.Residential mortgage backed securities, commercial mortgage backed securities and asset backed securities are not dueat a single maturity date. As such, these securities, as well as common stocks, were not included in the maturitiesdistribution.
6. Financing Receivables
The Company’s financing receivables include commercial mortgage loans, syndicated loans, consumer loans, policy loans,certificate loans and margin loans. See Note 2 for information regarding the Company’s accounting policies related toloans and the allowance for loan losses.
121

Allowance for Loan LossesThe following tables present a rollforward of the allowance for loan losses for the years ended and the ending balance ofthe allowance for loan losses by impairment method:
December 31, December 31, December 31,2015 2014 2013
(in millions)Beginning balance $ 35 $ 37 $ 44
Charge-offs (4) (4) (7)Recoveries — 1 1Provisions 1 1 (1)
Ending balance $ 32 $ 35 $ 37
Individually evaluated for impairment $ 4 $ 9 $ 9Collectively evaluated for impairment 28 26 28
The recorded investment in financing receivables by impairment method was as follows:
December 31, December 31,2015 2014
(in millions)Individually evaluated for impairment $ 34 $ 42Collectively evaluated for impairment 3,910 3,951
Total $ 3,944 $ 3,993
As of December 31, 2015 and 2014, the Company’s recorded investment in financing receivables individually evaluatedfor impairment for which there was no related allowance for loan losses was $21 million and $13 million, respectively.Unearned income, unamortized premiums and discounts, and net unamortized deferred fees and costs are not material tothe Company’s total loan balance.
During the years ended December 31, 2015, 2014 and 2013, the Company purchased $162 million, $227 million and$158 million, respectively, and sold $16 million, $13 million and $3 million, respectively, consisting primarily of syndicatedloans.
The Company has not acquired any loans with deteriorated credit quality as of the acquisition date.
Credit Quality InformationNonperforming loans, which are generally loans 90 days or more past due, were $10 million and $12 million as ofDecember 31, 2015 and 2014, respectively. All other loans were considered to be performing.
Commercial Mortgage LoansThe Company reviews the credit worthiness of the borrower and the performance of the underlying properties in order todetermine the risk of loss on commercial mortgage loans. Based on this review, the commercial mortgage loans areassigned an internal risk rating, which management updates as necessary. Commercial mortgage loans which managementhas assigned its highest risk rating were 1% of total commercial mortgage loans at both December 31, 2015 and 2014.Loans with the highest risk rating represent distressed loans which the Company has identified as impaired or expects tobecome delinquent or enter into foreclosure within the next six months. In addition, the Company reviews theconcentrations of credit risk by region and property type.
122

Concentrations of credit risk of commercial mortgage loans by U.S. region were as follows:
Loans Percentage
December 31, December 31,
2015 2014 2015 2014
(in millions)East North Central $ 211 $ 238 8% 9%East South Central 74 62 3 2Middle Atlantic 210 217 8 8Mountain 248 245 9 9New England 123 140 4 5Pacific 741 694 27 25South Atlantic 782 740 28 27West North Central 229 233 8 9West South Central 137 160 5 6
2,755 2,729 100% 100%
Less: allowance for loan losses 21 25
Total $ 2,734 $ 2,704
Concentrations of credit risk of commercial mortgage loans by property type were as follows:
Loans Percentage
December 31, December 31,
2015 2014 2015 2014
(in millions)Apartments $ 504 $ 500 18% 18%Hotel 35 34 1 1Industrial 459 461 17 17Mixed use 35 45 1 2Office 541 545 20 20Retail 984 988 36 36Other 197 156 7 6
2,755 2,729 100% 100%
Less: allowance for loan losses 21 25
Total $ 2,734 $ 2,704
Syndicated LoansThe recorded investment in syndicated loans at December 31, 2015 and 2014 was $553 million and $511 million,respectively. The Company’s syndicated loan portfolio is diversified across industries and issuers. The primary creditindicator for syndicated loans is whether the loans are performing in accordance with the contractual terms of thesyndication. Total nonperforming syndicated loans at December 31, 2015 and 2014 were $6 million and $4 million,respectively.
Consumer LoansThe recorded investment in consumer loans at December 31, 2015 and 2014 was $636 million and $753 million,respectively. The Company considers the credit worthiness of borrowers (FICO score), collateral characteristics such as LTVand geographic concentration in determining the allowance for loan losses for consumer loans. At a minimum,management updates FICO scores and LTV ratios semiannually.
As of December 31, 2015 and 2014, approximately 4% and 6%, respectively, of consumer loans had FICO scoresbelow 640. At both December 31, 2015 and 2014, approximately 2% of the Company’s residential mortgage loans hadLTV ratios greater than 90%. The Company’s most significant geographic concentration for consumer loans is in Californiarepresenting 37% of the portfolio as of both December 31, 2015 and 2014. No other state represents more than 10% ofthe total consumer loan portfolio.
Troubled Debt RestructuringsThe recorded investment in restructured loans was not material as of December 31, 2015, 2014 and 2013. The troubleddebt restructurings did not have a material impact to the Company’s allowance for loan losses or income recognized forthe years ended December 31, 2015, 2014 and 2013. There are no commitments to lend additional funds to borrowerswhose loans have been restructured.
123

7. Reinsurance
The Company reinsures a portion of the insurance risks associated with its traditional life, DI and LTC insurance productsthrough reinsurance agreements with unaffiliated reinsurance companies. Reinsurance contracts do not relieve theCompany from its primary obligation to policyholders.
The Company generally reinsures 90% of the death benefit liability for new term life insurance policies beginning in 2001and new individual fixed and variable universal life insurance policies beginning in 2002. Policies issued prior to thesedates are not subject to these same reinsurance levels.
However, for IUL policies issued after September 1, 2013 and VUL policies issued after January 1, 2014, the Companygenerally reinsures 50% of the death benefit liability. Similarly, the Company reinsures 50% of the death benefit andmorbidity liabilities related to its universal life product with long term care benefits.
The maximum amount of life insurance risk the Company will retain is $10 million on a single life and $10 million on anyflexible premium survivorship life policy; however, reinsurance agreements are in place such that retaining more than$1.5 million of insurance risk on a single life or a flexible premium survivorship life policy is very unusual. Risk on fixed andvariable universal life policies is reinsured on a yearly renewable term basis. Risk on most term life policies starting in2001 is reinsured on a coinsurance basis, a type of reinsurance in which the reinsurer participates proportionally in allmaterial risks and premiums associated with a policy.
For existing LTC policies, the Company has continued ceding 50% of the risk on a coinsurance basis to subsidiaries ofGenworth Financial, Inc. (‘‘Genworth’’) and retained the remaining risk. For RiverSource Life of NY, this reinsurancearrangement applies for 1996 and later issues only.
Generally, the Company retains at most $5,000 per month of risk per life on DI policies sold on policy forms introduced inmost states in 2007 and reinsures the remainder of the risk on a coinsurance basis with unaffiliated reinsurancecompanies. The Company retains all risk for new claims on DI contracts sold on other policy forms. The Company alsoretains all risk on accidental death benefit claims and substantially all risk associated with waiver of premium provisions.
At December 31, 2015 and 2014, traditional life and UL insurance in force aggregated $196.3 billion and $195.5 billion,respectively, of which $144.2 billion and $143.4 billion were reinsured at the respective year ends. Life insurance in forceis reported on a statutory basis.
The effect of reinsurance on premiums for the Company’s traditional long-duration contracts was as follows:
Years Ended December 31,
2015 2014 2013
(in millions)Direct premiums $ 629 $ 645 $ 650Reinsurance ceded (223) (222) (220)
Net premiums $ 406 $ 423 $ 430
Cost of insurance and administrative charges for non-traditional long-duration products are reflected in other revenues andwere net of reinsurance ceded of $107 million, $94 million and $87 million for the years ended December 31, 2015,2014 and 2013, respectively.
The Company also reinsures a portion of the risks associated with its personal auto, home and umbrella insuranceproducts through three types of reinsurance agreements with unaffiliated reinsurance companies. The Company purchasesreinsurance with a limit of $5 million per loss and the Company retains $750,000 per loss. For 2015, the Company’scatastrophe reinsurance had a limit of $155 million per event and the Company retained $20 million per event. For 2016,the Company’s catastrophe reinsurance has a limit of $180 million per event of which the Company retains $20 millionper event. The Company also cedes 80% of every personal umbrella loss with a limit of $5 million per loss.
124

The effect of reinsurance on premiums for the Company’s short-duration contracts was as follows:
Years Ended December 31,
2015 2014 2013
(in millions)Written premiums
Direct $ 1,093 $ 1,025 $ 900Ceded (19) (17) (16)
Total net written premiums $ 1,074 $ 1,008 $ 884
Earned premiumsDirect $ 1,068 $ 979 $ 868Ceded (19) (17) (16)
Total net earned premiums $ 1,049 $ 962 $ 852
Reinsurance recovered from reinsurers was $295 million, $260 million and $229 million for the years endedDecember 31, 2015, 2014 and 2013, respectively.
Receivables included $2.5 billion and $2.3 billion of reinsurance recoverables as of December 31, 2015 and 2014,respectively, including $1.9 billion and $1.8 billion related to LTC risk ceded to Genworth, respectively. Included inpolicyholder account balances, future policy benefits and claims were $551 million and $575 million related to previouslyassumed reinsurance arrangements as of December 31, 2015 and 2014, respectively.
8. Goodwill and Other Intangible Assets
Goodwill and intangible assets deemed to have indefinite lives are not amortized but are instead subject to impairmenttests. There were no impairments for the years ended December 31, 2015, 2014 and 2013.
The changes in the carrying amount of goodwill reported in the Company’s main operating segments were as follows:
Advice &Wealth Asset
Management Management Annuities Protection Consolidated
(in millions)Balance at January 1, 2014 $ 252 $ 821 $ 46 $ 45 $ 1,164Foreign currency translation — (19) — — (19)Purchase price adjustments — 9 — — 9
Balance at December 31, 2014 252 811 46 45 1,154Foreign currency translation — (15) — — (15)Purchase price adjustments — (2) — — (2)
Balance at December 31, 2015 $ 252 $ 794 $ 46 $ 45 $ 1,137
As of December 31, 2015 and 2014, the carrying amount of indefinite-lived intangible assets included $644 million and$630 million, respectively of investment management contracts. As of both December 31, 2015 and 2014, the carryingamount of indefinite-lived intangible assets included $67 million of trade names. Indefinite-lived intangible assets acquiredduring the year ended December 31, 2015 were $14 million.
Definite-lived intangible assets consisted of the following:
December 31, 2015 December 31, 2014
Gross Net Gross NetCarrying Accumulated Carrying Carrying Accumulated CarryingAmount Amortization Amount Amount Amortization Amount
(in millions)Customer relationships $ 149 $ (106) $ 43 $ 150 $ (97) $ 53Contracts 233 (189) 44 233 (180) 53Other 149 (103) 46 151 (98) 53
Total $ 531 $ (398) $ 133 $ 534 $ (375) $ 159
125

Definite-lived intangible assets acquired during the year ended December 31, 2015 were $9 million with a weightedaverage amortization period of 5 years. The aggregate amortization expense for definite-lived intangible assets during theyears ended December 31, 2015, 2014 and 2013 was $33 million, $40 million and $45 million, respectively. In 2015,2014 and 2013, the Company did not record any impairment charges on definite-lived intangible assets.
Estimated intangible amortization expense as of December 31, 2015 for the next five years is as follows:
(in millions)
2016 $ 262017 222018 212019 182020 13
9. Deferred Acquisition Costs and Deferred Sales Inducement Costs
In the third quarter of the year, management conducts its annual review of insurance and annuity valuation assumptionsrelative to current experience and management expectations. To the extent that expectations change as a result of thisreview, management updates valuation assumptions. The impact for the year ended December 31, 2015 primarilyreflected the difference between the Company’s previously assumed interest rates versus the continued low interest rateenvironment partially offset by improved persistency. The impact for the year ended December 31, 2014 primarily reflectedlower than previously assumed interest rates partially offset by improved persistency and mortality experience and a benefitfrom updating the Company’s variable annuity living benefit withdrawal utilization assumption. The impact for the yearended December 31, 2013 primarily reflected higher than previously assumed interest rates and changes in assumedpolicyholder behavior.
The balances of and changes in DAC were as follows:
2015 2014 2013
(in millions)Balance at January 1 $ 2,608 $ 2,663 $ 2,399Capitalization of acquisition costs 361 336 339Amortization, excluding the impact of valuation assumptions review (348) (360) (285)Amortization, impact of valuation assumptions review (6) (7) 78Impact of change in net unrealized securities losses (gains) 110 (24) 132
Balance at December 31 $ 2,725 $ 2,608 $ 2,663
The balances of and changes in DSIC, which is included in other assets, were as follows:
2015 2014 2013
(in millions)Balance at January 1 $ 362 $ 409 $ 404Capitalization of sales inducement costs 4 5 5Amortization, excluding the impact of valuation assumptions review (52) (51) (48)Amortization, impact of valuation assumptions review 1 (2) 25Impact of change in net unrealized securities losses 20 1 23
Balance at December 31 $ 335 $ 362 $ 409
126

10. Policyholder Account Balances, Future Policy Benefits and Claims andSeparate Account Liabilities
Policyholder account balances, future policy benefits and claims consisted of the following:
December 31,
2015 2014
(in millions)Policyholder account balancesFixed annuities $ 11,239 $ 12,700Variable annuity fixed sub-accounts 4,912 4,860VUL/UL insurance 2,897 2,856IUL insurance 808 534Other life insurance 794 840
Total policyholder account balances 20,650 21,790
Future policy benefitsVariable annuity GMWB 1,057 693Variable annuity GMAB — (41)(1)
Other annuity liabilities 31 115Fixed annuities life contingent liabilities 1,501 1,511EIA 27 29Life, DI and LTC insurance 5,112 5,106VUL/UL and other life insurance additional liabilities 452 437
Total future policy benefits 8,180 7,850
Policy claims and other policyholders’ funds 869 710
Total policyholder account balances, future policy benefits and claims $ 29,699 $ 30,350
(1) Includes the fair value of GMAB embedded derivatives that was a net asset at December 31, 2014 reported as a contra liability.
Fixed AnnuitiesFixed annuities include both deferred and payout contracts. Deferred contracts offer a guaranteed minimum rate of interestand security of the principal invested. Payout contracts guarantee a fixed income payment for life or the term of thecontract. The Company generally invests the proceeds from the annuity contracts in fixed rate securities.
The Company’s EIA product is a single premium deferred fixed annuity. The contract is issued with an initial term of sevenyears and interest earnings are linked to the performance of the S&P 500 Index�. This annuity has a minimum interestrate guarantee of 3% on 90% of the initial premium, adjusted for any surrenders. The Company generally invests theproceeds from the annuity contracts in fixed rate securities and hedges the equity risk with derivative instruments. SeeNote 16 for additional information regarding the Company’s derivative instruments used to hedge the risk related to EIA. In2007, the Company discontinued new sales of EIA.
Variable AnnuitiesPurchasers of variable annuities can select from a variety of investment options and can elect to allocate a portion to afixed account. A vast majority of the premiums received for variable annuity contracts are held in separate accounts wherethe assets are held for the exclusive benefit of those contractholders.
Most of the variable annuity contracts currently issued by the Company contain one or more guaranteed benefits, includingGMWB, GMAB, GMDB and GGU provisions. The Company previously offered contracts with GMIB provisions. See Note 2and Note 11 for additional information regarding the Company’s variable annuity guarantees. The Company does notcurrently hedge its risk under the GGU and GMIB provisions. See Note 14 and Note 16 for additional information regardingthe Company’s derivative instruments used to hedge risks related to GMWB, GMAB and GMDB provisions.
Insurance LiabilitiesVUL/UL is the largest group of insurance policies written by the Company. Purchasers of VUL can select from a variety ofinvestment options and can elect to allocate a portion to a fixed account or a separate account. A vast majority of thepremiums received for VUL policies are held in separate accounts where the assets are held for the exclusive benefit ofthose policyholders.
IUL insurance is similar to UL in many regards, although the rate of credited interest above the minimum guarantee forfunds allocated to an indexed account is linked to the performance of the specific index for the indexed account (subjectto a cap and floor). The Company offers an S&P 500 Index account option and a blended multi-index account option
127

comprised of the S&P 500 Index, the MSCI� EAFE Index and MSCI EM Index. Both options offer two crediting durations,one-year and two-year. The policyholder may allocate all or a portion of the policy value to a fixed or any available indexedaccount.
The Company also offers term life insurance as well as disability products. The Company no longer offers standalone LTCproducts and whole life insurance but has in force policies from prior years.
Insurance liabilities include accumulation values, incurred but not reported claims, obligations for anticipated future claims,unpaid reported claims and claim adjustment expenses.
The balance of insurance liabilities related to unpaid reported claims and claim adjustment expenses for auto and homewas $640 million and $518 million as of December 31, 2015 and 2014, respectively. The balance of insurance liabilitiesrelated to unpaid reported claims and claim adjustment expenses for life, DI and LTC policies was $1.1 billion and$1.0 billion as of December 31, 2015 and 2014, respectively.
The change in the liability for prior year incurred unpaid reported claims and claim adjustment expenses related to autoand home, life, DI and LTC policies was a decrease of $2 million, an increase of $9 million and an increase of $2 millionfor the years 2015, 2014 and 2013, respectively.
• In 2015, there was a $60 million decrease primarily reflecting favorable closed claim trends of DI and LTC policies andfrom an update to assumptions related to life rider benefits partially offset by an increase of $58 million related toelevated frequency and severity experience for auto injury claims for 2014 and prior accident years as well as a moregradual than anticipated improvement of 2014 and prior years existing claims and unfavorable prior year catastrophereserve development associated with 2014 hail storms.
• In 2014, there was a $42 million decrease related to favorable closed claim trends primarily related to DI and LTCpolicies more than offset by a $54 million increase primarily reflecting adverse development in the 2013 and prioraccident years auto liability coverage.
• In 2013, there was a $38 million decrease related to favorable closed claim trends primarily related to DI and LTCpolicies more than offset by a $42 million increase reflecting the unfavorable prior year reserve development for 2009through 2012 auto liability claims and prior year catastrophe reserve development related to Superstorm Sandy.
Portions of the Company’s fixed and variable universal life policies have product features that result in profits followed bylosses from the insurance component of the policy. These profits followed by losses can be generated by the cost structureof the product or secondary guarantees in the policy. The secondary guarantee ensures that, subject to specifiedconditions, the policy will not terminate and will continue to provide a death benefit even if there is insufficient policy valueto cover the monthly deductions and charges.
Threadneedle Investment LiabilitiesThreadneedle provides a range of unitized pooled pension funds, which invest in property, stocks, bonds and cash. Theinvestments are selected by the clients and are based on the level of risk they are willing to assume. All investmentperformance, net of fees, is passed through to the investors. The value of the liabilities represents the fair value of thepooled pension funds.
Separate Account LiabilitiesSeparate account liabilities consisted of the following:
December 31,
2015 2014
(in millions)Variable annuity $ 69,333 $ 72,125VUL insurance 6,637 7,016Other insurance 34 37Threadneedle investment liabilities 4,345 4,078
Total $ 80,349 $ 83,256
11. Variable Annuity and Insurance Guarantees
The majority of the variable annuity contracts offered by the Company contain GMDB provisions. The Company also offersvariable annuities with GGU, GMWB and GMAB provisions. The Company previously offered contracts containing GMIBprovisions. See Note 2 and Note 10 for additional information regarding the Company’s variable annuity guarantees.
128

The GMDB and GGU provisions provide a specified minimum return upon death of the contractholder. The death benefitpayable is the greater of (i) the contract value less any purchase payment credits subject to recapture and less a pro-rataportion of any rider fees, or (ii) the GMDB provisions specified in the contract. The Company has the following primaryGMDB provisions:
• Return of premium — provides purchase payments minus adjusted partial surrenders.
• Reset — provides that the value resets to the account value every sixth contract anniversary minus adjusted partialsurrenders. This provision was often provided in combination with the return of premium provision and is no longeroffered.
• Ratchet — provides that the value ratchets up to the maximum account value at specified anniversary intervals, plussubsequent purchase payments less adjusted partial surrenders.
The variable annuity contracts with GMWB riders typically have account values that are based on an underlying portfolio ofmutual funds, the values of which fluctuate based on fund performance. At issue, the guaranteed amount is equal to theamount deposited but the guarantee may be increased annually to the account value (a ‘‘step-up’’) in the case offavorable market performance or by a benefit credit if the contract includes this provision.
The Company has GMWB riders in force, which contain one or more of the following provisions:
• Withdrawals at a specified rate per year until the amount withdrawn is equal to the guaranteed amount.
• Withdrawals at a specified rate per year for the life of the contractholder (‘‘GMWB for life’’).
• Withdrawals at a specified rate per year for joint contractholders while either is alive.
• Withdrawals based on performance of the contract.
• Withdrawals based on the age withdrawals begin.
• Once withdrawals begin, the contractholder’s funds are moved to one of the three least aggressive asset allocationmodels.
• Credits are applied annually for a specified number of years to increase the guaranteed amount as long as withdrawalshave not been taken.
Variable annuity contractholders age 79 or younger at contract issue can also obtain a principal-back guarantee bypurchasing the optional GMAB rider for an additional charge. The GMAB rider guarantees that, regardless of marketperformance at the end of the 10-year waiting period, the contract value will be no less than the original investment or aspecified percentage of the highest anniversary value, adjusted for withdrawals. If the contract value is less than theguarantee at the end of the 10-year period, a lump sum will be added to the contract value to make the contract valueequal to the guarantee value.
Certain UL policies offered by the Company provide secondary guarantee benefits. The secondary guarantee ensures that,subject to specified conditions, the policy will not terminate and will continue to provide a death benefit even if there isinsufficient policy value to cover the monthly deductions and charges.
129

The following table provides information related to variable annuity guarantees for which the Company has establishedadditional liabilities:
December 31, 2015 December 31, 2014
Contract Weighted Contract WeightedVariable Annuity Total Value in Net Average Total Value in Net AverageGuarantees by Contract Separate Amount Attained Contract Separate Amount AttainedBenefit Type(1) Value Accounts at Risk Age Value Accounts at Risk Age
(in millions, except age)GMDB:
Return of premium $ 54,716 $ 52,871 $ 297 65 $ 55,378 $ 53,565 $ 24 64Five/six-year reset 9,307 6,731 78 65 10,360 7,821 28 64One-year ratchet 6,747 6,379 266 67 7,392 7,006 39 66Five-year ratchet 1,613 1,556 20 63 1,773 1,717 2 63Other 887 869 82 71 959 941 38 70
Total — GMDB $ 73,270 $ 68,406 $ 743 65 $ 75,862 $ 71,050 $ 131 64
GGU death benefit $ 1,056 $ 1,004 $ 113 67 $ 1,072 $ 1,019 $ 123 67GMIB $ 270 $ 251 $ 17 68 $ 343 $ 321 $ 9 67GMWB:
GMWB $ 3,118 $ 3,109 $ 2 69 $ 3,671 $ 3,659 $ 1 68GMWB for life 37,301 37,179 330 66 36,843 36,735 95 65
Total — GMWB $ 40,419 $ 40,288 $ 332 66 $ 40,514 $ 40,394 $ 96 65
GMAB $ 4,018 $ 4,006 $ 31 58 $ 4,247 $ 4,234 $ 2 58(1) Individual variable annuity contracts may have more than one guarantee and therefore may be included in more than one benefit
type. Variable annuity contracts for which the death benefit equals the account value are not shown in this table.
The net amount at risk for GMDB, GGU and GMAB guarantees is defined as the current guaranteed benefit amount inexcess of the current contract value. The net amount at risk for GMIB and GMWB guarantees is defined as the greater ofthe present value of the minimum guaranteed withdrawal payments less the current contract value or zero. The presentvalue is calculated using a discount rate that is consistent with assumptions embedded in the Company’s annuity pricingmodels.
The following table provides information related to insurance guarantees for which the Company has established additionalliabilities:
December 31, 2015 December 31, 2014
Weighted WeightedNet Average Net Average
Amount Attained Amount Attainedat Risk Age at Risk Age
(in millions, except age)UL secondary guarantees $ 6,601 63 $ 6,076 62
The net amount at risk for UL secondary guarantees is defined as the current guaranteed death benefit amount in excessof the current policyholder value.
Changes in additional liabilities (contra liabilities) for variable annuity and insurance guarantees were as follows:
GMDB & GGU GMIB GMWB(1) GMAB(1) UL
(in millions)Balance at January 1, 2013 $ 4 $ 9 $ 799 $ 103 $ 155
Incurred claims 4 (2) (1,182) (165) 67Paid claims (4) (1) — — (16)
Balance at December 31, 2013 4 6 (383) (62) 206Incurred claims 9 1 1,076 21 75Paid claims (4) — — — (18)
Balance at December 31, 2014 9 7 693 (41) 263Incurred claims 10 1 364 41 92Paid claims (5) — — — (23)
Balance at December 31, 2015 $ 14 $ 8 $ 1,057 $ — $ 332
(1) The incurred claims for GMWB and GMAB represent the total change in the liabilities (contra liabilities).
The liabilities for guaranteed benefits are supported by general account assets.
130

The following table summarizes the distribution of separate account balances by asset type for variable annuity contractsproviding guaranteed benefits:
December 31,
2015 2014
(in millions)Mutual funds:
Equity $ 39,806 $ 41,403Bond 23,700 25,060Other 5,241 4,490
Total mutual funds $ 68,747 $ 70,953
No gains or losses were recognized on assets transferred to separate accounts for the years ended December 31, 2015,2014 and 2013.
12. Customer Deposits
Customer deposits consisted of the following:
December 31,
2015 2014
(in millions)Fixed rate certificates $ 4,260 $ 3,597Stock market certificates 553 581Stock market embedded derivative 4 6Other 18 23Less: accrued interest classified in other liabilities (3) (8)
Total investment certificate reserves 4,832 4,199Brokerage deposits 3,802 3,465
Total $ 8,634 $ 7,664
Investment CertificatesThe Company offers fixed rate investment certificates primarily in amounts ranging from $1,000 to $2 million with interestcrediting rate terms ranging from 3 to 36 months. Investment certificates may be purchased either with a lump sumpayment or installment payments. Certificate owners are entitled to receive, at maturity, a definite sum of money.Payments from certificate owners are credited to investment certificate reserves. Investment certificate reserves generallyaccumulate interest at specified percentage rates. Reserves are maintained for advance payments made by certificateowners, accrued interest thereon and for additional credits in excess of minimum guaranteed rates and accrued interestthereon. On certificates allowing for the deduction of a surrender charge, the cash surrender values may be less thanaccumulated investment certificate reserves prior to maturity dates. Cash surrender values on certificates allowing for nosurrender charge are equal to certificate reserves. The Company generally invests the proceeds from investment certificatesin fixed and variable rate securities.
Certain investment certificate products have returns tied to the performance of equity markets. The Company guaranteesthe principal for purchasers who hold the certificate for the full term and purchasers may participate in increases in thestock market based on the S&P 500 Index, up to a maximum return. Purchasers can choose 100% participation in themarket index up to the cap or 25% participation plus fixed interest with a combined total up to the cap. Current first termcertificates have maximum returns of 1.0% to 2.0%. The equity component of these certificates is considered anembedded derivative and is accounted for separately. See Note 16 for additional information about derivative instrumentsused to economically hedge the equity price risk related to the Company’s stock market certificates.
Brokerage DepositsBrokerage deposits are amounts payable to brokerage customers related to free credit balances, funds deposited bycustomers and funds accruing to customers as a result of trades or contracts. The Company pays interest on certaincustomer credit balances and the interest is included in banking and deposit interest expense.
131

13. Debt
The balances and the stated interest rates of outstanding debt of Ameriprise Financial were as follows:
Outstanding Balance Stated Interest Rate
December 31, December 31,
2015 2014 2015 2014
(in millions)Long-term debt:
Senior notes due 2015 $ — $ 358(1) —% 5.7%Senior notes due 2019 322(1) 326(1) 7.3 7.3Senior notes due 2020 782(1) 786(1) 5.3 5.3Senior notes due 2023 750 750 4.0 4.0Senior notes due 2024 548 548 3.7 3.7Junior subordinated notes due 2066 245 294 7.5 7.5Capitalized lease obligations 60(2) —
Total long-term debt 2,707 3,062Short-term borrowings:
Federal Home Loan Bank (‘‘FHLB’’) advances 150 150 0.5 0.3Repurchase agreements 50 50 0.5 0.4
Total short-term borrowings 200 200
Total $ 2,907 $ 3,262
(1) Amounts include adjustments for fair value hedges on the Company’s long-term debt. See Note 16 for information on the Company’sfair value hedges.
(2) In the fourth quarter of 2015, the Company recorded a capital lease that had previously been incorrectly recorded as an operatinglease for the Ameriprise Financial Center. See Note 1 for additional information.
Long-Term DebtThe amounts included in the table above are net of any unamortized discount and premium associated with issuing thesenotes.
In 2015, the Company extinguished $49 million of its junior subordinated notes due 2066 in open market transactionsand recognized a gain of less than $1 million. In November 2015, the Company used cash on hand to fund the repaymentof $350 million of its senior notes.
On September 18, 2014, the Company issued $550 million of unsecured senior notes due October 15, 2024, andincurred debt issuance costs of $5 million. Interest payments are due semi-annually in arrears on April 15 andOctober 15, commencing on April 15, 2015.
In May 2014, the Company issued a notice of redemption for $200 million of its senior notes due 2039. The notes wereredeemed on June 16, 2014 pursuant to the terms of the indenture at the principal value plus accrued interest to theredemption date. The Company recognized an expense for the remaining unamortized debt issuance costs on the notes inthe second quarter of 2014.
On November 13, 2013, the Company issued $150 million of unsecured senior notes due October 15, 2023, andincurred debt issuance costs of $1 million. These notes form part of the series of senior notes due 2023 along with othernotes of this series issued on September 6, 2013. Interest payments are due semi-annually in arrears on April 15 andOctober 15, commencing April 15, 2014.
In October 2013, the Company issued a notice of redemption for $350 million of its senior notes due November 2015.The notes were redeemed pursuant to the terms of the indenture at the principal value plus an aggregate premium andaccrued interest to the redemption date. The redemption date of the notes was November 4, 2013. The Companyrecorded a net pretax loss of $19 million on the redemption of the notes in the fourth quarter of 2013.
On September 6, 2013, the Company issued $600 million of unsecured senior notes due October 15, 2023, and incurreddebt issuance costs of $5 million. Interest payments are due semi-annually in arrears on April 15 and October 15,commencing April 15, 2014.
The Company’s senior notes due 2019, 2020, 2023 and 2024 may be redeemed, in whole or in part, at any time prior tomaturity at a price equal to the greater of the principal amount and the present value of remaining scheduled payments,discounted to the redemption date, plus accrued and unpaid interest.
The Company’s junior subordinated notes due 2066 may be redeemed, in whole or in part, on or after June 1, 2016 at aprice equal to the principal amount plus accrued and compounded interest, provided that if the notes are not redeemed in
132

whole, at least $50 million aggregate principal amount of notes (excluding notes held by the Company) remain outstandingafter the redemption. Otherwise, the Company’s junior subordinated notes due 2066 are redeemable in whole at any time,subject to make whole provisions, which are equal to the principal amount plus the present value of interest paymentsbased on the terms of the note.
The Company’s junior subordinated notes due 2066 and credit facility contain various administrative, reporting, legal andfinancial covenants. The Company was in compliance with all such covenants at both December 31, 2015 and 2014.
At December 31, 2015, future maturities of Ameriprise Financial long-term debt were as follows:
(in millions)
2016 $ 112017 122018 132019 3132020 761Thereafter 1,545
Total future maturities $ 2,655
Short-term BorrowingsThe Company enters into repurchase agreements in exchange for cash, which it accounts for as secured borrowings andhas pledged Available-for-Sale securities to collateralize its obligation under the repurchase agreements. As ofDecember 31, 2015 and 2014, the Company had pledged $30 million and $18 million, respectively, of agency residentialmortgage backed securities and $22 million and $34 million, respectively, of commercial mortgage backed securities. Theremaining maturity of outstanding repurchase agreements was less than one month as of December 31, 2015 and lessthan four months as of December 31, 2014. The stated interest rate of the repurchase agreements is a weighted averageannualized interest rate on repurchase agreements held as of the balance sheet date.
The Company’s life insurance subsidiary is a member of the FHLB of Des Moines which provides access to collateralizedborrowings. The Company has pledged Available-for-Sale securities consisting of commercial mortgage backed securities tocollateralize its obligation under these borrowings. The fair value of the securities pledged is recorded in investments andwas $290 million and $298 million at December 31, 2015 and 2014, respectively. The remaining maturity of outstandingFHLB advances was less than three months as of December 31, 2015 and less than two months as of December 31,2014. The stated interest rate of the FHLB advances is a weighted average annualized interest rate on the outstandingborrowings as of the balance sheet date.
The Company has an unsecured revolving credit facility for up to $500 million that expires in May 2020. Under the termsof the credit agreement, the Company may increase the amount of this facility up to $750 million upon satisfaction ofcertain approval requirements. Available borrowings under the agreement are reduced by any outstanding letters of credit.The Company had no borrowings outstanding under this facility at both December 31, 2015 and 2014 and outstandingletters of credit issued against this facility were $1 million as of December 31, 2015.
14. Fair Values of Assets and Liabilities
GAAP defines fair value as the price that would be received to sell an asset or paid to transfer a liability in an orderlytransaction between market participants at the measurement date; that is, an exit price. The exit price assumes the assetor liability is not exchanged subject to a forced liquidation or distressed sale.
Valuation HierarchyThe Company categorizes its fair value measurements according to a three-level hierarchy. The hierarchy prioritizes theinputs used by the Company’s valuation techniques. A level is assigned to each fair value measurement based on thelowest level input that is significant to the fair value measurement in its entirety. The three levels of the fair value hierarchyare defined as follows:
Level 1 Unadjusted quoted prices for identical assets or liabilities in active markets that are accessible at themeasurement date.
Level 2 Prices or valuations based on observable inputs other than quoted prices in active markets for identical assetsand liabilities.
Level 3 Prices or valuations that require inputs that are both significant to the fair value measurement and unobservable.
133

The following tables present the balances of assets and liabilities of Ameriprise Financial measured at fair value on arecurring basis:
December 31, 2015
Level 1 Level 2 Level 3 Total
(in millions)Assets
Cash equivalents $ 80 $ 1,918 $ — $ 1,998Available-for-Sale securities:
Corporate debt securities — 14,923 1,425 16,348Residential mortgage backed securities — 5,755 218 5,973Commercial mortgage backed securities — 2,453 3 2,456Asset backed securities — 1,134 162 1,296State and municipal obligations — 2,290 — 2,290U.S. government and agencies obligations 33 35 — 68Foreign government bonds and obligations — 224 — 224Common stocks 5 8 5 18
Total Available-for-Sale securities 38 26,822 1,813 28,673Trading securities 6 18 — 24Separate account assets — 80,349 — 80,349Investments segregated for regulatory purposes 401 — — 401Other assets:
Interest rate derivative contracts — 1,940 — 1,940Equity derivative contracts 92 1,495 — 1,587Credit derivative contracts — 2 — 2Foreign exchange derivative contracts 2 54 — 56Other derivative contracts — 2 — 2
Total other assets 94 3,493 — 3,587
Total assets at fair value $ 619 $ 112,600 $ 1,813 $ 115,032
LiabilitiesPolicyholder account balances, future policy benefits and claims:
EIA embedded derivatives $ — $ 5 $ — $ 5IUL embedded derivatives — — 364 364GMWB and GMAB embedded derivatives — — 851 851(1)
Total policyholder account balances, future policy benefits and claims — 5 1,215 1,220(2)
Customer deposits — 4 — 4Other liabilities:
Interest rate derivative contracts — 969 — 969Equity derivative contracts 47 1,946 — 1,993Foreign exchange derivative contracts 2 16 — 18Other derivative contracts — 96 — 96Other 1 12 — 13
Total other liabilities 50 3,039 — 3,089
Total liabilities at fair value $ 50 $ 3,048 $ 1,215 $ 4,313
(1) The fair value of the GMWB and GMAB embedded derivatives included $994 million of individual contracts in a liability position and$143 million of individual contracts in an asset position.
(2) The Company’s adjustment for nonperformance risk resulted in a $398 million cumulative decrease to the embedded derivatives.
134

December 31, 2014
Level 1 Level 2 Level 3 Total
(in millions)Assets
Cash equivalents $ 27 $ 1,930 $ — $ 1,957Available-for-Sale securities:
Corporate debt securities — 15,647 1,518 17,165Residential mortgage backed securities — 6,001 206 6,207Commercial mortgage backed securities — 2,539 91 2,630Asset backed securities — 1,301 169 1,470State and municipal obligations — 2,239 — 2,239U.S. government and agencies obligations 12 35 — 47Foreign government bonds and obligations — 251 — 251Common stocks 5 7 6 18
Total Available-for-Sale securities 17 28,020 1,990 30,027Trading securities 54 28 1 83Separate account assets — 83,256 — 83,256Other assets:
Interest rate derivative contracts — 2,031 — 2,031Equity derivative contracts 282 1,757 — 2,039Foreign exchange derivative contracts 1 29 — 30Other derivative contracts — 1 — 1
Total other assets 283 3,818 — 4,101
Total assets at fair value $ 381 $ 117,052 $ 1,991 $ 119,424
LiabilitiesPolicyholder account balances, future policy benefits and claims:
EIA embedded derivatives $ — $ 6 $ — $ 6IUL embedded derivatives — — 242 242GMWB and GMAB embedded derivatives — — 479 479(1)
Total policyholder account balances, future policy benefits and claims — 6 721 727(2)
Customer deposits — 6 — 6Other liabilities:
Interest rate derivative contracts — 1,136 — 1,136Equity derivative contracts 376 2,326 — 2,702Foreign exchange derivative contracts 1 2 — 3Other derivative contracts — 114 — 114Other — 12 — 12
Total other liabilities 377 3,590 — 3,967
Total liabilities at fair value $ 377 $ 3,602 $ 721 $ 4,700
(1) The fair value of the GMWB and GMAB embedded derivatives included $700 million of individual contracts in a liability position and$221 million of individual contracts in an asset position.
(2) The Company’s adjustment for nonperformance risk resulted in a $311 million cumulative decrease to the embedded derivatives.
135

The following tables provide a summary of changes in Level 3 assets and liabilities of Ameriprise Financial measured at fairvalue on a recurring basis:
Available-for-Sale Securities
Residential CommercialCorporate Mortgage Mortgage Asset
Debt Backed Backed Backed Common TradingSecurities Securities Securities Securities Stocks Total Securities
(in millions)Balance, January 1, 2015 $ 1,518 $ 206 $ 91 $ 169 $ 6 $ 1,990 $ 1
Total gains (losses) included in:Net income (2) — — 1 — (1)(1) (1)(1)
Other comprehensive loss (21) (2) — (2) — (25) —Purchases 189 334 41 72 — 636 —Settlements (248) (55) (7) (22) — (332) —Transfers into Level 3 — — 6 14 — 20 —Transfers out of Level 3 (11) (265) (128) (70) (1) (475) —
Balance, December 31, 2015 $ 1,425 $ 218 $ 3 $ 162 $ 5 $ 1,813 $ —
Changes in unrealized gains (losses) relating toassets held at December 31, 2015 includedin:Net investment income $ (2) $ — $ — $ 1 $ — $ (1) $ —
(1) Included in net investment income in the Consolidated Statements of Operations.
Policyholder Account Balances,Future Policy Benefits and Claims
GMWB andIUL GMAB
Embedded EmbeddedDerivatives Derivatives Total
(in millions)Balance, January 1, 2015 $ 242 $ 479 $ 721
Total losses included in:Net income 27(1) 105(2) 132
Issues 114 271 385Settlements (19) (4) (23)
Balance, December 31, 2015 $ 364 $ 851 $ 1,215
Changes in unrealized losses relating to liabilities held at December 31, 2015 included in:Interest credited to fixed accounts $ 27 $ — $ 27Benefits, claims, losses and settlement expenses — 127 127
(1) Included in interest credited to fixed accounts in the Consolidated Statements of Operations.(2) Included in benefits, claims, losses and settlement expenses in the Consolidated Statements of Operations.
Available-for-Sale Securities
Residential CommercialCorporate Mortgage Mortgage Asset
Debt Backed Backed Backed Common TradingSecurities Securities Securities Securities Stocks Total Securities
(in millions)Balance, January 1, 2014 $ 1,640 $ 187 $ 30 $ 260 $ 6 $ 2,123 $ 2
Total gains (losses) included in:Net income (1) (1) 1 1 — —(1) —Other comprehensive income (2) — (2) 2 (1) (3) —
Purchases 213 399 59 32 1 704 1Sales (18) — — — — (18) (2)Settlements (306) (24) (1) (11) — (342) —Transfers into Level 3 — — 78 — 1 79 —Transfers out of Level 3 (8) (355) (74) (115) (1) (553) —
Balance, December 31, 2014 $ 1,518 $ 206 $ 91 $ 169 $ 6 $ 1,990 $ 1
Changes in unrealized gains (losses) relating toassets held at December 31, 2014 includedin:Net investment income $ (1) $ — $ 1 $ 1 $ — $ 1 $ —
(1) Included in net investment income in the Consolidated Statements of Operations.
136

Policyholder Account Balances,Future Policy Benefits and Claims
GMWB andIUL GMAB
Embedded EmbeddedDerivatives Derivatives Total
(in millions)Balance, January 1, 2014 $ 125 $ (575) $ (450)
Total losses included in:Net income 40(1) 811(2) 851
Issues 90 254 344Settlements (13) (11) (24)
Balance, December 31, 2014 $ 242 $ 479 $ 721
Changes in unrealized losses relating to liabilities held at December 31, 2014 included in:Interest credited to fixed accounts $ 40 $ — $ 40Benefits, claims, losses and settlement expenses — 811 811
(1) Included in interest credited to fixed accounts in the Consolidated Statements of Operations.(2) Included in benefits, claims, losses and settlement expenses in the Consolidated Statements of Operations.
Available-for-Sale Securities
Residential CommercialCorporate Mortgage Mortgage Asset
Debt Backed Backed Backed Common TradingSecurities Securities Securities Securities Stocks Total Securities
(in millions)Balance, January 1, 2013 $ 1,764 $ 284 $ 206 $ 178 $ 6 $ 2,438 $ —
Total gains (losses) included in:Net income (3) — — 2 — (1)(1) —Other comprehensive loss (41) — (6) 9 1 (37) —
Purchases 135 335 25 259 — 754 2Settlements (215) (18) (36) (5) — (274) —Transfers into Level 3 — — — 8 — 8 —Transfers out of Level 3 — (414) (159) (191) (1) (765) —
Balance, December 31, 2013 $ 1,640 $ 187 $ 30 $ 260 $ 6 $ 2,123 $ 2
Changes in unrealized gains (losses) relating toassets held at December 31, 2013 includedin:Net investment income $ (3) $ — $ — $ 2 $ — $ (1) $ —
(1) Included in net investment income in the Consolidated Statements of Operations.
Policyholder Account Balances,Future Policy Benefits and Claims
GMWB andIUL GMAB
Embedded EmbeddedDerivatives Derivatives Total
(in millions)Balance, January 1, 2013 $ 45 $ 833 $ 878
Total (gains) losses included in:Net income 19(1) (1,617)(2) (1,598)
Issues 62 228 290Settlements (1) (19) (20)
Balance, December 31, 2013 $ 125 $ (575) $ (450)
Changes in unrealized gains (losses) relating to liabilities held at December 31, 2013included in:Interest credited to fixed accounts $ 19 $ — $ 19Benefits, claims, losses and settlement expenses — (1,598) (1,598)
(1) Included in interest credited to fixed accounts in the Consolidated Statements of Operations.(2) Included in benefits, claims, losses and settlement expenses in the Consolidated Statements of Operations.
The increase (decrease) to pretax income of the Company’s adjustment for nonperformance risk on the fair value of itsembedded derivatives was $74 million, $124 million and $(168) million, net of DAC, DSIC, unearned revenue amortizationand the reinsurance accrual, for the years ended December 31, 2015, 2014 and 2013, respectively.
137

Securities transferred from Level 3 primarily represent securities with fair values that are now obtained from a third partypricing service with observable inputs. Securities transferred to Level 3 represent securities with fair values that are nowbased on a single non-binding broker quote. The Company recognizes transfers between levels of the fair value hierarchyas of the beginning of the quarter in which each transfer occurred. For assets and liabilities held at the end of thereporting periods that are measured at fair value on a recurring basis, there were no transfers between Level 1 andLevel 2.
The following tables provide a summary of the significant unobservable inputs used in the fair value measurementsdeveloped by the Company or reasonably available to the Company of Level 3 assets and liabilities:
December 31, 2015
Valuation WeightedFair Value Technique Unobservable Input Range Average
(in millions)Corporate debt securities (private placements) $ 1,411 Discounted cash flow Yield/spread to U.S. Treasuries 1.1% - 3.8% 1.6%IUL embedded derivatives $ 364 Discounted cash flow Nonperformance risk(1) 68 bpsGMWB and GMAB embedded derivatives $ 851 Discounted cash flow Utilization of guaranteed withdrawals(2) 0.0% - 75.6%
Surrender rate 0.0% - 59.1%Market volatility(3) 5.4% - 21.5%Nonperformance risk(1) 68 bps
December 31, 2014
Valuation WeightedFair Value Technique Unobservable Input Range Average
(in millions)Corporate debt securities (private placements) $ 1,476 Discounted cash flow Yield/spread to U.S. Treasuries 1.0% - 3.9% 1.5%IUL embedded derivatives $ 242 Discounted cash flow Nonperformance risk(1) 65 bpsGMWB and GMAB embedded derivatives $ 479 Discounted cash flow Utilization of guaranteed withdrawals(2) 0.0% - 51.1%
Surrender rate 0.0% - 59.1%Market volatility(3) 5.2% - 20.9%Nonperformance risk(1) 65 bpsElective contractholder strategy allocations(4) 0.0% - 3.0%
(1) The nonperformance risk is the spread added to the observable interest rates used in the valuation of the embedded derivatives.(2) The utilization of guaranteed withdrawals represents the percentage of contractholders that will begin withdrawing in any given year.(3) Market volatility is implied volatility of fund of funds and managed volatility funds.(4) The elective allocation represents the percentage of contractholders that are assumed to electively switch their investment allocation to a different
allocation model. As the contractholder experience of related elective strategy allocations reached the ultimate expected levels in 2015, the Company isno longer including this input in the fair value measurement effective September 30, 2015.
Level 3 measurements not included in the table above are obtained from non-binding broker quotes where unobservableinputs are not reasonably available to the Company.
Sensitivity of Fair Value Measurements to Changes in Unobservable InputsSignificant increases (decreases) in the yield/spread to U.S. Treasuries used in the fair value measurement of Level 3corporate debt securities in isolation would result in a significantly lower (higher) fair value measurement.
Significant increases (decreases) in nonperformance risk used in the fair value measurement of the IUL embeddedderivatives in isolation would result in a significantly lower (higher) fair value measurement.
Significant increases (decreases) in utilization and volatility used in the fair value measurement of the GMWB and GMABembedded derivatives in isolation would result in a significantly higher (lower) liability value. Significant increases(decreases) in nonperformance risk and surrender rate used in the fair value measurement of the GMWB and GMABembedded derivatives in isolation would result in a significantly lower (higher) liability value. Utilization of guaranteedwithdrawals and surrender rates vary with the type of rider, the duration of the policy, the age of the contractholder, thedistribution system and whether the value of the guaranteed benefit exceeds the contract accumulation value.
Determination of Fair ValueThe Company uses valuation techniques consistent with the market and income approaches to measure the fair value ofits assets and liabilities. The Company’s market approach uses prices and other relevant information generated by markettransactions involving identical or comparable assets or liabilities. The Company’s income approach uses valuationtechniques to convert future projected cash flows to a single discounted present value amount. When applying eitherapproach, the Company maximizes the use of observable inputs and minimizes the use of unobservable inputs.
The following is a description of the valuation techniques used to measure fair value and the general classification of theseinstruments pursuant to the fair value hierarchy.
138

Assets
Cash EquivalentsCash equivalents include highly liquid investments with original maturities of 90 days or less. Actively traded money marketfunds are measured at their NAV and classified as Level 1. The Company’s remaining cash equivalents are classified asLevel 2 and measured at amortized cost, which is a reasonable estimate of fair value because of the short time betweenthe purchase of the instrument and its expected realization.
Investments (Available-for-Sale Securities and Trading Securities)When available, the fair value of securities is based on quoted prices in active markets. If quoted prices are not available,fair values are obtained from third party pricing services, non-binding broker quotes, or other model-based valuationtechniques. Level 1 securities primarily include U.S. Treasuries. Level 2 securities primarily include corporate bonds,residential mortgage backed securities, commercial mortgage backed securities, asset backed securities, state andmunicipal obligations and U.S. agency and foreign government securities. The fair value of these Level 2 securities isbased on a market approach with prices obtained from third party pricing services. Observable inputs used to value thesesecurities can include, but are not limited to, reported trades, benchmark yields, issuer spreads and non-binding brokerquotes. Level 3 securities primarily include certain corporate bonds, non-agency residential mortgage backed securities,commercial mortgage backed securities and asset backed securities. The fair value of corporate bonds, non-agencyresidential mortgage backed securities, commercial mortgage backed securities and certain asset backed securitiesclassified as Level 3 is typically based on a single non-binding broker quote. The underlying inputs used for some of thenon-binding broker quotes are not readily available to the Company. The Company’s privately placed corporate bonds aretypically based on a single non-binding broker quote. In addition to the general pricing controls, the Company reviews thebroker prices to ensure that the broker quotes are reasonable and, when available, compares prices of privately issuedsecurities to public issues from the same issuer to ensure that the implicit illiquidity premium applied to the privatelyplaced investment is reasonable considering investment characteristics, maturity, and average life of the investment.
In consideration of the above, management is responsible for the fair values recorded on the financial statements. Pricesreceived from third party pricing services are subjected to exception reporting that identifies investments with significantdaily price movements as well as no movements. The Company reviews the exception reporting and resolves theexceptions through reaffirmation of the price or recording an appropriate fair value estimate. The Company also performssubsequent transaction testing. The Company performs annual due diligence of third party pricing services. The Company’sdue diligence procedures include assessing the vendor’s valuation qualifications, control environment, analysis of asset-class specific valuation methodologies, and understanding of sources of market observable assumptions and unobservableassumptions, if any, employed in the valuation methodology. The Company also considers the results of its exceptionreporting controls and any resulting price challenges that arise.
Separate Account AssetsThe fair value of assets held by separate accounts is determined by the NAV of the funds in which those separateaccounts are invested. The NAV represents the exit price for the separate account. Separate account assets are classifiedas Level 2 as they are traded in principal-to-principal markets with little publicly released pricing information.
Investments Segregated for Regulatory PurposesInvestments segregated for regulatory purposes includes U.S. Treasuries that are classified as Level 1.
Other AssetsDerivatives that are measured using quoted prices in active markets, such as foreign currency forwards, or derivatives thatare exchange-traded are classified as Level 1 measurements. The variation margin on futures contracts is also classified asLevel 1. The fair value of derivatives that are traded in less active over-the-counter (‘‘OTC’’) markets is generally measuredusing pricing models with market observable inputs such as interest rates and equity index levels. These measurements areclassified as Level 2 within the fair value hierarchy and include swaps and the majority of options. Other derivativecontracts consist of the Company’s macro hedge program. See Note 16 for further information on the macro hedgeprogram. The counterparties’ nonperformance risk associated with uncollateralized derivative assets was immaterial atDecember 31, 2015 and 2014. See Note 15 and Note 16 for further information on the credit risk of derivativeinstruments and related collateral.
139

Liabilities
Policyholder Account Balances, Future Policy Benefits and ClaimsThe Company values the embedded derivatives attributable to the provisions of certain variable annuity riders using internalvaluation models. These models calculate fair value by discounting expected cash flows from benefits plus margins forprofit, risk and expenses less embedded derivative fees. The projected cash flows used by these models include observablecapital market assumptions and incorporate significant unobservable inputs related to contractholder behavior assumptions,implied volatility, and margins for risk, profit and expenses that the Company believes an exit market participant wouldexpect. The fair value also reflects a current estimate of the Company’s nonperformance risk specific to these embeddedderivatives. Given the significant unobservable inputs to this valuation, these measurements are classified as Level 3. Theembedded derivatives attributable to these provisions are recorded in policyholder account balances, future policy benefitsand claims.
The Company uses various Black-Scholes calculations to determine the fair value of the embedded derivatives associatedwith the provisions of its EIA and IUL products. Significant inputs to the EIA calculation include observable interest rates,volatilities and equity index levels and, therefore, are classified as Level 2. The fair value of the IUL embedded derivativesincludes significant observable interest rates, volatilities and equity index levels and the significant unobservable estimateof the Company’s nonperformance risk. Given the significance of the nonperformance risk assumption to the fair value, theIUL embedded derivatives are classified as Level 3. The embedded derivatives attributable to these provisions are recordedin policyholder account balances, future policy benefits and claims.
The Company’s Corporate Actuarial Department calculates the fair value of the embedded derivatives on a monthly basis.During this process, control checks are performed to validate the completeness of the data. Actuarial managementapproves various components of the valuation along with the final results. The change in the fair value of the embeddedderivatives is reviewed monthly with senior management. The Level 3 inputs into the valuation are consistent with thepricing assumptions and updated as experience develops. Significant unobservable inputs that reflect policyholder behaviorare reviewed quarterly along with other valuation assumptions.
Customer DepositsThe Company uses various Black-Scholes calculations to determine the fair value of the embedded derivative liabilityassociated with the provisions of its stock market certificates. The inputs to these calculations are primarily marketobservable and include interest rates, volatilities and equity index levels. As a result, these measurements are classified asLevel 2.
Other LiabilitiesDerivatives that are measured using quoted prices in active markets, such as foreign currency forwards, or derivatives thatare exchange-traded, are classified as Level 1 measurements. The variation margin on futures contracts is also classifiedas Level 1. The fair value of derivatives that are traded in less active OTC markets are generally measured using pricingmodels with market observable inputs such as interest rates and equity index levels. These measurements are classified asLevel 2 within the fair value hierarchy and include swaps and the majority of options. Other derivative contracts consist ofthe Company’s macro hedge program. See Note 16 for further information on the macro hedge program. The Company’snonperformance risk associated with uncollateralized derivative liabilities was immaterial at December 31, 2015 and 2014.See Note 15 and Note 16 for further information on the credit risk of derivative instruments and related collateral.
Securities sold but not yet purchased include highly liquid investments which are short-term in nature. Securities sold butnot yet purchased are measured using amortized cost, which is a reasonable estimate of fair value because of the shorttime between the purchase of the instrument and its expected realization and are classified as Level 2.
During the reporting periods, there were no material assets or liabilities measured at fair value on a nonrecurring basis.
140

The following tables provide the carrying value and the estimated fair value of financial instruments that are not reported atfair value. All other financial instruments that are reported at fair value have been included above in the table withbalances of assets and liabilities Ameriprise Financial measured at fair value on a recurring basis.
December 31, 2015
Fair ValueCarryingValue Level 1 Level 2 Level 3 Total
(in millions)Financial Assets
Mortgage loans, net $ 3,359 $ — $ — $ 3,372 $ 3,372Policy and certificate loans 824 — 1 803 804Receivables 1,471 148 1,322 3 1,473Restricted and segregated cash 2,548 2,548 — — 2,548Other investments and assets 583 1 510 54 565
Financial LiabilitiesPolicyholder account balances, future policy benefits and
claims $ 11,523 $ — $ — $ 12,424 $ 12,424Investment certificate reserves 4,831 — — 4,823 4,823Brokerage customer deposits 3,802 3,802 — — 3,802Separate account liabilities 4,704 — 4,704 — 4,704Debt and other liabilities 3,173 202 2,958 113 3,273
December 31, 2014
Fair ValueCarryingValue Level 1 Level 2 Level 3 Total
(in millions)Financial Assets
Mortgage loans, net $ 3,440 $ — $ — $ 3,512 $ 3,512Policy and certificate loans 806 — 1 793 794Receivables 1,418 215 1,200 3 1,418Restricted and segregated cash 2,614 2,614 — — 2,614Other investments and assets 551 — 460 84 544
Financial LiabilitiesPolicyholder account balances, future policy benefits and
claims $ 12,979 $ — $ — $ 13,996 $ 13,996Investment certificate reserves 4,201 — — 4,195 4,195Brokerage customer deposits 3,465 3,465 — — 3,465Separate account liabilities 4,478 — 4,478 — 4,478Debt and other liabilities 3,576 261 3,446 121 3,828
Mortgage Loans, NetThe fair value of commercial mortgage loans, except those with significant credit deterioration, is determined bydiscounting contractual cash flows using discount rates that reflect current pricing for loans with similar remainingmaturities, liquidity and characteristics including LTV ratio, occupancy rate, refinance risk, debt service coverage, location,and property condition. For commercial mortgage loans with significant credit deterioration, fair value is determined usingthe same adjustments as above with an additional adjustment for the Company’s estimate of the amount recoverable onthe loan. Given the significant unobservable inputs to the valuation of commercial mortgage loans, these measurementsare classified as Level 3.
The fair value of consumer loans is determined by discounting estimated cash flows and incorporating adjustments forprepayment, administration expenses, loss severity, liquidity and credit loss estimates, with discount rates based on theCompany’s estimate of current market conditions. The fair value of consumer loans is classified as Level 3 as the valuationincludes significant unobservable inputs.
Policy and Certificate LoansPolicy loans represent loans made against the cash surrender value of the underlying life insurance or annuity product.These loans and the related interest are usually realized at death of the policyholder or contractholder or at surrender ofthe contract and are not transferable without the underlying insurance or annuity contract. The fair value of policy loans isdetermined by estimating expected cash flows discounted at rates based on the U.S. Treasury curve. Policy loans areclassified as Level 3 as the discount rate used may be adjusted for the underlying performance of individual policies.
Certificate loans represent loans made against and collateralized by the underlying certificate balance. These loans do nottransfer to third parties separate from the underlying certificate. The outstanding balance of these loans is considered areasonable estimate of fair value and is classified as Level 2.
141

ReceivablesBrokerage margin loans are measured at outstanding balances, which are a reasonable estimate of fair value because ofthe sufficiency of the collateral and short term nature of these loans. Margin loans that are sufficiently collateralized areclassified as Level 2. Margin loans that are not sufficiently collateralized are classified as Level 3.
Securities borrowed require the Company to deposit cash or collateral with the lender. As the market value of the securitiesborrowed is monitored daily, the carrying value is a reasonable estimate of fair value. The fair value of securities borrowedis classified as Level 1 as the value of the underlying securities is based on unadjusted prices for identical assets.
Restricted and Segregated CashRestricted and segregated cash is generally set aside for specific business transactions and restrictions are specific to theCompany and do not transfer to third party market participants; therefore, the carrying amount is a reasonable estimate offair value.
Amounts segregated under federal and other regulations may also reflect resale agreements and are measured at the priceat which the securities will be sold. This measurement is a reasonable estimate of fair value because of the short timebetween entering into the transaction and its expected realization and the reduced risk of credit loss due to pledging U.S.government-backed securities as collateral.
The fair value of restricted and segregated cash is classified as Level 1.
Other Investments and AssetsOther investments and assets primarily consist of syndicated loans. The fair value of syndicated loans is obtained from athird party pricing service or non-binding broker quotes. Syndicated loans that are priced using a market approach withobservable inputs are classified as Level 2 and syndicated loans priced using a single non-binding broker quote areclassified as Level 3.
Other investments and assets also include the Company’s membership in the FHLB and investments related to theCommunity Reinvestment Act. The fair value of these assets is approximated by the carrying value and classified as Level 3due to restrictions on transfer and lack of liquidity in the primary market for these assets.
Policyholder Account Balances, Future Policy Benefits and ClaimsThe fair value of fixed annuities in deferral status is determined by discounting cash flows using a risk neutral discount ratewith adjustments for profit margin, expense margin, early policy surrender behavior, a margin for adverse deviation fromestimated early policy surrender behavior and the Company’s nonperformance risk specific to these liabilities. The fair valueof non-life contingent fixed annuities in payout status, EIA host contracts and the fixed portion of a small number ofvariable annuity contracts classified as investment contracts is determined in a similar manner. Given the use of significantunobservable inputs to these valuations, the measurements are classified as Level 3.
Investment Certificate ReservesThe fair value of investment certificate reserves is determined by discounting cash flows using discount rates that reflectcurrent pricing for assets with similar terms and characteristics, with adjustments for early withdrawal behavior, penaltyfees, expense margin and the Company’s nonperformance risk specific to these liabilities. Given the use of significantunobservable inputs to this valuation, the measurement is classified as Level 3.
Brokerage Customer DepositsBrokerage customer deposits are liabilities with no defined maturities and fair value is the amount payable on demand atthe reporting date. The fair value of these deposits is classified as Level 1.
Separate Account LiabilitiesCertain separate account liabilities are classified as investment contracts and are carried at an amount equal to the relatedseparate account assets. The NAV of the related separate account assets represents the exit price for the separateaccount liabilities. Separate account liabilities are classified as Level 2 as they are traded in principal-to-principal marketswith little publicly released pricing information. A nonperformance adjustment is not included as the related separateaccount assets act as collateral for these liabilities and minimize nonperformance risk.
Debt and Other LiabilitiesThe fair value of long-term debt is based on quoted prices in active markets, when available. If quoted prices are notavailable, fair values are obtained from third party pricing services, broker quotes, or other model-based valuationtechniques such as present value of cash flows. The fair value of long-term debt is classified as Level 2.
142

The fair value of short-term borrowings is obtained from a third party pricing service. A nonperformance adjustment is notincluded as collateral requirements for these borrowings minimize the nonperformance risk. The fair value of short-termborrowings is classified as Level 2.
The fair value of future funding commitments to affordable housing partnerships is determined by discounting cash flows.The fair value of these commitments includes an adjustment for the Company’s nonperformance risk and is classified asLevel 3 due to the use of the significant unobservable input.
Securities loaned require the borrower to deposit cash or collateral with the Company. As the market value of the securitiesloaned is monitored daily, the carrying value is a reasonable estimate of fair value. Securities loaned are classified asLevel 1 as the fair value of the underlying securities is based on unadjusted prices for identical assets.
15. Offsetting Assets and Liabilities
Certain financial instruments and derivative instruments are eligible for offset in the Consolidated Balance Sheets. TheCompany’s derivative instruments, repurchase agreements and securities borrowing and lending agreements are subject tomaster netting arrangements and collateral arrangements and qualify for offset. A master netting arrangement with acounterparty creates a right of offset for amounts due to and from that same counterparty that is enforceable in the eventof a default or bankruptcy. Securities borrowed and loaned result from transactions between the Company’s broker dealersubsidiary and other financial institutions and are recorded at the amount of cash collateral advanced or received.Securities borrowed and securities loaned are primarily equity securities. The Company’s securities borrowed and securitiesloaned transactions generally do not have a fixed maturity date and may be terminated by either party under customaryterms.
The Company’s policy is to recognize amounts subject to master netting arrangements on a gross basis in the ConsolidatedBalance Sheets.
The following tables present the gross and net information about the Company’s assets subject to master nettingarrangements:
December 31, 2015
Gross Amounts Not Offset in theGross Gross Amounts Amounts of AssetsConsolidated Balance SheetsAmounts of Offset in the Presented in the
Recognized Consolidated Consolidated Financial Cash Securities NetAssets Balance Sheets Balance Sheets Instruments(1) Collateral Collateral Amount
(in millions)Derivatives:
OTC $ 3,129 $ — $ 3,129 $ (2,331) $ (391) $ (320) $ 87OTC cleared 418 — 418 (314) (102) — 2Exchange-traded 40 — 40 (3) — — 37
Total derivatives 3,587 — 3,587 (2,648) (493) (320) 126Securities borrowed 148 — 148 (30) — (115) 3
Total $ 3,735 $ — $ 3,735 $ (2,678) $ (493) $ (435) $ 129
December 31, 2014
Gross Amounts Not Offset in theGross Gross Amounts Amounts of AssetsConsolidated Balance SheetsAmounts of Offset in the Presented in the
Recognized Consolidated Consolidated Financial Cash Securities NetAssets Balance Sheets Balance Sheets Instruments(1) Collateral Collateral Amount
(in millions)Derivatives:
OTC $ 3,735 $ — $ 3,735 $ (3,000) $ (281) $ (418) $ 36OTC cleared 305 — 305 (224) (81) — —Exchange-traded 61 — 61 — — — 61
Total derivatives 4,101 — 4,101 (3,224) (362) (418) 97Securities borrowed 215 — 215 (49) — (163) 3
Total $ 4,316 $ — $ 4,316 $ (3,273) $ (362) $ (581) $ 100
(1) Represents the amount of assets that could be offset by liabilities with the same counterparty under master netting or similararrangements that management elects not to offset on the Consolidated Balance Sheets.
143

The following tables present the gross and net information about the Company’s liabilities subject to master nettingarrangements:
December 31, 2015
Gross Amounts Not Offset in theGross Gross Amounts Amounts of LiabilitiesConsolidated Balance SheetsAmounts of Offset in the Presented in the
Recognized Consolidated Consolidated Financial Cash Securities NetLiabilities Balance Sheets Balance Sheets Instruments(1) Collateral Collateral Amount
(in millions)Derivatives:
OTC $ 2,725 $ — $ 2,725 $ (2,331) $ — $ (393) $ 1OTC cleared 345 — 345 (314) (25) — 6Exchange-traded 6 — 6 (3) (1) — 2
Total derivatives 3,076 — 3,076 (2,648) (26) (393) 9Securities loaned 203 — 203 (30) — (164) 9Repurchase agreements 50 — 50 — — (50) —
Total $ 3,329 $ — $ 3,329 $ (2,678) $ (26) $ (607) $ 18
December 31, 2014
Gross Amounts Not Offset in theGross Gross Amounts Amounts of LiabilitiesConsolidated Balance SheetsAmounts of Offset in the Presented in the
Recognized Consolidated Consolidated Financial Cash Securities NetLiabilities Balance Sheets Balance Sheets Instruments(1) Collateral Collateral Amount
(in millions)Derivatives:
OTC $ 3,723 $ — $ 3,723 $ (3,000) $ — $ (723) $ —OTC cleared 232 — 232 (224) (8) — —
Total derivatives 3,955 — 3,955 (3,224) (8) (723) —Securities loaned 261 — 261 (49) — (205) 7Repurchase agreements 50 — 50 — — (50) —
Total $ 4,266 $ — $ 4,266 $ (3,273) $ (8) $ (978) $ 7
(1) Represents the amount of liabilities that could be offset by assets with the same counterparty under master netting or similararrangements that management elects not to offset on the Consolidated Balance Sheets.
In the tables above, the amounts of assets or liabilities presented in the Consolidated Balance Sheets are offset first byfinancial instruments that have the right of offset under master netting or similar arrangements, then any remainingamount is reduced by the amount of cash and securities collateral. The actual collateral may be greater than amountspresented in the tables.
When the fair value of collateral accepted by the Company is less than the amount due to the Company, there is a risk ofloss if the counterparty fails to perform or provide additional collateral. To mitigate this risk, the Company monitorscollateral values regularly and requires additional collateral when necessary. When the value of collateral pledged by theCompany declines, the Company may be required to post additional collateral.
The Company’s freestanding derivative instruments are reflected in other assets and other liabilities. Repurchaseagreements are reflected in short-term borrowings. Securities borrowing and lending agreements are reflected inreceivables and other liabilities, respectively. See Note 16 for additional disclosures related to the Company’s derivativeinstruments, Note 13 for additional disclosures related to the Company’s repurchase agreements and Note 4 forinformation related to derivatives held by consolidated investment entities.
16. Derivatives and Hedging Activities
Derivative instruments enable the Company to manage its exposure to various market risks. The value of such instrumentsis derived from an underlying variable or multiple variables, including equity, foreign exchange and interest rate indices orprices. The Company primarily enters into derivative agreements for risk management purposes related to the Company’sproducts and operations.
The Company’s freestanding derivative instruments are all subject to master netting arrangements. The Company’s policyon the recognition of derivatives on the Consolidated Balance Sheets is to not offset fair value amounts recognized forderivatives and collateral arrangements executed with the same counterparty under the same master netting arrangement.
144

See Note 15 for additional information regarding the estimated fair value of the Company’s freestanding derivatives afterconsidering the effect of master netting arrangements and collateral.
The Company uses derivatives as economic hedges and accounting hedges. The following table presents the notional valueand gross fair value of derivative instruments, including embedded derivatives:
December 31, 2015 December 31, 2014
Gross Fair Value Gross Fair Value
Notional Assets(1) Liabilities(2)(3) Notional Assets(1) Liabilities(2)(3)
(in millions)Derivatives designated as hedging
instrumentsInterest rate contracts $ 675 $ 58 $ — $ 1,025 $ 76 $ —
Total qualifying hedges 675 58 — 1,025 76 —
Derivatives not designated as hedginginstrumentsInterest rate contracts 63,798 1,882 969 61,849 1,955 1,136Equity contracts 70,238 1,587 1,993 69,805 2,039 2,702Credit contracts 600 2 — 616 — —Foreign exchange contracts 4,408 56 18 2,029 30 3Other contracts 3,760 2 96 2,744 1 114
Total non-designated hedges 142,804 3,529 3,076 137,043 4,025 3,955
Embedded derivativesGMWB and GMAB(4) N/A — 851 N/A — 479IUL N/A — 364 N/A — 242EIA N/A — 5 N/A — 6SMC N/A — 4 N/A — 6
Total embedded derivatives N/A — 1,224 N/A — 733
Total derivatives $ 143,479 $ 3,587 $ 4,300 $ 138,068 $ 4,101 $ 4,688
N/A Not applicable. (1) The fair value of freestanding derivative assets is included in Other assets on the Consolidated Balance Sheets.(2) The fair value of freestanding derivative liabilities is included in Other liabilities on the Consolidated Balance Sheets. The fair value of
GMWB and GMAB, IUL, and EIA embedded derivatives is included in Policyholder account balances, future policy benefits and claimson the Consolidated Balance Sheets. The fair value of the SMC embedded derivative liability is included in Customer deposits on theConsolidated Balance Sheets.
(3) The fair value of the Company’s derivative liabilities after considering the effects of master netting arrangements, cash collateral heldby the same counterparty and the fair value of net embedded derivatives was $1.6 billion and $1.5 billion at December 31, 2015and 2014, respectively. See Note 15 for additional information related to master netting arrangements and cash collateral. SeeNote 4 for information about derivatives held by consolidated VIEs.
(4) The fair value of the GMWB and GMAB embedded derivatives at December 31, 2015 included $994 million of individual contracts ina liability position and $143 million of individual contracts in an asset position. The fair value of the GMWB and GMAB embeddedderivatives at December 31, 2014 included $700 million of individual contracts in a liability position and $221 million of individualcontracts in an asset position.
See Note 14 for additional information regarding the Company’s fair value measurement of derivative instruments.
At December 31, 2015 and 2014, investment securities with a fair value of $323 million and $435 million, respectively,were received as collateral to meet contractual obligations under derivative contracts, of which $193 million and$151 million, respectively, may be sold, pledged or rehypothecated by the Company. At December 31, 2015 and 2014,the Company had not sold, pledged or rehypothecated any securities that were accepted as collateral. In addition, atDecember 31, 2015 and 2014, non-cash collateral accepted was held in separate custodial accounts and was notincluded in the Company’s Consolidated Balance Sheets.
145

Derivatives Not Designated as HedgesThe following table presents a summary of the impact of derivatives not designated as hedging instruments on theConsolidated Statements of Operations:
Benefits,Banking and Interest Claims,
Net Deposit Credited to Losses and General andInvestment Interest Distribution Fixed Settlement Administrative
Income Expense Expenses Accounts Expenses Expense
(in millions)Year Ended December 31, 2015
Interest rate contracts $ (21) $ — $ — $ — $ 241 $ —Equity contracts — — 1 (10) (304) 2Credit contracts — — — — (1) —Foreign exchange contracts 4 — (1) — 13 (2)Other contracts 1 — — — (27) —GMWB and GMAB embedded derivatives — — — — (372) —IUL embedded derivatives — — — (8) — —EIA embedded derivatives — — — 1 — —SMC embedded derivatives — — — — — —
Total loss $ (16) $ — $ — $ (17) $ (450) $ —
Year Ended December 31, 2014Interest rate contracts $ 1 $ — $ — $ — $ 1,122 $ —Equity contracts (4) 3 13 21 (304) 4Credit contracts — — — — (33) —Foreign exchange contracts 2 — (5) — (9) (1)Other contracts — — — — (12) —GMWB and GMAB embedded derivatives — — — — (1,054) —IUL embedded derivatives — — — (27) — —EIA embedded derivatives — — — (2) — —SMC embedded derivatives — (3) — — — —
Total gain (loss) $ (1) $ — $ 8 $ (8) $ (290) $ 3
Year Ended December 31, 2013Interest rate contracts $ 2 $ — $ — $ — $ (742) $ —Equity contracts (17) 7 9 14 (1,084) 5Credit contracts — — — — 6 —Foreign exchange contracts (2) — — — 26 —Other contracts 1 — — — (42) —GMWB and GMAB embedded derivatives — — — — 1,408 —IUL embedded derivatives — — — (16) — —EIA embedded derivatives — — — (3) — —SMC embedded derivatives — (6) — — — —
Total gain (loss) $ (16) $ 1 $ 9 $ (5) $ (428) $ 5
The Company holds derivative instruments that either do not qualify or are not designated for hedge accounting treatment.These derivative instruments are used as economic hedges of equity, interest rate, credit and foreign currency exchangerate risk related to various products and transactions of the Company.
Certain annuity contracts contain GMWB or GMAB provisions, which guarantee the right to make limited partial withdrawalseach contract year regardless of the volatility inherent in the underlying investments or guarantee a minimum accumulationvalue of consideration received at the beginning of the contract period, after a specified holding period, respectively. TheGMAB and non-life contingent GMWB provisions are considered embedded derivatives, which are bifurcated from their hostcontracts for valuation purposes and reported on the Consolidated Balance Sheets at fair value with changes in fair valuereported in earnings. The Company economically hedges the exposure related to GMAB and non-life contingent GMWBprovisions primarily using futures, options, interest rate swaptions, interest rate swaps, total return swaps and varianceswaps.
146

The deferred premium associated with certain of the above options is paid or received semi-annually over the life of theoption contract or at maturity. The following is a summary of the payments the Company is scheduled to make and receivefor these options:
Premiums Payable Premiums Receivable
(in millions)2016 $ 331 $ 762017 273 762018 221 1262019 264 1282020 198 592021-2027 633 176
Total $ 1,920 $ 641
Actual timing and payment amounts may differ due to future contract settlements, modifications or exercises of optionsprior to the full premium being paid or received.
The Company has a macro hedge program to provide protection against the statutory tail scenario risk arising from variableannuity reserves on its statutory surplus and to cover some of the residual risks not covered by other hedging activities. Asa means of economically hedging these risks, the Company uses a combination of options and/or swaps. Certain of themacro hedge derivatives used contain settlement provisions linked to both equity returns and interest rates; the remainingare interest rate contracts or equity contracts. The Company’s macro hedge derivatives are included in Other contracts inthe tables above.
EIA, IUL and stock market certificate products have returns tied to the performance of equity markets. As a result offluctuations in equity markets, the obligation incurred by the Company related to EIA, IUL and stock market certificateproducts will positively or negatively impact earnings over the life of these products. The equity component of the EIA, IULand stock market certificate product obligations are considered embedded derivatives, which are bifurcated from their hostcontracts for valuation purposes and reported on the Consolidated Balance Sheets at fair value with changes in fair valuereported in earnings. As a means of economically hedging its obligations under the provisions of these products, theCompany enters into index options and futures contracts.
The Company enters into futures and commodity swaps to manage its exposure to price risk arising from seed moneyinvestments in proprietary investment products. The Company enters into foreign currency forward contracts toeconomically hedge its exposure to certain foreign transactions. The Company enters into futures contracts to economicallyhedge its exposure related to compensation plans.
Cash Flow HedgesThe Company has designated and accounts for the following as cash flow hedges: (i) interest rate swaps to hedge interestrate exposure on debt, (ii) interest rate lock agreements to hedge interest rate exposure on debt issuances and(iii) swaptions used to hedge the risk of increasing interest rates on forecasted fixed premium product sales.
For all years ended December 31, 2015, 2014 and 2013, amounts recognized in earnings related to cash flow hedgesdue to ineffectiveness were $1 million. The estimated net amount of existing pretax losses as of December 31, 2015 thatthe Company expects to reclassify to earnings within the next twelve months is $4 million, which consists of $2 million ofpretax gains to be recorded as a reduction to interest and debt expense and $6 million of pretax losses to be recorded innet investment income. Currently, the longest period of time over which the Company is hedging exposure to the variabilityin future cash flows is 20 years and relates to forecasted debt interest payments. See Note 18 for a rollforward of netunrealized derivative gains (losses) included in AOCI related to cash flow hedges.
Fair Value HedgesIn 2010, the Company entered into and designated as fair value hedges three interest rate swaps to convert senior notesdue 2015, 2019 and 2020 from fixed rate debt to floating rate debt. The interest rate swaps related to the senior notesdue 2015 matured in the fourth quarter of 2015. The swaps have identical terms as the underlying debt being hedged sono ineffectiveness is expected to be realized. The Company recognizes gains and losses on the derivatives and the related
147

hedged items within interest and debt expense. The following table presents the amounts recognized in income related tofair value hedges:
Amount of Gain Recognized inIncome on Derivatives
Years Ended December 31,Derivatives designated as hedginginstruments Location of Gain Recorded into Income 2015 2014 2013
(in millions)Interest rate contracts Interest and debt expense $ 31 $ 33 $ 57
Included in the table above is an $18 million gain from the partial settlement of the fair value hedge on the Company’ssenior notes due November 2015, as a result of redeeming $350 million of the notes in the fourth quarter of 2013.
Credit RiskCredit risk associated with the Company’s derivatives is the risk that a derivative counterparty will not perform inaccordance with the terms of the applicable derivative contract. To mitigate such risk, the Company has establishedguidelines and oversight of credit risk through a comprehensive enterprise risk management program that includesmembers of senior management. Key components of this program are to require preapproval of counterparties and the useof master netting arrangements and collateral arrangements whenever practical. See Note 15 for additional information onthe Company’s credit exposure related to derivative assets.
Certain of the Company’s derivative contracts contain provisions that adjust the level of collateral the Company is requiredto post based on the Company’s debt rating (or based on the financial strength of the Company’s life insurancesubsidiaries for contracts in which those subsidiaries are the counterparty). Additionally, certain of the Company’s derivativecontracts contain provisions that allow the counterparty to terminate the contract if the Company’s debt does not maintaina specific credit rating (generally an investment grade rating) or the Company’s life insurance subsidiary does not maintaina specific financial strength rating. If these termination provisions were to be triggered, the Company’s counterparty couldrequire immediate settlement of any net liability position. At December 31, 2015 and 2014, the aggregate fair value ofderivative contracts in a net liability position containing such credit contingent provisions was $284 million and$416 million, respectively. The aggregate fair value of assets posted as collateral for such instruments as of December 31,2015 and 2014 was $283 million and $416 million, respectively. If the credit contingent provisions of derivative contractsin a net liability position at December 31, 2015 and 2014 were triggered, the aggregate fair value of additional assetsthat would be required to be posted as collateral or needed to settle the instruments immediately would have been$1 million and nil, respectively.
17. Share-Based Compensation
The Company’s share-based compensation plans consist of the Amended and Restated Ameriprise Financial 2005Incentive Compensation Plan (the ‘‘2005 ICP’’), the Ameriprise Financial 2008 Employment Incentive Equity Award Plan(the ‘‘2008 Plan’’), the Ameriprise Financial Franchise Advisor Deferred Compensation Plan (‘‘Franchise Advisor DeferralPlan’’), the Ameriprise Advisor Group Deferred Compensation Plan (‘‘Advisor Group Deferral Plan’’) and the ThreadneedleEquity Incentive Plan (‘‘EIP’’).
The components of the Company’s share-based compensation expense, net of forfeitures, were as follows:
December 31,
2015 2014 2013
(in millions)Stock option $ 39 $ 37 $ 36Restricted stock(1) 22 26 46Restricted stock units 83 67 61Liability awards 14 30 31
Total $ 158 $ 160 $ 174
(1) Includes nil, $3 million and $10 million of expense related to EIP for the years ended December 31, 2015, 2014 and 2013,respectively.
For the years ended December 31, 2015, 2014 and 2013, total income tax benefit recognized by the Company related toshare-based compensation expense was $56 million, $55 million and $60 million, respectively.
148

As of December 31, 2015, there was $99 million of total unrecognized compensation cost related to non-vested awardsunder the Company’s share-based compensation plans, which is expected to be recognized over a weighted-average periodof 2.4 years.
Amended and Restated Ameriprise Financial 2005 Incentive Compensation PlanThe 2005 ICP, which was amended and approved by shareholders on April 30, 2014, provides for the grant of cash andequity incentive awards to directors, employees and independent contractors, including stock options, restricted stockawards, restricted stock units, stock appreciation rights, performance shares and similar awards designed to comply withthe applicable federal regulations and laws of jurisdiction. Under the 2005 ICP, a maximum of 54.4 million shares may beissued. Of this total, no more than 4.5 million shares may be issued after April 30, 2014 for full value awards, which areawards other than stock options and stock appreciation rights. Shares issued under the 2005 ICP may be authorized andunissued shares or treasury shares.
Ameriprise Financial 2008 Employment Incentive Equity Award PlanThe 2008 Plan is designed to align employees’ interests with those of the shareholders of the Company and attract andretain new employees. The 2008 Plan provides for the grant of equity incentive awards to new employees, primarily those,who became employees in connection with a merger or acquisition, including stock options, restricted stock awards,restricted stock units, and other equity-based awards designed to comply with the applicable federal and foreignregulations and laws of jurisdiction. Under the 2008 Plan, a maximum of 6.0 million shares may be issued.
Stock OptionsStock options granted under the 2005 ICP and the 2008 Plan have an exercise price not less than 100% of the currentfair market value of a share of the Company’s common stock on the grant date and a maximum term of 10 years. Stockoptions granted generally vest ratably over three to four years. Vesting of option awards may be accelerated based on ageand length of service. Stock options granted are expensed on a straight-line basis over the vesting period based on the fairvalue of the awards on the date of grant. The grant date fair value of the options is calculated using a Black-Scholesoption-pricing model.
The following weighted average assumptions were used for stock option grants:
2015 2014 2013
Dividend yield 2.0% 2.0% 3.0%Expected volatility 26% 31% 41%Risk-free interest rate 1.2% 1.5% 0.9%Expected life of stock option (years) 5.0 5.0 5.0
The dividend yield assumption represents the Company’s expected dividend yield based on its historical dividend payoutsand management’s expectations. The expected volatility is based on the Company’s historical and implied volatilities. Therisk-free interest rate for periods within the expected option life is based on the U.S. Treasury yield curve at the grant date.The expected life of the option is based on the Company’s past experience and other considerations.
The weighted average grant date fair value for options granted during 2015, 2014 and 2013 was $25.12, $25.59 and$18.16, respectively.
A summary of the Company’s stock option activity for 2015 is presented below (shares and intrinsic value in millions):
Weighted AverageRemaining
Weighted Average Contractual Term AggregateShares Exercise Price (Years) Intrinsic Value
Outstanding at January 1 7.2 $ 65.07 6.7 $ 485Granted 1.6 128.58Exercised (1.4) 50.50Forfeited (0.1) 106.17
Outstanding at December 31 7.3 81.11 6.7 222
Exercisable at December 31 4.2 59.02 5.4 201
The intrinsic value of a stock option is the amount by which the fair value of the underlying stock exceeds the exerciseprice of the option. The total intrinsic value of options exercised was $111 million, $243 million and $299 million duringthe years ended December 31, 2015, 2014 and 2013, respectively.
149

Restricted Stock AwardsRestricted stock awards granted under the 2005 ICP and 2008 Plan generally vest ratably over three to four years or atthe end of five years. Vesting of restricted stock awards may be accelerated based on age and length of service.Compensation expense for restricted stock awards is based on the market price of Ameriprise Financial common stock onthe date of grant and is amortized on a straight-line basis over the vesting period. Quarterly dividends are paid onrestricted stock, as declared by the Company’s Board of Directors, during the vesting period and are not subject toforfeiture.
Restricted Stock Units and Deferred Share UnitsThe 2005 ICP provides for the grant of deferred share units to non-employee directors of the Company and the 2005 ICPand 2008 Plan provide for the grant of restricted stock units to employees. The director awards are fully vested uponissuance and are settled for Ameriprise Financial common stock upon the director’s termination of service. The employeeawards generally vest ratably over three to four years. Compensation expense for deferred share units and restricted stockunits is based on the market price of Ameriprise Financial stock on the date of grant. Restricted stock units granted toemployees are expensed on a straight-line basis over the vesting period or on an accelerated basis if certain age andlength of service requirements are met. Deferred share units granted to non-employee directors are expensed immediately.Dividends are paid on restricted stock units, as declared by the Company’s Board of Directors, during the vesting periodand are not subject to forfeiture. Dividend equivalents are issued on deferred share units, as dividends are declared by theCompany’s Board of Directors, until distribution and are not subject to forfeiture.
Ameriprise Financial Deferred Compensation PlanThe Ameriprise Financial Deferred Compensation Plan (‘‘DCP’’) under the 2005 ICP gives certain employees the choice todefer a portion of their eligible compensation, which can be invested in investment options as provided by the DCP,including the Ameriprise Financial Stock Fund. The DCP is an unfunded non-qualified deferred compensation plan undersection 409A of the Internal Revenue Code. The Company provides a match on certain deferrals. Participant deferrals vestimmediately and the Company match vests after three years. Distributions are made in shares of the Company’s commonstock for the portion of the deferral invested in the Ameriprise Financial Stock Fund and the Company match, for which theCompany has recorded in equity. The DCP does allow for accelerated vesting of the share-based awards in cases of death,disability and qualified retirement. Compensation expense related to the Company match is recognized on a straight-linebasis over the vesting period or on an accelerated basis if certain age and length of service requirements are met.Dividend equivalents are issued on deferrals into the Ameriprise Financial Stock Fund and the Company match. Dividendequivalents related to deferrals are not subject to forfeiture, whereas dividend equivalents related to the Company matchare subject to forfeiture until fully vested.
Ameriprise Financial Franchise Advisor Deferral PlanThe Franchise Advisor Deferral Plan, which was amended in January 2011, gives certain advisors the choice to defer aportion of their commissions into Ameriprise Financial stock or other investment options. The Franchise Advisor DeferralPlan is an unfunded non-qualified deferred compensation plan under section 409A of the Internal Revenue Code. Prior to2011, all deferrals were in the form of share-based awards and the Company provided a match on the advisor deferrals,which participants could elect to receive in cash or shares of common stock.
The Franchise Advisor Deferral Plan allows for the grant of share-based awards of up to 10.5 million shares of commonstock. The number of units awarded is based on the performance measures, deferral percentage and the market value ofAmeriprise Financial common stock on the deferral date as defined by the plan. Share-based awards made during 2011and later are fully vested and are not subject to forfeitures. Share-based awards made prior to 2011 generally vest ratablyover four years, beginning on January 1 of the year following the plan year in which the award was made. In addition tothe voluntary deferral, certain advisors are eligible for the Franchise Advisor Top Performer Stock Award or the FranchiseConsultant Growth Bonus. The Franchise Advisor Top Performer Stock Award allows eligible advisors to earn additionaldeferred stock awards on commissions over a specified threshold. The awards vest ratably over four years. The FranchiseConsultant Growth Bonus allows eligible advisors who coach other advisors the ability to earn a bonus based on thesuccess of the advisors they coach, which can be deferred into the plan. The awards vest ratably over three years. TheFranchise Advisor Deferral Plan allows for accelerated vesting of the share-based awards based on age and years as anadvisor. Commission expense is recognized on a straight-line basis over the vesting period. However, as franchise advisorsare not employees of the Company, the expense is adjusted each period based on the stock price of the Company’scommon stock up to the vesting date. Share units receive dividend equivalents, as dividends are declared by theCompany’s Board of Directors, until distribution and are subject to forfeiture until vested.
150

Ameriprise Advisor Group Deferred Compensation PlanThe Advisor Group Deferral Plan, which was created in April 2009, allows for employee advisors to receive share-basedbonus awards which are subject to future service requirements and forfeitures. The Advisor Group Deferral Plan is anunfunded non-qualified deferred compensation plan under section 409A of the Internal Revenue Code. The Advisor GroupDeferral Plan also gives qualifying employee advisors the choice to defer a portion of their base salary or commissions. Thisdeferral can be in the form of Ameriprise Financial stock or other investment options. Deferrals are not subject to futureservice requirements or forfeitures. Under the Advisor Group Deferral Plan, a maximum of 3.0 million shares may beissued. Awards granted under the Advisor Group Deferral Plan may be settled in cash and/or shares of the Company’scommon stock according to the award’s terms. Share units receive dividend equivalents, as dividends are declared by theCompany’s Board of Directors, until distribution and are subject to forfeiture until vested.
Full Value Share Award ActivityA summary of activity for the Company’s restricted stock awards, restricted stock units granted to employees (includingadvisors), compensation deferrals into stock and deferred share units for 2015 is presented below (shares in millions):
Weighted AverageShares Grant-date Fair Value
Non-vested shares at January 1 1.4 $ 80.68Granted 0.6 129.07Deferred 0.3 121.17Vested (1.0) 95.76Forfeited — 101.84
Non-vested shares at December 31 1.3 103.01
The deferred shares in the table above primarily relate to franchise advisor voluntary deferrals of their commissions intoAmeriprise Financial stock under the Franchise Advisor Deferral Plan that are fully vested at the deferral date.
The fair value of full value share awards vested during the years ended December 31, 2015, 2014 and 2013 was$133 million, $259 million and $120 million, respectively.
The weighted average grant date fair value for restricted shares, restricted stock units and deferred share units during2015, 2014 and 2013 was $128.43, $109.60 and $68.90, respectively. The weighted average grant date fair value forfranchise advisor and advisor group deferrals during 2015, 2014 and 2013 was $123.88, $114.69 and $80.77,respectively.
Performance Share UnitsUnder the 2005 ICP, the Company’s Executive Leadership Team may be awarded a target number of performance shareunits (‘‘PSUs’’). PSUs will be earned only to the extent that the Company attains certain goals relating to the Company’sperformance and relative total shareholder returns against peers over a three-year period. The awards also have athree-year service condition with cliff vesting with an accelerated service condition based on age and length of service. Theactual number of PSUs ultimately earned could vary from zero, if performance goals are not met, to as much as 200% ofthe target, if performance goals are significantly exceeded. The value of each target PSU is equal to the value of one shareof Ameriprise common stock. The total amount of target PSUs outstanding at the end of December 31, 2015, 2014 and2013 was 0.2 million, 0.2 million, 0.3 million, respectively. The PSUs are liability awards. During the years endedDecember 31, 2015 and 2014, the value of shares settled for PSU awards was $27 million and $20 million, respectively.There were no settlements made for PSU awards for the years ended December 31, 2013.
Threadneedle Equity Incentive PlanPrior to 2012, certain key Threadneedle employees were eligible for awards under the EIP based on a formula tied toThreadneedle’s financial performance. Awards under the EIP were first made in April 2009; prior awards were made underthe equity participation plan (‘‘EPP’’). In 2011, Threadneedle’s articles of incorporation were amended to create a newclass of Threadneedle corporate units to be granted under a modified EIP plan. Employees who held EIP units granted priorto 2011 were given the choice to exchange their existing units at the exchange date. EIP awards may be settled in cash orThreadneedle corporate units according to the award’s terms. For awards granted prior to 2011, the EIP provides for 100%vesting after three years, with a mandatory call after six years. For converted units and awards granted after February2011, the EIP provides for 100% vesting after two and a half years, with no mandatory call date. Converted units andunits granted after February 2011 have dividend rights once fully vested. The EPP provides for 50% vesting after threeyears and 50% vesting after four years, with required cash-out after five years. EIP and EPP awards are subject toforfeitures based on future service requirements. The EIP awards were no longer awarded after 2012 and insteadThreadneedle employees received awards under the 2005 ICP.
151

The value of the EPP and EIP awards is recognized as compensation expense evenly over the vesting periods. Generally,the expense is based on the grant date fair value of the awards as determined by an annual independent valuation ofThreadneedle’s fair market value; however, for awards accounted for as a liability the expense is adjusted to reflectThreadneedle’s current calculated value (the change in the value of the awards is recognized immediately for vestedawards and over the remaining vesting period for unvested awards). During the years ended December 31, 2015,2014 and 2013, cash settlements of EPP and EIP awards were $28 million, $28 million and $23 million, respectively.
18. Shareholders’ Equity
The following tables provide the amounts related to each component of other comprehensive income (loss) (‘‘OCI’’):
Year Ended December 31, 2015
Income TaxPretax Benefit (Expense) Net of Tax
(in millions)Net unrealized securities losses:
Net unrealized securities losses arising during the period(1) $ (1,027) $ 359 $ (668)Reclassification of net securities gains included in net income(2) (6) 2 (4)Impact of deferred acquisition costs, deferred sales inducement costs, unearned
revenue, benefit reserves and reinsurance recoverables 480 (168) 312
Net unrealized securities losses (553) 193 (360)
Net unrealized derivatives losses:Reclassification of net derivative losses included in net income(3) 1 — 1
Net unrealized derivatives losses 1 — 1
Defined benefit plans:Prior service credit (2) — (2)Net loss arising during the period (24) 6 (18)
Defined benefit plans (26) 6 (20)
Foreign currency translation (46) 16 (30)
Other comprehensive loss attributable to Ameriprise Financial (624) 215 (409)
Other comprehensive loss attributable to noncontrolling interests (60) — (60)
Total other comprehensive loss $ (684) $ 215 $ (469)
Year Ended December 31, 2014
Income TaxPretax Benefit (Expense) Net of Tax
(in millions)Net unrealized securities gains:
Net unrealized securities gains arising during the period(1) $ 529 $ (184) $ 345Reclassification of net securities gains included in net income(2) (39) 14 (25)Impact of deferred acquisition costs, deferred sales inducement costs, unearned
revenue, benefit reserves and reinsurance recoverables (290) 101 (189)
Net unrealized securities gains 200 (69) 131
Net unrealized derivatives losses:Reclassification of net derivative losses included in net income(3) 1 — 1
Net unrealized derivatives losses 1 — 1
Defined benefit plans:Prior service credit (1) — (1)Net loss arising during the period (37) 13 (24)
Defined benefit plans (38) 13 (25)
Foreign currency translation (62) 22 (40)
Other comprehensive income attributable to Ameriprise Financial 101 (34) 67
Other comprehensive loss attributable to noncontrolling interests (63) — (63)
Total other comprehensive income $ 38 $ (34) $ 4
152

Year Ended December 31, 2013
Income TaxPretax Benefit (Expense) Net of Tax
(in millions)Net unrealized securities losses:
Net unrealized securities losses arising during the period(1) $ (1,484) $ 513 $ (971)Reclassification of net securities gains included in net income(2) (7) 2 (5)Impact of deferred acquisition costs, deferred sales inducement costs, unearned
revenue, benefit reserves and reinsurance recoverables 490 (171) 319
Net unrealized securities losses (1,001) 344 (657)
Net unrealized derivatives losses:Reclassification of net derivative losses included in net income(3) 1 — 1
Net unrealized derivatives losses 1 — 1
Defined benefit plans:Prior service credit (2) 1 (1)Net gain arising during the period 71 (25) 46
Defined benefit plans 69 (24) 45
Foreign currency translation 18 (6) 12
Other comprehensive loss attributable to Ameriprise Financial (913) 314 (599)
Other comprehensive income attributable to noncontrolling interests 25 — 25
Total other comprehensive loss $ (888) $ 314 $ (574)
(1) Includes other-than-temporary impairment losses on Available-for-Sale securities related to factors other than credit that wererecognized in other comprehensive income (loss) during the period.
(2) Reclassification amounts are recorded in net investment income.(3) Includes a $4 million, $4 million and $4 million pretax gain reclassified to interest and debt expenses and a $5 million, $5 million
and $5 million pretax loss reclassified to net investment income for the years ended December 31, 2015, 2014 and 2013,respectively.
Other comprehensive income (loss) related to net unrealized securities gains (losses) includes three components:(i) unrealized gains (losses) that arose from changes in the market value of securities that were held during the period;(ii) (gains) losses that were previously unrealized, but have been recognized in current period net income due to sales ofAvailable-for-Sale securities and due to the reclassification of noncredit other-than-temporary impairment losses to creditlosses; and (iii) other adjustments primarily consisting of changes in insurance and annuity asset and liability balances,such as DAC, DSIC, unearned revenue, benefit reserves and reinsurance recoverables, to reflect the expected impact ontheir carrying values had the unrealized gains (losses) been realized as of the respective balance sheet dates.
The following table presents the changes in the balances of each component of AOCI, net of tax:
Net Unrealized Net Unrealized ForeignSecurities Derivatives Defined Currency
Gains Losses Benefit Plans Translation Total
(in millions)Balance, January 1, 2013 $ 1,312 $ (2) $ (91) $ (25) $ 1,194
OCI before reclassifications (652) — 39 12 (601)Amounts reclassified from AOCI (5) 1 6 — 2
OCI attributable to Ameriprise Financial (657) 1 45 12 (599)
Balance, December 31, 2013 655(1) (1) (46) (13) 595OCI before reclassifications 156 — (30) (40) 86Amounts reclassified from AOCI (25) 1 5 — (19)
OCI attributable to Ameriprise Financial 131 1 (25) (40) 67
Balance, December 31, 2014 786(1) — (71) (53) 662OCI before reclassifications (356) — (25) (30) (411)Amounts reclassified from AOCI (4) 1 5 — 2
OCI attributable to Ameriprise Financial (360) 1 (20) (30) (409)
Balance, December 31, 2015 $ 426(1) $ 1 $ (91) $ (83) $ 253
(1) Includes $4 million, $5 million and $(4) million of noncredit related impairments on securities and net unrealized securities gains(losses) on previously impaired securities at December 31, 2015, 2014 and 2013, respectively.
153

For the years ended December 31, 2015, 2014 and 2013, the Company repurchased a total of 13.9 million shares,11.8 million shares and 17.8 million shares, respectively, of its common stock for an aggregate cost of $1.7 billion,$1.4 billion and $1.5 billion, respectively. In April 2014, the Company’s Board of Directors authorized an expenditure of upto $2.5 billion for the repurchase of shares of the Company’s common stock through April 28, 2016. In December 2015,the Company’s Board of Directors authorized additional expenditures of up to $2.5 billion worth of the Company’s commonstock through December 31, 2017. As of December 31, 2015, the Company had $2.6 billion remaining under its sharerepurchase authorizations.
The Company may also reacquire shares of its common stock under its share-based compensation plans related torestricted stock awards and certain option exercises. The holders of restricted shares may elect to surrender a portion oftheir shares on the vesting date to cover their income tax obligation. These vested restricted shares are reacquired by theCompany and the Company’s payment of the holders’ income tax obligations are recorded as a treasury share purchase.For the years ended December 31, 2015, 2014 and 2013, the Company reacquired 0.4 million shares, 0.8 million sharesand 0.4 million shares, respectively, of its common stock through the surrender of shares upon vesting and paid in theaggregate $49 million, $92 million and $26 million, respectively, related to the holders’ income tax obligations on thevesting date. Option holders may elect to net settle their vested awards resulting in the surrender of the number of sharesrequired to cover the strike price and tax obligation of the options exercised. These shares are reacquired by the Companyand recorded as treasury shares. For the years ended December 31, 2015, 2014 and 2013, the Company reacquired0.7 million shares, 2.1 million shares and 2.9 million shares, respectively, of its common stock through the net settlementof options for an aggregate value of $92 million, $252 million and $227 million, respectively.
For the years ended December 31, 2015, 2014 and 2013, respectively, the Company reissued 1.0 million, 1.6 millionand 1.9 million treasury shares, respectively, for restricted stock award grants, PSUs, and issuance of shares vested underthe Ameriprise Financial Franchise Advisor Deferred Compensation Plan.
19. Earnings per Share Attributable to Ameriprise Financial, Inc. CommonShareholders
The computations of basic and diluted earnings per share attributable to Ameriprise Financial, Inc. common shareholdersare as follows:
Years Ended December 31,
2015 2014 2013
(in millions, except per share amounts)Numerator:
Income from continuing operations $ 1,687 $ 2,002 $ 1,478Less: Net income attributable to noncontrolling interests 125 381 141
Income from continuing operations attributable to Ameriprise Financial 1,562 1,621 1,337Loss from discontinued operations, net of tax — (2) (3)
Net income attributable to Ameriprise Financial $ 1,562 $ 1,619 $ 1,334
Denominator:Basic: Weighted-average common shares outstanding 181.7 191.6 203.2Effect of potentially dilutive nonqualified stock options and other share-based awards 2.5 3.4 3.9
Diluted: Weighted-average common shares outstanding 184.2 195.0 207.1
Earnings per share attributable to Ameriprise Financial, Inc. common shareholders:Basic:
Income from continuing operations $ 8.60 $ 8.46 $ 6.58Loss from discontinued operations — (0.01) (0.02)
Net income $ 8.60 $ 8.45 $ 6.56
Diluted:Income from continuing operations $ 8.48 $ 8.31 $ 6.46Loss from discontinued operations — (0.01) (0.02)
Net income $ 8.48 $ 8.30 $ 6.44
The calculation of diluted earnings per share excludes the incremental effect of 1.7 million and 0.1 million options as ofDecember 31, 2015, and 2014, respectively, due to their anti-dilutive effect. There was no incremental effect of optionsfor 2013.
154

20. Regulatory Requirements
Restrictions on the transfer of funds exist under regulatory requirements applicable to certain of the Company’ssubsidiaries. At December 31, 2015, the aggregate amount of unrestricted net assets was approximately $2.0 billion.
The National Association of Insurance Commissioners (‘‘NAIC’’) defines Risk-Based Capital (‘‘RBC’’) requirements forinsurance companies. The RBC requirements are used by the NAIC and state insurance regulators to identify companiesthat merit regulatory actions designed to protect policyholders. These requirements apply to both the Company’s life andproperty casualty insurance companies. In addition, IDS Property Casualty is subject to the statutory surplus requirementsof the State of Wisconsin. The Company’s life and property casualty companies each met their respective minimum RBCrequirements.
The Company’s life and property casualty insurance companies are required to prepare statutory financial statements inaccordance with the accounting practices prescribed or permitted by the insurance departments of their respective statesof domicile, which vary materially from GAAP. Prescribed statutory accounting practices include publications of the NAIC, aswell as state laws, regulations and general administrative rules. The more significant differences from GAAP includecharging policy acquisition costs to expense as incurred, establishing annuity and insurance reserves using differentactuarial methods and assumptions, valuing investments on a different basis and excluding certain assets from the balancesheet by charging them directly to surplus, such as a portion of the net deferred income tax assets.
State insurance statutes contain limitations as to the amount of dividends or distributions that insurers may make withoutproviding prior notification to state regulators. For RiverSource Life, dividends or distributions in excess of unassignedsurplus, as determined in accordance with accounting practices prescribed by the State of Minnesota, require advancenotice to the Minnesota Department of Commerce, RiverSource Life’s primary regulator, and are subject to potentialdisapproval. RiverSource Life’s statutory unassigned surplus aggregated $954 million and $638 million as ofDecember 31, 2015 and 2014, respectively.
In addition, dividends or distributions, whose fair market value, together with that of other dividends or distributions madewithin the preceding 12 months, exceeds the greater of the previous year’s statutory net gain from operations or 10% ofthe previous year-end statutory capital and surplus are referred to as ‘‘extraordinary dividends.’’ Extraordinary dividends alsorequire advance notice to the Minnesota Department of Commerce, and are subject to potential disapproval. Statutorycapital and surplus for RiverSource Life was $3.7 billion and $3.3 billion at December 31, 2015 and 2014, respectively.Statutory capital and surplus for IDS Property Casualty was $684 million and $560 million at December 31, 2015 and2014, respectively.
Statutory net gain from operations and net income (loss) are summarized as follows:
Years Ended December 31,
2015 2014 2013
(in millions)RiverSource Life
Statutory net gain from operations(1) $ 1,033 $ 1,412 $ 1,633Statutory net income(1) 633 1,154 1,337
IDS Property CasualtyStatutory net income (loss) (44) (25) 11
(1) Statutory net gain (loss) from operations and statutory net income (loss) are significantly impacted by changes in reserves for variableannuity guaranteed benefits, however, these impacts are substantially offset by unrealized gains (losses) on derivatives which are notincluded in statutory income but are recorded directly to surplus.
Government debt securities of $5 million at both December 31, 2015 and 2014, held by the Company’s life insurancesubsidiaries were on deposit with various states as required by law.
Ameriprise Certificate Company (‘‘ACC’’) is registered as an investment company under the Investment Company Act of1940 (the ‘‘1940 Act’’). ACC markets and sells investment certificates to clients. ACC is subject to various capitalrequirements under the 1940 Act, laws of the State of Minnesota and understandings with the Securities and ExchangeCommission (‘‘SEC’’) and the Minnesota Department of Commerce. The terms of the investment certificates issued by ACCand the provisions of the 1940 Act also require the maintenance by ACC of qualified assets. Under the provisions of itscertificates and the 1940 Act, ACC was required to have qualified assets (as that term is defined in Section 28(b) of the1940 Act) in the amount of $4.8 billion and $4.2 billion at December 31, 2015 and 2014, respectively. ACC hadqualified assets of $5.1 billion and $4.5 billion at December 31, 2015 and 2014, respectively.
Ameriprise Financial and ACC entered into a Capital Support Agreement on March 2, 2009, pursuant to which AmeripriseFinancial agrees to commit such capital to ACC as is necessary to satisfy applicable minimum capital requirements.Effective April 30, 2014, this agreement was amended to revise the maximum commitment to $50 million. The previous
155

maximum commitment, set March 2, 2009, was $115 million. For the years ended December 31, 2015 and 2014, ACCdid not draw upon the Capital Support Agreement and had met all applicable capital requirements.
Threadneedle’s required capital is predominantly based on the requirements specified by its regulator, the FinancialConduct Authority (‘‘FCA’’), under its Capital Adequacy Requirements for asset managers.
The Company has four broker-dealer subsidiaries, American Enterprise Investment Services Inc., Ameriprise FinancialServices, Inc., RiverSource Distributors, Inc. and Columbia Management Investment Distributors, Inc. The broker-dealersare subject to the net capital requirements of the Financial Industry Regulatory Authority (‘‘FINRA’’) and the Uniform NetCapital requirements of the SEC under Rule 15c3-1 of the Securities Exchange Act of 1934.
Ameriprise Trust Company is subject to capital adequacy requirements under the laws of the State of Minnesota asenforced by the Minnesota Department of Commerce.
Ameriprise National Trust Bank is subject to regulation by the Comptroller of Currency (‘‘OCC’’) and, to a limited extent, bythe Federal Deposit Insurance Corporation. As a limited powers national association, Ameriprise National Trust Bank issubject to supervision under various laws and regulations enforced by the OCC, including those related to capital adequacy,liquidity and conflicts of interest.
21. Income Taxes
The components of income tax provision attributable to continuing operations were as follows:
Years Ended December 31,
2015 2014 2013
(in millions)Current income tax
Federal $ 509 $ 248 $ 549State and local 36 33 24Foreign 41 36 37
Total current income tax 586 317 610
Deferred income taxFederal (124) 202 (102)State and local (4) 30 (10)Foreign (3) (4) (6)
Total deferred income tax (131) 228 (118)
Total income tax provision $ 455 $ 545 $ 492
The geographic sources of pretax income from continuing operations were as follows:
Years Ended December 31,
2015 2014 2013
(in millions)United States $ 1,710 $ 1,858 $ 1,640Foreign 432 689 330
Total $ 2,142 $ 2,547 $ 1,970
In December 2014, the Company received IRS approval for a change in accounting method related to variable annuityhedging. Accordingly, the Company began using the approved method of accounting in the fourth quarter of 2014. Thechange to the approved method increased deferred tax expense and current tax receivables with a corresponding decreaseto current tax expense and deferred tax assets of approximately $300 million in 2014.
156

The principal reasons that the aggregate income tax provision attributable to continuing operations is different from thatcomputed by using the U.S. statutory rate of 35% were as follows:
Years Ended December 31,
2015 2014 2013
Tax at U.S. statutory rate 35.0% 35.0% 35.0%Changes in taxes resulting from:
Net income attributable to noncontrolling interests (2.0) (5.2) (2.5)Dividend exclusion (6.7) (4.7) (5.1)Low income housing tax credits (3.0) (2.1) (2.7)Foreign tax credits, net of addback (2.1) (2.0) (0.9)State taxes, net of federal benefit — 1.6 0.5Tax-exempt interest income — (0.7) (0.9)Taxes applicable to prior years — (0.2) —Other, net 0.1 (0.3) 1.6
Income tax provision 21.3% 21.4% 25.0%
The decrease in the Company’s effective tax rate in 2014 compared to 2013 is primarily the result of an increase in netincome attributable to noncontrolling interests and an increase in foreign tax credits, as well as a $17 million benefit in2014 related to the completion of an Internal Revenue Service (‘‘IRS’’) audit.
Accumulated earnings of certain foreign subsidiaries, which totaled $272 million at December 31, 2015, are intended tobe permanently reinvested outside the United States. Accordingly, U.S. federal taxes, which would have aggregated$63 million, have not been provided on those earnings.
Deferred income tax assets and liabilities result from temporary differences between the assets and liabilities measured forGAAP reporting versus income tax return purposes. The significant components of the Company’s deferred income taxassets and liabilities, which are included net within other assets or other liabilities on the Consolidated Balance Sheets,were as follows:
December 31,
2015 2014
(in millions)Deferred income tax assets
Liabilities for policyholder account balances, future policy benefits and claims $ 1,391 $ 1,292Deferred compensation 384 350Investment related 118 83Postretirement benefits 56 —Loss carryovers and tax credit carryforwards — 25Other 87 102
Gross deferred income tax assets 2,036 1,852Less: valuation allowance 11 20
Total deferred income tax assets 2,025 1,832
Deferred income tax liabilitiesDeferred acquisition costs 730 738Net unrealized gains on Available-for-Sale securities 233 424Depreciation expense 169 131Deferred sales inducement costs 125 128Intangible assets 113 96Goodwill 66 —Other 18 101
Gross deferred income tax liabilities 1,454 1,618
Net deferred income tax assets $ 571 $ 214
Included in the Company’s deferred income tax assets are tax benefits related to state net operating losses of $16 million,net of federal benefit, which will expire beginning December 31, 2016. Based on analysis of the Company’s tax position,management believes it is more likely than not that the Company will not realize certain state deferred tax assets andstate net operating losses and therefore a valuation allowance of $11 million has been established.
157

A reconciliation of the beginning and ending amount of gross unrecognized tax benefits was as follows:
2015 2014 2013
(in millions)Balance at January 1 $ 242 $ 209 $ 116Additions based on tax positions related to the current year 18 17 22Additions for tax positions of prior years 48 35 74Reductions for tax positions of prior years (147) (19) (3)
Balance at December 31 $ 161 $ 242 $ 209
If recognized, approximately $57 million, $57 million and $62 million, net of federal tax benefits, of unrecognized taxbenefits as of December 31, 2015, 2014, and 2013, respectively, would affect the effective tax rate.
It is reasonably possible that the total amounts of unrecognized tax benefits will change in the next 12 months. TheCompany estimates that the total amount of gross unrecognized tax benefits may decrease by $90 million to $100 millionin the next 12 months primarily due to resolution of IRS examinations.
The Company recognizes interest and penalties related to unrecognized tax benefits as a component of the income taxprovision. The Company recognized a net increase of $3 million, $6 million, and $6 million in interest and penalties for theyears ended December 31, 2015, 2014, and 2013, respectively. At December 31, 2015 and 2014, the Company had apayable of $51 million and $48 million, respectively, related to accrued interest and penalties.
The Company or one or more of its subsidiaries files income tax returns in the U.S. federal jurisdiction, and various stateand foreign jurisdictions. The IRS has completed its field examination of the 1997 through 2011 tax returns. However, forfederal income tax purposes, tax years 1997 through 2006, 2008, and 2009 remain open for certain unagreed-uponissues. The IRS is currently auditing the Company’s U.S. Income Tax Returns for 2012 and 2013. The Company’s orcertain of its subsidiaries’ state income tax returns are currently under examination by various jurisdictions for years rangingfrom 1997 through 2012 and remain open for all years after 2012.
22. Retirement Plans and Profit Sharing Arrangements
Defined Benefit PlansPension Plans and Other Postretirement BenefitsThe Company’s U.S. non-advisor employees are generally eligible for the Ameriprise Financial Retirement Plan (the‘‘Retirement Plan’’), a noncontributory defined benefit plan which is a qualified plan under the Employee RetirementIncome Security Act of 1974, as amended (‘‘ERISA’’). Funding of costs for the Retirement Plan complies with theapplicable minimum funding requirements specified by ERISA and is held in a trust. The Retirement Plan is a cash balanceplan by which the employees’ accrued benefits are based on notional account balances, which are maintained for eachindividual. Each pay period these balances are credited with an amount equal to a percentage of eligible compensation asdefined by the Retirement Plan (which includes, but is not limited to, base pay, performance based incentive pay,commissions, shift differential and overtime). Prior to March 1, 2010, the percentage ranged from 2.5% to 10% based onemployees’ age plus years of service. Effective March 1, 2010, the percentage ranges from 2.5% to 5% based onemployees’ years of service. Employees eligible for the plan at the time of the change will continue to receive the samepercentage they were receiving until the new schedule becomes more favorable. Employees’ balances are also creditedwith a fixed rate of interest that is updated each January 1 and is based on the average of the daily five-year U.S. TreasuryNote yields for the previous October 1 through November 30, with a minimum crediting rate of 5%. Employees are fullyvested after three years of service or upon retirement at or after age 65, disability or death while employed. Employeeshave the option to receive annuity payments or a lump sum payout of vested balance at termination or retirement. TheRetirement Plan’s year-end is September 30.
In addition, the Company sponsors the Ameriprise Financial Supplemental Retirement Plan (the ‘‘SRP’’), an unfundednon-qualified deferred compensation plan subject to Section 409A of the Internal Revenue Code. This plan is for certainhighly compensated employees to replace the benefit that cannot be provided by the Retirement Plan due to IRS limits.The SRP generally parallels the Retirement Plan but offers different payment options.
The Company also sponsors unfunded defined benefit postretirement plans that provide health care and life insurance toretired U.S. employees. Net periodic postretirement benefit costs were nil for the years ended December 31, 2015, 2014and 2013.
Most employees outside the U.S. are covered by local retirement plans, some of which are funded, while other employeesreceive payments at the time of retirement or termination under applicable labor laws or agreements.
158

The components of the net periodic benefit cost for pension plans were as follows:
Years Ended December 31,
2015 2014 2013
(in millions)Service cost $ 46 $ 43 $ 46Interest cost 27 28 23Expected return on plan assets (40) (38) (33)Amortization of prior service costs (1) (1) (1)Amortization of net loss 9 7 11Other 4 3 2
Net periodic benefit cost $ 45 $ 42 $ 48
The prior service costs are amortized on a straight-line basis over the average remaining service period of activeparticipants. Actuarial gains and losses in excess of 10% of the greater of the projected benefit obligation or the market-related value of assets are amortized on a straight-line basis over the expected average remaining service period of activeparticipants.
The following table provides a reconciliation of changes in the benefit obligation:
Other PostretirementPension Plans Plans
2015 2014 2015 2014
(in millions)Benefit obligation, January 1 $ 776 $ 676 $ 18 $ 18Service cost 46 43 — —Interest cost 27 28 1 1Benefits paid (6) (7) (3) (4)Actuarial (gain) loss (3) 30 — —Participant contributions — — 2 3Settlements (20) (20) — —Foreign currency rate changes (8) (8) — —Additional voluntary contribution (‘‘AVC’’) obligation — 34 — —
Benefit obligation, December 31 $ 812 $ 776 $ 18 $ 18
The following table provides a reconciliation of changes in the fair value of assets:
Pension Plans
2015 2014
(in millions)Fair value of plan assets, January 1 $ 612 $ 544Actual return on plan assets (9) 37Employer contributions 40 47Benefits paid (6) (7)Settlements (20) (20)Foreign currency rate changes (9) (8)AVC asset — 19
Fair value of plan assets, December 31 $ 608 $ 612
The AVC obligation and asset included in the tables above relate to a retirement plan provided to employees outside theU.S., which allows participants to make voluntary contributions to be converted at retirement into additional defined benefitpension provided by the plan. Participant contributions are invested in one or more pooled pension funds available underthe plan.
159

The Company complies with the minimum funding requirements in all countries. The following table provides the amountsrecognized in the Consolidated Balance Sheets at December 31, which equal the funded status of the plans:
Other PostretirementPension Plans Plans
2015 2014 2015 2014
(in millions)Benefit liability $ (223) $ (178) $ (18) $ (18)Benefit asset 19 14 — —
Net amount recognized $ (204) $ (164) $ (18) $ (18)
The accumulated benefit obligation for all pension plans as of December 31, 2015 and 2014 was $740 million and$702 million, respectively. The following table provides information for pension plans with benefit obligations in excess ofplan assets:
December 31,
2015 2014
(in millions)Pension plans with accumulated benefit obligations in excess of plan assetsAccumulated benefit obligation $ 620 $ 582Fair value of plan assets 446 449Pension plans with projected benefit obligations in excess of plan assetsProjected benefit obligation $ 668 $ 628Fair value of plan assets 446 449
The weighted average assumptions used to determine benefit obligations were as follows:
Other PostretirementPension Plans Plans
2015 2014 2015 2014
Discount rates 3.66% 3.44% 3.90% 3.60%Rates of increase in compensation levels 4.36 4.35 N/A N/AHealthcare cost increase rates:
Next year trend rate N/A N/A 5.75 6.00Ultimate trend rate N/A N/A 5.00 5.00Years to ultimate trend rate N/A N/A 3 4
The weighted average assumptions used to determine net periodic benefit cost of pension plans were as follows:
2015 2014 2013
Discount rates 3.43% 4.06% 3.45%Rates of increase in compensation levels 4.41 4.38 4.36Expected long-term rates of return on assets 7.10 7.58 7.62
In developing the expected long-term rate of return on assets, management evaluated input from an external consultingfirm, including their projection of asset class return expectations and long-term inflation assumptions. The Company alsoconsidered historical returns on the plans’ assets. Discount rates are based on yields available on high-quality corporatebonds that would generate cash flows necessary to pay the benefits when due. A one percentage-point change in theassumed healthcare cost trend rates would not have a material effect on the postretirement benefit obligation or netperiodic postretirement benefit costs.
The Company’s pension plans’ assets are invested in an aggregate diversified portfolio to minimize the impact of anyadverse or unexpected results from a security class on the entire portfolio. Diversification is interpreted to includediversification by asset type, performance and risk characteristics and number of investments. When appropriate andconsistent with the objectives of the plans, derivative instruments may be used to mitigate risk or provide furtherdiversification, subject to the investment policies of the plans. Asset classes and ranges considered appropriate forinvestment of the plans’ assets are determined by each plan’s investment committee. The target allocations are 70%equity securities, 20% debt securities and 10% all other types of investments, except for the assets in pooled pensionfunds which are 65% equity securities and 35% debt securities and AVC assets which are allocated at the discretion of theindividual. Actual allocations will generally be within 5% of these targets. At December 31, 2015, there were no significantholdings of any single issuer and the exposure to derivative instruments was not significant.
160

The following tables present the Company’s pension plan assets measured at fair value on a recurring basis:
December 31, 2015
Asset Category Level 1 Level 2 Level 3 Total
(in millions)Equity securities:
U.S. large cap stocks $ 74 $ 83 $ — $ 157U.S. small cap stocks 55 3 — 58Non-U.S. large cap stocks 21 34 — 55Non-U.S. small cap stocks 21 — — 21Emerging markets 14 21 — 35
Debt securities:U.S. investment grade bonds 19 14 — 33U.S. high yield bonds — 26 — 26Non-U.S. investment grade bonds — 14 — 14
Real estate investment trusts — — 16 16Hedge funds — — 21 21Pooled pension funds — 143 — 143AVC assets (pooled pension funds) — 19 — 19Cash equivalents 10 — — 10
Total $ 214 $ 357 $ 37 $ 608
December 31, 2014
Asset Category Level 1 Level 2 Level 3 Total
(in millions)Equity securities:
U.S. large cap stocks $ 74 $ 84 $ — $ 158U.S. small cap stocks 59 1 — 60Non-U.S. large cap stocks 21 33 — 54Non-U.S. small cap stocks 18 — — 18Emerging markets 15 24 — 39
Debt securities:U.S. investment grade bonds 19 15 — 34U.S. high yield bonds — 27 — 27Non-U.S. investment grade bonds — 15 — 15
Real estate investment trusts — — 14 14Hedge funds — — 21 21Pooled pension funds — 144 — 144AVC assets (pooled pension funds) — 19 — 19Cash equivalents 9 — — 9
Total $ 215 $ 362 $ 35 $ 612
Equity securities are managed to track the performance of common market indices for both U.S. and non-U.S. securities,primarily across large cap, small cap and emerging market asset classes. Debt securities are managed to track theperformance of common market indices for both U.S. and non-U.S. investment grade bonds as well as a pool of U.S. highyield bonds. Real estate investment trusts are managed to track the performance of a broad population of investmentgrade non-agricultural income producing properties. The Company’s investments in hedge funds include investments in amulti-strategy fund and an off-shore fund managed to track the performance of broad fund of fund indices. Pooled pensionfunds are managed to track a specific benchmark based on the investment objectives of the fund. Cash equivalentsconsist of holdings in a money market fund that seeks to equal the return of the three month U.S. Treasury bill.
The fair value of real estate investment trusts is based primarily on the underlying cash flows of the properties within thetrusts which are significant unobservable inputs and classified as Level 3. The fair value of the hedge funds is based onthe proportionate share of the underlying net assets of the funds, which are significant unobservable inputs and classifiedas Level 3. The fair value of pooled pension funds and equity securities held in collective trust funds is based on the fund’sNAV and classified as Level 2 as they trade in principal-to-principal markets. Equity securities and mutual funds traded inactive markets are classified as Level 1. For debt securities and cash equivalents, the valuation techniques andclassifications are consistent with those used for the Company’s own investments as described in Note 14.
161

The following table provides a summary of changes in Level 3 assets measured at fair value on a recurring basis:
Real Estate HedgeAsset Category Investment Trusts Funds
(in millions)Balance at January 1, 2013 $ 12 $ 18
Actual return on plan assets:Relating to assets still held at the reporting date — 2
Purchases 2 —Sales (12) —
Balance at December 31, 2013 2 20Actual return on plan assets:
Relating to assets still held at the reporting date 1 1Purchases 11 —
Balance at December 31, 2014 14 21Actual return on plan assets:
Relating to assets still held at the reporting date 2 —
Balance at December 31, 2015 $ 16 $ 21
The amounts recognized in AOCI, net of tax, as of December 31, 2015 but not recognized as components of net periodicbenefit cost included an unrecognized actuarial loss of $97 million and an unrecognized prior service credit of $2 millionrelated to the Company’s pension plans and an unrecognized actuarial gain of $4 million related to the Company’s otherpostretirement plans. The estimated amounts that will be amortized from AOCI, net of tax, into net periodic benefit cost in2016 include a prior service credit of $1 million and an actuarial loss of $4 million related to Company’s pension plansand an actuarial gain of $1 million related to Company’s other postretirement plans. See Note 18 for a rollforward of AOCIrelated to the Company’s defined benefit plans.
The Company’s pension plans expect to make benefit payments to retirees as follows:
OtherPostretirement
Pension Plans Plans
(in millions)2016 $ 71 $ 22017 75 22018 74 22019 78 12020 76 12021-2025 322 6
The Company expects to contribute $23 million and $2 million to its pension plans and other postretirement plans,respectively, in 2016.
Defined Contribution PlansThe Company’s employees are generally eligible to participate in the Ameriprise Financial 401(k) Plan (the ‘‘401(k) Plan’’).The 401(k) Plan allows eligible employees to make contributions through payroll deductions up to IRS limits and investtheir contributions in one or more of the 401(k) Plan investment options, which include the Ameriprise Financial StockFund. The Company provides a dollar for dollar match up to the first 5% of eligible compensation an employee contributeson a pretax and/or Roth 401(k) basis for each annual period.
Under the 401(k) Plan, employees become eligible for contributions under the plan during the pay period they reach60 days of service. Match contributions are fully vested after five years of service, vesting ratably over the first five years ofservice, or upon retirement at or after age 65, disability or death while employed. The Company’s defined contribution planexpense was $47 million, $37 million and $35 million in 2015, 2014 and 2013, respectively.
Employees outside the U.S. who are not covered by the 401(k) may be covered by local defined contribution plans whichare subject to applicable laws and rules of the country where the plan is administered. The Company’s expense related todefined contribution plans outside the U.S. was $6 million, $6 million and $5 million in 2015, 2014 and 2013,respectively.
162

Threadneedle Profit Sharing PlanOn an annual basis, Threadneedle employees are eligible for a profit sharing arrangement. The profit sharing percentage isvariable and linked to certain performance criteria. Compensation expense related to the employee profit sharing plan was$60 million, $66 million and $69 million in 2015, 2014 and 2013, respectively.
23. Commitments, Guarantees and Contingencies
CommitmentsThe Company is committed to pay aggregate minimum rentals under noncancelable operating leases for office facilitiesand equipment in future years as follows:
(in millions)
2016 $ 562017 542018 452019 332020 26Thereafter 63
Total(1) $ 277
(1) Minimum payments have not been reduced by minimum sublease rentals due in the future under noncancelable subleases.
For the years ended December 31, 2015, 2014 and 2013, operating lease expense was $67 million, $85 million and$85 million, respectively.
The following table presents the Company’s funding commitments as of December 31:
2015 2014
(in millions)Commercial mortgage loans $ 73 $ 55Consumer mortgage loans 447 491Consumer lines of credit 3 3Affordable housing partnerships 117 124
Total funding commitments $ 640 $ 673
Since the Company expects many of the commitments related to consumer mortgage loans to expire without being drawn,total commitment amounts do not necessarily represent the Company’s future liquidity requirements. In addition, thecommitments include consumer credit lines that are cancelable upon notification to the consumer.
GuaranteesThe Company’s life and annuity products all have minimum interest rate guarantees in their fixed accounts. As ofDecember 31, 2015, these guarantees range up to 5%.
The Company is required by law to be a member of the guaranty fund association in every state where it is licensed to dobusiness. In the event of insolvency of one or more unaffiliated insurance companies, the Company could be adverselyaffected by the requirement to pay assessments to the guaranty fund associations.
The Company projects its cost of future guaranty fund assessments based on estimates of insurance company insolvenciesprovided by the National Organization of Life and Health Insurance Guaranty Associations (‘‘NOLHGA’’) and the amount ofits premiums written relative to the industry-wide premium in each state. The Company accrues the estimated cost offuture guaranty fund assessments when it is considered probable that an assessment will be imposed, the event obligatingthe Company to pay the assessment has occurred and the amount of the assessment can be reasonably estimated.
The Company has a liability for estimated guaranty fund assessments and a related premium tax asset. At December 31,2015 and 2014, the estimated liability was $13 million and $14 million, respectively. The related premium tax asset atboth December 31, 2015 and 2014 was $12 million. The expected period over which guaranty fund assessments will bemade and the related tax credits recovered is not known.
ContingenciesThe Company and its subsidiaries are involved in the normal course of business in legal, regulatory and arbitrationproceedings, including class actions, concerning matters arising in connection with the conduct of its activities as adiversified financial services firm. These include proceedings specific to the Company as well as proceedings generally
163

applicable to business practices in the industries in which it operates. The Company can also be subject to litigation arisingout of its general business activities, such as its investments, contracts, leases and employment relationships. Uncertaineconomic conditions, heightened and sustained volatility in the financial markets and significant financial reform legislationmay increase the likelihood that clients and other persons or regulators may present or threaten legal claims or thatregulators increase the scope or frequency of examinations of the Company or the financial services industry generally.
As with other financial services firms, the level of regulatory activity and inquiry concerning the Company’s businessesremains elevated. From time to time, the Company receives requests for information from, and/or has been subject toexamination or claims by, the SEC, FINRA, the OCC, the UK Financial Conduct Authority, state insurance and securitiesregulators, state attorneys general and various other domestic or foreign governmental and quasi-governmental authoritieson behalf of themselves or clients concerning the Company’s business activities and practices, and the practices of theCompany’s financial advisors. The Company has numerous pending matters which include information requests, exams orinquiries that the Company has received during recent periods regarding certain matters, including: sales and distribution ofmutual funds, annuities, equity and fixed income securities, real estate investment trusts, insurance products, and financialadvice offerings; supervision of the Company’s financial advisors; administration of insurance and annuity claims; securityof client information; trading activity; and front office systems and controls at the Company’s UK subsidiary. The Companyis also responding to regulatory audits, market conduct examinations and other state inquiries relating to an industry-wideinvestigation of unclaimed property and escheatment practices and procedures. The number of reviews and investigationshas increased in recent years with regard to many firms in the financial services industry, including Ameriprise Financial.The Company has cooperated and will continue to cooperate with the applicable regulators.
These legal and regulatory proceedings and disputes are subject to uncertainties and, as such, it is inherently difficult todetermine whether any loss is probable or even possible, or to reasonably estimate the amount of any loss. The Companycannot predict with certainty if, how or when any such proceedings will be initiated or resolved or what the eventualsettlement, fine, penalty or other relief, if any, may be, particularly for proceedings that are in their early stages ofdevelopment or where plaintiffs seek indeterminate damages. Numerous issues may need to be resolved, including throughpotentially lengthy discovery and determination of important factual matters, and by addressing unsettled legal questionsrelevant to the proceedings in question, before a loss or range of loss can be reasonably estimated for any proceeding. Anadverse outcome in one or more proceeding could eventually result in adverse judgments, settlements, fines, penalties orother sanctions, in addition to further claims, examinations or adverse publicity that could have a material adverse effecton the Company’s consolidated financial condition, results of operations or liquidity.
In accordance with applicable accounting standards, the Company establishes an accrued liability for contingent litigationand regulatory matters when those matters present loss contingencies that are both probable and can be reasonablyestimated. In such cases, there still may be an exposure to loss in excess of any amounts reasonably estimated andaccrued. When a loss contingency is not both probable and estimable, the Company does not establish an accrued liability,but continues to monitor, in conjunction with any outside counsel handling a matter, further developments that would makesuch loss contingency both probable and reasonably estimable. Once the Company establishes an accrued liability withrespect to a loss contingency, the Company continues to monitor the matter for further developments that could affect theamount of the accrued liability that has been previously established, and any appropriate adjustments are made eachquarter.
Certain legal and regulatory proceedings are described below.
In November 2014, a lawsuit was filed against the Company’s London-based asset management affiliate in England’s HighCourt of Justice Commercial Court, entitled Otkritie Capital International Ltd and JSC Otkritie Holding v. Threadneedle AssetManagement Ltd. and Threadneedle Management Services Ltd. (‘‘Threadneedle Defendants’’). Claimants allege that theThreadneedle Defendants should be held liable for the wrongful acts of one of its former employees, who in February 2014was held jointly and severally liable with several other parties for conspiracy and dishonest assistance in connection with afraud perpetrated against Claimants in 2011. Claimants allege they were harmed by that fraud in the amount of$120 million. The Threadneedle Defendants applied to the Court for an Order dismissing the proceedings as an abuse ofprocess of the Court. This application was declined in August 2015. The Threadneedle Defendants applied to the Court ofAppeal for leave to appeal, which application was granted in November 2015. A hearing on the appeal is expected inJanuary 2017 and the case is stayed pending the outcome of the appeal. The Company cannot reasonably estimate therange of loss, if any, that may result from this matter due to the early procedural status of the case, the number of partiesinvolved, and the failure to allege any specific, evidence based damages.
24. Related Party Transactions
The Company may engage in transactions in the ordinary course of business with significant shareholders or theirsubsidiaries, between the Company and its directors and officers or with other companies whose directors or officers mayalso serve as directors or officers for the Company or its subsidiaries. The Company carries out these transactions on
164

customary terms. The transactions have not had a material impact on the Company’s consolidated results of operations orfinancial condition.
The Company’s executive officers and directors may have transactions with the Company or its subsidiaries involvingfinancial products and insurance services. All obligations arising from these transactions are in the ordinary course of theCompany’s business and are on the same terms in effect for comparable transactions with the general public. Suchobligations involve normal risks of collection and do not have features or terms that are unfavorable to the Company or itssubsidiaries.
25. Segment Information
The Company’s reporting segments are Advice & Wealth Management, Asset Management, Annuities, Protection andCorporate & Other.
The accounting policies of the segments are the same as those of the Company, except for operating adjustments definedbelow, the method of capital allocation, the accounting for gains (losses) from intercompany revenues and expenses andnot providing for income taxes on a segment basis.
The largest source of intersegment revenues and expenses is retail distribution services, where segments are chargedtransfer pricing rates that approximate arm’s length market prices for distribution through the Advice & WealthManagement segment. The Advice & Wealth Management segment provides distribution services for affiliated andnon-affiliated products and services. The Asset Management segment provides investment management services for theCompany’s owned assets and client assets, and accordingly charges investment and advisory management fees to theother segments.
All costs related to shared services are allocated to the segments based on a rate times volume or fixed basis.
The Advice & Wealth Management segment provides financial planning and advice, as well as full-service brokerageservices, primarily to retail clients through the Company’s advisors. These services are centered on long-term, personalrelationships between the Company’s advisors and its clients and focus on helping clients confidently achieve their financialgoals. The Company’s advisors provide a distinctive approach to financial planning and have access to a broad selection ofboth affiliated and non-affiliated products to help clients meet their financial needs. A significant portion of revenues in thissegment is fee-based, driven by the level of client assets, which is impacted by both market movements and net assetflows. The Company also earns net investment income on invested assets primarily from certificate products. This segmentearns revenues (distribution fees) for distributing non-affiliated products and intersegment revenues (distribution fees) fordistributing the Company’s affiliated products and services provided to its retail clients. Intersegment expenses for thissegment include expenses for investment management services provided by the Asset Management segment.
The Asset Management segment provides investment management and advice and investment products to retail, high networth and institutional clients on a global scale through Columbia Threadneedle Investments, a new brand launched onMarch 30, 2015 that represents the combined capabilities, resources and reach of Columbia Management InvestmentAdvisers, LLC (‘‘Columbia Management’’) and Threadneedle. Although the group now operates under one brand,established investment teams, strategies and processes in place at both firms will not change as a result of the newbrand, nor will existing funds or client portfolios and mandates. Columbia Management primarily provides products andservices in the U.S. and Threadneedle primarily provides products and services internationally. The Company provides U.S.retail clients with products through unaffiliated third party financial institutions and through the Advice & WealthManagement segment, and provides institutional products and services through its institutional sales force. Internationalretail products are primarily distributed through third-party financial institutions and unaffiliated financial advisors. Retailproducts include U.S. mutual funds and their non-U.S. equivalents, exchange-traded funds and variable product fundsunderlying insurance and annuity separate accounts. Institutional asset management services are designed to meetspecific client objectives and may involve a range of products, including those that focus on traditional asset classes,separately managed accounts, individually managed accounts, CLOs, hedge fund or alternative strategies, collective fundsand property funds. CLOs, hedge fund or alternative strategies and certain private funds are often classified as alternativeassets. Revenues in this segment are primarily earned as fees based on managed asset balances, which are impacted bymarket movements, net asset flows, asset allocation and product mix. The Company may also earn performance fees fromcertain accounts where investment performance meets or exceeds certain pre-identified targets. The Asset Managementsegment also provides intercompany asset management services for Ameriprise Financial subsidiaries. The fees for all suchservices are reflected within the Asset Management segment results through intersegment transfer pricing. Intersegmentexpenses for this segment include distribution expenses for services provided by the Advice & Wealth Management,Annuities and Protection segments.
The Annuities segment provides variable and fixed annuity products of RiverSource Life companies to individual clients. TheCompany provides variable annuity products through its advisors and its fixed annuity products are distributed through both
165

affiliated and unaffiliated advisors and financial institutions. Revenues for the Company’s variable annuity products areprimarily earned as fees based on underlying account balances, which are impacted by both market movements and netasset flows. Revenues for the Company’s fixed annuity products are primarily earned as net investment income on assetssupporting fixed account balances, with profitability significantly impacted by the spread between net investment incomeearned and interest credited on the fixed account balances. The Company also earns net investment income on ownedassets supporting reserves for immediate annuities and for certain guaranteed benefits offered with variable annuities andon capital supporting the business. Intersegment revenues for this segment reflect fees paid by the Asset Managementsegment for marketing support and other services provided in connection with the availability of variable insurance trustfunds (‘‘VIT Funds’’) under the variable annuity contracts. Intersegment expenses for this segment include distributionexpenses for services provided by the Advice & Wealth Management segment, as well as expenses for investmentmanagement services provided by the Asset Management segment.
The Protection segment offers a variety of products to address the protection and risk management needs of theCompany’s retail clients including life, DI and property casualty insurance. Life and DI products are primarily providedthrough the Company’s advisors. The Company’s property casualty products are sold through affinity relationships. TheCompany issues insurance policies through its life insurance subsidiaries and the Property Casualty companies. The primarysources of revenues for this segment are premiums, fees, and charges that the Company receives to assume insurance-related risk. The Company earns net investment income on owned assets supporting insurance reserves and capitalsupporting the business. The Company also receives fees based on the level of assets supporting VUL separate accountbalances. This segment earns intersegment revenues from fees paid by the Asset Management segment for marketingsupport and other services provided in connection with the availability of VIT Funds under the VUL contracts. Intersegmentexpenses for this segment include distribution expenses for services provided by the Advice & Wealth Managementsegment, as well as expenses for investment management services provided by the Asset Management segment.
The Corporate & Other segment consists of net investment income or loss on corporate level assets, including excesscapital held in the Company’s subsidiaries and other unallocated equity and other revenues as well as unallocatedcorporate expenses. The Corporate & Other segment also includes revenues and expenses of consolidated investmententities, which are excluded on an operating basis.
Management uses segment operating measures in goal setting, as a basis for determining employee compensation and inevaluating performance on a basis comparable to that used by some securities analysts and investors. Consistent withGAAP accounting guidance for segment reporting, operating earnings is the Company’s measure of segment performance.Operating earnings should not be viewed as a substitute for GAAP income from continuing operations before income taxprovision. The Company believes the presentation of segment operating earnings, as the Company measures it formanagement purposes, enhances the understanding of its business by reflecting the underlying performance of its coreoperations and facilitating a more meaningful trend analysis.
Operating earnings is defined as operating net revenues less operating expenses. Operating net revenues and operatingexpenses exclude the results of discontinued operations, the market impact on IUL benefits (net of hedges and the relatedDAC amortization, unearned revenue amortization, and the reinsurance accrual), integration and restructuring charges andthe impact of consolidating investment entities. Operating net revenues also exclude net realized investment gains orlosses. Operating expenses also exclude the market impact on variable annuity guaranteed benefits (net of hedges and therelated DSIC and DAC amortization). The market impact on variable annuity guaranteed benefits and IUL benefits includeschanges in embedded derivative values caused by changes in financial market conditions, net of changes in economichedge values and unhedged items including the difference between assumed and actual underlying separate accountinvestment performance, fixed income credit exposures, transaction costs and certain policyholder contract elections, netof related impacts on DAC and DSIC amortization. The market impact also includes certain valuation adjustments made inaccordance with FASB Accounting Standards Codification 820, Fair Value Measurements and Disclosures, including theimpact on embedded derivative values of discounting projected benefits to reflect a current estimate of the Company’s lifeinsurance subsidiary’s nonperformance spread. Integration and restructuring charges primarily relate to the Company’sacquisition of the long-term asset management business of Columbia Management Group on April 30, 2010. The costsinclude system integration costs, proxy and other regulatory filing costs, employee reduction and retention costs andinvestment banking, legal and other acquisition costs. Beginning in the second quarter of 2012, integration andrestructuring charges also include expenses related to the Company’s transition of its federal savings bank subsidiary,Ameriprise Bank, FSB, to a limited powers national trust bank.
166

The following tables summarize selected financial information by segment and reconcile segment totals to those reportedon the consolidated financial statements:
December 31,
2015 2014
(in millions)Advice & Wealth Management $ 11,338 $ 10,220Asset Management 7,931 7,509Annuities 94,002 98,535Protection 20,755 20,779Corporate & Other 11,316 11,767
Total assets $ 145,342 $ 148,810
Years Ended December 31,
2015 2014 2013
(in millions)Operating net revenues:
Advice & Wealth Management $ 5,013 $ 4,806 $ 4,295Asset Management 3,254 3,320 3,169Annuities 2,541 2,591 2,561Protection 2,384 2,287 2,186Corporate & Other 3 4 15Eliminations(1) (1,461) (1,417) (1,369)
Total segment operating revenues 11,734 11,591 10,857Net realized gains 4 37 7Revenue attributable to CIEs 446 651 345Market impact on IUL benefits, net 7 (11) (10)Market impact of hedges on investments (21) — —
Total net revenues per consolidated statements of operations(2) $ 12,170 $ 12,268 $ 11,199
(1) Represents the elimination of intersegment revenues recognized for the years ended December 31, 2015, 2014 and 2013 in eachsegment as follows: Advice and Wealth Management ($1,035, $997 and $980, respectively); Asset Management ($43, $44 and$39, respectively); Annuities ($340, $235 and $307, respectively); Protection ($42, $139 and $40, respectively); and Corporate &Other ($1, $2 and $3, respectively).
(2) Includes foreign net revenues of $1,038, $1,315 and $897 for the years ended December 31, 2015, 2014 and 2013, respectively.
Years Ended December 31,
2015 2014 2013
(in millions)Operating earnings:
Advice & Wealth Management $ 859 $ 792 $ 592Asset Management 761 788 691Annuities 650 633 629Protection 183 246 336Corporate & Other (199) (230) (229)
Total segment operating earnings 2,254 2,229 2,019Net realized gains 4 37 7Net income attributable to noncontrolling interests 125 381 141Market impact on variable annuity guaranteed benefits, net (214) (94) (170)Market impact on IUL benefits, net (1) (6) (13)Market impact of hedges on investments (21) — —Integration and restructuring charges (5) — (14)
Income from continuing operations before income tax provision per consolidatedstatements of operations $ 2,142 $ 2,547 $ 1,970
167

26. Quarterly Financial Data (Unaudited)
2015 2014
12/31 9/30 6/30 3/31 12/31 9/30 6/30 3/31
(in millions, except per share data)Net revenues $ 3,103 $ 2,886 $ 3,128 $ 3,053 $ 3,089 $ 3,111 $ 3,072 $ 2,996Income from continuing operations before
income tax provision 446 463 615 618 558 720 619 650Income from continuing operations 380 352 476 479 454 565 467 516Loss from discontinued operations, net of tax — — — — (1) — — (1)
Net income 380 352 476 479 453 565 467 515Less: Net income attributable to noncontrolling
interests 23 (45) 61 86 28 145 93 115
Net income attributable to Ameriprise Financial $ 357 $ 397 $ 415 $ 393 $ 425 $ 420 $ 374 $ 400
Earnings per share attributable to AmeripriseFinancial, Inc. common shareholders:Basic
Income from continuing operations $ 2.02 $ 2.20 $ 2.26 $ 2.11 $ 2.27 $ 2.21 $ 1.94 $ 2.05Loss from discontinued operations — — — — (0.01) — — —
Net income $ 2.02 $ 2.20 $ 2.26 $ 2.11 $ 2.26 $ 2.21 $ 1.94 $ 2.05
DilutedIncome from continuing operations $ 2.00 $ 2.17 $ 2.23 $ 2.08 $ 2.23 $ 2.17 $ 1.91 $ 2.01Loss from discontinued operations — — — — (0.01) — — —
Net income $ 2.00 $ 2.17 $ 2.23 $ 2.08 $ 2.22 $ 2.17 $ 1.91 $ 2.01
Weighted average common shares outstanding:Basic 176.6 180.4 183.8 186.3 187.9 190.3 192.7 195.5Diluted 178.9 182.7 186.4 189.1 191.2 193.7 196.2 199.1
Cash dividends declared per common share $ 0.67 $ 0.67 $ 0.67 $ 0.58 $ 0.58 $ 0.58 $ 0.58 $ 0.52Common share price:
High 120.29 129.22 131.76 138.26 137.33 128.51 120.32 116.82Low 100.08 95.52 120.83 121.49 105.41 116.02 100.94 101.29
168
Item 9. Changes in and Disagreements With Accountants on Accounting andFinancial DisclosureNone.
Item 9A. Controls and Procedures
Disclosure Controls and ProceduresWe maintain disclosure controls and procedures (as defined in Rules 13a-15(e) and 15d-15(e) of the Securities ExchangeAct of 1934, as amended (the ‘‘Exchange Act’’)) designed to provide reasonable assurance that the information requiredto be reported in the Exchange Act filings is recorded, processed, summarized and reported within the time periodsspecified in and pursuant to SEC regulations, including controls and procedures designed to ensure that this information isaccumulated and communicated to our management, including our Chief Executive Officer and Chief Financial Officer, asappropriate, to allow timely decisions regarding the required disclosure. It should be noted that, because of inherentlimitations, our company’s disclosure controls and procedures, however well designed and operated, can provide onlyreasonable, and not absolute, assurance that the objectives of the disclosure controls and procedures are met.
Our management, under the supervision and with the participation of our Chief Executive Officer and Chief Financial Officer,evaluated the effectiveness of the disclosure controls and procedures as of the end of the period covered by this report.Based upon that evaluation, our company’s Chief Executive Officer and Chief Financial Officer have concluded that ourdisclosure controls and procedures were effective at a reasonable level of assurance as of December 31, 2015.
Changes in Internal Control over Financial ReportingThere have not been any changes in our internal control over financial reporting (as such term is defined inRules 13a-15(f) and 15d-15(f) under the Exchange Act) during the fourth fiscal quarter of the year to which this reportrelates that have materially affected, or are reasonably likely to materially affect, our company’s internal control overfinancial reporting.
Management’s Report on Internal Control Over Financial ReportingOur management is responsible for establishing and maintaining adequate internal control over financial reporting for theCompany.
The Company’s internal control over financial reporting is a process designed by, or under the supervision of, theCompany’s principal executive and principal financial officers and effected by the Company’s Board of Directors,management and other personnel to provide reasonable assurance regarding the reliability of financial reporting and thepreparation of financial statements for external purposes in accordance with generally accepted accounting principles inthe United States of America, and includes those policies and procedures that:
• Pertain to the maintenance of records that, in reasonable detail, accurately and fairly reflect the transactions anddispositions of the assets of the Company;
• Provide reasonable assurance that transactions are recorded as necessary to permit preparation of financialstatements in accordance with generally accepted accounting principles, and that receipts and expenditures of theCompany are being made only in accordance with authorizations of management and directors of the Company; and
• Provide reasonable assurance regarding prevention or timely detection of unauthorized acquisition, use or disposition ofthe Company’s assets that could have a material effect on the financial statements.
Because of its inherent limitations, internal control over financial reporting may not prevent or detect misstatements. Also,projections of any evaluation of effectiveness to future periods are subject to the risk that controls may becomeinadequate because of changes in conditions, or that the degree of compliance with the policies or procedures maydeteriorate.
The Company’s management, with the participation of our Chief Executive Officer and Chief Financial Officer, assessed theeffectiveness of the Company’s internal control over financial reporting as of December 31, 2015. In making thisassessment, the Company’s management used the criteria set forth in Internal Control — Integrated Framework (2013)issued by the Committee of Sponsoring Organizations of the Treadway Commission.
Based on management’s assessment and those criteria, we believe that, as of December 31, 2015, the Company’sinternal control over financial reporting is effective.
PricewaterhouseCoopers LLP, the Company’s independent registered public accounting firm, has issued an audit report onthe effectiveness of the Company’s internal control over financial reporting as of December 31, 2015.
Item 9B. Other InformationNone.
169

PART III.
Item 10. Directors, Executive Officers and Corporate GovernanceThe following portions of the Proxy Statement are incorporated herein by reference:
• information included under the caption ‘‘Items to be Voted on by Shareholders — Item 1 — Election of Directors’’;
• information included under the caption ‘‘Requirements, Including Deadlines, for Submission of Proxy Proposals,Nomination of Directors and Other Business by Shareholders’’;
• information under the caption ‘‘Corporate Governance-Codes of Conduct’’;
• information included under the caption ‘‘Corporate Governance-Membership on Board Committees’’;
• information under the caption ‘‘Corporate Governance — Nominating and Governance Committee — DirectorNomination Process’’;
• information included under the caption ‘‘Corporate Governance — Audit Committee’’;
• information included under the caption ‘‘Corporate Governance — Audit Committee Financial Experts’’; and
• information under the caption ‘‘Section 16(a) Beneficial Ownership Reporting Compliance.’’
EXECUTIVE OFFICERS OF OUR COMPANYSet forth below is a list of our executive officers as of the date this Annual Report on Form 10-K has been filed with theSEC. None of such officers has any family relationship with any other executive officer or our principal accounting officer,and none of such officers became an officer pursuant to any arrangement or understanding with any other person. Eachsuch officer has been elected to serve until the next annual election of officers or until his or her successor is elected andqualified. Each officer’s age is indicated by the number in parentheses next to his or her name.
James M. Cracchiolo — Chairman and Chief Executive OfficerMr. Cracchiolo (57) has been our Chairman and Chief Executive Officer since September 2005. Prior to that time,Mr. Cracchiolo was Chairman and Chief Executive Officer of American Express Financial Corporation (‘‘AEFC’’) since March2001; President and Chief Executive Officer of AEFC since November 2000; and Group President, Global Financial Servicesof American Express since June 2000. He served as Chairman of American Express Bank Ltd. from September 2000 untilApril 2005 and served as President and Chief Executive Officer of Travel Related Services International from May 1998through July 2003. He is an advisor to the March of Dimes and previously served on the boards of the American Councilof Life Insurers, The Financial Services Roundtable, Tech Data Corporation and the March of Dimes.
Walter S. Berman — Executive Vice President and Chief Financial OfficerMr. Berman (73) has been our Executive Vice President and Chief Financial Officer since September 2005. Prior to that,Mr. Berman served as Executive Vice President and Chief Financial Officer of AEFC, a position he held since January 2003.From April 2001 to January 2004, Mr. Berman served as Corporate Treasurer of American Express.
Kelli A. Hunter — Executive Vice President of Human ResourcesMs. Hunter (54) has been our Executive Vice President of Human Resources since September 2005. Prior to that,Ms. Hunter served as Executive Vice President of Human Resources of AEFC since joining our company in June 2005.Prior to joining AEFC, Ms. Hunter was Senior Vice President-Global Human Capital for Crown Castle InternationalCorporation in Houston, Texas. Prior to that, she held a variety of senior level positions in human resources for SoftwareSpectrum, Inc., Mary Kay, Inc., as well as Morgan Stanley Inc. and Bankers Trust New York Corporation.
John C. Junek — Executive Vice President and General CounselMr. Junek (66) has been our Executive Vice President and General Counsel since September 2005. Prior to that,Mr. Junek served as Senior Vice President and General Counsel of AEFC since June 2000.
Randy Kupper — Executive Vice President and Chief Information OfficerMr. Kupper (57) has been our Executive Vice President and Chief Information Officer since June 2012. Prior to that,Mr. Kupper had served as Executive Vice President-Applications Development since January 2010 and as Senior VicePresident-Applications Development since November 2008. Prior to joining Ameriprise in 2008, he served as a Senior VicePresident-Technology of U.S. Consumer and Small Business Services at American Express, where he spent approximatelyten years holding leadership positions in the technologies organization.
170

Neal Maglaque — President-Advice & Wealth Management, Business Development and Chief Operating OfficerMr. Maglaque (59) has been our President-Advice & Wealth Management, Business Development and Chief OperatingOfficer since June 2012. Prior to that time, Mr. Maglaque served as Executive Vice President and Advice & WealthManagement Chief Operating Officer since 2009, Senior Vice President-USAG Business Planning and Operations since2006 and as Senior Vice President-Lead Financial Officer Enterprise Finance since 2005. Prior thereto, Mr. Maglaque heldseveral leadership positions at American Express.
Deirdre D. McGraw — Executive Vice President-Marketing, Communications and Community RelationsMs. McGraw (45) has been our Executive Vice President-Marketing, Communications and Community Relations since May2014. Previously, Ms. McGraw served as Executive Vice President, Corporate Communications and Community Relationssince February 2010. Prior to that, Ms. McGraw served as Senior Vice President-Corporate Communications andCommunity Relations since February 2007 and as Vice President-Corporate Communications since May 2006. Priorthereto, Ms. McGraw served as Vice President-Business Planning and Communications for our Chairman’s Office, and priorto that, she served as Vice President-Business Planning and Communications for the Group President, Global FinancialServices at American Express.
Colin Moore — Executive Vice President and Global Chief Investment OfficerMr. Moore (57) has been our Executive Vice President and Global Chief Investment Officer since June 2013. Mr. Moorealso continues to serve as Chief Investment Officer-Columbia Management, a position he has held since 2010. Priorthereto, he was head of fixed income and liquidity strategies from 2009 to 2010. Mr. Moore joined Columbia Managementin 2002 as head of equity and has been a member of the investment community since 1983.
Joseph E. Sweeney — President-Advice & Wealth Management, Products and Service DeliveryMr. Sweeney (54) has been our President-Advice & Wealth Management, Products and Service Delivery since June 2012.Prior to that time, Mr. Sweeney served as President-Advice and Wealth Management, Products and Services since May2009 and as President-Financial Planning, Products and Services since 2005. Prior to that, Mr. Sweeney served as SeniorVice President and General Manager of Banking, Brokerage and Managed Products of AEFC since April 2002. Priorthereto, he served as Senior Vice President and Head, Business Transformation, Global Financial Services of AmericanExpress from March 2001 until April 2002. Mr. Sweeney is currently on the board of directors of the Securities Industryand Financial Markets Association.
David K. Stewart — Senior Vice President and Controller (Principal Accounting Officer)Mr. Stewart (62) has been our Senior Vice President and Controller since September 2005. Prior to that, Mr. Stewartserved as Vice President and Controller of AEFC and its subsidiaries since June 2002, when he joined American Express.Prior thereto, Mr. Stewart held various management and officer positions in accounting, financial reporting and treasuryoperations at Lutheran Brotherhood, now known as Thrivent Financial for Lutherans, where he was Vice President-Treasurerfrom 1997 until 2001.
William F. Truscott — CEO-Global Asset ManagementMr. Truscott (55) has been our CEO — Global Asset Management since September 2012. Prior to that time, Mr. Truscotthad served as CEO — U.S. Asset Management and President, Annuities since May 2010, as President — U.S. AssetManagement, Annuities and Chief Investment Officer since February 2008 and as President — U.S. Asset Managementand Chief Investment Officer since September 2005. Prior to that, Mr. Truscott served as Senior Vice President and ChiefInvestment Officer of AEFC, a position he held since he joined the company in September 2001.
John R. Woerner — President-Insurance & Annuities and Chief Strategy OfficerMr. Woerner (46) has been our President — Insurance and Annuities and Chief Strategy Officer since September 2012.Prior to that time, he served as President — Insurance and Chief Strategy Officer since February 2008 and, as Senior VicePresident — Strategy and Business Development since September 2005. Prior to that, Mr. Woerner served as Senior VicePresident — Strategic Planning and Business Development of AEFC since March 2005. Prior to joining AEFC, Mr. Woernerwas a Principal at McKinsey & Co., where he spent approximately ten years serving leading U.S. and European financialservices firms, and co-led McKinsey’s U.S. Asset Management Practice.
CORPORATE GOVERNANCEWe have adopted a set of Corporate Governance Principles and Categorical Standards of Director Independence which,together with the charters of the three standing committees of the Board of Directors (Audit; Compensation and Benefits;and Nominating and Governance) and our Code of Conduct (which constitutes the Company’s code of ethics), provide theframework for the governance of our company. A complete copy of our Corporate Governance Principles and CategoricalStandards of Director Independence, the charters of each of the Board committees, the Code of Conduct (which applies
171

not only to our Chief Executive Officer, Chief Financial Officer and Controller, but also to all other employees of ourcompany) and the Code of Business Conduct for the Members of the Board of Directors may be found by clicking the‘‘Corporate Governance’’ link found on our Investor Relations website at ir.ameriprise.com. You may also access ourInvestor Relations website through our main website at ameriprise.com by clicking on the ‘‘Investor Relations’’ link, whichis located at the bottom of the page. (Information from such sites is not incorporated by reference into this report.) Youmay also obtain free copies of these materials by writing to our Corporate Secretary at our principal executive offices.
Item 11. Executive Compensation
The following portions of the Proxy Statement are incorporated herein by reference:
• information under the caption ‘‘Corporate Governance — Compensation and Benefits Committee — CompensationCommittee Interlocks and Insider Participation’’;
• information included under the caption ‘‘Compensation of Executive Officers’’; and
• information included under the caption ‘‘Compensation of Directors.’’
Item 12. Security Ownership of Certain Beneficial Owners and Management andRelated Stockholder Matters
Equity Compensation Plan Information(a) (b) (c)
Number of securitiesNumber of securities remaining available for future
to be issued upon Weighted-average issuance under equityexercise of exercise price of compensation plans
outstanding options, outstanding options, (excluding securities reflectedwarrants and rights warrants and rights in column (a)) — shares
Plan categoryEquity compensation plans approved by security
holders 9,111,343(1) $ 81.39 16,836,687Equity compensation plans not approved by
security holders 2,724,579(2) $ 47.50 6,343,600(3)
Total 11,835,922 $ 81.11 23,180,287
(1) Includes 1,874,474 share units subject to vesting per the terms of the applicable plan which could result in the issuance of commonstock. As the terms of these share based awards do not provide for an exercise price, they have been excluded from the weightedaverage exercise price in column B.
(2) Includes 2,663,922 share units subject to vesting per the terms of the applicable plans which could result in the issuance ofcommon stock. As the terms of these share based awards do not provide for an exercise price, they have been excluded from theweighted average exercise price in column B. For additional information on the Company’s equity compensation plans see Note 17 —Share-Based Compensation to our Consolidated Financial Statements in Part II, Item 8 of this Annual Report on Form 10-K. Thenon-shareholder approved plans consist of the Ameriprise Financial 2008 Employment Incentive Equity Award Plan, the AmeripriseAdvisor Group Deferred Compensation Plan and the Ameriprise Financial Franchise Advisor Deferred Compensation Plan.
(3) Consists of 3,258,635 shares of common stock issuable under the terms of the Ameriprise Financial 2008 Employment IncentiveEquity Award Plan, 2,250,234 shares of common stock issuable under the Ameriprise Advisor Group Deferred Compensation Plan,and 834,731 shares of common stock issuable under the Ameriprise Financial Franchise Advisor Deferred Compensation Plan.
172

Descriptions of our equity compensation plans can be found in Note 17 to our Consolidated Financial Statements includedin Part II, Item 8 of this Annual Report on Form 10-K. Information concerning the market for our common shares and ourshareholders can be found in Part II, Item 5 of this Annual Report on Form 10-K. Price and dividend informationconcerning our common shares may be found in Note 26 to our Consolidated Financial Statements included in Part II,Item 8 of this Annual Report on Form 10-K. The information included under the caption ‘‘Ownership of Our CommonShares’’ in the Proxy Statement is incorporated herein by reference.
Item 13. Certain Relationships and Related Transactions, and DirectorIndependence
The information under the captions ‘‘Corporate Governance — Director Independence,’’ ‘‘Corporate Governance —Categorical Standards of Director Independence,’’ ‘‘Corporate Governance — Independence of Committee Members’’ and‘‘Certain Transactions’’ in the Proxy Statement is incorporated herein by reference.
Item 14. Principal Accountant Fees and Services
The information set forth under the heading ‘‘Items to be Voted on by Shareholders — Item 3 — Ratification of AuditCommittee’s Selection of the Company’s Independent Registered Public Accountants for 2016 — Independent RegisteredPublic Accountant Fees’’; ‘‘ — Services to Associated Organizations’’; and ‘‘ — Policy on Pre-Approval of Services Providedby Independent Registered Public Accountants,’’ in the Proxy Statement is incorporated herein by reference.
PART IV.
Item 15. Exhibits and Financial Statement Schedules
(a) 1. Financial Statements:
The information required herein has been provided in Item 8, which is incorporated herein by reference.
2. Financial schedules required to be filed by Item 8 of this form, and by Item 15(b):
Schedule I — Condensed Financial Information of Registrant (Parent Company Only)
All other financial schedules are not required under the related instructions, or are inapplicable and therefore havebeen omitted.
3. Exhibits:
The list of exhibits required to be filed as exhibits to this report are listed on pages E-1 through E-3 hereof under‘‘Exhibit Index,’’ which is incorporated herein by reference.
173

SignaturesPursuant to the requirements of the Securities Exchange Act of 1934, the registrant has duly caused this report to besigned on its behalf by the undersigned, thereunto duly authorized.
AMERIPRISE FINANCIAL, INC.
Registrant
Date: February 25, 2016 By /s/ Walter S. Berman
Walter S. BermanExecutive Vice President andChief Financial Officer
POWER OF ATTORNEYKNOW ALL PERSONS BY THESE PRESENTS, that each of the undersigned directors and officers of AmeripriseFinancial, Inc., a Delaware corporation, does hereby make, constitute and appoint James M. Cracchiolo, Walter S. Bermanand John C. Junek, and each of them, the undersigned’s true and lawful attorneys-in-fact, with power of substitution, forthe undersigned and in the undersigned’s name, place and stead, to sign and affix the undersigned’s name as suchdirector and/or officer of said corporation to an Annual Report on Form 10-K or other applicable form, and all amendmentsthereto, to be filed by such corporation with the Securities and Exchange Commission, Washington, D.C., under theSecurities Exchange Act of 1934, as amended, with all exhibits thereto and other supporting documents, with saidCommission, granting unto said attorneys-in-fact, and any of them, full power and authority to do and perform any and allacts necessary or incidental to the performance and execution of the powers herein expressly granted.
Pursuant to the requirements of the Securities Exchange Act of 1934, this report has been signed below by the followingpersons on behalf of the registrant and in the capacity and on the dates indicated.
Date: February 25, 2016 By /s/ James M. Cracchiolo
James M. CracchioloChairman and Chief Executive Officer(Principal Executive Officer and Director)
Date: February 25, 2016 By /s/ Walter S. Berman
Walter S. BermanExecutive Vice President andChief Financial Officer(Principal Financial Officer)
Date: February 25, 2016 By /s/ David K. Stewart
David K. StewartSenior Vice President and Controller(Principal Accounting Officer)
Date: February 25, 2016 By /s/ Dianne Neal Blixt
Dianne Neal BlixtDirector
174

Date: February 25, 2016 By /s/ Amy DiGeso
Amy DiGesoDirector
Date: February 25, 2016 By /s/ Lon R. Greenberg
Lon R. GreenbergDirector
Date: February 25, 2016 By /s/ Siri S. Marshall
Siri S. MarshallDirector
Date: February 25, 2016 By /s/ Jeffrey Noddle
Jeffrey NoddleDirector
Date: February 25, 2016 By /s/ H. Jay Sarles
H. Jay SarlesDirector
Date: February 25, 2016 By /s/ Robert F. Sharpe, Jr.
Robert F. Sharpe, Jr.Director
Date: February 25, 2016 By /s/ William H. Turner
William H. TurnerDirector
175

Report of Independent Registered Public Accounting Firm onFinancial Statement Schedule
To the Board of Directors and Shareholders of Ameriprise Financial, Inc.:
Our audits of the consolidated financial statements and of the effectiveness of internal control over financial reportingreferred to in our report dated February 25, 2016 appearing in this Annual Report to Shareholders of AmeripriseFinancial, Inc. on Form 10-K also included audits of the financial statement schedule listed in the index appearing underItem 15(a)(2) of this Form 10-K. In our opinion, this financial statement schedule presents fairly, in all material respects,the information set forth therein when read in conjunction with the related consolidated financial statements.
/s/ PricewaterhouseCoopers LLP
Minneapolis, MinnesotaFebruary 25, 2016
F-1

Schedule I — Condensed Financial Information of Registrant(Parent Company Only)
Condensed Statements of Operations . . . . . . . . . . . . . . . . . . . . . . . . . . . . . . . . . . . . . . . . . . . . . . . . . . F-3
Condensed Balance Sheets . . . . . . . . . . . . . . . . . . . . . . . . . . . . . . . . . . . . . . . . . . . . . . . . . . . . . . . . F-4
Condensed Statements of Cash Flows . . . . . . . . . . . . . . . . . . . . . . . . . . . . . . . . . . . . . . . . . . . . . . . . . . F-5
Notes to Condensed Financial Information of Registrant . . . . . . . . . . . . . . . . . . . . . . . . . . . . . . . . . . . . . . . F-6
F-2

Schedule I — Condensed Financial Information of RegistrantCondensed Statements of Operations(Parent Company Only)
Years Ended December 31,
2015 2014 2013
(in millions)Revenues
Management and financial advice fees $ (1) $ — $ 4Distribution fees — — 1Net investment income 2 30 33Other revenues 14 11 7
Total revenues 15 41 45Expenses
Benefits, claims, losses and settlement expenses 13 11 19Interest and debt expense 124 118 123General and administrative expense 193 195 221
Total expenses 330 324 363
Pretax loss before equity in earnings of subsidiaries (315) (283) (318)Income tax benefit (123) (88) (85)
Loss before equity in earnings of subsidiaries (192) (195) (233)Equity in earnings of subsidiaries excluding discontinued operations 1,754 1,816 1,570
Net income from continuing operations 1,562 1,621 1,337Loss from discontinued operations, net of tax — (2) (3)
Net income 1,562 1,619 1,334Other comprehensive income (loss), net of tax (409) 67 (599)
Total comprehensive income $ 1,153 $ 1,686 $ 735
See Notes to Condensed Financial Information of Registrant.
F-3

Schedule I — Condensed Financial Information of RegistrantCondensed Balance Sheet(Parent Company Only)
December 31,
2015 2014
(in millions, except shareamounts)
AssetsCash and cash equivalents $ 661 $ 1,257Investments 513 1,181Loans to subsidiaries 167 167Due from subsidiaries 227 212Receivables 40 22Land, buildings, equipment, and software, net of accumulated depreciation of $993 and $823,
respectively 294 232Investments in subsidiaries 7,779 7,762Other assets 1,425 1,577
Total assets $ 11,106 $ 12,410
Liabilities and Shareholders’ EquityLiabilities:Accounts payable and accrued expenses $ 198 $ 211Due to subsidiaries 148 329Borrowings from subsidiaries 331 349Debt 2,707 3,062Other liabilities 642 569
Total liabilities 4,026 4,520
Shareholders’ Equity:Common shares ($.01 par value; shares authorized, 1,250,000,000; shares issued, 322,822,746 and
320,990,255, respectively) 3 3Additional paid-in capital 7,611 7,345Retained earnings 9,551 8,469Treasury shares, at cost (151,789,486 and 137,880,746 shares, respectively) (10,338) (8,589)Accumulated other comprehensive income, net of tax, including amounts applicable to equity investments
in subsidiaries 253 662
Total shareholders’ equity 7,080 7,890
Total liabilities and equity $ 11,106 $ 12,410
See Notes to Condensed Financial Information of Registrant.
F-4

Schedule I — Condensed Financial Information of RegistrantCondensed Statements of Cash Flows(Parent Company Only)
Years Ended December 31,
2015 2014 2013
(in millions)Cash Flows from Operating ActivitiesNet income $ 1,562 $ 1,619 $ 1,334Equity in earnings of subsidiaries excluding discontinued operations (1,754) (1,816) (1,570)Loss from discontinued operations, net of tax — 2 3Dividends received from subsidiaries 1,485 1,569 1,163Other operating activities, primarily with subsidiaries 183 614 (34)
Net cash provided by operating activities 1,476 1,988 896
Cash Flows from Investing ActivitiesAvailable-for-Sale securities:
Proceeds from sales 112 62 2Maturities, sinking fund payments and calls 506 284 191Purchases (28) (756) (109)
Proceeds from sale of other investments 62 — 43Purchase of other investments (5) (50) (1)Purchase of land, buildings, equipment and software (47) (40) (54)Contributions to subsidiaries (271) (31) (106)Return of capital from subsidiaries 146 284 470Repayment of loans to subsidiaries 2,897 3,402 1,420Issuance of loans to subsidiaries (2,897) (3,112) (1,412)Other, net 7 99 20
Net cash provided by investing activities 482 142 464
Cash Flows from Financing ActivitiesDividends paid to shareholders (465) (426) (401)Repurchase of common shares (1,741) (1,577) (1,583)Cash paid for purchased options with deferred premiums (19) (388) (4)Cash received for purchased options with deferred premiums — 59 23Issuances of debt, net of issuance costs — 543 744Repayments of long-term debt (409) (200) (350)Loans from subsidiaries — 15 —Repayment of loans from subsidiaries (18) (15) —Exercise of stock options 16 33 118Excess tax benefits from share-based compensation 81 162 120Other, net 1 (4) (2)
Net cash used in financing activities (2,554) (1,798) (1,335)
Net increase (decrease) in cash and cash equivalents (596) 332 25Cash and cash equivalents at beginning of year 1,257 925 900
Cash and cash equivalents at end of year $ 661 $ 1,257 $ 925
Supplemental Disclosures:Interest paid on debt $ 154 $ 145 $ 129Income taxes paid, net 378 482 354Non-cash dividends from subsidiaries 52 152 —Non-cash contributions to subsidiaries — 51 —
See Notes to Condensed Financial Information of Registrant.
F-5

Schedule I — Condensed Financial Information of RegistrantNotes to Condensed Financial Information of Registrant(Parent Company Only)
1. Basis of PresentationThe accompanying Condensed Financial Statements include the accounts of Ameriprise Financial, Inc. (the ‘‘Registrant,’’‘‘Ameriprise Financial’’ or ‘‘Parent Company’’) and, on an equity basis, its subsidiaries and affiliates. The appropriatedretained earnings of consolidated investment entities are not included on the Parent Company Only Condensed FinancialStatements. The financial statements have been prepared in accordance with U.S. generally accepted accountingprinciples. The financial information of the Parent Company should be read in conjunction with the Consolidated FinancialStatements and Notes of Ameriprise Financial. Parent Company revenues and expenses, other than compensation andbenefits and debt and interest expense, are primarily related to intercompany transactions with subsidiaries and affiliates.
The change in the fair value of derivative instruments used as hedges is reflected in the Parent Company Only CondensedStatements of Operations. For certain of these derivatives, the change in the hedged item is reflected in the subsidiaries’Statements of Operations. The change in fair value of derivatives used to hedge asset-based distribution fees is included indistribution fees, while the underlying distribution fee revenue is reflected in equity in earnings of subsidiaries. The changein fair value of derivatives used to economically hedge exposure to equity price risk of Ameriprise Financial, Inc. commonstock granted as part of the Ameriprise Financial Franchise Advisor Deferred Compensation Plan is included in distributionexpenses, while the underlying distribution expenses are reflected in equity in earnings of subsidiaries. The change in fairvalue of certain derivatives used to economically hedge risk related to GMWB provisions is included in benefits, claims,losses and settlement expenses, while the underlying benefits, claims, losses and settlement expenses are reflected inequity in earnings of subsidiaries.
In the fourth quarter of 2015, the Parent Company recorded a capital lease that had previously been incorrectly recordedas an operating lease for Ameriprise Financial Center. The cumulative adjustment included a capital lease asset of$70 million, net of accumulated depreciation, and a related capital lease obligation of $60 million and a $10 millionincrease in pretax income. The impact to the prior period financial statements was not material. The lease term forAmeriprise Financial Center began in November 2000 and extends for 20 years, with several options to extend the term.
2. Discontinued OperationsThe results of Securities America Financial Corporation and its subsidiaries (collectively, ‘‘Securities America’’) have beenpresented as discontinued operations for all prior periods presented. The Company completed the sale of SecuritiesAmerica in the fourth quarter of 2011.
3. DebtAll of the debt of Ameriprise Financial is borrowings of the Parent Company, except as indicated below.
• At both December 31, 2015 and 2014, the debt of Ameriprise Financial included $50 million of repurchaseagreements, which are accounted for as secured borrowings.
• At both December 31, 2015 and 2014, Ameriprise Financial had $150 million of borrowings from the Federal HomeLoan Bank of Des Moines, which is collateralized with commercial mortgage backed securities.
4. Borrowings from SubsidiariesThe Parent Company has intercompany lending arrangements with its subsidiaries. At the end of each business day, takinginto consideration all legal and regulatory requirements associated with its subsidiaries, Ameriprise Financial is entitled todraw on all funds in specified bank accounts. Repayment of all or a portion of the funds is due on demand. The ParentCompany also has revolving credit agreements with its subsidiaries as the borrower aggregating $1.0 billion as ofDecember 31, 2015, of which nil was outstanding.
5. Guarantees, Commitments and ContingenciesThe Parent Company is the guarantor for operating leases of IDS Property Casualty Insurance Company and certain othersubsidiaries.
All consolidated legal, regulatory and arbitration proceedings, including class actions of Ameriprise Financial, Inc. and itsconsolidated subsidiaries are potential or current obligations of the Parent Company.
F-6

The Parent Company has committed revolving credit agreements with its subsidiaries as the lender aggregating $1.0 billionas of December 31, 2015.
The Parent Company and Ameriprise Certificate Company (‘‘ACC’’) entered into a Capital Support Agreement on March 2,2009, pursuant to which the Parent Company agrees to commit such capital to ACC as is necessary to satisfy applicableminimum capital requirements. Effective April 30, 2014, this agreement was amended to revise the maximumcommitment to $50 million. For the years ended December 31, 2015, 2014 and 2013, ACC did not draw upon theCapital Support Agreement and had met all applicable capital requirements.
The Parent Company and IDS Property Casualty Insurance Company (‘‘IDS Property Casualty’’) entered into a CapitalSupport Agreement on September 30, 2015, pursuant to which the Parent Company agrees to commit such capital to IDSProperty Casualty as is necessary to maintain IDS Property Casualty’s current financial strength ratings by AM Best. Themaximum capital amount is $150 million. Effective February 1, 2016, this agreement was amended to revise theexpiration date to be April 1, 2017. For the year ended December 31, 2015, IDS Property Casualty did not draw upon theCapital Support Agreement.
Ameriprise Financial Services Inc. (‘‘AFSI’’) entered into a FINRA approved subrogation agreement with the Parent Companyon December 15, 2014 for regulatory net capital purposes. The agreement consists of a $200 million secured demandnote. The note is secured by cash and securities equal to the principal value of the note pledged by the Parent Company.For the year ended December 31, 2015, AFSI had not made a demand of the principal amount.
F-7

Exhibit IndexPursuant to the rules and regulations of the Securities and Exchange Commission, we have filed certain agreements asexhibits to this Annual Report on Form 10-K. These agreements may contain representations and warranties by the parties.These representations and warranties have been made solely for the benefit of the other party or parties to suchagreements and (i) may have been qualified by disclosures made to such other party or parties, (ii) were made only as ofthe date of such agreements or such other date(s) as may be specified in such agreements and are subject to morerecent developments, which may not be fully reflected in our public disclosure, (iii) may reflect the allocation of risk amongthe parties to such agreements and (iv) may apply materiality standards different from what may be viewed as material toinvestors. Accordingly, these representations and warranties may not describe our actual state of affairs at the date hereofand should not be relied upon.
The following exhibits are filed as part of this Annual Report on Form 10-K. The exhibit numbers followed by an asterisk (*)indicate exhibits electronically filed herewith. All other exhibit numbers indicate exhibits previously filed and are herebyincorporated herein by reference. Exhibits numbered 10.2 through 10.26 are management contracts or compensationplans or arrangements.
Exhibit Description
3.1 Amended Restated Certificate of Incorporation of Ameriprise Financial, Inc. (incorporated by reference to Exhibit 3.1 to theCurrent Report on Form 8-K, File No. 1-32525, filed on May 1, 2014).
3.2 Amended and Restated Bylaws of Ameriprise Financial, Inc. (incorporated by reference to Exhibit 3.2 to the Current Report onForm 8-K, File No. 1-32525, filed on May 1, 2014).
4.1 Form of Specimen Common Stock Certificate (incorporated by reference to Exhibit 4.1 to Amendment No. 3 to Form 10Registration Statement, File No. 1-32525, filed on August 19, 2005).
Other instruments defining the rights of holders of long-term debt securities of the registrant are omitted pursuant toSection (b)(4)(iii)(A) of Item 601 of Regulation S-K. The registrant agrees to furnish copies of these instruments to the SECupon request.
4.2 Indenture dated as of October 5, 2005, between Ameriprise Financial, Inc. and U.S. Bank National Association, trustee(incorporated by reference to Exhibit 4(a) to the Registration Statement on Form S-3, File No. 333-128834, filed onOctober 5, 2005).
4.3 Indenture dated as of May 5, 2006, between Ameriprise Financial, Inc. and U.S. Bank National Association, trustee(incorporated by reference to Exhibit 4.A to the Registration Statement on Form S-3ASR, File No. 333-133860, filed onMay 5, 2006).
4.4 Junior Subordinated Debt Indenture, dated as of May 5, 2006, between Ameriprise Financial, Inc. and U.S. Bank NationalAssociation, trustee (incorporated by reference to Exhibit 4.C to the Registration Statement on Form S-3ASR, FileNo. 333-133860, filed on May 5, 2006).
10.1 Tax Allocation Agreement by and between American Express and Ameriprise Financial, Inc., dated as of September 30, 2005(incorporated by reference to Exhibit 10.2 to the Current Report on Form 8-K, File No. 1-32525, filed on October 4, 2005).
10.2 Ameriprise Financial 2005 Incentive Compensation Plan, as amended and restated effective April 30, 2014 (incorporated byreference to Exhibit B to the Proxy Statement for the Annual Meeting of Shareholders held on April 30, 2014, FileNo. 001-32525, filed on March 17, 2014).
10.3 Ameriprise Financial Deferred Compensation Plan, as amended and restated effective January 1, 2012 (incorporated byreference to Exhibit 10.3 of the Annual Report on Form 10-K, File No. 1-32525, filed on February 24, 2012).
10.4 Ameriprise Financial Supplemental Retirement Plan, as amended and restated effective April 1, 2010 (incorporated byreference to Exhibit 10.3 of the Quarterly Report on Form 10-Q, File No. 1-32525, filed on May 4, 2010).
10.5 Form of Ameriprise Financial 2005 Incentive Compensation Plan Master Agreement for Substitution Awards (incorporated byreference to Exhibit 10.8 to Amendment No. 2 to Form 10 Registration Statement, File No. 1-32525, filed on August 15,2005).
10.6 Ameriprise Financial Form of Award Certificate — Non-Qualified Stock Option Award (incorporated by reference to Exhibit 10.4to the Current Report on Form 8-K, File No. 1-32525, filed on October 4, 2005).
10.7 Ameriprise Financial Form of Award Certificate — Restricted Stock Award (incorporated by reference to Exhibit 10.5 to theCurrent Report on Form 8-K, File No. 1-32525, filed on October 4, 2005).
10.8 Ameriprise Financial Form of Award Certificate — Restricted Stock Unit Award (incorporated by reference to Exhibit 10.6 tothe Current Report on Form 8-K, File No. 1-32525, filed on October 4, 2005).
10.9 Ameriprise Financial Form of Agreement — Cash Incentive Award (incorporated by reference to Exhibit 10.7 to the CurrentReport on Form 8-K, File No. 1-32525, filed on October 4, 2005).
10.10 Ameriprise Financial Long-Term Incentive Award Program Guide (incorporated by reference to Exhibit 10.10 of the AnnualReport on Form 10-K File No. 1-32525, filed on February 29, 2008).
10.11 Ameriprise Financial Performance Cash Unit Plan Supplement to the Long Term Incentive Award Program Guide (incorporatedby reference to Exhibit 10.1 of the Quarterly Report on Form 10-Q, File No. 1-32525, filed on May 2, 2011).
10.12* Ameriprise Financial Form of Award Certificate — Performance Cash Unit Plan Award.
10.13 Ameriprise Financial Performance Share Unit Plan Supplement to the Long-Term Incentive Award Program Guide (incorporatedby reference to Exhibit 10.3 of the Quarterly Report on Form 10-Q, File No. 1-32525, filed on May 2, 2011).
10.14* Ameriprise Financial Form of Award Certificate — Performance Share Unit Plan Award.
E-1

Exhibit Description
10.15 Ameriprise Financial Deferred Share Plan for Outside Directors, as amended and restated effective December 3, 2014.
10.16 CEO Security and Compensation Arrangements (incorporated by reference to Item 1.01 of the Current Report on Form 8-K,File No. 1-32525, filed on October 31, 2005).
10.17 Ameriprise Financial Senior Executive Severance Plan, as amended and restated effective January 1, 2012 (incorporated byreference to Exhibit 10.17 of the Annual Report on Form 10-K, File No. 1-32525, filed on February 24, 2012).
10.18 Restricted Stock Awards in lieu of Key Executive Life Insurance Program (incorporated by reference to Item 1.01 of theCurrent Report on Form 8-K, File No. 1-32525, filed on November 18, 2005).
10.19 Ameriprise Financial Annual Incentive Award Plan, adopted effective as of September 30, 2005 (incorporated by reference toExhibit 10.28 of the Annual Report on Form 10-K, File No. 1-32525, filed on March 8, 2006).
10.20 Form of Indemnification Agreement for directors, Chief Executive Officer, Chief Financial Officer, General Counsel and PrincipalAccounting Officer and any other officers designated by the Chief Executive Officer (incorporated by reference to Exhibit 10.1to the Current Report on Form 8-K, File No. 1-32525, filed on April 26, 2012).
10.21 Ameriprise Financial 2008 Employment Incentive Equity Award Plan (incorporated by reference to Exhibit 4.1 to theRegistration Statement on Form S-8, File No. 333-156075, filed on December 11, 2008).
10.22 First Amendment to the Ameriprise Financial 2008 Employment Incentive Equity Award Plan dated September 29, 2015(incorporated by reference to Exhibit 10.1 to the Quarterly Report on Form 10-Q, File No. 1-32525, filed on November 2,2015).
10.23* Ameriprise Advisor Group Deferred Compensation Plan, as amended and restated effective January 1, 2016.
10.24 Amended and Restated Credit Agreement, dated as of May 1, 2015, among Ameriprise Financial, Inc., the lenders partythereto, Wells Fargo Bank, National Association, as Administrative Agent, Bank of America, N.A., as Syndication Agent, andCredit Suisse AG, Cayman Islands Branch, HSBC Bank USA, National Association, Citibank, N.A., and JPMorgan ChaseBank, N.A., as Co-Documentation Agents (incorporated by reference to Exhibit 10.1 to the Quarterly Report on Form 10-Q,File No. 1-32525, filed on May 4, 2015).
12* Ratio of Earnings to Fixed Charges.
13* Portions of the Ameriprise Financial, Inc. 2015 Annual Report to Shareholders, which, except for those sections incorporatedherein by reference, are furnished solely for the information of the SEC and are not to be deemed ‘‘filed.’’
21* Subsidiaries of Ameriprise Financial, Inc.
23* Consent of PricewaterhouseCoopers LLP, Independent Registered Public Accounting Firm.
24 Powers of attorney (included on Signature Page).
31.1* Certification of James M. Cracchiolo pursuant to Rule 13a-14(a) promulgated under the Securities Exchange Act of 1934, asamended.
31.2* Certification of Walter S. Berman pursuant to Rule 13a-14(a) promulgated under the Securities Exchange Act of 1934, asamended.
32* Certification of James M. Cracchiolo and Walter S. Berman pursuant to 18 U.S.C. Section 1350, as adopted pursuant toSection 906 of the Sarbanes-Oxley Act of 2002.
101* The following materials from Ameriprise Financial, Inc.’s Annual Report on Form 10-K for the year ended December 31, 2015,formatted in XBRL: (i) Consolidated Statements of Operations for the years ended December 31, 2015, 2014 and 2013;(ii) Consolidated Statements of Comprehensive Income for the years ended December 31, 2015, 2014 and 2013;(iii) Consolidated Balance Sheets at December 31, 2015 and 2014; (iv) Consolidated Statements of Equity for the yearsended December 31, 2015, 2014 and 2013; (v) Consolidated Statements of Cash Flows for the years ended December 31,2015, 2014 and 2013; (vi) Notes to the Consolidated Financial Statements; and (vii) Schedule I — Condensed FinancialInformation of Registrant (Parent Only).
E-2

Comparison of a five-year cumulative total return* Ameriprise Financial, Inc., the S&P 500 Index and the S&P 500 Financials Index
$300
$250
$50
$0
$100
$150
$200
3/11
12/1
0
6/11
9/11
12/1
1
3/12
6/12
9/12
12/1
2
3/1
3
6/1
3
9/1
3
12/1
3
3/14
6/14
9/14
12/1
4
3/15
6/15
9/15
12
/15
The graph belo compares the cumulative five-year total return for shareholders of Ameriprise Financial, Inc. common stock ith the cumulative total returns of the S&P 500 Index and the S&P 500 Financials Index. The graph tracks the performance of a 100 investment in our common stock and in each index ( ith the reinvestment of all dividends) from Dec. 31, 2010 to Dec. 31, 2015.
P erforman ce G raph
100 invested on Dec. 31, 2010 in stock or index, including reinvestment of dividends.
Fiscal year ending Dec. 31.
The Standard & Poor s 500 Index (S&P 500 Index), an unmanaged index of common stocks, is fre uently used as a general measure of market performance. The Index reflects reinvestment of all distributions and changes in market prices, but excludes brokerage commissions or other fees. The S&P 500 Financials Index measures the performance of financial components of the S&P 500 Index.
Past performance does not guarantee future results. It is not possible to invest directly in an index.
Copyright © 2016 S&P, a division of The McGra - ill Companies. All rights reserved.
Ameriprise Financial, Inc. S&P 500 Index S&P 500 Financials Index

Executive OfficesAmeriprise Financial Center 707 2nd Avenue South Minneapolis, MN 55474 612.671.3131
7 World Trade Center 250 Greenwich Street, Suite 3900 New York, NY 10007
Information Available to ShareholdersCopies of our company’s Annual Report on Form 10-K, proxy statement, press releases and other documents, as well as information on financial results and products and services, are available through the Ameriprise Financial website at ameriprise.com. Written copies of these materials are available without charge, upon written request to the corporate secretary’s office.
Stock Exchange ListingNew York Stock Exchange Symbol: AMP
Independent Registered Public Accounting FirmPricewaterhouseCoopers LLP 225 South 6th Street, Suite 1400 Minneapolis, MN 55402
Transfer AgentComputershare Trust Company, N.A. P.O. Box 30170 College Station, TX 77842 866.337.4999 (U.S. and Canada only) 781.575.3223 (International)
Email: [email protected]
Website: computershare.com/ameriprise
Annual MeetingThe 2016 Annual Meeting of Shareholders of Ameriprise Financial will be held at our Minneapolis headquarters at 707 2nd Avenue South, Minneapolis, MN 55474, on Wednesday, April 27, 2016, at 11 a.m. Central time. A written or audio transcript of the meeting will be available upon written request to the corporate secretary’s office. There will be a modest charge to defray production and mailing costs.
Shareholders As of Feb. 12, 2016, there were 15,429 shareholders of record. Copies of the Ameriprise Financial Corporate Governance Guidelines, as well as the charters of the four standing committees of the Board of Directors and the Ameriprise Financial Company Code of Conduct, are available on the company’s website at ir.ameriprise.com. Our website also provides important information about how and when we grant share-based compensation such as stock options and restricted stock, including the schedule of grant dates for 2016. We provide a copy of our Long-Term Incentive Awards Policy on our website and explain our policy for the approval of grants on a date when the Compensation and Benefits Committee of the Board of Directors or our chairman and chief executive officer is aware of material, nonpublic information about our company or its securities. Copies of these materials are available without charge, upon written request to the corporate secretary’s office.
We filed the Certifications of our chief executive officer and chief financial officer with the Securities and Exchange Commission pursuant to section 302 of the Sarbanes-Oxley Act of 2002 as exhibits 31.1 and 31.2 respectively, to our Annual Report on Form 10-K for the year ended Dec. 31, 2015.
Shareholder and Investor InquiriesWritten shareholder inquiries may be sent to: Computershare Shareholder Services P.O. Box 30170 College Station, TX 77842
or to: Corporate Secretary’s Office 1098 Ameriprise Financial Center Minneapolis, MN 55474
Written inquiries from the investment community should be sent to: Investor Relations 243 Ameriprise Financial Center Minneapolis, MN 55474
TrademarksThe following service marks of Ameriprise Financial, Inc. and its affiliates appear in this report:
Acorn®
Ameriprise Financial®
Be Brilliant.SM
Columbia Threadneedle Investments®
Confident Retirement®
SecureSource 4®
SecureSource 4 Plus®
The service mark Acorn is owned by Columbia Acorn Trust.
This report was printed using a printer recognized by the Printing Industry of Minnesota for its green initiatives and is certified as a Very Small Quantity Generator. The press used to print the report emits no volatile organic compounds.
General Information

James M. Cracchiolo Chairman and Chief Executive Officer
Walter S. Berman Executive Vice President and Chief Financial Officer
Campbell Fleming Chief Executive Officer EMEA and Global Chief Operating Officer Columbia Threadneedle Investments
Kelli A. Hunter Executive Vice President, Human Resources
John C. Junek Executive Vice President and General Counsel
Randy C. Kupper Executive Vice President and Chief Information Officer
Neal Maglaque President, Advice & Wealth Management Business Development and Chief Operating Officer
Deirdre D. McGraw Executive Vice President, Marketing, Corporate Communications and Community Relations
Colin Moore Executive Vice President, Global Chief Investment Officer
Patrick H. O’Connell Executive Vice President, Ameriprise Advisor Group
Joseph E. Sweeney President, Advice & Wealth Management Products and Service Delivery
William F. (Ted) Truscott Chief Executive Officer, Global Asset Management
William J. (Bill) Williams Executive Vice President, Ameriprise Franchise Group
John R. Woerner President, Insurance & Annuities and Chief Strategy Officer
James M. Cracchiolo Chairman and Chief Executive Officer Ameriprise Financial, Inc.
Dianne Neal Blixt Former Executive Vice President and Chief Financial Officer Reynolds American, Inc.
Amy DiGeso Former Executive Vice President Global Human Resources The Estée Lauder Companies Inc.
Lon R. Greenberg Chairman Emeritus and Former Chairman and Chief Executive Officer, UGI Corporation
Siri S. Marshall Former Senior Vice President and General Counsel General Mills, Inc.
Jeffrey Noddle Former Chairman SUPERVALU INC.
H. Jay Sarles Private Investor Former Vice Chairman Bank of America
Robert F. Sharpe, Jr. Former President Commercial Foods and Chief Administrative Officer ConAgra Foods, Inc.
William H. Turner Former Dean Montclair State University Former Chairman PNC Bank, NA, New Jersey
Executive Leadership Team Board of Directors
NOTE: Messrs. Fleming, O’Connell and Williams are not executive officers of Ameriprise Financial for the purposes of Section 16 of the Securities Exchange Act of 1934, as amended.

Financial Planning | Retirement | Investments | Insurance
ameriprise.com
© 2016 Ameriprise Financial, Inc. All rights reserved. 400425 M (3/16)