americans’ debt styles by age and over time...americans’ debt styles by age a nd over time 3 age...
TRANSCRIPT

H O U S I N G F I N A N C E P O L I C Y C E N T E R
RE S E A RC H RE P O R T
Americans’ Debt Styles by Age and
over Time
Wei Li Laurie Goodman
November 2015

AB O U T T H E U R BA N I N S T I T U TE
The nonprofit Urban Institute is dedicated to elevating the debate on social and economic policy. For nearly five
decades, Urban scholars have conducted research and offered evidence-based solutions that improve lives and
strengthen communities across a rapidly urbanizing world. Their objective research helps expand opportunities for
all, reduce hardship among the most vulnerable, and strengthen the effectiveness of the public sector.
Copyright © November 2015. Urban Institute. Permission is granted for reproduction of this file, with attribution to
the Urban Institute. Cover image by Tim Meko.
Contents Acknowledgments iv
Americans’ Debt Styles by Age and over Time 1
Age Patterns of All Debts 3
Middle-Aged Consumers Bear the Highest Debt Burden 3
Debt Patterns and the Life-Cycle Model of Consumption 6
Age Patterns of Five Major Types of Debts 6
Debt Types by Age Groups 6
Amount of Debt by Debt Type and Age Groups 7
Consumers’ Credit Scores and Debt Types 10
Debt Styles: Combinations of Different Types of Debts 11
17 Debt Styles 11
Debt Styles by Age Groups 11
Conclusion 13
Appendix A: A Closer Look at Debt Styles by Individual Debt Types 15
Auto Debt 15
Mortgage Debt 17
HELOC Debt 19
Student Loan Debt 21
Credit Card Debt 23
Appendix B: Detailed Results 26
Notes 37
References 38
About the Authors 39
Statement of Independence 41

Acknowledgments The Urban Institute’s Housing Finance Policy Center (HFPC) was launched with generous support at
the leadership level from the Citi Foundation and the John D. and Catherine T. MacArthur Foundation.
Additional support was provided by the Ford Foundation and the Open Society Foundations.
Ongoing support for HFPC is also provided by the Housing Finance Council, a group of firms and
individuals supporting high-quality independent research that informs evidence-based policy
development. Funds raised through the Housing Finance Council provide flexible resources, allowing
HFPC to anticipate and respond to emerging policy issues with timely analysis. This funding supports
HFPC’s research, outreach and engagement, and general operating activities.
This report was funded by these combined sources. We are grateful to them and to all our funders,
who make it possible for Urban to advance its mission.
The views expressed are those of the authors and should not be attributed to the Urban Institute,
its trustees, or its funders. Funders do not determine our research findings or the insights and
recommendations of our experts. Further information on the Urban Institute’s funding principles is
available at www.urban.org/support.

Americans’ Debt Styles by Age and
over Time This research report, the first in a series, reviews five years of consumer credit data to better
understand the debt styles of American consumers: how those styles differ for different age groups, and
how those styles have evolved. Subsequent reports will explore other aspects of the data, as well as
raise, and attempt to answer, some questions about why the data look as they do.
Our data consist of a random 2 percent sample of five years of depersonalized consumer data
(2010–2014) from a major credit bureau. Consumers were chosen based on the last two digits of their
personal identification number (assigned by the credit bureau for internal use). This generated a total of
5.314 million consumers for the August 2010 draw. The same information for each consumer was
collected each August from 2010 through 2014, creating panel data with five snapshots for each
consumer in the panel. If a consumer dropped out of the data (for example, because he or she passed
away), a new consumer was added in a manner that retains randomness in the sample. All records were
stripped of personally identifiable information, and no data on race/ethnicity, gender, or income were
included. The data included zip code, age,1 Vantage score,
2 information on debt in collection, and
balance and payment information for each of the following trade types: auto loan, credit card, student
loan, home equity line of credit, first mortgage, and second mortgage.
Test how much you know about consumer debt by taking our quiz on the next page.

2 A M E R I C A N S ’ D E B T S T Y L E S B Y A G E A N D O V E R T I M E
Debt Style Pop Quiz
Q1: What kind of consumer debt do most Americans carry?
a. No debt b. Credit card only c. Credit card and mortgage d. Credit card and auto e. Student loan and auto
Q2: At what age are borrowers most likely to have auto debt?
a. 20s and 30s b. 30s and 40s c. 40s and 50s d. 50s and 60s e. 60s and up
Q3: Which types of debt have grown from 2010 to 2014?
a. Student and auto loans b. Mortgages and home equity lines of credit (HELOCs) c. Credit cards for younger households d. a and b e. a and c
Q4: The borrower groups with the lowest credit scores are those with what kind(s) of debt?
a. No debt b. Auto loans only c. Auto loans and credit cards d. Auto and student loans e. Auto loans, credit cards, mortgages, HELOCs, and student loans
Q5: Those with mortgage debt typically have less mortgage debt than other Americans if they have
a. Only mortgage debt b. Mortgages and auto loans c. Mortgages and HELOCs d. Mortgages, auto loans, and HELOCs e. Mortgages, auto loans, and student loans
Answers: Q1: a (followed by b); Q2: b; Q3: e; Q4: a (followed by b); Q5: a.
If you answered all five questions correctly, you don’t have to read this paper; you should have
helped us write it. If you answered four questions correctly, you are a very astute observer of the debt
scene and you may or may not benefit from reading on. If you answered three or fewer questions
correctly, we promise you will learn something if you keep reading.

A M E R I C A N S ’ D E B T S T Y L E S B Y A G E A N D O V E R T I M E 3
Age Patterns of All Debts
Middle-Aged Consumers Bear the Highest Debt Burden
Those without debt tend to be quite young: approximately 54.5 percent of consumers ages 18–22 are
debt free, as are 39.2 percent of those between 23 and 27 (figure 1A).3 The percentage of borrowers
with no debt drops steadily as borrowers age, falling to 18.1 percent for the 63–67 age group, after
which it rises again, reaching 36.1 percent for those older than 77.4 And balances follow a similar
pattern. Figure 2A shows that, for those with debt, the debt burden is lowest for the very young and the
very old, peaking for borrowers between ages 38 and 52.
Figure 1A shows five trend lines, one for each year between 2010 and 2014. For consumers
younger than 48 years old, the percentage without debt of any kind has dropped steadily; as the
economy has improved, consumers have been comfortable increasing their leverage.
Figure 3A (page 9) shows the median 2014 credit scores of all consumers with and without debt.
Our analysis reveals that, within each age cohort, those without debt tend to have much lower Vantage
scores. For example, the 39.2 percent of 23–27-year-olds with no debt have a median Vantage score of
524, versus 669 for those who have debt. This difference is a bit narrower for older consumers, but still
quite dramatic. Those over age 77 who have no debt have a median Vantage score of 675, versus 805
for consumers with debt. This suggests that those who have no debt have not built the credit history
necessary to obtain debt, rather than the alternative, that they have no need for debt. Across age
groups, younger consumers tend to have much lower credit scores than older consumers. For example,
the median Vantage score for consumers 30 or younger is no more than 650; but it is more than 780 for
consumers 68 or older.

4 A M E R I C A N S ’ D E B T S T Y L E S B Y A G E A N D O V E R T I M E
FIGURE 1
Percentage of Consumers with One of the Five Major Types of Debt, by Age Group
A. No debt B. Credit card
C. Student loan D. Auto loan
E. Mortgage F. Home equity line of credit
Source: Authors’ calculations.
Note: Each line represents a year between 2010 and 2014.
0 1
2
3
4
18-22 23-27 28-32 33-37 38-42 43-47 48-52 53-57 58-62 63-67 68-72 73-77 >77
Age Groups
20
30
40
50
% o
f A
ll C
on
su
mers
0123
4
18-22 23-27 28-32 33-37 38-42 43-47 48-52 53-57 58-62 63-67 68-72 73-77 >77
Age Groups
40
50
60
70
% o
f C
on
su
mers
Wit
h D
eb
t
0
1234
18-22 23-27 28-32 33-37 38-42 43-47 48-52 53-57 58-62 63-67 68-72 73-77 >77
Age Groups
0
5
10
15
20
% o
f C
on
su
mers
Wit
h D
eb
t
01
2
3
4
18-22 23-27 28-32 33-37 38-42 43-47 48-52 53-57 58-62 63-67 68-72 73-77 >77
Age Groups
10
20
30
% o
f C
on
su
mers
Wit
h D
eb
t
01234
18-22 23-27 28-32 33-37 38-42 43-47 48-52 53-57 58-62 63-67 68-72 73-77 >77
Age Groups
0
10
20
30
40
% o
f C
on
su
mers
Wit
h D
eb
t
01234
18-22 23-27 28-32 33-37 38-42 43-47 48-52 53-57 58-62 63-67 68-72 73-77 >77
Age Groups
0.0
2.5
5.0
7.5
10.0
12.5
% o
f C
on
su
mers
Wit
h D
eb
t

A M E R I C A N S ’ D E B T S T Y L E S B Y A G E A N D O V E R T I M E 5
FIGURE 2
Median Balance on Major Types of Debts by Age Group
A. Any debt B. Credit card
C. Student loan D. Auto loan
E. Mortgage F. Home equity line of credit
Source: Authors’ calculations.
Note: Each line represents a year between 2010 and 2014.
01234
18-22 23-27 28-32 33-37 38-42 43-47 48-52 53-57 58-62 63-67 68-72 73-77 >77
Age Groups
0
20,000
40,000
60,000
80,000
Med
ian
Bala
nce (
$)
01234
18-22 23-27 28-32 33-37 38-42 43-47 48-52 53-57 58-62 63-67 68-72 73-77 >77
Age Groups
1,000
2,000
3,000
4,000
Med
ian
Bala
nce (
$)
0
1234
18-22 23-27 28-32 33-37 38-42 43-47 48-52 53-57 58-62 63-67 68-72 73-77 >77
Age Groups
8,000
10,000
12,000
14,000
16,000
Med
ian
Bala
nce (
$)
0123
4
18-22 23-27 28-32 33-37 38-42 43-47 48-52 53-57 58-62 63-67 68-72 73-77 >77
Age Groups
10,000
12,000
14,000
16,000
Med
ian
Bala
nce (
$)
01234
18-22 23-27 28-32 33-37 38-42 43-47 48-52 53-57 58-62 63-67 68-72 73-77 >77
Age Groups
80,000
100,000
120,000
140,000
160,000
Med
ian
Bala
nce (
$)
01
234
18-22 23-27 28-32 33-37 38-42 43-47 48-52 53-57 58-62 63-67 68-72 73-77 >77
Age Groups
20,000
25,000
30,000
35,000
40,000
Med
ian
Bala
nce (
$)

6 A M E R I C A N S ’ D E B T S T Y L E S B Y A G E A N D O V E R T I M E
Debt Patterns and the Life-Cycle Model of Consumption
The result that the debt burden is lowest for the youngest and oldest age group is somewhat at odds
with the economic literature on the life-cycle model of consumption. The model suggests that a
consumer’s level of consumption should be proportional to average lifetime income rather than actual
income at any given age (Friedman 1956; Hall 1978; Modigliani and Brumberg 1954). That is, younger
age groups theoretically consume more than their income, but as their income rises through the years,
their consumption won’t rise proportionately. Instead, much of the rising income is saved for retire-
ment. During retirement, while income is low, people maintain their lifestyle by living off their savings.
We are not the first to show that this pattern does not hold. We support the conclusion of a number
of earlier empirical studies that consumer’s actual choices differ from those of the life-cycle model of
consumption in a number of ways: First, consumers tend to borrow and consume less than predicted
early in their lifetimes. Second, they also tend to consume more and save less than predicted in middle
age, when they have their highest earnings; consequently they do not have enough savings to maintain
their consumption levels in retirement (Bernanke 1984; Carroll 1997; Flavin 1981; Hall and Mishkin
1982; Mankiw and Shapiro 1985; Shapiro and Slemrod 2003; Souleles 1999; Stephens 2003).
Further, younger consumers tend to have lower credit scores than older consumers; and, within an
age group, borrowers with no debt have lower credit scores than those with debt. Both facts support
the earlier conclusion of Wilcox (1989) and Zeldes (1989): consumers avoid debt because they are
constrained on what they can borrow and how much it costs, rather than because they have no need for
debt.
Apart from this report, little in the literature demonstrates how the type and the amount of debt, as
well as consumers credit scores by debt styles, change across age groups.
Age Patterns of Five Major Types of Debts
Debt Types by Age Groups
In 2014, the percentage of consumers with credit card spending5 (61 percent) exceeded the percentage
of consumers with any other type of debt. The next largest debt category was auto loans (29 percent),
then mortgages (28 percent), then student loans (11 percent), then HELOCs (6 percent).

A M E R I C A N S ’ D E B T S T Y L E S B Y A G E A N D O V E R T I M E 7
Distinctive age patterns are associated with each debt type. Figure 2 shows that the percentage of
consumers with each of the five major types of debt follows an inverted U shape, rising and then falling
again as consumers move to older age groups. However, the curve for each type of debt peaks at a
different age cohort and with different smoothness and symmetry. The highest percentage of
consumers have credit card debt in their 30s through early 70s (figure 1B), student loan debt in their
20s and 30s (figure 1C), auto debt in their 30s through 50s (figure 1D), mortgage debt in their late 30s
through early 60s (figure 1E), and HELOC debt in their early 40s through late 60s (figure 1F).
These debt patterns reflect lifestyle changes as consumers get older: they finish their higher
education and largely pay off the associated debt in their 20s and 30s, finance and become auto and
homeowners in their 30s through their 60s, and accumulate enough equity on their homes to finance
other spending against that equity in their late 40s through late 60s.
Unfortunately, our numbers for credit card debt do not allow us to differentiate between those who
use credit cards as a transaction vehicle, paying off their bills each month, and those who use credit
cards as a credit vehicle to finance their purchases over time.6 We can see, however, that 40 percent of
consumers in their early 20s have credit card spending, increasing steadily to 75 percent of consumers
in their 60s and then falling again into their 70s and beyond (figure 1B).
Excluding credit card spending, the percentage of consumers without any auto, mortgage, HELOC,
or student debt follows a more symmetric U shape: 80 percent of consumers in their early 20s do not
have these types of debt. This share of consumers quickly falls to only 40 percent in their late 30s
through late 50s, but rises again to more than 70 percent in their late 60s and older (figure 4).
Amount of Debt by Debt Type and Age Groups
As shown in figure 2A, consumers’ median total debt balance rises from $10,000 in their mid-20s to
$65,000 in their late 30s through early 50s, then falls again as they move to older age cohorts.
While the general inverted-U age patterns apply to the median balance for each type of debt, there
are distinct differences among the debt types. Consumers with auto loans have the highest debt burden
in from their late 30s to their 40s ($14,000, figure 2D); consumers with mortgage debt are most
burdened in their 30s and 40s ($160,000, figure 2E); and consumers with HELOCs owe the most in their
late 40s ($36,000, figure 2F). The amount of student debt peaks from the 30s to the early 40s ($15,000,
figure 2C), an older age than the peak percentage of consumers who have student loans, perhaps
reflecting higher student debt for those attending professional schools (Baum and Johnson 2015). Note
8 A M E R I C A N S ’ D E B T S T Y L E S B Y A G E A N D O V E R T I M E
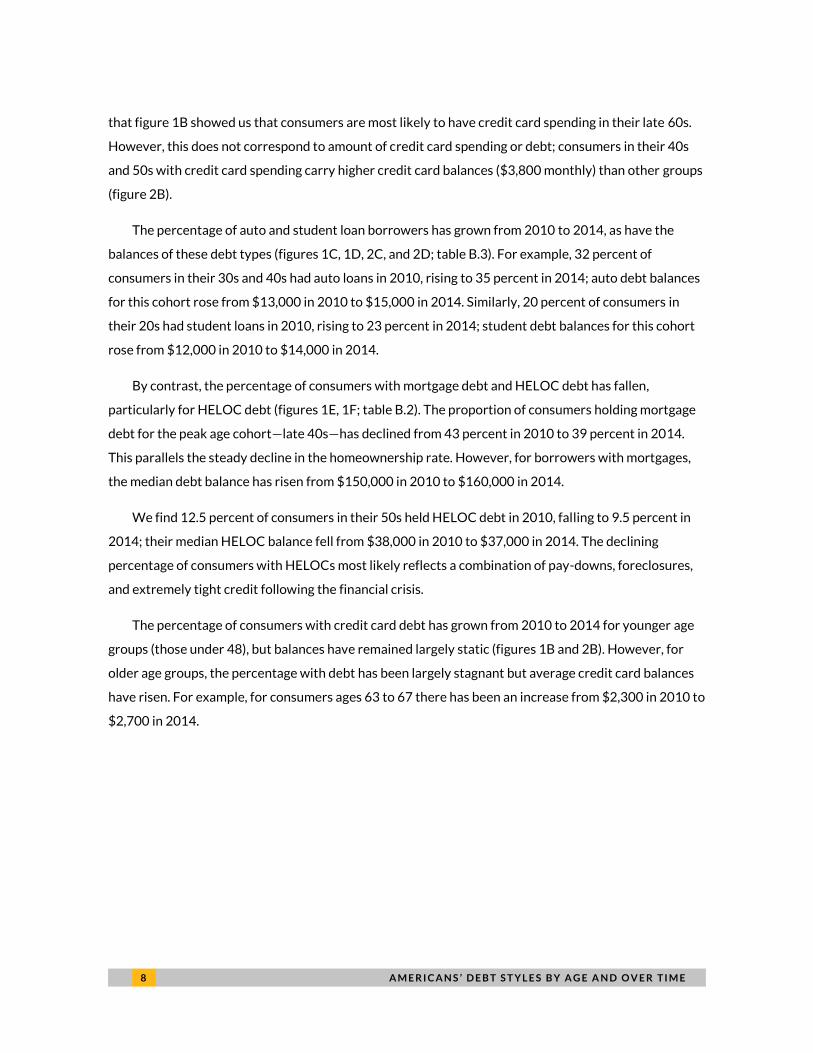
that figure 1B showed us that consumers are most likely to have credit card spending in their late 60s.
However, this does not correspond to amount of credit card spending or debt; consumers in their 40s
and 50s with credit card spending carry higher credit card balances ($3,800 monthly) than other groups
(figure 2B).
The percentage of auto and student loan borrowers has grown from 2010 to 2014, as have the
balances of these debt types (figures 1C, 1D, 2C, and 2D; table B.3). For example, 32 percent of
consumers in their 30s and 40s had auto loans in 2010, rising to 35 percent in 2014; auto debt balances
for this cohort rose from $13,000 in 2010 to $15,000 in 2014. Similarly, 20 percent of consumers in
their 20s had student loans in 2010, rising to 23 percent in 2014; student debt balances for this cohort
rose from $12,000 in 2010 to $14,000 in 2014.
By contrast, the percentage of consumers with mortgage debt and HELOC debt has fallen,
particularly for HELOC debt (figures 1E, 1F; table B.2). The proportion of consumers holding mortgage
debt for the peak age cohort—late 40s—has declined from 43 percent in 2010 to 39 percent in 2014.
This parallels the steady decline in the homeownership rate. However, for borrowers with mortgages,
the median debt balance has risen from $150,000 in 2010 to $160,000 in 2014.
We find 12.5 percent of consumers in their 50s held HELOC debt in 2010, falling to 9.5 percent in
2014; their median HELOC balance fell from $38,000 in 2010 to $37,000 in 2014. The declining
percentage of consumers with HELOCs most likely reflects a combination of pay-downs, foreclosures,
and extremely tight credit following the financial crisis.
The percentage of consumers with credit card debt has grown from 2010 to 2014 for younger age
groups (those under 48), but balances have remained largely static (figures 1B and 2B). However, for
older age groups, the percentage with debt has been largely stagnant but average credit card balances
have risen. For example, for consumers ages 63 to 67 there has been an increase from $2,300 in 2010 to
$2,700 in 2014.

A M E R I C A N S ’ D E B T S T Y L E S B Y A G E A N D O V E R T I M E 9
FIGURE 3
Median Vantage Scores in 2014 for Consumers with (Y) and without (N) a Type of Debt
A. Any debt B. Credit card spending
C. Student loan D. Auto loan
E. Mortgage F. Home equity line of credit
Source: Authors’ calculations.
Note: Curve A represents all consumers.
N
Y
A
18-22 23-27 28-32 33-37 38-42 43-47 48-52 53-57 58-62 63-67 68-72 73-77 >77
Age Groups
500
600
700
800
Med
ian
Van
tag
e S
co
re
N
Y
18-22 23-27 28-32 33-37 38-42 43-47 48-52 53-57 58-62 63-67 68-72 73-77 >77
Age Groups
600
700
800
Med
ian
Van
tag
e S
co
re
NY
18-22 23-27 28-32 33-37 38-42 43-47 48-52 53-57 58-62 63-67 68-72 73-77 >77
Age Groups
600
650
700
750
800
Med
ian
Van
tag
e S
co
re
N
Y
18-22 23-27 28-32 33-37 38-42 43-47 48-52 53-57 58-62 63-67 68-72 73-77 >77
Age Groups
600
650
700
750
800
Med
ian
Van
tag
e S
co
re
N
Y
18-22 23-27 28-32 33-37 38-42 43-47 48-52 53-57 58-62 63-67 68-72 73-77 >77
Age Groups
600
650
700
750
800
Med
ian
Van
tag
e S
co
re
N
Y
18-22 23-27 28-32 33-37 38-42 43-47 48-52 53-57 58-62 63-67 68-72 73-77 >77
Age Groups
650
700
750
800
Med
ian
Van
tag
e S
co
re

1 0 A M E R I C A N S ’ D E B T S T Y L E S B Y A G E A N D O V E R T I M E
Consumers’ Credit Scores and Debt Types
Older consumers tend to have higher credit scores than younger consumers. The median 2014 Vantage
score for consumers in their 20s is 630; this number rises to more than 760 for consumers in their 60s
and 70s (figure 3A and table B.4).
Within each age cohort, consumers with credit card spending have much higher median credit
scores than those without, with an average 160-point gap over all age groups. While the relationship is
quite strong, the causality is unclear. It is possible that those with credit card spending were those with
credit scores high enough to get cards. It is also possible that responsible use of cards increased their
credit scores. While the gap is largest for the youngest age groups and declines with age, the median
Vantage score for consumers in their 70s with credit card spending is still 80 points higher than the
score for those without (figure 3B, table B.4).
For consumers younger than their mid-60s, median credit scores are higher for consumers with
mortgage debt than for those without—undoubtedly, in part, reflecting the difficulty those with low
scores have in getting a mortgage. The largest gap—130 points—occurs in the late 20s and 30s, as
holding a mortgage likely also reflects increased stability and, of course, the transition from renter to
owner (figure 3E). This gap grows narrower as consumers age, and disappears when consumers reach
their mid-60s, when many of those who had mortgages have paid them off. For those in their late 60s
and older, consumers who still have mortgages actually tend to have lower credit scores than those who
don’t.
For those with student loans, borrowers in their late 30s, 40s, and older have lower credit scores
than borrowers with no student loans (figure 3C); for auto loans, borrowers in their late 50s and older
have lower credit scores than those without auto debt (figure 3D); and for HELOCs, borrowers in their
early 70s and older have credit scores than those without the debt (figure 3F). We believe this
crossover point reflects the age when many of the most creditworthy customers have paid off the debt
in question.

A M E R I C A N S ’ D E B T S T Y L E S B Y A G E A N D O V E R T I M E 1 1
Debt Styles: Combinations of Different Types of Debts
17 Debt Styles
Each of the five major types of debt reflects a different aspect of consumers’ lifestyle needs. For a
complete picture of a consumer’s debt style, we have to look at what combinations of debts the
consumer carries at any given time. The consumer may have any combination of auto, mortgage,
HELOC, or student loan debt. That gives us 16 combinations; adding borrowers with only credit card
balances gives us 17 debt styles. The 10 most popular combinations are shown in figure 4 (see table B.1
for a full list of all 17 debt styles). For our analysis, we have not paired credit card debt with other debt,
as we cannot distinguish transaction balances from revolving balances.
The top six debt styles among consumers with a credit record, in descending order, are
1. no debt (29 percent of all consumers),
2. credit card spending only (22 percent),
3. mortgage only (13 percent),
4. auto loan only (12 percent),
5. auto and mortgage (9 percent), and
6. student loan only (4 percent).
However, this rank order is not constant once we divide consumers into age groups. Rankings
within age groups reveal distinct patterns of debt styles, reflecting consumers’ lifestyle changes over
time.
Debt Styles by Age Groups
Except for the “no debt” and “credit card only” styles, which have a U shape, debt styles over age follow
an inverted U shape, first rising and then falling as consumers move to older age groups. Figure 4 shows
age patterns for each debt style.

1 2 A M E R I C A N S ’ D E B T S T Y L E S B Y A G E A N D O V E R T I M E
FIGURE 4
Percentage of Consumers Adopting a Debt Style, by Age Cohort
Source: Authors’ calculations.
54.5
39.2 35.2
32 29.1
26.9 24.2
21.4 19.7 18.1 19.3
21.9
36.1
25.6
18.3
14.2
13.5
13.5 14.2
15.6 18.6 23.1
29.2
36.9
43.9
45.5
0.6
3.6
8 12.4
16.2 18.3 18.7 18.9
18.8
17.4
15
12
6.9 10
14.8
13.6 12.4 11.8 11 10.8 10.6
10.8
11.4
10.8
9.3
5.1 0.4
3.5
7.7 11.3
13.4 13.8 13.3 12.4
11.1
9.5
6.6
4.1
1.5 7.1
11.7
8.1 4.9
2.9 2 1.7 1.5
1.2 0.8
0.6
0.5
0.5
0
0.1
0.7 1.8 3.3 4.3
4.7 4.8
4.7 4.3
3.3 2.3
1
1.5
5.8
4.9 2.9 1.7 1.1
1 0.9
0.6 0.4
0.2 0.2
0.1
0
0.1
0.7 1.8 2.9 3.4
3.5 3.3 2.9
2.4 1.5
0.9
0.3
0.1 1.5
3.5 3.1 1.9 1.5
1.8 1.7 1.1 0.5 0.2
0.1 0
0.2 1.4 3.4 3.9 3.3 3.5 4.7 5.9 6 6 5.6 4.8
3
0%
10%
20%
30%
40%
50%
60%
70%
80%
90%
100%
18-22 23-27 28-32 33-37 38-42 43-47 48-52 53-57 58-62 63-67 68-72 73-77 >77
No Debt CC Only Mort Only Auto Only
Auto+Mort Stud Only Mort+HELOC Stud+Auto
Auto+Mort+HELOC Stud+Auto+Mort Other

A M E R I C A N S ’ D E B T S T Y L E S B Y A G E A N D O V E R T I M E 1 3
1. The “no debt” and “credit card only” debt styles dominate the oldest (82 percent) and youngest
age groups (80 percent). In the middle age groups, consumers are more likely to have something
other than just credit card debt: 60 percent of consumers in their 40s and 50s have at least one
auto loan, student loan, mortgage, or HELOC.
2. The “mortgage debt only” style hits its high mark of 16–19 percent when consumers are in their
late 30s through early 60s, while the “mortgage and HELOC together” debt styles are most
common for those in their 40s through mid-60s (4–5 percent).
3. The “auto loan only” style hits its high mark of 15 percent for consumers in their 20s, but at
least 10 percent of all consumers in each age cohort under 73 have an auto loan.
4. The “auto and mortgage debt together” combination hits its high mark of 13 percent with
consumers in their late 30s through early 50s.
5. The “student loans only” and “student loans plus auto together” styles hits their high-water
marks of 7–12 percent and 5–6 percent, respectively, for consumers in their 20s and decline
quickly after the mid-30s.
In summary, for the 18 to 27 age group, the top three debt styles are “auto only,” “student loan
only,” and “both auto and student loans”; for the 28 to 32 age group, the top three debt styles are “auto
only,” “student only,” and “mortgage only”; for borrowers over age 32, the top three are “mortgage
only,” “auto loan only,” and “both auto and mortgage loans.”
For a closer and deeper look at age patterns of the debt styles and the interrelationship between
different types of debts, see appendix A.
Conclusion
In this paper, we have looked at debt styles across age groups. The basic patterns are not surprising:
student loan debt is more popular among younger borrowers; mortgages are more popular among
borrowers in their 30, 40s, and 50s. Home equity and “credit card only” debt is more prevalent among
older adults. Vantage scores generally rise with age. Those with mortgage debt in the mix have the
highest total indebtedness.
But there are a number of surprises: Consumers who have no debt have weaker credit scores than
those who have debt. Consumers who have auto debt in combination with any other type of debt
generally have lower credit scores than those who do not have auto debt but do have other debt.
Borrowers in their 20s and early 30s with both mortgage and student loan debt have higher credit
scores than borrowers in their later 30s and 40s with the same combination. Those borrowers who hold

1 4 A M E R I C A N S ’ D E B T S T Y L E S B Y A G E A N D O V E R T I M E
only any one type of debt (autos, mortgages, HELOCs, credit cards) generally hold less of that type of
debt than those who use that debt in combination.
We also find that consumers’ actual debt patterns differ from the predictions of the life-cycle model
of consumption, which can be explained by the constraints on what borrowers can borrow at what cost,
rather than they have no need for debt.

A P P E N D I X A 1 5
Appendix A: A Closer Look at Debt
Styles by Individual Debt Types Debt styles are combinations of different types of debts. This section discusses relevant debt styles by
each major debt type separately, by looking at how consumers combine a type of debt with other debt
types, and how the balance on that debt differs by age cohort among different combinations. One
consistent pattern is that those who have only one type of debt tend to have less of that debt than those
who have that type of debt in combination with other types of debt.
One important note: for credit cards, we cannot differentiate between consumers who use their
credit cards for transactional purposes and consumers who carry a revolving balance. Hence, we did not
consider credit cards when discussing debt styles under each of the auto, mortgage, HELOC, and
student loan sections. Instead, the last section of this appendix is devoted to “credit card only” debt and
credit cards in combination with other types of debt.
Figures in appendix A are broken down to allow us to look more closely at consumers who have
each debt type by debt style and age.
Auto Debt
Figure A.1A shows the percentage of consumers with auto loans by age group, the same picture seen in
figure 1D. For consumers in their 20s, approximately 25 percent have auto debt (figure A.1A): 14
percent have auto debt only (figure A.1B), another 6 percent have auto debt plus student loans (figure
A.1C), and 3 percent have auto, and student loan debt (figure A.1D); the balance have other
combinations. For consumers in their 40s, almost 40 percent have auto debt: 11 percent have auto debt
only, 12.5 percent have auto and mortgage debt, 3 percent have auto, mortgage, and HELOC debt, and
the balance have other combinations.
Figure A.2A shows the median balance for those who have auto debt by debt style. Those who have
auto debt only have lower amounts of auto debt than those who have auto debt in combination with
other debt types. Borrowers who have auto debt plus mortgage debt tend to have higher amounts of
auto debt than borrowers that do not have mortgage debt. This becomes clear when comparing line 2
(auto only) to line 3 (auto + mortgage) and line 5 (auto + mortgage + HELOC), or by comparing line 4
(auto + student loan) to line 6 (auto + mortgage + student loan).

1 6 A P P E N D I X A
FIGURE A.1
Debt Styles of Consumers with Auto Loans, by Age Cohort
A. Percentage with auto loans B. Percentage with only auto loans
C. Percentage with auto loans + mortgages D. Percentage with auto + student loans
E. Percentage with auto + mortgage + HELOC F. Percentage with auto + mortgage + student
Source: Authors’ calculations.
18-22 23-27 28-32 33-37 38-42 43-47 48-52 53-57 58-62 63-67 68-72 73-77 >77
Age Groups
10
15
20
25
30
% o
f A
ll C
on
su
mers
18-22 23-27 28-32 33-37 38-42 43-47 48-52 53-57 58-62 63-67 68-72 73-77 >77
Age Groups
6
8
10
12
14
% o
f A
ll C
on
su
mers
18-22 23-27 28-32 33-37 38-42 43-47 48-52 53-57 58-62 63-67 68-72 73-77 >77
Age Groups
0.0
2.5
5.0
7.5
10.0
12.5
% o
f A
ll C
on
su
mers
18-22 23-27 28-32 33-37 38-42 43-47 48-52 53-57 58-62 63-67 68-72 73-77 >77
Age Groups
0
2
4
6
% o
f A
ll C
on
su
mers
18-22 23-27 28-32 33-37 38-42 43-47 48-52 53-57 58-62 63-67 68-72 73-77 >77
Age Groups
0
1
2
3
% o
f A
ll C
on
su
mers
18-22 23-27 28-32 33-37 38-42 43-47 48-52 53-57 58-62 63-67 68-72 73-77 >77
Age Groups
0
1
2
3
% o
f A
ll C
on
su
mers

A P P E N D I X A 1 7
Figure A.2B shows that for all but the very oldest age groups, borrowers who have auto debt and
auto plus student loan debt (lines 2 and 4) also have lower Vantage scores than borrowers who have
auto debt in combination with mortgage debt (lines 3, 5, and 6).
FIGURE A.2
Median Balance and Vantage Scores on Debt Styles with Auto Loan Components, by Age Cohort
A. Median balance ($) B. Median Vantage score
Source: Authors’ calculations.
Note: Line 2 is auto only, line 3 is auto + mortgage, line 4 is auto + student loan, line 5 is auto + mortgage + HELOC, and line 6 is
auto + mortgage + student loan.
Mortgage Debt
Few borrowers have mortgage debt in their 20s. By their late 40s, 40 percent have mortgage debt
(figure A.3). As with auto debt, those who have mortgage debt alone have less average mortgage debt
than those who have mortgage debt as well as another type of debt (figure A.4A). Consumers who also
have HELOC debt have the highest amounts of mortgage debt. Consumers with mortgage debt only
have higher credit scores than those who hold mortgage debt and other debt (figure A.4B).
While credit scores generally increase with age, consumers who have mortgage debt, auto debt,
and student loan debt in their 20s and early 30s tend to have higher credit scores than those who have
that combination by their late 30s and after (figure A.4B). One explanation: mortgage debt is relatively
uncommon in one’s 20s and early 30s, so perhaps those who have this debt at this age have higher
incomes and better credit scores in general. Borrowers with auto debt in any combination with
mortgage debt have lower credit scores than those who have no auto debt.
2
34
5
6
18-22 23-27 28-32 33-37 38-42 43-47 48-52 53-57 58-62 63-67 68-72 73-77 >77
Age Groups
10,000
12,000
14,000
16,000
Med
ian
Bala
nce (
$)
2
3
4
5
6
18-22 23-27 28-32 33-37 38-42 43-47 48-52 53-57 58-62 63-67 68-72 73-77 >77
Age Groups
650
700
750
800
Med
ian
Van
tag
e S
co
re

1 8 A P P E N D I X A
FIGURE A.3
Debt Styles of Consumers with Mortgages, by Age Cohort
A. Percentage with mortgage B. Percentage with mortgage only
C. Percentage with mortgage + auto D. Percentage with mortgage + HELOC
E. Percentage with mortgage + auto + HELOC F. Percentage with mortgage + auto + student
Source: Authors’ calculations.
18-22 23-27 28-32 33-37 38-42 43-47 48-52 53-57 58-62 63-67 68-72 73-77 >77
Age Groups
0
10
20
30
40
% o
f A
ll C
on
su
mers
18-22 23-27 28-32 33-37 38-42 43-47 48-52 53-57 58-62 63-67 68-72 73-77 >77
Age Groups
0
5
10
15
% o
f A
ll C
on
su
mers
18-22 23-27 28-32 33-37 38-42 43-47 48-52 53-57 58-62 63-67 68-72 73-77 >77
Age Groups
0
1
2
3
% o
f A
ll C
on
su
mers
18-22 23-27 28-32 33-37 38-42 43-47 48-52 53-57 58-62 63-67 68-72 73-77 >77
Age Groups
0.0
2.5
5.0
7.5
10.0
12.5
% o
f A
ll C
on
su
mers
18-22 23-27 28-32 33-37 38-42 43-47 48-52 53-57 58-62 63-67 68-72 73-77 >77
Age Groups
0
1
2
3
% o
f A
ll C
on
su
mers
18-22 23-27 28-32 33-37 38-42 43-47 48-52 53-57 58-62 63-67 68-72 73-77 >77
Age Groups
0
1
2
3
4
% o
f A
ll C
on
su
mers

A P P E N D I X A 1 9
FIGURE A.4
Median Balance and Vantage Scores on Debt Styles with Mortgage Components, by Age Cohort
A. Median balance ($) B. Median Vantage score
Source: Authors’ calculations.
Note: Line 2 is mortgage only, line 3 is mortgage + auto, line 4 is mortgage + HELOC, line 5 is mortgage + auto + HELOC, and line 6
is mortgage + auto + student loan.
HELOC Debt
HELOC debt is most commonly found as the only form of debt, or in combination with mortgage debt or
mortgage and auto debt (figure A.5). Other combinations are relatively rare. We had noted earlier in the
paper that HELOC debt is skewed to older borrowers, but borrowers who only have HELOC debt are
even older. Those who have HELOC and mortgage debt or HELOC and mortgage and auto debt are
somewhat younger.
Borrowers older than their mid-50s with HELOC debt have less HELOC debt if they have only HELOC
debt or HELOC and auto debt than borrowers whose debt style includes mortgage debt in any form
(figure A.6A). This pattern is reversed for younger borrowers: those who hold HELOC only or HELOC
and auto debt have more HELOC debt than those who hold the HELOC debt in any combination with
mortgage debt. Further investigation is necessary to determine the reason for this.
Credit scores for those with HELOC debt are quite high across the board (figure A.6B). Older borrowers
with HELOC debt or HELOC debt and auto debt have the highest scores. For younger borrowers with
HELOCs, credit scores are fairly constant across debt styles. The only exception is that younger
borrowers (under 50) who have both HELOC and auto debt have lower scores than other debt styles
with HELOC debt.
2
3
4
5
6
18-22 23-27 28-32 33-37 38-42 43-47 48-52 53-57 58-62 63-67 68-72 73-77 >77
Age Groups
100,000
150,000
200,000
Med
ian
Bala
nce (
$)
2
34
5
6
18-22 23-27 28-32 33-37 38-42 43-47 48-52 53-57 58-62 63-67 68-72 73-77 >77
Age Groups
675
700
725
750
775
800
Med
ian
Van
tag
e S
co
re

2 0 A P P E N D I X A
FIGURE A.5
Debt Styles fo Consumers with Home Equity Lines of Credit, by Age Cohort
A. Percentage with HELOC B. Percentage with Only HELOC
C. Percentage with HELOC+Mortgage. D. % HELOC+Mortgage+Auto
E. Percentage with HELOC+Auto
Source: Authors’ calculations.
18-22 23-27 28-32 33-37 38-42 43-47 48-52 53-57 58-62 63-67 68-72 73-77 >77
Age Groups
0
2
4
6
8
10
% o
f A
ll C
on
su
mers
18-22 23-27 28-32 33-37 38-42 43-47 48-52 53-57 58-62 63-67 68-72 73-77 >77
Age Groups
0
1
2
3
4
% o
f A
ll C
on
su
mers
18-22 23-27 28-32 33-37 38-42 43-47 48-52 53-57 58-62 63-67 68-72 73-77 >77
Age Groups
0
1
2
3
4
% o
f A
ll C
on
su
mers
18-22 23-27 28-32 33-37 38-42 43-47 48-52 53-57 58-62 63-67 68-72 73-77 >77
Age Groups
0
1
2
3
% o
f A
ll C
on
su
mers
18-22 23-27 28-32 33-37 38-42 43-47 48-52 53-57 58-62 63-67 68-72 73-77 >77
Age Groups
0.00
0.25
0.50
0.75
1.00
1.25
% o
f A
ll C
on
su
mers

A P P E N D I X A 2 1
Figure A.6. Median Balance and Vantage Scores on Debt Styles with Home Equity Line of Credit
Components
A. Median balance B. Median Vantage score
Source: Authors’ calculations.
Note: Line 2 is HELOC only, line 3 is HELOC + mortgage, line 4 is HELOC + mortgage + auto, and line 5 is HELOC + auto.
Student Loan Debt
Twenty-one percent of younger consumers have student loan debt, and approximately half of these
have student loan debt only (figure A.7). The median amount of student loan debt does not vary much
by debt style. Borrowers who have student loan debt only generally have slightly less student loan debt
than those that have student loan debt in combination with other debt (figure A.8A). Consumers in their
30s, 40s, and 50s with student loan debt and mortgage debt, with or without auto debt, tend to have the
highest amount of student loan debt of any debt style, suggesting that many have accumulated debt
through graduate school. Consumers with only student loan debt tend to have lower credit scores than
any other group. Those consumers who have mortgage debt in the mix have the highest credit scores
(figure A.8B).
1
2
3
4
5
18-22 23-27 28-32 33-37 38-42 43-47 48-52 53-57 58-62 63-67 68-72 73-77 >77
Age Groups
20000
25000
30000
35000
40000
45000
Med
ian
Bala
nce (
$)
12
3
4
5
18-22 23-27 28-32 33-37 38-42 43-47 48-52 53-57 58-62 63-67 68-72 73-77 >77
Age Groups
700
725
750
775
800
Med
ian
Van
tag
e S
co
re

2 2 A P P E N D I X A
FIGURE A.7
Debt Styles of Consumers with Student Loans, by Age Cohort
A. Percentage with student loans B. Percentage with student loans only
C. Percentage with student + auto D. Percentage with student + auto + mortgage
E. Percentage with student + mortgage
Source: Authors’ calculations.
18-22 23-27 28-32 33-37 38-42 43-47 48-52 53-57 58-62 63-67 68-72 73-77 >77
Age Groups
0
5
10
15
20
% o
f A
ll C
on
su
mers
18-22 23-27 28-32 33-37 38-42 43-47 48-52 53-57 58-62 63-67 68-72 73-77 >77
Age Groups
0.0
2.5
5.0
7.5
10.0
12.5
% o
f A
ll C
on
su
mers
18-22 23-27 28-32 33-37 38-42 43-47 48-52 53-57 58-62 63-67 68-72 73-77 >77
Age Groups
0
2
4
6
% o
f A
ll C
on
su
mers
18-22 23-27 28-32 33-37 38-42 43-47 48-52 53-57 58-62 63-67 68-72 73-77 >77
Age Groups
0
1
2
3
% o
f A
ll C
on
su
mers
18-22 23-27 28-32 33-37 38-42 43-47 48-52 53-57 58-62 63-67 68-72 73-77 >77
Age Groups
0.0
0.5
1.0
1.5
2.0
2.5
% o
f A
ll C
on
su
mers

A P P E N D I X A 2 3
FIGURE A.8
Median Balance and Vantage Scores on Debt Styles with Student Loan Components
A. Median balance ($) B. Median Vantage score
Source: Authors’ calculations.
Note: Line 2 is student only, line 3 is student + auto, line 4 is student + auto + mortgage, and line 5 is student + mortgage.
Credit Card Debt
Consumers with credit card debt range from 40 percent of younger borrowers to over 70 percent of
borrowers in their late 50s and early 70s (figure A.9A). Not surprisingly, the percentage of “credit card
only” borrowers is U shaped—higher for younger borrowers, reaching a low of 15 percent for those in
the 30s and 40s, then beginning to rise again, reaching over 40 percent by the early 70s (figure A.9B).
“Credit card and mortgage debt” and “credit card and mortgage and auto debt” have an inverted U
shape, with peaks for consumers in their 30s, 40s, and early 50s (figures A.9C and A.9D). Credit card
and auto debt is relatively constant across age groups from the mid-20s to the mid-70s, ranging from 7
to 9 percent of the total (figure A.9E). Credit card and student loan debt is, as would be expected, far
more prevalent among younger age groups (figure A.9F).
Credit card balances are lowest for those with only credit card debt and highest among consumers
with credit card, mortgage, and auto debt (figure A.10A). When mortgage debt is found in the mix, in any
form, credit card balances are higher than when it is not. We cannot tell whether these borrowers are
more apt to be carrying revolving balances or whether they are simply more affluent, so their
transactions balances are higher.
Consumers younger than mid-30s with credit card and auto debt have lower credit scores than
other consumers (figure A.10B). For consumers older than this, those with credit card and student loan
12
3
4
5
18-22 23-27 28-32 33-37 38-42 43-47 48-52 53-57 58-62 63-67 68-72 73-77 >77
Age Groups
8000
10000
12000
14000
16000
Med
ian
Bala
nce (
$)
12
34
5
18-22 23-27 28-32 33-37 38-42 43-47 48-52 53-57 58-62 63-67 68-72 73-77 >77
Age Groups
600
650
700
750
Med
ian
Van
tag
e S
co
re

2 4 A P P E N D I X A
debt have the lowest scores. For borrowers younger than mid-50s, those with mortgage debt have the
highest credit scores. Borrowers older than this with only credit card debt have the highest scores.
FIGURE A.9
Debt Styles of Consumers with Credit Card Debt, by Age Group
A. Percentage with credit card debt B. Percentage with credit card debt only
C. Percentage with credit card debt + mortgage D. Percentage with credit card debt + mortgage + auto
E. Percentage with credit card debt+auto F. Percentage with credit card debt+student
Source: Authors’ calculations.
18-22 23-27 28-32 33-37 38-42 43-47 48-52 53-57 58-62 63-67 68-72 73-77 >77
Age Groups
40
50
60
70
% o
f A
ll C
on
su
mers
18-22 23-27 28-32 33-37 38-42 43-47 48-52 53-57 58-62 63-67 68-72 73-77 >77
Age Groups
20
30
40
% o
f A
ll C
on
su
mers
18-22 23-27 28-32 33-37 38-42 43-47 48-52 53-57 58-62 63-67 68-72 73-77 >77
Age Groups
0.0
2.5
5.0
7.5
10.0
12.5
15.0
% o
f A
ll C
on
su
mers
18-22 23-27 28-32 33-37 38-42 43-47 48-52 53-57 58-62 63-67 68-72 73-77 >77
Age Groups
0.0
2.5
5.0
7.5
10.0
12.5
% o
f A
ll C
on
su
mers
18-22 23-27 28-32 33-37 38-42 43-47 48-52 53-57 58-62 63-67 68-72 73-77 >77
Age Groups
4
5
6
7
8
9
10
% o
f A
ll C
on
su
mers
18-22 23-27 28-32 33-37 38-42 43-47 48-52 53-57 58-62 63-67 68-72 73-77 >77
Age Groups
0
2
4
6
% o
f A
ll C
on
su
mers

A P P E N D I X A 2 5
FIGURE A.10
Median Balance and Vantage Scores on Debt Styles with Credit Card Components
A. Median balance ($ B. Median Vantage score
Source: Authors’ calculations.
Note: Line 2 is credit card only, line 3 is credit card + mortgage, line 4 is credit card + mortgage + auto, line 5 is credit card + auto,
and line 6 is credit card + student loan.
2
3
4
5
6
18-22 23-27 28-32 33-37 38-42 43-47 48-52 53-57 58-62 63-67 68-72 73-77 >77
Age Groups
1,000
2,000
3,000
4,000
5,000
Med
ian
Bala
nce (
$)
23
4
5
6
18-22 23-27 28-32 33-37 38-42 43-47 48-52 53-57 58-62 63-67 68-72 73-77 >77
Age Groups
650
700
750
800
Med
ian
Van
tag
e S
co
re

2 6 A P P E N D I X B
Appendix B: Detailed Results Table B.1. Percentage of Consumers with 17 Debt Styles, by Year
Debt Style
% of Consumers with Age % of Consumers Missing Age
2010 2011 2012 2013 2014 Mean 2010 2011 2012 2013 2014 Mean
No debt 29.5 29.4 28.9 28.8 27.8 28.9 90.1 89.0 88.1 87.4 85.8 88.1
Credit card only 21.0 21.2 21.8 22.0 21.9 21.6 9.0 10.0 10.8 11.4 12.8 10.8
Mortgage only 13.2 13.1 12.6 12.0 11.8 12.5 0.5 0.5 0.5 0.5 0.5 0.5
Auto loan only 11.3 11.1 11.7 12.6 13.2 12.0 0.2 0.2 0.3 0.3 0.4 0.3
Auto + mortgage 9.2 9.0 9.0 8.9 9.4 9.1 0.1 0.1 0.2 0.2 0.4 0.2
Student loan only 3.7 4.2 4.4 4.5 4.5 4.3 0.1 0.1 0.1 0.0 0.0 0.1
Mortgage + HELOC 2.8 2.5 2.3 1.9 1.8 2.3
No other debt styles
Student + auto loans 1.9 2.0 2.2 2.4 2.7 2.2
Auto + mortgage + HELOC 2.0 1.8 1.7 1.5 1.5 1.7
Student + auto + mortgage 1.5 1.6 1.6 1.6 1.8 1.6
HELOC only 1.4 1.4 1.4 1.3 1.2 1.4
Student + mortgage 1.3 1.3 1.3 1.3 1.3 1.3
Auto + HELOC 0.5 0.5 0.6 0.6 0.6 0.6
All types of debts 0.3 0.3 0.3 0.2 0.2 0.3
Student + mortgage + HELOC 0.3 0.2 0.2 0.2 0.2 0.2
Student + HELOC 0.1 0.1 0.1 0.1 0.1 0.1
Student + auto + HELOC 0.1 0.1 0.1 0.1 0.1 0.1
Source: Authors’ calculations.
A P P E N D I X B 2 7
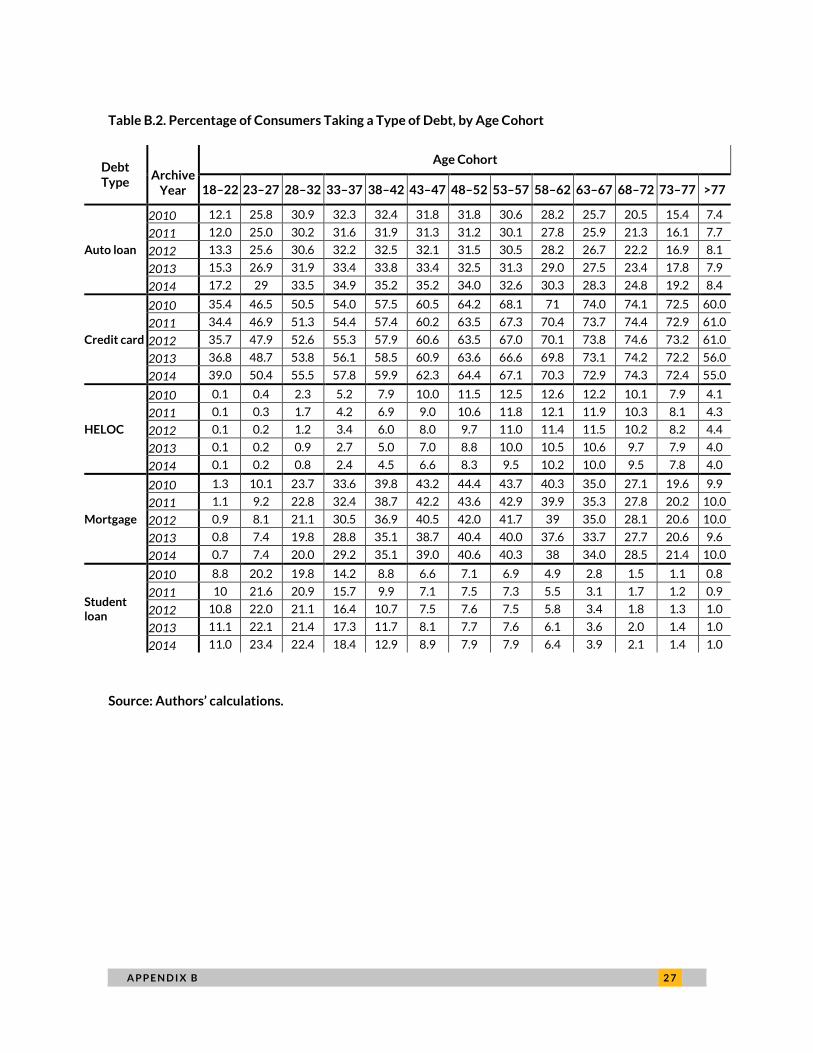
Table B.2. Percentage of Consumers Taking a Type of Debt, by Age Cohort
Debt Type
Archive Year
Age Cohort
18–22 23–27 28–32 33–37 38–42 43–47 48–52 53–57 58–62 63–67 68–72 73–77 >77
Auto loan
2010 12.1 25.8 30.9 32.3 32.4 31.8 31.8 30.6 28.2 25.7 20.5 15.4 7.4
2011 12.0 25.0 30.2 31.6 31.9 31.3 31.2 30.1 27.8 25.9 21.3 16.1 7.7
2012 13.3 25.6 30.6 32.2 32.5 32.1 31.5 30.5 28.2 26.7 22.2 16.9 8.1
2013 15.3 26.9 31.9 33.4 33.8 33.4 32.5 31.3 29.0 27.5 23.4 17.8 7.9
2014 17.2 29 33.5 34.9 35.2 35.2 34.0 32.6 30.3 28.3 24.8 19.2 8.4
Credit card
2010 35.4 46.5 50.5 54.0 57.5 60.5 64.2 68.1 71 74.0 74.1 72.5 60.0
2011 34.4 46.9 51.3 54.4 57.4 60.2 63.5 67.3 70.4 73.7 74.4 72.9 61.0
2012 35.7 47.9 52.6 55.3 57.9 60.6 63.5 67.0 70.1 73.8 74.6 73.2 61.0
2013 36.8 48.7 53.8 56.1 58.5 60.9 63.6 66.6 69.8 73.1 74.2 72.2 56.0
2014 39.0 50.4 55.5 57.8 59.9 62.3 64.4 67.1 70.3 72.9 74.3 72.4 55.0
HELOC
2010 0.1 0.4 2.3 5.2 7.9 10.0 11.5 12.5 12.6 12.2 10.1 7.9 4.1
2011 0.1 0.3 1.7 4.2 6.9 9.0 10.6 11.8 12.1 11.9 10.3 8.1 4.3
2012 0.1 0.2 1.2 3.4 6.0 8.0 9.7 11.0 11.4 11.5 10.2 8.2 4.4
2013 0.1 0.2 0.9 2.7 5.0 7.0 8.8 10.0 10.5 10.6 9.7 7.9 4.0
2014 0.1 0.2 0.8 2.4 4.5 6.6 8.3 9.5 10.2 10.0 9.5 7.8 4.0
Mortgage
2010 1.3 10.1 23.7 33.6 39.8 43.2 44.4 43.7 40.3 35.0 27.1 19.6 9.9
2011 1.1 9.2 22.8 32.4 38.7 42.2 43.6 42.9 39.9 35.3 27.8 20.2 10.0
2012 0.9 8.1 21.1 30.5 36.9 40.5 42.0 41.7 39 35.0 28.1 20.6 10.0
2013 0.8 7.4 19.8 28.8 35.1 38.7 40.4 40.0 37.6 33.7 27.7 20.6 9.6
2014 0.7 7.4 20.0 29.2 35.1 39.0 40.6 40.3 38 34.0 28.5 21.4 10.0
Student loan
2010 8.8 20.2 19.8 14.2 8.8 6.6 7.1 6.9 4.9 2.8 1.5 1.1 0.8
2011 10 21.6 20.9 15.7 9.9 7.1 7.5 7.3 5.5 3.1 1.7 1.2 0.9
2012 10.8 22.0 21.1 16.4 10.7 7.5 7.6 7.5 5.8 3.4 1.8 1.3 1.0
2013 11.1 22.1 21.4 17.3 11.7 8.1 7.7 7.6 6.1 3.6 2.0 1.4 1.0
2014 11.0 23.4 22.4 18.4 12.9 8.9 7.9 7.9 6.4 3.9 2.1 1.4 1.0
Source: Authors’ calculations.

2 8 A P P E N D I X B
Table B.3. Balance on Type of Consumer Debt by Age Cohort ($)
Debt Type
Archive Year
Age Cohort
18–22 23–27 28–32 33–37 38–42 43–47 48–52 53–57 58–62 63–67 68–72 73–77 >77
All
2010 2,851 11,637 24,198 50,893 75,573 78,599 70,214 57,193 41,640 25,500 12,320 4,996 1,340
2011 3,028 11,028 22,472 43,806 70,539 75,601 68,567 56,214 41,141 26,163 13,406 5,549 1,436
2012 3,215 11,050 21,046 37,381 60,290 68,008 63,652 53,537 39,258 26,187 14,281 6,156 1,580
2013 3,605 11,152 20,420 33,401 51,636 61,336 59,014 50,262 37,263 25,444 14,971 6,928 1,718
2014 3,817 12,179 21,348 34,955 52,298 63,219 60,094 51,229 38,328 26,705 16,487 7,955 1,951
Auto loan
2010 9,729 10,994 12,277 13,054 13,156 12,832 12,555 12,458 12,233 12,033 11,265 10,436 9,464
2011 9,973 11,034 12,247 13,214 13,471 13,119 12,731 12,523 12,291 12,162 11,351 10,658 9,401
2012 10,823 11,686 12,939 13,868 14,131 13,857 13,436 13,037 12,613 12,498 11,693 10,792 9,291
2013 11,305 12,350 13,677 14,497 14,948 14,727 14,227 13,732 13,370 13,072 12,218 11,164 9,485
2014 11,805 12,786 14,079 15,001 15,560 15,474 14,968 14,387 13,978 13,644 12,685 11,598 9,839
Credit card
2010 792 1,645 2,452 3,143 3,615 3,746 3,616 3,200 2,738 2,308 1,764 1,285 725
2011 748 1,527 2,322 2,981 3,503 3,716 3,627 3,255 2,795 2,402 1,886 1,379 768
2012 719 1,485 2,303 2,965 3,532 3,800 3,702 3,361 2,901 2,508 2,014 1,499 835
2013 717 1,449 2,296 2,993 3,567 3,897 3,797 3,451 2,988 2,616 2,151 1,603 892
2014 738 1,469 2,356 3,050 3,659 4,000 3,910 3,586 3,116 2,711 2,282 1,727 962
HELOC
2010 34,767 25,769 30,133 35,794 38,394 39,594 38,857 38,052 37,029 35,808 31,956 29,746 28,030
2011 17,916 23,174 28,707 33,732 37,474 38,655 38,643 37,934 36,912 36,190 32,573 30,002 28,462
2012 25,081 20,964 27,835 32,445 36,635 38,041 38,628 37,539 37,045 36,009 33,574 30,532 29,597
2013 24,087 24,227 26,317 30,981 35,056 37,592 37,971 37,079 36,170 35,712 33,098 30,199 29,519
2014 20,396 22,516 25,411 30,000 34,344 36,827 36,857 36,912 35,662 34,951 33,882 30,212 29,228
Mortgage
2010 106,120 133,445 152,280 166,289 164,912 150,209 133,291 120,316 114,164 108,045 96,195 84,039 74,929
2011 98,653 129,039 149,914 165,428 166,584 153,855 135,562 122,571 115,048 110,708 100,076 87,464 76,781
2012 95,271 125,353 147,163 162,091 165,533 154,435 136,469 122,680 114,605 111,237 102,499 89,293 78,082
2013 100,086 125,297 147,119 162,696 167,063 157,926 139,688 125,024 116,317 112,535 105,613 91,932 79,811
2014 99,301 126,706 148,672 164,873 169,755 161,266 143,356 127,591 117,613 113,946 108,721 95,613 81,315
Student loan
2010 6,665 12,025 12,886 14,246 13,988 11,719 12,078 12,394 12,051 11,307 10,420 10,215 10,687
2011 7,249 12,211 13,172 14,675 14,521 12,356 12,351 12,704 12,229 11,731 11,208 10,437 11,215
2012 7,596 12,877 13,472 15,104 15,375 13,205 12,813 13,191 12,738 12,002 11,648 10,955 11,595
2013 7,764 12,871 13,499 15,237 16,191 14,161 13,323 13,713 13,198 12,411 11,812 11,379 11,847
2014 7,787 14,222 14,569 15,940 17,270 15,848 14,201 14,361 13,631 12,780 11,974 11,673 12,020
Source: Authors’ calculations.

A P P E N D I X B 2 9
Table B.4. Consumers’ Median Vantage Scores with and without a Type of Debt, by Age Cohort
Debt Type
With and without Debt
Archive Year
Age Cohort
18–22
23–27
28–32
33–37
38–42
43–47
48–52
53–57
58–62
63–67
68–72
73–77
>77
All
With
2010 552 523 524 528 533 537 545 552 583 619 658 676 722
2011 552 524 524 531 536 541 548 554 586 617 656 675 716
2012 560 524 525 532 537 542 549 553 583 611 653 673 711
2013 562 524 526 532 538 543 549 553 580 608 647 668 675
2014 574 524 527 533 540 545 551 554 580 615 649 670 675
Without
2010 662 668 671 677 688 706 725 745 768 786 796 802 806
2011 661 670 674 680 689 705 723 744 767 785 797 803 806
2012 660 670 675 680 687 701 720 741 764 783 795 801 805
2013 659 669 677 681 686 700 718 739 762 782 794 801 805
2014 657 669 679 683 686 698 716 736 760 781 794 800 805
Auto loan
With
2010 602 575 586 607 629 650 672 710 744 775 789 796 792
2011 602 579 590 610 628 648 669 704 740 773 789 796 793
2012 611 582 593 610 626 645 666 697 732 768 787 794 792
2013 619 586 597 611 628 643 663 690 727 762 784 791 785
2014 625 592 603 616 631 645 663 687 725 759 783 791 784
Without
2010 647 661 665 668 674 688 706 723 739 755 770 782 784
2011 647 664 671 673 679 691 709 725 741 756 773 784 788
2012 647 664 672 675 678 690 707 725 740 756 772 783 788
2013 646 662 672 675 677 689 706 724 741 757 773 784 789
2014 645 661 673 677 678 689 706 725 741 758 774 786 790
Credit card
With
2010 558 527 536 543 549 552 563 582 609 642 667 689 722
2011 568 531 539 546 552 555 566 585 609 640 665 675 718
2012 578 531 539 546 552 556 566 584 607 635 663 675 714
2013 580 533 540 547 552 557 566 582 604 631 656 672 675
2014 582 535 541 548 552 558 568 584 604 637 660 674 675
Without
2010 683 694 700 708 717 730 745 763 780 792 800 805 808
2011 682 696 702 709 717 729 744 762 780 792 801 806 808
2012 680 695 701 707 713 725 740 759 778 790 799 804 807
2013 677 695 703 707 712 722 737 756 776 789 798 804 807
2014 673 694 703 707 711 719 734 752 773 788 798 803 807
HELOC
With
2010 618 613 621 630 640 654 673 703 734 767 786 794 792
2011 619 618 626 634 643 656 673 701 731 764 786 795 793
2012 624 620 629 636 643 655 671 698 727 760 784 793 792
2013 629 623 633 639 645 655 670 695 724 755 780 790 785
2014 632 628 638 643 648 657 671 694 724 754 779 789 784
Without
2010 699 699 709 717 727 737 748 761 771 780 787 791 790
2011 696 707 715 721 727 737 749 761 772 780 788 792 791
2012 696 708 716 721 725 735 746 759 771 779 787 791 789
2013 693 709 718 724 725 733 744 758 770 780 787 792 789
2014 686 706 726 730 730 735 746 759 771 780 788 792 789
Mortgage With
2010 616 594 585 586 592 605 631 667 715 765 788 796 792
2011 617 599 590 590 595 608 631 666 710 761 788 796 794
2012 623 604 594 594 598 610 630 664 706 755 785 794 792
2013 628 609 600 597 602 612 631 661 701 747 782 791 786

3 0 A P P E N D I X B
2014 631 615 605 600 603 613 631 659 697 744 780 791 784
Without
2010 669 706 714 717 723 732 743 754 765 775 783 786 787
2011 672 711 720 723 726 733 743 754 765 774 784 787 789
2012 672 713 722 724 725 732 741 753 763 773 782 786 788
2013 670 715 726 727 727 732 741 752 763 773 781 785 786
2014 676 718 731 733 732 735 743 753 764 773 782 786 787
Student loan
With
2010 616 592 606 630 649 665 686 716 744 771 787 794 792
2011 617 596 610 632 651 665 684 713 742 769 787 795 793
2012 623 601 615 633 649 664 681 709 737 766 785 793 792
2013 627 607 620 634 650 663 679 705 734 762 782 790 786
2014 631 612 625 638 652 665 679 705 733 760 782 790 785
Without
2010 633 666 674 665 651 657 687 709 721 730 735 749 752
2011 638 665 675 669 653 655 683 708 721 729 738 751 757
2012 640 664 673 669 652 652 678 706 720 729 741 754 753
2013 640 662 673 672 655 653 674 702 718 727 738 749 753
2014 639 665 674 674 657 652 673 701 717 726 740 747 755
Source: Authors’ calculations.

A P P E N D I X B 3 1
Table B.5. Percentage of Consumers Taking 1 of 17 Debt Styles, by Age Cohort
Debt Style
Archive Year
Age Cohort
18–22 23–27 28–32 33–37 38–42 43–47 48–52 53–57 58–62 63–67 68–72 73–77 >77
No debt
2010 54.5 39.2 35.2 32.0 29.1 26.9 24.2 21.4 19.7 18.1 19.3 21.9 36.0
2011 54.5 38.5 34.8 31.9 29.5 27.4 24.9 22.2 20.3 18.3 18.9 21.4 35.0
2012 52.1 37.3 33.8 31.4 29.2 27.2 25.1 22.6 20.6 18.3 18.7 21.1 35.0
2013 50.1 36.2 32.7 30.8 28.7 27.1 25.3 23.2 21.1 19.1 19.2 22.1 40.0
2014 47.6 33.9 31.0 29.3 27.7 26.0 24.6 22.8 20.7 19.3 19.1 21.7 41.0
Credit card only
2010 25.6 18.3 14.2 13.5 13.5 14.2 15.6 18.6 23.1 29.2 36.9 43.9 46.0
2011 24.7 19.0 14.8 14.0 13.9 14.6 15.7 18.6 23.1 28.7 36.1 43.2 46.0
2012 25.3 19.8 15.9 14.8 14.7 15.2 16.3 18.8 23.2 28.6 35.6 42.6 45.0
2013 25.4 20.2 16.5 15.1 15.1 15.5 16.7 19.1 23.3 28.4 34.7 41.1 42.0
2014 26.3 20.1 16.6 15.2 15.2 15.5 16.6 18.8 23.0 27.8 33.7 40.1 40.0
Mortgage only
2010 0.6 3.6 8.0 12.4 16.2 18.3 18.7 18.9 18.8 17.4 15.0 12.0 6.9
2011 0.5 3.3 7.7 12.1 15.9 18.1 18.6 18.7 18.6 17.5 15.3 12.3 7.1
2012 0.4 2.9 7.2 11.2 14.9 17.3 17.9 18.2 18.1 17.3 15.3 12.4 7.2
2013 0.3 2.6 6.7 10.3 13.9 16.2 17.1 17.3 17.4 16.5 15.0 12.3 6.7
2014 0.3 2.4 6.5 10.1 13.4 15.7 16.7 17.0 17.1 16.4 15.0 12.6 6.9
Auto loan only
2010 10.0 14.8 13.6 12.4 11.8 11.0 10.8 10.6 10.8 11.4 10.8 9.3 5.1
2011 9.8 14.2 13.1 12.2 11.6 10.9 10.6 10.4 10.5 11.3 11.0 9.6 5.3
2012 10.9 14.8 14.0 13.0 12.3 11.7 11.2 10.9 10.9 11.7 11.3 10.0 5.5
2013 12.6 16.1 15.1 14.1 13.6 12.9 12.1 11.6 11.6 12.3 12.0 10.5 5.4
2014 14.4 17.2 15.7 14.6 14.0 13.5 12.6 12.1 12.0 12.6 12.5 11.2 5.6
Auto +
mortgage
2010 0.4 3.5 7.7 11.3 13.4 13.8 13.3 12.4 11.1 9.5 6.6 4.1 1.5
2011 0.4 3.3 7.5 10.8 13.1 13.6 13.2 12.3 11.0 9.7 7.0 4.3 1.6
2012 0.4 3.0 7.2 10.5 12.9 13.7 13.2 12.3 11.0 10.0 7.4 4.6 1.7
2013 0.3 2.8 7.0 10.2 12.7 13.7 13.3 12.4 11.0 10.1 7.7 4.8 1.6
2014 0.3 2.8 7.3 10.6 13.1 14.5 14.0 13.0 11.6 10.5 8.3 5.4 1.8
Student loan only
2010 7.1 11.7 8.1 4.9 2.9 2 1.7 1.5 1.2 0.8 0.6 0.5 0.5
2011 8.2 13.0 9.0 5.7 3.4 2.3 2 1.7 1.3 0.9 0.6 0.6 0.5
2012 8.8 13.4 9.5 6.2 3.8 2.5 2.1 1.8 1.4 0.9 0.6 0.6 0.6
2013 8.8 13.2 9.7 6.5 4.1 2.8 2.2 1.9 1.6 1.1 0.7 0.6 0.6
2014 8.4 13.6 10.0 6.7 4.5 2.9 2.3 2 1.6 1.1 0.7 0.6 0.6
Mortgage + HELOC
2010 0.0 0.1 0.7 1.8 3.3 4.3 4.7 4.8 4.7 4.3 3.3 2.3 1
2011 0.0 0.1 0.5 1.5 2.8 3.8 4.3 4.4 4.4 4.1 3.2 2.3 1
2012 0.0 0.0 0.3 1.1 2.3 3.2 3.8 4 4 3.8 3.1 2.3 1
2013 0.0 0.0 0.2 0.8 1.8 2.6 3.2 3.3 3.4 3.2 2.7 2 0.9
2014 0.0 0.0 0.2 0.7 1.5 2.4 2.9 3.1 3.2 3 2.6 2 0.9
Student + auto
2010 1.5 5.8 4.9 2.9 1.7 1.1 1 0.9 0.6 0.4 0.2 0.2 0.1
2011 1.7 6.1 5.2 3.2 1.9 1.2 1.1 0.9 0.7 0.4 0.2 0.2 0.1
2012 1.9 6.4 5.5 3.6 2.2 1.4 1.2 1 0.8 0.5 0.3 0.2 0.1
2013 2.2 6.9 6.1 4.1 2.6 1.6 1.3 1.1 0.9 0.5 0.3 0.2 0.1
2014 2.4 7.7 6.6 4.5 2.9 1.9 1.5 1.2 0.9 0.6 0.3 0.2 0.1
Auto + Mortgage +
2010 0.0 0.1 0.7 1.8 2.9 3.4 3.5 3.3 2.9 2.4 1.5 0.9 0.3
2011 0.0 0.1 0.5 1.4 2.5 3.1 3.3 3.1 2.7 2.3 1.5 0.9 0.3
2012 0.0 0.0 0.4 1.1 2.1 2.8 3 2.9 2.6 2.3 1.5 0.9 0.3
2013 0.0 0.0 0.3 0.9 1.8 2.5 2.8 2.7 2.4 2.1 1.5 0.9 0.3

3 2 A P P E N D I X B
HELOC 2014 0.0 0.0 0.2 0.8 1.7 2.5 2.9 2.7 2.4 2.1 1.6 1.0 0.3
Student + Auto + Mortgage
2010 0.1 1.5 3.5 3.1 1.9 1.5 1.8 1.7 1.1 0.5 0.2 0.1 0.0
2011 0.1 1.4 3.6 3.3 2.1 1.6 1.9 1.8 1.2 0.6 0.2 0.1 0.0
2012 0.1 1.2 3.3 3.4 2.2 1.6 1.8 1.8 1.2 0.7 0.3 0.1 0.0
2013 0.1 1.2 3.2 3.6 2.4 1.7 1.8 1.8 1.3 0.7 0.3 0.1 0.0
2014 0.1 1.2 3.4 4.0 2.8 2.0 2.0 2.0 1.5 0.8 0.4 0.2 0.0
Source: Authors’ calculations.

A P P E N D I X B 3 3
Table B.6. Total Median Debt Balance, by Debt Style and Age Cohort
Debt Style
Archive Year
Age Cohort
18–22 23–27 28–32 33–37 38–42 43–47 48–52 53–57 58–62 63–67 68–72 73–77 >77
Credit card only
2010 762 1,327 1,667 2,013 2,340 2,452 2,388 2,165 1,896 1,707 1,349 1,032 611
2011 727 1,220 1,558 1,905 2,183 2,370 2,340 2,190 1,933 1,763 1,453 1,110 649
2012 698 1,192 1,577 1,904 2,220 2,423 2,354 2,251 1,995 1,829 1,547 1,203 697
2013 695 1,164 1,612 1,951 2,262 2,513 2,485 2,336 2,103 1,931 1,668 1,283 742
2014 704 1,166 1,625 1,966 2,277 2,505 2,513 2,380 2,197 1,994 1,746 1,376 793
Mortgage only
2010 103,543 133,126 149,160 162,580 162,137 147,837 130,096 117,718 112,141 107,317 96,662 84,177 74,244
2011 97,076 129,621 147,965 162,924 164,058 152,318 132,894 119,854 114,057 110,231 100,538 88,058 75,790
2012 94,931 125,993 145,176 159,681 162,758 153,184 134,905 120,926 113,567 111,473 102,802 90,132 78,058
2013 100,735 125,580 145,804 160,722 165,533 156,663 138,131 123,460 115,634 113,288 106,443 92,435 79,575
2014 99,266 128,187 148,567 164,080 168,112 159,036 141,841 125,363 116,795 113,927 109,022 95,392 80,866
Auto loan only
2010 10,734 12,715 14,223 15,230 15,644 15,808 15,789 15,933 15,672 15,694 14,850 13,571 11,920
2011 10,924 12,653 14,071 15,219 15,718 15,825 15,836 15,888 15,733 15,726 14,889 13,691 11,722
2012 11,772 13,433 15,048 16,115 16,747 16,855 16,923 16,740 16,341 16,348 15,407 14,176 11,753
2013 12,300 14,128 15,899 17,018 17,856 17,936 17,934 17,662 17,244 16,994 15,894 14,470 12,212
2014 12,948 14,616 16,402 17,756 18,615 18,997 18,859 18,565 18,063 17,777 16,547 15,115 12,669
Auto + mortgage
2010 129,711 154,637 174,195 188,267 188,362 175,965 161,089 147,177 140,828 132,313 118,902 110,423 98,172
2011 122,645 151,063 172,362 188,937 191,843 180,988 164,599 150,628 142,581 136,324 123,375 113,062 102,924
2012 119,543 149,504 172,317 188,057 193,652 184,103 166,006 151,582 143,730 136,864 129,125 113,457 104,314
2013 126,242 149,507 173,027 189,061 197,320 189,774 171,299 155,647 145,944 140,891 133,079 118,459 108,392
2014 123,814 151,712 176,021 192,541 200,490 195,722 176,799 159,907 149,588 143,944 136,890 125,424 111,267
Student loan only
2010 7,675 13,842 15,624 16,243 15,964 14,051 14,071 14,983 15,484 15,044 13,552 13,663 13,387
2011 8,028 13,907 15,700 16,642 16,256 14,140 13,841 14,734 14,941 15,596 15,480 13,952 14,161
2012 8,313 14,580 16,235 17,331 17,222 15,213 14,847 15,640 15,351 15,444 15,391 14,223 14,133
2013 8,493 14,527 16,483 18,085 18,302 17,014 16,101 16,267 16,503 15,732 15,527 15,117 15,048
2014 8,599 15,821 17,771 19,483 20,219 19,239 17,273 17,685 17,303 16,877 16,336 15,963 15,808
Mortgage + HELOC
2010 218,780 180,704 219,719 258,473 260,889 240,442 215,072 199,308 191,984 191,016 176,981 157,443 145,027
2011 225,690 165,466 208,221 250,467 257,878 242,079 216,130 202,397 191,658 189,569 182,210 158,651 145,287
2012 167,712 158,295 198,248 246,207 256,310 242,033 218,842 197,239 191,551 188,673 180,192 162,357 144,222
2013 196,642 162,473 204,997 241,120 254,079 243,774 220,376 196,258 189,798 188,107 183,652 162,849 145,943
2014 154,540 157,241 210,347 246,955 260,932 248,453 221,808 200,832 188,236 187,643 184,971 164,712 146,671
Student + auto
2010 20,017 29,129 33,623 35,991 36,204 34,503 34,617 35,129 34,979 32,604 30,423 29,214 30,408
2011 20,986 29,649 33,721 36,370 36,984 35,352 35,500 35,077 35,144 32,548 30,684 28,423 29,639
2012 22,156 31,087 34,941 38,532 38,287 37,163 37,054 36,545 36,599 34,878 35,878 29,975 30,859
2013 22,844 31,585 36,157 39,465 40,852 39,847 38,954 38,392 38,661 34,521 35,086 33,154 33,288
2014 23,411 33,466 37,967 41,224 44,035 42,573 41,348 40,224 39,914 38,233 36,958 31,230 32,782
Auto + mortgage + HELOC
2010 229,264 200,100 236,156 278,351 282,715 274,780 250,521 232,163 222,454 220,998 211,557 182,608 184,626
2011 207,566 178,720 226,934 270,981 281,734 275,248 249,996 229,510 216,787 218,815 205,244 189,665 183,743
2012 154,722 167,683 229,163 260,065 279,377 273,125 254,723 229,790 217,663 214,293 210,826 193,578 183,121
2013 183,705 169,459 215,990 262,988 280,675 278,892 258,774 232,820 219,404 215,477 208,755 203,568 185,263
2014 133,178 173,902 227,624 263,658 284,355 281,339 263,445 236,511 221,000 215,699 218,242 203,270 182,210
Student + auto + mortgage
2010 135,010 178,057 207,988 230,332 227,838 205,967 196,290 189,592 185,143 189,292 178,161 133,938 122,823
2011 135,281 172,002 204,182 230,675 232,849 208,107 198,038 192,954 186,133 192,164 182,370 149,395 140,811
2012 126,910 169,102 201,873 228,704 234,425 212,651 202,013 195,354 190,702 187,472 179,881 150,538 145,931
2013 133,076 172,514 202,563 231,452 236,556 220,406 206,658 196,713 191,126 192,040 183,291 157,537 131,204
2014 134,233 174,351 204,172 233,774 246,182 227,992 211,277 203,026 195,973 197,101 188,594 150,745 132,974

3 4 A P P E N D I X B
Source: Authors’ calculations.

A P P E N D I X B 3 5
Table B.7. Consumers’ Median Vantage Scores, by Debt Style and Age Cohort
Debt Style
Archive Year
Age Cohort
18–22 23–27 28–32 33–37 38–42 43–47 48–52 53–57 58–62 63–67 68–72 73–77 >77
No debt
2010 552 524 524 530 535 540 549 557 586 622 658 675 722
2011 555 524 526 533 538 544 552 561 588 620 655 674 715
2012 563 524 527 534 539 545 552 559 586 615 653 673 710
2013 567 524 528 534 541 546 552 559 585 612 647 668 675
2014 577 524 528 535 542 548 552 560 584 618 649 670 675
Credit card only
2010 696 701 693 695 701 718 743 776 794 803 807 809 810
2011 694 703 693 693 698 713 737 772 794 803 808 810 810
2012 692 702 694 692 696 708 731 767 791 801 806 808 809
2013 691 703 696 693 695 706 727 763 789 800 805 808 809
2014 687 702 695 690 692 700 720 753 786 799 805 808 809
Mortgage only
2010 670 709 718 727 736 746 755 769 779 787 792 794 794
2011 671 713 723 731 738 745 755 767 778 788 793 795 794
2012 673 715 726 731 736 742 751 764 775 785 791 793 793
2013 669 718 730 733 738 742 751 762 774 783 790 791 791
2014 687 722 737 740 743 746 752 762 774 784 791 792 791
Auto loan only
2010 645 645 635 630 633 642 658 683 713 742 772 788 790
2011 646 648 640 636 637 646 662 684 714 744 774 792 795
2012 646 649 643 639 638 649 661 684 713 742 770 788 795
2013 645 649 644 638 640 648 661 683 713 741 771 789 794
2014 644 647 643 637 636 645 658 681 712 742 771 790 794
Auto + mortgage
2010 665 693 701 706 713 721 733 743 753 764 770 773 772
2011 671 700 708 713 719 726 736 746 756 763 774 775 777
2012 668 704 712 716 720 728 736 748 756 764 774 777 777
2013 666 707 716 721 722 730 739 749 759 765 776 779 779
2014 666 708 723 726 728 732 741 751 760 767 777 782 781
Student loan only
2010 621 649 634 607 589 595 621 654 670 698 727 754 759
2011 629 647 632 610 589 592 619 649 671 696 726 760 759
2012 629 644 629 609 586 586 609 643 667 702 720 760 755
2013 631 641 632 614 593 588 607 643 666 693 719 744 759
2014 629 650 635 615 595 591 601 640 663 689 721 735 757
Mortgage + HELOC
2010 699 701 714 727 738 748 756 766 770 775 778 780 779
2011 725 701 718 728 738 745 755 765 771 773 779 782 782
2012 719 714 719 728 733 742 750 761 768 771 776 780 776
2013 723 716 718 729 733 739 747 758 766 771 773 778 773
2014 749 732 730 735 739 742 750 758 768 772 777 779 774
Student + auto
2010 652 671 661 643 629 630 653 672 687 700 715 739 720
2011 653 673 666 647 628 632 651 671 690 700 721 745 747
2012 655 672 666 650 625 627 648 674 689 703 719 746 750
2013 651 670 666 652 629 629 649 670 690 704 723 743 749
2014 651 671 664 650 626 625 646 665 685 696 716 741 750
Auto + mortgage +
2010 686 694 703 712 720 728 736 744 751 754 760 761 755
2011 710 709 711 718 723 731 739 747 754 756 761 767 758
2012 673 701 712 718 721 730 738 746 754 756 760 762 757
2013 697 714 714 722 725 729 738 747 755 758 762 762 765

3 6 A P P E N D I X B
HELOC 2014 687 714 723 727 730 734 741 751 758 761 763 768 766
Student + auto + mortgage
2010 673 714 719 704 683 684 714 724 734 734 738 744 742
2011 678 719 725 717 691 689 714 728 734 736 735 743 737
2012 676 719 725 720 695 691 713 729 737 735 748 747 752
2013 678 718 729 724 702 693 710 730 738 742 746 743 745
2014 675 719 732 729 706 695 711 729 738 741 747 756 761
Source: Authors’ calculations.
N O T E S 3 7
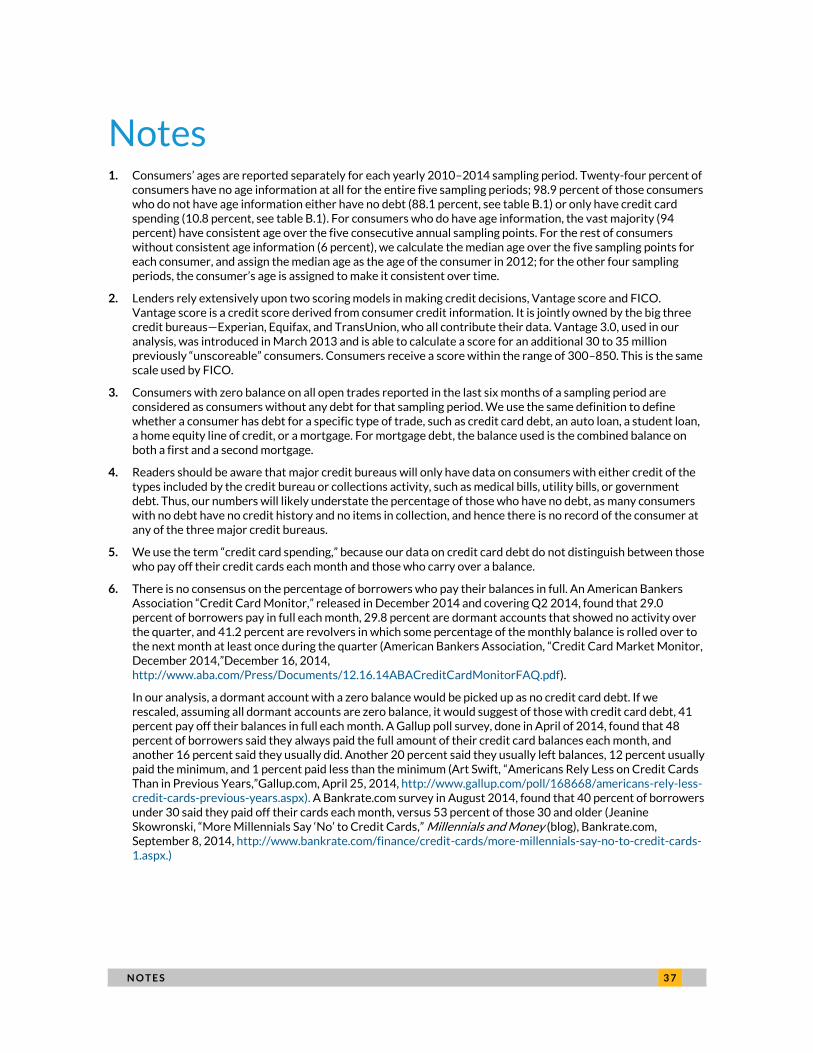
Notes 1. Consumers’ ages are reported separately for each yearly 2010–2014 sampling period. Twenty-four percent of
consumers have no age information at all for the entire five sampling periods; 98.9 percent of those consumers who do not have age information either have no debt (88.1 percent, see table B.1) or only have credit card spending (10.8 percent, see table B.1). For consumers who do have age information, the vast majority (94 percent) have consistent age over the five consecutive annual sampling points. For the rest of consumers without consistent age information (6 percent), we calculate the median age over the five sampling points for each consumer, and assign the median age as the age of the consumer in 2012; for the other four sampling periods, the consumer’s age is assigned to make it consistent over time.
2. Lenders rely extensively upon two scoring models in making credit decisions, Vantage score and FICO. Vantage score is a credit score derived from consumer credit information. It is jointly owned by the big three credit bureaus—Experian, Equifax, and TransUnion, who all contribute their data. Vantage 3.0, used in our analysis, was introduced in March 2013 and is able to calculate a score for an additional 30 to 35 million previously “unscoreable” consumers. Consumers receive a score within the range of 300–850. This is the same scale used by FICO.
3. Consumers with zero balance on all open trades reported in the last six months of a sampling period are considered as consumers without any debt for that sampling period. We use the same definition to define whether a consumer has debt for a specific type of trade, such as credit card debt, an auto loan, a student loan, a home equity line of credit, or a mortgage. For mortgage debt, the balance used is the combined balance on both a first and a second mortgage.
4. Readers should be aware that major credit bureaus will only have data on consumers with either credit of the types included by the credit bureau or collections activity, such as medical bills, utility bills, or government debt. Thus, our numbers will likely understate the percentage of those who have no debt, as many consumers with no debt have no credit history and no items in collection, and hence there is no record of the consumer at any of the three major credit bureaus.
5. We use the term “credit card spending,” because our data on credit card debt do not distinguish between those who pay off their credit cards each month and those who carry over a balance.
6. There is no consensus on the percentage of borrowers who pay their balances in full. An American Bankers Association “Credit Card Monitor,” released in December 2014 and covering Q2 2014, found that 29.0 percent of borrowers pay in full each month, 29.8 percent are dormant accounts that showed no activity over the quarter, and 41.2 percent are revolvers in which some percentage of the monthly balance is rolled over to the next month at least once during the quarter (American Bankers Association, “Credit Card Market Monitor, December 2014,”December 16, 2014, http://www.aba.com/Press/Documents/12.16.14ABACreditCardMonitorFAQ.pdf).
In our analysis, a dormant account with a zero balance would be picked up as no credit card debt. If we rescaled, assuming all dormant accounts are zero balance, it would suggest of those with credit card debt, 41 percent pay off their balances in full each month. A Gallup poll survey, done in April of 2014, found that 48 percent of borrowers said they always paid the full amount of their credit card balances each month, and another 16 percent said they usually did. Another 20 percent said they usually left balances, 12 percent usually paid the minimum, and 1 percent paid less than the minimum (Art Swift, “Americans Rely Less on Credit Cards Than in Previous Years,”Gallup.com, April 25, 2014, http://www.gallup.com/poll/168668/americans-rely-less-credit-cards-previous-years.aspx). A Bankrate.com survey in August 2014, found that 40 percent of borrowers under 30 said they paid off their cards each month, versus 53 percent of those 30 and older (Jeanine Skowronski, “More Millennials Say ‘No’ to Credit Cards,” Millennials and Money (blog), Bankrate.com, September 8, 2014, http://www.bankrate.com/finance/credit-cards/more-millennials-say-no-to-credit-cards-1.aspx.)

3 8 A P P E N D I X A
References Baum, Sandy, and Martha Johnson. 2015. “Student Debt: Who Borrows Most? What Lies Ahead?”Washington, DC:
Urban Institute. http://www.urban.org/sites/default/files/alfresco/publication-pdfs/2000191-Student-Debt-Who-Borrows-Most-What-Lies-Ahead.pdf.
Bernanke, Ben S. 1984. “Permanent Income, Liquidity, and Expenditure on Automobiles: Evidence from Panel Data.“ Quarterly Journal of Economics 99(3): 587–614.
Carroll, Christopher D. 1997. “Buffer-Stock Saving and the Life Cycle/Permanent Income Hypothesis.“ Quarterly Journal of Economics 112(1): 1–55.
Flavin, Marjorie A. 1981. “The Adjustment of Consumption to Changing Expectations about Future Income.“ Journal of Political Economy 89(5): 974–1009.
Friedman, Milton. 1956. “A Theory of the Consumption Function.“ Princeton, NJ: Princeton University Press.
Hall, Robert E. 1978. “Stochastic Implications of the Life Cycle—Permanent Income Hypothesis: Theory and
Evidence.“ Journal of Political Economy 86(6): 971–87.
Hall, Robert E., and Frederic S. Mishkin. 1982. “The Sensitivity of Consumption to Transitory Income: Estimates from Panel Data on Households.“ Econometrica 50(2): 461.
Mankiw, N. Gregory, and Matthew D. Shapiro. 1985. “Trends, Random Walks, and Tests of the Permanent Income Hypothesis.“ Journal of Monetary Economics 89(5): 165–74.
Modigliani, Franco, and Richard Brumberg. 1954. “Utility Analysis and the Consumption Function: An Interpretation of Cross-Section Data.” In Post-Keynesian Economics, edited by Kenneth K. Kurihara. New Brunswick, NJ: Rutgers University Press.
Shapiro, Matthew D., and Joel Slemrod. 2003. “Consumer Response to Tax Rebates.“ American Economic Review 93(1): 381–96.Souleles, Nicholas S. 1999. “The Response of Household Consumption to Income Tax Refunds.“
American Economic Review 89(4): 947–58.
Stephens, Melvin, Jr. 2003. “‘3rd of tha Month‘: Do Social Security Recipients Smooth Consumption between Checks?“ American Economic Review 93(1): 406–22.
Wilcox, James A. 1989. “Liquidity Constraints on Consumption: The Real Effects of Real Lending Policies.“ Federal Reserve Bank of San Francisco Economic Review 4: 39–52.
Zeldes, Stephen P. 1989. “Consumption and Liquidity Constraints: An Empirical Investigation.“ Journal of Political Economy 97(2): 305–46

A B O U T T H E A U T H O R S 3 9
About the Authors Wei Li is a senior research associate in the Housing Finance Policy Center at the Urban
Institute, where his research focuses on the social and political aspects of the housing
finance market and their implications for urban policy. His research has led to the
creation of the popular Credit Availability Index (HCAI) and the Real Denial Rate. He is
the winner of the 2015 Urban Institute President’s Award on Outstanding Research.
His work has been published widely in various academic journals and has been covered
in the Wall Street Journal, the Washington Post, and the New York Times, as well as in
other print and broadcast media. He is also a quantitative research methodologist with
a deep understanding of cost-benefit analysis, program evaluation, and causal
inference in social and political science.
Before joining Urban, Li was a principal researcher with the Center for Responsible
Lending, where he wrote numerous publications on the housing finance market and
created and managed the nonprofit organization’s comprehensive residential
mortgage database. Li received his PhD in environmental science, policy, and
management and an MA in statistics from the University of California at Berkeley.
Laurie Goodman is the director of the Housing Finance Policy Center at the Urban
Institute. The center is dedicated to providing policymakers data-driven analyses of
housing finance policy issues that they can depend on for relevance, accuracy, and
independence.
Before joining Urban in 2013, Goodman spent 30 years as an analyst and research
department manager at a number of Wall Street firms. From 2008 to 2013, she was a
senior managing director at Amherst Securities Group, LP, a boutique broker/dealer
specializing in securitized products, where her strategy effort became known for its
analysis of housing policy issues. From 1993 to 2008, Goodman was head of global
fixed income research and manager of US securitized products research at UBS and
predecessor firms, which were ranked first by Institutional Investor for 11 straight
years. Before that, she was a senior fixed income analyst, a mortgage portfolio
manager, and a senior economist at the Federal Reserve Bank of New York.

4 0 A B O U T T H E A U T H O R S
Goodman was inducted into the Fixed Income Analysts Hall of Fame in 2009. She
serves on the board of directors of MFA Financial, is an advisor to Amherst Capital
Management, and is a member of the Bipartisan Policy Center’s Housing Commission,
the Federal Reserve Bank of New York’s Financial Advisory Roundtable, and the New
York State Mortgage Relief Incentive Fund Advisory Committee. She has published
more than 200 journal articles and has coauthored and coedited five books. Goodman
has a BA in mathematics from the University of Pennsylvania and an MA and a PhD in
economics from Stanford University.
ST A T E M E N T O F I N D E P E N D E N C E
The Urban Institute strives to meet the highest standards of integrity and quality in its research and analyses and in
the evidence-based policy recommendations offered by its researchers and experts. We believe that operating
consistent with the values of independence, rigor, and transparency is essential to maintaining those standards. As
an organization, the Urban Institute does not take positions on issues, but it does empower and support its experts
in sharing their own evidence-based views and policy recommendations that have been shaped by scholarship.
Funders do not determine our research findings or the insights and recommendations of our experts. Urban
scholars and experts are expected to be objective and follow the evidence wherever it may lead.

2100 M Street NW
Washington, DC 20037
www.urban.org