american society of plumbing engineers volume 2
TRANSCRIPT

8/12/2019 American Society of Plumbing Engineers Volume 2
http://slidepdf.com/reader/full/american-society-of-plumbing-engineers-volume-2 1/233
iTable of Contents
Volume 2
Plumbing Systems
8/12/2019 American Society of Plumbing Engineers Volume 2
http://slidepdf.com/reader/full/american-society-of-plumbing-engineers-volume-2 2/233
ASPE Data Book — Volume 1ii
Copyright © 2000 by American Society of Plumbing Engineers
All rights reserved, including rights of reproduction and use in an y form or by any means, including the ma king of copies by a ny
photographic process, or by any electronic or mechanical device, printed or written or oral, or recording for sound or visual reproduc-
tion, or for use in any knowledge or retrieval system or device, unless permission in writing is obtained from the publisher.
The ASPE Data Book is designed to provide accurate and authoritat ive information for the design and specificat ion of plumbing
systems. The publisher ma kes no guara ntees or wa rra nties, expressed or implied, regarding the da ta and information conta ined in
this publicat ion. All data and informa tion are provided wit h the understa nding tha t th e publisher is not engaged in rendering legal,
consulting, engineering, or other professional services. If legal, consulting, or engineering advice or other expert assistance is re-
quired, the services of a competent professional should be engaged.
ISBN 1–891255–12–6
Pr inted in the U nited Sta tes of America
10 9 8 7 6 5 4 3 2 1

8/12/2019 American Society of Plumbing Engineers Volume 2
http://slidepdf.com/reader/full/american-society-of-plumbing-engineers-volume-2 3/233
iiiTable of Contents
Data Book Volume 2
Plumbing Systems
Da t a Book Chairperson: Anthony W. Stutes, P.E., CIPE
ASPE Vice-President, Technical: David Chin, P.E., CIPE
Editorial Review: ASPE Technical and Research Committee
Technical and Research CommitteeChairperson: Norman T. Heinig, CIPE
CONTRIBUTORS
Chapter 1Michael G rana ta , P .E .
Timothy S mith, CIP E
Pa tr ick L. Whitworth, CIP E
Chapter 2Notman T. Heinig, CIP E
Sa um K. Nour , Ph.D. , P .E . , CIPE
Chapter 3Michael G rana ta , P .E .
Timothy S mith, CIP E
Pa tr ick L. Whitworth, CIP E
Chapter 4Pa tr ick L. Whitworth, CIP E
Chapter 5Michael G rana ta , P .E .
Stephen E. Howe, P .E . , CIP E
Donald L. Sa mpler , Sr . , P .E . , CIPE
Chapter 6Anthony W. Stut es, P.E., CIP E
Chapter 7J oseph J . Ba rbera , P .E . , C IPE
J ohn P . Ca l lahan , CIPE
Pa ul D. Finnerty , CIPE
Ronald W. Howie, CIP E
Robert L. Love, P.E ., CIP E
St even T. Mayer, CIP E, CE T
J on G. Moore
Rand J . Refr iger i , P .E .
Chapter 8A. R. Rubin, P rofessor of B iologica l a nd
Agricultural Engineering,
North C arolina Sta te U nivers i tyP at rick L. Whitw orth, CIP E
Chapter 9Na tiona l G round Water Associat ion (NG WA),
Wester ville, OH
P at rick L. Whitw orth, CIP E
Chapter 10Clarke L. Marshal l
Chapter 11Micha el Fra nkel, CIP E
Wa rr en W. Serl es
Chapter 12Micha el Fra nkel, CIP E
8/12/2019 American Society of Plumbing Engineers Volume 2
http://slidepdf.com/reader/full/american-society-of-plumbing-engineers-volume-2 4/233
ASPE Data Book — Volume 1iv
ABOUT ASPE
The American S ociety of Plumbin g En gineers (ASP E) is the interna tiona l orga niza tion for professiona ls skilled in
the design a nd specification of plumbing syst ems. ASP E is dedicat ed to the adva ncement of the science of plumb-
ing engineering, to the professional growth and advancement of i ts members, and to the health, welfare, and
sa fety of the public.
The Society disseminat es technical da ta an d information, sponsors act ivit ies tha t fa cilitate int eract ion w ith
fellow professiona ls, and, t hrough resear ch and educat ion program s, expa nds th e base of know ledge of the plumb-
ing engineering industry. ASPE members are leaders in innovative plumbing design, effect ive materials and
energy use, a nd t he applicat ion of ad vanced techniques from ar ound the w orld.
WORLDWIDE MEMBERSHIP — ASP E w a s founded in 1964 and current ly ha s 7,100 members. S pan ning th e globe,
members are locat ed in the U nited Sta tes, Ca na da, Asia, Mexico, South America, the South P acific , Austra lia ,
and Europe. They represent an extensive network of experienced engineers, designers, contractors, educators,
code officials , a nd m anufa cturers interested in furthering t heir careers, their profession, and the industr y. ASP E
is at the forefront of technology. In addition, ASPE represents members and promotes the profession among all
segments of the constr uction indust ry.
ASPE MEMBERSHIP COMMUNICATION — All members belong to ASP E worldwide a nd ha ve the opportunity tobelong and pa rt icipate in one of the 57 sta te, provincial or local cha pters throughout th e U.S. a nd Ca na da. ASP E
chapters provide the major communication links and the first line of services and programs for the individual
member. Communicat ions w ith t he membership is enhanced through t he Society’s bimonthly new slet ter, t he
ASPE Report, and the monthly maga zine, Plum bing En gineer.
TECHNICAL PUBLICATIONS — The Society maintains a comprehensive publishing program, spearheaded by the
profession’s ba sic reference text, t he ASPE D ata B ook. The Data Book, encompa ssing forty -five chapters in four
volumes, provides comprehensive details of the a ccepted pra ctices an d design criteria used in th e field of plumbing
engineering. New a ddit ions t ha t will short ly join ASP E’s published libra ry of professional technical ma nuals and
ha ndbooks include: H igh-Technology Pharmaceuti cal Facili ti es Design M anual , Hi gh-Technology El ectronic Facili ti es
Design M anual, H ealth Care Faci l i t ies and H ospital s Design M anual, and Water Reuse Design M anu al.
CONVENTION AND TECHNICAL S YMPOSIUM — The Society h osts biennia l Conventions in even-num bered year s an dTechnica l Sym posia in odd-num bered year s to allow professional plumbing engin eers an d designers t o improve their
skills, learn original concepts, an d ma ke important networking conta cts to help them sta y a breast of current t rends
an d technologies. In conjunction with each Convention t here is an Engineered P lumbing Exposition, the grea test,
largest gat hering of plumbing engineering an d design products, equipment, a nd services. Everyt hing from pipes to
pumps to fixtures, from compressors to computers t o consulting s ervices is on display , giving engineers a nd specifiers
the opportunit y to view t he newest a nd most innovative mat erials an d equipment ava ilable to them.
CERTIFIED IN PLUMBING ENGINEERING — ASP E sponsors a national certification program for engineers and
designers of plumbing systems, which car ries the designat ion “Cert if ied in Plumbing E ngineering” or CIP E. The
certification program provides the profession, the plumbing industry, and the general public with a single, com-
prehensive qua lifica tion of professiona l competence for engineers a nd designers of plumbing sy stems. The CI P E,
designed exclusively by and for plumbing engineers, tests h undr eds of engineers an d designers a t centers thr oughout
the U nited St at es biennially . C reated t o provide a single, uniform na t ional credentia l in th e f ield of engineered
plumbing systems, the C IP E progra m is not in a ny w ay connected to sta te-regulated P rofessional Engineer (P .E.)
registrat ion.
ASPE RESEARCH FOUNDATION — The ASPE Research Foundation, established in 1976, is the only indepen-
dent, impartial organization involved in plumbing engineering and design research. The science of plumbing
engineering affects everyt hing . . . from the qua lity of our drinking w at er to the conservat ion of our w a ter resources
to the building codes for plumbing systems. Our lives are impacted daily by the advances made in plumbing
engineering technology through the Founda tion’s research a nd development.

8/12/2019 American Society of Plumbing Engineers Volume 2
http://slidepdf.com/reader/full/american-society-of-plumbing-engineers-volume-2 5/233

8/12/2019 American Society of Plumbing Engineers Volume 2
http://slidepdf.com/reader/full/american-society-of-plumbing-engineers-volume-2 6/233

8/12/2019 American Society of Plumbing Engineers Volume 2
http://slidepdf.com/reader/full/american-society-of-plumbing-engineers-volume-2 7/233
viiTable of Contents
Table of Contents
CHAPTER 1 Sanitary Drainage Systems . . . . . . . . . . . . . . . . . . . . . . . . . . . .
Introduction . . . . . . . . . . . . . . . . . . . . . . . . . . . . . . . . . . . . . . . . . . . . . . . . . . . . . .
Flow in Stacks, Building Drains, and Fixture Drains . . . . . . . . . . . . . . . . . . . . . . . .
Flow in Stacks . . . . . . . . . . . . . . . . . . . . . . . . . . . . . . . . . . . . . . . . . . . . . . . . .
Flow in Building Drains . . . . . . . . . . . . . . . . . . . . . . . . . . . . . . . . . . . . . . . . . . 2
Flow in Fixture Drains . . . . . . . . . . . . . . . . . . . . . . . . . . . . . . . . . . . . . . . . . . . 2
Pneumatic Pressures in a Sanitary Drainage System . . . . . . . . . . . . . . . . . . . . . . . . 2
Fixture Discharge Characteristics . . . . . . . . . . . . . . . . . . . . . . . . . . . . . . . . . . . . . . 3
Drainage Loads . . . . . . . . . . . . . . . . . . . . . . . . . . . . . . . . . . . . . . . . . . . . . . . . . . . . 3
Stack Capacities . . . . . . . . . . . . . . . . . . . . . . . . . . . . . . . . . . . . . . . . . . . . . . . . . . . 3
Capacities of Sloping Drains . . . . . . . . . . . . . . . . . . . . . . . . . . . . . . . . . . . . . . . . . . 5
Steady, Uniform Flow Conditions in Sloping Drains . . . . . . . . . . . . . . . . . . . . . . 6
Hazen and Williams Formula . . . . . . . . . . . . . . . . . . . . . . . . . . . . . . . . . . . . 7
Darcy-Weisbach Formula . . . . . . . . . . . . . . . . . . . . . . . . . . . . . . . . . . . . . . 7
Manning Formula . . . . . . . . . . . . . . . . . . . . . . . . . . . . . . . . . . . . . . . . . . . . 7
Slope of Horizontal Drainage Piping . . . . . . . . . . . . . . . . . . . . . . . . . . . . . . . . . . 7
Load or Drainage Piping . . . . . . . . . . . . . . . . . . . . . . . . . . . . . . . . . . . . . . . . . . 7
Components of Sanitary Drainage Systems . . . . . . . . . . . . . . . . . . . . . . . . . . . . . . . 9
Sumps and Ejectors . . . . . . . . . . . . . . . . . . . . . . . . . . . . . . . . . . . . . . . . . . . . . 9
Cleanouts . . . . . . . . . . . . . . . . . . . . . . . . . . . . . . . . . . . . . . . . . . . . . . . . . . . . . 9Floor Drains and Floor Sinks . . . . . . . . . . . . . . . . . . . . . . . . . . . . . . . . . . . . .
Grates/Strainers . . . . . . . . . . . . . . . . . . . . . . . . . . . . . . . . . . . . . . . . . . . . . . .
Flashing Ring . . . . . . . . . . . . . . . . . . . . . . . . . . . . . . . . . . . . . . . . . . . . . . . . . 2
Sediment Bucket . . . . . . . . . . . . . . . . . . . . . . . . . . . . . . . . . . . . . . . . . . . . . . . 2
Accessories . . . . . . . . . . . . . . . . . . . . . . . . . . . . . . . . . . . . . . . . . . . . . . . . . . . 2
Backwater Valves . . . . . . . . . . . . . . . . . . . . . . . . . . . . . . . . . . . . . . . . . . . . . . 2
Oil Interceptors . . . . . . . . . . . . . . . . . . . . . . . . . . . . . . . . . . . . . . . . . . . . . . . . 2
Grease Interceptors . . . . . . . . . . . . . . . . . . . . . . . . . . . . . . . . . . . . . . . . . . . . . 3
Trap Primers . . . . . . . . . . . . . . . . . . . . . . . . . . . . . . . . . . . . . . . . . . . . . . . . . . 3
Supports . . . . . . . . . . . . . . . . . . . . . . . . . . . . . . . . . . . . . . . . . . . . . . . . . . . . .4
Materials . . . . . . . . . . . . . . . . . . . . . . . . . . . . . . . . . . . . . . . . . . . . . . . . . . . . . . . 4
Noise Transmission . . . . . . . . . . . . . . . . . . . . . . . . . . . . . . . . . . . . . . . . . . . . . 5
Building Sewer Installation . . . . . . . . . . . . . . . . . . . . . . . . . . . . . . . . . . . . . . . . . . 5
Sanitation . . . . . . . . . . . . . . . . . . . . . . . . . . . . . . . . . . . . . . . . . . . . . . . . . . . . . . 6
Kitchen Areas . . . . . . . . . . . . . . . . . . . . . . . . . . . . . . . . . . . . . . . . . . . . . . . . . . . . 6
Waterproofing . . . . . . . . . . . . . . . . . . . . . . . . . . . . . . . . . . . . . . . . . . . . . . . . . . . . 7
Floor Leveling . . . . . . . . . . . . . . . . . . . . . . . . . . . . . . . . . . . . . . . . . . . . . . . . . . . . 7

8/12/2019 American Society of Plumbing Engineers Volume 2
http://slidepdf.com/reader/full/american-society-of-plumbing-engineers-volume-2 8/233
ASPE Data Book — Volume 2viii
Joining Methods . . . . . . . . . . . . . . . . . . . . . . . . . . . . . . . . . . . . . . . . . . . . . . . . . . 7
Thermal Expansion . . . . . . . . . . . . . . . . . . . . . . . . . . . . . . . . . . . . . . . . . . . . . . . 8
Protection from Damage . . . . . . . . . . . . . . . . . . . . . . . . . . . . . . . . . . . . . . . . . . . . 8
Sovent Systems . . . . . . . . . . . . . . . . . . . . . . . . . . . . . . . . . . . . . . . . . . . . . . . . . . 9
Research . . . . . . . . . . . . . . . . . . . . . . . . . . . . . . . . . . . . . . . . . . . . . . . . . . . . . . .9
References . . . . . . . . . . . . . . . . . . . . . . . . . . . . . . . . . . . . . . . . . . . . . . . . . . . . . . 9
CHAPTER 2 Gray-Water Systems . . . . . . . . . . . . . . . . . . . . . . . . . . . . . . . . .
Introduction . . . . . . . . . . . . . . . . . . . . . . . . . . . . . . . . . . . . . . . . . . . . . . . . . . . . . 2
Codes and Standards . . . . . . . . . . . . . . . . . . . . . . . . . . . . . . . . . . . . . . . . . . . . . . 22
System Description . . . . . . . . . . . . . . . . . . . . . . . . . . . . . . . . . . . . . . . . . . . . . . . . 22
System Components . . . . . . . . . . . . . . . . . . . . . . . . . . . . . . . . . . . . . . . . . . . . 23
Design Criteria for Gray-Water Supply and Consumption . . . . . . . . . . . . . . . . . . . 23
Design Estimates for Commercial Buildings . . . . . . . . . . . . . . . . . . . . . . . . . . 25
Gray-Water Supply . . . . . . . . . . . . . . . . . . . . . . . . . . . . . . . . . . . . . . . . . . 25
Gray-Water Demand . . . . . . . . . . . . . . . . . . . . . . . . . . . . . . . . . . . . . . . . . 25
Design Estimates for Residential Buildings . . . . . . . . . . . . . . . . . . . . . . . . . . . 25
Design Estimates for Irrigation Systems . . . . . . . . . . . . . . . . . . . . . . . . . . . . . 26
Treatment Systems . . . . . . . . . . . . . . . . . . . . . . . . . . . . . . . . . . . . . . . . . . . . . . . . 27
Economic Analysis — An Example . . . . . . . . . . . . . . . . . . . . . . . . . . . . . . . . . . . . 29
Precautions . . . . . . . . . . . . . . . . . . . . . . . . . . . . . . . . . . . . . . . . . . . . . . . . . . . . . 32
Public Concerns/Acceptance . . . . . . . . . . . . . . . . . . . . . . . . . . . . . . . . . . . . . . . . 33
Conclusion . . . . . . . . . . . . . . . . . . . . . . . . . . . . . . . . . . . . . . . . . . . . . . . . . . . . . . 33
References . . . . . . . . . . . . . . . . . . . . . . . . . . . . . . . . . . . . . . . . . . . . . . . . . . . . . . 34
CHAPTER 3 Vents and Venting . . . . . . . . . . . . . . . . . . . . . . . . . . . . . . . . . .35
Section I — Vents and Venting . . . . . . . . . . . . . . . . . . . . . . . . . . . . . . . . . . . . . . . 35
Purposes of Venting . . . . . . . . . . . . . . . . . . . . . . . . . . . . . . . . . . . . . . . . . . . . 35
Vent Stack Terminal . . . . . . . . . . . . . . . . . . . . . . . . . . . . . . . . . . . . . . . . . . . . 35
Traps and Trap Seals . . . . . . . . . . . . . . . . . . . . . . . . . . . . . . . . . . . . . . . . . . . 36
Factors Affecting Trap Seal Loss . . . . . . . . . . . . . . . . . . . . . . . . . . . . . . . . . . . 36
Suds Venting . . . . . . . . . . . . . . . . . . . . . . . . . . . . . . . . . . . . . . . . . . . . . . . . . 36
Fixture Vents . . . . . . . . . . . . . . . . . . . . . . . . . . . . . . . . . . . . . . . . . . . . . . . . . 37
Venting as a Means of Reducing Trap Seal Losses from Induced Siphonage . . . 39
Design of Vents to Control Induced Siphonage . . . . . . . . . . . . . . . . . . . . . . . . 4
Drainage Fixture Units . . . . . . . . . . . . . . . . . . . . . . . . . . . . . . . . . . . . . . . . . . 4
Vent Sizes and Lengths . . . . . . . . . . . . . . . . . . . . . . . . . . . . . . . . . . . . . . . . . . 4
End Venting . . . . . . . . . . . . . . . . . . . . . . . . . . . . . . . . . . . . . . . . . . . . . . . . . . 4
Common Vent . . . . . . . . . . . . . . . . . . . . . . . . . . . . . . . . . . . . . . . . . . . . . . . . . 4
Stack Venting . . . . . . . . . . . . . . . . . . . . . . . . . . . . . . . . . . . . . . . . . . . . . . . . . 4
Wet Venting . . . . . . . . . . . . . . . . . . . . . . . . . . . . . . . . . . . . . . . . . . . . . . . . . . 43
Circuit and Loop Venting . . . . . . . . . . . . . . . . . . . . . . . . . . . . . . . . . . . . . . . . 43
Relief Vents . . . . . . . . . . . . . . . . . . . . . . . . . . . . . . . . . . . . . . . . . . . . . . . . . . . 44

8/12/2019 American Society of Plumbing Engineers Volume 2
http://slidepdf.com/reader/full/american-society-of-plumbing-engineers-volume-2 9/233
ixTable of Contents
Offset . . . . . . . . . . . . . . . . . . . . . . . . . . . . . . . . . . . . . . . . . . . . . . . . . . . . . . . 44
Vent Headers . . . . . . . . . . . . . . . . . . . . . . . . . . . . . . . . . . . . . . . . . . . . . . . . . 45
Combination Waste and Vent Systems . . . . . . . . . . . . . . . . . . . . . . . . . . . . . . 45
Section II — Several Venting Systems . . . . . . . . . . . . . . . . . . . . . . . . . . . . . . . . . . 46
Philadelphia System . . . . . . . . . . . . . . . . . . . . . . . . . . . . . . . . . . . . . . . . . . . .46
Sovent System . . . . . . . . . . . . . . . . . . . . . . . . . . . . . . . . . . . . . . . . . . . . . . . . 46
Stack Venting . . . . . . . . . . . . . . . . . . . . . . . . . . . . . . . . . . . . . . . . . . . . . . . . . 47
Wet Venting . . . . . . . . . . . . . . . . . . . . . . . . . . . . . . . . . . . . . . . . . . . . . . . . . . 49
Reduced-Size Venting . . . . . . . . . . . . . . . . . . . . . . . . . . . . . . . . . . . . . . . . . . . 49
Section III — Sizing of Several Venting Systems . . . . . . . . . . . . . . . . . . . . . . . . . . 5
Reduced-Size Venting Design . . . . . . . . . . . . . . . . . . . . . . . . . . . . . . . . . . . . . 5
General Limitations . . . . . . . . . . . . . . . . . . . . . . . . . . . . . . . . . . . . . . . . . . 5
Sizing Procedure . . . . . . . . . . . . . . . . . . . . . . . . . . . . . . . . . . . . . . . . . . . . 5
Installation . . . . . . . . . . . . . . . . . . . . . . . . . . . . . . . . . . . . . . . . . . . . . . . . 52
Sovent Systems . . . . . . . . . . . . . . . . . . . . . . . . . . . . . . . . . . . . . . . . . . . . . . . . 54
Aerator Fittings . . . . . . . . . . . . . . . . . . . . . . . . . . . . . . . . . . . . . . . . . . . . . 54
Deaerator Fittings . . . . . . . . . . . . . . . . . . . . . . . . . . . . . . . . . . . . . . . . . . . 56
Sizing Procedure . . . . . . . . . . . . . . . . . . . . . . . . . . . . . . . . . . . . . . . . . . . . 57
Installation . . . . . . . . . . . . . . . . . . . . . . . . . . . . . . . . . . . . . . . . . . . . . . . . 62
Glossary . . . . . . . . . . . . . . . . . . . . . . . . . . . . . . . . . . . . . . . . . . . . . . . . . . . . . . . . 64
References . . . . . . . . . . . . . . . . . . . . . . . . . . . . . . . . . . . . . . . . . . . . . . . . . . . . . . 65
CHAPTER 4 Storm-Drainage Systems . . . . . . . . . . . . . . . . . . . . . . . . . . . . . 67
General Design Considerations for Buildings and Sites . . . . . . . . . . . . . . . . . . . . . 67
Materials . . . . . . . . . . . . . . . . . . . . . . . . . . . . . . . . . . . . . . . . . . . . . . . . . . . . . . . 68
Part One: Building Drainage System Design . . . . . . . . . . . . . . . . . . . . . . . . . . . . . 68Design Criteria . . . . . . . . . . . . . . . . . . . . . . . . . . . . . . . . . . . . . . . . . . . . . . . . 68
Pipe Sizing and Layout . . . . . . . . . . . . . . . . . . . . . . . . . . . . . . . . . . . . . . . . . . 69
Rainfall Rates . . . . . . . . . . . . . . . . . . . . . . . . . . . . . . . . . . . . . . . . . . . . . . . . . 69
Rainfall Rate Tables . . . . . . . . . . . . . . . . . . . . . . . . . . . . . . . . . . . . . . . . . . 69
Secondary Drainage Systems . . . . . . . . . . . . . . . . . . . . . . . . . . . . . . . . . . . 7
Roof Drainage . . . . . . . . . . . . . . . . . . . . . . . . . . . . . . . . . . . . . . . . . . . . . . . . . 79
Coordination . . . . . . . . . . . . . . . . . . . . . . . . . . . . . . . . . . . . . . . . . . . . . . . 79
Drain Location . . . . . . . . . . . . . . . . . . . . . . . . . . . . . . . . . . . . . . . . . . . . . 79
Roof Drain Construction . . . . . . . . . . . . . . . . . . . . . . . . . . . . . . . . . . . . . . 8
Piping Coordination . . . . . . . . . . . . . . . . . . . . . . . . . . . . . . . . . . . . . . . . . .8
Expansion . . . . . . . . . . . . . . . . . . . . . . . . . . . . . . . . . . . . . . . . . . . . . . . . . 85
Insulation . . . . . . . . . . . . . . . . . . . . . . . . . . . . . . . . . . . . . . . . . . . . . . . . . 85
Locating Vertical Leaders . . . . . . . . . . . . . . . . . . . . . . . . . . . . . . . . . . . . . . 85
Horizontal Pipe Sizing . . . . . . . . . . . . . . . . . . . . . . . . . . . . . . . . . . . . . . . . 88
Controlled-Flow Storm Drainage System . . . . . . . . . . . . . . . . . . . . . . . . . . 88
Part Two: Site Drainage System Design . . . . . . . . . . . . . . . . . . . . . . . . . . . . . . . . . 95
General Design Considerations . . . . . . . . . . . . . . . . . . . . . . . . . . . . . . . . . . . . 95

8/12/2019 American Society of Plumbing Engineers Volume 2
http://slidepdf.com/reader/full/american-society-of-plumbing-engineers-volume-2 10/233
ASPE Data Book — Volume 2x
Site Drainage . . . . . . . . . . . . . . . . . . . . . . . . . . . . . . . . . . . . . . . . . . . . . . . . . 95
The Rational Method of System Design . . . . . . . . . . . . . . . . . . . . . . . . . . . . . . 95
Exterior Piping and Inlets . . . . . . . . . . . . . . . . . . . . . . . . . . . . . . . . . . . . . . . . 98
Subsurface Drainage . . . . . . . . . . . . . . . . . . . . . . . . . . . . . . . . . . . . . . . . . . . . 99
Source of Subsurface Water . . . . . . . . . . . . . . . . . . . . . . . . . . . . . . . . . . .99
Site Investigation . . . . . . . . . . . . . . . . . . . . . . . . . . . . . . . . . . . . . . . . . . .
Drainage Pipe. . . . . . . . . . . . . . . . . . . . . . . . . . . . . . . . . . . . . . . . . . . . . . 2
Trenching . . . . . . . . . . . . . . . . . . . . . . . . . . . . . . . . . . . . . . . . . . . . . . . . 2
Selecting Pipe Diameter . . . . . . . . . . . . . . . . . . . . . . . . . . . . . . . . . . . . . . 4
Disposal of Ground Water . . . . . . . . . . . . . . . . . . . . . . . . . . . . . . . . . . . . 5
Storm-Water Detention . . . . . . . . . . . . . . . . . . . . . . . . . . . . . . . . . . . . . . . . . 5
Standard Equations . . . . . . . . . . . . . . . . . . . . . . . . . . . . . . . . . . . . . . . . . . . . . . 7
Appendix . . . . . . . . . . . . . . . . . . . . . . . . . . . . . . . . . . . . . . . . . . . . . . . . . . . . . . 9
Form 4-1 Storm-Drainage Calculations for Roof Drains and Vertical Leaders . . . . . . . . . . . . . . . . . . . . . . . . . . . . . . . . . . . . . . . . . . . 9
Form 4-2 Storm-Drainage System Sizing Sheet . . . . . . . . . . . . . . . . . . . . . .
Form 4-3 Storm-Water Drainage Worksheet 1 . . . . . . . . . . . . . . . . . . . . . . .
Form 4-3 Storm-Water Drainage Worksheet 2 . . . . . . . . . . . . . . . . . . . . . . . 2
Form 4-3 Storm-Water Drainage Worksheet 3 . . . . . . . . . . . . . . . . . . . . . . . 3
References . . . . . . . . . . . . . . . . . . . . . . . . . . . . . . . . . . . . . . . . . . . . . . . . . . . . . 4
CHAPTER 5 Cold-Water Systems . . . . . . . . . . . . . . . . . . . . . . . . . . . . . . . . 5
Introduction . . . . . . . . . . . . . . . . . . . . . . . . . . . . . . . . . . . . . . . . . . . . . . . . . . . . 5
Domestic Cold-Water Meters . . . . . . . . . . . . . . . . . . . . . . . . . . . . . . . . . . . . . . . . 5
Meter Types . . . . . . . . . . . . . . . . . . . . . . . . . . . . . . . . . . . . . . . . . . . . . . . . . 6
Sizing the Water Meter . . . . . . . . . . . . . . . . . . . . . . . . . . . . . . . . . . . . . . . . .6
Sizing the Water Line . . . . . . . . . . . . . . . . . . . . . . . . . . . . . . . . . . . . . . . . . . . . . 6
Hazen-Williams Formula . . . . . . . . . . . . . . . . . . . . . . . . . . . . . . . . . . . . . . . . 6
Factors Affecting Sizing . . . . . . . . . . . . . . . . . . . . . . . . . . . . . . . . . . . . . . . . . 2
Demand . . . . . . . . . . . . . . . . . . . . . . . . . . . . . . . . . . . . . . . . . . . . . . . . . 2
Velocity . . . . . . . . . . . . . . . . . . . . . . . . . . . . . . . . . . . . . . . . . . . . . . . . . . 2
Pressure . . . . . . . . . . . . . . . . . . . . . . . . . . . . . . . . . . . . . . . . . . . . . . . . . 22
Velocity Method . . . . . . . . . . . . . . . . . . . . . . . . . . . . . . . . . . . . . . . . . . . . 3
Summary . . . . . . . . . . . . . . . . . . . . . . . . . . . . . . . . . . . . . . . . . . . . . . . . . . . 3
Water Hammer . . . . . . . . . . . . . . . . . . . . . . . . . . . . . . . . . . . . . . . . . . . . . . . . . . 3
Shock Intensity . . . . . . . . . . . . . . . . . . . . . . . . . . . . . . . . . . . . . . . . . . . . . . . 32
System Protection and Control . . . . . . . . . . . . . . . . . . . . . . . . . . . . . . . . . . . 32
Air Chambers . . . . . . . . . . . . . . . . . . . . . . . . . . . . . . . . . . . . . . . . . . . . . 32
Water Hammer Arresters . . . . . . . . . . . . . . . . . . . . . . . . . . . . . . . . . . . . . 43
Backflow Prevention . . . . . . . . . . . . . . . . . . . . . . . . . . . . . . . . . . . . . . . . . . . . . . 44
Types of Cross-Connection Control Device . . . . . . . . . . . . . . . . . . . . . . . . . . . 44
Assessment of Hazard . . . . . . . . . . . . . . . . . . . . . . . . . . . . . . . . . . . . . . . . . . 45
Premise Isolation . . . . . . . . . . . . . . . . . . . . . . . . . . . . . . . . . . . . . . . . . . . . . 45

8/12/2019 American Society of Plumbing Engineers Volume 2
http://slidepdf.com/reader/full/american-society-of-plumbing-engineers-volume-2 11/233

8/12/2019 American Society of Plumbing Engineers Volume 2
http://slidepdf.com/reader/full/american-society-of-plumbing-engineers-volume-2 12/233
ASPE Data Book — Volume 2xii
CHAPTER 7 Fuel-Gas Piping Systems . . . . . . . . . . . . . . . . . . . . . . . . . . . . 73
Low and Medium-Pressure Natural Gas Systems . . . . . . . . . . . . . . . . . . . . . . . . 73
Design Considerations . . . . . . . . . . . . . . . . . . . . . . . . . . . . . . . . . . . . . . . . . 73
Laboratory Gas . . . . . . . . . . . . . . . . . . . . . . . . . . . . . . . . . . . . . . . . . . . . . 76
Gas Train Vents . . . . . . . . . . . . . . . . . . . . . . . . . . . . . . . . . . . . . . . . . . . . . .77
Appliances . . . . . . . . . . . . . . . . . . . . . . . . . . . . . . . . . . . . . . . . . . . . . . . . . . 77
Gas Boosters . . . . . . . . . . . . . . . . . . . . . . . . . . . . . . . . . . . . . . . . . . . . . . . . . 78
Definition . . . . . . . . . . . . . . . . . . . . . . . . . . . . . . . . . . . . . . . . . . . . . . . . 78
Gas Boosters for Natural or Liquefied Petroleum Gas . . . . . . . . . . . . . . . . 78
Materials of Construction . . . . . . . . . . . . . . . . . . . . . . . . . . . . . . . . . . . . 79
Gas Laws . . . . . . . . . . . . . . . . . . . . . . . . . . . . . . . . . . . . . . . . . . . . . . . . 79
Design Considerations . . . . . . . . . . . . . . . . . . . . . . . . . . . . . . . . . . . . . . . 8
Sizing a Gas Booster . . . . . . . . . . . . . . . . . . . . . . . . . . . . . . . . . . . . . . . . 82
Pipe Sizing . . . . . . . . . . . . . . . . . . . . . . . . . . . . . . . . . . . . . . . . . . . . . . . . . . 83
Liguefied Petroleum Gas . . . . . . . . . . . . . . . . . . . . . . . . . . . . . . . . . . . . . . . . . . . 94
Storage . . . . . . . . . . . . . . . . . . . . . . . . . . . . . . . . . . . . . . . . . . . . . . . . . . . . . 94
Material . . . . . . . . . . . . . . . . . . . . . . . . . . . . . . . . . . . . . . . . . . . . . . . . . . . . 96
Pipe . . . . . . . . . . . . . . . . . . . . . . . . . . . . . . . . . . . . . . . . . . . . . . . . . . . . . 96
Tubing . . . . . . . . . . . . . . . . . . . . . . . . . . . . . . . . . . . . . . . . . . . . . . . . . . 96
Plastic Pipe and Tubing . . . . . . . . . . . . . . . . . . . . . . . . . . . . . . . . . . . . . . 96
Fittings . . . . . . . . . . . . . . . . . . . . . . . . . . . . . . . . . . . . . . . . . . . . . . . . . . 96
Pipe Joints . . . . . . . . . . . . . . . . . . . . . . . . . . . . . . . . . . . . . . . . . . . . . . . 96
Tubing Joints . . . . . . . . . . . . . . . . . . . . . . . . . . . . . . . . . . . . . . . . . . . . . 96
Flexible Gas Hose . . . . . . . . . . . . . . . . . . . . . . . . . . . . . . . . . . . . . . . . . . . . . 96
Indoor . . . . . . . . . . . . . . . . . . . . . . . . . . . . . . . . . . . . . . . . . . . . . . . . . . . 96
Outdoor . . . . . . . . . . . . . . . . . . . . . . . . . . . . . . . . . . . . . . . . . . . . . . . . . 96
Warning . . . . . . . . . . . . . . . . . . . . . . . . . . . . . . . . . . . . . . . . . . . . . . . . . . . . 97
Leak Test . . . . . . . . . . . . . . . . . . . . . . . . . . . . . . . . . . . . . . . . . . . . . . . . . . . 97
Appendix A . . . . . . . . . . . . . . . . . . . . . . . . . . . . . . . . . . . . . . . . . . . . . . . . . . . . . 97
Appendix B — Values of Fuel Gas . . . . . . . . . . . . . . . . . . . . . . . . . . . . . . . . . . . . 2 2
Glossary . . . . . . . . . . . . . . . . . . . . . . . . . . . . . . . . . . . . . . . . . . . . . . . . . . . . . . . 2 3
References . . . . . . . . . . . . . . . . . . . . . . . . . . . . . . . . . . . . . . . . . . . . . . . . . . . . . 2 4
CHAPTER 8 Private Sewage-Disposal Systems . . . . . . . . . . . . . . . . . . . . . . 7
Introduction . . . . . . . . . . . . . . . . . . . . . . . . . . . . . . . . . . . . . . . . . . . . . . . . . . . . 2 7
Primary Collection and Treatment Systems . . . . . . . . . . . . . . . . . . . . . . . . . . . . .2 7
Soil-Absorption Systems . . . . . . . . . . . . . . . . . . . . . . . . . . . . . . . . . . . . . . . . . . . 2 7
Guide for Estimating Soil Absorption Potential . . . . . . . . . . . . . . . . . . . . . . . 2 7
Soil Maps . . . . . . . . . . . . . . . . . . . . . . . . . . . . . . . . . . . . . . . . . . . . . . . . 2 8
Clues to Absorption Capacity . . . . . . . . . . . . . . . . . . . . . . . . . . . . . . . . . . 2 8
Procedure for Percolation Tests . . . . . . . . . . . . . . . . . . . . . . . . . . . . . . . . 2 9
Soil-Absorption System Selection . . . . . . . . . . . . . . . . . . . . . . . . . . . . . . . . . 22
Leaching Trenches . . . . . . . . . . . . . . . . . . . . . . . . . . . . . . . . . . . . . . . . . . . . 22

8/12/2019 American Society of Plumbing Engineers Volume 2
http://slidepdf.com/reader/full/american-society-of-plumbing-engineers-volume-2 13/233
xiiiTable of Contents
Construction Considerations . . . . . . . . . . . . . . . . . . . . . . . . . . . . . . . . . . 222
Serial Distribution . . . . . . . . . . . . . . . . . . . . . . . . . . . . . . . . . . . . . . . . . . 223
Seepage Beds . . . . . . . . . . . . . . . . . . . . . . . . . . . . . . . . . . . . . . . . . . . . . . . . 224
Construction Considerations . . . . . . . . . . . . . . . . . . . . . . . . . . . . . . . . . . 225
Seepage Pits . . . . . . . . . . . . . . . . . . . . . . . . . . . . . . . . . . . . . . . . . . . . . . . . .225
Construction Considerations . . . . . . . . . . . . . . . . . . . . . . . . . . . . . . . . . . 225
Mound Systems . . . . . . . . . . . . . . . . . . . . . . . . . . . . . . . . . . . . . . . . . . . . . . 226
Collection and Treatment Alternatives . . . . . . . . . . . . . . . . . . . . . . . . . . . . . . . . . 226
Alternatives to Gravity Collection and Distribution . . . . . . . . . . . . . . . . . . . . 226
Alternatives to Conventional Primary-and-Secondary Treatment . . . . . . . . . . 227
Septic Tanks . . . . . . . . . . . . . . . . . . . . . . . . . . . . . . . . . . . . . . . . . . . . . . . . . . . . 227
Functions of the Septic Tank . . . . . . . . . . . . . . . . . . . . . . . . . . . . . . . . . . . . . 227
Biological Treatment . . . . . . . . . . . . . . . . . . . . . . . . . . . . . . . . . . . . . . . . 227
Solids Removal . . . . . . . . . . . . . . . . . . . . . . . . . . . . . . . . . . . . . . . . . . . . 227
Septic Tank Specifications . . . . . . . . . . . . . . . . . . . . . . . . . . . . . . . . . . . . . . . 228
Materials . . . . . . . . . . . . . . . . . . . . . . . . . . . . . . . . . . . . . . . . . . . . . . . . . 228
General . . . . . . . . . . . . . . . . . . . . . . . . . . . . . . . . . . . . . . . . . . . . . . . . . . 228
Invert . . . . . . . . . . . . . . . . . . . . . . . . . . . . . . . . . . . . . . . . . . . . . . . . . . . 228
Outlet . . . . . . . . . . . . . . . . . . . . . . . . . . . . . . . . . . . . . . . . . . . . . . . . . . . 228
Tank Proportions . . . . . . . . . . . . . . . . . . . . . . . . . . . . . . . . . . . . . . . . . . . 228
Storage above Liquid Level . . . . . . . . . . . . . . . . . . . . . . . . . . . . . . . . . . . 228
Use of Compartments . . . . . . . . . . . . . . . . . . . . . . . . . . . . . . . . . . . . . . . 229
General Information on Septic Tanks . . . . . . . . . . . . . . . . . . . . . . . . . . . . . . 229
Cleaning . . . . . . . . . . . . . . . . . . . . . . . . . . . . . . . . . . . . . . . . . . . . . . . . . 229
Grease Interceptors . . . . . . . . . . . . . . . . . . . . . . . . . . . . . . . . . . . . . . . . . 23
Chemicals . . . . . . . . . . . . . . . . . . . . . . . . . . . . . . . . . . . . . . . . . . . . . . . . 23
Miscellaneous . . . . . . . . . . . . . . . . . . . . . . . . . . . . . . . . . . . . . . . . . . . . . 23
Distribution Boxes . . . . . . . . . . . . . . . . . . . . . . . . . . . . . . . . . . . . . . . . . . . . . . . 23
Septic Tank/Soil-Absorption Systems for Institutions and Recreational andOther Establishments . . . . . . . . . . . . . . . . . . . . . . . . . . . . . . . . . . . . . . . . . . 23
Water Conservation . . . . . . . . . . . . . . . . . . . . . . . . . . . . . . . . . . . . . . . . . . . 232
Special Fixtures . . . . . . . . . . . . . . . . . . . . . . . . . . . . . . . . . . . . . . . . . . . . . . 232
Alternative Systems . . . . . . . . . . . . . . . . . . . . . . . . . . . . . . . . . . . . . . . . . . . 232
Special Design . . . . . . . . . . . . . . . . . . . . . . . . . . . . . . . . . . . . . . . . . . . . . . . 232
Individual Aerobic Waste-Water Treatment Plants . . . . . . . . . . . . . . . . . . . . . . . . 232
Estimating Sewage Quantities . . . . . . . . . . . . . . . . . . . . . . . . . . . . . . . . . . . . . .233
Inspection . . . . . . . . . . . . . . . . . . . . . . . . . . . . . . . . . . . . . . . . . . . . . . . . . . . . . 238
References . . . . . . . . . . . . . . . . . . . . . . . . . . . . . . . . . . . . . . . . . . . . . . . . . . . . . 238
Bibliography . . . . . . . . . . . . . . . . . . . . . . . . . . . . . . . . . . . . . . . . . . . . . . . . . . . . 238
CHAPTER 9 Private Water Systems . . . . . . . . . . . . . . . . . . . . . . . . . . . . . . 39
Introduction . . . . . . . . . . . . . . . . . . . . . . . . . . . . . . . . . . . . . . . . . . . . . . . . . . . . 239
Sources of Supply . . . . . . . . . . . . . . . . . . . . . . . . . . . . . . . . . . . . . . . . . . . . . 239
8/12/2019 American Society of Plumbing Engineers Volume 2
http://slidepdf.com/reader/full/american-society-of-plumbing-engineers-volume-2 14/233
ASPE Data Book — Volume 2xiv
Wells . . . . . . . . . . . . . . . . . . . . . . . . . . . . . . . . . . . . . . . . . . . . . . . . . . . . . . . . . 24
Dug Wells . . . . . . . . . . . . . . . . . . . . . . . . . . . . . . . . . . . . . . . . . . . . . . . . . . . 24
Bored Wells . . . . . . . . . . . . . . . . . . . . . . . . . . . . . . . . . . . . . . . . . . . . . . . . . . 24
Driven Wells . . . . . . . . . . . . . . . . . . . . . . . . . . . . . . . . . . . . . . . . . . . . . . . . . 24
Jetted Wells . . . . . . . . . . . . . . . . . . . . . . . . . . . . . . . . . . . . . . . . . . . . . . . . .24
Hydraulics of Wells . . . . . . . . . . . . . . . . . . . . . . . . . . . . . . . . . . . . . . . . . . . . 24
Protection of Wells . . . . . . . . . . . . . . . . . . . . . . . . . . . . . . . . . . . . . . . . . . . . 243
Water Demand . . . . . . . . . . . . . . . . . . . . . . . . . . . . . . . . . . . . . . . . . . . . . . . . . . 243
Water Quality . . . . . . . . . . . . . . . . . . . . . . . . . . . . . . . . . . . . . . . . . . . . . . . . . . . 244
Filtration . . . . . . . . . . . . . . . . . . . . . . . . . . . . . . . . . . . . . . . . . . . . . . . . . . . 244
Softening . . . . . . . . . . . . . . . . . . . . . . . . . . . . . . . . . . . . . . . . . . . . . . . . . . . 244
Scale and Corrosion Control . . . . . . . . . . . . . . . . . . . . . . . . . . . . . . . . . . . . . 244
Taste and Odor Control . . . . . . . . . . . . . . . . . . . . . . . . . . . . . . . . . . . . . . . . . 245
Prophylaxis . . . . . . . . . . . . . . . . . . . . . . . . . . . . . . . . . . . . . . . . . . . . . . . . . . 245
Disinfection . . . . . . . . . . . . . . . . . . . . . . . . . . . . . . . . . . . . . . . . . . . . . . . . . 245
System Elements . . . . . . . . . . . . . . . . . . . . . . . . . . . . . . . . . . . . . . . . . . . . . . . . 245
Pumps . . . . . . . . . . . . . . . . . . . . . . . . . . . . . . . . . . . . . . . . . . . . . . . . . . . . . 245
Well Pumps . . . . . . . . . . . . . . . . . . . . . . . . . . . . . . . . . . . . . . . . . . . . . . . 245
Storage Tanks . . . . . . . . . . . . . . . . . . . . . . . . . . . . . . . . . . . . . . . . . . . . . . . . 247
Suction Piping . . . . . . . . . . . . . . . . . . . . . . . . . . . . . . . . . . . . . . . . . . . . . . . 248
Pressure Regulators . . . . . . . . . . . . . . . . . . . . . . . . . . . . . . . . . . . . . . . . . . . 248
Supply Piping . . . . . . . . . . . . . . . . . . . . . . . . . . . . . . . . . . . . . . . . . . . . . . . . 249
Pipe Installation . . . . . . . . . . . . . . . . . . . . . . . . . . . . . . . . . . . . . . . . . . . . . . . . . 25
Thrust Blocks . . . . . . . . . . . . . . . . . . . . . . . . . . . . . . . . . . . . . . . . . . . . . . . . 25
Depth of Bury . . . . . . . . . . . . . . . . . . . . . . . . . . . . . . . . . . . . . . . . . . . . . . . . 25
Settlement . . . . . . . . . . . . . . . . . . . . . . . . . . . . . . . . . . . . . . . . . . . . . . . . . . 25
Expansion . . . . . . . . . . . . . . . . . . . . . . . . . . . . . . . . . . . . . . . . . . . . . . . . . . 25
Corrosion Protection . . . . . . . . . . . . . . . . . . . . . . . . . . . . . . . . . . . . . . . . . . . 252
Initial Operation and Maintenance . . . . . . . . . . . . . . . . . . . . . . . . . . . . . . . . . . . 252
Additional Information . . . . . . . . . . . . . . . . . . . . . . . . . . . . . . . . . . . . . . . . . . . . 252
CHAPTER 10 Vacuum Systems . . . . . . . . . . . . . . . . . . . . . . . . . . . . . . . . . 53
Introduction . . . . . . . . . . . . . . . . . . . . . . . . . . . . . . . . . . . . . . . . . . . . . . . . . . . . 253
Fundamentals . . . . . . . . . . . . . . . . . . . . . . . . . . . . . . . . . . . . . . . . . . . . . . . . . . 253
Pressure Measurement . . . . . . . . . . . . . . . . . . . . . . . . . . . . . . . . . . . . . . . . . . . . 254
Units of Measurement and Reference Points . . . . . . . . . . . . . . . . . . . . . . . . .254
Standard Reference Points and Conversions . . . . . . . . . . . . . . . . . . . . . . 254
Flow-Rate Measurement . . . . . . . . . . . . . . . . . . . . . . . . . . . . . . . . . . . . . 255
Converting scfm to acfm . . . . . . . . . . . . . . . . . . . . . . . . . . . . . . . . . . . . . 256
General Vacuum Criteria . . . . . . . . . . . . . . . . . . . . . . . . . . . . . . . . . . . . . . . . . . 257
Adjusting Vacuum-Pump Rating for Altitude . . . . . . . . . . . . . . . . . . . . . . . . . 257
Time for Pump to Reach Rated Vacuum . . . . . . . . . . . . . . . . . . . . . . . . . . . . 257
Adjusting Pressure Drop for Different Vacuum Pressures . . . . . . . . . . . . . . . 258
8/12/2019 American Society of Plumbing Engineers Volume 2
http://slidepdf.com/reader/full/american-society-of-plumbing-engineers-volume-2 15/233
xvTable of Contents
Simplified Method of Calculating Velocity . . . . . . . . . . . . . . . . . . . . . . . . . . . 258
Vacuum Work Forces . . . . . . . . . . . . . . . . . . . . . . . . . . . . . . . . . . . . . . . . . . 259
Vacuum Source and Source Components . . . . . . . . . . . . . . . . . . . . . . . . . . . . . . 259
General . . . . . . . . . . . . . . . . . . . . . . . . . . . . . . . . . . . . . . . . . . . . . . . . . . . . . 259
Vacuum Pumps . . . . . . . . . . . . . . . . . . . . . . . . . . . . . . . . . . . . . . . . . . . . . .259
Gas-Transfer Pumps . . . . . . . . . . . . . . . . . . . . . . . . . . . . . . . . . . . . . . . . 259
Receivers . . . . . . . . . . . . . . . . . . . . . . . . . . . . . . . . . . . . . . . . . . . . . . . . . . . 26
Seal Liquids . . . . . . . . . . . . . . . . . . . . . . . . . . . . . . . . . . . . . . . . . . . . . . . . . 26
Vacuum-Pressure Gauges . . . . . . . . . . . . . . . . . . . . . . . . . . . . . . . . . . . . . . . 26
Bourdon Gauge . . . . . . . . . . . . . . . . . . . . . . . . . . . . . . . . . . . . . . . . . . . . 26
Diaphragm Gauge . . . . . . . . . . . . . . . . . . . . . . . . . . . . . . . . . . . . . . . . . . 26
Ancillary Equipment . . . . . . . . . . . . . . . . . . . . . . . . . . . . . . . . . . . . . . . . . . . 26
Laboratory and Vacuum Systems . . . . . . . . . . . . . . . . . . . . . . . . . . . . . . . . . . . . 262
Codes and Standards . . . . . . . . . . . . . . . . . . . . . . . . . . . . . . . . . . . . . . . . . . 262
Vacuum Source . . . . . . . . . . . . . . . . . . . . . . . . . . . . . . . . . . . . . . . . . . . . . . 262
Distribution Network . . . . . . . . . . . . . . . . . . . . . . . . . . . . . . . . . . . . . . . . . . . 262
Pipe Material and Joints . . . . . . . . . . . . . . . . . . . . . . . . . . . . . . . . . . . . . 262
Sizing Criteria . . . . . . . . . . . . . . . . . . . . . . . . . . . . . . . . . . . . . . . . . . . . . . . . 262
Vacuum-Cleaning Systems . . . . . . . . . . . . . . . . . . . . . . . . . . . . . . . . . . . . . . . . . 266
Types of System and Equipment . . . . . . . . . . . . . . . . . . . . . . . . . . . . . . . . . . 266
Codes and Standards . . . . . . . . . . . . . . . . . . . . . . . . . . . . . . . . . . . . . . . . . . 266
System Components . . . . . . . . . . . . . . . . . . . . . . . . . . . . . . . . . . . . . . . . . . . 266
Vacuum Producer (Exhauster) . . . . . . . . . . . . . . . . . . . . . . . . . . . . . . . . . 266
Separators . . . . . . . . . . . . . . . . . . . . . . . . . . . . . . . . . . . . . . . . . . . . . . . 268
Filters . . . . . . . . . . . . . . . . . . . . . . . . . . . . . . . . . . . . . . . . . . . . . . . . . . . 268
Silencers . . . . . . . . . . . . . . . . . . . . . . . . . . . . . . . . . . . . . . . . . . . . . . . . . 268
Inlets . . . . . . . . . . . . . . . . . . . . . . . . . . . . . . . . . . . . . . . . . . . . . . . . . . . 268
Control and Check Valves . . . . . . . . . . . . . . . . . . . . . . . . . . . . . . . . . . . . 268
Air-Bleed Control . . . . . . . . . . . . . . . . . . . . . . . . . . . . . . . . . . . . . . . . . . . 268
Pipe and Fittings . . . . . . . . . . . . . . . . . . . . . . . . . . . . . . . . . . . . . . . . . . . 268
Detailed System Design . . . . . . . . . . . . . . . . . . . . . . . . . . . . . . . . . . . . . . . . . 269
Inlet Location and Spacing . . . . . . . . . . . . . . . . . . . . . . . . . . . . . . . . . . . 269
Determining the Number of Simultaneous Operators . . . . . . . . . . . . . . . . 269
Inlet-Valve, Tool, and Hose Sizing . . . . . . . . . . . . . . . . . . . . . . . . . . . . . . 269
Locating the Vacuum-Producer Assembly . . . . . . . . . . . . . . . . . . . . . . . . 27
Sizing the Piping Network . . . . . . . . . . . . . . . . . . . . . . . . . . . . . . . . . . . . 27Piping-System Friction Losses . . . . . . . . . . . . . . . . . . . . . . . . . . . . . . . . . 272
Vacuum-Producer (Exhauster) Sizing . . . . . . . . . . . . . . . . . . . . . . . . . . . . 274
Separator Selection and Sizing . . . . . . . . . . . . . . . . . . . . . . . . . . . . . . . . 275
General Design Considerations . . . . . . . . . . . . . . . . . . . . . . . . . . . . . . . . 276
References . . . . . . . . . . . . . . . . . . . . . . . . . . . . . . . . . . . . . . . . . . . . . . . . . . . . . 277

8/12/2019 American Society of Plumbing Engineers Volume 2
http://slidepdf.com/reader/full/american-society-of-plumbing-engineers-volume-2 16/233
ASPE Data Book — Volume 2xvi
CHAPTER 11 Water Treatment, Conditioning, and Purification . . . . . . . . . 79
Introduction . . . . . . . . . . . . . . . . . . . . . . . . . . . . . . . . . . . . . . . . . . . . . . . . . . . . 279
Codes and Standards . . . . . . . . . . . . . . . . . . . . . . . . . . . . . . . . . . . . . . . . . . . . . 279
Basic Water Chemistry . . . . . . . . . . . . . . . . . . . . . . . . . . . . . . . . . . . . . . . . . . . . 28
Water Impurities . . . . . . . . . . . . . . . . . . . . . . . . . . . . . . . . . . . . . . . . . . . . . .28
Suspended Matter (Particulates), Turbidity . . . . . . . . . . . . . . . . . . . . . . . 282
Dissolved Minerals and Organics . . . . . . . . . . . . . . . . . . . . . . . . . . . . . . . 282
Dissolved Gases . . . . . . . . . . . . . . . . . . . . . . . . . . . . . . . . . . . . . . . . . . . 284
Volatile Organic Compounds (VOC) . . . . . . . . . . . . . . . . . . . . . . . . . . . . . 284
Water Analysis and Impurity Measurement . . . . . . . . . . . . . . . . . . . . . . . . . . . . . 284
pH . . . . . . . . . . . . . . . . . . . . . . . . . . . . . . . . . . . . . . . . . . . . . . . . . . . . . . . . 285
Specific Resistance . . . . . . . . . . . . . . . . . . . . . . . . . . . . . . . . . . . . . . . . . . . . 285
Specific Conductance . . . . . . . . . . . . . . . . . . . . . . . . . . . . . . . . . . . . . . . . . . 287
Total Suspended Solids . . . . . . . . . . . . . . . . . . . . . . . . . . . . . . . . . . . . . . . . . 287
Total Dissolved Solids (TDS) . . . . . . . . . . . . . . . . . . . . . . . . . . . . . . . . . . . . . 288
Total Organic Carbon (TOC) . . . . . . . . . . . . . . . . . . . . . . . . . . . . . . . . . . . . . 288
Silt Density Index (SDI) . . . . . . . . . . . . . . . . . . . . . . . . . . . . . . . . . . . . . . . . . 288
Deposits and Corrosion . . . . . . . . . . . . . . . . . . . . . . . . . . . . . . . . . . . . . . . . . . . 289
Deposits . . . . . . . . . . . . . . . . . . . . . . . . . . . . . . . . . . . . . . . . . . . . . . . . . . . . 289
Scale and Sludge . . . . . . . . . . . . . . . . . . . . . . . . . . . . . . . . . . . . . . . . . . . 289
Biological Fouling . . . . . . . . . . . . . . . . . . . . . . . . . . . . . . . . . . . . . . . . . . 289
Corrosion . . . . . . . . . . . . . . . . . . . . . . . . . . . . . . . . . . . . . . . . . . . . . . . . . . . 289
Predicting Scale Formation and Corrosion Tendencies . . . . . . . . . . . . . . . . . . . . . 29
pH . . . . . . . . . . . . . . . . . . . . . . . . . . . . . . . . . . . . . . . . . . . . . . . . . . . . . . . . 29
Temperature . . . . . . . . . . . . . . . . . . . . . . . . . . . . . . . . . . . . . . . . . . . . . . . . . 29
Langelier Saturation Index (LSI) . . . . . . . . . . . . . . . . . . . . . . . . . . . . . . . . . . 29
Ryzner Stability Index (RI) . . . . . . . . . . . . . . . . . . . . . . . . . . . . . . . . . . . . . . . 292
Aggressiveness Index (AI) . . . . . . . . . . . . . . . . . . . . . . . . . . . . . . . . . . . . . . . 292
Treatment Methodologies . . . . . . . . . . . . . . . . . . . . . . . . . . . . . . . . . . . . . . . . . . 292
Aeration . . . . . . . . . . . . . . . . . . . . . . . . . . . . . . . . . . . . . . . . . . . . . . . . . . . . 292
Clarification . . . . . . . . . . . . . . . . . . . . . . . . . . . . . . . . . . . . . . . . . . . . . . . . . 294
Deaeration . . . . . . . . . . . . . . . . . . . . . . . . . . . . . . . . . . . . . . . . . . . . . . . . . . 294
Dealkalizing . . . . . . . . . . . . . . . . . . . . . . . . . . . . . . . . . . . . . . . . . . . . . . . . . 295
Decarbonation . . . . . . . . . . . . . . . . . . . . . . . . . . . . . . . . . . . . . . . . . . . . . . . 295
Distillation . . . . . . . . . . . . . . . . . . . . . . . . . . . . . . . . . . . . . . . . . . . . . . . . . . 295
Single-Stage Distillation . . . . . . . . . . . . . . . . . . . . . . . . . . . . . . . . . . . . . 295
Vapor-Compression Distillation . . . . . . . . . . . . . . . . . . . . . . . . . . . . . . . . 295
Multi-Effect Distillation . . . . . . . . . . . . . . . . . . . . . . . . . . . . . . . . . . . . . . 298
Filtration . . . . . . . . . . . . . . . . . . . . . . . . . . . . . . . . . . . . . . . . . . . . . . . . . . . 298
Deep-Bed Sand Filtration . . . . . . . . . . . . . . . . . . . . . . . . . . . . . . . . . . . . 298
Cross-Flow and Tangential-Flow Filtration . . . . . . . . . . . . . . . . . . . . . . . . 3
Activated Carbon Filtration . . . . . . . . . . . . . . . . . . . . . . . . . . . . . . . . . . . 3

8/12/2019 American Society of Plumbing Engineers Volume 2
http://slidepdf.com/reader/full/american-society-of-plumbing-engineers-volume-2 17/233
xviiTable of Contents
Ion Exchange and Removal . . . . . . . . . . . . . . . . . . . . . . . . . . . . . . . . . . . . . . 3
Regenerable Ion Exchange . . . . . . . . . . . . . . . . . . . . . . . . . . . . . . . . . . . . 3
Resins . . . . . . . . . . . . . . . . . . . . . . . . . . . . . . . . . . . . . . . . . . . . . . . . . . . 3
Regeneration Cycle . . . . . . . . . . . . . . . . . . . . . . . . . . . . . . . . . . . . . . . . . 3 2
Service Deionization . . . . . . . . . . . . . . . . . . . . . . . . . . . . . . . . . . . . . . . .3 5
Continuous Deionization . . . . . . . . . . . . . . . . . . . . . . . . . . . . . . . . . . . . . 3 6
Water Softening . . . . . . . . . . . . . . . . . . . . . . . . . . . . . . . . . . . . . . . . . . . . 3 7
Ion-Exchange System Design Considerations . . . . . . . . . . . . . . . . . . . . . . 3 8
Membrane Filtration and Separation . . . . . . . . . . . . . . . . . . . . . . . . . . . . . . . 3 8
Reverse Osmosis . . . . . . . . . . . . . . . . . . . . . . . . . . . . . . . . . . . . . . . . . . . 3 8
Membrane Selection . . . . . . . . . . . . . . . . . . . . . . . . . . . . . . . . . . . . . . . . 3
Cross-Flow Filtration . . . . . . . . . . . . . . . . . . . . . . . . . . . . . . . . . . . . . . . . 3
Microbial Control . . . . . . . . . . . . . . . . . . . . . . . . . . . . . . . . . . . . . . . . . . . . . 3
Chemicals . . . . . . . . . . . . . . . . . . . . . . . . . . . . . . . . . . . . . . . . . . . . . . . . 3
Ultraviolet Radiation . . . . . . . . . . . . . . . . . . . . . . . . . . . . . . . . . . . . . . . . 3
Filtering . . . . . . . . . . . . . . . . . . . . . . . . . . . . . . . . . . . . . . . . . . . . . . . . . 3 2
Heat . . . . . . . . . . . . . . . . . . . . . . . . . . . . . . . . . . . . . . . . . . . . . . . . . . . . 3 2
Ozone . . . . . . . . . . . . . . . . . . . . . . . . . . . . . . . . . . . . . . . . . . . . . . . . . . . 3 2
Water Treatment . . . . . . . . . . . . . . . . . . . . . . . . . . . . . . . . . . . . . . . . . . . . . . . . 3 3
Utility Water Treatment . . . . . . . . . . . . . . . . . . . . . . . . . . . . . . . . . . . . . . . . 3 3
Initial Filtering . . . . . . . . . . . . . . . . . . . . . . . . . . . . . . . . . . . . . . . . . . . . 3 4
Clarification . . . . . . . . . . . . . . . . . . . . . . . . . . . . . . . . . . . . . . . . . . . . . . 3 4
Biological Control . . . . . . . . . . . . . . . . . . . . . . . . . . . . . . . . . . . . . . . . . . 3 4
Water Softening . . . . . . . . . . . . . . . . . . . . . . . . . . . . . . . . . . . . . . . . . . . . 3 4
Boiler Feed-Water Conditioning . . . . . . . . . . . . . . . . . . . . . . . . . . . . . . . . . . . 3 4
Cooling-Water Conditioning . . . . . . . . . . . . . . . . . . . . . . . . . . . . . . . . . . . . . 3 5
Scale . . . . . . . . . . . . . . . . . . . . . . . . . . . . . . . . . . . . . . . . . . . . . . . . . . . . 3 6
Corrosion . . . . . . . . . . . . . . . . . . . . . . . . . . . . . . . . . . . . . . . . . . . . . . . . 3 6
Biological Fouling . . . . . . . . . . . . . . . . . . . . . . . . . . . . . . . . . . . . . . . . . . 3 6
Potable Water Treatment . . . . . . . . . . . . . . . . . . . . . . . . . . . . . . . . . . . . . . . . 3 6
Water Purification . . . . . . . . . . . . . . . . . . . . . . . . . . . . . . . . . . . . . . . . . . . . . . . . 3 7
Codes and Standards . . . . . . . . . . . . . . . . . . . . . . . . . . . . . . . . . . . . . . . . . . 3 7
Laboratory Systems . . . . . . . . . . . . . . . . . . . . . . . . . . . . . . . . . . . . . . . . . . . 3 7
Pharmaceutical Systems . . . . . . . . . . . . . . . . . . . . . . . . . . . . . . . . . . . . . . . . 32
Feed Water . . . . . . . . . . . . . . . . . . . . . . . . . . . . . . . . . . . . . . . . . . . . . . . . . . 32
Purification System Design . . . . . . . . . . . . . . . . . . . . . . . . . . . . . . . . . . . . . . 32Pretreatment . . . . . . . . . . . . . . . . . . . . . . . . . . . . . . . . . . . . . . . . . . . . . . 32
Central Purification Equipment . . . . . . . . . . . . . . . . . . . . . . . . . . . . . . . . . . . 323
Storage . . . . . . . . . . . . . . . . . . . . . . . . . . . . . . . . . . . . . . . . . . . . . . . . . . 323
Piping Distribution Network . . . . . . . . . . . . . . . . . . . . . . . . . . . . . . . . . . 324
System Design Considerations . . . . . . . . . . . . . . . . . . . . . . . . . . . . . . . . . 324
References . . . . . . . . . . . . . . . . . . . . . . . . . . . . . . . . . . . . . . . . . . . . . . . . . . . . . 325

8/12/2019 American Society of Plumbing Engineers Volume 2
http://slidepdf.com/reader/full/american-society-of-plumbing-engineers-volume-2 18/233

8/12/2019 American Society of Plumbing Engineers Volume 2
http://slidepdf.com/reader/full/american-society-of-plumbing-engineers-volume-2 19/233
xixTable of Contents
Codes and Standards . . . . . . . . . . . . . . . . . . . . . . . . . . . . . . . . . . . . . . . . . . 345
Pipe Material and Joint Selection . . . . . . . . . . . . . . . . . . . . . . . . . . . . . . . . . 345
System Design Considerations . . . . . . . . . . . . . . . . . . . . . . . . . . . . . . . . . . . 346
Fire-Suppression Water Drainage . . . . . . . . . . . . . . . . . . . . . . . . . . . . . . . . . . . . 346
System Description . . . . . . . . . . . . . . . . . . . . . . . . . . . . . . . . . . . . . . . . . . . .346
Flammable and Volatile Liquids . . . . . . . . . . . . . . . . . . . . . . . . . . . . . . . . . . . . . 347
Oil in Water . . . . . . . . . . . . . . . . . . . . . . . . . . . . . . . . . . . . . . . . . . . . . . . . . 347
Methods of Separation and Treatment . . . . . . . . . . . . . . . . . . . . . . . . . . . 347
References . . . . . . . . . . . . . . . . . . . . . . . . . . . . . . . . . . . . . . . . . . . . . . . . . . . . . 35
ILLUSTRATIONS
Figure 1-1 Procedure for Sizing an Offset Stack . . . . . . . . . . . . . . . . . . . . . . . . 6
Figure 1-2 Basic Floor-Drain Components . . . . . . . . . . . . . . . . . . . . . . . . . . .
Figure 1-3 Pattern Draft for Floor Gratings: (a) Sharp Edge,(b) Reverse Pattern. . . . . . . . . . . . . . . . . . . . . . . . . . . . . . . . . . . . . . . . . . .
Figure 1-4 Types of Floor Drain . . . . . . . . . . . . . . . . . . . . . . . . . . . . . . . . . . . 2
Figure 1-5 Various Types of Backwater Valve . . . . . . . . . . . . . . . . . . . . . . . . 3
Figure 1-6 Combination Floor Drain and Indirect Waste Receptor . . . . . . . . . 7
Figure 1-7 Inside-Caulk Drain Body . . . . . . . . . . . . . . . . . . . . . . . . . . . . . . . 7
Figure 1-8 Spigot-Outlet Drain Body . . . . . . . . . . . . . . . . . . . . . . . . . . . . . . . 8
Figure 1-9 No-Hub-Outlet Drain Body . . . . . . . . . . . . . . . . . . . . . . . . . . . . . . 8
Figure 1-10 IPS or Threaded-Outlet Drain Body . . . . . . . . . . . . . . . . . . . . . . 8
Figure 1-11 (A) Traditional Two-Pipe System, (B) Typical Sovent Single-Stack Plumbing System . . . . . . . . . . . . . . . . . . . . . . . . . . . . . . . . . . . . . . . . . . . 2
Figure 2-1 Plumbing System Flow Charts: (A) Conventional PlumbingSystem; (B) Recycled-Water System . . . . . . . . . . . . . . . . . . . . . . . . . . . . . 23
Figure 2-2 Riser Diagrams: (A) Gray-Water Plumbing System; (B) Recycled- Water-Waste System with System Treatment Plant (STP) . . . . . . . . . . . . . . 24
Figure 2-3 Water Treatment Systems: (A) Types of Gray-Water Treatment System; (B) Types of Black-Water Treatment System . . . . . . . . . . . . . . . . . 28
Figure 2-4 System Design Flow Chart Example (250-Room Hotel) . . . . . . . . . 3
Figure 2-5 Nomograph for Overview of Preliminary Feasibility of Gray-Water Systems . . . . . . . . . . . . . . . . . . . . . . . . . . . . . . . . . . . . . . . . . 32
Figure 3-1 Suds-Pressure-Zone Diagram . . . . . . . . . . . . . . . . . . . . . . . . . . . . 38
Figure 3-2 Suds Venting/Suds Pressure Zones . . . . . . . . . . . . . . . . . . . . . . . 39
Figure 3-3 Loop Vent, with Horizontal Branch Located (a) at Back Below Water Closets, (b) Directly Under Water Closets . . . . . . . . . . . . . . . . . . . . . 44
Figure 3-4 Circuit Vent . . . . . . . . . . . . . . . . . . . . . . . . . . . . . . . . . . . . . . . . . 44
Figure 3-5 Relief Vent . . . . . . . . . . . . . . . . . . . . . . . . . . . . . . . . . . . . . . . . . . 45
Figure 3-6 Offset . . . . . . . . . . . . . . . . . . . . . . . . . . . . . . . . . . . . . . . . . . . . . . 46
Figure 3-7 Combination Waste-and-Vent System . . . . . . . . . . . . . . . . . . . . . 47
Figure 3-8 Philadelphia System . . . . . . . . . . . . . . . . . . . . . . . . . . . . . . . . . . . 48
Figure 3-9 Wet Venting and Stack Venting . . . . . . . . . . . . . . . . . . . . . . . . . . 49
Figure 3-10 Pipe Layout Drawing — Two-Story Residential Building, Freezing

8/12/2019 American Society of Plumbing Engineers Volume 2
http://slidepdf.com/reader/full/american-society-of-plumbing-engineers-volume-2 20/233

8/12/2019 American Society of Plumbing Engineers Volume 2
http://slidepdf.com/reader/full/american-society-of-plumbing-engineers-volume-2 21/233
xxiTable of Contents
Figure 5-7 Pipe Sizing Data, Smooth Pipe . . . . . . . . . . . . . . . . . . . . . . . . . . 39
Figure 5-8 Pipe Sizing Data, Fairly Smooth Pipe . . . . . . . . . . . . . . . . . . . . . 4
Figure 5-9 Pipe Sizing Data, Fairly Rough Pipe . . . . . . . . . . . . . . . . . . . . . . 4
Figure 5-10 Pipe Sizing Data, Rough Pipe . . . . . . . . . . . . . . . . . . . . . . . . . . 42
Figure 5-11 Air Chambers: (a, b) Plain Air Chambers, (c) Standpipe Air Chamber, (d) Rechargeable Air Chamber . . . . . . . . . . . . . . . . . . . . . . 43
Figure 5-12 Hydropneumatic Pressure System Layout that Determines theMinimum Tank Pressure . . . . . . . . . . . . . . . . . . . . . . . . . . . . . . . . . . . . . 5
Figure 5-13 Typical Hydropneumatic Supply System . . . . . . . . . . . . . . . . . . 5
Figure 5-14 Piping Connections for a Gravity Water-Storage Tank with Reserve Capacity for Firefighting . . . . . . . . . . . . . . . . . . . . . . . . . . . 5
Figure 7-1 Variations of a Basic Simplex Booster System . . . . . . . . . . . . . . . . 8
Figure 7-3 Pipe Sizing, Low Pressure System with an Initial PressureUp to 1 psi (6.9 kPa) . . . . . . . . . . . . . . . . . . . . . . . . . . . . . . . . . . . . . . . . 92
Figure 7-4 Pipe Sizing, Any System with an Initial PressureBetween 1 and 20 psi (6.9 and 137.8 kPa) . . . . . . . . . . . . . . . . . . . . . . . . 93
Figure 7-5 Typical Diversity Curves for Gas Supply toHigh-Rise Apartments . . . . . . . . . . . . . . . . . . . . . . . . . . . . . . . . . . . . . . . 95
Figure 7-6 Diversity Percentage for Multifamily Buildings (Average) . . . . . . . 95
Figure 8-1 Three Legs of Disposal Field Fed from Cross Fitting Laidon Its Side . . . . . . . . . . . . . . . . . . . . . . . . . . . . . . . . . . . . . . . . . . . . . . . . 22
Figure 8-2 Disposal Lines Connected by Headers to Circumvent Stoppages . 22
Figure 8-3 Transverse and Lineal Sections of Drain Field Showing Rock andEarth Backfill around Drain Tile . . . . . . . . . . . . . . . . . . . . . . . . . . . . . . . 22
Figure 8-4 Graph Showing Relation Between Percolation Rate and AllowableRate at Sewage Application . . . . . . . . . . . . . . . . . . . . . . . . . . . . . . . . . . . 238
Figure 9-1 Well under (A) Static and (B) Pumping Conditions . . . . . . . . . . . 242
Figure 9-2 Typical Gravel Filter Well with a Vertical Turbine Pump . . . . . . . 246
Figure 9-3 Graph Indicating Minimum Storage-Tank Size . . . . . . . . . . . . . . 248
Figure 9-4 Storage-Tank Suction Piping Detail: (A) Sump Suction Alternate,(B) Anti-Vortex Alternate . . . . . . . . . . . . . . . . . . . . . . . . . . . . . . . . . . . . . 249
Figure 10-1 Conversion of Vacuum-Pressure Measurements . . . . . . . . . . . . 255
Figure 10-2 Schematic Detail of a Typical Laboratory Vacuum-Pump Assembly . . . . . . . . . . . . . . . . . . . . . . . . . . . . . . . . . . . . . . . . . . . . . . . 26
Figure 10-3 Typical Process Vacuum-Pump Duplex Arrangement . . . . . . . . 26
Figure 10-4 Direct Reading Chart Showing Diversity for Laboratory Vacuum . . . . . . . . . . . . . . . . . . . . . . . . . . . . . . . . . . . . . . . . . 263
Figure 10-5 Acceptable Leakage in Vacuum Systems . . . . . . . . . . . . . . . . . . 267
Figure 10-6 Vacuum-Cleaning Piping Friction Loss Chart . . . . . . . . . . . . . . 273
Figure 10-7 Schematic of a Typical Wet-Vacuum Cleaning Pump Assembly . 276
Figure 11-1 Typical Water Analysis Report . . . . . . . . . . . . . . . . . . . . . . . . . 286
Figure 11-2 pH of Saturation for Water . . . . . . . . . . . . . . . . . . . . . . . . . . . . 293
Figure 11-3 Detail of Vapor Compression Still . . . . . . . . . . . . . . . . . . . . . . . 296
Figure 11-4 Detail of Multi-Effect Still . . . . . . . . . . . . . . . . . . . . . . . . . . . . . 299
Figure 11-5 Schematic Detail of Large-Scale, Granular-Activated

8/12/2019 American Society of Plumbing Engineers Volume 2
http://slidepdf.com/reader/full/american-society-of-plumbing-engineers-volume-2 22/233
ASPE Data Book — Volume 2xxii
Carbon Filter . . . . . . . . . . . . . . . . . . . . . . . . . . . . . . . . . . . . . . . . . . . . . . 3
Figure 11-6 Typical Single-Bed Ion Exchanger . . . . . . . . . . . . . . . . . . . . . . . 3 3
Figure 11-7 Typical Dual-Bed Ion Exchanger . . . . . . . . . . . . . . . . . . . . . . . . 3 3
Figure 11-8 Typical Mixed-Bed Ion Exchanger . . . . . . . . . . . . . . . . . . . . . . . 3 4
Figure 11-9 Schematic Operation of a Continuous Deionization Unit . . . . . .3 6
Figure 11-10 Hollow-Fiber Reverse-Osmosis Configuration . . . . . . . . . . . . . 3 9
Figure 11-11 Spiral-Wound Reverse-Osmosis Configuration . . . . . . . . . . . . 3 9
Figure 11-12 Tubular Reverse Osmosis Configuration . . . . . . . . . . . . . . . . . 3
Figure 11-13 Plate-and-Frame Reverse-Osmosis Configuration . . . . . . . . . . 3
Figure 11-14 UV Wavelength Spectrum . . . . . . . . . . . . . . . . . . . . . . . . . . . . 3 2
Figure 11-15 Principle of Corona-Discharge Ozone Generator . . . . . . . . . . . 3 3
Figure 11-16 Typical Pharmaceutical Water-Flow Diagram . . . . . . . . . . . . . 322
Figure 12-1 Typical Acid-Resistant Manhole . . . . . . . . . . . . . . . . . . . . . . . . 335
Figure 12-2 Typical Large Acid-Neutralizing Basin . . . . . . . . . . . . . . . . . . . . 336
Figure 12-3 Typical Continuous Acid-Waste Treatment System . . . . . . . . . . 338
Figure 12-4 Typical Oil Interceptor . . . . . . . . . . . . . . . . . . . . . . . . . . . . . . . 348
Figure 12-5 Typical Gravity Draw-Off Installation (A) Plan and (B) Isometric . 349
TABLES
Table 1-1 Residential Fixture-Unit Loads . . . . . . . . . . . . . . . . . . . . . . . . . . . . . 3
Table 1-2 Capacities of Stacks . . . . . . . . . . . . . . . . . . . . . . . . . . . . . . . . . . . . . 4
Table 1-3 Horizontal Fixture Branches and Stacks . . . . . . . . . . . . . . . . . . . . . 5
Table 1-4 Values of R, R 2/3, A F , and A
H . . . . . . . . . . . . . . . . . . . . . . . . . . . . . . . . . . . . . . . . . . . . . 8
Table 1-5 Approximate Discharge Rates and Velocities in Sloping Drains,n = 0.015 . . . . . . . . . . . . . . . . . . . . . . . . . . . . . . . . . . . . . . . . . . . . . . . . . . 8
Table 1-6 Building Drains and Sewers . . . . . . . . . . . . . . . . . . . . . . . . . . . . . . . 9 Table 1-7 Recommended Grate Open Areas for Various Outlet Pipe Sizes . . . .
Table 1-8 Relative Properties of Selected Plumbing Materials for Drainage Systems . . . . . . . . . . . . . . . . . . . . . . . . . . . . . . . . . . . . . . . . . . . 5
Table 2-1 The National Sanitation Foundation’s Standard 41 . . . . . . . . . . . . 22
Table 2-2 Design Criteria of Six Typical Soils . . . . . . . . . . . . . . . . . . . . . . . . . 26
Table 2-2 (M) . . . . . . . . . . . . . . . . . . . . . . . . . . . . . . . . . . . . . . . . . . . . . . . . . . 26
Table 2-3 Location of the Gray-Water System . . . . . . . . . . . . . . . . . . . . . . . . 27
Table 2-4 Subsurface Drip Design Criteria of Six Typical Soils . . . . . . . . . . . . 27
Table 2-5 Gray-Water Treatment Processes for Normal Process Efficiency . . . 28
Table 2-6 Comparison of Gray-Water System Applications . . . . . . . . . . . . . . . 29
Table 2-7 Life-Cycle Economic Comparison: Gray-Water Systemsfor 250-Room Hotel . . . . . . . . . . . . . . . . . . . . . . . . . . . . . . . . . . . . . . . . . . 3
Table 3-1 Suds Pressure-Relief Vents . . . . . . . . . . . . . . . . . . . . . . . . . . . . . . 37
Table 3-2 Maximum Length of Trap Arm . . . . . . . . . . . . . . . . . . . . . . . . . . . . 39
Table 3-3 Maximum Distance of Fixture Trap from Vent . . . . . . . . . . . . . . . . 4
Table 3-4 Drainage-Fixture-Unit Values for Various Plumbing Fixtures . . . . . 4
Table 3-5 Size and Length of Vents . . . . . . . . . . . . . . . . . . . . . . . . . . . . . . . . 42

8/12/2019 American Society of Plumbing Engineers Volume 2
http://slidepdf.com/reader/full/american-society-of-plumbing-engineers-volume-2 23/233
xxiiiTable of Contents
Table 3-6 Size of Vent Stacks . . . . . . . . . . . . . . . . . . . . . . . . . . . . . . . . . . . . 43
Table 3-7 Fixture Unit Loads . . . . . . . . . . . . . . . . . . . . . . . . . . . . . . . . . . . . . 5
Table 3-8 Fixture Vents and Stack Vents . . . . . . . . . . . . . . . . . . . . . . . . . . . . 5
Table 3-9 Confluent Vents Serving Three Fixture or Stack Vents . . . . . . . . . . 5
Table 3-10 Confluent Vents Serving Four or More Fixture or Stack Vents,Schedule 40 Pipe . . . . . . . . . . . . . . . . . . . . . . . . . . . . . . . . . . . . . . . . . . . . 5
Table 3-11 Confluent Vents Serving Four or More Fixture or Stack Vents,Copper Tube . . . . . . . . . . . . . . . . . . . . . . . . . . . . . . . . . . . . . . . . . . . . . . . 52
Table 3-12 Flow Areas of Pipe and Tube, in2 (103 mm2) . . . . . . . . . . . . . . . . . 52
Table 3-13 Arterial Vents . . . . . . . . . . . . . . . . . . . . . . . . . . . . . . . . . . . . . . . 52
Table 3-14 Fixture Unit Loads . . . . . . . . . . . . . . . . . . . . . . . . . . . . . . . . . . . . 58
Table 3-15 Maximum Fixture Units . . . . . . . . . . . . . . . . . . . . . . . . . . . . . . . . 58
Table 3-16 Size Rules for Connecting Fixtures into the Sovent Single-Stack Drainage Plumbing System . . . . . . . . . . . . . . . . . . . . . . . . . . . . . . . . . . . . 59
Table 3-17 Minimum Size of Equalizing Line . . . . . . . . . . . . . . . . . . . . . . . . . 6
Table 3-18 Maximum Sovent Stack Loadings . . . . . . . . . . . . . . . . . . . . . . . . . 63 Table 3-19 Loadings for Building Drains . . . . . . . . . . . . . . . . . . . . . . . . . . . . 63
Table 4-1 Maximum Rates of Rainfall for Various US Cities, in./h (mm/h) . . 7
Table 4-2 Sizes of Roof Drains and Vertical Pipes . . . . . . . . . . . . . . . . . . . . . 85
Table 4-3 Sizes of Semicircular and Equivalent Rectangular Gutters . . . . . . . 86
Table 4-4 Pipe Sizing Chart . . . . . . . . . . . . . . . . . . . . . . . . . . . . . . . . . . . . . . 89
Table 4-5 Sizes of Scuppers for Secondary Drainage . . . . . . . . . . . . . . . . . . . 93
Table 4-6 Some Values of the Rational Coefficient C . . . . . . . . . . . . . . . . . . . 95
Table 4-7 Size Ranges for Filter Material . . . . . . . . . . . . . . . . . . . . . . . . . . . 3
Table 5-1 Displacement-Type Meters Meeting AWWA Specifications— Flow-Pressure Loss Averages . . . . . . . . . . . . . . . . . . . . . . . . . . . . . . . . . . 7
Table 5-2 Compound-Type Meters Meeting AWWA Specifications— Flow-Pressure Loss Averages . . . . . . . . . . . . . . . . . . . . . . . . . . . . . . . . . . 7
Table 5-3 Turbine-Type Meters Meeting AWWA Specifications— Flow-Pressure Loss Averages . . . . . . . . . . . . . . . . . . . . . . . . . . . . . . . . . . 7
Table 5-4 Surface Roughness Coefficient (C) Values for Various Types of Pipe . . . . . . . . . . . . . . . . . . . . . . . . . . . . . . . . . . . . . . . 22
Table 5-5 Demand Weight of Fixtures, in Fixture Units . . . . . . . . . . . . . . . . 23
Table 5-6 Conversions—Gallons per Minute (Liters per Second) toFixture Units . . . . . . . . . . . . . . . . . . . . . . . . . . . . . . . . . . . . . . . . . . . . . . 24
Table 5-7 Allowance for Friction Loss in Valves and Threaded Fittings . . . . . 28
Table 5-7 (M) . . . . . . . . . . . . . . . . . . . . . . . . . . . . . . . . . . . . . . . . . . . . . . . . . 28
Table 5-8 Flow and Pressure Required for Various Fixtures during Flow . . . 29
Table 5-9 Water Pipe Sizing—Fixture Units vs. psi/100 ft (kPa/100 m), Type L Copper Tubing . . . . . . . . . . . . . . . . . . . . . . . . . . . . . . . . . . . . . . . 33
Table 5-10 Water Pipe Sizing Fixture Units versus psi/100 ft. (kPa/100 m),Galvanized Fairly Rough Pipe . . . . . . . . . . . . . . . . . . . . . . . . . . . . . . . . . 36
Table 5-11 Required Air Chambers . . . . . . . . . . . . . . . . . . . . . . . . . . . . . . . 43
Table 5-12 Sizing and Selection of Water-Hammer Arresters . . . . . . . . . . . . 44

8/12/2019 American Society of Plumbing Engineers Volume 2
http://slidepdf.com/reader/full/american-society-of-plumbing-engineers-volume-2 24/233
ASPE Data Book — Volume 2xxiv
Table 5-13 Guide to the Assessment of Hazard and Applicationof Devices—Isolation at the Fixture . . . . . . . . . . . . . . . . . . . . . . . . . . . . . 46
Table 5-14 Guide to the Assessment of Facility Hazard and Applicationof Devices—Containment of Premise . . . . . . . . . . . . . . . . . . . . . . . . . . . . 47
Table 5-15 Minimum Flow Rates and Size of Minimum Area of RPBD . . . . . 48
Table 6-1 Typical Hot-Water Temperatures for Plumbing Fixturesand Equipment . . . . . . . . . . . . . . . . . . . . . . . . . . . . . . . . . . . . . . . . . . . . 59
Table 6-2 Hot-Water Multiplier, P . . . . . . . . . . . . . . . . . . . . . . . . . . . . . . . . . 6
Table 6-2 (M) . . . . . . . . . . . . . . . . . . . . . . . . . . . . . . . . . . . . . . . . . . . . . . . . . 63
Table 6-3 Thermal Properties of Water . . . . . . . . . . . . . . . . . . . . . . . . . . . . . 68
Table 6-4 Time/Water Temperature Combinations Producing Skin Damage . 7
Table 7-1 Approximate Gas Demand for Common Appliances . . . . . . . . . . . 75
Table 7-2 Equivalent Lengths for Various Valve and Fitting Sizes . . . . . . . . 84
Table 7-3 Natural Gas Pipe Sizing Table for Gas Pressure < 1.5 psi . . . . . . . 86
Table 7-3(M) Natural Gas Pipe Sizing Table for Gas Pressure < 10.3 kPa . . . 87
Table 7-4 Natural Gas Pipe Sizing Table for Gas Pressure < 1.5 psi . . . . . . . 88 Table 7-4(M) Natural Gas Pipe Sizing Table for Gas Pressure < 10.3 kPa . . . 89
Table 7-5 Natural Gas Pipe Sizing Table for Gas Pressure > 1 psi . . . . . . . . . 9
Table 7-5(M) Natural Gas Pipe Sizing Table for Gas Pressure > 6.895 kPa . . 9
Table 7-A1 Natural Gas Pipe Sizing Table for Gas Pressure > 1 psi . . . . . . . 98
Table 7-A1(M) Natural Gas Pipe Sizing Table for Gas Pressure > 6.895 kPa . 99
Table 7-A2 Natural Gas Pipe Sizing Table for Gas Pressure > 1 psi . . . . . . . 2
Table 7-A2(M) Natural Gas Pipe Sizing Table for Gas Pressure > 6.895 kPa . 201
Table 7-A3 Natural Gas Pipe Sizing Table for Gas Pressure > 1 psi . . . . . . . 2 2
Table 7-A3(M) Natural Gas Pipe Sizing Table for Gas Pressure > 6.895 kPa . 2 3
Table 7-A4 Natural Gas Pipe Sizing Table for Gas Pressure > 1 psi . . . . . . . 2 4
Table 7-A4(M) Natural Gas Pipe Sizing Table for Gas Pressure > 6.895 kPa . 205
Table 7-A5 Natural Gas Pipe Sizing Table for Gas Pressure > 1 psi . . . . . . . 2 6
Table 7-A5(M) Natural Gas Pipe Sizing Table for Gas Pressure > 6.895 kPa . 2 7
Table 7-A6 Natural Gas Pipe Sizing Table for Gas Pressure > 1 psi . . . . . . . 2 8
Table 7-A6(M) Natural Gas Pipe Sizing Table for Gas Pressure > 6.895 kPa . 2 9
Table 7-A7 Natural Gas Pipe Sizing Table for Gas Pressure < 1 psi . . . . . . . 2
Table 7-A7(M) Natural Gas Pipe Sizing Table for Gas Pressure < 6.9 kPa . . . 2
Table 7-B1 Typical Heating Values . . . . . . . . . . . . . . . . . . . . . . . . . . . . . . . 2 2
Table 7-B2 Typical Working Pressures . . . . . . . . . . . . . . . . . . . . . . . . . . . . . 2 2
Table 7-B3 Conversion Factors . . . . . . . . . . . . . . . . . . . . . . . . . . . . . . . . . . 2 3
Table 7-B4 Specific Gravity Multipliers . . . . . . . . . . . . . . . . . . . . . . . . . . . . 2 3
Table 8-1 Minimum Absorption Area for Private Dwellings . . . . . . . . . . . . . . 2 8
Table 8-2 Recommended Distances Between Soil-Absorption Systemand Site Features . . . . . . . . . . . . . . . . . . . . . . . . . . . . . . . . . . . . . . . . . . 22
Table 8-3 Liquid Capacity of Tank . . . . . . . . . . . . . . . . . . . . . . . . . . . . . . . . 227
Table 8-4 Allowable Sludge Accumulation . . . . . . . . . . . . . . . . . . . . . . . . . . 229
Table 8-5 Average Waste-Water Flows from Residential Sources . . . . . . . . . 233

8/12/2019 American Society of Plumbing Engineers Volume 2
http://slidepdf.com/reader/full/american-society-of-plumbing-engineers-volume-2 25/233
xxvTable of Contents
Table 8-6 Typical Waste-Water Flows from Commercial Sources . . . . . . . . . 234
Table 8-7 Typical Waste-Water Flows from Institutional Sources . . . . . . . . . 234
Table 8-8 Typical Waste-Water Flows from Recreational Sources . . . . . . . . . 235
Table 8-9 Quantities of Sewage Flows . . . . . . . . . . . . . . . . . . . . . . . . . . . . . 236
Table 8-10 Estimated Distribution of Sewage Flows . . . . . . . . . . . . . . . . . . .237
Table 8-11 Allowable Rate of Sewage Application to a Soil-Absorption System . . . . . . . . . . . . . . . . . . . . . . . . . . . . . . . . . . . . . . 237
Table 9-1 Curve Radii for Cast-Iron Pipe, ft (m) . . . . . . . . . . . . . . . . . . . . . . 25
Table 9-2 Thrust Block Requirements . . . . . . . . . . . . . . . . . . . . . . . . . . . . . 25
Table 9-3 Area of Bearing Face of Concrete Thrust Blocks, ft 2 (m2) . . . . . . . 25
Table 9-4 Coefficients of Expansion, in/in/°F (mm/mm/°C) . . . . . . . . . . . . 252
Table 10-1 Basic Vacuum-Pressure Measurements . . . . . . . . . . . . . . . . . . . 254
Table 10-2 Conversions from Torr to Various Vacuum-Pressure Units . . . . . 254
Table 10-3 IP and SI Pressure Conversion . . . . . . . . . . . . . . . . . . . . . . . . . . 256
Table 10-4 Expanded Air Ratio, 29.92/P, as a Function of Pressure,
P (in. Hg) . . . . . . . . . . . . . . . . . . . . . . . . . . . . . . . . . . . . . . . . . . . . . . . . . 256 Table 10-5 Direct Ratio for Converting scfm to acfm (nL/s to aL/s) . . . . . . . 257
Table 10-6 Barometric Pressure Corresponding to Altitude . . . . . . . . . . . . . 257
Table 10-7 Factor for Flow Rate Reduction Due to Altitude . . . . . . . . . . . . . 258
Table 10-8 Constant, C, for Finding Mean Air Velocity . . . . . . . . . . . . . . . . . 259
Table 10-9 Diversity Factor for Laboratory Vacuum Air Systems . . . . . . . . . 263
Table 10-10 Vacuum-Pump Exhaust Pipe Sizing . . . . . . . . . . . . . . . . . . . . . 264
Table 10-11 Pressure Loss Data for Sizing Vacuum Pipe . . . . . . . . . . . . . . . 265
Table 10-12 Recommended Sizes of Hand Tools and Hose . . . . . . . . . . . . . . 27
Table 10-13 Flow Rate and Friction Loss for Vacuum-Cleaning Toolsand Hoses . . . . . . . . . . . . . . . . . . . . . . . . . . . . . . . . . . . . . . . . . . . . . . . . 27
Table 10-14 Recommended Velocities for Vacuum-Cleaning Systems . . . . . . 27
Table 10-15 Pipe Size Based on Simultaneous Usage . . . . . . . . . . . . . . . . . . 272
Table 10-16 Equivalent Length (ft.) of Vacuum Cleaning Pipe Fittings . . . . . 274
Table 10-17 Classification of Material for Separator Selection . . . . . . . . . . . 275
Table 11-1 Important Elements, Acid Radicals, and Acids in Water Chemistry . . . . . . . . . . . . . . . . . . . . . . . . . . . . . . . . . . . . . . . . . . . 28
Table 11-2 Converting ppm of Impurities to ppm of Calcium Carbonate . . . . 285
Table 11-3 Resistivity and Conductivity Conversion . . . . . . . . . . . . . . . . . . . 287
Table 11-4 Prediction of Water Tendencies by the Langelier Index . . . . . . . . 29
Table 11-5 Numerical Values for Substitution in Equation 11-3 to Find
the pHs of Saturation for Water . . . . . . . . . . . . . . . . . . . . . . . . . . . . . . . . 29 Table 11-6 Prediction of Water Tendencies by the Ryzner Index . . . . . . . . . . 292
Table 11-7 Typical Cations and Anions Found in Water . . . . . . . . . . . . . . . . 3
Table 11-8 Comparison of Reverse-Osmosis Polymers . . . . . . . . . . . . . . . . . 3
Table 11-9 Recommended Boiler Feed-Water Limits and Steam Purity . . . . . 3 5
Table 11-10 Water-Treatment Technology for Small Potable Water Systems . 3 8
Table 11-11 CAP and ASTM Reagent-Grade Water Specifications . . . . . . . . . 3 9

8/12/2019 American Society of Plumbing Engineers Volume 2
http://slidepdf.com/reader/full/american-society-of-plumbing-engineers-volume-2 26/233
ASPE Data Book — Volume 2xxvi
Table 11-12 NCCLS Reagent-Grade Water Specifications . . . . . . . . . . . . . . . 3 9
Table 11-13 AAMI/ANSI Water-Quality Standards . . . . . . . . . . . . . . . . . . . . 3 9
Table 11-14 ASTM Electronics-Grade Water Standarda . . . . . . . . . . . . . . . . 32
Table 11-15 USP XXII Purified-Water and WFI Water-Purity Standards . . . . 32
Table 12-1 Drainage Pipe Sizing . . . . . . . . . . . . . . . . . . . . . . . . . . . . . . . . .33
Table 12-1 (M) . . . . . . . . . . . . . . . . . . . . . . . . . . . . . . . . . . . . . . . . . . . . . . . . 33
Index . . . . . . . . . . . . . . . . . . . . . . . . . . . . . . . . . . . . . . . . . . . . . . . . . . . . . 35

8/12/2019 American Society of Plumbing Engineers Volume 2
http://slidepdf.com/reader/full/american-society-of-plumbing-engineers-volume-2 27/233
1Chapter 1— Sanitary Drainage Systems
Sanitary
DrainageSystems1INTRODUCTION
A sanitary drainage system generally consists of horizontal branches, vertical stacks, a buildingdrain inside the building, and a building sewer from the building wall to the point of disposal.
To economically design a sanitary drainagesystem is to use the smallest pipes that can rap-idly carry away the soiled water from individualfixtures without clogging the pipes, without leav-ing solids in the piping, without generatingexcessive pneumatic pressures at points wherethe fixture drains connect to the stack (whichmight cause the reduction of trap water seals
and force sewer gases back through inhabitableareas), and without creating undue noise.
Since vents and venting systems are de-scribed in a separate chapter (Chapter 3 of this
volume), the following discussion centers on thedrain and waste systems’ design.
FLOW IN STACKS, BUILDINGDRAINS, AND FIXTURE DRAINS
Flow in Stacks
Flow in the drain empties into the vertical stack fitting, which may be a long-turn tee-wye or a short-turn or sanitary tee. Each of these fittingspermits flow from the drain to enter the stack
with a component directed vertically downward.Depending on the rate of flow out of the draininto the stack, the diameter of the stack, the typeof stack fitting, and the flow down the stack fromhigher levels, if any, the discharge from the fix-ture drain may or may not fill the cross section
of the stack at the level of entry. In any event, as
soon as the water enters the stack, it is rapidly accelerated downward by the force of gravity, and before it falls very far, it assumes the form of a sheet around the wall of the stack, leaving thecenter of the pipe open for the flow of air.
This sheet of water continues to accelerateuntil the frictional force exerted by the wall of the stack on the falling sheet of water equalsthe force of gravity. From that point on — if thedistance the water falls is great enough and pro-
vided that no flow enters the stack at lower levelsto interfere with the sheet — the sheet remainsunchanged in thickness and velocity until it
reaches the bottom of the stack. The ultimate vertical velocity the sheet attains is called the“terminal velocity,” and the distance the sheet must fall to attain this terminal velocity is calledthe “terminal length.” Following are the formu-lae developed for terminal velocity and terminallength:
Equation 1-1
VT
= 3.0
Q
2/5
d
LT
= 0.052VT
2
where
V T = Terminal velocity in stack, fps (m/s)
L T = Terminal length below point of flow entry, ft (m)
Q = Quantity rate of flow, gpm (L/s)
d = Diameter of stack, in. (mm)
Terminal velocity is attained at approximately 10 to 15 fps (3.05 to 5.22 m/s), and this velocity

8/12/2019 American Society of Plumbing Engineers Volume 2
http://slidepdf.com/reader/full/american-society-of-plumbing-engineers-volume-2 28/233
ASPE Data Book — Volume 22
is attained within 10 to 15 ft (3.05 to 5.22 m) of fall from the point of entry.
At the center of the stack is a core of air that is dragged along with the water by friction andfor which a supply source must be provided if
excessive pressures in the stack are to be avoided. The usual means of supplying this air is throughthe stack vent or vent stack. The entrained air in the stack causes a pressure reduction insidethe stack, which is caused by the frictional ef-fect of the falling sheet of water dragging the coreof air along with it.
If the sheet of water falling down the stack passes a stack fitting through which the dis-charge from a fixture is entering the stack, the
water from the branch mixes with or deflects therapidly moving sheet of water. An excess pres-sure in the drain from which the water is entering
the stack is required to deflect the sheet of water flowing downward or mix the branch water withit. The result is that a back pressure is createdin the branch, which increases with the flow rateand flow velocity down the stack and with therate of flow out of the drain.
Flow in Building Drains
When the sheet of water reaches the bend at the base of the stack, it turns at approximately right angles into the building drain. Flow enters thehorizontal drain at a relatively high velocity com-
pared to the velocity of flow in a horizontal drainunder uniform flow conditions. The slope of the
building drain is not adequate to maintain the velocity that existed in the sheet when it reachedthe base of the stack. The velocity of the water flowing along the building drain and sewer de-creases slowly then increases suddenly as thedepth of flow increases and completely fills thecross section of the drain. This phenomenon iscalled a “hydraulic jump.”
The critical distance at which the hydraulic jump may occur varies from immediately at thestack fitting to ten times the diameter of the stack
downstream. Less jump occurs if the horizontaldrain is larger than the stack. After the hydrau-lic jump occurs and water fills the drain, the pipetends to flow full until the friction resistance of the pipe retards the flow to that of uniform flow conditions.
Flow in Fixture Drains
Determination of the drain size required is a rela-tively simple matter, since the fixture drain must
be adequate only to carry the discharge from thefixture to which it is attached. Because of the
problem of self-siphonage, however, it is advis-able to select the diameter of the drain so that the drain flows little more than half full under the maximum discharge conditions likely to beimposed by the fixture.
For example, a lavatory drain capable of car-rying the flow discharged from a lavatory may still flow full over part or all of its length. Thereare several reasons for this. The vertical compo-nent of the flow out of the trap into the draintends to make the water attach itself to the up-per elements of the drain, and a slug of water isformed, filling the drain at that point. The result is that, if there is not sufficient air aspiratedthrough the overflow, the pipe will flow full for part of its length, the average velocity of flow
being less than the normal velocity for the rateof flow in the drain at a given slope.
If the fixture considered is a water closet, thesurge of water from the closet will continue al-most without change even along a very long drainuntil it reaches the stack. Thus, it can be as-sumed, for all practical purposes, that the surgecaused by the discharge of a water closet througha fixture drain reaches the stack or horizontal
branch with practically the same velocity it had when it left the fixture.
PNEUMATIC PRESSURES IN A SANITARY DRAINAGE SYSTEM
Because of the pressure conditions in a stack and a building drain, the waste water does not fill the cross section anywhere, so that the air can flow freely along with the water. The water flowing down the wall of the stack drags air withit by friction and carries it through the buildingdrain to the street sewer. The air is then ventedthroughout the main street sewer system so dan-gerous pressures are not build up.
If air is to enter the top of the stack to re-place that being carried along with the water,there must be a pressure reduction inside thestack. Because of the head loss necessary to ac-celerate the air and to provide for the energy lossat the entrance, however, this pressure reduc-tion is very small; it amounts to only a small

8/12/2019 American Society of Plumbing Engineers Volume 2
http://slidepdf.com/reader/full/american-society-of-plumbing-engineers-volume-2 29/233
3Chapter 1— Sanitary Drainage Systems
fraction of an inch (a millimeter) of water. What causes appreciable pressure reductions is thepartial or complete blocking of the stack by wa-ter flowing into the stack from a horizontal
branch.
A small increase in pneumatic pressure willoccur in the building drain even if there is nocomplete blocking of the air flow by a hydraulic
jump or by submergence of the outlet and the building sewer. This is due to the decrease incross-sectional area available for air flow whenthe water flowing in the drain has adapted itself to the slope and diameter of the drain.
FIXTURE DISCHARGECHARACTERISTICS
The discharge characteristic curves — flow ratesas a function of time — for most water-closet bowls have the same general shape, but someshow a much lower peak and a longer period of discharge. The discharge characteristics for vari-ous types of water-closet bowl, particularly low-flow water closets, have a significant impact on estimating the capacity of a sanitary drain-age system. Other plumbing fixtures, such assinks, lavatories, and bathtubs, may producesimilar surging flows in drainage systems, but they do not have as marked an effect as water closets do.
DRAINAGE LOADS
A single-family dwelling contains certain plumb-ing fixtures — one or more bathroom groups, eachconsisting of a water closet, a lavatory, and a
bathtub or shower stall; a kitchen sink, dish- washer, and washing machine; and, possibly, a set of laundry trays. Large buildings also haveother fixtures, for example, slop sinks and drink-ing water coolers. The important characteristicof these fixtures is that they are not used con-tinuously. Rather, they are used with irregular
frequencies that vary greatly during the day. Inaddition, the various fixtures have quite differ-ent discharge characteristics, regarding both theaverage rate of flow per use and the duration of a single discharge. Consequently, the probabil-ity of all the fixtures in the building operatingsimultaneously is small.
The assigning of fixture-unit (fu) values tofixtures to represent their load-producing effect
on the plumbing system was originally proposedin 1923 by Dr. Roy B. Hunter. The fixture-unit
values were designed for application in conjunc-tion with the probability of simultaneous use of fixtures to establish the maximum permissibledrainage loads expressed in fixture units rather than in gallons per minute (gpm) (L/s) of drain-age flow. Table 1-1 gives the recommendedfixture-unit values. The plumbing engineer must conform to local code requirements.
Table 1-1 Residential Fixture-Unit Loads
Fixture Fixture Units (fu)
Bathtub 2
Clothes washer 3
Dishwasher 2
Floor drain 3
Laundry tray 2
Lavatory 1
Shower 2
Sink (including dishwasher andgarbage disposer) 3
Water closet (tank type) 4
A fixture unit (fu) is a quantity in terms of which the load-producing effects on the plumb-ing system of different kinds of plumbing fixtures
are expressed on an arbitrarily chosen scale.Dr. Hunter conceived the idea of assigning a
fixture-unit value to represent the degree to which a fixture loads a system when used at themaximum assumed flow and frequency. Thepurpose of the fixture-unit concept is to make it possible to calculate the design load on the sys-tem directly when the system is a combinationof different kinds of fixtures, each having a load-ing characteristic different than the others.Current or recently conducted studies of drain-age loads on drainage systems may change these
values. These include studies of: (1) reduced flow
from water-saving fixtures; (2) models of stack, branch, and house drain flows; and (3) actualfixture use.
STACK CAPACITIES
The criterion of flow capacities in drainage stacksis based on the limitation of the water-occupiedcross section to a specified fraction, r s, of the

8/12/2019 American Society of Plumbing Engineers Volume 2
http://slidepdf.com/reader/full/american-society-of-plumbing-engineers-volume-2 30/233
ASPE Data Book — Volume 24
cross section of the stack where terminal veloc-ity exists, as suggested by earlier investigations.
Flow capacity can be expressed in terms of the stack diameter and the water cross section:
Equation 1-2Q = 27.8 × r
s5/3 × D8/3
where
Q = Capacity, gpm (L/s)
r s = Ratio of cross-sectional area of thesheet of water to cross-sectional area of the stack
D = Diameter of the stack, in. (mm)
Values of flow rates based on r = ¼, 7/24, and3 are tabulated in Table 1-2.
Table 1-2 Capacities of Stacks
Pipe Size, Flow, gpm (L/s)
in. (mm) r = 1 / 4 r = 7 / 24 r = 1 / 3
2 (50) 18.5 (1.18) 23.5 (1.48) —
3 (80) 54 (3.40) 70 (4.41) 85 (5.36)
4 (100) 112 (7.07) 145 (9.14) 180 (11.35)
5 (125) 205 (12.93) 270 (17.03) 324 (20.44)
6 (150) 330 (20.82) 435 (27.44) 530 (33.43)
8 (200) 710 (44.8) 920 (58.04) 1145 (72.24)
10 (250) 1300 (82.0) 1650 (104.1) 2055 (129.65)
12 (300) 2050 (129.3) 2650 (167.2) 3365 (212.3)
Whether or not Equation 1-2 can be usedsafely to predict stack capacities remains to beconfirmed and accepted. However, it provides a definite law of variation of stack capacity withdiameter; and if this law can be shown to holdfor the lower part of the range of stack diam-eters, it should be valid for the larger diameters.It should be remembered that both F.M. Dawsonand Dr. Hunter, in entirely independent investi-gations, came to the conclusion that slugs of
water, with their accompanying violent pressurefluctuations, did not occur until the stack flowed¼ to 3 full. Most model codes have based their stack loading tables on a value of r = ¼ or 7/24.
The recommended maximum permissibleflow in a stack is 7/24 of the total cross-sectionalarea of the stack. Substituting r = 7/24 into Equa-tion 1-2, the corresponding maximumpermissible flow for the various sizes of pipe ingpm (L/s) can be determined. Table 1-3 lists the
maximum permissible fixture units to be con- veyed by stacks of various sizes. The table wasobtained by taking into account the probability of simultaneous use of fixtures. For example, the500 fu is the maximum loading for a 4-in. (100-mm) stack, thus 147 gpm (9.3 L/s) is equivalent to 500 fu. This is the total load from all branches.
It should be noted that there is a restrictionof the amount of flow permitted to enter a stack from any branch when the stack is more thanthree branch intervals. If an attempt is made tointroduce too large a flow into the stack at any one level, the inflow will fill the stack at that level and will even back up the water above theelevation of inflow, which will cause violent pres-sure fluctuations in the stack — resulting in thesiphoning of trap seals — and may also cause slug-gish flow in the horizontal branch. This problem
was solved in a study of stack capacities made by Wyly and Eaton at the National Bureau of Standards, for the Housing and Home Finance
Agency, in 1950.
The water flowing out of the branch can en-ter the stack only by mixing with the streamflowing down the stack or by deflecting it. Sucha deflection of the high-velocity stream comingdown the stack can be accomplished only if thereis a large enough hydrostatic pressure in the
branch, since a force of some kind is required todeflect the downward flowing stream and there-fore change its momentum. This hydrostatic
pressure is built up by the backing up of the water in the branch until the head thus createdsuffices to change the momentum of the streamalready in the stack enough to allow the flow from the branch to enter the stack.
The magnitude of the maximum hydrostaticpressure that should be permitted in the branchas a result of the backing up of the spent water is based on the consideration that this backingup should not be sufficiently great to cause the
water to back up into a shower stall or to causesluggish flow. It is half the diameter of the hori-zontal branch at its connection to the stack. That
is, it is the head measured at the axis of the pipethat will just cause the branch to flow full near the exit.
When a long-turn tee-wye is used to connect the branch to the stack, the water has a greater
vertical velocity when it enters the stack than it does when a sanitary tee is used, and the back pressures should be smaller in this case for thesame flows down the stack and in the branch.

8/12/2019 American Society of Plumbing Engineers Volume 2
http://slidepdf.com/reader/full/american-society-of-plumbing-engineers-volume-2 31/233
5Chapter 1— Sanitary Drainage Systems
Table 1-3 shows the maximum permissiblefu loads for sanitary stacks. The procedure for sizing a multistory stack (greater than threefloors) is first to size the horizontal branchesconnected to the stack. This is done by totalingthe fixture units connected to each branch andsize in accordance with column 2 in Table 1-3.Next, total all the fixture units connected to thestack and determine the size from the same table,under column 4. Immediately check the next column, “ Total at One Branch Interval,” and de-termine that this maximum is not exceeded by any of the branches. If it is exceeded, the size of the stack as originally determined must be in-creased at least one size, or the loading of the
branches must be redesigned so that maximumconditions are satisfied. Take, for example, a 4-in. (100-mm) stack more than three stories inheight: The maximum loading for a 4-in. (100-
mm) branch is 160 fu, as shown in column 2 of Table 1-3. This load is limited by column 5 of the same table, which permits only 90 fu to beintroduced into a 4-in. (100-mm) stack in any one branch interval. The stack would have to beincreased in size to accommodate any branchload exceeding 90 fu.
Table 1-3 Horizontal FixtureBranches and Stacks
Maximum Number of Fixture Units (fu) that May Be Connected to
Any 1 Stack of Stacks with More than
Diameter Horizontal 3 or Fewer 3 Branch Intervals
of Pipe, Fixture Branch Total Total at 1in. (mm) Brancha Intervals for Stack Branch Interval
1½ (40) 3 4 8 2
2 (50) 6 10 24 6
2½ (65) 12 20 42 9
3 (80) 20b 48b 72b 20b
4 (100) 160 240 500 90
5 (125) 360 540 1100 200
6 (150) 620 960 1900 350
8 (200) 1400 2200 3600 600
10 (250) 2500 3800 5600 1000
12 (300) 3900 6000 8400 1500
15 (380) 7000
aDoes not include branches of the building drain.bNo more than 2 water closets or bathroom groups within eachbranch interval or more than 6 water closets or bathroom groupson the stack.
To illustrate clearly the requirements of a stack with an offset of more than 45° from the
vertical, Figure 1-1 shows the sizing of a stack in a 12-story building where there is one offset
between the fifth and sixth floors and another offset below the street floor.
Sizing is computed as follows:
Step 1. Compute the fixture units connected tothe stack. In this case, assume there are 1200fixture units connected to the stack from thestreet floor through the top floor.
Step 2. Size the portion of the stack above thefifth-floor offset. There are 400 fixture unitsfrom the top floor down through the sixthfloor. According to Table 1-3, column 4, 400fixture units require a 4-in. (100-mm) stack.
Step 3. Size the offset on the 5th floor. An offset
is sized and sloped like a building drain.Step 4. Size the lower portion of the stack from
the fifth floor down through the street floor. The lower portion of the stack must be largeenough to serve all fixture units connectedto it, from the top floor down, in this case,1200 fixture units. According to Table 1-3,1200 fixture units require a 6-in. (150-mm)stack.
Step 5. Size and slope the offset below the street floor the same as a building drain.
The fixture on the sixth floor should be con-
nected to the stack at least 2 ft (0.6 m) above theoffset. If this is not possible, then connect themseparately to the stack at least 2 ft (0.6 m) below the offset. If this is not possible either, run thefixture drain down to the fifth or fourth floor andconnect to the stack there.
CAPACITIES OF SLOPING DRAINS
Capacities of horizontal or sloping drains arecomplicated by surging flow.
The concept of flow on which the determina-
tion of drain sizes is based is that of a highly fluctuating or surging condition in the horizon-tal branches that carry the discharges of fixturesto the soil or waste stack. After falling down the
vertical stack, the water is assumed to enter the building drain with the peaks of the surges lev-eled off somewhat but still in a surging condition.
In a large building covering considerableground area there are probably several primary

8/12/2019 American Society of Plumbing Engineers Volume 2
http://slidepdf.com/reader/full/american-society-of-plumbing-engineers-volume-2 32/233
ASPE Data Book — Volume 26
branches and certainly at least one secondary branch. After the water enters the building drain,the surge continues to level off, becoming moreand more nearly uniform, particularly after thehydraulic jump has occurred. If the secondary
branch is long enough, and if the drain serves a large number of fixtures, the flow may becomesubstantially uniform before it reaches the street sewer.
Steady, Uniform Flow Conditions inSloping Drains
Although the equations of steady, uniform flow in sloping drains should not be used to deter-mine the capacities of sloping drains in which
surging flow exists, flow computations based onthese formulas afford a rough check on valuesobtained by the more complicated methods that
Figure 1-1 Procedure for Sizing an Offset Stack
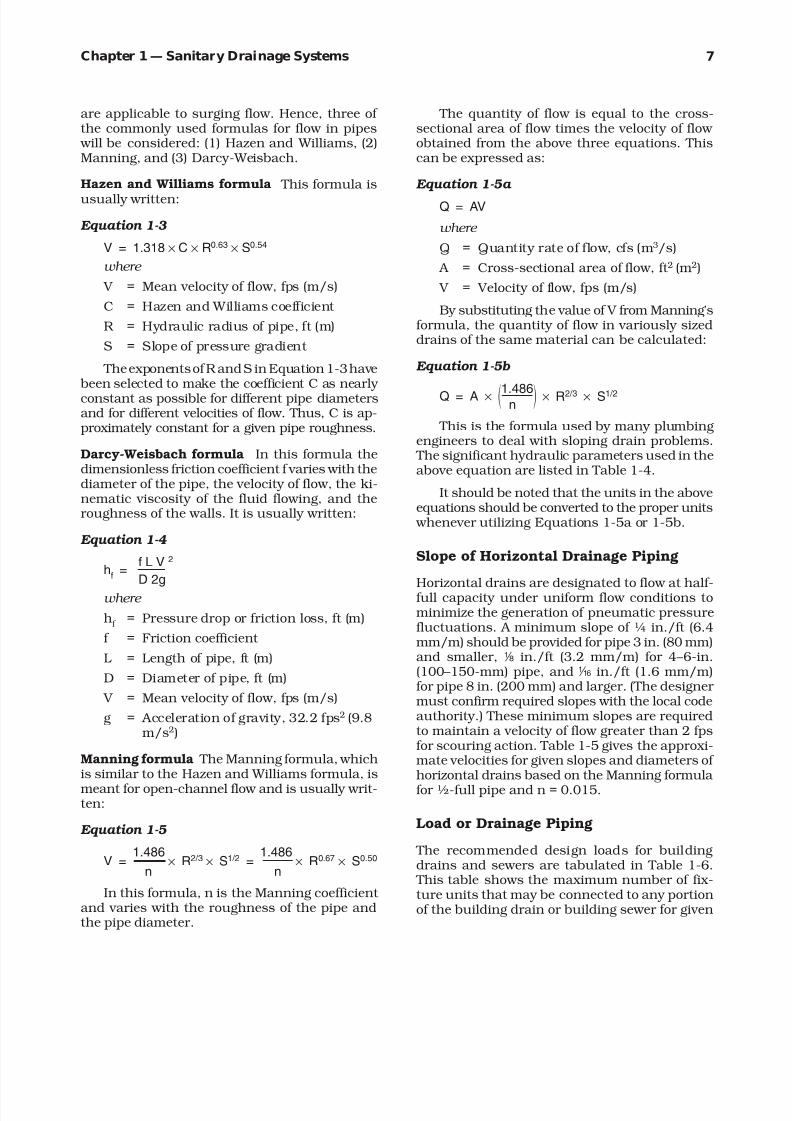
8/12/2019 American Society of Plumbing Engineers Volume 2
http://slidepdf.com/reader/full/american-society-of-plumbing-engineers-volume-2 33/233
7Chapter 1— Sanitary Drainage Systems
are applicable to surging flow. Hence, three of the commonly used formulas for flow in pipes
will be considered: (1) Hazen and Williams, (2)Manning, and (3) Darcy-Weisbach.
Hazen and Williams formula This formula is
usually written:
Equation 1-3
V = 1.318 × C × R0.63 × S0.54
where
V = Mean velocity of flow, fps (m/s)
C = Hazen and Williams coefficient
R = Hydraulic radius of pipe, ft (m)
S = Slope of pressure gradient
The exponents of R and S in Equation 1-3 have been selected to make the coefficient C as nearly constant as possible for different pipe diametersand for different velocities of flow. Thus, C is ap-proximately constant for a given pipe roughness.
Darcy-Weisbach formula In this formula thedimensionless friction coefficient f varies with thediameter of the pipe, the velocity of flow, the ki-nematic viscosity of the fluid flowing, and theroughness of the walls. It is usually written:
Equation 1-4
hf
=f L V 2
D 2g
where
hf = Pressure drop or friction loss, ft (m)
f = Friction coefficient
L = Length of pipe, ft (m)
D = Diameter of pipe, ft (m)
V = Mean velocity of flow, fps (m/s)
g = Acceleration of gravity, 32.2 fps2 (9.8m/s2)
Manning formula The Manning formula, whichis similar to the Hazen and Williams formula, is
meant for open-channel flow and is usually writ-ten:
Equation 1-5
V =1.486
× R2/3 × S1/2 =1.486
× R0.67 × S0.50
n n
In this formula, n is the Manning coefficient and varies with the roughness of the pipe andthe pipe diameter.
The quantity of flow is equal to the cross-sectional area of flow times the velocity of flow obtained from the above three equations. Thiscan be expressed as:
Equation 1-5a
Q = AV
where
Q = Quantity rate of flow, cfs (m3/s)
A = Cross-sectional area of flow, ft 2 (m2)
V = Velocity of flow, fps (m/s)
By substituting the value of V from Manning’sformula, the quantity of flow in variously sizeddrains of the same material can be calculated:
Equation 1-5b
Q = A ×1.486
× R2/3 × S1/2
n
This is the formula used by many plumbingengineers to deal with sloping drain problems.
The significant hydraulic parameters used in theabove equation are listed in Table 1-4.
It should be noted that the units in the aboveequations should be converted to the proper units
whenever utilizing Equations 1-5a or 1-5b.
Slope of Horizontal Drainage Piping
Horizontal drains are designated to flow at half-full capacity under uniform flow conditions tominimize the generation of pneumatic pressurefluctuations. A minimum slope of ¼ in./ft (6.4mm/m) should be provided for pipe 3 in. (80 mm)and smaller, 8 in./ft (3.2 mm/m) for 4 – 6-in.(100 – 150-mm) pipe, and z in./ft (1.6 mm/m)for pipe 8 in. (200 mm) and larger. (The designer must confirm required slopes with the local codeauthority.) These minimum slopes are requiredto maintain a velocity of flow greater than 2 fpsfor scouring action. Table 1-5 gives the approxi-mate velocities for given slopes and diameters of horizontal drains based on the Manning formula for ½-full pipe and n = 0.015.
Load or Drainage Piping
The recommended design loads for buildingdrains and sewers are tabulated in Table 1-6.
This table shows the maximum number of fix-ture units that may be connected to any portionof the building drain or building sewer for given
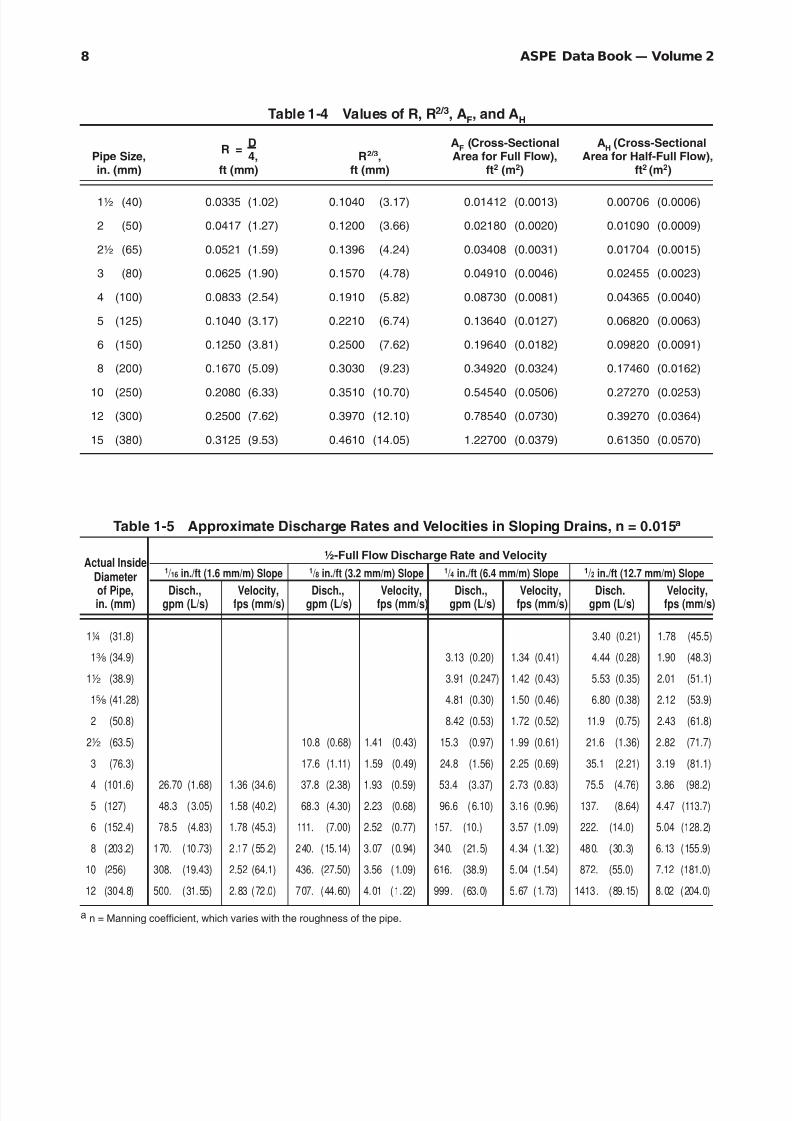
8/12/2019 American Society of Plumbing Engineers Volume 2
http://slidepdf.com/reader/full/american-society-of-plumbing-engineers-volume-2 34/233
ASPE Data Book — Volume 28
Table 1-4 Values of R, R2/3, AF, and A
H
R =D A
F (Cross-Sectional A
H (Cross-Sectional
Pipe Size, 4, R2/3, Area for Full Flow), Area for Half-Full Flow),in. (mm) ft (mm) ft (mm) ft2 (m2) ft2 (m2)
1½ (40) 0.0335 (1.02) 0.1040 (3.17) 0.01412 (0.0013) 0.00706 (0.0006)
2 (50) 0.0417 (1.27) 0.1200 (3.66) 0.02180 (0.0020) 0.01090 (0.0009)
2½ (65) 0.0521 (1.59) 0.1396 (4.24) 0.03408 (0.0031) 0.01704 (0.0015)
3 (80) 0.0625 (1.90) 0.1570 (4.78) 0.04910 (0.0046) 0.02455 (0.0023)
4 (100) 0.0833 (2.54) 0.1910 (5.82) 0.08730 (0.0081) 0.04365 (0.0040)
5 (125) 0.1040 (3.17) 0.2210 (6.74) 0.13640 (0.0127) 0.06820 (0.0063)
6 (150) 0.1250 (3.81) 0.2500 (7.62) 0.19640 (0.0182) 0.09820 (0.0091)
8 (200) 0.1670 (5.09) 0.3030 (9.23) 0.34920 (0.0324) 0.17460 (0.0162)
10 (250) 0.2080 (6.33) 0.3510 (10.70) 0.54540 (0.0506) 0.27270 (0.0253)
12 (300) 0.2500 (7.62) 0.3970 (12.10) 0.78540 (0.0730) 0.39270 (0.0364)
15 (380) 0.3125 (9.53) 0.4610 (14.05) 1.22700 (0.0379) 0.61350 (0.0570)
Table 1-5 Approximate Discharge Rates and Velocities in Sloping Drains, n = 0.015a
Actual Inside½-Full Flow Discharge Rate and Velocity
Diameter1 / 16 in./ft (1.6 mm/m) Slope 1 / 8 in./ft (3.2 mm/m) Slope 1 / 4 in./ft (6.4 mm/m) Slope 1 / 2 in./ft (12.7 mm/m) Slope
of Pipe, Disch., Velocity, Disch., Velocity, Disch., Velocity, Disch. Velocity,in. (mm) gpm (L/s) fps (mm/s) gpm (L/s) fps (mm/s) gpm (L/s) fps (mm/s) gpm (L/s) fps (mm/s)
14 (31.8) 3.40 (0.21) 1.78 (45.5)
1a (34.9) 3.13 (0.20) 1.34 (0.41) 4.44 (0.28) 1.90 (48.3)
12 (38.9) 3.91 (0.247) 1.42 (0.43) 5.53 (0.35) 2.01 (51.1)
1s (41.28) 4.81 (0.30) 1.50 (0.46) 6.80 (0.38) 2.12 (53.9)
2 (50.8) 8.42 (0.53) 1.72 (0.52) 11.9 (0.75) 2.43 (61.8)
22 (63.5) 10.8 (0.68) 1.41 (0.43) 15.3 (0.97) 1.99 (0.61) 21.6 (1.36) 2.82 (71.7)
3 (76.3) 17.6 (1.11) 1.59 (0.49) 24.8 (1.56) 2.25 (0.69) 35.1 (2.21) 3.19 (81.1)
4 (101.6) 26.70 (1.68) 1.36 (34.6) 37.8 (2.38) 1.93 (0.59) 53.4 (3.37) 2.73 (0.83) 75.5 (4.76) 3.86 (98.2)
5 (127) 48.3 (3.05) 1.58 (40.2) 68.3 (4.30) 2.23 (0.68) 96.6 (6.10) 3.16 (0.96) 137. (8.64) 4.47 (113.7)
6 (152.4) 78.5 (4.83) 1.78 (45.3) 111. (7.00) 2.52 (0.77) 157. (10.) 3.57 (1.09) 222. (14.0) 5.04 (128.2)
8 (203.2) 170. (10.73) 2.17 (55.2) 240. (15.14) 3.07 (0.94) 340. (21.5) 4.34 (1.32) 480. (30.3) 6.13 (155.9)
10 (256) 308. (19.43) 2.52 (64.1) 436. (27.50) 3.56 (1.09) 616. (38.9) 5.04 (1.54) 872. (55.0) 7.12 (181.0)
12 (304.8) 500. (31.55) 2.83 (72.0) 707. (44.60) 4.01 (1.22) 999. (63.0) 5.67 (1.73) 1413. (89.15) 8.02 (204.0)
a n = Manning coefficient, which varies with the roughness of the pipe.

8/12/2019 American Society of Plumbing Engineers Volume 2
http://slidepdf.com/reader/full/american-society-of-plumbing-engineers-volume-2 35/233
9Chapter 1— Sanitary Drainage Systems
slopes and diameters of pipes. For example, anoffset below the lowest branch with 1300 fu at ¼in./ft (6.4 mm/m) slope requires an 8-in. (200-mm) pipe.
For devices that provide continuous or semi-
continuous flow into the drainage system, suchas sump pumps, ejectors, and air-conditioningequipment, a value of 2 fu can be assigned for each gpm (L/s) of flow. For example, a sumppump that discharges at the rate of 200 gpm(12.6 L/s) is equivalent to 200 × 2 = 400 fu.
COMPONENTS OF SANITARY DRAINAGE SYSTEMS
Sumps and Ejectors
Building drains that cannot be discharged to thesewer by gravity flow may be discharged into a tightly covered and vented sump, from which theliquid is lifted and discharged into the building’sgravity drainage system by automatic pumpequipment or by any equally efficient methodapproved by the administrative authority. A du-plex pump system should be used, so that, inthe event of the breakdown of one pump, an-
other will remain in operation and no damage will be caused by the cessation of system opera-tion. When a duplex unit is used, each pumpshould be sized for 100% flow, and it is goodpractice to have the operation of the pumps al-ternate automatically.
Incoming water is collected in the sump be-fore it goes down the drain pipe. Heavy-flow drains require large sumps to retain greater thanusual amounts of water, thereby creating morehead pressure on the pipe inlet. Most manufac-turers make their sumps with bottom, side, or angle outlets and with inside caulk, no-hub,push-on, spigot, or screwed connections.
Cleanouts
The cleanout provides access to horizontal and
vertical lines to facilitate inspection and providea means of removing obstructions such as solidobjects, greasy wastes, and hair. Cleanouts, ingeneral, must be gas and water-tight, providequick and easy plug removal, allow ample spacefor the operation of cleansing tools, have a meansof adjustment to finished surfaces, be attractivein appearance, and be designed to support what-ever traffic is directed over them.
Some cleanouts are designed with a neopreneseal plug, which prevents “freezing” or bindingto the ferrule. All plugs are machined with a straight or running thread and a flared shoulder
for the neoprene gasket, permitting quick andcertain removal when necessary. A maximumopening is provided for tool access. Recessedcovers are available to accommodate carpet, tile,terrazzo and other surface finishes, and are ad-
justable to the exact floor level established by the adjustable housing or by the set screws.
Waste lines are normally laid beneath thefloor slabs at a distance sufficient to provide ad-equate backfill over the joints. Cleanouts are then
brought up to floor-level grade by pipe extensionpieces. Where the sewer line is at some distance
below grade and not easily accessible through
extensions, small pits or manholes with accesscovers must be installed. When cleanouts areinstalled in traffic areas, the traffic load must beconsidered when the materials of constructionare selected.
The size of the cleanout within a buildingshould be the same size as the piping, up to 4in. (100 mm). For larger size interior piping, 4-in. (100-mm) cleanouts are adequate for their
Table 1-6 Building Drains and Sewersa
Maximum Number of Fixture Units that
May Be Connected to Any Portion of the
DiameterBuilding Drain or Building Sewer
of Pipe, Slope, in./ft (mm/m)
in. (mm) 1 / 16 (1.6) 1 / 8 (3.2) 1 / 4 (6.4) 1 / 2 (12.7)
2 (50) 21 26
2½ (65) 24 31
3 (80) 42b 50b
4 (100) 180 216 250
5 (125) 390 480 575
6 (150) 700 840 1,000
8 (200) 1400 1600 1,920 2,300
10 (250) 2500 2900 3,500 4,200
12 (300) 2900 4600 5,600 6,700
15 (380) 7000 8300 10,000 12,000
aOn-site sewers that serve more than one building may be sizedaccording to the current standards and specifications of the ad-ministrative authority for public sewers.bNo more than 2 water closets or 2 bathroom groups, except insingle-family dwellings, where no more than 3 water closets or 3bathroom groups may be installed.

8/12/2019 American Society of Plumbing Engineers Volume 2
http://slidepdf.com/reader/full/american-society-of-plumbing-engineers-volume-2 36/233
ASPE Data Book — Volume 210
intended purpose; however, 6-in. (150-mm)cleanouts are recommended to allow for a larger
variety of access for sewer video equipment.
Cleanouts should be provided at the follow-ing locations:
1. Five ft 0 in. (1.5 m) outside or inside the build-ing at the point of exit.
2. At every change of direction greater than 45°.
3. A maximum distance between cleanouts of 50 ft (15.1 m) should be maintained for pip-ing 4 in. (100 mm) and smaller, and of 75 ft (22.9 m) for larger piping. Underground sani-tary sewer piping larger than 10 in. (250 mm)in diameter should be provided with man-holes at every change of direction and every 150 ft (45.7 m).
4. At the base of all stacks.
5. To comply with applicable codes.
Optional locations include:
1. At the roof stack terminal.
2. At the end of horizontal fixture branches or waste lines.
3. At fixture traps. (Fixture traps can bepremanufactured with cleanout plugs, al-though some codes prohibit the installationof this kind of trap.)
Floor Drains and Floor Sinks
A large-diameter drain with a deep sump con-nected to a large-diameter pipe will pass more
water more rapidly than a smaller drain will.However, economics do not allow the designer
arbitrarily to select the largest available drain when a smaller, less-expensive unit will do a sat-isfactory job. High-capacity drains are intendedfor use primarily in locations where the flow reaches high rates, such as malls, washdownareas, and certain industrial applications. Table1-7, which shows minimum ratios of open gratearea based on pipe diameter, is offered as a guidefor the selection of drains where the drain pipediameter is known.
The only drawback to using the open-area-pipe-diameter-ratio method is that all drainmanufacturers do not list the total open areas of grates in their catalogs. This information usu-ally can be obtained upon request, however.
For the sizing of floor drains for most indoor applications, the capacity of a drain is not ex-tremely critical because the drain’s primary function is to handle minor spillage or fixtureoverflow. The exceptions are, of course, cases
where equipment discharges to the drain, whereautomatic fire sprinklers may deluge an area withlarge amounts of water, and where flushing of the floor is required for sanitation.
Generally located floor drains or drains in-
stalled to anticipate a failure may not receivesufficient water flow to keep the protective water seal or plumbing trap from evaporating; if it doesevaporate, sewer gases will enter the space. Au-tomatic or manual trap primers should beinstalled to maintain a proper trap seal. (A smallamount of vegetable oil will dramatically reducethe evaporation rate of infrequently used floor drains and floor sinks.)
Figure 1-2 shows the basic components of a floor drain.
Grates/Strainers The selection of grates is based on use and theamount of flow. Light-traffic areas may have a nickel-bronze-finished grate, while mechanicalareas may have a large, heavy-duty, ductile irongrate.
The wearing of spike-heeled shoes promptedthe replacement of grates with a heel-proof, ¼-
Table 1-7 Recommended Grate OpenAreas for Various Outlet Pipe Sizes
Recommended Minimum Grate Open Area
Transverse MinimumNominal Area of Pipe, Inside Area,
Pipe Size, in.2a in.2
in. (mm) (× 10 mm2) (× 10 mm2)
1½ (40) 2.04 (1.3) 2.04 (1.3)2 (50) 3.14 (2.0) 3.14 (2.0)
3 (80) 7.06 (4.6) 7.06 (4.6)
4 (100) 12.60 (8.1) 12.06 (8.1)
5 (125) 19.60 (12.7) 19.60 (12.7)
6 (150) 28.30 (18.3) 28.30 (18.3)
8 (200) 50.25 (32.4) 50.24 (32.4)
aBased on extra-heavy soil pipe, nominal internal diameter.

8/12/2019 American Society of Plumbing Engineers Volume 2
http://slidepdf.com/reader/full/american-society-of-plumbing-engineers-volume-2 37/233
11Chapter 1— Sanitary Drainage Systems
in.-square (6.4-mm) hole design in public toilet rooms, corridors, passageways, promenadedecks, patios, stores, theaters, and markets.
Though this type of grating has less drainagecapacity than the previous one, its safety fea-ture makes it well worth the change.
Grates or strainers should be secured withstainless-steel screws in nickel-bronze tops.
Vandal-proof fasteners are available from most manufacturers. Vandal-proofing floor draingrates is advisable. If there is public access tothe roof, consideration must be given to protect-ing the vent openings from vandals.
In school gymnasium shower rooms, wherethe blocking of flat-top shower drains with paper towels can cause flooding, dome grates in the cor-ners of the room or angle grates against the wallscan be specified in addition to the regular shower drains. Shower-room gutters and curbs have be-come undesirable because of code requirements
and the obvious dangers involved. Therefore, thepassageways from shower areas into locker areasneed extended-length drains to prevent runoff
water from entering the locker areas.
Where grates are not secured and are subject to vehicular traffic, it is recommended that nontilting and/or tractor-type grates be installed.
When a grate starts to follow a wheel or is hit onone edge and starts to tilt, the skirt catches theside of the drain body and the grate slides back
into its original position. Ramp-drain gratingsshould be slightly convex because rapidly flowingramp water has a tendency to flow across thegrate. A better solution to this problem is to placeflat-top grates on a level surface at the bottom of the ramp, rather than on the ramp slope.
A technique in casting grates is the reversalof pattern draft, which removes the razor-sharpedges created when grates are buffed. See Fig-ure 1-3. The prevalent buffing technique is called“scuff-buff ’ because it gives the grate a slightly used appearance. The use of slots in grates is
becoming obsolete because of the slicing edgesthey create, which cause excess wear and tear
(a)
(b)
Figure 1-3 Pattern Draft for Floor Gratings:(a) Sharp Edge, (b) Reverse Pattern.
Figure 1-2 Basic Floor-Drain Components:(A) Removable Grate; (B) Rust-Resistant Bolts; (C) Integral, One-Piece, Flashing Ring;(D) Cast Drain Body with Sump; (E) Sediment Bucket (optional).

8/12/2019 American Society of Plumbing Engineers Volume 2
http://slidepdf.com/reader/full/american-society-of-plumbing-engineers-volume-2 38/233
ASPE Data Book — Volume 212
on the wheels of hand-trucks and other vehicles.Square openings are more desirable because they shorten this edge and provide greater drainagecapacity than round holes.
Flashing Ring This component makes an effective seal, whichprevents water from passing around the drainto the area below.
Sediment Bucket
A “sediment bucket ” is an additional internalstrainer designed to collect debris that gets by the regular strainer; it is required wherever thedrain can receive solids, trash, or grit that couldplug piping. Locations include:
1. Toilet rooms in commercial buildings should be equipped with floor drains with sediment buckets to facilitate cleaning.
2. Floor drains with sediment buckets must also be provided in mechanical equipment rooms, where pumps, boilers, water chillers, heat exchangers, and HVAC equipment regularly discharge and/or must be periodically drained for maintenance and repairs. HVACequipment requires the drainage of conden-sate from cooling coils, using indirect drains.
3. Boilers require drains with sediment buck-ets. Strategically located floor drains are alsorequired in buildings with wet fire-protectionsprinkler systems to drain water in casesprinkler heads are activated. The maximumtemperature of liquids discharged should be140°F (60°C).
Floor drains shall connect into a trap so con-structed that it can be readily cleaned and sizedto serve efficiently the purpose for which it isintended. A deep-seal-type trap or an approvedautomatic priming device should be provided. Thetrap shall be accessible either from the floor-draininlet or by a separate cleanout within the drain.
Figure 1-4 illustrates several types of drain that meet these conditions.
Accessories
A variety of accessories are available to makethe basic drain adaptable to various types of structure. The designer must know the construc-tion of the building, particularly the floor anddeck structures, to specify the appropriate drain.
Backwater Valves
A backwater valve can be installed on a buildingsewer/house drain when the drain is lower thanthe sewer line, when unusual sewer surchargesmay occur due to combined storm-water andsanitary sewer systems, or when older munici-pal sewers incur high rates of infiltration. A
backwater valve reacts similarly to the way a check valve does. The device consists of a me-chanical flapper or disc, which requires a certainamount of maintenance; therefore, attention
must be given during the placement of thesedevices to a free area and access for maintenance.Sediment can accumulate on the flapper valveseat, preventing the flapper from closing tightly.
Also, many valves employ a spring or mechani-cal device to exert a positive pressure on theflapper device, which requires occasional lubri-cation. Most manufacturers of backwater valvesprovide an access cover plate for maintenance,
which may also be used as a building sewer cleanout.
Figure 1-5 illustrates various types of back- water valve that may be installed where there is
a possibility of backflow.
Oil Interceptors
In commercial establishments such as servicestations, garages, auto-repair shops, dry clean-ers, laundries, industrial plants, and processindustries having machine shops, metal-treat-ing process rooms, chemical process or mixing
Figure 1-4 Types of Floor Drain:(A) Typical Drain with Integral Trap
that May Be Cleaned Through RemovableStrainer at Floor Level;
(B) Floor Drain with Combination Cleanoutand Backwater Valve, for Use Where
Possibility of Backflow Exists;(C) Drain with Combined Cleanout,
Backwater Valve, and Sediment Bucket.

8/12/2019 American Society of Plumbing Engineers Volume 2
http://slidepdf.com/reader/full/american-society-of-plumbing-engineers-volume-2 39/233
13Chapter 1— Sanitary Drainage Systems
rooms, etc., there is always the problem of flam-mable or volatile liquids entering the drainage
system, which can contaminate the sewer lineand cause a serious fire or explosive condition.
Oil interceptors are designed to separate andcollect oils and other light-density, volatile liq-uids, which would otherwise be discharged intothe drainage system. An oil interceptor is required
wherever lubricating oil, cutting oil, kerosene,gasoline, diesel fuel, aircraft fuel, naphtha, par-affin, trisodium phosphate, or other light-density and volatile liquids are present in or around thedrainage system.
The interceptor is furnished with a sediment
bucket, which collects debris, small parts, chips,particles, and other sediment that are frequently present in industrial waste from these types of facility and could clog the drainage system. A gasketed, removable cover permits access for cleaning the interceptor. To eliminate pressure
buildup inside the interceptor, a connection oneach side of the body allows the venting of theinterceptor.
Oil interceptors are sized in accordance withthe maximum anticipated gpm (L/s) flow rate of
waste water that could be discharged throughthe drains they serve. A flow-control fitting of
the exact gpm (L/s) interceptor rating ensuresmaximum oil interception efficiency. If this flow rating is exceeded, the separation of the oil fromthe waste water will not occur.
Oil draw-off pipes, used in conjunction witha supplemental waste oil storage tank, can im-prove efficiency and prolong system maintenanceand cleaning.
Grease Interceptors
In the drainage from commercial kitchens,grease, fats, and oils must be separated fromsewage. This function is performed by grease in-terceptors installed in drain lines where the
presence of grease in the sewage is expected.
It is sometimes practical to discharge the waste from two or more sinks into a single inter-ceptor. This practice is recommended only whenall the fixtures are close together to avoid instal-ling long piping runs to the interceptor. The closer the interceptor can be installed to the fixture(s)the better. The longer the run of pipe, the cooler the waste water is. As the waste water cools, thegrease congeals, coating and clogging the inte-rior of the pipe.
The procedures for sizing grease interceptors
are as follows:1. Determine the cubic content of the fixtures
by multiplying length by width by depth.
2. Determine the capacity in gallons (1 gal =231 in.3) (liters [1 L = 1000 cm3]).
3. Determine the actual drainage load. The fix-ture is usually filled to about 75% of capacity
with waste water. The items being washeddisplace about 25% of the fixture content.
Therefore, actual drainage load = 75% of fix-ture capacity.
4. Determine the flow rate and the drainage pe-riod. In general, good practice dictates a 1-min drainage period; however, where con-ditions permit, a 2-min period is acceptable.
The drainage period is the actual time re-quired to completely empty the fixture.
5. Flow rate = Actual drainage load
Drainage period
6. Select the interceptor that corresponds to theflow rate calculated.
It is recommended to provide the automaticremoval of grease from the interceptor to a stor-
age tank that can be cleaned regularly.
Trap Primers
In lieu of deep-seal P-traps, many jurisdictionsrequire trap primers on floor and fixture drainsthat are consistently used on an infrequent ba-sis. General-purpose, mechanical-room drains;toilet-room drains; and seasonable, condensatedrains fall into this category. A trap primer allows
Figure 1-5 Various Types of Backwater Valve
8/12/2019 American Society of Plumbing Engineers Volume 2
http://slidepdf.com/reader/full/american-society-of-plumbing-engineers-volume-2 40/233

8/12/2019 American Society of Plumbing Engineers Volume 2
http://slidepdf.com/reader/full/american-society-of-plumbing-engineers-volume-2 41/233
15Chapter 1— Sanitary Drainage Systems
chrome plating will eventually be worn off by traf-fic, the preferred material is solid, cast nickel-bronze, which maintains its attractiveappearance. In a swimming pool, however, chlo-rine necessitates the use of chlorine-resistant materials. For large grates that will be subject tohand-truck or forklift traffic, a ductile iron grate
with or without a nickel-bronze veneer is recom-mended.
Polished brass or bronze for floor service hasthe disadvantage of discoloring unless there isconstant traffic over it. Cast aluminum has also
been found inadequate for certain floor-serviceapplications due to excessive oxidation and itsinability to withstand abrasion.
Noise Transmission
Noise transmission along pipes may be reduced by avoiding direct metal-to-metal connections.Noise transmission through pipe walls is gen-erally reduced by using heavier materials. Noisetransmission to the building may be reduced
by isolating piping with resilient materials, suchas rugs, belts, plastic, or insulation. See Table1-8 for relative noise-insulation absorption
values.
BUILDING SEWER INSTALLATION
The installation of building sewers (house drains)is very critical to the operation of the sewer. In-adequate bedding in poor soils may allow thesewer to settle, causing dips and low points inthe sewer. The settlement of sewers interruptsflow, diminishes minimum cleansing velocity,reduces capacity, and creates a point where sol-ids can drop out of suspension and collect.
The following are some guidelines for install-ing building sewers/drains:
1. Compacted fill. Where natural soil or com-pacted fill exists, the trench must beexcavated in alignment with the proposed
pitch and grade of the sewer. Depressionsneed to be cut out along the trench line toaccept the additional diameter at the piping
joint or bell hub. A layer of sand or pea gravelis placed as a bed in the excavated trench
because it is easily compacted under the pipe,allowing more accurate alignment of the pipepitch. The pipe settles into the bed and isfirmly supported over its entire length.
2. Shallow fill . Where shallow amounts of fillexist, the trench can be over excavated toaccept a bed of sand, crushed stone, or simi-lar material that is easily compacted. Beddingshould be installed in lifts (layers), with eachlift compacted to ensure optimum compac-tion of the bedding. The bed must becompacted in alignment with the proposedpitch and grade of the sewer. It is recom-mended that pipe joints or bell hubdepressions be hand prepared due to thecoarser crushed stone. The soil bearing
weight determines trench widths and bed-ding thickness.
3. Deep fill . Where deep amounts of fill exist,the engineer should consult a geotechnicalengineer, who will perform soil borings to de-termine the depths at which soils with proper
bearing capacities exist. Solutions includecompacting existing fill by physical meansor removing existing fill and replacing it withcrushed stone structural fill.
4. Backfilling . Backfilling of the trench is just as critical as the compaction of the trench
bed and the strength of existing soils. Im-proper backfill placement can dislodge pipeand cause uneven sewer settlement, withphysical depressions in the surface. The typeof backfill material and compaction require-ments need to be reviewed to coordinate withthe type of permanent surface. Landscaped
areas are more forgiving of improper backfillplacement than hard surface areas, such asconcrete or bituminous paving.
Care must be taken when using mechanicalmeans to compact soils above piping. Me-chanical compaction of the first layer abovethe pipe by vibrating or tamping devicesshould be done with caution. Compacting thesoil in 6-in. (150-mm) layers is recommendedfor a good backfill.
Proper sewer bedding and trench backfill re-sults in an installation that can be countedupon for long, trouble-free service.
SANITATION
All drains should be cleaned periodically,particularly those in markets, hospitals, food-processing areas, animal shelters, morgues, andother locations where sanitation is important.

8/12/2019 American Society of Plumbing Engineers Volume 2
http://slidepdf.com/reader/full/american-society-of-plumbing-engineers-volume-2 42/233
ASPE Data Book — Volume 216
Where sanitation is important, an acid-re-sisting enameled interior in floor drains is widely accepted. The rough surfaces of either brass or iron castings collect and hold germs, fungus-laden scum, and fine debris, which usually accompany drain waste. There is no easy or sat-isfactory way to clean these rough surfaces; themost practical approach is to enamel them. Theimproved sanitation compensates for the addedexpense. However, pipe threads cannot be cut into enameled metals because the enameling willchip off in the area of the machining. Also, pipethreads themselves cannot be enameled; there-fore, caulked joints should be specified onenameled drains. Most adjustable floor drainsutilize a threaded head that allows elevation ad-
justments. The drains cannot be enameled because of this adjusting thread. However, thereare other adjustable drains that use sliding lugs
on a cast thread and may be enameled.
Another point to remember is that a grate or the top ledge of a drain can be enameled, but the enamel will not tolerate traffic abrasion with-out showing scratches and, eventually, chipping.
The solution to this problem is a stainless-steelor nickel-bronze rim and grate over the enam-eled drain body, a common practice on indirect
waste receptors, sometimes referred to as “floor sinks.” Specifiers seem to favor the square, indi-rect waste receptor, but the round receptor iseasier to clean and has better antisplash char-acteristics. For cases where the choice of squareor round is influenced by the floor pattern, roundsinks with square tops are available.
In applications such as hospital morgues,cystoscopic rooms, autopsy laboratories, slaugh-terhouses, and animal dens, the enameled drainis fitted with a flushing rim. This is most advis-able where blood or other objectionable materialsmight cling to the side walls of the drain.
Where the waste being drained can create a stoppage in the trap, a heel inlet on the trap witha flushing connection is recommended in addi-tion to the flushing rim, which merely keeps the
drain sides clean. (This option may not be al-lowed by certain codes.) A 2-in. (50-mm) trapflushes more effectively than a 3-in. (80-mm) trap
because it allows the flushing stream to drillthrough the debris rather than completely flushit out. A valve in the water line to the drain isthe best way to operate the flushing-rim drain.Flush valves have been used and save some wa-ter; however, they are not as convenient or effective as a shutoff valve. In any flushing wa-
ter-supply line to a drain, a vacuum breaker in-stalled according to code must be provided.
KITCHEN AREAS
When selecting kitchen drains, the designer must know the quantity of liquid and solid waste thedrains will be required to accept, as well as whichequipment emits waste on a regular basis and
which produces waste only by accidental spillage.
Floor-cleaning procedures should be ascer-tained to determine the amount of water used. If any amount of solid waste is to be drained, re-ceptors must be specified with removablesediment buckets made of galvanized or stain-less steel. Also, there must be enough verticalclearance over these drains to conveniently re-
move the sediment buckets for cleaning.Many kitchen planners mount kitchen equip-
ment on a 5-in. (125-mm) curb. Placing the drainon top of the curb and under the equipment makes connection of indirect drain lines diffi-cult and the receptor inaccessible for inspectionand cleaning. Mounting the receptor in front of the curb takes up floor space, and the myriadindirect drains that discharge into it create a potential hazard for employees who may trip over them. The solution requires close coordination
between the engineer and the kitchen designer.
Figure 1-6 Combination Floor Drainand Indirect Waste Receptor

8/12/2019 American Society of Plumbing Engineers Volume 2
http://slidepdf.com/reader/full/american-society-of-plumbing-engineers-volume-2 43/233
17Chapter 1— Sanitary Drainage Systems
with adjustable tops to attain an installation that is flush with the finished floor.
JOINING METHODS
Drain and cleanout outlets are manufactured infour basic types:
1. Inside caulk. In this arrangement, the pipeextends up into the drain body and oakum ispacked around the pipe tightly against the in-side of the outlet. Molten lead is then pouredinto this ring and later stamped or caulked tocorrect for lead shrinkage. Current installa-tion methods use a flexible gasket for a caulking material. See Figure 1-7.
2. Spigot outlet. This type utilizes the caulkingmethod as outlined above, except that the
spigot outlet is caulked into the hub or bellof the downstream pipe or fitting. See Figure1-8.
3. Push-seal gasketed outlet. This type utilizesa neoprene gasket similar to standard ASTMC564 neoprene gaskets approved for hub-and-spigot, cast-iron soil pipe. A ribbedneoprene gasket is applied to the acceptingpipe thus allowing the drain outlet to bepushed onto the pipe.
4. No-hub. This type utilizes a spigot (with no bead on the end) that is stubbed into a neo-
prene coupling with a stainless-steel bolting band (or other type of clamping device), which, in turn, accepts a downstream pieceof pipe or headless fitting. See Figure 1-9.
5. IPS or threaded. This type is a tapered femalethread in the drain outlet designed to accept the tapered male thread of a downstream pieceof pipe or fitting. See Figure 1-10.
Figure 1-6 shows an arrangement whereby any spillage in front of the curb can be drained by half of the receptor, while indirect drains areneatly tucked away.
Where equipment is on the floor level and an
indirect waste receptor must be provided under the equipment, a shallow bucket that can easily
be removed is recommended.
WATERPROOFING
Whenever a cast-iron drain is cemented into a slab, separation due to expansion and contrac-tion occurs and creates several problems. Oneis the constant wet area in the crevice aroundthe drain that promotes mildew odor and the
breeding of bacteria. Seepage to the floor below
is also a possibility. This problem can be cor-rected by a seepage or flashing flange. Weep holesin the flashing flange direct moisture into thedrain. Also, this flange accepts membrane ma-terial and, when used, the flashing ring shouldlock the membrane to the flange.
One prevalent misconception about the flash-ing flange is that it can have weep holes whenused with cleanouts. In this case, there can beno weep holes into the cleanout for the moistureto run to. Weep holes should also be eliminatedfrom the flashing flanges of drains, such as re-flection-pool drains, where the drain entrance is
shut off by an overflow standpipe to maintain a certain water level.
The term “nonpuncturing,” used in referenceto membrane-flashing, ring-securing methods, isnow obsolete as securing bolts have been movedinboard on flashing L flanges and the membraneneed not be punctured to get a seal. Of the vari-ous arrangements, this bolting method allows thegreatest squeeze pressure on the membrane.
FLOOR LEVELING
A major problem in setting floor drains andcleanouts occurs when the concrete is pouredlevel with the top of the unit, ignoring the fact that the addition of tile on the floor will causethe drain or cleanout to be lower than the sur-rounding surface. To solve the problem, cleanoutscan be specified with tappings in the cover rimto jack the top part of the cleanout up to thefinished floor level. Floor drains can be furnished
Figure 1-7 Inside-Caulk Drain Body

8/12/2019 American Society of Plumbing Engineers Volume 2
http://slidepdf.com/reader/full/american-society-of-plumbing-engineers-volume-2 44/233
ASPE Data Book — Volume 218
THERMAL EXPANSION
When excessive thermal expansion is anticipated,the pipe movement should be controlled to avoidharmful changes in slope or damage. This may
be done by anchoring, using expansion joints,or using expansion loops or bends. When an-choring, avoid excessive stress on the structureand the pipe. Piping or mechanical engineeringhandbooks should be consulted if stress analy-
Figure 1-8 Spigot-Outlet Drain Body
sis is to be performed due to excessive stressesor to the differing expansion characteristics of materials. See Data Book, Volume 2, Chapter 5for further information.
PROTECTION FROM DAMAGE
Following are some common types of damage toanticipate and some methods of protection:
Hazard Protection
Abrasion Plastic or rubber sleeves.Insulation where copper pipe leaves slab.
Condensation Insulation on piping.
Corrosion See Data Book, Vol. 1, Ch. 8,“Corrosion.”
Earth loads Stronger pipe or pipesleeves.
Expansion and Flexible joints, loops, swingcontraction joints, or offsets.
Fire Building constructionaround pipe. Some jurisdic-tions require metal piping
within 2 ft (0.6 m) of anentry into a firewall. Must maintain fire ratings.
Heat Keeping thermoplastic pipe
away from sources of heat or using insulation.
Nails Using ferrous pipe, steelsleeves, steel plates or spacepipe away from possible nailpenetration zone.
Seismic Bracing pipe and providingflexible joints at connection
between piping braced to walls or structure andpiping braced to the ceilingand between stories (where
there will be differentialmovements).
Settlement Sleeves or flexible joints. When embedded in concrete,covering with three layers of 15-lb (6.8-kg) felt.
Sunlight Protecting thermoplasticpipe by insulation and
jacket or shading to avoid warping.
Figure 1-9 No-Hub-Outlet Drain Body
Figure 1-10 IPS or Threaded-Outlet Drain Body

8/12/2019 American Society of Plumbing Engineers Volume 2
http://slidepdf.com/reader/full/american-society-of-plumbing-engineers-volume-2 45/233
19Chapter 1— Sanitary Drainage Systems
Vandals Installing pipe above reachor in areas protected by
building construction.Support piping well enoughto withstand 250 lb (113.4kg) hanging on the movingpipe.
Wood shrinkage Providing slip joints andclearance for pipe when
wood shrinks. Approxi-mately s in. (16 mm)/floor is adequate for usual frameconstruction, based on 4%shrinkage perpendicular to
wood grain. Shrinkage alongthe grain does not usually exceed 0.2%.
SOVENT SYSTEMS
The sovent single-stack plumbing system is a sanitary drainage system developed to improveand simplify soil, waste, and vent plumbing inmultistory buildings.
The basic design criteria for sovent drainageplumbing systems for multistory buildings is
based on experience gained in the design andconstruction of sovent systems serving many liv-ing units and on extensive experimental work on a plumbing test tower. The criteria to be used
as guidelines in design work must be obtainedfrom the designer and/or manufacturer of sovent systems.
The sovent system has four parts: a drain, waste, and vent (DWV) stack; a sovent aerator fitting at each floor level; drain, waste, and vent (DWV) horizontal branches; and a sovent deaerator fitting at the base of the stack. Thetwo special fittings, the aerator and deaerator,are the basis for the self-venting features of thesovent system.
The functions of the aerator are (1) to limit
the velocity of both liquid and air in the stack,(2) to prevent the cross section of the stack fromfilling with a plug of water, and (3) to mix effi-ciently the waste flowing in the branches withthe air in the stack. The deaerator fitting sepa-rates the air flow in the stack from the liquid,ensuring smooth entry into the building drainand relieving the positive pressure at the bottomof the stack. The result is a single stack that isself venting with the fittings balancing positive
and negative pressures at or near the zero linethroughout the system. Soil stack and vent com-
bine into a single sovent stack. Figure 1-11illustrates a typical sovent single-stack plumb-ing system.
RESEARCH
The advent and use of ultra-low-flow water clos-ets, and to some extent other water-savingfixtures, has brought into question the loadingon drainage systems and how the reducedamount of water “carries” solids in the system.Still to be confirmed is that the slope of conven-tional drainage piping allows solids to remain insuspension until mixed with other flows in thedrainage system. Further research is requiredto determine the proper slopes of drainage pip-
ing and that the release of water from fixtures isproperly timed to ensure that solids are carriedsufficient distances.
There have been numerous studies, particu-larly in the United Kingdom, of reduced-size
venting. These studies are discussed in moredepth in Chapter 3 of this volume, “ Vents and
Venting Systems.”
REFERENCES
1. Daugherty, Robert L., Joseph B. Franzini, and
E. John Finnemore. 1985. Fluid mechanics withengineering applications. 8th ed. New York:McGraw-Hill.
2. Dawson, F.M., and A.A. Kalinske. 1937. Report on hydraulics and pneumatics of plumbing drain- age systems. State University of Iowa Studies inEngineering, Bulletin no. 10.
3. Wyly and Eaton. 1950. National Bureau of Stan-dards, Housing and Home Finance Agency.

8/12/2019 American Society of Plumbing Engineers Volume 2
http://slidepdf.com/reader/full/american-society-of-plumbing-engineers-volume-2 46/233

8/12/2019 American Society of Plumbing Engineers Volume 2
http://slidepdf.com/reader/full/american-society-of-plumbing-engineers-volume-2 47/233
21Chapter 2— Gray-Water Systems
Gray-Water
Systems2INTRODUCTION
One of the means of conserving water is to re-cycle it. Nonpotable water systems that userecycled water are commonly referred to as “gray-
water systems.”
There is no single definition of gray water. The definitions of a variety of recycled watersare interchangeable. In general, the term “gray
water ” is intended to include appropriately treated water that has been recovered from typi-cal fixtures, such as lavatories, bathtubs,showers, and clothes washers. Waste potentially containing grease, such as that from kitchens
and dishwashers, as well as waste from food dis-posals in kitchens is excluded due to thepossibility of solid articles. Recycled water is in-tended to include “clean” water additionally treated to remove bacteria, heavy metals, andorganic material. “Black water,” on the other hand, is water recovered from plumbing fixturesdischarging human excrement, such as water closets and urinals, and cooling-tower water (be-cause of the chemicals involved in its treatment).Rainwater is another excellent source of water.It can be collected in cisterns for use in a wide
variety of nonpotable uses with little or no treat-
ment. Rainwater in cisterns can also be used for an emergency supply of drinking water if it isappropriately treated prior to use. This chapter is limited to the discussion of gray water only.
Gray-water systems have been used in vari-
ous areas of the world. In many regions, water isa critical resource and extreme measures to op-timize the use of water are sometimes necessary.
Water reuse offers a considerable savings of wa-ter resources, which is appealing in localities
where the underground aquifers are in danger of depletion or where adequate supplies of water are not available. Waste-water management isalso a significant reason for the use of gray-wa-ter systems.
On-site reclamation and recycling of relatively clean, nonpotable water is considered for the fol-lowing reasons:
1. In areas where the code mandates that gray water be used where the availability of po-table water is in short supply or restricted.
2. For projects where public liquid sewagedisposal capacity is either limited or inad-equate.
3. For economic reasons because obtaining po-table water or disposing of liquid waste is
very costly.
4. For economic reasons, where payback willoccur in less than 2 years and where recy-
cling will reduce sewer and water usage fees,resulting in substantial savings in operatingcosts.
Appropriately treated gray water is commonly used for the following proposes:
1. Flushing water for water closets and urinals.
2. Landscape irrigation.
3. Cooling-tower makeup.
Note: This chapter is written primarily to familiarize thereader with the general subject area. It is not intended to beused for system design without reference and adherence toother technical data and local code requirements.

8/12/2019 American Society of Plumbing Engineers Volume 2
http://slidepdf.com/reader/full/american-society-of-plumbing-engineers-volume-2 48/233

8/12/2019 American Society of Plumbing Engineers Volume 2
http://slidepdf.com/reader/full/american-society-of-plumbing-engineers-volume-2 49/233
23Chapter 2— Gray-Water Systems
System Components
The following components are generally used for most systems. Their arrangement and type de-pend on the specific treatment system selected.
1. A separate gray-water collection piping sys-
tem.2. A primary waste-treatment system consist-
ing of turbidity removal, storage, biologicaltreatment, and filtering.
3. Disinfecting systems consisting of ozone, ul-traviolet irradiation, chlorine, or iodine.
4. Treated water storage and system distribu-tion pressure pumps and piping.
DESIGN CRITERIA FOR GRAY- WATER SUPPLY AND CONSUMPTION
It is estimated that q of the waste water dis-charged from a typical household in 1 day is gray
water. The remaining waste water (that is, 3 of
the discharge) is black water from water closets. The discharge from the separate piping systemsupplying the gray-water system should be sized
based on the applicable plumbing code.
The following issues should be considered inthe design of any gray-water system:
1. The design flow is based on the number of people in a facility.
(B)Figure 2-1 Plumbing System Flow Charts:
(A) Conventional Plumbing System; (B) Recycled-Water System.
(A)

8/12/2019 American Society of Plumbing Engineers Volume 2
http://slidepdf.com/reader/full/american-society-of-plumbing-engineers-volume-2 50/233
ASPE Data Book — Volume 224
(A)
(B)
Figure 2-2 Riser Diagrams: (A) Gray-Water Plumbing System; (B) Recycled-Water-WasteSystem with System Treatment Plant (STP).
Notes, Figure 2-2(A) :1. Gray water can also be utilized for other uses, such as irrigation, cooling tower makeup, etc., providedtreatment is adequate. 2. Common vent for both drainage stacks.

8/12/2019 American Society of Plumbing Engineers Volume 2
http://slidepdf.com/reader/full/american-society-of-plumbing-engineers-volume-2 51/233
25Chapter 2— Gray-Water Systems
500-employee office. This demand could be sup-plied in part by the 1 gal/person/day availablefrom the fixtures identified in the gray-water supply section above.
In shopping centers, flow rates are based on
square feet (m2) of space, not the number of per-sons. The flow demand is gallons per day per square foot (0.06 gpd/ft 2 [0.23 L/day/0.1 m2]).
The calculations in food service resemblethose for grease interceptor sizing. The number of seats, the hours of operation, single-servingutensils, and other, similar factors change theequations for gray-water calculations.
Design Estimates for ResidentialBuildings
(a) The number of occupants of each dwelling
unit shall be calculated as follows:
Occupants, first bedroom: 2
Occupants, each additional bedroom: 1
(b) The estimated gray-water flows for each oc-cupant shall be calculated as follows:
Showers, bathtubs, and wash basins:25 gpd (95 L/day)/occupant
Laundry: 15 gpd (57 L/day)/occupant
(c) The total number of occupants shall be mul-tiplied by the applicable estimated gray-water discharge as provided above, and the type of fixtures connected to the gray-water system.
Example 2-1 Single-family dwelling, 3 bedrooms with showers, bathtubs, wash basins, and laun-dry facilities all connected to the gray-water system:
Total number of occupants = 2 + 1 + 1 = 4
Estimated gray-water flow = 4 × (25 + 15) =160 gpd
[4 × (95 + 57) = 608 L/day]
Example 2-2 Single-family dwelling, 4 bedrooms
with only the clothes washer connected to thegray-water system:
Total number of occupants = 2 + 1 + 1 + 1 = 5
Estimated gray-water flow = 5 × 15 = 75 gpd
(5 × 57 = 285 L/day)
2. Lavatory use is estimated at 0.25 gal/use(0.95 L/use).
3. Men use urinals 75% of the time and water closets 25% of the time.
4. The average person uses a toilet 3 times a
day.
Design Estimates for CommercialBuildings
Gray-water supply Estimates of gray-water sup-ply sources vary in commercial buildings. In anoffice building, fixtures such as lavatories, water coolers, mop sinks, and coffee sinks are estimatedto generate 1 gal/day/person (3.79 L/day/per-son). For an office building with 500 employees,
we would expect to be able to recover 500 gal/day (1823 L/day) for gray-water reuse. Based on
5 working days/week and 50 weeks/year annualuse, 125,000 gal/yr (473 175 L/yr) could be avail-able for gray-water reuse.
Gray-water demand The gray-water demand for an office building is estimated based on 3 toilet or urinal uses/day/person. For calculation pur-poses, assume the population is 50% male and50% female, and that men use urinals 75% of the time and water closets 25% of the time. For an office building with 500 employees, we wouldestimate the gray-water demand as follows:
250 males × 3 flushes/day × 0.5 gal/flush
(urinals ) × 75% usage = 281 gal/day
250 males × 3 flushes/day × 1.6 gal/flush(water closets ) × 25% usage = 300 gal/day
250 women × 3 flushes/day × 1.6 gal/flush(water closets) = 1200 gal/day
TOTAL gray-water demand = 1781gal/day =approx. 445,250 gal/yr
[250 males × 3 flushes/day × 1.89 L/flush(urinals ) × 75% usage = 1063 L/day
250 males × 3 flushes/day × 6.06 L/flush (wa-
ter closets ) × 25% usage = 1136 L/day 250 women × 3 flushes/day × 6.06 L/flush(water closets) = 4545 L/day
TOTAL gray-water demand = 6744 L/day =approx. 1 686 000 L/yr]
This example shows that approximately 3.6gal/person/day (13.5 L/person/day) is neededto supply gray water to toilets and urinals for a
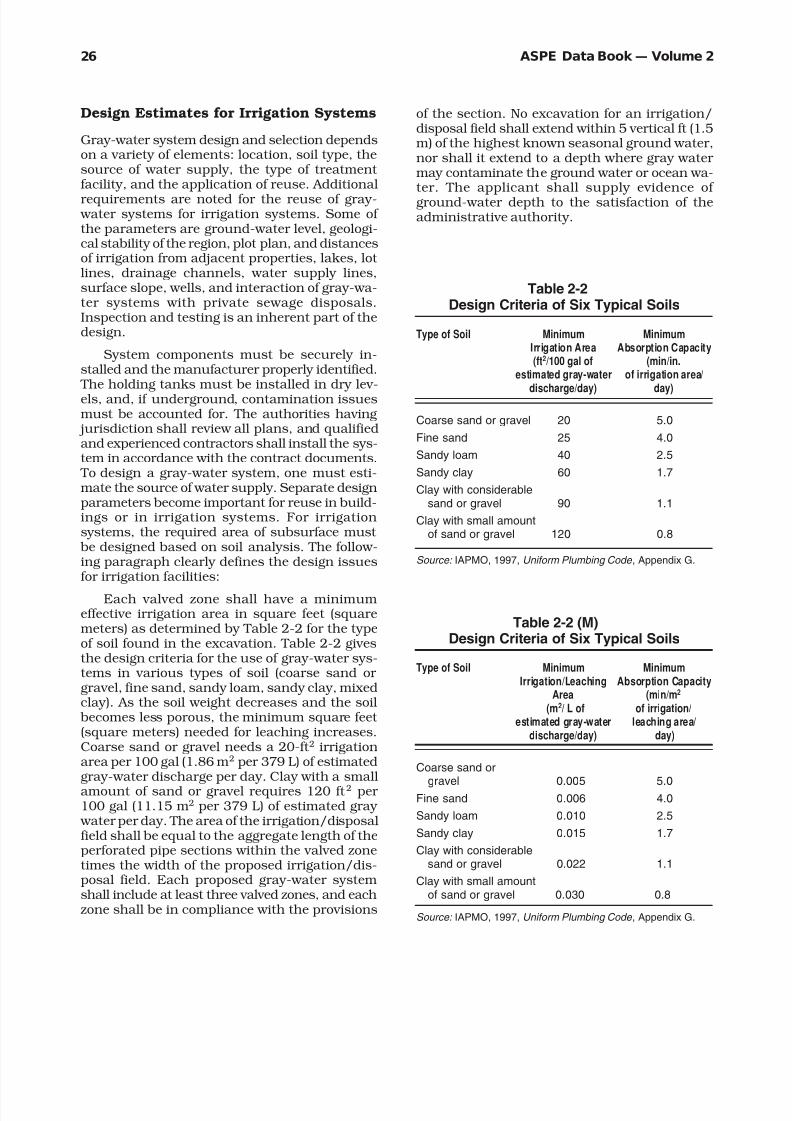
8/12/2019 American Society of Plumbing Engineers Volume 2
http://slidepdf.com/reader/full/american-society-of-plumbing-engineers-volume-2 52/233
ASPE Data Book — Volume 226
Design Estimates for Irrigation Systems
Gray-water system design and selection dependson a variety of elements: location, soil type, thesource of water supply, the type of treatment facility, and the application of reuse. Additional
requirements are noted for the reuse of gray- water systems for irrigation systems. Some of the parameters are ground-water level, geologi-cal stability of the region, plot plan, and distancesof irrigation from adjacent properties, lakes, lot lines, drainage channels, water supply lines,surface slope, wells, and interaction of gray-wa-ter systems with private sewage disposals.Inspection and testing is an inherent part of thedesign.
System components must be securely in-stalled and the manufacturer properly identified.
The holding tanks must be installed in dry lev-els, and, if underground, contamination issuesmust be accounted for. The authorities having
jurisdiction shall review all plans, and qualifiedand experienced contractors shall install the sys-tem in accordance with the contract documents.
To design a gray-water system, one must esti-mate the source of water supply. Separate designparameters become important for reuse in build-ings or in irrigation systems. For irrigationsystems, the required area of subsurface must
be designed based on soil analysis. The follow-ing paragraph clearly defines the design issuesfor irrigation facilities:
Each valved zone shall have a minimumeffective irrigation area in square feet (squaremeters) as determined by Table 2-2 for the typeof soil found in the excavation. Table 2-2 givesthe design criteria for the use of gray-water sys-tems in various types of soil (coarse sand or gravel, fine sand, sandy loam, sandy clay, mixedclay). As the soil weight decreases and the soil
becomes less porous, the minimum square feet (square meters) needed for leaching increases.Coarse sand or gravel needs a 20-ft 2 irrigationarea per 100 gal (1.86 m2 per 379 L) of estimatedgray-water discharge per day. Clay with a smallamount of sand or gravel requires 120 ft 2 per 100 gal (11.15 m2 per 379 L) of estimated gray
water per day. The area of the irrigation/disposalfield shall be equal to the aggregate length of theperforated pipe sections within the valved zonetimes the width of the proposed irrigation/dis-posal field. Each proposed gray-water systemshall include at least three valved zones, and eachzone shall be in compliance with the provisions
of the section. No excavation for an irrigation/disposal field shall extend within 5 vertical ft (1.5m) of the highest known seasonal ground water,nor shall it extend to a depth where gray water may contaminate the ground water or ocean wa-ter. The applicant shall supply evidence of ground-water depth to the satisfaction of theadministrative authority.
Table 2-2Design Criteria of Six Typical Soils
Type of Soil Minimum MinimumIrrigation Area Absorption Capacity(ft2/100 gal of (min/in.
estimated gray-water of irrigation area/
discharge/day) day)
Coarse sand or gravel 20 5.0
Fine sand 25 4.0
Sandy loam 40 2.5
Sandy clay 60 1.7
Clay with considerablesand or gravel 90 1.1
Clay with small amountof sand or gravel 120 0.8
Source: IAPMO, 1997, Uniform Plumbing Code , Appendix G.
Table 2-2 (M)Design Criteria of Six Typical Soils
Type of Soil Minimum MinimumIrrigation/Leaching Absorption Capacity
Area (min/m2
(m2/ L of of irrigation/estimated gray-water leaching area/
discharge/day) day)
Coarse sand or
gravel 0.005 5.0Fine sand 0.006 4.0
Sandy loam 0.010 2.5
Sandy clay 0.015 1.7
Clay with considerablesand or gravel 0.022 1.1
Clay with small amountof sand or gravel 0.030 0.8
Source: IAPMO, 1997, Uniform Plumbing Code , Appendix G.

8/12/2019 American Society of Plumbing Engineers Volume 2
http://slidepdf.com/reader/full/american-society-of-plumbing-engineers-volume-2 53/233
27Chapter 2— Gray-Water Systems
Table 2-3 identifies the location and separa-tion distances from a variety of structures andenvironments. For example, any building or structure shall be a minimum of 5 ft (1.5 m) froma gray-water surge tank. The minimum distancefrom any property lines to a gray-water surgetank is 5 ft (1.5 m). Critical areas such asstreams, lakes, seepage pits, or cesspools shall
be a minimum of 50 ft (15.2 m) from surge tanksand 100 ft (30.5 m) from irrigation fields. Simi-larly, the distance from the public water main toa surge tank shall be a minimum of 10 ft (3.1m). The table also identifies additional restric-tions.
See Table 2-4 for the design of the gray-wa-ter distribution in subsurface drip systems for
various types of soil. This table gives the mini-mum discharge, in gallons/day, for effectiveirrigation distribution. “Emitters” are defined asorifices with a minimum flow path of 120 microns(µ) and shall have a tolerance of manufacturing
variation equal to no more than 7%.
TREATMENT SYSTEMS
Treatment systems vary widely. The treatment system conditions the recovered water to a de-gree consistent with both the intended use of the conditioned water and the design require-ments of the design engineer, the applicable code,or the responsible code official — whichever is themost stringent. Typical waste-water (gray-water and black-water) treatments used for varioustypes of project are depicted in Figure 2-3. Thesize of the treatment systems available vary fromthose installed for individual private dwellingsto those serving multiple facilities. As the treat-ment facility becomes more complex, the number of treatment activities increases and the quality
of the water improves. Some of the treatment activities are basic screening, flow equalization,
biological treatment, filtration, coagulation, sedi-mentation, disinfections, reclaimed water tank,membrane filtration, and activated carbonfiltration.
The selection of a treatment system alsodepends on the quality and type of the influent
water. To decide which is the most appropriatetreatment, the kinds of fixture discharge to beused for reclaiming and the treatment require-ments of the authorities must be determined.
Table 2-5 describes the types of filtration and water-treatment processes most commonly usedin the gray-water treatment process. Dependingon the types of filtration, the degree and types of components filtered vary. Basic filtration con-centrates on reducing suspended solids and doesnot absorb nitrogen or phosphates. Coagulationassists in building up the solid filtration and addsphosphates to the list. Chlorination is signifi-
Table 2-3Location of the Gray-Water System
Element Minimum Horizontal Distance from
IrrigationHolding Tank, Disposal Field,
ft (mm) ft (mm)
Buildings or structures 5.2 (1524) 2.3 (610)Property line adjoining
private property 5 (1524) 5 (1524)
Water supply wells 50 (15 240) 100 (30 480)
Streams and lakes 50 (15 240) 50.5 (15 240)
Seepage pits or cesspools 5 (1524) 5 (1524)
Disposal field and 100%expansion area 5 (1524) 4.6 (1219)
Septic tank 0 (0) 5 (1524)
On-site domestic waterservice line 5 (1524) 5 (1524)
Pressurized publicwater main 10 (3048) 10.7 (3048)
Table 2-4Subsurface Drip Design Criteria
of Six Typical Soils
Type of Soil Minimum Minimum NumberEmitter of Emitters per
Discharge, gal/day (L/day)gal/day of Gray-Water(L/day) Production
Sand 1.8 (6.8) 0.6
Sandy loam 1.4 (5.3) 0.7
Loam 1.2 (4.5) 0.9
Clay loam 0.9 (3.4) 1.1
Silty clay 0.6 (2.3) 1.6
Clay 0.5 (1.9) 2

8/12/2019 American Society of Plumbing Engineers Volume 2
http://slidepdf.com/reader/full/american-society-of-plumbing-engineers-volume-2 54/233
ASPE Data Book — Volume 228
Table 2-5 Gray-Water Treatment Processes for Normal Process Efficiency
Biological Chemical TotalSuspended Oxygen Oxygen Phosphates, Dissolved
Process Solids Demand Demand P0-4 Nitrogen Solids
Filtration 80 40 35 0 0 0
Coagulation / filtration 90 50 40 85 0 15
Chlorination 0 20a 20a 0 0 0
Tertiary treatment 95 95 910 15-60 50-70 80
Absorphan (carbon filtration) 0 60-80 70 0 10 5
a Nominal, additional removals possible with super chlorination and extended contact time.
(A)
(B)
Figure 2-3 Water Treatment Systems:(A) Types of Gray-Water Treatment System; (B) Types of Black-Water Treatment System

8/12/2019 American Society of Plumbing Engineers Volume 2
http://slidepdf.com/reader/full/american-society-of-plumbing-engineers-volume-2 55/233
29Chapter 2— Gray-Water Systems
cant only on oxygen demand issues. Tertiary treatment includes filtration of all categories.
Absorphan, or carbon filtration, concentratesprimarily on biological and chemical oxygendemands.
Table 2-6 shows the design elements of gray- water system treatments. In the type A treatment,separate gray-water riser piping and water-closet piping is required. This type of treatment con-sists of filtration, chlorination, and color modifications. The system re-feeds the water clos-ets. The enhanced version of the type A treatment adds color as well as chemical treatments. If the
water source contains high percentages of soapsor foaming agents, the addition of defoamingagents is highly recommended. Increased condi-tioning of the water will increase the use of the
water for other applications, such as cooling tow-
ers. Type B treatments give the complete tertiary treatment of the water and permit the use of water for a wide variety of reuse applications. The biological and chemical oxygen treatmentsare mandatory for the high concentrations of fe-cal matter. The addition of chemical treatment,filtration, and/or carbon absorption conditionsthe water for a wide variety of applications. Treat-ment quality also must take into account thechemical compound of the water required for usein piping, cooling towers, industrial applications,
and plant life to prevent scaling of pipes and foul-ing of valves or equipment.
ECONOMIC ANALYSIS— AN EXAMPLE
Table 2-7 gives the life cycle economic compari-son of a gray-water system for a 250-room resort hotel. The cost of the conventional system is
based on water and sewer annual consumption. The minimum gray-water system, Type A treat-ment facility, would have an initial fixedestimated cost of $87,500.00. This cost amor-tized over 15 years with 12% interest will result in an annual cost for payment of the initial capi-tal cost. This annual cost, plus the water andsewer cost, plus the treatment equipment main-tenance cost is near the annual cost for the hotel
management. With maximum gray-water treat-ment, Type B, the total annual cost does not decrease very much. In fact, statistically they are nearly the same. Given this data, the only reasons to provide gray water in facilities are gov-ernmental or institutional incentives. In addition,the cost of sewage as well as the cost of water consumption may become the decisive factors.
Any increase in the cost of sewage or water,caused perhaps by a drought in a region, canalter the life-cycle economics.
Table 2-6 Comparison of Gray-Water System Applications
Potential SewageSystem Piping Treatment Gray-Water Uses Water Savingsa Savingsa
Conventional Base None N/A 0 0
Type A Separate Filtration, Water closets 20,000 gal/day 20,000 gal/day (minimal gray-water chlorination, (75 708 L/day) (75 708 L/day)
treatment) riser/separate color 17% (inc. irrigation), 26%WC stack 22% (without
irrigation)
Type A Separate Chemical Water closets, 35,000 gal/day, 35,000 gal/day (enhanced gray-water filtration, cooling towers, (132 489 L/day) (132 489 L/day)
treatment) riser/separate chlorination, irrigation (pos.) 30% (incl. irrigation), 46%WC stack color 38% (without
irrigation)
Type B Separate Tertiary All nonpotable 61,000 gal/day, N/Agray-water riser sewage uses (230 909 L/day)
treatment 52% (incl. irrigation)
a Values for savings noted are based on the 250-room resort hotel example. Percentages based on normal usage of 117,850 gal/day,Including irrigation, and 91,150 gal/day, without irrigation.

8/12/2019 American Society of Plumbing Engineers Volume 2
http://slidepdf.com/reader/full/american-society-of-plumbing-engineers-volume-2 56/233
ASPE Data Book — Volume 230
Figure 2-4 System Design Flow Chart Example (250-Room Hotel):(A) Conventional Plumbing System; (B) Recycling for Water Closets; (C) Recycling for Water
Closets and Cooling Tower; (D) Recycling for Water Closets, Cooling Tower, and Irrigation
(A)
(B)
(C)
(D)

8/12/2019 American Society of Plumbing Engineers Volume 2
http://slidepdf.com/reader/full/american-society-of-plumbing-engineers-volume-2 57/233
31Chapter 2— Gray-Water Systems
The complete water flow chart of the 250-room hotel is shown in Figure 2-4. As depictedin Table 2-6, the water-flow-rate savings areclearly defined.
Before one considers using a gray-water sys-tem, it is desirable to be able to evaluate quickly,on a preliminary basis, the potential economicfeasibility of the proposed scheme. To facilitatethis, a nomograph such as that shown in Figure2-5 can be used. This analysis shows the varia-tion in interest rates, variation in cost of
combined water and sewage, the water daily use,and cost of total systems based on two types of treatments, A and B. Movement through thechart from an interest rate (based on the cur-rent economy) to the combined cost of sewageand water (based on municipalities) to the water consumption (based on building occupancy) andto the type of treatment facility (based on thepurity required) can provide an approximate cost for a gray-water system.
To use the nomograph, proceed as follows:
1. Enter the lower right portion of the nomo-graph with the anticipated total potable water consumption for all users (based on a con-
ventional system).
2. Move vertically up to the combined utility cost for water purchase and sanitary sewagecharges (e.g., $1.25/1000 gal [3785 L] for wa-ter, and $0.75/1000 gal [3785 L] for sewage).
3. Move horizontally to the left to form baseline X.
4. Enter the upper right portion of the nomo-graph with the estimated additional cost of the gray-water system (additional piping,storage, and treatment equipment).
5. Move vertically down to the annual interest rate (cost of money) used in the analysis.
6. Move horizontally to the left to form baseline Y.
7. If the proposed system is a Type A gray-wa-ter system, go to the intersection of baseline
X and the system A curve (lower left quad-rant) of the nomograph.
8. If a Type B gray-water system is being stud-ied, go to the intersection of baseline X andthe system B curve.
9. From the appropriate intersection, move ver-tically up to the horizontal separation line
and then up and left at the indicated 45°angle to an intersection with baseline Y.
10. From this intersection point, move vertically down once again to the intersection with
baseline X.
11. If this final (circled) intersection is in the lower right field, the system appears preliminarily feasible and should be subjected to a moredetailed economic analysis.
12. If the final intersection falls to the left andabove the sector dividing line, then the eco-nomic feasibility of the scheme is strongly
suspect.Note: Obviously, the many variable inputs that must be considered in a detailed economic analysis do not lend themselves to an easy-to-use nomograph. Many of these inputs have been simplified by making normal assumptions about such things as ratios of reuse, relative quantities of water consumption, and sewage discharge. Thus, while the nomograph does give a quick and relatively good indication of feasibility, it does not replace a detailed economic evaluation. This is particularly true if the scheme under consideration has anticipated hydraulic flow patterns that differ markedly from the relative uses outlined in Figure 2-5.
Table 2-7 Life-Cycle Economic Comparison:Gray-Water Systems for 250-Room Hotel
Installed System
Type A Type B
(MinimalConventional Gray (Gray
System Water) Water)
Fixed Cost 0.000 $87,500 $259,000
Life 20 yr 15 yr 15 yr(Base system)
Cost of money 12% 12% 12%
Capital recoveryfactor N/A 0.1468.2 0.14682
Amortized first cost 0 $12,846 $38,026
Utility costs 0 0 0Water ($1.40/
1000 gal $59,395 $49,315 $28,299[3785 L])
Sewage ($0.50/ 1000 gal $13,706 $10,106 0[3785 L])
Operational cost 0 0 0
Treatmentequipment 0 $1,240 $6,305
Total Annual Cost $73,101 $73,507 $72,630

8/12/2019 American Society of Plumbing Engineers Volume 2
http://slidepdf.com/reader/full/american-society-of-plumbing-engineers-volume-2 58/233
ASPE Data Book — Volume 232
As a region’s population grows, the utiliza-tion of limited water supplies becomes morecritical, and the need for conservation becomesmore obvious, evidenced by regulation, a changein the types of plumbing fixtures, public educa-tion and voluntary participation, or an increasein water and sewage system charges. In addi-tion, the economic capabilities of a municipality determine its capability for adding sewage-treat-ment facilities and meeting the demands of thecommunity.
PRECAUTIONS
Since gray water poses a potential health haz-ard, a great deal of care must be exercised oncesuch a system is installed. One of the greatest dangers is the possibility that the gray water will
be inadvertently connected to the potable-water system. To avoid this possibility, the water itself and the piping must be made easily distinguish-able, anti-cross-connection precautions must betaken, and appropriate alarms must be installed.
Figure 2-5 Nomograph for Overview of Preliminary Feasibility of Gray-Water Systems

8/12/2019 American Society of Plumbing Engineers Volume 2
http://slidepdf.com/reader/full/american-society-of-plumbing-engineers-volume-2 59/233
33Chapter 2— Gray-Water Systems
Treated water could be colored by food dyethat is biodegradable. Fixtures could be bought in the color of the water if the water color will befound objectionable.
The piping system itself must be clearly iden-
tified with labels placed visibly along the run of the pipe. If possible, the piping material should bedifferent so that the possibility of mistaking andinterconnecting the two systems will be unlikely.
The most important consideration is the edu-cation of individuals and the staff of a facility
with a gray-water system. An explanation of thedangers and proper operating instructions willensure that an informed staff will operate andmaintain the system in a correct manner.
PUBLIC CONCERNS/ACCEPTANCE
Although gray-water systems have been approvedfor general use in different parts of the worldand have been designed in a variety of forms, it is still unfamiliar to many city and county gov-ernments, plumbing and facility engineers, andthe general public. An exception is the Baha-mas, where the local code mandates dual or gray-water systems in all occupancies.
Although the use of gray water is a provencost-effective alternative to the use of potable
water in various systems, there is reluctance onthe part of authorities to approve it. Some rea-sons include:
1. There is no generally accepted standard for the quality of recycled water. Several statesin the US, Japan, and the Caribbean haveadopted codes and guidelines, but for most of the world there is no standard. This hasresulted in rejection of the systems or longdelays during the approval process of projects
while the quality of the water is in question.
2. Regulatory and plumbing codes that do not have any specific restrictions against usinggray water or have ambiguous language that
could be interpreted for its use but whoseofficials impose special standards due to their lack of experience.
Although the use of gray water is ideal incertain circumstances, the success of gray wa-ter will depend solely on public acceptance, andthat will require an adequate educational effort.
The use of colored water in water closets may
not be attractive to the occupants of a newly oc-cupied high-rise. Educating the users of gray
water is imperative. An understanding of thesource and the associated dangers and limita-tions of gray water is essential to acceptance by the general public. To draw a parallel, the gen-eral public is now fully aware of the dangers of electricity, yet life without electricity is consid-ered to be abnormal.
An economic analysis of gray-water systemsin health-care facilities may favor dual plumb-ing systems. However, the presence of viruses,
bacteria, and biological contamination in health-care gray-water systems (through lavatories,
bathtubs, showers, and sinks) may increase thecost of water treatment. Also there is a legiti-mate concern regarding the spread of diseasethrough such gray-water systems that must not
be overlooked. Therefore, the application of gray- water systems in health-care facilities may be a less attractive option because of the possibility of biological contamination.
CONCLUSION
This Data Book chapter began with the definitionof gray water and ended with a discussion of itspublic acceptance. It touched briefly on the de-sign elements of the plumbing system andidentified the variations among different facilities.
The economic analysis of the gray-water system
can become the decisive issue that determines whether a gray-water system is even consideredfor a project. This analysis can be extrapolatedfor any other projects and variations.
For the full design of gray-water systems, thereader should refer to other technical data books.
Water treatment is one of the backbones of thegray-water system. For the water-flow calcula-tions with all the required pumps, piping, andcontrols, the reader is referred to the ASPEManual on Gray Water (forthcoming).
Finally, water shortages, government subsi-
dies, tax incentives, the facility limitations of localgovernments, and population growth will be theprimary motivators for designers and project engineers to consider gray-water system selec-tions in their designs.
8/12/2019 American Society of Plumbing Engineers Volume 2
http://slidepdf.com/reader/full/american-society-of-plumbing-engineers-volume-2 60/233
ASPE Data Book — Volume 234
REFERENCES
1. Atienze, J., and J. Craytor. 1995. Plumbing effi-ciency through gray-water recycling. Consulting Specifying Engineer . (March): 58.
2. Baltimore, MD, Dept. of Public Works. June
1966. Commercial water use research project, by J. B. Wolf, F. P. Linaweaver, and J.C. Center.
3. Dumfries Triangle and Occoquan-WoodbridgeSanitary District, Woodbridge, VA. Water uses study , by G. D. Gray and J. J. Woodcock.
4. International Association of Plumbing and Me-chanical Officials (IAPMO). 1998. California plumbing code . Walnut, CA.
5. IAPMO. 1997. Uniform plumbing code.
6. Konen, Thomas P. 1986. Water use in office buildings. Plumbing Engineer Magazine. July/Au-gust.
7. Lehr, Valentine A. 1987. Gray-water systems.Heating/Piping/Air Conditioning . January.
8. n.a. 1997. Water: Use of treated sewage on risein state. Los Angeles Times , August 17: A36.
9. Siegrist, R., and W. C. Boyle. 1976. Characteris-tics of rural household waste water. Journal of the Environmental Engineering Division , (June):533.
10. US Dept. of Commerce, National Information Ser- vices. 1978. Management of small waste flows , by Wisconsin University, PB-286-560.
11. US General Services Administration. 1995. Wa-ter management: A comprehensive approach for
facility managers.

8/12/2019 American Society of Plumbing Engineers Volume 2
http://slidepdf.com/reader/full/american-society-of-plumbing-engineers-volume-2 61/233
35Chapter 3— Vents and Venting
Vents and
Venting3 Venting systems are often the least understood
of the basic plumbing design concepts. The com-plete venting of a building drainage system is a very complicated subject, as can be seen fromthe great variety of venting systems that may beinvolved. It is not feasible to cover all the vent-ing variations in this chapter. However, to foster understanding, the preparation of venting tablesfor stacks and for horizontal branches for vari-ous venting systems is discussed.
Owing to the fact that the conditions that tend to produce pneumatic pressures in the vent-ing system that exceed or are below atmosphericpressure by considerable amounts vary so greatly
from case to case, and since the building drainmay be wholly or partly submerged — or not sub-merged at all — where it enters the street sewer,it is not feasible to lay down rules that will apply to the venting of all designs.
SECTION I — VENTS AND VENTING
Purposes of Venting
Vent systems are installed to eliminate trap si-
phonage, reduce back pressure and vacuumsurges, promote the rapid and silent flow of wastes, and ventilate the sewer. Trap siphonagereduces or eliminates the trap seal and leads toan insanitary and hazardous condition. Pressureand vacuum surges cause objectionable move-ments of the water in the highly visible water closet traps as well as affect the trap seals in allfixtures. Excessive pressure causes bubbles of sewer gas to flow through traps. Unvented traps
lead to gurgling noises and sluggish waste flow.
Sewer ventilation is required by some local au-thorities to promote flow in the sewer and toreduce the concentration of dangerous and cor-rosive gases.
Vent Stack Terminal
A “ vent stack terminal” is the part of the ventingsystem that extends through the roof, thus keep-ing the drainage system open to atmosphericpressure. Though it may be small by compari-son to the overall sanitary drainage piping, the
vent stack terminal is an important portion of
the system. Through the terminal vent, air at atmospheric pressure enters the drainage sys-tem to hold in balance the water seal containedin each fixture trap. The balance of atmosphericair pressure and gravitational pull on the waste-
water mass follows the principles outlined inChapter 1 of this volume, “Sanitary DrainageSystems.” Vent stack terminals need to be sizedin accordance with local codes and/or good en-gineering practices.
Good engineering practices include the fol-lowing:
1. Increase the terminal pipe by two sizes at 18in. (455 mm) below the roof line. This allowsfor the interior building space (which is usu-ally warmer) to provide a convecting flow of interior building heat, keeping the vent ter-minal at the roof from freezing closed.
2. Project the vent terminal in accordance with jurisdictional building codes and in a distant relationship from air intake louvers, windows,doors, and other roof openings, 10 ft (3 m)
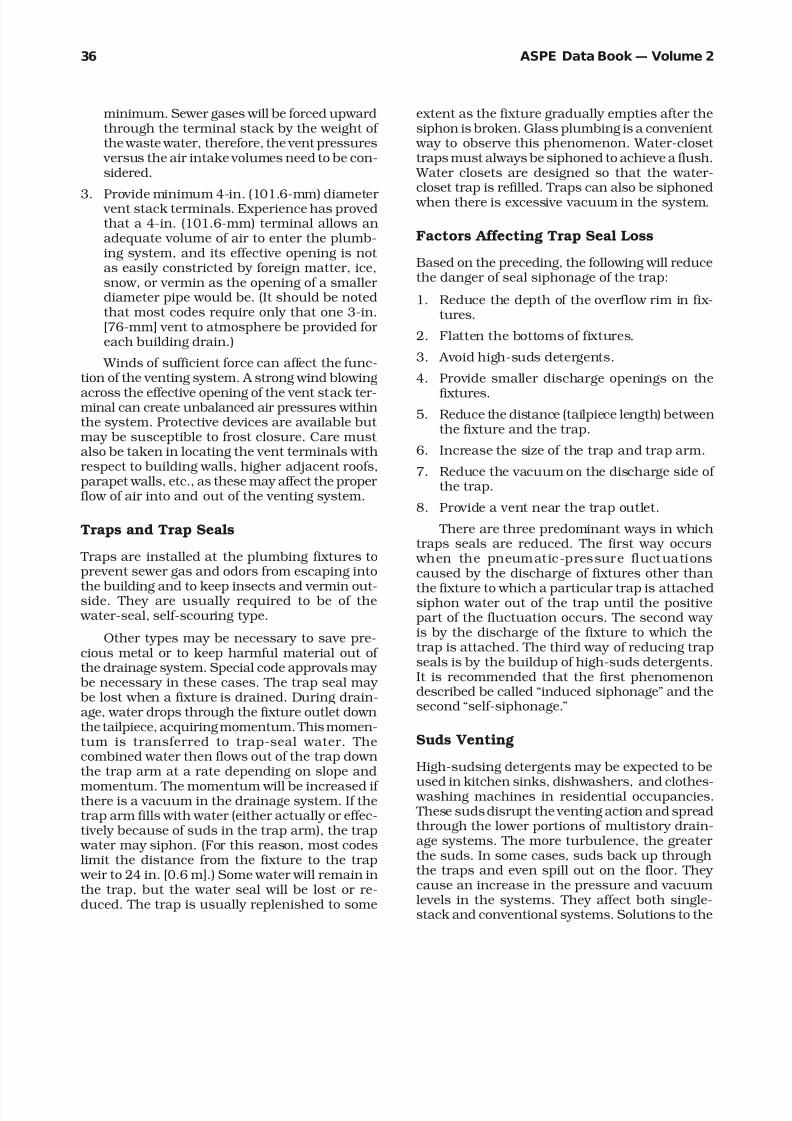
8/12/2019 American Society of Plumbing Engineers Volume 2
http://slidepdf.com/reader/full/american-society-of-plumbing-engineers-volume-2 62/233
ASPE Data Book — Volume 236
minimum. Sewer gases will be forced upwardthrough the terminal stack by the weight of the waste water, therefore, the vent pressures
versus the air intake volumes need to be con-sidered.
3. Provide minimum 4-in. (101.6-mm) diameter vent stack terminals. Experience has provedthat a 4-in. (101.6-mm) terminal allows anadequate volume of air to enter the plumb-ing system, and its effective opening is not as easily constricted by foreign matter, ice,snow, or vermin as the opening of a smaller diameter pipe would be. (It should be notedthat most codes require only that one 3-in.[76-mm] vent to atmosphere be provided for each building drain.)
Winds of sufficient force can affect the func-tion of the venting system. A strong wind blowing
across the effective opening of the vent stack ter-minal can create unbalanced air pressures withinthe system. Protective devices are available but may be susceptible to frost closure. Care must also be taken in locating the vent terminals withrespect to building walls, higher adjacent roofs,parapet walls, etc., as these may affect the proper flow of air into and out of the venting system.
Traps and Trap Seals
Traps are installed at the plumbing fixtures toprevent sewer gas and odors from escaping into
the building and to keep insects and vermin out-side. They are usually required to be of the water-seal, self-scouring type.
Other types may be necessary to save pre-cious metal or to keep harmful material out of the drainage system. Special code approvals may
be necessary in these cases. The trap seal may be lost when a fixture is drained. During drain-age, water drops through the fixture outlet downthe tailpiece, acquiring momentum. This momen-tum is transferred to trap-seal water. Thecombined water then flows out of the trap downthe trap arm at a rate depending on slope and
momentum. The momentum will be increased if there is a vacuum in the drainage system. If thetrap arm fills with water (either actually or effec-tively because of suds in the trap arm), the trap
water may siphon. (For this reason, most codeslimit the distance from the fixture to the trap
weir to 24 in. [0.6 m].) Some water will remain inthe trap, but the water seal will be lost or re-duced. The trap is usually replenished to some
extent as the fixture gradually empties after thesiphon is broken. Glass plumbing is a convenient
way to observe this phenomenon. Water-closet traps must always be siphoned to achieve a flush.
Water closets are designed so that the water-closet trap is refilled. Traps can also be siphoned
when there is excessive vacuum in the system.
Factors Affecting Trap Seal Loss
Based on the preceding, the following will reducethe danger of seal siphonage of the trap:
1. Reduce the depth of the overflow rim in fix-tures.
2. Flatten the bottoms of fixtures.
3. Avoid high-suds detergents.
4. Provide smaller discharge openings on the
fixtures.5. Reduce the distance (tailpiece length) between
the fixture and the trap.
6. Increase the size of the trap and trap arm.
7. Reduce the vacuum on the discharge side of the trap.
8. Provide a vent near the trap outlet.
There are three predominant ways in whichtraps seals are reduced. The first way occurs
when the pneumatic-pressure fluctuationscaused by the discharge of fixtures other than
the fixture to which a particular trap is attachedsiphon water out of the trap until the positivepart of the fluctuation occurs. The second way is by the discharge of the fixture to which thetrap is attached. The third way of reducing trapseals is by the buildup of high-suds detergents.It is recommended that the first phenomenondescribed be called “induced siphonage” and thesecond “self-siphonage.”
Suds Venting
High-sudsing detergents may be expected to be
used in kitchen sinks, dishwashers, and clothes- washing machines in residential occupancies. These suds disrupt the venting action and spreadthrough the lower portions of multistory drain-age systems. The more turbulence, the greater the suds. In some cases, suds back up throughthe traps and even spill out on the floor. They cause an increase in the pressure and vacuumlevels in the systems. They affect both single-stack and conventional systems. Solutions to the

8/12/2019 American Society of Plumbing Engineers Volume 2
http://slidepdf.com/reader/full/american-society-of-plumbing-engineers-volume-2 63/233

8/12/2019 American Society of Plumbing Engineers Volume 2
http://slidepdf.com/reader/full/american-society-of-plumbing-engineers-volume-2 64/233
ASPE Data Book — Volume 238
coincidental formation of a vortex which allowsair to be sucked down into the drain. Air that isdrawn through the fixture passes down the drainin the form of bubbles that are dragged alongthe highest element of the drain. If there isenough air traveling with the water, when theflow from the fixture falls off, the bubbles enablethe water to break loose from the upper element of the drain, so that the piston effect of water
that would otherwise occur is often prevented. If the slug of water continues to fill the cross sec-tion as the flow decreases, it moves downstreamslowly, creating a reduced pressure behind it that sucks the water out of the trap just as happens
when the reduced pressure is due to inducedsiphonage.
Only a limited amount of data on the self-siphonage of plumbing-fixture traps have been
Figure 3-1 Suds-Pressure-Zone Diagram
published. Tests of the siphonage of fixture traps were made as early as 1880, but no record of investigations of self-siphonage at such an early date has been found. Perhaps the most system-atic investigation of the subject was made by
John L. French and Herbert N. Eaton. A full-scale test was conducted by them to determinethe factors that affect self-siphonage and, moreparticularly, to establish limits on drain lengths,
slopes, diameters, and other pertinent variablesthat would ensure that excessive trap-seal lossesdue to self-siphonage would not occur.
Based on these early research results, lengthsof nominally sized, horizontal, unvented wastepipes believed to be safe against self-siphonagehave been established. For example, the Uniform Plumbing Code has a section on the maximumlength of the trap arm stating as follows:

8/12/2019 American Society of Plumbing Engineers Volume 2
http://slidepdf.com/reader/full/american-society-of-plumbing-engineers-volume-2 65/233
39Chapter 3— Vents and Venting
“Each fixture trap shall have a protecting vent so located that the developed length of the traparm from the trap weir to the inner edge of the
vent shall be within the distance given in Table3-2, but in no case less than two (2) times thediameter of the trap arm.”
Table 3-2 Maximum Length of Trap Arm
Diameter of Distance—Trap Arm, in. (mm) Trap to Vent, ft (m)
1¼ (32) 2½ (0.76)
1½ (38) 3½ (1.1)
2 (51) 5 (1.5)
3 (76) 6 (1.8)
4 (101) 10 (3.0)
Figure 3-2 Suds Venting/Suds Pressure Zones
It should be noted that the International Plumbing Code requirements differ significantly from these. They are set forth as follows:
“Each fixture trap shall have a protecting vent located so that the slope and the developed lengthin the fixture drain from the trap weir to the vent fitting are within the requirements set forth in
Table 3-3.”
Venting as a Means of Reducing TrapSeal Losses from Induced Siphonage
Spent water and other wastes from plumbing fix-tures enter vertical stacks through branch drains
where the flow is described as separated flow. The waste water travels along the lower portionof the drain allowing the free movement of air inthe upper portion of the conduit. Shortly after

8/12/2019 American Society of Plumbing Engineers Volume 2
http://slidepdf.com/reader/full/american-society-of-plumbing-engineers-volume-2 66/233
ASPE Data Book — Volume 240
entering the stack, the waste water attaches it-self to the walls of the vertical pipe forming anannular flow. The falling water drags with it air that in a conventional plumbing drainage sys-tem is removed through the extensive network of vents in addition to the building drain.
The capacity of a given design is governed by the system’s ability to manage the incoming air in such a way that the pressure excursions, posi-tive and negative, will be within certainacceptable limits. Positive pressures are high andoften the cause of failure in systems with com-plex building drains. The main vent stack is
designed to remove the expected air with a pres-sure loss less than 1 in. (25.4 mm) of water column. In tall buildings, the falling water de-
velops large negative pressures, which causefailures by siphoning the water from traps.
Design of Vents to Control InducedSiphonage
In most plumbing codes a loading table for ventsis provided. The purpose of such a table is to givethe information necessary to design the vent stack for the delivery of the amount of air required for
the control of pneumatic pressures at criticalpoints in the drainage system within limits of ±1in. (25.4 mm) of water column from atmosphericpressure. If this range of pressure can be main-tained, the effects of pneumatic-pressurefluctuations on the fixture-trap seals will be neg-ligible. The dimensions of pipes required to deliver given quantities of air at a pressure drop of 1 in.(25.4 mm) of water column can be computed fromthe Darcy-Weisbach Formula combined with the
conventional formula for expressing losses other than those associated with flow in long, straight pipes. This can be expressed as:
Equation 3-1
hf = fLV2
D2g
where
hf = Head loss due to friction, ft (m) of air column
f = Coefficient of friction correspondingto the roughness of the pipe surfaceand the diameter of the pipe
L = Length of piping, ft (m)
V = Velocity of flow, fps (m/s)
D = Diameter of piping, ft (m)
g = Gravitational acceleration, 32.2 ft/s2 (9.8 m/s2)
The maximum permissible length of vent pip-ing is expressed as:
Equation 3-2
L =hfd
5
(0.03109)fq2
where
L = Length of piping, ft (m)
hf = Head loss due to friction, ft (m) of fluid column
d = Diameter of piping, in. (mm)
f = Coefficient of friction correspondingto the roughness of the pipe surfaceand the diameter of the pipe
q = Quantity rate of flow, gpm (L/s)
Drainage Fixture Units
The selection of the size and length of vent pip-ing requires design or installation information
about the size of the soil and/or waste stack andthe fixture unit (derived from the supply systemdesign) loads connected to the stack. Total fix-ture units connected to the stack can becomputed in accordance with Table 3-4. Fixtureunits are really weighting factors that effectively convert the various types of fixture, having dif-ferent probabilities of use, to equivalent numbersof an arbitrarily chosen type of fixture with a single probability of use. In other words, the fix-
Table 3-3 Maximum Distance ofFixture Trap from Vent
Size ofFixture Slope, Distance
Size of Trap, Drain, in./ft from Trap,
in. (mm) in. (mm) (cm/m) ft (m)
14 (32) 14 (32) 4 (12.5) 32(1.07)
14 (32) 12 (40) 4 (12.5) 5 (1.52)
12 (40) 12 (40) 4 (12.5) 5 (1.52)
12 (40) 2 (51) 4 (12.5) 6 (1.83)
2 (51) 2 (51) 4 (12.5) 8 (2.44)
3 (76) 3 (76) 8 (25) 10 (3.05)
4 (101) 4 (101) 8 (25) 12 (3.66)

8/12/2019 American Society of Plumbing Engineers Volume 2
http://slidepdf.com/reader/full/american-society-of-plumbing-engineers-volume-2 67/233
41Chapter 3— Vents and Venting
ture unit assigned to each kind of fixture repre-sents the degree to which it loads the system.
The designer should confirm or adjust this data based on the local code.
Vent Sizes and Lengths The above two equations are useful for comput-ing lengths and diameters of vent pipes requiredto carry given rates of air flow. Appropriate val-ues of the friction coefficient should be used inapplying these equations. For any particular pipe,“f ” is an inverse function of the Reynold’s num-
ber (turbulence ) and incr eases wi th theroughness of pipe material relative to diameter.
The size of vent piping shall be determinedfrom its length and the total number of fixtureunits connected thereto, as set forth in Table
3-5. Note, in Table 3-5, that some codes limit the maximum length located in the horizontalposition due to higher friction losses in horizon-tal piping. On average, codes may limit that 20-50% of maximum length be located in thehorizontal position.
End Venting
“End venting” is a system of floor drains whose branch arms do not exceed 15 ft (4.5 m) and aresloped at 8 in./ft (3.2 mm/m) (1%) to a maindrain that is sized two pipe diameters larger,
therefore allowing the main drain to be end vented. The theory is that the system is over-sized allowing the sewer always to flow partially full, thus permitting air to circulate above. (Thisconfiguration is similar to a combination waste-and-vent system.)
Common Vent
A common vent may be used for two fixtures set on the same floor level but connecting at differ-ent levels in the stack, provided that the verticaldrain is one pipe diameter larger than the upper fixture drain but in no case smaller than thelower fixture drain, or whichever is the larger,and that both drains conform to the distancesfrom trap to vent for various size drains.
Stack Venting
A group of fixtures, consisting of one bathroomgroup and a kitchen sink or combination fixtures,may be installed without individual fixture vents
Table 3-4 Drainage-Fixture-Unit Valuesfor Various Plumbing Fixtures
Type of Fixture or Drainage-Fixture-Group of Fixtures Unit Value (dfu)
Automatic clothes washer (2-in. [51 mm] standpipe) 3Bathroom group consisting of a water closet,
lavatory, and bathtub or shower stall:Flushometer valve closet 8Tank-type closet 6
Bathtub (with or without overhead shower)a 2Bidet 1Clinic Sink 6Combination sink-and-tray with food-waste grinder 4Combination sink-and-tray with one
1½-in. (38 mm) trap 2Combination sink-and-tray with separate
1½-in. (38 mm) trap 3Dental unit or cuspidor 1
Dental lavatory 1Drinking fountain ½Dishwasher, domestic 2Floor drains with 2-in. (51 mm) waste 3Kitchen sink, domestic, with one 1½-in. (38 mm) trap 2Kitchen sink, domestic, with food-waste grinder 2Kitchen sink, domestic, with food-waste grinder
and dishwasher 1½-in. (38 mm) trap 3Kitchen sink, domestic, with dishwasher
1½-in. (38 mm) trap 3Lavatory with 1¼-in. (32-mm) waste 1Laundry trap (1 or 2 compartments) 2Shower stall, domestic 2Showers (group) per headb 2Sinks:
Surgeon’s 3Flushing rim (with valve) 6
Service (trap standard) 3Service (P trap) 2Pot, scullery, etc.b 4
Urinal, pedestal, syphon jet blowout 6Urinal, wall lip 4Urinal, stall, washout 4Urinal, trough (each 6-ft [1.8 m] section) 2Wash sink (circular or multiple) each set of faucets 2Water closet, tank-operated 4Water closet, valve-operated 6Fixtures not listed above:
Trap size 1¼ in. (32 mm) or less 1
Trap size 1½ in. (38 mm) 2Trap size 2 in. (51 mm) 3Trap size 2½ in. (63 mm) 4Trap size 3 in. (76 mm) 5Trap size 4 in. (101 mm) 6
a A shower head over a bathtub does not increase the fixture-unitvalue.b See Chapter 1 of this volume for the method of computing equiva-lent fixture values for devices or equipment that dischargescontinuous or semicontinuous flows into sanitary drainage sys-tems.
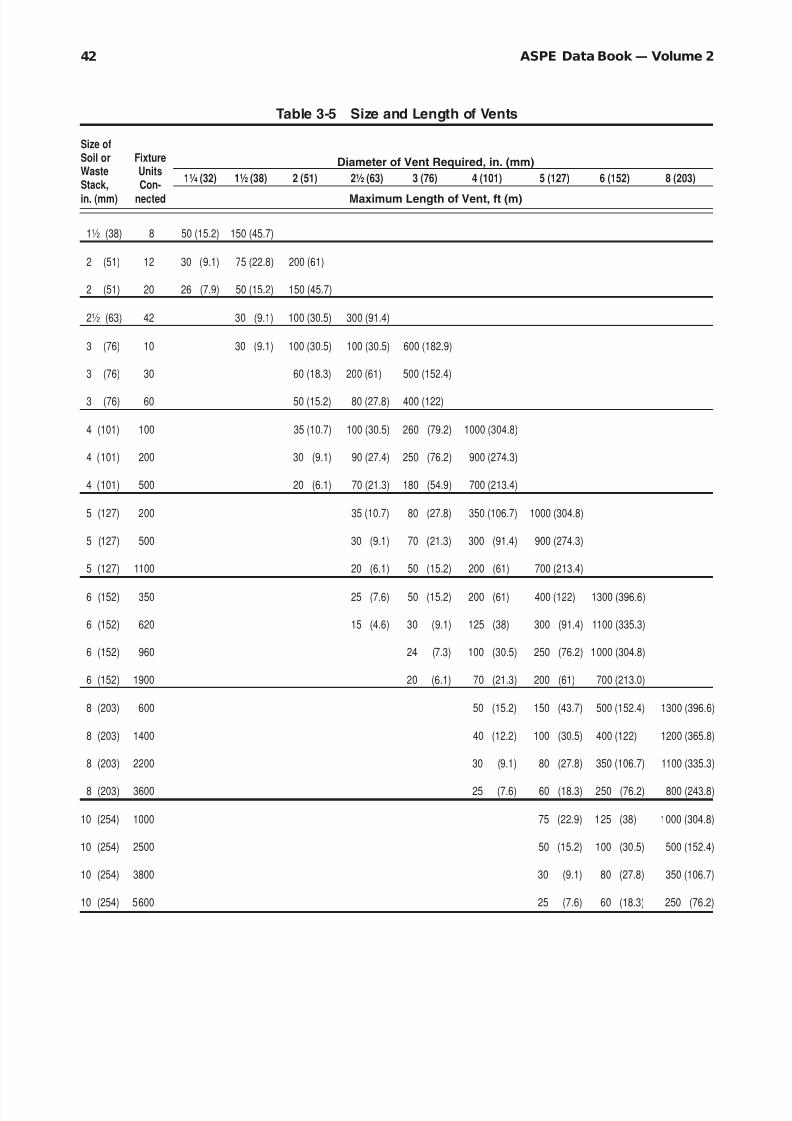
8/12/2019 American Society of Plumbing Engineers Volume 2
http://slidepdf.com/reader/full/american-society-of-plumbing-engineers-volume-2 68/233

8/12/2019 American Society of Plumbing Engineers Volume 2
http://slidepdf.com/reader/full/american-society-of-plumbing-engineers-volume-2 69/233
43Chapter 3— Vents and Venting
in a one-story building or on the top floor of a building, provided each fixture drain connectsindependently to the stack, and the water closet and bathtub or shower-stall drain enters thestack at the same level and in accordance withtrap-arm requirements.
When a sink or combination fixture connectsto the stack-vented bathroom group and whenthe street sewer is sufficiently overloaded to causefrequent submersion of the building sewer, a relief vent or back-vented fixture shall be con-nected to the stack below the stack-vented water closet or bathtub.
Wet Venting
If allowed by local codes, a single-bathroom groupof fixtures may be installed with a drain from a
back-vented lavatory, kitchen sink, or combina-tion fixture serving as a wet vent for a bathtubor shower stall and for the water closet, providedthat:
1. Not more than one fixture unit is drained intoa 1½-in. (38-mm) diameter wet vent or not more than four fixture units drain into a 2-in.(51-mm) diameter wet vent.
2. The horizontal branch connects to the stack at the same level as the water-closet drain or
below the water-closet drain when installedon the top floor.
Bathroom groups consisting of two lavato-ries and two bathtubs or shower stalls back to back on a top floor may be installed on the samehorizontal branch with a common vent for thelavatories and with no back vent for the bath-tubs or shower stalls and for the water closets,provided the wet vent is 2 in. (51 mm) in diam-eter and the length of the fixture drain conformsto Table 3-2.
On the lower floors of a multistory building,the waste pipe from one or two lavatories may
be used as a wet vent for one or two bathtubs or showers, provided that:
1. The wet vent and its extension to the vent stack is 2 in. (51 mm) in diameter.
2. Each water closet below the top floor is in-dividually back-vented.
3. The vent stack is sized as shown in Table 3-6.
Table 3-6 Size of Vent Stacks
Diam. of Vent Stacks
No. of Wet-Vented Fixtures in. mm
1 or 2 bathtubs or showers 2 50.8 3–5 bathtubs or showers 2½ 63.5
6–9 bathtubs or showers 3 76.2
10–16 bathtubs or showers 4 101.6
Circuit and Loop Venting
A branch soil or waste pipe to which two but not more than eight water closets (except blowout type), pedestal urinals, trap standard to floor,shower stalls, or floor drains are connected in
battery may be vented by a circuit or loop vent which takes off in front of the last fixture con-
nection. In addition, lower-floor branches servingmore than three water closets shall be provided
with a relief vent taken off in front of the first fixture connection. When lavatories or similar fixtures discharge above such branches, each
vertical branch shall be provided with a continu-ous vent.
Figure 3-3 represents a typical loop-vented, water-closet row installed on the top floor of a building or in a one-story building. Figure 3-3(a)shows the horizontal branch installed at the back
below the water closet. Figure 3-3(b) is the sametoilet room, except that the horizontal branch is
directly under the water closets.
Figure 3-4 illustrates a toilet arrangement similar to that shown in Figure 3-3 except that the installation applies to a multistory building.
A circuit vent is similar to a loop vent except that a circuit vent connects into the vent stack.
When the circuit, loop, or relief vent connec-tions are taken off the horizontal branch, the
vent branch connection shall be taken off at a vertical angle or from the top of the horizontal branch.
In sizing, the diameter of a circuit or loop vent shall be made not less than the size of thediameter of the vent stack, or one half the size of the diameter of the horizontal soil or waste
branch, whichever is smaller.
When fixtures are connected to one horizon-tal branch through a double wye or a sanitary tee in a vertical position, a common vent for eachtwo fixtures back to back with a double connec-

8/12/2019 American Society of Plumbing Engineers Volume 2
http://slidepdf.com/reader/full/american-society-of-plumbing-engineers-volume-2 70/233
ASPE Data Book — Volume 244
tion shall be provided. The common vent shall be installed in a vertical position as a continua-tion of the double connection.
Relief Vents
Soil and waste stacks in buildings having morethan ten branch intervals shall be provided witha relief vent at each tenth interval installed, be-ginning with the top floor. The size of the relief
vent shall be equal to the size of the vent stack to which it connects. The lower end of each relief
vent shall connect to the soil or waste stack through a wye below the horizontal branch serv-ing the floor, and the upper end shall connect tothe vent stack through a wye not less than 3 ft (0.9 m) above the floor level.
In order to balance the pressures that are
constantly changing within the plumbing sys-tem, it is necessary to provide a relief vent at various intervals, particularly in multistory build-ings. Figure 3-5 illustrates important requirements for the installation of a relief vent.
Offset
An offset in a run of piping consists of a combi-nation of elbows or bends that brings one section
of the pipe out of line but into a line approxi-mately parallel with the other section. The offset distance can be estimated according to the fol-lowing:
Pipe Size, Horizontal Offset,
in. (mm) in. (mm)2 (51) 5 (127)
3 (76) 7 (177)
4 (101) 10 (254)
5 (127) 12 (303)
6 (152) 14 (354)
8 (203) 18 (455)
Offsets less than 45° from the horizontal ina soil or waste stack shall comply with the fol-lowing:
1. Offsets may be vented as two separate soilor waste stacks, namely, the stack section below the offset and the stack section abovethe offset.
2. Offsets may be vented by installing a relief vent as a vertical continuation of the lower section of the stack or as a side vent con-nected to the lower section between the offset and the next lower fixture or horizontal
Figure 3-3 Loop Vent, with HorizontalBranch Located (a) at Back Below Water
Closets, (b) Directly Under Water Closets.
Figure 3-4 Circuit Vent

8/12/2019 American Society of Plumbing Engineers Volume 2
http://slidepdf.com/reader/full/american-society-of-plumbing-engineers-volume-2 71/233
45Chapter 3— Vents and Venting
branch. The upper section of the offset shall be provided with a yoke vent. The diameter of the vents shall be not less than the diam-eter of the main vent or of the soil and wastestack, whichever is smaller.
Figure 3-6 illustrates the requirements for installation.
Vent Headers
Stack vents and vent stacks may be connectedinto a common vent header at the top of thestacks and then extended to the open air at onepoint. This header shall be sized in accordance
with the requirements of Table 3-5, the number of units being the sum of all units on all stacksconnected thereto, and the developed length be-ing the longest vent length from the intersectionat the base of the most distant stack to the vent terminal in the open air as a direct extension of one stack.
Combination Waste and Vent Systems
These are horizontal wet-vented systems. They are used where walls are not available for vents.
They depend on oversized drainage pipes to pre- vent loss of trap seal. Surge loads are not allowed.
Figure 3-5 Relief Vent

8/12/2019 American Society of Plumbing Engineers Volume 2
http://slidepdf.com/reader/full/american-society-of-plumbing-engineers-volume-2 72/233
ASPE Data Book — Volume 246
Grease-producing fixtures are not allowed, asscouring action is poor. They are used primarily for extended floor or shower-drain installations,for floor sinks for markets or restaurants, andfor worktables in schools. See Figure 3-7. Somecodes also allow sinks and lavatories to be in-stalled with this type of system. Check the localcode for requirements.
SECTION II — SEVERAL VENTING SYSTEMS
Philadelphia System
Philadelphia or one pipe system refers to usingone stack instead of having separate drainageand vent stacks. These systems depend on re-lieving the pressures by making the pipe larger
than required for drainage pipe in a two-pipesystem. These systems also use unvented traps(“s” traps) that depend on oversized traps andrefill from flat bottom fixtures to maintain thetrap seal.
This system limits the trap arm length to re-duce suction buildup. The size of the main stack is increased to limit pressure and vacuum build-up. See Figure 3-8. Check with the local authoritiesto see if this system is allowed. Contact the City of Philadelphia for specific requirements.
Sovent System
The performance of the sovent plumbing systemis based mainly on the aerator, which is requiredon each floor level, and the deaerator at the baseof the stack. The aerator provides an offset andentrance chamber to divert the main flow aroundthe branch inlet and permit a gradual mixing of the branch flow with the main stack flow. Thesefittings limit the velocity of both liquid waste andair in the stack and create minimum turbulenceinside the fitting chamber. The resulting air flow
and associated pressure fluctuation are there-fore less. The deaerator installed at the base andat every change of direction of the stack from
vertical to horizontal acts to separate the air flow from the fixture in the stack, ensuring the smooth
Figure 3-6 Offset

8/12/2019 American Society of Plumbing Engineers Volume 2
http://slidepdf.com/reader/full/american-society-of-plumbing-engineers-volume-2 73/233
47Chapter 3— Vents and Venting
entry of liquid into the building drain and reliev-ing the positive pressure generated in the stack ’s
base. It is obvious that these fittings balancepositive and negative pressure at or near zerothroughout the entire system under conditionsof normal usage.
Stack Venting
In stack venting the fixtures are connected in-dependently through their fixture drains to thedrainage stack without any venting other than
what is afforded through the stack and stack vent. Since no back venting is used when the
fixtures are stack vented, economy of installa-tion is achieved.
However, with this type of venting, certainprecautions must be observed if the trap sealsof the stack-vented fixtures are not to be depleted
excessively by the pneumatic-pressure variations within the stack. One precaution that must beobserved is to connect the fixtures on the floor in question to the stack in the proper order ver-tically upward. They should be connected in order of decreasing rate of discharge in the upwarddirection. Thus the lavatory drain should be thedrain that is highest on the stack. The reason
Figure 3-7 Combination Waste-and-Vent System

8/12/2019 American Society of Plumbing Engineers Volume 2
http://slidepdf.com/reader/full/american-society-of-plumbing-engineers-volume-2 74/233
ASPE Data Book — Volume 248
Figure 3-8 Philadelphia System

8/12/2019 American Society of Plumbing Engineers Volume 2
http://slidepdf.com/reader/full/american-society-of-plumbing-engineers-volume-2 75/233
49Chapter 3— Vents and Venting
for this is that the discharge of a fixture draininto the stack causes pressure reduction for somedistance below the point of entry, and this pres-sure reduction is greater the greater the rate of discharge. (See Figure 3-9.)
Another precaution that is observed in theUnited States is to permit stack venting only insingle-story structures or on the top floor of multistory buildings.
It should be noted, however, that the Britishhave installed some systems with stack ventingon every floor of multistory buildings and report that it is working satisfactorily.
Wet Venting
A “ wet vent ” is one that vents a particular fix-ture and at the same time receives the discharge
from other fixtures (see Figure 3-9). In practice,such a vent receives the discharge only from low-rate fixtures, such as lavatories, sinks, etc., never from a water closet or from a number of fixtures.
The principal object of using wet vents is toreduce the vent piping required for a given in-stallation by making individual pipes serve twopurposes. Because wet venting simplifies thedrainage system and thereby decreases the cost of installation, there is an increasing tendency among code-writing authorities to permit its useunder suitable restrictions that are necessary toprevent excessive trap seal losses.
Dr. R. Hunter, at the National Bureau of Standards, conducted tests on wet venting andreported the results in Recommended Minimum Requirements for Plumbing in Dwellings and Simi- lar Buildings . He pointed out that, under certainconditions, wet venting could be used without danger of reducing trap seals excessively. In a later publication he indicated that bathroomfixtures back to back can be wet vented satisfac-torily, provided the bathtub drains between the
wet vent and the bathtub trap are laid on a uni-form slope and otherwise comply with the
conditions necessary to prevent excessive self-siphonage.
Reduced-Size Venting
In 1972, a laboratory study of one-story and split-level experimental drainage systems where the
vents varied from one to six pipe sizes smaller than those presently specified by codes showedsatisfactory hydraulic and pneumatic perfor-
Figure 3-9 Wet Venting andStack Venting
mance under various loading conditions (NationalBureau of Standards 1974). At the same time,the ten-story wet-vent system in Stevens’s Build-ing Technology Research Laboratory had beenmodified by reducing the vents one to three pipesizes in accordance with plans and specificationsfurnished by the National Bureau of Standards(NBS) and the conducting of a series of testsunder various loading conditions. Based on thetest loads imposed, the reduced-size ventsselected for use in this study appear to be ad-equate with regard to trap-seal retention and
blow-back for a ten-story building (Stevens In-
stitute of Technology 1973). In 1976, a report described the experimental findings of tests on a full-scale, two-story plumbing system with re-duced-size vents under a range of operatingconditions including having the vent terminalsclosed and the building drain submerged. Re-sults indicate that dry-vent piping in one andtwo-story housing units can safely be madesmaller than presently allowed by design with-out jeopardizing the trap seals.

8/12/2019 American Society of Plumbing Engineers Volume 2
http://slidepdf.com/reader/full/american-society-of-plumbing-engineers-volume-2 76/233
ASPE Data Book — Volume 250
SECTION III — SIZING OF SEVERAL VENTINGSYSTEMS
Reduced-Size Venting Design
This system may allow economies in venting de-sign in low-rise residential buildings. It is similar to traditional codes, but allows smaller size vents.It is limited to special conditions and requiresthat vent pipes not be restricted by products of corrosion.
General limitations Reduced-size venting is lim-ited to water fall from the highest fixture to the
building drain or its horizontal branches of 15 ft (4.6 m) for residential occupancies and residen-tial-type fixtures. Reduced-size vents must be of corrosion-resistant materials, such as copper or
plastic; must slope to the drain; must not be lo-cated where a stoppage could cause waste to back up into them (e.g., a single-compartment sink witha garbage disposer that could pump waste intothe vent pipe in the event of stoppage below the
vent); must not be installed within 1½ ft (0.5 m)developed length from a clothes-washer trap arm;and must be independent of other systems. (Ex- ception : The drains from these systems may connect to any other system in gravity-flow build-ing sewers.) Fixture and stack vents are traditionalsizes up to at least 6 in. (152 mm) above the flood
Table 3-7 Fixture Unit Loads
Fixture Fixture Units
Bathtub or shower 2
Clothes washer 3
Dish washer 2
Floor drain 3
Laundry tray 2
Lavatory 1
Sink (including dishwasher andgarbage disposer) 3
Water closet (tank type) 4
Table 3-8 Fixture Vents and Stack Vents
Elevation of Trap Centerline, Arm above Load Served by Vent Nominal Size of FixtureType of Vent Centerline of Its Horizontal Drain, ft (m) (fixture units) or Stack Vent, in. (mm)
Fixture vent for one trap Up to 8 (2.4) 3 or less ½ (12.7)a
4 ¾ (19)a
8–16 (2.4–4.9) 3 or less ¾ (19)4 1 (25.4)
Fixture vent for two traps Up to 8 (2.4) 3 or less ¾ (19)a
4–6 1 (25.4)7 and 8 1¼ (32)
8–16 (2.4–4.9) 6 or less 1 (25.4)7 and 8 1¼ (32)
Stack vent Up to 8 (2.4) 6 or less 1 (25.4)7–15 1¼ (32)16–29 1½ (38)
8–16 (2.4–4.9) 6 or less 1¼ (32)7–15 1½ (38)16–29 2 (51)
aIncrease one pipe size for two-story systems.
level rim of the fixture served. An arterial vent isinstalled for systems with more than one floor of fixtures (the drainage piping between the arterial
vent and the street sewer is at least the same sizeas the arterial vent). Vents that are subject tofreezing are of traditional size; vent terminals arescreened (free openings are at least 150% of therequired flow area and openings face down); anddrainage pipes are the size required by traditionalcodes. Always consult with the local plumbingcode enforcement agency or other governmentaldepartment having jurisdiction before designingthe system to be sure this sizing method is ac-ceptable under the applicable code.

8/12/2019 American Society of Plumbing Engineers Volume 2
http://slidepdf.com/reader/full/american-society-of-plumbing-engineers-volume-2 77/233
51Chapter 3— Vents and Venting
Table 3-10 Confluent Vents Serving Four or More Fixture or Stack Vents, Schedule 40 Pipe
Size of LargestNominal Size of Confluent Vent, in. (mm)
Vent Served, 1 (25.4) 1¼ (31) 1½ (38) 2(51) 2½ (63) 3(76) 4 (101)
in. (mm) Total Flow Area of Vents Served, in2 (103 mm2)
½ (12.7) 1.2–2.5 2.5–7.5 7.5–14(0.8–1.6) (1.6–4.8) (4.8–9.0)
¾ (19) 1.4–4.2 4.2–7.9 7.9– 21(0.9–2.7) (2.7–5.1) (5.1–13.6)
1 (25.4) 1.8–2.6 2.6–4.8 4.8–13 13–27(1.2–1.7) (1.7–3.1) (3.1–8.4) (8.4–17.4)
1¼ (31) 2.4–2.8 2.8–6.7 6.7–15 15–36(1.6–1.8) (1.8–4.3) (4.3–9.7) (9.7–23.2)
1½ (38) 2.9–5.5 5.5–11 11–27 27 to 79(1.9–3.6) (3.6–7.1) (7.1–17.4) (17.4 to 51.0)
2 (51) 3.8–6.8 6.8–16 16 to 48(2.5–4.4) (4.4–10.3) (10.3 to 31.0)
2½ (63) 5.7–11 to 34(3.7–7.1) (7.1 to 21.9)
3 (76) 8.3 to 22(5.4 to 14.2)
Table 3-9 Confluent Vents ServingThree Fixture or Stack Vents
Nominal Size of Fixture or Stack Vent, Nominal Size ofin. (mm) Confluent Vent,
Largest Next to Largest Smallest in (mm.)
½ (12.7) ½ (12.7) ½ (12.7) ¾ (19)
¾ (19) ¾ (19)a ¾ (19)a 1 (25.4)
1 (25.4) 1 (25.4)a ¾ (19)a 1¼ (31)
1 (25.4) 1 (25.4) 1 (25.4) 1½ (38)
1¼ (31) ¾ (19)a ¾ (19)a 1½ (38)
1¼ (31) 1 (25.4) ½ (12.7) 1½ (38)
1¼ (31) 1 (25.4) ¾ (19) 2 (51)
1¼ (31) 1¼ (31) ½ (12.7) 1½ (38)
1¼ (31) 1¼ (31) ¾ (19) 2 (51)
1½ (38) 1¼ (31)a 1¼ (31)a 2 (51)
1½ (38) 1½ (38) 1 (25.4)a 2 (51)
1½ (38) 1½ (38) 1¼ (31) 3 (76)
aOr smaller.
Sizing procedure The following steps should be followed in the design of reduced-size vent-ing:
1. Prepare a pipe layout drawing.
2. Determine the fixture units for each fixture vent and each stack vent using Table 3-7.
3. Size fixture and stack vents using Table 3-8.
4. Size confluent vents, beginning at the ventsfarthest from their termination.
A. When a confluent vent serves two fixture vents, two stack vents, or one fixture vent and one stack vent, make the confluent
vent one pipe size larger than the ventsserved.
B. When a confluent vent serves any com- bination of three fixture vents and stack
vents, size the confluent vent using Table3-9.
C. When a confluent vent serves any com- bination of four or more fixture and stack vents, size the confluent vent using Table3-10 or 3-11. For flow areas of pipe andtube, use Table 3-12.

8/12/2019 American Society of Plumbing Engineers Volume 2
http://slidepdf.com/reader/full/american-society-of-plumbing-engineers-volume-2 78/233

8/12/2019 American Society of Plumbing Engineers Volume 2
http://slidepdf.com/reader/full/american-society-of-plumbing-engineers-volume-2 79/233
53Chapter 3— Vents and Venting
Example. The following design example illustrates the reduced-size venting method:
Conditions. Two-story residential building, freezing climate, Schedule 40 plastic vents.
Step 1. Prepare a pipe layout. See Figure 3-10.
Step 2. Determine fixture and stack vent sizes by using Table 3-8.
Number of Elevation, Load (from Table 3-7) Size,Vent Pipe Fixture Traps Vent Stack ft (m) (fixture units) in. (mm)
1 1 no 5 (1.5) 3 ½ (12.7)
2 2 no 5 (1.5) 5 1 (25.4)
3 2 yes 15 (4.6) 5 1¼ (31)
4 3 yes 15 (4.6) 7 1½ (38)
5 1 no 4 (1.2) 3 ½ (12.7)
Step 3. Determine confluent vent size.
Sizes, Area (from Table 3-12), Size,Vent Pipe Number in. (mm) in2 (mm2) in. (mm)
20 2 1, 1 (25.4, 25.4) (vents 1 & 2) — 1¼ (31) (one size over 1)
21 3 1¼, 1, 1 (31, 25.4, 25.4) (vents 1, 2, and 3) — 2 (51) (from Table 3-10)
22 4 1 (25.4) (vent 1) 0.86 (0.6) 2 (51) (from Table 3-10)
1 (25.4) (vent 2) 0.86 (0.6)
1¼ (31) (vent 3) 1.5 (1.0)
1½ (38) (vent 4) 2.04 (1.3)
Step 4.No vent is longer than 25 ft (7.6 m); therefore, no increase is necessary.
Step 5. Determine arterial vent size from Table 3-13.
Vent Pipe Load (fixture units) Length, ft (m) Size, in. (mm)
4, 22, and 23 23 5 (1.5) 1½ (38)
Step 6. Increase all vents that are subject to freezing conditions to traditional sizes.
Vent Pipe Load (fixture units) Length ft, (m) Size, in. (mm)
22 23 4½ (1.4) 2 (51)a
23 23 1½ (0.5) 3 (76)b
a Traditional size.b Size required to prevent frost closure.
Vent 22 was 2 in. (51 mm), Step 3.
Vent 23 (extension of vent 22) should be increased from 2 in. (51 mm), Step 4, to 3 in. (76 mm).Increase bathtub drain to 2 in. (51 mm).

8/12/2019 American Society of Plumbing Engineers Volume 2
http://slidepdf.com/reader/full/american-society-of-plumbing-engineers-volume-2 80/233
ASPE Data Book — Volume 254
Sovent Systems
The sovent system is a single-stack system that may allow economies in drainage and vent systems. There are no limits to heights or occu-
pancies, but there are special design rules. Theeffects of excess suds should be considered.
Always consult with the local plumbing codeenforcement agency or other governmental de-partment having jurisdiction before designing thesystem to make sure this system is acceptableunder the local code.
The sovent system has four parts: a drain, waste, and vent (DWV) stack; a sovent aerator
fitting at each floor level; DWV horizontal branches; and a sovent deaerator fitting at the base of the stack. The two special fittings, theaerator and the deaerator, are the basis for theself-venting features of the sovent system. Soil
stack and vent combine into a single sovent stack. Figure 3-11 illustrates a typical sovent single-stack plumbing system and a traditionaltwo-pipe system.
Aerator fittings The sovent system aerator fit-ting consists of an offset at the upper stack inlet connection, a mixing chamber, one or more
branch inlets, one or more waste inlets for theconnection of smaller waste branches, a baffle
Figure 3-10 Pipe Layout Drawing – Two-Story Residential Building,Freezing Climate, Schedule 40 Plastic Vents

8/12/2019 American Society of Plumbing Engineers Volume 2
http://slidepdf.com/reader/full/american-society-of-plumbing-engineers-volume-2 81/233
55Chapter 3— Vents and Venting
(A) (B)
Figure 3-11 (A) Traditional Two-Pipe Plumbing System;(B) Typical Sovent Single-Stack Plumbing System.

8/12/2019 American Society of Plumbing Engineers Volume 2
http://slidepdf.com/reader/full/american-society-of-plumbing-engineers-volume-2 82/233
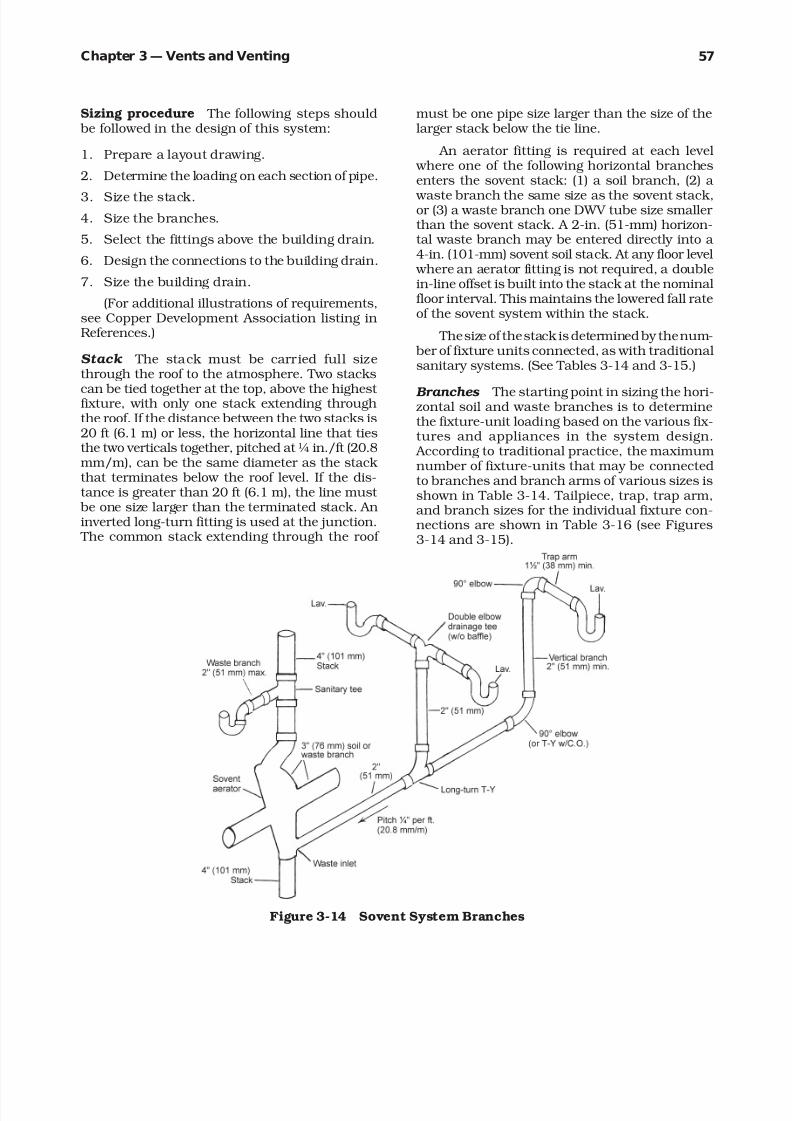
8/12/2019 American Society of Plumbing Engineers Volume 2
http://slidepdf.com/reader/full/american-society-of-plumbing-engineers-volume-2 83/233
57Chapter 3— Vents and Venting
Sizing procedure The following steps should be followed in the design of this system:
1. Prepare a layout drawing.
2. Determine the loading on each section of pipe.
3. Size the stack.4. Size the branches.
5. Select the fittings above the building drain.
6. Design the connections to the building drain.
7. Size the building drain.
(For additional illustrations of requirements,see Copper Development Association listing inReferences.)
Stack The stack must be carried full sizethrough the roof to the atmosphere. Two stacks
can be tied together at the top, above the highest fixture, with only one stack extending throughthe roof. If the distance between the two stacks is20 ft (6.1 m) or less, the horizontal line that tiesthe two verticals together, pitched at ¼ in./ft (20.8mm/m), can be the same diameter as the stack that terminates below the roof level. If the dis-tance is greater than 20 ft (6.1 m), the line must
be one size larger than the terminated stack. Aninverted long-turn fitting is used at the junction.
The common stack extending through the roof
must be one pipe size larger than the size of thelarger stack below the tie line.
An aerator fitting is required at each level where one of the following horizontal branchesenters the sovent stack: (1) a soil branch, (2) a
waste branch the same size as the sovent stack,or (3) a waste branch one DWV tube size smaller than the sovent stack. A 2-in. (51-mm) horizon-tal waste branch may be entered directly into a 4-in. (101-mm) sovent soil stack. At any floor level
where an aerator fitting is not required, a doublein-line offset is built into the stack at the nominalfloor interval. This maintains the lowered fall rateof the sovent system within the stack.
The size of the stack is determined by the num- ber of fixture units connected, as with traditionalsanitary systems. (See Tables 3-14 and 3-15.)
Branches The starting point in sizing the hori-zontal soil and waste branches is to determinethe fixture-unit loading based on the various fix-tures and appliances in the system design.
According to traditional practice, the maximumnumber of fixture-units that may be connectedto branches and branch arms of various sizes isshown in Table 3-14. Tailpiece, trap, trap arm,and branch sizes for the individual fixture con-nections are shown in Table 3-16 (see Figures3-14 and 3-15).
Figure 3-14 Sovent System Branches
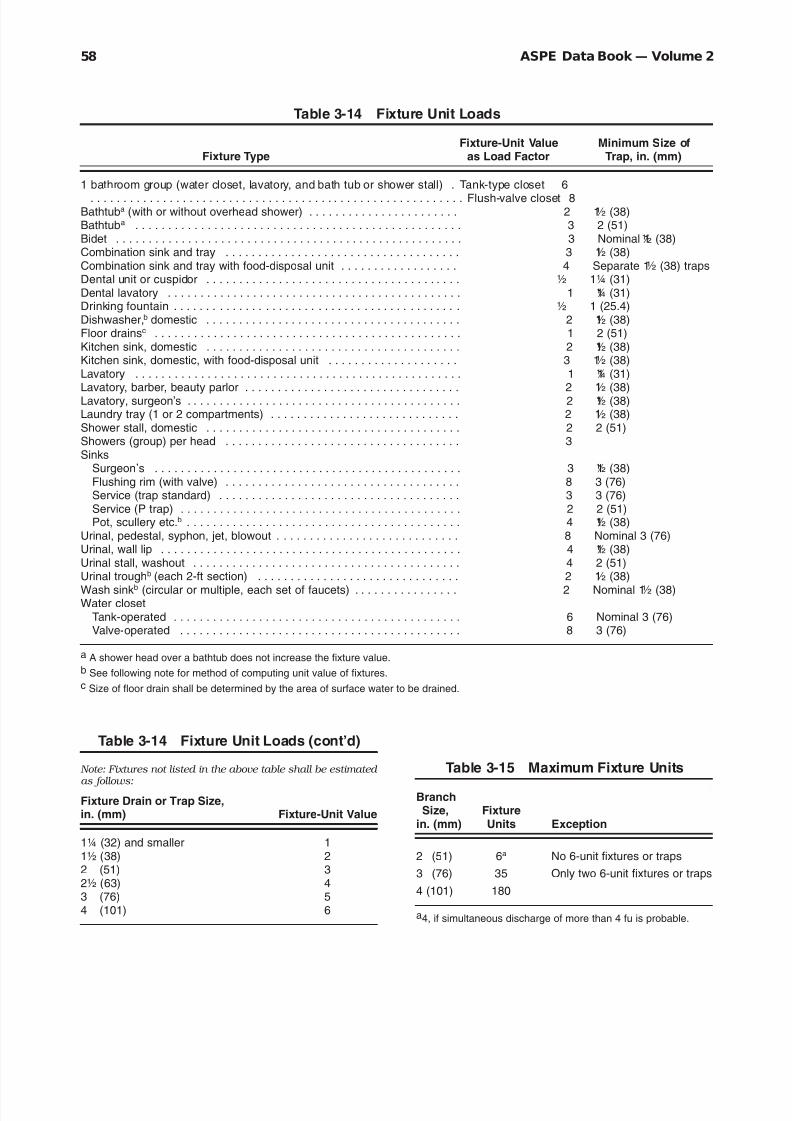
8/12/2019 American Society of Plumbing Engineers Volume 2
http://slidepdf.com/reader/full/american-society-of-plumbing-engineers-volume-2 84/233
ASPE Data Book — Volume 258
Table 3-14 Fixture Unit Loads
Fixture-Unit Value Minimum Size ofFixture Type as Load Factor Trap, in. (mm)
1 bathroom group (water closet, lavatory, and bath tub or shower stall) . Tank-type closet 6
. . . . . . . . . . . . . . . . . . . . . . . . . . . . . . . . . . . . . . . . . . . . . . . . . . . . . . . . . Flush-valve closet 8Bathtuba (with or without overhead shower) . . . . . . . . . . . . . . . . . . . . . . . 2 1½ (38)Bathtuba . . . . . . . . . . . . . . . . . . . . . . . . . . . . . . . . . . . . . . . . . . . . . . . . . . 3 2 (51)Bidet . . . . . . . . . . . . . . . . . . . . . . . . . . . . . . . . . . . . . . . . . . . . . . . . . . . . . 3 Nominal 1½ (38)Combination sink and tray . . . . . . . . . . . . . . . . . . . . . . . . . . . . . . . . . . . . 3 1½ (38)Combination sink and tray with food-disposal unit . . . . . . . . . . . . . . . . . . 4 Separate 1½ (38) trapsDental unit or cuspidor . . . . . . . . . . . . . . . . . . . . . . . . . . . . . . . . . . . . . . . ½ 1¼ (31)Dental lavatory . . . . . . . . . . . . . . . . . . . . . . . . . . . . . . . . . . . . . . . . . . . . . 1 1¼ (31)Drinking fountain . . . . . . . . . . . . . . . . . . . . . . . . . . . . . . . . . . . . . . . . . . . . ½ 1 (25.4)Dishwasher,b domestic . . . . . . . . . . . . . . . . . . . . . . . . . . . . . . . . . . . . . . . 2 1½ (38)Floor drainsc . . . . . . . . . . . . . . . . . . . . . . . . . . . . . . . . . . . . . . . . . . . . . . . 1 2 (51)Kitchen sink, domestic . . . . . . . . . . . . . . . . . . . . . . . . . . . . . . . . . . . . . . . 2 1½ (38)Kitchen sink, domestic, with food-disposal unit . . . . . . . . . . . . . . . . . . . . 3 1½ (38)Lavatory . . . . . . . . . . . . . . . . . . . . . . . . . . . . . . . . . . . . . . . . . . . . . . . . . . 1 1¼ (31)
Lavatory, barber, beauty parlor . . . . . . . . . . . . . . . . . . . . . . . . . . . . . . . . . 2 1½ (38)Lavatory, surgeon’s . . . . . . . . . . . . . . . . . . . . . . . . . . . . . . . . . . . . . . . . . . 2 1½ (38)Laundry tray (1 or 2 compartments) . . . . . . . . . . . . . . . . . . . . . . . . . . . . . 2 1½ (38)Shower stall, domestic . . . . . . . . . . . . . . . . . . . . . . . . . . . . . . . . . . . . . . . 2 2 (51)Showers (group) per head . . . . . . . . . . . . . . . . . . . . . . . . . . . . . . . . . . . . 3Sinks
Surgeon’s . . . . . . . . . . . . . . . . . . . . . . . . . . . . . . . . . . . . . . . . . . . . . . . 3 1½ (38)Flushing rim (with valve) . . . . . . . . . . . . . . . . . . . . . . . . . . . . . . . . . . . . 8 3 (76)Service (trap standard) . . . . . . . . . . . . . . . . . . . . . . . . . . . . . . . . . . . . . 3 3 (76)Service (P trap) . . . . . . . . . . . . . . . . . . . . . . . . . . . . . . . . . . . . . . . . . . . 2 2 (51)Pot, scullery etc.b . . . . . . . . . . . . . . . . . . . . . . . . . . . . . . . . . . . . . . . . . . 4 1½ (38)
Urinal, pedestal, syphon, jet, blowout . . . . . . . . . . . . . . . . . . . . . . . . . . . . 8 Nominal 3 (76)Urinal, wall lip . . . . . . . . . . . . . . . . . . . . . . . . . . . . . . . . . . . . . . . . . . . . . . 4 1½ (38)Urinal stall, washout . . . . . . . . . . . . . . . . . . . . . . . . . . . . . . . . . . . . . . . . . 4 2 (51)Urinal troughb (each 2-ft section) . . . . . . . . . . . . . . . . . . . . . . . . . . . . . . . 2 1½ (38)
Wash sinkb (circular or multiple, each set of faucets) . . . . . . . . . . . . . . . . 2 Nominal 1½ (38)Water closet
Tank-operated . . . . . . . . . . . . . . . . . . . . . . . . . . . . . . . . . . . . . . . . . . . . 6 Nominal 3 (76)Valve-operated . . . . . . . . . . . . . . . . . . . . . . . . . . . . . . . . . . . . . . . . . . . 8 3 (76)
a A shower head over a bathtub does not increase the fixture value.b See following note for method of computing unit value of fixtures.c Size of floor drain shall be determined by the area of surface water to be drained.
Table 3-14 Fixture Unit Loads (cont’d)
Note: Fixtures not listed in the above table shall be estimated
as follows:Fixture Drain or Trap Size,in. (mm) Fixture-Unit Value
1¼ (32) and smaller 11½ (38) 22 (51) 32½ (63) 43 (76) 54 (101) 6
Table 3-15 Maximum Fixture Units
BranchSize, Fixture
in. (mm) Units Exception
2 (51) 6a No 6-unit fixtures or traps
3 (76) 35 Only two 6-unit fixtures or traps
4 (101) 180
a4, if simultaneous discharge of more than 4 fu is probable.
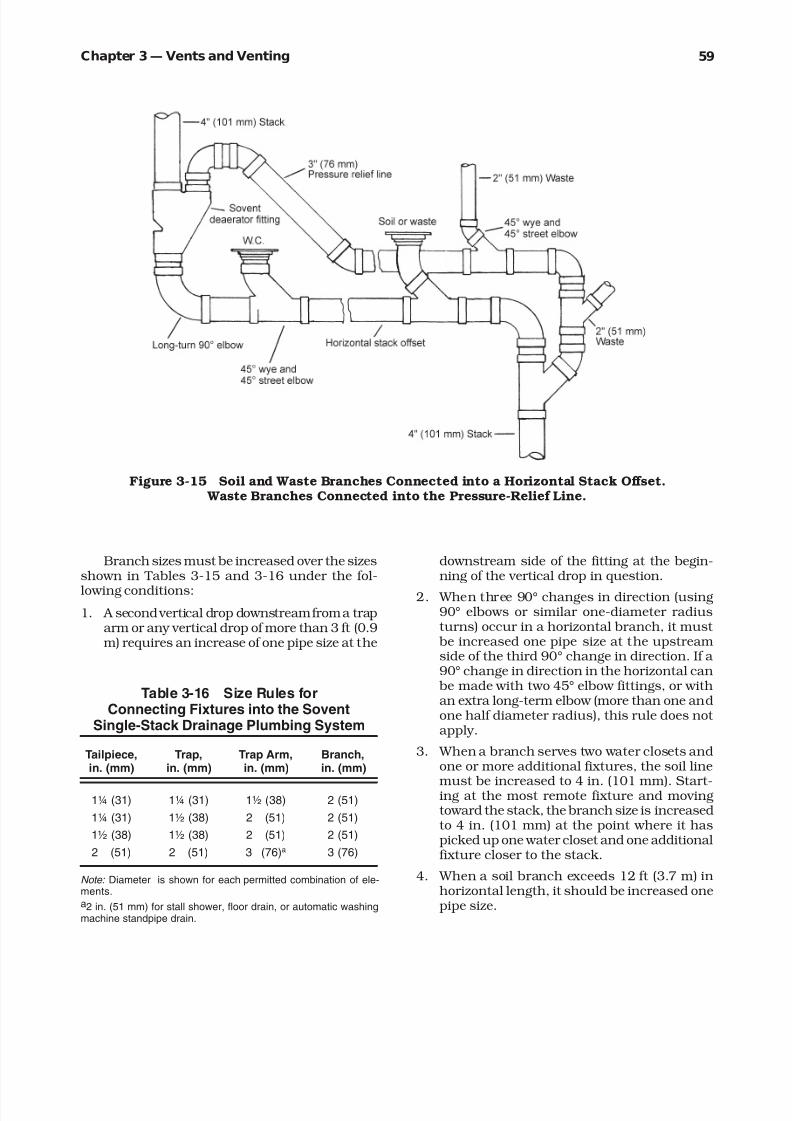
8/12/2019 American Society of Plumbing Engineers Volume 2
http://slidepdf.com/reader/full/american-society-of-plumbing-engineers-volume-2 85/233
59Chapter 3— Vents and Venting
Branch sizes must be increased over the sizesshown in Tables 3-15 and 3-16 under the fol-
lowing conditions:
1. A second vertical drop downstream from a traparm or any vertical drop of more than 3 ft (0.9m) requires an increase of one pipe size at the
Table 3-16 Size Rules forConnecting Fixtures into the Sovent
Single-Stack Drainage Plumbing System
Tailpiece, Trap, Trap Arm, Branch,in. (mm) in. (mm) in. (mm) in. (mm)
1¼ (31) 1¼ (31) 1½ (38) 2 (51)
1¼ (31) 1½ (38) 2 (51) 2 (51)
1½ (38) 1½ (38) 2 (51) 2 (51)
2 (51) 2 (51) 3 (76)a 3 (76)
Note: Diameter is shown for each permitted combination of ele-ments.a2 in. (51 mm) for stall shower, floor drain, or automatic washingmachine standpipe drain.
Figure 3-15 Soil and Waste Branches Connected into a Horizontal Stack Offset. Waste Branches Connected into the Pressure-Relief Line.
downstream side of the fitting at the begin-ning of the vertical drop in question.
2. When three 90° changes in direction (using90° elbows or similar one-diameter radiusturns) occur in a horizontal branch, it must
be increased one pipe size at the upstreamside of the third 90° change in direction. If a 90° change in direction in the horizontal can
be made with two 45° elbow fittings, or withan extra long-term elbow (more than one andone half diameter radius), this rule does not apply.
3. When a branch serves two water closets andone or more additional fixtures, the soil line
must be increased to 4 in. (101 mm). Start-ing at the most remote fixture and movingtoward the stack, the branch size is increasedto 4 in. (101 mm) at the point where it haspicked up one water closet and one additionalfixture closer to the stack.
4. When a soil branch exceeds 12 ft (3.7 m) inhorizontal length, it should be increased onepipe size.

8/12/2019 American Society of Plumbing Engineers Volume 2
http://slidepdf.com/reader/full/american-society-of-plumbing-engineers-volume-2 86/233
ASPE Data Book — Volume 260
5. When a waste branch exceeds 15 ft (4.6 m)in horizontal length, it should be increasedone pipe size.
Note : It is best to install a secondary pressure-equalizing line when the horizontal length
exceeds 27 ft (8.2 m) in cases (4) and (5)above.
Fittings An aerator fitting is required at eachlevel where one of the following horizontal
branches enters the sovent stack: (1) a soil branch, (2) a waste branch the same size as thesovent stack, or (3) a waste branch one DWV tube size smaller than the sovent stack. A 2-in.(51-mm) horizontal waste branch may be entereddirectly into a 4-in. (101-mm) sovent soil stack.
At a floor level where the aerator fitting isnot needed (e.g., on a 4-in. [101-mm] stack where
there is no soil branch and only a 2-in. [51-mm] waste branch enters), a double in-line offset isused in place of the aerator fitting.
At the deaerator outlet, the stack is connectedinto the horizontal drain through a long-turn fit-ting arrangement. Downstream, at least 4 ft (1.2m) from this point, the pressure relief line fromthe top of the deaerator fitting is connected intothe top of the building drain. A deaerator fitting,
with its pressure-relief line connection, is in-stalled in this way at the base of every sovent stack and also at every offset (vertical-horizon-tal-vertical) in a stack. In the latter case, the
pressure-relief line is tied into the stack imme-diately below the horizontal portion.
Waste branches at least one pipe size smaller than the stack may be led directly into the sovent aerator fitting through a waste entry. Smaller
waste branches may be led directly into a stack fitting.
Where there is an offset (vertical-horizontal- vertical) in the stack, a deaerator fitting, with itspressure-relief line, must be installed. This elimi-nates the need for a deaerator fitting at the baseof the stack if no branches enter the stack below
the stack offset and provided that double in-lineoffsets occur at every nominal floor interval. At a stack offset of less than 60° with the verticalno deaerator fitting is needed.
The following must be observed with regardto fittings in sovent systems:
Connection DWV Fitting
From trap arm to upper Single 90° elbow; for twovertical branch terminal lavatories double elbow
(short turn); for two sinks90° elbow plus a 45° elbow
From vertical branch to Long turn T-Y, 45° wyehorizontal branch and 45° or 90° elbow(exception: soil branchesrequire long turn 90°elbows for all 90°changes in direction)
From horizontal branch Single 90° elbow orto vertical branch double elbow
From horizontal to 45° wye and 45° elbow,horizontal (exception: long turn T-Y or 90° elbowsoil branches require longturn 90° elbows for all90° changes in direction)
From waste branch to stack Sanitary teeFrom branch below the Long turn T-Y or a 45°deaerator fitting to stack, wye and a 45° elbowto building drain, tohorizontal offset or topressure relief line
Pressure-equalizing lines As an alternative tothe sizing procedures previously outlined andincreasing the branch sizes, a pressure-equaliz-ing line may be used. Where this is done, a 1-in.(25.4-mm) or larger line is used to equalize thepressure in the branch by connecting it from the
top of the discharge side of the trap to one of thefollowing locations:
1. The top of the sovent aerator, using a specialinlet in the top of the fitting.
2. The atmosphere, via a run that may also con-nect with similar upper floor fixtures.
3. The stack, at least 3 ft (0.9 m) above the aera-tor at that floor level or immediately below oneat a higher level, using a DWV tee fitting.
Of the three locations, the top of the aerator is the preferred one. The minimum size of thepressure-equalizing line depends on the branchlength, as shown in Table 3-17.
The three recommended vent connection pointsare based on the formula of Prandtl-Colebrook (drain half full, roughness K b = 0.04 in. [1.0 mm]).Fixture units are according to Hunter ’s curve for peak load (NBS Monograph 31).
Building drain connections Each sovent stack normally empties through a deaerator,

8/12/2019 American Society of Plumbing Engineers Volume 2
http://slidepdf.com/reader/full/american-society-of-plumbing-engineers-volume-2 87/233
61Chapter 3— Vents and Venting
which should be installed as close as possible tothe building drain.
The deaerator outlet is connected to the build-ing drain through a long-turn 90° elbow (radiusof at least 1½ diameter), through two 45° elbows
or wyes, or through a long-turn (more than 1½diameter) T-Y fitting. The relief line venting thedeaerator chamber into the horizontal drainshould be 3 in. (76 mm) and should be connectedinto the top of the horizontal drain at least 4 ft (1.2 m) downstream from the base of the stack.Connection of the pressure-relief line into the
top of the building drain is through a 45° wyefitting. (See Figures 3-16 and 3-17.)
The deaerator fitting may be installed at a floor level above the base of the stack if designconditions dictate and no fixtures are attached
into the stack below it. Where this is done, thetraditional rules for connecting the deaerator fit-ting are followed; however, a longer relief line
will be required to reach the prescribed connec-tion point in the horizontal drain. Double in-lineoffsets must be installed in the stack at normalfloor intervals below the deaerator.
Two stacks may be combined before they en-ter the building drain. The size of the continuingcommon stack is determined by the total fixtureloading on the combined stacks. Fixtures may beconnected into the stack immediately below thedeaerator fitting and into the building drain be-
tween the base of the stack and the point wherethe pressure-relief line ties into the building drain.Fixtures may also be connected below a deaerator fitting into a horizontal offset in a stack. Two-in.(51-mm) waste branches may be connected intothe 3-in. (76-mm) deaerator pressure-relief line
by using a Y-branch fitting.
Table 3-17 Minimum Size ofEqualizing Line
Branch Length, Up to 8 Fixture 8–353 Fixtureft (m) Units, in. (mm) Units, in. (mm)
Up to 30 (up to 9.1) 1 (25.4) 1½ (38)
30–40 (9.1–12.2) 1¼ (31) 2 (51)
40–50 (12.2–15.2) 1½ (38) 2 (51)
Over 50 (over 15.2) 2 (51) 3 (76)
Figure 3-16 Soil and Waste Branches Connected below a Deaerator Fitting at the Bottom of the Stack

8/12/2019 American Society of Plumbing Engineers Volume 2
http://slidepdf.com/reader/full/american-society-of-plumbing-engineers-volume-2 88/233
ASPE Data Book — Volume 262
Sovent fitting Two basic types of sovent aera-tor fitting meet the needs of most stack designs:the double-side-entry fitting and the single-side-entry fitting. Face-entry fittings and top-entry fittings are used in special cases. (See Figure3-18.)
Branch inlets can be of any size to accom-modate standard DWV tube. When using thesingle-entry fitting, the inlet connections arenormally 3 in. (76 mm). When the double-side-entry fitting is used, the branch inlet connectionsmay be 4 or 3 in. (101 or 76 mm), depending onthe branch loading. Branches under 3 in. (76mm) in size can be connected into the aerator fittings with 3 and 4-in. (76 and 101-mm) en-tries by using appropriate reducer fittings.
Alternatively, fittings can be ordered to accom-modate smaller branches. However, economical
design is more likely to dictate the use of fittings with waste inlets to take smaller branches.
Consider a typical apartment-house, back-to-back bathroom grouping, as shown in Plan A of Figure 3-19, and assume a ten-story building.Stack size will be 4 in. (101 mm). The branchesare sized and designed as follows:
1. The lavatories, with a trap arm size of 1½ in.(38 mm), are joined into a vertical waste
branch of 2-in. (51-mm) size, according to Table 3-16. Since there is only one verticaldrop in the branch serving the lavatories, it remains 2 in. (51 mm) all the way to the aera-tor fitting waste inlet.
2. Water closets require a minimum soil-branchsize of 3 in. (76 mm). Since the branch serv-ing the two water closets also serves anadditional fixture, it must be increased to 4in. (101 mm) for entry into the aerator fitting.
An alternative design for the branches isshown in Plan B of Figure 3-19, which assumesthat a drop ceiling is not possible and the four
bathrooms must be served by two 4-in. (101-mm)stacks.
Installation The design engineer should explainthe special requirements of the sovent system tothe installer, who may be unfamiliar with them.More detailed drawings may be necessary to de-scribe the system completely. The engineer should make regular inspections to be sure that the design conditions are met in the field. Also,the owner should be given copies of the plumb-ing drawings for permanent records so that future additions can be properly sized.
Figure 3-17 Deaerator Fitting Locatedabove Floor Level of Building Drain
(A) (B)
Figure 3-18 Sovent Fitting: (A) Single-SideEntry (Without Waste Inlets); (B) Double-
Side Entry (with Waste Inlets)
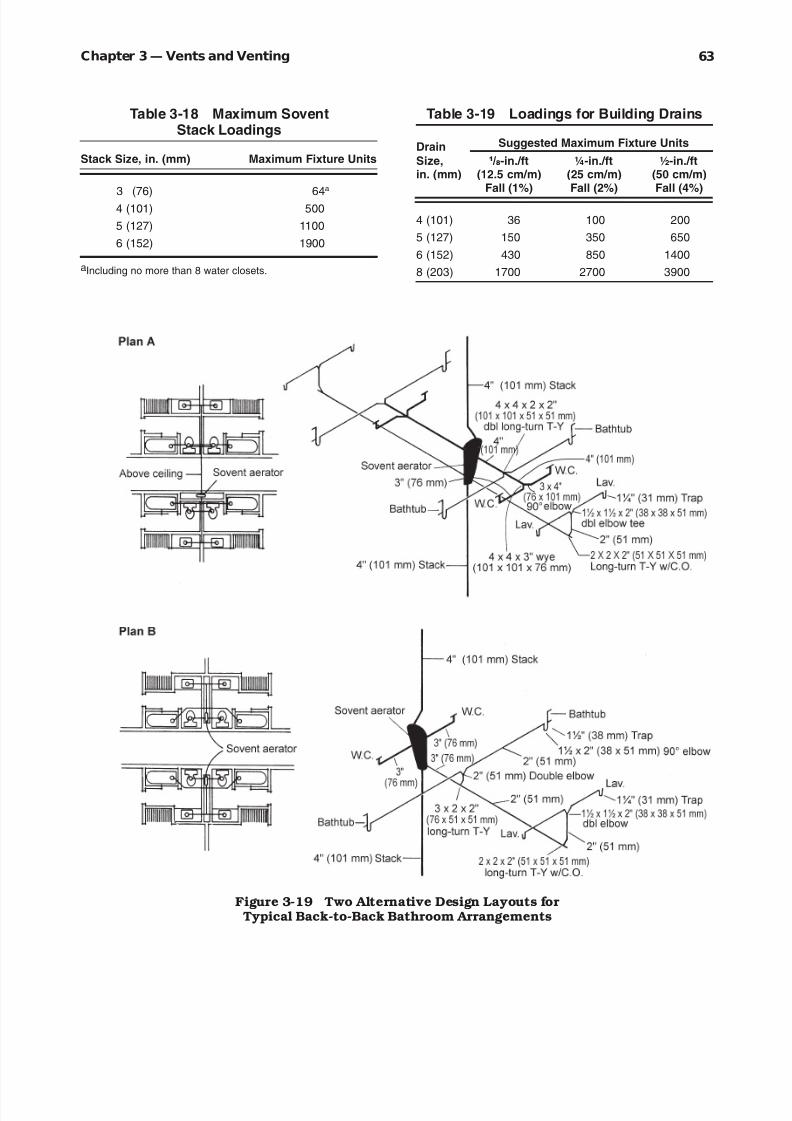
8/12/2019 American Society of Plumbing Engineers Volume 2
http://slidepdf.com/reader/full/american-society-of-plumbing-engineers-volume-2 89/233
63Chapter 3— Vents and Venting
Table 3-18 Maximum SoventStack Loadings
Stack Size, in. (mm) Maximum Fixture Units
3 (76) 64a
4 (101) 500
5 (127) 1100
6 (152) 1900
aIncluding no more than 8 water closets.
Table 3-19 Loadings for Building Drains
Drain Suggested Maximum Fixture Units
Size, -in./ft ¼-in./ft ½-in./ftin. (mm) (12.5 cm/m) (25 cm/m) (50 cm/m)
Fall (1%) Fall (2%) Fall (4%)
4 (101) 36 100 200
5 (127) 150 350 650
6 (152) 430 850 1400
8 (203) 1700 2700 3900
Figure 3-19 Two Alternative Design Layouts for Typical Back-to-Back Bathroom Arrangements

8/12/2019 American Society of Plumbing Engineers Volume 2
http://slidepdf.com/reader/full/american-society-of-plumbing-engineers-volume-2 90/233

8/12/2019 American Society of Plumbing Engineers Volume 2
http://slidepdf.com/reader/full/american-society-of-plumbing-engineers-volume-2 91/233

8/12/2019 American Society of Plumbing Engineers Volume 2
http://slidepdf.com/reader/full/american-society-of-plumbing-engineers-volume-2 92/233
ASPE Data Book — Volume 266

8/12/2019 American Society of Plumbing Engineers Volume 2
http://slidepdf.com/reader/full/american-society-of-plumbing-engineers-volume-2 93/233
67Chapter 4— Storm-Drainage Systems
Storm-
DrainageSystems4GENERAL DESIGN
CONSIDERATIONS FOR BUILDINGS AND SITES
Storm-drainage systems convey rainwater from buildings, surface runoff from all types of pre-cipitation, ground water, and subsurface water.
The drainage may include rainwater from park-ing lots, roadways, roofs of structures, and un-developed areas of a site.
Depending on the approval of the local ad-ministrative authority, some clear-water wastes,such as condensate from HVAC units, untreatedcooling-tower water, ice-machine discharge, and
pond overflow, may be allowed to be conductedto the storm-drainage system. These dischargesmust exclude any chemicals or sanitary flow.
If any oils are directed to the storm system,an oil separator must be provided to separatethe oils prior to discharge to a public storm sys-tem. The local authority must approve all drain-age plans, including detention and outfallstructures, and must issue permits.
Building sites should be provided with a means for draining water from roofs, paved ar-eas, areaways, yards, and all other areas where
the collection or uncontrolled flow of rainwater could cause damage to a building, overload localstreams, or present a hazard to the public. Thestorm-drainage systems should provide a con-duit or channel from the point of collection to anapproved point of disposal, usually a public stormsewer system or drainage canals.
If the building storm-drainage system is at a lower elevation than the public storm sewer sys-
tem, not allowing for gravity drainage, the drain-
age must be pumped. When a public means of disposal is not available, the discharge should be directed to a safe point of disposal as approved by the jurisdictional authority for storm-water control.
The storm sewer should be separate from thesanitary sewer system unless there is an ap-proved combined storm/sanitary sewer systemavailable. Such systems have become a rarity
because of the additional loads imposed on themunicipal sewage disposal plants; also, overflow could cause direct contamination of the localstreams and waterways. Federal government
regulations prohibit the use of combined sewersfor any public system that receives federal fund-ing. Controlled-flow storm-drainage systemsshould be considered in all combined storm/sani-tary sewer systems.
If the storm-drainage piping does connect tothe sanitary sewer, the storm drain must be prop-erly trapped prior to its connection. Storm-drain-age stacks do not require venting because thereis no need to control hydraulic or pneumatic pres-sures within any fixed limits. Negative pressuresoccur at the top of the stack and positive pres-sures exist at the bottom of the stack. Becausethe stack is not vented, pressures can becomerather high, creating turbulence at the base of the stack known as the “hydraulic jump” phe-nomenon. In general, supercritical flow can bechanged to subcritical flow only by passingthrough a hydraulic jump. The extreme turbu-lence in a hydraulic jump will dissipate energy rapidly, causing a sharp drop in the total head
between the supercritical and subcritical states

8/12/2019 American Society of Plumbing Engineers Volume 2
http://slidepdf.com/reader/full/american-society-of-plumbing-engineers-volume-2 94/233
ASPE Data Book — Volume 268
of flow. No connections should be made withinthe area where hydraulic jump may occur.
It may be more advantageous to route thestorm and sanitary mains separately to the ex-terior of the building before they are tied together
in the combined system, with a trap separatingthe systems. Traps should be either located in-side the building or buried, with access, below the frostline to prevent freezing. Connection of the storm leaders to the sanitary sewer should
be a minimum of 10 ft (3.1 m) downstream fromany sanitary connection to prevent the hydrau-lic jump from disrupting flow when the stormdrains are discharging and causing backups inthe sanitary system.
Rainwater is normally conveyed from the area being drained at the same rate at which it iscollected, unless controlled-flow systems are uti-
lized to alleviate overtaxation of the public stormsewers. The rate of the water flow to be drainedis determined by the size of the area beingdrained, the roughness coefficient and infiltra-tion rate of the area being drained, and the rateof rainfall. Rainfall intensity charts published by the National Weather Service and the adminis-trative authority having jurisdiction should beconsulted when determining the rate of rainfallfor the area of the country in which a building is
being constructed.
Ponding may be allowable in areas such as a paved schoolyard, where it would cause few prob-lems because of the normal inactivity in a schoolyard during rainy periods. If the structurecannot tolerate the additional weight imposed
by the ponding of the water or if the ponding of water may cause a hazard to the public, the morestringent of design considerations may be ap-propriate.
Similar to the requirements for sanitary sys-tems and per the local code authority, all sys-tems must be properly tested upon completion.
MATERIALSMaterials for aboveground piping in buildingsshould be brass, copper pipe or tube type DWV,cast-iron, galvanized or black steel, lead, alumi-num, ABS or PVC-DWV. Care should be takenin the use of plastic piping because of its higher expansion and contraction characteristics, re-quired supports, and possible noise problems.Exposed leaders or downspouts should be ca-
pable of withstanding all anticipated abuses,corrosion, weather, and expected expansion andcontraction.
Underground piping should be of cast iron(service or extra-heavy weight, depending on the
loads exerted on the pipe), ductile iron, hard-temper copper, aluminum, ABS, PVC-DWV, con-crete or extra-strength vitrified clay. If plasticpiping is used, a proper class B bedding must beprovided for adequate laying and support of thepipe. Plastic piping does not have the scour re-sistance of metal piping, especially at the baseelbow. Aluminum pipe and other metallic pipein corrosive soils must be wrapped or coated.Piping cast in columns should be type L copper or plastic. All materials must be approved by thelocal code body. See other Data Book chapterson piping and drainage for data on pipe sched-
ules, joining methods, plumbing drains, etc.
PART ONE: BUILDING DRAINAGESYSTEM DESIGN
The design of drainage systems should be basedon sound engineering judgment with standardengineering methods governing the basic aspectsof drainage systems. Special local conditions,
building and site characteristics, and code au-thority requirements may necessitate a uniquedesign. The designer should keep in mind that the codes are minimum standards only. All de-signs must meet, or exceed , the local code re-quirements.
Design Criteria
The following items should be considered whenestablishing the design criteria:
1. Local climatic conditions. Rainfall rate, snow depth, freezing conditions, frost line, etc., asdetermined from National Weather Servicepublications.
2. Building construction. Type of roof, pattern of
drainage slopes, vertical wall heights, para-pet heights, scupper sizes and locations,emergency drain requirements and locations,pipe space allocations in the ceiling space,
wall and chase locations, etc.
3. Departments having jurisdiction. Design rain-fall rate, minimum pipe size and slope, over-flow requirements, extent of overflow pipe anddischarge requirements, method of connec-
8/12/2019 American Society of Plumbing Engineers Volume 2
http://slidepdf.com/reader/full/american-society-of-plumbing-engineers-volume-2 95/233
69Chapter 4— Storm-Drainage Systems
tion to the public storm sewer, safe methodof disposal if the public storm sewer is not available, controlled-flow roof drainage, re-tention/detention, etc.
4. Site conditions. Location, size, topography and
elevation, soil conditions and type, water table, location and pipe material of publicstorm sewer, location of existing manholes,location of other utilities within the site, etc.
Pipe Sizing and Layout
The storm-drainage system(s) required for a building and site of simple design are shown inFigures 4-1 and 4-2. The following points should
be considered:
1. Roof drains and pipe sizing are based on thecollection areas, the slope of the pipe, and
the rainfall rate.2. Overflow drains and piping are equivalent to
the roof drains served, and the basis of thesizing is the same as it is for roof drains.
These drains should be piped separately fromthe primary system to a separate disposalpoint so that blockage of the primary drain-age system will not affect the overflow drain-age system.
3. The collection area for deck and balcony drains, where there is an adjacent vertical
wall face, is based on the horizontal collec-
tion area plus a percentage of the adjacent vertical wall areas.
4. The sizes of the mains are based on the ac-cumulated flows of the drains and drain lead-ers upstream.
5. The building storm-drain size is based on thetotal of the horizontal collection areas plus a percentage of the vertical wall areas on theone side of the building that contributes thegreatest flow.
6. Sizes of mains downstream of sump pumpsare based on the accumulated flows of grav-
ity drains upstream plus the discharge ca-pacity of any sump pumps upstream.
7. The pipe size of the sump pump discharge is based on the capacity of the pump but is nor-mally the same as the discharge pipe size of the pump. For duplex pumps that may oper-ate simultaneously, the combined dischargecapacity should be used. The discharge pipeshould connect to the horizontal storm maina minimum of 10 ft (3.3 m) downstream of
the base of any stack, as high pressure canexist in this zone due to hydraulic jump.
8. The size of the building overflow storm drainis based on the accumulated flow from theoverflow drain leaders upstream. Means for
the disposal of the overflow drain dischargemust meet the requirements of the localcodes. Local codes may not allow open dis-charge on the street, especially in northernclimates; therefore, it may be necessary totie to the public storm sewer separately fromthe primary drainage system. Both may berouted to the same manhole but with sepa-rate inlets.
9. The size of the area drain piping is based onthe collection area plus a percentage of theadjacent wall areas draining into the collec-tion area.
10. The size of an areaway or stairwell drain pip-ing is based on the collection area plus a per-centage of the adjacent wall areas not previously calculated draining into the area-
way or stairwell.
11. The size of the catch basin piping is basedon the “rational method” (see discussion un-der “Site Drainage” in Part Two of this chap-ter).
12. The size of the storm drain from the catch basins is based on the cumulative flows fromthe catch basins upstream.
13. The drain from the lower-level deck drainshould connect to the horizontal storm maina minimum of 10 ft (3.3 m) downstream of the base of any stack, as high pressure canexist in this zone due to hydraulic jump.
Rainfall Rates
Rainfall rate tables Table 4-1 lists the maxi-mum rainfall rates for various US cities. Theserates are also listed for various rainfall intensi-ties, both in duration length and in return pe-riod. Table 4-1 allows the selection of a precipitation-frequency value for a 10-year or 100-year return period with durations of 5 min,15 min, or 60 min. Other return periods anddurations can be selected by interpolation be-tween the values listed, as follows:
Equation 4-1
10-min value = 0.59 (15-min value) +0.41 (5-min value)

8/12/2019 American Society of Plumbing Engineers Volume 2
http://slidepdf.com/reader/full/american-society-of-plumbing-engineers-volume-2 96/233
ASPE Data Book — Volume 270
Equation 4-2
30-min value = 0.49 (60-min value) +0.51 (15-min value)
The “return period” determines the rainfallhistory used in the calculations and is theestimated average period of time between occur-rences of a rainfall rate that equals or exceedsthe design condition. A 100-year return period
will include heavier storms than a 10-year re-turn period and requires the use of a heavier rainfall intensity.
The “duration” determines the length of timeto be utilized in the rainfall calculations. Nor-mally, the intensity of a storm is much heavier taken over a shorter duration and decreases asthe storm progresses. During a flash flood or summer storm, a deluge of precipitation may occur for a short duration and taper off. There-fore, the amount of rainfall for a 5-min dura-tion, projected over a 60-min period where the
rainfall rate is averaged over the period, is sig-nificantly heavier than a 60-min duration totalfor a 60-min period.
The local code having jurisdiction should beconsulted to determine the rate of rainfall that is applicable for the design areas. A minimumdesign should be for a 10-year, 5-min storm for the building roof and for the site.
Design for the most stringent rainfall inten-sities may not be necessary if a secondary drain-age system is provided, such as scuppers in a parapet wall or a separately piped secondary drainage system, that will accept the overflow.
Therefore, the design may be based on a moreliberal design storm of a 100-year return period,60-min duration, as opposed to a more conser-
vative 100-year return period, 5-min duration.
Secondary drainage systems Some codes re-quire that the primary drainage system be de-signed for the less stringent value, with the
Figure 4-1 Piping Layout for Typical Building Elevation
Note : A = Roof drains and pipe, B = Overflow drains andpiping, C = Collection area for deck and balcony drains, D =Storm leaders, E = Building storm drain, F = Main down-stream of sump pump, G = Sump pump discharge, H =Building overflow storm drain, I = Area drain piping, J =
Area-way/stairwell drain piping, M = Connection of lower deck drain to horizontal storm main.
Figure 4-2 Piping Layout for Typical Building Site Plan
Note: E = Building storm drain, H = Building overflow stormdrain, I = Area drain piping, J = Area-way/stairwell drainpiping, K = Catch basin piping, L = Storm drain from thecatch basin.

8/12/2019 American Society of Plumbing Engineers Volume 2
http://slidepdf.com/reader/full/american-society-of-plumbing-engineers-volume-2 97/233

8/12/2019 American Society of Plumbing Engineers Volume 2
http://slidepdf.com/reader/full/american-society-of-plumbing-engineers-volume-2 98/233
ASPE Data Book — Volume 272
New Haven 9.00 (228.6) 6.00 (152.4) 3.0 6.42 (163.1)
Delaware:Dover 9.48 (240.8) 7.00 (177.8) 3.5 (88.9) 6.93 (176.1)
District of Columbia:
Washington 9.72 (246.9) 7.22 (183.4) 4.0 (101.6) 7.10 (180.4)
Florida:
Jacksonville 10.08 (256.0) 8.08 (205.2) 4.3 (109.2) 7.86 (199.6)
Key West 9.12 (231.6) 7.24 (183.9) 4.28 (108.7) 7.07 (179.6)
Miami 9.84 (249.9) 8.80 (223.5) 4.5 (114.3) 7.69 (195.4)
Orlando 10.80 (274.3) 8.40 (213.4) 4.50 (114.3) 8.42 (213.9)
Pensacola 10.80 (274.3) 8.08 (205.2) 4.60 (116.8) 8.18 (207.8)
Tampa 10.80 (274.3) 8.40 (213.4) 4.2 (106.7) 8.33 (211.6)
Tallahassee 10.50 (266.7) 8.04 (204.2) 4.1 8.05 (204.4)
Georgia:
Atlanta 9.90 (251.5) 7.12 (180.9) 3.5 (88.9) 7.33 (186.2)
Augusta 9.84 (249.9) 7.20 (182.9) 4.00 (101.6) 7.33 (186.2)
Macon 10.08 (256.0) 7.40 (188.0) 3.7 (94.0) 7.62 (193.6)
Savannah 9.60 (243.8) 7.60 (193.0) 4.0 (101.6) 7.44 (188.9)
Thomasville 10.44 (265.2) 7.88 (200.2) 4.0 (101.6) 7.96 (202.2)
Hawaii: Use NOAA atlas for detailed 3.00 (76.2) 5.2 (132.1)
Honolulu state precipitation map.
Idaho:
Boise Use NOAA atlas for detailed 1.0 (25.4) 2.7 (68.6)
Lewiston state precipitation map. 1.0 (25.4) 3.1 (78.7)
Pocatello 1.20 (30.5) 3.7 (94.0)
Illinois:
Cairo 9.84 (249.9) 6.96 (176.8) 3.40 (86.4) 7.16 (181.8)
Chicago 9.30 (236.2) 6.60 (167.6) 2.7 (68.6) 6.76 (171.8)
Peoria 9.72 (246.9) 6.88 (174.8) 2.9 () 7.04 (178.9)
Springfield 9.84 (249.9) 7.12 (180.9) 3.0 (76.2) 7.10 (180.3)
Indiana:
Evansville 9.72 (246.9) 6.80 (172.7) 3.0 (76.2) 7.04 (178.9)
Ft. Wayne 9.24 (234.7) 6.48 (164.6) 2.85 (72.4) 6.65 (168.9)
(Table 4-1 continued) Frequency and Duration of Storm
100-Yr., 5 Min. 100-Yr., 15-Min. 100-Yr., 60-Min. 10-Yr., 5-Min.
(Continued)
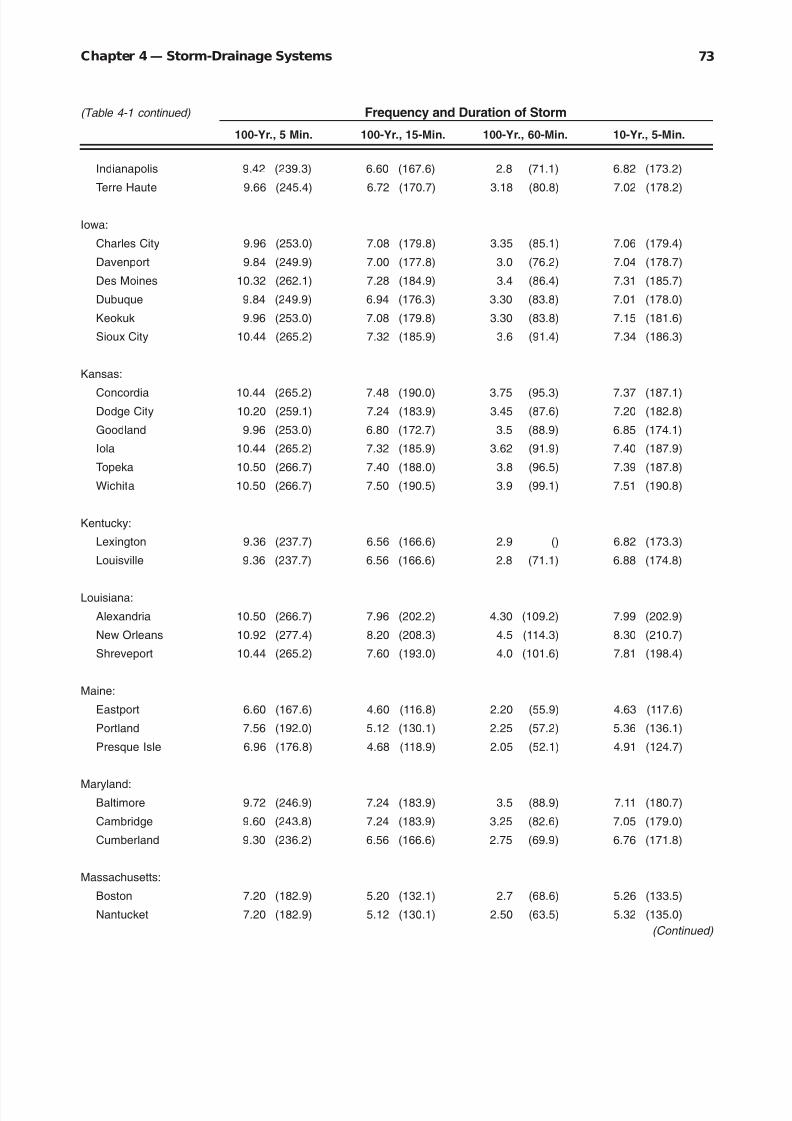
8/12/2019 American Society of Plumbing Engineers Volume 2
http://slidepdf.com/reader/full/american-society-of-plumbing-engineers-volume-2 99/233
73Chapter 4— Storm-Drainage Systems
Indianapolis 9.42 (239.3) 6.60 (167.6) 2.8 (71.1) 6.82 (173.2)
Terre Haute 9.66 (245.4) 6.72 (170.7) 3.18 (80.8) 7.02 (178.2)
Iowa:
Charles City 9.96 (253.0) 7.08 (179.8) 3.35 (85.1) 7.06 (179.4)
Davenport 9.84 (249.9) 7.00 (177.8) 3.0 (76.2) 7.04 (178.7)
Des Moines 10.32 (262.1) 7.28 (184.9) 3.4 (86.4) 7.31 (185.7)
Dubuque 9.84 (249.9) 6.94 (176.3) 3.30 (83.8) 7.01 (178.0)
Keokuk 9.96 (253.0) 7.08 (179.8) 3.30 (83.8) 7.15 (181.6)
Sioux City 10.44 (265.2) 7.32 (185.9) 3.6 (91.4) 7.34 (186.3)
Kansas:
Concordia 10.44 (265.2) 7.48 (190.0) 3.75 (95.3) 7.37 (187.1)Dodge City 10.20 (259.1) 7.24 (183.9) 3.45 (87.6) 7.20 (182.8)
Goodland 9.96 (253.0) 6.80 (172.7) 3.5 (88.9) 6.85 (174.1)
Iola 10.44 (265.2) 7.32 (185.9) 3.62 (91.9) 7.40 (187.9)
Topeka 10.50 (266.7) 7.40 (188.0) 3.8 (96.5) 7.39 (187.8)
Wichita 10.50 (266.7) 7.50 (190.5) 3.9 (99.1) 7.51 (190.8)
Kentucky:
Lexington 9.36 (237.7) 6.56 (166.6) 2.9 () 6.82 (173.3)
Louisville 9.36 (237.7) 6.56 (166.6) 2.8 (71.1) 6.88 (174.8)
Louisiana:
Alexandria 10.50 (266.7) 7.96 (202.2) 4.30 (109.2) 7.99 (202.9)
New Orleans 10.92 (277.4) 8.20 (208.3) 4.5 (114.3) 8.30 (210.7)
Shreveport 10.44 (265.2) 7.60 (193.0) 4.0 (101.6) 7.81 (198.4)
Maine:
Eastport 6.60 (167.6) 4.60 (116.8) 2.20 (55.9) 4.63 (117.6)
Portland 7.56 (192.0) 5.12 (130.1) 2.25 (57.2) 5.36 (136.1)
Presque Isle 6.96 (176.8) 4.68 (118.9) 2.05 (52.1) 4.91 (124.7)
Maryland:Baltimore 9.72 (246.9) 7.24 (183.9) 3.5 (88.9) 7.11 (180.7)
Cambridge 9.60 (243.8) 7.24 (183.9) 3.25 (82.6) 7.05 (179.0)
Cumberland 9.30 (236.2) 6.56 (166.6) 2.75 (69.9) 6.76 (171.8)
Massachusetts:
Boston 7.20 (182.9) 5.20 (132.1) 2.7 (68.6) 5.26 (133.5)
Nantucket 7.20 (182.9) 5.12 (130.1) 2.50 (63.5) 5.32 (135.0)
(Continued)
(Table 4-1 continued) Frequency and Duration of Storm
100-Yr., 5 Min. 100-Yr., 15-Min. 100-Yr., 60-Min. 10-Yr., 5-Min.

8/12/2019 American Society of Plumbing Engineers Volume 2
http://slidepdf.com/reader/full/american-society-of-plumbing-engineers-volume-2 100/233
ASPE Data Book — Volume 274
Springfield 8.64 (219.5) 6.00 (152.4) 2.70 (68.6) 6.20 (157.5)
Michigan:
Alpena 8.64 (219.5) 5.60 (142.2) 2.50 (63.5) 6.02 (153.0)
Detroit 8.88 (225.6) 5.92 (150.4) 2.5 (63.5) 6.37 (161.7)
Escanaba 8.88 (225.6) 5.60 (142.2) 2.40 (61.0) 6.22 (158.0)
Grand Rapids 9.00 (228.6) 6.00 (152.4) 2.6 (66.0) 6.48 (164.6)
Houghton 8.40 (213.4) 5.20 (132.1) 2.40 (61.0) 6.00 (152.5)
Lansing 9.24 (234.7) 6.10 (154.9) 2.80 (71.1) 6.62 (168.1)
Marquette 8.40 (213.4) 5.20 (132.1) 2.40 (61.0) 5.97 (151.7)
Port Huron 8.76 (222.5) 5.80 (147.3) 2.70 (68.6) 6.31 (160.4)
Ste. Marie 7.80 (198.1) 5.20 (132.1) 2.25 (57.2) 5.59 (141.9)
Minnesota:
Duluth 9.48 (240.8) 6.40 (162.6) 2.6 (66.0) 6.70 (170.1)
Minneapolis 9.96 (253.0) 6.88 (174.8) 3.0 (76.2) 7.00 (177.8)
Moorhead 10.02 (254.4) 6.88 (174.8) 3.20 (81.3) 6.88 (174.7)
Worthington 10.50 (266.7) 7.30 (185.4) 3.4 (86.4) 7.29 (185.2)
Mississippi:
Biloxi 11.04 (280.4) 8.10 (205.7) 4.5 (114.3) 8.35 (212.1)
Meridian 10.32 (262.1) 7.64 (194.1) 4.05 (102.9) 7.82 (198.6)
Tupeto 9.96 (253.0) 7.20 (182.9) 3.60 (91.4) 7.72 (196.0)
Vicksburg 10.44 (265.2) 7.68 (195.1) 4.20 (106.7) 7.87 (199.9)
Missouri:
Columbia 10.08 (256.0) 7.20 (182.9) 3.80 (96.5) 7.20 (183.0)
Hannibal 10.02 (254.5) 7.08 (179.8) 3.75 (95.3) 7.18 (182.3)
Kansas City 10.44 (265.2) 7.34 (186.4) 3.65 (92.7) 7.37 (187.1)
Poplar Bluff 9.96 (253.0) 7.08 (179.8) 3.55 (90.2) 7.27 (184.6)
St. Joseph 10.44 (265.2) 7.36 (186.9) 3.65 (92.7) 7.37 (187.1)
St. Louis 9.90 (251.5) 7.00 (177.8) 3.2 (81.3) 7.12 (180.9)
Springfield 10.14 (257.6) 7.20 (182.9) 3.7 (94.0) 7.23 (183.7)
Montana:
Havre 1.60 (40.6) 4.30 (109.2)
Helena Use NOAA atlas for detailed 1.50 (38.1) 3.80 (96.5)
Kalispell state precipitation map. 1.20 (30.5) 3.30 (83.8)
Miles City 2.15 (54.6) 7.00 (177.8)
Missoula 1.30 (33.0) 2.70 (68.6)
(Continued)
(Table 4-1 continued) Frequency and Duration of Storm
100-Yr., 5 Min. 100-Yr., 15-Min. 100-Yr., 60-Min. 10-Yr., 5-Min.

8/12/2019 American Society of Plumbing Engineers Volume 2
http://slidepdf.com/reader/full/american-society-of-plumbing-engineers-volume-2 101/233
75Chapter 4— Storm-Drainage Systems
Nebraska:
Lincoln 10.50 (266.1) 7.44 (189.0) 3.80 (96.5) 7.39 (187.8)
North Platte 10.02 (254.5) 6.80 (172.7) 3.35 (85.1) 6.88 (174.7)
Omaha 10.50 (266.1) 7.38 (187.5) 3.6 (91.4) 7.39 (187.8)
Scottsbluff 9.60 (243.8) 6.40 (162.6) 3.15 (80.0) 6.41 (162.7)
Valentine 9.96 (253.0) 6.84 (173.7) 3.25 (82.6) 6.78 (172.2)
Nevada:
Reno Use NOAA atlas for detailed 1.2 (30.5) 3.20 (81.3)
Tonopah state precipitation map. 1.00 (25.4) 3.00 (76.2)
Winnemucca 1.00 (25.4) 2.70 (68.6)
New Hampshire:
Berlin 7.80 (198.1) 5.36 (136.1) 2.2 (55.9) 5.64 (143.4)
Concord 7.92 (201.2) 5.60 (142.2) 2.50 (63.5) 5.73 (145.5)
New Jersey:
Atlantic City 9.36 (237.7) 6.72 (170.7) 3.4 (86.4) 6.82 (173.3)
Paterson 9.24 (234.7) 6.52 (165.6) 3.00 (76.2) 6.65 (168.9)
Trenton 9.30 (236.2) 6.72 (170.7) 3.2 (81.3) 6.71 (170.3)
New Mexico:
Albuquerque Use NOAA atlas for detailed 2.00 (50.8) 3.70 (94.0)
Roswell state precipitation map. 2.60 (66.0) 5.40 (137.2)
Santa Fe 2.00 (50.8) 4.40 (111.8)
New York:
Albany 9.12 (231.6) 6.24 (158.5) 2.50 (63.5) 6.48 (164.5)
Binghamton 8.82 (224.0) 5.72 (145.3) 2.4 (61.0) 6.34 (161.1)
Buffalo 8.40 (213.4) 5.34 (135.6) 2.30 (58.4) 5.97 (151.7)
Canton 8.10 (205.7) 5.24 (133.1) 2.25 (57.2) 5.84 (148.3)
Messena 7.86 (199.6) 5.20 (132.1) 2.25 (57.2) 5.61 (142.6)
New York 9.24 (234.7) 6.40 (162.6) 3.1 (78.7) 6.65 (168.9)
Oswego 8.28 (210.3) 5.50 (139.7) 2.20 (55.9) 5.81 (147.6)Rochester 8.28 (210.3) 5.20 (132.1) 2.20 (55.9) 5.80 (147.3)
Syracuse 8.64 (219.5) 5.32 (135.1) 2.4 (61.0) 6.06 (154.0)
North Carolina:
Asheville 9.60 (243.8) 6.84 (173.7) 3.2 (81.3) 6.99 (177.5)
Charlotte 9.84 (249.9) 6.92 (175.8) 3.4 (86.4) 7.24 (183.9)
Greensboro 9.84 (249.9) 7.00 (177.8) 3.30 (83.8) 7.22 (183.4)(Continued)
(Table 4-1 continued) Frequency and Duration of Storm
100-Yr., 5 Min. 100-Yr., 15-Min. 100-Yr., 60-Min. 10-Yr., 5-Min.
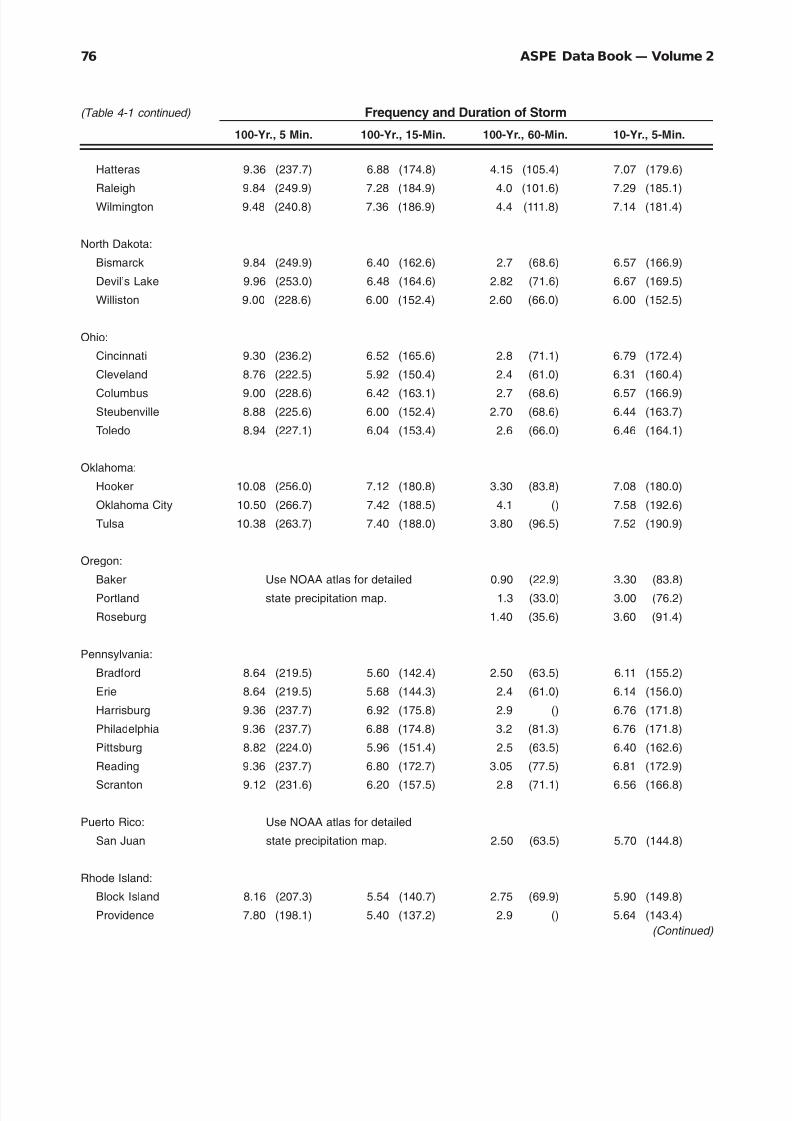
8/12/2019 American Society of Plumbing Engineers Volume 2
http://slidepdf.com/reader/full/american-society-of-plumbing-engineers-volume-2 102/233
ASPE Data Book — Volume 276
Hatteras 9.36 (237.7) 6.88 (174.8) 4.15 (105.4) 7.07 (179.6)
Raleigh 9.84 (249.9) 7.28 (184.9) 4.0 (101.6) 7.29 (185.1)
Wilmington 9.48 (240.8) 7.36 (186.9) 4.4 (111.8) 7.14 (181.4)
North Dakota:
Bismarck 9.84 (249.9) 6.40 (162.6) 2.7 (68.6) 6.57 (166.9)
Devil’s Lake 9.96 (253.0) 6.48 (164.6) 2.82 (71.6) 6.67 (169.5)
Williston 9.00 (228.6) 6.00 (152.4) 2.60 (66.0) 6.00 (152.5)
Ohio:
Cincinnati 9.30 (236.2) 6.52 (165.6) 2.8 (71.1) 6.79 (172.4)
Cleveland 8.76 (222.5) 5.92 (150.4) 2.4 (61.0) 6.31 (160.4)
Columbus 9.00 (228.6) 6.42 (163.1) 2.7 (68.6) 6.57 (166.9)Steubenville 8.88 (225.6) 6.00 (152.4) 2.70 (68.6) 6.44 (163.7)
Toledo 8.94 (227.1) 6.04 (153.4) 2.6 (66.0) 6.46 (164.1)
Oklahoma:
Hooker 10.08 (256.0) 7.12 (180.8) 3.30 (83.8) 7.08 (180.0)
Oklahoma City 10.50 (266.7) 7.42 (188.5) 4.1 () 7.58 (192.6)
Tulsa 10.38 (263.7) 7.40 (188.0) 3.80 (96.5) 7.52 (190.9)
Oregon:
Baker Use NOAA atlas for detailed 0.90 (22.9) 3.30 (83.8)
Portland state precipitation map. 1.3 (33.0) 3.00 (76.2)
Roseburg 1.40 (35.6) 3.60 (91.4)
Pennsylvania:
Bradford 8.64 (219.5) 5.60 (142.4) 2.50 (63.5) 6.11 (155.2)
Erie 8.64 (219.5) 5.68 (144.3) 2.4 (61.0) 6.14 (156.0)
Harrisburg 9.36 (237.7) 6.92 (175.8) 2.9 () 6.76 (171.8)
Philadelphia 9.36 (237.7) 6.88 (174.8) 3.2 (81.3) 6.76 (171.8)
Pittsburg 8.82 (224.0) 5.96 (151.4) 2.5 (63.5) 6.40 (162.6)
Reading 9.36 (237.7) 6.80 (172.7) 3.05 (77.5) 6.81 (172.9)
Scranton 9.12 (231.6) 6.20 (157.5) 2.8 (71.1) 6.56 (166.8)
Puerto Rico: Use NOAA atlas for detailed
San Juan state precipitation map. 2.50 (63.5) 5.70 (144.8)
Rhode Island:
Block Island 8.16 (207.3) 5.54 (140.7) 2.75 (69.9) 5.90 (149.8)
Providence 7.80 (198.1) 5.40 (137.2) 2.9 () 5.64 (143.4)
(Continued)
(Table 4-1 continued) Frequency and Duration of Storm
100-Yr., 5 Min. 100-Yr., 15-Min. 100-Yr., 60-Min. 10-Yr., 5-Min.

8/12/2019 American Society of Plumbing Engineers Volume 2
http://slidepdf.com/reader/full/american-society-of-plumbing-engineers-volume-2 103/233
77Chapter 4— Storm-Drainage Systems
South Carolina:
Charleston 9.36 (237.7) 7.48 (190.0) 4.1 () 7.24 (183.8)
Columbia 9.90 (251.5) 6.40 (162.6) 3.5 (88.9) 7.35 (186.6)
Greenville 9.84 (249.9) 7.36 (186.9) 3.3 (83.8) 7.17 (182.1)
South Dakota:
Aberdeen 10.02 (254.5) 7.08 (179.8) 3.30 (83.8) 6.82 (173.2)
Pierre 9.90 (251.5) 6.80 (172.7) 3.10 (78.7) 6.69 (169.9)
Rapid City 9.84 (249.9) 6.36 (161.5) 2.7 (68.6) 6.51 (165.4)
Yankton 10.44 (265.2) 7.28 (184.9) 3.62 (91.9) 7.25 (184.1)
Tennessee:
Chattanooga 9.84 (249.9) 7.00 (177.8) 3.50 (88.9) 7.32 (188.9)Knoxville 9.00 (228.6) 6.60 (167.6) 3.1 (78.7) 6.66 (169.2)
Memphis 9.96 (253.0) 7.14 (181.4) 3.5 (88.9) 7.37 (187.3)
Nashville 9.84 (249.9) 6.92 (175.8) 3.0 (76.2) 7.10 (180.3)
Texas:
Abilene 10.38 (263.7) 7.32 (185.9) 3.70 (94.0) 7.43 (188.7)
Amarillo 10.20 (259.1) 7.24 (183.9) 3.55 (90.2) 7.30 (185.4)
Austin 10.50 (266.7) 7.68 (195.1) 4.25 (108.0) 7.69 (195.3)
Brownsville 10.68 (271.3) 7.92 (201.2) 4.40 (111.8) 7.89 (200.4)
Corpus Christi 10.68 (271.3) 8.00 (203.2) 4.6 (116.8) 7.92 (201.2)
Dallas 10.50 (266.7) 7.50 (190.5) 4.2 (106.7) 7.63 (193.8)
Del Rio 10.20 (259.1) 7.29 (185.1) 4.00 (101.6) 7.32 (186.0)
El Paso 6.60 (167.6) 5.60 (142.2) 2.0 (50.8) 4.57 (116.1)
Fort Worth 10.50 (266.7) 7.50 (190.5) 3.90 (99.1) 7.60 (193.1)
Galveston 10.92 (277.4) 8.10 (205.7) 4.70 (119.4) 8.30 (210.7)
Houston 10.80 (274.3) 8.04 (204.2) 4.5 (114.3) 8.18 (207.8)
Palestine 10.44 (265.2) 7.60 (193.0) 4.00 (101.6) 7.79 (197.8)
Port Arthur 10.92 (277.4) 8.08 (205.2) 4.65 (118.1) 8.30 (210.7)
San Antonio 10.50 (266.7) 7.70 (195.6) 4.4 (111.8) 7.61 (193.2)
Tyler 10.38 (263.7) 7.52 (191.0) 3.90 (99.1) 7.76 (197.0)
Utah:
Modena Use NOAA atlas for detailed 1.50 (38.1) 3.80 (96.5)
Salt Lake City state precipitation map. 1.30 (33.0) 3.40 (86.4)
Vermont:
Brattleboro 8.40 (213.4) 5.88 (149.4) 2.40 (61.0) 6.02 (152.9)
Burlington 8.16 (207.3) 5.52 (140.2) 2.3 () 5.75 (146.0)
(Continued)
(Table 4-1 continued) Frequency and Duration of Storm
100-Yr., 5 Min. 100-Yr., 15-Min. 100-Yr., 60-Min. 10-Yr., 5-Min.

8/12/2019 American Society of Plumbing Engineers Volume 2
http://slidepdf.com/reader/full/american-society-of-plumbing-engineers-volume-2 104/233
ASPE Data Book — Volume 278
Rutland 8.28 (210.3) 5.60 (142.2) 2.4 (61.0) 5.92 (150.4)
Virginia:
Lynchburg 9.60 (243.8) 6.56 (166.6) 2.75 (69.9) 7.06 (179.3)
Norfolk 9.54 (242.3) 7.20 (182.9) 4.0 (101.6) 7.11 (180.6)
Richmond 9.84 (249.9) 7.28 (184.9) 4.0 (101.6) 7.23 (183.6)
Winchester 9.48 (240.8) 6.68 (169.7) 2.75 (69.9) 6.88 (174.6)
Wytheville 9.30 (236.2) 6.50 (165.1) 3.25 (82.6) 6.76 (171.8)
Washington:
North Head 1.00 (25.4) 2.80 (71.1)
Port Angeles 1.10 (27.9) 2.20 (55.9)
Seattle Use NOAA atlas for detailed 1.0 (25.4) 2.20 (55.9)Spokane state precipitation map. 1.00 (25.4) 3.10 (78.7)
Tacoma 1.00 (25.4) 2.80 (71.1)
Tatoosh Island 1.00 (25.4) 3.20 (81.3)
Walla Walla 1.00 (25.4) 2.70 (68.6)
Yakima 1.10 (27.9) 2.60 (66.0)
West Virginia:
Charleston 9.00 (228.6) 6.34 (161.0) 2.9 () 6.57 (166.9)
Elkins 8.94 (227.1) 6.32 (160.5) 2.75 (69.9) 6.53 (165.8)
Parkersburg 9.06 (230.1) 6.34 (161.0) 2.75 (69.9) 6.62 (168.0)
Wisconsin:
Green Bay 9.00 (228.6) 6.12 (155.4) 2.5 (63.5) 6.42 (163.1)
LaCrosse 9.84 (249.9) 6.90 (175.3) 2.9 () 6.98 (177.2)
Madison 9.48 (240.8) 6.70 (170.2) 3.12 (79.2) 6.79 (172.4)
Milwaukee 9.12 (231.6) 6.48 (164.6) 2.7 (68.6) 6.60 (167.7)
Spooner 9.66 (245.4) 6.52 (165.6) 2.85 (72.4) 6.81 (172.9)
Wyoming:
Cheyenne 2.5 (63.5) 5.60 (142.2)
Lander Use NOAA atlas for detailed 1.50 (38.1) 3.70 (94.0)Sheridan state precipitation map. 1.70 (43.2) 5.20 (132.1)
Yellowstone Park 1.40 (35.6) 2.50 (63.5)
Sources : Table 4-1 is based on the National Oceanic and Atmospheric Administration Technical Memorandum NWS HYDRO-35, except forthe 12 western states. NWS Technical Paper no. 25 was used for the following 12 western states: Arizona, California, Colorado, Hawaii,Idaho, Montana, Nevada, New Mexico, Oregon, Utah, Washington, and Wyoming. The NOAA Atlas 2: Precipitation – Frequency Atlas of the Western United States (11 Volumes, 1973) should also be utilized in the design for the 12 western states.
(Table 4-1 continued) Frequency and Duration of Storm
100-Yr., 5 Min. 100-Yr., 15-Min. 100-Yr., 60-Min. 10-Yr., 5-Min.

8/12/2019 American Society of Plumbing Engineers Volume 2
http://slidepdf.com/reader/full/american-society-of-plumbing-engineers-volume-2 105/233
79Chapter 4— Storm-Drainage Systems
secondary drainage system handling any over-flow that may occur when heavier storms arise.
These same codes may require that the second-ary drainage systems be designed for the morestringent values, for when the primary drainagesystems may be clogged. The Standard Plumbing Code , effective in 1990, requires that the pri-mary drainage system be designed for a 100-year,60-min rainfall frequency; also, the secondary drainage system must be designed for a 100-year,15-min rainfall frequency. The two systems’ com-
bined capacities would exceed the required ca-pacity for a 100-year, 5-min storm. If a rainfallheavier than the design rainfall occurred, the twosystems would work together to carry the in-creased load.
An argument can be made for using the most conservative rainfall rates in the design of roof
drainage systems. The shortcomings of under-designed roof drainage systems have had dra-matic results when roofs collapsed. The designer must weigh the liabilities of an under-designeddrainage system against the economic benefit of maybe only one pipe size. In consideration for the safety of life and the protection of the owner ’sproperty, use of the most conservative designmay be appropriate.
Roof Drainage
Coordination The building roof transfers the
combined weight of live and dead loads to thesupporting structure. The supporting structuremay be constructed of steel, concrete, wood, or other materials. Live loads include snow, rain,
wind, etc. Dead loads include HVAC units, roof drains, and the roof deck.
Locating the roof drains should be a coop-erative effort among the architect, the structuralengineer, and the plumbing engineer. The ar-chitect is familiar with the building construc-tion, parapets, walls, chase locations, availableheadroom for pipe runs, roof construction, andthe waterproofing membrane. The structural en-
gineer is familiar with the structural support lay-out, roof slopes, column orientation, footing sizesand depths, and the maximum allowable roof loading.
The plumbing engineer can provide informa-tion concerning the maximum roof areas per drain, wall and column furring-out requirements,headroom requirements, ceiling space require-ments, minimum footing depths, and the pos-
sible benefits of ponding. The plumbing engineer should also ensure that the drains are locatedin the low points of the roof to limit deflection —
which could cause ponding and shifting of theroof low point — and located to minimize the hori-zontal piping runs.
Drain location The first roof drain should not be farther than 50 ft (15.2 m) from the end of a valley, the maximum distance between drainsshould be 200 ft (61 m). With a roof slope of ¼in./ft (21 mm/m) and a distance of 20 ft (6.1 m)from the roof high point to the roof drain, thedepth of water at the drain would be approxi-mately 5 in. (12.7 cm). The parapet wall scup-pers would be set at 5 in. (12.7 cm) above theroof low point. A maximum weight at the drainthat would be transmitted to the roof structuralsupports would be 26 psf (126.9 kg/m2) live load,
which would exceed the capacity of a normal 20psf (97.7 kg/m2) roof live load (30 psf [146.5 kg/m2] live load in snow areas). The designer must closely coordinate the drainage system design
with the roof structural design.
All penetrations through the roof must besealed watertight. Metal flashing, 18 – 24 in. (0.46-0.61 m) square or round, is often suggestedaround the roof drain because of the heavy wear and the likelihood that it will be a leakage prob-lem area; it is usually placed between the roof-ing plies. This flashing may also be used to forma roof sump to collect the storm water prior to
its entering the drain. (A square opening is easier to cut into the roof than a round opening.)
Most codes require a minimum of two roof drains on roofs with areas less than 10,000 ft 2
(929 m2), and four drains on roofs exceeding10,000 ft 2 (929 m2). Some codes allow a maxi-mum roof area per drain of 10,000 ft 2 (929 m2),
but this may require that the drains and associ-ated piping be excessively large. To control labor costs and avoid potential furring and footingdepth problems with the piping, a maximum area of 5000 ft 2 (465 m2)per drain and a maximumdrain and leader size of 8 in. (203 mm) should
be considered.
The designer must be aware of the locationof roof expansion joints. These joints may pro-hibit rainwater flow across the roof, thus divid-ing the roof into fixed drainage areas. At least two roof drains should be provided for each roof drainage area, no matter how small.

8/12/2019 American Society of Plumbing Engineers Volume 2
http://slidepdf.com/reader/full/american-society-of-plumbing-engineers-volume-2 106/233
ASPE Data Book — Volume 280
The roof drain should be a minimum of 12 – 18 in. (0.30-0.61 m) from any parapet wall or other obstruction to allow for proper flashing.
The drains should be located a minimum of 10 ft (3.05 m) from any building opening or air in-take. The minimum roof drain size should be 2in. (50.8 mm) for decks and 3 in. (76.2 mm) whereleaves are possible. In selecting the size of theroof drain, all of the horizontal roof area fromadjacent high points sloping to the drain must
be taken into account.
Adjacent surfaces The roof drain must alsoreceive drainage of rainwater from other roof ar-eas, such as penthouses, that dump onto theroof area being calculated and from the adjacent
vertical walls that discharge onto the horizontalroof surface. Some codes require that 50% of all
vertical wall areas be added to the horizontal roof
area. Other codes use complex formulae for vari-ous wall configurations. These formulae are nor-mally excessive for roof areas that have more thanone vertical wall or multiple-story walls with run-off directed to the horizontal roof surface. Rainseldomly falls in a totally vertical direction. De-pending on the wind conditions, the angle of rain-fall could be as much as 60° to the vertical or more. The wind, particularly in high-rise build-ings, can blow the rain off a vertical wall andaway from the building surfaces.
The height above a horizontal surface at which the wind removes more than 50% of the
rainwater from the wall surfaces has not beendetermined. Further study is required before lo-cal codes can be contradicted; therefore, the lo-cal code concerning vertical wall contribution of rainwater to horizontal surfaces should be com-plied with as a minimum.
Roof drain construction Standard roof drainshave three basic parts: the strainer, the flashingring with gravel stop, and the drain body or sump.
The strainers may be cast-iron coated or poly-ethylene dome type (for use where leaves may beencountered) or flat type (for sunroofs, areaways,
and parking decks). Standard roof drain con-struction is shown in Figure 4-3. The roof draintypes for all the common roof types are depictedin Figure 4-4.
When selecting the type of drain to be used,the engineer must know the roof constructionand thickness. The roof may be flat or pitched,used to retain water for cooling purposes, havea sprinkler system for cooling purposes, used as
a terrace, used as a parking deck with heavy traffic, or used to retain rainwater to limit theeffluent to the storm sewer system.
Roof drains, other than for flat decks, shouldhave strainers that extend a minimum of 4 in.
(100 mm) above the roof surface immediately ad- jacent to the drain. Strainers for the roof drainsshall have an available inlet area not less than1½ times the area of the leader that serves thedrain. Dome-type strainers are required to pre-
vent the entrance of leaves, debris, birds, andsmall animals. Flat-deck strainers, for use onsun decks, promenades, and parking garages
where regular maintenance may be expected,shall have an available inlet area not less than 2times the area of the leader that serves the drain.Heel-proof strainers may be required if subjectedto pedestrian traffic.
The flashing ring is used to attach the roof waterproofing membrane to the drain body tomaintain the watertight integrity of the roof. Anunderdeck clamp should be utilized for securingthe drain to the metal or wood decking; pouredconcrete roofs do not require these clamps. Drainreceivers should be used on drains for concrete
Figure 4-3 Typical Roof Drain
Source: Reprinted, by permission, from the Jay R. Smithcatalog.
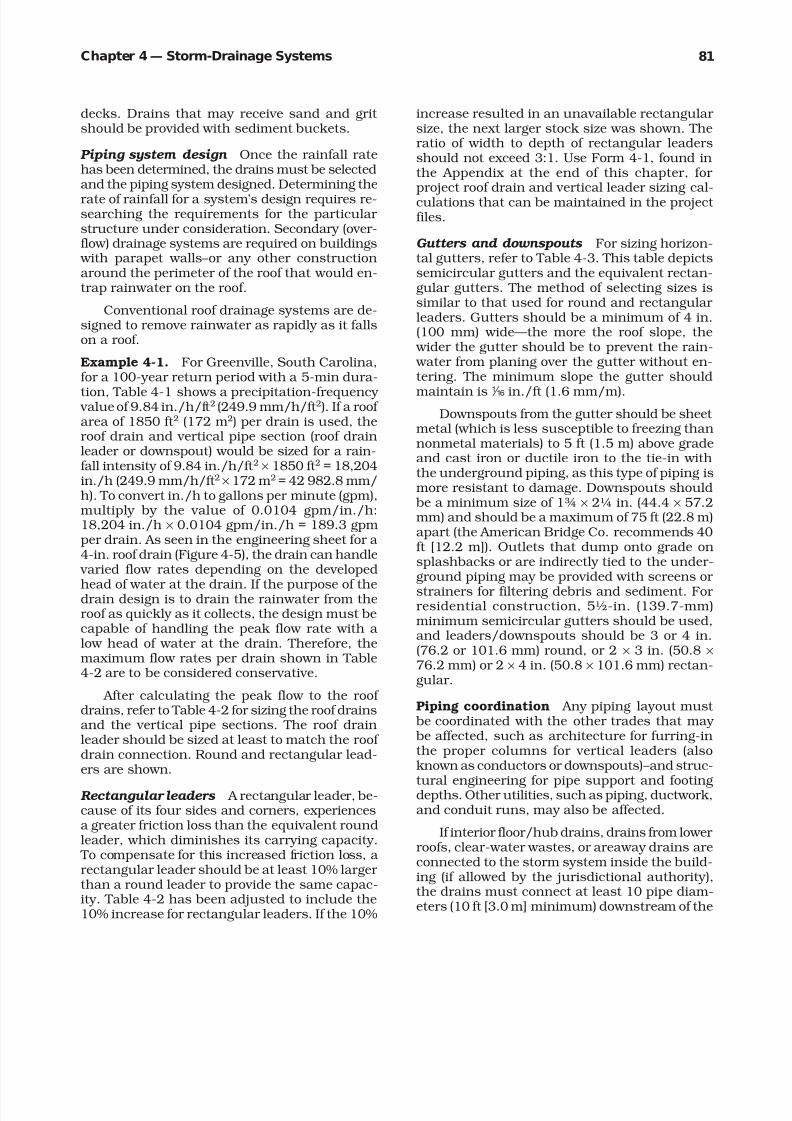
8/12/2019 American Society of Plumbing Engineers Volume 2
http://slidepdf.com/reader/full/american-society-of-plumbing-engineers-volume-2 107/233

8/12/2019 American Society of Plumbing Engineers Volume 2
http://slidepdf.com/reader/full/american-society-of-plumbing-engineers-volume-2 108/233

8/12/2019 American Society of Plumbing Engineers Volume 2
http://slidepdf.com/reader/full/american-society-of-plumbing-engineers-volume-2 109/233
83Chapter 4— Storm-Drainage Systems
(D)
(E)
(F)
Figure 4-4 Typical Roof-Drain Installations: (A) Steel or Concrete Roof Deck with Insulation Tapered to the Drain; (B) Precast or Steel Substrate with an Inverted-Membrane Type Roof; (C)
Parapet Drain in Poured Concrete Deck with Downspout Elbow; (D) Planting Area Drain inRaised Planter Box; (E) Indirect Waste for HVAC Equipment on Concrete Roof Deck; (F) Prom-
enade Drain in Precast Deck with Synthetic Flooring and Underdeck Clamp.
Source : Reprinted by permission of Tyler Pipe/The Wade Division, Tyler, Texas.

8/12/2019 American Society of Plumbing Engineers Volume 2
http://slidepdf.com/reader/full/american-society-of-plumbing-engineers-volume-2 110/233
ASPE Data Book — Volume 284
last offset fitting. Clear-water wastes should beproperly trapped and vented (see Figure 4-6).
Traps must be the same size as the horizontaldrain to which they are connected and should
be provided with 4-in. (102-mm) minimum, deep-seal p-traps, or with water from trap primers or frequently used fixtures to maintain the trap sealfor drains not receiving water on a regular basis.
Because of the excessive pressure that may exist in the leader, a low-level drain may becomethe vent to relieve the pressure, blowing water and air from the drain. These drains are subject to backflow and should be provided with back-
water valves and vented, or routed separately totie to the system beyond the point of excess pres-sure. If backwater valves are used, they can causethe areas affected not to allow drainage and a
Figure 4-6 Clear-Water Waste Branches forConnection to Storm System
Source : Reprinted, by permission, from The Illustrated Na- tional Plumbing Code Design Manual (Ballanco & Shumann1987).
Figure 4-5 4-In. (101-mm) Roof Drain Flow Chart
Source : Reprinted by permission of the Josam Company from the Design Engineering Sheet.

8/12/2019 American Society of Plumbing Engineers Volume 2
http://slidepdf.com/reader/full/american-society-of-plumbing-engineers-volume-2 111/233
85Chapter 4— Storm-Drainage Systems
Table 4-2 Sizes of Roof Drains and Vertical Pipes
Diameter of Leader, in. (mm) Cross-Sectional Water Contact Maximum DischargeDimensions of Leader, in. (mm) Area, in.2 (cm2) Area, in.2 (cm2) Capacity, gpm (L/s)a
2 (50.8) 3.14 (20.3) 6.28 (40.5) 30 (1.2)
2 × 2 (50.8 × 50.8) 4.00 (25.8) 8.00 (51.6) 30 (1.2)1½ × 2½ (38.1 × 63.5) 3.75 (24.2) 8.00 (51.6) 30 (1.2)
2½ (63.5) 4.91 (31.7) 7.85 (50.6) 54 (3.4)2½ × 2½ (63.5 × 63.5) 6.25 (40.3) 9.00 (58.1) 54 (3.4)
3 (76.2) 7.07 (45.6) 9.42 (60.8) 92 (5.8)2 × 4 (50.8 × 101.6) 8.00 (51.6) 12.00 (77.4) 92 (5.8)2½ × 3 (63.5 × 76.2) 7.50 (48.4) 11.00 (71.0) 92 (5.8)
4 (101.6) 12.57 (81.1) 12.57 (81.1) 192 (12.1)3 × 4¼ (76.2 × 107.6) 12.75 (82.3) 14.50 (93.6) 192 (12.1)3½ × 4 (88.9 × 101.6) 14.00 (90.3) 14.00 (90.3) 192 (12.1)
5 (127) 19.06 (123.0) 15.07 (97.2) 360 (22.7)4 × 5 (101.6 × 127) 20.00 (129.0) 18.00 (116.1) 360 (22.7)
4½ × 4½ (114.3 × 114.3) 20.25 (130.6) 18.00 (116.1) 360 (22.7)6 (152.4) 28.27 (183.4) 18.85 (121.6) 563 (35.5)
5 × 6 (127 × 152.4) 30.00 (193.5) 22.00 (141.9) 563 (35.5)5½ × 5½ (139.7 × 139.7) 30.25 (195.2) 22.00 (141.9) 563 (35.5)8 (203.2) 50.27 (324.3) 25.14 (162.2) 1208 (76.2)
6 × 8 (152.4 × 203.2) 48.00 (309.7) 28.00 (180.6) 1208 (76.2)
a With approximately 1¾-in. (45-mm) head of water at the drain.
buildup of water may occur. Horizontal piping of clear-water wastes and vents should be sized asa sanitary drainage branch is. When such pip-ing is tied to a leader, an upright wye should beutilized.
Expansion Expansion and improper anchoringof the vertical pipe have caused roof drains to bepushed up above the roof deck, destroying theintegrity of the roof waterproofing by tearing theflashing and the waterproofing membrane. Thisproblem can be more apparent in high-rise build-ings and buildings where the exposed leader issubjected to cold rainwater or melting snow andice that enters piping at the ambient tempera-ture of the building. An expansion joint at theroof drain or a horizontal section of the branchline should be provided to accommodate the
movement of the leader without affecting the roof drain. See Figure 4-7.
Insulation The horizontal section of pipe andthe roof-drain body should be insulated, per cold
water installations with a vapor barrier, to con-trol condensation. See Figure 4-8. Low-tempera-ture liquid flow in the piping will causecondensation to form on the outside of the pip-ing, possibly causing stain damage to the ceil-
ings or, where exposed, drip marks on the floor-ing.
Locating vertical leaders Locating the verti-cal leaders within the building has several ad-
vantages: convenience, safety, appearances, andfreeze protection. However, leaders located on theexterior can be installed at a much lower cost and do not take up any valuable floor space.
To keep the number of leaders to a minimum,the leaders may combine flows from more thanone roof drain, from a roof drain and a lower-deck drain, from a roof drain and clear-water
wastes, or from any combination of the above. The engineer must include the additional flows when calculating the leader size. This method isespecially beneficial in keeping the costs of high-rise buildings contained.
If the leaders are to be located at the build-ing columns, the column footings must bedropped correspondingly to accommodate theelbow at the base of the leader (stack). The baseelbow should be a long sweep bend to help alle-
viate any excess pressures in the downstreampipe, and the elbow should be properly sup-ported. The elbow may rest directly on the col-umn footing to act as a support (see Figure 4-8).

8/12/2019 American Society of Plumbing Engineers Volume 2
http://slidepdf.com/reader/full/american-society-of-plumbing-engineers-volume-2 112/233
ASPE Data Book — Volume 286
A riser clamp should be provided at each floor line for support of the leader. Also a cleanout should be provided at the base of all stacks toallow the base elbow to be rodded out.
If blockage occurs in the drainage system and
backs up in the vertical leader, the piping sys-tem may be subjected to a head pressure that isgreater than the joining system is designed for.
To prevent joint failure, pressure pipe may beconsidered for the piping system. All exterior lead-ers that may be exposed to damage, such as oc-curs in parking or truck-loading areas, should
be protected by metal or concrete guards or re-cessed in the wall and constructed of a ferrousalloy pipe, such as cast iron, to 5 ft (1.5 m) abovethe paving or loading platforms.
If an offset is 45° or less, the leader can be
sized as a vertical pipe. If the offset is greater than 45°, the pipe must be sized as a horizontalpipe. To avoid stoppages due to leaves, ice, etc.,the leader cannot be reduced in size in the di-rection of flow throughout its length. For ex-ample, an 8-in. (203-mm) horizontal line must
Table 4-3 Sizes of Semicircular and Equivalent Rectangular Gutters
Diameter of Gutter, in. (mm) Cross-Sectional Water Contact, Slope,a Capacity,
Dimensions of Gutter, in. (mm) Area, in.2
(mm2
) Area, in.2
(cm2
) in./ft (mm/m) gpm (L/min)
3 (76.2) 3.53 (22.83) 4.70 (30.32) z (1.6) —
3 (76.2) 3.53 (22.83) 4.70 (30.32) 8 (3.2) —
1½ × 2½ (38.1 × 63.4) 3.75 (24.25) 5.50 (35.48) ¼ (6.4) 26 (97.5)
1½ × 2½ (38.1 × 63.5) 3.75 (24.25) 5.50 (35.48) ½ (12.7) 40 (150)
4 (101.6) 6.28 (40.61) 6.28 (40.52) z (1.6) —
4 (101.6) 6.28 (40.61) 6.28 (40.52) 8 (3.2) 39 (146.25)
2¼ × 3 (57.2 × 76) 6.75 (43.65) 7.50 (48.50) ¼ (6.4) 55 (206.25)
2¼ × 3 (57.2 × 76) 6.75 (43.65) 7.50 (48.50) ½ (12.7) 87 (326.25)
5 (127) 9.82 (63.50) 7.85 (50.76) z (1.6) —
5 (127) 9.82 (63.50) 7.85 (50.76) 8 (3.2) 74 (277.5)
4 × 2½ (101.6 × 63.4) 10.00 (64.67) 9.00 (58.20) ¼ (6.4) 106 (397.5)
3 × 3½ (76 × 88.9) 10.00 (64.67) 9.00 (58.20) ½ (12.7) 156 (585)
6 (152) 14.14 (91.44) 9.43 (60.9) z (1.6) —
6 (152) 14.14 (91.44) 9.43 (60.9) 8 (3.2) 110 (412.5)
3 × 5 (76 × 127) 15.00 (97.00) 11.00 (71.14) ¼ (6.4) 157 (588.75)
3 × 5 (76 × 127) 15.00 (97.00) 11.00 (71.14) ½ (12.7) 225 (843.75)
8 (203.2) 25.27 (163.42) 12.57 (81.29) z (1.6) 172 (645)
8 (203.2) 25.27 (163.42) 12.57 (81.29) 8 (3.2) 247 (926.25)
4½ × 6 (114.3 × 152.4) 27.00 (174.6) 15.00 (97.00) ¼ (6.4) 348 (1305)4½ × 6 (114.3 × 152.4) 27.00 (174.6) 15.00 (97.00) ½ (12.7) 494 (1852.5)
10 (254) 39.77 (257.19) 15.70 (101.52) z (1.6) 331 (1241.25)
10 (254) 39.77 (257.19) 15.70 (101.52) 8 (3.2) 472 (1770)
5 × 8 (127 × 203.2) 40.00 (258.7) 18.00 (116.40) ¼ (6.4) 651 (2440.25)
4 × 10 (101.6 × 254) 40.00 (258.7) 18.00 (116.40) ½ (12.7) 1055 (3956.25)
Note: Figures are based on the Chezy Formula for Discharge of Circular Sewers, n = 0.013, and gutter flowing full.aMinimum velocity of 2 fps (0.6 m/s).
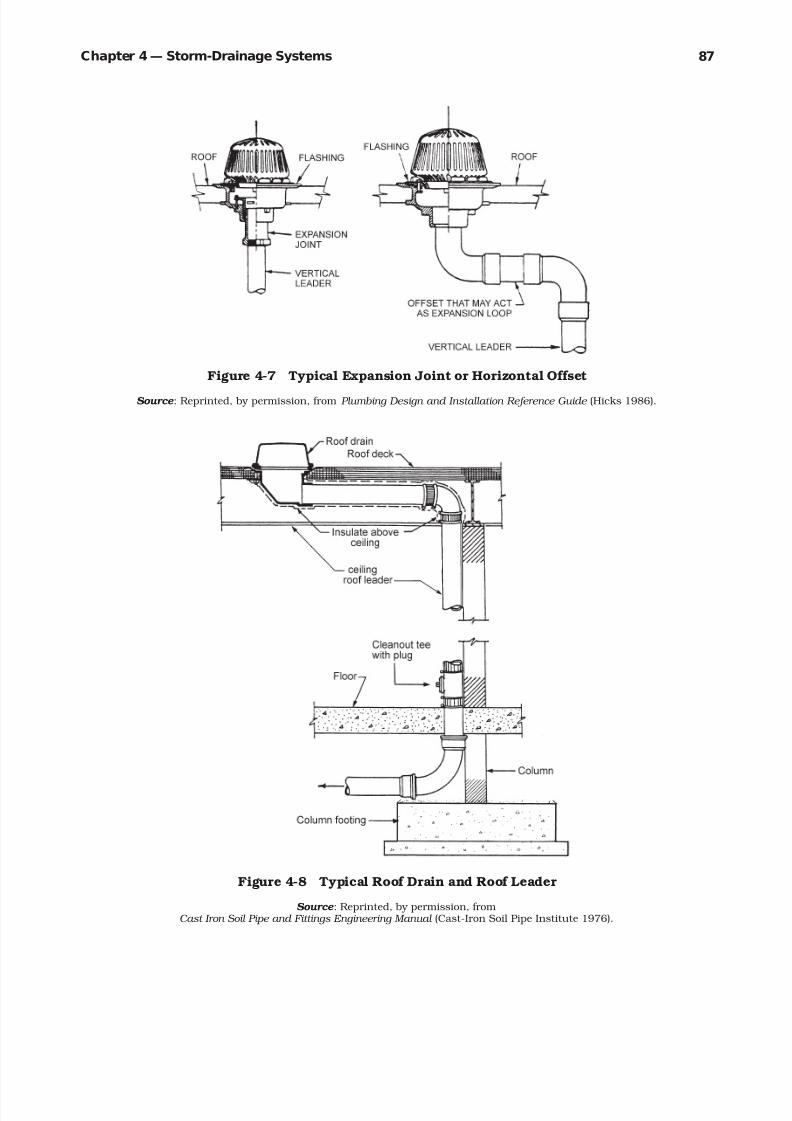
8/12/2019 American Society of Plumbing Engineers Volume 2
http://slidepdf.com/reader/full/american-society-of-plumbing-engineers-volume-2 113/233
87Chapter 4— Storm-Drainage Systems
Figure 4-8 Typical Roof Drain and Roof Leader
Source : Reprinted, by permission, fromCast Iron Soil Pipe and Fittings Engineering Manual (Cast-Iron Soil Pipe Institute 1976).
Figure 4-7 Typical Expansion Joint or Horizontal Offset
Source : Reprinted, by permission, from Plumbing Design and Installation Reference Guide (Hicks 1986).
8/12/2019 American Society of Plumbing Engineers Volume 2
http://slidepdf.com/reader/full/american-society-of-plumbing-engineers-volume-2 114/233
ASPE Data Book — Volume 288
tie to an 8-in. (203-mm) vertical leader, even if Table 4-2 requires a smaller size. Vertical lead-ers should be tied to the horizontal main withsingle-wye fittings; double-wye fittings should beavoided.
Horizontal pipe sizing The horizontal pipingshould be sized to flow full under uniform flow conditions at the peak flow rate, as opposed tosanitary sewers, which are designed to flow ½ toQ full. A minimum velocity of 2 ft/s (fps) (0.61m/s) should be maintained to properly scour thepipe of grit, sand, and debris. (Some authoritiesrecommend a minimum velocity of 3 fps [0.91m/s] to keep the sediment in suspension.)
The horizontal piping must be properly sup-ported, with bell holes provided for underground
bell-and-spigot piping. Use Form 4-2, in the Ap-pendix at the end of this chapter, to calculatethe storm-drain horizontal main size. Cleanoutsshould be provided at any change in directionexceeding 45° and at any change in pipe size,and to meet any applicable local code require-ments for distances between cleanouts. Thecleanouts should be extended up to grade or thefloor above, or out to the wall face with a wallplate. The location of cleanout plugs above ceil-ings may cause damage to the ceiling when thepipe must be cleaned.
Avoid running horizontal piping above theceilings of computer rooms, kitchens, and food-
preparation areas. A pipe rupture above one of these areas could cause major damage and con-tamination. Piping under building slabs should
be avoided if feasible; as pipe leaks could erodethe fill below slabs and cause the slab to crack.
Once the peak flow has been determined, theManning Formula (Equation 4-3) should be usedfor sizing; refer to Table 4-4.
Equation 4-3
Q = 1.486
× A × R.67 × S.5
n
where Q = Flow rate, ft 3/s (m3/s)
A = Area, ft 2 (m2)
R = Hydraulic radius of pipe = D/4, ft (m)
[D = Diameter of pipe, ft (m)]
S = Hydraulic slope, ft/ft (m/m)
n = Coefficient of roughness, constant
The roughness coefficient of the pipe can beaffected by age, corrosion, misalignment of thepipe, solid deposits in the pipe, and tree roots or other obstructions. Table 4-4 shows the types of
pipe material that are available for each of thelisted sizes. It also shows the various capacitiesof the piping at different slopes. The greater theslope is, the higher the capacity, but the greater the slope, the deeper the line and the more exca-
vation required. This may cause significant prob-lems when the engineer is trying to tie in to anexisting storm sewer or “daylight ” (i.e., dischargeto the open atmosphere as opposed to into anunderground pipe) to a ditch or canal.
Secondary drainage systems may be either scuppers, which allow the entrapped rainwater to overflow the roof, or a separately piped drain-
age system to a separate point of discharge. Scup-pers shall be sized in accordance with Table 4-5.
The secondary piping system shall be designedsimilarly to the way the primary drainage sys-tem was designed. Some codes and designersprefer that the discharge from secondary drain-age systems be readily noticeable, to ensure theprompt repair of the primary drainage systems.
If the storm-drainage system receives con-tinuous or intermittent flow from sump pumps,air-conditioning units, or similar devices, the flow should be added to the drainage system, either on the roof if the discharge is onto the roof, or inthe piping if the discharge ties directly to thedrainage system.
After the system has been laid out and sized,the designer should review the proposed systemto determine if revisions to the layout would im-prove the system from the standpoint of ease of installation, cost of materials and/or coordina-tion with other trades.
Controlled-flow storm-drainage system In lieuof sizing the storm-drainage system on the basisof the actual maximum projected roof areas, theroof drainage system (or a part of it) may be sizedon the equivalent or adjusted projected roof ar-eas that result from the controlled flow and thestorage of storm water on the roof.
Controlled-flow systems collect the rainwa-ter on the roof and release the flow slowly to thedrainage system. These systems can provide sig-nificant installation savings by requiring smaller roof drains, smaller diameter piping and smaller

8/12/2019 American Society of Plumbing Engineers Volume 2
http://slidepdf.com/reader/full/american-society-of-plumbing-engineers-volume-2 115/233
89Chapter 4— Storm-Drainage Systems
Table 4-4 Pipe Sizing Chart
Slope Discharge Capacity Velocity
Pipe Pipe Size, in./ft % gpm cfs fpsMaterial in. (mm) (cm/m) (L/s) (L/s) (m/s)
Cast iron 2 (50) ¼ (25) 2.1 19 (1.199) 0.043 (1.217) 1.97 (0.591)PVC-DWV 2 (50) ½ (50) 4.2 27 (1.703) 0.061 (1.726) 2.80 (0.840)Steel 2 (50) 1 (100) 8.3 39 (2.460) 0.086 (2.434) 3.94 (1.182)
Cast iron 3 (80) 8 (12.5) 1.0 40 (2.523) 0.090 (2.547) 1.83 (0.549)Ductile iron 3 (80) ¼ (25) 2.1 57 (3.596) 0.127 (3.594) 2.59 (0.867)PVC-DWV 3 (80) ½ (50) 4.2 81 (5.109) 0.180 (5.094) 3.67 (1.101)Steel 3 (80) 1 (100) 8.3 114 (7.191) 0.254 (7.188) 5.17 (1.551)
Cast iron 4 (100) 8 (12.5) 1.0 87 (5.488) 0.194 (5.490) 2.22 (0.666)Ductile iron 4 (100) ¼ (25) 2.1 123 (7.759) 0.274 (7.754) 3.14 (0.942)PVC-DWV 4 (100) ½ (50) 4.2 174 (10.976) 0.390 (11.037) 4.47 (1.341)Steel 4 (100) 1 (100) 8.3 247 (15.581) 0.550 (15.565) 6.30 (1.890)Concrete
Vitrified clay
Cast iron 6 (150) z (6.3) 0.5 178 (11.228) 0.397 (10.726) 2.02 (0.606)Ductile iron 6 (150) 8 (12.5) 1.0 257 (16.212) 0.572 (16.188) 2.91 (0.873)PVC-DWV 6 (150) x (18.8) 1.5 309 (19.492) 0.687 (19.442) 3.50 (1.050)Steel 6 (150) ¼ (25) 2.1 363 (22.898) 0.808 (22.866) 4.11 (1.233)Concrete 6 (150) c (31.3) 2.5 398 (25.106) 0.887 (25.102) 4.52 (1.356)Vitrified clay 6 (150) a (37.5) 3.0 436 (27.503) 0.972 (27.508) 4.95 (1.485)
6 (150) v (43.8) 3.5 471 (29.711) 1.050 (29.715) 5.35 (1.605)6 (150) ½ (50) 4.2 514 (32.423) 1.145 (32.404) 5.83 (1.749)6 (150) s (62.5) 5.0 563 (35.514) 1.255 (35.517) 6.39 (1.917)6 (150) ¾ (75) 6.0 617 (38.920) 1.375 (38.913) 7.00 (2.100)6 (150) d (87.5) 7.0 666 (42.011) 1.485 (42.026) 7.56 (2.268)
Cast iron 8 (200) 0.2 243 (15.328) 0.541 (15.291) 1.55 (0.465)
Ductile iron 8 (200) 0.4 343 (21.636) 0.765 (21.650) 2.19 (0.657)PVC-DWV 8 (200) z (6.3) 0.5 420 (26.494) 0.937 (26.517) 2.68 (0.804)Steel 8 (200) 0.8 485 (30.594) 1.082 (30.621) 3.10 (0.930)Concrete 8 (200) 8 (12.5) 1.0 554 (34.946) 1.234 (34.922) 3.53 (1.059)Vitrified clay 8 (200) x (18.8) 1.5 665 (41.948) 1.481 (41.912) 4.24 (1.272)
8 (200) ¼ (25) 2.1 782 (49.329) 1.742 (49.299) 4.99 (1.497)8 (200) c (31.3) 2.5 858 (54.123) 1.912 (54.110) 5.48 (1.644)8 (200) a (37.5) 3.0 940 (59.295) 2.095 (59.289) 6.00 (1.800)8 (200) v (43.8) 3.5 1,015 (64.026) 2.263 (64.043) 6.48 (1.944)8 (200) ½ (50) 4.2 1,107 (69.830) 2.467 (69.816) 7.06 (2.118)8 (200) b (56.3) 4.5 1,152 (72.668) 2.566 (72.618) 7.35 (2.205)
Cast iron 10 (250) 0.2 439 (27.692) 0.980 (27.751) 1.80 (0.540)Ductile iron 10 (250) 0.4 621 (39.173) 1.380 (39.054) 2.53 (0.759)PVC-DWV 10 (250) z (6.3) 0.5 761 (48.004) 1.700 (48.110) 3.12 (0.936)
Steel 10 (250) 0.8 879 (55.447) 1.960 (55.468) 3.59 (1.077)Concrete 10 (250) 8 (12.5) 1.0 1,002 (63.206) 2.230 (63.109) 4.09 (1.227)Vitrified clay 10 (250) x (18.8) 1.5 1,203 (75.885) 2.680 (75.844) 4.91 (1.473)
10 (250) ¼ (25) 2.1 1,414 (89.195) 3.150 (89.145) 5.78 (1.734)10 (250) c (31.3) 2.5 1,553 (97.963) 3.460 (97.918) 6.34 (1.902)10 (250) a (37.5) 3.0 1,701 (107.299) 3.790 (107.257) 6.95 (2.085)10 (250) v (43.8) 3.5 1,837 (115.878) 4.090 (115.747) 7.50 (2.250)
Cast iron 12 (300) 0.2 715 (45.102) 1.590 (44.997) 2.02 (0.606)Ductile iron 12 (300) 0.4 1,012 (63.837) 2.250 (63.675) 2.86 (0.600)
(Continued)

8/12/2019 American Society of Plumbing Engineers Volume 2
http://slidepdf.com/reader/full/american-society-of-plumbing-engineers-volume-2 116/233
ASPE Data Book — Volume 290
PVC-DWV 12 (300) z (6.3) 0.6 1,239 (78.156) 2.760 (78.108) 3.51 (1.053)Steel 12 (300) 0.8 1,431 (90.267) 3.190 (90.277) 4.06 (1.218)Concrete 12 (300) 8 (12.5) 1.0 1,632 (102.947) 3.640 (103.012) 4.63 (1.389)Vitrified clay 12 (300) 1.2 1,752 (110.516) 3.900 (110.370) 4.97 (1.491)
12 (300) 1.4 1,893 (119.410) 4.220 (119.426) 5.37 (1.611)12 (300) 1.6 2,024 (127.674) 4.510 (127.633) 5.74 (1.722)12 (300) 1.8 2,146 (135.370) 4.780 (135.274) 6.09 (1.827)12 (300) ¼ (25) 2.1 2,304 (145.336) 5.130 (145.179) 6.53 (1.959)12 (300) 2.2 2,373 (149.689) 5.290 (149.707) 6.74 (2.022)12 (300) 2.4 2,478 (156.312) 5.520 (156.216) 7.03 (2.109)
Ductile iron 14 (350) 0.1 760 (47.941) 1.690 (47.827) 1.58 (0.474)PVC-DWV 14 (350) 0.2 1,074 (67.748) 2.390 (67.637) 2.24 (0.672)Steel 14 (350) 0.3 1,316 (83.013) 2.930 (82.919) 2.74 (0.822)
14 (350) 0.4 1,519 (95.819) 3.380 (95.654) 3.16 (0.948)14 (350) z (6.3) 0.5 1,699 (107.173) 3.780 (106.974) 3.54 (1.062)14 (350) 0.6 1,861 (117.392) 4.150 (117.445) 3.88 (1.164)14 (350) 0.7 2,010 (126.791) 4.480 (126.784) 4.19 (1.257)14 (350) 0.8 2,149 (135.559) 4.790 (135.557) 4.48 (1.344)14 (350) 0.9 2,279 (143.759) 5.080 (143.764) 4.75 (1.425)14 (350) 8 (12.5) 1.0 2,450 (154.546) 5.460 (154.518) 5.11 (1.533)14 (350) 1.1 2,519 (158.899) 5.610 (158.763) 5.25 (1.575)14 (350) 1.2 2,631 (165.963) 5.860 (165.838) 5.48 (1.644)14 (350) 1.3 2,739 (172.776) 6.100 (172.630) 5.71 (1.713)14 (350) 1.4 2,842 (179.273) 6.330 (179.139) 5.92 (1.776)14 (350) x (18.8) 1.5 2,942 (185.581) 6.560 (185.648) 6.14 (1.842)14 (350) 1.6 3,039 (191.700) 6.770 (191.591) 6.33 (1.899)14 (350) 1.7 3,132 (197.567) 6.980 (197.534) 6.53 (1.959)
Cast iron 15 (375) 0.1 918 (57.907) 2.040 (57.766) 1.66 (0.498)Ductile iron 15 (375) 0.2 1,298 (81.878) 2.890 (81.787) 2.36 (0.708)Concrete 15 (375) 0.3 1,590 (100.297) 3.540 (100.182) 2.89 (0.867)Vitrified clay 15 (375) 0.4 1,835 (115.752) 4.090 (115.747) 3.33 (0.999)
15 (375) z (6.3) 0.5 2,052 (129.440) 4.570 (129.331) 3.72 (1.116)15 (375) 0.6 2,248 (141.804) 5.010 (141.783) 4.08 (1.224)15 (375) 0.7 2,428 (153.158) 5.410 (153.103) 4.41 (1.323)15 (375) 0.8 2,596 (163.756) 5.780 (163.574) 4.71 (1.413)15 (375) 0.9 2,753 (173.659) 6.130 (173.479) 5.00 (1.500)15 (375) 8 (12.5) 1.0 2,960 (186.717) 6.600 (186.780) 5.38 (1.614)15 (375) 1.1 3,044 (192.016) 6.780 (191.874) 5.53 (1.659)15 (375) 1.2 3,179 (200.531) 7.080 (200.364) 5.77 (1.731)15 (375) 1.3 3,309 (208.732) 7.370 (208.571) 6.01 (1.803)
15 (375) 1.4 3,434 (216.617) 7.650 (216.495) 6.23 (1.869)15 (375) x (18.8) 1.5 3,554 (224.186) 7.920 (224.136) 6.45 (1.935)15 (375) 1.6 3,671 (231.567) 8.180 (213.494) 6.67 (2.001)15 (375) 1.7 3,784 (238.695) 8.430 (238.569) 6.87 (2.061)
Ductile iron 16 (400) 0.1 1,049 (66.171) 2.340 (66.222) 1.66 (0.498)PVC-DWV 16 (400) 0.2 1,484 (93.611) 3.310 (93.673) 2.35 (0.705)Steel 16 (400) 0.3 1,817 (114.616) 4.050 (114.615) 2.87 (0.861)
16 (400) 0.4 2,099 (132.405) 4.680 (132.444) 3.32 (0.996)16 (400) z (6.3) 0.5 2,346 (147.986) 5.230 (148.009) 3.71 (1.113)
(Table 4-4 continued) Slope Discharge Capacity Velocity
Pipe Pipe Size, in./ft % gpm cfs fpsMaterial in. (mm) (cm/m) (L/s) (L/s) (m/s)
(Continued)

8/12/2019 American Society of Plumbing Engineers Volume 2
http://slidepdf.com/reader/full/american-society-of-plumbing-engineers-volume-2 117/233
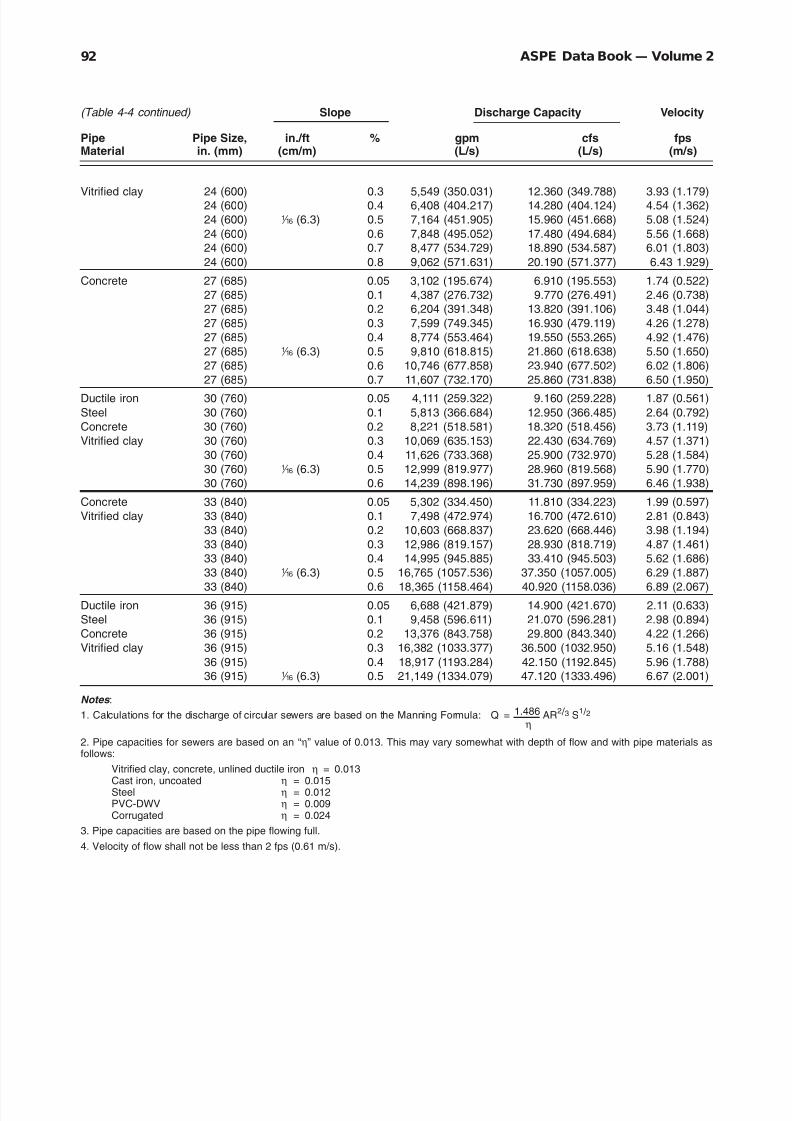
8/12/2019 American Society of Plumbing Engineers Volume 2
http://slidepdf.com/reader/full/american-society-of-plumbing-engineers-volume-2 118/233
ASPE Data Book — Volume 292
Vitrified clay 24 (600) 0.3 5,549 (350.031) 12.360 (349.788) 3.93 (1.179)24 (600) 0.4 6,408 (404.217) 14.280 (404.124) 4.54 (1.362)24 (600) z (6.3) 0.5 7,164 (451.905) 15.960 (451.668) 5.08 (1.524)24 (600) 0.6 7,848 (495.052) 17.480 (494.684) 5.56 (1.668)24 (600) 0.7 8,477 (534.729) 18.890 (534.587) 6.01 (1.803)24 (600) 0.8 9,062 (571.631) 20.190 (571.377) 6.43 1.929)
Concrete 27 (685) 0.05 3,102 (195.674) 6.910 (195.553) 1.74 (0.522)27 (685) 0.1 4,387 (276.732) 9.770 (276.491) 2.46 (0.738)27 (685) 0.2 6,204 (391.348) 13.820 (391.106) 3.48 (1.044)27 (685) 0.3 7,599 (749.345) 16.930 (479.119) 4.26 (1.278)27 (685) 0.4 8,774 (553.464) 19.550 (553.265) 4.92 (1.476)27 (685) z (6.3) 0.5 9,810 (618.815) 21.860 (618.638) 5.50 (1.650)27 (685) 0.6 10,746 (677.858) 23.940 (677.502) 6.02 (1.806)27 (685) 0.7 11,607 (732.170) 25.860 (731.838) 6.50 (1.950)
Ductile iron 30 (760) 0.05 4,111 (259.322) 9.160 (259.228) 1.87 (0.561)Steel 30 (760) 0.1 5,813 (366.684) 12.950 (366.485) 2.64 (0.792)Concrete 30 (760) 0.2 8,221 (518.581) 18.320 (518.456) 3.73 (1.119)Vitrified clay 30 (760) 0.3 10,069 (635.153) 22.430 (634.769) 4.57 (1.371)
30 (760) 0.4 11,626 (733.368) 25.900 (732.970) 5.28 (1.584)30 (760) z (6.3) 0.5 12,999 (819.977) 28.960 (819.568) 5.90 (1.770)30 (760) 0.6 14,239 (898.196) 31.730 (897.959) 6.46 (1.938)
Concrete 33 (840) 0.05 5,302 (334.450) 11.810 (334.223) 1.99 (0.597)Vitrified clay 33 (840) 0.1 7,498 (472.974) 16.700 (472.610) 2.81 (0.843)
33 (840) 0.2 10,603 (668.837) 23.620 (668.446) 3.98 (1.194)33 (840) 0.3 12,986 (819.157) 28.930 (818.719) 4.87 (1.461)33 (840) 0.4 14,995 (945.885) 33.410 (945.503) 5.62 (1.686)33 (840) z (6.3) 0.5 16,765 (1057.536) 37.350 (1057.005) 6.29 (1.887)
33 (840) 0.6 18,365 (1158.464) 40.920 (1158.036) 6.89 (2.067)Ductile iron 36 (915) 0.05 6,688 (421.879) 14.900 (421.670) 2.11 (0.633)Steel 36 (915) 0.1 9,458 (596.611) 21.070 (596.281) 2.98 (0.894)Concrete 36 (915) 0.2 13,376 (843.758) 29.800 (843.340) 4.22 (1.266)Vitrified clay 36 (915) 0.3 16,382 (1033.377) 36.500 (1032.950) 5.16 (1.548)
36 (915) 0.4 18,917 (1193.284) 42.150 (1192.845) 5.96 (1.788)36 (915) z (6.3) 0.5 21,149 (1334.079) 47.120 (1333.496) 6.67 (2.001)
Notes :
1. Calculations for the discharge of circular sewers are based on the Manning Formula: Q = 1.486 AR2 / 3 S
1 / 2η
2. Pipe capacities for sewers are based on an “η” value of 0.013. This may vary somewhat with depth of flow and with pipe materials asfollows:
Vitrified clay, concrete, unlined ductile iron η = 0.013
Cast iron, uncoated η = 0.015Steel η = 0.012PVC-DWV η = 0.009Corrugated η = 0.024
3. Pipe capacities are based on the pipe flowing full.
4. Velocity of flow shall not be less than 2 fps (0.61 m/s).
(Table 4-4 continued) Slope Discharge Capacity Velocity
Pipe Pipe Size, in./ft % gpm cfs fpsMaterial in. (mm) (cm/m) (L/s) (L/s) (m/s)
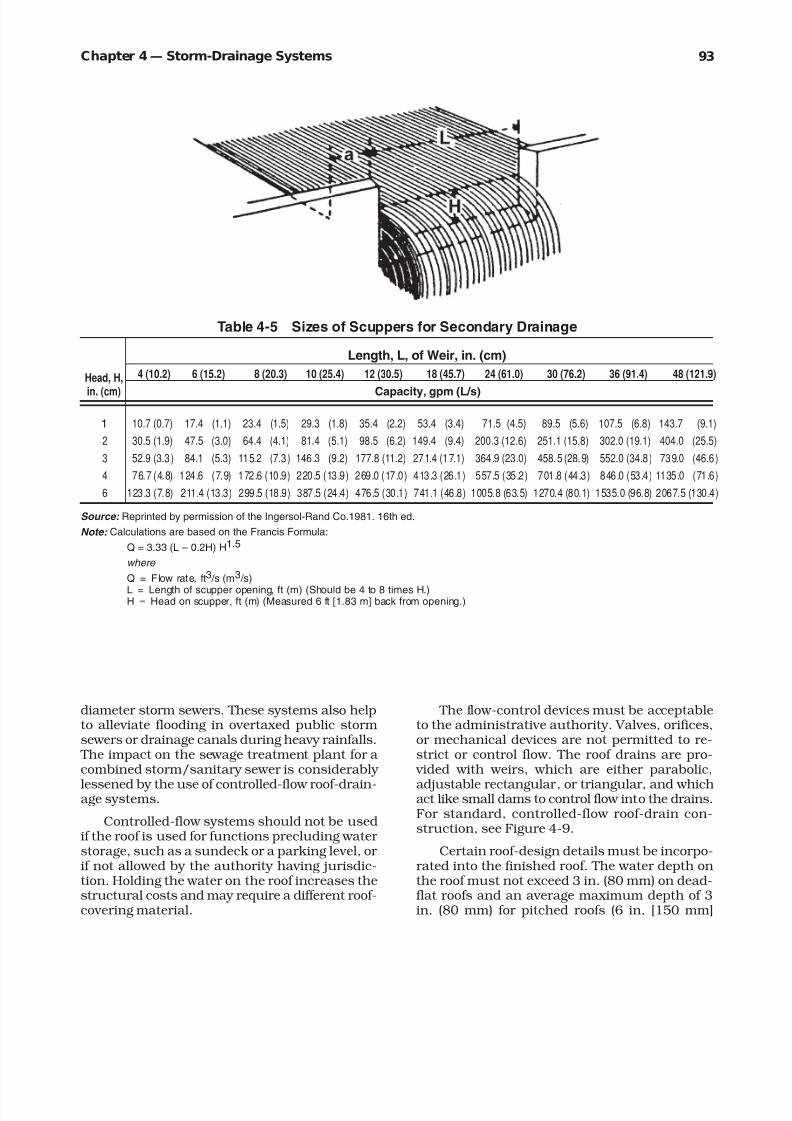
8/12/2019 American Society of Plumbing Engineers Volume 2
http://slidepdf.com/reader/full/american-society-of-plumbing-engineers-volume-2 119/233
93Chapter 4— Storm-Drainage Systems
diameter storm sewers. These systems also helpto alleviate flooding in overtaxed public stormsewers or drainage canals during heavy rainfalls.
The impact on the sewage treatment plant for a combined storm/sanitary sewer is considerably
lessened by the use of controlled-flow roof-drain-age systems.
Controlled-flow systems should not be usedif the roof is used for functions precluding water storage, such as a sundeck or a parking level, or if not allowed by the authority having jurisdic-tion. Holding the water on the roof increases thestructural costs and may require a different roof-covering material.
The flow-control devices must be acceptableto the administrative authority. Valves, orifices,or mechanical devices are not permitted to re-strict or control flow. The roof drains are pro-
vided with weirs, which are either parabolic,
adjustable rectangular, or triangular, and whichact like small dams to control flow into the drains.For standard, controlled-flow roof-drain con-struction, see Figure 4-9.
Certain roof-design details must be incorpo-rated into the finished roof. The water depth onthe roof must not exceed 3 in. (80 mm) on dead-flat roofs and an average maximum depth of 3in. (80 mm) for pitched roofs (6 in. [150 mm]
Table 4-5 Sizes of Scuppers for Secondary Drainage
Length, L, of Weir, in. (cm)
Head, H, 4 (10.2) 6 (15.2) 8 (20.3) 10 (25.4) 12 (30.5) 18 (45.7) 24 (61.0) 30 (76.2) 36 (91.4) 48 (121.9)
in. (cm) Capacity, gpm (L/s)
1 10.7 (0.7) 17.4 (1.1) 23.4 (1.5) 29.3 (1.8) 35.4 (2.2) 53.4 (3.4) 71.5 (4.5) 89.5 (5.6) 107.5 (6.8) 143.7 (9.1)
2 30.5 (1.9) 47.5 (3.0) 64.4 (4.1) 81.4 (5.1) 98.5 (6.2) 149.4 (9.4) 200.3 (12.6) 251.1 (15.8) 302.0 (19.1) 404.0 (25.5)
3 52.9 (3.3) 84.1 (5.3) 115.2 (7.3) 146.3 (9.2) 177.8 (11.2) 271.4 (17.1) 364.9 (23.0) 458.5 (28.9) 552.0 (34.8) 739.0 (46.6)
4 76.7 (4.8) 124.6 (7.9) 172.6 (10.9) 220.5 (13.9) 269.0 (17.0) 413.3 (26.1) 557.5 (35.2) 701.8 (44.3) 846.0 (53.4) 1135.0 (71.6)
6 123.3 (7.8) 211.4 (13.3) 299.5 (18.9) 387.5 (24.4) 476.5 (30.1) 741.1 (46.8) 1005.8 (63.5) 1270.4 (80.1) 1535.0 (96.8) 2067.5 (130.4)
Source: Reprinted by permission of the Ingersol-Rand Co.1981. 16th ed.
Note: Calculations are based on the Francis Formula:
Q = 3.33 (L – 0.2H) H1.5
where
Q = Flow rate, ft3 /s (m3 /s)
L = Length of scupper opening, ft (m) (Should be 4 to 8 times H.)H = Head on scupper, ft (m) (Measured 6 ft [1.83 m] back from opening.)

8/12/2019 American Society of Plumbing Engineers Volume 2
http://slidepdf.com/reader/full/american-society-of-plumbing-engineers-volume-2 120/233
ASPE Data Book — Volume 294
maximum from the high point to the low point of the roof) during the storm. The depth of water must be representative of the depth over all theroof and must assume the primary drains are
blocked. The drain-down time is the time, mea-sured in hours, for the roof to completely drainafter the storm has reached its maximumintensity and duration and has ceased. Thedrain-down time must be in accordance with thelocal code but should not exceed 24 hours (12 – 17 hours maximum recommended).
The flow-control device should be installedso that the rate of discharge of the water shouldnot exceed the rate allowed. The roof design for controlled-flow roof drainage should be based on
a minimum of 30 lb/ft 2 (psf) (1.44 kPa) loadingto provide a safety factor above the 15.6 psf (0.75kPa) represented by the 3-in. (76.2-mm) designdepth of water. The roof should be level and 45°cants should be installed at any wall or parapet.
The flashing should extend at least 6 in. (152.4mm) above the roof level. Doors opening ontothe roof must be provided with a curb at least 4in. (101 mm) high. Flow-control devices should
be protected by strainers and in no case shouldthe roof surface in the vicinity of the drain berecessed to create a reservoir.
Roof-drain manufacturers have done muchresearch on engineering criteria and parametersregarding the head of water on the roof for the
weir design in controlled-flow roof drains, andthey have established suggested design proce-dures with flow capacities and charts.
Secondary roof drainage is required in casethe primary drains are blocked, as is discussedearlier in this chapter. Secondary drainage sys-tems can reduce the savings potential of con-trolled-flow roof drainage systems. If scuppersare utilized, they should be placed ½ in. (12.7mm) above the maximum designated head, 3½in. (88.9 mm) above the roof level. One scupper,or secondary drain, should be provided for eachroof drain.
Figure 4-9 Example of a Controlled-Flow Drain
Source : Reprinted, by permission, from the Jay R. Smithcatalog.

8/12/2019 American Society of Plumbing Engineers Volume 2
http://slidepdf.com/reader/full/american-society-of-plumbing-engineers-volume-2 121/233
95Chapter 4— Storm-Drainage Systems
PART TWO:SITE DRAINAGE SYSTEM DESIGN
General Design Considerations
Part One of this chapter discussed general crite-ria that must be considered in the design of bothroof and site drainage systems, including mate-rials, rainfall rates, and pipe sizing. These gen-eral design considerations apply to Part Two also.
The tables and figures used to illustrate the chap-ter are consecutive from Part One to Part Two.
Site Drainage
When large areas with fewer drainage points – such as commercial or industrial sites, parkinglots, highways, airports or whole cities – require
storm drainage, the methods and tables foundin most codes are not applicable. The solutionsobtained using those methods would result insystems that are oversized for the flows involvedand are far too large to be economically feasible.
The reason is that, in large systems, time isrequired for flows to peak at the inlets and accu-mulate in the piping system. Because of this timefactor, the peak flow in the piping does not nec-essarily coincide with the peak rainfall. The de-sign of large storm-drainage systems usually isthe responsibility of the civil engineer; however,the applicable theories and principles are often
used by the plumbing engineer.
The rate of runoff from an area is influenced by many factors, such as:
1. Intensity and duration of the rainfall.
2. Type, imperviousness, and moisture content of the soil.
3. Slope of the surfaces.
4. Type and amount of vegetation.
5. Surface retention.
6. Temperature of the air, water, and soil.
The Rational Method of System Design
The “Rational Method” is the most universally applied and recommended way of calculatingrunoff because it takes all these factors into ac-count. This method assumes that, if rain wereto fall on a totally impervious surface at a con-stant rate long enough, water would eventually run off of the surface at the same rate as it was
applied to the surface, and it assumes that therunoff coefficient would remain constant.
The Rational Method of storm-drainagedesign states that the peak discharge is approxi-mately equal to the product of the area drained,
the runoff coefficient, and the maximum rainfallintensity, or:
Equation 4-4
Q = CIA
where
Q = Rainfall runoff, ft 3/s (m3/s)
C = Surface runoff, coefficient (depen-dent on the surface of the area drained)
I = Rainfall intensity, in./h (mm/h)
A = Drainage area, acres (m2)Note : 1 acre = 43,560 ft 2 (4047 m2)
The “runoff coefficient ” is that portion of rainthat falls on an area and flows off as free water and is not lost to infiltration into the soil, pondingin surface depressions, or evaporation (expressedas a decimal). Construction increases have in-creased the number of impervious surfaces,
which also increases the quantity of runoff. Table4-6 lists some values for the runoff coefficient asreported in the American Society of Civil Engi- neers’ Manual on the Design and Construction of
Sanitary and Storm Sewers . The rate of runoff is hard to accurately evalu-
ate and is impacted by the precipitation rate,
Table 4-6 Some Values of theRational Coefficient C
Surface Type C Value
Bituminous streets 0.70–0.95Concrete streets 0.80–0.95Driveways, walks 0.75–0.85Roofs 0.75–1.00Lawns, sandy soil
Flat, 2% 0.05–0.10Average, 2–7% 0.10–0.15Steep, 7% 0.15–0.20
Lawns, heavy soilFlat, 2% 0.13–0.17Average, 2–7% 0.18–0.22Steep, 7% 0.25–0.35
Unimproved areas 0.10–0.30

8/12/2019 American Society of Plumbing Engineers Volume 2
http://slidepdf.com/reader/full/american-society-of-plumbing-engineers-volume-2 122/233
ASPE Data Book — Volume 296
surface composition and slope, duration of theprecipitation, and the degree of saturation of thesoil. The infiltration rate is much greater for loosesandy soils than for hard clay type soils. Oncesaturated, the soil will not absorb any more wa-ter, which causes greater runoff. The longer theduration of the precipitation and the steeper theslope of the ground, the lower are the rate of infiltration and the amount of water held in de-pressions.
Most engineering designers make use of in-formation reported in tabular or graphic form,inserting local conditions per their experience andpractice. Most sites have various surface com-
positions. The runoff coefficient can be weightedand calculated as follows:
Equation 4-5
Cw
=(A
1 × C
1) + (A
2 × C
2) + (A
3 × C
3) +...(A
n × C
n)
A1 + A2 + A3 +...An
where
C w = Surface runoff
A 1 = Drainage area, by surface type, ft 2
(m2)
C1 = Runoff coefficient, by surface type
Figure 4-10 Overland Flow Time

8/12/2019 American Society of Plumbing Engineers Volume 2
http://slidepdf.com/reader/full/american-society-of-plumbing-engineers-volume-2 123/233

8/12/2019 American Society of Plumbing Engineers Volume 2
http://slidepdf.com/reader/full/american-society-of-plumbing-engineers-volume-2 124/233
ASPE Data Book — Volume 298
onto the grassy area at the most remote point of the tributary area.
Solution
The weighted coefficient of runoff for the entire
area will be calculated using Equation 4-5. Thetime of concentration will then be determined. The runoff rate will then be calculated using theRational Method Formula (Equation 4-4). Assumecoefficients of runoff for the various portions of the tributary area to be as follows: grassy area =0.15, pavement = 0.90, and the roof = 1.00.
Therefore, the weighted runoff coefficient is:
Cw
=(0.50 × 0.15) + (0.50 × 0.90) + (0.20 × 1.00)
0.50 + 0.50 + 0.20
Cw
=0.725
= 0.601.20
Time of concentration
Distance—Inlet to Time forMost Remote Point, Overland Flow
ft (m) (min)
Grass 100 (30.5) 15
Pavement 100 (30.5) 3
Roof — 5
Total 23
Rainfall intensity Using Figure 4-11 and enter-
ing the bottom of the graph at a time concentra-tion of 23 min, and following the vertical axis of the graph to where the vertical line intersectsthe 20-year frequency curve then horizontally tothe left, a rainfall intensity of approximately 5.1in./h (129.5 mm/h) is obtained.
Runoff The runoff from this tributary area iscalculated using the Rational Method Formula (Equation 4-4):
Q =0.60 × 5.1 × 43,560
= 3.1 ft3 /s3600 × 12
Q = 0.60 × 129.5 × 4047 = 0.9 m3 /s
3600 × 1000
Exterior Piping and Inlets
The designer should obtain drawings of the publicstorm sewer available at the project site that depict materials, locations, sizes, and depths. Thelocal authority should be contacted to ascertain
that the public storm system has the capacity for the projected flow. If the available capacity isnot sufficient to handle the additional flow, ei-ther a controlled-flow roof drainage system or a retention basin, or both, may be required. Thedesigner must coordinate the piping layout withother underground utilities.
The pipe should have a minimum exterior size of 10 in. (254 mm) unless otherwise noted
by the local code authority and should maintaina minimum velocity of 2 – 3 ft/s (fps) (0.61-0.91m/s); maximum velocity should be 30 fps (9.1m/s) to limit erosion of the pipe interior. Use
Table 4-4 for sizing the exterior piping, this siz-ing is based on the Manning Formula. The flow rates from other inlets should be accumulatedthrough the piping system. Use Form 4-3 (Sheets1-3) in the Appendix at the end of this chapter
for record keeping. The overland flow time to thefirst inlet must be added to the pipe flow time. The pipe flow time is determined by dividing thelength of pipe between two points by the velocity of flow in the pipe. The size is controlled by ei-ther the existing storm sewer size or by the al-lowable slope.
There are three basic inlets to the storm-drainage system:
1. Drainage inlets . Structures that admit storm water into the storm-drainage system, locatedin areas generally free of sediment or debris.Bottom is level with outlet pipe invert.
2. Catch basins . Similar to inlets except for space below the inlet and outlet pipes for re-tention of sediment. Located in paved areas;require good maintenance.
3. Manholes . Provide ease of access to pipe con-nections; use a drop manhole if there is a difference of 2 ft (0.61 m) or more betweenthe inlet and the outlet.
Catch basins should be provided at the inlet to drains, with strainer openings equal to at least twice the area of the drains. Use site contour lines to locate site low points; these areas must
be provided with drains to prevent ponding. Park-ing area and street gutter drains should be open-throat, curb type drains and should be provided
with hoods. Grate type inlets can become fouled,decreasing the capacity of the drain. Street in-lets should be located upstream of flow at theintersection of streets and so that the maximum
water depth at the curb is approximately Q theheight of the curb and the width of water in the

8/12/2019 American Society of Plumbing Engineers Volume 2
http://slidepdf.com/reader/full/american-society-of-plumbing-engineers-volume-2 125/233
99Chapter 4— Storm-Drainage Systems
gutter does not exceed ½ the width of the adja-cent driving lane.
Street gutters should use a roughness coef-ficient of 0.015. If trenches are utilized, thetrenches must be wide enough for a drain of the
proper size to connect to the trenches. Locationof drain inlets should be done so as to avoid pe-destrian crossing zones and to prevent water fromcrossing a street or sidewalk to reach the drain.Inlets should be in grassy areas to prevent wa-ter from flowing from the grassy area onto pavedareas and especially to prevent water from freez-ing on the paved areas in colder climates. Fur-ther, they should be adjacent to buildings toensure positive drainage away from the build-ings. Inlet flow capacities should be limited toapproximately 5 ft 3/s (0.14 m3/s). The maximumdistance between inlets should be 300 ft (91.4 m).
Culvert pipes are storm sewers that are usu-ally open on both ends. They are commonly placed in a creek bed or ditch and used to trans-port storm water from one side of a road or em-
bankment to the other side. Culvert inlets andoutlets should be provided with head walls com-posed of straight walls for culverts less than 24in. (0.61 m) in diameter and with wing walls for culverts greater than 24 in. (0.61 m) in diam-eter. Head walls tend to improve the hydrauliccharacteristics of the culvert and should be pro-
vided with vertical sloped bar strainers to reduceclogging.
The culvert should be sized to pass the de-sign flow rate without building up an excessive
water depth on the upstream end of the culvert,a minimum of 15 in. (381 mm). The culvert de-sign should provide reasonable freeboard to pre-
vent the water from running over the road or embankment, yet it cannot allow the water to
build up high enough to cause damage upstreamof the culvert.
Manholes should be provided for cleanout purposes on exterior piping at changes in direc-tion, changes in pipe size, and changes in slope;
at multiple pipe connections; and at intervals asrequired by the local code, but they should not be more than 250 – 500 ft (76.2-152.4 m) apart.Manholes should have a minimum opening of 24 in. (0.61 m) in diameter, have a 48-in. (1.22-m) minimum base diameter, have a 1 – 3-in. (25.4 – 76.2-mm) drop in invert across the base, beprovided with cast-iron steps at 9 in. (228.6 mm)on center, have a cast-iron frame and cover for
proper traffic load, and have an impact slab if the storm water cascades 10 ft (3.1 m) or more.
The layout of the piping system should at-tempt to keep excavation to a minimum by fol-lowing the slope of the ground above the pipe
and by limiting manhole depths to a maximumof 15 ft (4.6 m), if possible, by locating the man-holes closer together. The layout should also at-tempt to avoid tree locations because of root problems, and piping below paving should bekept to a minimum. The layout should avoid rail-road tracks. The exfiltration of water from bad
joints and cracks in the pipe can erode thesubgrade of roads or railways. When piping must cross a road or railway, joints with very little or no leakage should be selected and the strengthof the pipe must be proper for the trench loads it
will endure.
Subsurface Drainage
The importance of subsurface water-conveyingsystems cannot be overemphasized. Each sys-tem is designed to solve a specific problem. Somesystems are installed to prevent the earth fromlosing bearing resistance by water erosion of thesoil, others to prevent uplifting of the buildingslabs by hydrostatic pressure. Another reasonfor installing subsurface drainage systems is toprevent the slab or walls below grade from be-coming wet by capillary action if the ground wa-ter is too close to the slab. In each case, theobjective of this type of system is to prevent sub-surface water from rising above a predeterminedelevation.
Source of subsurface water The source of allsubsurface water is rain, hail, snow, or sleet.Some precipitation finds its way to streams, riv-ers, lakes, and oceans by surface runoff. Much
Figure 4-12 Sources of Subsurface Water

8/12/2019 American Society of Plumbing Engineers Volume 2
http://slidepdf.com/reader/full/american-society-of-plumbing-engineers-volume-2 126/233
ASPE Data Book — Volume 2100
of it seeps into the ground, percolates throughthe pores of the soil, and, eventually, spills intolarge surface bodies of water through under-ground passages or by becoming surface-borneagain. See Figure 4-12.
There are two basic types of subsurface water:
1. Perched water is a local accumulation that has seeped into the ground from previousrains and is trapped in small pockets by im-pervious substances, such as clay or rock.
The water accumulates because these sub-stances form a basin. Because perched wa-ter does not flow in the absence of rainfall,the upper surface of the water (called the
water table) is approximately level and theabsence of a constant inflow makes controlof the water straightforward. Pumping will
completely remove this water and local rain-fall is necessary to replenish it.
2. Flowing water occurs when subsurface wa-ter passes from deposit to deposit by perco-lation (constant flowing water table). This
body of water can be a small brook or a largeriver. The flow is constant in one direction.
The top of the water table is never level be-cause of the resistance of the soil to the flow of water. The quantity of water flowing is re-lated to the rate of water overflowing the de-posits, which, in turn, is related to theamount of percolation entering the deposits.During regional droughts, there may be noflow at all.
Site investigation Economics and feasibility are the bases of all analytical studies. The loca-tion of a structure is accepted only after a sur-
vey has proven that it is both technically feasibleand economically practical. The contours of theland have an important bearing on the amount of excavation and backfilling required. Under-ground conditions, such as rock and water, canalso be deciding factors.
Land contours and conditions above ground
can easily be determined by direct observation;underground conditions are more difficult to as-certain and require special equipment and expe-rience. The most common method of determiningsubsurface conditions is to bore a hole into theground and record the texture and strata eleva-tion of the various types of soil found. Boringscan also reveal water-table elevations, thestrength of the soils, and rock conditions. SeeFigure 4-13.
While rock can be useful in providing a good bearing for the structure, its presence may bethe one factor that prevents the use of the sitedue to excessive excavation costs. The soil may
be of a texture that will not sustain the weight of the structure and piles may have to be driven.
Also, ground water contributes to foundationproblems. The level of the ground water may cause poor soil bearing values, and often a highground-water table will necessitate costly pres-sure foundation slabs.
Determining capacities of ground water Prior to designing drainage systems, it is necessary todetermine the quantity of subsurface water that must be removed to lower the water table to a safe elevation. These tests are normally per-formed by a soils engineer or done at the request of the civil or structural engineer. As is common
with the majority of hydraulic formulae and themethods devised to ascertain characteristics of fluids, determination of subsurface water quan-tities involves an educated guess. With all thenecessary factors for various conditions that must be used in the formulae, it is improbable
that an accurate answer will be attained. How-ever, an answer that can be used with the as-surance that it is the best available can beobtained by considering the information from thegreat number of tests conducted in the labora-tory and in the field.
Two factors are used to determine quantitiesof subsurface water:
1. Coefficient of permeability , or K factor, de-
Figure 4-13 Borings Revealing the Natureof the Ground, Water Table Elevations,
and Rock Conditions

8/12/2019 American Society of Plumbing Engineers Volume 2
http://slidepdf.com/reader/full/american-society-of-plumbing-engineers-volume-2 127/233
101Chapter 4— Storm-Drainage Systems
fined as gallons (liters) of water per day through 1 square foot (0.09 m2) of soil, withan increasing head of 1 foot (0.3 m) every linear foot (0.3 m). See Figure 4-14.
2. Coefficient of transmissibility , or Q factor,
defined as gallons (liters) of water per day through the entire area, with the actual in-creasing head every linear foot (0.3 m).
Excavation prior to testing is considered themost accurate method for determining subsur-face water flows, as the excavation largely elimi-nates the resistance of the soil to flow. This methodcan easily be the most expensive: when contrac-tors are chosen before the design of the subsur-face drainage system, the advantage of competitive
bidding is lost. With Q directly determined, K can be estimated by using the following relationship, which will enable the design of the pipe and trench
system (see also Figure 4-14).
Equation 4-6
K =velocity
× 7.5 gal/ft3slope
K =velocity
× 1002.4 L/m3
slope
where
Velocity = Q/area, ft 2/day (m2/day)
Slope = Head per length, ft/ft (m/m)
The term “slope” refers to the hydraulic gra-
dient in the soil. It is difficult to determine; for most purposes, however, the slope is 1.
Information derived from borings include tex-ture and strata of soils, water, rock and samplesof specimens encountered. Direction of the flow can be determined by the elevation of the water table in the various borings.
Knowing the various strata and the textureof the soil, an average K factor can be determined.
A cross-section sketch of the strata informationobtained from the borings can be drawn and thearea of each layer determined. Laboratory testsor published charts will indicate the K factor for each texture of soil, and the average K factor of the cross section can be obtained.
If the table is flowing, it is important to choosethe proper cross section in relation to the direc-tion of flow. If the water is a deposit (not flow-ing), an average K for two cross sections, at right angles to each other, must be determined and
the larger one used.
The following industry standards for K fac-tors are used:
K Factors of Various Soil Textures,gal/day/ ft2 / ft of head/l ft (L/day/m2 /m of head/l m)
Clean gravel 100,000–1,000,000(43 852 977–438 529 774)
Mixture, sand and gravel 100–10,000(43 853–4 385 298)
Mixture, sand, silt, 0.01–10clay, fine sand (4.38–4385)
Clay 0.0001–0.001(0.044–0.438)
It can readily be observed from the abovetable that the chance of error with this methodis great. To eliminate as much error as possible,samples of the soils, taken during borings, should
be taken to a laboratory to obtain the proper K factor. The possibility of error will then be lim-ited to calculating an average K for the proper cross section of the site area. It must be realizedthat the K factor measures the capacity of thesoil to conduct water not the actual amount flow-
ing. The quantity of water infiltrating the soilmay be less than K but is never more. Thus, theK factor is a safe criterion for use with the bor-ing method.
After the average K is determined, Q must be established.
Equation 4-7
Q = K × area × slopeFigure 4-14 Cross Section Illustrating
the Concept of the K Factor

8/12/2019 American Society of Plumbing Engineers Volume 2
http://slidepdf.com/reader/full/american-society-of-plumbing-engineers-volume-2 128/233

8/12/2019 American Society of Plumbing Engineers Volume 2
http://slidepdf.com/reader/full/american-society-of-plumbing-engineers-volume-2 129/233
103Chapter 4— Storm-Drainage Systems
Concrete Institute and Data Book, Volume 1,Chapter 2.
To enable the greatest amount of water toflow into the piping, a filter material is placed
between the pipe and the wall of the trench. If
no filter material were installed between the pipeand the base soil material, the amount of water entering the pipe would be only as great as theamount of water coming through the soil adja-cent to the pipe, which depends on the K factor of the soil. The amount of water filtering through1 linear foot (0.3 m) of trench should be less thanthe amount of water 1 linear foot (0.3 m) of pipecan receive.
The foundation drainage piping should beplaced at the same elevation as the lowest floor and should be a minimum of 3 ft (0.9 m) fromthe foundation wall. The foundation drainage
system should be placed on all sides of the build-ing, or at least on all sides from which ground
water is expected.
A basic rule of spacing between trenches for below-slab drainage is that this distance should be no greater than twice the vertical distance of the adjacent trenches but should not exceed 10 – 15 ft (3.0 – 4.5 m) on center. The more porous thesoil, the farther apart and the deeper the trenchesshould be.
The vertical distance is measured from the bottom of the pipe to the top of the filter mate-
rial, normally a few inches (mm) to 18 in. (0.45m) below the slab. This rule is designed to pre-
vent the water table from rising above the eleva-tion required for safety between the trenches.
During trenching, care must be observed not to undermine the building footings. A “no-manzone” exists from the lower edge of a footing in a 45° angle (angle of repose) down and away from
the footing (see Figure 4-17). To prevent under-mining the footing, piping should not be placed
within this zone — unless the foundation/struc-tural engineer ’s approval to do so is obtained.
Filter materials The piping must be sur-rounded with gravel or another loose, non- absor-
bent material and should be backfilled with a similar material to at least 1 ft (0.3 m) below thepipe. Porous materials should be used above thepipe to direct ground water to the drain and should
be extended up as close as possible to grade.Filter materials can be obtained in mixtures
ranging from coarse gravel to fine sand and inany composition. With each mixture, a grain sizecurve can be developed to determine the generalsize of the mixture, at various percentages, by
weight. The filter material must be tamped toreduce washout of the base material.
Figure 4-17 Pipe and Footing Locations
Table 4-7 Size Ranges for Filter Material
Filter Material Size Range, 15% Size, 85% Size, K factorain. (mm) in. (mm) in. (mm)
Pea gravel 0.04–0.40 (1.–10.2) 0.09 (2.3) 0.25 (6.4) 29,000 (12.7)
Coarse sand 0.05–0.30 (1.3–7.6) 0.07 (1.8) 0.20 (5.1) 18,000 (7.9)
Fine sand and medium gravel 0.03–0.35 (0.8–8.9) 0.055 (1.4) 0.25 (6.4) 17,000 (7.5)
Coarse sand and medium gravel 0.025–0.35 (0.6–8.9) 0.03 (0.8) 0.24 (6.1) 14,000 (6.1)
Concrete sand 0.03–0.30 (0.8–7.6) 0.05 (1.3) 0.20 (5.1) 10,000 (4.4)
aIn gal/day/ft2 of pipe surface/ft of head/l ft (L/day/m2 /m/m x 106).

8/12/2019 American Society of Plumbing Engineers Volume 2
http://slidepdf.com/reader/full/american-society-of-plumbing-engineers-volume-2 130/233
ASPE Data Book — Volume 2104
For open-joint and perforated pipe, the filter material must be carefully selected to graduatefrom twice the size of the pipe openings to thefine size of the base material at the site.
The thickness of each layer of filter materialaround the pipe and in the trench should be at least 4 in. (101.6 mm). It is sometimes used asthe criterion of trench width, if the K factor of the soil does not require the width to be broader.See Figure 4-18.
Table 4-7 includes some common filteringmaterials and their size ranges.
Selecting pipe diameter Pipe diameter affectsthe functioning of the subsurface drain in two
ways. First, there must be sufficient surface topermit the required infiltration, and second, thepipe must be large enough to convey the infiltrated
water but not smaller than 4 in. (101.6 mm).
For example, assume a soil to have a K fac-tor of 1000 gal/day/ft 2 of pipe surface/ft of head/l ft (438 500 L/day/m2/m/l m) and a trench with8 ft 2 of surface (sides and bottom)/l ft (0.74 m2/0.3 l m) of trench . Assuming a hydraulic slopeof 1, the infiltration rate will be 8000 gal/day/ft (99345 L/day/m) of trench .
Using a trial-and-error method of solution,assume a 4-in. (101.6-mm) pipe. The pipe sur-face is approximately 1 ft 2/l ft (0.3 m2/l m) for a 4-in. (101.6-mm) porous pipe. Assume an infil-
tration capability of 10,000 gal/day/ft 2/l ft of pipe (4 385 000 L/day/m2/l m), then the pipeinfiltration rate will be 10,000 gal/day/l ft (4 385000 L/day/l m) of pipe. This is greater than therequired infiltration rate of 8000 gal/day/l ft (99345 L/day/m).
Now it must be determined whether this 4-in. (101.6-mm) pipe is able to convey the water.In order to solve the problem, certain simplify-
Figure 4-18 Pipe in Trench with Dimensions of Filter Layers
8/12/2019 American Society of Plumbing Engineers Volume 2
http://slidepdf.com/reader/full/american-society-of-plumbing-engineers-volume-2 131/233
105Chapter 4— Storm-Drainage Systems
ing assumptions must be made. In most cases,the drainage piping will be installed flat. How-ever, water will flow in a flat pipe if the end of that pipe is open to atmospheric pressure. A con-servative assumption is that the water acts as if the pipe had a slope of 0.01 ft/ft (0.01 m/m) or 1%. This enables the use of standard charts for the discharge of circular pipes based on theManning formula. Such a pipe chart would show that at a 0.01 ft/ft (0.01) slope, a 4-in. (101.6-mm) pipe will accommodate 150,000 gal/day (567 750 L/day). With an infiltration rate of 8000gal/day/l ft (99 345 L/day/m), the 4-in. (101.6-mm) pipe will be flowing full in 150,000/8000 or 20 ft (6.1 m). If the trench were 100 ft (30.5 m),requiring a capacity of 800,000 gal/day (3 028000 L/day), then the chart would indicate that an 8-in. (203-mm) pipe would be required.
Disposal of ground water Ground water very often becomes surface borne and a source of supply to streams, brooks, and rivers. If the natu-ral flow of ground water is disrupted, a water-
way, important to some individuals, may bedeprived of its supply. After the contours of theland and the adjacent property are studied, theground water may be directed to daylight, a stream, a ditch, or another natural waterway; or put back into the ground with diffusion wells,
which may defeat the purpose of the drainagesystem.
For many installations, it is neither feasible
nor desirable to return the water into the ground. The effect of additional ground water on an ad- jacent structure may be deleterious.
Discharge of subsurface water into munici-pal storm sewers requires permission from theauthorities having jurisdiction. Storm sewers areoften available and, if the capacity allows it, dis-charge into them is usually approved. It is a goodpractice to install a sediment pit to prevent wash-out material from entering municipal sewers andto provide an acceptable backwater valve in thedischarge to the public storm sewer. If the sub-soil drainage system is lower than the publicstorm sewer, pumping may be required.
If the drainage must be pumped, the sub-surface drainage pipe should terminate with a ¼ bend down into a sump (minimum 18 in. [0.45m] diameter and 24 in. [0.6 m] deep) with theend submerged 3 in. (76.2 mm) or less. Ventingof the sump is not required. The sump cover should be of proper traffic loading, flush with
the floor, and loose fitting, or, if used as an area drain, it can be open grating. The sump con-struction should be tile, plastic, fiberglass, steel,cast iron, concrete, or another approved mate-rial. The pump should be a duplex unit and, if considered critical, may require emergency power or a diesel backup pump. The capacity and headfor the pump must meet the anticipated require-ments. Subsurface water often contains sand andsilt sediment. Pumps must be designed to ac-cept some sediment, or damage to the pump com-ponents will occur.
The pump head must be sufficient to lift the water from the low-water pump-off level in thepit (normally 6 in. [127 mm] above the sump
bottom) to the necessary elevation to tie into thegravity storm main, plus make up for the fric-tion losses in the pump discharge piping, includ-
ing fittings and valves. A full-flow check valve isrequired in the pump discharge piping and anisolation valve should be provided for servicingthe check valve. If the lift is 35 – 40 ft (10.7 – 12.2m), the check valve should be the spring-loadedtype. The discharge piping should be the samesize as the pump connection, or larger to reducethe friction losses, and should be of galvanizedsteel with cast-iron, screwed fittings. An indi-
vidual branch electrical circuit should be pro- vided for the pump, with proper waterproof provisions. See Figure 4-19.
Some subsoil drainage water can have offen-
sive odors or can carry pollutants. Under theseconditions, discharge to the sanitary sewer may
be preferable, or required, and the sump may berequired to be upright. However, directing thedischarge to the sanitary sewer may overload thepublic sewer. The designed system should bereviewed by the jurisdictional authority.
Storm-Water Detention
Within the drainage basins of streams with a history of flooding, along outfalls with limitedcapacities, and in areas where the discharge
could cause overloading of the public stormsewer, the local authority may require an on-site storm water detention system with an es-tablished slow release rate as part of the drainageplan for a proposed development.
A change in the use of a site, from a woodedor grassy area to a paved commercial or indus-trial area, causes a severe impact to natural
waterways including a decrease in infiltration and
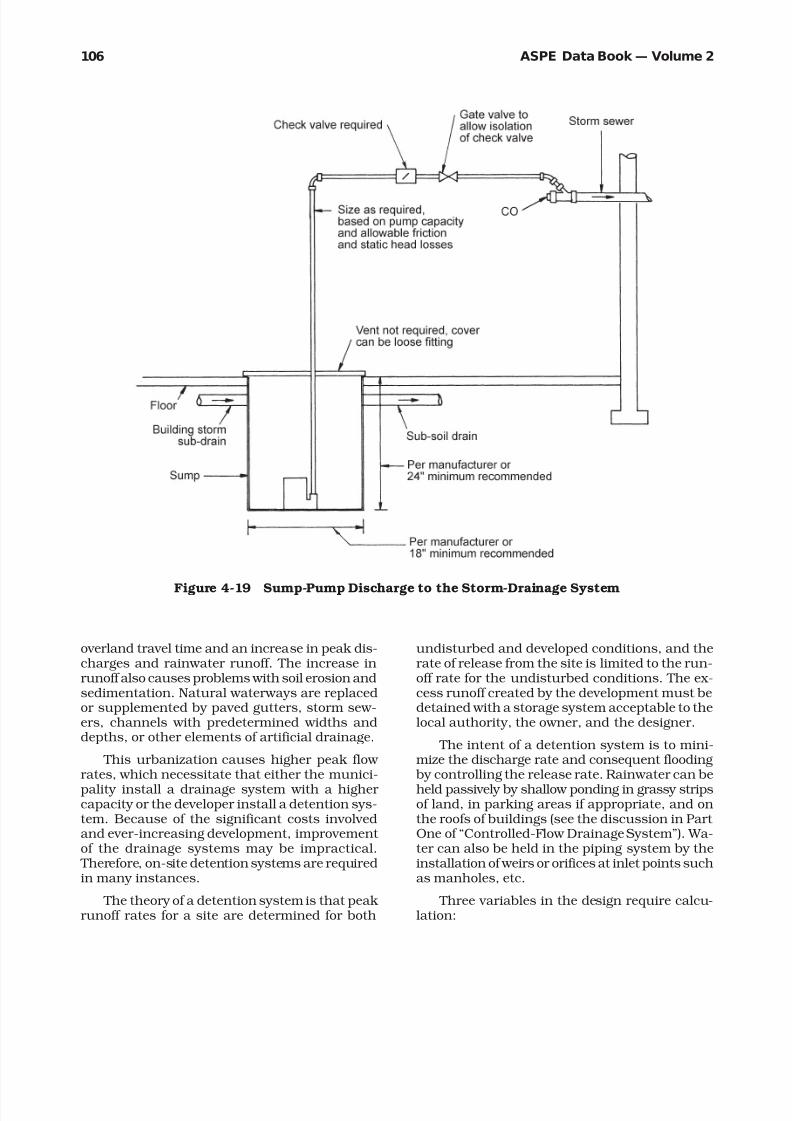
8/12/2019 American Society of Plumbing Engineers Volume 2
http://slidepdf.com/reader/full/american-society-of-plumbing-engineers-volume-2 132/233
ASPE Data Book — Volume 2106
overland travel time and an increase in peak dis-charges and rainwater runoff. The increase inrunoff also causes problems with soil erosion andsedimentation. Natural waterways are replacedor supplemented by paved gutters, storm sew-ers, channels with predetermined widths anddepths, or other elements of artificial drainage.
This urbanization causes higher peak flow rates, which necessitate that either the munici-
pality install a drainage system with a higher capacity or the developer install a detention sys-tem. Because of the significant costs involvedand ever-increasing development, improvement of the drainage systems may be impractical.
Therefore, on-site detention systems are requiredin many instances.
The theory of a detention system is that peak runoff rates for a site are determined for both
undisturbed and developed conditions, and therate of release from the site is limited to the run-off rate for the undisturbed conditions. The ex-cess runoff created by the development must bedetained with a storage system acceptable to thelocal authority, the owner, and the designer.
The intent of a detention system is to mini-mize the discharge rate and consequent flooding
by controlling the release rate. Rainwater can be
held passively by shallow ponding in grassy stripsof land, in parking areas if appropriate, and onthe roofs of buildings (see the discussion in Part One of “Controlled-Flow Drainage System”). Wa-ter can also be held in the piping system by theinstallation of weirs or orifices at inlet points suchas manholes, etc.
Three variables in the design require calcu-lation:
Figure 4-19 Sump-Pump Discharge to the Storm-Drainage System

8/12/2019 American Society of Plumbing Engineers Volume 2
http://slidepdf.com/reader/full/american-society-of-plumbing-engineers-volume-2 133/233

8/12/2019 American Society of Plumbing Engineers Volume 2
http://slidepdf.com/reader/full/american-society-of-plumbing-engineers-volume-2 134/233
ASPE Data Book — Volume 2108
in ft 3/s (m3/s) equal to the maximum allowableoperating condition under the head as deter-mined by the depth of retention.
Equation 4-14
Orifice area, A =Q
0.62 × 2GH
where
A = Area of outlet orifice or pipe, ft 2 (m3)
Q = Allowable outflow rate, ft 3/s (m3/s)
G = Acceleration due to gravity = 32.2ft/s2 (9.8 m/s2)
H = Head, distance of water level tocenterline of the outflow pipe, ft (m).
If the outlet flow is constant, select a depthof retention and a pump that will yield an out-
flow in ft 3/s (m3/s) equal to the maximum al-lowable. The constant outflow rate implies that the total outflow is the outflow rate multiplied
by the duration of the storm.
Equation 4-15
Pumped outflow, Vo = 60 QoT
Once the pumped (constant) outflow rate has been determined, the volume of storage requiredcan be calculated, as follows:
Equation 4-16
Vs = Vn − Vo
therefore
Vs =10,500T
− 60 QoTT + 25
Equation 4-17
T = − 25 + √ 4375 Q
o
All systems should be permitted and should be submitted to the local authority for approval.

8/12/2019 American Society of Plumbing Engineers Volume 2
http://slidepdf.com/reader/full/american-society-of-plumbing-engineers-volume-2 135/233
109Chapter 4— Storm-Drainage Systems
APPENDIX
Form 4-1 Storm-Drainage Calculations for Roof Drains and Vertical Leaders

8/12/2019 American Society of Plumbing Engineers Volume 2
http://slidepdf.com/reader/full/american-society-of-plumbing-engineers-volume-2 136/233
ASPE Data Book — Volume 2110
Form 4-2 Storm-Drainage System Sizing Sheet

8/12/2019 American Society of Plumbing Engineers Volume 2
http://slidepdf.com/reader/full/american-society-of-plumbing-engineers-volume-2 137/233
111Chapter 4— Storm-Drainage Systems
Form 4-3 Storm-Water Drainage Worksheet 1

8/12/2019 American Society of Plumbing Engineers Volume 2
http://slidepdf.com/reader/full/american-society-of-plumbing-engineers-volume-2 138/233
ASPE Data Book — Volume 2112
Form 4-3 Storm-Water Drainage Worksheet 2

8/12/2019 American Society of Plumbing Engineers Volume 2
http://slidepdf.com/reader/full/american-society-of-plumbing-engineers-volume-2 139/233
113Chapter 4— Storm-Drainage Systems
Form 4-3 Storm-Water Drainage Worksheet 3

8/12/2019 American Society of Plumbing Engineers Volume 2
http://slidepdf.com/reader/full/american-society-of-plumbing-engineers-volume-2 140/233
ASPE Data Book — Volume 2114
REFERENCES
1. American Concrete Institute. Concrete pipe hand- book . Washington, DC.
2. American Society of Civil Engineers. n.d. Manual on the design and construction of sanitary and
storm sewers.
3. Ballanco, Julius, and Eugene R. Shumann. 1987.The illustrated national plumbing code design manual . Ballanco and Shumann — IllustratedPlumbing Codes, Inc.
4. Building Officials and Code Administration(BOCA). 1981. BOCA basic plumbing code .
5. Cast-Iron Soil Pipe Institute. 1976. Cast-iron soil pipe and fittings engineering manual . Vol. 1. Washington, DC.
6. Church, James C. 1979. Practical plumbing de- sign guide . New York: McGraw-Hill.
7. Frankel, Michael. 1981. Storm water retentionmethods. Plumbing Engineer March/April andMay/June.
8. Frederick, Ralph H., Vance A. Meyers, andEugene P. Auciello. NOAA, National weather ser- vice 5-60 minute precipitation frequency for the eastern and central United States . NWS tech.memo. HYDRO-35. NTIS Publication PB-272 112.Silver Spring, MD: National Technical Informa-tion Service.
9. Hicks, Tyler G., ed. 1986. Plumbing design and installation reference guide . New York: McGraw-Hill.
10. Manas, Vincent T. 1968. National plumbing code,illustrated. St. Petersburg, FL: Manas Publica-tions.
11. Sansone, John R. 1978. Storm drainage designand detention using the rational method. Plumb- ing Engineer July/ August.
12. SBCCI. 1988. Standard plumbing code . Birming-ham, AL.
13. Soil Conservation Service, Engineering Division.1986. Urban hydrology for small watersheds. Technical release no. 55, June. NTIS publicationPB87-101580. Silver Spring, MD: National Tech-nical Information Service.
14. Steele, Alfred. 1982. Engineered plumbing design .Chicago: Delta Communications. (Now availablethrough ASPE.)
15. Steele, Alfred. High-rise plumbing. Plumbing En- gineer . Chicago: Delta Communications.
16. US War Department. Engineering manual of the War Department. Misc. publication no. 204.
17. US Department of the Army. Plumbing design manual no. 3.01.
18. Yrjanainen, Glen, and Alan W. Warren. 1973. A simple method for retention basin design. Water and Sewage Works December.

8/12/2019 American Society of Plumbing Engineers Volume 2
http://slidepdf.com/reader/full/american-society-of-plumbing-engineers-volume-2 141/233
115Chapter 5— Cold-Water Systems
Cold-Water
Systems5INTRODUCTION
Proper design of a building’s water-distributionsystem is necessary so that the various fixturesfunction properly, that excessive pressure andpressure fluctuations are prevented, and that supply failure under normal conditions isavoided. The amount of cold water used in a
building is a function of structure type, usage,occupancy, and time of day. It is necessary toprovide the most economical pipe sizes to meet the peak demand without wasteful excess in pip-ing or cost. There are at least five reasons why proper sizing of the piping in a water-distribu-
tion system is essential:1. Health . This factor is of great importance. In-
adequate sizing can cause negative pressuresin a piping system and lead to contamina-tion of the water supply by backflow or back-siphonage.
2. Pressure . If adequate residual pressure can-not be maintained at equipment and fixtures
because of inadequate pipe sizing, improper operation will result. Excessive pressures willcause erosion and noise problems in the pip-ing and accelerate deterioration of the sealsin faucets.
3. Flow . If flow rates cannot be maintained at adequate levels because of inadequate pipesizing, equipment performance will deteriorate.
4. Water service . Improper sizing can acceler-ate erosion, corrosion, and scale buildup.
5. Noise . High velocities cause noise and in-crease the danger of surge pressure shock.
(The accepted maximum velocity is 8 fps
[2.4 m/s].)
DOMESTIC COLD-WATER METERS
Many major municipalities furnish and/or in-stall a particular type of water meter. In suchlocations, the meter characteristics (type, size,flow, pressure drops, remote readouts, costs, etc.)can be obtained through the local water depart-ment. Depending on the type of project beingcontemplated, a utility may request a particular meter (e.g., compound meter vs. turbine meter.)
Whether a utility company ’s meter or a meter from another source is used, the above-men-tioned characteristics must be taken into con-sideration. The location of the meter is of primeimportance. The meter shall not be subjected tofreezing or submerged conditions. To discour-age tapping of the piping ahead of the meter, it may be required that the meter be located di-rectly inside the building wall. Some jurisdictions
want the meter immediately adjacent to the tapto prevent illegal connections between the meter and the tap. Where job conditions mandate sucha location, a meter in an outside pit or manhole
should be watertight against both surface andground-water conditions. A reduced-pressure backflow preventer is recommended at the build-ing meter and is required by some codes andmunicipalities.
Water meters for plumbing use are usually classified as the positive-displacement type,
which indicate direct flow and record water pas-sage in gal (L) or ft 3 (m3).

8/12/2019 American Society of Plumbing Engineers Volume 2
http://slidepdf.com/reader/full/american-society-of-plumbing-engineers-volume-2 142/233
ASPE Data Book — Volume 2116
Meter Types
1. Disc meter. These meters are normallys, w,1, 1½, and 2 in. (16, 19.1, 25, 40, and 50mm) in size; are manufactured to meet therequirements of AWWA Standard C700; have
a 150 psi (1034 kPa) maximum working pres-sure; and measure flow in one direction. Thistype of meter is common to residential andsmall commercial installations and is adapt-able for remote readout systems.
2. Compound meter. These meters are normally 2, 3, 4, and 6 in. (50, 80, 100, and 150 mm)in size; are manufactured to meet the require-ments of AWWA Standard C700; have a 150psi (1034 kPa) maximum working pressure;and measure flow in one direction. This typeof meter is used when most of the flow is low
but high flows are anticipated. It is capableof recording low flows and has the capacity for high flow rates.
3. Turbine meter. The sizes of this meter are 2,3, 4, 6, and 10 in. (50, 80, 100, 150, and 250mm). This type of meter has the characteris-tics of a compound meter but is more suit-able for encountering a variety of flows. (A strainer should be installed upstream of themeter.)
4. Propeller meter. The sizes of this meter are2 – 72 in. (51 – 1829 mm). Propeller meters areused where low flows never occur.
5. Fire-line meters or detector-check meters. Thistype of meter may be required by local codesin a water service that feeds a fire-protectionsprinkler system or fire-hydrant system. Insuch a case, the installation must meet therequirements of the local fire official and theappropriate insurance company. The designshould include a minimum of 8 pipe diam-eters of straight pipe upstream of the meter
before any change in direction or connections.
Various types of meter can be equipped withoptional accessories. Remote-readout systems,strip-chart recorders, etc. are available for spe-cific applications.
Sizing the Water Meter
The following design criteria may be used as a guide for selecting the proper meter:
1. Building occupancy type.
2. Minimum and maximum demand.
3. Water pressure available.
4. Size of building service.
5. Piping, valve, meter, and elevation losses.
6. Meter costs and tap fees.
7. Maintenance costs and fees.
Tables 5-1 to 5-3 from AWWA Standard M22are reprinted as additional guidelines for water meters.
SIZING THE WATER LINE
In practically all cases, water can be regarded asan incompressible fluid and, for calculations at approximately atmospheric temperature, it iscustomary to assume that water has a uniformdensity of 62.4 lb/ft 3 (1 kg/L), which holds nearly
constant through a temperature range of 32 – 60°F (0 – 15.6°C).
For calculations involving water-heating sys-tems such as boiler-feed pump discharge heads,it is necessary to take into account the changesin density, vapor pressure, and viscosity withtemperature. Application of the common empiri-cal equations for water flow is limited to water at usual atmospheric temperatures in the 32 – l00°F (0 – 37.8°C) range. At higher temperatures, thechanges in density and viscosity have a consid-erable bearing on flow relations; where accurateresults are desired, use of the common empiri-cal formulae is not recommended.
Hazen-Williams Formula
Among the many empirical formulae for frictionlosses that have been proposed, the Hazen-Wil-liams equation is the most widely used. In a con-
venient form, it reads as follows:
Equation 5-1
f = 0.2082
100
1.85
q1.85
C d4.8655
where
f = Friction head, ft of liquid/100 ft
of pipe (m/100 m)
C = Surface roughness constant
q = Fluid flow, gpm (L/s)
d = Inside diameter of pipe, in. (mm)
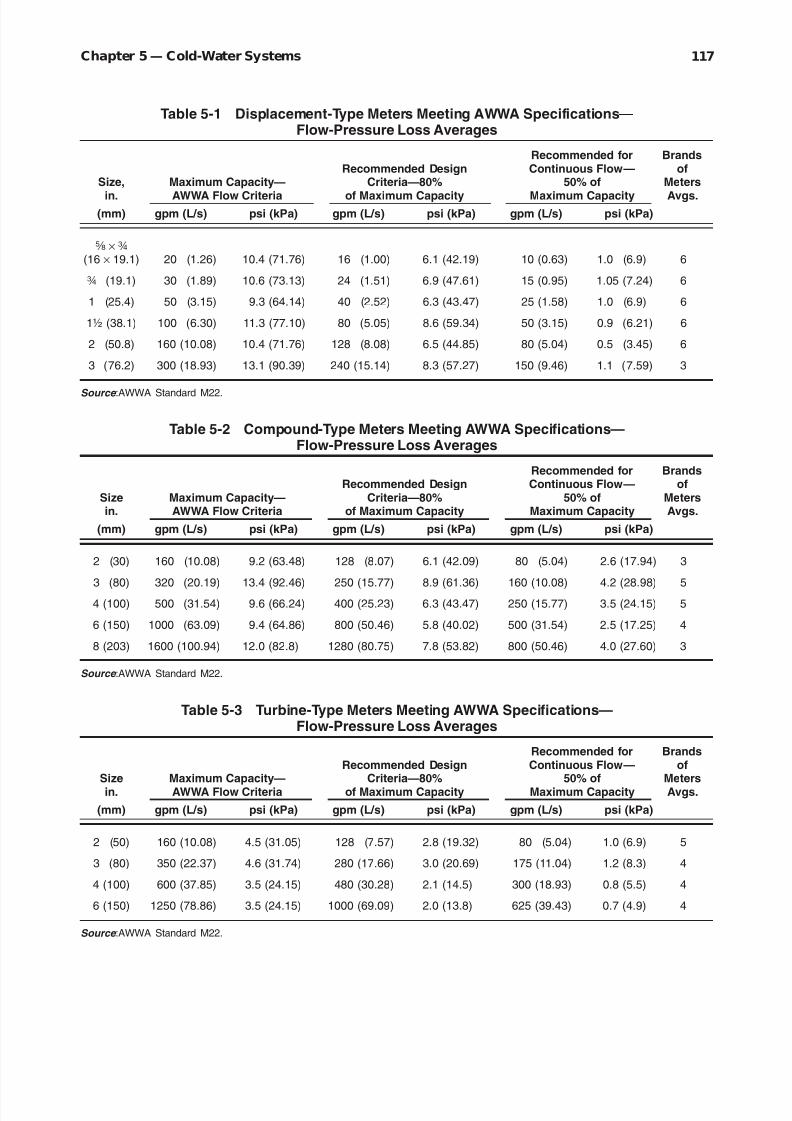
8/12/2019 American Society of Plumbing Engineers Volume 2
http://slidepdf.com/reader/full/american-society-of-plumbing-engineers-volume-2 143/233
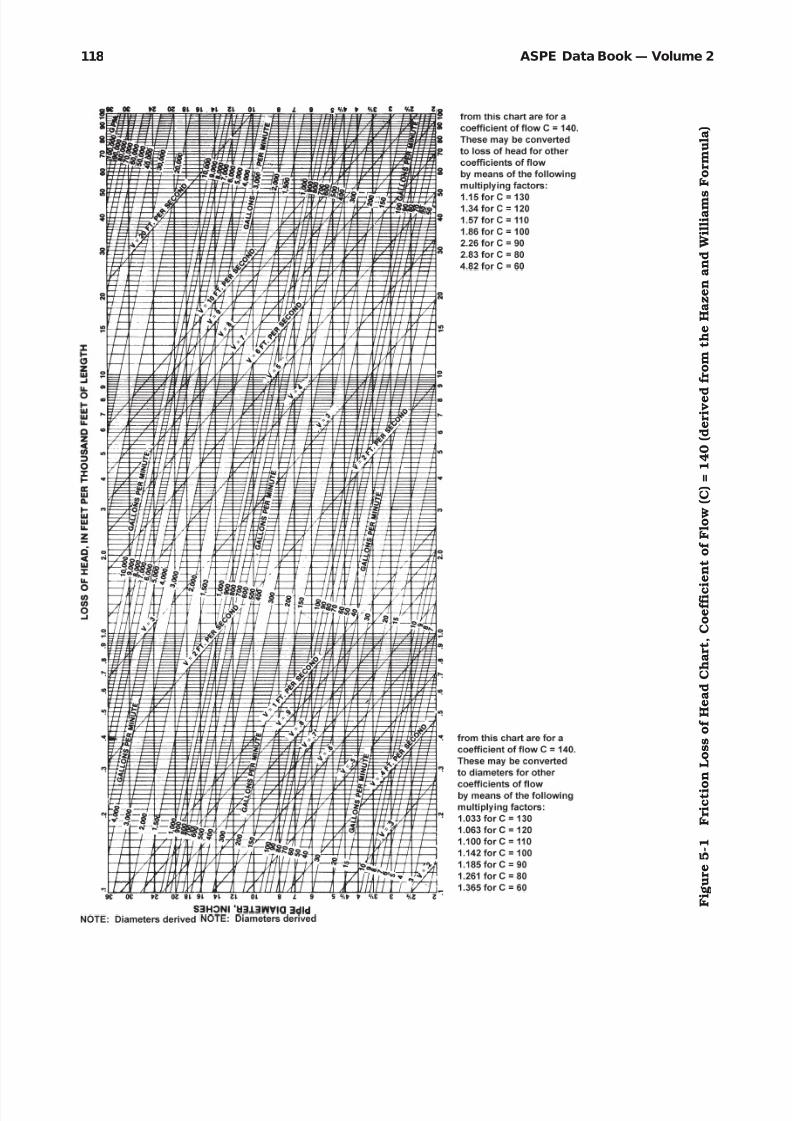
8/12/2019 American Society of Plumbing Engineers Volume 2
http://slidepdf.com/reader/full/american-society-of-plumbing-engineers-volume-2 144/233
ASPE Data Book — Volume 2118
F i g u r e 5 - 1
F r i c t i o
n L o s s o f H e a d C h a r t ,
C o e f f i c i e n t o f F l o w ( C ) = 1 4 0 ( d e r i v e d
f r o m t
h e H a z e n a n d W i l l i a m s
F o r m u l a )

8/12/2019 American Society of Plumbing Engineers Volume 2
http://slidepdf.com/reader/full/american-society-of-plumbing-engineers-volume-2 145/233
119Chapter 5— Cold-Water Systems
F i g u r e 5 - 1
( M )
F r i c t i o n L o s s o f H e a d C h a r t ,
C o e f f i c i e n t o f f l o w ( C ) = 1 4 0 ( d e r i v e d f r o m t
h e H a z e n a n d W i l l i a m
s F o r m u l a )

8/12/2019 American Society of Plumbing Engineers Volume 2
http://slidepdf.com/reader/full/american-society-of-plumbing-engineers-volume-2 146/233
ASPE Data Book — Volume 2120
Figure 5-2 Conversion of Fixture Units, fu, to gpm (L/s)

8/12/2019 American Society of Plumbing Engineers Volume 2
http://slidepdf.com/reader/full/american-society-of-plumbing-engineers-volume-2 147/233
121Chapter 5— Cold-Water Systems
This formula is most accurate for the flow of water in pipes larger than 2 in. (5 cm) and at velocities less than 10 fps (3 m/s).
Equation 5-1 yields accurate results only when the kinematic viscosity of the liquid is about
1.1 centistokes, which is the case of water at 60°F (15.6°C). However, the kinematic viscosity of water varies with temperature, from 1.8centistokes at 32°F (0°C) to 0.29 centistokes at 212°F (100°C); therefore, the tables are subject to this error, which may increase the friction loss
by as much as 20% at 32°F (0°C) and decrease it by as much as 20% at 212°F (100°C). Values of C, for various types of pipe, are shown in Table5-4, together with the corresponding multipliersthat should apply to the values of the head loss, f.
Figure 5-1 shows the friction loss of headchart, C = 140, derived from the Hazen-Williams
formula (Equation 5-1). Figure 5-2 illustrates theconversion of fixture units to gallons per minute(liters per second).
Factors Affecting Sizing
The three factors affecting the sizing of a water line are the demand flow rate (gpm) (L/s), the
velocity (fps) (m/s), and the pressure availablefor friction loss.
Demand The first factor, flow rate, is the water demand of the system, in gpm (L/s). There is a
vast difference in the water demand flow rates of flush valves in different types of occupancy. For example, ten water closets with flush valves inan apartment building may have a demand flow rate of 60 gpm (3.8 L/s), while ten water closets
with flush valves in a public school may have a demand flow rate of 90 gpm (5.7 L/s). The judg-ment and experience of the designer plays animportant part in accommodating such differ-ences in the design of water systems.
Another problem encountered in establish-ing flow rates is the practice of counting fixturesthat are not normally in use. For example, a ser-
vice sink in an office building is normally usedonly by the janitors at night; therefore, it shouldnot be counted as a fixture in the total demand.Hose bibbs are other fixtures that should not befigured at 100% of their number. For example,the systems of large buildings may have many hose bibbs installed but only a few will be oper-ated simultaneously. Individual branch linesshould be sized to handle all the fixtures on the
branch; however, the presence of these infre-
quently used fixtures should not be reflected inthe total demand.
After the designer has determined which fix-tures to include in the water demand calcula-tion, the maximum demand can be obtained.
Fixture unit (fu) values for each fixture can beassigned by using Table 5-5 and a total fu valuecan be obtained by adding the fu values of all
water-using fixtures with a normal domestic di- versity. The total fu value can be converted intoa gpm (L/s) flow rate by using Table 5-6 or Fig-ures 5-2 or 5-3, each of which includes a diver-sity factor.
The demand flow rates of all constant-usefixtures must be added to this flow rate. A con-stant-use fixture uses water continuously anddoes not have normal diversity. Air-conditioningcooling towers, booster pumps, commercial laun-
dry or dishwashing equipment, lawn sprinklers,and industrial processes are examples of con-stant-use fixtures. Any such equipment must befigured separately and added to the gpm (L/s)flow rate obtained from the conversion of all fix-ture units. This combined figure is the peak de-mand flow rate for the project. (Note : Fixturesthat are timed to operate during “off ” hoursshould not be added.)
The fixture-unit listings in Table 5-5 are for the total water consumption of the fixture. For the purposes of sizing either the hot or cold-wa-ter line, the fixture-unit loading for a fixture that uses both hot and cold water would be 75% of the total value. The 75% figure applies only tofixtures served by hot and cold water. It doesnot apply to single-service fixtures, such as wa-ter closets, urinals, and dishwashers.
Velocity The second factor affecting the sizingof a water line is velocity. A maximum velocity of 15 fps (4.6 m/s), which is suggested by somemodel plumbing codes, is much too high for many installations. A velocity above 6 or 7 fps (1.8 or 2.1 m/s) normally creates noise. Also, depend-ing on the piping material used and the tem-
perature, hardness, and pH of the water, velocities above 4 fps (1.2 m/s) can cause ero-sion of the piping material.
Another justification for lower velocities in a system is water hammer. Water hammer is thepounding force created by the sudden startingor stopping of water flow, which can be caused
by quick-opening or closing valves. The impact of water hammer is directly proportional to thechange in velocity and is equal to approximately 60 times the velocity change. For instance, if

8/12/2019 American Society of Plumbing Engineers Volume 2
http://slidepdf.com/reader/full/american-society-of-plumbing-engineers-volume-2 148/233
ASPE Data Book — Volume 2122
water traveling at 15 fps (4.6 m/s) is stoppedsuddenly, the increase in pressure within thepipe line will be approximately 900 psi (6205.3kPa). This increased pressure can do consider-able damage to piping systems and connectedequipment.
Pressure The third factor affecting the sizing of a water line is the pressure available for frictionloss. The first step in ascertaining pressure avail-able for friction loss is determining (from the lo-cal water department) the maximum andminimum water pressures and flow rate to beencountered at the project site. The maximumand minimum pressures may be nearly the sameor they may vary greatly; care must be taken tohandle the high pressure as well as the low pres-
sure. If the maximum pressure is above 80 psi,and a pressure-regulating device is installed, thepressure regulator will introduce an additional lossin the piping system when the water system is at minimum pressure. The water pressure should
be determined from a fire-hydrant flow test, whichis taken as close to the site as possible and in-cludes static and residual pressures at a flow rate.
Many model plumbing codes state that, if a pressure-regulating device is installed, the avail-able pressure must be considered as 80% of thereduced pressure setting. Spring-operated, pres-sure-regulating devices have a fall-off pressurethat is below the system pressure setting. Many engineers design a system incorporating the fall-off pressure of the equipment they are using;
Table 5-4 Surface Roughness Coefficient (C) Values for Various Types of Pipe
Values of C
Range Average Value Value Commonly(High = Best, smooth, well-laid for Good, Used for
Type of Pipe Low = Poor or corroded) Clean, New Pipe Design Purposes
Asbestos cement 160–140 150 140
Fiber — 150 140
Bitumastic-enamel-lined iron or steelcentrifugally applied 160–130 148 140
Cement-lined iron or steel centrifugally applied — 150 140Copper, brass, lead, tin or glass pipe and tubing 150–120 140 130
Wood stave 145–110 120 110
Welded and seamless steel 150–80 140 100
Continuous-interior, riveted steel(no projecting rivets or joints) — 139 100
Wrought iron 150–80 130 100
Cast iron 150–80 130 100
Tar-coated cast iron 145–80 130 100
Girth-riveted steel (projecting rivetsin girth seams only) — 130 100
Concrete 152–85 120 100
Full-riveted steel (projecting rivets ingirth and horizontal seams) — 115 100
Vitrified clay — 115 100
Spiral-riveted steel (flow with lap) — 110 100
Spiral-riveted steel (flow against lap) — 110 90
Corrugated steel — 60 60
Value of C 150 140 130 120 110 100 90 80 70 60Multiplier to Correct Tables 0.47 0.54 0.62 0.71 0.84 1.0 1.22 1.50 1.93 2.57

8/12/2019 American Society of Plumbing Engineers Volume 2
http://slidepdf.com/reader/full/american-society-of-plumbing-engineers-volume-2 149/233
123Chapter 5— Cold-Water Systems
however, the 80% factor is a rule of thumb that should not apply to an engineered system.
If the available water pressure at a project site is high enough to require the use of a pressure-regulating device, the pressure-regulat-
ing valve is considered the starting point of thesystem for the purposes of calculation.
The next step in obtaining the pressure avail-able for friction loss is to determine the residualpressure required at the governing fixture or appliance (not necessarily the farthest fixture).“Residual pressure” is the pressure required at the fixture for it to operate properly with water flowing. Normally, but not always, 8 psi (55.2kPa) is required for a flush-tank system and 15psi (103.4 kPa) is required for a flush-valve sys-tem. Some flush-valve fixtures require 20 or 25psi (137.9 or 172.4 kPa); some water closets re-
quire 40 psi (275.8 kPa); commercial dishwash-ers require 20 or 25 psi (137.9 or 172.4 kPa). It is evident, then, that the residual pressureshould be figured as the actual pressure neededat the governing fixture.
The third step is to determine the static pres-sure loss required to reach the governing fixtureor appliance. The static loss (or gain) is figuredat 0.433 psi/ft (9.8 kPa/m) of elevation differ-ence, above or below the water main. The differ-ence in elevation is usually a pressure loss tothe system, as fixtures are normally at a higher elevation than the source. If the fixture is lower than the source, there will be an increase in pres-sure and the static pressure is added to the ini-tial pressure.
Another pressure loss is created by the wa-ter meter. This loss of pressure, for a disc typemeter, can be determined from Figure 5-4 or fromthe manufacturer ’s flow charts. The flow is de-termined from charts indicating the total flow rate, in gpm (L/s), the size and type of the meter,and the pressure drop for the corresponding flow.
The loss is given in pounds per square inch (psi)and kilopascals (kPa). The selection of meter size
is very important in the final sizing of the pipingsystem and is one variable the designer can con-trol. Many other factors, such as the height of the building, city water pressure, and require-ments for backflow protection or water treatment,are dictated by codes or by the particular situa-tion. The designer must review the system very closely prior to the selection of a meter size. Usu-ally, the larger the meter, the higher the initialinstallation price and monthly charge. On the
Table 5-5 Demand Weight of Fixtures,in Fixture Unitsa
Weight Minimum(fixture units)c Connections,
in. (mm)
Fixture Typeb Cold HotPrivate Public Water Water
Bathtubd 2 4 2 (13) 2 (13)
Bedpan washer — 10 1 (25) —
Bidet 2 4 2 (13) 2 (13)
Combination sinkand tray 3 — 2 (13) 2 (13)
Dental unit or cuspidor — 1 a (10) —
Dental lavatory 1 2 2 (13) 2 (13)
Drinking fountain 1 2 a (10) —
Kitchen sink 2 4 2 (13) 2 (13)
Lavatory 1 2 a (10) a (10)
Laundry tray (1 or 2compartments) 2 4 2 (13) 2 (13)
Shower, each headd 2 4 2 (13) 2 (13)
Sink, service 2 4 2 (13) 2 (13)
Urinal, pedestal — 10 1 (25) —
Urinal (wall lip) — 5 2 (13) —
Urinal stall — 5 w (20) —
Urinal with flush tank — 3 — —
Wash sink, circular ormultiple (each set offaucets) — 2 2 (13) 2 (13)
Water closet:
Flush valve 6 10 1 (25) —
Tank 3 5 a (10) —
a For supply outlets likely to impose continuous demands, esti-mate the continuous supply separately and add to the total demand
for fixtures.b For fixtures not listed, weights may be assumed by comparingthe fixture to a listed one then using water in similar quantities andat similar rates.c The given weights are for the total demand of fixtures with bothhot and cold-water supplies. The weights for maximum separatedemands may be taken as 75% of the listed demand for the sup-ply.d A shower over a bathtub does not add a fixture unit to the group.

8/12/2019 American Society of Plumbing Engineers Volume 2
http://slidepdf.com/reader/full/american-society-of-plumbing-engineers-volume-2 150/233
ASPE Data Book — Volume 2124
Flow, Fixture Units
gpm Flush Flush(L/s) Tank Valve
1 (0.06) 0 —
2 (0.13) 1 —
3 (0.19) 3 —
4 (0.25) 4 —
5 (0.32) 6 —
6 (0.38) 7 —
7 (0.44) 8 —
8 (0.50) 10 —
9 (0.57) 12 —
10 (0.63) 13 —
11 (0.69) 15 —
12 (0.76) 16 —
13 (0.82) 18 —
14 (0.88) 20 —
15 (0.95) 21 —
16 (1.01) 23 —
17 (1.07) 24 —
18 (1.13) 26 —
19 (1.20) 28 —
20 (1.26) 30 —
21 (1.32) 32 —
22 (1.39) 34 5
23 (1.45) 36 6
24 (1.51) 39 7
25 (1.58) 42 8
26 (1.64) 44 9
27 (1.70) 46 10
28 (1.76) 49 11
29 (1.83) 51 12
30 (1.89) 54 13
31 (1.95) 56 14
32 (2.02) 58 15
33 (2.08) 60 16
34 (2.14) 63 18
35 (2.21) 66 20
36 (2.27) 69 21
37 (2.33) 74 23
38 (2.39) 78 25
39 (2.46) 83 26
40 (2.52) 86 28
41 (2.58) 90 30
42 (2.65) 95 31
43 (2.71) 99 33
44 (2.77) 103 35
Table 5-6 Conversions—Gallons per Minute (Liters per Second) to Fixture Units
45 (2.84) 107 37
46 (2.90) 111 39
47 (2.96) 115 42
48 (3.02) 119 44
49 (3.09) 123 46
50 (3.15) 127 48
51 (3.21) 130 50
52 (3.28) 135 52
53 (3.34) 141 54
54 (3.40) 146 57
55 (3.47) 151 60
56 (3.53) 155 63
57 (3.59) 160 66
58 (3.65) 165 69
59 (3.72) 170 73
60 (3.78) 175 76
62 (3.91) 185 82
64 (4.03) 195 88
66 (4.16) 205 95
68 (4.28) 215 102
70 (4.41) 225 108
72 (4.54) 236 116
74 (4.66) 245 124
76 (4.79) 254 132
78 (4.91) 264 140
80 (5.04) 275 148
82 (5.17) 284 158
84 (5.29) 294 168
86 (5.42) 305 176
88 (5.54) 315 186
90 (5.67) 326 195
92 (5.80) 337 205
94 (5.92) 348 214
96 (6.05) 359 223
98 (6.17) 370 234
100 (6.30) 380 245105 (6.62) 406 270
110 (6.93) 431 295
115 (7.25) 455 329
120 (7.56) 479 365
125 (7.88) 506 396
130 (8.19) 533 430
135 (8.51) 559 460
140 (8.82) 585 490
145 (9.14) 611 521
150 (9.45) 638 559
155 (9.77) 665 596
160 (10.08) 692 631
165 (10.40) 719 666
170 (10.71) 748 700
175 (11.03) 778 739
180 (11.34) 809 775
185 (11.66) 840 811
190 (11.97) 874 850
200 (12.60) 945 931
210 (13.23) 1018 1009
220 (13.86) 1091 1091
230 (14.49) 1173 1173
240 (15.12) 1254 1254
250 (15.75) 1335 1335
260 (16.38) 1418 1418
270 (17.01) 1500 1500
280 (17.64) 1583 1583
290 (18.27) 1668 1668
300 (18.90) 1755 1755
310 (19.53) 1845 1845
320 (20.16) 1926 1926
330 (20.79) 2018 2018
340 (21.42) 2110 2110
350 (22.05) 2204 2204
360 (22.68) 2298 2298
370 (23.31) 2388 2388
380 (23.94) 2480 2480
390 (24.57) 2575 2575
400 (25.20) 2670 2670
410 (25.83) 2765 2765
420 (26.46) 2862 2862
430 (27.09) 2960 2960
440 (27.72) 3060 3060
450 (28.35) 3150 3150500 (31.50) 3620 3620
550 (34.65) 4070 4070
600 (37.80) 4480 4480
700 (44.10) 5380 5380
800 (50.40) 6280 6280
900 (56.70) 7280 7280
1000 (63) 8300 8300
Flow, Fixture Units
gpm Flush Flush(L/s) Tank Valve
Flow, Fixture Units
gpm Flush Flush(L/s) Tank Valve

8/12/2019 American Society of Plumbing Engineers Volume 2
http://slidepdf.com/reader/full/american-society-of-plumbing-engineers-volume-2 151/233
125Chapter 5— Cold-Water Systems
other hand, a larger meter may mean a smaller-sized piping system, which might prove to bemore economical in the long run. These two fac-tors are evaluated by the designer and economicconsiderations guide the selection. Furthermore,if a system does not have ample pressure, a means of preserving the available pressure is touse a larger meter, thereby decreasing pressureloss. This fact may well enable the designer toeliminate the use of a water-pressure booster system, thereby substantially reducing theplumbing system costs.
The last step is to determine the other pres-sure losses encountered between the meter andthe governing fixture. These could be caused by a water softener, a backflow preventer, a filter,or any other device that creates a pressure lossin the system.
The “governing fixture” or appliance is thedevice that has the highest total when the re-sidual pressure, static pressure, and all other pressure losses are added. Take, for example,the system shown in Figure 5-5. To find the gov-erning fixture or appliance, determine whichdevice requires the most pressure. Knowing that the meter loss is the same for all parts of thesystem, it can be temporarily ignored. Going fromthe meter to the flush-valve water closet, thereare 15 psi (103.4 kPa) residual and no static lossfor a total of 15 psi (103.4 kPa). As a total goingthrough the backflow preventer, there are 16 psi
(110.3 kPa) residual and 8.66 psi (59.7 kPa) staticfor a total loss of 24.66 psi (170 kPa). Going tothe dishwasher, there is a total of 40 psi (275.8kPa) — 25 psi (172.4 kPa) residual plus 5 psi (34.5kPa) loss through the water heater plus 10 psi(69 kPa) loss through the softener. Therefore, thedishwasher is the governing fixture, for it hasthe highest total when the residual, static, andother losses are added.
Summarizing the steps, all the system needsor losses are subtracted from the minimum wa-ter pressure. The remainder is the pressure avail-able for friction, defined as the total energy (or
force) available to push the water through thepipes to the governing fixture or appliance. How this force is used is up to the designer, who may decide to use it evenly over the entire system, asan average pressure loss, or unevenly over thesystem. In designing the system, as long as thedesigner does not exceed the pressure availablefor friction, the system will work. A certainamount of pressure may be held in reserve, how-ever, to allow for aging of the piping or decreases
in available water supply pressures as an area incurs growth.
As previously determined, the governing ap-pliance in the example in Figure 5-5 is the dish-
washer. For the same example, assume that the
minimum incoming water pressure is 60 psi(413.7 kPa). To determine the pressure availablefor friction, start with 60 psi (413.7 kPa) andsubtract 3 psi (20.7 kPa) for the meter loss, 10psi 69 kPa) for the softener, 5 psi (34.5 kPa) for the water-heater coil, and 25 psi (172.4 kPa) re-sidual for the dishwasher. This leaves a remain-der of 17 psi (117.2 kPa), which is the pressureavailable for friction. The losses for the backflow preventer and the static do not occur on the line
between the meter and the governing fixture or appliance; therefore, they are not included in thecalculations at this time. Only losses that occur
on the line between the meter and the governingfixture or appliance are to be included in the ini-tial calculations to determine the pressure avail-able for friction. The other losses will enter intosubsequent calculations.
After obtaining the pressure available for fric-tion, the next step is to calculate the “averagepressure drop.” This is the pressure available for friction divided by the equivalent length of therun. The quotient is multiplied by l00 to obtainan answer in terms of loss in psi/100 ft (kPa/l00 m). In determining the equivalent length of run, an allowance must be made for fittings. This
can be determined from Table 5-7 or by adding a percentage to the developed length. The averagepressure drop is an average loss over the systemand should be used only as a guide in sizingpiping.
Part of the system can be designed to exceedthe average pressure drop, while another part isdesigned to be less than the average. The aver-age pressure drop can be exceeded — as long asthe total pressure available for friction is not exceeded. The average pressure drop calculation,
which is made initially, pertains only to the linefrom the meter to the governing fixture or appli-
ance. Care should be taken to account for theaverage pressure drop calculations for the other lines. The branches off the main line should besized on a different pressure-loss basis, or the
branches closest to the meter may take pres-sure away from the farthest branches. Table 5-8shows typical flow and pressure required duringflow for various fixtures.

8/12/2019 American Society of Plumbing Engineers Volume 2
http://slidepdf.com/reader/full/american-society-of-plumbing-engineers-volume-2 152/233
ASPE Data Book — Volume 2126
Example 5-1
Figure 5-6 illustrates how to determine the pres-sure available for friction.
In the system shown (with a main line run-ning from the meter, point A, to the governingfixture or appliance, point L), each section of the
line is equivalent to 10 ft (3.1 m) in length. Thisincludes an allowance for fittings. The allowablepressure drop for friction is 10 psi (69 kPa). Thefirst tabulation is the friction loss in the system.
Section A – B has an equivalent length of 10ft (3.1 m). The average pressure drop is 10 psi/100 ft (226.2 kPa/100 m). If it is assumed that
Figure 5-3 Conversion of Fixture Units, fu, to gpm (L/s),Design Load vs. Fixture Units, Mixed System

8/12/2019 American Society of Plumbing Engineers Volume 2
http://slidepdf.com/reader/full/american-society-of-plumbing-engineers-volume-2 153/233
127Chapter 5— Cold-Water Systems
precisely sized pipe is obtained to give a pres-sure loss (due to friction) of exactly 10 psi/100 ft (226.2 kPa/l00 m), the pressure loss in this sec-tion is 1 psi (6.9 kPa) and the pressure for fric-tion at point B is 9 psi (62.1 kPa). In sectionK – L, at point L, there is 0 pressure left for fric-tion. This is the governing fixture.
The next tabulation illustrates the sizing of branches (using a different friction-loss basisthan was used for the main).
10 psi (69 kPa) available for friction loss; long-est run: A – L, 100 ft (30.5 m); average pressuredrop: (10 × 100)/100 = 10 psi/100 ft (226.2 kPa/100 m).
Method A uses the same average pressureloss in the branches as was used in the line tothe governing fixture. The pressure available for
friction at the end of each branch is not 0. At point M, it is 1 psi (6.9 kPa); at point R, it is 5 psi(34.5 kPa); and at point U, it reaches a maxi-mum of 8 psi (55.2 kPa). Unless the pressure to
each fixture is used up as friction loss, it tendsto cause more water than necessary to flow through the branches to use the excess avail-able pressure.
Method B illustrates the ideal system. All the
available frictional pressure in each of the branches is used. In actual practice, this methodcan not be utilized. The average pressure loss ineach section is very high, far higher than is nor-mally accepted in modern construction. Many engineers and designers would be concerned withthe high pressure loss as well as with the high
velocity shown by this example.
Method C is a modified header system. Themain was sized on the average pressure drop of the system and the branches sized on their al-lowable frictional pressure drop. At section M – J,the total allowable pressure drop over the entire
system (point A to point M) is 10 psi (69 kPa).Point M has an equivalent length of 90 ft (27.4m) from point A. This gives an average pressure
Figure 5-4 Typical Friction Losses for Disk-Type Water Meters
4 " 6 " 3 " 2 "
1 - 1 / 2
"
1 " 3
/ 4 " 5 / 8 "
137.9
110.3
69.062.155.248.3
41.4
34.5
27.6
20.7
13.8
6.9
20
16
10987
6
5
4
3
2
1
4 5 6 7 8 9 10 20 30 40 50 60 80 100 200 300 400 600 800 1000
0 . 2
5
0 . 3
2
0 . 3
8
0 . 4
4
0 . 5
0
0 . 5
7
0 . 6
3
1 . 2
6
1 . 8
9
2 . 5
2
3 . 1
5
3 . 7
8
5 . 0
4
6 . 3
0
1 2 . 6
1 8 . 9
2 5 . 2
3 7 . 8
5 0 . 4
6 3 . 0
Flow, liters per second
Flow, gallons per minute
P r e s s ur e
L o s s ,k i l oP a s c al
s
P r e s s u
r e
L o s s , p o u n d s p e r i n c h
s q u a
r e d

8/12/2019 American Society of Plumbing Engineers Volume 2
http://slidepdf.com/reader/full/american-society-of-plumbing-engineers-volume-2 154/233
ASPE Data Book — Volume 2128
Table 5-7 Allowance for Friction Loss in Valves and Threaded Fittings
Equivalent Length of Pipe for Various Fittings (ft)
Diameter 90° 45° Couplingof Fitting Standard Standard Standard or Straight Gate Globe Angle
(in.) Elbow Elbow T 90° Run of T Valve Valve Valve
a 1 0.6 1.5 0.3 0.2 8 4
½ 2 1.2 3 0.6 0.4 15 8
¾ 2.5 1.5 4 0.8 0.5 20 12
1 3 1.8 5 0.9 0.6 25 15
1¼ 4 2.4 6 1.2 0.8 35 18
1½ 5 3 7 1.5 1 45 22
2 7 4 10 2 1.3 55 28
2½ 8 5 12 2.5 1.6 65 34
3 10 6 15 3 2 80 40
4 14 8 21 4 2.7 125 55
5 17 10 25 5 3.3 140 70
6 20 12 30 6 4 165 80
Note : Allowances based on nonrecessed threaded fittings. Use ½ the allowances for recessed threaded fittings or streamline solder fittings.
Table 5-7 (M) Allowance for Friction Loss in Valves and Threaded Fittings
Equivalent Length of Pipe for Various Fittings (m)
Diameter 90° 45° Couplingof Fitting Standard Standard Standard or Straight Gate Globe Angle
(mm) Elbow Elbow T 90° Run of T Valve Valve Valve
9.5 0.3 0.2 0.5 0.09 0.06 2.4 1.2
12.7 0.6 0.4 0.9 0.18 0.12 4.6 2.4
19.1 0.8 0.5 1.2 0.24 0.15 6.1 3.7
25.4 0.9 0.6 1.5 0.27 0.18 7.6 4.6
31.8 1.2 0.7 1.8 0.4 0.24 10.7 5.5
38.1 1.5 0.9 2.1 0.5 0.3 13.7 6.7
50.8 2.1 1.2 3.1 0.6 0.4 16.8 8.5
63.5 2.4 1.5 3.7 0.8 0.5 19.8 10.4
76.2 3.1 1.8 4.6 0.9 0.6 24.4 12.2
101.6 4.3 2.4 6.4 1.2 0.8 38.1 16.8
127 5.2 3.1 7.6 1.5 1.0 42.7 21.3
152.4 6.1 3.7 9.1 1.8 1.2 50.3 24.4
Note : Allowances based on nonrecessed threaded fittings. Use ½ the allowances for recessed threaded fittings or streamline solder fittings.

8/12/2019 American Society of Plumbing Engineers Volume 2
http://slidepdf.com/reader/full/american-society-of-plumbing-engineers-volume-2 155/233
129Chapter 5— Cold-Water Systems
Table 5-8 Flow and Pressure Required for Various Fixtures during Flow
Fixture Pressure, psi (kPa)a Flow, gpm (L/s)
Basin faucet 8 (55.2) 3 (0.19)
Basin faucet, self-closing 12 (82.7) 2.5 (0.16)Sink faucet, a in. (9.5 mm) 10 (69) 4.5 (0.28)
Sink faucet, ½ in. (12.7 mm) 5 (34.5) 4.5 (0.28)
Dishwasher 15–25 (103.4–172.4) b
Bathtub faucet 5 (34.5) 6 (0.38)
Laundry tub cock, ¼ in. (6.4 mm) 5 (34.5) 5 (0.32)
Shower 12 (82.7) 3–10 (0.19–0.6)
Water closet, ball cock 15 (103.4) 3 (0.19)
Water closet, flush valve 10–20 (69–137.9) 15–40 (0.95–2.5)
Urinal flush valve 15 (103.4) 15 (0.95)
Garden hose, 50 ft (15.2 m), and sill cock 30 (206.8) 5 (0.32)
a
Residual pressure in the pipe at the entrance of the fixture considered.bSee manufacturer’s data.
Figure 5-5 Establishing the Governing Fixture or Appliance
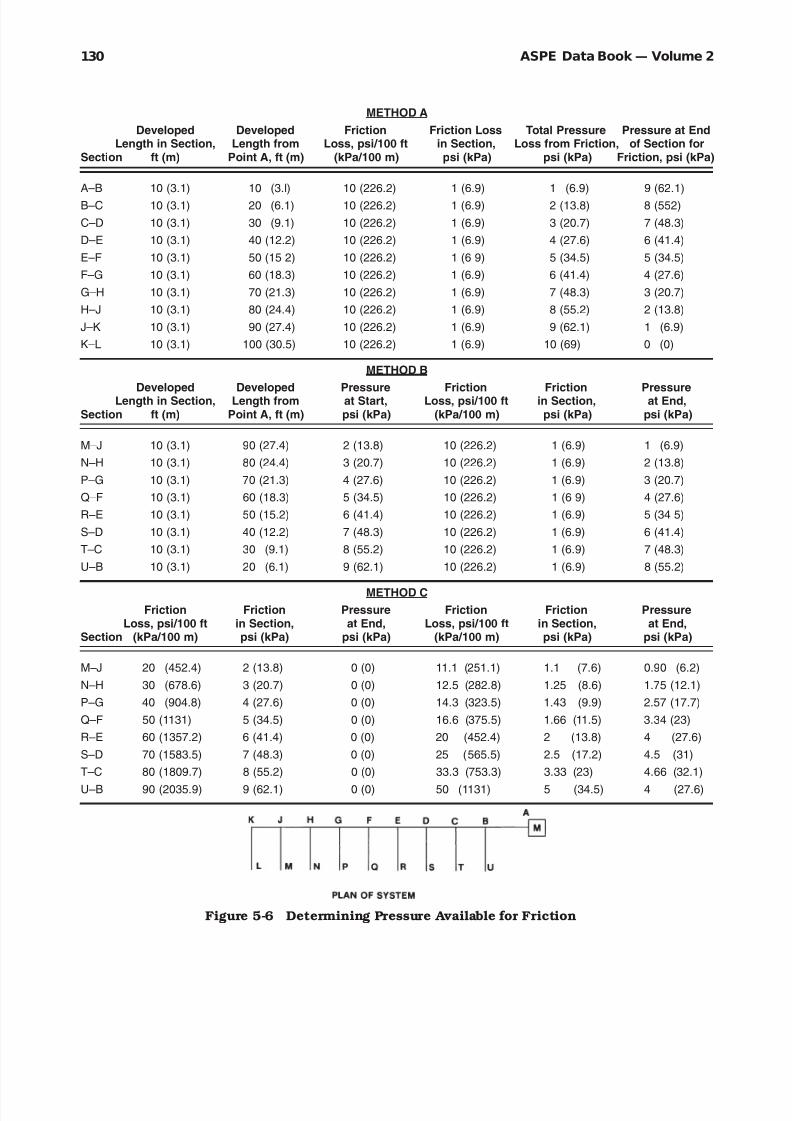
8/12/2019 American Society of Plumbing Engineers Volume 2
http://slidepdf.com/reader/full/american-society-of-plumbing-engineers-volume-2 156/233

8/12/2019 American Society of Plumbing Engineers Volume 2
http://slidepdf.com/reader/full/american-society-of-plumbing-engineers-volume-2 157/233
131Chapter 5— Cold-Water Systems
drop of 11.1 psi (7.6 kPa) and an unused fric-tional pressure of 0.9 psi (6.2 kPa). By goingthrough all the branches in the same manner,one can see that the unused frictional pressure
varies from 0.9 psi (6.2 kPa) to a maximum of 4.66 psi (32.1 kPa). These pressures are far lessthan those resulting from Method A and the av-erage pressure drops are far less than those re-sulting from Method B. Consequently, Method Cis the one most widely used by designers. In ac-tual practice, it is not necessary to calculate theaverage pressure drop for each branch; usually,the branches are close together and the changesin the average pressure drop are very small.
The last step is to take advantage of all avail-able pressure. For example, a water heater could
be located on the roof of a building. If the water system was designed to have a residual pres-
sure on the roof of 15 psi (103.4 kPa), then thehot water piping system can be sized with a staticpressure gain available, to be used for frictionloss in the hot water piping. Another example of utilizing available pressure is an installation witha combination of flush valves and flush-tank
water closets sized on the basis of a flush-valvesystem having a residual pressure of 15 psi(103.4 kPa). Within this system, the branchesthat have only flush-tank fixtures have an addi-tional 7 psi (48.3 kPa) of pressure, which can beused for friction. The 7 psi (48.3 kPa) is the dif-ference between the 15 psi (103.4 kPa) and 8 psi(55.2 kPa) residual pressures.
Velocity Method Another method designersuse to size water piping is the velocity method.
The average pressure drop available for frictionis calculated and, if it is greater than 7 or 8 psi/100 ft (158.4 or 181 kPa/100 m), the lines aresized on the basis of a 5 or 6-fps (1.5 or 1.8 m/s)
velocity. In this method, the main line is conser- vatively sized and the short branches may slightly exceed the average pressure drop. However, thetotal pressure drop of the system does not ex-ceed the allowable pressure loss for friction.
Summary
The following items must be determined and cal-culated when sizing a system:
1. The maximum flow rate of the system.
2. The maximum and minimum water pressurein the main.
3. The residual pressure required at the gov-
erning fixture or appliance.
4. The static pressure loss to get to the govern-ing fixture or appliance.
5. The meter loss.
6. Other losses between the meter and the gov-erning fixture or appliance.
7. The pressure available for friction.
8. The average pressure drop from the meter tothe governing fixture or appliance.
9. The average pressure drop for the other sys-tems.
10. The size of the line from the meter to thegoverning fixture or appliance.
11. The size of the branch line.
For the convenience of the designer in sizing
water systems, the following tables and figuresare provided:
• Table 5-9. Water pipe sizing, fixture units vs.psi/100 ft (kPa/100 m), Type L copper tub-ing.
• Table 5-10. Water pipe sizing, fixture units vs. psi/100 ft (kPa/l00 m), galvanized, fairly rough pipe.
• Figure 5-7. Pipe sizing data, copper tubing,smooth pipe.
• Figure 5-8. Pipe sizing data, fairly smoothpipe.
• Figure 5-9. Pipe sizing data, fairly rough pipe.
• Figure 5-10. Pipe sizing data, rough pipe.
WATER HAMMER
“ Water hammer ” is the term used to define thedestructive forces, pounding noises, and vibra-tions that develop in a piping system when a column of noncompressible liquid (water) flow-ing through a pipeline at a given pressure and
velocity is stopped abruptly. The surge pressure(or pressure wave) generated at the point of im-pact or stoppage travels back and forth throughthe piping system until the destructive energy isdissipated in the piping system. This violent ac-tion accounts for the piping noise and vibration.
The common cause of shock is the quick clos-ing of electrical, pneumatic, spring-loaded valvesor devices, as well as the quick, hand closure of
valves or fixture trim. The valve closure time is
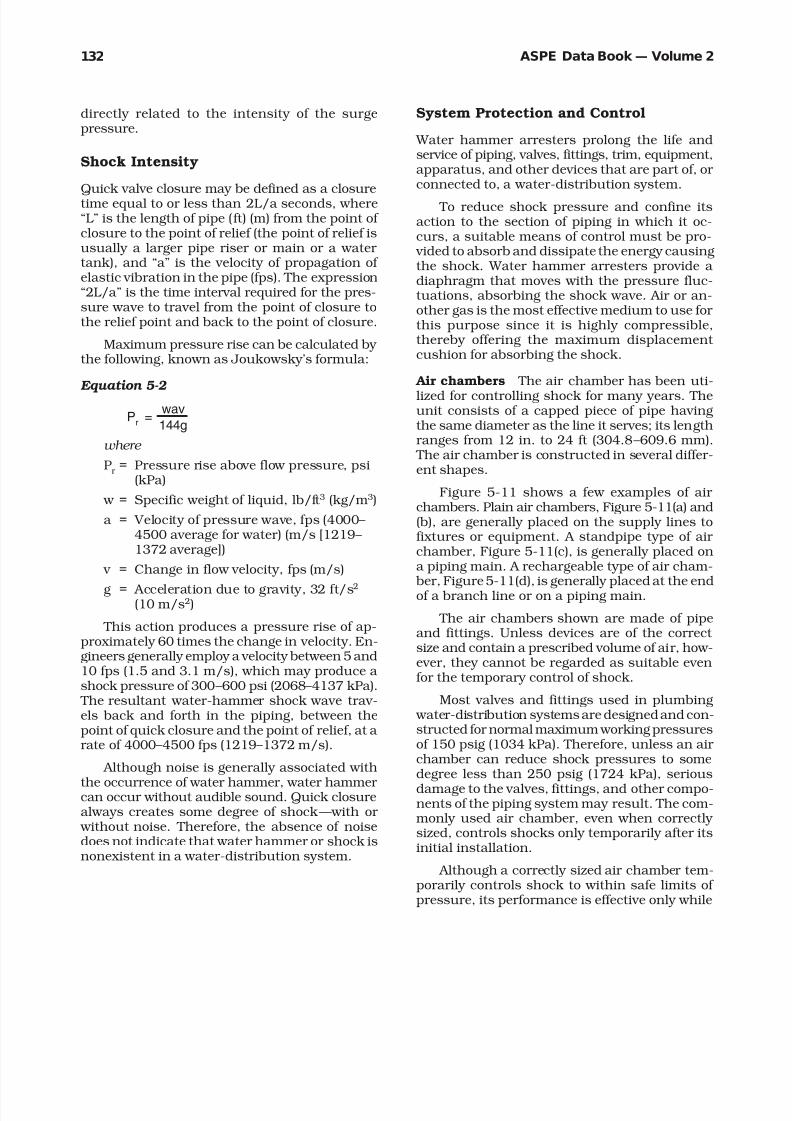
8/12/2019 American Society of Plumbing Engineers Volume 2
http://slidepdf.com/reader/full/american-society-of-plumbing-engineers-volume-2 158/233
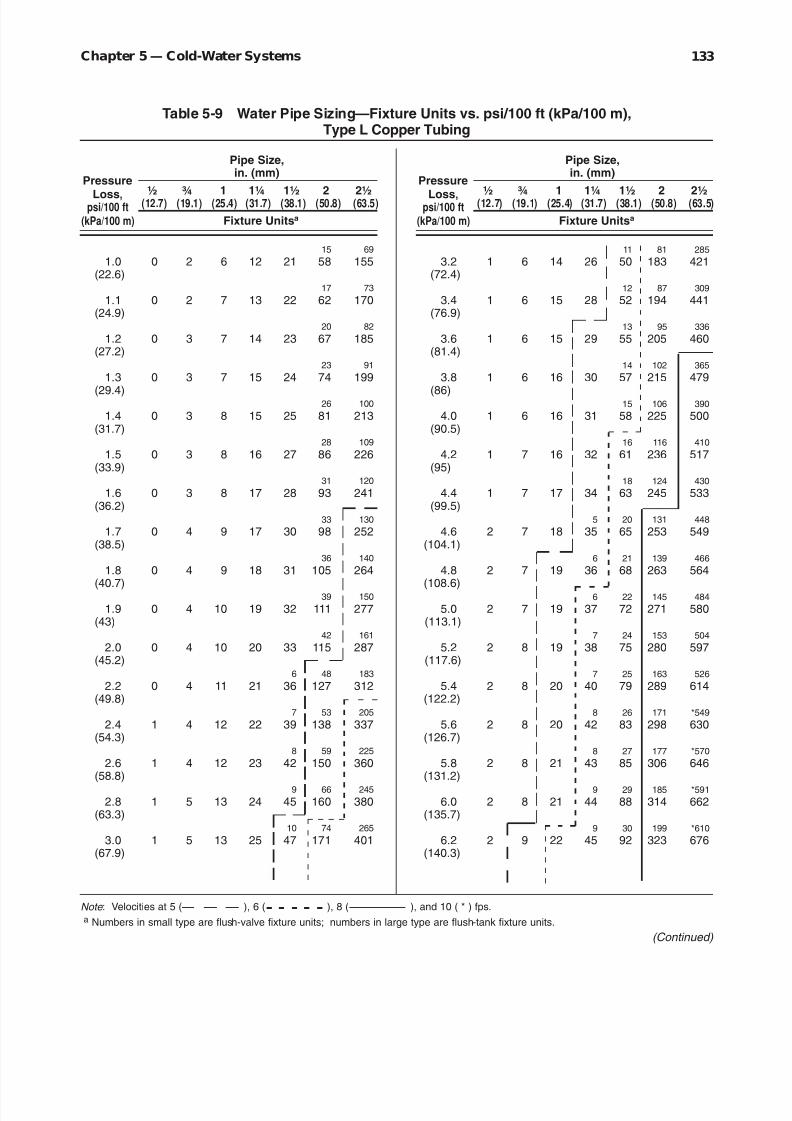
8/12/2019 American Society of Plumbing Engineers Volume 2
http://slidepdf.com/reader/full/american-society-of-plumbing-engineers-volume-2 159/233
133Chapter 5— Cold-Water Systems
Pipe Size,
Pressurein. (mm)
Loss, ½ ¾ 1 1¼ 1½ 2 2½psi/100 ft (12.7) (19.1) (25.4) (31.7) (38.1) (50.8) (63.5)
(kPa/100 m) Fixture Unitsa
15 69
1.0 0 2 6 12 21 58 155(22.6)
17 73
1.1 0 2 7 13 22 62 170(24.9)
20 82
1.2 0 3 7 14 23 67 185(27.2)
23 91
1.3 0 3 7 15 24 74 199
(29.4)26 100
1.4 0 3 8 15 25 81 213(31.7)
28 109
1.5 0 3 8 16 27 86 226(33.9)
31 120
1.6 0 3 8 17 28 93 241(36.2)
33 130
1.7 0 4 9 17 30 98 252(38.5)
36 140
1.8 0 4 9 18 31 105 264
(40.7) 39 150
1.9 0 4 10 19 32 111 277(43)
42 161
2.0 0 4 10 20 33 115 287(45.2)
6 48 183
2.2 0 4 11 21 36 127 312(49.8)
7 53 205
2.4 1 4 12 22 39 138 337(54.3)
8 59 225
2.6 1 4 12 23 42 150 360(58.8)
9 66 245
2.8 1 5 13 24 45 160 380(63.3)
10 74 265
3.0 1 5 13 25 47 171 401(67.9)
11 81 285
3.2 1 6 14 26 50 183 421(72.4)
12 87 309
3.4 1 6 15 28 52 194 441(76.9)
13 95 336
3.6 1 6 15 29 55 205 460(81.4)
14 102 365
3.8 1 6 16 30 57 215 479
(86)15 106 390
4.0 1 6 16 31 58 225 500(90.5)
16 116 410
4.2 1 7 16 32 61 236 517(95)
18 124 430
4.4 1 7 17 34 63 245 533(99.5)
5 20 131 448
4.6 2 7 18 35 65 253 549(104.1)
6 21 139 466
4.8 2 7 19 36 68 263 564
(108.6) 6 22 145 484
5.0 2 7 19 37 72 271 580(113.1)
7 24 153 504
5.2 2 8 19 38 75 280 597(117.6)
7 25 163 526
5.4 2 8 20 40 79 289 614(122.2)
8 26 171 *549
5.6 2 8 20 42 83 298 630(126.7)
8 27 177 *570
5.8 2 8 21 43 85 306 646(131.2)
9 29 185 *591
6.0 2 8 21 44 88 314 662(135.7)
9 30 199 *610
6.2 2 9 22 45 92 323 676(140.3)
Pipe Size,
Pressurein. (mm)
Loss, ½ ¾ 1 1¼ 1½ 2 2½psi/100 ft (12.7) (19.1) (25.4) (31.7) (38.1) (50.8) (63.5)
(kPa/100 m) Fixture Unitsa
Table 5-9 Water Pipe Sizing—Fixture Units vs. psi/100 ft (kPa/100 m),Type L Copper Tubing
Note : Velocities at 5 ( ), 6 ( ), 8 ( ), and 10 ( * ) fps.
a Numbers in small type are flush-valve fixture units; numbers in large type are flush-tank fixture units.
(Continued)

8/12/2019 American Society of Plumbing Engineers Volume 2
http://slidepdf.com/reader/full/american-society-of-plumbing-engineers-volume-2 160/233
ASPE Data Book — Volume 2134
10 31 202 *631
6.4 2 9 22 46 95 333 692(144.8)
10 32 210 *652
6.6 3 9 23 47 97 343 709(149.3)
11 34 216 *673
6.8 3 9 23 49 101 351 725(153.8)
11 35 *223 *693
7.0 3 9 23 50 104 359 742(158.4)
12 37 *231 *7137.2 3 10 24 51 106 367 758
(162.9)12 38 *241 *732
7.4 3 10 24 52 109 375 775(167.4)
13 40 *250 *754
7.6 3 10 24 53 112 385 791(171.9)
13 41 *259 *774
7.8 3 11 25 54 114 394 808(176.4)
14 43 *265 *793
8.0 3 11 25 55 117 401 824(181)
14 44 *273 *811
8.2 3 11 26 56 120 409 840(185.5)
14 46 *280 *829
8.4 3 11 26 57 123 416 856(190)
15 47 *286 *848
8.6 3 11 27 57 126 423 872(194.5)
15 48 *295 *867
8.8 3 11 27 58 128 431 889(199.1)
16 50 *305 *887
9.0 3 12 27 59 130 437 906(203.6)
16 51 *314 *908
9.2 3 12 28 60 133 444 925(208.1)
17 52 *323 *930
9.4 3 12 29 61 136 450 944(212.6)
17 54 *329 *950
9.6 3 12 29 62 140 455 963(217.2)
18 *56 *336 *970
9.8 3 12 29 64 145 460 982(221.7)
19 *58 *346 *993
10.0 4 13 30 65 148 467 1003(226.2)
20 *61 *366 *1022
10.4 4 13 31 67 153 480 1030(235.3)
21 *63 *374 *1039
10.6 4 13 31 68 155 487 1044(239.8)
22 *66 *390 *106811.0 4 13 32 71 160 500 1072
(248.8)23 *70 *405 *1089
11.4 4 14 33 74 166 513 1099(257.9)
24 *72 *414 *1124
11.6 4 14 34 76 169 520 1124(262.4)
5 25 *76 *430 *1124
12.0 4 14 34 79 175 533 1124(271.5)
5 *26 *80 *444 *1124
12.4 4 14 35 82 181 545 1124(280.5)
6 *27 *81 *452 *1124
12.6 4 15 36 84 184 552 1124(285)
6 *28 *85 *466 *1124
13.0 4 15 37 86 190 564 1124(294.1)
6 *29 *88 *480 *1124
13.4 4 15 37 89 195 577 1124(303.1)
6 *30 *90 *488 *1124
13.6 4 15 38 91 199 583 1124(307.6)
7 *31 *94 *502 *1124
14.0 5 16 40 94 204 595 1124(316.7)
7 *32 *98 *517 *1124
14.4 5 16 41 98 208 608 1124(325.7)
8 *33 *99 *526 *1124
14.6 5 16 41 99 210 614 1124(330.3)
8 *34 *102 *536 *1124
15.0 5 16 42 101 215 622 1124(339.3)
Pipe Size,
Pressurein. (mm)
Loss, ½ ¾ 1 1¼ 1½ 2 2½
psi/100 ft (12.7) (19.1) (25.4) (31.7) (38.1) (50.8) (63.5)
(kPa/100 m) Fixture Unitsa
Pipe Size,
Pressurein. (mm)
Loss, ½ ¾ 1 1¼ 1½ 2 2½
psi/100 ft (12.7) (19.1) (25.4) (31.7) (38.1) (50.8) (63.5)
(kPa/100 m) Fixture Unitsa
(Table 5-9 continued)
Note : Velocities at 5 ( ), 6 ( ), 8 ( ), and 10 ( * ) fps.
a Numbers in small type are flush-valve fixture units; numbers in large type are flush-tank fixture units.
(Continued)

8/12/2019 American Society of Plumbing Engineers Volume 2
http://slidepdf.com/reader/full/american-society-of-plumbing-engineers-volume-2 161/233
135Chapter 5— Cold-Water Systems
8 *35 *106 *536 *1124
15.5 5 16 43 104 221 622 1124(350.6)
9 *37 *110 *536 *1124
16.0 5 17 44 107 227 622 1124(361.9)
9 *39 *114 *536 *1124
16.5 5 17 45 110 233 622 1124(373.2)
*10 *41 *119 *536 *1124
17.0 5 18 46 114 239 622 1124(384.6)
*10 *43 *124 *536 *112417.5 5 18 47 117 245 622 1124
(395.9)*11 *44 *129 *536 *1124
18.0 6 19 49 120 250 622 1124(407.2)
*11 *46 *134 *536 *1124
18.5 6 19 50 123 257 622 1124(418.5)
*12 *48 *139 *536 *1124
19.0 6 19 51 126 263 622 1124(429.8)
*12 *49 *144 *536 *1124
19.5 6 20 52 129 270 622 1124(441.1)
*13 *51 *149 *536 *1124
20 6 20 53 132 276 622 1124(452.4)
* *13 *53 *160 *536 *1124
21 6 21 54 138 286 622 1124(475)
* *14 *57 *160 *536 *1124
22 6 21 56 145 286 622 1124(497.7)
* *15 *61 *160 *536 *1124
23 7 21 58 152 286 622 1124(520.3)
* *16 *65 *160 *536 *1124
24 7 22 60 158 286 622 1124(542.9)
* *16 *68 *160 *536 *1124
25 7 23 62 164 286 622 1124(565.5)
* *19 *71 *160 *536 *1124
26 7 23 65 168 286 622 1124(588.1)
* *21 *71 *160 *536 *1124
28 7 24 68 168 286 622 1124(633.4)
* * *23 *71 *160 *536 *1124
30 8 26 75 168 286 622 1124(678.6)
* * *26 *71 *160 *536 *1124
32 8 27 81 168 286 622 1124(723.9)
* * *26 *71 *160 *536 *1124
34 8 28 82 168 286 622 1124(769.1)
* * *26 *71 *160 *536 *1124
36 9 29 82 168 286 622 1124(814.4)
* * *26 *71 *160 *536 *112438 9 31 82 168 286 622 1124
(859.6)* * *26 *71 *160 *536 *1124
40 9 32 82 168 286 622 1124(904.8)
* * *26 *71 *160 *536 *1124
42 10 33 82 168 286 622 1124(950.1)
* * *26 *71 *160 *536 *1124
44 10 34 82 168 286 622 1124(995.3)
* * *26 *71 *160 *536 *1124
44 11 35 82 168 286 622 1124(1040.6)
* * *26 *71 *160 *536 *1124
48 11 35 82 168 286 622 1124(1085.8)
* * *26 *71 *160 *536 *1124
50 11 35 82 168 286 622 1124(1131)
* * *26 *71 *160 *536 *1124
55 12 35 82 168 286 622 1124(1244.1)
* * *26 *71 *160 *536 *1124
60 13 35 82 168 286 622 1124(1357.2)
* * *26 *71 *160 *536 *1124
80 14 35 82 168 286 622 1124(1809.7)
* * *26 *71 *160 *536 *1124
100 14 35 82 168 286 622 1124(2262.1)
Pipe Size,
Pressurein. (mm)
Loss, ½ ¾ 1 1¼ 1½ 2 2½
psi/100 ft (12.7) (19.1) (25.4) (31.7) (38.1) (50.8) (63.5)
(kPa/100 m) Fixture Unitsa
Pipe Size,
Pressurein. (mm)
Loss, ½ ¾ 1 1¼ 1½ 2 2½
psi/100 ft (12.7) (19.1) (25.4) (31.7) (38.1) (50.8) (63.5)
(kPa/100 m) Fixture Unitsa
(Table 5-9 continued)
Note : Velocities at 5 ( ), 6 ( ), 8 ( ), and 10 ( * ) fps.
a Numbers in small type are flush-valve fixture units; numbers in large type are flush-tank fixture units.

8/12/2019 American Society of Plumbing Engineers Volume 2
http://slidepdf.com/reader/full/american-society-of-plumbing-engineers-volume-2 162/233

8/12/2019 American Society of Plumbing Engineers Volume 2
http://slidepdf.com/reader/full/american-society-of-plumbing-engineers-volume-2 163/233
137Chapter 5— Cold-Water Systems
8 28 164 557
9.8 1 8 20 41 87 291 636(221.7)
8 29 170 *570
10.0 1 8 20 42 88 297 646(226.2)
8 31 175 *592
10.4 2 8 20 43 93 304 663(235.3)
9 31 177 *603
10.6 2 9 21 44 95 307 669(239.8)
9 33 186 *62011.0 2 9 21 45 66 315 684
(248.8)10 34 193 *638
11.4 2 9 22 46 101 323 697(257.9)
10 35 197 *647
11.6 2 9 22 47 104 327 704(262.4)
11 37 208 *666
12.0 2 9 23 48 107 334 719(271.5)
11 39 213 *687
12.4 2 9 23 49 110 348 737(280.5)
11 40 218 *698
12.6 3 10 23 50 112 242 746(285)
12 41 *226 *724
13.0 3 10 24 51 114 362 766(294.1)
12 43 *234 *745
13.4 3 10 24 52 118 370 783(303.1)
13 44 *239 *754
13.6 3 10 24 53 128 374 791(307.6)
13 46 *247 *775
14.0 3 10 24 53 122 382 809(316.7)
13 47 *255 *795
14.4 3 11 25 54 125 290 826(325.7)
14 48 *258 *805
14.6 3 11 25 55 126 394 834(330.3)
15 96 358
6.4 1 6 15 29 58 208 474(144.8)
16 100 372
6.6 1 6 15 30 59 213 484(149.3)
17 104 384
6.8 1 7 16 31 61 219 495(153.8)
18 107 395
7.0 1 7 16 32 62 224 505(158.4)
19 112 4077.2 1 7 16 32 64 230 515
(162.9)20 116 420
7.4 1 7 17 33 66 236 525(167.4)
20 119 432
7.6 1 7 17 33 67 240 535(171.9)
5 20 123 443
7.8 1 7 17 34 68 244 544(176.4)
5 22 127 454
8.0 1 7 18 34 71 249 554(181)
6 23 131 465
8.2 1 7 18 35 73 253 563(185.5)
6 24 134 475
8.4 1 7 18 36 75 257 572(190)
6 25 138 487
8.6 1 7 19 37 77 262 582(194.5)
7 25 142 498
8.8 1 8 19 38 79 267 591(199.1)
7 26 146 508
9.0 1 8 19 39 81 272 600(203.6)
7 26 150 519
9.2 1 8 19 39 83 277 609(208.1)
7 27 154 532
9.4 1 8 20 40 85 281 618(212.6)
8 28 160 545
9.6 1 8 20 41 86 286 627(217.2)
Pipe Size,
Pressurein. (mm)
Loss, ½ ¾ 1 1¼ 1½ 2 2½
psi/100 ft (12.7) (19.1) (25.4) (31.7) (38.1) (50.8) (63.5)
(kPa/100 m) Fixture Unitsa
Pipe Size,
Pressurein. (mm)
Loss, ½ ¾ 1 1¼ 1½ 2 2½
psi/100 ft (12.7) (19.1) (25.4) (31.7) (38.1) (50.8) (63.5)
(kPa/100 m) Fixture Unitsa
(Table 5-10 continued)
Note : Velocities at 5 ( ), 6 ( ), 8 ( ), and 10 ( * ) fps.
a Numbers in small type are flush-valve fixture units; numbers in large type are flush-tank fixture units.
(Continued)

8/12/2019 American Society of Plumbing Engineers Volume 2
http://slidepdf.com/reader/full/american-society-of-plumbing-engineers-volume-2 164/233
ASPE Data Book — Volume 2138
* *33 *100 *515 *1173
28 4 16 41 98 225 606 1173(633.4)
* *35 *118 *521 *1173
30 5 17 43 104 238 611 1173(678.6)
* *40 *128 *521 *1173
32 5 17 45 112 250 611 1173(723.9)
* *43 *138 *521 *1173
34 5 18 47 117 262 611 1173(769.1)
* * *46 *148 *521 *117336 6 19 49 123 275 611 1173
(814.4)* * *49 *159 *521 *1173
38 6 20 51 128 285 611 1173(859.6)
* * *52 *160 *521 *1173
40 6 20 53 134 286 611 1173(904.8)
* * *54 *160 *521 *1173
42 6 21 55 141 286 611 1173(950.1)
* * *59 *160 *521 *1173
44 6 21 56 148 286 611 1173(995.3)
* * *63 *160 *521 *1173
46 6 22 58 154 286 611 1173(1040.6)
* * * *64 *160 *521 *1173
48 7 23 60 156 286 611 1173(1085.8)
* * * *64 *160 *521 *1173
50 7 23 61 156 286 611 1173(1131)
* * * *64 *160 *521 *1173
55 7 24 66 156 286 611 1173(1244.1)
* * * *64 *160 *521 *1173
60 7 25 72 156 286 611 1173(1357.2)
* * * *64 *160 *521 *1173
80 9 31 72 156 286 611 1173(1809.7)
* * * *64 *160 *521 *1173
100 10 31 72 156 286 611 1173(2262.1)
14 50 *265 *827
15.0 3 11 26 56 129 401 854(339.3)
14 52 *275 *851
15.5 3 11 26 57 134 411 875(350.6)
15 53 *284 *875
16.0 3 12 27 58 138 420 896(361.9)
16 54 *292 *900
16.5 3 12 27 59 142 428 918(373.2)
16 57 *302 *92417.0 3 12 28 61 146 436 939
(384.6)17 *60 *315 *947
17.5 3 13 29 62 150 444 960(395.9)
18 *62 *325 *969
18.0 3 13 29 64 153 452 981(407.2)
19 *64 *336 *992
18.5 3 13 30 65 157 460 1002(418.5)
20 *66 *350 *1015
19.0 3 13 30 66 160 469 1023(429.8)
21 *69 *362 *1040
19.5 3 13 31 68 166 477 1045(441.1)
21 *72 *371 *1066
20 4 13 31 69 169 484 1066(452.4)
23 *76 *390 *1116
21 4 13 32 74 175 500 1116(475)
*25 *81 *410 *1165
22 4 14 34 77 183 517 1165(497.7)
*26 *85 *430 *1173
23 4 14 34 82 190 533 1173(520.3)
*27 *90 *448 *1173
24 4 15 35 85 198 549 1173(542.9)
*28 *95 *466 *1173
25 4 15 37 87 205 564 1173(565.5)
*30 *99 *484 *1173
26 4 15 39 91 211 580 1173(588.1)
Pipe Size,
Pressurein. (mm)
Loss, ½ ¾ 1 1¼ 1½ 2 2½
psi/100 ft (12.7) (19.1) (25.4) (31.7) (38.1) (50.8) (63.5)
(kPa/100 m) Fixture Unitsa
Pipe Size,
Pressurein. (mm)
Loss, ½ ¾ 1 1¼ 1½ 2 2½
psi/100 ft (12.7) (19.1) (25.4) (31.7) (38.1) (50.8) (63.5)
(kPa/100 m) Fixture Unitsa
(Table 5-10 continued)
Note : Velocities at 5 ( ), 6 ( ), 8 ( ), and 10 ( * ) fps.
a Numbers in small type are flush-valve fixture units; numbers in large type are flush-tank fixture units.
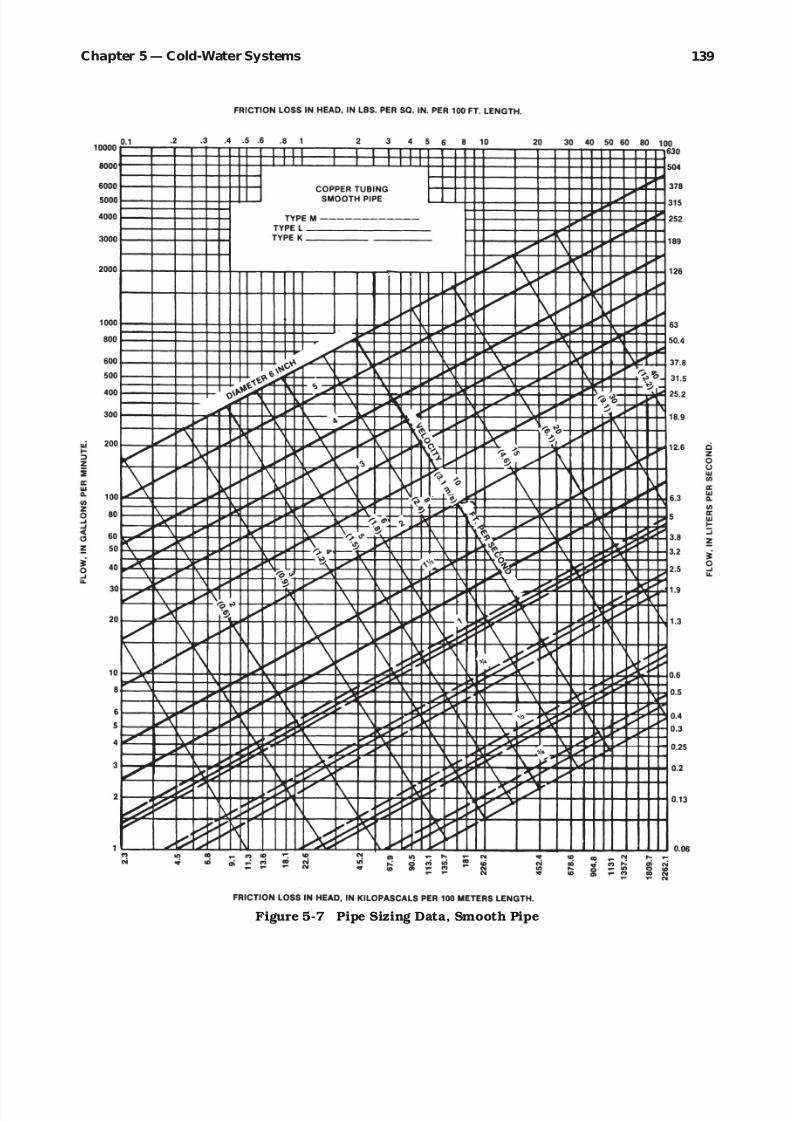
8/12/2019 American Society of Plumbing Engineers Volume 2
http://slidepdf.com/reader/full/american-society-of-plumbing-engineers-volume-2 165/233
139Chapter 5— Cold-Water Systems
Figure 5-7 Pipe Sizing Data, Smooth Pipe

8/12/2019 American Society of Plumbing Engineers Volume 2
http://slidepdf.com/reader/full/american-society-of-plumbing-engineers-volume-2 166/233
ASPE Data Book — Volume 2140
Figure 5-8 Pipe Sizing Data, Fairly Smooth Pipe
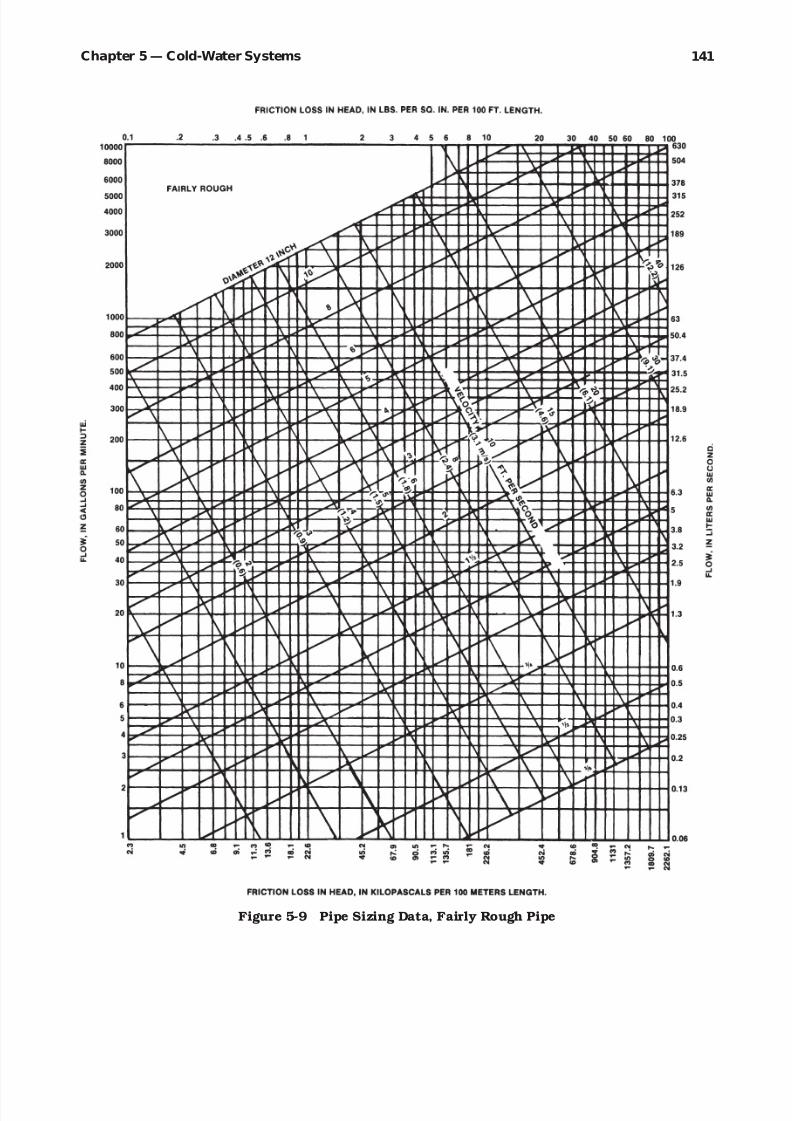
8/12/2019 American Society of Plumbing Engineers Volume 2
http://slidepdf.com/reader/full/american-society-of-plumbing-engineers-volume-2 167/233
141Chapter 5— Cold-Water Systems
Figure 5-9 Pipe Sizing Data, Fairly Rough Pipe

8/12/2019 American Society of Plumbing Engineers Volume 2
http://slidepdf.com/reader/full/american-society-of-plumbing-engineers-volume-2 168/233
ASPE Data Book — Volume 2142
Figure 5-10 Pipe Sizing Data, Rough Pipe

8/12/2019 American Society of Plumbing Engineers Volume 2
http://slidepdf.com/reader/full/american-society-of-plumbing-engineers-volume-2 169/233
143Chapter 5— Cold-Water Systems
it retains its initial charge of air. Air-chamber requirements are shown in Table 5-11.
The air charge can be depleted during theflow cycle since water is drawn from all direc-tions during flow. Moreover, the entrapped air isalso diminished by turbulence. During this pro-cess the water absorbs the air, and as the unit
becomes waterlogged, it loses its ability to ab-sorb shock.
Water hammer arresters
Symbols There are six manufactured sizes of water hammer arrester, each having a different capacity to control shock in piping systems of
varied sizes and scopes. The following symbols,
recommended by the Plumbing and DrainageInstitute (PDI), were devised to denote the rangein size of water hammer arrester:
A – B – C – D – E – F
“ A ” is the smallest-sized unit and “F ” representsthe largest.
Sizing and placement Sizing is based on fix-ture units for single and multiple-fixture branchlines and on pipe size.
Table 5-11 Required Air Chambers
Nominal Pipe Flow Velocity, Required Air Chamber
Pipe Diam., Length, Pressure, fps Volume, Phys. Size,in. (mm) ft (m) psig (kPa) (m/s) in.3 (cm3) in. (cm)
½ (12.71) 25 (7.62) 30 (0.79) 10 (3.04) 8 (1.3) ¾ × 15 (1.9 × 38.1)
½ (12.71) 100 (30.5) 60 (1.57) 10 (3.04) 60 (9.8) 1 × 69½ (2.5 × 176.5)
¾ (19.1) 50 (15.25) 60 (1.57) 5 (1.52) 13 (2.1) 1 × 5 (2.5 × 12.7)
¾ (19.1) 200 (61.0) 30 (0.79) 10 (3.04) 108 (17.7) 1¼ × 72½ (3.2 × 184.2)
1 (25.4) 100 (30.5) 60 (1.57) 5 (1.52) 19 (3.1) 1¼ × 127 / 10 (3.2 × 32.3)
1 (25.4) 50 (15.25) 30 (0.79) 10 (3.04) 40 (6.6) 1¼ × 27 (3.2 × 68.6)
1¼ (31.8) 50 (15.25) 60 (1.57) 10 (3.04) 110 (18.0) 1¼ × 54 (3.2 × 137.2)
1½ (38.1) 200 (61.0) 30 (0.79) 5 (1.52) 90 (14.8) 2 × 27 (5.1 × 68.6)
1½ (38.1) 50 (15.25) 60 (1.57) 10 (3.04) 170 (27.9) 2 × 50½ (5.1 × 128.3)
2 (50.8) 100 (30.5) 30 (0.79) 10 (3.04) 329 (53.9) 3 × 44½ (7.6 × 113.0)
2 (50.8) 25 (7.62) 60 (1.57) 10 (3.04) 150 (24.6) 2½ × 31 (6.4 × 78.7)
2 (50.8) 200 (61.0) 60 (1.57) 5 (1.52) 300 (49.2) 3 × 40½ (7.6 × 102.9)
In most installations where there are severalfixtures, usually only one fixture valve will be closed
at a time. Occasionally, however, two or more fix-ture valves may be closed at the same instant. Table 5-12,“Sizing and Selection of Water-Hammer
a b c d
Figure 5-11 Air Chambers: (a, b) Plain AirChambers, (c) Standpipe Air Chamber,
(d) Rechargeable Air Chamber

8/12/2019 American Society of Plumbing Engineers Volume 2
http://slidepdf.com/reader/full/american-society-of-plumbing-engineers-volume-2 170/233
ASPE Data Book — Volume 2144
Arresters,” takes into consideration all design fac-tors, including simultaneous usage, pipe size,length, flow, pressure, and velocity.
Table 5-12 Sizing and Selection of
Water-Hammer Arresters
PDI Units A B C D E F
Fixture Units 1 –11 12 –32 33 –60 61 –113 114 –154 155 –330
In the sizing of cold and hot-water branchlines, it is usual practice to obtain the total num-
ber of fixture units on each branch line. Thisinformation is then applied to sizing charts todetermine the required size of the branch line.
The properly sized water-hammer arresterscan be selected once the total number of fixture
units for a cold or hot-water branch line isknown. It is only necessary to apply the fixtureunits to Table 5-12 and select the appropriate
water-hammer arrester.
Note the following:
• When water pressure in the line exceeds 65psig, select the next larger size water-ham-mer arrester.
• If the fixture-unit total includes a fraction, it should be rounded up to the next larger wholenumber. Thus, if the total is 11½ fixture units,the unit should be sized for 12 fixture units.
• All sizing data in this chapter are based onflow velocities of 10 fps (3 m/s) or less.
It is suggested that the engineer employ PDIsymbols for the riser diagrams for sizing water-hammer arresters. This practice will enablemanufacturers to furnish the correct units.
The location of the water-hammer arrestersfrom the start of the horizontal branch line tothe last fixture supply on the branch line shouldnot exceed 20 ft (6.1 m) in length. When the
branch lines exceed the 20-ft (6.10-m) length,an additional water-hammer arrester should be
used and each should be sized for half the fix-ture-unit load. It has been established that thepreferred location for the water-hammer arrester is at the end of the branch line between the last two fixtures served. Units for branches servingpieces of equipment with quick-closing valvesshould be placed within a few ft (m) of the equip-ment isolation valve.
To prevent the harboring of Legionella pneumophila, bellows containing rubber shouldnot be used.
BACKFLOW PREVENTION
Theoretically, a well-designed and operated wa-ter-supply system should always be under a con-stant positive pressure, and contamination via
backflow or back-siphonage should never be ableto enter the distribution mains. Unfortunately,accidents do occur when excessive water de-mands for fire protection, operation of booster pumps, flushing of water mains, repairs, modi-fications, and maintenance to the distributionsystem cause the water pressure to drop.
Whenever the pressure in the distribution
system becomes low or negative, a condition de- velops that allows contamination to enter thedistribution system through connections withfixtures, equipment, or tanks that contain toxic,unsafe, or unpleasant liquids or gases. Thesephysical connections by which a water supply may be contaminated are known as “cross con-nections.” There are numerous, well-documentedcases where cross connections have been respon-sible for contaminating drinking water and, as a result, sometimes contributing to the spread of fatal disease.
The contamination of a water system through
cross connections can be avoided. This sectiondescribes the current recommended practice for the detection and elimination of unprotectedcross connections.
Types of Cross-Connection ControlDevice
When plumbing fixtures and equipment in wa-ter-supply systems are subject to backflow con-ditions, approved air gaps, backflow preventers,or vacuum breakers should be used. The follow-ing methods or devices can be used to protect
against backflow or back-siphonage:• Approved air-gap separation.
• Barometric loop.
• Mechanical protection devices.
• Reduced-pressure-principle backflow devices(RPBD).
• Double-check valve assemblies (DCVA).
• Atmospheric vacuum breakers (AVB).
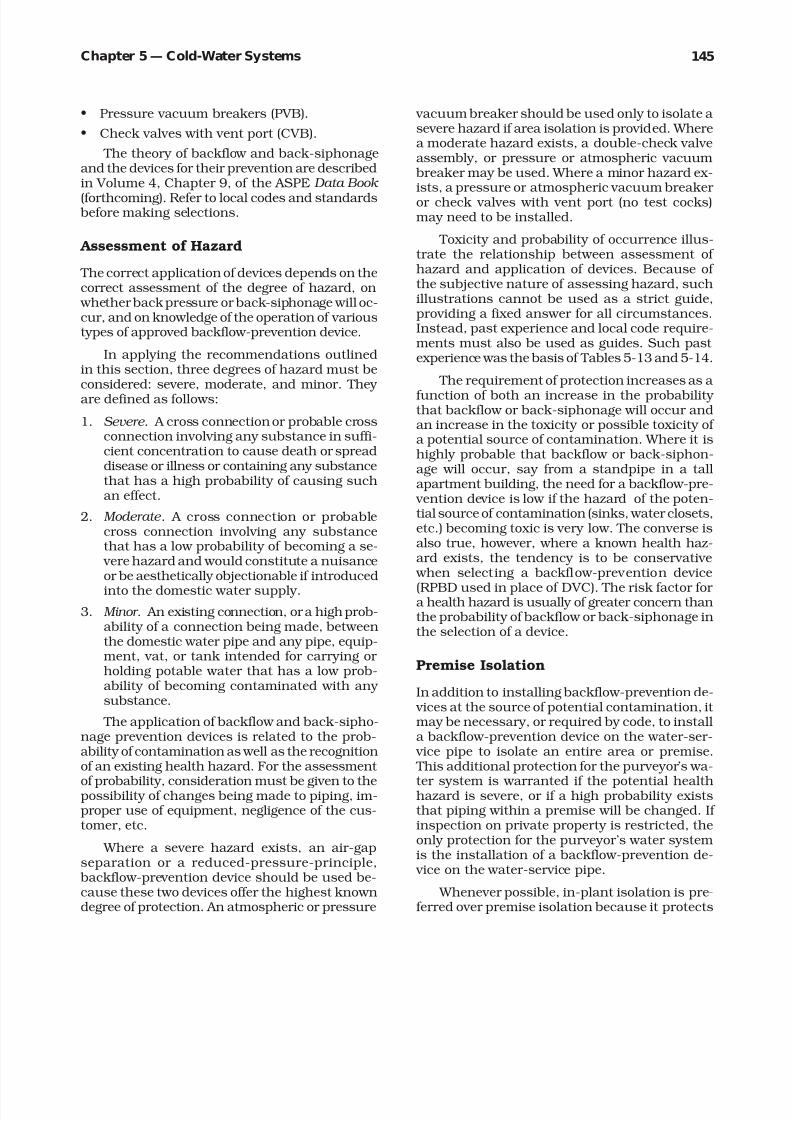
8/12/2019 American Society of Plumbing Engineers Volume 2
http://slidepdf.com/reader/full/american-society-of-plumbing-engineers-volume-2 171/233
145Chapter 5— Cold-Water Systems
• Pressure vacuum breakers (PVB).
• Check valves with vent port (CVB).
The theory of backflow and back-siphonageand the devices for their prevention are describedin Volume 4, Chapter 9, of the ASPE Data Book
(forthcoming). Refer to local codes and standards before making selections.
Assessment of Hazard
The correct application of devices depends on thecorrect assessment of the degree of hazard, on
whether back pressure or back-siphonage will oc-cur, and on knowledge of the operation of varioustypes of approved backflow-prevention device.
In applying the recommendations outlinedin this section, three degrees of hazard must beconsidered: severe, moderate, and minor. They are defined as follows:
1. Severe . A cross connection or probable crossconnection involving any substance in suffi-cient concentration to cause death or spreaddisease or illness or containing any substancethat has a high probability of causing suchan effect.
2. Moderate . A cross connection or probablecross connection involving any substancethat has a low probability of becoming a se-
vere hazard and would constitute a nuisanceor be aesthetically objectionable if introduced
into the domestic water supply.3. Minor . An existing connection, or a high prob-
ability of a connection being made, betweenthe domestic water pipe and any pipe, equip-ment, vat, or tank intended for carrying or holding potable water that has a low prob-ability of becoming contaminated with any substance.
The application of backflow and back-sipho-nage prevention devices is related to the prob-ability of contamination as well as the recognitionof an existing health hazard. For the assessment
of probability, consideration must be given to thepossibility of changes being made to piping, im-proper use of equipment, negligence of the cus-tomer, etc.
Where a severe hazard exists, an air-gapseparation or a reduced-pressure-principle,
backflow-prevention device should be used be-cause these two devices offer the highest knowndegree of protection. An atmospheric or pressure
vacuum breaker should be used only to isolate a severe hazard if area isolation is provided. Wherea moderate hazard exists, a double-check valveassembly, or pressure or atmospheric vacuum
breaker may be used. Where a minor hazard ex-ists, a pressure or atmospheric vacuum breaker or check valves with vent port (no test cocks)may need to be installed.
Toxicity and probability of occurrence illus-trate the relationship between assessment of hazard and application of devices. Because of the subjective nature of assessing hazard, suchillustrations cannot be used as a strict guide,providing a fixed answer for all circumstances.Instead, past experience and local code require-ments must also be used as guides. Such past experience was the basis of Tables 5-13 and 5-14.
The requirement of protection increases as a
function of both an increase in the probability that backflow or back-siphonage will occur andan increase in the toxicity or possible toxicity of a potential source of contamination. Where it ishighly probable that backflow or back-siphon-age will occur, say from a standpipe in a tallapartment building, the need for a backflow-pre-
vention device is low if the hazard of the poten-tial source of contamination (sinks, water closets,etc.) becoming toxic is very low. The converse isalso true, however, where a known health haz-ard exists, the tendency is to be conservative
when selecting a backflow-prevention device
(RPBD used in place of DVC). The risk factor for a health hazard is usually of greater concern thanthe probability of backflow or back-siphonage inthe selection of a device.
Premise Isolation
In addition to installing backflow-prevention de- vices at the source of potential contamination, it may be necessary, or required by code, to installa backflow-prevention device on the water-ser-
vice pipe to isolate an entire area or premise. This additional protection for the purveyor ’s wa-
ter system is warranted if the potential healthhazard is severe, or if a high probability existsthat piping within a premise will be changed. If inspection on private property is restricted, theonly protection for the purveyor ’s water systemis the installation of a backflow-prevention de-
vice on the water-service pipe.
Whenever possible, in-plant isolation is pre-ferred over premise isolation because it protects

8/12/2019 American Society of Plumbing Engineers Volume 2
http://slidepdf.com/reader/full/american-society-of-plumbing-engineers-volume-2 172/233
ASPE Data Book — Volume 2146
Table 5-13 Guide to the Assessment of Hazard and Application of Devices—Isolation at the Fixture
Recommended AdditionalDescription of Assessment of Recommended Device for Area of
Cross Connection Hazard Device at Fixture Premise Isolation
Aspirator (medical) Severe DCAP, AVB or PVB RPBD
Bed pan washers Severe DCAP, AVB or PVB RPBD
Autoclaves Severe DCAP, AVB or PVB RPBD
Specimen tanks Severe DCAP, AVB or PVB RPBD
Sterilizers Severe DCAP, AVB or PVB RPBD
Cuspidors Severe DCAP, AVB or PVB RPBD
Lab bench equipment Severe DCAP, AVB or PVB RPBD
Autopsy & mortuary equip. Severe AVB or PVB
Sewage pump Severe RPBD
Sewage ejectors Severe RPBD
Firefighting system (toxic-foamite) Severe RPBD
Connection to sewer pipe Severe AG
Connection to plating tanks Severe RPBD RPBD
Irrigation system orchemical injectors or pumps Severe RPBD
Connection to salt-water cooling system Severe RPBD
Tank vats or other vessels containingtoxic substances Severe RPBD
Connection to industrial fluid systems Severe RPBD
Dye vats or machines Severe RPBD
Cooling towers with chemical additives Severe RPBD
Trap primer Severe AG
Steam generators Moderatea DCV
Heating equipment Moderatea DCV
Irrigation systems Moderatea DCV, AVB or PVB
Swimming pools Moderatea DCV or AG
Vending machines Moderatea DCV or PVB
Ornamental fountains Moderatea DCV or AVB or PVB
Degreasing equipment Moderatea DCV
Lab bench equipment Minora AVB, PVB or CVP
Hose bibbs and yard hydrants Minora AVB
Trap primers Minora AG
Flexible shower heads Minora AVB
Steam tables Minora AVB
Washing equipment Minora AVB
Shampoo basins Minora AVB
Kitchen equipment Minora AVB
Aspirators Minora AVB
Domestic heating boiler Minora CVP
aWhere a higher hazard exists (due to toxicity or health hazard), additional area protection with RPBD is required. See Table 5-14 foradditional information.

8/12/2019 American Society of Plumbing Engineers Volume 2
http://slidepdf.com/reader/full/american-society-of-plumbing-engineers-volume-2 173/233
147Chapter 5— Cold-Water Systems
in-plant personnel and, in most cases, the de- vice can be sized smaller because in-plant pip-ing is smaller. However, even with in-plant isolation, the purveyor may still require premiseisolation.
The choice of devices for in-plant or premiseisolation depends on the degree of hazard. Sev-eral premises that fall into the severe hazard clas-sification and should be considered for isolationfrom the purveyor ’s system are noted in Tables5-13 and 5-14 and on the following list.
1. Premises with unapproved auxiliary water supplies.
2. Premises where inspection is restricted.
3. Hospitals, mortuaries, clinics, etc.
4. Laboratories.
5. Piers, docks, and other waterfront facilities.
6. Sewage-treatment plants.
7. Food and beverage-processing plants.
8. Chemical plants using a water process.
9. Metal-plating plants.
10. Petroleum-processing or storage plants.
11. Radioactive-material-processing plants andnuclear reactors.
12. Car-washing facilities.
13. Animal-research, care, and processingplants.
Table 5-14 Guide to the Assessment of Facility Hazard and Application of Devices—Containment of Premise
Recommended DeviceDescription of Premise Assessment ot Hazard on Water-Service Pipe
Hospital building with operating,mortuary, or laboratory facilities Severe RPBD
Plants using radioactive material Severe RPBD
Petroleum-processing or stage facilities Severe RPBD
Premise where inspection is restricted Severe RPBD
Sewage-treatment plant Severe RPBD
Commercial laundry Severe RPBD
Plating or chemical plants Severe RPBD
Docks, dockside facilities Severe RPBD(if no protection at fixture)
DCV(if protection at fixture)
Food & beverage-processing plants Severe RPBD
Pleasure boat marina Severe RPBD
Tall buildings (protection againstexcessive head of water) Moderate DCV
Steam plants Moderate DCV
Fire or sprinkler system to tall building(protection against excessive head of water) Moderate DCV

8/12/2019 American Society of Plumbing Engineers Volume 2
http://slidepdf.com/reader/full/american-society-of-plumbing-engineers-volume-2 174/233
ASPE Data Book — Volume 2148
Installation Requirements
1. All backflow devices should be installed inan accessible area to facilitate inspection,semiannual or annual testing, and mainte-nance. Some municipalities now require li-
censed inspectors to test and report on eachdevice on an annual basis. Considerationshould be given to future changes that may take place in the plumbing system. The de-
vices should be installed so that they will re-main accessible regardless of new or futurepiping. Check the manufacturer ’s literaturefor minimum clearances required for the re-moval of parts.
2. Adequate drainage should be provided for thedischarge from the reduced-pressure-device,relief-valve port. Minimum flow rates anddiameters of relief-valve porting are given in
Table 5-15 as a guide in the sizing of drainpipes.
A. In the case of a reduced-pressure de- vice installed in a hut, the “ bore-sighted”daylight drain must be capable of han-dling the volumes discharged from therelief valve.
B. The relief-valve outlet of the reduced-pressure device shall not be directly con-nected to the drain. An air gap of not lessthan 2 diameters of the relief valve outlet or 1 in. (2.5 cm), whichever is greater,must separate the drain from the outlet.
C. A funnel type collector or splash screenshould be used to direct the discharge tothe drain to prevent objectionable spillageor splashing.
3. Pressure and atmospheric vacuum breakersmay also “split ” or spill water. Spillage may occur during the testing of devices. Care must
be taken in choosing the location of devicesso that spillage will not cause damage or bea nuisance.
4. Do not install a reduced-pressure device in a pit below ground unless a drain to the sur-
face is provided. If the atmospheric vent issubmerged in groundwater, a cross connec-tion is created that may be more serious thanthe hazard the device isolates.
5. Before the installion of a backflow-preven-tion device, pipelines should be thoroughly flushed to remove all foreign material that could foul the operation of the device.
Table 5-15 Minimum Flow Rates and Size of Minimum Area of RPBD
Minimum Flow Rate Minimum Diameter ofSize of Device Past Relief Valve Relief Valve Porting (IPS)
in. mm gpm L/s in. mm
½ and s 15 and 17 2.5 0.19 a 10
¾ and 1 20 and 25 4.15 0.31 ½ 15
I¼ and 1½ 32 and 40 8.30 0.63 ¾ 20
2 50 16.70 1.27 1 25
2½ 65 16.70 1.27 1 25
3 80 25.00 1.89 1¼ 32
4 100 33.40 2.53 1½ 32
6 150 33.40 2.53 1½ 32
8 200 50.00 3.79 2 50
10 250 50.00 3.79 2 50
12 300 62.50 4.74 2½ 65
14 350 75.00 5.68 3 80
16 400 83.00 6.29 3 80

8/12/2019 American Society of Plumbing Engineers Volume 2
http://slidepdf.com/reader/full/american-society-of-plumbing-engineers-volume-2 175/233
149Chapter 5— Cold-Water Systems
6. Use of an in-line strainer may be required if the condition is such that foreign material iscontinually collecting in the line and lodgingunder seating surfaces. No strainer is to beused in a fire line without the approval of the insurance underwriters or fire marshal.
7. Isolating valves are necessary on reduced-pressure backflow devices, double-check
valve assemblies, and pressure vacuum breakers to permit replacement, testing, andmaintenance.
8. Internally weighted double-check valve as-semblies must be installed in the horizontalposition. Some brands of spring-loaded,double-check valve devices also must be in-stalled in the horizontal position. Check thelist of approved devices issued in each juris-diction and the manufacturer ’s recommen-
dations.9. All reduced-pressure-principle devices must
be installed in the horizontal position, un-less it is specifically noted otherwise in themanufacturer ’s data.
10. Check with the authority having jurisdictionand the manufacturer before installing any
backflow device in hot-water lines.
11. Backflow preventers are not to be installedin corrosive or polluted atmospheres. Thesurrounding atmosphere can enter the pipe-line through the open vent port of atmo-
spheric and pressure vacuum breakers,check valves with vent ports and reduced-pressure-principle devices.
12. Reduced-pressure-principle devices, double-check valves, and vacuum breakers installedin regions subject to freezing must be pro-tected by the insulation of the units in above-ground, heated structures. Care should betaken to enure that the testing and mainte-nance of the unit is not hindered by the ap-plication of the insulating material.
13. For installations where 24-hour, uninter-
rupted service is a necessity, a parallel de- vice should be provided to permit annualtesting and maintenance. The bypass or par-allel device must provide the same degree of protection as the main-line device.
14. For 8-in. (200-mm) and larger units, a method of lifting and installation is required.Existing crane facilities should be taken ad-
vantage of when determining a location for a
water-service and backflow-preventiondevice.
15. Adequate support should be provided for de- vices 6 in. (150 mm) and larger to prevent damage to connected pipe.
16. Backflow-prevention devices should be pro-tected against damage. Units placed in work areas, areas with public access, or areas with
vehicular traffic should be protected by fenced enclosures, stanchions, or some other means.
17. The possibility of vandalism and theft should be considered when choosing a location for a backflow-prevention device.
18. For reduced-pressure-principle and double-check-valve devices located outside of build-ings, consideration should be given to the
use of landscaping, etc., to obtain an aes-thetically pleasing installation.
19. In a device installed in a deep chamber, thechamber should be self venting. WorkersCompensation Board regulations require that the air within a chamber be checked for com-
bustible gas and adequate oxygen content before a workman enters the chamber.
20. A coupling should be installed in the line toallow flexibility for alignment during instal-lation.
21. When installing a double-check-valve, check-
valve-with-vent-port, or reduced-pressure-principle device on the feed waterline to a pressure vessel, always install the pressure-relief valve between the backflow device andthe pressure vessel.
22. If possible, a reduced-pressure-principle or double-check-assembly device should be in-stalled no more than 3 ft (1 m) above thefloor to facilitate access.
INADEQUATE WATER PRESSURE
When pressure in public water mains is not great enough to satisfy building requirements, thereare three ways to boost pressure to an accept-able level: with a hydropneumatic tank, a grav-ity tank, or a booster pump. These systems can
be used singly or in combination.
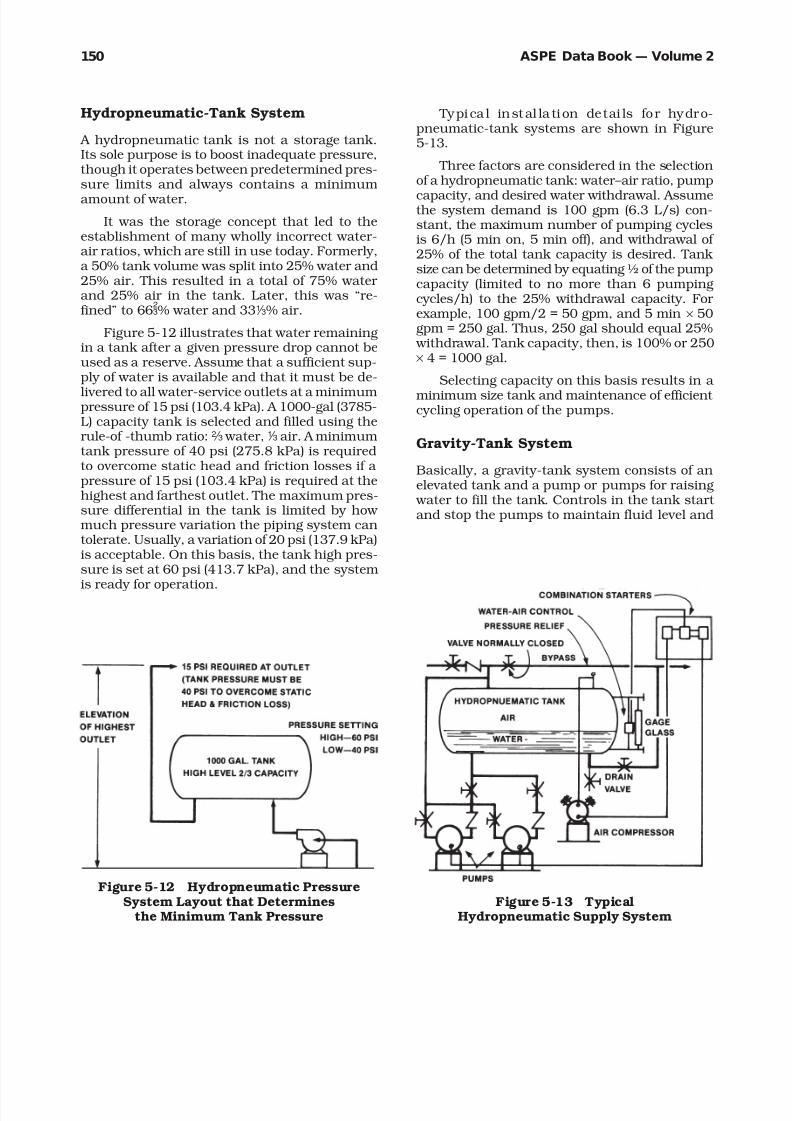
8/12/2019 American Society of Plumbing Engineers Volume 2
http://slidepdf.com/reader/full/american-society-of-plumbing-engineers-volume-2 176/233
ASPE Data Book — Volume 2150
Hydropneumatic-Tank System
A hydropneumatic tank is not a storage tank.Its sole purpose is to boost inadequate pressure,though it operates between predetermined pres-sure limits and always contains a minimum
amount of water.
It was the storage concept that led to theestablishment of many wholly incorrect water-air ratios, which are still in use today. Formerly,a 50% tank volume was split into 25% water and25% air. This resulted in a total of 75% water and 25% air in the tank. Later, this was “re-fined” to 66Q% water and 333% air.
Figure 5-12 illustrates that water remainingin a tank after a given pressure drop cannot beused as a reserve. Assume that a sufficient sup-ply of water is available and that it must be de-
livered to all water-service outlets at a minimumpressure of 15 psi (103.4 kPa). A 1000-gal (3785-L) capacity tank is selected and filled using therule-of -thumb ratio:q water,3 air. A minimumtank pressure of 40 psi (275.8 kPa) is requiredto overcome static head and friction losses if a pressure of 15 psi (103.4 kPa) is required at thehighest and farthest outlet. The maximum pres-sure differential in the tank is limited by how much pressure variation the piping system cantolerate. Usually, a variation of 20 psi (137.9 kPa)is acceptable. On this basis, the tank high pres-sure is set at 60 psi (413.7 kPa), and the system
is ready for operation.
Typical instal la tion detai ls for hydro-pneumatic-tank systems are shown in Figure5-13.
Three factors are considered in the selectionof a hydropneumatic tank: water – air ratio, pump
capacity, and desired water withdrawal. Assumethe system demand is 100 gpm (6.3 L/s) con-stant, the maximum number of pumping cyclesis 6/h (5 min on, 5 min off), and withdrawal of 25% of the total tank capacity is desired. Tank size can be determined by equating ½ of the pumpcapacity (limited to no more than 6 pumpingcycles/h) to the 25% withdrawal capacity. For example, 100 gpm/2 = 50 gpm, and 5 min × 50gpm = 250 gal. Thus, 250 gal should equal 25%
withdrawal. Tank capacity, then, is 100% or 250× 4 = 1000 gal.
Selecting capacity on this basis results in a
minimum size tank and maintenance of efficient cycling operation of the pumps.
Gravity-Tank System
Basically, a gravity-tank system consists of anelevated tank and a pump or pumps for raising
water to fill the tank. Controls in the tank start and stop the pumps to maintain fluid level and
Figure 5-12 Hydropneumatic PressureSystem Layout that Determines
the Minimum Tank PressureFigure 5-13 Typical
Hydropneumatic Supply System

8/12/2019 American Society of Plumbing Engineers Volume 2
http://slidepdf.com/reader/full/american-society-of-plumbing-engineers-volume-2 177/233
151Chapter 5— Cold-Water Systems
capacity. Water then flows from the tank to the waterlines by gravity action.
Three approaches may be used to determinetank capacity for a building:
1. Rule of thumb . An arbitrary tank capacity equal to 30 times pump capacity (gpm) (L/s)is recommended by some authorities. Thiscriterion theoretically provides a building
with a 30-min emergency reserve supply of water in case of power failure or disruptionof the source of water supply.
2. Empirical . With this method, the quantity of water required for emergency conditions isarbitrarily fixed. Based on this determina-tion, the length of time needed for pumpingthe water before safe shutdown can be esti-mated.
3. Cycling of pumps . The capacity of the tank is sized so that cycling of pumps will not oc-cur more than 6 times per hour. This trans-lates to 5 min off, 5 min on. The fewer thecycles per hour, the less the wear and tear on motors and the less maintenance required.Reducing the number of cycles, however, willproduce greater fluctuations in tank-water reserve.
Selecting a tank that provides a large water surface relative to its capacity makes it possibleto withdraw a considerable volume of water with-out appreciably lowering the liquid level. Main-
taining the water level in this way ensures a rela-tively constant water pressure regardless of
whether demand is at a low or peak condition. The following piping connections are required at the tank:
• Water supply to the tank.• Water supply to the system.
• Overflow line.
• Tank drain.
The locations of these connections on thetank are illustrated in Figure 5-14. The systemshown is also equipped with fire-standpipe andsprinkler connections to meet local code require-ments. The tank connections shown in Figure5-14 provide the required water supply for eachsystem, with the sprinkler reserve at the bot-tom, the fire-standpipe reserve at the next level,
and the water storage at the top. Piping connec-tions to the standpipe and sprinkler systemsshould be fitted with bronze strainers within thetank to prevent any debris from entering thosesystems.
Level controls are installed in the tank to start and stop pumps at low and high levels. The levelcontrol can be a float switch, pressure switch,electric prober, or any other acceptable device.
Tanks should be equipped with both high andlow-level alarms. The low-level alarm indicatesthat the pumps are not keeping up with demand.
Figure 5-14 Piping Connections for a Gravity Water-Storage Tank with Reserve Capacity for Firefighting

8/12/2019 American Society of Plumbing Engineers Volume 2
http://slidepdf.com/reader/full/american-society-of-plumbing-engineers-volume-2 178/233
ASPE Data Book — Volume 2152
The high-level alarm warns that water hasreached the overflow level and is spilling to waste.
When storage tanks are used for gravity feed,consideration must be given to the weight of thetank and water so proper support can beprovided.
Booster-Pump System
There are two ways to make a continuously runsystem deliver a relatively constant system pres-sure under varying load conditions. One way isto use a constant-speed pump with a pressure-regulating valve in the discharge piping. Theother way is to vary the speed of the pump shaft either at the motor or in the coupling.
A variety of booster-pump systems are cur-rently in use, with more being introduced all the
time. Detailed information on the design criteria and operational characteristics of water-pressure boosting systems is given in the ASPE Pumps and Pump Systems Handbook .
EXCESS WATER PRESSURE
One of the main sources of trouble in a water-distribution system is excessive pressure. Un-less a piece of equipment, fixture, or operationrequires a specified high pressure, a water sys-tem should not exceed a maximum of 80 psi(551.6 kPa) (check local code). To ensure this, a pressure-regulating valve (PRV) should be in-stalled.
The purpose of a pressure-regulating valveis to reduce water pressure from higher, supply-main pressures to desirable and adequate flow pressures when water is required at fixtures,appliances, or equipment.
Pressure-Regulating Valves
Definitions The following are definitions of terms used in discussing, sizing, and ordering
pressure-regulating valves: Accuracy The degree of fall-off in the outlet pressure from the set pressure at full-flow ca-pacity. Also, the capability of producing the sameresults for repetitive operations with identicalconditions of flow.
Dead-end service The type of service in whichthe PRV is required to close bottle-tight whenthere is no demand on the system.
Fall-off The amount that pressure is decreasedfrom set pressure to meet demand. The amount
of fall-off depends on the quantity of flow — thegreater the flow, the greater the fall-off. A fall-off of 20 psi (137.9 kPa) is considered to be the maxi-mum allowable fall-off.
No-flow pressure The pressure maintained inthe system when the PRV is shut tight so that high pressure at the inlet of the valve is not per-mitted to enter the system.
Reduced-flow pressure The pressure main-tained at the PRV outlet when water is flowing.
The no-flow (closed), set-point pressure of a PRV is always higher than the reduced-flow (open)
pressure. A PRV that is set to open at 45 psi(310.3 kPa) pressure (no-flow) would deliver a reduced-flow pressure of 30 psi (206.8 kPa) at peak demand if a 15 psi (103.4 kPa) fall-off had
been selected. Then the reduced-flow pressureat peak flow would be 30 psi (206.8 kPa).
Response The capability of a PRV to respondto change in outlet pressure.
Sensitivity The ability of a PRV to sense a change in pressure. If the valve is too sensitiveand quick to respond, the results are over-con-trol and a hunting effect. Not enough sensitivity results in operation that is sluggish and great
variations in the outlet pressure.
Set pressure That pressure, at the outlet of the PRV, at which the valve will start to open.
Types of pressure-regulating valve All pres-sure-regulating valves fall into the following gen-eral categories:
• Single-seated — direct-operated or pilot-oper-ated.
• Double-seated — direct-operated or pilot-oper-ated.
Single-seated pressure-regulating valves areused for dead-end service and when the flow to be regulated is intermittent. For dead-end ser- vice, the valve must be able to shut tight andnot permit the passage of any water when thereis no demand. Double-seated PRVs are used for continuous-flow conditions. They are not suitedfor dead-end service and should never be usedfor this purpose.

8/12/2019 American Society of Plumbing Engineers Volume 2
http://slidepdf.com/reader/full/american-society-of-plumbing-engineers-volume-2 179/233
153Chapter 5— Cold-Water Systems
Direct-operated PRVs tend to have a reduc-tion of the outlet pressure in direct proportion
with the increase of the flow rate. Pilot-operatedPRVs will maintain a close fluctuation of theoutlet pressure independent of the flow rate as-suming that the valve was sized properly.
Sizing, selection, and installation Initial cost,maintenance cost, and specific project require-ments regarding flow rates and pressure shoulddetermine which PRV is recommended for a par-ticular application.
Sizing and selection of a pressure-regulating valve can be performed after the following crite-ria are estimated: inlet pressure, outlet pressure,and capacity (flow rate). “Inlet pressure” is themaximum pressure expected upstream of theregulating valve. “Outlet pressure” is the pres-sure required downstream of the regulating valve.For large-capacity systems, which may also ex-perience periods of low flow, or when extremepressure reductions are expected, it is not ad-
visable to have only one regulating valve.
A PRV sized to accommodate both small andlarge flows has, in general, a high noise levelduring operation. In addition, small flows willproduce wire-drawing of the seat and possiblechatter.
In addition to having economic advantages,the proper application of pressure-regulating
valves can greatly influence the overall perfor-
mance of the system. Under most circumstances,a good application can increase system perfor-mance, reduce operating costs, and ensure a longer life expectancy for regulators.
For example, where initial pressures exceed200 psi (1379.0 kPa) or where there is a wide
variation between the initial pressure and thereduced pressure, or where the initial pressure
varies considerably, “two-stage reduction” is ben-eficial. Two-stage reduction is the use of two PRVsto reduce high service pressure proportionately and to eliminate an extremely wide variance be-tween the initial and reduced pressure. It is rec-ommended where the initial pressure is 200 lb(1379.0 kPa) or more and where the ratio of ini-tial to reduced pressure is more than 4 to 1 (e.g.,200 to 50 lb [1379.0 to 344.7 kPa]), or where theinitial pressure fluctuates greatly. The advan-tage of this installation is that neither valve issubjected to an excessive range of pressure re-ductions. This seems to stabilize the final reducedpressure, ensuring close and accurate perfor-
mance. Also, this type of installation reduces the velocity of flow (there’s less pressure drop acrosstwo regulators than across one), providing longer
valve life.
Selection of PRVs and pressure settings is
fairly simple. The first PRV could reduce from250 to 150 lb (1723.7 to 1034.2 kPa) and thesecond from 150 to approximately 50 lb (1034.2to 344.7 kPa) or there could be some similar di-
vision. PRV size can be selected according to themanufacturer ’s capacity tables if it is remem-
bered that each PRV should exceed the total ca-pacity of the system.
Where there is a wide variation of demandrequirements and where it is vital to maintain a continuous water supply as well as providegreater capacity, “parallel installation” is recom-mended. Parallel installation is the use of two or
more smaller size pressure-regulating valvesserving a larger size supply-pipe main. This typeof installation should be employed wherever thereis a wide variation of reduced-pressure require-ments and where it is vital to maintain a con-tinuous water supply. It also has the advantageof providing increased capacity beyond that pro-
vided by a single valve where needed. Multipleinstallation improves valve performance for
widely variable demands and permits the ser- vicing of an individual valve without the com-plete shutdown of the line, thus preventing costly shutdowns.
For a two-valve parallel installation, the to-tal capacity of the valves should equal or exceedthe capacity required by the system. One valveshould be set at 10 psi (69.0 kPa) higher delivery pressure than the other. For example, assumethat the system requires 400 gpm (25.2 L/s) andthe reduced-flow pressure required is 50 psi(344.7 kPa). Select two valves, each rated at 200gpm (12.6 L/s), with one valve set at 50 psi (344.7kPa) and the other valve set 10 psi (69.0 kPa)higher at 60 psi (413.7 kPa). Thus, when low
volume is required, the higher-set valve oper-ates alone. When a larger volume is demanded,
both valves open, delivering full-line capacity.
Another possible choice is to install two PRV combinations of different sizes. This is practicalon larger installations where supply lines are 2in. (50 mm) and larger and where there are fre-quent periods of small demand. The smaller PRV
would have the 10-psi (69.0-kPa) higher delivery pressure and thus operate alone to satisfy smalldemands, such as urinals and drinking foun-

8/12/2019 American Society of Plumbing Engineers Volume 2
http://slidepdf.com/reader/full/american-society-of-plumbing-engineers-volume-2 180/233
ASPE Data Book — Volume 2154
tains. When a larger volume is demanded, themain PRV would open to satisfy the system de-mand. For example, take an apartment buildingrequiring 300 gpm (18.9 L/s) at 60 psi (413.7kPa). The selection might be a 4-in. (100-mm)PRV rated for 240 gpm (15.1 L/s) (80% of totalmaximum flow rate) and set at 60 psi (413.7 kPa)and a 1½-in. (40-mm) PRV rated for 60 gpm (3.8L/s) and set at 70 psi (472.7 kPa).
Manufacturers have tables indicating recom-mended capacities and valve sizes for use in par-allel installations.
TESTING, CLEANING, ANDDISINFECTION OF DOMESTIC, WATER-SUPPLY SYSTEMS
TestingPrior to disinfection, connection to faucets andequipment, and installation of pipe insulation,the domestic water system should be hydrostati-cally tested for leakage. A typical test for interior piping is accomplished by capping all systemopenings, filling the system with water, and thenpumping a static head into the system at a mini-mum of 1½ times the working pressure (100 psi[689.5 kPa] minimum) for a period of not lessthan 2 hours. The aforementioned test require-ments are acceptable to most inspectors, but notethat 80 psi (551.6 kPa) is the maximum pres-
sure allowed by most designs and codes.
Under conditions where systems are subject to freezing, and with the approval of the author-ity having jurisdiction, an air test may be sub-stituted for the water test. This can beaccomplished by connecting an air compressor to the system, bringing the system up to 40 psi(275.8 kPa), checking for leaks with liquid soap,repairing any leaks, and then subjecting the sys-tem to a minimum of 1½ times the working pres-sure (100 psi [689.5 kPa] minimum) for a minimum of 2 hours.
Any equipment that may be damaged by these tests should be disconnected from thesystem.
Cleaning and Disinfecting
New or repaired potable water systems shall becleaned and disinfected prior to use whenever required by the administrative authority. Themethod to be followed should be per AWWA or
as follows (or as required by the administrativeauthority):
1. Cleaning and disinfection applies to both hot and cold, domestic (potable) water systemsand should be performed after all pipes,
valves, fixtures, and other components of thesystems are installed, tested, and ready for operation.
2. All domestic yard, hot and cold-water pipingshould be thoroughly flushed with clean, po-table water prior to disinfection to removedirt and other contaminants. Screens of fau-cets and strainers should be removed beforeflushing and reinstalled after completion of disinfection.
3. Disinfection should be done using chlorine,either gas or liquid. Calcium or sodium hy-pochlorite or another approved disinfectant may be used.
4. A service cock should be provided and lo-cated at the water-service entrance. The dis-infecting agent should be injected into andthrough the system from this cock only.
5. The disinfecting agent should be injected by a proportioning pump or device through theservice cock slowly and continuously at aneven rate. During disinfection, flow of the dis-infecting agent into the main connected tothe public water supply is not permitted.
6. All sectional valves should be opened duringdisinfection. All outlets should be fully openedat least twice during injection and the re-sidual checked with orthotolidin solution.
7. If chlorine is used, when the chlorine residualconcentration, calculated on the volume of
water the piping will contain, indicates not less than 50 parts per million (ppm) or milli-grams per liter (mg/L) at all outlets, then all
valves should be closed and secured.
8. The residual chlorine should be retained inthe piping systems for a period of not lessthan 24 hours.
9. After the retention, the residual should benot less than 5 ppm. If less, then the pro-cess should be repeated as described above.
10. If satisfactory, then all fixtures should beflushed with clean, potable water until re-sidual chlorine by orthotolidin test is not greater than that of the incoming water sup-ply (this may be zero).

8/12/2019 American Society of Plumbing Engineers Volume 2
http://slidepdf.com/reader/full/american-society-of-plumbing-engineers-volume-2 181/233
155Chapter 5— Cold-Water Systems
11. All work and certification of performanceshould be performed by approved applica-tors or qualified personnel with chemical andlaboratory experience. Certification of perfor-mance should indicate:
• Name and location of the job and date when disinfection was performed.
• Material used for disinfection.
• Retention period of disinfectant in pip-ing system.
• Ppm (mg/L) chlorine during retention.
• Ppm (mg/L) chlorine after flushing.
• Statement that disinfection was per-formed as specified.
• Signature and address of company/per-son performing disinfection.
12. Upon completion of final flushing (after re-tention period) the contractor should obtaina minimum of one water sample from eachhot and cold-water line and submit samplesto a state/province and/or local, approvedlaboratory. Samples should be taken fromfaucets located at the highest floor and fur-thest from the meter or main water supply.
The laboratory report should show the fol-lowing:
• Name and address of approved labora-tory testing the sample.
• Name and location of job and date thesamples were obtained.
• The coliform organism count. An accept- able test shall show the absence of coliform organisms. (Some codes requirean acceptable test for 2 consecutive days.)
• Any other tests required by local codeauthorities.
13. If analysis does not satisfy the above mini-mum requirements, the disinfection proce-dure must be repeated.
14. Before acceptance of the systems, the con-
tractor should submit to the architect (engi-neer) for his review 3 copies of the laboratory report and 3 copies of the certification of per-formance as specified above.
15. Under no circumstances should the contrac-tor permit the use of any portion of domestic
water systems until they are properly disin-fected, flushed, and certified.
NOTE: It should be understood that local code requirements, if more stringent than above sug- gested procedures, shall be included in the speci- fications.
REFERENCES
1. American Water Works Association (AWWA). AWWA cross connection control manual . New York.
2. AWWA. AWWA standard for disinfecting water mains , AWWA C601.
3. AWWA. AWWA standard for disinfection of water storage facilities , AWWAD105.
4. AWWA. Standard for hypochlorites , AWWA B300, AWWA M22.
5. AWWA. Standard for liquid chlorine , AWWAB301.
6. Manas, V.T. National plumbing code illustrated
handbook . New York: McGraw-Hill.
7. n.a. 1978. Piping systems fundamentals and ap-plication. Plant Engineer Magazine.
8. US Department of Commerce, National Bureauof Standards. BMS 65, Methods of estimating loads in plumbing systems , by R.B. Hunter. Washington, DC.
9. US Department of Commerce, National Bureauof Standards. BMS 66, Plumbing manual . Wash-ington, DC.
10. US Department of Commerce, National Bureauof Standards. BMS 79, Water distributing sys- tems for buildings , by R.B. Hunter. Washington,
DC.
11. White, George Clifford. 1972. Handbook of chlo- rination . New York: Van Nostrand Reinhold.

8/12/2019 American Society of Plumbing Engineers Volume 2
http://slidepdf.com/reader/full/american-society-of-plumbing-engineers-volume-2 182/233

8/12/2019 American Society of Plumbing Engineers Volume 2
http://slidepdf.com/reader/full/american-society-of-plumbing-engineers-volume-2 183/233
157Chapter 6— Domestic Water Heating Systems
Domestic
Water-HeatingSystems6
INTRODUCTION
Proper design of the domestic hot-water supply system for any building is extremely important.Careful planning on the basis of all available data
will ensure an adequate supply of water at thedesired temperature to each fixture at all times.
A properly designed system must, of course, con-form with all the regulations of the authoritieshaving jurisdiction.
The design objectives for an efficient hot- water distribution system include:
1. Providing adequate amounts of water at the
prescribed temperature to all fixtures andequipment at all times.
2. A system that will perform its function safely.
3. The utilization of an economical heat source.
4. A cost-effective and durable installation.
5. An economical operating system with reason-able maintenance.
A brief discussion of each of these objectivesis warranted. Any well-designed system shoulddeliver the prescribed temperature at the outlet almost instantaneously to avoid the wasteful
running of water until the desired temperatureis achieved. The hot water should be available at any time of the day or night and during low-demand periods as well as peak flows.
Safety must be built into any hot-water sys-tem, and the safety features must operateautomatically. The two paramount dangers to beguarded against are excessive pressures and tem-peratures. Exploding hot-water heaters and
scalding water at fixtures must be prevented in
the design stage. An economic heat source is of prime impor-
tance in conserving energy. Various sourcesinclude coal, gas, oil, steam, condensate, wastehot water, and solar energy. The availability andcost of any of these sources or combinations of these sources will dictate selection. If an espe-cially economical source is not adequate to satisfy the total demand, then it can be used to preheat the cold-water supply to the heater.
An economical and durable installation can be achieved by judicious selection of the proper
materials and equipment. The piping layout alsohas a marked effect on this objective and willlater determine the ease of replacement andrepair.
Cost-effective operation and maintenancealso depend upon the proper pre-selection of materials and equipment. The choice of instantaneous or storage type heaters, the se-lection of insulation on heaters and piping, thelocation of piping (avoiding cold, unheated ar-eas), the ease of circulation (the avoidance of drops and rises in piping), bypasses aroundpumps and tanks, and adequate valving acces-
sibility are all items that affect the operation andmaintenance of a system.
The design of a domestic water-heating sys-tem begins with estimating the facility ’s loadprofile and identifying the peak demand times.
To accomplish these steps, the designer must conduct discussions with the users of the space,determine the building type, and learn of any owner requirements. The information thus gath-

8/12/2019 American Society of Plumbing Engineers Volume 2
http://slidepdf.com/reader/full/american-society-of-plumbing-engineers-volume-2 184/233
ASPE Data Book — Volume 2158
ered will establish the required capacity of the water heating equipment and the general type of system to be used.
BASIC FORMULAE AND UNITS
The equations in this chapter are based on theprinciple of energy conservation. The fundamen-tal formula for this expresses a steady-state heat
balance for the heat input and output of thesystem:
Equation 6-1
q = r w c ∆T
where
q = Time rate of heat transfer,
Btu/h (kJ/h)r = Flow rate, gph (L/h)
w = Weight of heated water, lb (kg)
c = Specific heat of water,Btu/lb/°F (kJ/kg/K)
∆ T = Change in heated water temperature(temperature of leaving water minustemperature of incoming water,represented as T h – T c, °F [K])
For the purposes of this discussion, the spe-cific heat of water is constant, c = 1 Btu/lb/°F (c = 4.19 kJ/kg/K), and the weight of water is
constant at 8.33 lb/gal (999.6 kg/m3).
Equation 6-2
q = gph
1 Btu
8.33 lb
(∆T)lb/ °F gal
q =
m3
4.188 kJ
999.6 kg
(∆T)
____ ____________ ___________
h kg/K m3
Example 6-1 Calculate the heat output raterequired to heat 600 gph from 50 to 140°F (2.27m3/h from 283.15 to 333.15K).
Solution From Equation 6-2,
q = 600 gph
8.33 Btu
(140−50°F)
= 449,820 Btu/h
gal / °F
q =
2.27 m3
4188.32 kJ
(333.15−283.15 K)
___________ ______________
h m3 /K
= 475 374 kJ/h Note : The designer should be aware that water heaters installed in high elevations must be de-rated based on the elevation. The water heaters’manufacturers’ data should be consulted for in-formation on required modifications.
HEAT RECOVERY — ELECTRIC WATER HEATERS
It takes 1 Btu of energy to raise 1 lb of water 1°F. Since 1 kW is equal to 3413 Btu and 1 gal of
water weighs 8.33 lb, then it would take 1 kW of electrical power to raise 410 gal (1552.02 L) of
water 1°F. This can be expressed in a series of formulae, as follows:
Equation 6-3
410 gal= gal of water per kW at ∆T
∆T
1552.02 L
= L of water per kW at ∆T∆T
Equation 6-4
gph × ∆T= kW required
410 gal
L/h · ∆T
= kW required1552.02 L
Equation 6-5
gph= kW required
gal of water per kW at ∆T
L/h
= kW requiredL of water per kW at ∆T
where
∆ T = Temperature rise (temperaturedifferential), °F (°C)
gph = Gallons per hour of hot water required

8/12/2019 American Society of Plumbing Engineers Volume 2
http://slidepdf.com/reader/full/american-society-of-plumbing-engineers-volume-2 185/233
159Chapter 6— Domestic Water Heating Systems
L/h = Liters per hour of hot water required
Equation 6-3 can be used to establish a simple table based on the required temperaturerise.
Temperature Rise, ∆∆∆∆∆T, Gal (L) of Water°F (°C) per kW
110 (43) 3.73 (14.12)
100 (38) 4.10 (15.52)
90 (32) 4.55 (17.22)
80 (27) 5.13 (19.42)
70 (21) 5.86 (22.18)
60 (16) 6.83 (25.85)
50 (10) 8.20 (31.04)
40 (4) 10.25 (38.8)
This table can be used with Equation 6-5 to solvefor the kW electric element needed to heat therequired recovery volume of water.
Example 6-2 An electric water heater must besized based on the following information: (a) 40gph (151.42 L/h) of hot water at a temperatureof 140°F (43°C) is required. (b) The incoming
water supply during winter is 40°F (4°C).Solution Using Equation 6-5 and the abovetable, we find the following:
40 gph= 9.8 kW required
4.1 gal (100°F)
151.42 L/h
= 9.8 kW required15.52 L (38°C)
HOT-WATER TEMPERATURE
The generally accepted minimum hot-water tem-peratures for various plumbing fixtures andequipment are given in Table 6-1. Both tempera-ture and pressure should be verified with theclient and checked against local codes and themanuals of equipment used.
Table 6-1 Typical Hot-Water Temperaturesfor Plumbing Fixtures and Equipment
Use Temperature°F (°C)
Lavatory
Hand washing 105 (40)
Shaving 115 (45)
Showers and tubs 110 (43)
Therapeutic baths 95 (35)
Surgical scrubbing 110 (43)
Commercial and institutionallaundry 140–180 (60–82)
Residential dishwashingand laundry 140 (60)
Commercial, spray-type dishwashing(as required by the NSF):
Single or multiple-tank hoodor rack type:
Wash 150 min. (66 min.)
Final rinse 180–195 (82–91)
Single-tank conveyor type:
Wash 160 min. (71 min.)
Final rinse 180–195 (82–91)
Single-tank rack or door type:
Single-temperaturewash and rinse 165 min. (74 min.)
Chemical sanitizing glassware:
Wash 140 (60)
Rinse 75 min. (24 min.)
Note : Be aware that temperatures, as dictated by codes, owners,equipment manufacturers, or regulatory agencies, will occasion-ally differ from those shown.
MIXED-WATER TEMPERATURE
Mixing water at different temperatures to makea desired mixed-water temperature is the mainpurpose of domestic hot-water systems.
“P” is a hot-water multiplier and can be usedto determine the percentage of supply hot water that will blend the hot and cold water to pro-duce a desired mixed-water temperature.
8/12/2019 American Society of Plumbing Engineers Volume 2
http://slidepdf.com/reader/full/american-society-of-plumbing-engineers-volume-2 186/233

8/12/2019 American Society of Plumbing Engineers Volume 2
http://slidepdf.com/reader/full/american-society-of-plumbing-engineers-volume-2 187/233
161Chapter 6— Domestic Water Heating Systems
Table 6-2 Hot-Water Multiplier, P
Th = 110°F Hot-Water System Temperature
Tc, CW
Tm, Water Temperature at Fixture Outlet (°F)
Temp. (°F) 110 105 100 9545 1.00 0.92 0.85 0.77
50 1.00 0.92 0.83 0.75
55 1.00 0.91 0.82 0.73
60 1.00 0.90 0.80 0.70
65 1.00 0.89 0.78 0.67
Th = 120°F Hot-Water System Temperature
Tc, CWTm, Water Temperature at Fixture Outlet (°F)
Temp. (°F) 120 115 110 105 100 9545 1.00 0.93 0.87 0.80 0.73 0.67
50 1.00 0.93 0.86 0.79 0.71 0.64
55 1.00 0.92 0.85 0.77 0.69 0.62
60 1.00 0.92 0.83 0.75 0.67 0.58
65 1.00 0.91 0.82 0.73 0.64 0.55
Th = 130°F Hot-Water System Temperature
Tc, CWTm, Water Temperature at Fixture Outlet (°F)
Temp. (°F) 130 125 120 115 110 105 100 95
45 1.00 0.94 0.88 0.82 0.76 0.71 0.65 0.59
50 1.00 0.94 0.88 0.81 0.75 0.69 0.63 0.56
55 1.00 0.93 0.87 0.80 0.73 0.67 0.60 0.53
60 1.00 0.93 0.86 0.79 0.71 0.64 0.57 0.50
65 1.00 0.92 0.85 0.77 0.69 0.62 0.54 0.46
Th = 140°F Hot-Water System Temperature
Tc, CWT
m, Water Temperature at Fixture Outlet (°F)
Temp. (°F) 140 135 130 125 120 115 110 105 100 95
45 1.00 0.95 0.89 0.84 0.79 0.74 0.68 0.63 0.58 0.53
50 1.00 0.94 0.89 0.83 0.78 0.72 0.67 0.61 0.56 0.50
55 1.00 0.94 0.88 0.82 0.76 0.71 0.65 0.59 0.53 0.47
60 1.00 0.94 0.88 0.81 0.75 0.69 0.63 0.56 0.50 0.44
65 1.00 0.93 0.87 0.80 0.73 0.67 0.60 0.53 0.47 0.40
(Continued)
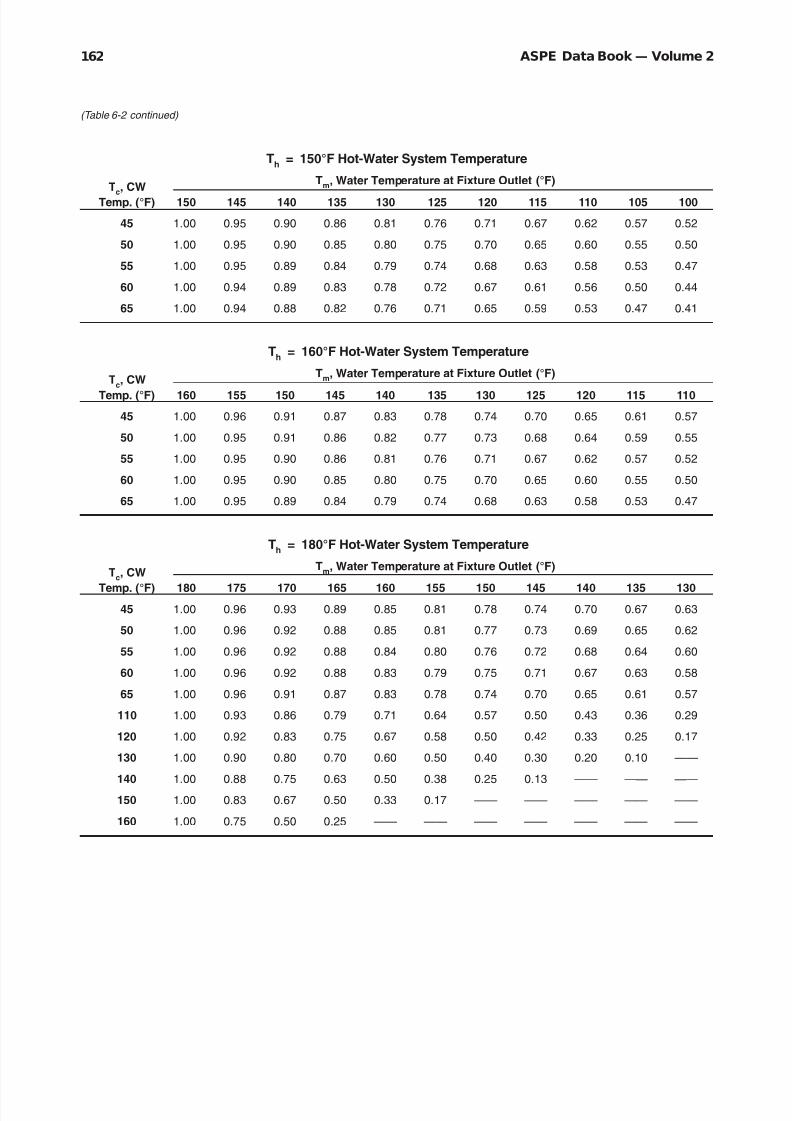
8/12/2019 American Society of Plumbing Engineers Volume 2
http://slidepdf.com/reader/full/american-society-of-plumbing-engineers-volume-2 188/233

8/12/2019 American Society of Plumbing Engineers Volume 2
http://slidepdf.com/reader/full/american-society-of-plumbing-engineers-volume-2 189/233

8/12/2019 American Society of Plumbing Engineers Volume 2
http://slidepdf.com/reader/full/american-society-of-plumbing-engineers-volume-2 190/233
ASPE Data Book — Volume 2164
Th = 66°C Hot-Water System Temperature
Tc, CWTm, Water Temperature at Fixture Outlet (°C)
Temp. (°C) 66 63 60 58 54 52 49 46 43 41 387 1.00 0.95 0.90 0.86 0.81 0.76 0.71 0.67 0.62 0.57 0.52
10 1.00 0.95 0.90 0.85 0.80 0.75 0.70 0.65 0.60 0.55 0.50
13 1.00 0.95 0.89 0.84 0.79 0.74 0.68 0.63 0.58 0.53 0.47
16 1.00 0.94 0.89 0.83 0.78 0.72 0.67 0.61 0.56 0.50 0.44
18 1.00 0.94 0.88 0.82 0.76 0.71 0.65 0.59 0.53 0.47 0.41
Th = 71°C Hot-Water System Temperature
Tc, CWTm, Water Temperature at Fixture Outlet (°C)
Temp. (°C) 71 68 66 63 60 58 54 52 49 46 437 1.00 0.96 0.91 0.87 0.83 0.78 0.74 0.70 0.65 0.61 0.57
10 1.00 0.95 0.91 0.86 0.82 0.77 0.73 0.68 0.64 0.59 0.55
13 1.00 0.95 0.90 0.86 0.81 0.76 0.71 0.67 0.62 0.57 0.52
16 1.00 0.95 0.90 0.85 0.80 0.75 0.70 0.65 0.60 0.55 0.50
18 1.00 0.95 0.89 0.84 0.79 0.74 0.68 0.63 0.58 0.53 0.47
Th = 82°C Hot-Water System Temperature
Tc, CWT
m, Water Temperature at Fixture Outlet (°C)
Temp. (°C) 82 79 77 74 71 68 66 63 60 58 54
7 1.00 0.96 0.93 0.89 0.85 0.81 0.78 0.74 0.70 0.67 0.63
10 1.00 0.96 0.92 0.88 0.85 0.81 0.77 0.73 0.69 0.65 0.62
13 1.00 0.96 0.92 0.88 0.84 0.80 0.76 0.72 0.68 0.64 0.60
16 1.00 0.96 0.92 0.88 0.83 0.79 0.75 0.71 0.67 0.63 0.58
18 1.00 0.96 0.91 0.87 0.83 0.78 0.74 0.70 0.65 0.61 0.57
43 1.00 0.93 0.86 0.79 0.71 0.64 0.57 0.50 0.43 0.36 0.29
49 1.00 0.92 0.83 0.75 0.67 0.58 0.50 0.42 0.33 0.25 0.17
54 1.00 0.90 0.80 0.70 0.60 0.50 0.40 0.30 0.20 0.10 —
60 1.00 0.88 0.75 0.63 0.50 0.38 0.25 0.13 — — —
66 1.00 0.83 0.67 0.50 0.33 0.17 — — — — —
71 1.00 0.75 0.50 0.25 — — — — — — —
(Table 6-2 continued)

8/12/2019 American Society of Plumbing Engineers Volume 2
http://slidepdf.com/reader/full/american-society-of-plumbing-engineers-volume-2 191/233
165Chapter 6— Domestic Water Heating Systems
140°F (60°C) at the top and 40°F (4°C) at the bottom, this tank, in theory, could still deliver half its volume at 140°F (60°C). But, if the twolayers were completely mixed, the tank tempera-ture would drop to 90°F (32°C), which, in most cases, is an unusable temperature.
HOT-WATER TEMPERATUREMAINTENANCE
Hot water of a desired temperature should bereadily available at any fixture. Either a hot-wa-ter circulation system or an electronically heatedsystem shall be used to achieve this purpose.
Hot-Water Circulation Systems
Hot-water supply piping, whether insulated or
not, transmits heat to the surrounding lower-temperature air by conduction, convection, andradiation. The user wastes water while waitingfor the desired temperature water to warm upthe piping system.
The sizing of the circulation system includesselection of the pump, sizing the supply and re-circulation piping, and selecting the insulationtype and thickness. Recirculation systems may not be practical for small systems but may bemandated for systems designed for such placesas food establishments. Proper sizing of the hot-
water circulating system is essential for theefficient and economical operation of the hot-wa-ter system. Oversizing will cause the system tolose additional heat and result in unnecessary expenditures on equipment and installation.Undersizing will seriously hamper circulation andthus starve the fixtures of the desired water tem-perature.
The procedure for sizing the hot-water cir-culating piping is as follows:
1. Calculate the heat-loss rates of the hot-wa-ter supply piping.
2. Calculate the heat-loss rates of the hot-wa-ter circulating piping.
3. Calculate the circulation rates for all partsof the circulating piping and the total circu-lation rate required.
4. Determine the allowable uniform friction-headloss and the total head required to overcomefriction losses in the piping when the water isflowing at the required circulation rate.
5. Calculate the rates of flow for various pipesizes that will give the uniform pressure dropestablished in Step 4, and tabulate the re-sults.
6. Size the system based upon the tabulation
set up in Step 5.7. With the sizes as established in Step 6, re-
peat Steps 2 through 6 as a check on theassumptions made.
As a guide to sizing circulation piping andcirculation pumps, the following empirical meth-ods are given but are not recommended in lieuof the more accurate procedures outlined above:
1. An allowance of ½ gpm (0.23 L/min) is as-signed for each small hot-water riser (¾– 1in. [1.9 – 2.54 cm]), 1 gpm (2.2 L/min) for eachmedium-sized hot-water riser (1¼-1½ in.
[3.2 – 3.8 cm]), and 2 gpm (4.4 L/min) for eachlarge-sized hot-water riser (2 in.[5 cm] andlarger).
2. An allowance of 1 gpm (2.2 L/min) is assignedfor each group of 20 hot-water-supplied fix-tures.
Self-Regulating Heat-Trace Systems
A heat-trace system is an economical, energy-efficient system for domestic hot-water tempera-ture maintenance. It is a self-regulating heatingcable installed on the hot-water supply pipes un-
derneath the standard pipe insulation. The cableadjusts its power output to compensate for varia-tions in water and ambient temperatures. It produces more heat if the temperature drops andless heat if the temperature rises. The heatingcable replaces supply-pipe heat losses at thepoint where heat loss occurs, thereby providingcontinuous, energy-efficient hot-water tempera-ture maintenance and eliminating the need for a recirculating system.
A one-pipe, heat-trace system design elimi-nates the need for designing complex re-circulation systems with their pumps, piping net-
works, and complicated flow balancing, andspecial cases, such as retrofits and multiple-pres-sure zones, are simple to design.
The installation of a heat-trace system issimple. The heating cable can be cut to length,spliced, tee-branched, and terminated at the jobsite, which reduces installation costs. Also, fewer plumbing components are needed; recirculating

8/12/2019 American Society of Plumbing Engineers Volume 2
http://slidepdf.com/reader/full/american-society-of-plumbing-engineers-volume-2 192/233

8/12/2019 American Society of Plumbing Engineers Volume 2
http://slidepdf.com/reader/full/american-society-of-plumbing-engineers-volume-2 193/233
167Chapter 6— Domestic Water Heating Systems
Boiler and Pressure Vessel Inspectors (NBBPVI)and are so labeled. The designer should verify
which agency ’s standards are applicable to the water-heating system being designed and follow those standards for the sizes, types, and loca-tions of required relief valves.
Sizing Pressure and Temperature-Relief Valves
The following information applies to heaters withmore than 200,000 Btu (211 000 kJ) input:
Temperature relief valves These shall have thecapacity to prevent water temperature from ex-ceeding 210°F (99°C). They shall be water ratedon the basis of 1250 Btu (1319 kJ) for each gphof water discharged at 30 lb (13.6 kg) workingpressure and a maximum temperature of 210°F
(99°C). The temperature rating is the maximum rate
of heat input to a heater on which a tempera-ture-relief valve can be installed and isdetermined as follows:
Equation 6-7
gph water heated × 8.33 × ∆T(°F)=
Btu valve
0.8 capacity req’d
L/h water heated × 1 kg/L × ∆T(°C)
=kJ valve 0.8 capacity req’d
Pressure relief valves These shall have the ca-pacity to prevent a pressure rise in excess of 10%of the set opening pressure. They shall be set at a pressure not exceeding the working pressureof the tank or heater.
The pressure rating is the maximum output of a boiler or heater on which a pressure-relief
valve can be used and is determined as follows:
Equation 6-8
gph water heated × 8.33 × ∆T (°F) = Btu valve capacity req’d
[L/h water heated × 1.0 kg/L × ∆T (°C) = kJ valvecapacity req’d]
Determine the Btu capacity required, then refer to a manufacturer ’s catalog for valve sizeselection.
THERMAL EXPANSION
Water expands as it is heated. This expansionshall be provided for in a domestic hot-water sys-tem to avoid damage to the piping. Use of a thermal expansion tank in the cold-water pipingto the water heater will accomplish this. It isrecommended that the designer contact themanufacturer of the thermal expansion tank for information on installation and sizing. Plumb-ing codes require some type of thermal expansioncompensation — expecially when there is either a
backflow-prevention device on the cold-water service to the building or a check valve in thesystem.
Relying only on the T&P relief valve to relievethe pressure is not good practice. Many localcodes now require expansion tanks for systems
over 4-gal (8.8-L) capacity. The relevant properties of water are shown
in Table 6-3.
Example 6-4 Using Table 6-3, determine thethermal expansion of a typical residence. Assumethe initial heating cycle has incoming water at 40°F (4°C) and a temperature rise of 100°F (38°C).
The water heater is 50-gal (189-L) capacity andthe piping system volume is 10 gal (38 L).
Solution
Specific volume of water @ 40°F = 0.01602 ft3 /lb
Specific volume of water @ 140°F = 0.01629 ft3 /lb
Sv40°F
=0.01602
= 1.66% increase in volume
Sv 140°F 0.01629
Total volume = 50-gal tank + 10-gal system = 60 gal
60 gal × 1.66% volume increase = 1-gal expansion
1 gal × 8.33 lb/gal × 0.01628 ft3 /lb = 0.1356 ft3 =19.5 in.3
(Specific volume of water @ 4°C = 0.00100 m3 /kg
Specific volume of water @ 60°C = 0.00102 m3
/kg Sv 4°C
=0.00100
= 1.66% increase in volume
Sv 60°C 0.00102
Total volume = 189-L tank + 38-L system = 227 L
227 L × 1.66% volume increase = 3.79-L expansion
3.79 L × 1 kg/L × 0.0010 m3 /kg = 0.0038 m3 = 380cm3 expansion)

8/12/2019 American Society of Plumbing Engineers Volume 2
http://slidepdf.com/reader/full/american-society-of-plumbing-engineers-volume-2 194/233
ASPE Data Book — Volume 2168
Table 6-3 Thermal Properties of Water
Saturation SpecificTemperature Pressure Volume Density Weight Specific Heat
°F °C psig kPa ft3 / lb m3 / kg lb / ft3 kg / m3 lb / gal kg / m3 Btu / lb-°F-h J / kg-°C-h
32 0.0 29.8 3 019.6 0.01602 0.00100 62.42 999.87 8.345 1001.40 1.0093 4225.74
40 4.4 29.7 3 009.5 0.01602 0.00100 62.42 999.87 8.345 1001.40 1.0048 4206.90
50 10.0 29.6 2 999.4 0.01603 0.00100 62.38 999.23 8.340 1000.80 1.0015 4193.08
60 15.5 29.5 2 989.2 0.01604 0.00100 62.34 998.59 8.334 1000.08 0.9995 4184.71
70 21.1 29.3 2 969.0 0.01606 0.00100 62.27 997.47 8.325 999.00 0.9982 4179.26
80 26.7 28.9 2 928.4 0.01608 0.00100 62.19 996.19 8.314 997.68 0.9975 4176.33
90 32.2 28.6 2 898.0 0.01610 0.00100 62.11 994.91 8.303 996.36 0.9971 4174.66
100 37.8 28.1 2 847.4 0.01613 0.00101 62.00 993.14 8.289 994.68 0.9970 4174.24
110 43.3 27.4 2 776.4 0.01617 0.00101 61.84 990.58 8.267 992.04 0.9971 4174.66
120 48.9 26.6 2 695.4 0.01620 0.00101 61.73 988.82 8.253 990.36 0.9974 4175.91
130 54.4 25.5 2 583.9 0.01625 0.00101 61.54 985.78 8.227 987.24 0.9978 4177.59
140 60.0 24.1 2 442.1 0.01629 0.00102 61.39 983.37 8.207 984.84 0.9984 4180.10
150 65.6 22.4 2 269.8 0.01634 0.00102 61.20 980.33 8.182 981.84 0.9990 4182.61
160 71.1 20.3 2 057.0 0.01639 0.00102 61.01 977.29 8.156 978.72 0.9998 4185.96
170 76.7 17.8 1 803.7 0.01645 0.00103 60.79 973.76 8.127 975.24 1.0007 4189.73
180 82.2 14.7 1 489.6 0.01651 0.00103 60.57 970.24 8.098 971.76 1.0017 4193.92
190 87.8 10.9 1 104.5 0.01657 0.00103 60.35 966.71 8.068 968.16 1.0028 4198.52
200 93.3 6.5 658.6 0.01663 0.00104 60.13 963.19 8.039 964.68 1.0039 4203.13
210 98.9 1.2 121.6 0.01670 0.00104 59.88 959.19 8.005 960.60 1.0052 4208.57
212 100.0 0.0 0.0 0.01672 0.00104 59.81 958.06 7.996 959.52 1.0055 4209.83
220 104.4 2.5 253.3 0.01677 0.00105 59.63 955.18 7.972 956.64 1.0068 4215.27
240 115.6 10.3 1 043.7 0.01692 0.00106 59.10 946.69 7.901 948.12 1.0104 4230.34
260 126.7 20.7 2 097.5 0.01709 0.00107 58.51 937.24 7.822 938.64 1.0148 4248.76
280 137.8 34.5 3 495.9 0.01726 0.00108 57.94 928.11 7.746 929.52 1.0200 4270.54
300 148.9 52.3 5 299.6 0.01745 0.00109 57.31 918.02 7.662 919.44 1.0260 4295.66
350 176.7 119.9 12 149.5 0.01799 0.00112 55.59 890.47 7.432 891.84 1.0440 4371.02
400 204.4 232.6 23 569.4 0.01864 0.00116 55.63 891.11 7.172 860.64 1.0670 4467.32
450 232.2 407.9 41 332.5 0.01940 0.00121 51.55 825.75 6.892 827.04 1.0950 4584.55
500 260.0 666.1 67 495.9 0.02040 0.00127 49.02 785.22 6.553 786.36 1.1300 4731.08
550 287.8 1030.5 104 420.6 0.02180 0.00136 45.87 734.77 6.132 735.84 1.2000 5024.16
600 315.6 1528.2 154 852.5 0.02360 0.00147 42.37 678.70 5.664 679.68 1.3620 5702.42
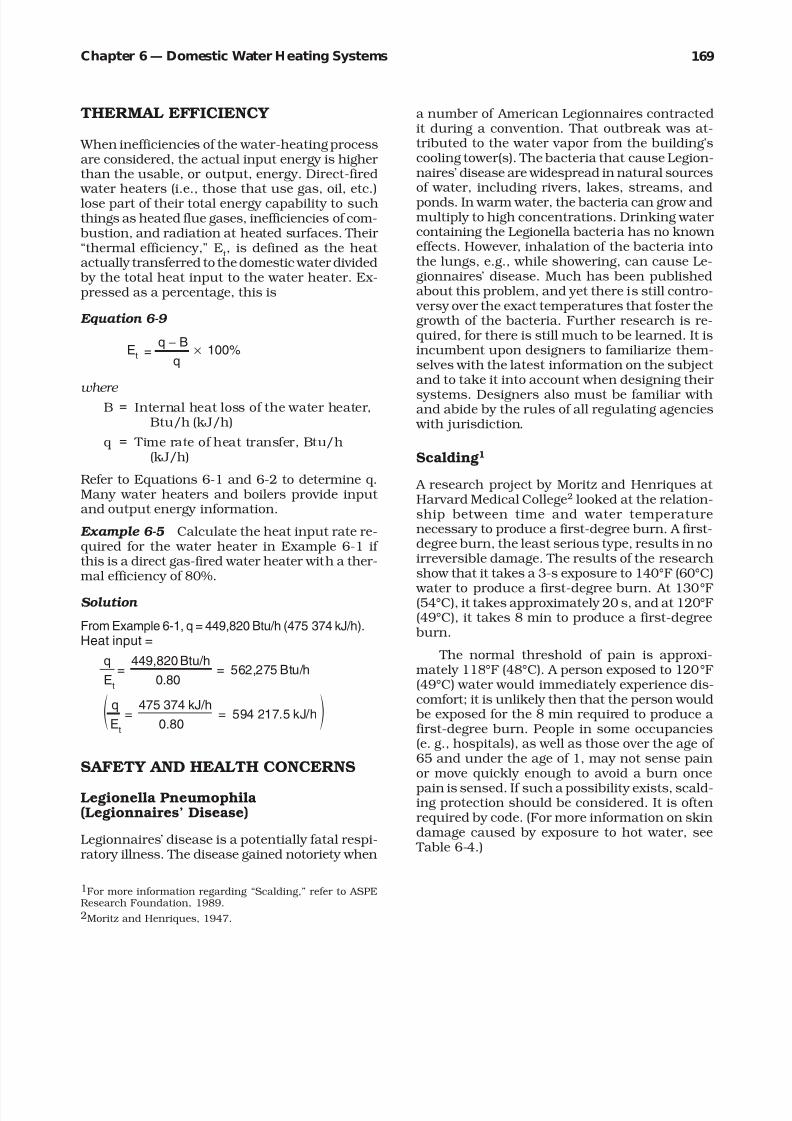
8/12/2019 American Society of Plumbing Engineers Volume 2
http://slidepdf.com/reader/full/american-society-of-plumbing-engineers-volume-2 195/233
169Chapter 6— Domestic Water Heating Systems
THERMAL EFFICIENCY
When inefficiencies of the water-heating processare considered, the actual input energy is higher than the usable, or output, energy. Direct-fired
water heaters (i.e., those that use gas, oil, etc.)lose part of their total energy capability to suchthings as heated flue gases, inefficiencies of com-
bustion, and radiation at heated surfaces. Their “thermal efficiency,” Et , is defined as the heat actually transferred to the domestic water divided
by the total heat input to the water heater. Ex-pressed as a percentage, this is
Equation 6-9
Et =q − B
× 100%q
where B = Internal heat loss of the water heater,
Btu/h (kJ/h)
q = Time rate of heat transfer, Btu/h(kJ/h)
Refer to Equations 6-1 and 6-2 to determine q.Many water heaters and boilers provide input and output energy information.
Example 6-5 Calculate the heat input rate re-quired for the water heater in Example 6-1 if this is a direct gas-fired water heater with a ther-mal efficiency of 80%.
Solution
From Example 6-1, q = 449,820 Btu/h (475 374 kJ/h).Heat input =
q=
449,820 Btu/h= 562,275 Btu/h
Et
0.80
q
=475 374 kJ/h
= 594 217.5 kJ/h
Et
0.80
SAFETY AND HEALTH CONCERNS
Legionella Pneumophila (Legionnaires’ Disease)
Legionnaires’ disease is a potentially fatal respi-ratory illness. The disease gained notoriety when
1For more information regarding “Scalding,” refer to ASPEResearch Foundation, 1989.2Moritz and Henriques, 1947.
a number of American Legionnaires contractedit during a convention. That outbreak was at-tributed to the water vapor from the building’scooling tower(s). The bacteria that cause Legion-naires’ disease are widespread in natural sourcesof water, including rivers, lakes, streams, andponds. In warm water, the bacteria can grow andmultiply to high concentrations. Drinking water containing the Legionella bacteria has no knowneffects. However, inhalation of the bacteria intothe lungs, e.g., while showering, can cause Le-gionnaires’ disease. Much has been publishedabout this problem, and yet there is still contro-
versy over the exact temperatures that foster thegrowth of the bacteria. Further research is re-quired, for there is still much to be learned. It isincumbent upon designers to familiarize them-selves with the latest information on the subject and to take it into account when designing their
systems. Designers also must be familiar withand abide by the rules of all regulating agencies
with jurisdiction.
Scalding1
A research project by Moritz and Henriques at Harvard Medical College2 looked at the relation-ship between time and water temperaturenecessary to produce a first-degree burn. A first-degree burn, the least serious type, results in noirreversible damage. The results of the researchshow that it takes a 3-s exposure to 140°F (60°C)
water to produce a first-degree burn. At 130°F (54°C), it takes approximately 20 s, and at 120°F (49°C), it takes 8 min to produce a first-degree
burn.
The normal threshold of pain is approxi-mately 118°F (48°C). A person exposed to 120°F (49°C) water would immediately experience dis-comfort; it is unlikely then that the person would
be exposed for the 8 min required to produce a first-degree burn. People in some occupancies(e. g., hospitals), as well as those over the age of 65 and under the age of 1, may not sense painor move quickly enough to avoid a burn once
pain is sensed. If such a possibility exists, scald-ing protection should be considered. It is oftenrequired by code. (For more information on skindamage caused by exposure to hot water, see
Table 6-4.)

8/12/2019 American Society of Plumbing Engineers Volume 2
http://slidepdf.com/reader/full/american-society-of-plumbing-engineers-volume-2 196/233

8/12/2019 American Society of Plumbing Engineers Volume 2
http://slidepdf.com/reader/full/american-society-of-plumbing-engineers-volume-2 197/233

8/12/2019 American Society of Plumbing Engineers Volume 2
http://slidepdf.com/reader/full/american-society-of-plumbing-engineers-volume-2 198/233

8/12/2019 American Society of Plumbing Engineers Volume 2
http://slidepdf.com/reader/full/american-society-of-plumbing-engineers-volume-2 199/233
173Chapter 7— Fuel-Gas Piping Systems
Fuel-Gas
PipingSystems7LOW AND MEDIUM-PRESSURE
NATURAL GAS SYSTEMS
The composition, specific gravity, and heating value of natural gas vary depending upon the well (or field) from which the gas is gathered.Natural gas is a mixture of gases, most of whichare hydrocarbons, and the predominant hydro-carbon is methane. Some natural gases containsignificant quantities of nitrogen, carbon diox-ide, or sulfur (usually as H2S). Natural gasescontaining sulfur or carbon dioxide are apt to becorrosive. These corrosive substances are usu-ally eliminated by treatment of the natural gas
before it is transmitted to the customers. Readily condensable petroleum gases are also usually extracted before the natural gas is put into thepipeline to prevent condensation during trans-mission.
The specific gravity of natural gas varies from0.55 to 1.0 and the heating value varies from900 to 1100 Btu/ft 3 (33.9 to 41.5 mJ/m3). Natu-ral gas is nominally rated at 1000 Btu/ft 3 (37.7
J/m3), manufactured gas is nominally rated at 520 Btu/ft 3 (20 mJ/m3), and mixed gas is nomi-nally rated at 800 Btu/ft 3 (30.1 mJ/m3). Liquefiedpetroleum gases (LPG) are nominally rated at
2500 Btu/ft 3 (94.1 mJ/m3). Natural gas is trans-mitted from the fields to the local marketing anddistribution systems at very high pressures, usu-ally in the range of 500 to 1000 psi (3447.4 to6894.8 kPa). Local distribution systems are at much lower pressures. The plumbing engineer should determine the specific gravity, pressure,and heating value of the gas from the utility com-pany or LPG provider serving the project area.
This chapter covers fuel-gas systems on con-
sumers’ premises — that is, upstream anddownstream from the gas supplier ’s meter set assembly — and includes system design and ap-pliance gas usage, gas train venting, ventilation,and combustion air requirements. Since natu-ral gas is a depletable energy resource, theengineer should design for its efficient use. Thedirect utilization of natural gas is preferable tothe use of electrical energy when electricity isobtained from the combustion of gas or oil. How-ever, in many areas, the gas supplier and/or governmental agencies may impose regulationsthat restrict the use of natural gas. Refer to the
chapter “Energy Conservation in Plumbing Sys-tems,” in Data Book Volume 1, for informationon appliance efficiencies and energy conserva-tion recommendations.
Design Considerations
The energy available in 1 cubic foot (cubic meter)of natural gas, at atmospheric pressure, is calledthe “heating (or caloric) value.” The flow of gas,expressed in cubic feet per hour (cfh) or cubicmeters per hour (m3/h), in the distribution pip-ing depends on the amount of gas being
consumed by the appliances. This quantity of gas depends on the requirements of the appli-ances. For example, 33,200 Btu/h (35 mJ/h) arerequired to raise the temperature of 40 gal (151.4L) of water from 40 to 140°F (4.4 to 60°C) in 1hour. This value is obtained as follows:
Equation 7-1
Q = m × Cp × ∆T

8/12/2019 American Society of Plumbing Engineers Volume 2
http://slidepdf.com/reader/full/american-society-of-plumbing-engineers-volume-2 200/233
ASPE Data Book — Volume 2174
where
Q = Energy required, Btu/h (J/h)
m = Mass flow, gal/h (L/h)
Cp = Specific heat of water, 1 Btu/°F (J/°C)
∆ T = Temperature rise, °F (°C)Q = (40 gal/h)(8.33 lb/gal)(1 Btu/lb-°F)(100°F) =
33,320 Btu/h
[Q = (151 L/h)(1 kg/L)(6.1 kJ/kg-°C)(38°C) =35 MJ/h]
If the water heater in this case is 80% effi-cient, then 41,650 Btu/h (43.8 mJ/h) of gas will
be needed at the appliance’s burner (33,320 Btu/h/.80). If natural gas with a heating value of 1000Btu/ft 3 (37.7 mJ/m3) serves the appliance, thepiping system must supply 41.7 cfh (1.2 m3/h)of gas to the appliance with adequate pressure
to allow proper burner operation. The formula for the flow rate of gas is shown below:
Equation 7-2
Q =Output
(Eff × HV)
where
Q = Gas flow rate, cfh (m3/h)
Output = Appliance’s output, Btu/h (J/h)
Eff = Appliance’s efficiency, %
HV = Heating value of the fuel gas,
Btu/ft 3
(J/m3
) The difference between the input and the out-
put is the heat lost in the burner, the heat exchanger, and the flue gases. Water heating andspace heating equipment is usually 75 to 85%efficient, and ratings are given for both input andoutput. Cooking and laundry equipment is usu-ally 75 to 85% efficient, and ratings are given for
both input and output. However, cooking andlaundry equipment is usually rated only by itsinput requirements. When the input required for the appliance is known, Equation 7-2 is ex-pressed as follows:
Equation 7-3
Q =Input
HV
where
Q = Gas flow rate, cfh (m3/h)
Input = Appliance’s input, Btu/h (J/h)
HV = Heating value of the fuel gas,
Btu/ft 3 (J/m3)
When the exact data on the appliance’s gasusage is unavailable from the equipment manu-facturer, Table 7-1 can be used to obtain theapproximate requirements for common appli-
ances. The gas pressure in the piping system down-
stream of the meter is usually 5 to 14 in. (127 to355.6 mm) of water column (wc). Design prac-tice limits the pressure losses in the piping to0.5 in. (12.7 mm) wc, or less than 10%, when 5to 14 in. (127 to 355.6 mm) wc is available at themeter outlet. However, local codes may dictate a more stringent pressure drop maximum; theseshould be consulted before the system is sized.Most appliances require approximately 5 in.(127mm) wc; however, the designer must beaware that large appliances, such as boilers, may
require higher gas pressures to operate properly. Where appliances require higher pressures or where long distribution lines are involved, it may be necessary to use higher pressures at the meter outlet to satisfy the appliance requirements or provide for greater pressure losses in the pipingsystem. If greater pressure at the meter outlet can be attained, a greater pressure drop can beallowed in the piping system. If the greater pres-sure drop design can be used, a more economicalpiping system is possible. Systems are often de-signed with meter outlet pressures of 3 to 5 psi(20.7 to 34.5 kPa) and with pressure regulators
to reduce the pressure for appliances as required. The designer has to allow for the venting of suchregulators, often to the atmosphere, when they are installed within buildings.
When bottled gas is used, the tank can haveas much as 150 psi (1044.6 kPa) pressure, to bereduced to the burner design pressure of 11 in.(279.4 mm) wc. The regulator is normally locatedat the tank for this pressure reduction.
To size the gas piping for a distribution sys-tem, the designer must determine the followingitems:
1. The appliance requirements, including thegas consumption, pressure, and pipe size re-quired at the appliance connection (totalconnected load). Is the appliance provided
with a pressure regulator?
2. The piping layout, showing the length of (hori-zontal and vertical) piping, number of fittingsand valves, and number of appliances.

8/12/2019 American Society of Plumbing Engineers Volume 2
http://slidepdf.com/reader/full/american-society-of-plumbing-engineers-volume-2 201/233
175Chapter 7— Fuel-Gas Piping Systems
Table 7-1 Approximate Gas Demand for Common Appliancesa
Appliance Input, Btu/h (mJ/h)
Commercial kitchen equipment
Small broiler 30,000 (31.7)Large broiler 60,000 (63.3)
Combination broiler and roaster 66,000 (69.6)
Coffee maker, 3-burner 18,000 (19)
Coffee maker, 4-burner 24,000 (25.3)
Deep fat fryer, 45 lb (20.4 kg) of fat 50,000 (52.8)
Deep fat fryer, 75 lb (34.1 kg) of fat 75,000 (79.1)
Doughnut fryer, 200 lb (90.8 kg) of fat 72,000 (76)
2-deck baking and roasting oven 100,000 (105.5)
3-deck baking oven 96,000 (101.3)
Revolving oven, 4 or 5 trays 210,000 (221.6)
Range with hot top and oven 90,000 (95)
Range with hot top 45,000 (47.5)
Range with fry top and oven 100,000 (105.5)
Range with fry top 50,000 (52.8)
Coffee urn, single, 5-gal (18.9 L) 28,000 (29.5)
Coffee urn, twin, 10-gal. (37.9 L) 56,000 (59.1)
Coffee urn, twin, 15-gal (56.8 L) 84,000 (88.6)
Stackable convection oven, per section of oven 60,000 (63.3)
Residential equipment Clothes dryer (Type I) 35,000 (36.9)
Range 65,000 (68.6)
Stove-top burners (each) 40,000 (42.2)
Oven 25,000 (26.4)
30-gal (113.6-L) water heater 30,000 (31.7)
40 to 50-gal (151.4 to 189.3-L) water heater 50,000 (52.8)
Log lighter 25,000 (26.4)
Barbecue 50,000 (52.8)
Miscellaneous equipment
Commercial log lighter 50,000 (52.8)
Bunsen burner 5,000 (5.3)
Gas engine, per horsepower (745.7 W) 10,000 (10.6)
Steam boiler, per horsepower (745.7 W) 50,000 (52.8)
Commercial clothes dryer (Type 2) See manufacturer’s data.
aThe values given in this table should be used only when the manufacturer ’s data are not available.

8/12/2019 American Society of Plumbing Engineers Volume 2
http://slidepdf.com/reader/full/american-society-of-plumbing-engineers-volume-2 202/233
ASPE Data Book — Volume 2176
3. The fuel gas to be supplied, where and by whom; also the specific gravity and heating value of the fuel gas and the pressure to beprovided at the meter outlet.
4. The allowable pressure loss from the meter
to the appliances.5. The diversity factor — the number of appli-
ances operating at one time compared to thetotal number of connected appliances. Thisshould be provided by the owner and/or user.
Standard engineering methods may be usedto determine pipe sizes for a system, or the ac-ceptable capacity/pipe size tables may be used
when such tables are available for the specificoperating conditions of the system under con-sideration. The diversity factor is an important item when determining the most practical pipesizes to be used in occupancies such as mul-tiple-family dwellings. It is dependent on the typeand number of gas appliances being installed.Refer to the “pipe sizing” section later in thischapter.
The most common material used for gas pip-ing is black steel; however, many other materialsare utilized, including copper, wrought iron, plas-tic, brass, and aluminum alloy. The proper material to be used depends on the specificinstallation conditions and local code limitations.
Any condition that could be detrimental to theintegrity of the piping system must be avoided.
Corrosion and physical damage are the most ob- vious causes of pipe failure. The piping materialitself and/or the provisions taken for the protec-tion of the piping material must prevent thepossibility of pipe failure. Corrosion can occur
because of electrolysis or because a corrosive ma-terial is in contact with either the exterior or theinterior surface of the piping.
Coatings are commonly applied to buried me-tallic pipe to prevent corrosion of the exterior surface. The gas supplier should be contacted todetermine if the gas contains any corrosive ma-terial, such as moisture, hydrogen sulfide (H2S),
or carbon dioxide (CO2). Due to the grave conse-quences of leakage in the gas piping system, thedesigner must carefully consider the piping ma-terial to be used and the means to protect thepiping and protect against leaks.
Gas piping should be installed only in safelocations. Buried piping should be installed deepenough to protect the pipe from physical dam-age. When piping is installed in concealed spaces,
care should be taken so that, in the event of gasleakage, gas will not accumulate in the concealedspace. The installation of gas piping in anunventilated space under a building should beavoided. Such conditions have resulted in disas-trous explosions. A gas leak anywhere along thelength of a buried pipe can flow in the annular space around the pipe and accumulate in a cavity under the building. Ignition of this accumulatedgas can result in an explosion. For this reason,it is best to try to locate the gas main above gradeat the point of entrance into the building. If thisis not feasible, the main can be installed in a
ventilated sleeve (containment pipe). The designer should carefully detail this installation so that leaked gas will be harmlessly vented to the at-mosphere and not accumulated in the building.Gas piping should be located where it will not besubject to damage by such things as vehicles,
forklifts, cranes, machinery, or occupants. Sup-port of piping should be in accordance with codesand as described in the chapter “Hangers andSupports,” in Data Book Volume 4 (forthcoming).
Valves, controls, pressure regulators, andsafety devices used in gas systems should bedesigned and approved for such use. Shut-off
valves should be installed in accessible locationsand near each appliance, with a union betweenthe valve and the appliance. Shut-off valvesshould be of the plug or cock type with a lever handle. Larger sizes should be of the lubricatedplug type. The quarter-turn lever handle provides
visual indication of whether the valve is openedor closed. An approved assembly of semirigid or flexible tubing and fittings, referred to as an “ap-pliance connector,” is sometimes used to connect the piping outlet to the appliance. Appliance con-nectors are rated by capacity, based on a specifiedpressure, flow, and pressure drop.
Laboratory Gas
Natural gas or propane gas is used in laborato-ries at lab benches for Bunsen burners and other minor users. Typical Bunsen burners consume
either 5000 cfh (141.6 m3/h) (small burners) or 10,000 cfh (283.2 m3/h) (large burners). Themaximum pressure at the burner should not exceed 14 in. wc (355.6 mm wc).
The gas distribution piping should be sizedin the manner discussed later in this chapter;however, the following diversities may be applied:

8/12/2019 American Society of Plumbing Engineers Volume 2
http://slidepdf.com/reader/full/american-society-of-plumbing-engineers-volume-2 203/233
177Chapter 7— Fuel-Gas Piping Systems
MinimumFlow,
Number of Outlets Use Factor cfh (m3 /h)
1–8 100 9 (0.26)
9–16 90 15 (0.43)
17–29 80 24 (0.68)30–79 60 48 (1.36)
80–162 50 82 (2.32)
163–325 45 107 (3.03)
326–742 40 131 (3.71)
743–1570 30 260 (7.36)
1571–2900 25 472 (13.37)
2901 and up 20 726 (20.56)
Branch piping that serves one or two labora-tories should be sized for 100% usage regardlessof the number of outlets. Use factors should be
modified to suit special conditions and must beused with judgment after consultation with theowner and/or user.
Some local codes require that laboratory gassystems, especially those in schools or universi-ties, be supplied with emergency gas shut-off
valves on the supply to each laboratory. The valveshould be normally closed and opened only whenthe gas is being used. It should be located insidethe laboratory and used in conjunction with shut-off valves at the benches or equipment, whichmay be required by other codes. The designer should ensure that locations meet local code re-
quirements. Where compressed air is also supplied to the
laboratory, aluminum check valves should beprovided on the supply to the laboratory to pre-
vent air from being injected back into the gassystem. An alternative to aluminum check valvesis gas turrets with integral check valves.
Gas Train Vents
Guidelines for the use of vents from pressureregulators, also referred to as “gas-train vents,”can be found in the latest editions of NFPA 54
and Factory Mutual (FM) Loss Prevention Data Sheet 6-4 , as well as in other publications of in-dustry standards, such as those issued by Industrial Risk Insurers (IRI) and the AmericanGas Association (AGA). As a practical matter,many boiler manufacturers can provide resourcematerials, such as gas-train venting schemes,that reference standards organizations. Factorsthat determine which standard to reference are
based upon the input (Btu/h) and the owner ’s
insurance underwriter. The plumbing designer must be aware of the existence of these stan-dards — especially when designing piping for
boilers with input capacities of 2,500,000 Btu/h(732 kW) or more that are not listed by a nation-ally recognized testing laboratory agency, e.g.,equipment that does not bear a UL label or haveFactory Mutual Research Corporation (FMRC)approval listing.
Industrial-boiler gas trains often requiremultiple, piped, gas-train vents to the atmo-sphere. These are usually ¾ in., and the materialused should follow the classification as specifiedin NFPA 54 under the heading “Gas Piping Sys-tem Design, Materials, and Components.” Wheremultiple gas-train vents are indicated, each shallrun independently to the atmosphere. Care must
be exercised in the location of the termination
points of these pipes. Vent pipes should termi-nate with 90° ells turned down vertically and beprotected with an insect screen over the outlet.
It should be noted that when the pressureregulators activate they can release largeamounts of fuel gas. It is not uncommon for a local fire department to be sumoned to investi-gate an odor of gas caused by a gas-train vent discharge. Every attempt should be made to lo-cate the terminal point of the vents above theline of the roof and away from doors, windows,and fresh-air intakes. It should also be locatedon a side of the building that is not protected
from the wind. Refer to NFPA 54 and local codesfor vent locations.
Appliances
Most manufacturers of gas appliances rate their equipment by the gas consumption values that are used to determine the maximum gas flow rate in the piping. Table 7-1 shows the approxi-mate gas consumption for some commonappliances.
The products of combustion from an appli-ance must be safely exhausted to the outside. This
is accomplished with a gas vent system in most cases. Where an appliance has a very low rate of gas consumption (e.g., Bunsen burner or counter-top coffee maker) or where an appliance has anexhaust system associated with the appliance(e.g., gas clothes dryer or range), and the roomsize and ventilation are adequate, a gas vent sys-tem may not be required. Current practice usually dictates the use of factory-fabricated and listed

8/12/2019 American Society of Plumbing Engineers Volume 2
http://slidepdf.com/reader/full/american-society-of-plumbing-engineers-volume-2 204/233
ASPE Data Book — Volume 2178
vents for small to medium-sized appliances. Largeappliances and equipment may require specially designed venting or exhaust systems.
For proper operation, the gas vent systemmust satisfy the appliance draft and building
safety requirements. To meet these conditions,consideration of combustion and ventilation air supplies, draft hood dilution, startup conditions,flue gas temperatures, oxygen depletion, exter-nal wind conditions, and pollution dispersion isrequired. For example, appliances equipped withdraft hoods need excess vent capacity to draw inthe draft hood dilution air and prevent draft hoodspillage. Inadequate combustion air supply cancause oxygen depletion and inadequate firing.
This condition can create a safety hazard becauseof a combination of draft hood spillage and inad-equate flue gas removal. The motive force
exhausting flue gases from an appliance can begravity (a natural draft due to the difference indensities between hot flue gases and ambient air) or mechanical (induced-draft fan or forced-draft fan). The motive force involved affects thesize and configurations that may safely be ap-plied to a vent system. The designer is referredto the chapter on gas vent systems of the localmechanical or plumbing code and to the data developed by the manufacturers of gas vents for sizing information. Due to the fact that many codes require that appliances conform to an ap-proved standard, such as the American Gas
Association (AGA), a simple approach to the de-sign of vent systems can be as follows:
1. The vent system conforms to the manu-facturer ’s instructions and the terms of thelisting.
2. The gravity vents cannot exceed certain hori-zontal lengths, must exceed certain minimumslopes upward to their vertical chimneys, andcannot terminate less than 5 ft (1.5 m) abovethe appliance outlet.
3. The vent size cannot be smaller than the vent connector collar size of the appliance.
4. The size of a single vent that services morethan one appliance must not be less thanthe area of the largest vent connector servedplus 50% of the areas of the additional vent connectors.
Since vent chimney heights and flue gas tem-peratures determine the theoretical draft, thereare many situations where the above approach
will produce oversized vent systems. Whatever
approach is used, a great deal of care must betaken when designing vents that are horizontal.It is recommended that every system be engi-neered and checked for compliance with codes.
A conservative design is warranted in light of the hazards involved.
Combustion air is required for the proper operation of gas appliances. In addition to thetheoretical amount of air required for combus-tion, excess air is necessary to assure completecombustion. Approximately 1 ft 3 (0.03 m3) of air at standard conditions is needed for each 100Btu (1055 J) of fuel burned. Air is also requiredfor the dilution of flue gases when draft hoodsare provided. Some additional amount of air isalso needed for ventilation of the equipment room. This air for combustion, dilution, and ven-tilation is usually supplied by permanent
openings or ducts connected to the outdoors. Twoopenings should be supplied. One opening should be high (above the draft hood inlet) and the other opening should be low (below the combustionair inlet to the appliance). The size of these open-ings can be determined by standard engineeringmethods, based on the air balance in the equip-ment room and taking into account the energy (natural draft or mechanical) available to draw air into the room; however, these must comply
with codes, which usually give more conserva-tive opening sizes, based on the area of theopening required per Btu (J) of gas consumed.
Gas Boosters
Definition A “gas booster ” is a mechanical pieceof equipment that increases the pressure of gasfor the purpose of meeting equipment or func-tional demands. It is used when there isinsufficient pressure available from the gas utility or LPG storage device to supply the necessary pres-sure to the equipment at hand. It is important tonote that the gas service must be capable of the
volumetric flow rate required at the boosted level. A booster cannot overcome an inadequate volu-metric supply. (See “Sizing a Gas Booster ” below.)
Gas boosters for natural or liquefied petroleumgas Boosters for natural or utility-supplied gasare hermetically sealed and are equipped to de-liver a volumetric flow rate (user defined but withinthe booster ’s rated capacity) to an elevated pres-sure beyond the supply pressure. The outlet pressure usually remains at a constant differen-tial above the supply pressure within a reasonablerange. The discharge pressure is the sum of the

8/12/2019 American Society of Plumbing Engineers Volume 2
http://slidepdf.com/reader/full/american-society-of-plumbing-engineers-volume-2 205/233
179Chapter 7— Fuel-Gas Piping Systems
incoming gas pressure and the booster-added pres-sure at the chosen flow rate . The incoming gaspressure usually has an upper safety limit as stipu-lated by the hermetic gas booster manufacturer.
Therefore, in the engineering literature from themanufacturer, the engineer may find cautions or
warnings about the upper limits of incoming pres-sure, usually about 5 psi (34.5 kPa).
Materials of construction
Housing and rotor Boosters used for fuel gasmust be UL listed for the specific duty intendedand shall be hermetically sealed. Casings onstandard boosters are usually constructed of carbon steel, depending on the equipment sup-plier. Booster casings are also available instainless steel and aluminum. Inlet and outlet connections are threaded or flanged, depending
on the pipe size connection and the manufac-turer selected, and the casings are constructedleak tight. Drive impellers are contained withinthe casing and always manufactured of a spark-resistant material such as aluminum.
Discharge type check valves are furnished onthe booster inlet and on the booster bypass. It isimportant that these checks are listed and ap-proved for use on the gas stream at hand. Thefan, control panel, valves, piping, and interelec-trical connections can be specified as a skid-mounted package at the discretion of thedesigner. This allows for UL listing of the entire
package rather than of individual components.Electrical components Motor housings for gas-booster systems are designed for explosion-proof (XP) construction and are rated per NEMA Class 1, Division 1, Group D classification withthermal overload protection. A factory UL listed
junction box with a protected, sealed inlet is nec-essary for wiring connections.
Other electrical ancillary equipment Boost-ers are equipped with low-pressure switches that monitor the incoming gas pressure. The switchis designed to shut down the booster should the
utility-supplied pressure fall below a preset limit. The set point is usually about 3 in. (80 mm) wa-ter column (wc), but the designer should verify the limit with the local gas provider. The switchmust be UL listed for use with the gas service at hand. When the switch opens, it de-energizesthe motor control circuit and simultaneously outputs both audible and visual signals, whichrequire manual resetting. The booster can be
equipped with an optional hi/low gas-pressureswitch. This feature equips the booster to runonly when adequate supply pressure is available.
The switch shuts the booster down at the maxi-mum discharge set-point pressure at the output line pressure.
Minimum gas flow Gas boosters normally re-quire a minimum gas flow that serves as aninternal cooling medium. For example, a booster sized at a flow rate of 10,000 cfh (283.2 m3/h)
will have an inherent minimum turndown basedon the minimum flow required to cool the unit.
This rate, in the example, may be, say 2000 cfh(566.3 m3/h) (see Figure 7-2). Should the unit
be required to run below this turndown rate, ad-ditional supplemental cooling systems must beincorporated into the booster design. The heat exchangers normally rated for this use are wa-
ter cooled.
Intrinsic safety Electrical connections aremade through a sealed, explosion-proof conduit to the XP junction box on the booster unit. Con-trol panels are rated NEMA 4 for outdoor useand NEMA 12 for indoor use unless the booster system is to be located in a hazardous area, whichmay have additional requirements. The panel,as an assembly, must display a UL label specificfor its intended use.
Gas laws
Pressure-volume relationships The gas lawsapply to the relationship of the incoming gas sup-ply and the boosted service. The standard law for compressed gas relationships is as follows:
Equation 7-4
PV = RT
where
P = Pressure, psi or in. wc(kPa or mm wc)
V = Volume, cfh (m3/h)
R = Constant for the gas-air mixtureused
T = Temperature, °F (°C)
Usually the temperature of the gas remainsrelatively constant and can therefore be ignoredin the relationship. Therefore, the pressure timesthe volume is proportional to a constant R. Fur-ther, the pressure/volume ratios before and after the booster are proportional, that is:
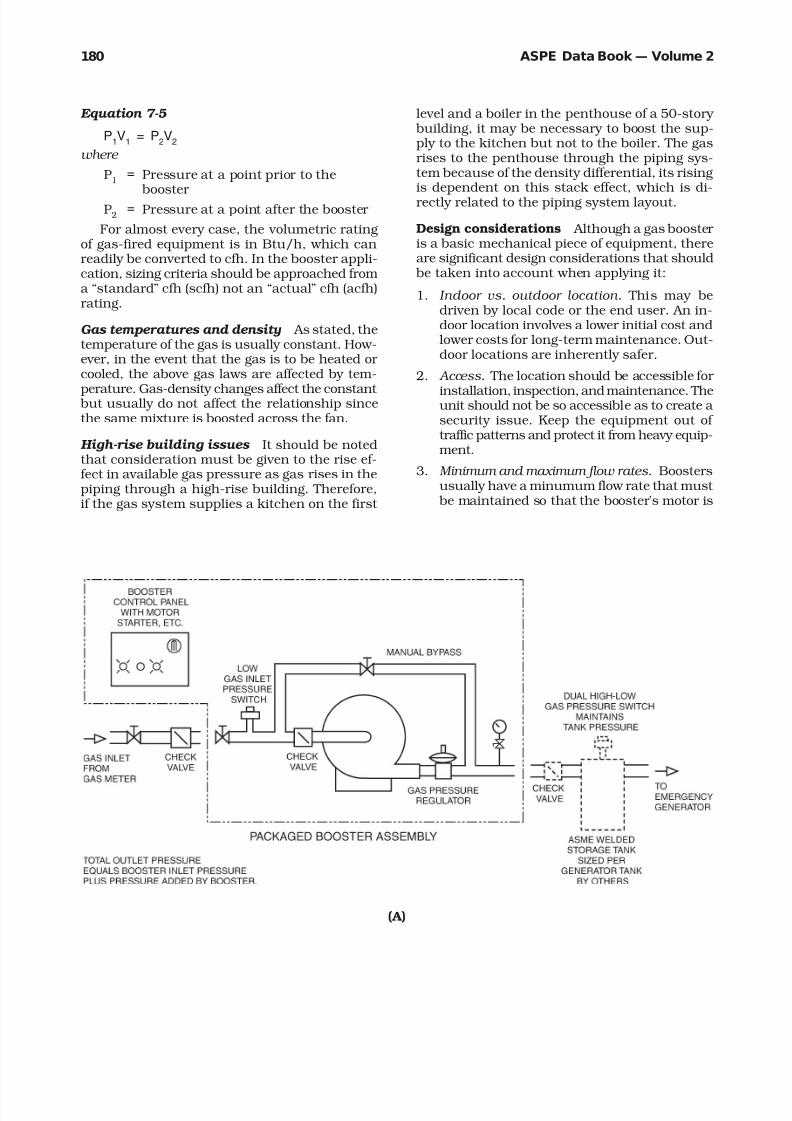
8/12/2019 American Society of Plumbing Engineers Volume 2
http://slidepdf.com/reader/full/american-society-of-plumbing-engineers-volume-2 206/233

8/12/2019 American Society of Plumbing Engineers Volume 2
http://slidepdf.com/reader/full/american-society-of-plumbing-engineers-volume-2 207/233
181Chapter 7— Fuel-Gas Piping Systems
(B)
(C)
Figure 7-1 Variations of a Basic Simplex Booster System: (A) Standby Generator Application with Accumulator Tank Having a Limitation on Maximum Pressure,
(B) Dual Booster System for Critical Systems Like Those in Hospitals,(C) Heat Exchanger Loop Example — Required for High Flow Range with Low Minimum Flow.
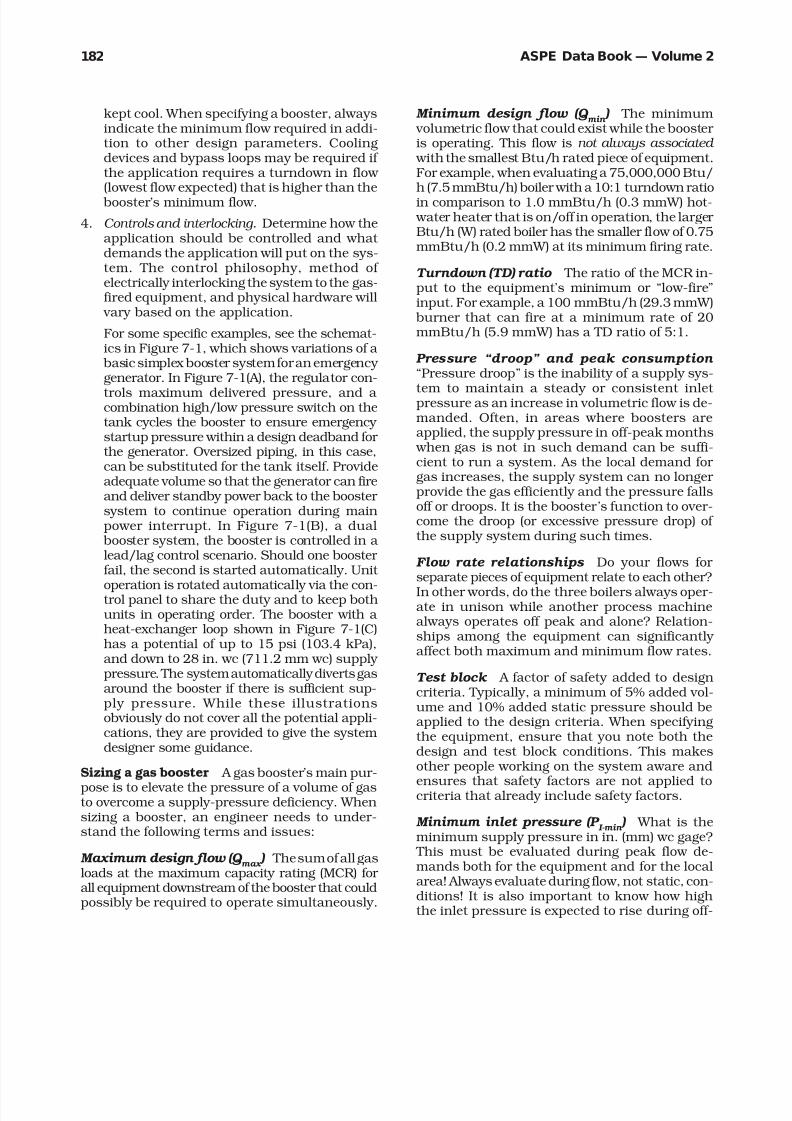
8/12/2019 American Society of Plumbing Engineers Volume 2
http://slidepdf.com/reader/full/american-society-of-plumbing-engineers-volume-2 208/233
ASPE Data Book — Volume 2182
kept cool. When specifying a booster, alwaysindicate the minimum flow required in addi-tion to other design parameters. Coolingdevices and bypass loops may be required if the application requires a turndown in flow (lowest flow expected) that is higher than the
booster ’s minimum flow.
4. Controls and interlocking. Determine how theapplication should be controlled and what demands the application will put on the sys-tem. The control philosophy, method of electrically interlocking the system to the gas-fired equipment, and physical hardware will
vary based on the application.
For some specific examples, see the schemat-ics in Figure 7-1, which shows variations of a
basic simplex booster system for an emergency generator. In Figure 7-1(A), the regulator con-
trols maximum delivered pressure, and a combination high/low pressure switch on thetank cycles the booster to ensure emergency startup pressure within a design deadband for the generator. Oversized piping, in this case,can be substituted for the tank itself. Provideadequate volume so that the generator can fireand deliver standby power back to the booster system to continue operation during mainpower interrupt. In Figure 7-1(B), a dual
booster system, the booster is controlled in a lead/lag control scenario. Should one booster fail, the second is started automatically. Unit
operation is rotated automatically via the con-trol panel to share the duty and to keep bothunits in operating order. The booster with a heat-exchanger loop shown in Figure 7-1(C)has a potential of up to 15 psi (103.4 kPa),and down to 28 in. wc (711.2 mm wc) supply pressure. The system automatically diverts gasaround the booster if there is sufficient sup-ply pressure. While these illustrationsobviously do not cover all the potential appli-cations, they are provided to give the systemdesigner some guidance.
Sizing a gas booster A gas booster ’s main pur-
pose is to elevate the pressure of a volume of gasto overcome a supply-pressure deficiency. Whensizing a booster, an engineer needs to under-stand the following terms and issues:
Maximum design flow (Q max
) The sum of all gasloads at the maximum capacity rating (MCR) for all equipment downstream of the booster that couldpossibly be required to operate simultaneously.
Minimum design flow (Q min
) The minimum volumetric flow that could exist while the booster is operating. This flow is not always associated
with the smallest Btu/h rated piece of equipment.For example, when evaluating a 75,000,000 Btu/h (7.5 mmBtu/h) boiler with a 10:1 turndown ratioin comparison to 1.0 mmBtu/h (0.3 mmW) hot-
water heater that is on/off in operation, the larger Btu/h (W) rated boiler has the smaller flow of 0.75mmBtu/h (0.2 mmW) at its minimum firing rate.
Turndown (TD) ratio The ratio of the MCR in-put to the equipment ’s minimum or “low-fire”input. For example, a 100 mmBtu/h (29.3 mmW)
burner that can fire at a minimum rate of 20mmBtu/h (5.9 mmW) has a TD ratio of 5:1.
Pressure “ droop ” and peak consumption “Pressure droop” is the inability of a supply sys-
tem to maintain a steady or consistent inlet pressure as an increase in volumetric flow is de-manded. Often, in areas where boosters areapplied, the supply pressure in off-peak months
when gas is not in such demand can be suffi-cient to run a system. As the local demand for gas increases, the supply system can no longer provide the gas efficiently and the pressure fallsoff or droops. It is the booster ’s function to over-come the droop (or excessive pressure drop) of the supply system during such times.
Flow rate relationships Do your flows for separate pieces of equipment relate to each other?
In other words, do the three boilers always oper-ate in unison while another process machinealways operates off peak and alone? Relation-ships among the equipment can significantly affect both maximum and minimum flow rates.
Test block A factor of safety added to designcriteria. Typically, a minimum of 5% added vol-ume and 10% added static pressure should beapplied to the design criteria. When specifyingthe equipment, ensure that you note both thedesign and test block conditions. This makesother people working on the system aware and
ensures that safety factors are not applied tocriteria that already include safety factors.
Minimum inlet pressure (P I-min
) What is theminimum supply pressure in in. (mm) wc gage?
This must be evaluated during peak flow de-mands both for the equipment and for the localarea! Always evaluate during flow, not static, con-ditions! It is also important to know how highthe inlet pressure is expected to rise during off-

8/12/2019 American Society of Plumbing Engineers Volume 2
http://slidepdf.com/reader/full/american-society-of-plumbing-engineers-volume-2 209/233
183Chapter 7— Fuel-Gas Piping Systems
7. Test block flow (Q TB) = (1.05 × Qmin) to (1.05 ×Qmax )
8. Test block pressure boost: 1.10 × ∆P = PI-eq +PPL – PI-min
where
PPL = Pressure losses, psi (kPa)
Pipe Sizing
A number of formulae can be used to calculatethe capacity of natural gas piping based on such
variables as delivery pressure, pressure dropthrough the piping system, pipe size, pipe mate-rial, and length of piping. Most of these formulaeare referenced in numerous current model codes,as well as in the NFPA standards. The most com-monly referenced formula for gas pressuresunder 1½ psi (10.3 kPa), the NFPA formula listed
in the National Fuel Gas Code, NFPA 54, was usedas the basis for Tables 7-3 and 7-4. The other commonly referenced equation, the Weymouthformula, was used as the basis for Table 7-5 and
Appendix Tables 7-A1 through 7-A6. The Weymouth formula, referenced within thesetables, is applicable only for initial gas pressuresgreater than 1 psi (6.9 kPa). A third formula, theSpitzglass formula, which is shown in Table 7-
A7, is limited to gas pressures under 1 psi (6.9kPa).
The design of piping systems for gas flow is a basic fluid flow problem and its solution is simi-
lar to that for any other pipe sizing problem. Therequired flow rate can easily be determined, thepressure losses due to friction can be calculated,and the required residual pressure at each ap-pliance is usually known. Using basic engineeringformulae, the engineer can tabulate the variousquantities, establish the pipe sizes for each sec-tion of piping, and demonstrate the pressure andflow rate at any point in the system. The flow of gas in a pipe with pressures not exceeding 1 psi(6.9 kPa) is often computed using the Spitzglassformula, as shown below:
Equation 7-6
Q = 3550 K h SL
Q = 3550 K
h
½
SL
Q = 3550
d5h
½
SL 1 +
3.6+ 0.03dd
peak periods. A booster is typically rated to about 5 psi (34.5 kPa). It may be possible to exceedthis rating during off-peak demand periods,therefore, a bypass system or other means of pro-tection is required. Often this pressure can bespecified by the local gas company as the mini-mum guaranteed gas pressure from their supply system. Also, the maximum inlet pressure (PI-
max ) must be determined.
Maximum outlet pressure (P O-max)
List all maxi-mum and required supply pressures for the
various pieces of equipment being supplied gasfrom the booster. Determine the differential be-tween the highest expected gas pressure supply to the booster (e.g., 8 in. wc [203.2 mm wc]) andthe lowest maximum supply pressure rating toa piece of equipment (e.g., 18 in. wc [457.2 mm
wc]). The booster ’s pressure gain should not ex-
ceed this differential (for the above example, 18 – 8 = 10 in. wc [457.2 – 203.2 = 254 mm wc])unless other means of protecting the downstreamequipment are provided.
Outlet pressure protection There are several ways to protect equipment downstream of a booster should it be necessary due to potentialover-pressurization during off-peak periods. If allthe equipment being serviced operates at nomi-nally the same pressure, install a regulator onthe inlet or outlet of the booster to maintain a controlled maximum outlet pressure. If the equip-ment being serviced operates at various inlet pressures, it may be best to supply a regulator for each piece of equipment. Most often, pack-aged equipment is supplied with its ownregulator. If this is the case, review the equip-ment regulator ’s maximum inlet pressure.
To perform an evaluation of system require-ments:
1. Establish design Qmin and Qmax per the abovedefinitions while evaluating TD requirements.
2. Establish PI-min and PI-max per the above defi-nitions.
3. Define maximum inlet pressure requirementsto equipment (PI-eq ).
4. Define piping pressure losses (PPL ) from gas booster location to each piece of equipment.
5. Design flow rate (QD) = Qmin to Qmax ,cfh (m3/h)
6. Design pressure boost (∆P) = PI-eq + PPL – PI-min

8/12/2019 American Society of Plumbing Engineers Volume 2
http://slidepdf.com/reader/full/american-society-of-plumbing-engineers-volume-2 210/233
ASPE Data Book — Volume 2184
where
Q = The gas at standard conditions, cfh (m3 /h)
K = Constant for a given pipe size
h = The pressure drop, in. (mm) wc
S = Specific gravity of the gas
L = Length of pipe, ft (m)
The constant for a given pipe size (K) may becalculated by using the following relation:
Equation 7-7
K =
D5
½
1 + 3.6 + 0.03 × D D
where
K = Constant for a given pipe size
D = Inside diameter of the pipe, in. (mm)
The length used in the above formula should be corrected to allow for the added resistance toflow caused by valves and fittings in the piping.
This corrected length is called the “equiva-lent length.” Table 7-2 gives the equivalent lengths for various valve and fitting sizes. Thedesigner is cautioned to conform to applicablecodes for the project location.
The above method is accurate and gives a solution that has a definite technical basis. How-ever, in actual practice, published tables show-
ing the capacities for the various pipe sizes andlengths give solutions that are quickly and eas-ily obtained and generally adequate for most situ-ations. These tables are in many model codesand in National Fire Protection Association
(NFPA) Standard 54 . The lengths shown are de- veloped lengths (lengths measured along the cen-ter line of the piping plus a fitting allowance).
The pressure drops include an allowance for a nominal amount of valves and fittings.
To determine the size of each section of pipein a gas-supply system using the gas pipe-sizingtables, the following method should be used:
1. Measure the length of the pipe from the gasmeter location to the most remote outlet onthe system. Add a fitting allowance.
2. Select the column showing that distance (or
the next longer distance, if the table does not give the exact length).
3. Use the vertical column to locate all gas de-mand figures for this particular system.
4. Starting at the most remote outlet, find inthe vertical column the selected gas demandfor that outlet. If the exact figure is not shown, choose the next larger figure below in the column.
5. Opposite this demand figure, in the first col-umn at the left, the correct size of pipe will
be found.
Table 7-2 Equivalent Lengths for Various Valve and Fitting Sizes
Pipe Size, in. (mm)
Fitting ¾ (19.1) 1 (25.4) 1½ (38.1) 2 (50.8) 2½ (63.5) 3 (76.2) 4 (101.6) 5 (127) 6 (152.4) 8 (203.2)
Equivalent Lengths, ft (m)
90° elbow 1.00 2.00 2.50 3.00 4.00 5.50 6.50 9.00 12.0 15.0
(0.3) (0.61) (0.76) (0.91) (1.22) (1.68) (1.98) (2.74) (3.66) (4.57)
Tee (run) 0.50 0.75 1.00 1.50 2.00 3.00 3.50 4.50 6.00 7.00
(0.15) (0.23) (0.3) (0.46) (0.61) (0.91) (1.07) (1.37) (1.83) (2.13)
Tee (branch) 2.50 3.50 4.50 5.00 6.00 11.0 13.0 18.0 24.0 30.0
(0.76) (1.07) (1.37) (1.52) (1.83) (3.35) (3.96) (5.49) (7.32) (9.14)
Gas cock 4.00 5.00 7.50 9.00 12.0 17.0 20.0 28.0 37.0 46.0
(approx.) (1.22) (1.52) (2.29) (2.74) (3.66) (5.18) (6.1) (8.53) (11.28) (14.02)
Note : The pressure drop through valves should be taken from manufacturers’ published data rather than using the equivalent lengths, sincethe various patterns of gas cocks can vary greatly.
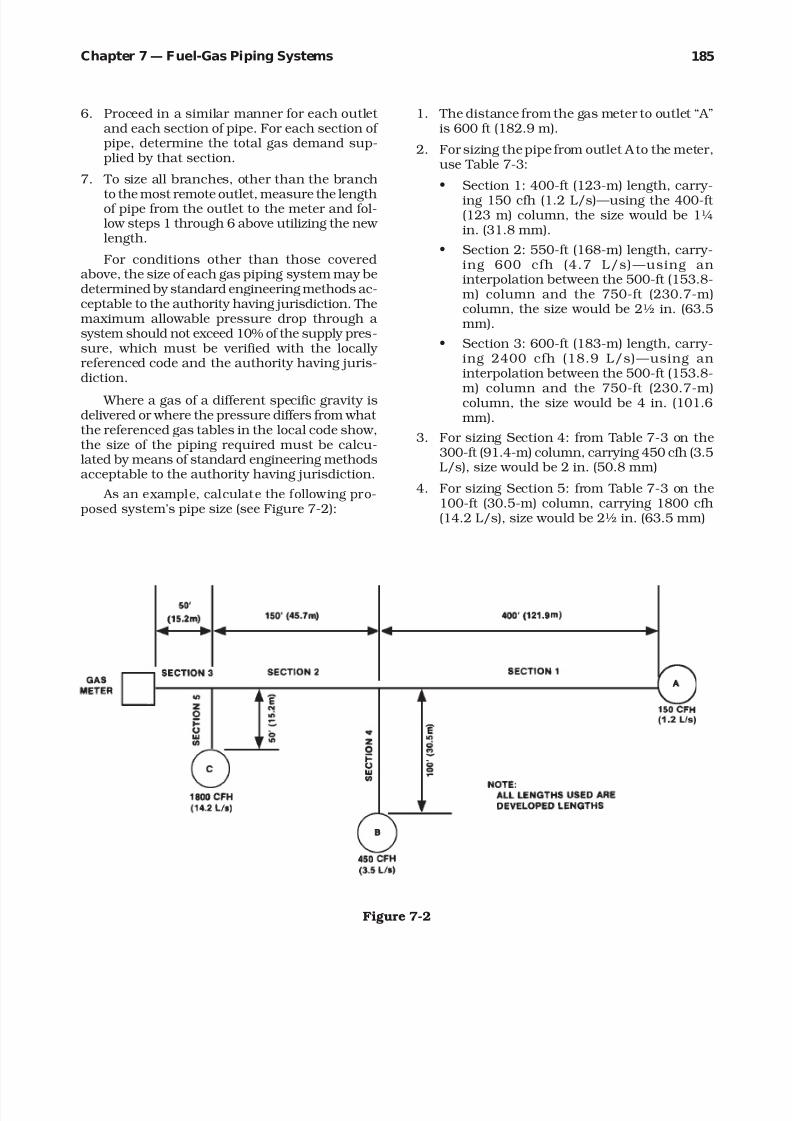
8/12/2019 American Society of Plumbing Engineers Volume 2
http://slidepdf.com/reader/full/american-society-of-plumbing-engineers-volume-2 211/233
185Chapter 7— Fuel-Gas Piping Systems
6. Proceed in a similar manner for each outlet and each section of pipe. For each section of pipe, determine the total gas demand sup-plied by that section.
7. To size all branches, other than the branch
to the most remote outlet, measure the lengthof pipe from the outlet to the meter and fol-low steps 1 through 6 above utilizing the new length.
For conditions other than those coveredabove, the size of each gas piping system may bedetermined by standard engineering methods ac-ceptable to the authority having jurisdiction. Themaximum allowable pressure drop through a system should not exceed 10% of the supply pres-sure, which must be verified with the locally referenced code and the authority having juris-diction.
Where a gas of a different specific gravity isdelivered or where the pressure differs from what the referenced gas tables in the local code show,the size of the piping required must be calcu-lated by means of standard engineering methodsacceptable to the authority having jurisdiction.
As an example, calculate the following pro-posed system’s pipe size (see Figure 7-2):
1. The distance from the gas meter to outlet “ A ”is 600 ft (182.9 m).
2. For sizing the pipe from outlet A to the meter,use Table 7-3:
• Section 1: 400-ft (123-m) length, carry-
ing 150 cfh (1.2 L/s) — using the 400-ft (123 m) column, the size would be 1¼in. (31.8 mm).
• Section 2: 550-ft (168-m) length, carry-ing 600 cfh (4.7 L/s) — using aninterpolation between the 500-ft (153.8-m) column and the 750-ft (230.7-m)column, the size would be 2½ in. (63.5mm).
• Section 3: 600-ft (183-m) length, carry-ing 2400 cfh (18.9 L/s) — using aninterpolation between the 500-ft (153.8-
m) column and the 750-ft (230.7-m)column, the size would be 4 in. (101.6mm).
3. For sizing Section 4: from Table 7-3 on the300-ft (91.4-m) column, carrying 450 cfh (3.5L/s), size would be 2 in. (50.8 mm)
4. For sizing Section 5: from Table 7-3 on the100-ft (30.5-m) column, carrying 1800 cfh(14.2 L/s), size would be 2½ in. (63.5 mm)
Figure 7-2

8/12/2019 American Society of Plumbing Engineers Volume 2
http://slidepdf.com/reader/full/american-society-of-plumbing-engineers-volume-2 212/233
ASPE Data Book — Volume 2186
N F P A F o r m u l a :
Q
=
2 3 1 3
× D
2 . 6 2 3 ×
h
0 . 5 4 1
C r × L
W h e r e :
Q
=
F l o w ( f t 3 /
h )
D
=
I n t e r n a l p
i p e d i a m e t e r ( i n . )
h
=
P r e s s u r e
d r o p ( i n . w c )
C r =
C o r r e c t i o
n f a c t o r o f 0 . 6 1
L
=
T o t a l e q u
i v a l e n t l e n g t h o f s y s t e m p
i p i n g ( f t )
G i v e n :
h
=
0 . 5
T
h e p r e s s u r e d r o p t h r o u g h t h e s y s t e m
C r =
0 . 6 1
C
o r r e c t i o n F a c t o r ( = 0 . 6 1 i f i n i t i a l p r e s s u r e < 1 . 5 p s i )
S
=
0 . 6
T
h e s p e c i f i c g r a v i t y o f t h e n a t u r a l g a s
T a b l e 7 - 3
N a t u r a l G a s
P i p e S i z i n g T a b l e f o r G a s P r e
s s u r e < 1 . 5 p s i
P i p e
A c t u a l
T o t a l E q u i v a l e n t L e
n g t h o f L o n g e s t R u n o f P i p i n g i n S y
s t e m (
f t )
S i z e
I . D . a
1 0
2 5
5 0
7 5
1 0 0
1 5 0
1 7 5
2 0 0
2 5 0
3 0 0
4 0 0
5
0 0
7 5 0
1 0 0 0
1 2 5 0
1 5 0 0
1 7
5 0
2 0 0 0
3 0 0 0
( i n . )
( i n . )
C a p a c i t i e s ( c f h )
½
0 .
6 2 2
1 7 2
1
0 5
7 2
5 8
4 9
4 0
3 7
3 4
3 0
2 7
2 3
2 1
1 7
1 4
1 3
1 1
1 1
1 0
8
¾
0 .
8 2 4
3 6 0
2
1 9
1 5 1
1 2 1
1 0 3
8 3
7 6
7 1
6 3
5 7
4 9
4 3
3 5
3 0
2 6
2 4
2 2
2 0
1 6
1
1 .
0 4 9
6 7 8
4
1 3
2 8 4
2 2 8
1 9 5
1 5 7
1 4 4
1 3 4
1 1 9
1 0 8
9 2
8 2
6 6
5 6
5 0
4 5
4 1
3 9
3 1
1 ¼
1 .
3 8
1 ,
3 9 1
8
4 7
5 8 2
4 6 8
4 0 0
3 2 1
2 9 6
2 7 5
2 4 4
2 2 1
1 8 9
1
6 8
1 3 5
1 1 5
1 0 2
9 2
8 5
7 9
6 4
1 ½
1 .
6 1
2 ,
0 8 4
1 , 2
7 0
8 7 3
7 0 1
6 0 0
4 8 2
4 4 3
4 1 2
3 6 5
3 3 1
2 8 3
2
5 1
2 0 2
1 7 3
1 5 3
1 3 9
1 2 7
1 1 9
9 5
2
2 .
0 6 7
4 ,
0 1 4
2 , 4
4 5
1 ,
6 8 1
1 ,
3 5 0
1 ,
1 5 5
9 2 8
8 5 3
7 9 4
7 0 4
6 3 7
5 4 6
4
8 4
3 8 8
3 3 2
2 9 5
2 6 7
2 4 6
2 2 8
1 8 3
2 ½
2 .
4 6 9
6 ,
3 9 8
3 , 8
9 7
2 ,
6 7 9
2 ,
1 5 1
1 ,
8 4 1
1 ,
4 7 8
1 ,
3 6 0
1 ,
2 6 5
1 ,
1 2 1
1 ,
0 1 6
8 7 0
7
7 1
6 1 9
5 3 0
4 6 9
4 2 5
3 9 1
3 6 4
2 9 2
3
3 .
0 6 8
1 1 ,
3 1 0
6 , 8
9 0
4 ,
7 3 5
3 ,
8 0 2
3 ,
2 5 4
2 ,
6 1 3
2 ,
4 0 4
2 ,
2 3 7
1 ,
9 8 2
1 ,
7 9 6
1 ,
5 3 7
1 , 3
6 2
1 ,
0 9 4
9 3 6
8 3 0
7 5 2
6 9 2
6 4 4
5 1 7
4
4 .
0 2 6
2 3 ,
0 7 0
1 4 , 0
5 2
9 ,
6 5 8
7 ,
7 5 6
6 ,
6 3 8
5 ,
3 3 1
4 ,
9 0 4
4 ,
5 6 2
4 ,
0 4 3
3 ,
6 6 4
3 ,
1 3 6
2 , 7
7 9
2 ,
2 3 2
1 ,
9 1 0
1 ,
6 9 3
1 ,
5 3 4
1 , 4
1 1
1 ,
3 1 3
1 ,
0 5 4
5
5 .
0 4 7
4 1 ,
7 3 6
2 5 , 4
2 3
1 7 ,
4 7 3
1 4 ,
0 3 1
1 2 ,
0 0 9
9 ,
6 4 4
8 ,
8 7 2
8 ,
2 5 4
7 ,
3 1 5
6 ,
6 2 8
5 ,
6 7 3
5 , 0
2 8
4 ,
0 3 7
3 ,
4 5 6
3 ,
0 6 3
2 ,
7 7 5
2 , 5
5 3
2 ,
3 7 5
1 ,
9 0 7
6
6 .
0 6 5
6 7 ,
5 8 0
4 1 , 1
6 6
2 8 ,
2 9 3
2 2 ,
7 2 0
1 9 ,
4 4 6
1 5 ,
6 1 5
1 4 ,
3 6 6
1 3 ,
3 6 5
1 1 ,
8 4 5
1 0 ,
7 3 2
9 ,
1 8 6
8 , 1
4 1
6 ,
5 3 8
5 ,
5 9 5
4 ,
9 5 9
4 ,
4 9 3
4 , 1
3 4
3 ,
8 4 6
3 ,
0 8 8
8
7 .
9 8 1
1 3 8 ,
8 5 2
8 4 , 5
8 0
5 8 ,
1 3 1
4 6 ,
6 8 1
3 9 ,
9 5 3
3 2 ,
0 8 4
2 9 ,
5 1 7
2 7 ,
4 6 0
2 4 ,
3 3 7
2 2 ,
0 5 1
1 8 ,
8 7 3
1 6 , 7
2 7
1 3 ,
4 3 2
1 1 ,
4 9 6
1 0 ,
1 8 9
9 ,
2 3 2
8 , 4
9 3
7 ,
9 0 1
6 ,
3 4 5
1 0
1 0 .
0 2
2 5 2 ,
1 9 2
1 5 3 , 6
1 9
1 0 5 ,
5 8 2
8 4 ,
7 8 6
7 2 ,
5 6 6
5 8 ,
2 7 3
5 3 ,
6 1 0
4 9 ,
8 7 4
4 4 ,
2 0 2
4 0 ,
0 5 1
3 4 ,
2 7 8
3 0 , 3
8 0
2 4 ,
3 9 6
2 0 ,
8 8 0
1 8 ,
5 0 6
1 6 ,
7 6 7
1 5 , 4
2 6
1 4 ,
3 5 1
1 ,
5 2 4
1 2
1 1 .
9 3 8
3 9 9 ,
2 5 1
2 4 3 , 1
9 9
1 6 7 ,
1 4 9
1 3 4 ,
2 2 7
1 1 4 ,
8 8 1
9 2 ,
2 5 3
8 4 ,
8 7 2
7 8 ,
9 5 7
6 9 ,
9 7 8
6 3 ,
4 0 5
5 4 ,
2 6 7
4 8 , 0
9 5
3 8 ,
6 2 2
3 3 ,
0 5 6
2 9 ,
2 9 7
2 6 ,
5 4 5
2 4 , 4
2 1
2 2 ,
7 1 9
1 8 ,
2 4 4
S o u r c e : R e p r i n t e d , w i t h p e r m i s
s i o n , f r o m d a t a d e v e l o p e d b y t h e B o s t o n c h a p t e r o f A S P E .
a I . D . ( i n t e r n a l d i a m e t e r ) b a s e d
o n s c h e d u l e 4 0 s t e e l p i p e .

8/12/2019 American Society of Plumbing Engineers Volume 2
http://slidepdf.com/reader/full/american-society-of-plumbing-engineers-volume-2 213/233
187Chapter 7— Fuel-Gas Piping Systems
N F P A F o r m u l a :
Q
=
0 . 0 0 7 8 7
2 3 1 3
×
D 2 . 6 2 3
×
h
0 . 5 4 1
C r × L
W h e r e :
Q
=
F l o w ( L / s
)
D
=
I n t e r n a l p
i p e d i a m e t e r ( m m )
h
=
P r e s s u r e
d r o p ( k P a o r m m w c )
C r =
C o r r e c t i o
n f a c t o r o f 0 . 6 1
L
=
T o t a l e q u
i v a l e n t l e n g t h o f s y s t e m p
i p i n g ( m )
G i v e n :
h
=
1 2 . 7
T
h e p r e s s u r e d r o p t h r o u g h t h e s y s t e m ( m m w c )
C r =
0 . 6 1
C
o r r e c t i o n f a c t o r ( = 0 . 6 1 i f i n i t i a l p r e s s u r e < 1 0 . 3 k P a )
S
=
0 . 6
T
h e s p e c i f i c g r a v i t y o f t h e n a t u r a l g a s
T a b l e 7 - 3 ( M )
N a t u r a l G a s
P i p e S i z i n g T a b l e f o r G a s P r e s s u r e < 1 0 . 3
k P a
P i p e
A c t u a l
T o t a l E q u i v a l e n t L e n g t h o f L o n g e s t R u n o f P i p i n g i n S y
s t e m ( m )
S i z e
I . D . a
3 . 1
7 . 6
1 5 . 2
2 2 . 9
3 0 . 5
4 5 . 7
5 3
. 4
6 1 . 0
7 6 . 2
9 1 . 4
1 2 1 . 9
1 5 2
. 4
2 2 8 . 6
3 0 4 . 8
3 8 1
4 5 7 . 2
5 3 3 .
4
6 0 9 . 6
9 1 4 . 4
( m m )
( m m )
C a p a c i t i e s ( L / s )
1 5
1 5 .
8
1 .
3 5
0 .
8 2
0 .
5 7
0 .
4 6
0 .
3 9
0 .
3 1
0
. 2 9
0 .
2 7
0 .
2 4
0 .
2 1
0 .
1 8
0 .
1 6
0 .
1 3
0 .
1 1
0 .
1 0
0 .
0 9
0 . 0
8
0 .
0 8
0 .
0 6
2 0
2 0 .
9
2 .
8 3
1 .
7 2
1 .
1 9
0 .
9 5
0 .
8 1
0 .
6 5
0
. 6 0
0 .
5 6
0 .
5 0
0 .
4 5
0 .
3 8
0 .
3 4
0 .
2 7
0 .
2 3
0 .
2 1
0 .
1 9
0 . 1
7
0 .
1 6
0 .
1 3
2 5
2 6 .
6
5 .
3 3
3 .
2 5
2 .
2 3
1 .
7 9
1 .
5 3
1 .
2 3
1
. 1 3
1 .
0 5
0 .
9 3
0 .
8 5
0 .
7 2
0 .
6 4
0 .
5 2
0 .
4 4
0 .
3 9
0 .
3 5
0 . 3
3
0 .
3 0
0 .
2 4
3 5
3 5 .
1
1 0 .
9 5
6 .
6 7
4 .
5 8
3 .
6 8
3 .
1 5
2 .
5 3
2
. 3 3
2 .
1 7
1 .
9 2
1 .
7 4
1 .
4 9
1 .
3 2
1 .
0 6
0 .
9 1
0 .
8 0
0 .
7 3
0 . 6
7
0 .
6 2
0 .
5 0
4 0
4 0 .
9
1 6 .
4 0
9 .
9 9
6 .
8 7
5 .
5 1
4 .
7 2
3 .
7 9
3
. 4 9
3 .
2 4
2 .
8 8
2 .
6 1
2 .
2 3
1 .
9 8
1 .
5 9
1 .
3 6
1 .
2 0
1 .
0 9
1 . 0
0
0 .
9 3
0 .
7 5
5 0
5 2 .
5
3 1 .
5 9
1 9 .
2 4
1 3 .
2 3
1 0 .
6 2
9 .
0 9
7 .
3 0
6
. 7 2
6 .
2 5
5 .
5 4
5 .
0 2
4 .
2 9
3 .
8 1
3 .
0 6
2 .
6 2
2 .
3 2
2 .
1 0
1 . 9
3
1 .
8 0
1 .
4 4
6 5
6 2 .
7
5 0 .
3 5
3 0 .
6 7
2 1 .
0 8
1 6 .
9 3
1 4 .
4 9
1 1 .
6 3
1 0
. 7 0
9 .
9 6
8 .
8 3
8 .
0 0
6 .
8 4
6 .
0 7
4 .
8 7
4 .
1 7
3 .
6 9
3 .
3 5
3 . 0
8
2 .
8 7
2 .
3 0
7 5
7 7 .
9
8 9 .
0 1
5 4 .
2 2
3 7 .
2 7
2 9 .
9 3
2 5 .
6 1
2 0 .
5 7
1 8
. 9 2
1 7 .
6 0
1 5 .
6 0
1 4 .
1 4
1 2 .
1 0
1 0 .
7 2
8 .
6 1
7 .
3 7
6 .
5 3
5 .
9 2
5 . 4
4
5 .
0 7
4 .
0 7
1 0 0
1 0 2 .
2
1 8 1 .
5 6
1 1 0 .
5 9
7 6 .
0 1
6 1 .
0 4
5 2 .
2 4
4 1 .
9 5
3 8
. 5 9
3 5 .
9 1
3 1 .
8 2
2 8 .
8 3
2 4 .
6 8
2 1 .
8 7
1 7 .
5 6
1 5 .
0 3
1 3 .
3 2
1 2 .
0 7
1 1 . 1
1
1 0 .
3 3
8 .
3 0
1 2 5
1 2 8 .
2
3 2 8 .
4 6
2 0 0 .
0 8
1 3 7 .
5 1
1 1 0 .
4 3
9 4 .
5 1
7 5 .
9 0
6 9
. 8 2
6 4 .
9 6
5 7 .
5 7
5 2 .
1 6
4 4 .
6 4
3 9 .
5 7
3 1 .
7 7
2 7 .
1 9
2 4 .
1 0
2 1 .
8 4
2 0 . 0
9
1 8 .
6 9
1 5 .
0 1
1 5 0
1 5 4 .
1
5 3 1 .
8 6
3 2 3 .
9 7
2 2 2 .
6 7
1 7 8 .
8 1
1 5 3 .
0 4
1 2 2 .
8 9
1 1 3
. 0 6
1 0 5 .
1 8
9 3 .
2 2
8 4 .
4 6
7 2 .
2 9
6 4 .
0 7
5 1 .
4 5
4 4 .
0 3
3 9 .
0 3
3 5 .
3 6
3 2 . 5
3
3 0 .
2 6
2 4 .
3 0
2 0 0
2 0 2 .
7
1 0 9 2 .
7 6
6 6 5 .
6 4
4 5 7 .
4 9
3 6 7 .
3 8
3 1 4 .
4 3
2 5 2 .
5 0
2 3 2
. 3 0
2 1 6 .
1 1
1 9 1 .
5 3
1 7 3 .
5 4
1 4 8 .
5 3
1 3 1 .
6 4
1 0 5 .
7 1
9 0 .
4 7
8 0 .
1 9
7 2 .
6 5
6 6 . 8
4
6 2 .
1 8
4 9 .
9 3
2 5 0
2 5 4 .
5
1 9 8 4 .
7 5
1 2 0 8 .
9 8
8 3 0 .
9 3
6 6 7 .
2 6
5 7 1 .
0 9
4 5 8 .
6 1
4 2 1
. 9 1
3 9 2 .
5 1
3 4 7 .
8 7
3 1 5 .
2 0
2 6 9 .
7 7
2 3 9 .
0 9
1 9 2 .
0 0
1 6 4 .
3 3
1 4 5 .
6 4
1 3 1 .
9 6
1 2 1 . 4
0
1 1 2 .
9 4
9 0 .
6 9
3 0 0
3 0 3 .
2
3 1 4 2 .
1 1
1 9 1 3 .
9 7
1 3 1 5 .
4 6
1 0 5 6 .
3 6
9 0 4 .
1 1
7 2 6 .
0 3
6 6 7
. 9 4
6 2 1 .
3 9
5 5 0 .
7 3
4 9 9 .
0 0
4 2 7 .
0 8
3 7 8 .
5 1
3 0 3 .
9 6
2 6 0 .
1 5
2 3 0 .
5 6
2 0 8 .
9 1
1 9 2 . 1
9
1 7 8 .
8 0
1 4 3 .
5 8
S o u r c e : R e p r i n t e d , w i t h p e r m i s
s i o n , f r o m d a t a d e v e l o p e d b y t h e B o s t o n c h a p t e r o f A S P E .
a I . D . ( i n t e r n a l d i a m e t e r ) b a s e d
o n s c h e d u l e 4 0 s t e e l p i p e .

8/12/2019 American Society of Plumbing Engineers Volume 2
http://slidepdf.com/reader/full/american-society-of-plumbing-engineers-volume-2 214/233
ASPE Data Book — Volume 2188
N F P A F o r m u l a :
Q
=
2 3 1 3
× D
2 . 6 2 3
×
h
0 . 5 4 1
C r × L
W h e r e :
Q
=
F l o w ( f t 3 /
h )
D
=
I n t e r n a l p
i p e d i a m e t e r ( i n . )
h
=
P r e s s u r e
d r o p ( i n . w c )
C r =
C o r r e c t i o
n f a c t o r o f 0 . 6 1
L
=
T o t a l e q u
i v a l e n t l e n g t h o f s y s t e m p
i p i n g ( f t )
G i v e n :
h
=
0 . 3
T
h e p r e s s u r e d r o p t h r o u g h t h e s y s t e m
C r =
0 . 6 1
C
o r r e c t i o n f a c t o r ( = 0 . 6 1 i f i n i t i a l p r e s s u r e < 1 . 5 p s i )
S
=
0 . 6
T
h e s p e c i f i c g r a v i t y o f t h e n a t u r a l g a s
T a b l e 7 - 4
N a t u r a l G a s
P i p e S i z i n g T a b l e f o r G a s P r e
s s u r e < 1 . 5 p s i
P i p e
A c t u a l
T o t a l E q u i v a l e n t L e
n g t h o f L o n g e s t R u n o f P i p i n g i n S y
s t e m (
f t )
S i z e
I . D . a
1 0
2 5
5 0
7 5
1 0 0
1 5 0
1 7 5
2 0 0
2 5 0
3 0 0
4 0 0
5
0 0
7 5 0
1 0 0 0
1 2 5 0
1 5 0 0
1 7
5 0
2 0 0 0
3 0 0 0
( i n . )
( i n . )
C a p a c i t i e s ( c f h )
½
0 .
6 2 2
1 3 0
7 9
5 5
4 4
3 8
3 0
2 8
2 6
2 3
2 1
1 8
1 6
1 3
1 1
1 0
9
8
7
6
¾
0 .
8 2 4
2 7 3
1
6 6
1 1 4
9 2
7 9
6 3
5 8
5 4
4 8
4 3
3 7
3 3
2 6
2 3
2 0
1 8
1 7
1 6
1 2
1
1 .
0 4 9
5 1 4
3
1 3
2 1 5
1 7 3
1 4 8
1 1 9
1 0 9
1 0 2
9 0
8 2
7 0
6 2
5 0
4 3
3 8
3 4
3 1
2 9
2 3
1 ¼
1 .
3 8
1 ,
0 5 5
6
4 3
4 4 2
3 5 5
3 0 4
2 4 4
2 2 4
2 0 9
1 8 5
1 6 8
1 4 3
1
2 7
1 0 2
8 7
7 7
7 0
6 5
6 0
4 8
1 ½
1 .
6 1
1 ,
5 8 1
9
6 3
6 6 2
5 3 2
4 5 5
3 6 5
3 3 6
3 1 3
2 7 7
2 5 1
2 1 5
1
9 0
1 5 3
1 3 1
1 1 6
1 0 5
9 7
9 0
7 2
2
2 .
0 6 7
3 ,
0 4 5
1 , 8
5 5
1 ,
2 7 5
1 ,
0 2 4
8 7 6
7 0 4
6 4 7
6 0 2
5 3 4
4 8 4
4 1 4
3
6 7
2 9 5
2 5 2
2 2 3
2 0 2
1 8 6
1 7 3
1 3 9
2 ½
2 .
4 6 9
4 ,
8 5 3
2 , 9
5 6
2 ,
0 3 2
1 ,
6 3 2
1 ,
3 9 6
1 ,
1 2 1
1 ,
0 3 2
9 6 0
8 5 1
7 7 1
6 6 0
5
8 5
4 6 9
4 0 2
3 5 6
3 2 3
2 9 7
2 7 6
2 2 2
3
3 .
0 6 8
8 ,
5 7 9
5 , 2
2 6
3 ,
5 9 2
2 ,
8 8 4
2 ,
4 6 9
1 ,
9 8 2
1 ,
8 2 4
1 ,
6 9 7
1 ,
5 0 4
1 ,
3 6 2
1 ,
1 6 6
1 , 0
3 4
8 3 0
7 1 0
6 3 0
5 7 0
5 2 5
4 8 8
3 9 2
4
4 .
0 2 6
1 7 ,
4 9 9
1 0 , 6
5 9
7 ,
3 2 6
5 ,
8 8 3
5 ,
0 3 5
4 ,
0 4 3
3 ,
7 2 0
3 ,
4 6 1
3 ,
0 6 7
2 ,
7 7 9
2 ,
3 7 9
2 , 1
0 8
1 ,
6 9 3
1 ,
4 4 9
1 ,
2 8 4
1 ,
1 6 3
1 , 0
7 0
9 9 6
8 0 0
5
5 .
0 4 7
3 1 ,
6 5 9
1 9 , 2
8 4
1 3 ,
2 5 4
1 0 ,
6 4 3
9 ,
1 0 9
7 ,
3 1 5
6 ,
7 3 0
6 ,
2 6 1
5 ,
5 4 9
5 ,
0 2 8
4 ,
3 0 3
3 , 8
1 4
3 ,
0 6 3
2 ,
6 2 1
2 ,
3 2 3
2 ,
1 0 5
1 , 9
3 6
1 ,
8 0 1
1 ,
4 4 7
6
6 .
0 6 5
5 1 ,
2 6 3
3 1 , 2
2 6
2 1 ,
4 6 1
1 7 ,
2 3 4
1 4 ,
7 5 0
1 1 ,
8 4 5
1 0 ,
8 9 7
1 0 ,
1 3 8
8 ,
9 8 5
8 ,
1 4 1
6 ,
9 6 8
6 , 1
7 5
4 ,
9 5 9
4 ,
2 4 4
3 ,
7 6 2
3 ,
4 0 8
3 , 1
3 6
2 ,
9 1 7
2 ,
3 4 2
8
7 .
9 8 1
1 0 5 ,
3 2 5
6 4 , 1
5 7
4 4 ,
0 9 5
3 5 ,
4 1 0
3 0 ,
3 0 6
2 4 ,
3 3 7
2 2 ,
3 9 0
2 0 ,
8 2 9
1 8 ,
4 6 1
1 6 ,
7 2 7
1 4 ,
3 1 6
1 2 , 6
8 8
1 0 ,
1 8 9
8 ,
7 2 0
7 ,
7 2 9
7 ,
0 0 3
6 , 4
4 2
5 ,
9 9 3
4 ,
8 1 3
1 0
1 0 .
0 2
1 9 1 ,
2 9 8
1 1 6 , 5
2 7
8 0 ,
0 8 8
6 4 ,
3 1 4
5 5 ,
0 4 4
4 4 ,
2 0 2
4 0 ,
6 6 6
3 7 ,
8 3 2
3 3 ,
5 2 9
3 0 ,
3 8 0
2 6 ,
0 0 1
2 3 , 0
4 5
1 8 ,
5 0 6
1 5 ,
8 3 8
1 4 ,
0 3 7
1 2 ,
7 1 9
1 1 , 7
0 1
1 0 ,
8 8 6
8 ,
7 4 2
1 2
1 1 .
9 3 8
3 0 2 ,
8 4 9
1 8 4 , 4
7 6
1 2 6 ,
7 9 0
1 0 1 ,
8 1 7
8 7 ,
1 4 2
6 9 ,
9 7 8
6 4 ,
3 7 9
5 9 ,
8 9 2
5 3 ,
0 8 1
4 8 ,
0 9 5
4 1 ,
1 6 3
3 6 , 4
8 2
2 9 ,
2 9 7
2 5 ,
0 7 4
2 2 ,
2 2 3
2 0 ,
1 3 5
1 8 , 5
2 4
1 7 ,
2 3 3
1 3 ,
8 3 9
S o u r c e : R e p r i n t e d , w i t h p e r m i s
s i o n , f r o m d a t a d e v e l o p e d b y t h e B o s t o n c h a p t e r o f A S P E .
a I . D . ( i n t e r n a l d i a m e t e r ) b a s e d
o n s c h e d u l e 4 0 s t e e l p i p e .

8/12/2019 American Society of Plumbing Engineers Volume 2
http://slidepdf.com/reader/full/american-society-of-plumbing-engineers-volume-2 215/233
189Chapter 7— Fuel-Gas Piping Systems
N F P A F o r m u l a :
Q
=
0 . 0 0 7 8 7
2 3 1 3
×
D 2 . 6 2 3
×
h
0 . 5 4 1
C r × L
W h e r e :
Q
=
F l o w ( L / s
)
D
=
I n t e r n a l p
i p e d i a m e t e r ( m m )
h
=
P r e s s u r e
d r o p ( k P a o r m m w c )
C r =
C o r r e c t i o
n f a c t o r o f 0 . 6 1
L
=
T o t a l e q u
i v a l e n t l e n g t h o f s y s t e m p
i p i n g ( m )
G i v e n :
h
=
1 2 . 7
T
h e p r e s s u r e d r o p t h r o u g h t h e s y s t e m ( m m w c )
C r =
0 . 6 1
C
o r r e c t i o n f a c t o r ( = 0 . 6 1 i f i n i t i a l p r e s s u r e < 1 0 . 3 k P a )
S
=
0 . 6
T
h e s p e c i f i c g r a v i t y o f t h e n a t u r a l g a s
T a b l e 7 - 4 ( M )
N a t u r a l G a s
P i p e S i z i n g T a b l e f o r G a s P r e s s u r e < 1 0 . 3
k P a
P i p e
A c t u a l
T o t a l E q u i v a l e n t L e n g t h o f L o n g e s t R u n o f P i p i n g i n S y
s t e m ( m )
S i z e
I . D . a
3 . 1
7 . 6
1 5 . 2
2 2 . 9
3 0 . 5
4 5 . 7
5
3 . 4
6 1 . 0
7 6 . 2
9 1 . 4
1 2 1 . 9
1 5 2
. 4
2 2 8 . 6
3 0 4 . 8
3 8 1
4 5 7 . 2
5 3 3 .
4
6 0 9 . 6
9 1 4 . 4
( m m )
( m m )
C a p a c i t i e s ( L / s )
1 5
1 5 .
8
1 .
0 3
0 .
6 3
0 .
4 3
0 .
3 5
0 .
3 0
0 .
2 4
0
. 2 2
0 .
2 0
0 .
1 8
0 .
1 6
0 .
1 4
0 .
1 2
0 .
1 0
0 .
0 9
0 .
0 8
0 .
0 7
0 . 0
6
0 .
0 6
0 .
0 5
2 0
2 0 .
9
2 .
1 5
1 .
3 1
0 .
9 0
0 .
7 2
0 .
6 2
0 .
5 0
0
. 4 6
0 .
4 2
0 .
3 8
0 .
3 4
0 .
2 9
0 .
2 6
0 .
2 1
0 .
1 8
0 .
1 6
0 .
1 4
0 . 1
3
0 .
1 2
0 .
1 0
2 5
2 6 .
6
4 .
0 4
2 .
4 6
1 .
6 9
1 .
3 6
1 .
1 6
0 .
9 3
0
. 8 6
0 .
8 0
0 .
7 1
0 .
6 4
0 .
5 5
0 .
4 9
0 .
3 9
0 .
3 3
0 .
3 0
0 .
2 7
0 . 2
5
0 .
2 3
0 .
1 8
3 5
3 5 .
1
8 .
3 0
5 .
0 6
3 .
4 8
2 .
7 9
2 .
3 9
1 .
9 2
1
. 7 7
1 .
6 4
1 .
4 6
1 .
3 2
1 .
1 3
1 .
0 0
0 .
8 0
0 .
6 9
0 .
6 1
0 .
5 5
0 . 5
1
0 .
4 7
0 .
3 8
4 0
4 0 .
9
1 2 .
4 4
7 .
5 8
5 .
2 1
4 .
1 8
3 .
5 8
2 .
8 8
2
. 6 5
2 .
4 6
2 .
1 8
1 .
9 8
1 .
6 9
1 .
5 0
1 .
2 0
1 .
0 3
0 .
9 1
0 .
8 3
0 . 7
6
0 .
7 1
0 .
5 7
5 0
5 2 .
5
2 3 .
9 6
1 4 .
6 0
1 0 .
0 3
8 .
0 6
6 .
9 0
5 .
5 4
5
. 0 9
4 .
7 4
4 .
2 0
3 .
8 1
3 .
2 6
2 .
8 9
2 .
3 2
1 .
9 8
1 .
7 6
1 .
5 9
1 . 4
7
1 .
3 6
1 .
1 0
6 5
6 2 .
7
3 8 .
1 9
2 3 .
2 7
1 5 .
9 9
1 2 .
8 4
1 0 .
9 9
8 .
8 3
8
. 1 2
7 .
5 5
6 .
6 9
6 .
0 7
5 .
1 9
4 .
6 0
3 .
6 9
3 .
1 6
2 .
8 0
2 .
5 4
2 . 3
4
2 .
1 7
1 .
7 5
7 5
7 7 .
9
6 7 .
5 2
4 1 .
1 3
2 8 .
2 7
2 2 .
7 0
1 9 .
4 3
1 5 .
6 0
1 4
. 3 5
1 3 .
3 5
1 1 .
8 3
1 0 .
7 2
9 .
1 8
8 .
1 3
6 .
5 3
5 .
5 9
4 .
9 5
4 .
4 9
4 . 1
3
3 .
8 4
3 .
0 9
1 0 0
1 0 2 .
2
1 3 7 .
7 2
8 3 .
8 9
5 7 .
6 6
4 6 .
3 0
3 9 .
6 3
3 1 .
8 2
2 9
. 2 8
2 7 .
2 4
2 4 .
1 4
2 1 .
8 7
1 8 .
7 2
1 6 .
5 9
1 3 .
3 2
1 1 .
4 0
1 0 .
1 1
9 .
1 6
8 . 4
2
7 .
8 4
6 .
2 9
1 2 5
1 2 8 .
2
2 4 9 .
1 5
1 5 1 .
7 7
1 0 4 .
3 1
8 3 .
7 6
7 1 .
6 9
5 7 .
5 7
5 2
. 9 6
4 9 .
2 7
4 3 .
6 7
3 9 .
5 7
3 3 .
8 7
3 0 .
0 1
2 4 .
1 0
2 0 .
6 3
1 8 .
2 8
1 6 .
5 7
1 5 . 2
4
1 4 .
1 8
1 1 .
3 9
1 5 0
1 5 4 .
1
4 0 3 .
4 4
2 4 5 .
7 5
1 6 8 .
9 0
1 3 5 .
6 3
1 1 6 .
0 8
9 3 .
2 2
8 5
. 7 6
7 9 .
7 8
7 0 .
7 1
6 4 .
0 7
5 4 .
8 4
4 8 .
6 0
3 9 .
0 3
3 3 .
4 0
2 9 .
6 0
2 6 .
8 2
2 4 . 6
8
2 2 .
9 6
1 8 .
4 4
2 0 0
2 0 2 .
7
8 2 8 .
9 1
5 0 4 .
9 2
3 4 7 .
0 3
2 7 8 .
6 7
2 3 8 .
5 1
1 9 1 .
5 3
1 7 6
. 2 1
1 6 3 .
9 3
1 4 5 .
2 8
1 3 1 .
6 4
1 1 2 .
6 7
9 9 .
8 5
8 0 .
1 9
6 8 .
6 3
6 0 .
8 2
5 5 .
1 1
5 0 . 7
0
4 7 .
1 7
3 7 .
8 8
2 5 0
2 5 4 .
5
1 5 0 5 .
5 2
9 1 7 .
0 6
6 3 0 .
2 9
5 0 6 .
1 5
4 3 3 .
2 0
3 4 7 .
8 7
3 2 0
. 0 4
2 9 7 .
7 3
2 6 3 .
8 8
2 3 9 .
0 9
2 0 4 .
6 3
1 8 1 .
3 6
1 4 5 .
6 4
1 2 4 .
6 5
1 1 0 .
4 7
1 0 0 .
1 0
9 2 . 0
9
8 5 .
6 7
6 8 .
8 0
3 0 0
3 0 3 .
2
2 3 8 3 .
4 2
1 4 5 1 .
8 3
9 9 7 .
8 3
8 0 1 .
3 0
6 8 5 .
8 1
5 5 0 .
7 3
5 0 6
. 6 6
4 7 1 .
3 5
4 1 7 .
7 5
3 7 8 .
5 1
3 2 3 .
9 6
2 8 7 .
1 2
2 3 0 .
5 6
1 9 7 .
3 3
1 7 4 .
8 9
1 5 8 .
4 7
1 4 5 . 7
9
1 3 5 .
6 3
1 0 8 .
9 1
S o u r c e : R e p r i n t e d , w i t h p e r m i s
s i o n , f r o m d a t a d e v e l o p e d b y t h e B o s t o n c h a p t e r o f A S P E .
a I . D . ( i n t e r n a l d i a m e t e r ) b a s e d
o n s c h e d u l e 4 0 s t e e l p i p e .

8/12/2019 American Society of Plumbing Engineers Volume 2
http://slidepdf.com/reader/full/american-society-of-plumbing-engineers-volume-2 216/233
ASPE Data Book — Volume 2190
W e y m o u t h F o r m u l a :
Q
=
2 0 3 8 . 1
( P
1 2 – P 2
2 ) × D
1 6 / 3
½
L S
W h e r e :
Q
=
G a s f l o w
( c f h )
G i v e n :
P 1
=
2
I n i t i a l p r e s s u r e i n s y s t e m ( p s i )
D
=
I n t e r n a l p
i p e d i a m e t e r ( i n . )
P 2
=
1
F i n a l p r e s s u r e i n s y s t e m ( p s i )
L
=
T o t a l e q u
i v a l e n t l e n g t h , l o n g e s t r u n o f p i p e ( f t )
S
=
0 . 6
T h
e s p e c i f i c g r a v i t y o f t h e n a t u r a l g a s
S
=
S p e c i f i c g
r a v i t y o f t h e g a s
P 1
=
I n i t i a l p r e
s s u r e i n t h e s y s t e m ( p s i )
P 2
=
F i n a l p r e s s u r e o f t h e s y s t e m ( p s i )
T a b l e 7 - 5
N a t u r a l G a s
P i p e S i z i n g T a b l e f o r G a s P r e s s u r e > 1 p s i
P i p
e S i z e — I n s i d e D i a m e t e r ( i n . )
a
T o t a l
N o m i n a l
½
¾
1
1 ¼
1 ½
2
2 ½
3
4
5
6
8
1 0
1 2
E q u i v a l e n t
A c t u a l
0 . 6 2 2
0 . 8 2 4
1 . 0 4 9
1 . 3 8 0
1 . 6 1 0
2 . 0 6 7
2 . 4 6 9
3 . 0 6 8
4 . 0 2 6
5 . 0 4 7
6 . 0 6 5
7 . 9 8 1
1 0 . 0 2
1 1 . 9 4
L e n g t h ( f t )
C a p a c i t i e s ( c f h )
1 0
4 0 6
8 6 0
1 ,
6 3 7
3 ,
4 0 2
5 ,
1 3 2
9 ,
9 9 1
1 6 ,
0 4 8
2 8 ,
6 4 1
5 9 ,
1 1 6
1 0 8 ,
0 1 0
1 7 6 ,
3 0 3
3 6 6 ,
6 0 4
6 7 2
, 4 9 8
1 ,
0 7 2 ,
8 2 3
2 5
2 5 7
5 4 4
1 ,
0 3 5
2 ,
1 5 2
3 ,
2 4 5
6 ,
3 1 9
1 0 ,
1 5 0
1 8 ,
1 1 4
3 7 ,
3 8 8
6 8 ,
3 1 2
1 1 1 ,
5 0 4
2 3 1 ,
8 6 0
4 2 5
, 3 2 5
6 7 8 ,
5 1 3
5 0
1 8 2
3 8 5
7 3 2
1 ,
5 2 1
2 ,
2 9 5
4 ,
4 6 8
7 ,
1 7 7
1 2 ,
8 0 9
2 6 ,
4 3 8
4 8 ,
3 0 4
7 8 ,
8 4 5
1 6 3 ,
9 5 0
3 0 0
, 7 5 0
4 7 9 ,
7 8 1
7 5
1 4 8
3 1 4
5 9 8
1 ,
2 4 2
1 ,
8 7 4
3 ,
6 4 8
5 ,
8 6 0
1 0 ,
4 5 8
2 1 ,
5 8 6
3 9 ,
4 4 0
6 4 ,
3 7 7
1 3 3 ,
8 6 5
2 4 5
, 5 6 2
3 9 1 ,
7 4 0
1 0 0
1 2 8
2 7 2
5 1 8
1 ,
0 7 6
1 ,
6 2 3
3 ,
1 6 0
5 ,
0 7 5
9 ,
0 5 7
1 8 ,
6 9 4
3 4 ,
1 5 6
5 5 ,
7 5 2
1 1 5 ,
9 3 0
2 1 2
, 6 6 3
3 3 9 ,
2 5 6
1 5 0
1 0 5
2 2 2
4 2 3
8 7 8
1 ,
3 2 5
2 ,
5 8 0
4 ,
1 4 4
7 ,
3 9 5
1 5 ,
2 6 4
2 7 ,
8 8 8
4 5 ,
5 2 1
9 4 ,
6 5 7
1 7 3
, 6 3 8
2 7 7 ,
0 0 2
1 7 5
9 7
2 0 6
3 9 1
8 1 3
1 ,
2 2 7
2 ,
3 8 8
3 ,
8 3 6
6 ,
8 4 7
1 4 ,
1 3 1
2 5 ,
8 1 9
4 2 ,
1 4 4
8 7 ,
6 3 5
1 6 0
, 7 5 8
2 5 6 ,
4 5 4
2 0 0
9 1
1 9 2
3 6 6
7 6 1
1 ,
1 4 7
2 ,
2 3 4
3 ,
5 8 9
6 ,
4 0 4
1 3 ,
2 1 9
2 4 ,
1 5 2
3 9 ,
4 2 3
8 1 ,
9 7 5
1 5 0
, 3 7 5
2 3 9 ,
8 9 0
2 5 0
8 1
1 7 2
3 2 7
6 8 0
1 ,
0 2 6
1 ,
9 9 8
3 ,
2 1 0
5 ,
7 2 8
1 1 ,
8 2 3
2 1 ,
6 0 2
3 5 ,
2 6 1
7 3 ,
3 2 1
1 3 4
, 5 0 0
2 1 4 ,
5 6 5
3 0 0
7 4
1 5 7
2 9 9
6 2 1
9 3 7
1 ,
8 2 4
2 ,
9 3 0
5 ,
2 2 9
1 0 ,
7 9 3
1 9 ,
7 2 0
3 2 ,
1 8 8
6 6 ,
9 3 2
1 2 2
, 7 8 1
1 9 5 ,
8 7 0
4 0 0
6 4
1 3 6
2 5 9
5 3 8
8 1 1
1 ,
5 8 0
2 ,
5 3 7
4 ,
5 2 9
9 ,
3 4 7
1 7 ,
0 7 8
2 7 ,
8 7 6
5 7 ,
9 6 5
1 0 6
, 3 3 1
1 6 9 ,
6 2 8
5 0 0
5 7
1 2 2
2 3 2
4 8 1
7 2 6
1 ,
4 1 3
2 ,
2 7 0
4 ,
0 5 0
8 ,
3 6 0
1 5 ,
2 7 5
2 4 ,
9 3 3
5 1 ,
8 4 6
9 5
, 1 0 6
1 5 1 ,
7 2 0
6 0 0
5 2
1 1 1
2 1 1
4 3 9
6 6 2
1 ,
2 9 0
2 ,
0 7 2
3 ,
6 9 8
7 ,
6 3 2
1 3 ,
9 4 4
2 2 ,
7 6 1
4 7 ,
3 2 8
8 6
, 8 1 9
1 3 8 ,
5 0 1
7 5 0
4 7
9 9
1 8 9
3 9 3
5 9 3
1 ,
1 5 4
1 ,
8 5 3
3 ,
3 0 7
6 ,
8 2 6
1 2 ,
4 7 2
2 0 ,
3 5 8
4 2 ,
3 3 2
7 7
, 6 5 3
1 2 3 ,
8 7 9
1 0 0 0
4 1
8 6
1 6 4
3 4 0
5 1 3
9 9 9
1 ,
6 0 5
2 ,
8 6 4
5 ,
9 1 2
1 0 ,
8 0 1
1 7 ,
6 3 0
3 6 ,
6 6 0
6 7
, 2 5 0
1 0 7 ,
2 8 2
1 2 5 0
3 6
7 7
1 4 6
3 0 4
4 5 9
8 9 4
1 ,
4 3 5
2 ,
5 6 2
5 ,
2 8 8
9 ,
6 6 1
1 5 ,
7 6 9
3 2 ,
7 9 0
6 0
, 1 5 0
9 5 ,
9 5 6
1 5 0 0
3 3
7 0
1 3 4
2 7 8
4 1 9
8 1 6
1 ,
3 1 0
2 ,
3 3 9
4 ,
8 2 7
8 ,
8 1 9
1 4 ,
3 9 5
2 9 ,
9 3 3
5 4
, 9 0 9
8 7 ,
5 9 6
1 7 5 0
3 1
6 5
1 2 4
2 5 7
3 8 8
7 5 5
1 ,
2 1 3
2 ,
1 6 5
4 ,
4 6 9
8 ,
1 6 5
1 3 ,
3 2 7
2 7 ,
7 1 3
5 0
, 8 3 6
8 1 ,
0 9 8
2 0 0 0
2 9
6 1
1 1 6
2 4 1
3 6 3
7 0 6
1 ,
1 3 5
2 ,
0 2 5
4 ,
1 8 0
7 ,
6 3 7
1 2 ,
4 6 6
2 5 ,
9 2 3
4 7
, 5 5 3
7 5 ,
8 6 0
2 5 0 0
2 6
5 4
1 0 4
2 1 5
3 2 5
6 3 2
1 ,
0 1 5
1 ,
8 1 1
3 ,
7 3 9
6 ,
8 3 1
1 1 ,
1 5 0
2 3 ,
1 8 6
4 2
, 5 3 3
6 7 ,
8 5 1
3 0 0 0
2 3
5 0
9 5
1 9 6
2 9 6
5 7 7
9 2 7
1 ,
6 5 4
3 ,
4 1 3
6 ,
2 3 6
1 0 ,
1 7 9
2 1 ,
1 6 6
3 8
, 8 2 7
6 1 ,
9 3 9
4 0 0 0
2 0
4 3
8 2
1 7 0
2 5 7
5 0 0
8 0 2
1 ,
4 3 2
2 ,
9 5 6
5 ,
4 0 1
8 ,
8 1 5
1 8 ,
3 3 0
3 3
, 6 2 5
5 3 ,
6 4 1
S o u r c e : R e p r i n t e d , w i t h p e r m i s
s i o n , f r o m d a t a d e v e l o p e d b y t h e B o s t o n c h a p t e r o f A S P E .
a I . D . ( i n t e r n a l d i a m e t e r ) b a s e d
o n s c h e d u l e 4 0 s t e e l p i p e .

8/12/2019 American Society of Plumbing Engineers Volume 2
http://slidepdf.com/reader/full/american-society-of-plumbing-engineers-volume-2 217/233
191Chapter 7— Fuel-Gas Piping Systems
W e y m o u t h F o r m u l a :
Q
=
1 6 . 0 4
( P 1
2 – P 2
2 ) × D
1 6 / 3
½
L S
W h e r e :
Q
=
G a s f l o w
( L 3 / s )
G i v e n :
P 1
=
1 3 . 8
I n
i t i a l p r e s s u r e o f t h e s y s t e m (
k P a )
D
=
I n t e r n a l p
i p e d i a m e t e r ( m m )
P 2
=
6 . 8 9
F i
n a l p r e s s u r e o f t h e s y s t e m (
k P a )
L
=
T o t a l e q u
i v a l e n t l e n g t h , l o n g e s t r u n o f p i p i n g
( m )
S
=
0 . 6
T h
e s p e c i f i c g r a v i t y o f t h e n a t u r a l g a s
S
=
S p e c i f i c g
r a v i t y o f t h e g a s
P 1
=
I n i t i a l p r e
s s u r e i n s y s t e m (
k P a )
P 2
=
F i n a l p r e s s u r e i n s y s t e m (
k P a )
T a b l e 7 - 5 ( M )
N a t u r a l G a s
P i p e S i z i n g T a b l e f o r G a s P r e
s s u r e > 6 . 8
9 5 k P a
P i p e S i z e — I n s i d e D i a m e t e r ( m m ) a
T o t a l
N o m i n a l
1 5
2 0
2 5
3 5
4 0
5 0
6 5
7 5
1 0 0
1 2 5
1 5 0
2 0 0
2
5 0
3 0 0
E q u i v a l e n t
A c t u a l
1 5 . 8
2 0 . 9
2 6 . 6
3 5 . 1
4 0 . 9
5 2 . 5
6 2 . 7
7 7 . 9
1 0 2 . 2
1 2 8 . 2
1 5 4 . 1
2 0 2 . 7
2 5 4 . 5
3 0 3 . 2
L e n g t h ( m )
C a p a c i t i e s ( L / s )
3 . 1
3 .
2 0
6 .
7 7
1 2 .
9
2 6 .
8
4 0 .
4
7 8 .
6
1 2 6 .
3
2 2 5 .
4
4 6 5 . 2
8 5 0 .
0
1 3 8 7 .
5
2 8 8 5 .
2
5 2 9 2 .
6
8 4 4 3 .
1
7 . 6
2 .
0 2
4 .
2 8
8 .
1 5
1 6 .
9
2 5 .
5
4 9 .
7
7 9 .
9
1 4 2 .
6
2 9 4 . 2
5 3 7 .
6
8 7 7 .
5
1 8 2 4 .
7
3 3 4 7 .
3
5 3 3 9 .
9
1 5 . 2
1 .
4 3
3 .
0 3
5 .
7 6
1 2 .
0
1 8 .
1
3 5 .
2
5 6 .
5
1 0 0 .
8
2 0 8 . 1
3 8 0 .
2
6 2 0 .
5
1 2 9 0 .
3
2 3 6 6 .
9
3 7 7 5 .
9
2 2 . 9
1 .
1 7
2 .
4 7
4 .
7 0
9 .
7 8
1 4 .
7
2 8 .
7
4 6 .
1
8 2 .
3
1 6 9 . 9
3 1 0 .
4
5 0 6 .
6
1 0 5 3 .
5
1 9 3 2 .
6
3 0 8 3 .
0
3 0 . 5
1 .
0 1
2 .
1 4
4 .
0 7
8 .
4 7
1 2 .
8
2 4 .
9
3 9 .
9
7 1 .
3
1 4 7 . 1
2 6 8 .
8
4 3 8 .
8
9 1 2 .
4
1 6 7 3 .
7
2 6 6 9 .
9
4 5 . 7
0 .
8 3
1 .
7 5
3 .
3 3
6 .
9 1
1 0 .
4
2 0 .
3
3 2 .
6
5 8 .
2
1 2 0 . 1
2 1 9 .
5
3 5 8 .
3
7 4 4 .
9
1 3 6 6 .
5
2 1 8 0 .
0
5 3 . 4
0 .
7 6
1 .
6 2
3 .
0 8
6 .
4 0
9 .
6 5
1 8 .
8
3 0 .
2
5 3 .
9
1 1 1 . 2
2 0 3 .
2
3 3 1 .
7
6 8 9 .
7
1 2 6 5 .
2
2 0 1 8 .
3
6 1 . 0
0 .
7 1
1 .
5 1
2 .
8 8
5 .
9 9
9 .
0 3
1 7 .
6
2 8 .
2
5 0 .
4
1 0 4 . 0
1 9 0 .
1
3 1 0 .
3
6 4 5 .
1
1 1 8 3 .
5
1 8 8 7 .
9
7 6 . 2
0 .
6 4
1 .
3 5
2 .
5 8
5 .
3 5
8 .
0 8
1 5 .
7
2 5 .
3
4 5 .
1
9 3 . 0
1 7 0 .
0
2 7 7 .
5
5 7 7 .
0
1 0 5 8 .
5
1 6 8 8 .
6
9 1 . 4
0 .
5 8
1 .
2 4
2 .
3 5
4 .
8 9
7 .
3 7
1 4 .
4
2 3 .
1
4 1 .
2
8 4 . 9
1 5 5 .
2
2 5 3 .
3
5 2 6 .
8
9 6 6 .
3
1 5 4 1 .
5
1 2 1 . 9
0 .
5 1
1 .
0 7
2 .
0 4
4 .
2 3
6 .
3 9
1 2 .
4
2 0 .
0
3 5 .
6
7 3 . 6
1 3 4 .
4
2 1 9 .
4
4 5 6 .
2
8 3 6 .
8
1 3 3 5 .
0
1 5 2 . 4
0 .
4 5
0 .
9 6
1 .
8 2
3 .
7 9
5 .
7 1
1 1 .
1
1 7 .
9
3 1 .
9
6 5 . 8
1 2 0 .
2
1 9 6 .
2
4 0 8 .
0
7 4 8 .
5
1 1 9 4 .
0
1 8 2 . 9
0 .
4 1
0 .
8 7
1 .
6 6
3 .
4 6
5 .
2 1
1 0 .
2
1 6 .
3
2 9 .
1
6 0 . 1
1 0 9 .
7
1 7 9 .
1
3 7 2 .
5
6 8 3 .
3
1 0 9 0 .
0
2 2 8 . 6
0 .
3 7
0 .
7 8
1 .
4 9
3 .
0 9
4 .
6 6
9 .
0 8
1 4 .
6
2 6 .
0
5 3 . 7
9 8 .
2
1 6 0 .
2
3 3 3 .
2
6
1 1 .
1
9 7 4 .
9
3 0 4 . 8
0 .
3 2
0 .
6 8
1 .
2 9
2 .
6 8
4 .
0 4
7 .
8 6
1 2 .
6
2 2 .
5
4 6 . 5
8 5 .
0
1 3 8 .
8
2 8 8 .
5
5 2 9 .
3
8 4 4 .
3
3 8 1 . 0
0 .
2 9
0 .
6 1
1 .
1 5
2 .
3 9
3 .
6 1
7 .
0 3
1 1 .
3
2 0 .
2
4 1 . 6
7 6 .
0
1 2 4 .
1
2 5 8 .
1
4 7 3 .
4
7 5 5 .
2
4 5 7 . 2
0 .
2 6
0 .
5 5
1 .
0 5
2 .
1 9
3 .
3 0
6 .
4 2
1 0 .
3
1 8 .
4
3 8 . 0
6 9 .
4
1 1 3 .
3
2 3 5 .
6
4 3 2 .
1
6 8 9 .
4
5 3 3 . 4
0 .
2 4
0 .
5 1
0 .
9 7
2 .
0 2
3 .
0 5
5 .
9 4
9 .
5 5
1 7 .
0
3 5 . 2
6 4 .
3
1 0 4 .
9
2 1 8 .
1
4 0 0 .
1
6 3 8 .
2
6 0 9 . 6
0 .
2 3
0 .
4 8
0 .
9 1
1 .
8 9
2 .
8 6
5 .
5 6
8 .
9 3
1 5 .
9
3 2 . 9
6 0 .
1
9 8 .
1
2 0 4 .
0
3 7 4 .
2
5 9 7 .
0
7 6 2 . 0
0 .
2 0
0 .
4 3
0 .
8 1
1 .
6 9
2 .
5 5
4 .
9 7
7 .
9 9
1 4 .
3
2 9 . 4
5 3 .
8
8 7 .
8
1 8 2 .
5
3 3 4 .
7
5 3 4 .
0
9 1 4 . 4
0 .
1 8
0 .
3 9
0 .
7 4
1 .
5 5
2 .
3 3
4 .
5 4
7 .
2 9
1 3 .
0
2 6 . 9
4 9 .
1
8 0 .
1
1 6 6 .
6
3 0 5 .
6
4 8 7 .
5
1 2 1 9 . 2
0 .
1 6
0 .
3 4
0 .
6 4
1 .
3 4
2 .
0 2
3 .
9 3
6 .
3 2
1 1 .
3
2 3 . 3
4 2 .
5
6 9 .
4
1 4 4 .
3
2 6 4 .
6
4 2 2 .
2
S o u r c e : R e p r i n t e d , w i t h p e r m i s
s i o n , f r o m d a t a d e v e l o p e d b y t h e B o s t o n c h a p t e r o f A S P E .
a I . D . ( i n t e r n a l d i a m e t e r ) b a s e d
o n s c h e d u l e 4 0 s t e e l p i p e .

8/12/2019 American Society of Plumbing Engineers Volume 2
http://slidepdf.com/reader/full/american-society-of-plumbing-engineers-volume-2 218/233
ASPE Data Book — Volume 2192
Enter chart at left, with cubic feet per hour (liters per second), move horizontally to pipe diameter line, drop perpendicularly to length line and movehorizontally to read pressure drop at right.
Figure 7-3 Pipe Sizing, Low Pressure System with an Initial Pressure Up to 1 psi (6.9 kPa)
Source : Reprinted from data developed by the Pacific Gas and Electric Company.
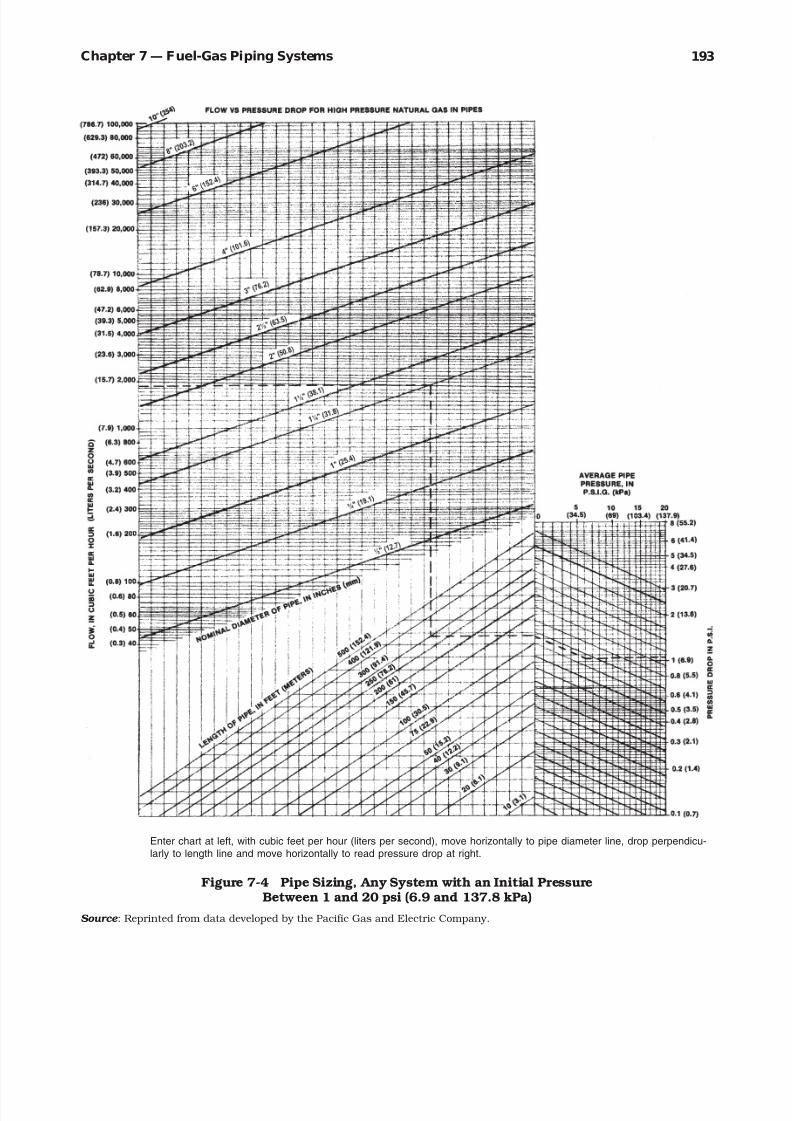
8/12/2019 American Society of Plumbing Engineers Volume 2
http://slidepdf.com/reader/full/american-society-of-plumbing-engineers-volume-2 219/233
193Chapter 7— Fuel-Gas Piping Systems
Enter chart at left, with cubic feet per hour (liters per second), move horizontally to pipe diameter line, drop perpendicu-larly to length line and move horizontally to read pressure drop at right.
Figure 7-4 Pipe Sizing, Any System with an Initial PressureBetween 1 and 20 psi (6.9 and 137.8 kPa)
Source : Reprinted from data developed by the Pacific Gas and Electric Company.

8/12/2019 American Society of Plumbing Engineers Volume 2
http://slidepdf.com/reader/full/american-society-of-plumbing-engineers-volume-2 220/233
ASPE Data Book — Volume 2194
Many codes, including American NationalStandards Institute (ANSI) Z223.1 and NFPA 54,recommend the same procedures detailed above,except for Step 7. These codes recommend uti-lizing the same maximum distance column for all branch lines regardless of the exact distancefrom the meter. Steps 3 and 4 of the example
would be, from Table 7-3 on the 750-ft (230.7-m) column carrying 450 cfh (3.5 L/s) for Section4 and 1800 cfh (14.2 L/s) for section 5, pipe sizesof 2½ in. (63.5 mm) and 4 in. (91.2 mm), respec-tively. The designer should investigate the localcode and apply the appropriate sizing procedure.
Therefore, for gas pressures less than 1 psi(6.895 kPa), use Appendix Table 7-A7 and for gas pressures less than 1.5 psi (10.3 kPa), use
Tables 7-3 or 7-4. For sizing systems with morethan 1 psi (6.9 kPa) supply pressure, Tables 7-4
and 7-5 and Appendix Tables 7-A1 – A6 may beused. For sizing systems with less than 1 psi(6.9 kPa) pressure, Table 7-A7 may be used. Theuse of these tables is similar to that describedfor Table 7-3.
Occasionally, it is necessary to size a natu-ral gas distribution system for pressures other than the conventional low and medium pressuresalready discussed. Figures 7-3 and 7-4 are in-cluded for such applications. (Proprietary pipesizing calculators are available which also solvethe applicable equations.)
Figure 7-3 is for any low-pressure system with an initial pressure up to 1 psi (6.9 kPa) or 28 in. (711.2 mm) wc, and Figure 7-4 is for any system with an initial pressure between 1 and20 psi (6.9 and 137.8 kPa). These graphs can beused in two ways: one, to determine the pres-sure drop, and the other, to determine the pipesize.
Essentially, diversity can only be used todetermine the gas flow rate for a system whensuch a system serves laboratories, as previously discussed, or cooking appliances. Diversity can-not be applied to water heating or space heating
appliances because these appliances will, at times, simultaneously demand full capacity gasflows. For more than 25 years, however, many codes have recognized that, in multifamily build-ings, the demand is always less than the totalconnected load when gas is used for cooking.Figures 7-5 and 7-6 indicate the percentage of the maximum possible demand (diversity) that can be expected, based on the number of unitsin the system.
LIQUEFIED PETROLEUM GAS
Liquefied petroleum gas (LPG) is a refined natu-ral gas developed mainly for use beyond theutilities’ gas mains, but it has proven to be com-petitive within the areas not covered by mainsin rural areas. It is chiefly a blend of propaneand butane with traces of other hydrocarbonsremaining from the various production methods.
The exact blend is controlled by the LPG dis-tributor to match the climatic conditions of thearea served. For this reason, the engineer must confirm the heat value of the supplied gas. Un-like natural gas, LPG has a specific gravity of 1.53 and a rating of 2500 Btu/cf (93 MJ/cm3).
The compact storage for relatively large quan-tities of energy has led to widespread acceptanceand usage of LPG in all areas previously served
by utilities providing other gas to users, includ-ing automotive users.
Storage
The LPG storage tanks can be provided by the vendor or the customer and are subject to theregulations of the US Department of Transpor-tation (DOT) and the local authority, as well asNFPA standards, so the plumbing designer haslittle opportunity to design storage tanks andpiping, per se. Normally, the designer starts at the storage supply outlet, and the piping system
is generally in the low-pressure, 11 in. (279 mm) wc, range. Piping must be designed so that thereis no more than 2 in. (50 mm) wc pressure dropat any outlet in the system. Gas pipes may be sized in accordance with NFPA 54, which is ac-cepted by most jurisdictions.
Small tanks (for example, those for residen-tial cooking and heating) are allowed to be locatedin close proximity to buildings. Large tanks (e.g.,for industrial or multiple building use), however,have strict requirements governing their loca-tion in relation to buildings, public use areas,and property lines. If large leaks occur, the
heavier-than-air gas will hug the ground andform a fog. The potential for a hazardous condi-tion could exist. Proper safety precautions andequipment, as well as good judgment, must beutilized when locating large LPG storage tanks.
Note : The following is only a very brief out-line and is not intended to be used in lieu of NFPA 54. The designer must use the current ac-cepted edition.

8/12/2019 American Society of Plumbing Engineers Volume 2
http://slidepdf.com/reader/full/american-society-of-plumbing-engineers-volume-2 221/233

8/12/2019 American Society of Plumbing Engineers Volume 2
http://slidepdf.com/reader/full/american-society-of-plumbing-engineers-volume-2 222/233

8/12/2019 American Society of Plumbing Engineers Volume 2
http://slidepdf.com/reader/full/american-society-of-plumbing-engineers-volume-2 223/233
197Chapter 7— Fuel-Gas Piping Systems
Warning
The fact that LPG vapors are heavier than air has a practical bearing on several items. For onething, LPG systems are located in such a man-ner that the hazard of escaping gas is kept at a
minimum.
Since the heavier-than-air gas tends to settlein low places, the vent termination of relief valvesmust be located at a safe distance from open-ings into buildings that are below the level of such valves. With many gas systems, for ex-ample, both the gas pressure regulator and thefuel containers are installed adjacently to the
building they serve. This distance must be a least 3 ft (0.91 m) measured horizontally. However,the required clearances vary according to thetank size and the adjacent activities. The designer should refer to the local code and NFPA 54 for these clearances.
The slope of flash tubes used in connection with lighting devices is determined by the spe-cific gravity of the gas. With propane, for example,the tubes are slanted downward from the burner to the ignition source as the heavier-than-air gastends to flow downward when released. Auto-matic appliances are normally equipped withsafety pilots, which shut off the flow of gas inthe event of pilot failure. With lighter-than-air gases, the automatic shut-off valve usually cutsoff the gas to the main burner only, leaving the
pilot burner unprotected. The small amount of gas that is released is discharged through the vent or otherwise dissipated. With LPG, however,gas escaping from the pilot would tend to collect in a low place and be a hazard. For this reason,LPG appliances are normally equipped with 100%safety pilots, which shut off the gas to both themain burner and the pilot in the event of pilot failure.
When LPG piping is installed in crawl spacesor in pipe tunnels, the engineer may consider a “sniffer ” system, which automatically shuts downthe gas supply, sounds an alarm, and activates
an exhaust system to purge the escaping gas fromthe area.
Leak Test
Prior to charging the new piping with LPG, a satisfactory leak test must be conducted. Thedesigner should refer to the applicable local codeand NFPA 54 for test requirements.
APPENDIX A
The following gas pipe sizing tables (Tables 7-A1through 7-A7) are for varying gas pressures in
both inch-pound (IP) and international standard(SI) units.
These tables are based on the use of sched-ule 40 black steel pipe with threaded joints.
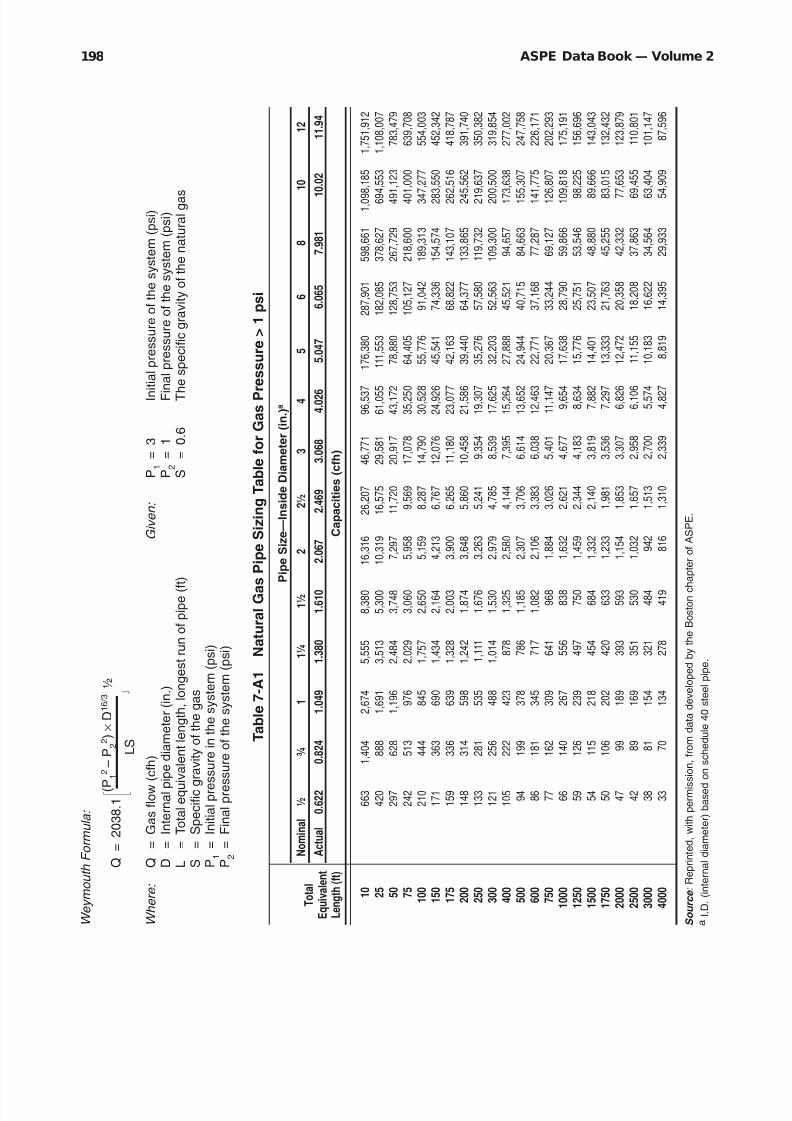
8/12/2019 American Society of Plumbing Engineers Volume 2
http://slidepdf.com/reader/full/american-society-of-plumbing-engineers-volume-2 224/233
ASPE Data Book — Volume 2198
W e y m o u t h F o r m u l a :
Q
=
2 0 3 8 . 1
( P
1 2 – P 2
2 ) × D
1 6 / 3
½
L S
W h e r e :
Q
=
G a s f l o w
( c f h )
G i v e n :
P 1
=
3
I n i t i a l p r e s s u r e o f t h e s y s t e m ( p s i )
D
=
I n t e r n a l p
i p e d i a m e t e r ( i n . )
P 2
=
1
F i n a l p r e s s u r e o f t h e s y s t e m ( p s i )
L
=
T o t a l e q u
i v a l e n t l e n g t h , l o n g e s t r u n o f p i p e ( f t )
S
=
0 . 6
T h
e s p e c i f i c g r a v i t y o f t h e n a t u r a l g a s
S
=
S p e c i f i c g
r a v i t y o f t h e g a s
P 1
=
I n i t i a l p r e
s s u r e i n t h e s y s t e m ( p s i )
P 2
=
F i n a l p r e s s u r e o f t h e s y s t e m ( p s i )
T a b l e 7 - A 1
N a t u r a l G a
s P i p e S i z i n g T a b l e f o r G a s P r e s s u r e > 1 p s i
P i p e S i z e — I n s i d e D i a m e t e r ( i n . )
a
T o t a l
N o m i n a l
½
¾
1
1 ¼
1 ½
2
2 ½
3
4
5
6
8
1 0
1 2
E q u i v a l e n t
A c t u a l
0 . 6 2 2
0 . 8 2 4
1 . 0 4 9
1 . 3 8 0
1 . 6 1 0
2 . 0 6 7
2 . 4 6 9
3 . 0 6 8
4 . 0 2 6
5 . 0 4 7
6 . 0 6 5
7 . 9 8 1
1
0 . 0 2
1 1 . 9 4
L e n g t h ( f t )
C a p a c i t i e s ( c f h )
1 0
6 6 3
1 ,
4 0 4
2 ,
6 7 4
5 ,
5 5 5
8 ,
3 8 0
1 6 ,
3 1 6
2 6 ,
2 0 7
4 6 ,
7 7 1
9 6 ,
5 3
7
1 7 6 ,
3 8 0
2 8 7 ,
9 0 1
5 9 8 ,
6 6 1
1 ,
0 9
8 ,
1 8 5
1 ,
7 5 1 ,
9 1 2
2 5
4 2 0
8 8 8
1 ,
6 9 1
3 ,
5 1 3
5 ,
3 0 0
1 0 ,
3 1 9
1 6 ,
5 7 5
2 9 ,
5 8 1
6 1 ,
0 5
5
1 1 1 ,
5 5 3
1 8 2 ,
0 8 5
3 7 8 ,
6 2 7
6 9
4 ,
5 5 3
1 ,
1 0 8 ,
0 0 7
5 0
2 9 7
6 2 8
1 ,
1 9 6
2 ,
4 8 4
3 ,
7 4 8
7 ,
2 9 7
1 1 ,
7 2 0
2 0 ,
9 1 7
4 3 ,
1 7
2
7 8 ,
8 8 0
1 2 8 ,
7 5 3
2 6 7 ,
7 2 9
4 9
1 ,
1 2 3
7 8 3 ,
4 7 9
7 5
2 4 2
5 1 3
9 7 6
2 ,
0 2 9
3 ,
0 6 0
5 ,
9 5 8
9 ,
5 6 9
1 7 ,
0 7 8
3 5 ,
2 5
0
6 4 ,
4 0 5
1 0 5 ,
1 2 7
2 1 8 ,
6 0 0
4 0
1 ,
0 0 0
6 3 9 ,
7 0 8
1 0 0
2 1 0
4 4 4
8 4 5
1 ,
7 5 7
2 ,
6 5 0
5 ,
1 5 9
8 ,
2 8 7
1 4 ,
7 9 0
3 0 ,
5 2
8
5 5 ,
7 7 6
9 1 ,
0 4 2
1 8 9 ,
3 1 3
3 4
7 ,
2 7 7
5 5 4 ,
0 0 3
1 5 0
1 7 1
3 6 3
6 9 0
1 ,
4 3 4
2 ,
1 6 4
4 ,
2 1 3
6 ,
7 6 7
1 2 ,
0 7 6
2 4 ,
9 2
6
4 5 ,
5 4 1
7 4 ,
3 3 6
1 5 4 ,
5 7 4
2 8
3 ,
5 5 0
4 5 2 ,
3 4 2
1 7 5
1 5 9
3 3 6
6 3 9
1 ,
3 2 8
2 ,
0 0 3
3 ,
9 0 0
6 ,
2 6 5
1 1 ,
1 8 0
2 3 ,
0 7
7
4 2 ,
1 6 3
6 8 ,
8 2 2
1 4 3 ,
1 0 7
2 6
2 ,
5 1 6
4 1 8 ,
7 8 7
2 0 0
1 4 8
3 1 4
5 9 8
1 ,
2 4 2
1 ,
8 7 4
3 ,
6 4 8
5 ,
8 6 0
1 0 ,
4 5 8
2 1 ,
5 8
6
3 9 ,
4 4 0
6 4 ,
3 7 7
1 3 3 ,
8 6 5
2 4
5 ,
5 6 2
3 9 1 ,
7 4 0
2 5 0
1 3 3
2 8 1
5 3 5
1 ,
1 1 1
1 ,
6 7 6
3 ,
2 6 3
5 ,
2 4 1
9 ,
3 5 4
1 9 ,
3 0
7
3 5 ,
2 7 6
5 7 ,
5 8 0
1 1 9 ,
7 3 2
2 1
9 ,
6 3 7
3 5 0 ,
3 8 2
3 0 0
1 2 1
2 5 6
4 8 8
1 ,
0 1 4
1 ,
5 3 0
2 ,
9 7 9
4 ,
7 8 5
8 ,
5 3 9
1 7 ,
6 2
5
3 2 ,
2 0 3
5 2 ,
5 6 3
1 0 9 ,
3 0 0
2 0
0 ,
5 0 0
3 1 9 ,
8 5 4
4 0 0
1 0 5
2 2 2
4 2 3
8 7 8
1 ,
3 2 5
2 ,
5 8 0
4 ,
1 4 4
7 ,
3 9 5
1 5 ,
2 6
4
2 7 ,
8 8 8
4 5 ,
5 2 1
9 4 ,
6 5 7
1 7
3 ,
6 3 8
2 7 7 ,
0 0 2
5 0 0
9 4
1 9 9
3 7 8
7 8 6
1 ,
1 8 5
2 ,
3 0 7
3 ,
7 0 6
6 ,
6 1 4
1 3 ,
6 5
2
2 4 ,
9 4 4
4 0 ,
7 1 5
8 4 ,
6 6 3
1 5
5 ,
3 0 7
2 4 7 ,
7 5 8
6 0 0
8 6
1 8 1
3 4 5
7 1 7
1 ,
0 8 2
2 ,
1 0 6
3 ,
3 8 3
6 ,
0 3 8
1 2 ,
4 6
3
2 2 ,
7 7 1
3 7 ,
1 6 8
7 7 ,
2 8 7
1 4
1 ,
7 7 5
2 2 6 ,
1 7 1
7 5 0
7 7
1 6 2
3 0 9
6 4 1
9 6 8
1 ,
8 8 4
3 ,
0 2 6
5 ,
4 0 1
1 1 ,
1 4
7
2 0 ,
3 6 7
3 3 ,
2 4 4
6 9 ,
1 2 7
1 2
6 ,
8 0 7
2 0 2 ,
2 9 3
1 0 0 0
6 6
1 4 0
2 6 7
5 5 6
8 3 8
1 ,
6 3 2
2 ,
6 2 1
4 ,
6 7 7
9 ,
6 5
4
1 7 ,
6 3 8
2 8 ,
7 9 0
5 9 ,
8 6 6
1 0
9 ,
8 1 8
1 7 5 ,
1 9 1
1 2 5 0
5 9
1 2 6
2 3 9
4 9 7
7 5 0
1 ,
4 5 9
2 ,
3 4 4
4 ,
1 8 3
8 ,
6 3
4
1 5 ,
7 7 6
2 5 ,
7 5 1
5 3 ,
5 4 6
9
8 ,
2 2 5
1 5 6 ,
6 9 6
1 5 0 0
5 4
1 1 5
2 1 8
4 5 4
6 8 4
1 ,
3 3 2
2 ,
1 4 0
3 ,
8 1 9
7 ,
8 8
2
1 4 ,
4 0 1
2 3 ,
5 0 7
4 8 ,
8 8 0
8
9 ,
6 6 6
1 4 3 ,
0 4 3
1 7 5 0
5 0
1 0 6
2 0 2
4 2 0
6 3 3
1 ,
2 3 3
1 ,
9 8 1
3 ,
5 3 6
7 ,
2 9
7
1 3 ,
3 3 3
2 1 ,
7 6 3
4 5 ,
2 5 5
8
3 ,
0 1 5
1 3 2 ,
4 3 2
2 0 0 0
4 7
9 9
1 8 9
3 9 3
5 9 3
1 ,
1 5 4
1 ,
8 5 3
3 ,
3 0 7
6 ,
8 2
6
1 2 ,
4 7 2
2 0 ,
3 5 8
4 2 ,
3 3 2
7
7 ,
6 5 3
1 2 3 ,
8 7 9
2 5 0 0
4 2
8 9
1 6 9
3 5 1
5 3 0
1 ,
0 3 2
1 ,
6 5 7
2 ,
9 5 8
6 ,
1 0
6
1 1 ,
1 5 5
1 8 ,
2 0 8
3 7 ,
8 6 3
6
9 ,
4 5 5
1 1 0 ,
8 0 1
3 0 0 0
3 8
8 1
1 5 4
3 2 1
4 8 4
9 4 2
1 ,
5 1 3
2 ,
7 0 0
5 ,
5 7
4
1 0 ,
1 8 3
1 6 ,
6 2 2
3 4 ,
5 6 4
6
3 ,
4 0 4
1 0 1 ,
1 4 7
4 0 0 0
3 3
7 0
1 3 4
2 7 8
4 1 9
8 1 6
1 ,
3 1 0
2 ,
3 3 9
4 ,
8 2
7
8 ,
8 1 9
1 4 ,
3 9 5
2 9 ,
9 3 3
5
4 ,
9 0 9
8 7 ,
5 9 6
S o u r c e : R e p r i n t e d , w i t h p e r m i s
s i o n , f r o m d a t a d e v e l o p e d b y t h e B o s t o n c h a p t e r o f A S P E .
a I . D . ( i n t e r n a l d i a m e t e r ) b a s e d
o n s c h e d u l e 4 0 s t e e l p i p e .

8/12/2019 American Society of Plumbing Engineers Volume 2
http://slidepdf.com/reader/full/american-society-of-plumbing-engineers-volume-2 225/233
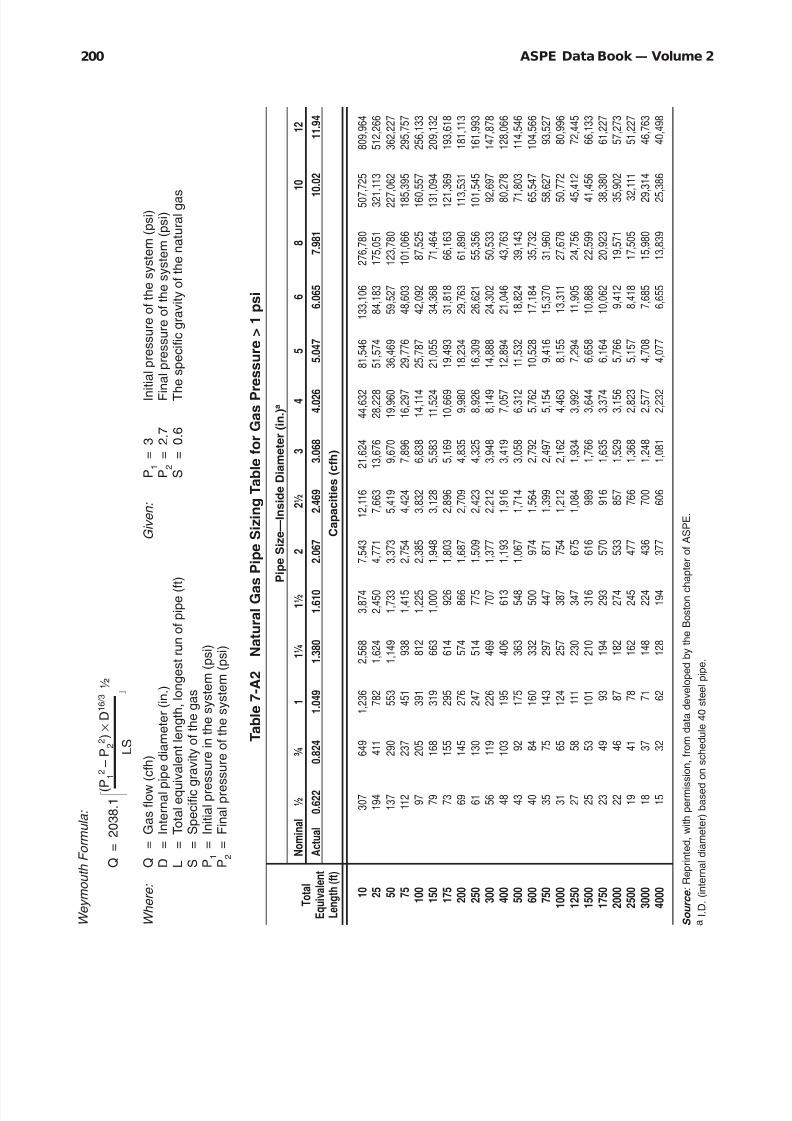
8/12/2019 American Society of Plumbing Engineers Volume 2
http://slidepdf.com/reader/full/american-society-of-plumbing-engineers-volume-2 226/233
ASPE Data Book — Volume 2200
W e y m o u t h F o r m u l a :
Q
=
2 0 3 8 . 1
( P
1 2 – P 2
2 ) × D
1 6 / 3
½
L S
W h e r e :
Q
=
G a s f l o w
( c f h )
G i v e n :
P 1
=
3
I n i t i a l p r e s s u r e o f t h e s y s t e m ( p s i )
D
=
I n t e r n a l p
i p e d i a m e t e r ( i n . )
P 2
=
2 . 7
F i n a l p r e s s u r e o f t h e s y s t e m ( p s i )
L
=
T o t a l e q u
i v a l e n t l e n g t h , l o n g e s t r u n o f p i p e ( f t )
S
=
0 . 6
T h
e s p e c i f i c g r a v i t y o f t h e n a t u r a l g a s
S
=
S p e c i f i c g
r a v i t y o f t h e g a s
P 1
=
I n i t i a l p r e
s s u r e i n t h e s y s t e m ( p s i )
P 2
=
F i n a l p r e s s u r e o f t h e s y s t e m ( p s i )
T a b l e 7 - A 2
N a t u r a l G a
s P i p e S i z i n g T a b l e f o r G a s P r e s s u r e > 1 p s i
P i p e S i z e — I n s i d e D i a m e t e r ( i n . )
a
T o t a l
N o m i n a l
½
¾
1
1 ¼
1 ½
2
2 ½
3
4
5
6
8
1 0
1 2
E q u i v a l e n t
A c t u a l
0 . 6 2 2
0 . 8 2 4
1 . 0 4 9
1 . 3 8 0
1 . 6 1 0
2 . 0 6 7
2 . 4 6 9
3 . 0 6 8
4 . 0 2 6
5 . 0 4 7
6 . 0 6 5
7 . 9 8 1
1
0 . 0 2
1 1 . 9 4
L e n g t h ( f t )
C a p a c i t i e s ( c f h )
1 0
3 0 7
6 4 9
1 ,
2 3 6
2 ,
5 6 8
3 ,
8 7 4
7 ,
5 4 3
1 2 ,
1 1 6
2 1 ,
6 2 4
4 4 ,
6 3 2
8 1 ,
5 4 6
1 3 3 ,
1 0 6
2 7 6 ,
7 8 0
5 0 7
, 7 2 5
8 0 9 ,
9 6 4
2 5
1 9 4
4 1 1
7 8 2
1 ,
6 2 4
2 ,
4 5 0
4 ,
7 7 1
7 ,
6 6 3
1 3 ,
6 7 6
2 8 ,
2 2 8
5 1 ,
5 7 4
8 4 ,
1 8 3
1 7 5 ,
0 5 1
3 2 1 ,
1 1 3
5 1 2 ,
2 6 6
5 0
1 3 7
2 9 0
5 5 3
1 ,
1 4 9
1 ,
7 3 3
3 ,
3 7 3
5 ,
4 1 9
9 ,
6 7 0
1 9 ,
9 6 0
3 6 ,
4 6 9
5 9 ,
5 2 7
1 2 3 ,
7 8 0
2 2 7
, 0 6 2
3 6 2 ,
2 2 7
7 5
1 1 2
2 3 7
4 5 1
9 3 8
1 ,
4 1 5
2 ,
7 5 4
4 ,
4 2 4
7 ,
8 9 6
1 6 ,
2 9 7
2 9 ,
7 7 6
4 8 ,
6 0 3
1 0 1 ,
0 6 6
1 8 5
, 3 9 5
2 9 5 ,
7 5 7
1 0 0
9 7
2 0 5
3 9 1
8 1 2
1 ,
2 2 5
2 ,
3 8 5
3 ,
8 3 2
6 ,
8 3 8
1 4 ,
1 1 4
2 5 ,
7 8 7
4 2 ,
0 9 2
8 7 ,
5 2 5
1 6 0
, 5 5 7
2 5 6 ,
1 3 3
1 5 0
7 9
1 6 8
3 1 9
6 6 3
1 ,
0 0 0
1 ,
9 4 8
3 ,
1 2 8
5 ,
5 8 3
1 1 ,
5 2 4
2 1 ,
0 5 5
3 4 ,
3 6 8
7 1 ,
4 6 4
1 3 1
, 0 9 4
2 0 9 ,
1 3 2
1 7 5
7 3
1 5 5
2 9 5
6 1 4
9 2 6
1 ,
8 0 3
2 ,
8 9 6
5 ,
1 6 9
1 0 ,
6 6 9
1 9 ,
4 9 3
3 1 ,
8 1 8
6 6 ,
1 6 3
1 2 1
, 3 6 9
1 9 3 ,
6 1 8
2 0 0
6 9
1 4 5
2 7 6
5 7 4
8 6 6
1 ,
6 8 7
2 ,
7 0 9
4 ,
8 3 5
9 ,
9 8 0
1 8 ,
2 3 4
2 9 ,
7 6 3
6 1 ,
8 9 0
1 1 3
, 5 3 1
1 8 1 ,
1 1 3
2 5 0
6 1
1 3 0
2 4 7
5 1 4
7 7 5
1 ,
5 0 9
2 ,
4 2 3
4 ,
3 2 5
8 ,
9 2 6
1 6 ,
3 0 9
2 6 ,
6 2 1
5 5 ,
3 5 6
1 0 1
, 5 4 5
1 6 1 ,
9 9 3
3 0 0
5 6
1 1 9
2 2 6
4 6 9
7 0 7
1 ,
3 7 7
2 ,
2 1 2
3 ,
9 4 8
8 ,
1 4 9
1 4 ,
8 8 8
2 4 ,
3 0 2
5 0 ,
5 3 3
9 2
, 6 9 7
1 4 7 ,
8 7 8
4 0 0
4 8
1 0 3
1 9 5
4 0 6
6 1 3
1 ,
1 9 3
1 ,
9 1 6
3 ,
4 1 9
7 ,
0 5 7
1 2 ,
8 9 4
2 1 ,
0 4 6
4 3 ,
7 6 3
8 0
, 2 7 8
1 2 8 ,
0 6 6
5 0 0
4 3
9 2
1 7 5
3 6 3
5 4 8
1 ,
0 6 7
1 ,
7 1 4
3 ,
0 5 8
6 ,
3 1 2
1 1 ,
5 3 2
1 8 ,
8 2 4
3 9 ,
1 4 3
7 1
, 8 0 3
1 1 4 ,
5 4 6
6 0 0
4 0
8 4
1 6 0
3 3 2
5 0 0
9 7 4
1 ,
5 6 4
2 ,
7 9 2
5 ,
7 6 2
1 0 ,
5 2 8
1 7 ,
1 8 4
3 5 ,
7 3 2
6 5
, 5 4 7
1 0 4 ,
5 6 6
7 5 0
3 5
7 5
1 4 3
2 9 7
4 4 7
8 7 1
1 ,
3 9 9
2 ,
4 9 7
5 ,
1 5 4
9 ,
4 1 6
1 5 ,
3 7 0
3 1 ,
9 6 0
5 8
, 6 2 7
9 3 ,
5 2 7
1 0 0 0
3 1
6 5
1 2 4
2 5 7
3 8 7
7 5 4
1 ,
2 1 2
2 ,
1 6 2
4 ,
4 6 3
8 ,
1 5 5
1 3 ,
3 1 1
2 7 ,
6 7 8
5 0
, 7 7 2
8 0 ,
9 9 6
1 2 5 0
2 7
5 8
1 1 1
2 3 0
3 4 7
6 7 5
1 ,
0 8 4
1 ,
9 3 4
3 ,
9 9 2
7 ,
2 9 4
1 1 ,
9 0 5
2 4 ,
7 5 6
4 5
, 4 1 2
7 2 ,
4 4 5
1 5 0 0
2 5
5 3
1 0 1
2 1 0
3 1 6
6 1 6
9 8 9
1 ,
7 6 6
3 ,
6 4 4
6 ,
6 5 8
1 0 ,
8 6 8
2 2 ,
5 9 9
4 1
, 4 5 6
6 6 ,
1 3 3
1 7 5 0
2 3
4 9
9 3
1 9 4
2 9 3
5 7 0
9 1 6
1 ,
6 3 5
3 ,
3 7 4
6 ,
1 6 4
1 0 ,
0 6 2
2 0 ,
9 2 3
3 8
, 3 8 0
6 1 ,
2 2 7
2 0 0 0
2 2
4 6
8 7
1 8 2
2 7 4
5 3 3
8 5 7
1 ,
5 2 9
3 ,
1 5 6
5 ,
7 6 6
9 ,
4 1 2
1 9 ,
5 7 1
3 5
, 9 0 2
5 7 ,
2 7 3
2 5 0 0
1 9
4 1
7 8
1 6 2
2 4 5
4 7 7
7 6 6
1 ,
3 6 8
2 ,
8 2 3
5 ,
1 5 7
8 ,
4 1 8
1 7 ,
5 0 5
3 2 ,
1 1 1
5 1 ,
2 2 7
3 0 0 0
1 8
3 7
7 1
1 4 8
2 2 4
4 3 6
7 0 0
1 ,
2 4 8
2 ,
5 7 7
4 ,
7 0 8
7 ,
6 8 5
1 5 ,
9 8 0
2 9
, 3 1 4
4 6 ,
7 6 3
4 0 0 0
1 5
3 2
6 2
1 2 8
1 9 4
3 7 7
6 0 6
1 ,
0 8 1
2 ,
2 3 2
4 ,
0 7 7
6 ,
6 5 5
1 3 ,
8 3 9
2 5
, 3 8 6
4 0 ,
4 9 8
S o u r c e : R e p r i n t e d , w i t h p e r m i s
s i o n , f r o m d a t a d e v e l o p e d b y t h e B o s t o n c h a p t e r o f A S P E .
a I . D . ( i n t e r n a l d i a m e t e r ) b a s e d
o n s c h e d u l e 4 0 s t e e l p i p e .

8/12/2019 American Society of Plumbing Engineers Volume 2
http://slidepdf.com/reader/full/american-society-of-plumbing-engineers-volume-2 227/233
201Chapter 7— Fuel-Gas Piping Systems
W e y m o u t h F o r m u l a :
Q
=
1 6 . 0 4
( P 1
2 – P 2
2 ) × D
1 6 / 3
½
L S
W h e r e :
Q
=
G a s f l o w
( L 3 / s )
G i v e n :
P 1
=
2 0 . 6 9
I n
i t i a l p r e s s u r e o f t h e s y s t e m (
k P a )
D
=
I n t e r n a l p
i p e d i a m e t e r ( m m )
P 2
=
1 8 . 6 2
F i
n a l p r e s s u r e o f t h e s y s t e m (
k P a )
L
=
T o t a l e q u
i v a l e n t l e n g t h , l o n g e s t r u n o f p i p i n g
( m )
S
=
0 . 6
T h
e s p e c i f i c g r a v i t y o f t h e n a t u r a l g a s
S
=
S p e c i f i c g
r a v i t y o f t h e g a s
P 1
=
I n i t i a l p r e
s s u r e i n s y s t e m (
k P a )
P 2
=
F i n a l p r e s s u r e i n s y s t e m (
k P a )
T a b l e 7 - A 2 ( M )
N a t u r a l G a s
P i p e S i z i n g T a b l e f o r G a s P r e s s u r e > 6 . 8
9 5 k P a
P i p e S i z e — I n s i d e D i a m e t e r ( m m ) a
T o t a l
N o m i n a l
1 5
2 0
2 5
3 5
4 0
5 0
6 5
7 5
1 0 0
1 2 5
1 5 0
2 0 0
2
5 0
3 0 0
E q u i v a l e n t
A c t u a l
1 5 . 8
2 0 . 9
2 6 . 6
3 5 . 1
4 0 . 9
5 2 . 5
6 2 . 7
7 7 . 9
1 0 2 . 2
1 2 8 . 2
1 5 4 . 1
2 0 2 . 7
2 5 4 . 5
3 0 3 . 2
L e n g t h ( m )
C a p a c i t i e s ( L / s )
3 . 1
2 .
4 1
5 .
1 1
9 .
7
2 0 .
2
3 0 .
5
5 9 .
4
9 5 .
4
1 7 0 .
2
3 5 1 . 3
6 4 1 .
8
1 0 4 7 .
5
2 1 7 8 .
3
3 9
9 5 .
8
6 3 7 4 .
4
7 . 6
1 .
5 3
3 .
2 3
6 .
1 5
1 2 .
8
1 9 .
3
3 7 .
5
6 0 .
3
1 0 7 .
6
2 2 2 . 2
4 0 5 .
9
6 6 2 .
5
1 3 7 7 .
6
2 5
2 7 .
2
4 0 3 1 .
5
1 5 . 2
1 .
0 8
2 .
2 9
4 .
3 5
9 .
0
1 3 .
6
2 6 .
5
4 2 .
6
7 6 .
1
1 5 7 . 1
2 8 7 .
0
4 6 8 .
5
9 7 4 .
1
1 7
8 7 .
0
2 8 5 0 .
7
2 2 . 9
0 .
8 8
1 .
8 7
3 .
5 5
7 .
3 8
1 1 .
1
2 1 .
7
3 4 .
8
6 2 .
1
1 2 8 . 3
2 3 4 .
3
3 8 2 .
5
7 9 5 .
4
1 4
5 9 .
1
2 3 2 7 .
6
3 0 . 5
0 .
7 6
1 .
6 2
3 .
0 8
6 .
3 9
9 .
6
1 8 .
8
3 0 .
2
5 3 .
8
1 1 1 . 1
2 0 2 .
9
3 3 1 .
3
6 8 8 .
8
1 2
6 3 .
6
2 0 1 5 .
8
4 5 . 7
0 .
6 2
1 .
3 2
2 .
5 1
5 .
2 2
7 .
9
1 5 .
3
2 4 .
6
4 3 .
9
9 0 . 7
1 6 5 .
7
2 7 0 .
5
5 6 2 .
4
1 0
3 1 .
7
1 6 4 5 .
9
5 3 . 4
0 .
5 8
1 .
2 2
2 .
3 3
4 .
8 3
7 .
2 9
1 4 .
2
2 2 .
8
4 0 .
7
8 4 . 0
1 5 3 .
4
2 5 0 .
4
5 2 0 .
7
9
5 5 .
2
1 5 2 3 .
8
6 1 . 0
0 .
5 4
1 .
1 4
2 .
1 8
4 .
5 2
6 .
8 2
1 3 .
3
2 1 .
3
3 8 .
1
7 8 . 5
1 4 3 .
5
2 3 4 .
2
4 8 7 .
1
8
9 3 .
5
1 4 2 5 .
4
7 6 . 2
0 .
4 8
1 .
0 2
1 .
9 5
4 .
0 4
6 .
1 0
1 1 .
9
1 9 .
1
3 4 .
0
7 0 . 3
1 2 8 .
4
2 0 9 .
5
4 3 5 .
7
7
9 9 .
2
1 2 7 4 .
9
9 1 . 4
0 .
4 4
0 .
9 3
1 .
7 8
3 .
6 9
5 .
5 7
1 0 .
8
1 7 .
4
3 1 .
1
6 4 . 1
1 1 7 .
2
1 9 1 .
3
3 9 7 .
7
7
2 9 .
5
1 1 6 3 .
8
1 2 1 . 9
0 .
3 8
0 .
8 1
1 .
5 4
3 .
2
4 .
8 2
9 .
4
1 5 .
1
2 6 .
9
5 5 . 5
1 0 1 .
5
1 6 5 .
6
3 4 4 .
4
6
3 1 .
8
1 0 0 7 .
9
1 5 2 . 4
0 .
3 4
0 .
7 2
1 .
3 8
2 .
8 6
4 .
3 1
8 .
4
1 3 .
5
2 4 .
1
4 9 . 7
9 0 .
8
1 4 8 .
1
3 0 8 .
1
5
6 5 .
1
9 0 1 .
5
1 8 2 . 9
0 .
3 1
0 .
6 6
1 .
2 6
2 .
6 1
3 .
9 4
7 .
7
1 2 .
3
2 2 .
0
4 5 . 3
8 2 .
9
1 3 5 .
2
2 8 1 .
2
5
1 5 .
9
8 2 2 .
9
2 2 8 . 6
0 .
2 8
0 .
5 9
1 .
1 2
2 .
3 3
3 .
5 2
6 .
8 5
1 1 .
0
1 9 .
7
4 0 . 6
7 4 .
1
1 2 1 .
0
2 5 1 .
5
4
6 1 .
4
7 3 6 .
1
3 0 4 . 8
0 .
2 4
0 .
5 1
0 .
9 7
2 .
0 2
3 .
0 5
5 .
9 4
9 .
5
1 7 .
0
3 5 . 1
6 4 .
2
1 0 4 .
8
2 1 7 .
8
3
9 9 .
6
6 3 7 .
4
3 8 1 . 0
0 .
2 2
0 .
4 6
0 .
8 7
1 .
8 1
2 .
7 3
5 .
3 1
8 .
5
1 5 .
2
3 1 . 4
5 7 .
4
9 3 .
7
1 9 4 .
8
3
5 7 .
4
5 7 0 .
1
4 5 7 . 2
0 .
2 0
0 .
4 2
0 .
7 9
1 .
6 5
2 .
4 9
4 .
8 5
7 .
8
1 3 .
9
2 8 . 7
5 2 .
4
8 5 .
5
1 7 7 .
9
3
2 6 .
3
5 2 0 .
5
5 3 3 . 4
0 .
1 8
0 .
3 9
0 .
7 4
1 .
5 3
2 .
3 0
4 .
4 9
7 .
2 1
1 2 .
9
2 6 . 6
4 8 .
5
7 9 .
2
1 6 4 .
7
3
0 2 .
1
4 8 1 .
9
6 0 9 . 6
0 .
1 7
0 .
3 6
0 .
6 9
1 .
4 3
2 .
1 6
4 .
2
6 .
7 4
1 2 .
0
2 4 . 8
4 5 .
4
7 4 .
1
1 5 4 .
0
2
8 2 .
5
4 5 0 .
7
7 6 2 . 0
0 .
1 5
0 .
3 2
0 .
6 2
1 .
2 8
1 .
9 3
3 .
7 5
6 .
0 3
1 0 .
8
2 2 . 2
4 0 .
6
6 6 .
3
1 3 7 .
8
2
5 2 .
7
4 0 3 .
2
9 1 4 . 4
0 .
1 4
0 .
3 0
0 .
5 6
1 .
1 7
1 .
7 6
3 .
4 3
5 .
5 1
9 .
8
2 0 . 3
3 7 .
1
6 0 .
5
1 2 5 .
8
2
3 0 .
7
3 6 8 .
0
1 2 1 9 . 2
0 .
1 2
0 .
2 6
0 .
4 9
1 .
0 1
1 .
5 2
2 .
9 7
4 .
7 7
8 .
5
1 7 . 6
3 2 .
1
5 2 .
4
1 0 8 .
9
1
9 9 .
8
3 1 8 .
7
S o u r c e : R e p r i n t e d , w i t h p e r m i s
s i o n , f r o m d a t a d e v e l o p e d b y t h e B o s t o n c h a p t e r o f A S P E .
a I . D . ( i n t e r n a l d i a m e t e r ) b a s e d
o n s c h e d u l e 4 0 s t e e l p i p e .
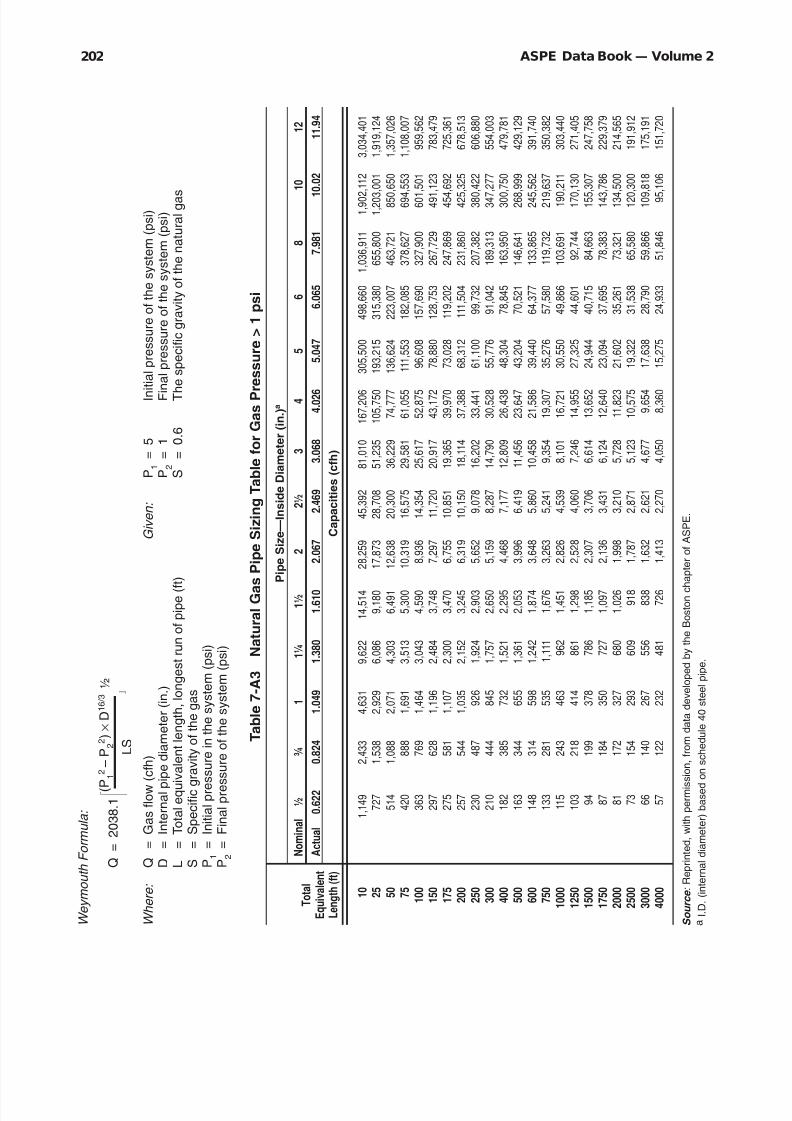
8/12/2019 American Society of Plumbing Engineers Volume 2
http://slidepdf.com/reader/full/american-society-of-plumbing-engineers-volume-2 228/233
ASPE Data Book — Volume 2202
W e y m o u t h F o r m u l a :
Q
=
2 0 3 8 . 1
( P
1 2 – P 2
2 ) × D
1 6 / 3
½
L S
W h e r e :
Q
=
G a s f l o w
( c f h )
G i v e n :
P 1
=
5
I n i t i a l p r e s s u r e o f t h e s y s t e m ( p s i )
D
=
I n t e r n a l p
i p e d i a m e t e r ( i n . )
P 2
=
1
F i n a l p r e s s u r e o f t h e s y s t e m ( p s i )
L
=
T o t a l e q u
i v a l e n t l e n g t h , l o n g e s t r u n o f p i p e ( f t )
S
=
0 . 6
T h
e s p e c i f i c g r a v i t y o f t h e n a t u r a l g a s
S
=
S p e c i f i c g
r a v i t y o f t h e g a s
P 1
=
I n i t i a l p r e
s s u r e i n t h e s y s t e m ( p s i )
P 2
=
F i n a l p r e s s u r e o f t h e s y s t e m ( p s i )
T a b l e 7 - A 3
N a t u r a l G a
s P i p e S i z i n g T a b l e f o r G a s P r e s s u r e > 1 p s i
P i p e S i z e — I n s i d e D i a m e t e r ( i n . )
a
T o t a l
N o m i n a l
½
¾
1
1 ¼
1 ½
2
2 ½
3
4
5
6
8
1 0
1 2
E q u i v a l e n t
A c t u a l
0 . 6 2 2
0 . 8 2 4
1 . 0 4 9
1 . 3 8 0
1 . 6 1 0
2 . 0 6 7
2 . 4 6 9
3 . 0 6 8
4 . 0 2 6
5 . 0 4 7
6 . 0 6 5
7 . 9 8 1
1
0 . 0 2
1 1 . 9 4
L e n g t h ( f t )
C a p a c i t i e s ( c f h )
1 0
1 ,
1 4 9
2 ,
4 3 3
4 ,
6 3 1
9 ,
6 2 2
1 4 ,
5 1 4
2 8 ,
2 5 9
4 5 ,
3 9 2
8 1 ,
0 1 0
1 6 7 ,
2 0 6
3 0 5 ,
5 0 0
4 9 8 ,
6 6 0
1 ,
0 3 6 ,
9 1 1
1 ,
9 0 2 ,
1 1 2
3 ,
0 3 4 ,
4 0 1
2 5
7 2 7
1 ,
5 3 8
2 ,
9 2 9
6 ,
0 8 6
9 ,
1 8 0
1 7 ,
8 7 3
2 8 ,
7 0 8
5 1 ,
2 3 5
1 0 5 ,
7 5 0
1 9 3 ,
2 1 5
3 1 5 ,
3 8 0
6 5 5 ,
8 0 0
1 ,
2 0 3
, 0 0 1
1 ,
9 1 9 ,
1 2 4
5 0
5 1 4
1 ,
0 8 8
2 ,
0 7 1
4 ,
3 0 3
6 ,
4 9 1
1 2 ,
6 3 8
2 0 ,
3 0 0
3 6 ,
2 2 9
7 4 ,
7 7 7
1 3 6 ,
6 2 4
2 2 3 ,
0 0 7
4 6 3 ,
7 2 1
8 5 0
, 6 5 0
1 ,
3 5 7 ,
0 2 6
7 5
4 2 0
8 8 8
1 ,
6 9 1
3 ,
5 1 3
5 ,
3 0 0
1 0 ,
3 1 9
1 6 ,
5 7 5
2 9 ,
5 8 1
6 1 ,
0 5 5
1 1 1 ,
5 5 3
1 8 2 ,
0 8 5
3 7 8 ,
6 2 7
6 9 4
, 5 5 3
1 ,
1 0 8 ,
0 0 7
1 0 0
3 6 3
7 6 9
1 ,
4 6 4
3 ,
0 4 3
4 ,
5 9 0
8 ,
9 3 6
1 4 ,
3 5 4
2 5 ,
6 1 7
5 2 ,
8 7 5
9 6 ,
6 0 8
1 5 7 ,
6 9 0
3 2 7 ,
9 0 0
6 0 1
, 5 0 1
9 5 9 ,
5 6 2
1 5 0
2 9 7
6 2 8
1 ,
1 9 6
2 ,
4 8 4
3 ,
7 4 8
7 ,
2 9 7
1 1 ,
7 2 0
2 0 ,
9 1 7
4 3 ,
1 7 2
7 8 ,
8 8 0
1 2 8 ,
7 5 3
2 6 7 ,
7 2 9
4 9 1
, 1 2 3
7 8 3 ,
4 7 9
1 7 5
2 7 5
5 8 1
1 ,
1 0 7
2 ,
3 0 0
3 ,
4 7 0
6 ,
7 5 5
1 0 ,
8 5 1
1 9 ,
3 6 5
3 9 ,
9 7 0
7 3 ,
0 2 8
1 1 9 ,
2 0 2
2 4 7 ,
8 6 9
4 5 4
, 6 9 2
7 2 5 ,
3 6 1
2 0 0
2 5 7
5 4 4
1 ,
0 3 5
2 ,
1 5 2
3 ,
2 4 5
6 ,
3 1 9
1 0 ,
1 5 0
1 8 ,
1 1 4
3 7 ,
3 8 8
6 8 ,
3 1 2
1 1 1 ,
5 0 4
2 3 1 ,
8 6 0
4 2 5
, 3 2 5
6 7 8 ,
5 1 3
2 5 0
2 3 0
4 8 7
9 2 6
1 ,
9 2 4
2 ,
9 0 3
5 ,
6 5 2
9 ,
0 7 8
1 6 ,
2 0 2
3 3 ,
4 4 1
6 1 ,
1 0 0
9 9 ,
7 3 2
2 0 7 ,
3 8 2
3 8 0
, 4 2 2
6 0 6 ,
8 8 0
3 0 0
2 1 0
4 4 4
8 4 5
1 ,
7 5 7
2 ,
6 5 0
5 ,
1 5 9
8 ,
2 8 7
1 4 ,
7 9 0
3 0 ,
5 2 8
5 5 ,
7 7 6
9 1 ,
0 4 2
1 8 9 ,
3 1 3
3 4 7
, 2 7 7
5 5 4 ,
0 0 3
4 0 0
1 8 2
3 8 5
7 3 2
1 ,
5 2 1
2 ,
2 9 5
4 ,
4 6 8
7 ,
1 7 7
1 2 ,
8 0 9
2 6 ,
4 3 8
4 8 ,
3 0 4
7 8 ,
8 4 5
1 6 3 ,
9 5 0
3 0 0
, 7 5 0
4 7 9 ,
7 8 1
5 0 0
1 6 3
3 4 4
6 5 5
1 ,
3 6 1
2 ,
0 5 3
3 ,
9 9 6
6 ,
4 1 9
1 1 ,
4 5 6
2 3 ,
6 4 7
4 3 ,
2 0 4
7 0 ,
5 2 1
1 4 6 ,
6 4 1
2 6 8
, 9 9 9
4 2 9 ,
1 2 9
6 0 0
1 4 8
3 1 4
5 9 8
1 ,
2 4 2
1 ,
8 7 4
3 ,
6 4 8
5 ,
8 6 0
1 0 ,
4 5 8
2 1 ,
5 8 6
3 9 ,
4 4 0
6 4 ,
3 7 7
1 3 3 ,
8 6 5
2 4 5
, 5 6 2
3 9 1 ,
7 4 0
7 5 0
1 3 3
2 8 1
5 3 5
1 ,
1 1 1
1 ,
6 7 6
3 ,
2 6 3
5 ,
2 4 1
9 ,
3 5 4
1 9 ,
3 0 7
3 5 ,
2 7 6
5 7 ,
5 8 0
1 1 9 ,
7 3 2
2 1 9
, 6 3 7
3 5 0 ,
3 8 2
1 0 0 0
1 1 5
2 4 3
4 6 3
9 6 2
1 ,
4 5 1
2 ,
8 2 6
4 ,
5 3 9
8 ,
1 0 1
1 6 ,
7 2 1
3 0 ,
5 5 0
4 9 ,
8 6 6
1 0 3 ,
6 9 1
1 9 0 ,
2 1 1
3 0 3 ,
4 4 0
1 2 5 0
1 0 3
2 1 8
4 1 4
8 6 1
1 ,
2 9 8
2 ,
5 2 8
4 ,
0 6 0
7 ,
2 4 6
1 4 ,
9 5 5
2 7 ,
3 2 5
4 4 ,
6 0 1
9 2 ,
7 4 4
1 7 0
, 1 3 0
2 7 1 ,
4 0 5
1 5 0 0
9 4
1 9 9
3 7 8
7 8 6
1 ,
1 8 5
2 ,
3 0 7
3 ,
7 0 6
6 ,
6 1 4
1 3 ,
6 5 2
2 4 ,
9 4 4
4 0 ,
7 1 5
8 4 ,
6 6 3
1 5 5
, 3 0 7
2 4 7 ,
7 5 8
1 7 5 0
8 7
1 8 4
3 5 0
7 2 7
1 ,
0 9 7
2 ,
1 3 6
3 ,
4 3 1
6 ,
1 2 4
1 2 ,
6 4 0
2 3 ,
0 9 4
3 7 ,
6 9 5
7 8 ,
3 8 3
1 4 3
, 7 8 6
2 2 9 ,
3 7 9
2 0 0 0
8 1
1 7 2
3 2 7
6 8 0
1 ,
0 2 6
1 ,
9 9 8
3 ,
2 1 0
5 ,
7 2 8
1 1 ,
8 2 3
2 1 ,
6 0 2
3 5 ,
2 6 1
7 3 ,
3 2 1
1 3 4
, 5 0 0
2 1 4 ,
5 6 5
2 5 0 0
7 3
1 5 4
2 9 3
6 0 9
9 1 8
1 ,
7 8 7
2 ,
8 7 1
5 ,
1 2 3
1 0 ,
5 7 5
1 9 ,
3 2 2
3 1 ,
5 3 8
6 5 ,
5 8 0
1 2 0
, 3 0 0
1 9 1 ,
9 1 2
3 0 0 0
6 6
1 4 0
2 6 7
5 5 6
8 3 8
1 ,
6 3 2
2 ,
6 2 1
4 ,
6 7 7
9 ,
6 5 4
1 7 ,
6 3 8
2 8 ,
7 9 0
5 9 ,
8 6 6
1 0 9
, 8 1 8
1 7 5 ,
1 9 1
4 0 0 0
5 7
1 2 2
2 3 2
4 8 1
7 2 6
1 ,
4 1 3
2 ,
2 7 0
4 ,
0 5 0
8 ,
3 6 0
1 5 ,
2 7 5
2 4 ,
9 3 3
5 1 ,
8 4 6
9 5
, 1 0 6
1 5 1 ,
7 2 0
S o u r c e : R e p r i n t e d , w i t h p e r m i s
s i o n , f r o m d a t a d e v e l o p e d b y t h e B o s t o n c h a p t e r o f A S P E .
a I . D . ( i n t e r n a l d i a m e t e r ) b a s e d
o n s c h e d u l e 4 0 s t e e l p i p e .

8/12/2019 American Society of Plumbing Engineers Volume 2
http://slidepdf.com/reader/full/american-society-of-plumbing-engineers-volume-2 229/233
203Chapter 7— Fuel-Gas Piping Systems
W e y m o u t h F o r m u l a :
Q
=
1 6 . 0 4
( P 1
2 – P 2
2 ) × D
1 6 / 3
½
L S
W h e r e :
Q
=
G a s f l o w
( L 3 / s )
G i v e n :
P 1
=
3 4 . 4 8
I n
i t i a l p r e s s u r e o f t h e s y s t e m (
k P a )
D
=
I n t e r n a l p
i p e d i a m e t e r ( m m )
P 2
=
6 . 8 9
F i
n a l p r e s s u r e o f t h e s y s t e m (
k P a )
L
=
T o t a l e q u
i v a l e n t l e n g t h , l o n g e s t r u n o f p i p i n g
( m )
S
=
0 . 6
T h
e s p e c i f i c g r a v i t y o f t h e n a t u r a l g a s
S
=
S p e c i f i c g
r a v i t y o f t h e g a s
P 1
=
I n i t i a l p r e
s s u r e i n s y s t e m (
k P a )
P 2
=
F i n a l p r e s s u r e i n s y s t e m (
k P a )
T a b l e 7 - A 3 ( M )
N a t u r a l G a s
P i p e S i z i n g T a b l e f o r G a s P r e s s u r e > 6 . 8
9 5 k P a
P i p e S i z e — I n s i d e D i a m e t e r ( m m ) a
T o t a l
N o m i n a l
1 5
2 0
2 5
3 5
4 0
5 0
6 5
7 5
1 0 0
1 2 5
1 5 0
2 0 0
2
5 0
3 0 0
E q u i v a l e n t
A c t u a l
1 5 . 8
2 0 . 9
2 6 . 6
3 5 . 1
4 0 . 9
5 2 . 5
6 2 . 7
7 7 . 9
1 0 2 . 2
1 2 8 . 2
1 5 4 . 1
2 0 2 . 7
2 5 4 . 5
3 0 3 . 2
L e n g t h ( m )
C a p a c i t i e s ( L / s )
3 . 1
9 .
0 4
1 9 .
1 4
3 6 .
4
7 5 .
7
1 1 4 .
2
2 2 2 .
4
3 5 7 .
2
6 3 7 .
5
1 3 1 5 . 9
0
2 4 0 4 .
3 0
3 9 2 4 .
5 0
8 1 6 0 .
5 0
1 4
9
6 9 .
6 0
2 3
8 8 0 .
7
7 . 6
5 .
7 2
1 2 .
1 1
2 3 .
0 5
4 7 .
9
7 2 .
2
1 4 0 .
7
2 2 5 .
9
4 0 3 .
2
8 3 2 . 3
1 5 2 0 .
6 0
2 4 8 2 .
0 0
5 1 6 1 .
1 0
9 4
6 7 .
6 0
1 5
1 0 3 .
5
1 5 . 2
4 .
0 4
8 .
5 6
1 6 .
3 0
3 3 .
9
5 1 .
1
9 9 .
5
1 5 9 .
8
2 8 5 .
1
5 8 8 . 5
1 0 7 5 .
2 0
1 7 5 5 .
1 0
3 6 4 9 .
5 0
6 6
9 4 .
6 0
1 0
6 7 9 .
8
2 2 . 9
3 .
3 0
6 .
9 9
1 3 .
3 1
2 7 .
6 5
4 1 .
7
8 1 .
2
1 3 0 .
4
2 3 2 .
8
4 8 0 . 5
8 7 7 .
9
1 4 3 3 .
0 0
2 9 7 9 .
8 0
5 4
6 6 .
1 0
8
7 2 0 .
0
3 0 . 5
2 .
8 6
6 .
0 5
1 1 .
5 2
2 3 .
9 5
3 6 .
1
7 0 .
3
1 1 3 .
0
2 0 1 .
6
4 1 6 . 1
7 6 0 .
3
1 2 4 1 .
0 0
2 5 8 0 .
6 0
4 7
3 3 .
8 0
7
5 5 1 .
8
4 5 . 7
2 .
3 4
4 .
9 4
9 .
4 1
1 9 .
5 5
2 9 .
5
5 7 .
4
9 2 .
2
1 6 4 .
6
3 3 9 . 8
6 2 0 .
8
1 0 1 3 .
3 0
2 1 0 7 .
0 0
3 8
6 5 .
1 0
6
1 6 6 .
0
5 3 . 4
2 .
1 6
4 .
5 8
8 .
7 1
1 8 .
1 0
2 7 .
3 1
5 3 .
2
8 5 .
4
1 5 2 .
4
3 1 4 . 6
5 7 4 .
7
9 3 8 .
1
1 9 5 0 .
7 0
3 5
7 8 .
4 0
5
7 0 8 .
6
6 1 . 0
2 .
0 2
4 .
2 8
8 .
1 5
1 6 .
9 3
2 5 .
5 4
4 9 .
7
7 9 .
9
1 4 2 .
6
2 9 4 . 2
5 3 7 .
6
8 7 7 .
5
1 8 2 4 .
7 0
3 3
4 7 .
3 0
5
3 3 9 .
9
7 6 . 2
1 .
8 1
3 .
8 3
7 .
2 9
1 5 .
1 5
2 2 .
8 5
4 4 .
5
7 1 .
4
1 2 7 .
5
2 6 3 . 2
4 8 0 .
9
7 8 4 .
9
1 6 3 2 .
1 0
2 9
9 3 .
9 0
4
7 7 6 .
1
9 1 . 4
1 .
6 5
3 .
5 0
6 .
6 5
1 3 .
8 3
2 0 .
8 5
4 0 .
6
6 5 .
2
1 1 6 .
4
2 4 0 . 3
4 3 9 .
0
7 1 6 .
5
1 4 8 9 .
9 0
2 7
3 3 .
1 0
4
3 6 0 .
0
1 2 1 . 9
1 .
4 3
3 .
0 3
5 .
7 6
1 1 .
9 7
1 8 .
0 6
3 5 .
2
5 6 .
5
1 0 0 .
8
2 0 8 . 1
3 8 0 .
2
6 2 0 .
5
1 2 9 0 .
3 0
2 3
6 6 .
9 0
3
7 7 5 .
9
1 5 2 . 4
1 .
2 8
2 .
7 1
5 .
1 5
1 0 .
7 1
1 6 .
1 5
3 1 .
5
5 0 .
5
9 0 .
2
1 8 6 . 1
3 4 0 .
0
5 5 5 .
0
1 1 5 4 .
1 0
2
1 1 7 .
0 0
3
3 7 7 .
2
1 8 2 . 9
1 .
1 7
2 .
4 7
4 .
7 0
9 .
7 8
1 4 .
7 5
2 8 .
7
4 6 .
1
8 2 .
3
1 6 9 . 9
3 1 0 .
4
5 0 6 .
6
1 0 5 3 .
5 0
1 9
3 2 .
6 0
3
0 8 3 .
0
2 2 8 . 6
1 .
0 4
2 .
2 1
4 .
2 1
8 .
7 4
1 3 .
1 9
2 5 .
6 8
4 1 .
2
7 3 .
6
1 5 1 . 9
2 7 7 .
6
4 5 3 .
2
9 4 2 .
3
1 7
2 8 .
5 0
2
7 5 7 .
5
3 0 4 . 8
0 .
9 0
1 .
9 1
3 .
6 4
7 .
5 7
1 1 .
4 2
2 2 .
2 4
3 5 .
7
6 3 .
8
1 3 1 . 6
2 4 0 .
4
3 9 2 .
4
8 1 6 .
0
1 4
9 7 .
0 0
2
3 8 8 .
1
3 8 1 . 0
0 .
8 1
1 .
7 1
3 .
2 6
6 .
7 7
1 0 .
2 2
1 9 .
8 9
3 2 .
0
5 7 .
0
1 1 7 . 7
2 1 5 .
0
3 5 1 .
0
7 2 9 .
9
1 3
3 8 .
9 0
2
1 3 6 .
0
4 5 7 . 2
0 .
7 4
1 .
5 6
2 .
9 8
6 .
1 8
9 .
3 3
1 8 .
1 6
2 9 .
2
5 2 .
1
1 0 7 . 4
1 9 6 .
3
3 2 0 .
4
6 6 6 .
3
1 2
2 2 .
3 0
1
9 4 9 .
9
5 3 3 . 4
0 .
6 8
1 .
4 5
2 .
7 5
5 .
7 2
8 .
6 3
1 6 .
8 1
2 7 .
0
4 8 .
2
9 9 . 5
1 8 1 .
7
2 9 6 .
7
6 1 6 .
9
1 1
3 1 .
6 0
1
8 0 5 .
2
6 0 9 . 6
0 .
6 4
1 .
3 5
2 .
5 8
5 .
3 5
8 .
0 8
1 5 .
7 3
2 5 .
2 6
4 5 .
1
9 3 . 0
1 7 0 .
0
2 7 7 .
5
5 7 7 .
0
1 0
5 8 .
5 0
1
6 8 8 .
6
7 6 2 . 0
0 .
5 7
1 .
2 1
2 .
3 0
4 .
7 9
7 .
2 2
1 4 .
0 7
2 2 .
5 9
4 0 .
3
8 3 . 2
1 5 2 .
1
2 4 8 .
2
5 1 6 .
1
9
4 6 .
8
1
5 1 0 .
4
9 1 4 . 4
0 .
5 2
1 .
1 1
2 .
1 0
4 .
3 7
6 .
5 9
1 2 .
8 4
2 0 .
6 2
3 6 .
8
7 6 . 0
1 3 8 .
8
2 2 6 .
6
4 7 1 .
1
8
6 4 .
3
1
3 7 8 .
8
1 2 1 9 . 2
0 .
4 5
0 .
9 6
1 .
8 2
3 .
7 9
5 .
7 1
1 1 .
1 2
1 7 .
8 6
3 1 .
9
6 5 . 8
1 2 0 .
2
1 9 6 .
2
4 0 8 .
0
7
4 8 .
5
1
1 9 4 .
0
S o u r c e : R e p r i n t e d , w i t h p e r m i s
s i o n , f r o m d a t a d e v e l o p e d b y t h e B o s t o n c h a p t e r o f A S P E .
a I . D . ( i n t e r n a l d i a m e t e r ) b a s e d
o n s c h e d u l e 4 0 s t e e l p i p e .

8/12/2019 American Society of Plumbing Engineers Volume 2
http://slidepdf.com/reader/full/american-society-of-plumbing-engineers-volume-2 230/233
ASPE Data Book — Volume 2204
W e y m o u t h F o r m u l a :
Q
=
2 0 3 8 . 1
( P
1 2 – P 2
2 ) × D
1 6 / 3
½
L S
W h e r e :
Q
=
G a s f l o w
( c f h )
G i v e n :
P 1
=
5
I n i t i a l p r e s s u r e o f t h e s y s t e m ( p s i )
D
=
I n t e r n a l p
i p e d i a m e t e r ( i n . )
P 2
=
4 . 5
F i n a l p r e s s u r e o f t h e s y s t e m ( p s i )
L
=
T o t a l e q u
i v a l e n t l e n g t h , l o n g e s t r u n o f p i p e ( f t )
S
=
0 . 6
T h
e s p e c i f i c g r a v i t y o f t h e n a t u r a l g a s
S
=
S p e c i f i c g
r a v i t y o f t h e g a s
P 1
=
I n i t i a l p r e
s s u r e i n t h e s y s t e m ( p s i )
P 2
=
F i n a l p r e s s u r e o f t h e s y s t e m ( p s i )
T a b l e 7 - A 4
N a t u r a l G a
s P i p e S i z i n g T a b l e f o r G a s P r e s s u r e > 1 p s i
P i p e S i z e — I n s i d e D i a m e t e r ( i n . )
a
T o t a l
N o m i n a l
½
¾
1
1 ¼
1 ½
2
2 ½
3
4
5
6
8
1 0
1 2
E q u i v a l e n t
A c t u a l
0 . 6 2 2
0 . 8 2 4
1 . 0 4 9
1 . 3 8 0
1 . 6 1 0
2 . 0 6 7
2 . 4 6 9
3 . 0 6 8
4 . 0 2 6
5 . 0 4 7
6 . 0 6 5
7 . 9 8 1
1
0 . 0 2
1 1 . 9 4
L e n g t h ( f t )
C a p a c i t i e s ( c f h )
1 0
5 1 1
1 ,
0 8 2
2 ,
0 6 0
4 ,
2 8 1
6 ,
4 5 7
1 2 ,
5 7 2
2 0 ,
1 9 4
3 6 ,
0 3 9
7 4 ,
3 8 6
1 3 5 ,
9 1 0
2 2 1 ,
8 4 3
4 6 1 ,
2 9 9
8 4 6
, 2 0 8
1 ,
3 4 9 ,
9 3 9
2 5
3 2 3
6 8 4
1 ,
3 0 3
2 ,
7 0 7
4 ,
0 8 4
7 ,
9 5 1
1 2 ,
7 7 2
2 2 ,
7 9 3
4 7 ,
0 4 6
8 5 ,
9 5 7
1 4 0 ,
3 0 6
2 9 1 ,
7 5 1
5 3 5
, 1 8 9
8 5 3 ,
7 7 6
5 0
2 2 9
4 8 4
9 2 1
1 ,
9 1 4
2 ,
8 8 8
5 ,
6 2 2
9 ,
0 3 1
1 6 ,
1 1 7
3 3 ,
2 6 7
6 0 ,
7 8 1
9 9 ,
2 1 1
2 0 6 ,
2 9 9
3 7 8
, 4 3 6
6 0 3 ,
7 1 1
7 5
1 8 7
3 9 5
7 5 2
1 ,
5 6 3
2 ,
3 5 8
4 ,
5 9 1
7 ,
3 7 4
1 3 ,
1 6 0
2 7 ,
1 6 2
4 9 ,
6 2 7
8 1 ,
0 0 6
1 6 8 ,
4 4 3
3 0 8
, 9 9 2
4 9 2 ,
9 2 8
1 0 0
1 6 2
3 4 2
6 5 1
1 ,
3 5 4
2 ,
0 4 2
3 ,
9 7 6
6 ,
3 8 6
1 1 ,
3 9 7
2 3 ,
5 2 3
4 2 ,
9 7 9
7 0 ,
1 5 3
1 4 5 ,
8 7 6
2 6 7
, 5 9 5
4 2 6 ,
8 8 8
1 5 0
1 3 2
2 7 9
5 3 2
1 ,
1 0 5
1 ,
6 6 7
3 ,
2 4 6
5 ,
2 1 4
9 ,
3 0 5
1 9 ,
2 0 6
3 5 ,
0 9 2
5 7 ,
2 8 0
1 1 9 ,
1 0 7
2 1 8
, 4 9 0
3 4 8 ,
5 5 3
1 7 5
1 2 2
2 5 9
4 9 2
1 ,
0 2 3
1 ,
5 4 4
3 ,
0 0 5
4 ,
8 2 7
8 ,
6 1 5
1 7 ,
7 8 2
3 2 ,
4 8 9
5 3 ,
0 3 1
1 1 0 ,
2 7 2
2 0 2
, 2 8 2
3 2 2 ,
6 9 7
2 0 0
1 1 4
2 4 2
4 6 1
9 5 7
1 ,
4 4 4
2 ,
8 1 1
4 ,
5 1 5
8 ,
0 5 9
1 6 ,
6 3 3
3 0 ,
3 9 0
4 9 ,
6 0 6
1 0 3 ,
1 5 0
1 8 9
, 2 1 8
3 0 1 ,
8 5 6
2 5 0
1 0 2
2 1 6
4 1 2
8 5 6
1 ,
2 9 1
2 ,
5 1 4
4 ,
0 3 9
7 ,
2 0 8
1 4 ,
8 7 7
2 7 ,
1 8 2
4 4 ,
3 6 9
9 2 ,
2 6 0
1 6 9
, 2 4 2
2 6 9 ,
9 8 8
3 0 0
9 3
1 9 8
3 7 6
7 8 2
1 ,
1 7 9
2 ,
2 9 5
3 ,
6 8 7
6 ,
5 8 0
1 3 ,
5 8 1
2 4 ,
8 1 4
4 0 ,
5 0 3
8 4 ,
2 2 1
1 5 4
, 4 9 6
2 4 6 ,
4 6 4
4 0 0
8 1
1 7 1
3 2 6
6 7 7
1 ,
0 2 1
1 ,
9 8 8
3 ,
1 9 3
5 ,
6 9 8
1 1 ,
7 6 2
2 1 ,
4 8 9
3 5 ,
0 7 6
7 2 ,
9 3 8
1 3 3
, 7 9 7
2 1 3 ,
4 4 4
5 0 0
7 2
1 5 3
2 9 1
6 0 5
9 1 3
1 ,
7 7 8
2 ,
8 5 6
5 ,
0 9 7
1 0 ,
5 2 0
1 9 ,
2 2 1
3 1 ,
3 7 3
6 5 ,
2 3 8
1 1 9
, 6 7 2
1 9 0 ,
9 1 0
6 0 0
6 6
1 4 0
2 6 6
5 5 3
8 3 4
1 ,
6 2 3
2 ,
6 0 7
4 ,
6 5 3
9 ,
6 0 3
1 7 ,
5 4 6
2 8 ,
6 4 0
5 9 ,
5 5 3
1 0 9
, 2 4 5
1 7 4 ,
2 7 6
7 5 0
5 9
1 2 5
2 3 8
4 9 4
7 4 6
1 ,
4 5 2
2 ,
3 3 2
4 ,
1 6 1
8 ,
5 8 9
1 5 ,
6 9 4
2 5 ,
6 1 6
5 3 ,
2 6 6
9 7
, 7 1 2
1 5 5 ,
8 7 8
1 0 0 0
5 1
1 0 8
2 0 6
4 2 8
6 4 6
1 ,
2 5 7
2 ,
0 1 9
3 ,
6 0 4
7 ,
4 3 9
1 3 ,
5 9 1
2 2 ,
1 8 4
4 6 ,
1 3 0
8 4
, 6 2 1
1 3 4 ,
9 9 4
1 2 5 0
4 6
9 7
1 8 4
3 8 3
5 7 8
1 ,
1 2 4
1 ,
8 0 6
3 ,
2 2 3
6 ,
6 5 3
1 2 ,
1 5 6
1 9 ,
8 4 2
4 1 ,
2 6 0
7 5
, 6 8 7
1 2 0 ,
7 4 2
1 5 0 0
4 2
8 8
1 6 8
3 5 0
5 2 7
1 ,
0 2 7
1 ,
6 4 9
2 ,
9 4 3
6 ,
0 7 4
1 1 ,
0 9 7
1 8 ,
1 1 3
3 7 ,
6 6 5
6 9
, 0 9 3
1 1 0 ,
2 2 2
1 7 5 0
3 9
8 2
1 5 6
3 2 4
4 8 8
9 5 0
1 ,
5 2 7
2 ,
7 2 4
5 ,
6 2 3
1 0 ,
2 7 4
1 6 ,
7 7 0
3 4 ,
8 7 1
6 3
, 9 6 7
1 0 2 ,
0 4 6
2 0 0 0
3 6
7 7
1 4 6
3 0 3
4 5 7
8 8 9
1 ,
4 2 8
2 ,
5 4 8
5 ,
2 6 0
9 ,
6 1 0
1 5 ,
6 8 7
3 2 ,
6 1 9
5 9
, 8 3 6
9 5 ,
4 5 5
2 5 0 0
3 2
6 8
1 3 0
2 7 1
4 0 8
7 9 5
1 ,
2 7 7
2 ,
2 7 9
4 ,
7 0 5
8 ,
5 9 6
1 4 ,
0 3 1
2 9 ,
1 7 5
5 3
, 5 1 9
8 5 ,
3 7 8
3 0 0 0
3 0
6 2
1 1 9
2 4 7
3 7 3
7 2 6
1 ,
1 6 6
2 ,
0 8 1
4 ,
2 9 5
7 ,
8 4 7
1 2 ,
8 0 8
2 6 ,
6 3 3
4 8
, 8 5 6
7 7 ,
9 3 9
4 0 0 0
2 6
5 4
1 0 3
2 1 4
3 2 3
6 2 9
1 ,
0 1 0
1 ,
8 0 2
3 ,
7 1 9
6 ,
7 9 6
1 1 ,
0 9 2
2 3 ,
0 6 5
4 2
, 3 1 0
6 7 ,
4 9 7
S o u r c e : R e p r i n t e d , w i t h p e r m i s
s i o n , f r o m d a t a d e v e l o p e d b y t h e B o s t o n c h a p t e r o f A S P E .
a I . D . ( i n t e r n a l d i a m e t e r ) b a s e d
o n s c h e d u l e 4 0 s t e e l p i p e .

8/12/2019 American Society of Plumbing Engineers Volume 2
http://slidepdf.com/reader/full/american-society-of-plumbing-engineers-volume-2 231/233
205Chapter 7— Fuel-Gas Piping Systems
W e y m o u t h F o r m u l a :
Q
=
1 6 . 0 4
( P 1
2 – P 2
2 ) × D
1 6 / 3
½
L S
W h e r e :
Q
=
G a s f l o w
( L 3 / s )
G i v e n :
P 1
=
3 4 . 4 8
I n
i t i a l p r e s s u r e o f t h e s y s t e m (
k P a )
D
=
I n t e r n a l p
i p e d i a m e t e r ( m m )
P 2
=
3 1 . 0 3
F i
n a l p r e s s u r e o f t h e s y s t e m (
k P a )
L
=
T o t a l e q u
i v a l e n t l e n g t h , l o n g e s t r u n o f p i p i n g
( m )
S
=
0 . 6
T h
e s p e c i f i c g r a v i t y o f t h e n a t u r a l g a s
S
=
S p e c i f i c g
r a v i t y o f t h e g a s
P 1
=
I n i t i a l p r e
s s u r e i n s y s t e m (
k P a )
P 2
=
F i n a l p r e s s u r e i n s y s t e m (
k P a )
T a b l e 7 - A 4 ( M )
N a t u r a l G a s
P i p e S i z i n g T a b l e f o r G a s P r e s s u r e > 6 . 8
9 5 k P a
P i p e S i z e — I n s i d e D i a m e t e r ( m m ) a
T o t a l
N o m i n a l
1 5
2 0
2 5
3 5
4 0
5 0
6 5
7 5
1 0 0
1 2 5
1 5 0
2 0 0
2
5 0
3 0 0
E q u i v a l e n t
A c t u a l
1 5 . 8
2 0 . 9
2 6 . 6
3 5 . 1
4 0 . 9
5 2 . 5
6 2 . 7
7 7 . 9
1 0 2 . 2
1 2 8 . 2
1 5 4 . 1
2 0 2 . 7
2 5 4 . 5
3 0 3 . 2
L e n g t h ( m )
C a p a c i t i e s ( L / s )
3 . 1
4 .
0 2
8 .
5 2
1 6 .
2
3 3 .
7
5 0 .
8
9 8 .
9
1 5 8 .
9
2 8 3 .
6
5 8 5 . 4
1 0 6 9 .
6 0
1 7 4 5 .
9
3 6 3 0 .
4
6 6
5 9 .
7
1 0
6 2 4 .
0
7 . 6
2 .
5 4
5 .
3 9
1 0 .
2 5
2 1 .
3
3 2 .
1
6 2 .
6
1 0 0 .
5
1 7 9 .
4
3 7 0 . 3
6 7 6 .
5
1 1 0 4 .
2
2 2 9 6 .
1
4 2 1 1 .
9
6
7 1 9 .
2
1 5 . 2
1 .
8 0
3 .
8 1
7 .
2 5
1 5 .
1
2 2 .
7
4 4 .
2
7 1 .
1
1 2 6 .
8
2 6 1 . 8
4 7 8 .
3
7 8 0 .
8
1 6 2 3 .
6
2 9
7 8 .
3
4
7 5 1 .
2
2 2 . 9
1 .
4 7
3 .
1 1
5 .
9 2
1 2 .
3
1 8 .
6
3 6 .
1
5 8
1 0 3 .
6
2 1 3 . 8
3 9 0 .
6
6 3 7 .
5
1 3 2 5 .
6
2 4
3 1 .
8
3
8 7 9 .
3
3 0 . 5
1 .
2 7
2 .
6 9
5 .
1 3
1 0 .
6 5
1 6 .
1
3 1 .
3
5 0 .
3
8 9 .
7
1 8 5 . 1
3 3 8 .
2
5 5 2 .
1
1 1 4 8 .
0
2 1
0 6 .
0
3
3 5 9 .
6
4 5 . 7
1 .
0 4
2 .
2
4 .
1 9
8 .
7 0
1 3 .
1
2 5 .
5
4 1
7 3 .
2
1 5 1 . 2
2 7 6 .
2
4 5 0 .
8
9 3 7 .
4
1 7
1 9 .
5
2
7 4 3 .
1
5 3 . 4
0 .
9 6
2 .
0 4
3 .
8 8
8 .
0 5
1 2 .
1 5
2 3 .
7
3 8
6 7 .
8
1 3 9 . 9
2 5 5 .
7
4 1 7 .
4
8 6 7 .
8
1 5
9 2 .
0
2
5 3 9 .
6
6 1 . 0
0 .
9 0
1 .
9
3 .
6 3
7 .
5 3
1 1 .
3 6
2 2 .
1
3 5 .
5
6 3 .
4
1 3 0 . 9
2 3 9 .
2
3 9 0 .
4
8 1 1 .
8
1 4
8 9 .
1
2
3 7 5 .
6
7 6 . 2
0 .
8 0
1 .
7
3 .
2 4
6 .
7 4
1 0 .
1 6
1 9 .
8
3 1 .
8
5 6 .
7
1 1 7 . 1
2 1 3 .
9
3 4 9 .
2
7 2 6 .
1
1 3
3 1 .
9
2
1 2 4 .
8
9 1 . 4
0 .
7 3
1 .
5 5
2 .
9 6
6 .
1 5
9 .
2 8
1 8 .
1
2 9
5 1 .
8
1 0 6 . 9
1 9 5 .
3
3 1 8 .
8
6 6 2 .
8
1 2
1 5 .
9
1
9 3 9 .
7
1 2 1 . 9
0 .
6 4
1 .
3 5
2 .
5 6
5 .
3 3
8 .
0 3
1 5 .
6
2 5 .
1
4 4 .
8
9 2 . 6
1 6 9 .
1
2 7 6 .
1
5 7 4 .
0
1 0
5 3 .
0
1
6 7 9 .
8
1 5 2 . 4
0 .
5 7
1 .
2
2 .
2 9
4 .
7 6
7 .
1 9
1 4 .
0
2 2 .
5
4 0 .
1
8 2 . 8
1 5 1 .
3
2 4 6 .
9
5 1 3 .
4
9
4 1 .
8
1
5 0 2 .
5
1 8 2 . 9
0 .
5 2
1 .
1
2 .
0 9
4 .
3 5
6 .
5 6
1 2 .
8
2 0 .
5
3 6 .
6
7 5 . 6
1 3 8 .
1
2 2 5 .
4
4 6 8 .
7
8
5 9 .
8
1
3 7 1 .
6
2 2 8 . 6
0 .
4 6
0 .
9 8
1 .
8 7
3 .
8 9
5 .
8 7
1 1 .
4 2
1 8 .
4
3 2 .
8
6 7 . 6
1 2 3 .
5
2 0 1 .
6
4 1 9 .
2
7
6 9 .
0
1
2 2 6 .
8
3 0 4 . 8
0 .
4 0
0 .
8 5
1 .
6 2
3 .
3 7
5 .
0 8
9 .
8 9
1 5 .
9
2 8 .
4
5 8 . 5
1 0 7 .
0
1 7 4 .
6
3 6 3 .
0
6
6 6 .
0
1
0 6 2 .
4
3 8 1 . 0
0 .
3 6
0 .
7 6
1 .
4 5
3 .
0 1
4 .
5 5
8 .
8 5
1 4 .
2
2 5 .
4
5 2 . 4
9 5 .
7
1 5 6 .
2
3 2 4 .
7
5
9 5 .
7
9 5 0 .
2
4 5 7 . 2
0 .
3 3
0 .
7
1 .
3 2
2 .
7 5
4 .
1 5
8 .
0 8
1 3 .
0
2 3 .
2
4 7 . 8
8 7 .
3
1 4 2 .
6
2 9 6 .
4
5
4 3 .
8
8 6 7 .
4
5 3 3 . 4
0 .
3 0
0 .
6 4
1 .
2 3
2 .
5 5
3 .
8 4
7 .
4 8
1 2 .
0 1
2 1 .
4
4 4 . 3
8 0 .
9
1 3 2
2 7 4 .
4
5
0 3 .
4
8 0 3 .
1
6 0 9 . 6
0 .
2 8
0 .
6 0
1 .
1 5
2 .
3 8
3 .
5 9
7 .
0 0
1 1 .
2 4
2 0 .
1
4 1 . 4
7 5 .
6
1 2 3 .
5
2 5 6 .
7
4
7 0 .
9
7 5 1 .
2
7 6 2 . 0
0 .
2 5
0 .
5 4
1 .
0 3
2 .
1 3
3 .
2 1
6 .
2 6
1 0 .
0 5
1 7 .
9
3 7 . 0
6 7 .
6
1 1 0 .
4
2 2 9 .
6
4
2 1 .
2
6 7 1 .
9
9 1 4 . 4
0 .
2 3
0 .
4 9
0 .
9 4
1 .
9 5
2 .
9 3
5 .
7 1
9 .
1 8
1 6 .
4
3 3 . 8
6 1 .
8
1 0 0 .
8
2 0 9 .
6
3
8 4 .
5
6 1 3 .
4
1 2 1 9 . 2
0 .
2 0
0 .
4 3
0 .
8 1
1 .
6 8
2 .
5 4
4 .
9 5
7 .
9 5
1 4 .
2
2 9 . 3
5 3 .
5
8 7 .
3
1 8 1 .
5
3
3 3 .
0
5 3 1 .
2
S o u r c e : R e p r i n t e d , w i t h p e r m i s
s i o n , f r o m d a t a d e v e l o p e d b y t h e B o s t o n c h a p t e r o f A S P E .
a I . D . ( i n t e r n a l d i a m e t e r ) b a s e d
o n s c h e d u l e 4 0 s t e e l p i p e .

8/12/2019 American Society of Plumbing Engineers Volume 2
http://slidepdf.com/reader/full/american-society-of-plumbing-engineers-volume-2 232/233

8/12/2019 American Society of Plumbing Engineers Volume 2
http://slidepdf.com/reader/full/american-society-of-plumbing-engineers-volume-2 233/233