american journal of science, vol. , april, 643–677, doi …bethke/pdf/ajs2007.pdfamerican journal...
TRANSCRIPT
American Journal of ScienceAPRIL 2007
THE THERMODYNAMICS AND KINETICS OFMICROBIAL METABOLISM
QUSHENG JIN* and CRAIG M. BETHKEDepartment of Geology, University of Illinois, 1301 West Green Street,
Urbana, Illinois 61801-2919 USA
ABSTRACT. The various kinetic rate laws commonly used to describe microbialmetabolism are derived considering only forward reaction progress and hence areinconsistent with the requirements of thermodynamics. These laws may be appliedwithout significant error where abundant energy is available to drive the metabolicreaction, so the forward reaction overwhelms the reverse. The laws are, however,unsuitable where little energy may be available. In previous papers we derived a newrate law for microbial respiration considering that reaction progresses simultaneouslyin both the forward and reverse directions. In this paper, we demonstrate in a new andrigorous way how the rate law can account quantitatively for the thermodynamicdriving force for reaction. We refine our previous work on microbial respiration tobetter account for details of the electron transfer process. We furthermore extend thetheory to account for enzymatic reaction and microbial fermentation. We show thatcommonly used rate laws of simple form can be modified to honor thermodynamicconsistency by including a thermodynamic potential factor. Finally, we consider howthe rate of biomass synthesis can be determined from the rate of respiration orfermentation. We apply these results to describe (1) the enzymatic reaction by whichbenzoyl-CoA forms, (2) crotonate fermentation, and (3) glucose fermentation; foreach process we demonstrate how the reaction rate is affected by the thermodynamicdriving force. Results of the study improve our ability to predict microbial metabolicrates accurately over a spectrum of geochemical environments, including undereutrophic and oligotrophic conditions.
introductionA microorganism liberates chemical energy from its environment by using its
enzymes to catalyze a chemical reaction. A respiring microbe catalyzes a redox reactionin which electrons are transferred from a donor to acceptor species, leaving the donoroxidized and the acceptor reduced. It conserves a portion of the energy liberated inthis way by translocating protons outside of the cell’s membrane and synthesizingadenosine triphosphate (ATP) from adenosine diphosphate (ADP) and the orthophos-phate ion (PO4
3�, denoted Pi). A fermenting microbe, in contrast, conserves energy bycoupling ATP synthesis to the breakdown of a complex substrate molecule found in itsenvironment. The breakdown produces simpler species, one more oxidized and theother more reduced than the substrate. The ATP serves as a store of chemical energy ina respiring or fermenting microbe, which it can expend for purposes such as cellmaintenance and reproduction, biomass synthesis, and chemical species transportacross its membrane.
A microorganism, then, affects the chemistry of its environment by catalyzingchemical reactions. The environment, on the other hand, controls the activities of
*Corresponding author: Current address: Department of Geological Sciences, University of Oregon,1272 University of Oregon, Eugene, Oregon 97403-1272 USA; Email: [email protected].
[American Journal of Science, Vol. 307, April, 2007, P. 643–677, DOI 10.2475/04.2007.01]
643
microorganisms by providing habitats, nutrients, and energy resources and in this waythe community structures of microbial populations. Predicting accurately the rate ofmicrobial metabolism in nature is fundamental to understanding interaction betweenmicrobial populations and their geochemical environments.
The rate laws commonly used to predict microbial respiration rate, such as theMonod and dual-Monod equations, make no accounting of the energetics of themetabolic process. They do not consider, for example, the requirement that theenvironment supply at least as much energy as is conserved by microbial metabolism.The relations are developed assuming that the respiration reaction proceed in theforward direction only, a reasonable assumption only where the environment is rich inchemical energy, that is where the metabolic reaction is far from equilibrium.
Chemical reactions in natural environments in many cases can supply only modestamounts of energy to a microbe because they deviate little from thermodynamicequilibrium. This is especially likely to be true for anaerobic respiration and thefermentation of short-chain fatty acids like propionate and butyrate. In such cases, wemust acknowledge the metabolic reaction proceeds simultaneously in the forward andreverse directions; the net rate is the difference between the forward and reverse rates.Predicting the rate of microbial metabolism in natural environments in such casesrequires use of a kinetic rate law consistent with the principles of thermodynamics, onethat accounts for the reverse as well as forward progress of the metabolic reaction.
The need for kinetic rate laws in general to be thermodynamically consistent isbroadly appreciated among physical chemists (for example, Denbigh, 1961; Blum andLuus, 1964; Van Rysselberghe, 1967; Boudart, 1975, 1976; Boyd, 1977; Corio, 1983;Boudart and Djega-Mariadassou, 1984; Peka and Miloslav, 2005), following pioneeringwork on the subject done in the 1940s and 1950s (Gadsby and others, 1946; Horiuti,1948; Manes and others, 1950; Hollingsworth, 1952a, 1952b, 1957). Microbiologistshave been able to avoid thermodynamic considerations in their kinetic calculations inlarge part because they tend to consider situations where large amounts of energy areavailable to drive a metabolic reaction forward. Most laboratory experiments, forexample, are formulated to facilitate rapid microbial growth, and therefore containabundant quantities of substrates. Similarly, some polluted environments, such aswhere organic compounds are exposed to atmospheric dioxygen, are energeticallyrich. In such cases, the energy available in the environment is sufficiently in excess ofthe energy conserved by the microbe such that the forward reaction rate overwhelmsthe reverse rate, allowing the latter to be ignored.
The Earth’s hydrosphere and lithosphere, including many pristine and contami-nated environments, however, are not everywhere rich in chemical energy. Theamount of energy released by organic matter degradation, for example, may be smalldue to the nature of the reaction, or the fact that the substrate is depleted. In thesecases, reverse reaction may not be negligible, and we cannot necessarily ignore therequirement that a cell conserve by its metabolic reaction part of the energy availablefrom environment.
In studying metabolic rates in many natural environments, therefore, geomicrobi-ologists need to employ a thermodynamically consistent rate law. Failure to do sopresents clear contradictions. The Monod equation (Monod, 1949), for example,predicts that a microorganism will continue to metabolize its substrate until itsconcentration asymptotically approaches zero. But as its concentration decreases, theenergy a substrate can offer to microbes diminishes, and eventually metabolic reac-tions may become energetically unfavorable. In behaving as suggested by the Monodequation, a microbe might need to expend energy to drive forward its own metabolicreaction.
644 Q. Jin and C. M. Bethke—The thermodynamics and kinetics

In recent papers (Jin and Bethke, 2002, 2003), we derived on the basis of thechemiosmotic model of respiration and from nonequilibrium thermodynamics ageneral rate law for microbial respiration accounting for the thermodynamic controlon respiration rate. In this paper, we show in a new and rigorous way how the rate lawfor microbial metabolism in general can take into account the thermodynamic drivingforce, the difference between the energy available and the energy conserved. Weextend the rate law to account for the kinetics of enzymatic reactions and the rate ofmicrobial fermentation. We then show that rate laws in common use, such as theMonod equation, can be modified to be thermodynamically consistent. We takeenzymatic reaction of benzoyl-CoA formation as an example and show that thermody-namic driving force controls the progress of enzymatic reactions. Finally, usingmicrobial fermentation of crotonate and glucose as examples, we demonstrate howthermodynamic driving forces control the rates of microbial fermentation. Theseexamples provide concrete illustrations of why honoring thermodynamic consistencycan be important when predicting the rates of enzymatic reaction and microbialmetabolism in natural environments.
thermodynamic consistencyThere exists a natural consistency between the fields of chemical kinetics and
thermodynamics that must be honored by any general theory of reaction rates (forexample, Boudart, 1976). The equilibrium state of a chemical reaction, for example, isthe state at which forward and reverse reaction rates are in balance. These concepts arefamiliar in geochemistry. The rate r (mol � sec�1) at which a mineral dissolves orprecipitates (in latter case, r is negative), for example, represents the differencebetween the rate of mineral dissolution (forward reaction) and that of mineralprecipitation (reverse reaction) and can be predicted by a rate law of a form
r � k�AS �i
�Ai��i�1 � �Q
K�1/�� (1)
(Lasaga, 1981, 1984; Aagaard and Helgeson, 1982; Nagy and others, 1991; Nagy andLasaga, 1992). Here, k� is the rate constant for the forward reaction, AS is the mineral’ssurface area, [Ai] is the concentration of a chemical species Ai, and �i is the exponentassociated with this species, Q and K are the reaction’s ion activity product andequilibrium constant, and, as will be discussed later, � is the average stoichiometricnumber. This equation can be re-expressed
r � k�AS �i
�Ai��i�1 � exp��
f�RT�� (2)
in terms of the thermodynamic driving force f, which is the negative of the Gibbs freeenergy change �G of reaction (that is f � � �G); here, R is the gas constant and T isabsolute temperature. Where the reaction is in equilibrium, dissolution and precipita-tion are in balance. At the equilibrium point, f is zero and, by this equation, the netreaction rate vanishes.
In this section, we consider in a rigorous sense the requirement of consistencybetween kinetics and thermodynamics. We begin by taking the overall reactionbetween an initial reactant species Sp1 and a final product species SpN
Sp1 w SpN (3)
Reaction proceeds simultaneously in both the forward and reverse directions, at ratesof r� and r�, respectively. The Gibbs free energy change of the reaction is taken as �G,
645of microbial metabolism
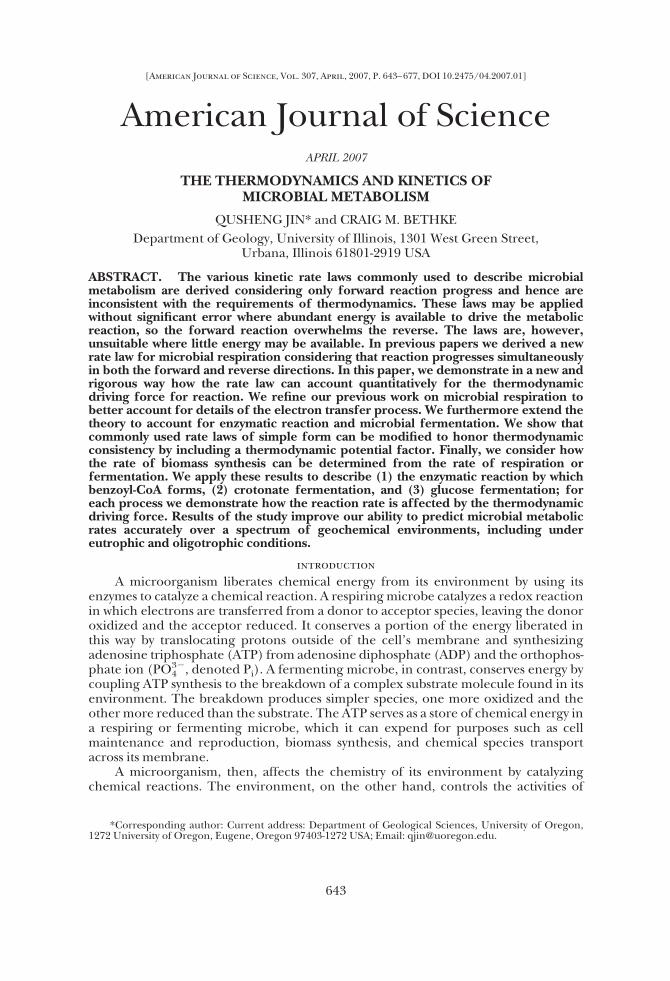
the negative of which is the thermodynamic driving force f . As shown in figure 1, theoverall reaction is composed of N � 1 elementary steps,
Sp1 w1
Sp2 · · · Spi w1
Spi�1 · · · SpN�1 wN�1
SpN (4)
Here, Spi (i � 2, . . . , N�1) is a reaction intermediate. Each of the elementary steps ioccurs �i times per turnover of reaction 3, where �i is the step’s stoichiometric number.The Gibbs free energy change and thermodynamic driving force for step i are taken as�Gi and fi (fi � ��Gi). The Gibbs free energy change for the overall reaction is
�G � �i
�i�G i (5)
since step i occurs �i times per turnover of the overall reaction 3. The thermodynamicdriving force for the overall reaction then can be written
f � �i
�i fi (6)
in terms of the driving force fi for step i.
Elementary ReactionAccording to the activated complex theory (Lasaga, 1981), the forward and
reverse rates (ri� and ri�) for an elementary step i (between Spi and Spi�1) are given as
ri� �kBTh�
exp���Gi�
RT � (7)
and
ri� �kBTh�
exp���Gi�
RT � (8)
Fig. 1. Variation with reaction progress of chemical energy for the overall reaction 3 (Jin and Bethke,2002). The reaction is composed of N �1 elementary steps. The Gibbs free energy change �Gi for anelementary step i is the difference �Gi�
� �Gi� between the activation energies for the step’s forward and
reverse reactions.
646 Q. Jin and C. M. Bethke—The thermodynamics and kinetics

Here, kB is Boltzmann’s constant, h� is Plank’s constant, and�Gi� and �Gi�
are theGibbs free energy of activation for forward and reverse reaction at step i. The Gibbsfree energy released over step i, �Gi, is the difference �Gi�
� �Gi� between the
activation energies, as can be seen in figure 1. Combining equations (7) and (8),
ri�
ri�� exp��
�Gi� � �Gi�
RT � � exp���G i
RT � � exp� fi
RT� (9)
we see the ratio of forward to reverse rate for the step varies with the thermodynamicdriving force. The step’s net rate ri is the difference between ri� and ri� and can bewritten as
ri � ri��1 � exp��G i
RT �� (10)
or
ri � ri��1 � exp��fi
RT�� (11)
by substituting equation (9).
Overall ReactionThe ratio of the forward to reverse rates of the overall reaction can be expressed in
terms of those for individual elementary steps (see Appendix)
r�
r�� �
i�1
N�1 ri�
ri�(12)
Substituting equation (9), the ratio for the overall reaction is given
r�
r�� exp�� �
i�1
N�1
�Gi�RT� � exp��i�1
N�1
fi�RT� (13)
This expression can be rewritten
r�
r�� exp��
�G�RT� � exp� f
�RT� (14)
where � is the average stoichiometric number, defined as
� �¥i�1
N�1 �i�G i
¥i�1N�1 �G i
�¥i�1
N�1 �ifi
¥i�1N�1 fi
(15)
Substituting equation (5) and (6)
� ��G
¥i�1N�1 �G i
�f
¥i�1N�1 fi
(16)
(Temkin, 1963).The net rate r of overall reaction is the difference between the forward and reverse
rates, that is r � r� – r–. Substituting equation (14) into this relation gives
r � r� � FT (17)
where FT is the thermodynamic potential factor
647of microbial metabolism
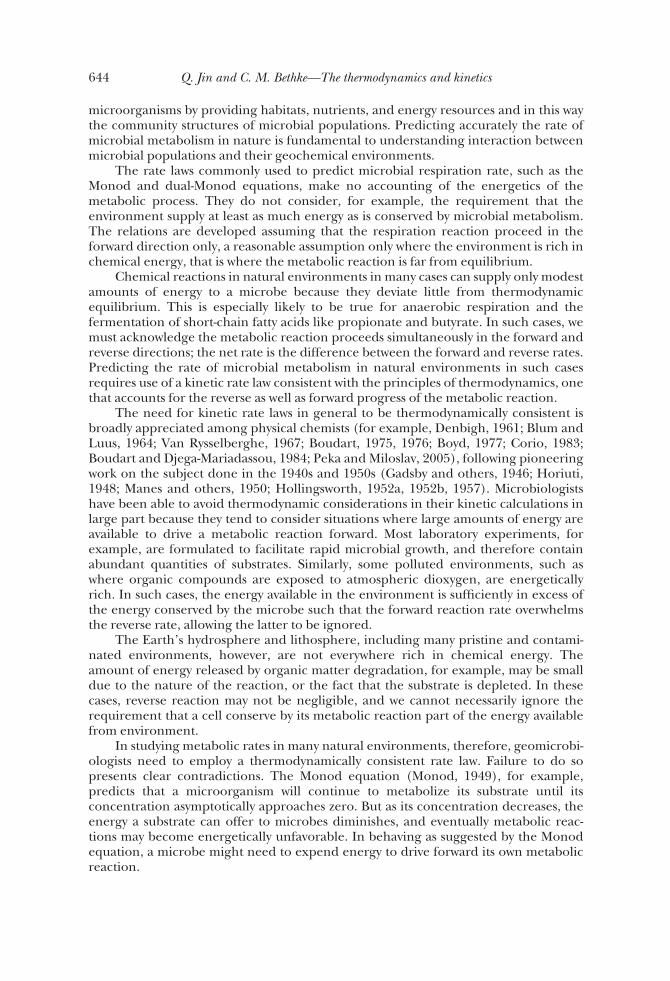
FT � 1 � exp� �G�RT� � 1 � exp��
f�RT� (18)
(Happel, 1972). This factor shows how the overall reaction rate depends on thethermodynamic driving force f for the reaction. Where there is a strong drive, �G islarge and negative, FT approximates unity, and the overall rate is about equal to theforward reaction rate. If the reaction is in equilibrium, the driving force f and hence FTvanishes, and the net rate is zero. Where f is negative, FT takes a negative value and thereaction proceeds backwards, that is, at a negative rate.
Equations (17) and (18) are notable in that they show that a rate law, in order tobe thermodynamically consistent, needs to account for not only the forward but thereverse rate of reaction. The net rate, the difference between these two values, varieswith the amount of energy available to drive the reaction, and this variation isaccounted for by the thermodynamic potential factor FT. These relations constituteimportant tenets of irreversible thermodynamics and must be included in any generaltheory of reaction rate.
microbial metabolismApplying the discussion in the previous section, we can show the rate of microbial
metabolism can be calculated in a way that honors the requirement of thermodynamicconsistency.
Enzymatic ReactionsThe basic unit of microbial metabolism is the enzymatic reaction, that is, a
reaction catalyzed by an enzymatic protein. To catalyze a reaction, an enzyme bindsfirst to the reactant or substrate compound, S. Once bound, the substrate-enzymecomplex reacts to form the product species P. An enzymatic reaction can be repre-sented in a general form as
�S
SS w �P
PP (19)
where S and P are the stoichiometric coefficients for the substrate and productspecies. The Gibbs free energy change (�G) of the reaction is
�G � �Go � RT ln�P aP
P
�S aSS
(20)
where �Go is the Gibbs free energy change under standard conditions: absolutetemperature of T (in Kelvin) and the activities of reactant and products (that is, aS andaP, respectively) and gas fugacities of 1. In cases of dilute solutions and gases, followingcommon practice in geomicrobiology, we will use concentration and partial pressurein place of activity and fugacity when evaluating this equation.
A special case of enzymatic reaction occurs where the Gibbs free energy changebecomes positive (that is �G � 0), making forward progress of the reaction thermody-namically unfavorable. Enzymes can still catalyze such a reaction by simultaneouslycatalyzing an energy-releasing reaction, such as the hydrolysis of ATP to adenosinemonophosphate (AMP) and pyrophosphate (PPi), or to ADP and Pi. In the case of ATPhydrolysis to AMP and PPi
ATP � H2O w AMP � PPi � 2H� (21)
the Gibbs free energy change �GM is
648 Q. Jin and C. M. Bethke—The thermodynamics and kinetics

�GM � �GMo � RT ln
�AMP��PPi�
�ATP�(22)
where [ ] represents concentration of chemical species (in molal unit) and �GMo is the
value of �GM under biological standard conditions (that is activities and fugacities of 1and pH 7), about �41.67 kJ � (mol ATP)�1 at 25oC (Thauer and others, 1977).
If a number ATP of ATPs are hydrolyzed per turnover of reaction 19, the amountof energy released is the product of this number and �GM, that is ATP � �GM. Theoverall reaction takes the general form
�S
SS � ATPATP � ATPH2O ^ �P
PP � ATPAMP � ATPPPi � 2ATPH� (23)
and the thermodynamic driving force f for the reaction
f � ��G � ATP � �GM (24)
is the difference between the energy available from reaction 19 (that is the negative of�G, eq 20) and that from the hydrolysis of ATP to AMP and PPi. Typical examples ofcoupled enzymatic reactions are substrate uptake into a cell’s cytoplasm (for example,Varma and others, 1983; Stahlmann and others, 1991) and substrate activationreactions, such as acetyl-CoA formation (Cozzone, 1998) and adenosine phosphosul-fate formation (Peck, 1959).
FermentationFermentative microorganisms can conserve the chemical energy released from
the oxidation of organic compounds without transferring electrons to an externalelectron acceptor. Here external means the electron acceptor is not produced orconsumed by the fermentation reaction. During fermentation, organic compoundsare degraded and oxidized to a series of intermediate compounds. The electronsreleased from the oxidation are utilized to take coenzymes, such as nicotinamideadenine dinucleotide (NAD�), to their reduced form. The reduced coenzymes revertto their oxidized form by reducing intermediate compounds. As a result, microbialfermentation degrades an organic substrate S to reaction products of two forms, oneoxidized (P�) and the other reduced (P�)
Sw �P�
P�P� � �P�
P�P� (25)
The energy available �GA for fermentation is the negative of the Gibbs free energychange �G of this reaction, that is
�GA � ��G � ��Go � RT ln�P� �P��P� �P� �P��P�
�S�(26)
Fermentative microorganisms can conserve a fraction of the energy released bycoupling reaction 25 to ATP synthesis
ADP � Pi � 2H� w ATP � H2O (27)
This pathway is known as substrate level phosphorylation. The Gibbs free energychange �GP of ATP synthesis is
�GP � �GPo � RT ln
�ATP�
�ADP��Pi�(28)
649of microbial metabolism

where �GPo , the standard Gibbs free energy change at pH 7, is about 31.50 kJ � (mol
ATP)�1 at 25oC (Rosing and Slater, 1972), [ATP], [ADP], and [Pi] are concentrationsof ATP, ADP, and phosphate inside the cell membrane. The value of �GP, denoted asthe phosphorylation potential, ranges from 40 to 50 kJ � (mol ATP)�1 in anaerobicmicroorganisms (Thauer and others, 1977; Kashket, 1983; Bond and Russell, 1998;Tran and Unden, 1998).
The overall reaction for microbial fermentation, then, is
S � PADP � PPi � 2PH� w �P�
P�P� � �P�
P�P� � PATP � PH2O (29)
where P is the number of ATP synthesized per turnover of the reaction. The totalamount of energy �GC conserved during fermentation then is the product P � �GP.Note the value of �GP and thus �GC is positive. The thermodynamic driving force f forfermentation
f � �GA � �GC
� �GA � P � �GP (30)
is the difference between the energy available (eq 26) and that conserved. This valuerepresents the chemical energy available to drive the degradation of substrate S whilesynthesizing ATP.
RespirationRespiring microorganisms derive energy by catalyzing an electron transfer reac-
tion. Electrons derived from the oxidation of an electron donor pass through arespiratory chain to a terminal enzyme, when they reduce an external electronacceptor (fig. 2). Among the broad variety of electron donors found in naturalenvironments are dihydrogen (H2), formate, and acetate. Common electron acceptors
Fig. 2. Generalized model of microbial respiration. Electrons derived from the oxidation of an electrondonating species D are transferred to redox coenzyme E. The energy released in this step is conserved bysynthesizing ATP from ADP and phosphate. The electrons released from the oxidation of the reducedcoenzyme E are then transferred through the respiratory chain containing coenzymes c1 and c2 to anaccepting species A. Some of the energy released is conserved by translocating protons out of cellmembrane, building up proton motive force. Reaction centers (ovals) are, from left to right: primaryreductase, coenzyme reductase, and a terminal reductase.
650 Q. Jin and C. M. Bethke—The thermodynamics and kinetics
are dioxygen (O2), nitrate, ferric iron, sulfate, bicarbonate, and so on. The respiratorychain itself is a series of membrane-associated enzymes and coenzymes, which conservea part of the chemical energy released from the electron transfer reaction as protonmotive force across the cell membrane, an energy store which the cell can use tosynthesize ATP.
Redox reaction.—Many electron donors such as acetate and propionate cannotdonate electrons directly to the respiratory chain. Instead, electrons pass into therespiratory chain through the cycling of a redox coenzyme E. Oxidation of an electrondonor D
�D
DD w �D�
D�D� � ne� (31)
to D� is coupled to the reduction of a redox coenzyme E�
�E�
E�E� � ne�w �E
EE (32)
to form E . It is coenzyme E that donates electrons to the respiratory chain. As electronspass through the cell’s respiratory chain to electron accepting species, they shuttlealong a series of redox enzymes and coenzymes. A primary redox enzyme, the firstenzyme in the chain, strips electrons from the coenzyme E according to
�E
EE w �E�
E�E� � ne� (33)
Once electrons have traversed the respiratory chain, a terminal redox enzyme transfersthem to an accepting species, according to a half-cell reaction
�A
AA � ne�w �A�
A�A� (34)
where A and A� are chemical species on the oxidized and reduced sides of the electronaccepting reaction.
We can write the electron transfer from the electron donors D to acceptors A astwo consecutive redox reactions. The first is the oxidation of donor D (reaction 31)and reduction of coenzyme E� (reaction 32),
�D
DD � �E�
E�E� w �D�
D�D� � �E
EE (35)
The second the re-oxidation of redox coenzyme E (reaction 33) to pass electrons intothe respiratory chain and eventually onto the electron acceptor A (reaction 34),
�E
EE � �A
AA w �E�
E�E� � �A�
A�A� (36)
The redox reaction occurring in the environment as a result of microbial respiration is
�D
DD � �A
AA w �D�
D�D� � �A�
A�A� (37)
the sum of reaction 35 and 36. The energy available for respiration can be calculated asthe negative value of the Gibbs free energy change of reaction
�GA � ��G � nF�Eo � RT ln�D� �D��D� �A� �A��A�
�D �D�D �A �A�A(38)
651of microbial metabolism

where F is the Faraday’s constant and �Eo is the redox potential difference understandard conditions between half-reactions 34 and 31.
Energy conservation.—Respiring microorganisms can conserve some of the energyreleased by electron transfer from donor to acceptor in two ways. First, if themetabolism involves a redox coenzyme E, the microbe can couple the reduction of Eduring electron acceptance (reaction 35) to ATP synthesis (reaction 27). The overallreaction is
�D
DD � �E�
E�E� � PADP � PPi � 2PH� w �D�
D�D�
� �E
EE � PATP � PH2O (39)
the sum of the two reactions. The amount of energy conserved is the product P � �GPof the number P of ATPs synthesized and the phosphorylation potential.
Second, according to the chemiosmotic theory (Mitchell, 1961), microorganismscan conserve the chemical energy released from the electron transfer through therespiratory chain (reaction 36) by translocating protons inside their cytoplasm to theoutside of their membrane
Hin� w Hout
� (40)
Here Hin� and Hout
� represent, respectively, protons inside and outside the membrane(fig. 2). We can represent the coupled reaction between electron transfer and protontranslocation in a general form
�E
EE � �A
AA � HR Hin
� w �E�
E�E� � �A�
A�A� � HR Hout
� (41)
where HR is the number of protons translocated outside the membrane per turnover of
the reaction.Translocating protons outside the cell leads to differences in electrical charge and
proton concentration across the cell membrane, creating electrical potential andchemical potential differences. When protons pass outside the membrane, the move-ment of a charge of �1 against the electrical potential difference across the membraneleads to an electrical energy change, the amount of which is given per mole of protonsas F��. Here, �� � �out � �in is the difference between the electrical potential outside(�out) and inside (�in) the membrane. The movement of protons through theconcentration difference across the membrane results in a chemical energy change,the amount of which per mole of protons is RT ln [Hout
� ]/[Hin�]. The sum of the two
energy changes
�GH � F�� � RT ln�Hout
� �
�Hin� �
� F�p (42)
represents the total free energy change in kJ � (mol H�)�1 arising from the transloca-tion of protons outside the cell membrane. Here, �p is the proton motive force, in volts(Nicholls and Ferguson, 1992)
�p � �� �RT ln�10�
F�pH (43)
and �pH � pHout � pHin, the difference between the pH outside (pHout) and inside(pHin) the membrane. The total amount of energy conserved by translocating the
652 Q. Jin and C. M. Bethke—The thermodynamics and kinetics
number of HR protons is the product H
R � F � �p of the number of protons translocatedand the free energy change �GH.
The overall reaction representing microbial respiration can be written
�D
DD � �A
AA � PADP � PPi � �2P � HR �Hin
� w �D�
D�D�
� �A�
A�A� � PATP � PH2O � HR Hout
� (44)
as the sum of reactions 39 and 41. The total amount of energy conserved (�GC) duringelectron transfer from the electron donor D to electron acceptor A is
�GC � P � �GP � HR � F � �p (45)
the sum of the energy conserved as phosphorylation potential during reaction 39 andthat conserved as proton motive force during reaction 41.
The phosphorylation potential �GP and proton motive force �p in respiringmicroorganisms are interconvertible due to the catalytic activities of ATP synthase inthe cell membrane. This enzyme can transfer proton motive force to the phosphoryla-tion potential, and vice versa, by coupling ATP synthesis to proton translocation fromthe outside to inside of the cell membrane,
ADPi � Pi � HP Hout
� w ATP � H2O � �HP � 2�Hin
� (46)
Here, HP is the number of protons translocated out of cell membrane per ATP
synthesized. The Gibbs free energy change of this reaction is
�G � �GP � HP � F � �p (47)
In contrast to microbial respiration (reaction 44), reaction 46 can be assumed to beclose to thermodynamic equilibrium. As a result, the Gibbs free energy change �G iszero and
�GP � HP � F � �p (48)
Substituting into equation (45), we can express the total amount �GC of energyconserved
�GC � PR � �GP (49)
in terms of phosphorylation potential. Here PR � P � H
R /HP is the number of
equivalent ATPs synthesized during respiration.The thermodynamic driving force f for microbial respiration
f � �GA � PR � �GP (50)
is the difference between the energy available (�GA, eq 38) and that conserved (�GC,eq 49). The value of f represents the chemical energy available to drive forward thetransfer of electrons from donor D through the respiratory chain and acceptor A, whileconserving energy by ATP synthesis and proton translocation.
Biomass SynthesisAmong the uses for the energy a microorganism conserves during fermentation or
respiration is the creation of new biomass. The ability to predict the rate at which astrain creates biomass is important to understanding biogeochemical reactions, be-cause the reactions are autocatalytic, that is, the reaction rates attainable in a geochemi-cal system increase as biomass concentration increases.
653of microbial metabolism
Biomass synthesis requires that nutrients, primarily carbon and nitrogen, beconsumed. Organic as well as inorganic carbon can be utilized as the source of nutrientcarbon, so we can take the general formula CHpOq to represent the carbon source(Stouthamer and Van Verseveld, 1985). The reductance degree �C of the carbonsource is the number of electrons available per carbon atom, given by
�C � 4 � p � 2q (51)
as shown by Minkevich and Eroshin (1973). If we neglect the phosphorus and sulfurcontent of the biomass formed, we can write a general formula C5H7O2N to representbiomass (Hoover and Porges, 1952). The reductance degree �B for biomass is
�B � 4 �75
� 2 �25
� 3 �15
� 4 (52)
The difference z between �B and �C (that is z � �B � �C � 2q � p) represents thenumber of electrons consumed (z � 0) or liberated (z � 0) per carbon during biomasssynthesis.
For certain carbon nutrients such as propionate (CH3CH2COO�) and butyrate(CH3CH2CH2COO�), the reduction degree �C of the carbon source is greater thanthat of the biomass, �B, in which case the value of z becomes negative and hencebiomass synthesis releases electrons. Where bicarbonate (HCO3
�) and formate(HCOO�) are utilized as the carbon source, however, the value of z is greater than zeroand we can represent biomass synthesis as an electron accepting half-reaction
5CHpOq � NH4� � �5z � 1�H� � 5ze� 3 C5H7O2N � �5q � 2�H2O (53)
assuming the microorganism utilizes ammonia as its nitrogen source. During biomasssynthesis, the electrons consumed are provided by the oxidation of the redox coen-zymes, and the energy required is provided by the hydrolysis of ATP (the reverse ofreaction 27). The overall reaction representing biomass synthesis, then,
5zn �
E
EE�5CHpOq�PSATP�NH4
��(5z � 2PS � 1)H� 3
5zn �
E�
E�E�
�C5H7O2N�PSADP�P
SPi�(5q � 2 � PS)H2O (54)
is the sum of half-cell reactions 33 and 53. Here PS is the mole number of ATPs
hydrolyzed per mole biomass synthesized.For respiring microorganisms, the redox enzyme E consumed during biomass
synthesis can be replenished by coupling the reduction of coenzyme E� to theoxidation of electron donor D (that is reaction 39). The overall reaction in this casebecomes
5zn �
D
DD � 5CHpOq � PXATP � NH4
� � �PX � 2 � 5q�H2O � �5z � 2P
X � 1�H�
35zn �
D�
D�D� � C5H7O2N � PXADP � P
XPi (55)
the sum of reactions 39 and 54. Here PX � P
S � (5z/n)P represents the net number ofATPs consumed per biomass synthesized. In theory, we can calculate the thermody-namic driving force fX for biomass synthesis
654 Q. Jin and C. M. Bethke—The thermodynamics and kinetics

fX � ��GXR � P
X � �GP (56)
as the difference between the negative of the Gibbs free energy change �GXR of the
oxidation of electron D (reaction 31) coupled to biomass synthesis half-reaction(reaction 53) and the energy available from hydrolyzing ATP (P
X � �GP). For mostmicroorganisms, however, appropriate values for �GX
R and PX remain to be determined
and the driving force for biomass synthesis cannot be evaluated to this level ofprecision.
Microbial MetabolismA microbe’s metabolism is the sum of its catabolism (that is respiration or
fermentation) and its anabolism (that is biomass synthesis). Where the reductiondegree of the carbon source is less than that of the biomass (that is �C � �B),catabolism and anabolism both consume electrons released from the oxidation of theelectron donor (fig. 3) or fermented organic compound. The fractions of electronsconsumed by catabolism and anabolism are denoted �e and �S, respectively (McCarty,1971); the two fractions sum to one, that is �e � �S � 1.
The metabolism of a respiring microorganism has commonly been represented asthe result of a single reaction, by adding the product of �e and respiration (reaction 44)and the product of �S and biomass synthesis (reaction 55) (for example, Stouthamerand Van Verseveld, 1985; VanBriesen and Rittmann, 2000, et cetera). Expressingmicrobial metabolism in this way suggests microbial catabolism and anabolism are fullycoupled and, as a result, the reaction coefficients for substrate consumption andbiomass synthesis remain invariant regardless of the changes in the environment. Infact, microbial catabolism and anabolism are parallel and independent metabolicpathways and microbial metabolism is just a convenient term to summarize theensemble of biochemical reactions within a cell. A microorganism regulates catabolismand anabolism simultaneously to achieve its goal of survival and growth, but there is noevidence suggesting an enzymatic coupling between catabolism and anabolism ortherefore a single reaction describing its metabolism.
The values of �e and �S reflect the partitioning of electrons between catabolismand anabolism. It is worth noting that �e and �S do not affect the thermodynamicdriving forces f for respiration (eq 50), because respiration and biomass synthesis areparallel reactions in a microbe’s metabolism. The thermodynamic driving force f is bydefinition the chemical energy available to drive respiration, or the electron transferfrom the oxidation of electron donor D to the reduction of acceptor A. An electron
Fig. 3. Division of electrons between respiration and biomass synthesis. Electrons are released from theoxidation of electron donor D to its oxidized form D�. A fraction �e of electrons released is consumed byreducing the electron acceptor A to its reduced form A�. The remainder �s � 1 � �e is consumed by biomasssynthesis, represented here as the conversion of nutrients to biomass, C5H7O2N.
655of microbial metabolism
consumed in the half-reaction of biomass synthesis (reaction 53) does not participatein respiration and, therefore, does not affect the driving force for respiration.
thermodynamic potential factor
The rates of microbial fermentation, respiration, and biomass synthesis varydirectly with the thermodynamic potential factor, according to equation (17). Formicrobial fermentation and respiration, the factor can be written as
FT � 1 � exp���GA � �GC
�RT � (57)
by substituting equation (30) and (50) into (18). Comparing this relation to thethermodynamic term commonly carried in rate laws for abiotic reactions (eq 2), we seean additional term of the energy conserved (�GC), which takes into account thatmicrobial metabolism conserves energy from the environments. In other words, theenergy conserved �GC is not available to drive the metabolism forward.
Average Stoichiometric NumberThe average stoichiometric number � can in principle be determined from the
mechanism of the overall metabolic reaction as well as the Gibbs free energy change ordriving force for each elementary step. This information, however, is unavailable formost metabolisms. Instead, we can assume that a single rate determining (or limiting)step controls progress of the overall reaction. At steady state, the thermodynamic drivefor other steps is insignificant compared to that for the rate determining step. In otherwords, we can approximate the thermodynamic driving force f for the overall reactionas
f � �rdfrd � �ird,i�1
N�1
�ifi � �rdfrd (58)
and the sum of the driving forces fi for each step as
�i�1
N�1
fi � frd � �ird,i�1
N�1
fi � frd (59)
where �rd is the number of times that the rate determining step takes place perturnover of the overall reaction and frd is the step’s driving force. Substitutingequations (58) and (59) into (16), we see that � � �rd, that is, the average stoichiomet-ric number � is approximately �rd.
Since the number of times the rate determining step occurs in the overall reactiondepends on how the reaction (for example, reactions 29 and 44) is written, so does thevalue of � (Jin and Bethke, 2005). If the stoichiometric coefficients (those are S, P,D, A, et cetera) of reactions 29 and 44 were to double, the value of �rd would double aswell, and so will the average stoichiometric number �. For microbial catabolism, likelyrate determining steps are ATP synthesis during fermentation, proton translocation,substrate activation (for example, benzoyl-CoA formation), electron transfer to extra-cellular electron acceptors, and so on.
Thermodynamic ControlThe thermodynamic potential factor varies as a function of the thermodynamic
driving force, as shown in figure 4. The driving force is large where the energy availableto a microbe from its environment, �GA, is much greater than that conserved by
656 Q. Jin and C. M. Bethke—The thermodynamics and kinetics

microbial metabolism, �GC. Under such conditions, the value of FT approaches unityand the metabolic rate r, the product of FT and the forward reaction rate r�, is aboutthe same as the forward rate. Taking � to be two, a driving force of 15 kJ � mol�1
translates to a value for FT of about 0.95, for example, and the net reaction rate istherefore about 95 percent of the forward rate. Where the driving force is large,therefore, the thermodynamic potential factor plays only a small role in determiningthe metabolic rate and can commonly be neglected.
The thermodynamic potential factor, conversely, can exert a strong control onmetabolic rate if the thermodynamic drive is small. Where the energy available (�GA)falls close to that conserved by microbial metabolism (�GC), the driving force ap-proaches zero and so does the value of FT. As a result, microbial metabolism proceedsat a net rate much smaller than the forward reaction rate. In natural environments, thedriving force for biogeochemical processes such as sulfate reduction, methanogenesis,et cetera, can be quite small. The small drives result from the fact that such chemicalreactions commonly liberate little free energy under standard conditions (that is ��Go
is small, or even negative), and because the supply of substrates in natural environ-ments can be severely depleted. For many biogeochemical processes, therefore, thethermodynamic potential factor has to be considered to predict their rates.
The value of FT assumes a zero value where the driving force vanishes, as is the casewhere the energy available in the environment balances the energy conserved by themicrobe. The cessation of microbial metabolism once the energy available falls to afinite value has been widely reported for experimental studies of the fermentation ofethanol, propionate, butyrate, and benzoate (Seitz and others, 1990; Wallrabensteinand Schink, 1994; Westermann, 1994; Wu and others, 1994; Hopkins and others, 1995;Warikoo and others, 1996; Scholten and Conrad, 2000; Jackson and McInerney, 2002;Jin, 2007) and for many types of microbial respiration, including nitrate reduction(Cord-Ruwisch and others, 1988; Seitz and others, 1990; Lu and others, 2001), arsenatereduction (Blum and others, 1998; Jin and Bethke, 2003), iron reduction (Liu andothers, 2001; Roden and Urrutia, 2002; Dominik and Kaupenjohan, 2004; He andSanford, 2004), sulfate reduction (Cord-Ruwisch and others, 1988; Seitz and others,
Fig. 4. Variation of the thermodynamic potential factor FT with the energy available �GA. Line A and Brepresent previous models (those are eq 62 and 64, respectively). Line C represents the model we present(eq 57), taking a value for the average stoichiometric number � of 2 and that for energy conserved �GC as 30kJ � mol�1. In evaluating equation (64), the phosphorylation potential �GP is taken as 50 kJ � (mol ATP)�1.
657of microbial metabolism

1990; Hoehler and others, 1998, 2001; Sonne-Hansen and others, 1999), methanogen-esis (Jetten and others, 1990; Westermann, 1994; Yang and McCarty, 1998; Hoehlerand others, 1998, 2001), and acetogenesis (Conrad and Wetter, 1990; Peters andothers, 1998).
At the point at which the thermodynamic drive vanishes,
�GC � �GA (60)
The amount of energy available in an experiment at the point at which metabolismceases, then, is a measure of the amount of energy a microbe conserves. Thisobservation provides a convenient approach for estimating energy conservation byfermenting and respiring microbes, even in cases where details of the metabolicpathway have yet to be resolved.
A driving force less than zero occurs where insufficient energy is available tosupport energy conservation. In this case, FT becomes negative, suggesting thatmicrobial metabolism proceeds in reverse. Microbial catabolism in the reverse direc-tion would consume rather than conserve energy, wasting a cell’s energy store. Toavoid dissipation of its energy stores, a microorganism will normally regulate theactivities of the enzymes in its respiratory chain in order to stop the metabolism. Wecan, therefore, represent the rate of microbial metabolism in a form
r � � r��1 � exp���GA � �GC
�RT ��; �GA � �GC
0; �GA � �GC
(61)
that accounts for the possibility of a negative thermodynamic drive and the necessity ofa microbe, under such conditions, preserving its energy stores.
Other ModelsWe can compare the thermodynamic potential factor proposed herein (eq 61) to
previous attempts to honor thermodynamic consistency in the description of microbialmetabolism (fig. 4). Hoh and Cord-Ruwisch (1996) proposed a thermodynamic termof the form
F � 1 � exp���GA
RT � (62)
We see that this factor is a simplification of the thermodynamic potential factor for thecase in which microbial metabolism is an elementary process (that is � � 1) thatdoesn’t conserve energy (�GC � 0). A factor of this form suggests that microbialmetabolism would proceed until the chemical reaction (for example, reactions 25 and37) reaches a thermodynamic equilibrium, regardless whether or not the driving forceis positive.
A second model (Kleerebezem and Stams, 2000) recognizes that a microorganismcan utilize only part of the energy available to drive its metabolic reaction forward.These authors modified the model of Hoh and Cord-Ruwisch (1996) as
F � 1 � exp���GA � �GC
RT � (63)
to account for the thermodynamic drive for the fermentation of butyrate to dihydro-gen and acetate. This model represents a special case of equation (61) in which � takesa value of 1.
658 Q. Jin and C. M. Bethke—The thermodynamics and kinetics
A third model (Liu and others, 2001) is based on the concept of a biologicalenergy quantum (Schink and Friedrich, 1994). According to this concept, ATPsynthase produces one ATP for every three protons translocated inside the cellmembrane. The minimum quantum of energy, therefore, is the energy required totranslocate one proton out of cell membrane, about one third of energy required forATP synthesis. In other words, for microbial metabolism to proceed forward, theenergy available should be larger than one third of the energy required for ATPsynthesis. Taking into account this minimum quantum energy, Liu and others (2001)proposed a factor of
F � 1 � exp�
�GA �13
�GP
RT (64)
According to this model, microbial metabolism proceeds until the energy availabledecreases to one third of the phosphorylation potential. Comparing this relation toequation (61), we see that this model holds for the special case in which microbialmetabolism is an elementary process (that is � � 1) that produces one-third of an ATPper turnover of the reaction.
Curtis (2003) modified the model of Hoh and Cord-Ruwisch (1996) so that
F � � 1 � exp���GA
RT �, �GA � �GTHR
0, �GA � �GTHR
(65)
In this way, they provided for the cessation of microbial metabolism where the energyavailable decreases below a threshold �GTHR. Comparing this model to equation (61),we see the threshold energy �GTHR is in fact the amount of energy �GC conserved,which is more properly subtracted from the energy available �GA to give the thermody-namic control.
rate law
The rate rF of microbial fermentation (reaction 25) is the number of moles of thesubstrate S degraded per unit volume, per unit time (mol � liter�1 � sec�1, or M � sec�1)
rF � �d �S�
dt�
d �P��
P�dt�
d �P��
P�dt(66)
The rate rR of microbial respiration (reaction 37) is the mole number of electronstransferred through the respiratory chain per unit volume, per unit time
rR � �d �D�
Ddt� �
d �A�
Adt�
d �D��
D�dt�
d �A��
A�dt(67)
And, the rate rX of biomass synthesis (reaction 55) is the number of grams of biomasssynthesized per unit volume, per unit time (g � liter�1 � sec�1)
rX �d �X�
dt(68)
Here [X] is biomass concentration (g biomass � liter�1, or g � liter�1). A general kinetictheory for microbial metabolism requires laws be developed describing each of theserates.
659of microbial metabolism

Steady StateAt steady state, the energy conserved (per unit volume per unit time) during
catabolism equals that consumed by biomass synthesis and cell maintenance. For arespiring microorganism, the energy conservation rate rR
E (kJ � liter�1 � sec�1) is
rRE � P
R � �GP � rR/n (69)
the product of the energy conserved per mole of electrons transferred and the rate ofelectron transfer. The rate rX
E of energy consumption during biomass synthesis is
r XE � P
X � �GP �rX
w(70)
which is the product of energy consumed per gram of biomass synthesized and the rateof biomass synthesis. Here, w, the molecular weight for biomass. The rate r M
E of energyconsumption during cellular maintenance can be expressed
r ME � �X� � rM � �GP (71)
where rM is the number of ATPs consumed in maintaining each gram of biomass perunit time. Cellular maintenance refers to a variety of biochemical processes that do notcontribute to biomass synthesis and microbial growth, such as maintaining the protonmotive force, transporting solutes across the cell membrane, the turnover of cellularmacromolecules, cell motility, et cetera (Neidhardt and others, 1990). At steady state,
r RE � rX
E � rME (72)
Substituting equations (69), (70), and (71), we see that
rX � Y � rR � D � �X� (73)
where Y � w � PR /(P
X � n) is the growth yield (g � mol�1), the grams of biomasssynthesized per mole of electrons transferred through the respiratory chain, and D �w � rM/P
X has been termed the specific maintenance rate (sec�1) (Marr and others,1962; Pirt, 1965). Equation (73) was developed empirically by Herbert (1958) toaccount for the loss of biomass due to cellular maintenance. According to equation(73), although microbial catabolism and anabolism are not coupled by any enzymes,the balance between the energy production and consumption at steady state gives riseto a linear relationship between the rates of biomass synthesis and those of respiration(or fermentation). To predict the rate of microbial metabolism (catabolism andanabolism) at steady state, we need only predict the rate of microbial respiration (orfermentation) and then subtract the rate of biomass synthesis, calculated according toequation (73).
Once the rates of microbial respiration (or fermentation) and biomass synthesisare known, we can predict the rates at which the chemical species involved in microbialmetabolism are consumed or produced. For a respiring microorganism utilizing acarbon source with reduction degrees less than that of biomass, both respiration andbiomass synthesis consume the electron donor D (reactions 44 and 55). The rate ofelectron donor consumption can be calculated
d�D�
dt� �D � rR �
5 � z � D
n � wrX (74)
as the sum of the rates at which respiration and biomass synthesis consume theelectron donor.
660 Q. Jin and C. M. Bethke—The thermodynamics and kinetics

Forward RateFrom equation (61), we see that a thermodynamically consistent rate law for
microbial fermentation and respiration is composed of two parts: the thermodynamicpotential factor (eq 61) and the forward reaction rate r�. To predict the metabolicrate, we need a description of the latter. Various empirical rate laws, such as thezero-order, first-order, logistic, logarithmic, Monod, and dual-Monod equation, havebeen proposed to describe respiration and fermentation (for example, Monod, 1949;Megee and others, 1972; Berner, 1980; Lee and others, 1984; Simkins and Alexander,1984; Bae and Rittmann, 1996; et cetera).
We can generalize these simple laws as a multi-Monod equation (Jin and Bethke,2005)
r� � k�X� �C
FC (75)
where k is the rate constant (mol � (mg � sec) �1) and FC are kinetic factors
FC ��C�
�C� � KC(76)
that describe how the concentration [C] of the organic substrate controls the fermen-tation rate, or the concentration of electron donor or acceptor controls the respirationrate. Here, KC is the half-saturation constant (mol � liter�1 or molal). These lawspredict well the forward rates of fermentation and respiration when applied underappropriate geochemical conditions, such as large substrate concentrations, bufferedpH, and no buildup of metabolic products.
By combining a simple law of such form with the thermodynamic potential factor,we can generalize the rate law to apply over a range of thermodynamic conditions. Inother words, appending the thermodynamic factor produces a modified rate law thathonors the requirements of thermodynamic consistency. A general rate law predictingthe rate rF of the microbial fermentation
rF � � k�X� �S
�S�
�S� � KS�1 � exp��
f�RT��; f � 0
0; f � 0(77)
can be written from equations (61), (75), and (76), where KS is the half-saturationconstant for the substrate and the driving force f is calculated according to equation(30). The respiration rate rR can be predicted according to
rR � � k�X��D �D�
�D �D� � KD�
�A �A�
�A �A� � KA�1 � exp��
f�RT��; f � 0
0; f � 0(78)
where KD and KA are half-saturation constants for electron donor D and acceptor A,respectively, and the driving force is calculated according to equation (50).
Where the energy available is abundant and the thermodynamic drive is large, aswe have noted, the value of FT in the general rate law (eq 77 and eq 78) approachesunity and forward reaction overwhelms reverse; as such, the general rate law simplifiesto the simple laws (eq 75). For example, laboratory studies, in order to promotemicrobial growth, are commonly conducted in the presence of a large thermodynamicdriving force. This is also the case where microbial metabolism in the environments is
661of microbial metabolism

driven by abundant energy available, such as organic compounds exposed to atmo-spheric oxygen.
applicationWe have shown previously that the thermodynamic driving force can exert a
significant control on the rate of microbial respiration (Jin and Bethke, 2003, 2005). Inthis section, we demonstrate how thermodynamics can control the progress of enzy-matic reactions and the metabolism of fermentative micororganisms.
Enzymatic ReactionSyntrophus gentianae can ferment benzoate syntrophically, relying on sulfate-
reducing bacteria and methanogens to consume the dihydrogen it produces (Schink,1992). During fermentation, benzoate-CoA ligase combines benzoate and coenzyme A(CoASH) to produce benzoyl-CoA
Benzoate � CoASH � H� q Benzoyl-CoA � H2O (79)
The Gibbs free energy change �G is
�G � �Go � RT ln�Benzoyl-CoA�
�Benzoate��CoASH�(80)
Here the standard Gibbs free energy change at pH 7, �Go , takes a value of 25.0 kJ �(mol benzoate)�1 at 25oC (Thauer and others, 1977; Schocke and Schink, 1999).Where concentrations of benzoate, benzoyl-CoA, and coenzyme A are in similar mMranges, the value of �G remains positive and reaction 79 should proceed backwards,decomposing benzoyl-CoA to benzoate and coenzyme A.
Benzoate-CoA ligase catalyzes the forward reaction by coupling it to ATP hydroly-sis to form AMP and PPi (reaction 21). Since one ATP is hydrolyzed per benzoyl-CoAproduced, the overall reaction can be represented
Benzoate � CoASH � ATP q Benzoyl-CoA � AMP � PPi � H� (81)
as the sum of reactions 79 and 21. According to equation (24), the thermodynamicdriving force for this reaction is
f � ��G � �GM (82)
which is the negative Gibbs free energy change for reaction 81. Here, �G is the Gibbsfree energy for reaction 79 (eq 80).
Schocke and Schink (1999) studied the progress of benzoyl-CoA formationcatalyzed by benzoate-CoA ligase purified from S. gentianae (fig. 5). In their experi-ments, a cell-free extract containing benzoate-CoA ligase was added to a pH-bufferedsolution containing 1 mM benzoate, 1 mM coenzyme A, and 1 mM ATP. With time, theconcentrations of benzoate, coenzyme A, and ATP decreased, while benzoyl-CoA andAMP accumulated. After about 10 minutes, the concentrations of these species heldconstant, indicating the reaction had ceased. At this point, 0.65 mM of benzoate, 0.47mM of coenzyme A, and 0.65 mM of ATP remained in the system.
To test whether the thermodynamic driving force (eq 82) controls the rate ofbenzoyl-CoA formation, we need to evaluate how the Gibbs free energy change �G ofreaction 79 (eq 80) and the energy �GM released by ATP hydrolysis (reaction 21) varyover the course of the experiment. As shown in figure 6, the value of �G, about 32.2 kJ �(mol benzoate)�1 at the beginning of experiment, increases with time, approaching aconstant value of 42.5 kJ � (mol benzoate)�1. The increase is due to the rise inbenzoyl-CoA concentration and declines in the concentrations of benzoate and
662 Q. Jin and C. M. Bethke—The thermodynamics and kinetics
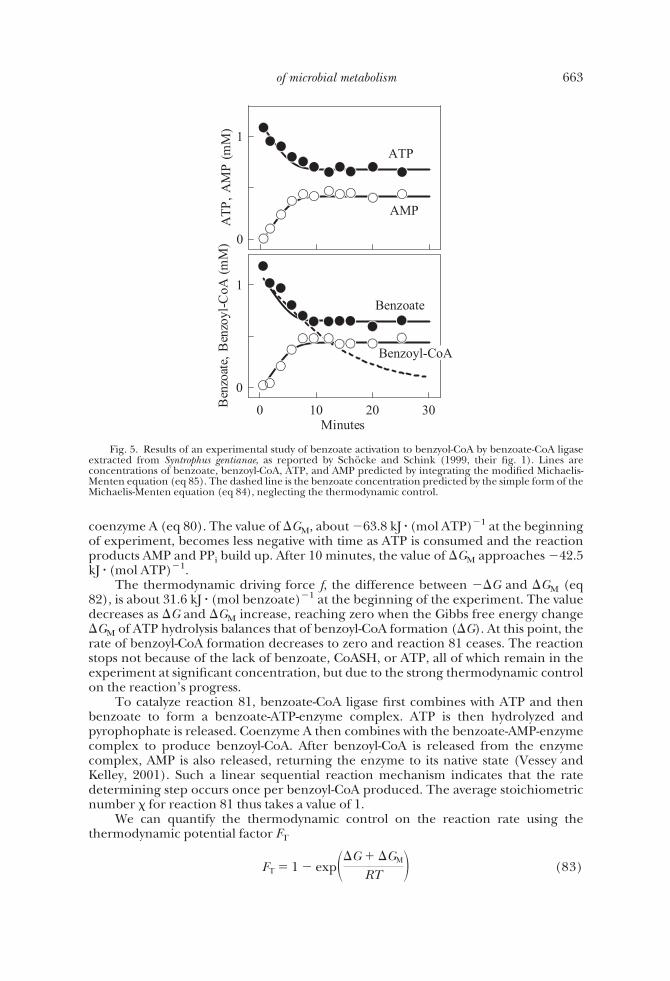
coenzyme A (eq 80). The value of �GM, about �63.8 kJ � (mol ATP)�1 at the beginningof experiment, becomes less negative with time as ATP is consumed and the reactionproducts AMP and PPi build up. After 10 minutes, the value of �GM approaches �42.5kJ � (mol ATP)�1.
The thermodynamic driving force f, the difference between ��G and �GM (eq82), is about 31.6 kJ � (mol benzoate)�1 at the beginning of the experiment. The valuedecreases as �G and �GM increase, reaching zero when the Gibbs free energy change�GM of ATP hydrolysis balances that of benzoyl-CoA formation (�G). At this point, therate of benzoyl-CoA formation decreases to zero and reaction 81 ceases. The reactionstops not because of the lack of benzoate, CoASH, or ATP, all of which remain in theexperiment at significant concentration, but due to the strong thermodynamic controlon the reaction’s progress.
To catalyze reaction 81, benzoate-CoA ligase first combines with ATP and thenbenzoate to form a benzoate-ATP-enzyme complex. ATP is then hydrolyzed andpyrophophate is released. Coenzyme A then combines with the benzoate-AMP-enzymecomplex to produce benzoyl-CoA. After benzoyl-CoA is released from the enzymecomplex, AMP is also released, returning the enzyme to its native state (Vessey andKelley, 2001). Such a linear sequential reaction mechanism indicates that the ratedetermining step occurs once per benzoyl-CoA produced. The average stoichiometricnumber � for reaction 81 thus takes a value of 1.
We can quantify the thermodynamic control on the reaction rate using thethermodynamic potential factor FT
FT � 1 � exp��G � �GM
RT � (83)
Fig. 5. Results of an experimental study of benzoate activation to benzyol-CoA by benzoate-CoA ligaseextracted from Syntrophus gentianae, as reported by Schocke and Schink (1999, their fig. 1). Lines areconcentrations of benzoate, benzoyl-CoA, ATP, and AMP predicted by integrating the modified Michaelis-Menten equation (eq 85). The dashed line is the benzoate concentration predicted by the simple form of theMichaelis-Menten equation (eq 84), neglecting the thermodynamic control.
663of microbial metabolism

by substituting equation (82) into (18). As shown in figure 6, the value of FT, aboutunity at the beginning of the experiment, decreases with time due to the decreases inthe driving force f. When the driving force disappears after about 10 minutes, the valueof FT decreases to zero and, according to the thermodynamically consistent rate law(eq 17), so does the predicted reaction rate .
As discussed above, we can account for the thermodynamic control by appendingthe thermodynamic potential factor FT (eq 57) to the rate law describing the forwardprogress of reaction 81. In enzyme kinetics, the forward rate is often described by theMichaelis-Menten equation (Plowman, 1972). For reaction 81, which consumes mul-tiple substrates, we can describe the forward rate as the product of the Michaelis-Menten equations (Schocke and Schink, 1999) written for each substrate individually,
r � rmax
�Benzoate�
�Benzoate� � KBen
�CoASH�
�CoASH� � KCoA
�ATP�
�ATP� � KATP(84)
where rmax is the maximum rate for a given amount of benzoyl-CoA ligase (mol �liter�1 � sec�1), and KBen, KCoA, and KATP are the Michaelis-Menten constants forbenzoate, CoASH, and ATP, respectively. The thermodynamically consistent form ofthis equation is
Fig. 6. Variation with time of the Gibbs free energy change (�G), the free energy released from ATPhydrolysis to AMP and PPi (�GM), thermodynamic driving force f, and the thermodynamic potential factorFT in the experiment study of benzoyl-CoA formation (Schocke and Schink, 1999). Lines are values of �GM,�G, f, and FT calculated using equation (22), (80), (82), and (57), respectively. Data points are the resultscalculated directly from the reported experiment data.
664 Q. Jin and C. M. Bethke—The thermodynamics and kinetics

r � rmax
�Benzoate�
�Benzoate� � KBen
�CoASH�
�CoASH� � KCoA
�ATP�
�ATP� � KATPFT (85)
where FT is given by equation (83).We can predict how the concentrations of chemical species vary with the experi-
ment progress by integrating equation (85) numerically. In evaluating the rate law, wetake a value of 2.5 � 10�6 mol � (liter � sec)�1 for rmax. The values for KBen, KCoA, andKATP, as determined by Schocke and Schink (1999), are 0.026 mM, 0.8 mM, and 0.05mM, respectively. We assume the enzyme activity, and also the value of rmax, remainsconstant throughout the experiment since the experiment duration of 25 minutes isrelatively short and the experimental conditions unchanged. As shown in figure 5, themodeling results fit the observations well. The concentrations of benzoate and ATPdecrease for about 10 minutes, then remain constant. Figure 7 shows how the ratecalculated by equation (85) varies over the course of the experiment. The rate is at itsmaximum at the beginning of the experiment and decreases to zero after 10 minutes.
If we neglect the thermodynamic control and use the multiple Michaelis-Mentenequation (eq 84) to predict the variations with time in the concentrations of chemicalspecies, the results differ significantly from the laboratory observations as shown infigure 5. To best fit the experiment observations, we take a value of 2.0 � 10�6 mol �liter�1 � sec�1 for rmax. According to equation (84), the concentrations of benzoate,CoASH, and ATP decrease with time. Instead of approaching constant values after 10minutes, however, the concentrations continue to decrease toward zero. Figure 7shows how the rate calculated in this way varies with time. According to equation (84),the rate decreases with time, but remains non-zero over the entire experimentalinterval.
The differences between the predictions by the Michaelis-Menten equation (eq84) and those by its revised form (eq 85) arise from the thermodynamic control on therate of benzoyl-CoA formation. According to equation (84), the rate depends only onthe concentrations of benzoate, coenzyme A, and ATP. Thus the calculated rateremains positive as long as the concentrations remain above zero, regardless whetherthe thermodynamic drive is positive or not. The thermodynamically consistent rate
Fig. 7. Variation of reaction rate with time predicted for the experimental study of benzoyl-CoAformation (Schocke and Schink, 1999). Solid line represents reaction rate calculated using the modifiedMichaelis-Menten equation (eq 85); the dashed line show the rate calculated according to the Michaelis-Menten equation (eq 84).
665of microbial metabolism

equation (eq 85) takes into account how the thermodynamic driving force controls therate. The rate vanishes when the driving force decreases to zero, even thoughsignificant amounts of substrates remain in the system to be catalyzed.
Crotonate FermentationThe fermentation of crotonate (CH3CHCHCOO�) by Syntrophus buswellii pro-
vides a second example of how thermodynamic drive can affect the rate of microbialmetabolism. S. buswellii can dismutate crotonate to acetate (CH3COO�) and butyrateaccording to
Crotonate � H2Ow Acetate �12
Butyrate �12
H� (86)
(Auburger and Winter, 1996). The Gibbs free energy change �G is
�G � �Go � RT ln�Acetate��Butyrate�1/2�H��1/2
�Crotonate�(87)
The value of �Go at 25oC, calculated from the formation energies (Thauer and others,1977), is �102.2 kJ � (mol crotonate)�1.
On the basis of the mass balance between crotonate consumption and acetate andbutyrate production observed in experiment studies (Wallrabenstein and Schink,1994), we see that S. buswellii utilizes butyrate as a carbon source. The half-cell reactionfor biomass synthesis (reaction 53) can be written
CH3CH2CH2COO� �45
NH4� 3
45
C5H7O2N �25
H2O �195
H� � 4e� (88)
The reduction degree of butyrate is 5, higher than the value of 4 for biomass. As aresult, biomass synthesis requires electron acceptors to proceed forward. The identityof the electron acceptor is unknown, but from the amount of biomass synthesized wecan estimate the stoichiometric relationship between the crotonate fermented andbutyrate produced. Auburger and Winter (1995) measured that about 9.5 g of biomassis produced per mol of crotonate fermented. In other words, about 0.08 mol ofbiomass (C5H7O2N, M.W. 113.1) is synthesized per mol crotonate fermented, consum-ing 0.1 mol butyrate. For each mole of crotonate fermented, then, the mole numbersof acetate and butyrate produced are 1 and 0.4 (that is 0.5 � 0.1), respectively.
Wallrabenstein and Schink (1994) studied crotonate fermentation by this strain at28oC. Their culture was inoculated into batch reactors containing the growth mediumwith an initial concentration of 10 mM crotonate. With time, as shown in figure 8, theconcentrations of biomass, acetate, and butyrate increase, while crotonate decreases.After about 16 days, crotonate concentration has fallen to a constant value of 0.5 mM,indicating fermentation has ceased.
Due to large crotonate concentration and low concentrations of acetate andbutyrate at the beginning of the experiment, the energy initially available (��G, asgiven by eq 87) is considerable, about 70.0 kJ � (mol crotonate)�1. As shown in figure 9,the energy decreases with time to 50.0 kJ � (mol crotonate)�1 over about 16 days andremains constant thereafter.
On the basis of the observed growth yield, Auburger and Winter (1996) estimatedthat 0.9 ATPs are synthesized for each crotonate fermented. Assuming that thephosphorylation potential �GP is 50 kJ � (mol ATP)�1 and taking the number of ATPssynthesized per crotonate fermented as 1, the value of the energy conserved (�GC) byS. buswellii is about 50.0 kJ � (mol crotonate)�1. Assuming that the mechanism forcrotonate fermentation does not vary over the course of the experiment, the value of
666 Q. Jin and C. M. Bethke—The thermodynamics and kinetics

�GC can be taken to be constant. As shown in figure 9, the thermodynamic drivingforce f , the difference between ��G and �GC, decreases from an initial value of about20.0 kJ � (mol crotonate)�1, reflecting the decrease in the energy available. After about16 days, the energy available balances that conserved and the driving force falls to zero.Based upon the relatively small values of the thermodynamic driving force f formicrobial fermentation, we see that the available energy controls significantly the ratesof crotonate fermentation by S. buswellii.
To evaluate the thermodynamic control on the fermentation by S. buswellii, weneed to estimate the value for the average stoichiometric number �. During crotonatefermentation, S. buswellii activates crotonate to crotonyl-CoA, a step catalyzed by eithercrotonate:CoA ligase or CoA transferase (Auburger and Winter, 1996). Assumingcrotonate activation is the rate determining step, the value of � for the reaction writtento yield a single crotonate is 1, since this step occurs once per crotonate fermented(reaction 86). The thermodynamic potential factor takes the form
FT � 1 � exp��G � �GC
RT � (89)
As shown in figure 9, the value of FT varies with the thermodynamic drive, starting nearunity but, after about 16 days, falling sharply to about zero. The thermodynamic factor,then, becomes a significant factor controlling the rate of crotonate fermentation.
We can describe the forward fermentation rate using the Monod equation
r� � k �X��Crotonate�
�Crotonate� � KS(90)
Adding the thermodynamic potential factor FT,
Fig. 8. Results of an experimental study of crotonate fermentation by Syntrophus buswellii, as reported byWallrabenstein and Schink (1994, their figure 1). Solid lines are concentrations of biomass, crotonate,butyrate, and acetate predicted by integrating equations (73) and (91). Note that butyrate produced percrotonate fermented is only 0.34, less than 0.5 as shown in reaction 86, due to the compound’s consumptionas a carbon source for biomass synthesis.
667of microbial metabolism

r � k �X��Crotoate�
�Crotonate� � KS�1 � exp��G � �GC
RT �� (91)
gives a thermodynamically consistent form of the Monod equation. We model theexperiment progress by integrating equations (73) and (91) numerically, taking intoaccount the mole ratio of 0.4 for butyrate produced to crotonate fermented. Inevaluating these equations, we take best-fit values of 20.0 mmol � g�1 � day�1 for rateconstant k, 0.5 mM for half-saturation constant KS, 9.5 g � (mol crotonate) �1 for growthyield Y, and zero for specific maintenance rate D. As shown in figure 8, the modifiedMonod equation (eq 91) predicts well the trend in crotonate concentration with time.
Figure 10 shows the rate of crotonate fermentation, as calculated using themodified Monod equation (eq 91). The rate predicted depends on the concentrationsof biomass and crotonate, and the thermodynamic potential factor FT. Crotonateconcentration and FT decrease with time, lowering the rate. The increasing biomassconcentration, conversely, raises the rate. The net rate first increases with time due tothe increasing biomass concentration, then, after about 12 days, starts to decrease inresponse to the thermodynamic control. The rate approaches zero after 16 days, alongwith the driving force and FT.
If we were to neglect the thermodynamic control and use the simple Monodequation (eq 90) to model the experiment, the results predicted would deviatesignificantly from those observed (fig. 10). In this case, crotonate will continue to bemetabolized until its concentration falls to zero. The Monod equation accounts onlyfor the effects of the concentrations of crotonate and biomass and, as a result,
Fig. 9. Variation with time of the energy available (��G), thermodynamic driving force f, andthermodynamic potential factor FT in the experiment study of crotonate fermentation (Wallrabenstein andSchink, 1994). Values of ��G, f, and FT are calculated using equations (87), (30), and (89), respectively.Data points are values calculated directly from the reported experimental data.
668 Q. Jin and C. M. Bethke—The thermodynamics and kinetics

invariably predicts a positive rate even when the energy available is insufficient to drivethe fermentation forward.
Glucose FermentationMicroorganisms degrade natural organic matter in natural environments by
hydrolyzing polymers such as polysaccharide to monomers like sugar molecules. Themonomers are then fermented to dihydrogen, short-chain fatty acids, and so on. As athird example of the importance of thermodynamics in controlling metabolic rates, weconsider how the thermodynamic drive controls the rate of glucose (C6H12O6)fermentation. This example differs from the previous example in that the drive for thefermentation is considerably larger for glucose than crotonate.
Lactic acid bacteria can oxidize one glucose molecule to two pyruvate moleculesthrough the glycolysis pathway, reducing two molecules of NAD� to NADH andsynthesizing two ATPs
Glucose � 2NAD� w 2 Pyruvate � 2 NADH � 4 H� (92)
The NADH can be re-oxidized to NAD� by reducing pyruvate to lactate(CH3CHOHCOO�)
Pyruvate � NADH � H� ^ Lactate � NAD� (93)
The overall reaction for fermentation of glucose to lactate is
Glucose w 2 Lactate � 2 H� (94)
and the Gibbs free energy change is
�G � �Go � RT ln�Lactate�2�H��2
�Glucose�(95)
The value of �Go at 25oC is �118.40 kJ � (mol glucose) �1 (Thauer and others, 1977).Figure 11 shows how the energy available (��G) varies with glucose concentration,assuming in a fermentative environment pH of 3 and lactate concentration of 500 �M.Because ��Go is large, the value of ��G is invariably positive (that is �150 kJ � (molglucose) �1) even at glucose concentrations as small as 1 �M. At glucose concentra-tions greater than 1 mM, the energy available is greater than 170 kJ � (mol glucose)�1.
Fig. 10. Variation in fermentation rate with time as calculated for the experimental study of crotonatefermentation (Wallrabenstein and Schink, 1994). Solid line represents the reaction rate predicted using themodified Monod equation (eq 91); the dashed line represents the predictions by the Monod equation (eq90), neglecting the thermodynamic control.
669of microbial metabolism

The amount �GC of energy conserved can be determined from the number ofATPs produced during glycolysis (Stryer, 1988). Since two ATPs are synthesized perglucose fermented, the energy conserved �GC � 2� �GP � 100 kJ � (mol glucose)�1,assuming a phosphorylation potential �GP of 50 kJ � (mol ATP)�1. Figure 11 shows howthe thermodynamic driving force f, the difference between the energy available andthe energy conserved, varies with glucose concentration. Since so much energy isavailable, the thermodynamic drive remains positive even at glucose concentrations assmall as 10�5 �M. At glucose concentrations over 1 �M, the value of f increases tomore than 50 kJ � (mol glucose)�1.
We can assume that ATP synthesis is the rate determining step. During glycolysis,ATP synthesis step, either the formation of phosphoglycerate or that of pyruvate,occurs twice per glucose fermented. The average stoichiometric number � thereforefor the reaction written to produce one glucose takes a value of 2. The thermodynamicpotential factor takes the form
FT � 1 � exp��G � �GC
2RT � (96)
or, substituting equation (95),
FT � 1 ��Lactate��H��
�Glucose�1/2 exp��Go � �GC
2RT � (97)
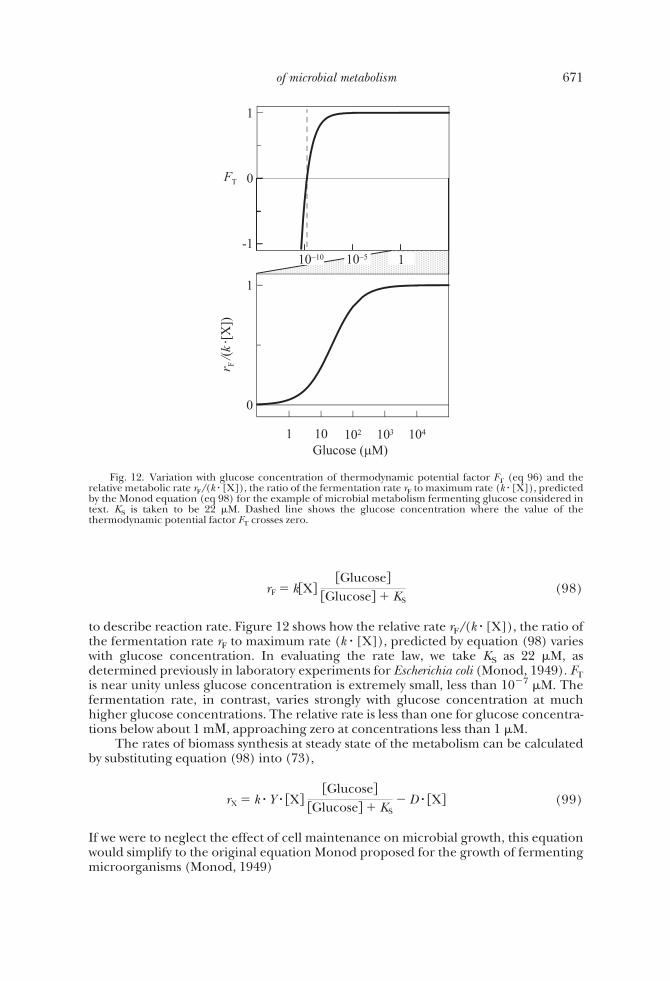
in terms of glucose and lactate concentrations. Figure 12 shows how the value of FTvaries with glucose concentration under the conditions assumed above. Where glucoseconcentration is greater than 10�7 �M, the value of FT remains close to unity. Thevalue falls significantly below unity only for glucose concentrations below 10�7 �M. Inother words, the thermodynamic control on glucose fermentation is significant onlywhere glucose concentration is extremely small.
Since abundant energy is available to drive glucose fermentation, we can neglectthe thermodynamic control under most circumstances and use the Monod equation
Fig. 11. Effect of glucose concentration on the energy available (��G, calculated according to eq 95)and driving force (f, by eq 30) for the example of glucose fermentation to lactate considered in the text. Inevaluating equation (95), we assume a temperature at 25oC, pH of 3, and a lactate concentration of 500 �M.Dashed line represents the amount of energy conserved (that is 100 kJ � (mol glucose)�1).
670 Q. Jin and C. M. Bethke—The thermodynamics and kinetics
rF � k�X��Glucose�
�Glucose� � KS(98)
to describe reaction rate. Figure 12 shows how the relative rate rF/(k � [X]), the ratio ofthe fermentation rate rF to maximum rate (k � [X]), predicted by equation (98) varieswith glucose concentration. In evaluating the rate law, we take KS as 22 �M, asdetermined previously in laboratory experiments for Escherichia coli (Monod, 1949). FTis near unity unless glucose concentration is extremely small, less than 10�7 �M. Thefermentation rate, in contrast, varies strongly with glucose concentration at muchhigher glucose concentrations. The relative rate is less than one for glucose concentra-tions below about 1 m�, approaching zero at concentrations less than 1 �M.
The rates of biomass synthesis at steady state of the metabolism can be calculatedby substituting equation (98) into (73),
rX � k � Y � �X��Glucose�
�Glucose� � KS� D � �X� (99)
If we were to neglect the effect of cell maintenance on microbial growth, this equationwould simplify to the original equation Monod proposed for the growth of fermentingmicroorganisms (Monod, 1949)
Fig. 12. Variation with glucose concentration of thermodynamic potential factor FT (eq 96) and therelative metabolic rate rF/(k � [X]), the ratio of the fermentation rate rF to maximum rate (k � [X]), predictedby the Monod equation (eq 98) for the example of microbial metabolism fermenting glucose considered intext. KS is taken to be 22 �M. Dashed line shows the glucose concentration where the value of thethermodynamic potential factor FT crosses zero.
671of microbial metabolism
rX � rmax
�Glucose�
�Glucose� � KS(100)
We see the maximum rate rmax is the product of rate constant k for fermentation,biomass yield Y, and biomass concentration [X]. Microorganisms can also fermentglucose to acetate, formate, ethanol, et cetera. In each case, the energy available is largerelative to the energy conserved, giving a large thermodynamic driving force. As apractical matter, then, the requirement of thermodynamic consistency need not beaddressed in predicting the rate of glucose fermentation.
discussion
In this paper we have cast study of the kinetics of microbial metabolism firmlywithin the framework of chemical thermodynamics, revealing a natural consistency notapparent in previous approaches to the problem. We have generalized our previouswork on microbial respiration and extended it to describe processes of fermentationand enzyme catalysis, in each case developing a kinetic description wholly consistentwith the principles of thermodynamics. We have shown how the requirement ofthermodynamic consistency affects the form of kinetic rate laws governing microbialmetabolism, and delineated the conditions under which honoring this requirement isimportant.
Rigorous analysis of the problem leads to a thermodynamic potential factor FT (eq57) that describes the thermodynamic control on the rate of microbial metabolism.The factor accounts for the availability of energy in the cell’s environment, relative tothat conserved as ATP and proton motive force. Whereas a rate law of traditional formis valid in the presence of abundant energy, appending FT to the equation casts the lawin a form applicable over a range of energetic conditions.
Geochemical environments differ broadly in their ability to supply chemicalenergy to microorganisms. In cases where the energy available far exceeds the energyconserved, the thermodynamic driving force is large and the thermodynamic potentialfactor approaches unity. In such cases, the thermodynamic control on microbialmetabolism can be safely neglected, and the rate laws in common use work well. Tofigure the rate of a fermentative microorganism growing on glucose, for example, thethermodynamic potential factor can be neglected because the energy available isinvariably large. Laboratory experiments, as a second example, are characteristicallydesigned to supply abundant energy, in order to facilitate growth.
Many, perhaps most geochemical environments, in contrast, are less hospitable tomicrobes due to both the quality and quantity of substrates available to microorgan-isms. The quality of substrates may limit the energy available where the negative of thestandard Gibbs free energy change of the reaction by which they are consumed issmall. Microbial sulfate reduction and methanogenesis, for example, exploit chemicalreactions that are commonly close to equilibrium and hence supply little energy tomicroorganisms. In many natural environments, furthermore, substrates may bepresent in only small quantities. The interiors of microbial mats and deep reaches ofstratified water columns may be so depleted in electron acceptors or organic matterthat little chemical energy can be derived there. In addition, the buildup of metabolicproducts in semi-closed environments can limit the amount of energy available. Forexample, many bacteria can oxidize short-chain fatty acids (propionate, butyrate, etcetera) and alcohol (ethanol, et cetera) by transferring electrons to hydrogen ions,reducing them to dihydrogen. Where dihydrogen accumulates in the environment,the energy available decreases, limiting the progress of microbial metabolism. In thesecases, the thermodynamic potential factor assumes values considerably less than one,many times approaching zero or even becoming negative; the corresponding meta-
672 Q. Jin and C. M. Bethke—The thermodynamics and kinetics

bolic rates, if the metabolism proceeds at all, may be quite small. Rate laws oftraditional form, in contrast, invariably predict a positive rate, even where thermody-namics would drive metabolism backwards. It is of critical importance when consider-ing microbes in natural environments, therefore, to appreciate that both kinetic andthermodynamic factors can exert significant controls on a microbe’s metabolic rate.
acknowledgmentsWe thank James Imlay, Matthew Kirk, and Robert Sanford for their interest and
generous advice. This work was supported by Department of Energy Grant DE-FG02-02ER15317 and the generosity of Chevron, ConocoPhillips, ExxonMobil UpstreamResearch, Idaho National Engineering and Environmental Laboratory, LawrenceLivermore, Sandia, SCK-CEN, Texaco, and the U.S. Geological Survey.
AppendixThe relationship in the ratio of forward to reverse reaction rates between an overall reaction (reaction
3) and its elementary steps (reaction 4) (eq 12) can be derived by considering the forward and reversepassage of an individual molecule taking part in the overall chemical reaction (reaction 3). The probabilityof a molecule Sp1 reacting to completion to form SpN over an interval of time �t, denoted P(Sp13SpN), isthe product of the probabilities that each elementary step proceeds forward
P �Sp1 3 SpN� � P �Sp1 3 Sp2� � P �Sp2 3 Sp3� � � � � � P �SpN�1 3 SpN� (A.1)
over this interval. Here, P(Spi3Spi�1) represents the probability that an intermediate molecule Spi reactsover �t to form Spi�1. Similarly, the probability that a molecule SpN reacts backward over �t to form Sp1
P �SpN 3 Sp1� � P �SpN 3 SpN�1� � P �SpN�1 3 SpN�2� � � � � � P �Sp2 3 Sp1� (A.2)
is given as the product of the probabilities over this interval of a molecule following the reverse of eachindividual step.
Since r is the net rate of the overall reaction, the concentration of Sp1 at time t��t is [Sp1]t � r � �t,where [Sp1]t is the concentration of Sp1 at time t. For very small �t, the number of Sp1 per a unit volume overthis interval is [Sp1]t � r � �t /2. During time interval �t, if only one molecule of Sp1 in a unit volume of fluidreacts to form one SpN, the probability of a particular molecule in the volume reacting to SpN is the inverse ofthe total number of Sp1 in the volume, that is, 1/([Sp1]t � r � �t/2). Forward reaction occurs r� � �t timesover �t, so P(Sp13SpN) is given
P�Sp1 3 SpN� �r� � �t
�Sp1�t � r � �t/2
(A.3)
Similarly, the probability that a given molecule SpN reacts to Sp1 over �t is
P�SpN 3 Sp1� �r� � �t
�SpN�t � r � �t/2(A.4)
Here, [SpN]t is the concentration of SpN at time t. Combining equations (A.3) and (A.4), the ratio ofP(Sp13SpN) to P(SpN3Sp1) is
P �Sp1 3 SpN�
P �SpN 3 Sp1��
�SpN�t � r � �t/2�Sp1�
t � r � �t/2�r�
r�(A.5)
For elementary step 1 (Sp1w Sp2), the probability that a given molecule Sp1 reacts to Sp2 over �t, P(Sp13Sp2), can be estimated as we did for the overall forward reaction (eq A.3). If the step occurs �1 times perreaction turnover,
P�Sp1 3 Sp2� ��1 � r1� � �t
�Sp1�t � �1 � r1 � �t/2
(A.6)
where r1� and r1 are forward and net rates of step 1, respectively, and �1 is the step’s stoichiometric number.At steady state, the net rate r of overall reaction is the product of the step’s net rate and stoichiometric
number, that is r � �1 � r1. Substituting gives
673of microbial metabolism

P�Sp1 3 Sp2� ��1 � r1� � �t
�Sp1�t � r � �t/2
(A.7)
For the step N�1 (SpN�1w SpN), similarly, the relation
P�SpN 3 SpN�1� ��N�1 � r�N�1�� � �t�SpN�t � r � �t/2
(A.8)
gives the probability that a given molecule of SpN reacts over �t to form SpN�1.For an intermediate step i, since the intermediate’s concentration [Spi] remains constant at steady state,
forward reaction occurs �i � ri� � �t times over �t. The probability of an individual molecule participating inthe forward reaction is
P�Spi 3 Spi�1� ��i � ri� � �t
�Spi�(A.9)
For step i�1,
P�Spi 3 Spi�1� ��i�1 � r�i�1�� � �t
�Spi�(A.10)
is the probability of a given molecule Spi participating in the reverse reaction.Substituting equations (A.7) and (A.9) into (A.1) gives the probability of a given molecule Sp1 reacting
to SpN
P�Sp1 3 SpN� ��1 � r1� � �t
�Sp1�t � r � �t/2
�2 � r2� � �t�Sp2�
· · ·�i � ri� � �t
�Spi�· · ·
�N�1 � r�N�1�� � �t�SpN�1�
��1 � r1� � �t
�Sp1�t � r � �t/2 �
i�2
N�1�i � ri� � �t
�Spi�(A.11)
in terms of the forward reaction rates at each step. Substituting equations (A.8) and (A.10) into (A.2), givesthe probability for the reverse reaction
P�SpN 3 Sp1� ��N�1 � r�N�1�� � �t�SpN�t � r � �t/2
�N�2 � r�N�2�� � �t�SpN�1�
· · ·�i�1 � r�i�1�� � �t
�Spi�· · ·
�1 � r1� � �t�Sp2�
��N�1 � r�N�1�� � �t�SpN�t � r � �t/2 �
i�N�1
2�i�1 � r�i�1�� � �t
�Spi�(A.12)
The ratio of P(Sp13SpN) to P(SpN3Sp1) is then
P �Sp1 3 SpN�
P �SpN 3 Sp1��
�1 � r1�
�Sp1�t � r � �t/2
�SpN�t � r � �t/2�N�1 � r�N�1��
�i�2N�1
�i � ri�
�Spi�
�i�N�12
�i�1 � r�i�1��
�Spi�
(A.13)
Rearranging,
P �Sp1 3 SpN�
P �SpN 3 Sp1��
�SpN�t � r � �t/2�Sp1�
t � r � �t/2�1 � �i�2
N�1 �i � r1� � �i�2N�1 ri� �i�N�1
2 �Spi�
�N�1 � �i�N�12 �i�1 � r�N�1�� � �i�N�1
2 r�i�1�� �i�2N�1 �Spi�
(A.14)
This equation can be further simplified to
P �Sp1 3 SpN�
P �SpN 3 Sp1��
�SpN�t � r � �t/2�Sp1�
t � r � �t/2 �i�1
N�1ri�
ri�(A.15)
Comparing equations (A.5) and (A.15), we see that the ratio of the forward to reverse rates of the overallreaction can be expressed in terms of the ratios for the individual elementary steps as in equation (12).
674 Q. Jin and C. M. Bethke—The thermodynamics and kinetics

Equation (12) was derived originally (Boudart, 1976) following a different and less concise procedure, fromTemkin’s identity equation (Temkin, 1971).
References
Aagaard, P., and Helgeson, H. C., 1982, Thermodynamic and kinetic constraints on reaction rates amongminerals and aqueous solutions: Theoretical considerations: American Journal of Science, v. 282,p. 237-285.
Auburger, G., and Winter, J., 1995, Isolation and physiological characterization of Syntrophus buswellii strainGA from a syntrophic benzoate-degrading, strictly anaerobic coculture: Applied Microbiology andBiotechnology, v. 44, p. 241-248.
–––––– 1996, Activation and degradation of benzoate, 3-phenylpropionate and crotonate by Syntrophusbuswellii strain GA. Evidence for electron-transport phosphorylation during crotonate respiration:Applied Microbiology and Biotechnology, v. 44, p. 807-815.
Bae, W., and Rittmann, B. E., 1996, A stuctured model of dual-limitation kinetics: Biotechnology andBioengineering, v. 49, p. 683-689.
Berner, R. A., 1980, Early Diagenesis: A Theoretical Approach: Princeton Series in Geochemistry: Princeton,New Jersey, Princeton University Press, 241 p.
Blum, E. H., and Luus, R., 1964, Thermodynamic consistency of reaction rate expressions: ChemicalEngineering Science, v. 19, p. 322-323.
Blum, J. S., Bindi, A. B., Buzzelli, J., Stolz, J. F., and Oremland, R. S., 1998, Bacillus arsenicoselenatis, sp. nov.,and Bacillus selenitireducens, sp. nov.: two haloalkaliphiles from Mono Lake, California that respireoxyanions of selenium and arsenic: Archives of Microbiology, v. 171, p. 19-30.
Bond, D. R., and Russell, J. B., 1998, Relationship between intracellular phosphate, proton motive force, andrate of nongrowth energy dissipation (energy spilling) in Streptococcus bovis JB1: Applied and Environmen-tal Microbiology, v. 64, p. 976-981.
Boudart, M., 1975, Heterogeneous catalysis, in Eyring, H., editor, Reactions in Condensed Phases: PhysicalChemistry. An Advanced Treatise: New York, Academic Press, p. 349-411.
–––––– 1976, Consistency between kinetics and thermodynamics: Journal of Physical Chemistry, v. 80,p. 2869-2870.
Boudart, M., and Djega-Mariadassou, G., 1984, Kinetics of Heterogeneous Catalytic Reactions: PhysicalChemistry: Science and Engineering: Princeton, New Jersey, Princeton University, p. 77-117.
Boyd, R. K., 1977, Macroscopic and microscopic restrictions on chemical kinetics: Chemical Reviews, v. 77,p. 93-119.
Conrad, R., and Wetter, B., 1990, Influence of temperature on energetics of hydrogen metabolism in homoaceto-genic, methanogenic, and other anaerobic bacteria: Archives of Microbiology, v. 155, p. 94-98.
Cord-Ruwisch, R., Steitz, H. J., and Conrad, R., 1988, The capacity of hydrogenotrophic anaerobic bacteria tocompete for traces of hydrogen depends on the redox potential of the terminal electron acceptor:Archives of Microbiology, v. 149, p. 350-357.
Corio, P. L., 1983, Thermodynamic and kinetic descriptions of equilibrium: The Journal of PhysicalChemistry, v. 87, p. 2416-2419.
Cozzone, A. J., 1998, Regulation of acetate metabolism by protein phosphorylation in enteric bacteria:Annual Review of Microbiology, v. 52, p. 127-164.
Curtis, G. P., 2003, Comparison of approaches for simulating reactive solute transport involving organicdegradation reactions by multiple terminal electron acceptors: Computers and Geosciences, v. 29,p. 319-329.
Denbigh, K., 1961, The Principles of Chemical Equilibrium: With Applications in Chemistry and ChemicalEngineering: Cambridge, United Kingdom, Cambridge University Press, 491 p.
Dominik, P., and Kaupenjohan, M., 2004, Reduction of Fe(III) (hydr)oxides with known thermodynamicstability by Geobacter metallireducens: Geomicrobiology Journal, v. 21, p. 287-295.
Gadsby, J., Hinshelwood, C., and Sykes, K., 1946, The kinetics of the reactions of the steam-carbon system:Proceedings of the Royal Society of London, Series A, Mathematical and Physical Sciences (1934-1990),v. 187, p. 129-151.
Happel, J., 1972, Study of kinetic structure using marked atoms: Catalysis Reviews, v. 6, p. 221-260.He, Q., and Sanford, R. A., 2004, Acetate threshold concentrations suggest varying energy requirements
during anaerobic respiration by Anaeromyxobacter dehalogenans: Applied and Environmental Microbiol-ogy, v. 70, p. 6940-6943.
Herbert, D., 1958, Some principles of continuous culture, in Tunevall, G., editor, Recent Progess in Microbiology:Stockholm, VII International Congress for Microbiology, Almqvist and Wiksell, p. 381-396.
Hoehler, T. M., Alperin, M. J., Albert, D. B., and Martens, C. S., 1998, Thermodynamic control on hydrogenconcentrations in anoxic sediments: Geochimica et Cosmochimica Acta, v. 62, p. 1745-1756.
–––––– 2001, Apparent minimum free energy requirements for methanogenic Archaea and sulfate-reducingbacteria in an anoxic marine sediment: FEMS Microbiology Ecology, v. 38, p. 33-41.
Hoh, C. Y., and Cord-Ruwisch, R., 1996, A practical kinetic model that considers endproduct inhibition inanaerobic digestion processes by including the equilibrium constant: Biotechnology and Bioengineer-ing, v. 51, p. 597-604.
Hollingsworth, C. A., 1952a, Equilibrium and the rate laws: The Journal of Chemical Physics, v. 20,p. 1649-1650.
–––––– 1952b, Equilibrium and the rate laws for forward and reverse reactions: The Journal of ChemicalPhysics, v. 20, p. 921-922.
675of microbial metabolism

–––––– 1957, Kinetics and equilibria of complex reactions: Journal of Chemical Physics, v. 27, p. 1346-1348.Hoover, S. R., and Porges, N., 1952, Assimilation of dairy wastes by activate sludge. II. The equation of
synthesis and rate of oxygen utilization: Sewage and Industrial Wastes, v. 24, p. 306-312.Hopkins, B., McInerney, M., and Warikoo, V., 1995, Evidence for anaerobic syntrophic benzoate degrada-
tion threshold and isolation of the syntrophic benzoate degrader: Applied and Environmental Microbi-ology, v. 61, p. 526-530.
Horiuti, J., 1948, A method of statistical mechanical treatment of equilibrium and chemical reactions:Journal of the Research Institute for Catalysis, v. 1, p. 8-79.
Jackson, B. E., and McInerney, M. J., 2002, Anaerobic microbial metabolism can proceed close tothermodynamic limits: Nature, v. 415, p. 454-456.
Jetten, M. S. M., Stams, A. J. M., and Zehnder, A. J. B., 1990, Acetate threshold values and acetate activatingenzymes in methanogenic bacteria: FEMS Microbiology Ecology, v. 73, p. 339-344.
Jin, Q., 2007, Control of hydrogen partial pressures on the rates of syntrophic microbial metabolisms: akinetic model for butyrate fermentation: Geobiology, v. 5, p. 35-48, doi: 10.1111/j.1472-4669.2006.00090.
Jin, Q., and Bethke, C. M., 2002, Kinetics of electron transfer through the respiratory chain: BiophysicalJournal, v. 83, p. 1797-1808.
–––––– 2003, A new rate law describing microbial respiration: Applied and Environmental Microbiology,v. 69, p. 2340-2348.
–––––– 2005, Predicting the rate of microbial respiration in geochemical environments: Geochimica etCosmochimica Acta, v. 69, p. 1133-1143.
Kashket, E. R., 1983, Stoichiometry of the H�-ATPase of Escherichia coli cells during anaerobic growth: FEBSLetters, v. 154, p. 343-346.
Kleerebezem, R., and Stams, A. J. M., 2000, Kinetic of syntrophic cultures: A theoretical treatise on butyratefermentation: Biotechnology and Bioengineering, v. 67, p. 529-543.
Lasaga, A. C., 1981, Transition state theory, in Lasaga, A. C., and Kirkpatrick, R. J., editors, Kinetics ofGeochemical Processes: Reviews in Mineralogy and Geochemistry, v. 8, p. 135-169.
–––––– 1984, Chemical kinetics of water-rock interactions: Journal of Geophysical Research, v. 89, p. 4009-4025.
Lee, A. L., Ataai, M. M., and Shuler, M. L., 1984, Double-substrate-limited growth of Escherichia coli:Biotechnology and Bioengineering, v. 26, p. 1398-1401.
Liu, C., Kota, S., Zachara, J. M., Fredrickson, J. K., and Brinkman, C. K., 2001, Kinetic analysis of the bacterialreduction of goethite: Environmental Science and Technology, v. 35, p. 2482-2490.
Lu, X. X., Tao, S., Bosma, T., and Gerritse, J., 2001, Characteristic hydrogen concentrations for various redoxprocesses in batch study: Journal of Environmental Science and Health, Part A: Environmental Scienceand Engineering, v. 36, p. 1725-1734.
Manes, M., Hofer, L. J. E., and Weller, S., 1950, Classical thermodynamics and reaction rates close toequilibrium: The Journal of Chemical Physics, v. 18, p. 1355-1361.
Marr, A. G., Nilson, E. H., and Clark, D. J., 1962, The maintenance requirement of Escherichia coli: Annals ofthe New York Academy of Sciences, v. 102, p. 536-548.
McCarty, P. L., 1971, Energetics of bacterial growth, in Faust, S. D., and Hunter, J. V., editors, OrganicCompounds in Aquatic Environments: New York, Marcel Dekker, Inc., p. 495-531.
Megee, R. D. I., Drake, J. F., Fredrickson, A. G., and Tsuchiya, H. M., 1972, Studies in intermicrobialsymbiosis. Saccharomyces cerevisiae and Lactobacillus casei: Canadian Journal of Microbiology, v. 18,p. 1733-1742.
Minkevich, I. G., and Eroshin, V. K., 1973, Productivity and heat generation of fermentation under oxygenlimitation: Folia Microbiol (Praha), v. 18, p. 376-385.
Mitchell, P., 1961, Coupling of phosphorylation to electron and hydrogen transfer by a chemi-osmotic typeof mechanism: Nature, v. 191, p. 144-148.
Monod, J., 1949, The growth of bacterial cultures: Annual Review of Microbiology, v. 3, p. 371-394.Nagy, K. L., and Lasaga, A. C., 1992, Dissolution and precipitation kinetics of gibbsite at 80oC and pH3: the
dependence on solution saturation state: Geochimica et Cosmochimica Acta, v. 56, p. 3093-3111.Nagy, K. L., Blum, A. E., and Lasaga, A. C., 1991, Dissolution and precipitation kinetics of kaolinite at 80oC
and pH 3: the dependence on solution saturation state: American Journal of Science, v. 291, p. 649-686.Neidhardt, F. C., Ingraham, J. L., and Schaechter, M., 1990, Physiology of the Bacterial Cell: a Molecular
Approach: Sunderland, Massachusetts, Sinauer Associates, Inc., 506 p.Nicholls, D. G., and Ferguson, S. J., 1992, Bioenergetics: London, Academic Press, 255 p.Peck, H. D., Jr., 1959, The ATP-dependent reduction of sulfate with hydrogen in extracts of Desulfovibrio
desulfuricans: Proceedings of the National Academy of Sciences of USA, v. 45, p. 701-708.Peka, and Miloslav, 2005, Thermodynamics and foundations of mass-action kinetics: Progress in Reaction
Kinetics and Mechanism, v. 30, p. 3-113.Peters, V., Janssen, P. H., and Conrad, R., 1998, Efficiency of hydrogen utilization during unitrophic and
mixotrophic growth of Acetobacterium woodii on hydrogen and lactate in the chemostat: FEMS Microbiol-ogy Ecology, v. 26, p. 317-324.
Pirt, S. J., 1965, The maintenance energy of bacteria in growing cultures: Proceedings of the Royal Society ofLondon, Series B, Biological Sciences, v. 163, p. 224-231.
Plowman, K. M., 1972, Enzyme Kinetics: McGraw-Hill Series in Advanced Chemistry: New York, McGraw-HillBook Company, 171 p.
Roden, E. E., and Urrutia, M. M., 2002, Influence of biogenic Fe(II) on bacterial crystalline Fe(III) oxidereduction: Geomicrobiology Journal, v. 19, p. 209-251.
Rosing, J., and Slater, E., 1972, The value of �Go for the hydrolysis of ATP: Biochimica et Biophysica Acta,v. 267, p. 275-290.
676 Q. Jin and C. M. Bethke—The thermodynamics and kinetics

Schink, B., 1992, Syntrophism among prokaryotes, in Balows, A., Truper, H. G., Dworkin, M., Harder, W.,and Schleifer, K. H., editors, The Prokaryotes. A Handbook on the Biology of Bacteria: Ecophysiology,isolation, identification, applications: New York, Springer, p. 276-299.
Schink, B., and Friedrich, M., 1994, Energetics of syntrophic fatty acid oxidation: FEMS MicrobiologyReviews, v. 15, p. 85-94.
Schocke, L., and Schink, B., 1999, Energetics and biochemistry of fermentative benzoate degradation bySyntrophus gentianae: Archives of Microbiology, v. 171, p. 331-337.
Scholten, J. C. M., and Conrad, R., 2000, Energetics of syntrophic propionate oxidation in defined batch andchemostat cocultures: Applied and Environmental Microbiology, v. 66, p. 2934-2942.
Seitz, H. J., Schink, B., Pfennig, N., and Conrad, R., 1990, Energetics of syntrophic ethanol oxidation indefined chemostat cocultures. 1. Energy requirement for H2 production and H2 oxidation: Archives ofMicrobiology, v. 155, p. 82-88.
Simkins, S., and Alexander, M., 1984, Models for mineralization kinetics with the variables of substrateconcentration and population density: Applied and Environmental Microbiology, v. 47, p. 1299-1306.
Sonne-Hansen, J., Westermann, P., and Ahring, B. K., 1999, Kinetics of sulfate and hydrogen uptake by thethermophilic sulfate-reducing bacteria Thermodesulfobacterium sp. strain JSP and Thermodesulfovibrio sp.strain R1Ha3: Applied and Environmental Microbiology, v. 65, p. 1304-1307.
Stahlmann, J., Warthmann, R., and Cypionka, H., 1991, Na�-dependent accumulation of sulfate andthiosulfate in marine sulfate-reducing bacteria: Archives of Microbiology, v. 155, p. 554-558.
Stouthamer, A. H., and Van Verseveld, H. W., 1985, Stoichiometry of microbial growth, in Bull, A. T., andDalton, H., editors, Comprehensive Biotechnology: The Principles, Applications and Regulations ofBiotechnology in Industry, Agriculture and Medicine: Oxford, Pergamon Press, p. 215-238.
Stryer, L., 1988, Biochemistry: New York, Freeman and Company, 1089 p.Temkin, M. I., 1963, Kinetics of stationary reactions: Doklady Akademii Nauk SSSR, v. 152, p. 156-159.–––––– 1971, The kinetics of steady-state complex reactions: International Chemical Engineering, v. 11,
p. 709-717.Thauer, R. K., Jungermann, K., and Decker, K., 1977, Energy conservation in chemotrophic anaerobic
bacteria: Bacteriological Reviews, v. 41, p. 100-180.Tran, Q. H., and Unden, G., 1998, Changes in the proton potential and the cellular energetics of Escherichia
coli during growth by aerobic and anaerobic respiration or by fermentation: European Journal ofBiochemistry, v. 251, p. 538-543.
Van Rysselberghe, P., 1967, Consistency between kinetics and thermodynamics: Chemical EngineeringScience, v. 22, p. 706-707.
VanBriesen, J. M., and Rittmann, B. E., 2000, Mathematical description of microbiological reactionsinvolving intermediates: Biotechnology and Bioengineering, v. 67, p. 35-52.
Varma, A., Schonheit, P., and Thauer, R. K., 1983, Electrogenic sodium ion/proton antiport in Desulfovibriovulgaris: Archives of Microbiology, v. 136, p. 69-73.
Vessey, D. A., and Kelley, M., 2001, Characterization of the reaction mechanism for the XL-I form of bovineliver xenobiotic/medium-chain fatty acid:CoA ligase: Biochemical Journal, v. 357, p. 283-288.
Wallrabenstein, C., and Schink, B., 1994, Evidence of reversed electron transport involved in syntrophicbutyrate and benzoate oxidation by Syntrophomonas wolfei and Syntrophus buswellii: Archives of Microbiol-ogy, v. 162, p. 136-142.
Warikoo, V., McInerney, M., Robinson, J., and Suflita, J., 1996, Interspecies acetate transfer influences theextent of anaerobic benzoate degradation by syntrophic consortia: Applied and Environmental Microbi-ology, v. 62, p. 26-32.
Westermann, P., 1994, The effect of incubation temperature on steady-state concentrations of hydrogen andvolatile fatty acids during anaerobic degradation in slurries from wetland sediments: FEMS Microbiol-ogy Ecology, v. 13, p. 295-302.
Wu, W. M., Jain, M. K., and Zeikus, J. G., 1994, Anaerobic degradation of normal- and branched-chain fattyacids with four or more carbons to methane by a syntrophic methanogenic triculture: Applied andEnvironmental Microbiology, v. 60, p. 2220–2226.
Yang, Y., and McCarty, P. L., 1998, Competition for hydrogen within a chlorinated solvent dehalogenatinganaerobic mixed culture: Environmental Science and Technology, v. 32, p. 3591-3597.
677of microbial metabolism