american industrial hygiene association … american industrial hygiene association bulk asbestos...
TRANSCRIPT

RTI/04562/78L-F
AMERICAN INDUSTRIAL HYGIENE ASSOCIATIONBULK ASBESTOS PROFICIENCY ANALYTICAL
TESTING PROGRAM
FINAL REPORT TO LABORATORIES - TEST ROUND A78-109
Prepared for the
American Industrial Hygiene Association2700 Prosperity Avenue, Suite 250
Fairfax, Virginia 22031
Prepared by
Bruce W. Harvey, Stacy S. Doorn, J. Todd Ennis,Lisa C. Greene, Wayne G. Winstead, and Maurice Gerald
Environmental and Industrial Sciences Division
andElizabeth E. Robbins
Research Computing Division
RTI International3040 Cornwallis Road
Research Triangle Park, NC 27709-2194
April 2009
This report may contain confidential information. If you are not the intended recipient, you are herebynotified that any review, dissemination, distribution, or duplication of this report is strictly forbidden. If
you are not the intended recipient, please destroy all copies of the report and contact RTI International.

i
TABLE OF CONTENTS
Section Page
I Introduction . . . . . . . . . . . . . . . . . . . . . . . . . . . . . . . . . . . . . . . . . . . . . . . . . . . 1
II Test Material Selection and Preparation . . . . . . . . . . . . . . . . . . . . . . . . . . . . . 2
III Reference Laboratory Analyses of Test Materials . . . . . . . . . . . . . . . . . . . . . . 2
IV RTI Analyses of Test Materials . . . . . . . . . . . . . . . . . . . . . . . . . . . . . . . . . . . 3
V Summary of the Test Round . . . . . . . . . . . . . . . . . . . . . . . . . . . . . . . . . . . . . 10
VI Individual Laboratory Results . . . . . . . . . . . . . . . . . . . . . . . . . . . . . . . . . . . . 13
VII Analysis Problems and Suggestions . . . . . . . . . . . . . . . . . . . . . . . . . . . . . . . 15
VIII Test Method/Analytical Technique Summary . . . . . . . . . . . . . . . . . . . . . . . . 17
IX Participant Feedback . . . . . . . . . . . . . . . . . . . . . . . . . . . . . . . . . . . . . . . . . . 20
X Schedule for Test Round A79-209 . . . . . . . . . . . . . . . . . . . . . . . . . . . . . . . . 20
LIST OF TABLES
Table Page
1 Results of Reference Analyses . . . . . . . . . . . . . . . . . . . . . . . . . . . . . . . . . . . . 4
2 Optical Properties of Asbestos in Test Sample Lots . . . . . . . . . . . . . . . . . . . . 6
3 Semiquantitation Means and Ranges, and Acceptance Ranges . . . . . . . . . . 11
4 Distribution of Penalty Point Totals Incurred . . . . . . . . . . . . . . . . . . . . . . . . . 12
5 Test Sample Classification, Asbestos Identification, and Semiquantitation Errors, by Test Sample Lot . . . . . . . . . . . . . . . . . . . . . . . . 12
6 Cited Test Methods and Techniques . . . . . . . . . . . . . . . . . . . . . . . . . . . . . . . 18
7 Analysis of Errors and Asbestos Semiquantitation, by TestMethod/Technique Used . . . . . . . . . . . . . . . . . . . . . . . . . . . . . . . . . . . . . . . . 19

1
AMERICAN INDUSTRIAL HYGIENE ASSOCIATIONBULK ASBESTOS PROFICIENCY ANALYTICAL TESTING PROGRAM
FINAL REPORT TO LABORATORIES - TEST ROUND A78-109
Section I - IntroductionThe 78th test round of the American Industrial Hygiene Association (AIHA) Bulk
Asbestos Proficiency Analytical Testing Program began on February 13, 2009, with the
distribution of test samples to 239 laboratories enrolled for participation. This reflects an
increase in total enrollment of four laboratories from that of Test Round A77-408.
The program provides the means by which a participating laboratory’s proficiency
rating may be determined for the analysis of asbestos in bulk insulation materials by
polarized light microscopy (PLM). Laboratory ratings of “pass” (P) or “fail” (F) are
determined on an individual test round basis and are based on grading criteria and a
penalty point system described on page 13 of this report. The grading criteria cover both
qualitative and semiquantitative analyses.
Each laboratory received four samples, three of which contained asbestos. Lots A,
B, and C contained chrysotile. Lot D did not contain asbestos. The test round was
judged to be of moderate analytical difficulty. The relatively low asbestos content in the
three positive lots suggested that some false negative errors were possible. The
presence of a trace amount of an amphibole in the Lot C material suggested that some
semiquantitative errors due to overestimation of the amphibole mineral were possible.
Few false positive errors were anticipated.
Laboratories were asked to classify each test sample as asbestos-containing
(positive) or non-asbestos-containing (negative). For positive test samples, laboratories
were also asked to identify the type(s) and to semiquantitate the amount of asbestos
present. For all test samples, additional information about fibrous nonasbestos and
nonfibrous matrix/binder materials was also requested. Laboratory performance ratings
were based on correct classification of the test samples, correct identification of the
asbestos type(s) in the positive test sample lots, and correct semiquantitation of the
asbestos type(s) within broad acceptance ranges in those lots.

2
Section II - Test Material Selection and PreparationAll four of the bulk materials used in this test round originated from the asbestos
repository at RTI. They included a textured ceiling spray (Lot A), a floor tile (Lot B), a
spray-applied fireproofing (Lot C), and a vinyl sheet flooring (Lot D). These are real-
world materials acquired from asbestos abatement or renovation projects. Detailed
descriptions of these four materials are contained in Sections III and IV of this report.
All four lots were deemed suitably homogeneous, so no mixing or blending was
performed prior to packaging. Packaging consisted of placing small portions (5-10
grams) of the material into a series of standard, plastic scintillation vials or zipper-seal
sample bags. Filled vials and bags were placed in trays, with the order of tray-filling
noted on the side of the tray. Such labeling and ordering of the test sample containers
allow for detection of possible sample bias generated during packaging.
Upon completion of packaging, a quality control check was initiated with a visual
inspection of each test sample container in each test sample lot to verify the presence
of the test material. Then the contents of 20% of the containers constituting all four lots
were examined using PLM. Chrysotile was confirmed in the contents of all the
containers examined for Lots A, B, and C. The trace-level amphibole revealed in RTI’s
subsequent detailed characterization of Lot C was not seen during the quality control
check. However, a small amount of a second, chrysotile-containing, mineral wool-based
insulation material was noted in the contents of 4 of the 53 vials examined for Lot C.
This material was judged to have been situated adjacent to the Lot C material in its
original real-world application. Although some acicular chrysotile was observed in the
mineral wool insulation, subsequent PLM analysis revealed no amphibole minerals to be
present. No asbestos was detected in the contents of any of the containers examined
for Lot D. Homogeneity was judged to be very good in Lots A, B, and D, and moderately
good in Lot C.
Section III - Reference Laboratory Analyses of Test MaterialsTwo independent laboratories, whose principals have provided reference analyses
since the inception of the program, were sent representative subsamples of each lot.
The results of their analyses, along with those of RTI’s in-house analysis, are contained
3
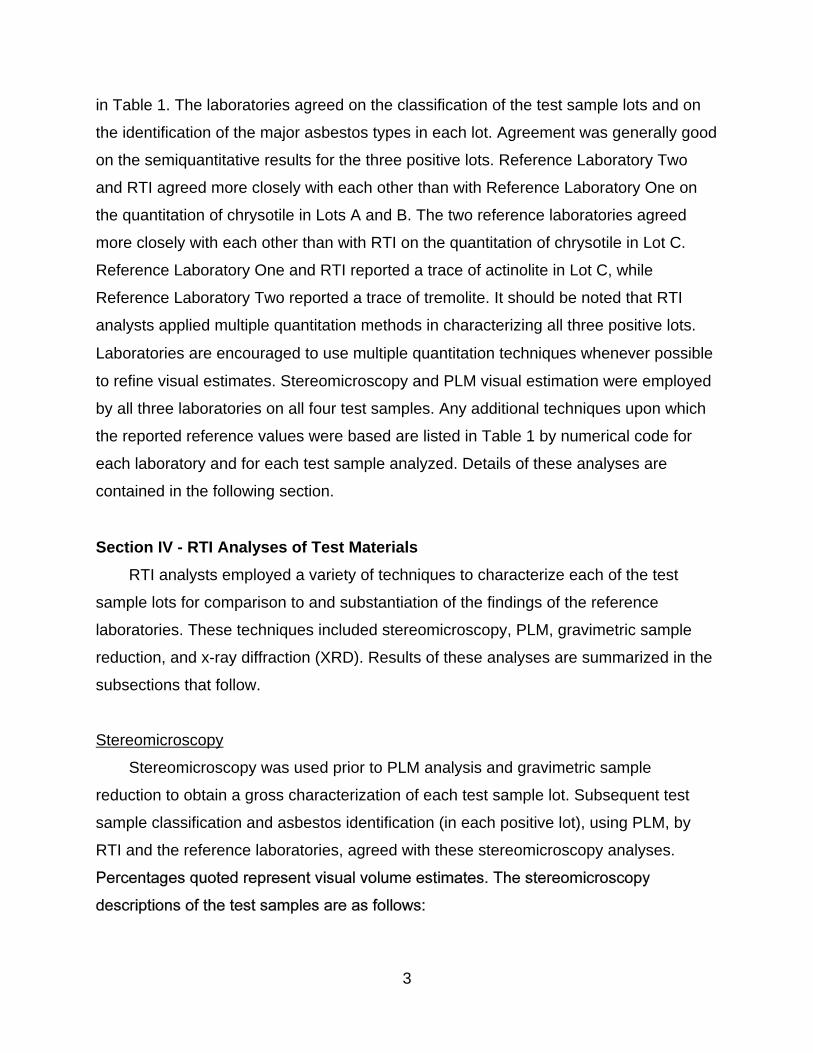
in Table 1. The laboratories agreed on the classification of the test sample lots and on
the identification of the major asbestos types in each lot. Agreement was generally good
on the semiquantitative results for the three positive lots. Reference Laboratory Two
and RTI agreed more closely with each other than with Reference Laboratory One on
the quantitation of chrysotile in Lots A and B. The two reference laboratories agreed
more closely with each other than with RTI on the quantitation of chrysotile in Lot C.
Reference Laboratory One and RTI reported a trace of actinolite in Lot C, while
Reference Laboratory Two reported a trace of tremolite. It should be noted that RTI
analysts applied multiple quantitation methods in characterizing all three positive lots.
Laboratories are encouraged to use multiple quantitation techniques whenever possible
to refine visual estimates. Stereomicroscopy and PLM visual estimation were employed
by all three laboratories on all four test samples. Any additional techniques upon which
the reported reference values were based are listed in Table 1 by numerical code for
each laboratory and for each test sample analyzed. Details of these analyses are
contained in the following section.
Section IV - RTI Analyses of Test MaterialsRTI analysts employed a variety of techniques to characterize each of the test
sample lots for comparison to and substantiation of the findings of the reference
laboratories. These techniques included stereomicroscopy, PLM, gravimetric sample
reduction, and x-ray diffraction (XRD). Results of these analyses are summarized in the
subsections that follow.
Stereomicroscopy
Stereomicroscopy was used prior to PLM analysis and gravimetric sample
reduction to obtain a gross characterization of each test sample lot. Subsequent test
sample classification and asbestos identification (in each positive lot), using PLM, by
RTI and the reference laboratories, agreed with these stereomicroscopy analyses.
4
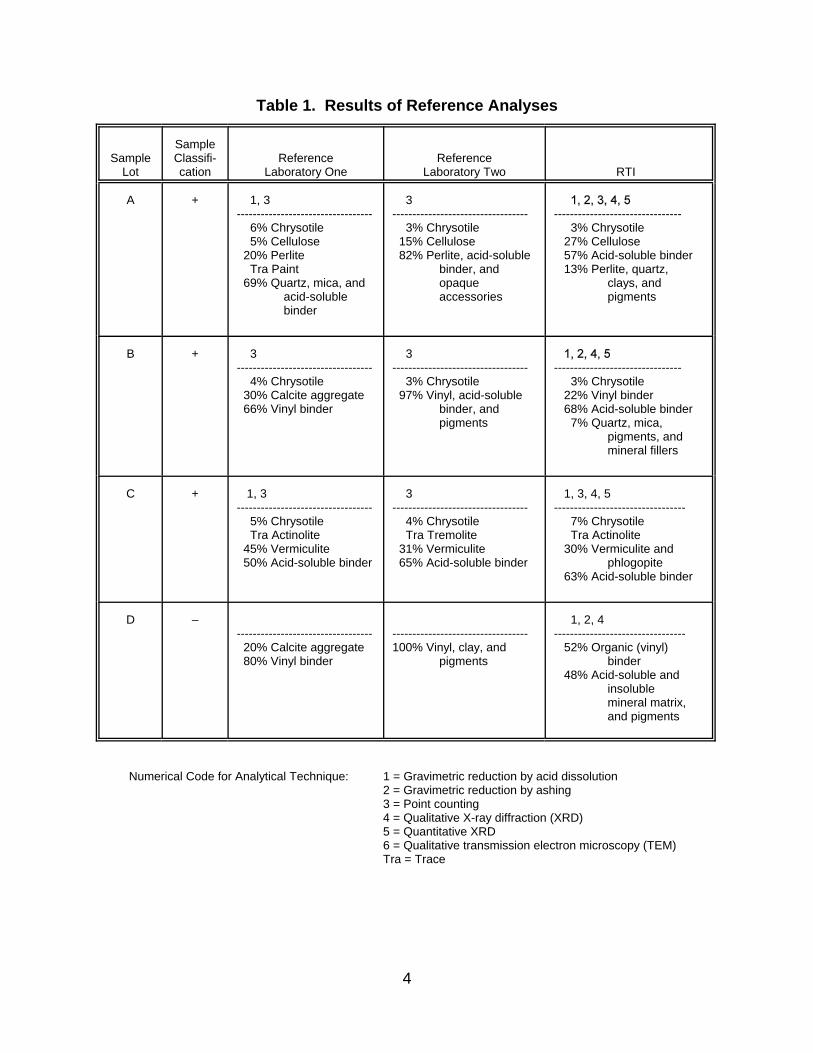
Table 1. Results of Reference Analyses
SampleLot
SampleClassifi-cation
ReferenceLaboratory One
ReferenceLaboratory Two RTI
A + 1, 3---------------------------------- 6% Chrysotile 5% Cellulose 20% Perlite Tra Paint 69% Quartz, mica, and acid-soluble binder
3---------------------------------- 3% Chrysotile 15% Cellulose 82% Perlite, acid-soluble binder, and opaque accessories
-------------------------------- 3% Chrysotile 27% Cellulose 57% Acid-soluble binder 13% Perlite, quartz, clays, and pigments
B + 3---------------------------------- 4% Chrysotile 30% Calcite aggregate 66% Vinyl binder
3---------------------------------- 3% Chrysotile 97% Vinyl, acid-soluble binder, and pigments
-------------------------------- 3% Chrysotile 22% Vinyl binder 68% Acid-soluble binder 7% Quartz, mica, pigments, and mineral fillers
C + 1, 3---------------------------------- 5% Chrysotile Tra Actinolite 45% Vermiculite 50% Acid-soluble binder
3---------------------------------- 4% Chrysotile Tra Tremolite 31% Vermiculite 65% Acid-soluble binder
1, 3, 4, 5--------------------------------- 7% Chrysotile Tra Actinolite 30% Vermiculite and phlogopite 63% Acid-soluble binder
D
– ---------------------------------- 20% Calcite aggregate 80% Vinyl binder
----------------------------------100% Vinyl, clay, and pigments
1, 2, 4--------------------------------- 52% Organic (vinyl) binder 48% Acid-soluble and insoluble mineral matrix, and pigments
Numerical Code for Analytical Technique: 1 = Gravimetric reduction by acid dissolution 2 = Gravimetric reduction by ashing 3 = Point counting
4 = Qualitative X-ray diffraction (XRD)5 = Quantitative XRD6 = Qualitative transmission electron microscopy (TEM)Tra = Trace

5
Lot B: This material consists of a self-adhesive floor tile approximately 1/16 inch (1.6millimeters) thick. The upper surface is distinguished by a textured faux stoneor marble pattern with shades of yellow, beige, brown, and rose. The tintedportion of the tile constitutes approximately one-third of the tile’s thickness. Theremaining two-thirds of the tile is off-white in color. Granular minerals such asquartz and calcite are clearly visible in the tile’s broken edges. The vinyl matrixis relatively soft. This tile is more flexible than older brittle asphaltic floor tiles.Fibrous material is not readily apparent in observation of broken edges. A thinlayer of tacky adhesive is present on the bottom surface of the tile. Theadhesive does not appear to contain fibrous components.

6
Polarized Light Microscopy (PLM)
Several subsamples were randomly extracted from the repository container of each
positive test sample lot for detailed PLM analysis prior to gravimetric sample reduction.
For each asbestos component encountered in each positive lot, the following optical
properties were determined: morphology, aspect ratio, color, pleochroism, refractive
indices (RIs), birefringence, central-stop dispersion staining colors, extinction type and
angle, and sign of elongation. These properties are summarized in Table 2.
Table 2. Optical Properties of Asbestos in Test Sample Lots
Optical Property
Lot A Lot B Lot C
Chrysotile Chrysotile Chrysotile Actinolite
MorphologyWavy, curvilinear, with
“knees”Fine, wavy, with
splayed endsWavy, curvilinear, with
“knees”Straight,
needle-like
Aspect Ratio
Color
Pleochroism
RefractiveIndices
Birefringence
Central-StopDispersion
Staining Colors
Extinction
Sign ofElongation
Brief material descriptions acquired during the PLM examination are as follows:

7
Lot C: Slide mounts of this material are dominated by gypsum-based matrix, amicaceous mineral, and chrysotile asbestos. The matrix, which coats all othercomponents and makes their identification difficult, is moderately effervescentin room-temperature HCl. The micaceous mineral displays a variety of colorsranging from dark brown to green, but most commonly golden brown. Thechrysotile exhibits positive sign of elongation and parallel extinction. In 1.550 RIliquid, the chrysotile displays typical blue to purple dispersion staining colors.Chrysotile is visually estimated to constitute 3% of the material. A trace amountof an amphibole mineral occurs as small needle-like fibers and bundles. Thismaterial is identified as actinolite and is inhomogeneously distributedthroughout the material.
Lot D: Slide mounts of this material reveal a homogeneous mixture dominated by fine-grained, equant-shaped mineral fragments with moderate birefringence. With the addition of gentle heat from the microscope light source, the vinyl matrixdissolves in the 1.550 RI liquid in which it is mounted. Translucent occlusionscan be observed in the oil mount. These occlusions appear to be consistentwith the stereoscopic observation of a polished top surface. No fibrous materialis visible.
Gravimetric Sample Reduction
Representative subsamples from all four lots were subjected to gravimetric sample
reduction, by way of acid dissolution and/or low-temperature ashing, to confirm
qualitative results for organic and acid-soluble components and to refine
semiquantitative results derived from stereomicroscopy and PLM examinations. The
results of these test sample reductions are described below. Unless otherwise noted,
losses are quoted as a percentage of the sample’s starting weight.
Test sample compositions rendered low-temperature ashing useful on Lots A, B,
and D. Results of this sample reduction are described below. For the reduction, a
minimum of eight preweighed subsamples were ashed at approximately 480°C for 15
hours. Each residue was allowed to return to ambient temperature (stabilize) before
reweighing.
8
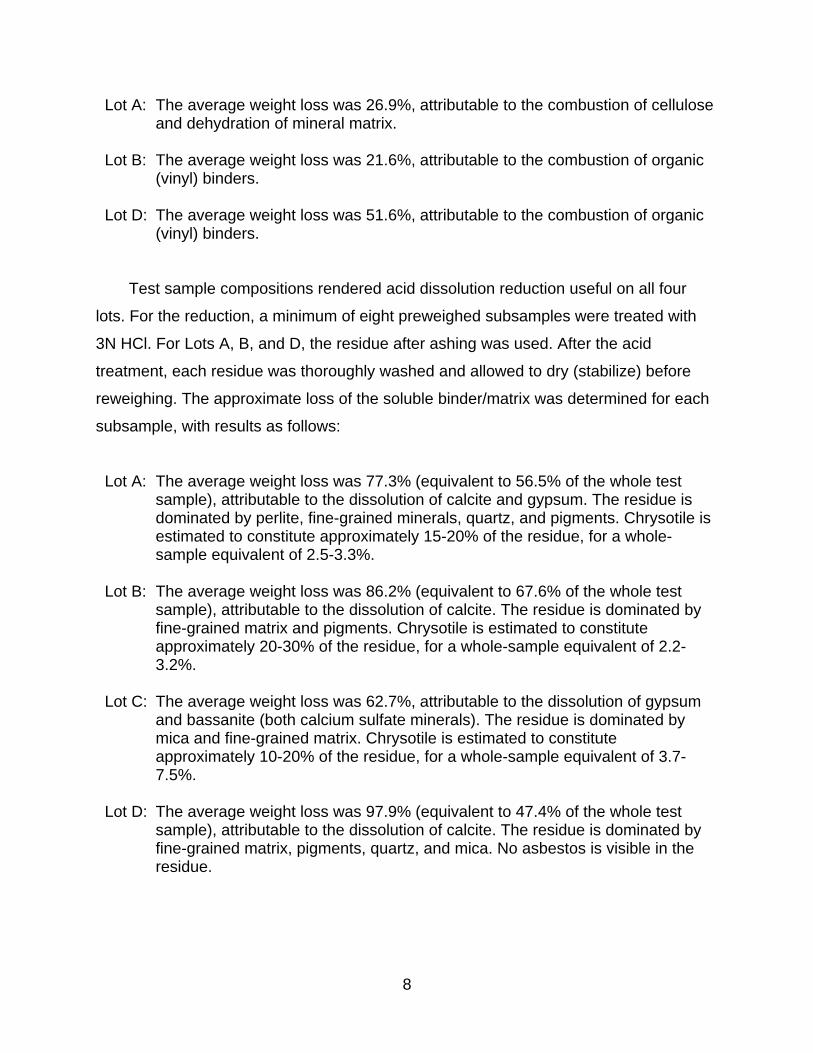
Lot A: The average weight loss was 26.9%, attributable to the combustion of celluloseand dehydration of mineral matrix.
Lot B: The average weight loss was 21.6%, attributable to the combustion of organic(vinyl) binders.
Lot D: The average weight loss was 51.6%, attributable to the combustion of organic(vinyl) binders.
Test sample compositions rendered acid dissolution reduction useful on all four
lots. For the reduction, a minimum of eight preweighed subsamples were treated with
3N HCl. For Lots A, B, and D, the residue after ashing was used. After the acid
treatment, each residue was thoroughly washed and allowed to dry (stabilize) before
reweighing. The approximate loss of the soluble binder/matrix was determined for each
subsample, with results as follows:
Lot A: The average weight loss was 77.3% (equivalent to 56.5% of the whole testsample), attributable to the dissolution of calcite and gypsum. The residue isdominated by perlite, fine-grained minerals, quartz, and pigments. Chrysotile isestimated to constitute approximately 15-20% of the residue, for a whole-sample equivalent of 2.5-3.3%.
Lot B: The average weight loss was 86.2% (equivalent to 67.6% of the whole test sample), attributable to the dissolution of calcite. The residue is dominated byfine-grained matrix and pigments. Chrysotile is estimated to constituteapproximately 20-30% of the residue, for a whole-sample equivalent of 2.2-3.2%.
Lot C: The average weight loss was 62.7%, attributable to the dissolution of gypsumand bassanite (both calcium sulfate minerals). The residue is dominated bymica and fine-grained matrix. Chrysotile is estimated to constituteapproximately 10-20% of the residue, for a whole-sample equivalent of 3.7-7.5%.
Lot D: The average weight loss was 97.9% (equivalent to 47.4% of the whole test sample), attributable to the dissolution of calcite. The residue is dominated byfine-grained matrix, pigments, quartz, and mica. No asbestos is visible in theresidue.

9
X-Ray Diffraction (XRD)
Treated (by ashing and/or acid dissolution; see the previous section) and untreated
subsamples of all four lots were extracted for XRD analysis. All treated and untreated
subsamples were ground with a mortar and pestle, and powder mounts were prepared.
Scans were run from 5°22 or 8°22 to 62°22 at a scan rate of either 0.01°22 per second
or 0.02°22 per 0.6 second. Differences in scan rates are attributable to differences in
XRD instrumentation and have no impact on RTI’s interpretation of the diffractograms.
Following are the results of the XRD analyses:
Lot D: No asbestiform phases were detected in scans of the untreated and treatedmaterial. Confirmed nonasbestiform phases included calcite (untreated only),quartz (treated only), muscovite mica (treated only), rutile [titanium dioxide](treated only), and microcline (treated only).

10
Quantitation of Asbestos in Positive Test Sample Lots
The concentration of asbestos in each of the three positive lots was determined by
point counting, quantitative XRD, and gravimetric sample reduction, each where
applicable. An abundance of fine-grained pigments in residues from gravimetric
reduction of the Lot B floor tile material adhered to
Means and standard deviations were calculated for the point counts, XRD
quantitation values, and gravimetric residue estimates for the asbestos type(s) in each
sample and used to develop two-sided tolerance limits (acceptance ranges). Limits
were chosen so as to have 99% confidence that 95% of the reported values would be
deemed acceptable. The final acceptance range for a sample used the lowest value
among the minimum values and the highest value among the maximum values for all
techniques used. Semiquantitative results and acceptance ranges are shown in Table 3.
The number of replicate analyses used in each calculation is also indicated.
Section V - Summary of the Test RoundOf the 239 laboratories enrolled, 230 submitted results of analyses for the test
round, for a response rate of . This rate was slightly higher than the 94% average
participation rate for the 55 previous test rounds conducted under the proficiency rating
format. A laboratory not returning results was deemed “failing” (F) for the test round
unless it had notified AIHA beforehand of its intent not to participate in the test round
and provided a qualifying reason for the nonparticipation. One laboratory provided such
notification to AIHA. Of the 230 participating laboratories, 227 (99%) submitted analysis
via RTI’s Web site for the program.
The eight laboratories that did not submit results by the deadline date or have an
AIHA-approved exemption were contacted by RTI to confirm their intent not to
participate. One laboratory indicated that it would submit late results but did not. One
laboratory wishes to remain enrolled but will not submit results before Test Round 80.

11
Table 3. Semiquantitation Means and Ranges, and Acceptance Ranges
SemiquantitationMethod
Lot A Lot B Lot C
Chrysotile Chrysotile Chrysotile
Point CountMean (%)Range (%)
Replicates (#)
2.31.4 to 3.0
7not applied
5.13.5 to 6.3
8
SemiquantitativeXRD
Mean (%)Range (%)
Replicates (#)
2.72.0 to 3.9
8
3.63.2 to 4.3
10
9.06.8 to 9.8
9
GravimetryMean (%)Range (%)
Replicates (#)not applied
2.81.6 to 3.7
20not applied
99/95 AcceptanceRange (%)
Trace to 8%,inclusive
Trace to 8%,inclusive
Trace to 15%,inclusive
One laboratory returned its test samples without explanation. The other five laboratories
did not reply to RTI’s voice messages or e-mails.
Tables 4 and 5 illustrate the total test round effort, as generated by the results of
analyses submitted by participating laboratories. Table 4 shows the penalty point totals
incurred by passing (P) and failing (F) laboratories based on the grading criteria
described on page 13 of this report. A laboratory was rated F for incurring 100 or more
penalty points or for not participating. The total numbers of P and F laboratories are also
indicated. For the test round, 203 laboratories (85% of the total enrolled, 88% of the
total participating) were rated P. Of the 35 F laboratories for the test round, 26 were
rated so for incurring classification errors, with or without other error types, and 1
resulted from a combination of asbestos identification errors and/or semiquantitation
errors, without classification errors. The eight laboratories that did not submit results by
the deadline or have an AIHA-approved exemption received F ratings for
nonparticipation. This was the first test round of participation for 3 of the 35 F
laboratories.
Table 5 lists totals of false negatives, false positives, asbestos identification errors,
and semiquantitation errors made by laboratories, by sample lot. False negatives and
false positives are denoted by “FN” and “FP,” respectively; asbestos identification and

12
Table 4. Distribution of Penalty Point Totals Incurred
Total PenaltyPoints Incurred
Number ofLaboratories
Passing Laboratories 0 159
1 - 24 30
25 - 49 9
50 - 74 2
75 - 99 3
Total Passing Laboratories 203
Failing Laboratories 100 - 124 21
125 - 149 0
150 - 199 2
200 or more 4
Nonparticipants 8
Total Failing Laboratories 35
Excused Laboratories 1
Suspended Laboratories 0
Table 5. Sample Classification, Asbestos Identification,and Semiquantitation Errors, by Test Sample Lot
SampleLot
AsbestosContent
Number of Errors, by Type
FN FP ID SQ
A + 1 ---- 15 34
B + 21 ---- 2 2
C + 2 ---- 3 10
D – ---- 6 ---- ----
Total Errors Incurred 24 6 20 46
FN = False Negative FP = False Positive ID = Asbestos Identification Error SQ = Semiquantitation Error

13
semiquantitation errors are denoted by “ID” and “SQ,” respectively. Totals of all error
types incurred for the test round are shown at the bottom of the table.
The following evaluation criteria were used to assign these classification,
identification, and semiquantitation errors:
Proficiency Grading Criteria Penalty Points
Failing to submit analysis results Automatic NP
Failing to report asbestos in a positive sample (FN) 100
Reporting 1% or greater asbestos in a blank sample (FP) 100
Failing to report the correct asbestos type, in a one-type sample (ID) 50Failing to report second asbestos type, in a multi-type sample (ID) 50Failing to report third asbestos type, in a multi-type sample (ID) 25
Reporting 1% or greater incorrect asbestos type (ID) 45/type
Reporting trace asbestos in a blank or trace incorrectasbestos type(s) in a positive sample No penalty
Failing to report trace asbestos when RTI QC confirmsit in all samples 25/type
Failing to report trace asbestos when RTI QC does notconfirm it in all samples No penalty
Per sample, first asbestos semiquantitation outside acceptance range 20Per sample, second asbestos semiquantitation outside acceptance range 10Per sample, third asbestos semiquantitation outside acceptance range 5
Section VI - Individual Laboratory ResultsPlease refer to the computer printout on page 14 for a tabulation of your individual
laboratory results and a comparison of those results with the reference laboratories’
analyses. The total penalty points incurred by your laboratory during this test round and
the status of your laboratory as a result of your performance this test round are listed in
the upper right-hand corner of the form. The number of penalty points per sample is
highlighted in the section entitled “Analysis Results for Laboratory _____.”

14
One-page
“computer printout of graded results”
to be inserted here

15
A laboratory achieved a program status of proficient (P) if two of its three most
recent test rounds were rated P. A laboratory also achieved a program rating of P if it
had participated in only two test rounds but had been rated P in each. A laboratory was
rated nonproficient (NP) for the program if it was rated F for more than one of the three
most recent test rounds. If a laboratory’s program rating is listed as not applicable (NA),
that laboratory has not participated in the number of test rounds required to establish a
program rating. Through the completion of this test round, 204 laboratories (85% of the
total enrolled) have a P program rating, 25 (11%) have an NP program rating, and 10
(4%) have no program status because they have not completed the requisite number of
test rounds.
Section VII - Analysis Problems and SuggestionsThe following appraisals are provided concerning trends or patterns seen in sample
classification, asbestos identification, and semiquantitation errors for each of the four
test sample lots.
A total of 30 classification errors were incurred, for an overall classification error
rate of 3.3%. This was only slightly higher than the program’s 3.1% historic classification
error rate. Twenty-four false negatives resulted in a false negative error rate of 3.5%;
this was slightly higher than the program’s historic false negative error rate of 3.0%. Six
false positives resulted in a false positive error rate of 2.6%; this was considerably lower
than the program’s historic false positive error rate of 3.3%.
Twenty-one of the 24 false negatives were incurred on Lot B, a vinyl floor tile
containing approximately 3% chrysotile. These false negatives were easily avoidable if
the laboratory had the ability to perform a gravimetric matrix reduction prior to looking
for and quantifying any asbestos present. Ashing and acid dissolution removed
approximately 22% and 68% of the sample’s weight, respectively. Chrysotile was easily
detected in the residue, constituting 20-30% of the remaining material.
The results on Lot B illustrate that laboratories not routinely performing gravimetric
matrix reduction on floor tiles potentially run a high risk for failing to detect asbestos
(when present) and incurring an avoidable false negative. RTI recommends that
laboratories employ a full spectrum of sample treatment processes, such as those

16
described in the EPA Test Method for the Determination of Asbestos in Bulk Building
Materials, EPA/600/R-93/116. Performing ashing and acid reduction serves to
concentrate any asbestos present into the residue, where it is more easily detected and
better quantified.
If a laboratory does not have the equipment or capability to perform these sample
reductions, it may be well-advised to submit floor tile samples to another laboratory with
gravimetric reduction and/or transmission electron microscopy (TEM) capability, in order
to confirm or refute the negative PLM results. If a laboratory does this as standard
practice on all floor tiles, it may seek a permanent “floor tile waiver” from AIHA. This
waiver allows the laboratory to choose to either: 1) not submit results on any floor tile
PT sample, or 2) submit results on floor tile PT samples but not have them graded by
RTI.
Six false positives were incurred on Lot D, a sheet linoleum containing no fibrous
components. Five laboratories reported the presence of chrysotile, in amounts ranging
from 2% to 15%. A sixth laboratory reported 10% each of chrysotile and tremolite. That
laboratories would report any asbestos type at all is surprising, as RTI detected no
fibrous material to be present in the material. Three of the six laboratories also incurred
false negatives on Lot B, suggesting the possibility that analysis results for the two
samples were transposed in the process of being reported.
Twenty identification errors were incurred, for an identification error rate of 2.9%.
This was less than one-half the program’s historic error rate of 6.5%.
Fifteen of the 20 identification errors were incurred on Lot A, a textured ceiling
spray containing approximately 3% chrysotile. Nine errors were assigned for reporting
amosite or tremolite but not reporting the chrysotile known to be present; six errors were
incurred for reporting amosite or tremolite in addition to the chrysotile.
The other five identification errors were divided between Lots B and C. Both errors
on Lot B were incurred for reporting tremolite in addition to the chrysotile known to be
present. On Lot C, two errors were assigned for reporting anthophyllite but not reporting
the chrysotile known to be present. The other was incurred for reporting amosite in
addition to the chrysotile. RTI and the two reference laboratories reported the presence
of trace-level amphibole exhibiting inclined extinction.

17
The number of semiquantitation errors was low compared to that in recent test
rounds, but not unexpected given the specific nature of the test samples in this test
round. On Lot B, all 34 semiquantitation errors were incurred by laboratories reporting
chrysotile in amounts exceeding the upper limit of RTI’s acceptance range for that
asbestos type. Ten errors were incurred on Lot C, all for reporting asbestos types in
amounts exceeding the upper limits of RTI’s acceptance ranges. Two errors were
incurred on Lot B, also for reporting asbestos types in amounts exceeding the upper
limits of RTI’s acceptance ranges.
Section VIII - Test Method/Analytical Technique SummaryRTI solicited information about the test methods and analytical techniques
employed by the program participants on this test round’s test samples. The cited
methods and techniques are listed in Table 6. RTI then correlated false negative, false
positive, asbestos identification, and asbestos semiquantitation errors to the
method/technique used. Based on the recommendations of its statisticians, RTI
performed two simple statistical analyses – an analysis of variance (ANOVA) and a
mean squared error (MSE) test – of the semiquantitative data on positive sample lots.
The ANOVA determines if there is a statistically significant difference among the
consensus means of the reported values, for each test method/technique. Its use is
appropriate when comparing multiple data sets of widely varying numbers of individual
measurements. If the ANOVA indicates that a significant difference exists among the
results for the methods/techniques used, the MSE test attempts to identify the
method/technique combination yielding the best semiquantitative results by comparing
the accuracy of reported values to the true value for the test sample and also factoring
in the precision of the reported values. If a statistically significant difference is found, the
results of the evaluation of the data are included in this report.
It appears that the relatively small number of errors of any type make presentation
of these comparative data on a per-sample basis to be of limited value and practicality
to participating laboratories. Therefore, and effective with Test Round A71-207, RTI has
elected to present the error type/frequency data for each test method used in
cumulative terms for all samples in the test round. These data are provided in Table 7.

18
Table 6. Cited Test Methods and Techniques
Legend Method Qualitative Technique Quantitative Technique
1 EPA INT / PTCTEPA Interim Method(1982)
Polarized Light MicroscopyPoint Counting
2 EPA INT / CVE Equivalent Visual Estimation
3 EPA INT / GRAV Gravimetric Reduction
4 EPA INT / XRD X-Ray Diffraction Standards Comparison
5 EPA REV / PTCT
EPA Revised Method(1993)
Polarized Light MicroscopyPoint Counting
6 EPA REV / CVE Calibrated Visual Estimation
7 EPA REV / GRAV Gravimetric Reduction
8 EPA REV / XRD X-Ray Diffraction Standards Comparison
9 EPA REV / EM Analytical Electron Microscopy Visual Estimation
10 NYS / PTCT New York State Method198.1
Polarized Light Microscopy Point Counting
11 NYS / TEM New York State Method198.4
Transmission ElectronMicroscopy
Visual Estimation
12 NIOSH / VE NIOSH Method 9002 Polarized Light Microscopy Visual Estimation
13 NIOSH / XRD NIOSH Method 9002 X-Ray Diffraction Standards Comparison
14 OSHA / VE OSHA Method D-191 Polarized Light Microscopy Visual Estimation
15 OTHER Method Not SpecifiedAbove
The number in each row of the column with the heading “Avg. Error Points Per
Analysis” was calculated by summing the number of false negatives and false positives
times 100, the number of ID errors times 50, and the number of semiquantitation errors
times 20 and dividing that sum by the total number of analyses performed by that
method. This weighting reflects the relative penalty point values for these error types in
the actual grading criteria for the program.
Three methods that use PLM for qualitative analysis and visual estimation or
calibrated visual estimation for quantitative analysis – the 1982 EPA Interim Method,
1993 EPA Revised Method, and NIOSH Method 9002 – were, as in Test Rounds
A71-207 through A77-408, the ones most often cited by laboratories this round. In five
of those six previous test rounds, the lowest rates of false negatives, false positives,
and asbestos identification and semiquantitation errors, and the lowest average penalty

19
Table 7. Analysis of Errors and Asbestos Semiquantitation,by Test Method/Technique Used
Test Round A78-109
# Method/TechniqueCited by Laboratory
Total No.of
Analyses FN
FNErrorRate(%) FP
FPErrorRate(%) ID
IDErrorRate(%) SQ
SQErrorRate(%)
Avg.Error
Points/Analysis
1 EPA INT / PTCT
2 EPA INT / EVE
3 EPA INT / GRAV
5 EPA REV / PTCT
6 EPA REV / CVE
7 EPA REV / GRAV
10 NYS / PTCT
12 NIOSH / VE
14 OSHA / VE
15 OTHER
points per analysis in each round, were achieved by laboratories using the 1993 EPA
Revised Method with calibrated visual estimation (method 6). In Test Round A73-407,
the NIOSH method with semiquantitation by visual estimation (method 12) fared the
best of the three methods most commonly used. This test round, method 6 again
yielded the lowest average penalty points per analysis.
A comparatively very small number of analyses were performed by laboratories
using either EPA method, with point counting or gravimetric reduction for quantitation
(method 1, 3, 5, or 7); the New York State PLM method, with point counting for
quantitation (method 10); the OSHA method, with visual estimation for quantitation
(method 14); and other methods not specified in Table 7. The latter are for the most part
in-house test methods developed by laboratories outside of the United States. Rates of
false negatives and false positives incurred by laboratories using these methods were

20
generally nonexistent or very low, but these method/technique combinations produced
mixed results on asbestos identification and semiquantitation errors and on penalty
points per laboratory.
The ANOVA revealed that there was no statistically significant difference in
semiquantitative results among methods for any of the three sample lots. MSE analysis
of Lot A data suggests that the most accurate and precise semiquantitation overall was
reported by laboratories using method 1, and for the three most commonly cited
methods, by laboratories using method 6. MSE analysis of Lot B data suggests that the
most accurate and precise semiquantitation overall was reported by laboratories using
method 3, and for the three most commonly cited methods, again by laboratories using
method 6. MSE analysis of Lot C data suggests that the most accurate and precise
semiquantitation overall was reported by laboratories using method 5, and for the three
most commonly cited methods, by laboratories using method 6.
Section IX - Participant FeedbackRTI welcomes comments and constructive criticism from program participants on
any aspect of this test round or RTI’s overall administration of the program. Please
direct such to Program Manager Bruce Harvey at (919) 541-6573 or [email protected].
Section X - Schedule for Test Round A79-209The following dates relating to Test Round A79-209 of the Bulk Asbestos
Proficiency Analytical Testing Program have been agreed upon by AIHA and RTI:
May 15, 2009 RTI distribution of test sample packets to laboratories.
June 15, 2009 Deadline for RTI receipt of results of laboratory analyses.
July 15, 2009 Distribution/posting of “Final Report to Laboratories - TestRound A79-209” to participants.
END OF REPORT