america - vanguardinstitutional.vanguard.com/pdf/has_2002.pdfonce a minor player in the retirement...
TRANSCRIPT

®
S A V E S
How
A Report on Vanguard Defined Contribution Plans
2 0 0 2
America

Once a minor player in the retirement savings system, defined contribution plans, in
particular 401(k) plans, have taken center stage as the dominant form of retirement savings
for America’s workers. Today nearly 60 million employees participate in defined contribution
plans, and industry assets total $2.2 trillion. By 2030, researchers expect that defined
contribution plans will be paying more to the baby boom generation than Social Security.
The Vanguard Group is a leader in the defined contribution marketplace
with nearly $300 billion in retirement assets. We offer plan sponsors invest-
ment management, recordkeeping, and education services. Today we serve
more than 1,300 plan sponsors and nearly 3 million participants.
As an industry leader, Vanguard recognizes that it’s important to have a
detailed understanding of defined contribution plans and the role they play
in the U.S. retirement system. To this end, we’ve prepared the 2002 edition
of How America Saves: A Report on Vanguard Defined Contribution Plans. This
report provides an assessment of defined contribution plans and participant
behavior based on Vanguard recordkeeping data and other sources. It also
offers an update on the broader defined contribution savings system.
We hope our report will serve as a valuable reference tool, and that our
observations will prove useful as your organization continues to evaluate
its retirement offerings.
Sincerely,
F. William McNabb III
Managing Director
Institutional Investor Group
September 2002

4 Highlights
8 part one
Retirement Plans andthe U.S. Workforce
10 The U.S. Workforce
13 Plans, Participants, and Assets
17 Retirement Plan Coverage
22 The Incomes of Older Americans
26 part two
Vanguard Defined ContributionPlans: Current Features
28 Participation Rates
31 Savings Rates
33 Participant Investment Decisions
37 Account Balances
40 Plan Investment Options and Decisions
47 Exchange Activity
49 Participant Education and Advice
52 Access Methods and The Internet
55 Plan Loans
59 In-Service Withdrawals
60 Plan Distributions and Rollovers
64 part three
Insights and Strategies
66 Boosting Participation and Savings Rates
73 How Much Should Workers Be Saving?
78 Restrictions on Company Stock
83 “Money Attitudes” and RetirementCommunications
89 Participant Trading Behavior: A Longer-Term View
93 Methodology
94 References
96 Acknowledgments
see following pages for Highlights . . .
C O N T E N T S

Total private sector retirement plan assets reached $4.1 trillion in 2001 and will likely grow at single-digit rates through 2003 (assuming single-digit market returns).Defined benefit assets constituted 46% of the total; defined contribution assets,54%. At year-end 2001 there were 23 million participants in defined benefit plansand 57 million participants in defined contribution plans. Page 14.
401(k) plans now account for nearly three-quarters of all defined contribution planassets, more than 80% of all defined contribution plan participants, and nearly 40% of all private sector retirement assets. Page 15.
Just less than half of U.S. workers were covered by employer retirement plans atyear-end 2001: 6% had defined benefit plan coverage only; 28% had defined contri-bution plan coverage only; and 15% had coverage from both types of plans. Page18.
For older Americans, Social Security remains the most prevalent source of income:9 of 10 older Americans received Social Security income in 2000. Six of 10 olderhouseholds had income from savings; 4 of 10, income from employer plans. Forlow-income households, Social Security accounted for 8 of every 10 dollars ofincome; for high-income households, income came from a mix of Social Security, personal savings, employer plans, and work earnings. Page 22.
Vanguard average plan participation rates declined from 79% in 1999 to 76% in2001, a pattern similar to that reported by other industry sources. Likely reasonsinclude the slowdown in the U.S. economy and the impact of declining stock priceson new plan enrollment. Page 28.
Retirement Plansand the U.S.Workforce
Participation andSavings Behavior
Highlights

From 1999 to 2001, Vanguard average plan savings rates also declined by 1% to just more than 7%. As with participation rates, likely reasons include the economic slowdown and the impact of falling stock prices on savings behavior.Some data on participant deferral rates in the first half of 2002 suggested risingsavings rates, possibly in response to improved economic conditions and pension reform. Page 31.
The main tools for boosting plan participation and savings rates remain specificplan features (company match, loans) and participant communications. New strategies include plan design features such as automatic enrollment and automatic savings (SMarT) plans, as well as new education techniques such as personaliza-tion and “money attitudes” research. New studies also underscore the importanceof peer group dynamics in determining savings behavior. Page 66.
Despite a two-year decline in U.S. stocks of –20%, the average asset allocation toequities among Vanguard participants fell only slightly, from 78% in 1999 to 76% in 2001. Falling asset values were offset by ongoing contributions to equities.Contribution allocations to equities remain virtually unchanged, at 81% of new contributions in 2001. Pages 33 and 34.
Although Vanguard participants maintained high allocations to equities in the faceof a sharply declining stock market, the average Vanguard participant’s account balance fell by only 1% from 1999 to 2001. The typical (median) account balanceactually rose by 5% during the period. Again, new contributions offset the impact of declining asset values. These results may explain participants’ continuedcommitment to a buy-and-hold strategy, despite the worst decline in U.S. stockprices in a quarter century. Page 37.
Highlights
Impact of the Bear Market in U.S. Stocks
In any given year, few participants trade (i.e., exchange monies among investmentoptions in their employer’s plan). In 1999 only 17% of participants undertook anyinvestment exchange; in 2001 that number fell to 14% of participants. Page 47.
While fewer participants are trading, those who do trade are becoming increasinglylike-minded, with a preference for moving assets into fixed income investments.In 2001 an average of 2.5% of Vanguard net recordkeeping assets was shifted from equities to fixed income investments. While still modest, it was more than double the shift of 0.9% of average assets into fixed income investments in 1999. Page 48.
Company stock accounted for 14% of total defined contribution assets at Vanguard—and 25% of total assets among plans offering company stock as an investment option. These concentration levels remain somewhat below industry averages. Page 78.
The types of restrictions employers imposed on company stock are closely linkedwith the decision whether to make employer contributions in company stock or cash. Employers making stock contributions are more likely to impose restrictionson participants’ ability to diversify those contributions. Employers making cash con-tributions are more likely to have no restrictions at all or impose caps or maximumsin an effort to avoid concentrated stock holdings by participants. Pages 78 to
Vanguard participants are divided into three segments based on their degree ofinvolvement with their retirement accounts. Frequent contactors represented 22%of the Vanguard participant population in 2001; they contacted Vanguard an aver-age of 38 times per year, through the Web, a voice-response unit, or a telephoneassociate. Infrequent contactors constituted 30% of the plan population; they
Highlights
The Role ofCompany Stock
Participant Account Activity
Participant TradingActivity
81.

contacted Vanguard an average of four times per year. Just less than half of participants (48%) were noncontactors—they relied exclusively on quarterly accountstatements for information about their retirement plan accounts. Page 52.
Frequent contactors tend to be 45-year-old males with high account balances andhigh household incomes. According to Vanguard surveys of national plan partici-pants, these demographic elements are similar to those for frequent stock marketcheckers and frequent traders. Page 52.
Low levels of participant involvement—both reflected in account access data and in participant trading activity—seem appropriate in light of median account balances ($15,000) and a limited number of actual investment holdings (a median of three options). Page 42.
At a national level, an estimated 30% of preretirees are well prepared for retire-ment, 30% are potentially secure, and 40% are at risk. Page 74.
A participant earning $50,000 per year and covered only by a defined contributionplan would need to save 15% of income (both in employer and employee contribu-tions) over 30 years to ensure adequate retirement savings. For a participant withboth defined benefit and defined contribution coverage, the target savings ratewould be 9%. Based on these benchmarks, current defined contribution savingsrates appear to be too low. Page 77.
Other factors driving higher retirement savings include: a possible reduction inSocial Security benefits; the prospect for higher out-of-pocket Medicare and otherhealth care costs; increased life expectancy; and the additional savings needed to “self-fund” retirement income streams from lump-sum distributions. Page 75.
Highlights
Retirement Savings Adequacy

Retirement Plans and the U.S. Workforce
P A R T O N E
The U.S. retirement savings system rests on three legs. The first, Social Security, pro-vides income payments to older Americansand disability payments to workers. Thisdefined benefit program is mandatory andnearly universal. The system is publiclyfinanced through employer and employeepayroll taxes.

The second leg consists of an
extensive array of employer-
sponsored retirement plans.
Sponsorship of such plans is vol-
untary, and U.S. tax law provides
incentives to encourage plan
adoption. The principal sponsors
are private sector employers;
other important sponsors
include unions, nonprofit organi-
zations, and the public sector.
Defined contribution plans are
now the most prevalent type
of plan, though defined benefit
plans remain quite important for
employees of large companies,
union members, and public
sector workers.
The third leg of the U.S.
system is individually controlled
private retirement savings. Tax
incentives are granted to several
types of personal retirement
savings, including individual
retirement accounts (IRAs) and
fixed and variable annuities.
In this section we provide an
overview of key aspects of the
U.S. retirement system, with an
emphasis on employer-sponsored
retirement plans for private sec-
tor workers. This section covers:
• An overview of the U.S.
workforce in 2001.
• Size and scope of private
retirement plans.
• Retirement plan coverage.
• Income sources for today’s
older Americans.

The U.S. workforce has undergone
several dramatic changes over the past
quarter century. The changes outlined
below provide a broader context for
understanding retirement plan cover-
age and the shift from defined benefit
to defined contribution plans over
the period.
Employment
In 2001 the U.S. population totaled
285 million, and the U.S. workforce
reached 142 million (see chart 1).
Today, nearly 80% of jobs in the U.S.
workforce are in the private sector;
15% are in the public sector; and 2%
are in agriculture.
Over the past quarter century, private
sector employment has grown more
rapidly than public sector employ-
ment (see chart 2). From 1975 to
2001, private payrolls grew from 63
million to 110 million workers at an
annualized growth rate of 2.3%.
During the same period, government
payrolls expanded from 15 million to
21 million workers—an annualized
growth rate of 1.4%.
Part 1 Retirement Plans and the U.S. Workforce
1. Current U.S. Workforce 2001
Individuals
U.S. population
Civilian labor force
284.9
141.8
Source: U.S. Census, Department of Labor, 2001.
Composition of U.S. Workforce (in millions)
Individuals
Private sector (nonfarm)
Government
Agriculture
Unemployed
Other
110.2
21.1
3.1
6.7
0.7
Percentage
78%
15%
2%
5%
0%
Composition of Civilian Labor Force (in millions)
2. Growth of U.S. Workforce 1975–2001
Nonfarm Workers (in millions)
Public sector payrolls (+1.4% per year)
Private sector payrolls (+2.3% per year)
1975
1977
1979
1981
1983
1985
1987
1989
1991
1993
1995
1997
1999
2001
0
20
40
60
80
100
120
Source: Department of Labor, 2001.
The U.S. Workforce
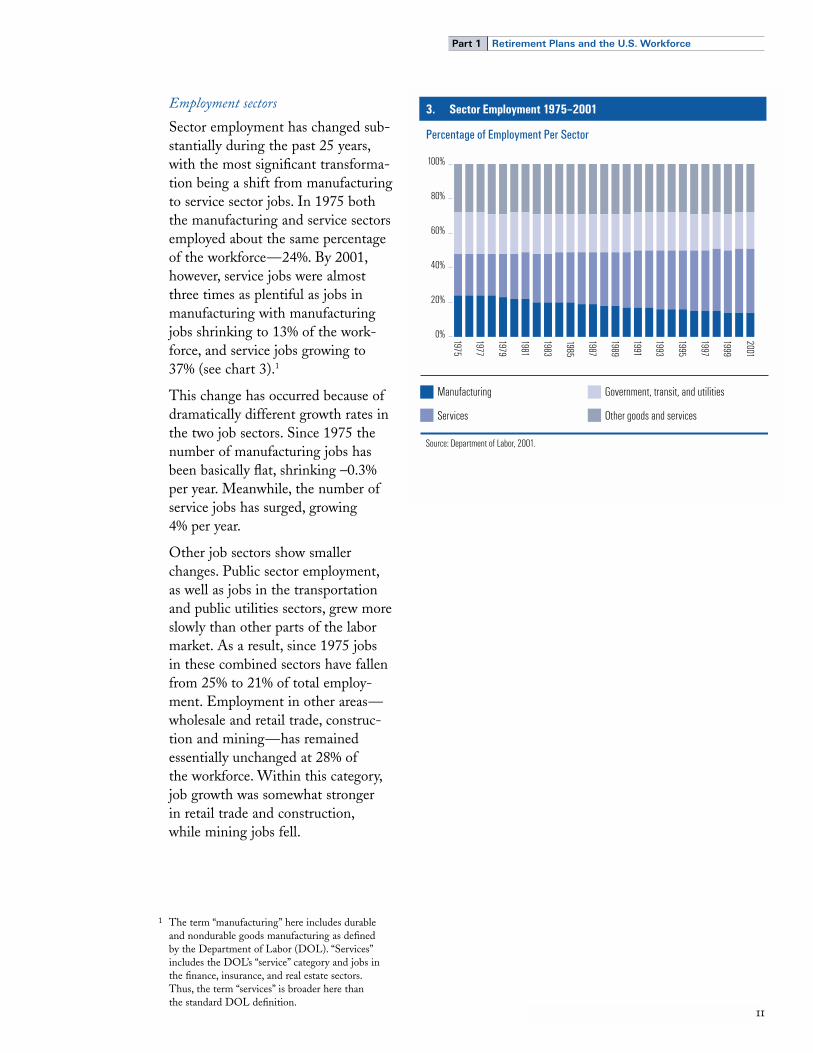
Employment sectors
Sector employment has changed sub-
stantially during the past 25 years,
with the most significant transforma-
tion being a shift from manufacturing
to service sector jobs. In 1975 both
the manufacturing and service sectors
employed about the same percentage
of the workforce—24%. By 2001,
however, service jobs were almost
three times as plentiful as jobs in
manufacturing with manufacturing
jobs shrinking to 13% of the work-
force, and service jobs growing to
37% (see chart 3).1
This change has occurred because of
dramatically different growth rates in
the two job sectors. Since 1975 the
number of manufacturing jobs has
been basically flat, shrinking –0.3%
per year. Meanwhile, the number of
service jobs has surged, growing
4% per year.
Other job sectors show smaller
changes. Public sector employment,
as well as jobs in the transportation
and public utilities sectors, grew more
slowly than other parts of the labor
market. As a result, since 1975 jobs
in these combined sectors have fallen
from 25% to 21% of total employ-
ment. Employment in other areas—
wholesale and retail trade, construc-
tion and mining—has remained
essentially unchanged at 28% of
the workforce. Within this category,
job growth was somewhat stronger
in retail trade and construction,
while mining jobs fell.
Part 1 Retirement Plans and the U.S. Workforce
3. Sector Employment 1975–2001
Percentage of Employment Per Sector
1975
1977
1979
1981
1983
1985
1987
1989
1991
1993
1995
1997
1999
2001
0%
20%
40%
60%
80%
100%
Manufacturing
Services
Government, transit, and utilities
Other goods and services
Source: Department of Labor, 2001.
1 The term “manufacturing” here includes durable
and nondurable goods manufacturing as defined
by the Department of Labor (DOL). “Services”
includes the DOL’s “service” category and jobs in
the finance, insurance, and real estate sectors.
Thus, the term “services” is broader here than
the standard DOL definition.

Work arrangements
Full-time work remains the most
common type of employment
arrangement in the U.S. Three-
quarters of workers are engaged
in full-time work (see chart 4).
An additional 15% are engaged
in traditional part-time work.
Nearly 13 million workers, or just
less than 10% of the workforce, are
employed in what are termed “alter-
native work arrangements” (see again
chart 4).2 These jobs are structured
somewhat differently than traditional
full-time or part-time work.
Workers in alternative work arrange-
ments include3:
Independent contractors (6.4% of
the workforce)—freelance workers
who typically acquire clients on their
own. Examples include management
consultants, freelance writers, or self-
employed trades people.
On-call workers (1.6%)—workers who
are called to a job as needed by vari-
ous employers. Their work may last a
day or two or extend to several weeks.
They include construction workers
hired through a union hall, substitute
teachers, or on-call nurses.
Temporary-help agency workers (0.9%)—
any workers paid by a temporary-
employment agency. The typical tem-
porary worker is the “temp” office sec-
retary, but this category also includes
jobs such as temporary accountants
or paralegals.
Contract workers (0.5%)—workers
employed by a contracting company,
which provides another organization
with workers on a long-term basis.
The workers of the contracting
company typically work for a single
client and often at the client’s work
site. Examples include employees
of food service, security, or computer
services companies—activities
typically “outsourced” by the client
organization to the contracting firm.
Part 1 Retirement Plans and the U.S. Workforce
4. Work Arrangements in 2001
Employed Workforce135.0 million
75.2% Full-time101.5 million
9.4% Alternative Work Arrangements12.7 million
Source: Department of Labor, 2001; Vanguard estimates.
15.4% Part-time20.8 million
2 This information has been drawn from
Polivka, 1996.
3 Separate from the definition of full-time, part-
time, or alternative work; another 2% to 4% of
the workforce (three million to six million workers)
is classified as “contingent”—workers who expect
their employment to end in the foreseeable future.
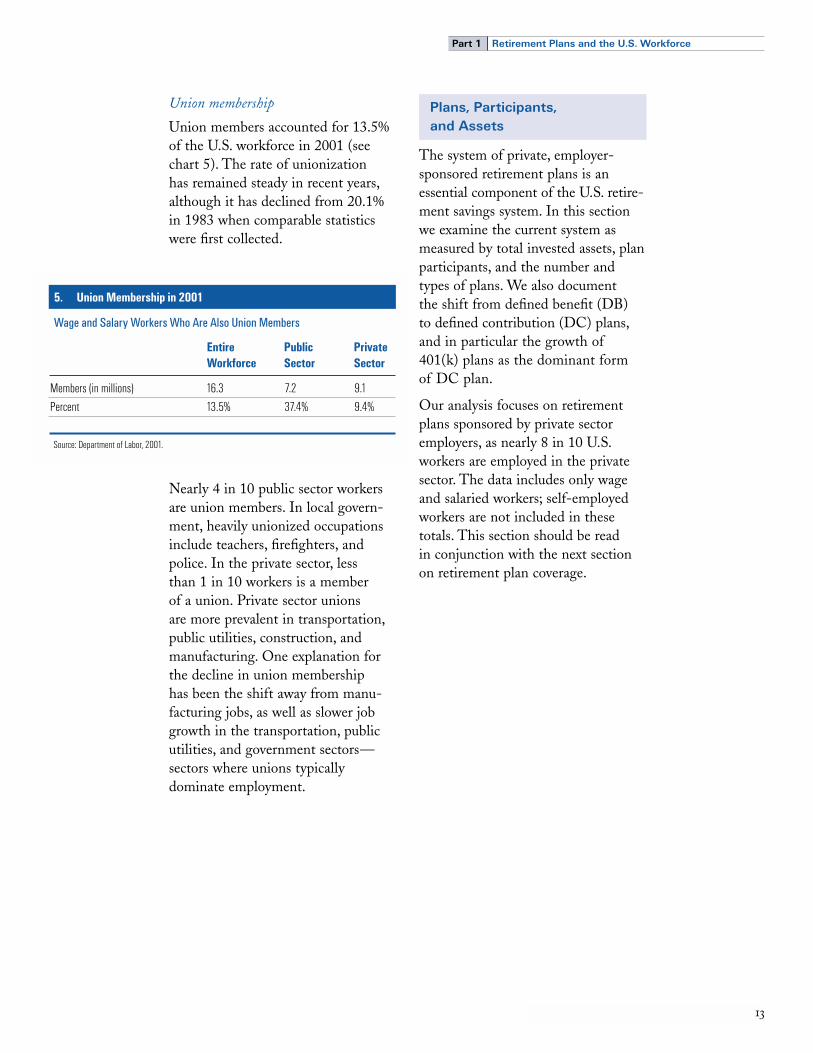
Union membership
Union members accounted for 13.5%
of the U.S. workforce in 2001 (see
chart 5). The rate of unionization
has remained steady in recent years,
although it has declined from 20.1%
in 1983 when comparable statistics
were first collected.
Nearly 4 in 10 public sector workers
are union members. In local govern-
ment, heavily unionized occupations
include teachers, firefighters, and
police. In the private sector, less
than 1 in 10 workers is a member
of a union. Private sector unions
are more prevalent in transportation,
public utilities, construction, and
manufacturing. One explanation for
the decline in union membership
has been the shift away from manu-
facturing jobs, as well as slower job
growth in the transportation, public
utilities, and government sectors—
sectors where unions typically
dominate employment.
The system of private, employer-
sponsored retirement plans is an
essential component of the U.S. retire-
ment savings system. In this section
we examine the current system as
measured by total invested assets, plan
participants, and the number and
types of plans. We also document
the shift from defined benefit (DB)
to defined contribution (DC) plans,
and in particular the growth of
401(k) plans as the dominant form
of DC plan.
Our analysis focuses on retirement
plans sponsored by private sector
employers, as nearly 8 in 10 U.S.
workers are employed in the private
sector. The data includes only wage
and salaried workers; self-employed
workers are not included in these
totals. This section should be read
in conjunction with the next section
on retirement plan coverage.
Part 1 Retirement Plans and the U.S. Workforce
5. Union Membership in 2001
Wage and Salary Workers Who Are Also Union Members
EntireWorkforce
Public Sector
Private Sector
Members (in millions)
Percent
16.3
13.5%
7.2
37.4%
9.1
9.4%
Source: Department of Labor, 2001.
Plans, Participants, and Assets

Overview
As of 2001, based on Vanguard esti-
mates4, private sector retirement assets
totaled $4.1 trillion, with $1.9 trillion
invested in DB plans and $2.2 trillion
in DC plans (see chart 6, top panel).
Although they are not formally part
of the employer-based retirement
system, IRAs are the recipients of
rollovers from both DC and DB
plans, and so a portion of IRA assets
comes from employer-sponsored
plans. As of 2001 IRA assets stood
at $2.6 trillion.5
Retirement Plans Overview
Based on our estimates (which
assume single-digit market returns
in 2002 and 2003), asset levels in
both DB and DC plans will continue
to grow at modest rates through
2003. Continuing the trend of the
past two decades, DC and IRA assets
are expected to grow at a faster rate
than DB assets.
As of 2001 there were about 80 mil-
lion workers participating in private
sector retirement plans (see chart 6,
second panel). A worker may be in
multiple plans, and so the actual
number of private sector workers cov-
ered by an employer-sponsored plan
is lower (see page 17). Of the private
sector workers in retirement plans,
about 70% of the total, or 57 million,
were in DC plans; about 30%, or 23
million, were in DB plans.
In 2001 there were more than
700,000 private sector DC plans,
compared with more than 50,000
DB plans (see chart 6, third panel).
Both in terms of active participants
and number of plans, DC plans
are expected to continue to grow,
while DB plans are expected to
stagnate or continue their historical
decline, albeit at a much slower
rate than in the past.
Part 1 Retirement Plans and the U.S. Workforce
4 Data through 1998 is drawn from DOL retirement
plans data, issued by the Pension Benefits and
Welfare Administration. Data for 1999 through
2003 is based on Vanguard estimates.5 While the percentage of IRA assets due to
employer rollovers is uncertain, 44% of IRA
account holders indicated that a portion of their
IRA assets are derived from an employer-
sponsored retirement plan. See ICI, 2002.
6. Retirement Plans Overview 2001–2003
2001Private Sector 2002 2003
AnnualGrowth
Rate
4%7%
5%
6%
0%4%
2%
–1%4%
4%
8%6%6%8%
1,894 2,166
4,060
2,602
23,000 57,100
80,100
52,000 736,000
788,000
1,603 45,900 70,600
392,800
$ $
$
$
$
1,951 2,275
4,226
2,732
22,900 58,900
81,800
51,000 765,500
816,500
1,706 47,700 73,400
424,200
$ $
$
$
$
2,044 2,457
4,501
2,951
22,800 61,200
84,000
50,500 796,100
846,600
1,867 51,500 79,200
458,200
$ $
$
$
$
Assets ($ billions)Defined BenefitDefined Contribution
Total
IRA Assets
Participants (thousands)Defined BenefitDefined Contribution
Total
PlansDefined BenefitDefined Contribution
Total
401(k) Plans* 401(k) Assets ($ trillions) 401(k) Participants (thousands) 401(k) Eligibles (thousands)** 401(k) Plans
* 401(k) data is subset of defined contribution data. ** 401(k) eligibles are estimated based on weighted participation rate of 65%. Source: Vanguard estimates; Department of Labor; Federal Reserve. 2002 and 2003 forecasts based on balanced index market return of 5% in 2002 and 8% in 2003.

Although they are already included
in the totals for DC plans, we have
separately estimated assets, partici-
pants, and 401(k) plans (see chart 6,
bottom panel). In 2001, 401(k) assets
stood at $1.6 trillion. Out of an esti-
mated 70 million workers eligible
for 401(k) plans, nearly 46 million
were active participants in their plans.
And the total number of 401(k)
plans approached 400,000.
By several measures, 401(k) plans
are now the dominant form of DC
retirement plan, more significant than
traditional DC plans such as stand-
alone profit-sharing, money purchase,
or employee stock ownership plans
(ESOPs). Today, 401(k) plans
account for:
• More than half of all DC plans.
• Nearly three-quarters of all DC
plan assets.
• More than 80% of all DC
plan participants.
Perhaps most significantly, 401(k)
plans now account for nearly 40%
of all private sector retirement plan
assets, DB and DC combined—a
total of $1.6 trillion in 401(k) plans
versus a combined $4.1 trillion in
all DB and DC plans.
Assets
Since 1985 DC plan assets have
grown at more than twice the rate
of DB plan assets (see chart 7).
DC plan assets have expanded at an
11% annualized rate, compared with
a 5% growth rate for DB plan assets.
Much of the growth in DC assets
has come from 401(k) plans, which
have surged at a compound rate
of 16% per year since 1985.
Similarly, IRA assets grew at double-
digit rates during the same period,
(see chart 8) expanding from $236
billion to $2.6 trillion since 1985.
This reflects an annualized growth
rate of 16% per year.
Part 1 Retirement Plans and the U.S. Workforce
7. Plan Assets 1985–2001
Assets of Private Sector Retirement Plans (in billions)
DB +5% per year
DC +11% per year
401(k) +16% per year
1985
1986
1987
1988
1989
1990
1991
1992
1993
1994
1995
1996
1997
1998
1999
2000
2001
Note: 401(k) is a subset of defined contribution data.Source: Department of Labor through 1998; Vanguard estimates thereafter.
$0
$500
$1,000
$1,500
$2,000
$2,500
8. IRAs 1985–2001
IRA Assets (in billions)
Source: Federal Reserve and Vanguard estimates.
$0
$500
$1,000
$1,500
$2,000
$2,500
$3,000
1986
1985
1987
1988
1989
1990
1991
1992
1993
1994
1995
1996
1997
1998
1999
2000
2001
IRAs +16% per year

Participants
Since 1985 DC plan participants have
grown from 33 million to 57 million,
a compound growth rate of about 3%
per year (see chart 9). Within this
category, 401(k) plan participants
have expanded at a 10% growth rate.
In 1985 3 in 10 DC plan participants
were in 401(k) plans; by 2001, nearly
8 in 10 were. The number of DB
plan participants fell from 29 million
in 1985 to 23 million in 2001—
a decline of 1% per year over the
period. This in part reflects the
shift in employment away from sec-
tors, such as manufacturing or the
government, where DB plans have
traditionally predominated.
Plans
Similar patterns are reflected in the
changing number of DB, DC, and
401(k) retirement plans (see chart
10). The number of DB plans has
fallen from more than 170,000 in
1985 to about 52,000 in 2001.
Meanwhile, the number of DC plans
has grown, and in particular 401(k)
plans have expanded at double-digit
rates. In 1985 only 6% of DC plans
were 401(k) plans; by 2001, more
than half were.
Part 1 Retirement Plans and the U.S. Workforce
9. Plan Participants 1985–2001
Private Sector Active Retirement Plan Participants (in thousands)
DB –1% per year
DC +3% per year
401(k) +10% per year1985
1986
1987
1988
1989
1990
1991
1992
1993
1994
1995
1996
1997
1998
1999
2000
2001
Note: 401(k) data is a subset of defined contribution data.Source: Department of Labor through 1998; Vanguard estimates thereafter.
0
10,000
20,000
30,000
40,000
50,000
60,000
10. Plans 1985–2001
Number of Private Sector Retirement Plans
DB –7% per year
DC +3% per year
401(k) +17% per year
1985
1986
1987
1988
1989
1990
1991
1992
1993
1994
1995
1996
1997
1998
1999
2000
2001
Note: 401(k) data is a subset of defined contribution data.Source: Department of Labor through 1998; Vanguard estimates thereafter.
0
200,000
400,000
600,000
800,000

Coverage is the term used to describe
the number of workers eligible for,
and participating in, an employer-
sponsored retirement savings plan. It
is an important measure of the success
of the U.S. retirement savings system,
as the system relies on employment-
based retirement plans and private
savings to supplement benefits from
the Social Security system.
The term “pension coverage” is still
widely used, though it is now some-
thing of an anachronism given the
shift away from DB plans (pensions)
to DC plans (savings plans) over
the past quarter century. In this sec-
tion we summarize retirement plan
coverage both currently and histori-
cally, and offer some perspective
on how coverage varies across the
U.S. workforce.
Given that nearly 8 in 10 jobs are
in the private sector, our focus is on
private sector wage and salaried
workers (excluding the self-employed).
Pension coverage rates for the
public sector, as we note below, are
comparable to those found among
large private employers. Our analysis
addresses coverage rates, the number
of active workers covered by a private
plan—as opposed to sponsorship
rates, the number of employers
offering a retirement plan.6
Current coverage
According to our own estimates based
on historical data from the U.S.
Department of Labor, 49% of private
sector salaried and wage workers
were participating in a retirement
plan in 2001, and 51% were not
(see chart 11).
The dominant type of retirement
plan is a DC plan. More than 4 in 10
private sector workers participate in
a DC plan—28% participate solely
in a DC plan, and another 15% are
in both a DB and DC plan. In terms
of DB coverage, about 2 in 10 private
sector workers have such coverage—
6% of workers have only a DB plan,
and, again, 15% have both a DB
and a DC plan.
Part 1 Retirement Plans and the U.S. Workforce
6 The plan sponsorship rate, the percentage of
employers offering a retirement plan to workers, is
generally higher than plan coverage rates by more
than ten percentage points. The sponsorship rate
indicates only whether an employer has established
a retirement plan, regardless of eligibility rules or
participation by the employee. The coverage rate
reflects the actual number of employees who are
eligible for a plan and who are covered by it
(including, in voluntary 401(k) plans, those who
actually participate in the plan).
11. Current Private Sector Coverage 2001
15% DB and DC
Source: Department of Labor, 2001; Vanguard estimates.
51% Not covered
28% DC only% DC only
6% DB only
Retirement Plan Coverage

Historical coverage
Over the past quarter century, pen-
sion coverage has remained virtually
unchanged, at just under half of the
private sector workforce, despite
the dramatic shift from DB to DC
plans (see chart 12). In 1975 the
dominant form of pension plan cover-
age was DB-only. For 31% of the
private workforce, the only type of
retirement plan offered was a DB
plan. Another 8% of workers had
both DB and DC plans. At that time,
only 6% of private sector workers
were covered by DC-only plans,
which at the time did not include
401(k) plans.
With the introduction of 401(k)
plans in the early 1980s, coverage
by DC plans soared. The number
of workers covered by DC-only plans
nearly quintupled, from 6% to 28%
of the private sector workforce.
And the number of dual-coverage
participants—those covered by both
DB and DC plans—nearly doubled,
from 8% to 15%. Meanwhile,
coverage by stand-alone DB plans
declined sharply, from 31% to 6%
of the workforce.
In simple terms, over the past quarter
century, the rates of DB and DC
coverage have essentially traded
places. In 1975 about 4 in 10 private
sector workers (39%) had DB plan
coverage, either as a stand-alone DB
plan or in combined DB-DC cover-
age. By 2001, DC plans covered more
than 4 out of 10 (43%) workers.
In 1975, DC plans covered less than
2 out of 10 (14%) private sector
workers; by 2001, DB plans covered
2 in 10 workers (21%). The dominant
type of DC plan changed as well,
away from standalone profit-sharing
and ESOP programs to 401(k) plans,
sometimes in combination with
profit-sharing or ESOP features.
Part 1 Retirement Plans and the U.S. Workforce
12. Historical Private Sector Coverage 1975–2001
Percentage of Coverage
DB Only DC Only
DB and DC
1975
1977
1979
1981
1983
1985
1987
1989
1991
1993
1995
1997
1999
2001
Source: Department of Labor, 1999; Vanguard estimates.
5%
10%
15%
20%
25%
30%
35%

Variations in coverage
Pension coverage depends on a num-
ber of employment-related factors
(see chart 13). These include firm
size, employment sector, employee
skill grade, and the type of work
arrangement (full-time, part-time,
alternative). As a general rule,
coverage rates are higher among:
• Public sector and large private
sector firms.
• Manufacturing, transportation, pub-
lic utilities, and financial services.
• Professional/technical employees
and union members.
• Full-time workers.
At the other extreme, coverage
rates are lowest among small firms,
among sectors like construction and
retail sales, and among part-time,
on-call, temporary, and independent
contract workers.
Part 1 Retirement Plans and the U.S. Workforce
13. Variations in Coverage 1999
Percentage of Private Sector Salary and Wage Workers Participating in an Employer Retirement Plan—by Economic FactorOverall Average: 48%
Firm Size/Type* SectorType of Employees
Work Arrangement
Above-average coverage
Near-average coverage
Below-average coverage
Very large firms (81%)Public sector (80%)Large firms (70%)
Medium firms (57%)
Small firms (34%)
Manufacturing (68%)FIRE (62%)**Transportation and public utilities (59%)
Wholesale trade (53%)Services (45%)
Construction (39%)Retail trade (30%)
Full-time (56%)
Contract workers (48%)***R
On-call workers (31%)***Part-time (21%)Temp help (8%)***Independent contractors (2%)***
Union (79%)Professional/technical (69%)
Clerical/sales (45%)R
Blue collar/service (42%)
Economic Factor (Coverage Rate)
* Very large firms: 2,500 or more employees; large firms: 500–2,499 employees; medium firms: 100–499 employees; small firms: 1–99 employees. ** Finance, insurance, and real estate sector. *** 2001. Note: Below- and above-average defined as more than 10% below- or above-average. Source: Department of Labor, 1999, 2001.

Another way to look at variations
in pension coverage is by the
demographic characteristics of
workers (see chart 14).7 Not surpris-
ingly, workers who are older, have
average or above-average incomes,
or who have college or professional
training are more likely to be in jobs
with retirement plans. Meanwhile,
younger workers with low incomes
and less education are less likely
to be in jobs with retirement plans.
Coverage among women and men is
about equal—although, importantly,
this figure only measures those women
in the formal workforce. Because
more women than men work in the
home and fall outside the employ-
ment-based pension system, the
pension coverage rate for women in
the aggregate is lower than that for
men. White workers have somewhat
higher rates of coverage than black
workers or other races; perhaps the
most significant disparity is the low
rate of coverage for Hispanic workers.
Part 1 Retirement Plans and the U.S. Workforce
7 This demographic analysis is based on the public
and private sector workforce that is full-time and
full-year, age 18 to 64. Because full-time and public
sector employees have high rates of coverage, the
average coverage rate for this group is 61%. This
figure is used to make comparisons of above- and
below-average coverage.
14. Demographic Variations in Coverage 1999
Percentage of Public and Private Workers, Full-time and Full-year, Participating in an Employer Retirement Plan—by Demographic FactorOverall Average: 61%
Age Income Education
Race
Above-average coverage
Near-average coverageV
Below-average coverage
Age 45–54 (72%)Age 55–64 (68%)
Age 35–44 (61%)Age 25–34 (54%)V
Age 21–24 (33%)Age 20 and under (17%)
$50K+ (82%)$40–$49K (78%)$30–$39K (70%)
$20–$29K (50%)
$15–$19K (38%)$10–$14K (26%)
Gender
Male (61%)Female (60%)
White (65%)Black (56%)Other (55%)
Hispanic (38%)
Graduate/professional (81%)Bachelor’s degree (72%)
Some college (62%)High school (55%)
Less than high school (32%)
Demographic Factor (Coverage Rate)
Note: Below- and above-average defined as more than 10% below- or above-average. Source: Department of Labor, 1999; EBRI, 1999.

Boosting plan coverage
These statistics convey some of the
challenges involved in boosting cover-
age rates and strengthening the role
of employer-based plans in the U.S.
retirement savings system. For exam-
ple, small businesses (companies with
less than 100 employees) employ
more than 4 out of 10 private workers
in the U.S. But only a third or so of
small businesses are able to offer an
employer plan. Surveys of business
owners indicate that there are two
main reasons why they don’t offer a
retirement plan—uncertain company
revenues and workers’ preferences
for wages.8
When an employer offers an employ-
ee-voluntary program like a 401(k)
plan, coverage rates will also depend
on workers’ decisions to join the plan.
Retirement plan coverage is lower for
workers who are younger, who have
less income, or who are less educated.
One reason is that these workers are
more likely to be in jobs that lack
retirement plan coverage. But another
reason is that workers may choose not
to participate—whether because of
low income and an inability to save,
or a lack of understanding or aware-
ness of the plan and its benefits.
There are two challenges to boosting
private pension coverage in the
U.S.: encouraging firms, particularly
medium- and small-sized businesses,
to take on the costs of plan sponsor-
ship; and, in the case of voluntary
programs like 401(k) plans, encouraging
workers, particularly lower-income
workers, to take on the costs of
contributing to their plan.
Part 1 Retirement Plans and the U.S. Workforce
8 EBRI, 2002.

Another way to examine the U.S.
retirement savings system is from the
perspective of the benefits paid today
to older Americans. In 2001 more
than 35 million Americans—about
12% of the population—were age 65
or older. Not all of these individuals
were “retired” in the traditional
sense—that is, individuals who had
left their primary occupation. But age
65 remains a traditional demarcation
point between the active workforce
and the retired population in the U.S.
In this section we look at the current
incomes of those age 65 and older
in 2000. This data is drawn from
an analysis conducted by the Social
Security Administration based on
a survey by the U.S. Census Bureau.9
Sources of income
Social Security remains the most
prevalent form of income earned
by older Americans. Nine out of 10
older Americans received benefits
under the program in 2000, the latest
year for which data is available
(see chart 15). Six out of 10 older
Americans reported income from
their personal savings; about 4 in 10
said they received income from an
employer retirement plan, both public
and private sector. About 1 in 5
older Americans had salary or wages
from work.
Two caveats about these results:
First, with the shift from DB to DC
plans, the distinction between person-
al savings and employer plans has
become blurred. The category
“employer plans” includes pension
payments received from a DB plan.
But it may not capture DC plan
savings, depending on how the indi-
vidual replied to the Census Bureau
survey. Workers who roll over DC
plan savings (or DB lump sums)
to IRAs may classify these monies
as savings. Thus, the finding that
4 out of 10 older Americans receive
money from an employer plan may
refer largely to DB pension payments
and some, but not all, DC monies.
Part 1 Retirement Plans and the U.S. Workforce
15. Income Sources for Older Americans in 2000
Percentage of Older Americans Receiving Income from a Given Source
90%
5%
22%
41%
4%
59%
SocialSecurity
Personal Savings
EmployerPlans
Veterans’Benefits
PublicAssistance
WorkEarnings
Source: Social Security Administration, 2002.
Source
0%
20%
40%
60%
80%
100%
9 See Social Security Administration, 2002. This data
is based on Social Security “aged units”—married
couples with at least one member 65 and older or
single individuals age 65 and older. Throughout
this section we use informal terms like “older
Americans” or “households age 65 and older”
instead of the more technical “aged units.”
The Incomes of Older Americans

Second, this survey includes all
Americans 65 and older, whether they
are working or retired. So, for an item
like “work earnings,” the results shown
include individuals still in the work-
force, as well as individuals who con-
sider themselves retired, but who also
have chosen to work in retirement.
Shares of income
Another way to look at retiree income
is to examine the total income earned
in aggregate by all older Americans
(see chart 16). Social Security again
tops the list, accounting for about 4
out of every 10 dollars of income paid
to individuals age 65 and over. Work
earnings represent nearly a quarter
of total income. Both income from
savings and retirement plans amount
to nearly a fifth each.
Income distribution
Social Security is the dominant
source of income for lower-income
households, while higher-income
households rely on multiple sources
(see chart 17 on page 24). In 2000
the bottom quintile of households,
ranked by income, earned less than
$9,000 per year; the second quintile
earned from $9,000 to $15,000.
For both groups, Social Security
accounted for 82% of their incomes.
For the middle-income group, with
income from $15,000 to $24,000 in
2000, Social Security was still a domi-
nant source of earnings, accounting
for 64% of income. But more than
one-third came from other sources—
including employer plans (16%), per-
sonal savings (9%), and work earnings
(7%). In the fourth quintile—those
older Americans earning $24,000 to
$40,000—Social Security accounted
for less than half (46%) of income.
Employer plans provided nearly
a quarter of income (23%). Personal
savings and work earnings were
also important sources of income.
The top-income segment—those
earning more than $40,000 in 2000—
was unique because of the dominance
of work earnings, which accounted
for 35% of total income. Personal
savings were the second most impor-
tant source of income (24%), with
employer plans and Social Security
making up the balance (19% each).
Part 1 Retirement Plans and the U.S. Workforce
16. Components of Total Income in 2000P
Percentage of Total Income, Age 65 and Older, from Source
38% Social Security
23% Work earnings
18% Employer plans
18% Personal savings
Source: Social Security Administration, 2002.
3% Other

The role of Social Security
Social Security is the sole retirement
income for about one-third of older
Americans, accounting for 90% to
100% of their total income (see chart
18). In fact, for 1 in 5 recipients,
Social Security is their entire income.
Another one-third of Social Security
recipients derive the majority of their
income from Social Security; Social
Security ranges from 50% to 89% of
their income. Slightly more than a
third rely on Social Security for less
than half of their income.
The future of Social Security
In 2001 Social Security covered a
total of 153 million workers for both
old-age and disability benefits. Nearly
39 million individuals received old-
age income benefits under the pro-
gram. The average annual retirement
payment equaled about $10,100.
Social Security retirement benefits
are designed to replace about 40%
of the average American’s preretire-
ment income. This level of benefit is
about half that paid by the public
systems in continental Europe, but
on par with programs in the United
Kingdom, Canada, Australia, and
the Netherlands.
Social Security faces a well-documented
financial crisis because of demograph-
ics. The system is largely financed on
a “pay as you go” basis, meaning that
taxes on current workers are used to
pay benefits to current retirees. As the
baby boom ages, there will be a surge
in the number of Social Security
recipients, but a much smaller growth
in the number of workers paying
taxes to the system. Today there are
3.4 workers paying taxes for every
Social Security recipient; by 2030,
when the baby boom is retired, there
will be 2.1 workers for each retiree.
Part 1 Retirement Plans and the U.S. Workforce
17. Income Distribution for Older Americans, 2000
Percentage of Income from Various Sources, by Income Quintiles
Social Security
Work Earnings
Top 20%
Fourth 20%
19% 19% 24% 35% 3%
Employer Plans
Other
Personal Savings
Source: Social Security Administration, 2002.
0% 20% 40% 60% 80% 100%
46% 23% 13% 14% 4%
Middle 20%
Second 20%
Bottom 20%
64% 16% 9% 7% 4%
82% 7% 5% 3% 3%
82% 3%3%
1% 11%
18. Role of Social Security, 2000P
Percentage of Older Americans Deriving Given Percent of Income from Social Security
100% of income: 20%
90–99% of income: 11%
50–89% of income: 33%
Source: Social Security Administration, 2002.
Less than 50% of income: 36%
The trustees of the Social Security
system estimate that the system
will be fiscally insolvent by 2041.
At that point, to restore financial
health, benefits would need to be
reduced by about 30%, or tax rates
increased by half, in order to maintain
benefits. Possible reform strategies
include combinations of benefit
reductions, tax increases, or the
greater use of prefunded investments
(whether invested centrally or
through individual private accounts).
Today Social Security accounts for
half or more of income for 6 out of
10 older Americans. Regardless of the
direction taken by reform proposals,
Social Security is likely to remain
an essential component of retirement
income for the baby boom generation.
The role of work earnings
For many Americans age 65 and older,
work earnings are a modest source of
income used to supplement Social
Security, employer plans, and personal
savings. As noted above, only 2 in 10
households age 65 and older report
that they receive work earnings.
For the baby boom generation
contemplating its retirement, work
is expected to play an increasingly
important role in financing retirement
income needs, especially if Social
Security benefits are not as generous.
One popular notion is the idea of
“phased retirement” or “bridge jobs”—
of not ending all work at retirement,
but instead moving from a primary
occupation to other type of work.
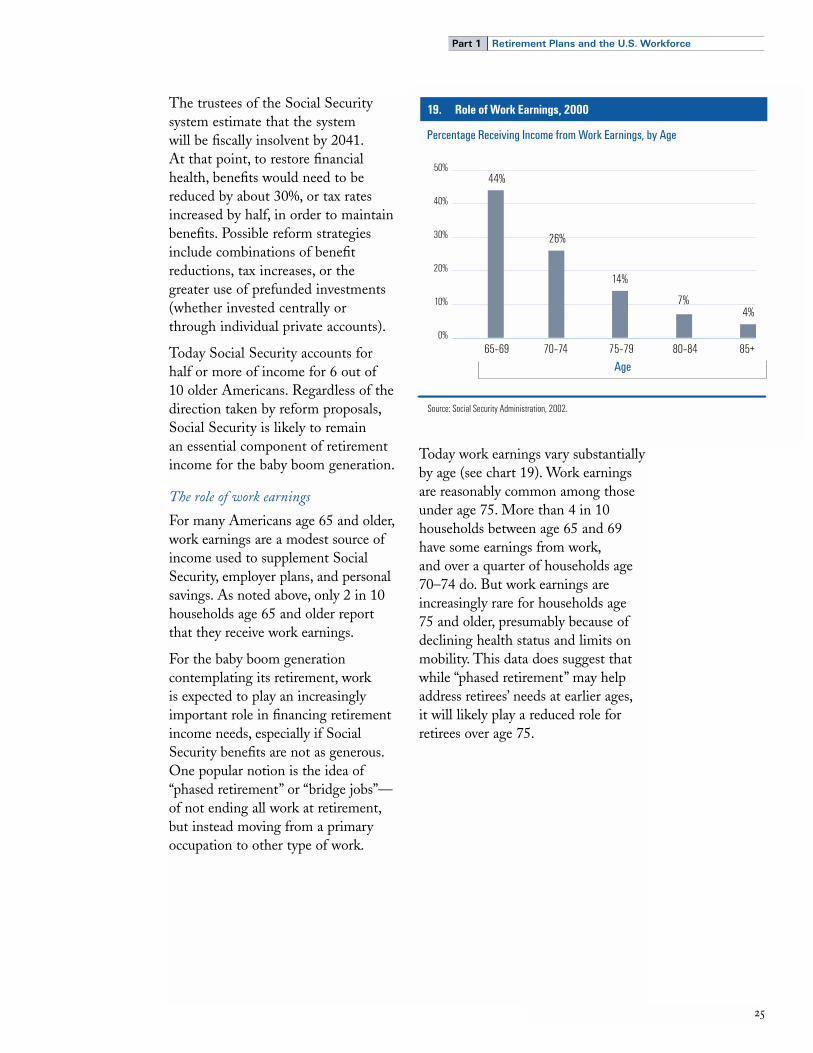
Today work earnings vary substantially
by age (see chart 19). Work earnings
are reasonably common among those
under age 75. More than 4 in 10
households between age 65 and 69
have some earnings from work,
and over a quarter of households age
70–74 do. But work earnings are
increasingly rare for households age
75 and older, presumably because of
declining health status and limits on
mobility. This data does suggest that
while “phased retirement” may help
address retirees’ needs at earlier ages,
it will likely play a reduced role for
retirees over age 75.
Part 1 Retirement Plans and the U.S. Workforce
19. Role of Work Earnings, 2000
Percentage Receiving Income from Work Earnings, by Age
44%
4%7%
14%
26%
65–69 70–74 75–79 85+80–84
Source: Social Security Administration, 2002.
Age
0%
10%
20%
30%
40%
50%

Vanguard Defined ContributionPlans: Current Features
P A R T T W O
Defined contribution plans have become the dominant type of retirement savings plan sponsored by private sector employers in the U.S. and a critical component of the U.S. savings system.

Over the past 20 years, both
participation and savings rates
in such plans have grown.
Participants today hold high
allocations to equity investments
in pursuit of their long-term
retirement goals. DC plans in
the United States offer a com-
prehensive range of services—
including, for participants,
an array of investment choices,
financial educational materials,
and account access services.
The success of DC plans can
be measured in three key ways—
the rate at which employees
participate in their plan, the rate
at which they contribute to the
plan, and the way in which they
choose to invest their savings.
In this section we look at each
of these three metrics using data
from Vanguard’s universe of
DC recordkeeping clients.
In addition, we examine other
DC plan characteristics
using data from Vanguard
clients, including:
• Average and median
account balances.
• Investment options offered
by sponsors, and their use
by participants.
• Education and advice trends.
• Preretirement access to
savings via loans and in-
service withdrawals.
• Participant distribution
behavior when changing
jobs or retiring.

For plan sponsors and industry
providers, participation rates in DC
plans remain the most visible metric
of success. A number of factors drive
sponsor interest in participation rates:
• Employees perceive retirement
savings plans as a positive benefit,
and sponsors view savings plans as
an integral part of total compensa-
tion. Encouraging participation is
therefore a means of promoting
employee retention and loyalty.
• Under nondiscrimination testing
rules, sponsors must achieve ade-
quate participation by lower-paid
employees if higher-paid workers
are to take maximum advantage
of a 401(k) plan.
• DC plans are an ever-increasing
component of retirement wealth
for American workers. Sponsors
seek to encourage high participation
rates in an effort to promote
retirement security.
Among Vanguard DC plans with
a voluntary employee component,
the average plan participation rate
in 2001 was 76% (see chart 20).
This figure is comparable to other
industry-reported figures for average
plan participation rates.
At both the plan and participant
level, based on both Vanguard and
other industry sources, participation
rates dropped by 3% to 4% between
1999 and 2001. Although there have
been no formal studies on why rates
dropped, we suspect that it is the
result of two factors. First, the eco-
nomic slowdown in 2001 may have
caused some participants to exit
their plans because of economic wor-
ries.10 Second, strong stock market
returns in the late 1990s encouraged
workers to join their savings plans.
In the subsequent bear market, lower
stock returns may have discouraged
newly eligible workers from joining
their retirement savings plan.
Part 2 Vanguard Defined Contribution Plans—Current Features
20. Plan Participation RatesI
Unweighted Average Participation Rate
79% 76%83%80%
1999
Vanguard Profit Sharing/401(k) Council of America
2001
Source: The Vanguard Group, 2001; Greenwich Associates, 2001; Profit Sharing/401(k) Council of America, 2001a.
80% 74%
Greenwich Associates0%
20%
40%
60%
80%
100%
10 Note that participants laid off during the
economic slowdown would not have contributed to
the decline in participation rates, as laid-off workers
would be no longer eligible for plan membership
and so would be excluded from the participation
rate calculation. But currently eligible workers who
temporarily elect not to participate—because a
spouse was laid off or because of worries about
their own financial future—would contribute to
lower participation rates.
Participation Rates
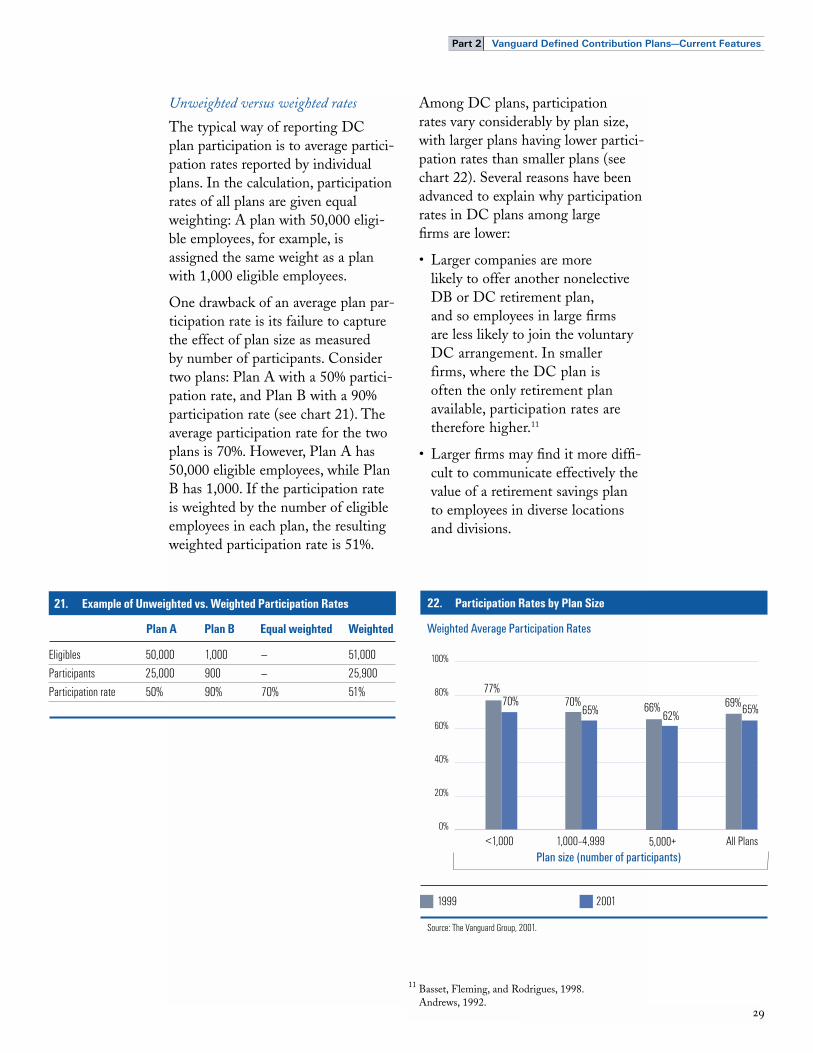
Unweighted versus weighted rates
The typical way of reporting DC
plan participation is to average partici-
pation rates reported by individual
plans. In the calculation, participation
rates of all plans are given equal
weighting: A plan with 50,000 eligi-
ble employees, for example, is
assigned the same weight as a plan
with 1,000 eligible employees.
One drawback of an average plan par-
ticipation rate is its failure to capture
the effect of plan size as measured
by number of participants. Consider
two plans: Plan A with a 50% partici-
pation rate, and Plan B with a 90%
participation rate (see chart 21). The
average participation rate for the two
plans is 70%. However, Plan A has
50,000 eligible employees, while Plan
B has 1,000. If the participation rate
is weighted by the number of eligible
employees in each plan, the resulting
weighted participation rate is 51%.
Among DC plans, participation
rates vary considerably by plan size,
with larger plans having lower partici-
pation rates than smaller plans (see
chart 22). Several reasons have been
advanced to explain why participation
rates in DC plans among large
firms are lower:
• Larger companies are more
likely to offer another nonelective
DB or DC retirement plan,
and so employees in large firms
are less likely to join the voluntary
DC arrangement. In smaller
firms, where the DC plan is
often the only retirement plan
available, participation rates are
therefore higher.11
• Larger firms may find it more diffi-
cult to communicate effectively the
value of a retirement savings plan
to employees in diverse locations
and divisions.
Part 2 Vanguard Defined Contribution Plans—Current Features
11 Basset, Fleming, and Rodrigues, 1998.
Andrews, 1992.
21. Example of Unweighted vs. Weighted Participation Rates
Plan BPlan A Equal weighted Weighted
Eligibles
Participants
Participation rate
1,000
900
90%
—
—
70%
50,000
25,000
50%
51,000
25,900
51%
22. Participation Rates by Plan SizeI
Weighted Average Participation Rates
70%65%
69%65%
1999
1,000–4,999 All Plans
2001
Source: The Vanguard Group, 2001.
77%70%
<1,000
66%62%
5,000+0%
20%
40%
60%
80%
100%
Plan size (number of participants)

While the average plan participation
rate at Vanguard was 76% in 2001,
the weighted participation rate was
65%. One way to interpret these
different figures is that the average
employer is able to attract 3 out
of 4 eligible participants to join a
voluntary DC arrangement—i.e.,
the average plan participation rate is
76%. However, the average employee
across all plans is likely to join a
voluntary DC arrangement in 2 out
of 3 cases—i.e., the weighted plan
participation rate is 65%. The lower
weighted rate is due to the fact that
employees at larger firms are less
likely to join a voluntary DC plan.
As with the unweighted participation
rates, weighted participation rates
fell by 3% to 4% from 1999 to 2001
(see chart 23).
Participation by income and age
Participant rates also vary substan-
tially by income and age. Income
is a key determinant of participation
(see chart 24). Among low-income
employees earning less than $15,000,
about 1 in 5 (19%) employees
participate; among high-income
employees earning more than
$75,000, 9 in 10 (89%) participate.
Part 2 Vanguard Defined Contribution Plans—Current Features
23. Vanguard Unweighted vs. Weighted Participation Rates
Average Participation Rate
79%69%
1999
65%
76%
2001
Unweighted Weighted
Source: The Vanguard Group, 2001.
0%
20%
40%
60%
80%
100%
24. Participation Rates by Income
Weighted Average Participation Rate
19%
89%80%
67% 65%
47%
<$15,000 $15,000–$30,000
$30,001–$50,000
All>$75,000$50,001–$75,000
Source: The Vanguard Group, 2001.
Income
0%
20%
40%
60%
80%
100%

Age is also an important element in
the participation decision. Less than
1 in 3 employees under age 25
participate, while three-quarters of
participants between the ages of 55
and 64 join their employer’s savings
plan (see chart 25).
Defined contribution plans are
intended principally as a savings vehi-
cle for retirement. Along with plan
participation, a critical measure of
success is whether participants are
saving enough to fund an adequate
standard of living during retirement.
Vanguard participants are currently
saving an average of 7.2% of their
incomes in employer-sponsored DC
plans. The corresponding median
savings rate is 6%, meaning that half
of participants are saving above this
rate, and half below (see chart 26).
Both the average and the median
rates have fallen by a full percentage
point since 1999. As with participa-
tion rates, while no formal research
has been done on the reasons for
the decline, we believe that the eco-
nomic slowdown and poor stock
returns may have discouraged savings
behavior, particularly among newly
eligible employees.
Part 2 Vanguard Defined Contribution Plans—Current Features
25. Participation Rates by Age
Weighted Average Participation Rate
31%
75%
60%
75%
65%73%
60%
<25 25–34 35–44 55–64 65+ All45–54
Source: The Vanguard Group, 2001.
Age
0%
20%
40%
60%
80%
100%
Source: The Vanguard Group, 2001.
26. Savings Rates
8.31%
7%7.20%
6%
1999 20011999 20010%
2%
4%
6%
8%
MedianMean
Savings Rates

Distribution of savings rates
Savings rates among participants vary
widely around the average of 7.2%
and the median of 6%. One in 4
participants save between 5% and 6%
of salary. This may be due in part to
the fact that the most common
employer match is 50 cents for each
dollar contributed up to 6%. One in
10 participants saves 2% or less, while
2 in 10 participants save more than
10% of salary (see chart 27).
Demographic influences
As with participation rates, both
income and age are determinants of
savings rates. Not surprisingly, high-
income employees find it easier to
save than do low-income employees.
The most affluent save a median of
7% of income, while less affluent save
5% (see chart 28). This gap would be
greater if not for IRS dollar limits on
contributions ($11,000 in 2001); this
dollar cap effectively prevents very
high income households from saving
at higher percentage rates.
Besides income, savings rates vary
by age, with older workers not sur-
prisingly saving more than younger
workers (see chart 29).
Savings versus deferral rates
A participant’s savings rate measures the
actual contributions made by the partici-
pant in a given year divided by the
participant’s income. Calculating savings
behavior in this way provides the best
measure of actual economic savings.
Another method for calculating
savings behavior is to take an average
of participants’ deferral rates—the
rate at which participants are having
contributions deducted from their
pay. This figure is more readily calcu-
lated from recordkeeping systems
than savings rates. But the average
deferral rate is not a perfect measure
of savings behavior; in fact, it is more
reflective of anticipated or expected
rather than actual savings behavior.
Why would savings and deferral rates
differ? Participants may sign up for
a given deferral rate, but then reduce
or increase it during the year. Other
participants may be capped by IRS
dollar limits. Still others might
Part 2 Vanguard Defined Contribution Plans—Current Features
Source: The Vanguard Group, 2001.
27. Distribution of Savings Rates
Percentage of Participants
15% 16%14%
4%
9%–10% 11%–15% >15%7%–8%
27%
5%–6%
15%
3%–4%
9%
1%–2%
Savings Rates
0%
5%
10%
15%
20%
25%
30%
28. Savings Rates by Income
Median Savings Rate
5.71%
6.93%7.00%
6.00% 6.00%
5.00%
<$15,000 $15,000–$30,000
$30,001–$50,000
All>$75,000$50,001–$75,000
Source: The Vanguard Group, 2001.
Income
0.00%
2.00%
4.00%
6.00%
8.00%

receive additional income at year-end,
such as bonuses, which effectively
reduces their percentage savings rate.12
In 2001 the average Vanguard deferral
rate for participants contributing to
their plan was 8.1%, versus an average
savings rate of 7.2%. Vanguard defer-
ral rates typically run about a percent-
age point or so higher than average
savings rates.
Interestingly, for the first six months
of 2002, Vanguard average deferral
rates rose from 8.1% in 2001 to 8.3%
for the first six months of 2002. This
increase in savings behavior may
be the result of a number of factors,
such as improving economic condi-
tions or the impact of pension reform
legislation, which allows much higher
percentage-of-income contributions
to DC plans. Over time, measuring
actual savings rates as well as deferral
rates will help determine whether this
trend in savings behavior will persist.
A third factor in gauging the success
of a defined contribution plan is
whether participants are taking
appropriate levels of equity market
risk in pursuit of their long-term
goals. Despite the recent bear market
in U.S. stocks, participant equity
holdings are only marginally lower;
participants do not appear to have
significantly shifted their portfolios
away from the equity market over
the past two years.
Asset and contribution allocations
For the average plan, nearly two-
thirds of assets (63%) are invested
directly in equities (see chart 30).
This total includes both diversified
common stock funds and company
stock. If balanced and life-cycle
funds are included in the mix, 3 in 4
plan dollars (76%) are invested in
equity-linked investments, compared
with 78% in 1999.
Part 2 Vanguard Defined Contribution Plans—Current Features
29. Savings Rates by Age
Median Savings Rate
4.62%
6.18%
8.35%7.71%
6.00%6.00%5.84%
<25 25–34 35–44 55–64 65+ All45–54
Source: The Vanguard Group, 2001.
Age
0.00%
2.00%
4.00%
6.00%
8.00%
10.00%
30. Plan Asset AllocationP
Vanguard—Defined Contribution PlansTotal equity/balanced: 76%
49% Stock funds
18% Money market/stable value
6% Bond funds
13% Balanced funds
14% Company stock
Source: The Vanguard Group, 2001.
12 Average deferral and savings rates will also differ
because the two rates may be drawn from different
samples of participants.
Participant Investment Decisions
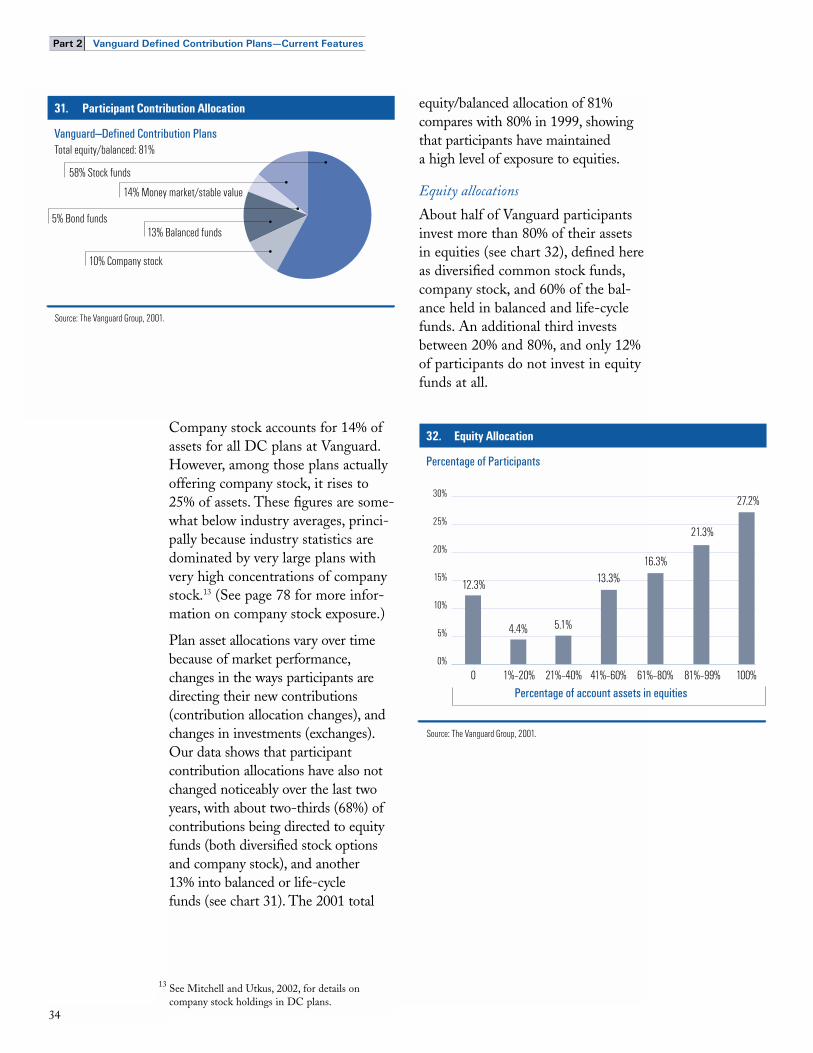
Company stock accounts for 14% of
assets for all DC plans at Vanguard.
However, among those plans actually
offering company stock, it rises to
25% of assets. These figures are some-
what below industry averages, princi-
pally because industry statistics are
dominated by very large plans with
very high concentrations of company
stock.13 (See page 78 for more infor-
mation on company stock exposure.)
Plan asset allocations vary over time
because of market performance,
changes in the ways participants are
directing their new contributions
(contribution allocation changes), and
changes in investments (exchanges).
Our data shows that participant
contribution allocations have also not
changed noticeably over the last two
years, with about two-thirds (68%) of
contributions being directed to equity
funds (both diversified stock options
and company stock), and another
13% into balanced or life-cycle
funds (see chart 31). The 2001 total
equity/balanced allocation of 81%
compares with 80% in 1999, showing
that participants have maintained
a high level of exposure to equities.
Equity allocations
About half of Vanguard participants
invest more than 80% of their assets
in equities (see chart 32), defined here
as diversified common stock funds,
company stock, and 60% of the bal-
ance held in balanced and life-cycle
funds. An additional third invests
between 20% and 80%, and only 12%
of participants do not invest in equity
funds at all.
Part 2 Vanguard Defined Contribution Plans—Current Features
31. Participant Contribution AllocationP
Vanguard—Defined Contribution PlansTotal equity/balanced: 81%
58% Stock funds
14% Money market/stable value
5% Bond funds13% Balanced funds
10% Company stock
Source: The Vanguard Group, 2001.
32. Equity Allocation
Percentage of Participants
12.3% 13.3%
21.3%
16.3%
27.2%
5.1%4.4%
0 1%–20% 21%–40% 61%–80% 81%–99% 100%41%–60%
Source: The Vanguard Group, 2001.
Percentage of account assets in equities
0%
5%
10%
15%
20%
25%
30%
13 See Mitchell and Utkus, 2002, for details on
company stock holdings in DC plans.

The percentage of participants with
more than 80% of their account in
equities has declined over the past
two years, from about 60% to less
than 50% of participants, in line with
the decline in the U.S. equity mar-
kets. Overall this appears to be the
result of two effects: falling stock
market values and modest shifts by
some participants out of equities and
into fixed income investments.
Total equity holdings remain fairly
constant across plan size (see
chart 33). However, among larger
plans there is a substitution of com-
pany stock holdings for diversified
equity funds. Large plans are much
more likely to offer company stock,
and when they do are also more
likely to restrict participants’
ability to diversify out of that stock.
(See page 78 for more information
on company stock exposure.)
Demographic influences
Participant income and age are key
factors influencing investment deci-
sions. Higher-income participants
take on somewhat more equity
market risk, while lower-income par-
ticipants do not. However, at least
among Vanguard clients, the differ-
ence in equity exposure by income
level is not dramatically different. In
2001 participants earning more than
$75,000 had an average of 73% of
assets invested in equities, while par-
ticipants earning less than $15,000
had 64% of account assets in equities
(see chart 34).
Part 2 Vanguard Defined Contribution Plans—Current Features
33. Asset Allocation by Plan Size
StockFunds
CompanyStock
BalancedFunds
TotalEquity
BondFunds
Number of participants
Money Market/Stable Value
<1,000
1,000–4,999
5,000+
All Plans
17%
20%
18%
18%
7%
5%
6%
6%
70%
68%
72%
71%
18%
15%
11%
13%
1%
7%
19%
14%
58%
52%
46%
49%
*Stock, company stock, and 60% of balanced funds. Source: The Vanguard Group, 2001.
Asset Allocation
*
34. Asset Allocation by Income
StockFunds
CompanyStock
BalancedFunds
TotalEquity
BondFunds
Income
Money Market/Stable Value
<$15,000
$15,000–$30,000
$30,001–$50,000
$50,001–$75,000
>$75,000
All (mean)
24%
25%
22%
19%
16%
18%
6%
6%
6%
5%
5%
6%
64%
63%
66%
70%
73%
71%
14%
14%
14%
14%
12%
13%
15%
13%
13%
14%
15%
14%
41%
42%
45%
48%
51%
49%
*Stock, company stock, and 60% of balanced funds. Source: The Vanguard Group, 2001.
Asset Allocation
*

Younger participants generally take
on more equity market exposure than
older participants (see chart 35).
(The data for participants under age
25 is an anomaly undoubtedly due to
a very small sample size.) As a whole,
participants appear to have taken the
“time diversification” principle to
heart—namely, the longer your time
horizon, the higher your commitment
to equities.
It remains a topic of debate as to how
older participants end up with more
conservative allocations. One explana-
tion is that, as they age, participants
gradually shift monies from equities
to fixed income. This is a common
financial education principle.
A second theory is the so-called
“demographic cohort” effect.
Participants of a given age belong to
a generational cohort, and that cohort
develops similar investment risk
preferences based on its shared life
experiences. In other words, younger
investors may hold more in equities
because of common generational per-
ceptions—e.g., greater awareness of
the returns of equities, the influence
of the bull market, greater acceptance
of risk-taking. Although research has
not resolved the debate between the
two theories, it’s likely that both fac-
tors—the lower risk tolerance of older
investors and common demographic
cohort experiences—play a role.
Part 2 Vanguard Defined Contribution Plans—Current Features
35. Asset Allocation by Age
StockFunds
CompanyStock
BalancedFunds
TotalEquity
BondFunds
Age
Money Market/Stable Value
<25
25–34
35–44
45–54
55–64
65+
All (mean)
21%
10%
12%
17%
24%
34%
18%
6%
4%
5%
6%
7%
9%
6%
64%
80%
79%
72%
64%
51%
71%
23%
12%
13%
13%
13%
13%
13%
9%
13%
15%
15%
13%
9%
14%
41%
60%
56%
49%
43%
34%
49%
*Stock, company stock, and 60% of balanced funds. Source: The Vanguard Group, 2001.
Asset Allocation
*

Defined contribution plan account
balances are important on two counts:
• Retirement savings adequacy.
Account balances measure how
much workers have accumulated
for retirement at their current
employer, and thus influence
an important policy question—
Are workers saving enough
for retirement?
• Economics of retirement providers.
Average balances are also of interest
to retirement services providers
and sponsors negotiating plan fees.
Most revenues for providers are
typically generated through asset-
based fees. The economics of
the retirement services business
is therefore directly linked to
average balances.
On both of these questions, current
DC plan balances only tell part
of the story. In the United States,
DC plans are not a closed system;
when employees change jobs or retire,
monies are frequently rolled over to
IRAs.14 As a result, because of job
changes, participants’ current balances
do not reflect lifetime DC savings.
Job changes are reasonably com-
mon—among Vanguard recordkeep-
ing participants, median plan tenure
is six years and median employment
tenure is ten years.
A complete analysis of retirement
savings adequacy must reflect not only
current DC plan balances, but also
Social Security, DB programs, IRAs,
and other assets held by workers.
(See page 73 for a discussion of retire-
ment savings adequacy.) Similarly, the
economics of DC service providers
depend not only on current DB plan
balances, but also on potential IRA
rollover assets arising when partici-
pants change jobs or retire.
Mean versus median balance amounts
Among Vanguard recordkeeping par-
ticipants, the average account balance
in 2001 totaled about $48,000 (see
chart 36). The median balance was
about $15,000, roughly one-third
of the average balance.
Part 2 Vanguard Defined Contribution Plans—Current Features
36. Account Balances
Account Balance
$14,676
$47,980
$15,360
$48,299
$0
$10,000
$20,000
$30,000
$40,000
$50,000
$60,000
Source: The Vanguard Group, 2001.
1999 20011999 2001
MedianMean
14 Nearly half of all IRA holders report that their
accounts include monies from employer retirement
plans. See ICI, 2002, p. 48.
Account Balances

During the recent decline in stock
prices, the average account holder
saw balances fall, as new contributions
were not adequate to offset market
losses on existing investments. The
median account holder, with a balance
of just more than $15,000, saw account
values rise as investment losses were
offset by new contributions.
These figures underscore the impor-
tance of differentiating between
the experiences of the average versus
the median participant in understand-
ing the impact of market volatility.
The wide divergence between the
median and the average balance is
due to a small number of very large
accounts, which significantly raise
the average (see chart 37). Mean-
while, more than 4 in 10 participants
have $10,000 or less in their
DC plan accounts.
Part 2 Vanguard Defined Contribution Plans—Current Features
37. Distribution of Account BalancesA
Percentage of Participants
<$10,000 $10,000–$20,000
$20,001–$40,000
$40,001–$60,000
$60,001–$80,000
$80,001–$100,000
>$100,000
2001
Account balances
1999
Source: The Vanguard Group, 2001.
0%
10%
20%
30%
40%
50%
42% 41%
14% 15% 14% 15%
8% 8%5% 5% 3% 3%
13%13%

Demographic influences
Among the factors influencing account
balances are participant income, age,
and plan tenure. These three factors
are intertwined. Not only do incomes
rise somewhat with age, making
saving more affordable—but older
participants generally save more as
they move closer to retirement. Also,
workers with long tenure in a plan
will contribute to higher balances
for a number of reasons. The longer
workers stay at their jobs, the more
likely they are to participate and save
in a retirement savings plan. Also,
their balances in their current plan
will be higher because they have
not recently changed jobs.
Higher account balances follow higher
incomes (see chart 38), with a signifi-
cant increase at the affluent end of
the scale. Balances for participants
earning more than $75,000 are almost
double those of participants earning
between $50,000 and $75,000.
Median balances follow a more
linear pattern, moving from just
less than $7,000 for low-income
participants to more than $31,000
for high-income participants.
Account balances also rise with
participants’ ages (see chart 39)
in a consistent manner.
Part 2 Vanguard Defined Contribution Plans—Current Features
38. Account Balance by Income
Account Balance
$27,241
$6,626
$46,611
$18,727
$47,980
$15,360
$80,193
$31,733$34,379
$12,605
$26,496
$8,225
<$15,000 $15,000–$30,000
$30,001–$50,000
>$75,000 All$50,001-$75,000
Income
$0
$20,000
$40,000
$60,000
$80,000
$100,000
Mean Median
Source: The Vanguard Group, 2001.
39. Account Balance by Age
Account Balance
$2,74
5$1
,393 $1
2,178
$5,9
78
$35,
514
$15,
812
$63,
695
$25,
940
$93,
571
$37,3
43
$117
,643
$41,9
11
$47,9
80$1
5,36
0
<25 25–34 35–44 45–54 55–64 65+ All
Median
Age
Mean
Source: The Vanguard Group, 2001.
$0
$20,000
$40,000
$60,000
$80,000
$100,000
$120,000

Finally, participants with higher
balances are also more likely to be
longer-tenured employees, having
seen both their income and their
balances grow over time (see
chart 40).
Plan sponsors have continued to
increase the number and type of
investment options available to
participants in an effort to encourage
diversified investment holdings.
However, participant usage of these
options, both in the number of funds
held and the type of investment
options chosen, has not kept pace.
Type of options offered
Virtually all Vanguard DC plans
offer a balanced array of investment
options covering four major invest-
ment categories: equities, bond
funds, balanced funds, and money
market/stable value options (see
chart 41 at right). Given the desire
of most sponsors to encourage partici-
pant holdings of equities for their
retirement goals, diversified equity
funds continue to be the most popular
type of funds offered. Equity offer-
ings typically include both indexed
and active U.S. stock funds, including
both large-capitalization and mid-
or small-capitalization stocks, as
well as one or more international
fund options.
Part 2 Vanguard Defined Contribution Plans—Current Features
40. Average Account Balance by Tenure
Average Account Balance
$6,0
31$6
,446
$9,6
85$9
,219
$16,
972
$15,
687 $3
3,21
3$2
9,26
7
$57,6
99$5
6,76
8
$97,2
03$1
01,7
59
$48,
299
$47,9
80
<1 1–3 4–5 6–10 11–15 >15 All
2001 Mean
Tenure in years
1999 Mean
Source: The Vanguard Group, 2001.
$0
$20,000
$40,000
$60,000
$80,000
$100,000
$120,000
Plan Investment Options and Decisions

Fifteen percent of plans offer company
stock as an investment choice.
(See page 78 for more information
on company stock holdings.)
Meanwhile, sponsor interest in bond
index and life-cycle funds has
increased by more than 12% each
over the last two years.
Interest in self-directed brokerage
accounts and mutual fund windows
has more than doubled over the past
two years, though the level of usage
remains low, with 7% of Vanguard
plans utilizing brokerage accounts or
windows. Self-directed brokerage
accounts allow participants to choose
investments from literally thousands
of individual stocks, bonds, and
mutual funds. Mutual fund windows
provide participants with access to
a large menu of mutual funds.
Part 2 Vanguard Defined Contribution Plans—Current Features
41. Type of Investment Options Offered
Vanguard Percentage of Plans Offering
Equity fundsActive domestic
Index domestic
Company stock
International
Balanced fundsTraditional balanced
Life-cycle options
Bond fundsActive
Index
Stable value/investment contract
Money market
Self-directed brokerage/ mutual fund window
Profit Sharing/401(k) Council of America
97%
95%
15%
90%
81%
40%
47%
73%
43%
75%
7%
77%
54%
21%
64%
61%
26%
60%
21%
32%
72%
14%
Source: The Vanguard Group, 2001; Profit Sharing/401(k) Council of America, 2001a.

Number of options offered
Sponsors continue to expand the
number of investment options offered
in DC plans, typically in response
to a small group of participants
seeking greater investment flexibility.
Today the average Vanguard plan
offers 14 investment options, up
from 12 options two years ago (see
chart 42). Sixty percent of plans
offer between 8 and 15 options,
while about 1 in 4 plans (22%) offer
more than 15 investment choices
to their participants.
With the U.S. bear market of the past
two years, surveys indicate that plan
sponsor interest in expanded choice
may be waning. As one example, Ford
Motor Company recently announced
that it was streamlining the investment
menu in its 401(k) plan, reducing
the number of options offered from
60 to 36. Among the concerns associ-
ated with increased investment choice
are the possibility for greater partici-
pant confusion; the need for addition-
al investment communications and
education; the worry that demand for
choice was driven more by short-term
market performance (e.g., the surge
in growth funds in the late 1990s);
and finally, the recognition that most
participants do not opt for additional
investment choices when they are
made available.
Number of options used
Participant use of investment options
has remained unchanged over the past
two years, despite an increase in the
number of options offered. The aver-
age participant holds 3 options, the
same number as in 1999, even as the
number of options offered grew
from 12 to 14. About half (44%) of
participants invest in only 1 or 2
options (see chart 43); nearly 9 in 10
hold 5 options or less. Only 13%
diversify their holdings with 6 or
more options.
Part 2 Vanguard Defined Contribution Plans—Current Features
42. Number of Options Offered
Percentage of Plans Offering
4.3%
30.6%
22.0%
31.8%
11.3%
1–4 5–7 8–10 16+
Mean number of options =14
11–15
Number of options
0%
5%
10%
15%
20%
25%
30%
35%
Source: The Vanguard Group, 2001.
43. Number of Options Used
Percentage of Participants
23.8% 24.7%
12.9%
18.6%20.0%
1 2 3 6+4–5
Number of options
0%0%
5%5%
10%10%
15%15%
20%20%
25%25%
Mean number of options used = 3
Source: The Vanguard Group, 2001.

Life-cycle funds in plans
Life-cycle funds are balanced portfo-
lios with varying risk/reward charac-
teristics. Plan sponsors offer these
funds to provide one-stop investment
decision-making to novice investors.
Forty percent of plans offer one or
more life-cycle funds, up from 28%
two years ago, and they account
for about 8% of average plan assets.
Participant usage has increased by
a small amount. Twenty-two percent
of participants offered a life-cycle
option select it, a 2% increase over
1999 (see chart 44). Of plans offering
life-cycle options, two-thirds have less
than 10% of their total assets invested
in them (see chart 45), showing no
change from two years ago.
Part 2 Vanguard Defined Contribution Plans—Current Features
44. Plan Use of Life-cycle OptionsAverage Recordkeeping Assets
Percentage of plans offering
Percentage of plan assets invested*
39.7%
7.7%
22.0%
39.2%
Percentage of participants using*
Percentage of participant account balances
0% 10% 20% 30% 40%
*In plans offering life-cycle options. Source: The Vanguard Group, 2001.
45. Life-cycle Use Across PlansW
Percentage of Plans
16%
6%9%
19%
50%
<5% 10%–14% 15%–19% >20%5%–9%
Source: The Vanguard Group, 2001.
Percentage of plan assets in life-cycle options
0%
10%
20%
30%
40%
50%
60%
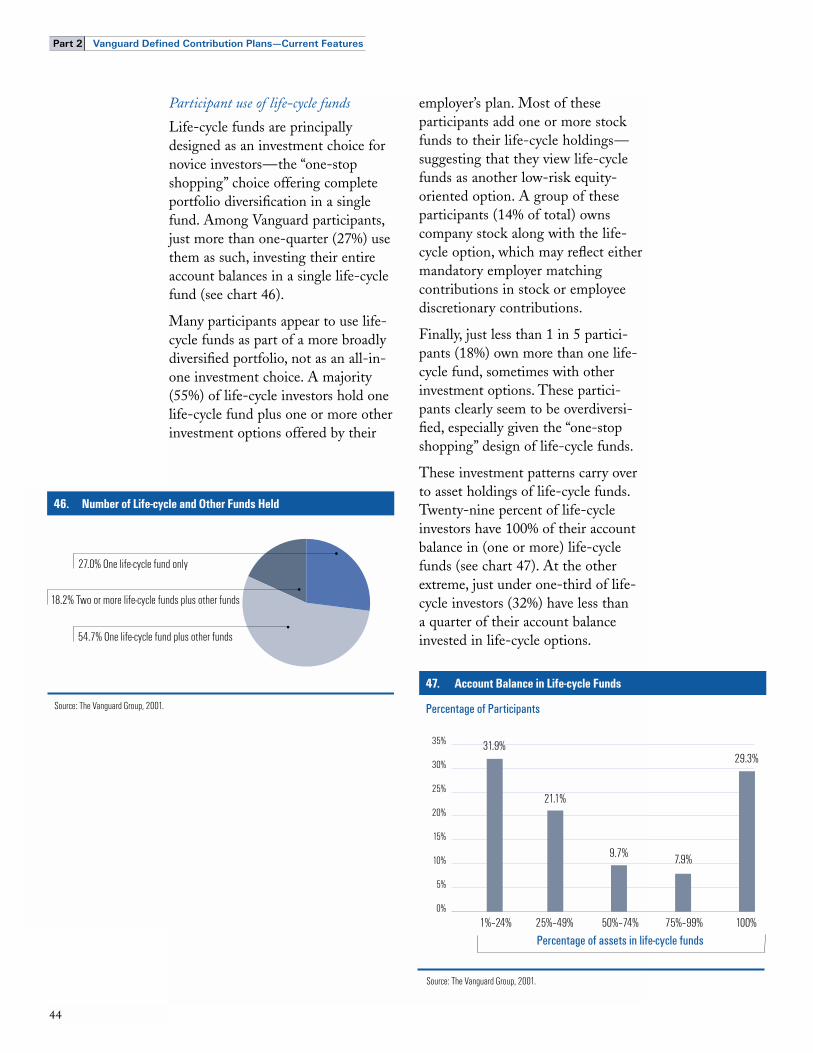
Participant use of life-cycle funds
Life-cycle funds are principally
designed as an investment choice for
novice investors—the “one-stop
shopping” choice offering complete
portfolio diversification in a single
fund. Among Vanguard participants,
just more than one-quarter (27%) use
them as such, investing their entire
account balances in a single life-cycle
fund (see chart 46).
Many participants appear to use life-
cycle funds as part of a more broadly
diversified portfolio, not as an all-in-
one investment choice. A majority
(55%) of life-cycle investors hold one
life-cycle fund plus one or more other
investment options offered by their
employer’s plan. Most of these
participants add one or more stock
funds to their life-cycle holdings—
suggesting that they view life-cycle
funds as another low-risk equity-
oriented option. A group of these
participants (14% of total) owns
company stock along with the life-
cycle option, which may reflect either
mandatory employer matching
contributions in stock or employee
discretionary contributions.
Finally, just less than 1 in 5 partici-
pants (18%) own more than one life-
cycle fund, sometimes with other
investment options. These partici-
pants clearly seem to be overdiversi-
fied, especially given the “one-stop
shopping” design of life-cycle funds.
These investment patterns carry over
to asset holdings of life-cycle funds.
Twenty-nine percent of life-cycle
investors have 100% of their account
balance in (one or more) life-cycle
funds (see chart 47). At the other
extreme, just under one-third of life-
cycle investors (32%) have less than
a quarter of their account balance
invested in life-cycle options.
Part 2 Vanguard Defined Contribution Plans—Current Features
46. Number of Life-cycle and Other Funds HeldP
27.0% One life-cycle fund only
18.2% Two or more life-cycle funds plus other funds
54.7% One life-cycle fund plus other funds
Source: The Vanguard Group, 2001.
47. Account Balance in Life-cycle Funds
Percentage of Participants
31.9%29.3%
7.9%9.7%
21.1%
1%–24% 25%–49% 50%–74% 100%75%–99%
Source: The Vanguard Group, 2001.
Percentage of assets in life-cycle funds
0%
5%
10%
15%
20%
25%
30%
35%

Company stock
Company stock is typically offered
as an investment option by larger DC
plans (see page 78). Company stock
holdings may arise through voluntary
employee contributions or through
employer contributions, which may be
in the form of 401(k) matching, profit-
sharing, or ESOP contributions.
As of 2001, only 15% of Vanguard
recordkeeping plans offered company
stock as an investment option.
However, because large plans are
more likely to offer company stock,
53% of Vanguard recordkeeping par-
ticipants had access to company stock,
and 31% held actual investments
in company stock.
Among Vanguard plans offering com-
pany stock, two-thirds had 20% or
less of plan assets invested in compa-
ny stock (see chart 48). The remain-
ing third had concentration levels of
more than 20%. The plans with the
higher levels of concentration tend to
be larger plans. Large plans are more
likely to offer employer matching or
other contributions in the form of
company stock; they are also more
likely to impose restrictions on diver-
sification of employer contributions
(see page 79).
Of the Vanguard participants with
access to company stock through their
plans, about 40% have no holdings in
company stock (see chart 49). These
are participants who have chosen not
to invest their own contributions in
company stock; also, they either have
no employer matching contributions
in stock, or are able to diversify
those contributions.
Another one-fifth or so of partici-
pants have up to 20% of their
account balance invested in company
stock. Just over 1 in 3 (36%) of
Vanguard participants have concen-
trated positions exceeding 20%
of account balances.
Part 2 Vanguard Defined Contribution Plans—Current Features
48. Company Stock Exposure for Plans
Percentage of Plans
67%
5%2%
7%
19%
1%–20% 21%–40% 41%–60% >80%61%–80%
Source: The Vanguard Group, 2001.
Balance of plan in company stock (%)
0%
10%
20%
30%
40%
50%
60%
70%
80%
49. Company Stock Exposure for Participants
Percentage of Participants
41%
5%8%
13%10%
22%
0% 1%–20% 21%–40% >80%61%–80%41%–60%
Source: The Vanguard Group, 2001.
0%
10%
20%
30%
40%
50%
Balance in company stock (%)

International funds
Although most plans offer interna-
tional funds, interest among partici-
pants is relatively low. Today less
than 20% of participants select the
option. When they do so, they invest
modestly, directing only 12% of their
assets to these funds (see chart 50).
The decline in exposure is likely
due to lower relative returns on
foreign stocks as well as a possible
decline in usage.
Part 2 Vanguard Defined Contribution Plans—Current Features
50. Use of International OptionsAverage Recordkeeping Assets
Percentage of plans offering
Percentage of plan assets invested*
11.8%
19.0%
2.8%
90.2%
Percentage of participants using*
Percentage of participant account balances
*In plans offering international options. Source: The Vanguard Group, 2001.
0% 20% 40% 60% 80% 100%

Exchange activity represents another
measure of participants’ investment
decision-making. Unlike a change in
their contribution allocation, where
participants decide to redirect future
contributions to the plan to other
investments, an exchange involves
moving currently invested monies
from one plan investment option to
another. Exchanges are a proxy for
participants’ holding period for
investments, as well as a measure of
their patience in pursuing long-term
financial goals.
This section summarizes data on
exchange activity for 2001. A longer-
term look at the trading behavior of
participants can be found on page 89.
Exchange provisions
Daily exchanges are nearly universal
for Vanguard DC plans, with almost
96% of plan sponsors allowing
them (see chart 51). Daily exchange
capabilities are made possible by the
daily valuation of investment assets,
which all Vanguard clients offer
and which is the norm in the record-
keeping industry.
Volume of exchanges
Exchange activity is associated with
only a small number of participants,
however. In 2001, 14% of Vanguard
participants exchanged money from
one investment option to another,
down from 17% in 1999. The majority
of participants made no investment
exchanges. Whether this is due to a
commitment to long-term investment
strategies, indecision in the face of the
bear market in U.S. stocks, or simple
inertia, most participants seem
inclined to make an investment deci-
sion and then stay put.
That said, participants who make an
exchange do move a large volume of
money. In 2001 the 14% of partici-
pants making exchanges moved 23%
of all DC recordkeeping assets at
Vanguard (see chart 52).
Part 2 Vanguard Defined Contribution Plans—Current Features
51. Exchange Provisions
Percentage of Plans
Less than quarterly
Frequency of exchanges permitted
Quarterly
0.3%
2.4%
1.6%
95.7%
Monthly
Daily
Source: The Vanguard Group, 2001.
0% 20% 40% 60% 80% 100%
52. Vanguard 2001 Exchange Activity
Total Participants
Participants making exchanges
$118 billion
2.3 million
Participants not making exchanges
Source: The Vanguard Group, 2001.
Average Recordkeeping Assets
0% 20% 40% 60% 80% 100%
0% 20% 40% 60% 80% 100%
77%23%
14% 86%
Exchange Activity
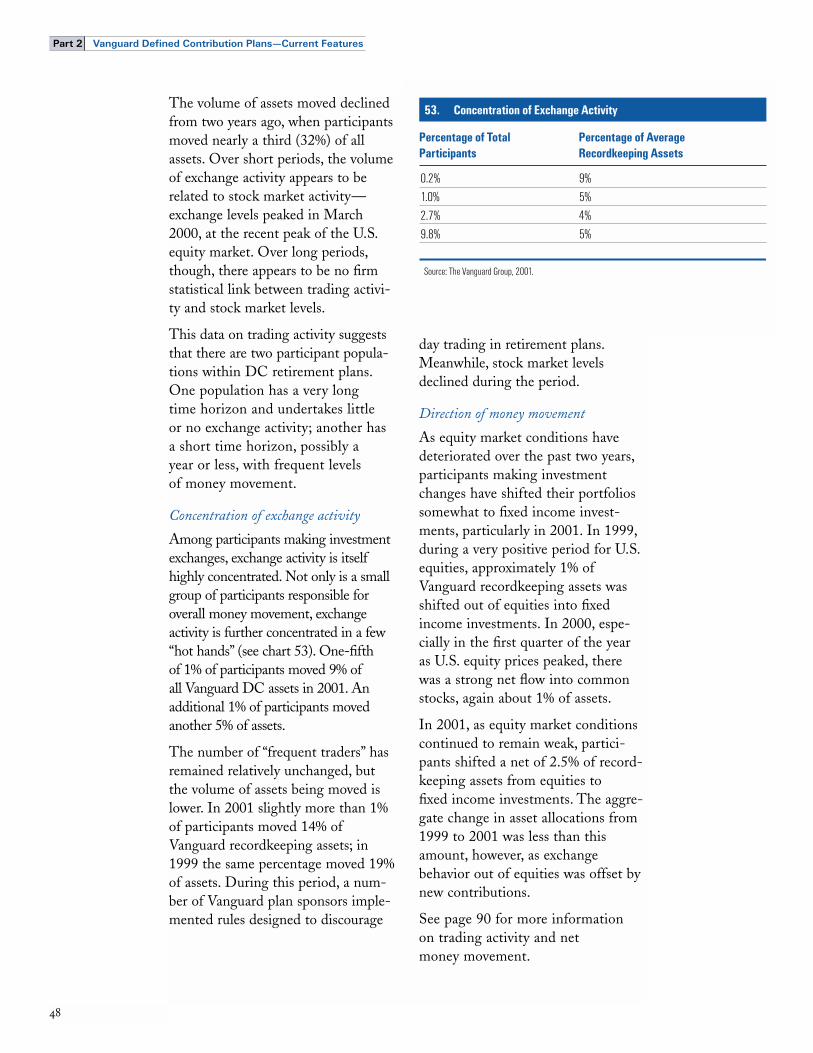
The volume of assets moved declined
from two years ago, when participants
moved nearly a third (32%) of all
assets. Over short periods, the volume
of exchange activity appears to be
related to stock market activity—
exchange levels peaked in March
2000, at the recent peak of the U.S.
equity market. Over long periods,
though, there appears to be no firm
statistical link between trading activi-
ty and stock market levels.
This data on trading activity suggests
that there are two participant popula-
tions within DC retirement plans.
One population has a very long
time horizon and undertakes little
or no exchange activity; another has
a short time horizon, possibly a
year or less, with frequent levels
of money movement.
Concentration of exchange activity
Among participants making investment
exchanges, exchange activity is itself
highly concentrated. Not only is a small
group of participants responsible for
overall money movement, exchange
activity is further concentrated in a few
“hot hands” (see chart 53). One-fifth
of 1% of participants moved 9% of
all Vanguard DC assets in 2001. An
additional 1% of participants moved
another 5% of assets.
The number of “frequent traders” has
remained relatively unchanged, but
the volume of assets being moved is
lower. In 2001 slightly more than 1%
of participants moved 14% of
Vanguard recordkeeping assets; in
1999 the same percentage moved 19%
of assets. During this period, a num-
ber of Vanguard plan sponsors imple-
mented rules designed to discourage
day trading in retirement plans.
Meanwhile, stock market levels
declined during the period.
Direction of money movement
As equity market conditions have
deteriorated over the past two years,
participants making investment
changes have shifted their portfolios
somewhat to fixed income invest-
ments, particularly in 2001. In 1999,
during a very positive period for U.S.
equities, approximately 1% of
Vanguard recordkeeping assets was
shifted out of equities into fixed
income investments. In 2000, espe-
cially in the first quarter of the year
as U.S. equity prices peaked, there
was a strong net flow into common
stocks, again about 1% of assets.
In 2001, as equity market conditions
continued to remain weak, partici-
pants shifted a net of 2.5% of record-
keeping assets from equities to
fixed income investments. The aggre-
gate change in asset allocations from
1999 to 2001 was less than this
amount, however, as exchange
behavior out of equities was offset by
new contributions.
See page 90 for more information
on trading activity and net
money movement.
Part 2 Vanguard Defined Contribution Plans—Current Features
53. Concentration of Exchange Activity
Percentage of Total Participants
Percentage of AverageRecordkeeping Assets
0.2%
1.0%
2.7%
9.8%
9%
5%
4%
5%
Source: The Vanguard Group, 2001.

Retirement savings communications
and education are essential to a suc-
cessful participant-directed defined
contribution plan. Through work-
place financial education, employees
learn why they should participate in
an employer retirement plan, how
they should invest, and how much
they’ll need to save to achieve their
financial goals.
Overall effectiveness
Education has a measurable and dra-
matic impact on participant behavior,
according to several academic and
industry studies. It is particularly
effective in boosting participation
and savings rates. Simply making
education available in the work-
place raises participation rates by
11.8% in absolute terms (see
chart 54). And when participants
actively engage in workplace educa-
tion programs, participation rates
rise 19.5%.
Education’s impact appears to be
strongest among low-balance partici-
pants. High-balance participants
already participate at a higher rate and
save more; the marginal impact of
education is therefore muted. High-
balance participants are also constrained
by IRS limits on their contributions,
and so are restricted in their ability to
change their savings behavior in
response to workplace education.
Besides increasing participation, edu-
cation also boosts savings rates (see
chart 55). With workplace education,
participants save more for retirement
and have higher retirement plan bal-
ances. They also have higher total
household savings rates. In essence,
through a spillover effect, workplace
education prompts participants to
take a comprehensive look at all of
their personal finances. This spillover
even affects spouses of nonhighly
compensated employees. Spouses of
participants with access to workplace
education have higher participation
and savings rates in their own
employer’s plan.15
Part 2 Vanguard Defined Contribution Plans—Current Features
0%
5%
10%
15%
20%
54. The Impact of Education on Participation
Increase in Participation Rate
11.8%
19.5%
Education available in workplace Education used by participants
Source: Bernheim and Garrett, 1996.
15 Bernheim and Garrett, 1996.
55. The Impact of Education on SavingsIncrease in Participation Rate
3.0%3.9%
6.0%
7.7%
$5,000
$7,508
No education
Retirement savings rate
Total household savings rate
Plan balances
With education
Source: Bernheim and Garrett, 1996.
0%
2%
4%
6%
8%
10%
$0
$2,000
$4,000
$6,000
$8,000
$10,000
Participant Education and Advice

The effectiveness of employee meetings
Group employee meetings are a par-
ticularly powerful medium for
employee education (see chart 56).
Even after accounting for differences
in plan features and other educational
offerings, group meetings were shown
to increase participation rates 12.1%
in absolute terms. Meetings also
boosted savings rates 1.1%—a gain
of 37% over the average savings rate
of 3% for nonhighly compensated
employees in this study.
Meetings are most effective among
nonhighly compensated employees.
For the highly compensated, the
impact of meetings, as with education
generally, is muted because of already
high participation and contribution
rates and IRS limits on contributions.
Employee “money attitudes”
Participants have different psycholog-
ical characteristics when it comes to
planning for their future and manag-
ing their retirement savings. They can
be classified into five segments rang-
ing from Successful Planners, who
have a strong interest in retirement
planning and in equity risk-taking,
to Live-For-Today Avoiders, who are
focused on current financial needs
and are uninterested in thinking
about the future. Each of these seg-
ments has different demands for
education, advice, and assistance,
and will react differently to the types
of communications offered and
messages delivered.
For more information on money
attitude segmentation and its role
in education programs, see page 83.
Part 2 Vanguard Defined Contribution Plans—Current Features
0%
3%
6%
9%
12%
15%
56. The Effect of Employee Meetings
Percentage Increase
12.1%
Increase in participation rates Increase in contribution rates
1.1%
Note: Nonhighly compensated employees only.
Source: Bayer, Bernheim, and Scholz, 1996.

Participant demand for education
There is a strong interest in, and
demand for, investment and retire-
ment education among participants.
Participants are most interested in
retirement planning, with more than
9 in 10 expressing a desire for addi-
tional education in this area (see
chart 57). Nearly 9 in 10 want more
details on company plan provisions.
Many are interested in advanced
investing or financial planning topics.
Advice is one of the most popular
education subjects. Eighty-nine
percent of participants are very or
somewhat interested in receiving rec-
ommendations on plan investments
(see chart 58).
Most participants also are seeking
additional “beyond the plan” financial
information on topics such as
IRAs, taxable investments, brokerage
accounts, and variable annuities,
up significantly from 1999.
Part 2 Vanguard Defined Contribution Plans—Current Features
57. Participant Education NeedsAverage Recordkeeping Assets
Very interested
Company plan details
Retirement planning
Personal financial information
Advanced investment information
Somewhat interested Not at all interested
Source: The Vanguard Group, 2001.
0% 20% 40% 60% 80% 100%
28% 9%
37% 11%
29% 33%
43% 19%
63%
50%
36%
36%
58. Participant Additional InterestsAverage Recordkeeping Assets
Very interested
Advice
IRAs
Taxable investment accounts
Brokerage accounts
Variable annuities
Somewhat interested Not at all interested
Source: The Vanguard Group, 2001.
0% 20% 40% 60% 80% 100%
6%80%
82%
66%
18% 14%68%
15% 11%74%
14%
6%12%
23% 11%

Within defined contribution plans, a
variety of account access services have
evolved to foster participant control
over plan savings and facilitate invest-
ment decisions. Yet despite the avail-
ability of phone, voice-response, and
Web-access channels, most partici-
pants have very little or no interaction
with their plan savings in a given year.
A minority of participants is actively
engaged in managing their accounts.
For this group, improved technology
and near-universal Internet access
have dramatically accelerated the use
of the Web as an access method.
Frequency of account access
In 2001 nearly half of plan partici-
pants never contacted Vanguard
regarding their plan investments
(see chart 59), a level unchanged
from 1999. For these participants,
quarterly investment statements,
mailed automatically, were the
sole method for reviewing plan bal-
ances and investments.
Three in 10 participants are infre-
quent contactors. They contact
Vanguard an average of 4 times per
year, whether through a telephone
associate, an interaction with a voice-
response unit, or via the Internet.
Almost a quarter of participants are
frequent contactors. They contact
Vanguard through all channels an
average of 38 times per year, an
average of more than 3 times per
month. (Although this level of con-
tact may seem quite high, keep in
mind that with the Internet, a
brief look at fund prices or account
balances constitutes a distinct and
separate contact.)
Contact behavior is influenced
primarily by account balances
(see chart 60). The larger a partici-
pant’s balance, the more likely the
participant will be proactive about
obtaining information from
Vanguard. The balance for frequent
contactors is nearly two-and-a-
half times as high as the balance
for noncontactors.
Part 2 Vanguard Defined Contribution Plans—Current Features
59. Account Access FrequencyP
47.8% Noncontactors
22.4% Frequent contactors
29.8% Infrequent contactors
Source: The Vanguard Group, 2001.
60. Demographics of Contactors
Balance Age Years
In Plan Married Male Income
>$75,000
Noncontactors
Infrequent contactors
Frequent contactors
All participants
36.2%
36.3%
45.3%
38.2%
61.3%
62.3%
74.7%
64.6%
70.4%
79.8%
77.4%
72.1%
7.2
7.6
9.0
7.7
43.6
43.3
44.7
43.6
$43,534
$59,903
$105,213
$62,211
Source: The Vanguard Group, 2001.
PercentageMean
Access Methods and the Internet

Frequent contactors share a number
of similar demographic characteris-
tics. Compared with the general par-
ticipant population, they are more
likely to be high-income, high-bal-
ance, male participants. Based on
recordkeeping data, this finding is
similar to results from a Vanguard
national survey of plan participants, in
which affluent, educated male partici-
pants, typically in professional or
executive positions, were more likely
than others to actively track the stock
market and transact in their retire-
ment accounts.16
Types of account access
Participants rely on three channels
for access to their accounts: toll-free
telephone calls to service associates,
automated voice-response systems,
and the Internet. When measured
in terms of total participant usage
per channel, telephone contact with
a service associate remains the most
widely used. During 2001, 4 in 10
participants who contacted Vanguard
about their employer’s plan used a
service associate (see chart 61).
Automated voice-response systems
were second in popularity, the
Web third.
But when measured in terms of num-
ber of total contacts, the Internet
predominates. Web interactions
accounted for 40% of all participant
contacts, with an average of 27
web interactions per year.
Internet access and usage
Most Vanguard DC plan participants
now have access to the Internet,
either at home or at work. In 2001,
85% reported having access to the
Internet either through home,
work, or both (see chart 62). This
is an increase over 1999, when
3 in 10 participants reported no
access to the Internet. Of those with
Internet access, 20% report visiting
Vanguard.com® for plan-related finan-
cial information at least once a week.
Part 2 Vanguard Defined Contribution Plans—Current Features
61. Account Access MethodsIncrease in Participation Rate
42%
25%14% 13%
40%47%
17.7
2.9
27.4
Telephone associate
Percentage ofparticipants using
Percentage ofcontacts
Mean numberof contacts
InternetVoice-response unit
Source: The Vanguard Group, 2001.
0%
20%
40%
60%
80%
100%
0
5
10
15
20
25
30
16 See Vanguard, 2002a.
62. Participant Access to the InternetP
50% Both at home and at work
11% At work
Source: The Vanguard Group, 2001.
24% At home
15% Do not have access
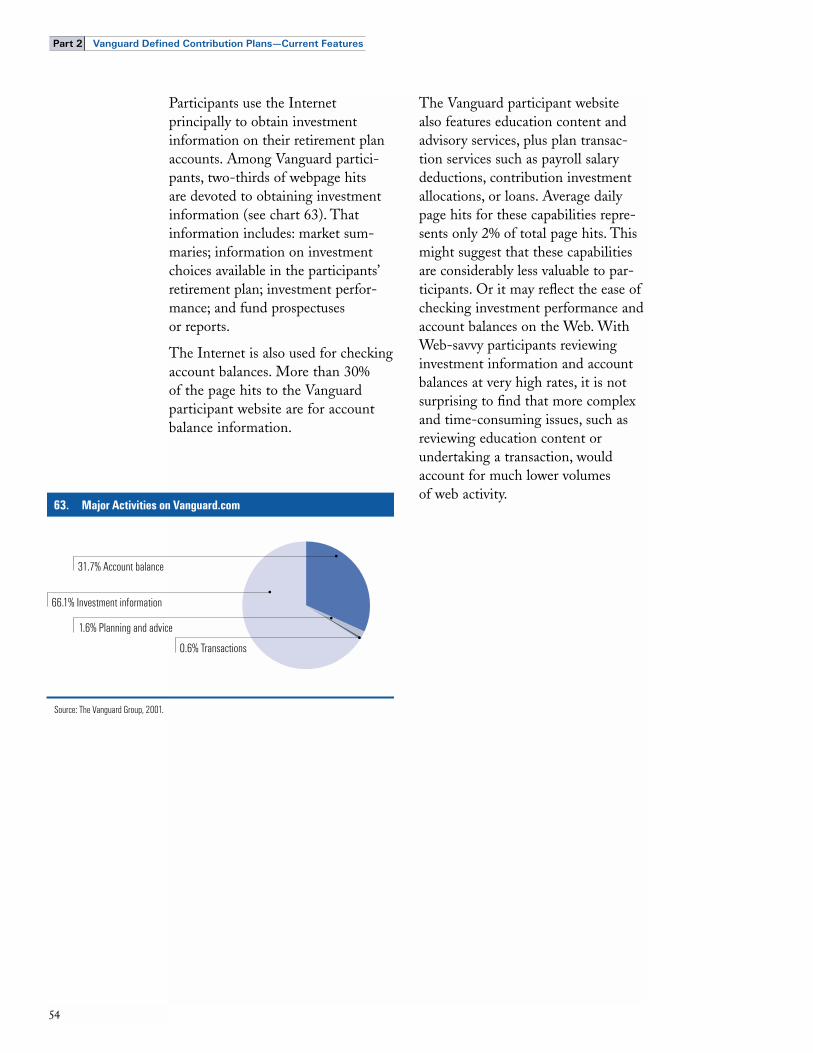
Participants use the Internet
principally to obtain investment
information on their retirement plan
accounts. Among Vanguard partici-
pants, two-thirds of webpage hits
are devoted to obtaining investment
information (see chart 63). That
information includes: market sum-
maries; information on investment
choices available in the participants’
retirement plan; investment perfor-
mance; and fund prospectuses
or reports.
The Internet is also used for checking
account balances. More than 30%
of the page hits to the Vanguard
participant website are for account
balance information.
The Vanguard participant website
also features education content and
advisory services, plus plan transac-
tion services such as payroll salary
deductions, contribution investment
allocations, or loans. Average daily
page hits for these capabilities repre-
sents only 2% of total page hits. This
might suggest that these capabilities
are considerably less valuable to par-
ticipants. Or it may reflect the ease of
checking investment performance and
account balances on the Web. With
Web-savvy participants reviewing
investment information and account
balances at very high rates, it is not
surprising to find that more complex
and time-consuming issues, such as
reviewing education content or
undertaking a transaction, would
account for much lower volumes
of web activity.
Part 2 Vanguard Defined Contribution Plans—Current Features
63. Major Activities on Vanguard.comP
31.7% Account balance
1.6% Planning and advice
Source: The Vanguard Group, 2001.
66.1% Investment information
0.6% Transactions
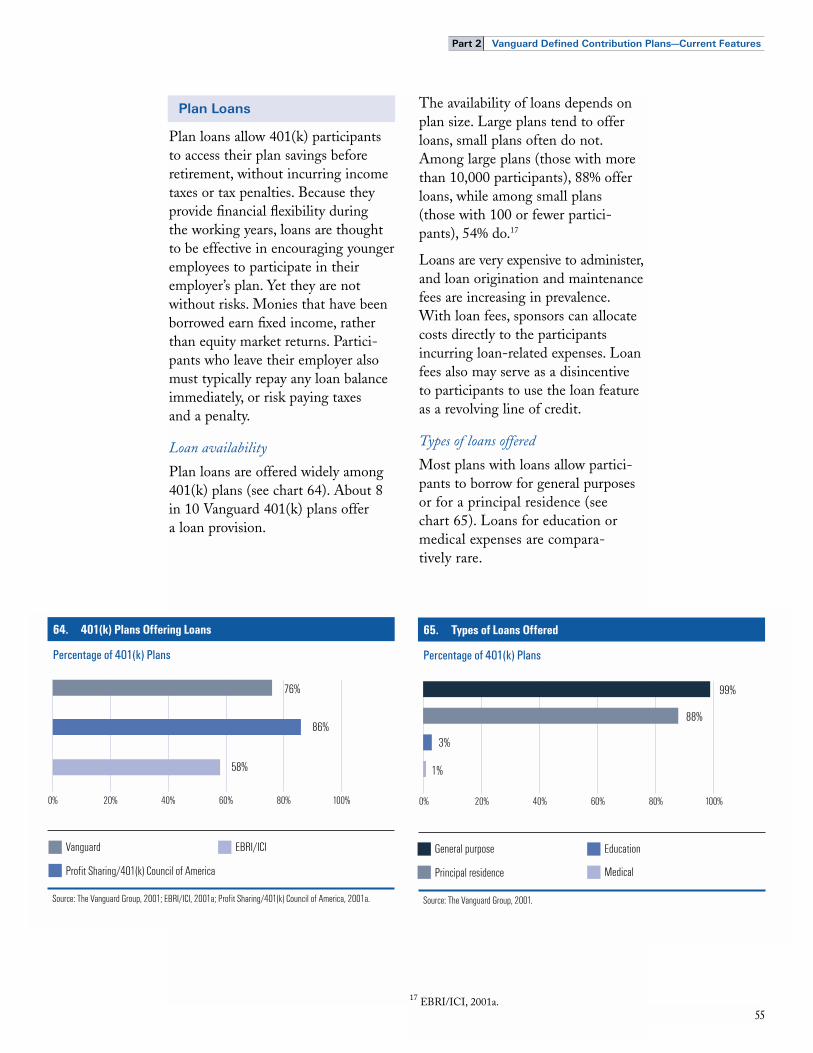
Plan loans allow 401(k) participants
to access their plan savings before
retirement, without incurring income
taxes or tax penalties. Because they
provide financial flexibility during
the working years, loans are thought
to be effective in encouraging younger
employees to participate in their
employer’s plan. Yet they are not
without risks. Monies that have been
borrowed earn fixed income, rather
than equity market returns. Partici-
pants who leave their employer also
must typically repay any loan balance
immediately, or risk paying taxes
and a penalty.
Loan availability
Plan loans are offered widely among
401(k) plans (see chart 64). About 8
in 10 Vanguard 401(k) plans offer
a loan provision.
The availability of loans depends on
plan size. Large plans tend to offer
loans, small plans often do not.
Among large plans (those with more
than 10,000 participants), 88% offer
loans, while among small plans
(those with 100 or fewer partici-
pants), 54% do.17
Loans are very expensive to administer,
and loan origination and maintenance
fees are increasing in prevalence.
With loan fees, sponsors can allocate
costs directly to the participants
incurring loan-related expenses. Loan
fees also may serve as a disincentive
to participants to use the loan feature
as a revolving line of credit.
Types of loans offered
Most plans with loans allow partici-
pants to borrow for general purposes
or for a principal residence (see
chart 65). Loans for education or
medical expenses are compara-
tively rare.
Part 2 Vanguard Defined Contribution Plans—Current Features
64. 401(k) Plans Offering LoansA
Percentage of 401(k) Plans
Vanguard
Profit Sharing/401(k) Council of America
76%
86%
58%
EBRI/ICI
Source: The Vanguard Group, 2001; EBRI/ICI, 2001a; Profit Sharing/401(k) Council of America, 2001a.
0% 20% 40% 60% 80% 100%
65. Types of Loans OfferedA
Percentage of 401(k) Plans
General purpose
Principal residence
99%
88%
3%
1%
Education
Medical
Source: The Vanguard Group, 2001.
0% 20% 40% 60% 80% 100%
17 EBRI/ICI, 2001a.
Plan Loans

Loan exposure and loan use
Fewer than 1 in 5 participants takes
a loan (see chart 66). On average,
participants taking a loan borrow
14% of their account balance. The
average loan amount in 2001 was
about $6,800, down somewhat from
$7,200 in 1999.
Loans are sometimes criticized as a
form of revolving credit for younger,
lower-income workers. While that
may be partly true, loan use is actually
more prevalent among workers in
their 30s and 40s—about 50% higher
than for workers in their 20s. For
example, 16% of Vanguard partici-
pants in their 40s have loans, while
only 8% of participants in their 20s
do (see chart 67).
Part 2 Vanguard Defined Contribution Plans—Current Features
66. Loan Usage
Percentage of Participants
Average loan amount
Percentage of participantswith loans
Percentage of participantbalances borrowed
$6,856
17%
14%
Source: The Vanguard Group, 2001.
$0 $2,000 $4,000 $6,000 $8,000 $10,000
Loan Amount
0% 5% 10% 15% 20%
67. Loan Usage by Age
Percentage of Participants With Loans
8%
15% 14%
20s 30s Average
16%
40s
13%
50s
7%
60s
Age
Source: The Vanguard Group, 2001.
0%
5%
10%
15%
20%
25%

While loan use is highest among par-
ticipants in their 30s and 40s, the
greatest financial exposure to loans—
expressed as a percentage of total
assets—is among participants in their
20s (see chart 68). These participants
average 27% of their account balance
as a loan, almost double the overall
percentage for all loan users.
This stands to reason, as participants
in their 20s typically have smaller bal-
ances. As a result, when they take a
loan, they are likely to have higher
loan exposure as a percentage of total
assets. But it also means that when
young participants change jobs,
which they are more likely to do, they
face a greater financial risk in either
repaying the loan immediately, or
incurring taxes and penalties on the
outstanding balance.
Demographics of loan users
How do loan users, accounting for
less than 1 in 5 participants, compare
with the other 4 in 5 participants who
do not take loans? Among Vanguard
participants, loan users and nonloan
users are the same age (43 years old
on average) and have virtually identi-
cal account balances (see chart 69).
Income is where they differ. Across
the board, loan users are more likely
to have lower incomes. In particular,
there are more loan users with
incomes under $75,000. Not surpris-
ingly, high-income households, those
with incomes above $75,000, are
less likely to use loans.
Part 2 Vanguard Defined Contribution Plans—Current Features
68. Loan Exposure by Age
Percentage of Account Balance in Loan
27%
21%
14%
20s 30s Average
15%
40s
11%
50s
9%
60s
Age
Source: The Vanguard Group, 2001.
0%
5%
10%
15%
20%
25%
30%
69. Demographics of Loan Users
Participants With Loans
Average Age
Average Account BalanceIncome Range<$15,000
$15,000–30,000
$30,001–50,000
$50,001–75,000
>$75,000
ParticipantsWithout Loans
43
$48,016
4.0%
10.2%
24.5%
29.8%
31.5%
43
$47,433
3.4%
8.8%
20.9%
27.0%
39.9%
Source: The Vanguard Group, 2001.

Multiple loans
Although 6 in 10 Vanguard 401(k)
plans allow only one loan per
participant, a number of plans allow
participants to have multiple out-
standing loans. Twenty-eight percent
of plans allow two loans, and
10% allow three or more loans (see
chart 70).
Offering additional loans does not
appear to affect the usage of loans.
The percentage of participants taking
loans ranges from 16% to 18% of
plan participants, whether one, two,
or three or more loans are offered.
The actual exposure to loans as a
percentage of account balances is also
basically unchanged—varying from
14% to 15% of account balances
(see chart 71).
What does vary are participants’
average balances and the value of the
loans they have taken. Plans that
offer more loans have the same usage
rate of loans, but they also have
higher average balances and higher
loan values outstanding. As a result,
the percentage exposure to loans is
similar to plans with only one loan.
Overall, plans that offer multiple
loans are plans with above-average
balances. These above-average bal-
ances may arise for several reasons—
the plan has been in existence for a
long time, the participants are long-
tenured employees, or the partici-
pants have high incomes or high sav-
ings rates. In these situations, it
appears that sponsors are more will-
ing to add additional loans. But in
aggregate, it seems additional loans
do not necessarily lead to higher loan
exposure—assuming that they are
only offered to participants with
higher average balances.
Part 2 Vanguard Defined Contribution Plans—Current Features
70. Number of Loans Allowed
Percentage of Plans
62%
28%
10%
1 2 3+
Number of loans
0%
10%
20%
30%
40%
50%
60%
70%
80%
Source: The Vanguard Group, 2001.
71. Loan Exposure by Number of Loans Allowed
Average loan amount
Average account balance
Percent of account balance in loan
1
$5,800
$39,600
15%
2
$7,400
$54,200
14%
3+
$8,100
$58,800
14%
Source: The Vanguard Group, 2001.
Number of Loans
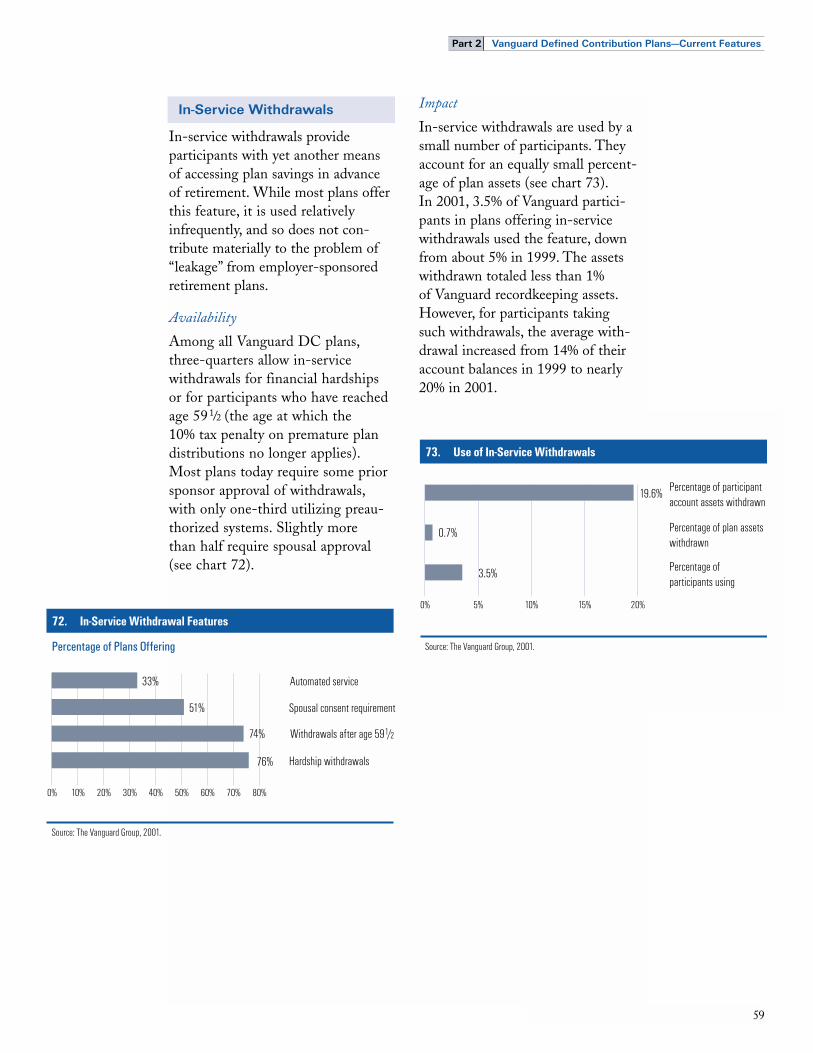
In-service withdrawals provide
participants with yet another means
of accessing plan savings in advance
of retirement. While most plans offer
this feature, it is used relatively
infrequently, and so does not con-
tribute materially to the problem of
“leakage” from employer-sponsored
retirement plans.
Availability
Among all Vanguard DC plans,
three-quarters allow in-service
withdrawals for financial hardships
or for participants who have reached
age 59 1/2 (the age at which the
10% tax penalty on premature plan
distributions no longer applies).
Most plans today require some prior
sponsor approval of withdrawals,
with only one-third utilizing preau-
thorized systems. Slightly more
than half require spousal approval
(see chart 72).
Impact
In-service withdrawals are used by a
small number of participants. They
account for an equally small percent-
age of plan assets (see chart 73).
In 2001, 3.5% of Vanguard partici-
pants in plans offering in-service
withdrawals used the feature, down
from about 5% in 1999. The assets
withdrawn totaled less than 1%
of Vanguard recordkeeping assets.
However, for participants taking
such withdrawals, the average with-
drawal increased from 14% of their
account balances in 1999 to nearly
20% in 2001.
Part 2 Vanguard Defined Contribution Plans—Current Features
72. In-Service Withdrawal FeaturesA
Percentage of Plans Offering
33%
1 2/
Automated service
51% Spousal consent requirement
Withdrawals after age 5974%
76% Hardship withdrawals
Source: The Vanguard Group, 2001.
0% 10% 20% 30% 40% 50% 60% 70% 80%
73. Use of In-Service WithdrawalsAverage Recordkeeping Assets
19.6% Percentage of participantaccount assets withdrawn
0.7% Percentage of plan assetswithdrawn
3.5% Percentage of participants using
Source: The Vanguard Group, 2001.
0% 5% 10% 15% 20%
In-Service Withdrawals

When changing jobs or retiring,
defined contribution plan participants
have the option of receiving their
plan savings in the form of a lump-
sum distribution. This money may
be rolled over to an IRA or other
qualified retirement plan, or it may
be spent. Participants can also keep
the money in their employer’s plan
if the value is more than $5,000.
Older or more affluent participants
tend to save their plan distributions.
However, among younger or lower-
balance participants, the spending of
plan savings—the problem of “leak-
age” from the retirement system—is a
significant concern. Participants who
spend their distribution face both
short-term and long-term costs. In
the short run, participants incur both
taxes and penalties on the amounts
spent. In the long run, because of the
lost opportunity for compound earn-
ings, they raise significantly the
amount they must save during the
rest of their working years.
In this discussion of distribution
behavior, we separately report on par-
ticipant behavior and the flow of
assets for each of these categories.
The calculations are based on several
simplifying assumptions, described
at the end of this section.
Participant and asset flows
Plan distributions occur reasonably
frequently as participants change jobs
or retire, and they represent a surpris-
ingly large portion of plan assets
and participants. In 2001, 12% of
Vanguard recordkeeping participants
became eligible for a plan distribution,
either due to a job change or retire-
ment. Their plan assets totaled 10%
of Vanguard recordkeeping assets.
Part 2 Vanguard Defined Contribution Plans—Current Features
74. Plan DistributionsP
By Percentage of Participants Choosing Option
32% Rollover
29% Remain in plan
1% Installment payments1% Rollover and cash
Source: The Vanguard Group, 2001.
36% Cash lump sum
56% Rollover
32% Remain in plan
2% Installment payments
10% Cash lump sum
By Percentage of Assets Distributed
Plan Distributions and Rollovers

For all participants eligible for a plan
distribution in 2001, 6 in 10
Vanguard participants chose to pre-
serve their savings by rolling over
their assets to an IRA or other quali-
fied plan, or remaining in their
former employer’s plan (see chart 74).
Nearly 4 in 10 participants chose to
take their distribution as a cash
lump sum. About 1% of participants
chose to split their distribution
between saving and spending.
In terms of assets, 88% of all plan
assets eligible for distribution were
preserved—either rolled over to an
IRA or other qualified plan, or left in
the former employer’s plan. Only 12%
of assets were distributed in cash
(usually as a lump sum, but infre-
quently as installment payments).
Another way to look at these statistics
is in terms of the participant and asset
flows out of DC plans. In 2001, of
the 12% of Vanguard participants eli-
gible for a lump sum, only 3% chose
to retain their assets in their employ-
er’s plan. Most participants left their
employer’s plan—4% of participants
rolled over assets to an IRA, and 4%
took a cash lump sum. (Participants
combining rollovers and lump sums,
or taking installment payments,
accounted for the remaining 1%).
In terms of the 10% of assets available
for distribution in 2001, the decision
still favored leaving the plan, but
by a smaller margin. A total of 6%
of assets left the employer plan—5%
of assets went to an IRA rollover,
and 1% was distributed in cash. The
remaining 4% of assets remained
in the employer plan.
Part 2 Vanguard Defined Contribution Plans—Current Features

Vanguard results appear to be more
positive than reported in other
sources. In one study, based on plan
data from the early 1990s, 28% of
participants completed a rollover,
accounting for 56% of assets (see
chart 75). Nearly 8 out of 10 partici-
pants took distributions in cash.
Cash lump sums were used for a vari-
ety of purposes—current spending,
transfer to a taxable savings account,
debt repayment, or education,
housing, health, and other purposes.18
Determinants of distribution behavior
Age has a significant impact on
distribution behavior. Younger partici-
pants are less likely to preserve their
retirement savings. For example,
during 2001 just less than half of
participants in their 20s (45%) rolled
over their distribution to an IRA or
kept it in an employer plan. But
three-quarters of participants in their
50s did so (see chart 76). In terms
of assets, participants in their 20s
preserved slightly more than two-
thirds of their assets in an IRA or
employer plan, while participants
in their 50s preserved 95%.
Part 2 Vanguard Defined Contribution Plans—Current Features
75. Uses of Plan Distributions
Percentage of Assets
Rollover SpendingSavings/other accountDebtEducation/health/businessHouse purchase/mortgage
Percentage of Participants
56.3%
13.2%
10.9%
7.5%
6.5%
5.6%
28.3%
28.8%
11.2%
17.3%
7.8%
6.6%
Source: Bassett, Fleming, and Rodrigues, 1998.
76. Plan Distribution Behavior by Age
Percentage of Participants Choosing
Rollover
Remain in plan
Cash lump sum
Installments
Rollover and cash
23%
22%
55%
0%
1%
20s
28%
29%
41%
0%
1%
30s
32%
32%
34%
0%
1%
40s
41%
34%
23%
1%
2%
50s
45%
28%
23%
2%
2%
60s
33%
14%
22%
26%
4%
70s
32%
29%
36%
1%
1%
Average
Percentage of Assets Distributed
Rollover
Remain in plan
Cash lump sum
Installments
40%
28%
32%
0%
20s
45%
40%
15%
0%
30s
47%
44%
9%
0%
40s
55%
40%
6%
0%
50s
59%
35%
6%
0%
60s
68%
21%
8%
4%
70s
53%
39%
8%
0%
Average
Source: The Vanguard Group, 2001.
18 Bassett, Fleming, and Rodrigues, 1998.
The same demographic factors that
drive participation and contribution
rates also appear to influence distri-
bution behavior. In general, those
who invest their DC savings are
more likely to be older, have higher
incomes, be better educated, or own
a home. Those who spend their dis-
tribution are likely to be younger,
have lower incomes, have less educa-
tion, and rent rather than own
their home.19
The problem of “leakage”
The consumption of DC plan savings
prior to retirement—the problem
of “leakage”—poses a significant
challenge for plan sponsors, providers,
and policy-makers. As this data illus-
trates, the problem is most acute
for younger participants with smaller
account balances. These dollars are
small in the aggregate, but have
significant implications for these
participants’ future standard of living.
Through compounding, these small
amounts, if invested over a lifetime,
are more powerful than larger
sums accumulated later in life.
By consuming—rather than saving—
their small account balances when
they are young, participants face a
higher savings burden throughout the
rest of their working lives. See page
73 for additional information on
savings adequacy.
A word on methodology
In analyzing plan distribution
behavior in this section, we report
separately on participant behavior
and the flow of assets for each of the
categories. The asset calculations are
based on the actual dollar figures. The
participant calculations, however, use
several simplifying assumptions.
First, a participant who terminated
employment during 2001 and was
still classified as vested at year-
end is considered a participant who
has kept his or her savings in
their employer’s retirement plan.
Subsequently, the participant may
choose to roll over the assets to an
IRA or cash them out.
Second, any participant who rolled
over pre-tax assets but was obliged to
take after-tax assets as a cash distri-
bution was considered a rollover par-
ticipant. Meanwhile, the assets are
allocated, respectively, to the rollover
and cash lump-sum category. Third,
in the case of a combination rollover
and cash distribution, participants
rolling over more than 80% of assets
were classified as rollover participants;
rolling over less than 20% of assets
as a cash lump-sum participant;
and between 20% and 80% of assets
as a combination rollover/lump-
sum participant.
Part 2 Vanguard Defined Contribution Plans—Current Features
19 Bassett, Fleming, and Rodrigues, 1998.

Insights and Strategies
P A R T T H R E E
Today defined contribution plans play an important role in the national debate over U.S. retirement savings. As part of abroader pension and tax reform effort in 2001, Congress expanded the tax benefitsgranted to DC plans. This new legislation further strengthened the role of these plans in the U.S. employer-sponsored retirement system.

At the same time, a two-year
slide in U.S. equity prices has
raised concern about the nature
of risk in DC plans and, in
particular, participant reaction
to that risk. The stock market
decline, the most severe in a
quarter century, has not led
to widespread selling of stocks
by participants. But it has
prompted a debate over the role
of employer-versus-employee
risk-taking, the nature of retire-
ment guarantees, and the relative
merits of DB plans versus DC
plans. Perhaps most significantly,
the market decline highlighted
the risks associated with high
levels of company stock in the
DC plans of several well-known
companies, including Lucent
and Enron.
The decline in stock prices
has had another, possibly
beneficial effect—increasing
national interest in the adequacy
of retirement savings in the
U.S. Several years of negative
market returns have challenged
the belief that the capital
markets alone can be counted
on to deliver adequate retire-
ment savings. With current
returns posting in the negative,
and future returns likely to be
more modest, savings behavior
is now at center stage.
With renewed national focus
on savings rates, and the current
attention to diversification,
investment education, and
participant trading activity,
we examine five topics relevant
to DC plans:
• Boosting participation and
savings rates.
• How much should workers
save for retirement?
• The nature of restrictions
on company stock.
• Workers’ “money attitudes”—
the psychological attitudes
and beliefs that influence
savings behavior.
• Trading activity—a look
at the participants who
do transact in their account
year-to-year.

Boosting plan participation and sav-
ings rates remain ongoing priorities
for many plan sponsors. Employees
attach a high value to 401(k) benefits;
as a result, raising plan participation is
often a means of enhancing employee
loyalty and retention. Some sponsors
also have strictly pragmatic concerns:
Under nondiscrimination testing,
highly compensated employees are
limited in their ability to save through
a plan if lower-paid employees do
not participate adequately. Finally,
many employers are concerned about
savings adequacy—whether their
employees are putting aside sufficient
savings for retirement.
As noted in our discussion of partici-
pation rates (see page 28), while the
average plan participation rate is 76%,
the participation rate weighted by
number of participants is 65%, mean-
ing that about 1 in 3 participants fails
to join his or her employer’s DC plan.
In addition, the Vanguard median
savings rate is 6%, meaning half of
participants contribute 6% or less to
their employer’s plan. According to
our calculations, that savings rate is
only adequate for lower-income
workers whose employer provides
another generous retirement benefit
on top of the voluntary DC plan
(see page 73).
In this section we describe factors
influencing participants’ savings
behavior—both the initial decision
to join, or participate, in a retirement
plan, as well as the decision to save
at a certain level. A wide range of
factors appears to be important in
participants’ decisions. These include
participant demographic features
such as age, income, education, and
job tenure; plan features such as
employer matching contributions
and loans; plan education and com-
munications; and social and peer
group effects in the workplace. To
address the problem of adequate
participation and savings, some
sponsors are considering new plan
features such as automatic enrollment
or automatic (so-called SMarT)
savings programs.
Demographic factors
For plan sponsors seeking to boost
plan participation and savings rates,
the difficulty of the task is a direct
function of the demographics of their
workforce. Both income and age are
important determinants in workers’
decisions about whether to participate
and save in an employer retirement
plan. But a host of other factors come
into play as well, including level
of education, job tenure, and other
savings and wealth—including home
ownership (see chart 77).
Part 3 Insights and Strategies
Boosting Participation and Savings Rates

In general, if an employer’s workforce
has large numbers of young, short-
tenured employees with lower
incomes and lower levels of educa-
tion, both participation and savings
rates are likely to be below average.
Sponsors with such employees will
have to make special efforts to boost
participation and savings rates.
But if the employer’s workforce is
comprised of older, long-tenure
employees, with higher-average
incomes and levels of education,
demographics are conducive to high
rates of plan participation and sav-
ings. Sponsors with such workforce
characteristics should find it easier to
encourage savings behavior among
their employees.
Plan features and size
An employer match is one of the
strongest inducements to plan
participation. About two-thirds of
participants cite matching contribu-
tions as an important reason for join-
ing an employer-sponsored savings
plan.20 Several researchers have like-
wise found a positive statistical
relationship between an employer
match and a plan’s participation rate.21
The evidence is mixed, however, on
whether participation rates are a func-
tion of the size of the match. Some
studies suggest that it is not the size
of the match, but the mere existence
of a match, that boosts participation.22
Plan loans (available in DC plans
with a 401(k) arrangement) provide
participants with financial flexibility
during the working years, and so are
thought to be effective in encourag-
ing plan participation.23 Loans
allow participants to use what is
effectively a retirement savings plan
for other financial objectives, includ-
ing the purchase of a car or home,
college expenses, or emergency
spending. Anecdotally, many plan
sponsors have found that adding a
loan feature encourages participation
among younger workers—although
only 1 in 5 participants cited a
loan feature as the top reason for
joining a plan.24
Part 3 Insights and Strategies
77. Demographic Influences on Plan Participation
Less Likely to Participate
Factor
More Likely to Participate
Low income
Younger
New to job
High school or less
Renter
Other retirement plan
IncomeAgeJob tenureEducationHome OwnershipEmployer plans
High income
Older
Long-term employee
College or more
Home owner
Only 401(k) plan
Source: Bassett, Fleming, and Rodrigues, 1998; Hinz and Turner, 1998; Clark and Schieber, 1998.
20 EBRI/ICI, 2000b.21 Andrews, 1992. Papke, 1995. Papke and Poterba,
1995. Clark and Schieber, 1998. Even and
MacPherson, 1999. Munnell, Sundén, and
Taylor, 2000.22 Bassett, Fleming, and Rodrigues, 1998.23 Munnell, Sundén, and Taylor, 2000.24 EBRI/ICI, 2000b.

Plan size also influences participation
rates, with large plans having lower
participation rates than small plans.
One reason may be that large
employers are more likely to offer
another nonvoluntary DB or DC
plan. As a result, employees have less
incentive to save on their own.
Another reason may be that larger
firms find it more difficult to commu-
nicate the benefits of voluntary retire-
ment savings; in a large organization,
the impact of benefits communica-
tions may be more diffuse than in
smaller firms.
The role of education
Research has shown that workplace
financial education has a measurable
and dramatic impact on participant
behavior. Education is particularly
effective in boosting participation and
savings rates. Simply making educa-
tion available raises participation rates
11.8% in absolute terms (see page
49). And when employees actively
engage in workplace education pro-
grams, participation rates rise 19.5%.
The impact of education appears to
be strongest among low-balance par-
ticipants. High-balance participants
already participate and save at higher
rates; the marginal impact of educa-
tion is therefore rather limited. High-
balance participants also are con-
strained by IRS limits on their contri-
butions, and thus are restricted in
their ability to increase their savings
behavior in response to workplace
education.
Besides increasing participation rates,
education also boosts savings rates
(see page 49). When workplace edu-
cation is offered, participants save
more for retirement and have higher
retirement plan balances. They also
have higher total household savings
rates. In essence, through a spillover
effect, workplace education prompts
participants to take a comprehensive
look at all of their personal finances.
This even affects the spouses of non-
highly compensated employees, as the
spouses of participants with access to
workplace education have higher par-
ticipation and savings rates in their
own employers’ plans.25
These beneficial effects of education
were calculated based on companies
offering traditional communications—
e.g., simple plan communications in
print and employee group meetings.
Today there are new techniques, such
as personalized communications,
either in print or electronic form,
which are employed to boost partici-
pation and savings rates.
Another new strategy is to reformu-
late retirement communications based
on employees’ attitudes and beliefs
about retirement and financial
planning—their “money attitudes.”
Workers differ materially in their
interest in, and enthusiasm for, many
aspects of financial and money
management. Understanding these
psychological and attitudinal differ-
ences may help improve workplace
financial education programs. (See
page 83 for more on money attitudes.)
Part 3 Insights and Strategies
25 Bernheim and Garrett, 1996. Bayer, Bernheim, and
Scholz, 1996.

Social and peer group effects
One new research finding is that
participation rates are influenced not
only by traditional economic factors,
but also by the social and peer group
dynamics within an organization.
Plan sponsors have known for some
time that having strong “plan advo-
cates” within a location or division
can often dramatically boost partici-
pation and savings rates. New
research corroborates this intuition
and suggests that peer group dynam-
ics play an important role for
two reasons26:
• Plan participation is a complex
matter, and relying on peer groups
is a good way to gather information
and make decisions.
• Peer groups lead to common
thinking. An individual may want
to mimic the behavior of the work
group he or she belongs to, whether
that behavior is positive (joining
the plan) or negative (steering
clear of it).
Sponsors seeking to boost participa-
tion will want to look at ways to alter
or enhance peer group dynamics.
The aim of education is not simply
to alter individual behavior, but also
group attitudes and beliefs.
Automatic enrollment
Automatic enrollment—the manda-
tory enrollment of eligible employ-
ees—has emerged in recent years as a
technique to boost plan participation
rates. Under automatic enrollment,
the employer enrolls newly eligible
employees (or all eligible employees)
in a default investment fund at a
default savings rate. The employee
retains the right to “opt out” of the
arrangement—hence automatic
enrollment is sometimes described
as “negative elections.”
An automatic enrollment feature has
been adopted by a small but growing
number of sponsors. Among
Vanguard’s 401(k) clients, less than
10% of large plans (those with more
than $100 million) have adopted the
feature. Anecdotally, clients remain
interested in exploring this option.
Immediate interest has waned some-
what during 2001, however, as a result
of the economic downturn; few spon-
sors are interested in adding to their
current benefits costs in the form
of higher matching contributions for
automatic enrollment.
In a July 2001 survey of 15 Vanguard
clients offering automatic enrollment,
two patterns emerged.27 Sponsors
typically set low default savings rates,
with most choosing a default rate of
3% or less. About one-quarter of plan
sponsors chose a default savings rate
of 4% or more. While 40% of plan
sponsors chose balanced or life-cycle
funds for their default investment
option, 60% of clients made conserva-
tive choices—typically money market
or stable value funds.
Part 3 Insights and Strategies
26 Duflo and Saez, 2000, 2002.
27 Vanguard, 2001b. See also Profit-Sharing/ 401(k)
Council of America, 2001b.
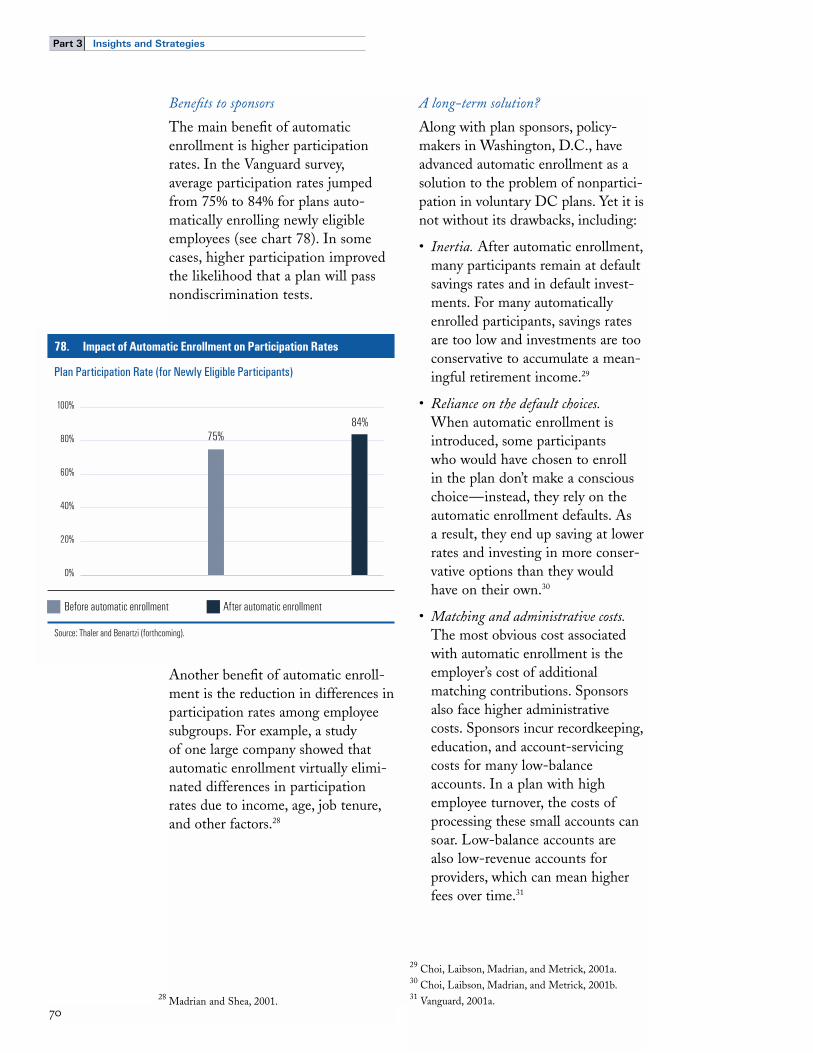
Benefits to sponsors
The main benefit of automatic
enrollment is higher participation
rates. In the Vanguard survey,
average participation rates jumped
from 75% to 84% for plans auto-
matically enrolling newly eligible
employees (see chart 78). In some
cases, higher participation improved
the likelihood that a plan will pass
nondiscrimination tests.
Another benefit of automatic enroll-
ment is the reduction in differences in
participation rates among employee
subgroups. For example, a study
of one large company showed that
automatic enrollment virtually elimi-
nated differences in participation
rates due to income, age, job tenure,
and other factors.28
A long-term solution?
Along with plan sponsors, policy-
makers in Washington, D.C., have
advanced automatic enrollment as a
solution to the problem of nonpartici-
pation in voluntary DC plans. Yet it is
not without its drawbacks, including:
• Inertia. After automatic enrollment,
many participants remain at default
savings rates and in default invest-
ments. For many automatically
enrolled participants, savings rates
are too low and investments are too
conservative to accumulate a mean-
ingful retirement income.29
• Reliance on the default choices.
When automatic enrollment is
introduced, some participants
who would have chosen to enroll
in the plan don’t make a conscious
choice—instead, they rely on the
automatic enrollment defaults. As
a result, they end up saving at lower
rates and investing in more conser-
vative options than they would
have on their own.30
• Matching and administrative costs.
The most obvious cost associated
with automatic enrollment is the
employer’s cost of additional
matching contributions. Sponsors
also face higher administrative
costs. Sponsors incur recordkeeping,
education, and account-servicing
costs for many low-balance
accounts. In a plan with high
employee turnover, the costs of
processing these small accounts can
soar. Low-balance accounts are
also low-revenue accounts for
providers, which can mean higher
fees over time.31
Part 3 Insights and Strategies
78. Impact of Automatic Enrollment on Participation Rates
Plan Participation Rate (for Newly Eligible Participants)
75%84%
Before automatic enrollment After automatic enrollment
Source: Thaler and Benartzi (forthcoming).
0%
20%
40%
60%
80%
100%
28 Madrian and Shea, 2001.
29 Choi, Laibson, Madrian, and Metrick, 2001a.30 Choi, Laibson, Madrian, and Metrick, 2001b.31 Vanguard, 2001a.

McDonald’s Corporation’s decision to
discontinue its automatic enrollment
program is a case in point, in particu-
lar because the company was among
the first to roll out the program.
According to published media
reports, automatic enrollment simply
increased participation rates among
“marginal participators.” McDonald’s
felt it should spend more of its own
money, in the form of matching con-
tributions, on long-tenure employees
who were saving responsibly for
retirement. As a result, the company
adopted a safe-harbor plan, which
meant higher contributions for the
safe-harbor match, but with none of
the headaches (or costs) of nondis-
crimination testing.32
The SMarT Plan33
In their efforts to encourage higher
savings, sponsors face a critical obsta-
cle: employee inertia. Inertia keeps
employees from taking action, such as
increasing savings rates over time.
Inertia is also self-perpetuating.
After contributing at a given rate for
years, employees can come to believe
that their current savings rate is the
only rate they can afford. The stan-
dard advice of a financial planner—
that most people could save another
5% of income with no noticeable
effect on their standard of living—
falls on deaf ears.
How might plan sponsors use natural
inertia to move workers onto the path
of saving adequately for the future?
One solution is to institutionalize a
“save your raise” philosophy as a fea-
ture of the plan. Financial planners
often advise clients to “save your raise
each year,” or at least a part of it. But
most participants, whether due to
inertia or lack of interest or time, can’t
or won’t do it on their own.
Two researchers, Professors Shlomo
Benartzi of UCLA and Richard
Thaler of the University of Chicago,
have designed a “save your raise” plan
that relies on inertia. They call the
program the SMarT plan—Save More
for Tomorrow.34 The researchers are
well-known proponents of behavioral
finance—an academic discipline
that attempts to integrate the
tenets of human psychology with
modern finance.
How SMarT works
Under an automatic savings or
SMarT feature, participants sign up
today to have their plan deferral rate
increased in the future, typically
(though not necessarily) at the next
merit review or pay increase. The
increase is a set amount—for exam-
ple, 1% or 2% of pay. There is also a
cap, such as 10%. For example, a par-
ticipant saving 3% today might sign
up for a 1% SMarT feature. At the
time of the next pay or merit increase,
the participant’s deferral rate would
rise by 1% to 4%. In the following
year it would increase to 5%; in the
next, to 6%; and so on, until reaching
the cap of 10%. With the SMarT
program, once the initial commitment
is made, regular increases to savings
occur automatically.
Part 3 Insights and Strategies
32 Plan Sponsor, 2002, pp. 16-17.33 See Thaler and Benartzi (forthcoming) and
Vanguard, 2001b for additional background on the
SMarT plan. 34 Thaler and Benartzi (forthcoming).

The SMarT plan makes clever use
of participant psychology. Participants
find it easy to join because signing up
for the service has no immediate
financial impact. When the partici-
pant’s contribution to the plan is
increased, any pain from the higher
deferral rate may be offset by a merit
or a cost-of-living increase. Depending
on the increase, a 1% or 2% boost in
the deferral rate may be nearly invisi-
ble in the participant’s paycheck.
Participants also observe the modest
impact that additional savings has on
their paycheck. They can see firsthand
what financial planners preach—a
small boost in savings has virtually no
financial impact and is easy to live
with. Finally, if they balk at the idea
of higher savings, most—through
inertia—don’t take the time to cancel
the program.
Initial SMarT results
Thus far, Professors Benartzi and
Thaler have tested the SMarT program
at one medium-size company, a 300-
person manufacturer, with very prom-
ising results. There, average deferral
rates more than doubled over three
pay raises—a period of about 28
months (see chart 79). The challenge
is whether these results can be repli-
cated more broadly.
A multidisciplinary approach
As the research in this section
implies, no single technique or pro-
gram seems likely to address the
problem of low participation and sav-
ings rates in DC plans. Instead, what
appears to be required is a multidisci-
plinary approach, a strategy that relies
on multiple tools to address the
resistance and inertia associated with
some workers’ unwillingness to save
for the future.
A multidisciplinary strategy will be
built from a number of complementa-
ry techniques. Plan design features
like matching contributions and loans
are essential; education programs
remain powerful tools. For sponsors
looking to enhance their participation
or savings programs, there are also
new techniques to be considered. In
plan design, features like automatic
enrollment or SMarT savings programs
need to be evaluated; in education,
personalized communications or
strategies targeting workers’ money
attitudes should play a role. And any
comprehensive approach must consid-
er not just the individual employee,
but the peer group and social environ-
ment of the organization as well, so
as to create a culture that encourages
and promotes savings behavior in
the workplace.
Part 3 Insights and Strategies
79. Impact of Automatic Savings on SMarT Feature
Average Savings Rate
4.4%
9.8%
8.6%
7.1%
Prior toProgram
After FirstPay Raise
After SecondPay Raise
After ThirdPay Raise
Source: Benartzi and Thaler.
Duration
0%
2%
4%
6%
8%
10%

As sponsors and providers seek to
encourage retirement savings, an
essential question to consider is:
How much should workers be saving
for their retirement? In this section
we summarize some of the recent
research on the adequacy of retire-
ment savings in the U.S., and then
provide our estimates of how
much workers should be saving to
achieve a comfortable retirement.
Comprehensive look
Analyzing the adequacy of Americans’
retirement savings requires compre-
hensive household financial data,
including information on:
• Social Security.
• Employer-sponsored retirement
plans, including DB pension bene-
fits and DC account balances.
• Personal savings, whether held
in bank accounts, mutual funds,
brokerage accounts, or insurance
products.
• Housing equity.
For the median (50th percentile) U.S.
household approaching retirement,
these sources of retirement wealth are
sometimes referred to as the “rule of
fifths.” For the typical household,
Social Security accounts for about
two-fifths of retirement wealth;
employer plans, personal savings, and
housing equity account for another
one-fifth each (see chart 80).35
Savings among preretirees
To examine whether American work-
ers are saving enough for retirement,
several studies have relied on a
national survey of preretirees known
as the Health and Retirement Study
(HRS). The HRS is tracking more
than 8,000 households nationwide in
their 50s and 60s; the aim is to follow
this group through their remaining
work years and retirement.36 One
study drawing on HRS results found
positive news—the average U.S.
household approaching retirement
appeared to have adequate levels of
savings. Looking beneath these aver-
ages, about 2 out of 3 preretirees
appeared to have adequate levels of
wealth for a retirement income; but a
large group, one-third of preretirees,
did not.37
Part 3 Insights and Strategies
80. Retirement Wealth of PreretireesP
41% Social Security
21% Financial assets
Source: Moore and Mitchell, 1997.
20% Employer plan
18% Housing
35 Moore and Mitchell, 1997.
36 The first wave of HRS tracked about 8,000 house-
holds age 51 to 61 in 1992; updates to the study are
made every three years.37 Gustman and Steinmeier, 1998.
How Much Should Workers Be Saving?

A second study of preretirees looked
at the amount households would need
to save until retirement to fund an
adequate standard of living. It found
that the typical (median) preretiree
household would need to save 16%
of income until retirement in order
to retire by age 62. But that same
median household would need to save
only 7% of income if retirement were
delayed until age 65. This result
would suggest that, by varying savings
rates and retirement dates, the average
U.S. household was well on its way to
a reasonably comfortable retirement.38
But looking beneath the averages,
there was much variation in the level
of preparation for retirement. Based
on the results of this second study,
American preretirees could be divided
into three camps (see chart 81):39
• The well prepared. Thirty percent of
American preretirees are well pre-
pared for retirement. To retire by
age 65, this group needs no addi-
tional savings.
• The potentially secure. Another 30%
of American preretirees have accu-
mulated meaningful retirement
wealth, but still need to save more.
To retire by age 65, they need to
save up to 9% of their income
until retirement.
• The “at risk” households. Forty percent
of American preretirees are financial-
ly vulnerable and will suffer a large
drop in their standard of living at
retirement. To retire by age 65, this
group would need to save at double-
digit rates (from 14% to 27% of
income). But many of these house-
holds are low income and lack the
resources to attain such savings rates.
All in all, this study suggests that 6 in
10 households approaching retirement
seem on track financially, while 4 in
10 households are at high risk for not
meeting reasonable retirement goals.
A third study focused on all U.S.
households, not just preretirees,
provided similar results. In that
report, the typical (median) U.S.
household seemed on track for retire-
ment. At the same time, there was
strong evidence that the bottom 25%
of households were clearly unprepared
for retirement. The other 25% fell
somewhere in between.40
Part 3 Insights and Strategies
81. Retirement Readiness of PreretireesP
Percentage of Preretiree Households by Level of Retirement Security
30% Well prepared
40% At risk
30% Potentially secure
Source: Vanguard summary from Moore and Mitchell, 1997.
38 Moore and Mitchell, 1997.39 Our classification adapted from Moore and
Mitchell, 1997. 40 Engen, Gale, and Ucello, 1999.
The case for additional savings
These research studies confirm that a
majority of American households are
either well prepared or reasonably on
track for a comfortable retirement.
But there are several reasons why the
outlook may not be as sanguine:
• Interest in early retirement. Most of
these studies show positive results if
individuals retire at 65. Yet today,
half of all workers retire by age 62,
and national surveys indicate that
many workers want to retire in their
early 60s.
• Longevity risk. At the same time
that workers want to retire earlier,
increases in life expectancy also
mean a longer period in retirement.
Workers must not only plan for the
years prior to eligibility for Social
Security and Medicare; they must
also consider the resources needed
over a longer life. The growth of
DC plans also means a greater
reliance on lump-sum distributions.
Individuals living off lump-sum
payments will need more money to
“self insure” against their own
longevity risk—the risk of living
long and running out of money.
• Reduced Social Security benefits.
According to the system’s trustees,
Social Security benefits are likely to
be lower for the baby boom genera-
tion—by as much as 30%—if the
system is not reformed. And some
reform proposals may require addi-
tional savings by workers.
• Health care costs. Medicare, the
health program for those older than
65, is also facing a financial crisis
because of baby boom demograph-
ics and rising health care costs.
Facing these same cost pressures,
many large employers are reducing
retiree health benefits (most small
companies don’t even offer them).
And Medicaid, the program for the
poor that pays for nursing homes
for most older Americans, is also
facing a financial crunch.
Finally, many national estimates of
retirement needs assume that retirees
will trade down in their housing and
spend their house equity during
retirement. Yet according to some
researchers, most retirees don’t actually
use their home equity for retirement,
except in a time of crisis, such as
entry into a nursing home.41 So
retirement savings calculations that
rely on spending housing equity may
be too optimistic.
All of these concerns provide
the impetus for additional retire-
ment savings.
Part 3 Insights and Strategies
41 Venti and Wise, 2000, 2001.

What constitutes adequate savings?
At what rate, then, should individual
workers be saving for retirement? A
precise answer to that question is
impossible without knowing a work-
er’s complete financial picture, espe-
cially the details of employer plans
and personal savings. Some also
would argue that retirement forecasts
should also be based on the worker’s
health profile and a customized esti-
mate of life expectancy.
That said, it is possible to estimate
some broad guidelines across the
working-age population. We assume
that individuals will want to replace
75% of their preretirement income.
We also assume that they will save
for retirement over 30 years—say,
from age 35 to 65. (While many indi-
viduals do start saving at an earlier
age, a majority of young plan partici-
pants cash out their retirement
plan distributions.)
Two other issues are critical to calcu-
lating retirement needs—the types of
employer retirement plan offered to a
worker, and the likely benefits expect-
ed from Social Security. We look at
two different scenarios:
• DC versus DB/DC coverage. In
terms of employer plan coverage,
two hypothetical workers, Worker
A and B, each has access to a DC
plan arrangement for 30 years.
Worker A saves through a DC plan
for his entire savings period.
Worker B, besides saving through
a DC plan, also spends the last
20 years of his career at a large
employer sponsoring a DB plan.
In the latter case, the DB pension
plan pays a level of benefit typical
of a large company—11/2% of the
worker’s final five-year average
salary for each year of service.42
• Social Security benefits. In one sce-
nario, each worker receives currently
scheduled Social Security benefits;
in a second, we assume that some
type of Social Security proposal is
implemented, and the net impact is
that benefits are reduced by 15%,
meaning that each worker needs to
make up the difference.
In the first scenario, with full Social
Security benefits and saving only
through a DC plan, Worker A has a
target retirement savings rate of 11%
to 20% of annual pay (see chart 82),
depending on income. This figure
includes both employer and employee
contributions. For example, if Worker
A earns $50,000, the target savings
rate is 15% of income. If Worker A’s
employer makes a 3% matching con-
tribution and a 2% profit-sharing
contribution, Worker A has to save
the balance—10% of salary.
Worker B’s target savings rate is lower
because his employer also sponsors a
DB pension plan, which in this case
is paid for by the employer. If Worker
B earns $50,000, for example, the tar-
get savings rate is 9%. Again this is
the amount of total savings from both
employer and employee contributions
in the DC plan.
Part 3 Insights and Strategies
42 For a 20-year employee, this benefit works out
to be about 22% of the worker’s final-year salary.
Importantly, the DB pension is not integrated
with Social Security; in other words, the benefit
value is not reduced based on Social Security
benefits received.

What happens if Social Security
benefits are reduced by 15% in our
example? Target savings rates are 2%
to 3% higher (see chart 83). This
may seem like a small amount of
additional savings, but keep in mind
that it is calculated over a 30-year
period. More likely than not, if Social
Security benefits were reduced, many
workers would have fewer than 30
years to make up the difference.
A retirement savings gap
These calculations confirm what
research studies suggest—that for
many households, there is still a sav-
ings gap when it comes to retirement
security. Today the typical employee
is saving 6% of his or her salary
in a DC plan. Assuming a typical
employer matching contribution
of 50 cents on the dollar (up to
6% of pay), the total retirement
savings rate for the typical DC plan
participant is 9%.
However, a 9% total savings rate in a
DC plan is appropriate in only limit-
ed circumstances. According to our
calculations, it is satisfactory for low-
and middle-income workers who have
a generous DB plan and who plan to
spend the last 20 years of their work
life accruing a benefit in that plan.
For most other workers, though, sav-
ings rates need to be higher to fund a
comfortable retirement. Moreover, as
our calculations indicate, required sav-
ings rates are even higher if Social
Security reform leads to some reduc-
tion in benefits. Higher savings rates
are also crucial in addressing concerns
not captured in our calculations,
including the desire for early retire-
ment, increased life expectancy and
longevity risk, and the rising costs of
health care in retirement.
Part 3 Insights and Strategies
82. Target Retirement Savings Rates
Worker A(DC only)
Worker B(DB/DC)
Current Income
$ 25,000
$ 50,000
$ 75,000
$ 100,000
5%
9%
12%
14%
11%
15%
18%
20%
Plan Coverage
Note: Based on 75% replacement income ratio; full Social Security benefits; moderately aggressive investment assumptions (60–80% in equity investments); for Worker B, 20–year DB coverage replacing 22% of final average pay. High-income participants may be limited in their ability to achieve these savings rates through a qualified plan. Source: The Vanguard Group, 2002.
Percentage of Income That Must Be Saved for Retirement Over 30 Years(Employee and Employer Contributions)
83. Target Retirement Savings Rates With Reduced Social Security
Worker A(DC only)
Worker B(DB/DC)
Current Income
$ 25,000
$ 50,000
$ 75,000
$ 100,000
8%
11%
14%
16%
14%
18%
20%
22%
Plan Coverage
Note: Based on 75% replacement income ratio; 15% reduction in Social Security benefits; moderately aggressive investment assumptions (60–80% in equity investments); for Worker B, 20–year DB coverage replacing 22% of final average pay. High-income participants may be limited in their ability to achieve these savings rates through a qualified plan. Source: The Vanguard Group, 2002.
Percentage of Income That Must Be Saved for Retirement Over 30 Years(Employee and Employer Contributions)

The double-digit decline in stock
prices over the past two years has
raised concerns about plan partici-
pants’ possible reactions to market
volatility. But it has also highlighted
the dangers of concentrated positions
in company stock held in some
defined contribution plans. Workers
at a number of well-known compa-
nies, including Lucent and Enron,
lost substantial sums, and in some
cases their entire plan savings, as a
result of stock market losses or com-
pany bankruptcy.
The role of company stock in retire-
ment plans has drawn scrutiny from
policy-makers in Washington, D.C.,
and various reform proposals have
been presented to either encourage or
mandate greater diversification. The
policy debate has focused in part on
the restrictions imposed on partici-
pants’ ability to diversify employer
contributions made in stock; another
concern has been whether partici-
pants adequately understand the risks
associated with high levels of compa-
ny stock holdings. A national survey
of DC plan participants conducted by
Vanguard, for example, shows that
participants view company stock as a
safer investment than a diversified
equity fund.43
In this section we provide informa-
tion on overall exposure to company
stock, as well as an overview of the
restrictions imposed by employers on
company stock holdings. The findings
are based on a mid-2001 survey of
Vanguard recordkeeping clients.44
Overall asset allocation to stock
Company stock accounted for 14% of
Vanguard’s total DC assets in 2001,
which includes plans offering and not
offering company stock as an option.
Measured in terms of only those plans
offering company stock as an option,
company stock accounted for 25% of
Vanguard DC assets. These figures are
somewhat below the averages reported
by government and industry statis-
tics—that 16% to 19% of total assets
in DC plans are invested in company
stock and that 29% of total assets of
plans offering stock are invested in
company stock.45
As also discussed previously, a plan’s
asset allocation to company stock
varies by plan size. Larger plans have
a greater exposure to company stock
than smaller plans (see page 45).
While large and small plans have
similar allocations to equities, in large
plans company stock substitutes for
holdings in diversified stock funds.
Part 3 Insights and Strategies
43 See Vanguard, 2002a, p. 6.
44 A more complete discussion of the role of company
stock in employer-sponsored retirement plans can
be found in Mitchell and Utkus, 2002.45 Mitchell and Utkus, 2002.
Restrictions on Company Stock

Participant and plan exposure
Concentrated holdings in company
stock are not widespread across all
Vanguard plans but are associated
with a specific group of plans and
participants (see chart 84). In terms
of plans, only 15% of Vanguard DC
plans offered company stock as an
investment option in 2001—10% had
concentration levels of 20% or less
of assets in company stock and 5%
had concentration levels exceeding
20% of assets.46
While the percentage of Vanguard
plans offering company stock is small,
the percentage of participants having
access to company stock is consider-
ably higher. The reason is that large
plans (with more participants) are
more likely to offer company stock
and have higher levels of concentrated
holdings in it. For example, half of all
Vanguard plans with more than 2,500
participants offered company stock in
2001, compared with only 4% of plans
with fewer than 500 participants. As a
result, while a small minority (15%) of
Vanguard DC plans offered company
stock, a slight majority (53%) of
Vanguard recordkeeping participants
had access to company stock in their
employer’s plan.
Of the 53% of Vanguard participants
with access to company stock, 22%
were offered the option but declined
to invest in company stock. In some
plans, particularly of medium- and
small-sized firms, company stock is
simply another investment option in
which participants can choose not to
invest. In some plans, employer con-
tributions are often made in cash;
if they are made in stock, they may
not be subject to restrictions on
diversification. Another 12% of par-
ticipants had positions in company
stock of up to 20% of their account
balance. Finally, about 1 in 5 Vanguard
participants (19%) had both access to
company stock and positions exceed-
ing 20% of their account balance.
Part 3 Insights and Strategies
84. Plan and Participant Exposure to Company StockP
Percentage of Plans
5% Allocation more than 20%
10% Allocation of 1%–20%
85% Not offered
Source: The Vanguard Group, 2001.
47% Not offered 19%
Allocation more than 20%
12% Allocation of 1%–20%
22% Offered but 0% invested
Percentage of Participants
46 As of mid-2001, company stock was offered by 264
qualified Vanguard record-keeping plans, sponsored
by 173 separate client organizations.

Directed versus discretionary plans
Concentrated positions in company
stock are influenced by both partici-
pant behavior and plan design.
Participants appear to believe that
company stock is a safer equity
investment than a diversified equity
option, despite the higher risks asso-
ciated with individual stocks.
Participant investment decisions are
also highly influenced by past per-
formance. If a stock’s performance
has been strong, participants will
allocate a large portion of their sav-
ings to it; if a stock’s performance
has been weak, they will avoid it.47
At the plan level, sponsors have two
decisions to make about company
stock. The first is whether employer
contributions should be made in cash
(i.e., left to the discretion of the
employee to invest) or in shares of
company stock. The second decision
is what types of restrictions, if any,
should be imposed on company stock
holdings in the plan, whether made
by the employer or the employee.
Some restrictions may be positive
(i.e., enhancing diversification) by
limiting participants’ ability to hold
concentrated stock positions; others
may be negative in that they dis-
courage or prohibit diversification of
company stock; still others may be
neutral, meaning that the restric-
tions, such as trading rules, are
designed for other purposes and
are not intended to encourage or
inhibit diversification.
Part 3 Insights and Strategies
47 See Benartzi, 2001.

Among Vanguard plans offering com-
pany stock, 45% are directed plans,
where the employer makes a match-
ing or other contribution in stock.
Fifty-five percent are discretionary
plans, where investment decisions
about the employer contribution are
left to the employee. Again, plans that
direct contributions, like plans with
company stock, generally are more
likely to be large plans. As a result,
of the Vanguard participants with
access to company stock in their
employer plans, 52% are in directed
plans that match in stock and 48%
are in discretionary plans that
match in cash.
Restrictions
Our analysis of restrictions on com-
pany stock indicates that employer
restrictions vary considerably depend-
ing on whether the plan is directed
or discretionary (see chart 85a and b).
Part 3 Insights and Strategies
85. Restrictions on Company Stock
Impact on Diversification Restriction
Number
Imposing Category %
Age/service/vesting limitsRestricted until terminationMandatory holding periodMinimum % in company stock
No restrictionsCaps/maximums
Trading limitsOther
Negative
Positive
Varied
Total:
% of Total
4525111
166
512
121
37%21%9%1%
13%5%
4%10%
100%
68%
18%
14%
100%
Discretionary Plans—Restrictions Imposed by DC Plans With Discretionary Contributions to Company Stock(114 plans, 124 plan/fund combinations*)
Impact on Diversification Restriction
Number
Imposing Category %
No restrictionsCaps/maximums
Age/service/vesting limitsRestricted until terminationMandatory holding period
Trading limitsOther
Positive
Negative
Varied
Total:
% of Total
6025
652
719
124
48%20%
5%4%2%
6%15%
100%
69%
10%
15%
100%
* Some plans have more than one company stock fund; e.g. the stock of the current employer plus common stock of previous acquisition or merger partners. Source: The Vanguard Group, 2001.
Directed Plans—Restrictions Imposed by DC Plans With Contributions Directed to Company Stock(106 plans, 121 plan/fund combinations*)
a
b

Among the directed plans that match
in stock, nearly 7 in 10 restrict diver-
sification by participants in some way.
The most common way to restrict
diversification is through age or ser-
vice limits (including the statutory
ESOP limit of age 55 and ten years
of service). Some restrict diversifica-
tion completely until termination or
retirement. A small number require
a mandatory holding period.48
By comparison, discretionary plans
that match in cash are likely to
encourage flexibility and diversifica-
tion. Nearly 7 in 10 plans extend full
diversification rights to participants,
or they impose caps to discourage
concentrated holdings in company
stock. Somewhat contradictorily, a
small number of plans that allow
participants to make all investment
decisions impose a restriction (based
on age, service, etc.) if participants
choose to invest in company stock.
Based on these results, it appears that
restrictions are an important factor
when deciding between making the
employer contribution in stock or in
cash. Directed plans, with the match
in stock, are more likely to restrict
participants’ ability to diversify.
Discretionary plans, with the match
in cash, are more likely to allow full
participant diversification, or they
impose restrictions on participants’
ability to hold a concentrated position
in company stock.
Impact on concentration
Both the employer decision to direct
contributions to stock, and any related
restrictions, appear to have a mean-
ingful impact on whether or not par-
ticipants have concentrated holdings
in company stock. Among Vanguard
clients, directed plans have an average
allocation to company stock of 38%,
while discretionary plans have an allo-
cation to company stock of 17%. In
the broader industry, a similar pattern
prevails. Directed plans have an aver-
age allocation to company stock of
48%, while discretionary plans have
an average allocation to company
stock of 20%.49
In light of the controversy surrounding
company stock holdings, a number
of prominent employers have chosen
to eliminate or significantly reduce
restrictions on participants’ ability
to diversify employer stock contribu-
tions. Other employers are also
examining ways to increase partici-
pant awareness of risk, including
targeted education campaigns.
Part 3 Insights and Strategies
48 Many employers impose multiple restrictions on
diversification—e.g., an age and a service limit, plus
limits on trading to accommodate SEC earnings
black-out periods or to counter stock day-trading by
employees. Our analysis presents only the primary
restriction for each company stock fund. Also, we
have focused only on active company stock funds;
some plans have frozen funds/wasting assets, which
we have excluded from this analysis. 49 See Mitchell and Utkus, 2002.
Recent stock market turmoil has
again highlighted the importance of
investment and retirement education
in defined contribution plans. There
has been a dramatic expansion of par-
ticipant communications over the past
decade, and a corresponding shift in
focus from plan enrollment to the
broader retirement and financial plan-
ning needs of workers. As communi-
cations efforts have grown, plan spon-
sors have also expressed an interest in
new techniques that will enhance
effectiveness.
In many ways, benefits communica-
tions are like other forms of market-
ing communications—the aim is to
elicit certain “buying behavior.” In the
case of retirement plan communica-
tions, the intended buying behavior is
to induce employees to join the plan,
save at an adequate rate, and appro-
priately diversify investments.
One element essential to improving
the effectiveness of these communica-
tions is to tailor programs to the spe-
cific needs of an audience. Today plan
sponsors use a variety of methods to
target their communications, includ-
ing participant demographics and
plan status (e.g., nonparticipants, low
savers, conservative investors).
Another approach is to target plan
communications based on attitudinal
segmentation of the target audience—
developing communications that
reflect the audience’s attitudes toward
financial and retirement planning.
The material that follows summa-
rizes the major money attitude seg-
ments of the employee population
found in DC retirement plans. A
more detailed analysis of these results
can be found in a separate publica-
tion by the Vanguard® Center for
Retirement Research.50
Part 3 Insights and Strategies
50 Vanguard, 2002b.
“Money Attitudes” andRetirement Communications

What is attitudinal segmentation?
Attitudinal segmentation is a widely
used marketing technique that
employs soft psychological variables
such as preferences and beliefs to
define a target market, in addition to
hard demographic variables such as
age or income.
Many companies use a combination
of hard demographic segmentation
and soft psychological segmentation
in targeting consumers and markets.
For example, an operator of business
hotels might target specific demo-
graphic variables in its marketing
efforts—e.g., high-income profes-
sionals who travel for a living. But it
might also augment this strategy by
targeting specific attitudes or interests
of the target audience, such as con-
venience, cost-effectiveness, or a busi-
ness-savvy approach to client service.
In retirement plans, sponsors can
design retirement communications
around hard demographic or plan
variables, such as a campaign to pro-
mote plan participation among young
workers or a preretirement seminar
for those older than 50. But sponsors
also can design communications
around soft characteristics such as the
audience’s level of interest in financial
and retirement planning; its attitude
toward savings and the future; and its
level of interest in investment risk-
taking. We call these psychological
variables money attitudes.
Methodology
The five attitudinal segments
described in this report were created
as part of our multiphase research
program. The first phase, conducted
in 1999, consisted of in-depth inter-
views with a group of workers, which
included active plan participants, eli-
gible nonparticipants, and recent
retirees (within the previous five
years). The results from these inter-
views were used to create hypotheses
about potential attitudinal segments.
Part 3 Insights and Strategies

In 2000 these hypotheses were tested
with a quantitative survey of partici-
pants and eligible nonparticipants
drawn from Vanguard recordkeeping
clients. Subsequently, in 2001 these
results were validated against a
national random sample of retirement
plan participants. The results are
generally projectable to the national
retirement plan population (with
some differences as noted in the
separate Vanguard report).
Five money attitudes
Retirement plan participants fall into
five money attitude segments (see
chart 86). Two types of Planners—
Successful Planners and Up &
Coming Planners—together repre-
sent about half of the retirement plan
population, which includes partici-
pants and nonparticipating eligible
employees. Another fifth of the
retirement plan population falls into
a third category, Secure Doers. A
third of the population consists of
two types of Avoiders—Stressed
Avoiders, who are anxious about
money matters, and Live-for-Today
Avoiders, who focus on current grati-
fication rather than future rewards.
Part 3 Insights and Strategies
86. Five Money Attitude Segments
Percentage of Retirement Plan Population*
33% AvoidersStressed (19%)Live-for-Today (14%)
47% PlannersSuccessful (21%)Up & Coming (26%)
20% Secure Doers
* Includes both participants and eligible nonparticipants. Statistics based on Vanguard recordkeeping population, which may differ from national sample. Source: The Vanguard Group, 2002.

Planners have a strong vision about
the future and about retirement.
Retirement is not simply the end of a
primary work career; it is seen as a
new lifestyle, a new opportunity.
Planners envision specific goals for
the future—where and how they’ll
live, what activities they’ll pursue—
and are intent on realizing this vision
(see chart 87).
The two types of Planners share
many characteristics, but they differ
largely in age and self-confidence.
Successful Planners enjoy planning
and managing money. They are
disciplined savers and participate in
their employer’s DC plans at high
rates (90%). Successful Planners are
optimistic about and confident in the
success of their retirement plans, and
willingly take equity market risks
in pursuit of their goals.
Part 3 Insights and Strategies
Vision of retirement
Interest in retirement and financial planning
Savings behavior/deferral of gratification
Plan participation rate*
Preparation for retirement
Equity risk-taking
Sources of financial information
Other
Possess a strong vision with clear goals and aspirations
Enjoy planning and dealing with finances; derive satisfaction from managing money
Disciplined savers; derive satisfaction from saving
90%
Optimistic they will meet retirement goals; least concerned about having enough money
Willing to take risks for higher returns
Many—plan provider, media, Internet, adviser, employer
Older and more affluent; more active with the Internet
Similar to Successful Planners but with some uncertainty
Enjoy dealing with finances, planning, money management
Disciplined savers; enjoy savings process
81%
Not yet in a position to meet retirement goals but optimistic about the future
Have made money in stocks, but are less confident than Successful Planners
Many, like Successful Planners
Younger than Successful Planners
Less goal-focused; willing to adjust lifestyle to resources
Strong interest in saving for the future, but not as concerned with planning or managing their money
Willing to save for future
71%
Optimistic about retirement; likely to save sufficiently for future
Less willing to take equity market risk
Employer, plan provider, or adviser
Older and more affluent
Successful Planners(21%)
Up & Coming Planners(26%)
Secure Doers(20%)
Planners (47%) Doers (20%)
87. Five Money Attitudes—Highlights
* Participation rates were statistically different at a 90% confidence level (except for both Avoider groups). Note: Percentages shown are of a random sample drawn from more than 2 million Vanguard participants and eligible nonparticipants. Source: The Vanguard Group, 2002.

Up & Coming Planners are Successful
Planners in the making. Up &
Coming Planners enjoy retirement
planning and saving for the future;
they have an optimistic outlook and
they are stock market-oriented. While
they feel they are on track to realizing
their goals, they are somewhat less
confident about the future success
of their planning efforts.
Secure Doers, the third segment, are
quite different from Planners. They
take a highly disciplined approach to
saving for the future. But while they
are committed to saving, they don’t
find financial planning rewarding.
For Secure Doers, low involvement
in money matters is typical. They do
not enjoy managing finances. Secure
Doers are busy with other things in
their lives, such as family or career.
They are sometimes found in the
professions, as well as among entre-
preneurs—individuals who are
interested in their work but not in
managing their money.
The two Avoiders segments account
for one-third of the retirement
plan population. Both Avoiders
segments are characterized by low
participation rates, but they differ
markedly in terms of motivation.
Stressed Avoiders are anxious and
confused about money matters.
This anxiety impedes their savings
behavior and leads to pessimism
about the future.
Live-for-Today Avoiders aren’t stressed
about financial matters; they simply
have little or no interest in planning
for the future. Deferring gratification
is not high on their agenda, nor is
worrying about their future retire-
ment needs. Live-for-Today Avoiders
are simply focused on today’s con-
sumption and today’s spending.
Part 3 Insights and Strategies
Worried about future and money; not goal- or vision-oriented
Stressed out and confused by financial planning, money—but interested in learning more
Saving impeded by confusion, worry
62%
Pessimistic about having enough money for retirement
Least confident of their investment skills
Employer, plan provider
Nonparticipants regret not having joined plan; participants wish they had started sooner
Not focused on the future at all
Little interest in planning; not stressed; would rather “live for today“ than “plan for tomorrow“
Little satisfaction from saving; leisure time more valuable; retirement too far away
64%
Have not considered retirement needs; have highest degree of confidence in Social Security
Middle-of-the-road attitudes toward risk-taking
Employer, plan provider
Somewhat younger than all other groups
Stressed Avoiders(19%)
Live-for-Today Avoiders(14%)
Avoiders (33%)

Using money attitudes
Money attitudes can be used in
designing communications and in
potentially improving their effective-
ness. Each money attitude segment
has distinct interests in retirement
and financial matters. Some sponsors
may choose to identify one or two
segments as the target audience for
most of their plan communications.
Others might choose to vary their
approach from year to year, targeting
the needs of different audiences.
Whichever approach is taken, money
attitudes can be used to improve
existing communications strategies:
• Enrollment. The lesson from money
attitudes research is that, for many
sponsors, enrollment programs
should be structured not around the
needs of natural savers, namely
Planners and Doers, but around the
needs of Avoiders. Communications
should be even more focused on
communicating current benefits
and simplifying terminology, with
explicit and directive calls-to-action.
• Investment options. Complex invest-
ment menus may be suitable for
Planners, but other segments will
struggle with expanded investment
choice. Both menu design and com-
munications should be adapted to
the needs of an employee popula-
tion’s dominant attitudinal segment.
• Ongoing education. Most ongoing
financial education programs natu-
rally appeal to Planners. Attracting
Secure Doers and Avoiders to
such programs requires a different
approach, with focused efforts
on narrowly targeted and simpli-
fied topics.
• E-communications. Money attitudes
may also be used to devise strategies
for financial websites (both intranet
and Internet) and other e-commu-
nications (including interactive
e-mail, CD-ROMs, and e-meetings).
Among Vanguard participants, 85%
have access to the Internet at work,
at home, or both. As a result, nei-
ther availability nor access is the
chief obstacles to the use of e-com-
munications. Rather it is participants’
underlying interest in personal
finance—in other words, their
money attitude.
Money attitudes also play a role
in the use of new personalized
communications, and in devising a
strategy for offering investment
advice to participants. Additional
details on the use of money attitudes
can be found in a separate publica-
tion from the Vanguard Center
for Retirement Research.51
Part 3 Insights and Strategies
51 Vanguard, 2002b.

Stock market volatility over the past
two years has raised concerns about
participants’ willingness to maintain
equity-oriented retirement portfolios
in the face of falling stock prices. As
we noted previously (see page 47),
despite this worry, the vast majority
of participants have made no changes
in their investment portfolios in the
past year. Part of the reason has to be
the balancing effect of new contribu-
tions, which for the typical partici-
pant have offset losses from declining
equity investments over the past
two years.
Nonetheless, while the majority of
participants have stayed the course in
their retirement plans, a small group
of participants does make changes in
any given year, and the amount of
money exchanged is meaningful (see
page 48). In this section we review
longer-term data on trading behavior
patterns from Vanguard recordkeep-
ing systems between 1997 and 2002.
We look at the movement (exchange)
of existing monies among investment
options within a retirement plan, and
examine the volume of trading activi-
ty, as well as the direction toward, or
away from, equity holdings.
Our analysis indicates that since the
collapse of the stock market bubble in
early 2000, participant trading vol-
umes have fallen by half. The direc-
tion of money movement—either into
or out of equities—has varied over the
years, fluctuating modestly with then-
current market conditions. But in
2001 the movement to fixed income
investments became more pro-
nounced. Overall it appears that while
fewer participants are making invest-
ment exchanges in their accounts,
those who are trading are favoring
fixed income investments over stocks.
Not surprisingly, the largest outflow
into fixed income investments during
2001 occurred in September after the
terrorist attacks and the temporary
closing of the stock exchanges.
Part 3 Insights and Strategies
Participant Trading Behavior:A Longer-Term View
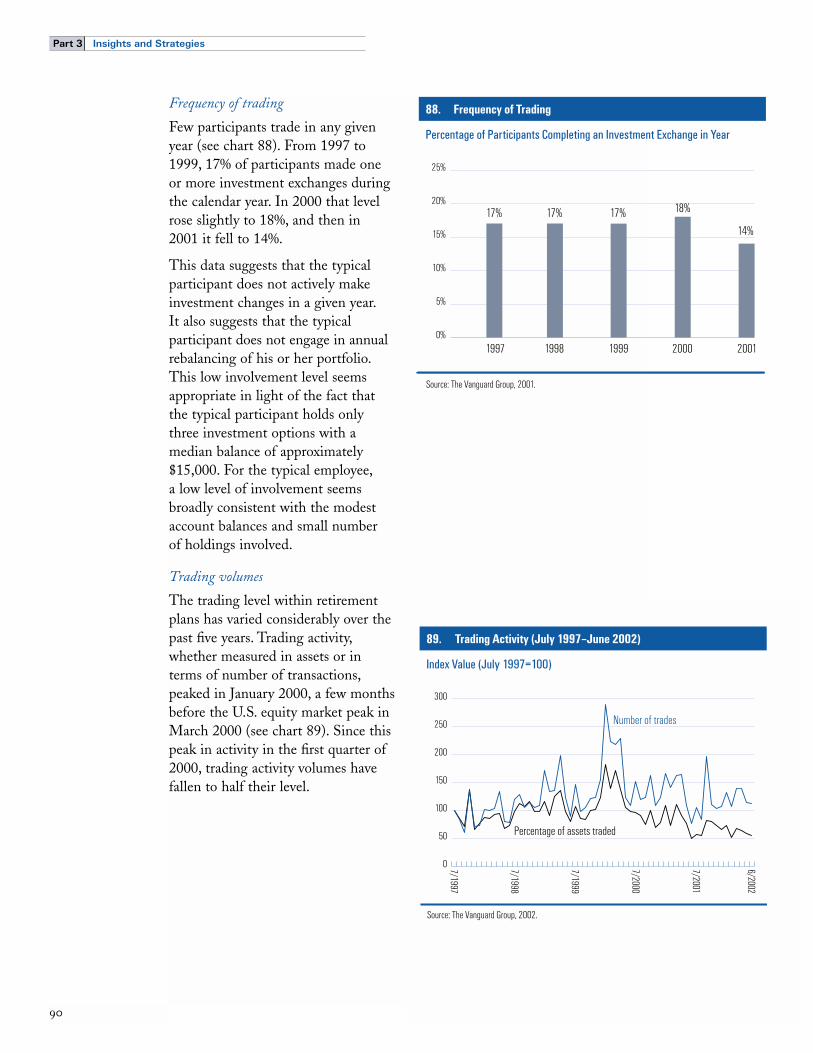
Frequency of trading
Few participants trade in any given
year (see chart 88). From 1997 to
1999, 17% of participants made one
or more investment exchanges during
the calendar year. In 2000 that level
rose slightly to 18%, and then in
2001 it fell to 14%.
This data suggests that the typical
participant does not actively make
investment changes in a given year.
It also suggests that the typical
participant does not engage in annual
rebalancing of his or her portfolio.
This low involvement level seems
appropriate in light of the fact that
the typical participant holds only
three investment options with a
median balance of approximately
$15,000. For the typical employee,
a low level of involvement seems
broadly consistent with the modest
account balances and small number
of holdings involved.
Trading volumes
The trading level within retirement
plans has varied considerably over the
past five years. Trading activity,
whether measured in assets or in
terms of number of transactions,
peaked in January 2000, a few months
before the U.S. equity market peak in
March 2000 (see chart 89). Since this
peak in activity in the first quarter of
2000, trading activity volumes have
fallen to half their level.
Part 3 Insights and Strategies
88. Frequency of Trading
Percentage of Participants Completing an Investment Exchange in Year
17%
14%
18%17%17%
1997 1998 1999 20012000
Source: The Vanguard Group, 2001.
0%
5%
10%
15%
20%
25%
89. Trading Activity (July 1997–June 2002)
Index Value (July 1997=100)
Percentage of assets traded
Number of trades
7/1997
7/1998
7/1999
7/2000
7/2001
6/2002
Source: The Vanguard Group, 2002.
0
50
100
150
200
250
300

Trading activity also appears to be
linked to periods of financial turmoil.
The first two peaks in trading activity
coincided with the Asian financial
crisis in 1997 and the Russian debt
crisis in 1998, both of which
increased volatility in U.S. stock mar-
kets. But these bursts in trading activ-
ity were modest compared with sub-
sequent jumps in trading activity in
1999 and 2000.
Although there appears to be a broad
relationship between stock market
levels and participant trading, with
both peaking in early 2001, the link is
more graphical than statistical. We
analyzed the statistical relationship
between trading activity (both assets
and numbers of trades) and various
stock market indexes, including the
Dow Jones Industrial Average, the
Standard & Poor’s 500 Index, and
the Nasdaq market index. In none
of these cases was there a statistically
significant link between trading activ-
ity and the total return on the index.
Further research is needed in this
area, but the graphical data nonethe-
less suggests some type of relationship.
One possibility is that participants
may overreact during periods of
financial crisis or exuberance; but
during other periods, their trading
decisions may be random, and more
related to personal financial decisions
than market conditions.
Direction of money movement
Another way to view participant
trading activity is to analyze the
direction of the monies being
moved—either as a net movement
into equities or a net movement into
fixed income. Over the past five
years, the most remarkable feature
has been the large flow into common
stocks at the peak of the U.S. stock
market in early 2000, and a move,
albeit somewhat erratic, into fixed
income investments during the
recent bear market (see chart 90).
Part 3 Insights and Strategies
90. Net Money Movement (July 1997–June 2002)
Equity Flows as Percentage of Average Assets
Source: The Vanguard Group, 2002.
–1.00%
–0.80%
–0.60%
–0.40%
–0.20%
0.00%
0.20%
0.40%
0.60%
0.80%
1.00%
7/1997
7/1998
7/1999
7/2000
7/2001
6/2002
Net movement into fixed income
Net movement into equities

Cumulatively, since U.S. stock prices
began to decline in March 2000,
there has been a decrease in trading
activity—but among those trading,
there also has been a shift in senti-
ment (see chart 91). In 1999 there
was an actual net flow out of equities,
representing 0.9% of average record-
keeping assets. In 2000, especially as
a result of the substantial shift into
stocks in the first quarter, there was a
net flow into equities, again equiva-
lent to 0.9% of average recordkeeping
assets. But by 2001 trading activity
had fallen, and those trading had
become more interested in fixed
income investments. Net exchanges
flowed into fixed income investments,
representing 2.5% of average record-
keeping assets.
Implications
Although more research is needed,
these results suggest a few tentative
conclusions. First, the typical (median)
participant makes no investment
exchanges in a given year. Active
involvement with DC plan assets
is relatively uncommon. This low
level of engagement seems consistent
when the typical participant owns
$15,000 in assets and has three
investment holdings.
Second, there appears to be some
link between participant trading
activity and market levels, with trad-
ing spiking at various periods of
market exuberance or decline. But
simple tests between trading activity
and market returns show no statisti-
cally significant link. There is possibly
a more complex relationship between
stock market performance and
participant trading.
And finally, prior to the peak in
U.S. stock prices in early 2000, net
flows to or from stocks seemed to
vary both positively and negatively.
But since the downturn in U.S.
stocks, the direction of trading,
among those who actually do trade,
has been away from common stocks
and into fixed income investments,
particularly in 2001. Yet in aggregate,
participant holdings of equities have
only declined modestly, as new con-
tributions to stocks offset declining
asset values and exchanges into fixed
income investments.
Part 3 Insights and Strategies
91. Trading Summary (1999–2001)
(In Billions)
% of ParticipantsTrading (Making
an Exchange)Year
Net Flow Into(Out Of)Equities
Net Flow As % of Average
Recordkeeping Assets
1999
2000
2001
0.90%
0.90%
2.50%
(0.9)
1.1
(2.9)
17%
18%
14%
Source: The Vanguard Group, 2001.

Methodology
The Vanguard data included in this
report is drawn from several sources:
All defined contribution clients. This
universe consists of more than 2,100
plans, 1,400 clients, and 2.5 million
participants for which Vanguard pro-
vides recordkeeping services. It
includes 401(k) and 403(b) plans;
paired 401(k)/profit-sharing plans;
paired 401(k)/ESOP plans; and other
defined contribution arrangements
such as money purchase plans.
Approximately 7 out of 10 Vanguard
client relationships are plans with a
401(k) salary deferral feature. All
references to “The Vanguard Group”
are to this universe, and all data is
as of December 31, 2001, unless
otherwise noted.
Vanguard participation and deferral
rates. Data on participation and defer-
ral rates is drawn from a subset of
Vanguard’s recordkeeping clients
for whom we perform nondiscrimina-
tion testing. This subset includes
more than 650 plans and more than
500,000 participants. Ninety-seven
percent of these plans are 401(k)
or paired 401(k) plans. Income data
used in participation and deferral rate
analyses also comes from this subset
of plans.
External income data. Income data for
asset allocation, account balance, and
loan demographics is from an external
source overlaid onto Vanguard partic-
ipant data. This external income data
covers 65% of the Vanguard partici-
pant universe and is the most recent
data available.
Access channels/Internet data. Data for
access method frequency and demo-
graphics is drawn from a subset of
Vanguard’s universe. The analysis is
based on unique Social Security num-
bers and participants who have been
in their plan for an entire year.
This set covers approximately two-
thirds of all Vanguard recordkeeping
participants. Data on participants’
ability to access the Internet comes
from the Vanguard 2001 Participant
Relationship Study, a biennial tele-
phone survey among a random sam-
ple of 1,000 participants drawn from
Vanguard’s participant base; the sur-
vey was conducted in May and June
2001. Data for reasons participants
visit Vanguard.com is the average
daily number of visits to Vanguard
webpages from January through
April 2002.
Company stock data. Data on restric-
tions on company stock is drawn
from a subset of Vanguard’s record-
keeping universe. It consists of all
tax-qualified plans at Vanguard offer-
ing company stock as an investment
option as of June 30, 2001. The sub-
set covers 264 plans, 173 clients, and
1.2 million participants.
Education and advice data. Data
on participant education needs
and additional interests come from
the Vanguard 2001 Participant
Relationship Study, a biennial tele-
phone survey among a random
sample of 1,000 participants drawn
from Vanguard’s participant base;
the survey was conducted in May
and June 2001.
Finally, this report includes data
drawn from a wide range of industry
and academic sources. Each study has
its unique data limitations and we
encourage you to consult the individ-
ual references listed at the back of
this report.
References
Andrews, Emily S. 1992. “The
Growth and Distribution of 401(k)
Plans,” in Turner & Beller, Trends in
Pensions 1992, U.S. Department of
Labor, Washington, DC, pp. 149–176.
Bassett, William F., Michael J.
Fleming, and Anthony P. Rodrigues.
1998. “How Workers Use 401(k)
Plans: The Participation,
Contribution, and Withdrawal
Decisions,” National Tax Journal,
51(2), pp. 263–289.
Bayer, Patrick J., John Karl Scholz, and
B. Douglas Bernheim. 1996. “The
Effects of Financial Education
in the Workplace: Evidence from a
Survey of Employers,” NBER
Working Paper 5655. www.nber.org.
Benartzi, Shlomo. 2001. “Excessive
Extrapolation and the Allocation
of 401(k) Accounts to Company
Stock,” Journal of Finance. LVI (5).
pp. 1747-1764.
Bernheim, B. Douglas, and Daniel M.
Garrett. 1996. “The Determinants and
Consequences of Financial Education
in the Workplace: Evidence from a
Survey of Households,” Stanford
University Department of Economics,
Working Paper 96-007, Stanford,
CA, 1996.
Choi, James J., David Laibson, Brigitte
C. Madrian, and Andrew Metrick.
2001a. “For Better or For Worse:
Default Effects and 401(k) Savings
Behavior,” NBER Working Paper
8651. www.nber.org.
Choi, James J., David Laibson,
Brigitte C. Madrian, and Andrew
Metrick. 2001b. “Defined
Contribution Pensions: Plan Rules,
Participant Decisions, and the Path of
Least Resistance,” NBER Working
Paper 8655. www.nber.org.
Clark, Robert L. and Sylvester J.
Schieber. 1998. “Factors Affecting
Participation Rates and Contribution
Levels in 401(k) Plans,” in Living with
Defined Contribution Plans, Olivia S.
Mitchell and Sylvester J. Schieber,
eds., Wharton School Pension
Research Council, University of
Pennsylvania Press, Philadelphia, PA.
Duflo, Esther and Emmanuel Saez.
2000. “Participation and Investment
Decisions in a Retirement Plan: The
Influence of Colleagues’ Choices,”
NBER Working Paper 7735.
www.nber.org.
Duflo, Esther and Emmanuel Saez.
2002. “The Role of Information
and Social Interactions in Retirement
Plan Decisions: Evidence from a
Randomized Experiment,” NBER
Working Paper 8885. www.nber.org.
EBRI/ICI. 2001a. “401(k) Plan
Asset Allocation, Account Balances,
and Loan Activity in 2000,” ICI
Perspective, 7 (5), Washington, DC.
EBRI/ICI. 2001b. “Contribution
Behavior of 401(K) Plan Participants,”
ICI Perspective, 7 (4), Washington, DC.
EBRI. 2002. “The 2002 Small
Employer Retirement Survey (SERS)
Summary of Findings,” Employee
Benefits Research Institute,
Washington, DC. www.ebri.org.
Engen, Eric M., William G. Gale,
and Cori E. Ucello. 1999. “The
Adequacy of Retirement Savings.”
Brookings Paper on Economic
Activity 2, pp. 65-187. As cited in
Cori E. Ucello, “Are Americans Saving
Enough for Retirement,” Issues in
Brief, Center for Retirement Research
at Boston College, July 2001.

Even, William E. and David A.
MacPherson. 1999. “Employee
Participation in 401(k) Plans,”
Working Paper.
Greenwich Associates. 2001.
2001 401(k) Study, January 2002,
Greenwich, CT.
Gustman, Alan L. and Thomas L.
Steinmeier. 1998. “Effects of Pensions
on Saving: Analysis With Data From
the Health and Retirement Study,”
NBER Working Paper 6681.
www.nber.org.
Hinz, Richard P. and John A. Turner.
1998. “Why Don’t Workers
Participate?” in Living with Defined
Contribution Plans, Olivia S. Mitchell
and Sylvester J. Schieber, eds.,
Wharton School Pension Research
Council, University of Pennsylvania
Press, Philadelphia, PA.
ICI. 2002. 2002 Mutual Fund
Factbook, Investment Company
Institute, Washington, DC, p. 48.
Madrian, Brigitte C. and Dennis F.
Shea. 2001. “The Power of Suggestion:
Inertia in 401(k) Participation and
Savings Behavior,” Quarterly Journal
of Economics, 116(4). pp. 1149–1187.
Mitchell, Olivia S. and Stephen P.
Utkus. 2002. “The Role of Company
Stock in Defined Contribution Plans,”
Wharton Pension Research Council
Working Paper pp. 2002–04.
http://prc.wharton.upenn.edu/prc/PR
C/WP/WP2002-4.pdf.
Moore, James F. and Olivia S. Mitchell.
1997. “Projected Retirement Wealth
and Savings Adequacy in the Health
and Retirement Study,” NBER
Working Paper 6240. www.nber.org.
Munnell, Alicia H., Annika Sundén,
and Catherine Taylor. 2000. “What
Determines 401(k) Participation and
Contributions?” CRR Working Paper
2000-12, Center for Retirement
Research at Boston College.
www.bc.edu/crr.
Papke, Leslie E. 1995. “Participation
in and Contributions to 401(k)
Pension Plans,” Journal of Human
Resources, 30(2), pp. 311–325.
Papke, Leslie E. and James M.
Poterba. 1995. “Survey Evidence on
Employer Match Rates and Employee
Savings Behavior in 401(k) Plans,”
Economic Letters, 49 (3), pp. 313–317.
Plan Sponsor. 2002. “Auto-enrollment’s
Achilles’ Heel.” May 2002, pp. 16–17.
Polivka, Anne E. 1996. “Contingent
and Alternative Work Arrangements,
Defined,” Monthly Labor Review,
Department of Labor, Washington,
DC, October, p 6. www.bls.gov.
Profit Sharing/401(k) Council of
America. 2001a. 44th Annual Survey
of Profit Sharing and 401(k) Plans:
Reflecting 2000 Plan Year Experience,
Chicago, IL. www.psca.org.
Profit Sharing/401(k) Council of
America. 2001b. “Automatic
Enrollment 2001: A Study of
Automatic Enrollment Features in
401(k) Plans,” Chicago, IL.
www.psca.org.

Social Security Administration. 2002.
“Income of the Aged Chartbook,
2000” and “Income of the Population
55 and Older, 2000,” Washington,
DC. www.ssa.gov.
Thaler, Richard H. and Shlomo
Benartzi (forthcoming). “Save More
Tomorrow: Using Behavioral
Economics to Increase Employee
Saving,” Journal of Political Economy.
Vanguard. 2001a. Automatic
Enrollment: Benefits and Costs of
Adoption, Vanguard Center for
Retirement Research.
http://institutional.vanguard.com/
Institutional/retirement_research.html
Vanguard. 2001b. Automatic
Enrollment: Vanguard Client
Experience, Vanguard Center
for Retirement Research.
http://institutional.vanguard.com/
Institutional/retirement_research.html
Vanguard. 2002a. Vanguard Participant
Monitor: Expecting Lower Market
Returns in the Near Term, Vanguard
Center for Retirement Research.
http://institutional.vanguard.com/
Institutional/retirement_research.html
Vanguard. 2002b. Using “Money
Attitudes” to Enhance Retirement
Communications, Vanguard Center
for Retirement Research.
http://institutional.vanguard.com/
Institutional/retirement_research.html
Venti, Steven F. and David A. Wise.
2000. “Aging and Housing Equity,”
NBER Working Paper 7882.
www.nber.org.
Venti, Steven F. and David A. Wise.
2001. “Aging and Housing Equity:
Another Look,” NBER Working
Paper 8608. www.nber.org.
Acknowledgments
We extend our thanks to the following
Vanguard crew members who made
this publication possible:
Data analysis
Kathleen Callan
Michael Gold
Gary Mottola
Daniel Proctor
William Nessmith
Communications
Samuel Atlee
Suzanne Cionci
John Friel
Susan Fuhs
Christine M. Johnson
Martha Witte
Stephen Utkus
Vanguard Center for Retirement
Research

®
®
Institutional Investor Group Vanguard Center for Retirement Research Post Office Box 2900Valley Forge, PA 19482-2900
© 2002 The Vanguard Group, Inc.All rights reserved.Vanguard MarketingCorporation, Distributor.
27569-1 092002
On the WebGo to institutional.vanguard.comand select “Vanguard Center forRetirement Research.”
Standard & Poor’s® is a trademark ofThe McGraw-Hill Companies, Inc., andhas been licensed for use by TheVanguard Group, Inc. Vanguard mutualfunds are not sponsored, endorsed,sold, or promoted by Standard &Poor’s, and Standard & Poor’s makesno representation regarding the advisa-bility of investing in the funds.
The Vanguard Group, Vanguard,Vanguard.com, and the ship logo aretrademarks of The Vanguard Group,Inc. All other marks are the exclusiveproperty of their respective owners.