américa latina em cifras 2018 - alacero.org · américa latina em cifras latin america in figures...
TRANSCRIPT

América Latina em Cifras 2018LATIN AMERICA IN FIGURES2018

2. Alacero
_ _
Alacero - Latin American Steel Association - is the non-
profit civil association that brings together the steel value
chain of Latin America to promote the values of regional
integration, technological innovation, excellence in
human resources, safety at work, corporate responsibility
and socio-environmental sustainability.
Founded in 1959, it is integrated by more than 60
producing and related companies from 19 countries in
Latin America and the world, whose production is close
to 70 million tons per year.
Alacero is recognized as a Special Consultant
Organization by the United Nations.

América Latina em Cifras Latin America in Figures 3
_ _
COVER
Santa IfIgenIa VIaduct, São Paulo, BrazIl
CAPA
ViAduto SAntA ifigêniA São PAulo, BrASil
Alacero - Associação Latino-Americana do Aço -
é uma entidade civil sem fins lucrativos que reúne
a cadeia de valor do aço da América Latina. Seus
associados desenvolvem suas atividades em 19 países
do mundo e, sua produção é de aproximadamente 70
milhões de toneladas anuais, representando 95% do
aço fabricado na América Latina.
Fundada em 1959, a entidade busca fomentar os
valores de integração regional, inovação tecnológica,
excelência em recursos humanos, responsabilidade
empresarial e sustentabilidade socioambiental.
A Alacero é reconhecida como Organismo Consultor
Especial para as Nações Unidas.
© Alf Ribeiro / Shutterstock.com

4. Alacero
_ _
ConteúdoContent
_Alacero´s Vision is to be the regional institution representing the steel industry in Latin America to promote and support its sustain-ability on the basis of its key role in the development of the region.
_A visão da Alacero é ser a instituição regional que representa a indústria do aço na América Latina para promover a sustentabilidade com base em sua importância para o desenvolvimento da região.
© Fernando Romero Enterprise · Foster and Partners · AICM · Aerial.
Proporcionada por Grupo Aeroportuario de la Ciudad de México.

América Latina em Cifras Latin America in Figures 5
_ _
P. 06
P.08
P. 10
P.12
P. 18
P.26
P.30
P.34
IntroduçãoForeword
Sócios da Alacero Members of Alacero
3 Indicadores3 key figures
Produção de aço bruto Crude steel production
Produção e consumo de laminadosFinished steel production and consumption
Comércio siderúrgico latino-americanoLatin American steel trade
Indicadores econômicos e siderúrgicos da América Latina Latin America: Economic and steel indicators
Siderurgia chinesa: impacto sobre a América LatinaChinese steel industry: Impact on Latin America
01
02.
03.
04.
05.
06.
07.
08.

6. Alacero
_ _
01. IntroduçãoForeword
_Alacero has undertaken to encourage cooperation between companies and regional associations to combat unfair trade, favoring fair competition and good practices to all its participants.
_A Alacero comprometeu-se a incentivar a cooperação entre empresas e associações regionais para combater o comércio desleal, favorecendo a concorrência leal e boas práticas para todos os seus participantes.

_ _América Latina em Cifras Latin America in Figures 7
A economia latino-americana man-
tém a taxa de crescimento apresen-
tada no primeiro trimestre de 2017.
Apesar da incerteza política, das
crescentes tensões comerciais e da
forte crise financeira na Argentina,
a América Latina espera alcançar
um crescimento de 1,2% do PIB
em 2018, apoiada por um cresci-
mento global mais forte e pelos
altos preços das commodities.
Em 2018, o uso aparente de aço al-
cançará 68,5 milhões de toneladas
(Mt), enquanto a produção de aços
laminados alcançará 55,9 milhões,
1,3% e 5,6% maiores que em 2017,
respectivamente.
As previsões incluem um aumento
no consumo mundial de 3,9% e
6% na China.
As importações totais da América
Latina atingirão 23,5 Mt, o que
representa retração de 6,5% em
relação a 2017, porém o consumo
regional é suprido por 34% pelas
importações.
Desde 2015, os governos regionais,
em cooperação com empresas
siderúrgicas, fortaleceram seus
esforços para nivelar o campo
de atuação, estabelecendo ações
antidumping e salvaguardas, bus-
cando assegurar a competitividade
internacional do setor. Atualmente,
a América Latina tem 66 ações de
defesa comercial em vigor, 44 delas
contra a China.
The Latin American economy maintains the growth rate that began the first trimester of previous year. Despite the political uncertainty, the escalatory trade tensions, and the strong financial crisis in Argentina, Latin America expects to set a 1.2% GDP expansion in 2018 supported by stronger global growth and the high prices of commodities.In 2018, apparent steel use will reach to 68.5 million tons (Mt), while finished steel output will reach to 55.9 Mt, 1.3% and 5.6% higher than 2017, respectively.Forecasts includes an increase in world consumption of 3.9%, and 6.0% in China.Latin America total imports will reach 23.5 Mt, which represents a contraction of 6% compared to 2017, however regional consumption is supplied by 34% for these imports.Since 2015, the regional governments in cooperation with steel companies have strengthened their efforts to level the playing field, establishing antidumping actions and safeguards, pursuing to ensure international competitiveness in the industry. Currently, Latin America has 66 trade defense actions in force, 44 of these are against China.
Francisco Leal
Diretor Geral / General DirectorAlacero
8. Alacero
_ _ 8. Alacero
_ _
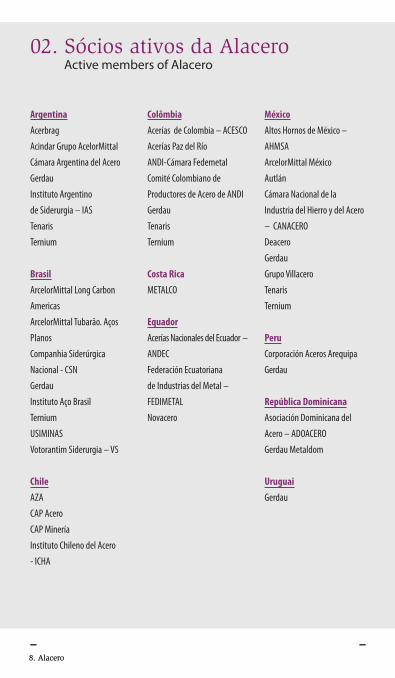
ArgentinaAcerbrag
Acindar Grupo AcelorMittal
Cámara Argentina del Acero
Gerdau
Instituto Argentino
de Siderurgia – IAS
Tenaris
Ternium
BrasilArcelorMittal Long Carbon
Americas
ArcelorMittal Tubarão. Aços
Planos
Companhia Siderúrgica
Nacional - CSN
Gerdau
Instituto Aço Brasil
Ternium
USIMINAS
Votorantim Siderurgia – VS
ChileAZA
CAP Acero
CAP Minería
Instituto Chileno del Acero
- ICHA
México Altos Hornos de México –
AHMSA
ArcelorMittal México
Autlán
Cámara Nacional de la
Industria del Hierro y del Acero
– CANACERO
Deacero
Gerdau
Grupo Villacero
Tenaris
Ternium
PeruCorporación Aceros Arequipa
Gerdau
República DominicanaAsociación Dominicana del
Acero – ADOACERO
Gerdau Metaldom
UruguaiGerdau
ColômbiaAcerías de Colombia – ACESCO
Acerías Paz del Río
ANDI-Cámara Fedemetal
Comité Colombiano de
Productores de Acero de ANDI
Gerdau
Tenaris
Ternium
Costa RicaMETALCO
EquadorAcerías Nacionales del Ecuador –
ANDEC
Federación Ecuatoriana
de Industrias del Metal –
FEDIMETAL
Novacero
02. Sócios ativos da AlaceroActive members of Alacero

América Latina em Cifras Latin America in Figures 9
_ __ _
Os sócios da Alacero produzem cerca de 70 milhões de toneladas por ano na região.
Alacero´s members produce about 70 million tons a year in the region.
RepúblicaDominicana
Uruguai
Brasil
Colômbia
México
Costa Rica
Equador
Peru
Chile
Argentina

10. Alacero
_ _
3 key figures to understand the steel industry today
Global Overcapacity
tons is the estimated global overcapacity installed, in which China is responsible for 50%, with 280 million tons. This level is equivalent to 4.1 times the steel consumption in Latin America.
Chinese Steel Industry
tons was the Chinese´s production of crude steel in 2017. Meanwhile, China’s apparent steel consumption recorded 737 million tons, while total exports reached 73 million tons.
Unfair Trade
in force antidumping resolutions and/or safeguards related to steel products in Latin America are against China.
560 million
832 million
44 out of 66
© Marco Mendizábal

América Latina em Cifras Latin America in Figures 11
_ _
3 indicadores para entender a indústria do aço hoje
Excesso de Capacidade Global
de toneladas é a estimativa sobre capacidade instalada a nível global,
na qual a China é responsável por 50%, com 280 milhões de toneladas.
O que representa 4,1 vezes o consumo de aço na América Latina.
Siderurgia Chinesa
de toneladas foi a produção de aço bruto da China em 2017. Por sua
vez, o consumo aparente de laminados registrou 737 milhões de
toneladas, enquanto as exportações totais atingiram 73 milhões de
toneladas.
Comércio Desleal
ações de defesa comercial e/ou antidumping relacionadas ao aço, em
vigor na América Latina, são contra a China.
560 milhões
832 milhões
44 de 66

12. Alacero
_ _
04. Produção de aço brutoCrude steel production
12. Alacero
_The steel industry is fundamental for the metal-mechanic chain’ s development
_A indústria do aço é fundamental para o desenvolvimento da cadeia metal-mecânica

América Latina em Cifras Latin America in Figures 13
_ _
O ano de 2017 foi um ponto
decisivo para a indústria, apoiado
em condições mais favoráveis para
a recuperação produtiva e um
moderado aumento nos preços do
mercado siderúrgico. O ano de 2018
começou com expectativas muito
boas, que se mantêm apesar das
adversidades internas e externas
que ocorreram até o momento.
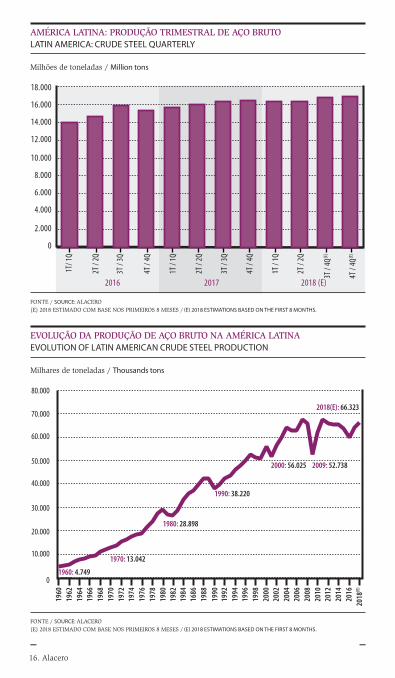
Até o final de 2018, a produção
de aço bruto deverá atingir 66,3
milhões de toneladas, o que
representaria um aumento de 3,2%
em relação ao ano anterior.
The recovery continues
The year 2017 was a turning point for the industry supported by better conditions for the productive recovery and a moderate rise in the prices of the steel market. 2018 began with very good expectations, which have remained despite internal and external adversities that have been faced so far this year.By the end of 2018, crude steel production is expected to reach 66.3 million tons, which represents an increase of 3.2% over the previous year.
Ritmo de recuperação é mantido

14. Alacero
_ _
China
Japão / Japan
Índia
Estados Unidos / United States
Rússia
Coreia do Sul / South Korea
Alemanha / Germany
Turquia / Turkey
Brasil / Brazil
Itália / Italy
Taiwan - China
Ucrânia / Ukraine
Irã / Iran
México / Mexico
França / France
Espanha / Spain
Canadá
Vietnã
Polônia / Poland
Austria
Bélgica / Belgium
Reino Unido / United Kingdom
Egito / Egypt
Holanda / The Netherlands
África do Sul / South Africa
Austrália
Eslovaquia / Slovak Republic
Paquistão / Pakistan
Arábia Saudita / Saudi Arabia
Indonésia
Outros / Other
Total Mundial / World Total
1
2
3
4
5
6
7
8
9
11
12
10
14
13
15
16
17
19
18
22
20
21
28
23
24
27
29
36
25
29
807,6
104,8
95,5
78,5
70,5
68,6
42,1
33,2
31,3
23,4
21,8
24,2
17,9
18,8
14,4
13,6
12,6
7,8
9
7,4
7,7
7,6
5
6,9
6,1
5,3
4,8
3,6
5,5
4,7
66,8
1.627,0
2016
Ranking Volume
1
2
3
4
5
6
7
8
9
10
11
12
13
14
15
16
17
18
19
20
21
22
23
24
25
26
27
28
29
30
831,7
104,7
101,4
81,6
71,3
71
43,4
37,5
34,4
24,1
22,4
21,3
21,2
19,9
15,5
14,5
13,6
11,5
10,3
8,1
7,8
7,5
6,9
6,8
6,3
5,3
5
5
4,8
4,8
69,8
1.689,4
2017
VolumeRanking
FONTE / SOURCE: WORLDSTEEL IN FIGURES 2018
País / Country
MUNDO: RANKING DE PRODUÇÃO DE AÇO BRUTOWORLD: RANKING OF CRUDE STEEL PRODUCTION
Milhões de toneladas / Million tons

REPARTICIÓN REGIONAL DE LAPRODUCCIÓN DE ACERO CRUDO 2018(E)
REGIONAL SHARE OF CRUDE STEELPRODUCTION 2018(E)
Brasil/Brazil (55%)Argentina (8%)Chile (2%)
México/Mexico (32%)Peru (2%)Outro/Other (4%)
2%
4%2%
8%
32% 55%
América Latina em Cifras Latin America in Figures 15
_
PRODUÇÃO LATINO-AMERICANA DE AÇO BRUTO 2018(E)
LATIN AMERICAN CRUDE STEELPRODUCTION 2018(E)
milhões de
toneladas
million tons66,3
da produção
mundial
of global production
3,7% vai aumentar a
produção vs. 2017
production willincrease vs. 2017
3,2%
Brasil / Brazil
México / Mexico
Argentina
Peru
Chile
Colômbia / Colombia
Equador / Ecuador
Guatemala
Cuba
Venezuela
El Salvador
Uruguai / Uruguay
Outros / Other Latam
Total
33.897
18.930
5.488
1.078
1.118
1.079
667
395
256
1.485
121
94
638
65.247
33.256
18.228
5.028
1.082
1.358
1.112
720
403
284
1.345
124
97
639
63.676
31.275
18.811
4.126
1.168
1.272
1.153
576
314
244
553
100
61
70
59.723
34.365
19.924
4.624
1.207
1.253
1.158
561
294
221
444
96
58
24
64.229
35.209
20.694
5.458
1.240
1.157
1.098
583
300
225
173
99
60
25
66.323
2%
4%
18%
3%
-8%
-5%
4%
2%
2%
-61%
3%
4%
4%
3%
201620152014 2017 2018(E) Var.́ 18/́ 17
AMÉRICA LATINA: PRODUÇÃO DE AÇO BRUTO POR PAÍSESLATIN AMERICA: CRUDE STEEL PRODUCTION BY COUNTRY
País / Country
FONTE / SOURCE: ALACERO(E) 2018 ESTIMADO COM BASE NOS PRIMEIROS 8 MESES / (E) 2018 ESTIMATIONS ARE BASED ON THE FIRST 8 MONTHSOUTROS LATAM INCLUEM A PARAGUAI E TRINIDAD & TOBAGO / OTHER LATAM INCLUDES PARAGUAY AND TRINIDAD & TOBAGO
Milhares de toneladas / Thousand tons
FONTE / SOURCE: ALACERO(E) 2018 ESTIMADO COM BASE NOS PRIMEIROS 8 MESES / (E) 2018 ESTIMATIONS ARE BASED ON THE FIRST 8 MONTHS
DISTRIBUIÇÃO REGIONAL DA PRODUÇÃO DE AÇO BRUTO 2018(E)
REGIONAL SHARE CRUDE STEELPRODUCTION 2018(E)
REPARTICIÓN REGIONAL DE LAPRODUCCIÓN DE ACERO CRUDO 2018(E)
REGIONAL SHARE OF CRUDE STEELPRODUCTION 2018(E)
Brasil/Brazil (55%)Argentina (8%)Chile (2%)
México/Mexico (32%)Perú/Peru (2%)Otros/Other (4%)
2%
4%2%
8%
32% 55%
16. Alacero
_ _
1960: 4.749
1970: 13.042
1980: 28.898
1990: 38.220
2000: 56.025 2009: 52.738
2018(E): 66.323
1962
1960
1964
1966
1968
1970
1972
1974
1976
1978
1980
1982
1984
1686
1988
1990
1992
1994
1996
1998
2000
2002
2004
2006
2008
2010
2012
2014
2016
2018
(E)
FONTE / SOURCE: ALACERO(E) 2018 ESTIMADO COM BASE NOS PRIMEIROS 8 MESES / (E) 2018 ESTIMATIONS BASED ON THE FIRST 8 MONTHS.
2016 2017 2018 (E)
18.000
16.000
14.000
12.000
10.000
8.000
6.000
4.000
2.000
0
AMÉRICA LATINA: PRODUÇÃO TRIMESTRAL DE AÇO BRUTOLATIN AMERICA: CRUDE STEEL QUARTERLY
Milhões de toneladas / Million tons
EVOLUÇÃO DA PRODUÇÃO DE AÇO BRUTO NA AMÉRICA LATINAEVOLUTION OF LATIN AMERICAN CRUDE STEEL PRODUCTION
Milhares de toneladas / Thousands tons
FONTE / SOURCE: ALACERO(E) 2018 ESTIMADO COM BASE NOS PRIMEIROS 8 MESES / (E) 2018 ESTIMATIONS BASED ON THE FIRST 8 MONTHS.

América Latina em Cifras Latin America in Figures 17
_ _
AMÉRICA LATINA: PRODUÇÃO DE FERRO PRIMÁRIO(A) LATIN AMERICA: PRIMARY IRON PRODUCTION (A)
Brasil / Brazil
México / Mexico
Argentina
Chile
Venezuela
Colômbia / Colombia
Paraguai / Paraguay
Trinidad & Tobago
Peru
América Latina /
Latin America
27.016
11.095
4.427
584
1.402
234
71
2.168
88
47.086
27.803
10.074
3.934
644
1.356
240
73
2.199
72
46.396
26.036
9.782
2.914
677
659
225
50
129
11
40.482
28.426
10.256
3.402
670
491
203
38
-
-
43.486
28.362
10.373
3.951
664
491
213
39
-
-
44.093
0%
1%
16%
-1%
0%
5%
4%
nd
nd
1%
201620152014 2017 2018(E) Var.́ 18/́ 17País / Country
Milhares de toneladas / Thousand tons
FONTE / SOURCE: ALACERO (A) FERRO PRIMÁRIO INCLUI FERRO GUSA E FERRO ESPONJA / (A) PRIMARY IRON INCLUDES PIG IRON AND SPONGE IRON.(E) 2018 ESTIMADO COM BASE NOS PRIMEIROS 8 MESES / (E) 2018 ESTIMATIONS BASED ON THE FIRST 8 MONTHS.
PRODUÇÃO DE FERRO PRIMÁRIO 2018(E)
PRIMARY IRON PRODUCTION 2018(E)
milhões de
toneladas
million tons44,1
do ferro primário regional é produzido no Brasil
of the primary iron production comes from Brazil
64%
vai aumentar a
produção vs. 2017
production increase vs. 2017
1,4%
DISTRIBUIÇÃO DA PRODUÇÃO DE FERRO PRIMÁRIO POR PAÍSPRIMARY IRON PRODUCTION DISTRIBUTION BY COUNTRIES
DISTRIBUCIÓN DE LA PRODUCCIÓN DE HIERRO PRIMARIO POR PAÍSES
PRIMARY IRON PRODUCTION DISTRIBUTION BY COUNTRIES
Brasil/Brazil (65%)Argentina (9%)Chile (1%)
México/Mexico (24%)Venezuela (2%)Outro/Other (0%)
1%2% 1%
65%
24%
9%
FONTE / SOURCE: ALACERO
DISTRIBUCIÓN DE LA PRODUCCIÓN DE HIERRO PRIMARIO POR PAÍSES
PRIMARY IRON PRODUCTION DISTRIBUTION BY COUNTRIES
Brasil/Brazil (65%)Argentina (9%)Chile (1%)
México/Mexico (24%)Venezuela (2%)Otros/Other (0%)
1%2% 1%
65%
24%
9%

18. Alacero
_ _
05. Produção e consumo de laminados Finished steel production and consumption
_O aço está presente em todas as atividades diárias, tornando a vida diária mais fácil e prazerosa
_Steel is present in all our everyday activities, making our life easier and more enjoyable.

América Latina em Cifras Latin America in Figures 19
_ _
2018: Um bom ano apesar das adversidades
Em 2018, a demanda por laminados
na América Latina deve crescer
1,3% em relação a 2017, atingindo
68,5 milhões de toneladas,
crescendo abaixo do potencial da
região devido a fatores internos; a
incerteza política latente no Brasil,
no México e na Colômbia devido
ao ciclo eleitoral, bem como a
crise financeira na Argentina e
fatores externos; as crescentes
tensões comerciais causadas pelo
protecionismo dos Estados Unidos.
Além disso, prevê-se um aumento
no consumo global de 3,9% e 6,0%
na China. A produção de laminados
na região, em 2018, alcançará
52,8 milhões de toneladas, o que
representa um aumento de 3,2%
em relação a 2017.
2018: A good year despite the adversities
In 2018, the apparent finished steel use in Latin America is expected to increase 1.3% versus 2017, reaching 68.5 million tons, growing below the potential of the region due to internal factors; the political uncer-tainty latent in Brazil, Mexico and Colombia due to the electoral cycle, and the financial crisis in Argentina, and external factors; the escalatory trade tensions caused by the United States protectionism.Additionally, an increase in global consumption of 3.9% and 6.0% in China is forecast. The production of finished steel in the region will reach 52.8 million tons in 2018, which represents an increase of 3.2% compared to 2017.

20. Alacero
_ _
Argentina
Brasil / Brazil
Chile
Colômbia / Colombia
México / Mexico
Peru
Venezuela
Outros / Other
América Latina /
Latin America
14.895
8.803
13.549
6.089
9.674
6.150
7.923
5.223
8.378
12.709
8.701
13.738
5.800
8.815
6.178
7.688
5.282
8.000
14.463
9.896
15.068
6.380
9.319
6.732
6.890
5.536
8.722
10.667
9.127
16.143
6.761
9.614
7.118
3.300
5.744
8.196
-26%
-8%
7%
6%
3%
6%
-52%
4%
-6%
20162015 2017 2018E) Var.́ 18/́ 17
AMÉRICA LATINA: PRODUTO INTERNO BRUTO PER CAPITA (US$)LATIN AMERICA: GROSS DOMESTIC PRODUCT PER CAPITA (US$)
País / Country
FONTE / SOURCE: IMF WEO OCTOBER 2018. CEPAL / ECLAC (E) 2018 ESTIMADO / (E) 2018 ESTIMATED.OUTROS INCLUEM O RESTO DOS PAÍSES DA AMÉRICA LATINA / OTHERS INCLUYE THE RESTO OF LATIN AMERICAN´S COUNTRIES
FONTE / SOURCE: IMF WEO OCTOBER 2018. CEPAL / ECLAC (E) 2018 ESTIMADO COM BASE NOS PRIMEIROS 8 MESES / (E) 2018 ESTIMATIONS BASED ON THE FIRST 8 MONTHS.
2016
140
2015
2014
2013
2012
2011
2010
2009
2008
120
140
80
60
40
Kg
12.000
10.000
8.000
6.000
4.000
US$
2017
107
85
113 113118 119 118
114
104 107
7.711
9.9449.776
8.3788.000
8.722
9.9149.983
8.674
7.016
2018
(E)
107
8.196
AMÉRICA LATINA: RELAÇÃO ENTRE CONSUMO DE AÇO E PIB (PER CAPITA)LATIN AMERICA: RELATIONSHIP BETWEEN ASU (PER CAPITA) AND GDP (PER CAPITA)
Consumo de aço per capita / ASU per capitaPIB per cápita / GDP per capita
US$ - precios corrientes / US$ current prices
Kg uS$
13.209
12.112
14.620
7.999
10.981
6.563
7.030
5.242
9.776
2014

América Latina em Cifras Latin America in Figures 21
_ _
Aço e crescimento
A indústria siderúrgica é um
dos pilares do desenvolvimento
econômico e social da América
Latina, registrando uma alta
proporção de consumo aparente
de aço per capita com o Produto
Interno Bruto per capita (PIB pc).
Os níveis atuais de consumo de
aço per capita continuam bem
abaixo da média mundial, um sinal
do caminho que ainda precisa ser
percorrido.
Steel and growth
The steel industry is one of the pillars of the economic and social development of Latin America, showing a high correlation between Apparent Steel Consumption per capita (ASU pc) and GDP pp. The current ASU pp levels remain well below the world average, sign that we still have a long way to go.
Argentina
Brasil / BrazilChile
Colômbia / Colombia
México / MexicoPeru
Venezuela
Outros Latam /
Other LatamAmérica Latina /
Latin AmericaUnião Européia
(28) / Europea Union (28)*Estados Unidos /
United States*Coreia do Sul /
South Korea*Mundo / World*
117
124
148
83
191
94
68
59
118
294
337
1.102
212
201620152014 2017 2018(E) Var.́ 18/́ 17
AMÉRICA LATINA: CONSUMO APARENTE DE AÇO LAMINADO PER CAPITALATIN AMERICA: APPARENT STEEL USE PER CAPITA
País / Country
FONTE / SOURCE: ALACERO - CEPAL/ECLAC - WORLDSTEEL (PRELIMINAR SRO OCT. 2018 / PRELIMINARY SRO OCT. 2018)OUTROS INCLUI O RESTO DOS PAÍSES DA AMÉRICA LATINA / OTHER LATAM INCLUDES REST OF LATIN AMERICA(E) ESTIMADO / (E) ESTIMATED
KgS
121
102
156
84
200
111
60
59
114
303
300
1.103
204
96
87
153
75
202
103
24
56
104
310
285
1.124
204
112
91
152
73
207
114
16
56
107
320
301
1.106
211
111
95
152
74
200
116
16
57
107
327
306
1.057
217
0%
4%
0%
2%
-3%
2%
-1%
2%
0%
2%
2%
-4%
3%

22. Alacero
_
Ásia
China
União Europeia (28)
/ European Union (28)
América do Norte/
North America
América Latina /
Latin America
Oriente Médio /
Middle East
Países CIS /
CIS Countries
Outros Europa /
Others Europe
África
Austrália & N.Z.
Mundo / World
1.011,1
710,8
148,9
122,7
72,3
54,5
57,7
37,0
37,4
7,6
1.550
977,5
672,3
153,7
109,5
70,5
53,8
52,4
40,1
38,7
7,4
1.504
1.000,6
681,0
157,6
106,9
64,9
53,1
50,9
40,7
37,6
6,9
1.520
1.058,5
736,8
163,0
114,3
67,6
53,3
54,0
42,6
34,9
6,6
1.595
1.110,5
781,0
166,8
117,3
68,5
54,5
54,8
41,9
36,0
7,3
1.658
4,9%
6,0%
2,3%
2,6%
1,3%
2,1%
1,4%
-1,6%
3,1%
11,2%
3,9%
201620152014 2017 Var.́ 18/́ 17
MUNDO: CONSUMO APARENTE DE PRODUTOS LAMINADOS WORLD: APPARENT FINISHED STEEL USE
Região / Region
Milhões de toneladas / Million tons
Consumo aparente de aço
Estima-se que o consumo aparente
de aço em 2018 na América Latina
cresça 1,3% em relação a 2017,
ante uma média mundial que
registrará um crescimento de 3,9%.
Por outro lado, o consumo da
China crescerá 6%, e o da América
do Norte crescerá 2,6%. Enquanto
isso, a União Europeia (28) terá um
crescimento de 2,3% em 2018.
Apparent steel use
The steel industry is one of the pillars of the economic and social development of Latin America, showing a high correlation between Apparent Steel Consumption per capita (ASU pc) and GDP pp. The current ASU pp levels remain well below the world average, sign that we still have a long way to go.
2018(E)
FONTES: ALACERO PARA AMÉRICA LATINA E WORLDSTEEL PRELIMINAR SRO OCTUBRE 2018 PARA RESTO DO MUNDO /SOURCE: ALACERO FOR LATIN AMERICA AND WORLDSTEEL PRELIMINARY SRO OCTOBER 2018 FOR ROW(E) 2018 ESTIMADO / (E) 2018 ESTIMATED

América Latina em Cifras Latin America in Figures 23
_ _
Argentina
Brasil / Brazil
Chile
Colômbia / Colombia
México / Mexico
Peru
Venezuela
Outros / Other
América Latina /
Latin America
5,0
25,6
2,6
4,0
23,5
2,9
2,0
6,7
72,3
5,3
21,3
2,8
4,0
25,0
3,5
1,8
6,9
70,5
4,2
18,2
2,8
3,7
25,5
3,3
0,7
6,6
64,9
4,9
19,2
2,8
3,6
26,4
3,7
0,5
6,6
67,6
5,0
20,1
2,8
3,7
25,9
3,8
0,5
6,8
68,5
0,8%
4,9%
1,1%
2,5%
-1,9%
3,3%
0,0%
2,7%
1,3%
201620152014 2017 2018(E) Var.́ 18/́ 17
AMÉRICA LATINA: CONSUMO APARENTE DE PRODUTOS LAMINADOS LATIN AMERICA: APPARENT FINISHED STEEL USE
País / Country
Milhões de toneladas / Million tons
FONTE / SOURCE: ALACERO. INFORMAÇÃO FORNECIDA PELAS SECRETARIAS REGIONAIS / ALACERO. DATA SUBMITED BY REGIONAL SECRETARIES. NOTA / NOTE: 2018 SÃO PROJEÇÕES FEITAS COM BASE NO SRO DA AMÉRICA LATINA / 2018 ARE FORECASTS BASED ON THE LATIN AMERICA SRO.OUTROS INCLUEM CUBA, EQUADOR, EL SALVADOR, GUATEMALA, HONDURAS, PANAMA, PARAGUAI, REPÚBLICA DOMINICANA E URUGUAI / OTHERS INCLUDE CUBA, DOMINICAN REPUBLIC, ECUADOR, EL SALVADOR, GUATEMALA, HONDURAS, PANAMA, PARAGUAY, AND URUGUAY.
FONTE / SOURCE: ALACERO
Construção/Construction (51%) Electrodomesticos/Domestic Appliances (1%)Equipamentos Elétricos/Electrical Equipment (2%)
Maquinaria Mecânica/Mechanical Machinery (14%)
Produtos Métalicos/Metal Products (18%)
Automotive/Automotive (12%)Outro Transporte/Other Transport (1%)
51%
12%
18%
14%
1%
1%2%
AMÉRICA LATINA: USO DE AÇO POR SETORES EM 2017LATIN AMERICA: STEEL USE BY SECTORS 2017

24. Alacero
México / Mexico
Brasil / Brazil
Peru
Argentina
Colômbia / Colombia
Chile
Ecuador / Equador
Guatemala
Costa Rica
Rep. Dominicana /
Dominican Rep.
Venezuela
Cuba
El Salvador
Uruguai / Uruguay
Outros / Others
América Latina /
Latin America
Brasil / Brazil
México / Mexico
Argentina
Colômbia / Colombia
Venezuela
Peru
Rep. Dominicana /
Dominican Rep.
América Latina /
Latin America
8.084
10.688
1.725
1.312
1.394
1.017
707
574
516
460
726
105
83
79
425
27.894
14.229
8.594
2.546
410
635
60
-
26.474
8.301
9.253
1.656
1.291
1.420
1.035
761
591
426
474
504
126
85
81
438
26.442
13.388
8.533
2.556
440
756
52
-
25.725
8.742
8.647
1.333
1.360
1.326
1.081
696
474
436
382
305
130
97
75
19
25.102
12.273
9.154
2.274
447
225
57
46
24.476
8.731
8.734
1.594
1.462
1.414
1.062
710
454
417
378
158
114
90
66
21
25.406
13.688
9.023
2.374
482
246
55
54
25.922
9.227
9.365
1.885
1.503
1.397
1.112
754
476
463
401
138
120
95
70
23
27.029
14.417
9.682
2.351
421
95
58
60
27.084
5%
7%
-1%
-13%
-61%
5%
10%
4%
2016
2016
2015
2015
2014
2014
2017
2017
2018(E)
2018(E)
Var.́ 18/́ 17
Var.́ 18/́ 17
AMERICA LATINA: PRODUÇÃO DE AÇOS LONGOSLATIN AMERICA: LONG STEEL PRODUCTION
AMÉRICA LATINA: PRODUÇÃO DE AÇO PLANOLATIN AMERICA: FLAT STEEL PRODUCTION
País / Country
País / Country
FONTE / SOURCE: ALACERO. INFORMAÇÃO FORNECIDA PELAS SECRETARIAS REGIONAIS / ALACERO. DATA SUBMITED BY REGIONAL SECRETARIES OUTROS INCLUI PARAGUAI E TRINIDAD & TOBAGO / OTHERS INCLUDE PARAGUAY AND TRINIDAD Y TOBAGO(E) 2018 ESTIMADO COM BASE NOS PRIMEIROS 8 MESES / (E) 2017 ESTIMATIONS ARE BASED ON THE FIRST 8 MONTHS
FONTE / SOURCE: ALACERO. INFORMAÇÃO FORNECIDA PELAS SECRETARIAS REGIONAIS / ALACERO. DATA SUBMITED BY REGIONAL SECRETARIES. (E) 2018 ESTIMADO EN BASE A LOS 8 PRIMEROS MESES / (E) 2018 ESTIMATIONS ARE BASED ON THE FIRST 8 MONTHS
Milhares de toneladas / Thousand tons
Milhares de toneladas / Thousand tons
6%
7%
18%
3%
-1%
5%
6%
5%
11%
6%
-13%
5%
5%
5%
6%
6%

América Latina em Cifras Latin America in Figures 25
_ __ __ _
Argentina
Brasil / Brazil
México / Mexico
Venezuela
América Latina /
Latin America
750
657
1.064
-
2.471
360
388
739
-
1.486
376
391
801
-
1.568
621
384
939
-
1.944
736
427
1.000
-
2.164
19%
11%
7%
0%
11%
201620152014 2017 2018(E) Var.́ 18/́ 17
AMÉRICA LATINA: PRODUÇÃO DE TUBOS SEM COSTURALATIN AMERICA: SEAMLESS TUBES PRODUCTION
País / Country
Milhões de toneladas / Million tons
PRODUÇÃO LATINO-AMERICANA
DE LAMINADOS 2018
LATIN AMERICAN FINISHED STEEL PRODUCTION 2018
Milhões de toneladas
Million tons55,8 FONTE / SOURCE: ALACERO. INFORMAÇÃO FORNECIDA PELAS SECRETARIAS REGIONAIS / ALACERO. DATA SUBMITED BY REGIONAL SECRETARIES(E) 2018 ESTIMADO COM BASE NOS PRIMEIROS 8 MESES / (E) 2018 ESTIMATIONS ARE BASED ON THE FIRST 8 MONTHS
2016 2017 2018(E)
AMÉRICA LATINA: PRODUCCIÓN Y CONSUMO TRIMESTRAL DE LAMINADOSLATIN AMERICA: QUARTERLY FINISHED STEEL PRODUCTION AND USE
21.000
18.000
15.000
12.000
9.000
6.000
3.000
0
AMÉRICA LATINA: PRODUÇÃO E CONSUMO TRIMESTRAL DE LAMINADOSLATIN AMERICA: QUARTERLY FINISHED STEEL PRODUCTION AND USE
Milhões de toneladas / Million tons
2016 2017 2018(E)
AMÉRICA LATINA: PRODUCCIÓN Y CONSUMO TRIMESTRAL DE LAMINADOSLATIN AMERICA: QUARTERLY FINISHED STEEL PRODUCTION AND USE
21.000
18.000
15.000
12.000
9.000
6.000
3.000
0
Produção / Production Consumo / Consumption
FONTE / SOURCE: ALACERO. INFORMAÇÃO FORNECIDA PELAS SECRETARIAS REGIONAIS / DATA SUBMITED BY REGIONAL SECRETARIES (E) 3T Y 4T 2018 ESTIMADO EN BASE A LOS 8 PRIMEROS MESES / (E) 3Q AND 4Q 2018 ESTIMATIONS ARE BASED ON THE FIRST 8 MONTHS

26. Alacero
_ _
06. Comércio siderúrgico latino-americano Latin American steel trade
_O aço é essencial paraalcançar uma economia circular: Reduzir, Reutilizar, Recuperar, Repensar.
_Steel is fundamental to achievinga circular economy:Reduce, Reuse, Recover, Rethink.
América Latina em Cifras Latin America in Figures 27
_ __ __ _
As importações ainda são uma ameaça
As importações totais de aço
realizadas pela América Latina
reduziram em relação a 2017
principalmente devido ao menor
saldo exportador da China, mas
a participação das importações
sobre o consumo permanece
elevada, e estima-se que atinja
34% até o final de 2018. Esta
situação ocorre e se agrava ano
após ano, gerando desincentivos
para a indústria local, atritos
comerciais e ameaças de desem-
prego. Além disso, em muitos
casos, esses produtos entram
na região a preços de dump-
ing, de países com economias
“não-mercantis”, que subsidiam
a produção de aço e fornecem
facilidades financeiras, fora das
diretrizes da OMC para suas
indústrias. Em 2017, a China
embarcou 7,0 milhões de tonela-
das de aço para a região.
Desde 2015, os governos locais e
as empresas siderúrgicas têm
fortalecido seus esforços para
nivelar o campo de atuação,
seguindo os procedimentos
permitidos pela OMC, por meio
do estabelecimento de ações
antidumping e salvaguardas, bus-
cando garantir a competitividade
internacional do setor.
Imports are still a threat
Total steel imports received by Latin America have contracted with re-spect to 2017, mainly due to China lower export balance, however the share of imports over consumption remains high, and it is estimated to reach 34% by the end of 2018. This situation remains or aggravated year after year, generating disincen-tives for the local industry, trade frictions and threatens jobs. In addi-tion, in many cases these products enter the region at dumping prices, from countries with ‘non-market’ economies, which subsidize steel production and provide financial fa-cilities, outside the WTO guidelines for their industries. In 2017, China shipped 7.0 million tonnes of steel to the region.Since 2015, local governments and steel companies have strengthened their efforts to level the playing field, following the procedures allowed by the WTO, through the establishment of anti-dumping and safeguard actions, seeking to ensure the international competi-tiveness of the industry.

28. Alacero
_ _
Argentina
Brasil / Brazil
Chile
Colômbia / Colombia
México / Mexico
Peru
Venezuela
Outros / Other
América Latina /
Latin America
Argentina
Brasil / Brazil
Chile
Colômbia / Colombia
México / Mexico
Peru
Venezuela
Outros / Other
América Latina /
Latin America
790
3.389
82
85
3.579
162
20
431
8.538
762
3.921
1.561
2.645
8.716
2.054
732
4.327
24.719
394
4.905
67
49
2.910
162
72
491
9.050
1.054
2.825
1.854
2.661
10.217
1.593
956
4.427
25.587
391
4.717
78
60
3.134
203
41
576
9.200
573
1.398
1.604
2.392
9.925
1.750
189
4.455
22.286
706
5.455
99
79
3.349
236
0
699
10.623
1.021
1.995
1.719
2.200
11.086
2.378
108
4.587
25.095
722
5.246
146
114
3.749
217
-
750
10.944
1.302
2.103
1.835
2.428
9.304
1.659
55
4.782
23.467
2%
-4%
48%
44%
12%
-8%
-100%
7%
3%
28%
5%
7%
10%
-16%
-30%
-49%
4%
-6,5%
2016
2016
2015
2015
2014
2014
2017
2017
2018E)
2018(E)
Var.́ 18/́ 17
Var.́ 18/́ 17
AMÉRICA LATINA: EXPORTAÇÕES DE AÇO LAMINADOLATIN AMERICA: FINISHED STEEL EXPORTS
AMÉRICA LATINA: IMPORTAÇÃO DE AÇO LAMINADOLATIN AMERICA: FINISHED STEEL IMPORTS
País / Country
País / Country
FONTE / SOURCE: ALACERO, INFORMAÇÃO FORNECIDA PELAS SECRETARIAS REGIONAIS / INFORMATION SUBMITED BY REGIONAL SECRETARIESOUTROS INCLUEM CUBA, EQUADOR, EL SALVADOR, GUATEMALA, HONDURAS, PANAMÁ, PARAGUAI, REPÚBLICA DOMINICANA E URUGUAI / OTHERS INCLUDE CUBA, DOMINICAN REPUBLIC, ECUADOR, EL SALVADOR, GUATEMALA, HONDURAS, PANAMA, PARAGUAY, AND URUGUAY(E) 2018 ESTIMADO COM BASE NOS PRIMEIROS 8 MESES / (E) 2018 ESTIMATIONS ARE BASED ON THE FIRST 8 MONTHS
FONTE / SOURCE: ALACERO, INFORMAÇÃO FORNECIDA PELAS SECRETARIAS REGIONAIS/ INFORMATION SUBMITED BY REGIONAL SECRETARIESOUTROS INCLUEM CUBA, EQUADOR, EL SALVADOR, GUATEMALA, HONDURAS, PANAMÁ, PARAGUAI, REPÚBLICA DOMINICANA E URUGUAI / OTHERS INCLUDE CUBA, DOMINICAN REPUBLIC, ECUADOR, EL SALVADOR, GUATEMALA, HONDURAS, PANAMA, PARAGUAY, AND URUGUAY. (E) 2018 ESTIMADO COM BASE NOS PRIMEIROS 8 MESES / (E) 2018 ESTIMATIONS ARE BASED ON THE FIRST 8 MONTHS
Milhares de toneladas / Thousand tons
Milhares de toneladas / Thousand tons

América Latina em Cifras Latin America in Figures 29
_ _
DÉFICIT COMERCIAL DE AÇO NA AMÉRICA LATINA 2018LATIN AMERICA STEEL TRADE DEFICIT 2018
milhões de toneladas
million tons
é a participação
das importações
sobre o consumo
is the share of imports over consumption
12,5
34%
0
-2.000
-4.000
-6.000
-8.000
-10.000
-12.000
-14.000
-16.000
-18.0002018(E)2017201620152014
2018(E)2017201620152014
25
24
23
22
21
20
34%
25
36%
26
34%
22
37%
25
34%
23
38%
36%
34%
32%
26
AMÉRICA LATINA: BALANÇA COMERCIAL DE LAMINADOS(E)
LATIN AMERICA: FINISHED STEEL TRADE BALANCE(E)
Milhares de toneladas / Thousand tons
AMÉRICA LATINA: EVOLUÇÃO DA PARTICIPAÇÃO DAS IMPORTAÇÕES NO CONSUMO DE LAMINADOSLATIN AMERICA: EVOLUTION OF THE SHARE OF IMPORTS IN THE FINISHED STEEL CONSUMPTION
Milhares de toneladas / Thousand tons
Importações / Imports from ChinaÍndice de importação - Consumo / Imports - Use ratio (%)
2018(E)2017201620152014
25
24
23
22
21
20
34%
25
36%
26
34%
22
37%
25
34%
23
38%
36%
34%
32%
26
FONTE / SOURCE: ALACERO. INFORMAÇÃO FORNECIDA PELAS SECRETARIAS REGIONAIS / DATA SUBMITED BY REGIONAL SECRETARIES. (E) 2018 ESTIMADO COM BASE NOS PRIMEIROS 8 MESES / (E) 2018 ESTIMATIONS ARE BASED ON THE FIRST 8 MONTHS
FONTE / SOURCE: ALACERO, INFORMAÇÃO FORNECIDA PELAS SECRETARIAS REGIONAIS / INFORMATION SUBMITED BY REGIONAL SECRETARIES(E) 2018 ESTIMADO COM BASE NOS PRIMEIROS 8 MESES / (E) 2018 ESTIMATIONS ARE BASED ON THE FIRST 8 MONTHS

30. Alacero
_ _
07. Indicadores econômicos e siderúrgicos da América Latina Latin America: Economic and steel indicators
_Uma adequada infraestrutu-ra viária é essencial para a competitividade da indústria siderúrgica e o desenvolvi-mento sustentável na América Latina.
_An appropriate road instructure is essential for the Latin American steel industry and the sustainable development of the region.

América Latina em Cifras Latin America in Figures 31
_ _
Crescimento moderado
Apesar da incerteza política
causada pelos momentos eleitorais
nas principais economias da região,
as crescentes tensões comerciais
geradas pelo protecionismo dos
Estados Unidos e a forte crise
financeira que vem sido mantida
na Argentina desde o segundo
trimestre, a América Latina tem
se beneficiado com o crescimento
econômico global e os altos níveis
de preços das commodities.
Segundo o Fundo Monetário
Internacional (FMI), o crescimento
em 2018 será de 1,2%, mantendo
praticamente o mesmo ritmo do
ano passado. Seria o segundo
ano consecutivo de recuperação
moderada no período recessivo
2015-2016.
Até 2019, é esperado um
crescimento de 2,1% na região,
principalmente como resultado
de recuperações econômicas
mais amplas no Brasil, México e
Colômbia.
Moderate growth
Despite the political uncertainty caused by the electoral cycles in the main economies of the region, the escalatory trade tensions due to United States protectionism, and the strong financial crisis that is facing Argentina since second tri-mester, Latin America has benefited from world economic growth and high levels of commodity prices.According to the International Mon-etary Fund (IMF), growth in 2018 will be 1.2%, maintaining almost the same pace of last year. It would be the second consecutive year of moderate recovery of the recessive period 2015-2016.By 2019, a 2.1% growth is observed in the region, mainly due to of broader economic recoveries in Brazil, Mexico, and Colombia.

32. Alacero
_ _
Argentina
Brasil / Brazil
Chile
Colômbia / Colombia
México / Mexico
Peru
Venezuela
Outros / Other
América Latina /
Latin America
Argentina
Brasil / Brazil
Chile
Colômbia / Colombia
México / Mexico
Peru
Venezuela
América Latina /
Latin America
-2,5%
0,5%
1,8%
4,7%
2,8%
2,4%
-3,9%
4,7%
1,3%
2,7%
-3,5%
2,3%
3,0%
3,3%
3,3%
-6,2%
3,2%
0,3%
-1,8%
-3,5%
1,3%
2,0%
2,9%
4,0%
-16,5%
4,3%
-0,6%
2,9%
1,0%
1,5%
1,8%
2,0%
2,5%
-14,0%
4,6%
1,3%
-2,6%
1,4%
4,0%
2,8%
2,2%
4,1%
-18,0%
4,3%
1,2%
201620152014 2017 2018(E)
AMÉRICA LATINA: EVOLUÇÃO DO PRODUTO INTERNO BRUTOLATIN AMERICA: GROSS DOMESTIC PRODUCT EVOLUTION
AMÉRICA LATINA: EVOLUÇÃO DA PRODUÇÃO INDUSTRIALLATIN AMERICA: INDUSTRIAL PRODUCTION EVOLUTION
País / Country
País / Country
Taxa de variação anual (%) / Annual variation rate (%)
Taxa de variação anual em % / Yearly % variation rate
FONTES / SOURCE: IMF WEO OCTOBER 2018(E) 2018 ESTIMADO COM BASE NOS PRIMEIROS 8 MESES / (E) 2018 ESTIMATIONS ARE BASED ON THE FIRST 8 MONTHS
FONTE / SOURCE: ALACERO. DATOS DE SECRETARÍAS REGIONALES / ALACERO. DATA BY REGIONAL SECRETARIES*CIFRA DE AMÉRICA LATINA CONSIDERA SOLO LOS PAÍSES LISTADOS. LATIN AMERICAN NUMBER CONSIDERER ONLY LISTED COUNTRIES.(E) 2018 ESTIMADO COM BASE NOS PRIMEIROS 8 MESES / (E) 2018 ESTIMATIONS ARE BASED ON THE FIRST 8 MONTHS
-4,2%
-3,0%
0,4%
0,7%
2,6%
-3,6%
-7,2%
-1,6%
0,3%
-8,3%
0,8%
1,2%
1,1%
-1,5%
-6,8%
-3,1%
-5,7%
-6,4%
-1,5%
3,0%
0,4%
-1,4%
nd
-3,7%
2,1%
2,5%
-0,6%
-2,0%
-0,6%
-0,2%
nd
0,8%
0,5%
2,8%
3,1%
2,7%
0,4%
5,1%
nd
1,3%
201620152014 2017 2018(E)

América Latina em Cifras Latin America in Figures 33
_ _
INDICADORES MACROECONÔMICOSMACROECONOMIC INDEXES
expandirão o PIB mundial em 2018 will expand the world GDP in 2017
3,7% expandirão o PIB da América Latina em 2018
will expand the Latin American GDP in 2018
1,2%
de crescimento da
produção industrial
em 2018
will grow industrial production in 2018
1,3%
FONTE / SOURCE: DADOS DE SECRETARIAS REGIONAIS/ ALACERO. DATA BY REGIONAL SECRETARIES. *NÚMEROS DA AMÉRICA LATINA CONSIDERAM APENAS OS PAÍSES LISTADOS / LATIN AMERICAN NUMBER CONSIDERER ONLY LISTED COUNTRIES.(E) 2018 ESTIMADO COM BASE NOS PRIMEIROS 8 MESES / (E) 2018 ESTIMATIONS ARE BASED ON THE FIRST 8 MONTHS
2017
12%
2015201420132012201120102009
8%
4%
0%
-4%
-8%
2016 2018(E)
PIB / GDP % Produção industrial / Industrial Production (%)
AMÉRICA LATINA: RELAÇÃO CRESCIMENTO DO PIB E DA PRODUÇÃO INDUSTRIAL.LATIN AMERICA: RELATIONSHIP BETWEEN GPD GROWTH AND INDUSTRIAL PRODUCTION
34. Alacero
_ _
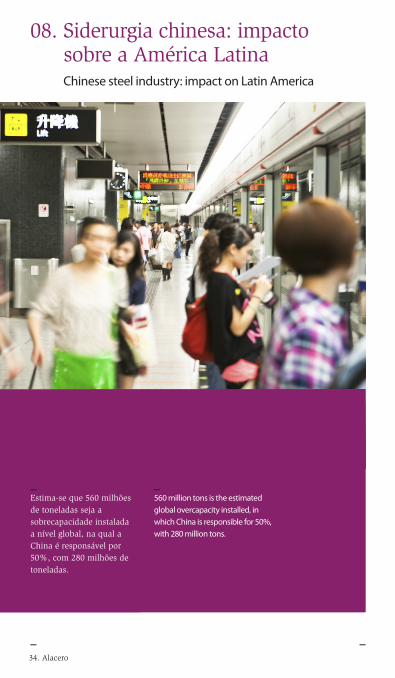
08. Siderurgia chinesa: impacto sobre a América Latina Chinese steel industry: impact on Latin America
_560 million tons is the estimated global overcapacity installed, in which China is responsible for 50%, with 280 million tons.
_Estima-se que 560 milhões de toneladas seja a sobrecapacidade instalada a nível global, na qual a China é responsável por 50%, com 280 milhões de toneladas.
América Latina em Cifras Latin America in Figures 35
_ _
China tem aumento de produção e consumo
A economia da China cumpriu
as expectativas de crescimento,
atingindo uma média de 6,8% du-
rante o primeiro semestre do ano.
Em 2018, as exportações chinesas
de laminados diminuíram em
relação ao ano anterior, principal-
mente devido ao forte crescimento
do consumo aparente de lamina-
dos, que representa 781 milhões
de toneladas (6,0%) a mais do que
em 2017.
Desde 2016, a China iniciou um
plano para reduzir sua capacidade
instalada de aço e, desde então,
conseguiu reverter a tendência de
crescimento acelerado e no final de
2017 sua capacidade era de 1.047
milhões de toneladas, 4% menos
que no ano anterior. Números da
OCDE.
Apesar dessas reduções, a gigante
asiática continua aumentando
seus números de produção. O aço
bruto acumulado produzido nos
primeiros 8 meses do ano é 6% su-
perior ao mesmo período de 2017.
China increases its production and consumption
China’s economy has met growth expectations, reaching an annualized average of 6.8% during the first half of the year.In 2018, Chinese exports finished steel capacity have decreased compared to the previous year, mainly due to the apparent steel consumption strong growth, accounting 781 million tons (6.0%) more than in 2017.In 2016 China started a plan to reduce its installed steel capacity, and since then they have managed to reverse the accelerated growth trend and at the end of 2017 its capacity was 1,047 million tons, 4% less than the previous year according to OECD data.Despite these reductions, the Asian giant continues to raise its production figures. The accumulated crude steel produced during the first 8 months of the year is 6% higher than the same period of 2017.

36. Alacero
_ _
650
700
750
120
100
80
60
40
20
0
2013 2014 2015 2016 2017
Producción / Production Consumo / Consumption Exportaciones / Exports
60
110
800
850
900
73
FONTE / SOURCE: WORLDSTEEL (SRO OCTOBER 2018) / ALACERO / ALFÂNDEGA CHINESA / CHINESE CUSTOMS SERVICE
FONTE / SOURCE: BASE DE DADOS DE EXCESSO DE CAPACIDADE DE PRODUÇÃO DA OCDE / OECD STEELMAKING CAPACITY DATABASE.
SOBRECAPACIDAD DE CHINA Y EL MUNDO
0
100
200
300
400
500
Millones de toneladas / Million tons
2013 2015 2017
Mundo sem China / World without China China
OVERCAPACITY IN THE WORLD AND CHINA
287264 280 280
450
334
PRODUÇÃO, CONSUMO E EXPORTAÇÕES DE AÇO CHINA: PRODUCTION, CONSUMPTION AND EXPORTS OF STEEL
Milhões de toneladas / Million tons
650
700
750
120
100
80
60
40
20
0
2013 2014 2015 2016 2017
Produção / Production Consumo / Consumption Exportações / Exports
60
110
800
850
900
73
EXCESSO DE CAPACIDADE NO MUNDO E NA CHINAOVERCAPACITY IN THE WORLD AND CHINA
Milhões de toneladas / Million tons
SOBRECAPACIDAD DE CHINA Y EL MUNDO
0
100
200
300
400
500
Millones de toneladas / Million tons
2013 2015 2017
Mundo excluyendo China / World without China China
OVERCAPACITY IN THE WORLD AND CHINA
287264 280 280
450
334

América Latina em Cifras Latin America in Figures 37
_ _
2013 2014 2015 2016 2017(E)
6,3
15,7 15,4
9,3 9,4
16,2
7,6
14,7
7,0
18,1
FONTE / SOURCE: ALACERO - ALFÂNDEGA CHINESA / CHINESE CUSTOMS SERVICE
AMÉRICA LATINA: EVOLUÇÃO DE IMPORTAÇÕES DE AÇO LAMINADOLATIN AMERICA: EVOLUTION OF FINISHED STEEL IMPORTS
2013 2014 2015 2016 2017(E)
6,3
15,7 15,4
9,3 9,4
16,2
7,6
14,7
7,0
18,1
Importações da china / Imports from ChinaImportações do resto do mundo / Imports from ROW
Milhões de toneladas / Million tons
AMÉRICA LATINA: EVOLUÇÃO DO ÍNDICE DE IMPORTAÇÕES/CONSUMO DE AÇO LATIN AMERICA: EVOLUTION OF STEEL IMPORTS/USE RATIO
2012 2013 2014 2015 2016
33%
30% 31%
34%37%
20172010 201|1
36%30%
25%
20%
5%
0%
34%
9%
31%
11%12%11%
7%6%5%6%
15%
10%
FONTE / SOURCE: ALACERO - ALFÂNDEGA CHINESA / CHINESE CUSTOMS SERVICE
Importações chinesas / Chinese imports Resto do mundo / ROWÍndice de importação da China - Consumo (%) / Importsfrom China - Use ratio (%)Índice total de importações - Consumo (%) / Importsfrom China - Use ratio (%)

Associação Latino-Americana de Aço
Alameda Santos 2.300, conjunto 62
CEP: 01418-200 - São Paulo, SP, Brasil
[email protected] | www.alacero.org
Tel: (+55) 11 3195 5491
@RedAlacero Alacero Alacero