amended draft underground water impact report · andromedae-1 (ad-1) and andromedae south 1 (as-1)....
TRANSCRIPT

Amended Draft Underground Water Impact Report ATP1056P – Cooper Basin
Date: 8 May 2014

Amended Draft - Underground Water Impact Report – ATP1056P
Table of Contents
Glossary and Units of Measurement ............................................ 1
1 Introduction ..................................................................... 4
1.1 Project area ............................................................................................... 4
1.1.1 Summary of production wells ...................................................................... 5
1.2 Summary of methods ................................................................................. 8
2 Legislation ..................................................................... 10
2.1 Petroleum and Gas (Production and Safety) Act 2004 ............................. 10
2.2 Water Act 2000 (Qld) ............................................................................... 10
2.3 Other relevant water regulations ............................................................. 11
3 Existing geological and hydrogeological regime .................. 12
3.1 Geological summary ................................................................................. 12
3.1.1 Local stratigraphy .....................................................................................12
3.1.2 Geological Structure ..................................................................................14
3.1.3 Petroleum resources .................................................................................17
3.2 Regional hydrogeological summary.......................................................... 17
3.2.1 Groundwater use within ATP1056P ..............................................................17
4 Part A: Underground water extractions ............................. 20
4.1 Quantity of water already produced ......................................................... 20
4.2 Quantity of water to be produced in the next three years ........................ 20
4.3 Currently producing zones ....................................................................... 21
Part B: Aquifer information and underground water flow ............. 22
4.4 Description of each aquifer ...................................................................... 22
4.4.1 Hutton Sandstone (Central 5 – production) ..................................................22
4.4.2 Westbourne Formation, Adori Sandstone and Birkhead Formation (Central 4 – not producing) .......................................................................................................22
4.4.3 Murta Formation, McKinlay Member and Namur Sandstone (Central 3 – not producing) .............................................................................................................23

Amended Draft - Underground Water Impact Report – ATP1056P
4.5 Underground water flow and aquifer interactions .................................... 23
4.6 Underground Water Level Trend Analysis ................................................ 25
5 Part C: Predicted water level declines for the affected aquifers 26
5.1 Maps of the affected area ......................................................................... 26
5.2 Methods and techniques used .................................................................. 29
5.3 Water bores within the potentially affected area ..................................... 31
5.4 Review of maps produced ........................................................................ 32
6 Part D: Water Monitoring Strategy .................................... 33
6.1 Rationale .................................................................................................. 33
6.2 Monitoring strategy .................................................................................. 33
6.3 Timetable and methodology ..................................................................... 33
6.4 Reporting program ................................................................................... 35
7 Part E: Spring Impact Management Strategy ..................... 36
7.1 Spring inventory ...................................................................................... 36
7.2 Connectivity between the spring and the aquifer ..................................... 36
7.3 Management of Impacts ........................................................................... 36
7.4 Timetable for Strategy ............................................................................. 36
7.5 Reporting Program ................................................................................... 36
8 Part F: For a CMA assign responsibilities 8 to petroleum tenure holders ................................................................................. 38
9 References .................................................................... 39
9.1 Documents ............................................................................................... 39
9.2 External datasets ..................................................................................... 39
Appendix A – Water quality results ........................................... 40
Appendix B – Registered bores within ATP1056P ........................ 42

Amended Draft - Underground Water Impact Report – ATP1056P
Document Revision History
Date Version Author Comment
27 November 2013 1 Nicola Fry Draft UWIR for consultation
8 May 2014 2 Nicola Fry Amended draft UWIR for DEHP review

Amended Draft - Underground Water Impact Report – ATP1056P 1
Glossary and Units of Measurement
AD-1 Andromedae 1, production testing well within ATP1056P
Aquifer Rock or sediment in a formation, group of formations, or part of a formation that is saturated and sufficiently permeable to transmit economic quantities of water.
Aquifer properties The characteristics of an aquifer that determine its hydraulic behaviour and its response to abstraction.
Aquifer, confined An aquifer that is overlain by low permeability strata. The hydraulic conductivity of the confining bed is significantly lower than that of the aquifer.
Aquifer, unconfined Also known as a water table aquifer. An aquifer in which there are no confining beds between the zone of saturation and the surface. The water table is the upper boundary of an unconfined aquifer.
AS-1 Andromedae South 1, production testing well within ATP1056P
ATP Authority To Prospect
Baseline The natural situation.
Beneficial aquifer An aquifer that can produce water at a sufficient rate and quality for an identified use.
Bore A structure drilled below the surface to obtain water from an aquifer/reservoir or series of aquifers.
Casing Steel pipe cemented in place during the construction process to stabilize the wellbore.
Coal A sedimentary rock derived from the compaction and consolidation of vegetation or swamp deposits to form a fossilised carbonaceous rock.
Coal seam A layer of coal within a sedimentary rock sequence.
Confining layer Low permeability strata that may be saturated but will not allow water to move through it under ordinary hydraulic gradients.
d days
DEHP Department of Environment and Heritage Protection; as of 30 March 2012 some functions of the former Department of Environment and Resource Management will be delivered to the Department of Environment and Heritage Protection, including matters relating to UWIRs.
DNRM Department of Natural Resources and Mines
Drawdown A lowering of the water table in an unconfined aquifer or the pressure surface of a confined aquifer caused by pumping of groundwater from bores and wells.
Eh Reduction potential; also written as ORP
Electrical conductivity (EC)
A measure of a fluid’s ability to conduct an electrical current and is an estimation of the total ions dissolved. It is often used as a measure of water salinity. Measured in µS/cm.
GAB Great Artesian Basin
GMA Groundwater Management Areas

Amended Draft - Underground Water Impact Report – ATP1056P 2
Groundwater The water contained in interconnected pores or fractures located below the water table in the saturated zone.
Groundwater system A system that is hydrogeologically more similar than different in regard to geological province, hydraulic characteristics and water quality, and may consist of one or more geological formations.
GWDB DNRM's groundwater database
Head (hydraulic head)
A specific measurement of water pressure above a geodetic datum.
Hydraulic conductivity
The rate at which water of a specified density and kinematic viscosity can move through a permeable medium (notionally equivalent to the permeability of an aquifer to fresh water). Measured in metes per day (m/d).
Hydrocarbon An organic compound consisting entirely of hydrogen and carbon
Intracratonig sag basin
A sedimentary basin that formed via sedimentary depoisiton of a large trough or depression within stable continental crust
kL kilolitres
km kilometres
Lacustrine meaning "of a lake" or "relating to a lake"
m meters
mbgl meters below ground level
microSiemens per centimetre (µS/cm)
A measure of water salinity commonly referred to as EC (see also Electrical Conductivity). Most commonly measured in the field with calibrated field meters.
ML megalitres
mSS meters relative to sea level
Oil-water contact A bounding surface in a reservoir above which predominantly oil occurs and below which predominantly water occurs.
Permeability A measure of the ability of a porous material (e.g. a rock or unconsolidated material) to allow fluids to pass through it.
Petroleum A liquid mixture of hydrocarbons which is present in suitable rock strata and can be extracted and refined to produce fuels including petrol, paraffin, and diesel oil; oil.
pH Potential of Hydrogen; the logarithm of the reciprocal of hydrogen-ion concentration in gram atoms per litre; provides a measure on a scale from 0 to 14 of the acidity or alkalinity of a solution (where 7 is neutral, greater than 7 is alkaline and less than 7 is acidic).
Pressure cement Cement inserted around casings of a well built to withstand a required pressure to ensure no leakage occurs.
Produced water Groundwater generated from the production zone during production testing.
Production well A well used to retrieve petroleum from the underground reservoir.
Production testing program
An exploration program designed to test the ability of pilot production wells to flow petroleum.
Production zone Target stratigraphic unit(s) or formation(s) (or part thereof) where petroleum resources and/or groundwater is produced from.
Recharge The process which replenishes groundwater, usually by rainfall infiltrating from the ground surface to the water table and by river water reaching the water table or exposed aquifers. The addition of water to an aquifer.
Amended Draft - Underground Water Impact Report – ATP1056P 3
Reservoir Porous or fractured rock formations that can accumulate (in this case) petroleum resources
Resistivity The ability of a material to oppose the flow of electric current
RN Registered number (within DNRM groundwater database)
Sandstone Sandstone is a sedimentary rock composed mainly of sand-sized minerals or rock grains (predominantly quartz).
Sandstone aquifer Permeable sandstone that allows percolation of water and other fluids, and is porous enough to store large quantities of groundwater.
Standing water level (SWL)
The height to which groundwater rises in a bore after it is drilled and completed, and after a period of pumping when levels return to natural atmospheric or confined pressure levels.
Stratigraphy The depositional order of sedimentary rocks in layers.
TDS Total Dissolved Solids, measured in milligrams/litre (mg/L)
Unconformity/ An unconformity is a buried erosion surface separating two rock masses or strata of different ages, indicating that sediment deposition was not continuous.
UWIR Underground Water Impact Report
Water quality Term used to describe the chemical, physical, and biological characteristics of water, usually in respect to its suitability for a particular purpose.
Well Pertaining to a petroleum exploration or production well.

Amended Draft - Underground Water Impact Report – ATP1056P 4
1 Introduction
The Water Act 2000 (Qld) (Water Act) requires petroleum tenure holders to manage impacts of extraction of underground water from their exploration or production activities. To assist in achieving this, petroleum tenure holders must prepare an underground water impact report (UWIR), which is used to establish obligations on petroleum tenure holders and ensure measures and programs are in place to mitigate and measure impacts on underground water.
The key aspects of an UWIR are:
› information about underground water extractions resulting from the exercise of underground water rights;
› information about aquifers affected, or likely to be affected;
› maps showing the area of the affected aquifer(s) where underground water levels are expected to decline;
› a water monitoring strategy;
› a spring impact management strategy.
This UWIR provides information about the relevant underground water extractions and the potential impacts on aquifers within ATP1056P as a result of dewatering during production testing. Specifically, production testing to date has occurred at one production test well within ATP1056P, which is located within the Cooper and Eromanga Basins and is approximately 150km east of Thargomindah town, Queensland, and 1150km west of Brisbane (Figure 1). This UWIR covers the entire ATP1056P block; however, it is specifically concerned with the area surrounding the production testing program at the Andromedae discoveries (Figure 2).
1.1 Project area
ATP1056P is the subject of petroleum exploration activities for oil. Location of the current exploration activity is shown in Figure 2.
AGL Cooper Basin Pty Ltd is operator of ATP1056P, on behalf of the joint venture (JV) between AGL, and other parties shown in Table 1.
The ATP area is approximately 3865 km2. Current and recent activities within the area include seismic programs, exploration drilling, and production testing.
Eight oil exploration wells have been drilled in two drilling campaigns in late 2011 and early 2013. Five of these wells have been plugged and abandoned (P&A) while two have been cased and completed and a third cased and suspended for production testing (Figure 2).
Production testing has occurred twice, during May 2012 and October 2012 – March 2013. In late October 2013, an additional extended production test commenced for two wells, Andromedae-1 (AD-1) and Andromedae South 1 (AS-1).

Amended Draft - Underground Water Impact Report – ATP1056P 5
Table 1: JV participants and interest within ATP1056P
JV Participant Participating Interest (%)
AGL Cooper Basin Pty Ltd (Operator) 40
Carson Energy, Inc 12
OG Operating, Inc 15.277
Discovery Geo Corporation 3
Foresight Australia Pty Ltd 10
Matariki Petroleum Partners 3
Rockwall Oil, LP 5
Tamark Pty Ltd 11.723
Total 100
1.1.1 Summary of production wells
AD-1 and AS-1 both target the Jurassic Hutton Sandstone reservoir. The completion details are shown in Table 2.
AD-1 was drilled as a near field oil exploration well in exploration permit ATP1056P. The permit sits within a north east trending string of small to moderately sized producing oil fields that exist directly adjacent to the western permit boundary. The major oilfields of the Jackson-Naccowlah trend lie less than 10km to the north (outside of ATP1056P). Oil is produced primarily at the Hutton Sandstone level although minor production does occur at all stratigraphic levels up to the Murta Formation in the surrounding region. Permian coals within the Nappamerri Trough primarily sourced this oil which is interpreted to have migrated vertically and laterally out of the kitchen areas. Prospects within the ATP1056P permit area lie on direct migration and spill pathways from the trough and existing fields.
The primary objective of the AD-1 well is to test an elongate, fault independent anticline within the Jurassic Hutton Sandstone lying on an interpreted migration pathway from the nearby producing Watson oilfield.
The primary objective of AS-1 is to test an interpreted structurally 4-way closed anticline within the Jurassic Hutton Sandstone. The well, drilled in early 2013, is located 930m south-southeast of AD-1.
Table 2: Production well details
Well Andromedae – 1 (AD-1) Andromedae South -1 (AS-1)
Spud date 27/09/2011 18/04/2013
Reservoir Hutton Sandstone Hutton Sandstone
Perforated interval (mSS)
1496.55 to 1498.55 (2 m interval) 1494.87 to 1496.37 (1.5 m interval)
Total depth 1699.00 m KB 1683.75 m MD

Amended Draft - Underground Water Impact Report – ATP1056P 6
Figure 1: Location of ATP1056P with respect to the Cooper and Eromanga Basins

Amended Draft - Underground Water Impact Report – ATP1056P 7
Figure 2: Location of petroleum wells within the region. Within ATP1056P production testing has occurred at Andromedae 1 and is currently occurring there again and at Andromedae South 1 since late 2013.

Amended Draft - Underground Water Impact Report – ATP1056P 8
1.2 Summary of methods
An assessment of impacts on underground water from the production testing activities within ATP1056P has been undertaken by referencing available relevant data and reports. It should be noted, however, that there was not a lot of ATP specific data available as a result of the early stages of exploration.
A summary of the UWIR requirements under the Water Act 2000 (QLD) and the relevant sections of this report in which they have been addressed is included in Table 3.
It should be noted that a requirement of the UWIR is to predict the magnitude of water level declines for affected aquifers. To this end, the UWIR must include a map showing the area of the aquifer where water level is predicted to decline, because of the taking of the quantities of water, by more than the applicable trigger value:
› within 3 years following the report consultation day (this area is defined as the Immediately Affected Area); and
› at any time (this area is defined as the Long Term Affected Area).
Drawdown trigger threshold values, as defined by the Water Act, are 5 m declines in water level for consolidated rock (e.g. sandstone) aquifers, 2 m declines in unconsolidated aquifers, and 0.2 m declines in water level for spring source aquifers.
However, given the lack of available relevant data and the small scale of the previous and current production testing, no Immediately Affected Area or Long Term Affected Area can be accurately defined for aquifers within ATP1056P. Based on the logic discussed in Section 6.26, for the purpose of meeting s376b)(iv) and (v) of the Water Act, a conservative “potentially affected area” has been defined as a 2 km buffer within the Hutton Sandstone around both the wells currently under production testing. This area is shown in Figure 9. It should be emphasised that this area has been mapped highly conservatively and some first pass reservoir modelling indicates the likely affected area would be much smaller; it would be unlikely that any impact could actually be detected within much of the area (if there were receptors in place), let alone an impact close to or above the drawdown trigger threshold as defined by the Water Act. In addition, it should be noted, within this potentially affected area, there are no receptors (water bores, groundwater dependant ecosystems/springs, or exploration holes).
Table 3: Reporting requirements from Water Act 2000, and which sections of this UWIR they apply to
Reporting requirement as stated in the Water Act 2000 UWIR section
Section 376
(a) for the area to which the report relates—
(i) the quantity of water produced or taken from the area because of the exercise of any previous relevant underground water rights; and
Section 4.1
(ii) an estimate of the quantity of water to be produced or taken because of the exercise of the relevant underground water rights for a 3 year period starting on the consultation day for the report;
Section 4.2
(b) for each aquifer affected, or likely to be affected, by the exercise of the relevant underground water rights—
(i) a description of the aquifer; and
Section 5.1
(ii) an analysis of the movement of underground water to and from the aquifer, including how the aquifer interacts with other aquifers; and
Section 5.2
(iii) an analysis of the trends in water level change for the aquifer because of the exercise of the rights mentioned in paragraph (a)(i); and
Sections 5.3
Amended Draft - Underground Water Impact Report – ATP1056P 9
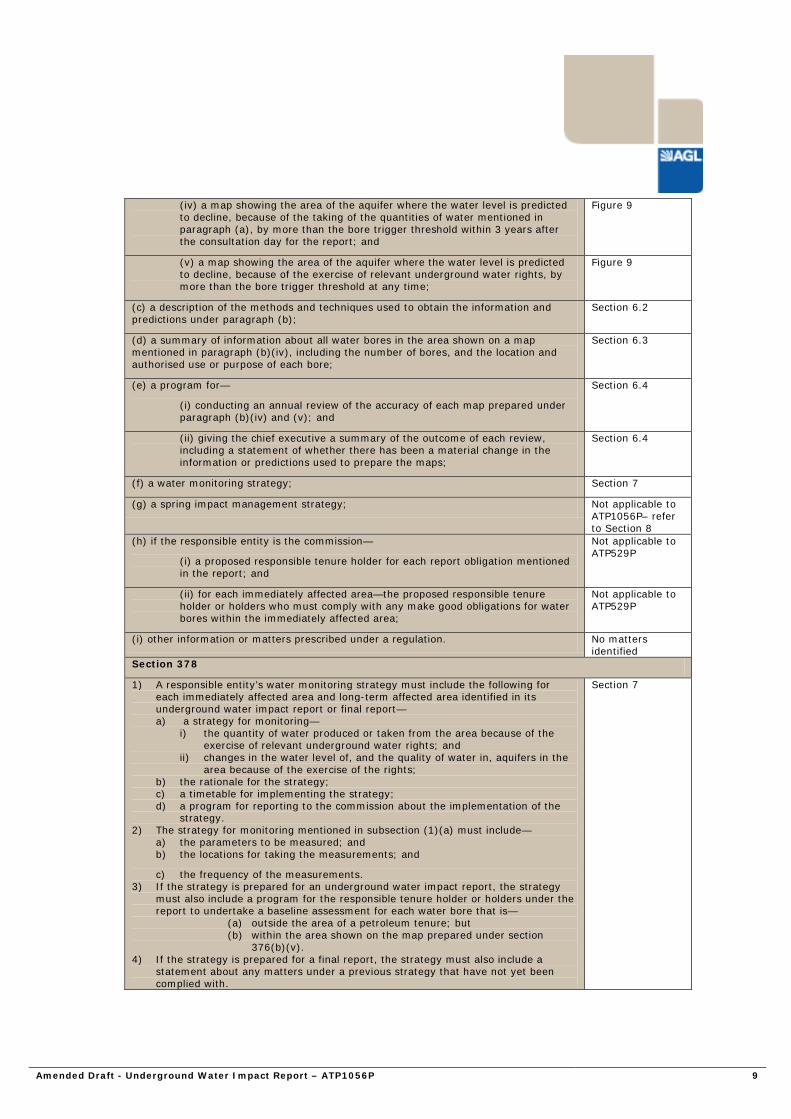
(iv) a map showing the area of the aquifer where the water level is predicted to decline, because of the taking of the quantities of water mentioned in paragraph (a), by more than the bore trigger threshold within 3 years after the consultation day for the report; and
Figure 9
(v) a map showing the area of the aquifer where the water level is predicted to decline, because of the exercise of relevant underground water rights, by more than the bore trigger threshold at any time;
Figure 9
(c) a description of the methods and techniques used to obtain the information and predictions under paragraph (b);
Section 6.2
(d) a summary of information about all water bores in the area shown on a map mentioned in paragraph (b)(iv), including the number of bores, and the location and authorised use or purpose of each bore;
Section 6.3
(e) a program for—
(i) conducting an annual review of the accuracy of each map prepared under paragraph (b)(iv) and (v); and
Section 6.4
(ii) giving the chief executive a summary of the outcome of each review, including a statement of whether there has been a material change in the information or predictions used to prepare the maps;
Section 6.4
(f) a water monitoring strategy; Section 7
(g) a spring impact management strategy; Not applicable to ATP1056P– refer to Section 8
(h) if the responsible entity is the commission—
(i) a proposed responsible tenure holder for each report obligation mentioned in the report; and
Not applicable to ATP529P
(ii) for each immediately affected area—the proposed responsible tenure holder or holders who must comply with any make good obligations for water bores within the immediately affected area;
Not applicable to ATP529P
(i) other information or matters prescribed under a regulation. No matters identified
Section 378
1) A responsible entity’s water monitoring strategy must include the following for each immediately affected area and long-term affected area identified in its underground water impact report or final report— a) a strategy for monitoring—
i) the quantity of water produced or taken from the area because of the exercise of relevant underground water rights; and
ii) changes in the water level of, and the quality of water in, aquifers in the area because of the exercise of the rights;
b) the rationale for the strategy; c) a timetable for implementing the strategy; d) a program for reporting to the commission about the implementation of the
strategy. 2) The strategy for monitoring mentioned in subsection (1)(a) must include—
a) the parameters to be measured; and b) the locations for taking the measurements; and
c) the frequency of the measurements. 3) If the strategy is prepared for an underground water impact report, the strategy
must also include a program for the responsible tenure holder or holders under the report to undertake a baseline assessment for each water bore that is—
(a) outside the area of a petroleum tenure; but (b) within the area shown on the map prepared under section
376(b)(v). 4) If the strategy is prepared for a final report, the strategy must also include a
statement about any matters under a previous strategy that have not yet been complied with.
Section 7

Amended Draft - Underground Water Impact Report – ATP1056P 10
2 Legislation
The primary legislative requirements for the management of groundwater with respect to petroleum tenure holders for ATP1056P are summarised below.
2.1 Petroleum and Gas (Production and Safety) Act 2004
The Water and Other Legislation Amendment Act 2010 amends the Water Act 2000 (Water Act) and other relevant legislation with the aim of improving the management of impacts associated with groundwater extraction that form part of petroleum activities. These amendments transfer the regulatory framework for underground water from the Petroleum Act 1923 and the Petroleum and Gas (Production and Safety) Act (P&G Act) to the Water Act.
The P&G Act originally provided all rights of water extraction to a petroleum activity. However, through recent updates of the P&G Act and the Water Act, a petroleum tenure holder has an obligation to identify impact, establish baseline conditions and maintain groundwater supplies in private bores in the vicinity of petroleum operations. Where a bore owner can demonstrate reduced access to groundwater supplies, or a reduction in beneficial use class due to water quality changes, as a result of petroleum operations, “make good” provisions are available to address the loss incurred by an affected bore owner.
Under the P&G Act, the make good obligation for affected bores also applies to petroleum tenure obtained under the Petroleum Act 1923 and are further defined in the Water Act.
2.2 Water Act 2000 (Qld)
The Water Act 2000 (Qld) (as amended 2010):
› Provides a comprehensive regime for the planning and management of all water resources (including vesting to the State the rights over the use, flow and control of all surface water, groundwater, rivers and springs) in Queensland.
› Regulates water use and the obligations of petroleum tenure holders in relation to groundwater monitoring, reporting, impact assessment and management of impacts on other water users.
› Provides a framework and conditions for preparing a Baseline Assessment Plan and outlines the requirements of bore owners to provide information that the petroleum holder reasonably requires to undertake a baseline assessment of any bore.
› Sets out the process for applying for a Water Licence (where water is utilised outside of a petroleum lease or not on adjacent land owned by the same person).
› Sets out the process for assessing, reporting, monitoring, and negotiating with other water users regarding the impact of petroleum production on aquifers.
The management of impacts on groundwater caused by the exercise of groundwater rights by petroleum tenement holders is achieved primarily by providing a regulatory framework that:
› Requires petroleum tenure holders to monitor and assess the impact of the exercise of underground water rights on water bores and to enter into “make good” agreements with the owners of the bores;
› Requires the preparation of UWIRs that establish underground water obligations, including obligations to monitor and manage impacts on aquifers and springs;

Amended Draft - Underground Water Impact Report – ATP1056P 11
If an existing water bore has an impaired capacity as a result of petroleum exploration or operation activities, an agreement is required to be negotiated with the owner of the bore about the following:
› The reason for the bore’s impaired capacity.
› The measures the petroleum tenement holder will take to ensure the bore owner has access to a reasonable quantity and quality of water for the authorised use and purpose of the bore;
› Any monetary or non-monetary compensation payable to the bore owner for impact on the bore.
If an agreement relating to a water bore is made the agreement is taken to be a “make good” agreement for the bore.
An UWIR will identify whether an Immediately Affected Area will result from petroleum activities. An Immediately Affected Area is defined as an area where the predicted decline in water levels within 3 years is above the drawdown trigger threshold:
› 5 m for a consolidated aquifer
› 2 m for an unconsolidated aquifer
› 0.2 m for a spring.
UWIRs are published to enable the community, including bore owners and other stakeholders, within the area of testing, to make comments. Submissions made by stakeholders will be summarised by AGL, addressed as appropriate and provided to the Department of Environment and Heritage Protection (DEHP) together with the UWIR. UWIRs are submitted for approval by DEHP.
The relevant requirements within the Water Act applicable to the preparation of UWIRs, along with the reference to the section in this report where the requirement is addressed is presented in Table 3.
2.3 Other relevant water regulations
The following legislations are also applicable to the oil production within ATP1056P:
• Environmental Protection Act 1994 (Qld)
• Environmental Protection (Water) Policy 2009 (Qld)
• Management of Water Produced in Association with Petroleum Activities (produced water), December 2007
• Great Artesian Basin Resource Operations Plan 2006
• Environmental Protection and Biodiversity Conservation (EPBC) Act 1994
• Water Resource (Cooper Creek) Plan 2000 (Qld)
Amended Draft - Underground Water Impact Report – ATP1056P 12
3 Existing geological and hydrogeological regime
3.1 Geological summary
ATP1056P lies in the central portion of the Jurassic to Cretaceous Eromanga Basin wherein the primary targets for oil exploration lie. The permit also in part, unconformably overlies thin, remnant sediments of the Carboniferous to Triassic Cooper Basin with basement comprised of granodiorite and metasediments of the Cambro – Ordovician Warburton Basin.
The Eromanga Basin formed as an intracratonic sag basin comprising several depocentres formed around the underlying major basement troughs and platforms. Jurassic sedimentation occurred primarily within a fluvial to lacustrine environment consisting of three main fining upward clastic sequences. The Early Cretaceous period saw the Eromanga undergo subsidence at a much higher rate resulting in deposition of thick, shallow marine sequences transitioning finally to paralic and terrestrial environments. Deposition within the basin was terminated abruptly in the Late Cretaceous in which followed a period of predominantly erosion with minimal deposition through to the present.
Throughout the period of deposition the basin was structurally quiescent; however, periods of Late Cretaceous and Tertiary tectonism resulted in the majority of the structural features in the Eromanga. The majority of structures associated with these events generally post date hydrocarbon charge in the basin, and as such, closures associated are not prospective for exploration. Primary structures within the Eromanga sequence prospective for hydrocarbon exploration are simple, fault independent drape and compaction features over old basement highs.
3.1.1 Local stratigraphy
Generalised stratigraphy is represented in Figure 3. Following, is a description of the stratigraphic units penetrated by the AD-1 well, with quoted depths relative to kelly bushing (93.45 mSS).
The Toolachee Formation (1651.40 – 1668.96m KB) was deposited as a low energy meander belt to lacustrine facies. Stacked, fining up sequences of fine to coarse grained sandstones, dark grey siltstone, carbonaceous shale and channel capping coal seams dominate the unit. Moderate to high levels of siliceous cementation indicate poor porosity in these sandstone units.
The Poolowanna Formation (or Basal Jurassic facies) (1632.95 – 1651.40m KB) unconformably overlies the Permian sequences at this location and consists of a fine to medium, quartz dominated sandstone and interbedded siltstone. Thin and laterally discontinuous coals seams occur in the upper portion of the formation. Reasonably high energy fluvial sedimentation meandering within a floodplain and peat swamp facies is the likely environment of deposition for this unit.
The Hutton Sandstone (1589.97 – 1632.95m KB) comprises of a series of upward fining stacked channel sandstones deposited under high energy braided fluviatile system. The quartzose and sublabile sands are predominantly medium to coarse grained with conglomeratic bands pervasive throughout the unit. Sandstone units occasionally grade into minor siltstone and mudstone beds.

Amended Draft - Underground Water Impact Report – ATP1056P 13
The Birkhead Formation (1569.59 – 1589.97m KB) is a succession of interbedded mudstone, dark grey to brown siltstone and medium to coarse channel sandstones. Rare lenticular coals are present with the sandstones dominantly volcanolithic and well cemented authigenic clays comprising the matrix. The unit is interpreted to be deposited under meandering fluvial environment.
The Adori Sandstone (1563.00 – 1569.59m KB) is a thin, fine to medium grained labile sandstone deposited under high energy braided fluvial conditions. Occasionally the unit tends to coarse sandstone to conglomerate with low visual porosity.
The Westbourne Formation (1450.14 – 1563.00m KB) comprises of a lacustrine sequence of interbedded siltstone, mudstone and minor lenses of fine grained quartzose sandstones. Occasional thinly bedded and laterally discontinuous coal seams are present with the unit overall containing a moderate amount of carbonaceous material.
The Namur Sandstone (1355.25 – 1450.14m KB) deposition resulted from a period of high energy, braided fluviatile conditions with intervening lower energy, distal floodplain type sedimentation. As such the sequence comprises fine to medium grained sub labile quartzose sandstone and thin interbedded siltstone with disseminated fine carbonaceous fragments.
The Murta Formation (1278.92 – 1355.25m KB) consists predominantly of thickly bedded siltstone with varying thickness of fine to medium grained sub-labile quartzose sandstones. The unit represents deposition under lacustrine to lower delta conditions.
The Cadna-Owie Formation (1194.67 – 1278.92m KB) was deposited as the transgressive interface between terrestrial and shallow marine environments. It consists of fine grained, clay rich sediments to fine calcareous sandstones with minor limestone and bioturbation occasionally noted.
The Bulldog Shale (918.64 – 1194.67m KB) was deposited in a shallow to moderately deep open marine environment. The unit consists of a series of upward coarsening siltstones and fine grained sandstones. Glauconitic sandstones are common toward the base of the unit with disseminated pyrite common in the upper half of the unit.
The Coorikiana Sandstone (852.00 – 918.64m KB) was deposited as a regressive marine shoreface deposit. Sandstones are interbedded with minor medium to brown grey sandstones with minor medium to brown grey siltstones. Sandstones are fine grained, off white to light green to grey, with a calcareous matrix. Glauconite is a common accessory mineral.
The Oodnadatta Formation (650.93 – 852.00m KB) is a shallow marine sequence consisting of laminated claystone and siltstone with interbedded fine grained sandstone. Calcareous and ferruginous concretions and a thin unit of calcareous siltstone and fossil rich concretionary limestone exist in the lower part of the unit.
The Mackunda Formation (494.00 – 852.00m KB) was deposited during several cycles of alternating deep water marine sedimentation and shoreface deposition. Sandstones are typically fine grained, off white to light grey fine grained, and often have a calcareous cement. Siltstones are grey to dark grey, argillaceous and occasionally become pyritic near the base.
The Winton Formation (Surface – 494.00m KB) is a fluvial sequence, consisting of fine to coarse grained sandstones, carbonaceous and pyritic shale, siltstone and coal seams with intraclast conglomerates. Sandstone beds contain abundant fresh volcanogenic debris, lithics, felspar and traces of apatite, ferromagnesian minerals and mica.
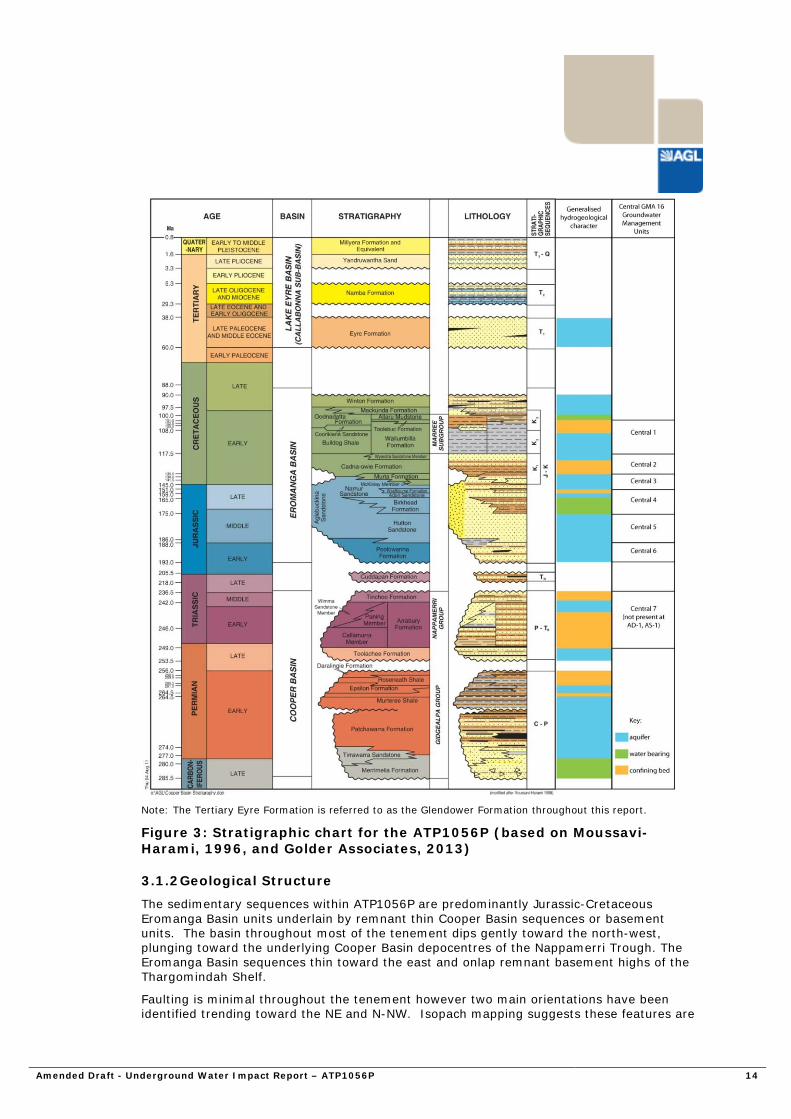
Amended Draft - Underground Water Impact Report – ATP1056P 14
Note: The Tertiary Eyre Formation is referred to as the Glendower Formation throughout this report.
Figure 3: Stratigraphic chart for the ATP1056P (based on Moussavi-Harami, 1996, and Golder Associates, 2013)
3.1.2 Geological Structure
The sedimentary sequences within ATP1056P are predominantly Jurassic-Cretaceous Eromanga Basin units underlain by remnant thin Cooper Basin sequences or basement units. The basin throughout most of the tenement dips gently toward the north-west, plunging toward the underlying Cooper Basin depocentres of the Nappamerri Trough. The Eromanga Basin sequences thin toward the east and onlap remnant basement highs of the Thargomindah Shelf.
Faulting is minimal throughout the tenement however two main orientations have been identified trending toward the NE and N-NW. Isopach mapping suggests these features are

Amended Draft - Underground Water Impact Report – ATP1056P 15
relatively recent and a result of up to four Late Cretaceous – Tertiary deformation events. Early basement induced faults appear to have undergone limited activity throughout the Jurassic – Cretaceous and rarely extend into the Eromanga section.
Figure 4 shows a seismic section (with offset locations of AD-1, AS-1, Pyxis-1 and Pyxis-2 identified) displaying the structure within the area of AGL’s activities. No faults have been identified in this section, confirming the relatively structurally benign nature of the area. The structure shown in this seismic line is typical for the geology within the region of AGL’s activities in ATP1056P.

Amended Draft - Underground Water Impact Report – ATP1056P 16
Figure 4: Seismic section displaying typical structure within the region. Vertical axis is in time (seconds). The location of the section is shown by the red line in the insert map. Mapped formation tops for the Cadna-owie, Murta, Westbourne and Hutton Sandstone are shown as coloured horizons. Depths to formation tops, as logged in AD-1, are also displayed. There are no water bores within the vicinity of this section. The Hutton Sandstone is the aquifer defined as the potentially affected aquifer (refer to Section 6).

Amended Draft - Underground Water Impact Report – ATP1056P 17
3.1.3 Petroleum resources
Within the region, significant oil reservoirs are present within the Hutton Sandstone, the Birkhead Formation and the Murta Formation. The Wyandra Sandstone Member, McKinlay Member (belonging to the Murta Formation) and Namur Sandstone, Westbourne Formation and Adori Sandstone and Lower Poolowanna hold minor oil reservoirs.
Within ATP1056P, the current exploration targets are Hutton Sandstone reservoirs known as the Andromedae discoveries, located at both AD-1 and AS-1. Structural mapping and petrophysical interpretation to date indicates that the oil-water contact lies at approximately 1500mSS at AS-1 and 1504mSS at AD-1.
3.2 Regional hydrogeological summary
The Quaternary/Tertiary fluvial deposits of the Lake Eyre Basin contain some water resources. However, it is the Triassic – Cretaceous Great Artesian Basin (GAB) that contains the major water resources across the region.
The main GAB aquifers within ATP1056P are the Winton Formation, Cadna-Owie Formation, Hooray Sandstone, Hutton Sandstone and Poolwanna Formation (Precipice Sandstone equivalent) within the Eromanga Basin. The aquifers within the Eromanga Basin are considered highly productive aquifers across most of the GAB.
The aquifers of the Cooper Basin are not considered within the defined sandstone aquifers of the GAB apart from the upper formations (Wimma Sandstone Member and younger).
Both the Cooper Basin and Eromanga Basin are multi-layered systems comprising alternating layers of sandstone, shales, mudstones and siltstone formations. Within the Eromanga Basin, the sandstone formations are typically the aquifers or water bearing zones. The siltstone, shale and mudstone formations typically are low permeability and not considered aquifers; however, local sandstone beds within these formations can be considered as groundwater resources.
QDNRM (2005) defined subdivisions of the GAB into Groundwater Management Areas (GMA), and each area is further divided into Groundwater Management Units, allowing for administration of access to water and water entitlements. ATP1056P is within the Central GMA. The Groundwater Management Units are for this GMA are shown in Figure 3.
The aquifers relevant to this UWIR are discussed in Section 5.
Shown in Figure 4 is a seismic section that displays the structure of the relevant hydrogeological units within the vicinity of the extraction activities in ATP1056P. The elevations of mapped formation tops are displayed with respect to AD-1. As discussed later in Section 6, the Hutton Sandstone is defined as the only potentially affected aquifer. There are no known water bores within the vicinity of the extraction activities that tap this aquifer. There are no significant faults identified within the area shown in the seismic section. There are no available groundwater levels for these aquifers in the vicinity of AGL’s activities apart from the oil/water contact which is discussed in section 5.2.
3.2.1 Groundwater use within ATP1056P
Within the region, only the shallow aquifers are of interest to the local population due to ease of access. As such, the deeper Hutton and Poolowanna Sandstone aquifers, for example, are not used as beneficial water supply aquifers.
Within the DNRM groundwater database (GWDB) there are 28 bores located within ATP1056P. These are presented in Table 7 of Appendix B – Registered bores within ATP1056P and in Figure 5. Thirteen (13) are described as abandoned and 15 are existing, however many of these are/were not water supply bores but were/are related to hydrocarbon exploration. Within the DNRM GWDB, only five of the 28 bores within

Amended Draft - Underground Water Impact Report – ATP1056P 18
ATP1056P are assigned with a facility role (petroleum exploration); the remaining 23 bores are undefined. There are seven registered bores that have the target aquifer identified within the database.

Amended Draft - Underground Water Impact Report – ATP1056P 19
Figure 5: Map of registered bores within ATP1056P (labelled with Registered Number)

Amended Draft - Underground Water Impact Report – ATP1056P 20
4 Part A: Underground water extractions
4.1 Quantity of water already produced
AGL has produced water from the Hutton Sandstone as part of production testing at AD-1. Production testing to date has occurred during two periods: October 2011 – March 2012 and October 2012 to March 2013. A total of 0.87 ML (870 KL) of water has been produced (as at October 2013). Figure 6 shows the water production data to date.
Figure 6: Water production from the production testing program to date (as at October 2013) within ATP1056P (AD-1)
4.2 Quantity of water to be produced in the next three years
Production testing will continue in late 2013 in both AD-1 and AS-1, and at this stage is licensed to proceed for a period of 12 months. The production philosophy for this current program is likely to be different from the previous two programs so it has been difficult to accurately predict the volumes of produced water. However, based on predicted oil and total fluid production, if the production testing continues for the full 12 month licensed period then it is expected the total volume of water produced could be approximately 10.5 ML. This prediction is currently being refined with modelling work and, although yet to be finalised, the preliminary model is currently estimating water production for a 12 month production test to be within the range of 5 – 40 ML.
There are no further plans for production testing within ATP1056P beyond this current program scheduled (which commenced late October 2013).
93 86 107
98
191
162 142
0
50
100
150
200
250
May
-12
Jun-
12
Jul-1
2
Aug
-12
Sep-
12
Oct
-12
Nov
-12
Dec
-12
Jan-
13
Feb-
13
Mar
-13
Apr
-13
May
-13
Jun-
13
Jul-1
3
Aug
-13
Sep-
13
Oct
-13
Wat
er p
rodu
ctio
n (K
L)

Amended Draft - Underground Water Impact Report – ATP1056P 21
4.3 Currently producing zones
To date, AGL has produced water and hydrocarbons from the Hutton Sandstone reservoir. Water produced is associated water from oil production. The produced water has been managed, and will continue to be managed, by simple gravity separation processes to recover oil and the water disposal via a lined evaporation dam.

Amended Draft - Underground Water Impact Report – ATP1056P 22
5 Part B: Aquifer information and underground water flow
5.1 Description of each aquifer
The aquifer affected by water extraction is Central 5 (Hutton Sandstone) and is discussed in detail in the following section. Other units are not considered likely to be affected as a result of AGL’s petroleum exploration activities within ATP1056P as they are segregated from the wells with casing and/or not in hydrogeological communication with the petroleum producing interval within this region. However, for comparison, the overlying Central 3 (Murta Formation, McKinlay Member, Namur Sandstone) and Central 4 (Westbourne Formation, Adori Sandstone, Birkhead Formation) are also included in the discussion following.
5.1.1 Hutton Sandstone (Central 5 – production)
The Jurassic Hutton Sandstone contains significant GAB aquifers with yields of up to 50 L/s of good quality water (QDNRM, 2005). Within this region, however, its depth (around 1600 mbgl) prevents it from uses other than for petroleum exploration/production activities. There are no bores within the DNRM GWDB that identify the target aquifer as the Hutton Sandstone within ATP1056P.
Within the ATP1056P Hutton Sandstone, the groundwater flow is expected to be to the southwest to south-southwest, consistent with the flow of the major GAB units as described in the literature (Habermehl and Lau, 1997). There is insufficient water level data within the region to characterise Hutton Sandstone groundwater flow direction further. Recharge areas are on the eastern margins of the Eromanga Basin (QDNRM, 2005). Hydraulic conductivity for the Hutton Sandstone within the vicinity of this site is expected to be in the range of 0.35 – 0.01 m/d (Santos, 2013).
Within ATP1056P, two water samples have been collected from bores (Hercules North 1 and Pyxis 1 (refer to Figure 2 for location)) tapping the Hutton Sandstone aquifer. Details of these are presented in Appendix A – Water quality results. The groundwater is slightly alkaline (pH 7.89), slightly saline (~6,300 µs/cm), and is dominated by sodium-potassium-chloride-bicarbonate (Na-K-Cl-HCO3) ions. (Note, the K-Cl may be residual drilling fluid contamination.) The chemistry of the Hercules North 1 sample is plotted in Figure 7.
It has long been recognised that within aquifers of the GAB, there are some areas where the naturally occurring fluoride content is significantly elevated (Evans, 1996). Most natural waters contain fluoride concentrations generally less than 1.0 mg/L (Hem, 1989, in Evans, 1996). The water sample from Hercules North 1 returned a fluoride concentration of 4.0 mg/L.
At AD-1, the Hutton Sandstone is 43 m thick and at AS-1 the Hutton Sandstone is 40m thick.
5.1.2 Westbourne Formation, Adori Sandstone and Birkhead Formation (Central 4 – not producing)
The Westbourne Formation and Adori Sandstone are chronologically equivalent to the Namur Sandstone.
Regionally, the Jurassic Adori Sandstone of the Injune Creek Group contains reasonable GAB aquifers with generally good yields and good quality water (averaging 1000 µS/cm) (QDNRM, 2005). Recharge to the Adori Sandstone occurs along the eastern margin of the

Amended Draft - Underground Water Impact Report – ATP1056P 23
Eromanga Basin (QDNRM, 2005). Regionally the Westbourne Formation and the Birkhead Formation are considered confining beds, but locally can be considered water bearing zones.
Within ATP1056P, there is one bore that is identified as tapping the Westbourne Formation between 1425 and 1692 mbgl (RN 23578) (but it is noted that the bore is open from 231 – 1844 mbgl, and so this would also include the Adori and Hutton Sandstones as well as any contribution from shallower aquifers). No bores are specifically identified to tap either the Adori Sandstone of the Birkhead Formation. RN 23578 is reported to have yielded slightly saline water averaging around 3515 µS/cm, with an average pH of 8.85. Given the construction of the bore, however, it is not possible to assign this necessarily to the Westbourne Formation and given the depth of water sample used for the analysis (1387 m), it actually appears this can be allocated to the Namur Sandstone (especially given the chemical signature is very similar to that of the Namur Sandstone (Figure 7).
At AD-1, the thicknesses of these units are: 20 m (Birkhead Formation), 7 m (Adori Sandstone), and 113 m (Westbourne Formation). At AS-1, the thicknesses of these units are: 20 m (Birkhead Formation), 8 m (Adori Sandstone), and 106 m (Westbourne Formation).
5.1.3 Murta Formation, McKinlay Member and Namur Sandstone (Central 3 – not producing)
The Jurassic – Cretaceous Namur Sandstone and the McKinlay Member are basin margin equivalents, and laterally continuous with the Hooray Sandstone, and are generally the shallowest major artesian aquifer intercepted by water bores within the GAB of Queensland (QDNRM, 2005). These formations are restricted to subsurface and are recharged from connecting Hooray Sandstone to the northeast and potentially also the Algebuckina Sandstone to the west (QDNRM, 2005).
Within ATP1056P’s Murta Formation/McKinlay Member/Namur Sandstone, the groundwater flow is expected to be to the southwest to south-southwest, consistent with the flow of the major GAB units as described in the literature (e.g. Evans, 1996). There is insufficient water level data within the region to characterise groundwater flow direction within these units further. Hydraulic conductivity for these units within the vicinity of this site is expected to be somewhat similar to that described previously for the Hutton Sandstone (which is also similar to the Hooray Sandstone) (Santos, 2013).
Within ATP1056P one water sample has been collected from the Bradford 1 exploration bore from the Namur Sandstone, and one water sample has also been mentioned in the DNRM GWDB from bore RN 23466 (Dio Ella 1), which has been inferred (based on data in the DNRM GWDB) to also tap the Namur Sandstone. Details of these are presented in Appendix A – Water quality results. The groundwater is slightly alkaline (pH 8.2), slightly saline (2250 µs/cm – 4800 mg/L), and is dominated by sodium-bicarbonate (Na-HCO3) ions. The chemistry of the Dio Ella 1 sample is plotted in Figure 7.
Similarly, to the sample obtained from the Hutton Sandstone, elevated levels of fluoride were observed in the Namur Sandstone (Dio Ella 1) at a level of 5.6 mg/L.
At AD-1, the Namur Sandstone is 95 m thick and the Murta Formation is 76 m thick. At AS-1, the Namur Sandstone is 103 m thick and the Murta Formation is 77 m thick. The McKinlay Member is not logged at either AD-1 or AS-1.
5.2 Underground water flow and aquifer interactions
There is a lack of local data that can be used to interpret groundwater flow and aquifer interactions. However, groundwater flow within the confined GAB aquifers in the area is expected to be to the southwest to south-southwest, consistent with the flow of the major

Amended Draft - Underground Water Impact Report – ATP1056P 24
GAB units as described in the literature (e.g. Evans, 1996). Within the GAB, recharge is dominantly by infiltration of rainfall directly into the outcropping sandstone aquifers along the eastern margins of the basin (QDNRM, 2005). Recharge within ATP1056P is expected to be mainly contributed by sub-surface flow from the laterally equivalent units to the northeast. Flow is expected to be dominantly lateral, rather than vertical, within the aquifers due to the presence of confining layers. The Hutton Sandstone is confined by the Birkhead Formation, which in the production testing area is predominantly arenaceous siltstone. This confining layer has sealed the hydrocarbons within the Hutton Sandstone reservoir at the Andromedae discoveries, and also, therefore, prevents groundwater flow between the Hutton Sandstone and shallower aquifers of the region.
The chemical composition of the water within each aquifer appears to be broadly distinct, (based on the limited available data) further suggesting relative isolation and limited connectivity between each aquifer (Figure 7).
Figure 7: Piper plot of available water chemistry data from bores within ATP1056P (data in Appendix A – Water quality results)
The affected stratum (Hutton Sandstone) lies within a depth range of 1496-1539 mSS (AD-1). All shallower aquifers/reservoirs are behind casing and have no access to the surface or other aquifers (that are not naturally connected) via the production wells. The oil/water contact lies at approximately 1500 mSS at AS-1 and 1504 mSS at AD-1.

Amended Draft - Underground Water Impact Report – ATP1056P 25
What is known about the Hutton Sandstone within ATP1056P so far has been acquired through the drilling of exploration bores within the permit. It is not possible to determine if there is communication between the Hutton Sandstone and shallower zones. Well data in the field suggests that reservoir seals provide separation between known oil reservoirs and other aquifers. Based on drilling and production data it’s not possible to quantify the degree of communication between the reservoirs.
Data obtained by AGL regarding the Hutton Sandstone is limited to exploration bores. This data does not permit an exhaustive review of communication between reservoirs. Field data suggests that reservoir seals provide adequate separation between the oil reservoir and shallower aquifers.
5.3 Underground Water Level Trend Analysis
There is a lack of local data that can be used to interpret groundwater level trends over time within the region. However, it is noted, in recent times there have been significant pressure increases in regional aquifers (used for water supply) within the GAB because of the cap and pipe programs (QDNRM, 2005). Standing water levels recorded within the DNRM GWDB are shown in Appendix B – Registered bores within ATP1056P; no bore has had more than one measurement of data and, therefore, no trends can be inferred.
There is not enough data for the target reservoir/aquifer (Hutton Sandstone) within ATP1056P to analyse water level trends. However, the current oil/water contact, and therefore the water level, is estimated to be approximately 1500 mSS at AS-1 and 1504 mSS at AD-1. The reservoir/aquifer has shown no sign of pressure depletion due to previous production testing. During production testing, the oil/water contact will naturally rise as oil is produced from the reservoir, and because of the regional extent and water pressure within the Hutton Sandstone and the relatively small volume of water expected to be removed in the current program (currently estimated at ~10.5 ML), no water level / pressure declines are expected outside of the immediate production testing area. On a regional scale, the impact of fluid production on the Hutton Sandstone as a result of production testing at AD-1 and AS-1 is expected to be negligible.
Amended Draft - Underground Water Impact Report – ATP1056P 26
6 Part C: Predicted water level declines for the affected aquifers
6.1 Maps of the affected area
The Andromedae discoveries have an area of approximately 1.1 km2 within ATP1056P. The structure of the discoveries has been mapped from the interpretation of 3D seismic data and is shown in a regional context in Figure 8.
The target reservoir of the discoveries is the Hutton Sandstone. No decline in water production rate has been observed and there is no suspected decline in reservoir pressure during production testing. Due to the nature of the geology, the fact that the exploration activities are targeting a conventional oil deposit (i.e. oil is held in place by an impermeable seal) and the integrity of the well bores, it is interpreted that no aquifers other than the target Hutton Sandstone will be/have been affected by the exploration activities. The expected impact on the Hutton Sandstone is interpreted to be localised, given the small scale of the exploration activities to date and proposed.
Given the lack of available data and the small scale of the previous and current production testing, no Immediately Affected Area or Long Term Affected Area can be accurately defined for the Hutton Sandstone. Based on the logic discussed in Section 6.2, for the purpose of meeting s376b)(iv) and (v) of the Water Act, a conservative “potentially affected area” has been defined as a 2 km buffer within the Hutton Sandstone around both the wells undergoing production testing (AD-1 and AS-1). This area is shown in Figure 9. It should be emphasised that this area has been mapped highly conservatively, and it would be unlikely that any impact could actually be detected within much of the area (if there were receptors in place), let alone an impact above the drawdown trigger threshold as defined by the Water Act (a drop of 5 m of head in a consolidated aquifer as observed at a bore).
It should be noted, within this potentially affected area, there are no receptors (water bores, groundwater dependant ecosystems/springs, or exploration holes).

Amended Draft - Underground Water Impact Report – ATP1056P 27
Figure 8: Depth structure map of the Cadna-Owie Formation within the interpreted 3D area.

Amended Draft - Underground Water Impact Report – ATP1056P 28
Figure 9: Map showing potentially affected area

Amended Draft - Underground Water Impact Report – ATP1056P 29
6.2 Methods and techniques used
The map of the potentially affected area within the Hutton Sandstone aquifer (Figure 9) was produced based on the following information.
Previous production testing at AD-1 was conducted in 2012 and 2013 (one period in May 2012 and a 6 month test from October 2012 – March 2013). During this production testing, oil and water was removed from the Hutton Sandstone via AD-1 only. A total of 0.87 ML of water was removed during these times. It appears there was no depletion in reservoir pressure at the site of the nearby AS-1 (located 1km to the southeast) which indicates the Hutton Sandstone aquifer that was affected by the AD-1 production test occurred within a 1 km radius surrounding AD-1 or less.
The current production test (commenced late October 2013) is currently licensed to be conducted for a 12 month period; during this test both AD-1 and AS-1 will be tested.
Based on this previous information and the assumption that the reservoir around AS-1 reacts in a similar way to that around the nearby AD-1 well, it is expected that the combined effect of production testing at both wells for a period of 12 months would influence an area within the Hutton Sandstone likely to be less than 2 kilometres in radius around the two wells.
To support this assertion, a Blackoil reservoir model was built using in-house Tempest (Roxar) to predict the potential impact on water pressure within the Hutton Sandstone reservoir as a result of AGL’s activities for the current and planned extraction program using several scenarios. The maximum impact was predicted using a forecast of 5 years and irreducible water saturation of 0.15 (which was based on correlations with historical data). The model was calibrated against historical data based on the production test results. The model was forecast assuming production of 1500 barrels of liquid (oil and water) from both wells with installation of artificial lift.
A snapshot of the results of the model is shown in Figure 10. This has been presented in terms of water phase saturation; where a saturation level of 1.00 indicates the liquid present within the reservoir is 100% water, a saturation level less than that indicates the presence of oil. For the purpose of this report, these images can be interpreted as the areas coloured red are areas that have not been impacted upon as a result of the extraction activities occurring at AD-1 and AS-1.
The extent of the maximum impact within the Hutton Sandstone has been modelled as approximately 1000 meters from the AD-1 well and approximately 500 meters from the AS-1 well, with no impact predicted outside of these areas. Given the limitations of the input, the resultant models are interpreted as being a coarse representation of the real situation. As such, an arbitrary 2km boundary was defined around both the wells in order to accommodate an area greater than the predicted area of potential impact defined by the model. We believe that the actual drainage radius of each well would be smaller than this predicted area.
As mentioned previously, it should be emphasised that this area has been mapped highly conservatively, and it would be unlikely that any impact could actually be detected within much of the area (if there were receptors in place), let alone an impact above the drawdown trigger threshold as defined by the Water Act (being a decline in the water level by more than 5 m). This area represents the zone around the wells that could potentially observe a water pressure decline, but it is likely the decline would be well under the drawdown trigger threshold for much of the defined area. Outside the defined affected area there is expected to be zero change in water level within the Hutton Sandstone as a result of the production testing activities.

Amended Draft - Underground Water Impact Report – ATP1056P 30
Figure 10: Snapshot of output of Hutton Sandstone reservoir model showing water phase saturation at time zero (A, B) and a forecast of 5 years (C, D). The red colour indicates water saturation of 1.00, i.e. complete water saturation. For the purpose of this report, the red areas indicate the area where there is no change of water pressure predicted as a result of extracting liquid (oil and water) from the two wells.

Amended Draft - Underground Water Impact Report – ATP1056P 31
6.3 Water bores within the potentially affected area
There are no groundwater bores within the defined potentially affected area. The closest (assumed) water supply bore is located 4.4 km to the northwest of the potentially affected area boundary.
Within ATP1056P six registered groundwater bores are located greater than 15 km from the AD-1 and AS-1 wells and are summarised in Table 4. There is only one water bore within 15 km and it is located in nearby PL35. None of the bores are screened across the production unit (Hutton Sandstone) of the Andromedae discoveries.
On the basis of the distance of these water bores from the Andromedae discoveries and the fact that, to AGL’s knowledge, none of these bores access the Hutton Sandstone (Central 5 Groundwater Management Unit of the Central GMA), there is no means of using these bores or the wells to infer any sort of aquifer interactions or impact on effective pressure.
Outside of ATP1056P, the closest (inferred) existing water bore is RN 6304 (Whim Well) and taps the Tertiary Glendower Formation. RN 6304 is 4.4 km northwest of the potentially affected area boundary, within the Watson oilfield. The next closest inferred water bore outside of ATP1056P is greater than 15 km from the potentially affected area boundary, and again is inferred to tap the Tertiary Glendower Formation (RN 6303, Whip Bore). There are no other bores outside of ATP1056P within 20 km of the production testing activities.
Table 4: Private Water Bores located within 50km of Andromedae 1 and Andromedae South 1, as listed in DNRM’s GWDB
Local Bore Name
Registered Number
Tenure/Block/ Sub Block
Total Depth (mbgl)
Main Aquifer
Distance from potentially affected area (km)
Dio Nocaburra 1 23599 ATP1056 1718 Namur Sandstone
15.5
Dio Ella 1 23466 ATP1056 1278 Namur Sandstone?
26.9
Winninia No 1 Bore
50223 ATP1056 27? Glendower Formation
33
Winninia No 2 Bore
50352 ATP1056 32 Glendower Formation
33
Bobs Bore 15433 ATP1056 37 Glendower Formation
35
Muggera Bore 50673 ATP1056 1070 Wallumbilla Formation
45.9
Whim Well 6304 PL35 31 Glendower Formation
4.4
Whip Bore 6303 ATP752P W 29 Glendower Formation
15.7

Amended Draft - Underground Water Impact Report – ATP1056P 32
6.4 Review of maps produced
Going forward, AGL will conduct annual reviews of the maps contained within this UWIR if any new data is available from the production testing activities. These reviews will note any significant increases or decreases in volumes and comment as to why they occurred (e.g. increase in number of production testing wells) and what the expected effect on the aquifer will be. These reviews will be incorporated and elaborated on in the relevant section in future UWIR’s.
In line with 376(e) of the Water Act, AGL will commit to conducting an annual review of the accuracy of each map and provide a summary of the outcome of each review to the Chief Executive of the relevant department (DEHP at the time of writing). This review will occur annually during the life of the existing production testing program. The first annual review is scheduled to occur 1 year after approval of this UWIR.
Amended Draft - Underground Water Impact Report – ATP1056P 33
7 Part D: Water Monitoring Strategy
7.1 Rationale
Due to the massive regional extent of these sandstone aquifers there is excellent pressure support during the entire period that production testing has and will occur.
The absence of water bores in the defined potentially affected area of the Andromedae discoveries means that there is no feasible way to assess changes in water levels. In addition, there are no groundwater receptors (water supply bores or groundwater dependant ecosystems) within the defined potentially affected area.
As a potentially affected area (in lieu of the definition of an Immediately Affected Area and/or a Long Term Affected Area) has been identified for the Hutton Sandstone, a WMS is required specifically for monitoring the water levels and volumes taken from this hydrogeological unit. In order to meet section 376(e) of the Water Act 2000 (Qld) requirement of a WMS and in order to continue to refine the current understanding of the groundwater system and to monitor any changes in groundwater within the Hutton Sandstone aquifer as a result of the production testing activities, the groundwater monitoring program as detailed in the following sections and listed in Table 5 will be undertaken for the duration of the upcoming production testing period.
As such, the rationale underpinning the WMS is to monitor and assess changes in water production and water chemistry of the produced water from the Hutton Sandstone aquifer as a result production testing activities. In addition, employment of the WMS will further improve the understanding on the hydrogeological system and potential impacts on the aquifer.
Given the low volume of water production as well as the lack of groundwater receptors within the defined potentially affected area of the Hutton Sandstone, the water monitoring strategy (WMS) proposed is simple.
7.2 Monitoring strategy
AGL’s monitoring strategy is based on two primary parameters. These are formation water production history and water quality. By monitoring and maintaining records of these parameters, AGL has developed a monitoring strategy that meets the requirements of Section 376(f) of the Water Act. The following section provides more specific details of how these parameters are collected.
7.3 Timetable and methodology
The groundwater monitoring program, as shown in Table 5, will be employed during the upcoming production testing in late 2013 in order to satisfy the requirement of a water management strategy for the affected area as defined for the Hutton Sandstone (section 376(e) of the Water Act 2000 (Qld)).

Amended Draft - Underground Water Impact Report – ATP1056P 34
Table 5: Water monitoring program during production testing – site list and schedule
Monitoring Site
Tenure Location Water production monitoring (in terms of cumulative flow) (in KL/day)
Water quality (refer Table 6)
AD-1 ATP1056P -28.12021947, 142.12475914
Daily -
AS-1 ATP1056P -28°07'39.8337", 142°07'45.1317"
Daily -
Storage dam
ATP1056P -28.12073° 142.12506
- Every 2 months (starting first month of production)
7.3.1.1 Produced water volume monitoring
Previously, the volume of water produced from AD-1 was measured at the storage dam periodically. Water flow meters are now installed at both wells for the current production testing program. The meters will allow for daily collection of cumulative flow data for each well.
7.3.1.2 Water quality monitoring
Surface water samples will be collected using standard industry practices, including use of appropriately preserved sample containers based on sample analytes. Field measurements (Electrical Conductivity (EC), pH, Eh, temperature and Total Dissolved Solids (TDS)) will be collected in accordance with standard industry practices and recorded. "
Water quality samples are sent to a NATA accredited laboratory in Brisbane in appropriate sample bottles within the specified holding time. The analytical suite shown in Table 6 has been adopted for water quality analysis.

Amended Draft - Underground Water Impact Report – ATP1056P 35
Table 6: Water quality laboratory analytical suite
Category Parameters Check on Field Parameters
Electrical conductivity and TDS
Major ions (in mg/L) Cations
calcium
magnesium
sodium
potassium
Anions
chloride
hydroxide
carbonate
bicarbonate
sulphate
fluoride
Dissolved metals and minor / trace elements (in mg/L)
aluminium
arsenic
barium
beryllium
cadmium
chromium
cobalt
copper
iron
lead
manganese
mercury
nickel
vanadium
zinc
Hydrocarbons (in µg/L) TPHs
PAHs
BTEX
7.4 Reporting program
Given the small scale of the production testing and the short length of the programs (current program licensed to be 12 months duration), a frequent reporting program is not warranted. AGL proposes to maintain the monitoring data in house, which could be provided upon request to the Office of Groundwater Impact Assessment and/or Department of Environment and Heritage Protection. Data collected from previous production testing is presented within this Underground Water Impact Report.
In view of the fact this is currently planned to be a limited production testing program, and there will be limited data available from the wells in terms of recovery water levels, there will be very little new information to warrant an annual review. However, in line with 376(e) of the Water Act 2000 (Qld) AGL will commit to conducting an annual review of the accuracy of each map and provide a summary of the outcome of each review to the Chief Executive of the relevant department (DEHP at the time of writing). This review will occur annually during the life of the existing production testing program, although it is noted that this upcoming program is only currently licensed to occur for a 12 month period. The first annual review is scheduled to occur 1 year after approval of this UWIR. Otherwise, as required by the Water Act 2000 (Qld), a new UWIR will be compiled every 3 years and submitted to DEHP, if production testing continues.
In addition, required under section 378 (1)(d) of the Water Act 2000 (Qld), AGL will submit a report relating to the implementation of the water monitoring strategy to the Office of Groundwater Impact Assessment yearly for ATP1056P.

Amended Draft - Underground Water Impact Report – ATP1056P 36
8 Part E: Spring Impact Management Strategy
8.1 Spring inventory
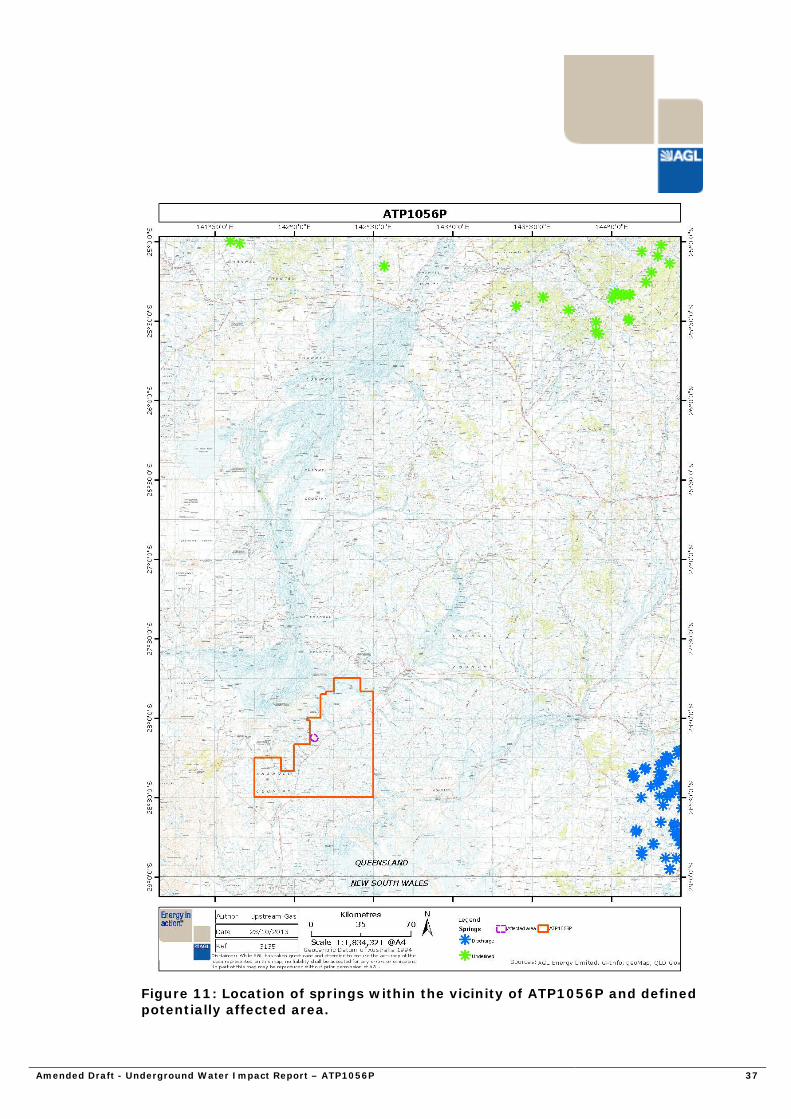
A review has been undertaken of the Queensland Wetland Data (version 3.0), prepared by the Queensland Department of Science, Information Technology, Innovation and the Arts in 2012. The dataset provides mapping of the 2009 extent and type of wetlands at 1:100,000 scale across Queensland. There are no springs identified within ATP1056P (Figure 11). The closest mapped spring in Queensland is approximately 200 km to the east of the production testing activities and is not within ATP1056P.
As no springs exist within ATP1056P or within the defined potentially affected area, a spring management strategy is not required for this UWIR.
8.2 Connectivity between the spring and the aquifer
Not applicable.
8.3 Management of Impacts
Not applicable.
8.4 Timetable for Strategy
Not applicable.
8.5 Reporting Program
Not applicable.
Amended Draft - Underground Water Impact Report – ATP1056P 37
Figure 11: Location of springs within the vicinity of ATP1056P and defined potentially affected area.

Amended Draft - Underground Water Impact Report – ATP1056P 38
9 Part F: For a CMA assign responsibilities 8 to petroleum tenure holders
Not applicable as ATP1056P is not part of a CMA as per s376(i).
Amended Draft - Underground Water Impact Report – ATP1056P 39
10 References
10.1 Documents
Evans, P.A., 1996. Fluoride anomalies in aquifers of the Queensland section of the Great Artesian Basin and their significance. In: Mesozoic Geology of the Eastern Australia Plate Conference, Brisbane, 23-26 September, 1996, Geological Society of Australia Extended Abstracts No. 43, p 172-178.
Golder Associates, 2013. Underground water impact report for Santos Cooper Basin oil and gas fields, SW QLD, Report prepared for Santos Ltd, Report number: 117636010-3000-001-Rev3. Accessed online October 2013: http://www.ehp.qld.gov.au/management/coal-seam-gas/pdf/santos-uwir.pdf
Habermehl M.A., and Lau J.E., 1997, Hydrogeology of the Great Artesian Basin (Map at scale 1:2500000), Australian Geological Survey Organisation, Canberra
Moussavi-Harami, R., 1996. Burial history. In: Alexander, E.M. and Hibburt, J.E., (Eds), 1996. The petroleum history of South Australia, Vol 2: Eromanga Basin, South Australia, Department of Mines and Energy, Report Book, 96/20, p111-124.
Queensland Department of Natural Resources and Mine (QDRNM), 2005. Hydrogeological framework report for the Great Artesian Basin Water Resource Plan Area, Version 1.0. Accessed online October 2013: http://www.nrm.qld.gov.au/wrp/pdf/gab/gab-hydrogeological-framework-report.pdf
10.2 External datasets
Queensland Digital Groundwater Bore Data (DNRM bore database), 2012, Licence for version 1.0 (May 2012), Department of Natural Resources and Mines, State of Queensland. Available by request http://www.dnrm.qld.gov.au/
Queensland Wetland Data, Version 3.0, obtained via download from the Queensland Government Information Service http://dds.information.qld.gov.au/DDS/Search.aspx, accessed 23rd October 2013
Geoscience Australia, 2009. 1:250 000 geoMAP Topographic map, zone 55. Used as base map in figures throughout report (legend not shown). Available at http://www.ga.gov.au/topographic-mapping/digital-topographic-maps.html

Amended Draft - Underground Water Impact Report – ATP1056P 40
Appendix A – Water quality results
Sample location Hercules North 1*
Pyxis 1* Bradford 1* Dio Ella 1 (23466)**
Dio Wompi 1 (23578) **
Muggera Bore (50673)**
Bob’s Well (7436)**
Target aquifer Hutton Hutton Namur Namur Namur? Wallumbilla Glendower
Sample date 26/05/2013
6/12/2011
16/11/2011
05/06/1988
10/7/1999 4/3/2008 24/8/1962
Analyte grouping/ Analyte Units Limit of reading
pH Value pH Unit 0.01 7.89 8.2 8.6 8.2
Sodium Adsorption Ratio - 0.01 31.5 38 76 49 19.5
Electrical Conductivity @ 25°C µS/cm 1 6300 2250 3150 1960
Salinity (NaCl equivalent) mg/L (Unknown)
3400 4800
Total Dissolved Solids @180°C mg/L 10 4570 1440 2027 1060 5406 (inferred)
Total Dissolved Solids (Calc.) mg/L 1 4100
Total Hardness as CaCO3 mg/L 1 128 41 20 13 1141
Resistivity at 25°C ohm cm 1 159
Hydroxide Alkalinity as CaCO3 mg/L 1 <1
Carbonate Alkalinity as CaCO3 mg/L 1 <1 14 51 2 0
Bicarbonate Alkalinity as CaCO3
mg/L 1 1110 1200 1567 189 150
Total Alkalinity as CaCO3 mg/L 1 1110 1000 1370 158 123
Sulfate as SO4 - Turbidimetric mg/L 1 27 13 25 32 1149
Chloride mg/L 1 1200 185 291 474 2212
Calcium mg/L 1 48 12 6 5 252
Magnesium mg/L 1 2 2.8 1 0.1 124

Amended Draft - Underground Water Impact Report – ATP1056P 41
Sample location Hercules North 1*
Pyxis 1* Bradford 1* Dio Ella 1 (23466)**
Dio Wompi 1 (23578) **
Muggera Bore (50673)**
Bob’s Well (7436)**
Sodium mg/L 1 819 560 773 407 1517
Potassium mg/L 1 930 12 27 2 -
Fluoride mg/L 0.1 4 5.6 3 7 1
Total Anions meq/L 0.01 56.6
Total Cations meq/L 0.01 62
Ionic Balance % 0.01 4.56
Iron mg/L (Unknown)
0.21 0 0.01
Manganese mg/L (Unknown)
0.03 0 0.01
*- data collected for AGL
** - data obtained from DNRM GWDB

Amended Draft - Underground Water Impact Report – ATP1056P 42
Appendix B – Registered bores within ATP1056P
Table 7: Registered bores within ATP1056P from DNRM’s 2012 groundwater database (GWDB)
Registered Number (RN)
Drilled date
Easting Northing Original name of facility
Facility status
Facility role+ Facility type Target aquifer
Aquifer age*
Water level mbgl (date)
6975 637611 6914536 EAGLE HAWK Abandoned Undefined within GWDB – interpreted to be water supply
Sub-artesian Facility
6976 641243 6909354 WET CAMP BORE
Abandoned Undefined within GWDB – interpreted to be water supply
Sub-artesian Facility
6981 625526 6912113 PADDY PADDY WELL
Abandoned Undefined within GWDB– interpreted to be water supply
Sub-artesian Facility
6984 605237 6877135 BRANSBY HOMESTEAD
Abandoned Undefined within GWDB– interpreted to be water supply
Sub-artesian Facility
6985 616352 6883471 HUMES CREEK BORE
Abandoned Undefined within GWDB– interpreted to be water supply
Sub-artesian Facility
6986 644716 6882522 DITCHERIE WELL
Abandoned Undefined within GWDB– interpreted to be water supply
Sub-artesian Facility
6988 614818 6892786 SOUTH BOUNDARY BORE
Abandoned Undefined within GWDB– interpreted to be water supply
Sub-artesian Facility
7429 579237 6873142 WININNA Abandoned Undefined within GWDB - – interpreted to be water supply
Sub-artesian Facility Winton Formation
Cretaceous

Amended Draft - Underground Water Impact Report – ATP1056P 43
Registered Number (RN)
Drilled date
Easting Northing Original name of facility
Facility status
Facility role+ Facility type Target aquifer
Aquifer age*
Water level mbgl (date)
7436 585052 6861546 BOBS WELL Abandoned Undefined within GWDB– interpreted to be water supply
Sub-artesian Facility Glendower Formation (inferred)
Tertiary
13297 8/01/1957 598403 6858315 NARYILCO NO 5
Abandoned Undefined within GWDB - interpreted to be water supply
Sub-artesian Facility Glendower Formation
Tertiary -39.6 (8/1/1957)
13749 30/08/1958 612518 6894307 NOCKATUNGA NO. 1
Abandoned Undefined within GWDB - interpreted to be water supply
Sub-artesian Facility Winton Formation
Cretaceous -24.4 (30/8/ 1958)
13799 22/10/1958 599041 6875107 NOCKATUNGA NO. 2
Abandoned Undefined within GWDB - interpreted to be water supply
Sub-artesian Facility Glendower Formation
Tertiary -32 (22/10/ 1958)
15433 1/01/1962 585052 6861546 BOBS BORE Existing Undefined within GWDB – interpreted to be water supply
Sub-artesian Facility Glendower Formation
Tertiary
23409 30/04/1985 629739 6924365 DIO MILFORD 1
Existing Undefined within GWDB – interpreted to be water supply, previously petroleum exploration
Artesian Bore, Condition Unknown
23466 15/11/1986 639477 6892343 DIO ELLA 1 Existing Undefined within GWDB – interpreted to be water supply, previously petroleum exploration
Artesian Bore, Controlled Flow
Namur Sandstone (inferred)
Jurassic
23508 27/01/1986 628618 6853828 DIO WOMPAH 1
Abandoned Undefined within GWDB – interpreted to be petroleum exploration
Artesian Bore, Ceased to Flow
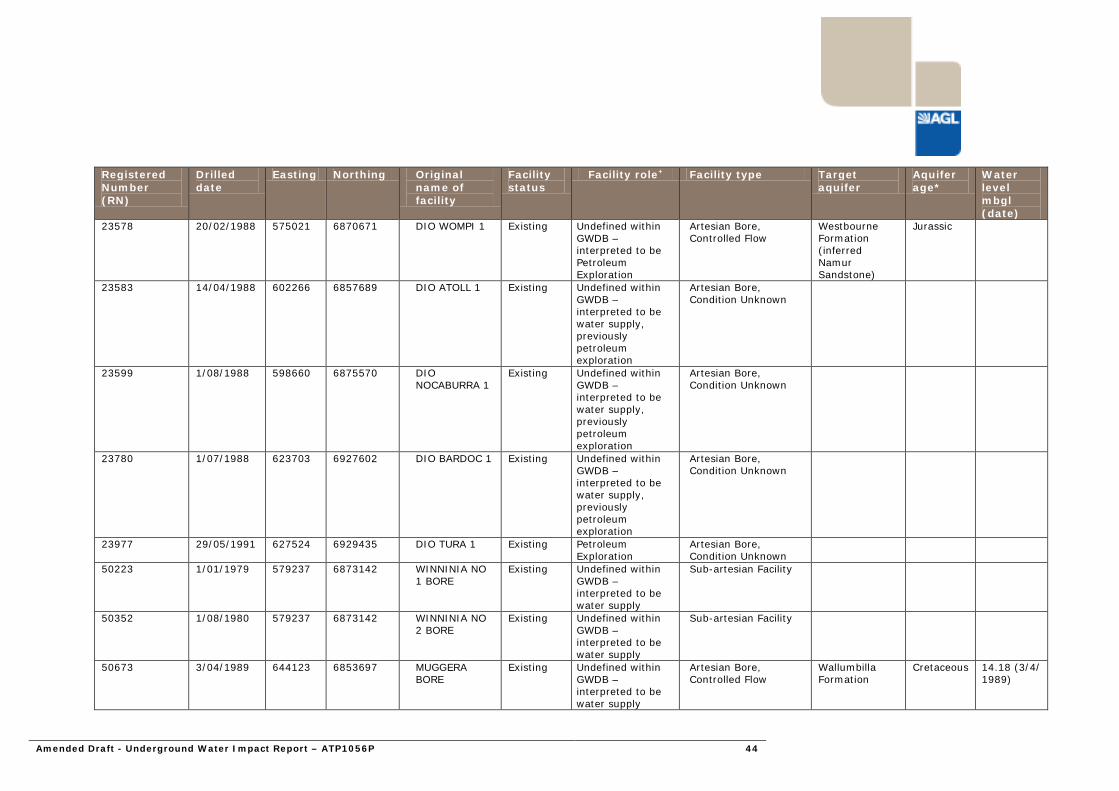
Amended Draft - Underground Water Impact Report – ATP1056P 44
Registered Number (RN)
Drilled date
Easting Northing Original name of facility
Facility status
Facility role+ Facility type Target aquifer
Aquifer age*
Water level mbgl (date)
23578 20/02/1988 575021 6870671 DIO WOMPI 1 Existing Undefined within GWDB – interpreted to be Petroleum Exploration
Artesian Bore, Controlled Flow
Westbourne Formation (inferred Namur Sandstone)
Jurassic
23583 14/04/1988 602266 6857689 DIO ATOLL 1 Existing Undefined within GWDB – interpreted to be water supply, previously petroleum exploration
Artesian Bore, Condition Unknown
23599 1/08/1988 598660 6875570 DIO NOCABURRA 1
Existing Undefined within GWDB – interpreted to be water supply, previously petroleum exploration
Artesian Bore, Condition Unknown
23780 1/07/1988 623703 6927602 DIO BARDOC 1 Existing Undefined within GWDB – interpreted to be water supply, previously petroleum exploration
Artesian Bore, Condition Unknown
23977 29/05/1991 627524 6929435 DIO TURA 1 Existing Petroleum Exploration
Artesian Bore, Condition Unknown
50223 1/01/1979 579237 6873142 WINNINIA NO 1 BORE
Existing Undefined within GWDB – interpreted to be water supply
Sub-artesian Facility
50352 1/08/1980 579237 6873142 WINNINIA NO 2 BORE
Existing Undefined within GWDB – interpreted to be water supply
Sub-artesian Facility
50673 3/04/1989 644123 6853697 MUGGERA BORE
Existing Undefined within GWDB – interpreted to be water supply
Artesian Bore, Controlled Flow
Wallumbilla Formation
Cretaceous 14.18 (3/4/ 1989)
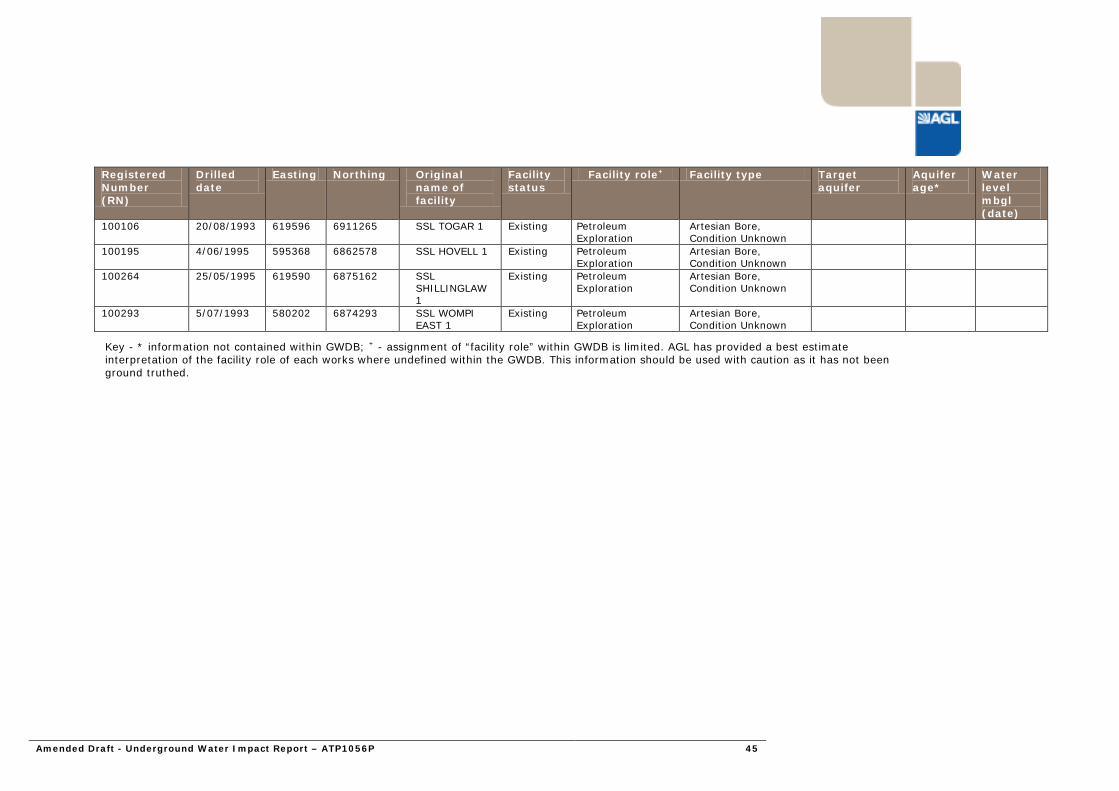
Amended Draft - Underground Water Impact Report – ATP1056P 45
Registered Number (RN)
Drilled date
Easting Northing Original name of facility
Facility status
Facility role+ Facility type Target aquifer
Aquifer age*
Water level mbgl (date)
100106 20/08/1993 619596 6911265 SSL TOGAR 1 Existing Petroleum Exploration
Artesian Bore, Condition Unknown
100195 4/06/1995 595368 6862578 SSL HOVELL 1 Existing Petroleum Exploration
Artesian Bore, Condition Unknown
100264 25/05/1995 619590 6875162 SSL SHILLINGLAW 1
Existing Petroleum Exploration
Artesian Bore, Condition Unknown
100293 5/07/1993 580202 6874293 SSL WOMPI EAST 1
Existing Petroleum Exploration
Artesian Bore, Condition Unknown
Key - * information not contained within GWDB; + - assignment of “facility role” within GWDB is limited. AGL has provided a best estimate interpretation of the facility role of each works where undefined within the GWDB. This information should be used with caution as it has not been ground truthed.