amended budget summary all divisions
TRANSCRIPT
Amended Budget SummaryAll Divisions
(Revised for Reduced Appropriations June 23, 2014)

UNIVERSITY OF VIRGINIA 2014-2015 BUDGET SUMMARY
TABLE OF CONTENTS
2014-2015 AMENDED BUDGET SUMMARY (Revised for Reduced Appropriations June 23, 2014)…….….A-1 [Pages A-1 to A-7 reflect revised charts, graphs, and narrative that should
be referenced when reading similar sections in the Budget Summary]
CONSOLIDATED BUDGET SUMMARY ............................................................................................................. 1 ACADEMIC DIVISION
Budget and Planning Process .................................................................................................................. 13 Overview of Operating Sources of Funds ............................................................................................... 17 Overview of Operating Uses ................................................................................................................... 23 Major Academic & Administrative Budget Overviews
Executive Vice President and Provost .............................................................................................. 31 College and Graduate School of Arts & Sciences ............................................................................ 35 Curry School of Education ................................................................................................................ 40 Darden School of Business ............................................................................................................... 45 Frank Batten School of Leadership and Public Policy ..................................................................... 48 McIntire School of Commerce .......................................................................................................... 51 School of Architecture ...................................................................................................................... 54 School of Continuing and Professional Studies ................................................................................ 58 School of Engineering and Applied Science ..................................................................................... 62 School of Law ................................................................................................................................... 67 School of Medicine ........................................................................................................................... 70 School of Nursing ............................................................................................................................. 77 University Library ............................................................................................................................. 82 President’s Office ............................................................................................................................. 86 Director of Athletic Programs ........................................................................................................... 89 Vice President and Chief Information Officer .................................................................................. 93 Vice President and Chief Officer for Diversity and Equity .............................................................. 97 Vice President for Research .............................................................................................................. 99 Vice President and Chief Student Affairs Officer .......................................................................... 104 Executive Vice President and Chief Operating Officer .................................................................. 107 Vice President and Chief Human Resources Officer ...................................................................... 110 Vice President for Management and Budget .................................................................................. 113 Senior Vice President for University Advancement ....................................................................... 118
COLLEGE AT WISE ..................................................................................................................................... 121 MEDICAL CENTER ...................................................................................................................................... 130 ANNUAL RENOVATION & INFRASTRUCTURE PROJECTS PLAN ............................................................... 136 RESOLUTION ............................................................................................................................................... 139 Cover photograph courtesy of Daniel Addison/U.Va. University Communications
A ‐ 1
UNIVERSITY OF VIRGINIA 2014-2015 AMENDED BUDGET SUMMARY
REVISED FOR REDUCED APPROPRIATIONS JUNE 23, 2014 OPERATING BUDGET SUMMARY
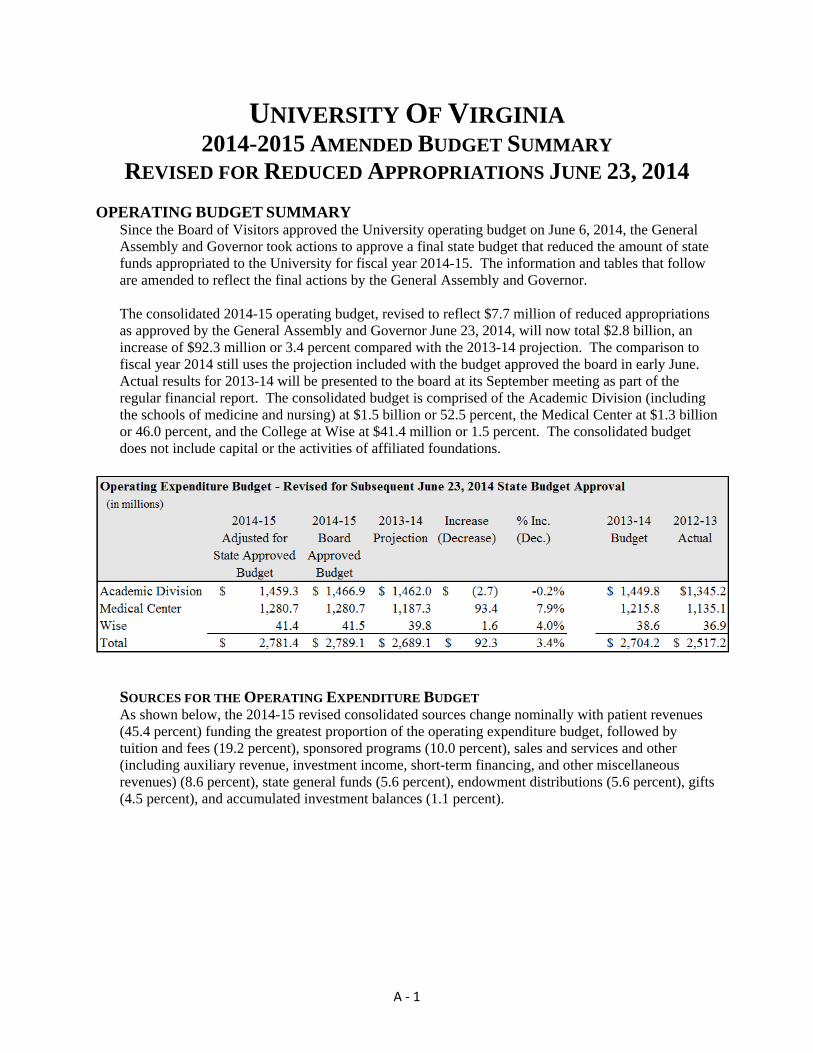
Since the Board of Visitors approved the University operating budget on June 6, 2014, the General Assembly and Governor took actions to approve a final state budget that reduced the amount of state funds appropriated to the University for fiscal year 2014-15. The information and tables that follow are amended to reflect the final actions by the General Assembly and Governor. The consolidated 2014-15 operating budget, revised to reflect $7.7 million of reduced appropriations as approved by the General Assembly and Governor June 23, 2014, will now total $2.8 billion, an increase of $92.3 million or 3.4 percent compared with the 2013-14 projection. The comparison to fiscal year 2014 still uses the projection included with the budget approved the board in early June. Actual results for 2013-14 will be presented to the board at its September meeting as part of the regular financial report. The consolidated budget is comprised of the Academic Division (including the schools of medicine and nursing) at $1.5 billion or 52.5 percent, the Medical Center at $1.3 billion or 46.0 percent, and the College at Wise at $41.4 million or 1.5 percent. The consolidated budget does not include capital or the activities of affiliated foundations.
SOURCES FOR THE OPERATING EXPENDITURE BUDGET As shown below, the 2014-15 revised consolidated sources change nominally with patient revenues (45.4 percent) funding the greatest proportion of the operating expenditure budget, followed by tuition and fees (19.2 percent), sponsored programs (10.0 percent), sales and services and other (including auxiliary revenue, investment income, short-term financing, and other miscellaneous revenues) (8.6 percent), state general funds (5.6 percent), endowment distributions (5.6 percent), gifts (4.5 percent), and accumulated investment balances (1.1 percent).

A ‐ 2
ACADEMIC DIVISION OPERATING SOURCES OF FUNDS As demonstrated in the 2014-15 revised chart below, tuition and fees (36.6 percent) provides the greatest proportion of the operating budget, followed by sponsored programs (19.4 percent), sales and service revenue and other (including auxiliary sales and services, investment income, and other miscellaneous revenues) (12.6 percent), endowment distributions (10.7 percent), state general funds (9.9 percent, down from 10.3 percent originally planned), gifts (8.7 percent), and operating cash balances (including carry forward balances ) (2.1 percent).

A ‐ 3

A ‐ 4
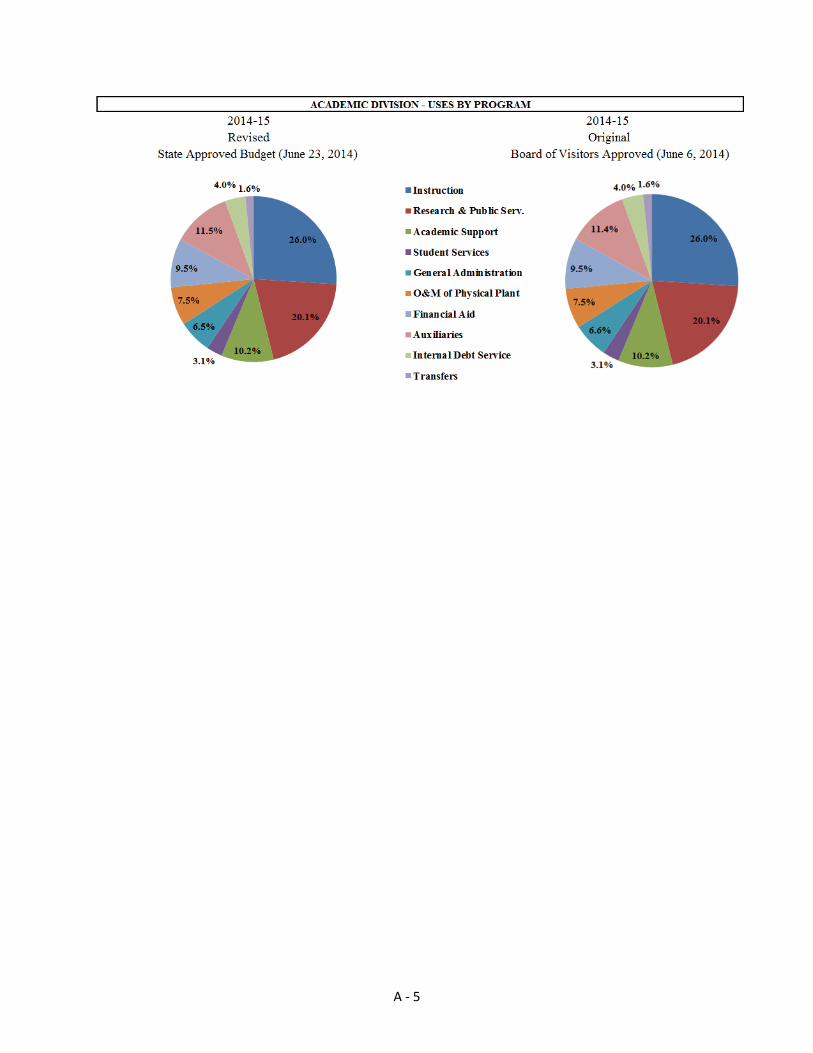
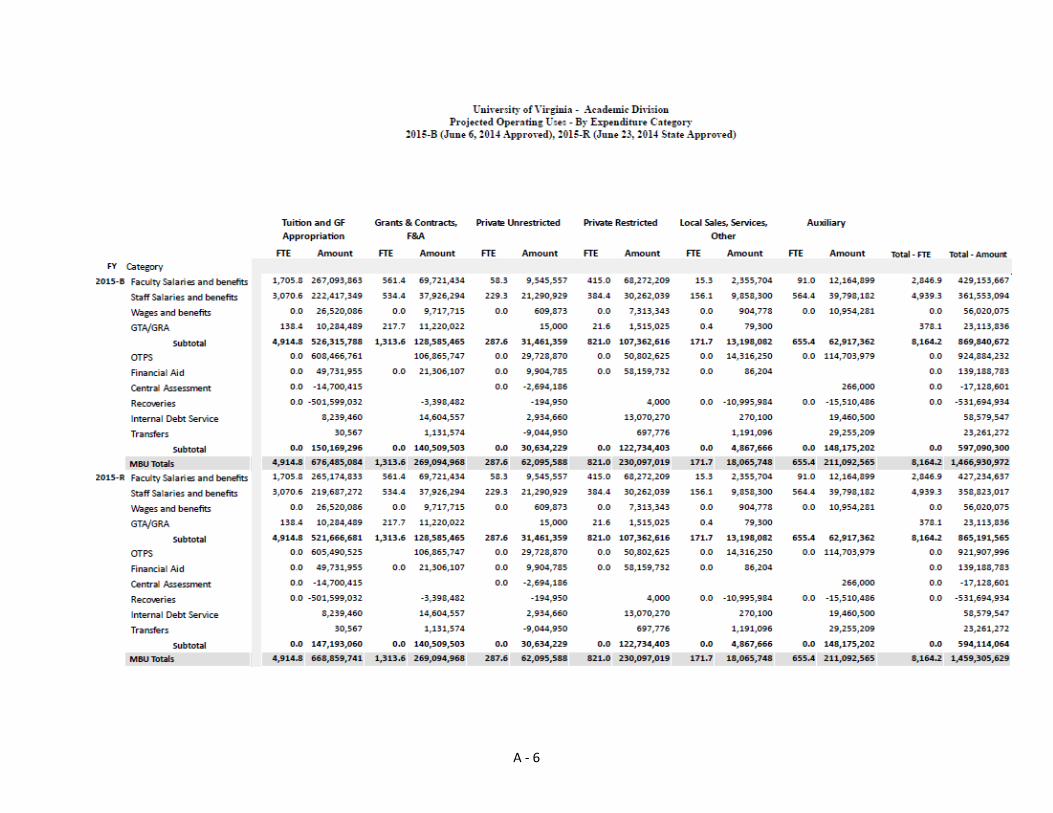
OPERATING USES BY EXPENDITURE CATEGORY AND PROGRAM Because of state revenue shortfalls final action by the General Assembly which was approved by the Governor on June 23, 2014 eliminated new general fund support for certain research/public service initiatives (cancer, focused ultrasound, and the Virginia Foundation for the Humanities) and for faculty and staff salary increases. To mitigate the elimination of state support for salary adjustments in 2014-15 the University will defer implementation of the planned salary increases for faculty (4.75 percent merit pool) and University staff (3 percent merit pool) until October 1. Classified staff will not receive a salary adjustment since the state must authorize all compensation actions for this category of employee.
Actions taken by the University to adjust to the reduced state funding do not materially alter the proportions of the budget by expenditure category. As the pie charts below indicate, 59.3 percent of the Academic Division’s total operating budget will be expended on personal services. When financial aid and auxiliary operations are excluded, 72.2 percent of educational expenditures are for the compensation (including fringe benefits) of faculty, staff, wage employees, and graduate teaching and research assistants. The impact of the revision is also immaterial when we look at uses by activity.
A ‐ 5
A ‐ 6
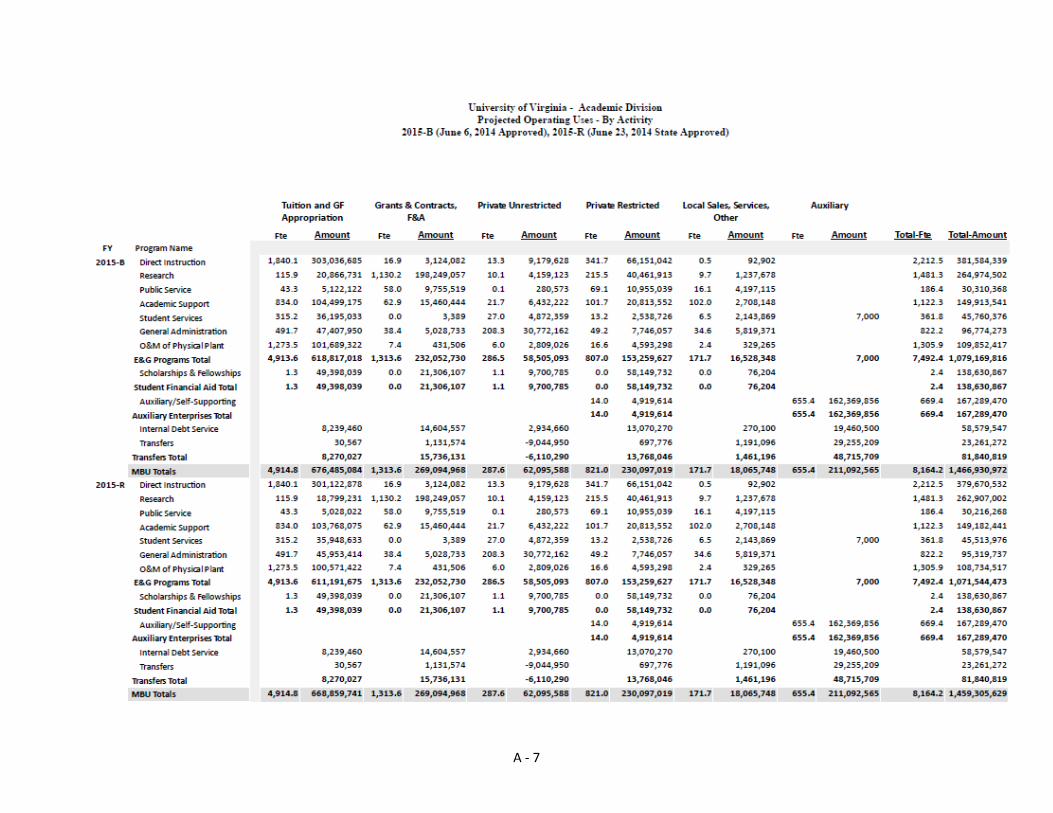
A ‐ 7
UNIVERSITY OF VIRGINIA 2014-2015 CONSOLIDATED BUDGET SUMMARY
STRATEGIC PRIORITIES The academic program is the heart of the University of Virginia’s mission. From the time of Thomas Jefferson until today, the University has aspired to define its own model for higher education, one that continues to be widely respected for its originality. The University community seeks to be distinctive in several ways. Its efforts are rooted in a set of core principles: excellence, honor and self-governance, innovation and collaboration in the pursuit of knowledge, leadership for the public good, and a vibrant breadth of academic offerings within and across schools. These defining principles were originally expressed by Mr. Jefferson and continue to serve as the guideposts for the University’s future strategic development. These principles shape how U.Va. chooses its academic strategies, how it teaches students and prepares them for the future, and how it brings the knowledge, energy, and commitment developed in the University to the benefit of society through service.
U.Va.’s faculty and schools continue to be ranked among the best in the nation. For 21 consecutive years, the University’s overall undergraduate program has been ranked first or second among public institutions, surpassed only by the flagship University of California institutions. The University’s School of Law, the Darden School of Business, and the McIntire School of Commerce are all top fifteen schools. Rather than relying on a star system, the University has achieved its rankings through strong teams of faculty, and the whole has been greater than the sum of its parts.
Competitor public institutions are typically much larger. The University has foregone the economies of scale these institutions can achieve in favor of an emphasis on smaller courses and closer faculty/student interaction. Competitor private institutions are typically smaller, but they do not face the political pressures to grow in service to the public that the University feels. One result of U.Va’s scale is that its departments are typically smaller than those at most research universities (including private institutions). Rankings are known to correlate with size. The University’s choice to remain relatively small requires collaboration across the Grounds in order to achieve a critical mass of faculty in certain important areas that is essential to ensuring continued academic recognition. The University’s decision to remain relatively small may constrain some of the choices that it can make, but it underscores a commitment to prioritize quality. Defining the Future: The Cornerstone Plan In 2013, the University of Virginia experienced a defining moment in its history with the unveiling of The Cornerstone Plan, a five-year strategic plan for the University’s Academic Division that will equip the University to move boldly into its third century. The Cornerstone Plan is organized around the theme of leadership and focuses on the development of leadership among students, faculty and staff; leadership in pedagogy, clinical care, and research; and leadership in higher education. In the process, it will bring national and international recognition to the University and to the Commonwealth. The strategic planning process, which began in fall 2012, was inclusive, bringing together faculty, staff, alumni, parents, students, and Board of Visitors members to focus on seven distinct themes within the broad effort: enhancing faculty recruitment, retention, and development; determining what it means to be a public university in the 21st century; enhancing private support and understanding the University’s financial constraints; streamlining business practices; examining student life at a residential college and career services; creating synergy by identifying and aligning common interests across the University; and examining the use of technology to enhance learning and research. After considering the multitude of
CO
NSO
LID
ATED
BU
DG
ET S
UM
MAR
Y
1
ideas put forth by various working groups and stakeholders, the University identified five pillars to serve as goals over the next five years:
Pillar 1: Enrich and strengthen the University’s distinctive residential culture;
Pillar 2: Strengthen the University’s capacity to advance knowledge and serve the Commonwealth of Virginia, the nation, and the world through research, scholarship, creative arts, and innovation;
Pillar 3: Provide educational experiences that deliver new levels of student engagement;
Pillar 4: Assemble and support a distinguishing faculty; and
Pillar 5: Steward the University’s resources to promote academic excellence and affordable access. These pillars were approved by the Board of Visitors in November 2013. Each pillar is supported by a number of strategies and initiatives for implementation, which include practical, measurable steps to address the challenges confronting higher education and also reflect the University’s unique values. The Cornerstone Plan also provides a clear framework for multiyear financial planning, allowing academic leaders and administrators to tie resource allocation decisions to the strategic priorities detailed in the plan. Enriching and Strengthening the University’s Distinctive Residential Culture (Pillar 1) Jefferson’s academical village is the foundation of U.Va.’s residential culture. With its unique size and close relationship between faculty and students, U.Va. prepares citizen-leaders who are imaginative, globally aware, and ready for public service. The Cornerstone Plan seeks to enrich and strengthen this residential culture by intensifying its work in developing students as leaders, advising students to be successful in their work at the University and beyond, and engaging alumni as a vital part of U.Va.’s residential culture. While the University has a long track record of success in all three of these areas, The Cornerstone Plan provides an opportunity for U.Va. to recommit itself to the things that make it distinctive, and to make these key components of its residential culture a high priority for resources and innovation. Accordingly, this budget reflects a number of such investments through significant enhancements to academic and career advising activities and resources, funding for student diversity initiatives, and planning for renovated spaces to meet the changing needs of UVa’s residential culture. Strengthening the University’s Capacity to Advance Knowledge (Pillar 2) The University of Virginia has remained true to the philosophy of its founder by constantly adapting to the contours of new knowledge and by shaping those contours through cutting-edge research and scholarship. The Cornerstone Plan calls for major investments in interdisciplinary research institutes and research infrastructure and services to support the research and scholarship of faculty and students throughout the institution and to bring the perspectives and strengths represented in the disciplines of the University’s eleven schools to bear in advancing knowledge and creative expression to solve today’s most challenging problems. This budget reflects a number of initiatives related to this Pillar, including the ongoing development of a research institute and a new graduate major related to “big data,” significant investments in UVa’s research infrastructure and libraries, and ongoing support for innovation and technology commercialization. Providing Educational Experiences that Deliver New Levels of Student Engagement (Pillar 3) The Cornerstone Plan calls for educational experiences that encourage students to internalize knowledge and for innovative programs whose effectiveness can be measured by the impact they have on students’ lives. By melding the curricular, the cocurricular, and the extracurricular into a coherent and powerful educational experience, the University will leverage its distinctive residential culture and highest-quality
CO
NSO
LID
ATED
BU
DG
ET S
UM
MAR
Y
2

academic programs to provide educational experiences that engage the whole student in a deeper inquiry of the world in all of its complexities. In doing so, U.Va. will not rely on mere platitudes, but will engage in continuous improvement of its programs and become a model for assessing and disseminating new models of teaching and learning for the globally engaged student. This budget reflects these commitments through the establishment of global initiatives intended to provide opportunities for students and faculty to incorporate global perspectives into existing teaching, research, service, and leadership activities. Furthermore, this budget reflects an ongoing commitment to using evidence about learning outcomes as a way to assess and improve academic programs and initiatives. Assembling and Supporting a Distinguishing Faculty (Pillar 4) Faculty hiring and compensation is a critical area of emphasis. Attracting and retaining the best faculty is more than just a financial issue. Hiring the right people is the most critical resource decision the University makes. Supporting, evaluating, and rewarding the current faculty is equally important. The University projects significant retirements over the next five to ten years, with the possibility that half of the faculty who will be at the University in 2020 are not on Grounds today. Many peer schools face similar demographic challenges. To succeed in hiring the right people, the University must be vigilant in the search and recruitment process and have the resources necessary to compete with peer schools. U.Va. desires not simply to replace retiring faculty members, but to use the occasion to elevate the quality of faculty in ways that are consistent with the University’s dual focus on education and research. The goal is to recruit faculty members who combine leadership in their field with a commitment to educational innovation. Without question, the highest strategic priority reflected in this budget is to the University’s faculty, with significant resources being allocated to recruiting and retaining top faculty, and to providing faculty with the resources they need to succeed and to do their part to advance the other goals of The Cornerstone Plan. While the majority of the funds required to do so come from reallocations within units and the use of revenues associated with enrollment growth, this budget includes a significant investment in building and supporting U.Va.’s faculty. Steward the University’s Resources to Promote Academic Excellence and Affordable Access (Pillar 5) Maintaining Access and Affordability The University is focused on developing an integrated tuition and financial aid model in an effort to attract and retain a diverse student body of the highest caliber while also providing the appropriate level of resources for investment in programs, faculty, and staff. The University’s robust financial aid program, AccessUVa, is fundamental to fulfilling the University’s public mandate as the University admits students on a need-blind basis and is committed to meeting 100% of demonstrated financial need. As a result of the economic downturn, the proportion of the student population qualifying for need-based aid has increased – the percentage of in-state students qualifying for need-based aid rose from 24 percent in 2004 to 34 percent in 2014. The University is taking steps to mitigate additional investment in the program from unrestricted institutional resources, including an emphasis on fundraising targeted to meeting the financial need of students. An early success included the establishment of the Blue Ridge Scholarships to benefit the entering class of fall 2014, seeded by a $2.5 million challenge gift. A more in-depth discussion of AccessUVa can be found on page 8. Organizational Excellence - “Engage. Simplify. Enable the Mission.” The Organizational Excellence (OE) program, established in August 2013, is a key strategy in The Cornerstone Plan, and seeks to deliver high-quality support for the advancement of institutional priorities and goals – excellence in education, research, and scholarship. It is a comprehensive program to enhance the organization’s resource capacity by aligning and optimizing processes, technologies, human capital, and funds with mission.
CO
NSO
LID
ATED
BU
DG
ET S
UM
MAR
Y
3
Although a specific strategy under Pillar 5 – Steward the University’s Resources to Promote Academic Excellence and Affordable Access – the outcomes of the program will support and benefit, directly and/or indirectly, all of the strategies in the plan. Thus, the program supports the enhancement of student experiences, strengthening capacity for research and scholarship, assembling a distinguished faculty, developing leaders, and revitalizing fundraising. The program is founded on the following guiding principles:
Academic and administrative collaboration Data-driven and results-oriented Structure for ongoing impact, not episodic Long-term, strategic focus
The program is governed by a Leadership Council of faculty and administrators and has executive sponsorship from the Executive Vice President and Chief Operating Officer, the Executive Vice President and Provost, the Vice President for Management and Budget, and a Dean from an academic school. The Leadership Council and Executive Sponsors partner with the University community to develop, facilitate, coordinate, and sequence a portfolio of initiatives across the organization. In 2013-14, a foundational, comprehensive benchmarking study of six administrative functions – human resources, information technology, procurement, finance, research administration, and student services - was completed to assess current performance and acquire insight into how to design and deliver high-quality administrative services that best support the University’s core activities of teaching, research, patient care and public service. Benchmarking of other services, including facilities and development, is currently underway. Several pan-institutional improvement efforts have been initiated to enhance efficiency and effectiveness, and they are informed, aligned and integrated with the benchmarking study findings. These include research administration, managerial reporting, strategic sourcing, travel and expense management, leadership development and human resources services. In 2014-15, OE leadership will continue to leverage the benchmarking study findings, as well as other sources of information, to identify additional areas of opportunity. Specific initiatives will be defined, prioritized, and coordinated into a portfolio of activity to be implemented over several years. Based on work underway, measurable performance excellence is expected in several areas in FY15:
Streamlined electronic grant proposal process and enhanced research infrastructure Realized cost savings on select supplies and services as a result of strategic sourcing pilot and
subsequent expansion to other commodities Improved space planning, leading to less reliance on leased space Enhanced workforce management and planning Increased integration of IT enablement for automation and support
Supporting the Objectives of the Higher Education Opportunity Act of 2011 A number of the University’s strategic initiatives are shaped by the Virginia Higher Education Opportunity Act of 2011 (HEOA), which committed the Commonwealth and the University to goals for degree attainment, economic opportunity, and affordable access. The overarching goal of the HEOA is to produce 100,000 more degrees by 2025, particularly in science, technology, engineering, mathematics, and health (STEM-H) fields. With a 93 percent graduation rate, the University’s response to this goal is to increase the number of undergraduate students by 1,673 between 2011 and 2018. Beyond admitting more students, the University has targeted ways to increase enrollment in STEM-H programs while maintaining the strength of its liberal arts programs.
CO
NSO
LID
ATED
BU
DG
ET S
UM
MAR
Y
4

The HEOA legislation requires submission in odd-numbered years of a six-year plan by each higher education institution that outlines how the institution will respond to furthering the objectives of the Act. The most recent plan was submitted in July 2013 and not only projected efforts through 2020, but also reported on progress toward achieving the strategies outlined in the previous report. The University of Virginia’s College at Wise The University of Virginia’s College at Wise is equally committed to a set of core principles: insight, competence, sensitivity, and integrity necessary for living enriched lives and for enriching the lives of others. Key strategic priorities reflected in this budget include addressing Teaching &Research (T&R) faculty salary needs, the planning and development of the STEM Early College Academy, High Need Degree funding to support the increased engagement of T&R faculty in student recruitment, investigating the feasibility of an RN-to-BSN online program, and increased resources for the Healthy Appalachia Institute in support of the Appalachian Prosperity Project. Further discussion and analysis of The College at Wise’s strategic priorities and operating budget begins on page 122. Medical Center The Medical Center’s 2014-2015 budget was developed recognizing the challenge of providing patient care, teaching, and research services in an increasingly changing health care industry. While the full impact of the Affordable Care Act will not be realized for a number of years, many of its provisions have already been implemented. To meet this challenge, the Medical Center utilized a priority-based budget process to align resource allocations with Medical Center strategies and goals to achieve the Health System’s strategic planning goal of becoming a top decile academic medical center based on quality measures. The Medical Center budget development process is operationally focused and highly participatory. Patient care service management, support function management, and physicians have significant roles in the budget development cycle. The budget process begins with senior management developing basic budget assumptions such as discharges, length of stay, and productivity standards which drive the number of employees. The Medical Center’s budget is consistent with its Long Range Financial Plan, and provides each operating unit a cumulative operating budget that contains service demand forecasts, required full-time equivalent personnel, and non-labor expenses. OPERATING BUDGET SUMMARY The consolidated operating expenditure budget for the period July 1, 2014 through June 30, 2015 for the University of Virginia will total $2.8 billion, an increase of $100.0 million or 3.7 percent compared with the 2013-14 projection. The consolidated budget is comprised of the Academic Division (including the schools of medicine and nursing) at $1.5 billion or 52.6 percent, the Medical Center at $1.3 billion or 45.9 percent, and the College at Wise at $41.5 million or 1.5 percent. The consolidated budget does not include capital or the activities of affiliated foundations.
2014-15 2013-14 Increase % Inc. 2013-14 2012-13Budget Projection (Decrease) (Dec.) Budget Actual
Academic Division $ 1,466.9 $ 1,462.0 $ 4.9 0.3% $ 1,412.5 $1,345.2 Medical Center 1,280.7 1,187.3 93.4 7.9% 1,215.8 1,135.1 Wise 41.5 39.8 1.7 4.3% 38.6 36.9Total $ 2,789.1 $ 2,689.1 $ 100.0 3.7% $ 2,666.9 $ 2,517.2
Operating Expenditure Budget (in millions)
CO
NSO
LID
ATED
BU
DG
ET S
UM
MAR
Y
5

SOURCES FOR THE OPERATING EXPENDITURE BUDGET As shown below, patient revenues (45.2 percent) fund the greatest proportion of the operating expenditure budget, followed by tuition and fees (19.2 percent), sponsored programs (10.0 percent), sales and services and other (including auxiliary revenue, investment income, short-term financing, and other miscellaneous revenues) (8.5 percent), state general funds (5.9 percent), endowment distributions (5.6 percent), gifts (4.5 percent), and accumulated investment balances (1.1 percent).
2014-15 2013-14 Projected
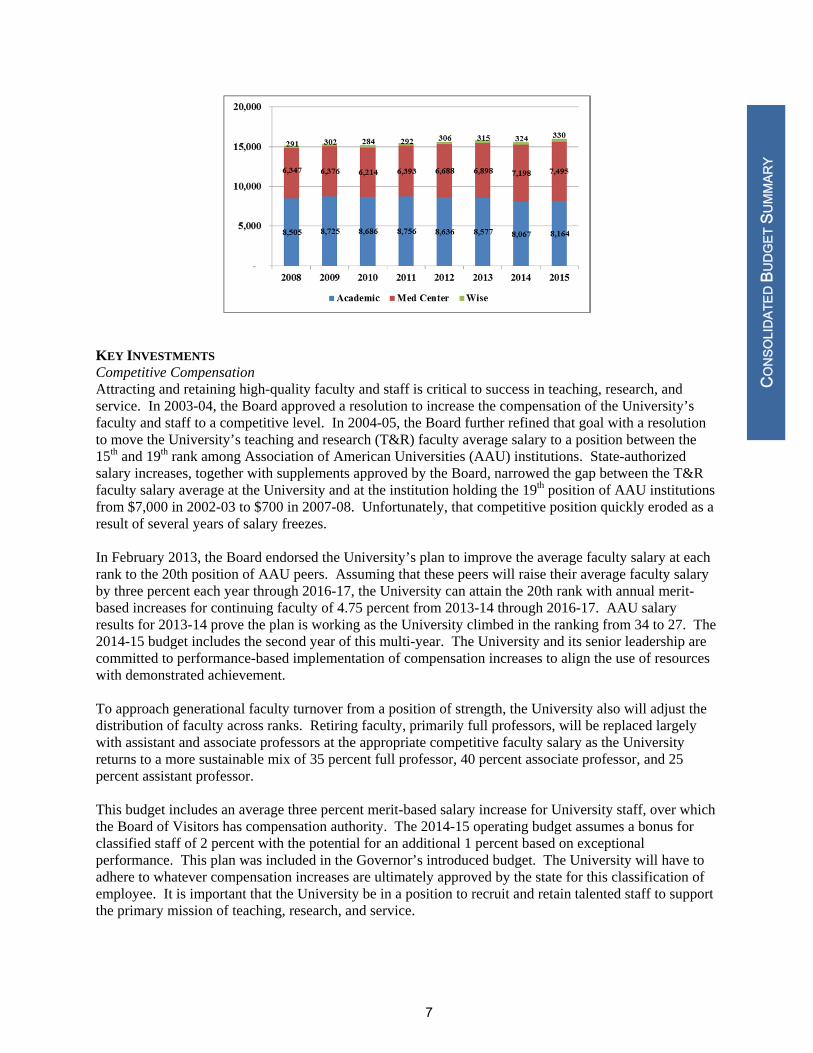
EMPLOYMENT LEVELS – ALL DIVISIONS The University has planned for 15,989 full-time equivalent (FTE) positions for 2014-15, an increase of 2.6 percent or 400 FTEs over the 2013-14 revised budget levels as shown below. The Academic Division is expecting 8,164 FTEs, an increase of 97 FTEs. This increase is driven primarily by College of Arts and Sciences faculty searches underway, Vice President for Research hiring initiatives and a temporary staffing increase associated with the managerial reporting effort. The Medical Center is projecting 7,495 FTEs, an increase of 297 FTEs over current staffing levels. Increased staffing for the Centers of Excellence and new initiatives account for an increase of 100 FTEs. The remainder of the growth is to support facility expansion, including the Battle Building, and core program growth for existing operations, including 44 additional FTEs to support bedside staffing ratios at the Medical Center and the Transitional Care Hospital. Wise plans to increase its employment by 6 FTEs to 330 FTEs, adding three self-funded positions in auxiliary enterprises, two educational and general (E&G) support positions and one privately funded instructional position.
CO
NSO
LID
ATED
BU
DG
ET S
UM
MAR
Y
6
KEY INVESTMENTS Competitive Compensation Attracting and retaining high-quality faculty and staff is critical to success in teaching, research, and service. In 2003-04, the Board approved a resolution to increase the compensation of the University’s faculty and staff to a competitive level. In 2004-05, the Board further refined that goal with a resolution to move the University’s teaching and research (T&R) faculty average salary to a position between the 15th and 19th rank among Association of American Universities (AAU) institutions. State-authorized salary increases, together with supplements approved by the Board, narrowed the gap between the T&R faculty salary average at the University and at the institution holding the 19th position of AAU institutions from $7,000 in 2002-03 to $700 in 2007-08. Unfortunately, that competitive position quickly eroded as a result of several years of salary freezes. In February 2013, the Board endorsed the University’s plan to improve the average faculty salary at each rank to the 20th position of AAU peers. Assuming that these peers will raise their average faculty salary by three percent each year through 2016-17, the University can attain the 20th rank with annual merit-based increases for continuing faculty of 4.75 percent from 2013-14 through 2016-17. AAU salary results for 2013-14 prove the plan is working as the University climbed in the ranking from 34 to 27. The 2014-15 budget includes the second year of this multi-year. The University and its senior leadership are committed to performance-based implementation of compensation increases to align the use of resources with demonstrated achievement. To approach generational faculty turnover from a position of strength, the University also will adjust the distribution of faculty across ranks. Retiring faculty, primarily full professors, will be replaced largely with assistant and associate professors at the appropriate competitive faculty salary as the University returns to a more sustainable mix of 35 percent full professor, 40 percent associate professor, and 25 percent assistant professor. This budget includes an average three percent merit-based salary increase for University staff, over which the Board of Visitors has compensation authority. The 2014-15 operating budget assumes a bonus for classified staff of 2 percent with the potential for an additional 1 percent based on exceptional performance. This plan was included in the Governor’s introduced budget. The University will have to adhere to whatever compensation increases are ultimately approved by the state for this classification of employee. It is important that the University be in a position to recruit and retain talented staff to support the primary mission of teaching, research, and service.
CO
NSO
LID
ATED
BU
DG
ET S
UM
MAR
Y
7

Enrollment Growth In February 2011 the Board approved a 1,400 student increase in prior undergraduate enrollment projections, bringing the total expected enrollment growth between fall 2011 and fall 2018 to 1,673. In fall 2014, overall undergraduate enrollment is expected to increase by 375 students.
To support this larger enrollment, the 2014-15 budget includes $6.6 million from incremental tuition revenues and $1.1 million in state support from the 2014 General Assembly. Representatives from the Budget Office, the Provost’s Office, and the undergraduate schools collaborated to develop a funding formula to ensure that new revenues are allocated to support new faculty hires and other critical support functions. Out of the 2014-15 incremental revenue from enrollment growth, $4.8 million is distributed to the undergraduate schools, $1.4 million is allocated to AccessUVa to fund need-based aid for the new students, and $849,000 is reserved for non-academic requirements. AccessUVa The Board of Visitors authorized AccessUVa in February 2004 to ensure that an undergraduate education at the University would be available to all students regardless of their financial circumstances. The program has been successful in increasing socioeconomic diversity, reducing student loan debt, and meeting 100 percent of need for all of the University’s students. In August 2013 the Board of Visitors reauthorized the AccessUVa program by affirming the University’s policy of need-blind admissions and of meeting 100 percent of demonstrated need while also standardizing aid packages and including loans for all students with demonstrated need. There is a $14,000 cap on the amount of need-based loans for low income in-state undergraduates may accumulate over a four-year period. For all other undergraduates, this cap is $28,000 over a four-year period. The projected 2014-15 full cost of AccessUVa will be $116.6 million, an increase of $10.8 million from 2013-14. This increase is related to three factors: $4.8M increase in need for existing students with need, $3.7M increase due to more students having need; $1.4M increase due to enrollment growth; and $0.9M increase due to tuition differentials. About $68.8 million will be available from restricted gifts and endowments, athletic grants, state tax funds, outside grants, federal grants and loans, and federal work study to award to students with need. Given the University’s guarantee to meet undergraduate students’ demonstrated need, the University will meet the remaining $47.8 million need from unrestricted resources, including tuition re-allocated to financial aid and the unrestricted endowment. Strategic Investment Fund The University continuously reallocates internal funding to support new priorities, but typically it has been done within a single school or department. As part of its multi-year financial planning process, the University identified the need for a more formalized approach to ensure that reallocated funds are used for strategic purposes and in a transparent manner. Accordingly, the University has established the Strategic Investment Fund, a revolving investment fund that will support initiatives emerging from The Cornerstone Plan and provide the flexibility to seize new opportunities that advance the University’s academic mission and strategy. When the Board of Visitors approved the 2013-14 operating budget it passed a resolution that recognizes the need to fund one-time strategic investment priorities. As an interim measure, prior to finalizing the long-term financial plan, the Board delegated to the Chair and Vice Chair of the Finance Committee the authority to approve one-time strategic investment needs as presented by the President. There were no allocations made from the strategic investment fund in 2013-14. The 2014-15 budget includes a number of high priority items funded by the Strategic Investment Fund many of which adhere to the principles of Organizational Excellence. They include expansion of digital materials in the library; a collaborative
CO
NSO
LID
ATED
BU
DG
ET S
UM
MAR
Y
8

collection sharing initiative to eliminate duplicate journal holdings among research libraries; a managerial reporting project that will ensure data integrity, simplify reporting, and allow more robust financial analysis and long term planning; a support structure for projects that will improve processes and identify efficiencies; and an investment in communications in support of The Cornerstone Plan. Research and Innovation As federal budget cuts impact traditional research funding agencies, the University seeks to diversify its research base through collaboration across schools within the University; through partnerships with industry; and in cooperation with institutions located throughout the nation and globally. Examples of these types of activities are described below. Rolls-Royce Partnership: In 2007, British-based Rolls-Royce announced plans to build a new jet engine manufacturing plant in Prince George County, offering significant educational and research opportunities for the University. As part of Rolls-Royce's decision to locate its facility in Virginia, the University became part of an innovative partnership that includes Virginia Tech, Virginia State University, and the Virginia Community College System (VCCS) to collaborate with the company on a variety of fronts. The state allocated $40 million to the University, Virginia Tech, and the VCCS over five years as incentive for the company’s location and research activities; the University’s share is $23.5 million. In 2012-13, the University received its fourth installment, totaling $4.8 million and its final installment of $4.3 million in 2013-14: $3.8 million to establish new endowed professorships in the McIntire School of Commerce and provide graduate student support and, in the Engineering School, $200,000 to support the new manufacturing minor and $250,000 to match research awards from Rolls-Royce. In April 2014 Rolls-Royce announced that the University of Virginia is joining the global Rolls-Royce University Technology Centers network, comprising research groups in world-class universities identified to develop long-term research and technology programs. Creating such a center provides each party with mutual benefits through funding of fundamental, collaborative research to advance key aerospace technologies critical to Rolls-Royce. AstraZeneca Collaboration: Through a strategic research collaboration established in 2009, the University and AstraZeneca are working together to develop innovative treatments for cardiovascular disease. Already, over $8 million in funding has been committed to U.Va. The partnership supports preclinical to clinical research projects that work to identify disease mechanisms and biological targets with the potential to lead to successful and commercially viable treatments. Leveraging the strengths of both partners, funded principal investigators from the University are matched with AstraZeneca researchers to accelerate the translation of research into new drugs for patient care. The alliance has the potential to greatly speed up the development of novel drugs to treat diseases in several targeted areas, taking these projects years ahead in some cases. Those targeted areas include coronary artery disease (CAD), peripheral vascular disease (PAD), myocardial infarction, atherosclerosis, and abdominal aortic aneurysms. In aggregate, these diseases account for nearly half of all deaths in the United States. Another exciting development with the AstraZeneca-U.Va. Research Alliance is that several projects that were initially started with modest seed grants have now been expanded into much larger grants. Sustainability: U.Va. has distinctive strengths in environmental sustainability research and education distributed throughout many academic and operating units. Sustainability projects include the U.Va. Bay Game -- a large-scale participatory computer simulation of the Chesapeake Bay watershed -- a powerful tool with real-world applications and impact. It has been described by federal and state agencies, non-governmental organizations, and corporate and education leaders as "the first of its kind" and “simply the best watershed management tool that exists.” U.Va. has the potential to become the global leader in shallow water coastal ecosystem research. The institution’s collaborative research activities can make a difference in how decisions and policies are developed that impact the health of the world’s ecosystems
CO
NSO
LID
ATED
BU
DG
ET S
UM
MAR
Y
9
and associated societal and economic well-being. Data Science: Society’s most pressing challenges frequently involve large, complex systems. The behavior of these systems is best understood by handling large amounts of data. To solve these challenges, we need to develop new ways to acquire, analyze, and make sense out of big data. The U.Va. Data Science Institute is an institute for large scale, complex data analysis. It is a unique confluence of computation, science, engineering, mathematics, statistics, commerce, social science, humanities, law, & more. Its mission is to achieve recognized excellence in research and education in the interdisciplinary field of data science that crosses disciplines, departments, schools and colleges to leverage U.Va.’s combined capabilities in data science. Don Brown was appointed to lead the Institute, which already has developed curricula: Masters and Certificate for graduate students; Minors for undergraduates; and Courses for general data literacy (non-specialists) minors and classes. The Institute has also secured a $10 million private foundation gift to support its efforts with the possibility of additional philanthropy on the near horizon. U.Va. Innovation: U.Va. Innovation manages a new set of growing programs designed to enhance the University’s ability to disseminate knowledge and know-how via commercialization and corporate partnerships. These programs support and link with school-based efforts to enhance entrepreneurship in Commerce (entrepreneurship), Darden (new I-lab), Engineering (entrepreneurship courses), and Medicine (translational medicine). The University has recently received funding for three exemplary programs supporting this effort:
One of only seven multi-institution initiatives to win federal funding as part of the U.S. Department of Commerce’s i6 Challenge in 2012, the Virginia Innovation Partnership, led by UVa, brings together universities, community colleges, corporations, investment capital and other resources to drive promising research discoveries forward. The Virginia Innovation Partnership is unique in the U.S. because it creates a network that links talent, ideas, and capital together across an entire state. The Virginia Innovation Partnership received $1 million in federal funding over two years as part of the i6 Challenge, with additional matching funds provided by corporate participants, university partners, and other entities.
In partnership with the Commonwealth, the University established the U.Va. Economic
Development Accelerator (UVEDA), a program to enhance proof-of-concept research, promote economic development, and accelerate university innovations toward new products, services, and companies. Private, federal, and foundation contributions will match a $1 million investment by the Commonwealth to develop the U.Va. Economic Development Accelerator (UVEDA), a public-private partnership designed to facilitate knowledge transfer and business development around University research and innovation. The public-private partnership created by the UVEDA will enable students, faculty, corporate partners, entrepreneurs, and others to experiment, collaborate, develop products and services, attract investments, build companies, and create jobs.
OpenGrounds (OG) serves as a catalyst for creative cross-disciplinary scholarship at the University and connects the University and the global community, addressing critical challenges through collaborative engagement. OpenGrounds connects fellows, faculty, students, and partners across disciplines to collaborate in new ways, share knowledge, and inspire creative action that makes impact on the world. A new state-of-the-art studio space on the Corner was launched in March 2012 and has hosted over 300 events, to date, with diverse groups from across Grounds and the external community. Additional programming space, adjacent to the current location, is slated to be renovated in 2014-2015. The OG initiative has already secured significant private funding (Vonage corporate challenge on designing the future of mobile
CO
NSO
LID
ATED
BU
DG
ET S
UM
MAR
Y
10
significant private funding (Vonage corporate challenge on designing the future of mobile communications). Based on peer benchmarking including Stanford, Harvard, Michigan, Columbia, and others, OpenGrounds is a comprehensive university program distinguished from any other in the nation. It could be rapidly expanded to studios in other schools and other external locations nationally and internationally.
U.Va. Applied Research Institute (ARI): ARI was created to enlarge the scope of projects that University researchers can participate in with government intelligence agencies and private companies. The institute, located at the U.Va. Research Park, has secured $1 million in contracts for projects to date and has hired its first full-time director. ARI leverages the University’s human and capital assets to support applied research, education, and training, with a focus on homeland security, national intelligence, and defense challenges with a particular emphasis on opportunities related to operations at Fort Belvoir’s Rivanna Station in northern Albemarle County. ARI’s mission is to create additional unique, traditional, and non-traditional research opportunities for faculty, staff, and students; develop and provide education and training programs relevant to ARI partners; foster pan-University research initiatives; provide U.Va. students unique analytical, research, and development opportunities and facilitate faculty/scientist exchanges with industry and government.
NSF ASSIST Grant: U.Va. and three other universities are partnering on a national nanotechnology research effort to create self-powered devices to help people monitor their health and better understand how their environment affects it. The National Science Foundation (NSF) Nanosystems Engineering Research Center for Advanced Self-Powered Systems of Integrated Sensors and Technologies, or ASSIST includes four partner schools plus five other affiliated universities and about 30 industry partners in its global research consortium. ASSIST is funded by an initial five-year, $18.5 million NSF grant. ASSIST researchers are using nanomaterials and nanostructures to develop self-powered health monitoring sensors and devices that use body heat and motion as power sources. These devices could be worn on the chest like a patch, on the wrist like a watch, as a cap that fits over a tooth, or in other ways, depending on the biological system that is being monitored. New devices created from this partnership could transform health care by improving the way doctors, patients, and researchers gather and interpret uninterrupted streams of health data.
CO
NSO
LID
ATED
BU
DG
ET S
UM
MAR
Y
11

12

ACADEMIC DIVISION BUDGET AND PLANNING PROCESS
A New University Financial Model: The Final Step from Concept to Reality The 2013-14 fiscal year marks the final stage of planning for the new financial model. The University has constructed the academic division budget that this document describes with an eye to translating it into the new model’s terms in the earliest days of 2014-2015. When that process is complete, the University will have taken a major step toward a core principle of The Cornerstone Plan: aligning resources with its aspirations. The new model enables leaders to more directly shape the financial destinies of the schools and units they lead, while at the same time holding them more clearly accountable for their performance. In the past, some revenues that the schools and units generated were aggregated by the University and allocated through decisions of central leaders. In the new model, revenue flows directly to the schools and units that generate it, while, at the same time, costs for central services that were covered through that same type of central decision-making will be allocated to schools and units by estimates of their usage of those services, based on such drivers as numbers of faculty, staff and/or students. Often, for the first time, schools and units will see their entire financial picture and will be able to plan with a clear understanding of the financial implications of their decisions. The entire system is designed to reward academic-values-driven creativity while providing the transparency of financial planning and decision-making. This will help ensure that we gain the maximum value from the financial resources we have, proving that academic excellence and affordable access can indeed be complementary goals. Although this academic division budget anticipates translation into the new model, it is the last that will have been assembled mainly using the University’s traditional processes and
terms of reference. Schools and units will enter the coming fiscal year with the familiarity of a budget built the “old way,” but will participate in its conversion into the new framework. Few of our academic schools are able to directly generate more funding in a year than they spend, nor do University leaders expect them to do so. As such, the University will provide additional operating support, from resources such as unrestricted state funding and unrestricted private funding, to those schools and units that may require it. In the first year, support will take the form of hold-harmless funds; in later years, this support will evolve into a combination of base operating support (ongoing) and strategic operating support (limited in duration). As the academic division budget is translated into the terms of the new University financial model early in 2014-2015, planning that is conducted exclusively in the new model’s terms will begin for 2015-2016 and beyond. Pillar 5 of The Cornerstone Plan, which focuses on stewardship of the University’s resources to promote both academic excellence and affordable access, will guide that planning toward strategic priorities such as enriching the residential student experience and supporting faculty excellence. By October, the early steps of the budget-construction cycle for the next fiscal year, using the new model’s terms, will be well under way, and the transition to the new model will be complete by spring 2015, when the 2015-2016 budget is presented to the Board of Visitors. Reflecting the final transition to a new financial model, this document focuses on the strategic priorities of the institution and its constituent units and service centers (beginning on page 30). Strategic direction, key trends, and budget analysis are included for each school and major administrative area.
ACAD
EMIC
DIV
ISIO
N
13

BUDGET AND PLANNING GUIDELINES The Academic Division utilized the following revenue assumptions in the development of the proposed budget: 1. Tuition: For planning purposes, schools
developed plans assuming no increase in undergraduate tuition and fees. Actual tuition and fee charges for 2014-15 reflect rates approved by the Board of Visitors in February and April.
2. Research: Grants and contracts revenues are based on historical spending patterns and known new awards with the presumption of a slight decrease in base federal research spending. The Facilities and Administrative cost rate is 58 percent for contracts awarded beginning July 1, 2012.
3. Auxiliary enterprises: Schools developed
plans assuming a moderate increase in student mandatory fees. Actual revenues and fee charges for 2014-15 are based on activity volumes and reflect rates approved by the Board of Visitors in February.
4. State appropriations: For planning purposes,
schools and units assumed no growth in the state appropriations. This budget reflects the state appropriation that was presented in the Governor’s introduced budget since at this time the General Assembly has yet to act on a final budget for 2014-16.
5. Endowment and interest payout: The
University’s approved endowment spending policy will govern the endowment distribution for 2014-15. Return on cash balances invested in the University short-term pool will reflect market-based rates as described in the University’s Internal Investment Program policy.
6. Philanthropy: Estimates for annual giving
are projected for each school and unit based upon estimates developed in consultation between University Advancement and school officials.
The Academic Division utilized the following expenditure assumptions in the development of the proposed budget: 1. Enrollment: Schools assumed planned
enrollment growth for fall 2014 would be supported by allocating incremental revenue related to enrollment growth to those schools with additional students according to a formula that supports the cost of faculty as well as academic, student, and administrative support.
2. Financial aid: The Academic Division’s
contribution from unrestricted resources to AccessUVa will increase to $47.8 million in 2014-15.
3. Compensation:
a. All budgets will account for the
annualized cost of the July 2013 state-authorized salary increases.
b. The 2014-15 budget includes a 4.75 percent merit based salary pool for teaching and research faculty; a 3 percent merit pool for University staff; and funds for a bonus for classified staff as directed by the Commonwealth.
c. 2014-15 fringe benefit rates are estimated at:
Pooled Fringe Benefit Rates Projected 2014-15
FT Faculty and University Staff-Executive
27.7%
FT Classified Staff; University Staff-Managerial/Professional, and University Staff Operational/Administrative
36.5%
Part-time Faculty and Staff with benefits
27.7%
Part-time Faculty and Staff without benefits and Wage employees
6.0%
4. Operations and maintenance costs: The
University commits to funding operating and maintenance costs for new facilities and proactively addressing deferred maintenance. Debt service includes
ACAD
EMIC
DIV
ISIO
N
14

principle payments as well as the blended internal borrowing rate of 4.75 percent.
5. The Darden School of Business and the Law
School financial self-sufficiency models and the McIntire School of Commerce and School of Continuing and Professional Studies revenue-sharing agreements continue in 2014-15.
6. Auxiliary enterprises, the Medical Center,
and the University Physicians Group include a general and administrative charge on the adjusted 2012-13 expenditure base to cover their share of central services.
7. Self-supporting units will continue to
comply with the Board of Visitors Capital and Operating Reserves Policy established in April 2006. Schools and units will also plan for appropriate contingency reserves.
HIGHER EDUCATION EQUIPMENT TRUST The 1986 General Assembly established a statewide Higher Education Equipment Trust to meet the high-priority equipment needs of higher education. In 2014-15, the University expects to receive approximately $13 million and will utilize the funds strategically to assist in new faculty start-up packages, purchase critical research equipment, and replace obsolete equipment. This funding comes to the University as reimbursement of purchases, so neither the allocation nor the related purchases are included in the University's 2014-15 budget. COMPARISON OF THE OPERATING BUDGET TO
AUDITED FINANCIAL RESULTS The annual operating budget reflects budget allocation decisions necessary to accomplish University goals and ensure physical and financial resources are appropriately preserved for the future. It is the responsibility of the University’s administration to propose annual plans which keep expenditures and revenues in balance. The University’s 2014-15 operating budget serves as its financial plan and is developed on a basis that is different than the basis for preparing audited financial statements. The University
prepares its financial statements in conformity with accounting principles generally accepted in the United States. As a public institution, the University adheres to standards promulgated by the Governmental Accounting Standards Board (GASB).
The Statement of Revenues, Expenses, and Changes in Net Assets from the audited financial statements most closely relates to the operating budget, but there are different rules and conventions employed. Several of these differences include: GASB financial statements classify general
fund appropriations as non-operating income, while the operating budget classifies them as operating income.
GASB financial statements are prepared on
an accrual basis, while the operating budget is prepared on a cash basis, consistent with the state’s operating budget.
GASB financial statements recognize
depreciation expense for capitalized buildings and equipment. In the Academic Division’s operating budget, depreciation expense is not funded, and capital purchases of less than $2 million are expensed rather than spread over the useful life of the capital asset. This is, in part, due to the state funding a portion of maintenance as a capital outlay appropriation. Academic Division expenditures for major repair or renovation work occur within the reserve accounts, which are not part of the operating budget. Alternatively, the Medical Center’s operating budget includes funded depreciation for buildings and equipment.
GASB financial statements reflect actual
endowment investment performance. The operating budget reflects endowment distributions – funds available for expenditure.
GASB financial statements accrue certain pledged gifts in the year the pledge is made. The operating budget includes only cash
ACAD
EMIC
DIV
ISIO
N
15

received for gifts – again, funds available for expenditure.
Management reports on the fiscal condition of the University on a cash/budgetary basis as well as the modified GASB principles. PERFORMANCE MEASUREMENT Under the 2005 Restructured Higher Education Financial and Administrative Operations Act and the 2006 and 2009 Management Agreements, the University’s performance on a set of pre-defined measures has been subject to review annually by the State Council of Higher Education for Virginia (SCHEV). The Higher Education Opportunity Act of 2011 (HEOA) suspended the Restructuring Act’s requirement that institutions submit performance measure reports until new measures were defined in accordance with the goals and objectives of the HEOA, and further provided that any institution certified by SCHEV as having met its institutional performance benchmarks for fiscal year 2010-11 would be eligible to receive the related financial benefits in subsequent years until new measures were defined and assessed by SCHEV. The 2013 General Assembly approved six new education related performance measures against which all institutions of higher education will be assessed beginning in October 2014. Each institution must:
Meet at least 95 percent of its State Council approved biennial projections for in-state undergraduate headcount enrollment.
Meet at least 95 percent of its State Council approved biennial projections for the number of in-state associate and bachelor degree awards.
Meet at least 95 percent of its State Council approved biennial projections for the number of in-state STEM-H associate and bachelor degree awards.
Meet at least 95 percent of its State Council approved biennial projections for the number of in-state, upper level – sophomore level for two-year institutions and junior and senior level for four-year institutions – program placed, full-time equivalent students.
Maintain or increase the number of in-state associate and bachelor degrees awarded to students from under-represented populations.
Maintain or increase the number of in-state two-year transfers to four-year institutions.
Meeting these performance measures entitles the institution to receive interest on its tuition balances and rebates of certain procurement fees.
ACAD
EMIC
DIV
ISIO
N
16

ACADEMIC DIVISION OVERVIEW OF OPERATING SOURCES OF FUNDS
The Academic Division’s projected operating sources are summarized on the next page. This schedule provides available operating resources based on projected cash inflows from state general funds, tuition and fees, sponsored research and F&A cost recoveries, endowment distributions, gifts, sales and service revenues, and other sources. Available resources for the operating budget are $1.47 billion for 2014-15, a 0.5 percent increase from the revised projection of sources in 2013-14. A more detailed discussion follows over the next few pages, but the relatively flat resources are primarily related to one-time carry forward balances included in the revised 2013-14 sources, expected reduced sponsored program activity, and lower anticipated sales and services revenue, including gain-share revenue in the School of Medicine, which was budgeted at $16 million in 2013-14, but is not in included in the 2014-15 proposed budgets. These are, in turn, offset by increases in tuition and state general funds. For the most part, cash balances carried forward from one year to the next are related to purchase commitments spanning the fiscal year, multi-year strategic commitments, one-time balances used for one-time expenses such as start-up packages, and departmental contingency reserves to be used in the event of revenue shortfalls or unanticipated expenditures. As demonstrated in the 2014-15 chart below, tuition and fees (36.4 percent) provides the greatest proportion of the operating budget, followed by sponsored programs (19.3 percent), sales and service revenue and other (including auxiliary sales and services, investment income, and other miscellaneous revenues) (12.5 percent), endowment distributions (10.7 percent), state general funds (10.3 percent), gifts (8.7 percent), and operating cash balances (including carry forward balances ) (2.1 percent).
2014-15 2013-14 Projected
ACAD
EMIC
DIV
ISIO
N
17

University of Virginia - Academic DivisionProjected Operating Sources
( $ )
Sources Amount
1
Tui on and GF
Appropria on
2
Grants & Contracts, F&A
3
Private Unrestricted
4
Private Restricted
5
Local Sales, Services,
Other
6
Auxiliary Total‐Amount
FY Resources Category
2014‐R Appropria ons: State
Tui on
Less: Tui on to Financial Aid
Student Fees
Sales & Services
Grants & Contracts
F&A ‐ Cost Recoveries
Endowment Distribu on
Endowment Admin Fee
Gi s
Gi s‐Via Affil Fdns
Investment Income
Opera ng Cash Balances
MBU Totals
2015‐O Appropria ons: State
Tui on
Less: Tui on to Financial Aid
Student Fees
Sales & Services
Grants & Contracts
F&A ‐ Cost Recoveries
Endowment Distribu on
Endowment Admin Fee
Gi s
Gi s‐Via Affil Fdns
Investment Income
Opera ng Cash Balances
MBU Totals
145,514,784 ‐ ‐ ‐ ‐ ‐ 145,514,784
468,006,581 ‐ ‐ ‐ 57,000 ‐ 468,063,581
‐33,494,827 ‐ ‐ ‐ ‐ ‐ ‐33,494,827
30,604,060 ‐ ‐ ‐ 2,104,341 40,508,462 73,216,863
21,773,601 ‐ ‐ ‐ 10,384,491 160,085,901 192,243,993
‐ 228,389,684 ‐ ‐ ‐ ‐ 228,389,684
16,600,000 43,200,000 ‐ ‐ ‐ ‐ 59,800,000
‐ ‐ 41,502,295 96,483,206 ‐ ‐ 137,985,501
‐ ‐ 16,220,050 ‐ ‐ ‐ 16,220,050
‐ ‐ ‐ 25,434,000 ‐ ‐ 25,434,000
‐ ‐ 302,000 98,075,897 ‐ ‐ 98,377,897
‐ ‐ ‐ ‐ 1,231,638 ‐ 1,231,638
27,237,096 4,100,001 7,871,932 10,529,815 4,088,886 1,259,599 55,087,330
676,241,295 275,689,685 65,896,277 230,522,918 17,866,357 201,853,961 1,468,070,493
152,447,668 ‐ ‐ ‐ ‐ ‐ 152,447,668
501,228,013 ‐ ‐ ‐ 57,000 ‐ 501,285,013
‐40,704,158 ‐ ‐ ‐ ‐ ‐ ‐40,704,158
31,865,413 ‐ ‐ ‐ 1,734,874 42,188,842 75,789,129
5,778,961 ‐ ‐ 922,564 10,671,961 167,791,129 185,164,615
‐ 224,876,980 ‐ ‐ ‐ ‐ 224,876,980
16,600,000 43,000,000 ‐ ‐ ‐ ‐ 59,600,000
‐ ‐ 42,297,000 98,281,113 ‐ ‐ 140,578,113
‐ ‐ 16,548,050 ‐ ‐ ‐ 16,548,050
‐ ‐ ‐ 26,451,407 ‐ ‐ 26,451,407
‐ ‐ 314,000 100,940,813 ‐ ‐ 101,254,813
‐ ‐ ‐ ‐ 367,439 ‐ 367,439
9,269,187 1,250,001 6,957,076 5,482,683 5,528,290 1,990,631 30,477,867
676,485,084 269,126,981 66,116,126 232,078,580 18,359,564 211,970,602 1,474,136,937
18

FUNDING SOURCES State General Fund Appropriation State general funds are tax revenues appropriated by the General Assembly to the institution. The $152.4 million budgeted general fund appropriation for 2014-15 reflects an increase of approximately $6.9 million over the revised 2013-14 budget of $145.5 million. Because the General Assembly has not yet passed a final state budget for 2014-16, this operating budget reflects the general funds as introduced by the Governor. The state general fund appropriation is comprised of:
$133.1 million in general operating
appropriation, a $9.8 million increase over 2013-14. This increase includes base operating support, as well as funding for enrollment growth and faculty and staff salary increases;
$7.7 million, an increase of $2.0 million, for
bioengineering, biosciences, cancer research, and the focused ultrasound program. The new money is designated for cancer research and the focused ultrasound program;
$1.0 million for the economic development
accelerator; and
$10.5 million for student financial aid.
The following chart shows the University’s standing among peer public institutions using the 2013-14 state appropriation for each school:
Tuition and Fees The 2014-15 tuition and fees budget was developed using the approved enrollment growth plan, which reflects a total of 21,384 on-Grounds headcount students for fall 2014. Of
the 14,985 undergraduate students, it is expected that 69 percent will be Virginians. The off-Grounds enrollment projection for fall 2014 is 2,606 students. The following chart demonstrates the trends in undergraduate, graduate, and professional (graduate programs in McIntire, Darden, Law, and the School of Medicine) enrollment.
The 2014-15 budget reflects tuition increases approved by the Board of Visitors in February and April, as summarized below:
TUITION AND E&G FEES
In-State Out-of-State
Undergraduate 4.3% 5.7% Graduate - Engineering 2.9% 1.7% Graduate – Ph.D. Arts & Sciences
2.4%-2.5% 2.1%-2.4%
Graduate –Master’s Degree Arts & Sciences
2.5% 2.4%
Graduate – Biomedical Sciences
1.6%-2.5% 1.6%-2.4%
Graduate - Other 3.0% 1.8%
Batten MPP Program 4.9% 6.3%
Nursing CNL Program 19.6% 19.2% Graduate - Commerce (tuition and all fees)
1.2%-3.1% 1.2%-3.1%
Darden (includes all fees) 2.6%-8.0% 2.4%-3.7% Law (includes all fees) 4.0%-
21.3% 3.6%-7.2%
Medicine (includes all fees) 1.6% 1.5%
Tuition and fees revenue, net of financial aid, is expected to increase by $28.6 million or 5.6 percent to $536.4 million. The chart on the following page provides the detail.
School
2013-14 General Funds per In-state Student
University of North Carolina $ 22,131 University of Maryland $19,014 University of Michigan $13,887 University of Virginia $9,518
ACAD
EMIC
DIV
ISIO
N
19

Approximately $19.9 million of the tuition and fees increase relates to increases in undergraduate tuition rates and undergraduate enrollment growth. Undergraduate tuition revenues include the Board-approved $5,000 tuition differential charged to students in the McIntire School of Commerce, expected to generate approximately $3.5 million, and the Board-approved $2,000 tuition differential charged to first- and second-year students in the School of Engineering and Applied Science, expected to generate approximately $1.2 million. Increases in tuition rates and enrollment in graduate programs account for another $2.5 million of the increase in total tuition and fees. About $2.2 million of the incremental revenue is allocable to tuition from Law and Darden, and another $0.7 million is attributable to the School of Medicine. Miscellaneous undergraduate programs such as the Bachelor of Interdisciplinary Studies, Semester at Sea, Mt. Lake, and music lessons account for about $0.8 million in incremental tuition and fees.
Approximately $2.5 million of the additional revenue is related to E&G fees, application fees,
program fees such as the School of Nursing and School of Medicine clinical services fees, the School of Nursing laboratory fee, and the School of Engineering and Applied Science lab fee, and mandatory student fees assessed by auxiliary (i.e., non-academic) programs such as athletics, bus services, student union, student health, and other activities. In 2014-15, $79.8 million, 13.8 percent of tuition revenue, will be applied to undergraduate, graduate, and professional financial aid. The University re-allocates tuition revenues to support financial aid through the following programs: $41.8 million to support AccessUVa.
$30.8 million to fund the cost of in-state
tuition and fees and a healthcare voucher for eligible graduate teaching assistants, and to provide the differential between in-state and out-of-state tuition and fees for out-of-state graduate students employed in a significant academic capacity and earning at least $5,000 annually.
$7.8 million for graduate fellowships, including Law and Darden students.
$1.2 million for summer session, January term, study abroad, and academic transition.
Grants, Contracts, and F&A Recoveries Direct expenditures reimbursed from grants and contracts are expected to be $224.9 million, a decrease of $3.5 million or 1.5 percent as compared to the 2013-14 revised budget. This decrease is based on the concerns about future federal investment in research, as evidenced by a real decline in new sponsored program awards during the period July 2013 through March 2014 in comparison to July 2012 through March 2013. The following graph demonstrates the trend in research awards for the University, including the temporary impact of ARRA research awards in fiscal years 2010-2012.
2014-15 Tuition and Fees Revenue (in 000s)
2013-14 Revised
2014-15 Projected
% Change from 2013-14
Tuition
Undergraduate – In-state 100,320$ 111,439$ 11.1%
Undergraduate – Out-of-state 169,178 184,857 9.3%
Less: Tuition to financial aid (32,375) (39,516) 22.1%
Net Undergraduate Tuition 237,123 256,780 8.3%
Graduate 56,694 59,273 4.5%
Less: Tuition to financial aid (28,469) (30,788) 8.1%
Net Graduate Tuition 28,225 28,485 0.9%
Professional 94,455 96,705 2.4%
Less: Tuition to financial aid (7,450) (7,758) 4.1%
Net Professional Tuition 87,005 88,947 2.2%
Medical School 28,739 29,442 2.4%
Less: Tuition to financial aid (510) (510) 0.0%
Net Medical School Tuition 28,229 28,932 2.5%
Other Tuition 18,677 19,569 4.8%
Less: Tuition to financial aid (1,120) (1,188) 6.1%
Net Other Tuition 17,557 18,381 4.7%
Student Fees 73,217 75,789 3.5%
Total Tuition and Fees 471,357$ 497,314$ 5.5%
ACAD
EMIC
DIV
ISIO
N
20

In conjunction with the decrease in expected grants and contracts, the budget includes a $.2 million or .3 percent decrease in the reimbursement of indirect costs by grants and contracts. The percentage decrease in F&A recoveries is slightly smaller than that for grants and contracts due to the increase in the University’s F&A rate effective July 2012. The University successfully renegotiated the F&A rate to 58 percent, which is applied to new contracts awarded after July 2012. F&A recoveries are expected to comprise $59.6 million of the 2014-15 funding sources. Endowment Income and Gifts The endowment spending policy adopted by the Board allows the endowment spending distribution to increase each year by an inflationary factor, as long as the resulting distribution falls between four and six percent of the preceding June 30 market value of the endowment. Accordingly, the 2014-15 endowment distribution will increase by an inflationary measure of 1.8 percent, based on the five year average of the Higher Education Price Index. This places the 2014-15 distribution at 4.68 percent of the June 30, 2013 market value as reflected in the budget assumptions reviewed with the Board in November 2013. The 2014-15 distribution will be made in two installments (July 2014 and January 2015) and is expected to provide $157.1 million to the 2014-15 budget, an increase of 1.9 percent over 2013-14.
A 0.5 percent administrative fee (based on the endowment’s June 30 market value for the preceding fiscal year) will be assessed to each endowment. One-half of the assessment will be held centrally, while the other half will be returned as unrestricted funds to the schools and units that hold the endowment accounts. The 2014-15 fee will be based on the endowment market value as of June 30, 2014 and is expected to provide $15.5 million to the 2014-15 budget.
Total gifts from annual giving and transferred from foundations available for the operating budget is projected at $127.7 million, a $3.8 million increase over revised 2013-14. This projection excludes philanthropic cash flow that will not be available for the operating budget (i.e., it is deposited with University affiliated foundations, invested in the endowment, transferred to capital projects, or made in the form of non-cash gifts-in-kind). Sales and Services and Other Sources of Funds Remaining sources of funds for the 2014-15 operating budget include sales and services ($185.2 million), operating cash balances ($30.5 million), and investment income ($.3 million). Sales and services includes revenues generated from housing rents, dining contracts and retail sales, bookstore sales, parking permits and fines, athletic conference revenues and gate receipts, and other activities. Sales and services revenue is expected to decrease by 4.1 percent from 2013-14. The change is largely driven by the fact that the 2014-15 budget does not reflect the Medical Center’s shared funding of medical education due to uncertainty around the amount while the 2013-14 budget includes a $16.0 million contribution. Increases in the auxiliary operations serve to mitigate the full impact of this change. The $30.5 million in operating cash balances for 2014-15 includes $11.2 million in accumulated investment earnings to meet expenditure commitments made from unrestricted institutional private funds. The accumulated investment earnings were the result of a Board action years ago to invest a portion of current funds in the pooled endowment fund.
ACAD
EMIC
DIV
ISIO
N
21

The revised 2013-14 operating budget includes operating cash balances of $55.1 million. This reflects unexpended funds carried forward from 2012-13 which are available for expenditure during 2013-14. For the most part, cash balances that carry forward from year to year are related to purchase commitments that span fiscal years, multi-year strategic commitments, one-
time balances used for such things as start-up packages, vacancy and turnover savings, and departmental contingency reserves to be used in the event of revenue shortfalls or to meet unanticipated expenditures.
ACAD
EMIC
DIV
ISIO
N
22

ACADEMIC DIVISION OVERVIEW OF OPERATING USES This Budget Summary document includes two views of the Academic Division’s projected operating uses by fund source: by expenditure category on page 26, which summarizes expenditures for personal services, other than personal services (OTPS), and financial aid, and by activity on page 28, which summarizes total expenditures by instruction, research, administration, and so forth. The projected operating uses are net of revenues and recoveries that internal service providers (such as Printing and Copying Services and Facilities Management) receive from other University departments to offset their expenses, as well as funds that are transferred to reserves.
The Academic Division’s projected spending plan comes to $1.47 billion for 2014-15, an increase of $4.9 million or .5 percent as compared to the revised projection for the 2013-14 budget. This very slight increase is due to a reduction of expenditures from sponsored research awards and one-time carry forward balances included in the revised 2013-14 uses. As compared to the projected available sources of $1.47 billion, the 2014-15 operating plan generates a surplus of $7.2 million. The surplus is comprised of operating cash reserves set aside for future years and restricted gifts and endowment income not expected to be expended in 2014-15. The spending plan includes several funds held in a central account for specific strategic needs, which will be allocated during the 2014-15 fiscal year, and for unexpected contingencies. Additionally, each vice president and dean manages reserves related to anticipated vacancies and contingencies. The central reserves include:
$20,000,000 Strategic Investment Fund $22,490,301 Funds for July compensation adjustments $ 8,806,200 Reserve related to unanticipated tuition shortfalls, weather-related utility
usage, and other contingencies
ACAD
EMIC
DIV
ISIO
N
23
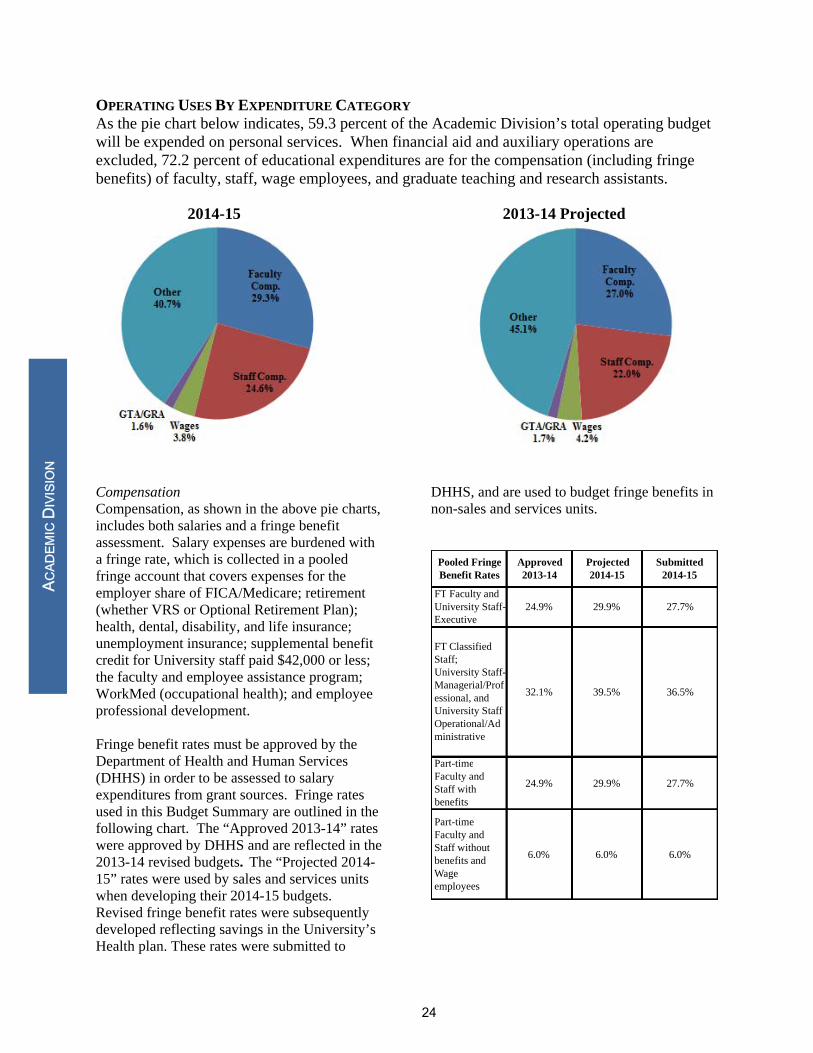
OPERATING USES BY EXPENDITURE CATEGORY As the pie chart below indicates, 59.3 percent of the Academic Division’s total operating budget will be expended on personal services. When financial aid and auxiliary operations are excluded, 72.2 percent of educational expenditures are for the compensation (including fringe benefits) of faculty, staff, wage employees, and graduate teaching and research assistants. 2014-15 2013-14 Projected
Compensation Compensation, as shown in the above pie charts, includes both salaries and a fringe benefit assessment. Salary expenses are burdened with a fringe rate, which is collected in a pooled fringe account that covers expenses for the employer share of FICA/Medicare; retirement (whether VRS or Optional Retirement Plan); health, dental, disability, and life insurance; unemployment insurance; supplemental benefit credit for University staff paid $42,000 or less; the faculty and employee assistance program; WorkMed (occupational health); and employee professional development.
Fringe benefit rates must be approved by the Department of Health and Human Services (DHHS) in order to be assessed to salary expenditures from grant sources. Fringe rates used in this Budget Summary are outlined in the following chart. The “Approved 2013-14” rates were approved by DHHS and are reflected in the 2013-14 revised budgets. The “Projected 2014-15” rates were used by sales and services units when developing their 2014-15 budgets. Revised fringe benefit rates were subsequently developed reflecting savings in the University’s Health plan. These rates were submitted to
DHHS, and are used to budget fringe benefits in non-sales and services units.
Pooled Fringe Benefit Rates
Approved 2013-14
Projected 2014-15
Submitted 2014-15
FT Faculty and University Staff-Executive
24.9% 29.9% 27.7%
FT Classified Staff; University Staff-Managerial/Professional, and University Staff Operational/Administrative
32.1% 39.5% 36.5%
Part-timeFaculty and Staff with benefits
24.9% 29.9% 27.7%
Part-time Faculty and Staff without benefits and Wage employees
6.0% 6.0% 6.0%
ACAD
EMIC
DIV
ISIO
N
24
In the 2014-16 introduced state budget, there is a provision for a one-time bonus of 2% for all state employees who meet expectations on their most recent performance evaluations, and an additional 1% one-time bonus for all state employees who receive an exceptional rating. While the final budget had not been passed at the time this budget was developed, it assumes that these one-time funds will be allocated to the institution. This budget includes provision for the following salary increases effective in July 2014:
4.75% of salary budgets authorized for merit increases for T&R Faculty;
3% of salary budgets authorized for merit increases for Administrative and Professional Faculty, Graduate Teaching and Research Assistants, and University Staff; and
2% one-time bonus for classified staff with a rating of meets expectations or better, and an additional 1% one-time bonus for those classified staff receiving exceptional evaluations.
Under the University’s Restructuring Agreement with the Commonwealth, the Board may authorize compensation adjustments for faculty and University staff. However, the Board is not authorized to grant base salary increases for classified staff; only the General Assembly may do so.
ACAD
EMIC
DIV
ISIO
N
25

University of Virginia - Academic DivisionProjected Operating Uses - By Expenditure Category
1
Tui on and GF
Appropria on
FTE Amount
2
Grants & Contracts,
F&A
FTE Amount
3
Private Unrestricted
FTE Amount
4
Private Restricted
FTE Amount
5
Local Sales, Services,
Other
FTE Amount
6
Auxiliary
FTE Amount Total ‐ FTE Total ‐ Amount
FY CTCSCategory
2014‐R Faculty Salaries and benefitsStaff Salaries and benefitsWages and benefitsGTA/GRA
Subtotal
OTPS
Financial Aid
Central Assessment
Recoveries
Internal Debt Service
Transfers
Subtotal
MBU Totals
2015‐O Faculty Salaries and benefitsStaff Salaries and benefitsWages and benefitsGTA/GRA
Subtotal
OTPS
Financial Aid
Central Assessment
Recoveries
Internal Debt Service
Transfers
Subtotal
MBU Totals
1,599.5 230,478,262 579.2 70,457,271 70.7 11,042,751 454.2 67,150,435 27.0 3,230,760 97.2 12,043,713 2,827.7 394,403,192
3,037.4 197,170,119 553.7 37,820,655 185.9 15,311,517 344.4 25,100,208 158.5 9,741,860 556.7 36,824,081 4,836.6 321,968,440
‐ 27,553,810 ‐ 11,038,803 ‐ 600,699 0.0 10,974,064 ‐ 1,351,166 ‐ 9,286,318 0.0 60,804,860
167.9 11,592,000 220.0 11,637,290 ‐ 15,000 13.5 855,725 0.9 64,998 ‐ ‐ 402.2 24,165,013
4,804.8 466,794,190 1,352.8 130,954,019 256.6 26,969,967 812.1 104,080,432 186.4 14,388,784 653.9 58,154,112 8,066.6 801,341,504
0.0 709,637,623 ‐ 109,412,211 0.0 32,731,869 0.0 47,358,656 ‐ 17,180,461 0.0 110,435,097 0.0 1,026,755,917
0.0 47,040,147 ‐ 22,107,984 0.0 12,749,133 0.0 57,129,014 0.0 49,953 ‐ ‐ 0.0 139,076,231
‐ ‐14,800,589 ‐ ‐ ‐ ‐2,664,027 ‐ ‐ ‐ ‐ ‐ ‐ ‐ ‐17,464,616
‐ ‐546,370,335 ‐ ‐2,525,377 ‐ ‐227,950 ‐ ‐1,056 ‐ ‐14,239,110 0.0 ‐15,175,333 0.0 ‐578,539,161
‐ 9,121,049 ‐ 14,545,936 ‐ 2,935,035 ‐ 17,279,197 ‐ 34,800 ‐ 18,942,142 ‐ 62,858,159
‐ 4,818,210 ‐ 1,171,846 ‐ ‐6,942,850 ‐ 70,000 ‐ 336,949 ‐ 28,492,314 ‐ 27,946,469
0.0 209,446,105 144,712,600 0.0 38,581,210 0.0 121,835,811 0.0 3,363,053 0.0 142,694,220 0.0 660,632,999
4,804.8 676,240,295 1,352.8 275,666,619 256.6 65,551,177 812.1 225,916,243 186.4 17,751,837 653.9 200,848,332 8,066.6 1,461,974,504
1,705.8 267,093,863 561.4 69,721,434 58.3 9,545,557 415.0 68,272,209 15.3 2,355,704 91.0 12,164,899 2,846.9 429,153,667
3,070.6 222,417,349 534.4 37,926,294 229.3 21,290,929 384.4 30,262,039 156.1 9,858,300 564.4 39,798,182 4,939.3 361,553,094
0.0 26,520,086 0.0 9,717,715 0.0 609,873 0.0 7,313,343 0.0 904,778 0.0 10,954,281 0.0 56,020,075
138.4 10,284,489 217.7 11,220,022 ‐ 15,000 21.6 1,515,025 0.4 79,300 ‐ ‐ 378.1 23,113,836
4,914.8 526,315,788 1,313.6 128,585,465 287.6 31,461,359 821.0 107,362,616 171.7 13,198,082 655.4 62,917,362 8,164.2 869,840,672
0.0 608,466,761 ‐ 106,865,747 0.0 29,728,870 0.0 50,802,625 0.0 14,316,250 0.0 114,703,979 0.0 924,884,232
0.0 49,731,955 0.0 21,306,107 0.0 9,904,785 0.0 58,159,732 0.0 86,204 ‐ ‐ 0.0 139,188,783
0.0 ‐14,700,415 ‐ ‐ 0.0 ‐2,694,186 ‐ ‐ ‐ ‐ ‐ 266,000 0.0 ‐17,128,601
0.0 ‐501,599,032 ‐ ‐3,398,482 ‐ ‐194,950 ‐ 4,000 0.0 ‐10,995,984 0.0 ‐15,510,486 0.0 ‐531,694,934
‐ 8,239,460 ‐ 14,604,557 ‐ 2,934,660 ‐ 13,070,270 ‐ 270,100 ‐ 19,460,500 ‐ 58,579,547
‐ 30,567 ‐ 1,131,574 ‐ ‐9,044,950 ‐ 697,776 ‐ 1,191,096 ‐ 29,255,209 ‐ 23,261,272
0.0 150,169,296 0.0 140,509,503 0.0 30,634,229 0.0 122,734,403 0.0 4,867,666 0.0 148,175,202 0.0 597,090,300
4,914.8 676,485,084 1,313.6 269,094,968 287.6 62,095,588 821.0 230,097,019 171.7 18,065,748 655.4 211,092,565 8,164.2 1,466,930,972
26

OPERATING USES BY ACTIVITY The schedule of the Academic Division’s projected operating uses by activity on page 28 summarizes total expenditures by program: direct instruction, research, public service, academic support, student services, general administration, O&M of physical plant, scholarships and fellowships, and auxiliary/self-supporting. The following charts show the percentage of the total operating budget dedicated to each major activity:
2014-15 2013-14 Projected
E&G BUDGET E&G is a term used to describe operations that are directly related to the University's educational objectives, including the programs of direct instruction, research, public service, academic support, student services, general administration, and O&M of physical plant. Direct Instruction Instruction includes the teaching faculty, support staff, instructional equipment, and operating costs directly related to instruction, as well as departmental research. The 2014-15 direct instruction budget is $381.6 million, a $21.6 million or 6.0 percent increase over the 2013-14 revised forecast. The increased budget results from additional investments funded from tuition rate increases, incremental enrollments, the phase in of the tuition differential in the School of Engineering and Applied Science, and differential tuition for several graduate programs. The schools all expect to utilize the incremental funds to invest
in faculty and direct instructional support.
The University recommends the use of the Pratt Fund, a gift from John Lee Pratt that is intended “to supplement salaries of the professors of the Departments of Biology, Chemistry, Mathematics and Physics, to purchase equipment for these departments as suggested by the heads of the departments and approved by the President and the Board of Visitors, and to provide for scholarships in these departments for outstanding students." Mr. Pratt’s will provides further that these funds could be used "to support research in the School of Medicine and to provide scholarships for medical students." The will stipulates that the Pratt endowment reverts to Washington and Lee University if the University of Virginia does not comply with the provisions of the will. The original Pratt endowment has been split into two equal endowments, with 50 percent of the original principal assigned to the College of Arts and Sciences and the remaining 50 percent assigned to the School of Medicine.
ACAD
EMIC
DIV
ISIO
N
27

University of Virginia - Academic DivisionProjected Operating Uses - By Activity
1
Tui on and GF
Appropria on
Fte Amount
2
Grants & Contracts,
F&A
Fte Amount
3
Private Unrestricted
Fte Amount
4
Private Restricted
Fte Amount
5
Local Sales, Services,
Other
Fte Amount
6
Auxiliary
Fte Amount Total‐Fte Total‐AmountFY Subtotal for Program Name 1Program SortProgram Name
2014‐R 1 Direct Instruc on
1 Research
1 Public Service
1 Academic Support
1 Student Services
1 General Administra on
1 O&M of Physical Plant
E&G Programs Total
1 Scholarships & Fellowships
Student Financial Aid Total
8 Auxiliary/Self-Suppor ng
Auxiliary Enterprises Total
4 Internal Debt Service
Transfers
Transfers Total
MBU Totals
2015‐O 1 Direct Instruc on
1 Research
1 Public Service
1 Academic Support
1 Student Services
1 General Administra on
1 O&M of Physical Plant
E&G Programs Total
1 Scholarships & Fellowships
Student Financial Aid Total
8 Auxiliary/Self-Suppor ng
Auxiliary Enterprises Total
4 Internal Debt Service
Transfers
Transfers Total
MBU Totals
1,712.9 284,916,945 19.3 3,554,814 22.6 8,904,272 362.4 63,065,521 1.5 1,162,326 - - 2,118.7 361,603,877
84.8 29,645,946 1,174.3 203,159,741 9.0 4,044,468 244.8 40,942,862 33.6 1,296,635 - - 1,546.5 279,089,653
40.1 5,501,032 59.4 10,369,431 0.0 547,625 62.4 9,611,498 32.2 5,002,597 - - 194.2 31,032,183
881.0 106,409,684 56.5 13,335,944 16.5 6,641,305 62.9 16,086,225 83.0 2,955,711 - - 1,099.9 145,428,868
310.4 36,418,972 0.0 3,362 15.3 3,648,600 12.4 2,272,100 6.7 2,351,133 - 7,000 344.8 44,701,167
492.7 51,070,472 36.3 4,599,757 187.2 29,690,524 42.7 6,672,932 26.7 4,238,507 - - 785.6 96,272,192
1,278.7 101,262,571 7.0 2,817,804 6.0 3,638,867 9.5 2,972,755 2.7 338,226 - - 1,303.9 111,030,223
4,800.6 615,225,621 1,352.8 237,840,853 256.6 57,115,661 797.1 141,623,893 186.4 17,345,135 7,000 7,393.5 1,069,158,164
4.3 47,075,415 - 22,107,984 0.0 12,416,831 0.0 57,119,014 0.0 34,953 - - 4.3 138,754,197
4.3 47,075,415 22,107,984 0.0 12,416,831 0.0 57,119,014 0.0 34,953 4.3 138,754,197
- - - - - 26,500 15.0 9,824,139 - - 653.9 153,406,876 668.9 163,257,515
26,500 15.0 9,824,139 653.9 153,406,876 668.9 163,257,515
- 9,121,049 - 14,545,936 - 2,935,035 - 17,279,197 - 34,800 - 18,942,142 - 62,858,159
- 4,818,210 - 1,171,846 - -6,942,850 - 70,000 - 336,949 - 28,492,314 - 27,946,469
13,939,259 15,717,782 ‐4,007,815 17,349,197 371,749 47,434,456 90,804,628
4,804.8 676,240,295 1,352.8 275,666,619 256.6 65,551,177 812.1 225,916,243 186.4 17,751,837 653.9 200,848,332 8,066.6 1,461,974,504
1,840.1 303,036,685 16.9 3,124,082 13.3 9,179,628 341.7 66,151,042 0.5 92,902 - - 2,212.5 381,584,339
115.9 20,866,731 1,130.2 198,249,057 10.1 4,159,123 215.5 40,461,913 9.7 1,237,678 - - 1,481.3 264,974,502
43.3 5,122,122 58.0 9,755,519 0.1 280,573 69.1 10,955,039 16.1 4,197,115 - - 186.4 30,310,368
834.0 104,499,175 62.9 15,460,444 21.7 6,432,222 101.7 20,813,552 102.0 2,708,148 - - 1,122.3 149,913,541
315.2 36,195,033 0.0 3,389 27.0 4,872,359 13.2 2,538,726 6.5 2,143,869 - 7,000 361.8 45,760,376
491.7 47,407,950 38.4 5,028,733 208.3 30,772,162 49.2 7,746,057 34.6 5,819,371 - - 822.2 96,774,273
1,273.5 101,689,322 7.4 431,506 6.0 2,809,026 16.6 4,593,298 2.4 329,265 - - 1,305.9 109,852,417
4,913.6 618,817,018 1,313.6 232,052,730 286.5 58,505,093 807.0 153,259,627 171.7 16,528,348 7,000 7,492.4 1,079,169,816
1.3 49,398,039 0.0 21,306,107 1.1 9,700,785 0.0 58,149,732 0.0 76,204 - - 2.4 138,630,867
1.3 49,398,039 0.0 21,306,107 1.1 9,700,785 0.0 58,149,732 0.0 76,204 2.4 138,630,867
- - - - - - 14.0 4,919,614 - - 655.4 162,369,856 669.4 167,289,470
14.0 4,919,614 655.4 162,369,856 669.4 167,289,470
- 8,239,460 - 14,604,557 - 2,934,660 - 13,070,270 - 270,100 - 19,460,500 - 58,579,547
- 30,567 - 1,131,574 - -9,044,950 - 697,776 - 1,191,096 - 29,255,209 - 23,261,272
8,270,027 15,736,131 ‐6,110,290 13,768,046 1,461,196 48,715,709 81,840,819
4,914.8 676,485,084 1,313.6 269,094,968 287.6 62,095,588 821.0 230,097,019 171.7 18,065,748 655.4 211,092,565 8,164.2 1,466,930,972
28

For 2014-15, $5.1 million is recommended for the School of Medicine to provide direct research support. For the College of Arts and Sciences, $3.58 million will support the departments of Biology, Chemistry, Mathematics, and Physics in compliance with the terms of Mr. Pratt’s will. Research and Public Service The 2014-15 research and public service budget will decrease by $14.8 million or 4.8 percent as compared to the revised 2013-14 budget. This category includes both University and externally-funded research and public service. University-funded research and public service includes support for research faculty, as well as the Center for Public Service, the Center for Advanced Studies, the Center for Politics, the Institute of Nuclear and Particle Physics, the Virginia Center for Diabetes Professional Education, the Virginia Foundation for the Humanities, the Institute of Government, the Women’s Center, the Virginia Film Festival, Blandy Farm, and non-credit course offerings.
The Commonwealth’s expected investment in research of $8.7 million in 2014-15 is included in this program. Of this amount, $1.6 million has been set aside for the University’s highest science and technology priorities, $4.4 million has been allocated for cancer research in the School of Medicine, $1.0 million has been earmarked for an economic development accelerator, and $1.75 million has been allocated for focused ultrasound research. The 2013-14 revised budget includes nearly $6.4 million of unexpended funds carried forward from 2012-13. These represent one-time funds that are not repeated in the original 2014-15 budget. Academic Support The academic support program encompasses the libraries, academic computing, and academic administration. The $149.9 million budget for 2014-15 is an increase of $4.5 million or 3.1 percent, primarily related to $8.8 million of new funding for the library, academic advising, enhanced IT security, and salary and fringe increases related to this activity. Additionally $2.3 million of incremental enrollment growth revenue which will be used to meet support costs of the additional students is held in this activity.
These 2014-15 increases are offset by the elimination of $7.7 million of prior year cash balances included in the projected 2013-14 budget. Student Services The student services program includes those activities whose primary purpose is to contribute to the students' emotional and physical well-being and to their intellectual, cultural, and social development outside of the classroom. The 2014-15 student services budget is $45.7 million, which is an increase of $1.1 million or 2.4 percent from the revised 2013-14 budget. General Administration This category includes executive, financial, administrative, logistical, and fundraising activities. The 2014-15 general administration budget is $96.8 million, which represents an increase of $.5 million or .5 percent primarily related to $7.9 million of new funding which includes short-term funding for the managerial reporting project; university communications and branding strategy; a support structure for organizational excellence projects expected to increase efficiencies, reduce costs, and increase quality; and salary and fringe benefit increases. When adjusted for the one-time carry forward balance included in the 2013-14 projected budget, the 2014-15 budget reflects a 7.7 percent increase.
O&M of Physical Plant The O&M program category includes all expenditures for maintaining and operating facilities, leasing space, and police and security, net of amounts charged to auxiliary enterprises and the Medical Center. The 2014-15 O&M budget of $109.9 million, including items held in reserve, is projected to decrease $1.2 million or 1.1 percent as compared to the 2013-14 revised budget. The decrease is attributable to the inclusion of carry forward balances in the 2013-14 revised budget.
STUDENT FINANCIAL AID The student financial aid budget, $138.6 million in 2014-15, includes graduate and undergraduate student scholarships, fellowships, and other forms of student assistance supported from state
ACAD
EMIC
DIV
ISIO
N
29

general funds, endowment income, gifts, and federal sources. This budget excludes loans, or aid provided directly to students by third parties. Aid funded from tuition is presented as a discount to tuition revenues earlier in this document. Financial aid awards to undergraduate students primarily are based on current federal methodology and packaged according to the principles of AccessUVa. For graduate students, the University is committed to working with schools to improve the flexibility and attractiveness of the University’s graduate support packages in order to become more competitive in attracting top graduate students. Support to graduate students is based upon both employment as a graduate teaching or research assistant and merit. The 2014-15 financial aid budget includes funding from central unrestricted private resources of $2.6 million for an undergraduate merit scholarship program, the University Achievement Awards.
AUXILIARY ENTERPRISES An auxiliary enterprise is an entity that exists to furnish goods or services to students, faculty, or staff and charges a fee to recover the cost of the service. Auxiliary enterprises are expected to be self-supporting, with revenues fully supporting the operating and capital expenditures of the enterprise. Emphasis is placed on providing safe, effective, and efficient enterprises that are compatible with, and facilitate the accomplishment of, the University's primary mission. The Commonwealth requires that auxiliaries be charged an overhead rate to support the general and administrative services provided by E&G operations. In 2014-15, the auxiliaries will be charged an average of 6.2 percent of their operating expenditures. A total of $6.4 million will be recovered by central administration. In return, auxiliaries are credited with interest earned on their cash balances. Disbursements from auxiliaries are expected to total $224.6 million, including amounts to be transferred to reserves for renewal, replacement, and debt service. The University continues to place emphasis on the maintenance of prudent
reserves for the rational and systematic renewal and replacement of equipment and facilities. Detailed budget information, including projected expenditures from reserves, for the major auxiliary enterprise units is included in the following sections. INTERNAL DEBT SERVICE The internal debt service category reflects debt service payments made by schools/units related to borrowings from the University’s internal bank. The 2014-15 budget includes internal debt service payments of $58.6 million, a decrease of 6.8 percent from the 2013-14 budget of $63.2 million. This decrease is primarily attributed to debt satisfied for the Scott Stadium Waterproofing project and the Batten School’s pay down on its debt. STAFFING The Academic Division projects an increase of 97 FTE positions to 8,164 in 2014-15. An increase of 110 FTEs is expected from state and tuition sources primarily directed to faculty searches in Arts and Sciences, Engineering, and the School for Continuing and Professional Studies. With decreasing federal research dollars, a decrease of 39 FTEs, or 2.9 percent is expected in positions funded from grants and contracts. Positions funded from private sources are expected to increase by 27 FTEs or 2.2 percent, largely in support of the managerial reporting initiative, while positions funded from auxiliaries are expected to increase by one position. Of the 8,166 positions budgeted, 48 percent (3,880 positions) are involved directly in the primary programs of instruction, research, and public service.
(rounded to nearest FTE)
State
Grants & Contracts
Private
Auxiliary
Total
2013-14 Revised
4,805
1,353
1,255
654
8,067
2014-15 4,915 1,314 1,280 655 8,164 Change 110 (39) 25 1 97 % Chng 2.3% (2.9%) 2.2% 0.2% 1.2%
ACAD
EMIC
DIV
ISIO
N
30
MAJOR ACADEMIC AND ADMINISTRATIVE BUDGET OVERVIEWS The following pages (through page 120) provide an overview of each school and administrative/service center area. The overview includes a description of the unit’s operations and strategic direction; an explanation of the 2014-15 budget; and a summary of projects currently on the capital plan, as well as any anticipated changes. EXECUTIVE VICE PRESIDENT AND PROVOST Overview of Operations The Executive Vice President and Provost is the chief academic officer of the University of Virginia and is charged with overseeing the education, research, and public service in the schools of the University, in the University’s libraries and museums, and in a number of other academically-related units. In addition to the eleven schools and University Libraries, the Executive Vice President and Provost (EVPP) maintains responsibility for other academic units including Undergraduate Admissions, Center for Liberal Arts, Teaching Resource Center, Center for Politics, Virginia Foundation for the Humanities, the Weldon Cooper Center for Public Service, the University of Virginia Press, the Applied Research Institute, the Data Science Institute, and the Shannon Center for Advanced Studies. The EVPP’s major responsibilities include: Appointing deans and overseeing their evaluations;
Working with deans and directors to maintain
excellence and realize the academic aspirations of the individual schools and of the University as a whole;
Serving as the chief personnel officer for faculty, overseeing faculty hiring and the promotion, tenure, and peer review processes for faculty;
Managing the University’s academic budget, in cooperation with the president and the chief operating officer;
Promoting interdisciplinary and innovative approaches to education and research, as well as fostering diversity of faculty, students, and staff;
Developing and implementing a thoughtful vision
for the future of the University and its relationship to other societal, governmental, and economic institutions, and to society at large;
Overseeing global academic activities, including foreign study, global internships, Universitas 21, international exchange of scholars, and the promotion of international study; and
Overseeing academic planning, building on current strategies for advancing academic programs and efficient resource allocations, and nurturing innovations in all programs.
Strategic Direction The major goals for the EVPP in 2014-15 include: 1. Recruit, retain, and develop academic personnel.
Conduct or oversee searches for senior academic leaders and advise the University president on appointments. Strengthen faculty recruitment and advancement with particular attention to recruiting, promoting, and retaining high-quality faculty from diverse backgrounds who demonstrate potential as outstanding scholars and who share a commitment to the University’s goals.
2. Work with senior leaders to set the University’s
academic priorities and align resources and technologies in service to the University’s strategic plan. Academic program and curriculum review is integral to this work.
3. Advance the University’s core functions of
teaching, research, and service by supporting the work of the deans and fostering collaboration across schools and academic units, especially as related to the arts, international programs, science, and research.
4. Develop and sustain the infrastructure necessary
to support the University's academic mission, including management of data and data systems in service to faculty and students, effective use of academic space, and compliance with the Commonwealth’s higher education coordinating body and the University’s regional accrediting
MAJ
OR
BU
DG
ET U
NIT
OVE
RVI
EWS
31

agency. Through the deans, supervise the work of personnel responsible for preparing (in collaboration with the Executive Vice President and Chief Operating Officer) all academic revenue and expenditure budgets.
The EVPP has oversight of all initiatives emanating from the 2007 strategic planning effort. Three of the six initiatives established are administered by the EVPP, who manages each respective program budget and is responsible for coordinating and advancing these priorities and affiliated core values. The following are overviews of those three initiatives. Jefferson Public Citizens (JPC) and the Student Experience: JPC is a comprehensive academic public service program that integrates students’ service and research experiences throughout their time at the University. The program deepens student learning by integrating academic and public service experiences and seeks to inspire students to act as engaged citizens through community partnerships, research service projects, and scholarly reflection. Institute for Faculty Advancement and Academic Leadership includes the following components: 1. The Leadership in Academic Matters Program,
which prepares faculty to become the next generation of department heads, directors, and other University administrative leaders;
2. The Professors as Writers Program, conducted by the Teaching Resource Center, provides support to faculty in their academic and professional writing;
3. The Institute for Leadership Excellence in
Academic Departments, which targets faculty serving as department chairs or directors of academic centers, provides workshops and other programs to facilitate discussion of common cross-departmental issues, and encourages progress towards a diverse faculty and staff; and
4. The Teaching Technology Support Partners Program, which provides the opportunity for qualified graduate students to work with faculty to foster integration of technology and innovation into their teaching.
Global Affairs: The Office of Global Affairs advances U.Va.’s international research, learning, and outreach to prepare students, the University, and the Commonwealth to thrive in an interconnected
world. Global Affairs anticipates support for several new initiatives in 2014-15 including: 1. Creating a new cross-school Global Studies
major that will enhance international teaching, learning, and research.
2. Supporting the director of the UVA China Office to manage programs, admissions, development, engagement with alumni and friends, and to serve as a potential base for distance learning programs.
3. Identifying and nurturing a small number of programs of outstanding cross-disciplinary or cross-school international research that are areas of excellence for the University.
4. Fostering an international internship program that significantly expands opportunities for experiential learning abroad, particularly by drawing on the support of alumni and parents.
The Center for International Studies will continue to serve as a focal point for University-wide global research and education. Critical to the Center’s mission is the formation of interdisciplinary faculty efforts. The Center supports: research initiatives, working groups, and seminars that address significant international issues; development of new courses with a significant international/global perspective or which develop “global classrooms” involving collaboration with similar courses at universities abroad; visiting international scholars and practitioners whose presence on Grounds will contribute to the promotion of research and learning; and individual faculty and graduate student projects that require supplemental aid because of their international scope. Other strategic initiatives the dovetail with the University’s Cornerstone Plan include: The Applied Research Institute (ARI): The institute’s mission is to create research opportunities for faculty, staff and students; develop and provide education and training programs relevant to its partners; foster pan-University research initiatives; provide U.Va. students unique analytical, research and development opportunities; and facilitate faculty/scientific exchanges with industry and government. The Data Science Institute The Data Science Institute is an institute for large scale, complex data analysis. It is a unique confluence of computation, science, engineering,
MAJ
OR
BU
DG
ET U
NIT
OVE
RVI
EWS
32

mathematics, statistics, commerce, social science, humanities, law, & more. Its mission is to achieve recognized excellence in research and education in the interdisciplinary field of data science through interdisciplinary collaboration. The Master of Science in Data Science (MSDS) is an 11‐month professional masters program, designed to meet the increasingly data‐intensive needs of industry and government. Core program courses will be taught by faculty from the Departments of Computer Science, Statistics, and Systems and Information Engineering. Total Advising A new comprehensive advising system led by the vice provost for educational innovation and interdisciplinary studies. 2014–15 Operating Budget The EVPP is currently funded through a centralized budget target, as well as self-generated private resources, grants and contracts, and sales and services activities for the University Press. As shown on the pie chart below, excluding the schools and the library, for 2014–15, 65 percent of the EVPP’s operating budget is from tuition and state general funds. Private funds (endowment distributions and gifts) represent 16 percent of funding. Grants, contracts, and F&A constitute 15 percent, while sales and services make-up 4 percent.
Excluding the schools and the library, the EVPP’s 2014-15 operating budget (see the following page) is $60.5 million, primarily allocated to faculty and staff compensation (56 percent) and academic support activities. The EVPP’s 2014-15 operating budget includes an allocation of $24,334 related to fall 2014 enrollment growth for USEMs. Funding will be allocated to the target budgets for compensation adjustments as authorized by the state or the Board of Visitors. Including the schools and the library, the operating budget for all areas reporting to the EVPP will be $912 million in 2014–15.
Capital Plan Projects included in the Major Capital Projects Plan under the EVPP area which are not directly related to the schools or the library include: 1) the Fralin Art Museum Addition ($28 million), for which a concept design and fundraising package is being prepared, and 2) the Contemplative Sciences Center (currently authorized at $13.68 million).
MAJ
OR
BU
DG
ET U
NIT
OVE
RVI
EWS
33

University of Virginia - MBU SummaryExec Level: R1380 VP: PV-VP/Provost, Mbu Level: <All>
Excluding Schools & Library
1
Tui on and GF
Appropria on
FTE Amount
2
Grants & Contracts,
F&A
FTE Amount
3
Private Unrestricted
FTE Amount
4
Private Restricted
FTE Amount
5
Local Sales, Services,
Other
FTE Amount
6
Auxiliary
FTE Amount Total ‐ FTE Total ‐ Amount
FY CTCS Category
2014‐R Faculty Salaries and benefitsStaff Salaries and benefitsWages and benefitsGTA/GRA
Subtotal
OTPS
Financial Aid
Central Assessment
Recoveries
Internal Debt Service
Transfers
Subtotal
MBU Totals
2015‐O Faculty Salaries and benefitsStaff Salaries and benefitsWages and benefitsGTA/GRA
Subtotal
OTPS
Financial Aid
Central Assessment
Recoveries
Internal Debt Service
Transfers
Subtotal
MBU Totals
96.3 10,120,829 12.2 1,215,256 11.9 1,377,865 10.8 1,135,740 5.8 478,000 0.4 38,953 137.2 14,366,643
144.8 9,241,565 21.9 1,296,893 7.8 562,808 21.8 1,520,356 6.3 363,846 10.6 594,271 213.1 13,579,739
‐ 3,244,090 ‐ 767,596 ‐ 41,500 ‐ 462,579 ‐ 61,000 ‐ 11,677 ‐ 4,588,442
10.3 635,850 ‐ ‐ ‐ 15,000 ‐ 247 ‐ ‐ ‐ ‐ 10.3 651,097
251.4 23,242,334 34.1 3,279,745 19.6 1,997,173 32.6 3,118,922 12.0 902,846 11.0 644,901 360.6 33,185,921
‐ 20,850,505 ‐ 1,810,354 ‐ 5,991,170 ‐ 2,236,161 ‐ 673,956 ‐ 962,017 ‐ 32,524,163
‐ 12,000 ‐ 25,785 ‐ 373,132 ‐ 477,471 ‐ 15,000 ‐ ‐ ‐ 903,388
‐ 197,590 ‐ ‐ ‐ ‐ ‐ ‐ ‐ ‐ ‐ ‐ ‐ 197,590
‐ ‐ ‐ 550,000 ‐ ‐ ‐ ‐ ‐ ‐507,000 ‐ ‐ ‐ 43,000
‐ ‐ ‐ 4,333,227 ‐ ‐ ‐ ‐ ‐ ‐ ‐ ‐ ‐ 4,333,227
‐ ‐72,334 ‐ ‐ ‐ ‐ ‐ ‐ ‐ ‐ ‐ ‐ ‐ ‐72,334
20,987,761 6,719,366 6,364,302 2,713,632 181,956 962,017 37,929,034
251.4 44,230,096 34.1 9,999,111 19.6 8,361,475 32.6 5,832,554 12.0 1,084,802 11.0 1,606,918 360.6 71,114,956
86.5 9,166,760 10.0 1,192,332 10.9 1,379,129 10.3 1,083,725 ‐ ‐ 0.4 41,263 118.0 12,863,210
153.3 10,204,963 20.5 1,380,519 10.3 699,819 25.3 1,996,470 1.0 73,935 10.6 657,763 221.0 15,013,469
0.0 4,885,385 ‐ 544,296 ‐ 5,000 ‐ 472,149 ‐ 8,000 0.0 11,355 0.0 5,926,185
‐ ‐ ‐ 10,000 ‐ 15,000 ‐ ‐ ‐ ‐ ‐ ‐ ‐ 25,000
239.8 24,257,109 30.5 3,127,147 21.2 2,098,948 35.6 3,552,344 1.0 81,935 11.0 710,381 339.0 33,827,864
0.0 14,659,255 ‐ 1,479,116 0.0 1,526,378 ‐ 2,454,705 ‐ 336,665 0.0 1,111,818 0.0 21,567,937
‐ ‐ ‐ 25,785 0.0 224,000 0.0 326,410 ‐ 10,000 ‐ ‐ 0.0 586,195
0.0 216,478 ‐ ‐ ‐ ‐ ‐ ‐ ‐ ‐ ‐ ‐ 0.0 216,478
‐ ‐ ‐ ‐ ‐ 33,000 ‐ ‐ ‐ ‐7,000 ‐ ‐ ‐ 26,000
‐ ‐ ‐ 4,338,558 ‐ ‐ ‐ ‐ ‐ ‐ ‐ ‐ ‐ 4,338,558
‐ ‐64,680 ‐ ‐ ‐ ‐ ‐ ‐ ‐ ‐ ‐ ‐ ‐ ‐64,680
0.0 14,811,053 5,843,459 0.0 1,783,378 0.0 2,781,115 339,665 0.0 1,111,818 0.0 26,670,488
239.8 39,068,161 30.5 8,970,606 21.2 3,882,326 35.6 6,333,459 1.0 421,600 11.0 1,822,199 339.0 60,498,351
34

COLLEGE AND GRADUATE SCHOOL OF ARTS &
SCIENCES Overview of Operations The College and Graduate School of Arts & Sciences is the largest of the University of Virginia’s eleven schools and is the institution’s intellectual core. Offering more than 50 undergraduate majors and concentrations and more than two dozen graduate programs, Arts & Sciences spans the liberal arts, stretching from the study of the birth of the universe to the latest scientific and technological advances and encompassing the literatures and languages, history and arts, economics, and politics of the world's cultures. The College and Graduate School comprise more than 11,600 students taught by approximately 700 full-time regular faculty members.
Strategic Direction The College enters a decisive moment in its history in a strong position, poised to grow in new directions with greater vitality. The years ahead will witness the confluence of several critical issues that will affect the strength and stature of the College, and by extension the University. Replacing retiring faculty and expanding the overall size of the faculty to enhance the undergraduate experience and seize intellectual opportunities will lead the College to hire as many as 230 new faculty members by 2020. This will mean a new College, new scholarship, and new ways of teaching. The choices and judgments made now will define the College for decades. Planning in the College envisions a contemporary form of Jefferson’s Academical Village as the College’s defining advantage—one that stresses high levels of student-faculty interaction, collaboration of scholars, and opportunities for engaged learning. The College seeks to heighten the stature of its departments and programs with regard to research and graduate education while maintaining its long-standing reputation for excellence in undergraduate education and exceptional teaching. The plan rests
on four areas of emphasis fundamental to the College’s success and aspirations: First, the College will reimagine, reinvigorate,
and extend the undergraduate experience, taking advantage of our distinctive scale and residential environment to prepare students to lead, contribute, and compose meaningful lives.
Second, acknowledging the constraints of its relatively small scale for a major research university, the College will emphasize connections across disciplines and target investments toward areas of research that are both critical for the future and aligned with traditional or emerging strengths.
Third, the College will seize the opportunities afforded by the large volume of faculty hiring during this period to remap its intellectual terrain. This also requires addressing the eroding competitiveness of faculty salaries and securing funding for start-up support for new hires, particularly in the sciences.
Finally, the College’s aspirations are limited by infrastructure constraints, requiring that we address several facilities and administrative needs to ensure the beauty and functionality of the College physical spaces.
The College’s initiatives and directions are ambitious yet very much within grasp. The College’s planning priorities are supported by a detailed financial plan, integrated into the College’s fundraising priorities and aligned with the capital plan. Success will require substantial investment of new resources during a period of continuing budgetary uncertainty. The College will continue to update its long-term financial planning model to incorporate priority initiatives into the annual operating budget. Projections estimate the aggregated cost of implementing the College’s planning priorities during the current three-year cycle ending June 2016 to be approximately $35 million in base budget plus $21 million of non-base investments, excluding capital projects. The base budget increase represents growth of approximately 20% relative to the current operating budget (excluding sponsored programs). The projected base budget growth through 2015-16 does not capture other pressures on the College’s operating budget beyond specific planning initiatives during this period, such as for benefits rate changes, staff salary increases, inflationary adjustments, etc.
MAJ
OR
BU
DG
ET U
NIT
OVE
RVI
EWS
35
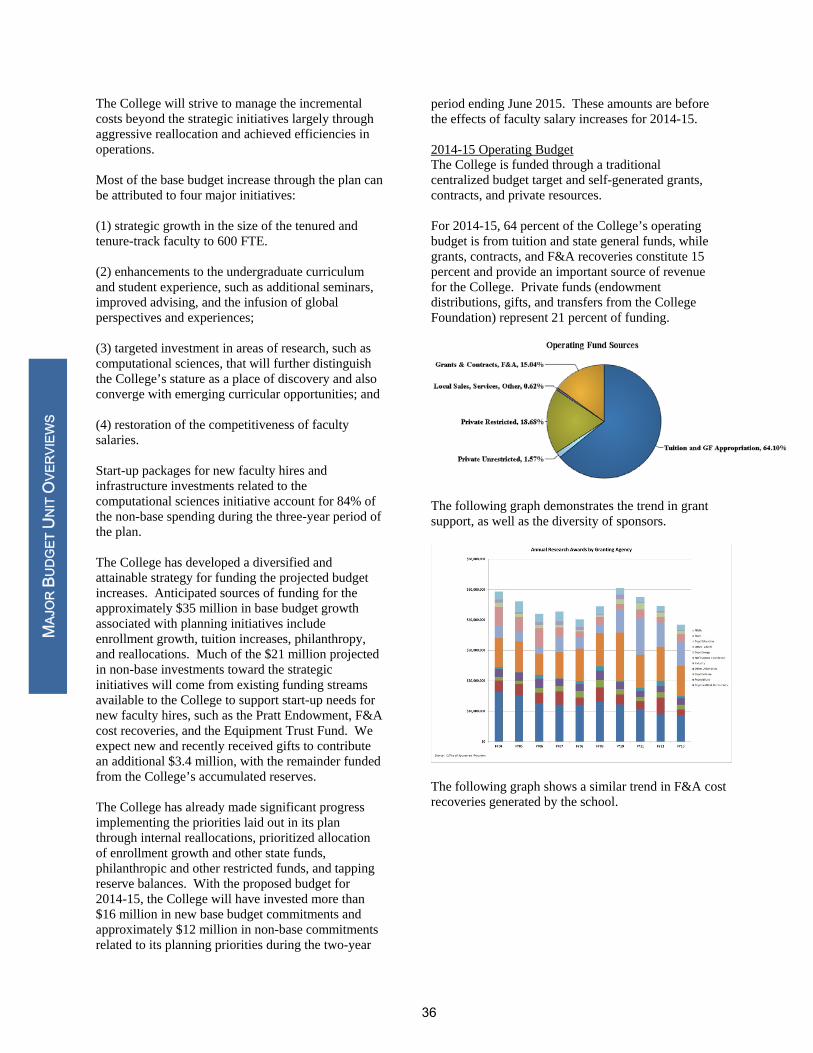
The College will strive to manage the incremental costs beyond the strategic initiatives largely through aggressive reallocation and achieved efficiencies in operations. Most of the base budget increase through the plan can be attributed to four major initiatives: (1) strategic growth in the size of the tenured and tenure-track faculty to 600 FTE. (2) enhancements to the undergraduate curriculum and student experience, such as additional seminars, improved advising, and the infusion of global perspectives and experiences; (3) targeted investment in areas of research, such as computational sciences, that will further distinguish the College’s stature as a place of discovery and also converge with emerging curricular opportunities; and (4) restoration of the competitiveness of faculty salaries. Start-up packages for new faculty hires and infrastructure investments related to the computational sciences initiative account for 84% of the non-base spending during the three-year period of the plan. The College has developed a diversified and attainable strategy for funding the projected budget increases. Anticipated sources of funding for the approximately $35 million in base budget growth associated with planning initiatives include enrollment growth, tuition increases, philanthropy, and reallocations. Much of the $21 million projected in non-base investments toward the strategic initiatives will come from existing funding streams available to the College to support start-up needs for new faculty hires, such as the Pratt Endowment, F&A cost recoveries, and the Equipment Trust Fund. We expect new and recently received gifts to contribute an additional $3.4 million, with the remainder funded from the College’s accumulated reserves. The College has already made significant progress implementing the priorities laid out in its plan through internal reallocations, prioritized allocation of enrollment growth and other state funds, philanthropic and other restricted funds, and tapping reserve balances. With the proposed budget for 2014-15, the College will have invested more than $16 million in new base budget commitments and approximately $12 million in non-base commitments related to its planning priorities during the two-year
period ending June 2015. These amounts are before the effects of faculty salary increases for 2014-15. 2014-15 Operating Budget The College is funded through a traditional centralized budget target and self-generated grants, contracts, and private resources. For 2014-15, 64 percent of the College’s operating budget is from tuition and state general funds, while grants, contracts, and F&A recoveries constitute 15 percent and provide an important source of revenue for the College. Private funds (endowment distributions, gifts, and transfers from the College Foundation) represent 21 percent of funding.
The following graph demonstrates the trend in grant support, as well as the diversity of sponsors.
The following graph shows a similar trend in F&A cost recoveries generated by the school.
MAJ
OR
BU
DG
ET U
NIT
OVE
RVI
EWS
36

The College’s 2014-15 operating budget (see page 39) is $203.9 million, with compensation and graduate fellowships accounting for 83 percent of the budget, including faculty compensation (49 percent), GTA/GRA stipends and graduate fellowship support (21 percent), and staff compensation (12 percent). The College’s budget is allocated almost entirely toward academic core activities (teaching, research, and service), with very little toward administrative services. The majority of administrative services are incurred in the central University budgets. The College’s 2014-15 operating budget includes an allocation of $2.5 million related to fall 2014 enrollment growth. Funding will be allocated to the target budgets for compensation adjustments as authorized by the state or the Board of Visitors. In anticipation of the new University financial model, the College has set aside a contingency reserve to ensure future financial stability. In anticipation of the selection of a new dean, the College has also set aside undesignated reserves related to future initiatives as of 2014-15. Current reserves also include $3.4 million designated for the College’s planning priorities during 2014-15 and 2015-16 as well as a modest gift-funded pool to support minor capital renovations. The College’s various reserves are reflected in the 2013-14 revised budget, but are not yet included in the 2014-15 original budget since they represent one-time funds and are not part of the permanent base budget. This explains the substantial decrease in OTPS budget from one year to the next. Recruiting and retaining faculty will be a continued emphasis, requiring additional investments in compensation and start-up packages. The following graph demonstrates the average College faculty salary compared to the 60th and 75th percentile of AAU peers.
The following chart provides the student:faculty ratio over the past several years.
Capital Plan Construction is ongoing for the New Cabell Hall Renovation, to be completed in two phases by September 2014. Currently, the highest priority project not in construction is the renovation of Gilmer Hall and the Chemistry Building, the College’s longstanding workhorse buildings in the sciences. The renovations are on the Major Capital Projects Plan at an estimated $134 million, proposed to be funded in full from state general funds. The 2013 General Assembly provided $1.8 million for pre-planning (programming and concept design phase) of this critical project. Other projects on the long-term capital program include the construction of a new music building ($59.5 million); construction of a drama building addition ($25.5 million); renewal of Old Cabell Hall ($65 million), expansion of the Anheuser-Busch Coastal Research Center ($6 million); and a Science and Engineering Teaching and Research Facility shared with the School of Engineering and Applied Science ($147.3 million). The College also anticipates significant renovation needed for the
MAJ
OR
BU
DG
ET U
NIT
OVE
RVI
EWS
37

Physics Building over the next five years. The recently completed STEM Facilities Study completed initial work towards recommending strategies for much needed renovations. As part of the first phase of the Gilmer Hall and Chemistry Building renovation project, kicking off this spring 2014, the College will identify program and renovation needs for Gilmer, Chemistry, and also the Physics Building.
MAJ
OR
BU
DG
ET U
NIT
OVE
RVI
EWS
38

University of Virginia - MBU SummaryExec Level: R1380 VP: PV-VP/Provost, Mbu Level: R2010 MBU: AS-College of Arts & Sciences
1
Tui on and GFAppropria on
FTE Amount
2
Grants & Contracts,F&A
FTE Amount
3
Private Unrestricted
FTE Amount
4
Private Restricted
FTE Amount
5
Local Sales, Services,Other
FTE Amount
6
Auxiliary
FTE Amount Total ‐ FTE Total ‐ Amount
FY CTCS Category
2014‐R Faculty Salaries and benefitsStaff Salaries and benefitsWages and benefitsGTA/GRA
Subtotal
OTPS
Financial Aid
Recoveries
Internal Debt Service
Transfers
Subtotal
MBU Totals
2015‐O Faculty Salaries and benefitsStaff Salaries and benefitsWages and benefitsGTA/GRA
Subtotal
OTPS
Financial Aid
Recoveries
Internal Debt Service
Transfers
Subtotal
MBU Totals
556.3 69,336,507 95.2 9,301,995 13.8 2,206,337 101.3 12,744,699 0.2 13,000 ‐ ‐ 766.8 93,602,538
181.3 11,705,300 38.7 2,043,779 ‐ ‐ 44.5 2,643,720 4.8 413,740 ‐ ‐ 269.3 16,806,539
‐ 3,950,607 ‐ 2,568,017 ‐ 18,671 ‐ 1,116,869 ‐ 81,777 ‐ ‐ ‐ 7,735,941
114.4 8,514,187 37.4 2,779,834 ‐ ‐ 1.9 138,841 0.1 9,000 ‐ ‐ 153.8 11,441,862
852.1 93,506,601 171.2 16,693,625 13.8 2,225,008 147.6 16,644,129 5.1 517,517 1,189.9 129,586,880
‐ 23,173,762 ‐ 13,137,737 0.0 1,204,078 ‐ 6,942,284 ‐ 1,503,804 ‐ ‐ 0.0 45,961,666
0.0 19,673,227 ‐ 2,989,614 0.0 1,659,250 0.0 8,508,216 0.0 19,100 ‐ ‐ 0.0 32,849,407
‐ ‐221,854 ‐ ‐ ‐ ‐ ‐ ‐ ‐ ‐770,364 ‐ ‐ ‐ ‐992,218
‐ ‐ ‐ ‐ ‐ ‐ ‐ 19,000 ‐ ‐ ‐ ‐ ‐ 19,000
‐ ‐93,617 ‐ ‐ ‐ ‐ ‐ ‐ ‐ ‐ ‐ ‐ ‐ ‐93,617
0.0 42,531,518 16,127,351 0.0 2,863,328 0.0 15,469,500 0.0 752,540 0.0 77,744,238
852.1 136,038,119 171.2 32,820,976 13.8 5,088,336 147.6 32,113,629 5.1 1,270,057 1,189.9 207,331,118
607.1 76,124,896 85.3 8,742,732 7.0 1,088,804 111.9 14,722,394 0.2 14,700 ‐ ‐ 811.5 100,693,526
193.4 12,748,146 26.8 1,496,663 ‐ ‐ 51.6 3,237,462 4.3 393,203 ‐ ‐ 276.1 17,875,474
0.0 2,494,079 ‐ 3,023,563 ‐ 9,501 ‐ 820,584 ‐ 125,202 ‐ ‐ 0.0 6,472,929
98.1 7,382,220 28.3 2,108,361 ‐ ‐ 3.8 282,418 0.1 9,300 ‐ ‐ 130.3 9,782,299
898.5 98,749,340 140.5 15,371,319 7.0 1,098,305 167.3 19,062,858 4.7 542,405 1,217.9 134,824,227
‐ 10,847,790 ‐ 13,153,987 0.0 1,118,115 ‐ 10,808,883 ‐ 1,555,414 ‐ ‐ 0.0 37,484,189
‐ 21,326,845 ‐ 2,144,325 ‐ 980,285 ‐ 7,805,384 ‐ ‐ ‐ ‐ ‐ 32,256,839
‐ ‐236,956 ‐ ‐ ‐ ‐ ‐ 4,000 ‐ ‐840,300 ‐ ‐ ‐ ‐1,073,256
‐ ‐ ‐ ‐ ‐ ‐ ‐ 406,333 ‐ ‐ ‐ ‐ ‐ 406,333
‐ 18,988 ‐ ‐ ‐ ‐ ‐ ‐ ‐ ‐ ‐ ‐ ‐ 18,988
31,956,667 15,298,312 0.0 2,098,400 19,024,600 715,114 0.0 69,093,093
898.5 130,706,007 140.5 30,669,631 7.0 3,196,705 167.3 38,087,458 4.7 1,257,519 1,217.9 203,917,321
39

CURRY SCHOOL OF EDUCATION Overview of Operations For the Curry School of Education, the past two years have been a time of transition, innovation, and investment that positions the School well for the coming years. Since 2012, Curry has, among many other things: Begun renovation of Ruffner Hall, scheduled for
completion in the summer of 2014;
Strengthened interdisciplinary partnerships with the Darden School, the Batten School, the School of Medicine, the College of Arts & Sciences, the School of Continuing and Professional Studies and others;
Taken full ownership of its courses and programs offered online and outside of Charlottesville;
Successfully launched its first massive open
online course (MOOC) through Coursera;
Converted one of its two undergraduate programs to a four-year, direct-admit program;
Obtained approval for a new undergraduate major, which will enroll its first students in the fall of 2014;
Grown its undergraduate courses and programs
in order to have more balanced enrollments across all degree levels;
Increased the number of online and hybrid
course and program offerings; and Established a new department of Kinesiology,
which enables faculty to engage more fluidly in the kind of cross-unit, interdisciplinary research that further advances the aims of the School and University.
Curry has benefitted from these changes, moving from 23rd to 22nd in national rankings and increasing the number of ranked graduate specialties – from seven to eight – and the number of ranked specialties in the top ten in the nation – from three to five, recruiting and hiring top faculty candidates, and helping to drive the recognition of the University as one of the top three institutions in the nation that influence education policy.
Strategic Direction Curry has four strategic foci: enrollment, research, sustaining program quality, and stewardship of resources. As evidenced below, the School’s strategic direction is in line with the University’s newly-approved Cornerstone Plan. In developing and refining its strategic direction, Curry has paid close attention to the needs of the University and to the Commonwealth as it strives to meet its obligations under the Higher Education Restructuring Act as outlined in SCHEV’s institutional performance standards and the goals of the 2011 Higher Education Opportunity Act. Enrollment Curry began the 2012-13 academic year with its first class of directly admitted first-year undergraduate students, its first fully-online graduate programs, its first dual-degree program with another professional school (Darden), and its full ownership of Curry courses and degree and certificate programs at off-Grounds sites. Curry will begin the 2014-15 academic year with a new, interdisciplinary undergraduate major, increasing its total to three undergraduate programs. Enrollment trends through 2013-14 are shown below.
Curry’s students now span the full range of student experiences from first-year undergraduates to Ph.D. candidates and from full-time students in residence in Charlottesville to adult professional learners throughout the Commonwealth and, increasingly, the world. The goals for Curry for the next five years are: Focus on growth of targeted master’s degree
level programs, as enrollment in its undergraduate programs is currently at the capacity allowed by the University;
MAJ
OR
BU
DG
ET U
NIT
OVE
RVI
EWS
40
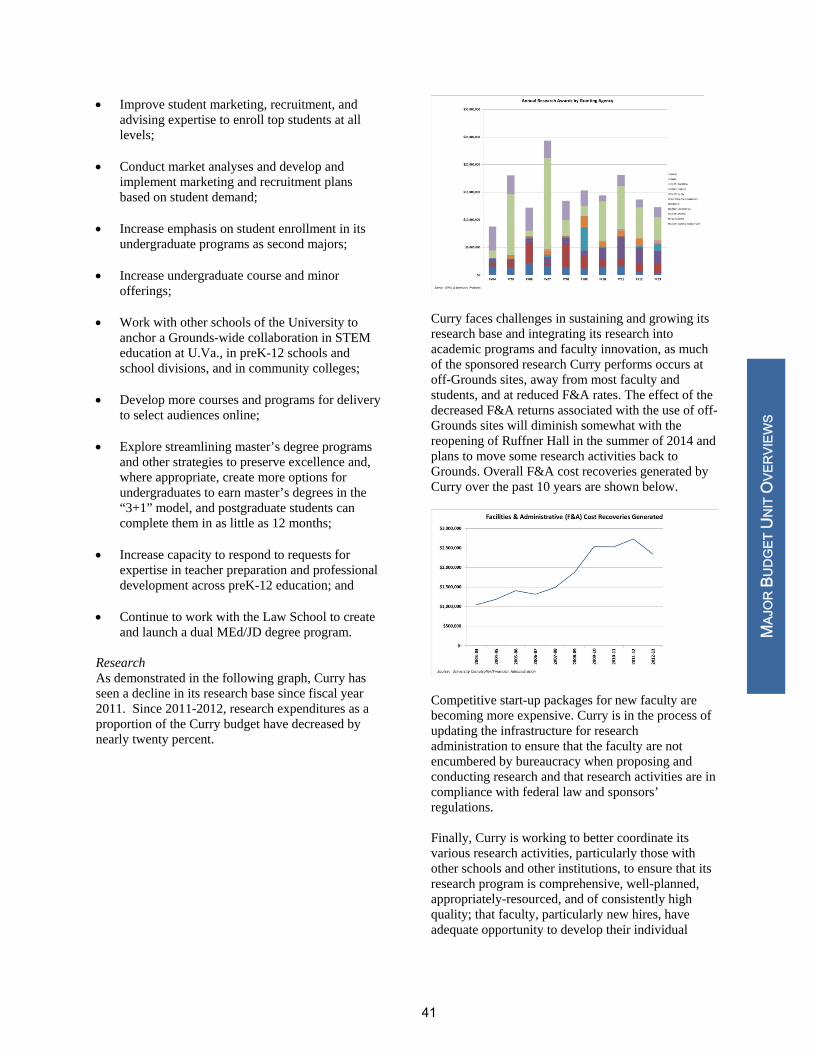
Improve student marketing, recruitment, and advising expertise to enroll top students at all levels;
Conduct market analyses and develop and implement marketing and recruitment plans based on student demand;
Increase emphasis on student enrollment in its undergraduate programs as second majors;
Increase undergraduate course and minor offerings;
Work with other schools of the University to anchor a Grounds-wide collaboration in STEM education at U.Va., in preK-12 schools and school divisions, and in community colleges;
Develop more courses and programs for delivery
to select audiences online; Explore streamlining master’s degree programs
and other strategies to preserve excellence and, where appropriate, create more options for undergraduates to earn master’s degrees in the “3+1” model, and postgraduate students can complete them in as little as 12 months;
Increase capacity to respond to requests for expertise in teacher preparation and professional development across preK-12 education; and
Continue to work with the Law School to create
and launch a dual MEd/JD degree program. Research As demonstrated in the following graph, Curry has seen a decline in its research base since fiscal year 2011. Since 2011-2012, research expenditures as a proportion of the Curry budget have decreased by nearly twenty percent.
Curry faces challenges in sustaining and growing its research base and integrating its research into academic programs and faculty innovation, as much of the sponsored research Curry performs occurs at off-Grounds sites, away from most faculty and students, and at reduced F&A rates. The effect of the decreased F&A returns associated with the use of off-Grounds sites will diminish somewhat with the reopening of Ruffner Hall in the summer of 2014 and plans to move some research activities back to Grounds. Overall F&A cost recoveries generated by Curry over the past 10 years are shown below.
Competitive start-up packages for new faculty are becoming more expensive. Curry is in the process of updating the infrastructure for research administration to ensure that the faculty are not encumbered by bureaucracy when proposing and conducting research and that research activities are in compliance with federal law and sponsors’ regulations. Finally, Curry is working to better coordinate its various research activities, particularly those with other schools and other institutions, to ensure that its research program is comprehensive, well-planned, appropriately-resourced, and of consistently high quality; that faculty, particularly new hires, have adequate opportunity to develop their individual
MAJ
OR
BU
DG
ET U
NIT
OVE
RVI
EWS
41

portfolios; and that all of the School’s research is represented in Curry’s various doctoral programs. The research goals for Curry for the next five years are: Consolidate and add to existing research
administrators to better coordinate Curry’s various research activities under the lead of Curry’s Associate Dean for Research and Faculty Development;
In collaboration with the University Library and other schools, continue to develop an initiative to establish U.Va. as a model of providing advanced data services and mentoring related to research in the social sciences;
Collaborate to identify additional space for research activities to take place on-Grounds, in closer proximity to faculty and students, and to develop a multi-year research space plan;
Refine a multi-year plan for the use of indirect
cost recoveries to fund school- and department-level research administration and infrastructure and to create investment and incentive funds; and
Identify funding for research centers to become self-sustaining.
Sustain High-Quality Programs Curry recognizes the relationship between academic program quality and the long-term financial health of the School. The School strives to improve its overall academic reputation of its diverse specialties through sustained attention to the quality of its programs and services for students. In order to progress toward these goals, Curry plans to implement the following key initiatives over the next five years: Conduct comprehensive academic program
reviews, resulting in multi-year plans for enrollment, curricula, research, and faculty development;
Perform reviews of administrative offices, resulting in more efficient and higher quality service for faculty, staff, and students;
Ensure the School has adequate faculty expertise and administrative infrastructure to support high-quality programs, both on- and off-Grounds;
Develop functions and processes that ensure course sizes and schedules, as well as faculty workloads, are high quality, efficient, and interdisciplinary;
Continue to update Curry’s largest and most highly-regarded program, Teacher Education, to be more evidence-based, innovative, and competitive for top students;
Coordinate enrollment growth to ensure that the
experiences of students are not compromised and that growth can be supported and sustained; and
Revise expectations regarding doctoral students to include an increased role in instruction to support enrollment growth and provide doctoral students valuable teaching experiences.
Resources Curry’s all-funds budget has grown from $33 million to $40 million from 2010-11 to 2013-14 despite years of general fund budget reductions and declining research support. The School continues to work toward generating additional revenue to support its strategic vision. Curry has great potential to expand enrollment-related revenues both in on-Grounds undergraduate courses and graduate, non-doctoral degree programs and in off-Grounds and online degree and certificate programs; to grow research and clinical revenues and revenues from existing and new sales and services activities such as summer camps, professional conferences, and professional development workshops; and to create entirely new revenue streams from faculty innovations that are brought to market. Curry must balance these opportunities with a realistic analysis of sustainability, opportunity cost, and fidelity to mission, along with the need to be accountable to the University for the full cost of its operations. While much of what Curry plans to do with regard to resources is woven throughout the initiatives already listed above, Curry will also: Continue to develop and refine administrative
infrastructure and expertise for working in an activity-based environment to best optimize Curry’s potential to meet its mission and to be a responsible and significant part of fulfilling the University’s mission and strategic direction;
MAJ
OR
BU
DG
ET U
NIT
OVE
RVI
EWS
42

Continue to develop and refine a comprehensive system of multi-year planning to effectively manage and coordinate existing and new revenue streams and cost structures with the goal of achieving financial sustainability, increasing quality, and attaining appropriate levels of reserves;
Continue phasing in plans to move all units to a
“full-cost” model of operations through rate adjustments, a three-year phase-in of G&A recoveries, and a five-year phase in of project reserves;
Work with central administrators and other
schools to ensure that Curry has, and will continue to have, enough space to meet teaching and service missions along with its research mission; and
Serve as a model for the rest of the University of
a data-driven approach to resource planning that is integrated into academic planning efforts.
2014-15 Operating Budget For 2014-15, 51 percent of Curry’s operating budget is from tuition and state general funds. Grants, contracts, and F&A constitute 36 percent. Private funds (endowment distribution, gifts, and transfers from the Curry Foundation) represent 7 percent of funding.
The School’s 2014-15 operating budget is $40.4 million. The primary spending initiatives are faculty compensation (42 percent), staff salaries and wages (23 percent), and GTA/ GRA stipends and graduate fellowship support (13 percent). Curry’s 2014-15 operating budget includes an allocation of $372,804 related to fall 2014 enrollment growth. Funding will be allocated to the target budgets for compensation adjustments as authorized by the state or the Board of Visitors.
The following graph demonstrates the average Curry faculty salary as compared to the 60th and 75th percentile of AAU peers.
Capital Plan Curry’s only project on the Major Capital Projects Plan is the $23.7 million renovation of Ruffner Hall, which is financed by the state and which began construction in January 2013. Completion is expected in the summer of 2014 with the building available for full use before fall semester 2014. Curry continues to engage central administrators in a conversation about building on-Grounds, general-purpose research space that can be shared by “dry-lab” researchers throughout the University. . .
MAJ
OR
BU
DG
ET U
NIT
OVE
RVI
EWS
43
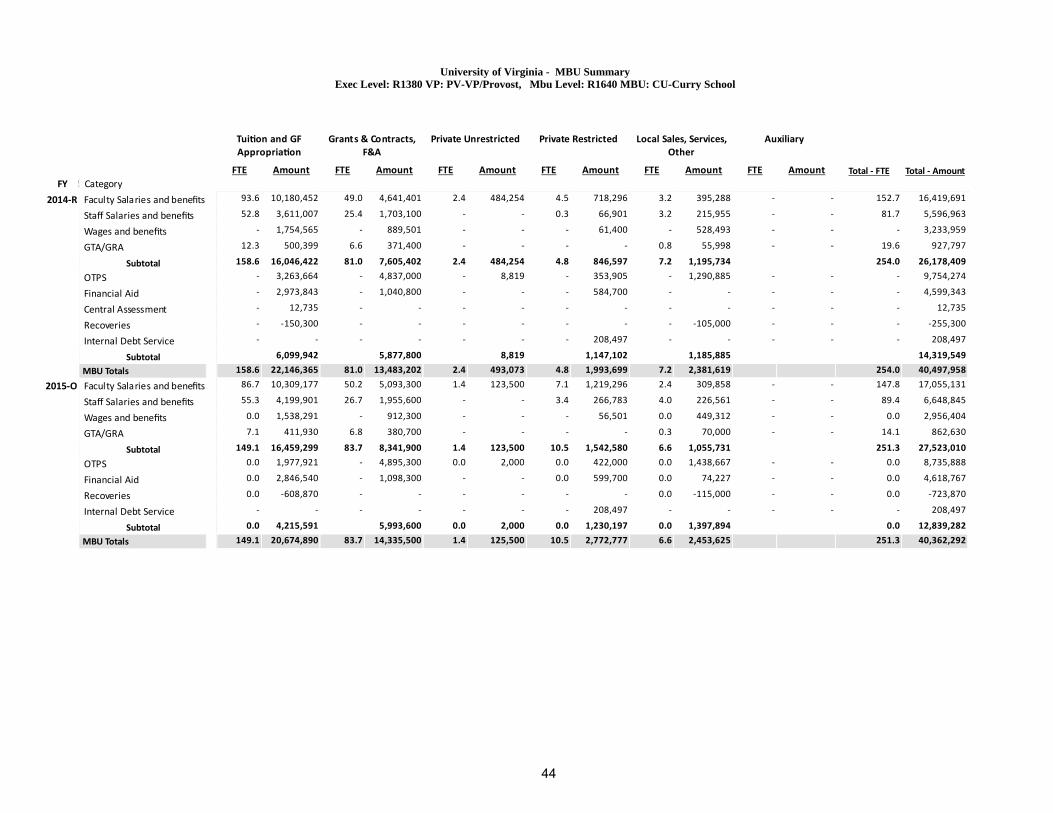
University of Virginia - MBU SummaryExec Level: R1380 VP: PV-VP/Provost, Mbu Level: R1640 MBU: CU-Curry School
1
Tui on and GFAppropria on
FTE Amount
2
Grants & Contracts,F&A
FTE Amount
3
Private Unrestricted
FTE Amount
4
Private Restricted
FTE Amount
5
Local Sales, Services,Other
FTE Amount
6
Auxiliary
FTE Amount Total ‐ FTE Total ‐ Amount
FY CTCS Category
2014‐R Faculty Salaries and benefitsStaff Salaries and benefitsWages and benefitsGTA/GRA
Subtotal
OTPS
Financial Aid
Central Assessment
Recoveries
Internal Debt Service
Subtotal
MBU Totals
2015‐O Faculty Salaries and benefitsStaff Salaries and benefitsWages and benefitsGTA/GRA
Subtotal
OTPS
Financial Aid
Recoveries
Internal Debt Service
Subtotal
MBU Totals
93.6 10,180,452 49.0 4,641,401 2.4 484,254 4.5 718,296 3.2 395,288 ‐ ‐ 152.7 16,419,691
52.8 3,611,007 25.4 1,703,100 ‐ ‐ 0.3 66,901 3.2 215,955 ‐ ‐ 81.7 5,596,963
‐ 1,754,565 ‐ 889,501 ‐ ‐ ‐ 61,400 ‐ 528,493 ‐ ‐ ‐ 3,233,959
12.3 500,399 6.6 371,400 ‐ ‐ ‐ ‐ 0.8 55,998 ‐ ‐ 19.6 927,797
158.6 16,046,422 81.0 7,605,402 2.4 484,254 4.8 846,597 7.2 1,195,734 254.0 26,178,409
‐ 3,263,664 ‐ 4,837,000 ‐ 8,819 ‐ 353,905 ‐ 1,290,885 ‐ ‐ ‐ 9,754,274
‐ 2,973,843 ‐ 1,040,800 ‐ ‐ ‐ 584,700 ‐ ‐ ‐ ‐ ‐ 4,599,343
‐ 12,735 ‐ ‐ ‐ ‐ ‐ ‐ ‐ ‐ ‐ ‐ ‐ 12,735
‐ ‐150,300 ‐ ‐ ‐ ‐ ‐ ‐ ‐ ‐105,000 ‐ ‐ ‐ ‐255,300
‐ ‐ ‐ ‐ ‐ ‐ ‐ 208,497 ‐ ‐ ‐ ‐ ‐ 208,497
6,099,942 5,877,800 8,819 1,147,102 1,185,885 14,319,549
158.6 22,146,365 81.0 13,483,202 2.4 493,073 4.8 1,993,699 7.2 2,381,619 254.0 40,497,958
86.7 10,309,177 50.2 5,093,300 1.4 123,500 7.1 1,219,296 2.4 309,858 ‐ ‐ 147.8 17,055,131
55.3 4,199,901 26.7 1,955,600 ‐ ‐ 3.4 266,783 4.0 226,561 ‐ ‐ 89.4 6,648,845
0.0 1,538,291 ‐ 912,300 ‐ ‐ ‐ 56,501 0.0 449,312 ‐ ‐ 0.0 2,956,404
7.1 411,930 6.8 380,700 ‐ ‐ ‐ ‐ 0.3 70,000 ‐ ‐ 14.1 862,630
149.1 16,459,299 83.7 8,341,900 1.4 123,500 10.5 1,542,580 6.6 1,055,731 251.3 27,523,010
0.0 1,977,921 ‐ 4,895,300 0.0 2,000 0.0 422,000 0.0 1,438,667 ‐ ‐ 0.0 8,735,888
0.0 2,846,540 ‐ 1,098,300 ‐ ‐ 0.0 599,700 0.0 74,227 ‐ ‐ 0.0 4,618,767
0.0 ‐608,870 ‐ ‐ ‐ ‐ ‐ ‐ 0.0 ‐115,000 ‐ ‐ 0.0 ‐723,870
‐ ‐ ‐ ‐ ‐ ‐ ‐ 208,497 ‐ ‐ ‐ ‐ ‐ 208,497
0.0 4,215,591 5,993,600 0.0 2,000 0.0 1,230,197 0.0 1,397,894 0.0 12,839,282
149.1 20,674,890 83.7 14,335,500 1.4 125,500 10.5 2,772,777 6.6 2,453,625 251.3 40,362,292
44

DARDEN SCHOOL OF BUSINESS Overview of Operations The Darden School of Business improves the world by developing and inspiring responsible leaders and by advancing knowledge. Darden follows a three-pronged approach to achieving its mission: student-centered learning, thought leadership, and active engagement with the business community. The school offers a Master of Business Administration (MBA) in three formats: a traditional residency-based program (641 students anticipated in 2014-15), an Executive MBA (132 students anticipated in 2014-15), and a Global Executive MBA (58 students anticipated in 2014-15). In addition, the School has a small cohort of PhD students (10 students anticipated in 2014-15). The overall trend in headcount enrollment is shown below. The School also offers executive education programs through the Darden School Foundation.
Strategic Direction Darden’s goals for the next year continue to build on the school’s “Six Pillars” strategy: Top Students, Top Programs, Top Faculty/Staff, Top Infrastructure, Top Brand, and Top Resources. The School believes that becoming a more globally relevant school is critical to sustaining its top standing as a graduate business school. During the 2011-12 academic year, Darden launched a Global Executive MBA program. In the 2014-15 academic year, the School’s goal is to grow this program, continuing the development of a globally relevant curriculum and increasing Darden’s international standing through branding and outreach. Since 2012-13, four MOOCs (Massive Open Online Courses) have been launched and, due to their success, they will be offered for a second time. The School plans to continue to offer future courses in this format and to increase other options for online learning. Additionally, Darden is in the process of recruiting several academic faculty to succeed retiring faculty and other similar transitions.
The following graph shows the trend in student: faculty ratio at Darden.
2014-15 Operating Budget Financial self-sufficiency was first endorsed by the Board of Visitors in 1995 and formalized by memorandum of understanding in 2001. As a financially self-sufficient school, Darden retains its tuition revenues and receives a subsidy for each in-state student. This subsidy (which represents 50 percent of the differential between in-state and out-of-state tuition), is currently $2,500 but will decline to $1,500 as the differential between in-state and out-of-state tuition changes. The School is responsible for generating sufficient revenues to cover all of its operating and capital expenditures. Under self-sufficiency, other than the in-state student subsidy ($240,000 in the 2014-15 budget), the only central allocations to Darden are $70,000 from state general funds for financial aid to in-state students and $40,000 from private funds for financial aid. Approximately 64 percent of the School’s operating budget is funded from tuition; 33 percent from endowment distributions, gifts, and transfers from the Darden School Foundation; and the remainder from other sources.
MAJ
OR
BU
DG
ET U
NIT
OVE
RVI
EWS
45
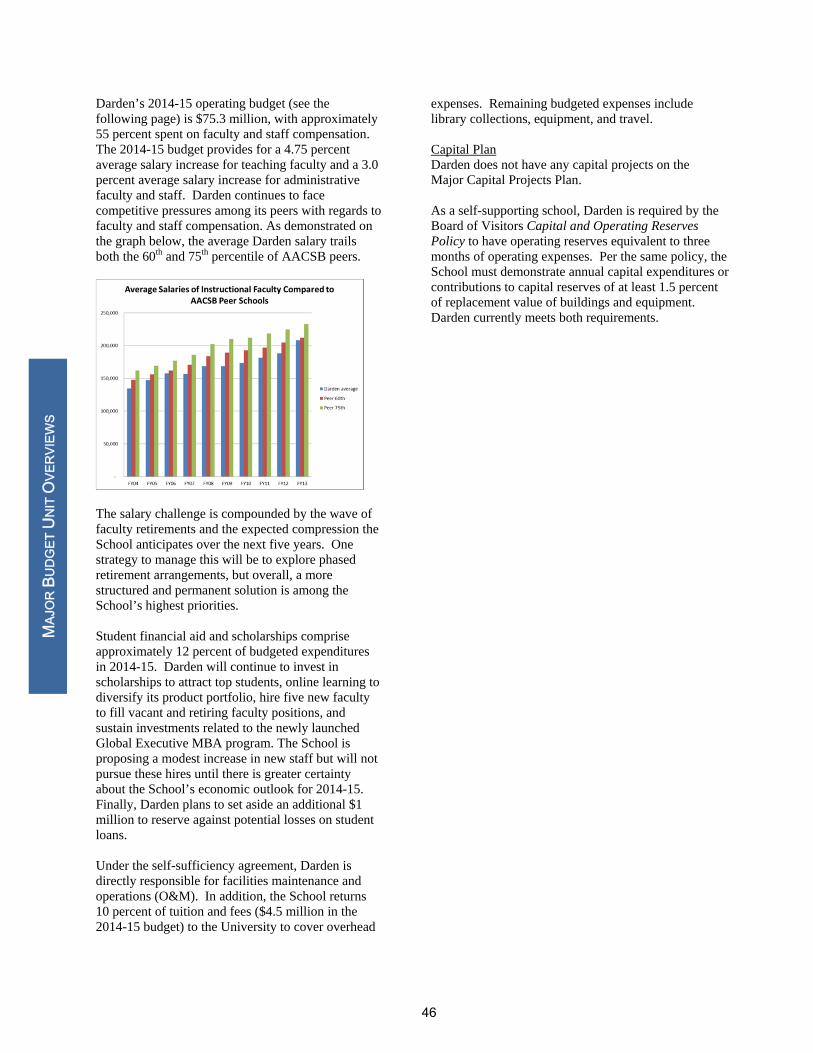
Darden’s 2014-15 operating budget (see the following page) is $75.3 million, with approximately 55 percent spent on faculty and staff compensation. The 2014-15 budget provides for a 4.75 percent average salary increase for teaching faculty and a 3.0 percent average salary increase for administrative faculty and staff. Darden continues to face competitive pressures among its peers with regards to faculty and staff compensation. As demonstrated on the graph below, the average Darden salary trails both the 60th and 75th percentile of AACSB peers.
The salary challenge is compounded by the wave of faculty retirements and the expected compression the School anticipates over the next five years. One strategy to manage this will be to explore phased retirement arrangements, but overall, a more structured and permanent solution is among the School’s highest priorities. Student financial aid and scholarships comprise approximately 12 percent of budgeted expenditures in 2014-15. Darden will continue to invest in scholarships to attract top students, online learning to diversify its product portfolio, hire five new faculty to fill vacant and retiring faculty positions, and sustain investments related to the newly launched Global Executive MBA program. The School is proposing a modest increase in new staff but will not pursue these hires until there is greater certainty about the School’s economic outlook for 2014-15. Finally, Darden plans to set aside an additional $1 million to reserve against potential losses on student loans. Under the self-sufficiency agreement, Darden is directly responsible for facilities maintenance and operations (O&M). In addition, the School returns 10 percent of tuition and fees ($4.5 million in the 2014-15 budget) to the University to cover overhead
expenses. Remaining budgeted expenses include library collections, equipment, and travel. Capital Plan Darden does not have any capital projects on the Major Capital Projects Plan. As a self-supporting school, Darden is required by the Board of Visitors Capital and Operating Reserves Policy to have operating reserves equivalent to three months of operating expenses. Per the same policy, the School must demonstrate annual capital expenditures or contributions to capital reserves of at least 1.5 percent of replacement value of buildings and equipment. Darden currently meets both requirements.
MAJ
OR
BU
DG
ET U
NIT
OVE
RVI
EWS
46

University of Virginia - MBU SummaryExec Level: R1380 VP: PV-VP/Provost, Mbu Level: R1825 MBU: DA-Darden School
1
Tui on and GFAppropria on
FTE Amount
2
Grants & Contracts,F&A
FTE Amount
3
Private Unrestricted
FTE Amount
4
Private Restricted
FTE Amount
5
Local Sales, Services,Other
FTE Amount
6
Auxiliary
FTE Amount Total ‐ FTE Total ‐ Amount
FY CTCS Category
2014‐R Faculty Salaries and benefitsStaff Salaries and benefitsWages and benefits
Subtotal
OTPS
Financial Aid
Central Assessment
Internal Debt Service
Transfers
Subtotal
MBU Totals
2015‐O Faculty Salaries and benefitsStaff Salaries and benefitsWages and benefits
Subtotal
OTPS
Financial Aid
Central Assessment
Internal Debt Service
Transfers
Subtotal
MBU Totals
79.0 17,192,320 ‐ ‐ ‐ ‐ 28.0 5,584,353 1.0 164,032 ‐ ‐ 108.0 22,940,705
105.4 8,299,778 ‐ ‐ ‐ ‐ 14.0 1,196,614 15.0 926,434 ‐ ‐ 134.4 10,422,826
‐ 4,548,215 ‐ ‐ ‐ ‐ ‐ 196,451 ‐ 26,712 ‐ ‐ ‐ 4,771,378
184.4 30,040,313 42.0 6,977,418 16.0 1,117,178 242.4 38,134,909
‐ 12,084,267 ‐ ‐ ‐ 303,655 ‐ 4,177,609 ‐ 829,883 ‐ ‐ ‐ 17,395,414
‐ 973,658 ‐ ‐ ‐ ‐ ‐ 5,862,871 ‐ ‐ ‐ ‐ ‐ 6,836,529
‐ 4,180,102 ‐ ‐ ‐ ‐ ‐ ‐ ‐ ‐ ‐ ‐ ‐ 4,180,102
‐ ‐ ‐ ‐ ‐ ‐ ‐ 3,143,808 ‐ ‐ ‐ ‐ ‐ 3,143,808
‐ 1,227,500 ‐ ‐ ‐ ‐ ‐ ‐ ‐ ‐ ‐ ‐ ‐ 1,227,500
18,465,527 303,655 13,184,288 829,883 32,783,353
184.4 48,505,840 303,655 42.0 20,161,706 16.0 1,947,061 242.4 70,918,262
69.0 17,435,648 ‐ ‐ ‐ ‐ 40.0 7,759,158 1.0 134,946 ‐ ‐ 110.0 25,329,752
105.1 9,146,599 ‐ ‐ ‐ ‐ 19.0 1,798,803 15.0 712,005 ‐ ‐ 139.1 11,657,407
‐ 3,991,153 ‐ ‐ ‐ ‐ ‐ 561,853 ‐ 25,200 ‐ ‐ ‐ 4,578,206
174.1 30,573,400 59.0 10,119,814 16.0 872,151 249.1 41,565,365
0.0 10,829,350 ‐ ‐ ‐ 303,655 ‐ 3,961,204 ‐ 850,635 ‐ ‐ 0.0 15,944,844
‐ 1,170,399 ‐ ‐ ‐ ‐ ‐ 7,719,494 ‐ ‐ ‐ ‐ ‐ 8,889,893
‐ 4,480,405 ‐ ‐ ‐ ‐ ‐ ‐ ‐ ‐ ‐ ‐ ‐ 4,480,405
‐ ‐ ‐ ‐ ‐ ‐ ‐ 3,139,343 ‐ ‐ ‐ ‐ ‐ 3,139,343
‐ 1,260,000 ‐ ‐ ‐ ‐ ‐ ‐ ‐ ‐ ‐ ‐ ‐ 1,260,000
0.0 17,740,154 303,655 14,820,041 850,635 0.0 33,714,485
174.1 48,313,554 303,655 59.0 24,939,855 16.0 1,722,786 249.1 75,279,850
47

FRANK BATTEN SCHOOL OF LEADERSHIP AND
PUBLIC POLICY Overview of Operations The University of Virginia established the Frank Batten School of Leadership and Public Policy in 2007 as part of its strategic plan and as an expression of its Jeffersonian heritage. Through its instructional, research, and outreach programs, the Batten School contributes in important ways to public understanding and deliberation of the great domestic and international issues of each age. The Batten School’s mission is to generate useful knowledge and educate leaders who are prepared to serve communities of all sizes and lead necessary and sustainable change. The Batten School trains students in critical leadership skills and in the analytics and substance of policy. Its programs inspire students to act vigorously, effectively, and ethically on behalf of the common good. Faculty are committed to teaching the use of rigorous analysis; the subtle understanding of political, social and economic context; and the exercise of creative personal and organizational leadership to initiate change in an increasingly diverse world. May 2014 will mark the end of the Batten School’s seventh year of existence. The School’s academic offerings continue to grow and mature. In May 2014, the first cohort of undergraduate students will receive their Bachelor’s degrees. Enrollments in the accelerated and two-year MPP programs and the undergraduate program are strong and continue on an upward trajectory. Strategic Direction The Batten School’s goals for 2014-15 are to: 1. Conduct two national faculty searches and make
multiple tenure-track hires from these searches;
2. Complete a formal review of the Master of Public Policy (MPP) curriculum and produce a report that includes specific recommendations and proposed future directions;
3. Further articulate our school-wide approach to leadership education and research by adopting initial core leadership competencies, reviewing the substance and sequencing of our leadership curriculum, aligning our co-curricular programming with our competencies and curriculum, and planning for hiring a chaired professor in leadership, as well as the future development of a leadership center;
4. Develop and fully implement the Undergraduate Capstone Project requirement;
5. Continue improving student development opportunities, and specifically focus on graduate and undergraduate co-curricular student leadership development;
6. Engage alumni and friends of the School through an annual giving campaign;
7. Develop a framework for the Batten School’s communications infrastructure and begin to adequately resource this function by hiring a communications director;
8. Track and implement provisions of the University’s new financial model;
9. Study opportunities and articulate options for Batten School physical expansion and Garrett Hall improvements to accommodate planned growth.
An enduring University of Virginia core value is to train students to exercise leadership responsibilities in a democratic society. Carrying forward this Jeffersonian tradition, the Batten School takes an expansive approach to public policy education -- one that prepares students to be effective, ethical, and enlightened leaders not only in government, but also in their professions and local communities. The School has strengthened the student experience by featuring capstone experiences as a key component of the undergraduate and graduate programs. These capstones inspire students to become engaged citizens who take on significant challenges through academic projects and scholarly reflection. The graduate capstone projects occur within real-world organizations in public policy arenas and the undergraduate capstones are completed by groups, helping students further develop their leadership and collaboration skills. The School emphasizes the idea that students must see connections between academic learning and public service by requiring MPP students to complete summer internships. Many undergraduates will seek internships as well. The Batten School continues to build its faculty, now 13 strong, representing diverse interests and backgrounds in economics, political science, and
MAJ
OR
BU
DG
ET U
NIT
OVE
RVI
EWS
48

psychology. The faculty includes nine tenure track and four practitioners, and it will grow to about 16 scholars in FY15-16. Interdisciplinary collaboration is a cornerstone of the Batten faculty and student experience. The School promotes the University’s objective of expediting degree completion by offering an accelerated BA/ MPP program, which allows University undergraduates to receive both a bachelor's degree and the MPP degree in one year less than is normally required to earn both degrees. Batten accepts approximately 45 students per year into this program. Student demand is high and admission competitive. Most students complete the two degrees in five years (rather than the normal six), but some students are able to earn the degrees in four years. In addition, Batten has recently launched new dual degree graduate programs including MPP/JD, MPP/MBA, MPP/Master of Public Health, and MPP/Master of Urban and Environmental Planning. These programs train future professionals for leadership and analytic careers in the legal, health care, business, and environmental sectors. All of the programs allow students to pursue two graduate degrees in an expedited manner, typically saving a year of study. Finally, the Batten School expanded its commitment to the University’s efforts to diversify research to include the promotion of economic growth. The continuing partnership with the Curry School of Education that supports the joint Center on Education Policy and Workforce Competitiveness has proven successful. Batten also partners with the School of Medicine’s Department of Public Health Services to establish the University of Virginia Center for Health Policy. 2014-15 Operating Budget The Batten School has a hybrid budget model, with the majority of its budget coming from a decentralized source – the endowment funded from the original gift that established the School. The School receives an allocation of tuition generated, net of undergraduate financial aid. Gifts and endowments provide 61 percent of the 2014-15 operational budget, with 36 percent from tuition and the remainder from grants and contracts and F&A.
The Batten School’s 2014-15 operating budget (see the following page) is $10.74 million. The primary spending initiatives are faculty compensation (47 percent), staff salaries (13 percent), wages (9 percent), OTPS (12 percent), debt service (5 percent), and student fellowships (14 percent). The school’s 2014-15 operating budget includes an allocation of $372,909 related to fall 2014 enrollment growth. Funding will be allocated to the target budgets for compensation adjustments as authorized by the state or the Board of Visitors. The School will continue to fill its planned faculty positions, add academic programs, and build the infrastructure required to aggressively search for and identify new markets and diverse revenue streams. Capital Plan No additions, deletions, or modifications for the next update of the Major Capital Projects Plan are planned.
MAJ
OR
BU
DG
ET U
NIT
OVE
RVI
EWS
49

University of Virginia - MBU SummaryExec Level: R1380 VP: PV-VP/Provost, Mbu Level: R1361 MBU: BA-Frank Batten School
1
Tui on and GFAppropria on
FTE Amount
2
Grants & Contracts,F&A
FTE Amount
3
Private Unrestricted
FTE Amount
4
Private Restricted
FTE Amount
5
Local Sales, Services,Other
FTE Amount
6
Auxiliary
FTE Amount Total ‐ FTE Total ‐ Amount
FY CTCS Category
2014‐R Faculty Salaries and benefitsStaff Salaries and benefitsWages and benefitsGTA/GRA
Subtotal
OTPS
Financial Aid
Internal Debt Service
Subtotal
MBU Totals
2015‐O Faculty Salaries and benefitsStaff Salaries and benefitsWages and benefitsGTA/GRA
Subtotal
OTPS
Financial Aid
Internal Debt Service
Subtotal
MBU Totals
10.1 2,037,805 0.2 25,084 ‐ ‐ 8.0 1,900,000 ‐ ‐ ‐ ‐ 18.2 3,962,889
1.1 113,000 1.0 45,000 ‐ ‐ 10.8 885,366 ‐ ‐ ‐ ‐ 12.9 1,043,366
‐ 252,200 ‐ 75,000 ‐ 101,550 ‐ 303,640 ‐ ‐ ‐ ‐ ‐ 732,390
1.6 150,000 0.3 17,000 ‐ ‐ ‐ ‐ ‐ ‐ ‐ ‐ 1.9 167,000
12.7 2,553,005 1.4 162,084 101,550 18.8 3,089,006 33.0 5,905,645
‐ 100 ‐ 28,000 ‐ 50,000 ‐ 1,345,468 ‐ 7,560 ‐ ‐ ‐ 1,431,128
‐ 271,461 ‐ 7,440 ‐ ‐ ‐ 724,000 ‐ ‐ ‐ ‐ ‐ 1,002,901
‐ ‐ ‐ ‐ ‐ ‐ ‐ 4,526,330 ‐ ‐ ‐ ‐ ‐ 4,526,330
271,561 35,440 50,000 6,595,798 7,560 6,960,359
12.7 2,824,566 1.4 197,524 151,550 18.8 9,684,804 7,560 33.0 12,866,004
13.9 2,931,980 0.3 46,300 ‐ ‐ 9.5 2,117,300 ‐ ‐ ‐ ‐ 23.7 5,095,580
1.2 123,401 1.3 78,400 ‐ ‐ 12.2 1,141,800 ‐ ‐ ‐ ‐ 14.6 1,343,601
0.0 224,600 ‐ 126,200 ‐ 87,270 ‐ 355,063 ‐ ‐ ‐ ‐ 0.0 793,133
2.0 198,000 ‐ ‐ ‐ ‐ ‐ ‐ ‐ ‐ ‐ ‐ 2.0 198,000
17.0 3,477,981 1.6 250,900 87,270 21.6 3,614,163 40.2 7,430,314
0.0 500 ‐ 38,000 ‐ 48,500 ‐ 1,149,611 0.0 8,500 ‐ ‐ 0.0 1,245,111
0.0 404,250 ‐ ‐ ‐ ‐ ‐ 1,132,500 ‐ ‐ ‐ ‐ 0.0 1,536,750
‐ ‐ ‐ ‐ ‐ ‐ ‐ 530,231 ‐ ‐ ‐ ‐ ‐ 530,231
0.0 404,750 38,000 48,500 2,812,342 0.0 8,500 0.0 3,312,092
17.0 3,882,731 1.6 288,900 135,770 21.6 6,426,505 0.0 8,500 40.2 10,742,406
50

MCINTIRE SCHOOL OF COMMERCE Overview of Operations Established in 1921 through a gift from Paul Goodloe McIntire, the McIntire School of Commerce offers an undergraduate degree (697 students in 2013-14) and three Master of Science graduate degrees (233 students in 2013-14) in Commerce, Management of Information Technology, and Accounting. McIntire’s projected 2014-15 enrollment is 695 undergraduate and 236 graduate students.
The below graph shows changes to the School’s student:faculty ratio over time.
In addition to its degree programs and through its McIntire School of Commerce Foundation, the School offers the McIntire Business Institute, a non-degree, general business certificate program in the summer and during the academic year, as well as other custom-designed, executive education programs. Strategic Direction McIntire’s strategic plan is focused on: 1. Maintaining and enhancing high-quality
programs offered by a world-class faculty, with students selected through a very competitive admissions process, and emphasizing innovative global programming;
2. Recruiting and retaining high-quality faculty and staff by offering competitive compensation, as well as adequate research and teaching support to encourage innovation, through the development of significant and diverse funding sources;
3. Investing in revenue-generating programs,
examining options to expand existing programs and launch new programs, and hiring and retaining the necessary professional staff ; and
4. Providing value-added student services by expanding use of technology, providing the highest levels of student and career services, and collaborating with students to establish new student organizations and areas of interest.
McIntire raises funds and offers programs through its research centers as a way to enhance the intellectual capital of faculty, students, business professionals, and corporate partners. Throughout the year, McIntire research centers sponsor popular symposia, panels, and other programs for faculty, practitioners, and students, discussing both current topics in business and the very best of practice. 2014-15 Operating Budget The McIntire School operates within a hybrid funding model, with the undergraduate programs funded through a traditional centralized budget target plus an allocation of differential undergraduate tuition generated, net of a 10 percent assessment and a share of undergraduate financial aid. The graduate programs operate on a revenue-sharing basis. Under the revenue sharing agreement established in 1990, the McIntire School retains its graduate tuition revenues, less a 15 percent assessment ($1.1 million in the 2014-15 budget) to the University to cover overhead expenses. Approximately 68 percent of the School’s operating budget is funded from tuition, while 32 percent is funded from endowment distributions, gifts, and transfers from the McIntire School Foundation.
MAJ
OR
BU
DG
ET U
NIT
OVE
RVI
EWS
51

In 2014-15, full-time McIntire undergraduate students will pay a tuition rate that is $5,000 higher than full-time undergraduate tuition. The differential tuition rate generates funds that are critical in the areas of faculty compensation and retention; student services, career services, and technology; and building and enhancing programs. Tuition and fees for McIntire graduate programs will increase by 1.0-3.0 percent in 2014-15. McIntire’s 2014-15 operating budget (see the following page) is $29.5 million, with approximately 82 percent spent on faculty and staff compensation, 11 percent on other than personal services, and 3 percent on student financial aid. The School’s 2014-15 operating budget includes an allocation of $59,000 related to projected fall 2014 enrollment growth. McIntire received a total of $321,000 to support enrollment growth in fall 2011 through fall 2013. Funding will be allocated to the target budgets for compensation adjustments as authorized by the state or the Board of Visitors. McIntire anticipates hiring five or six new faculty in 2014-15. The School faces stiff competition from peers to retain the best, most productive faculty and recruit new faculty at competitive compensation levels. The following graph shows the average McIntire salary as compared to the 60th and 75th percentile of AAU peers:
In the short-term, McIntire obtained additional private support to address faculty compensation issues. It is critical, however, that a sustainable source of revenue be identified. Capital Plan Currently, McIntire does not have any capital projects on the Major Capital Projects Plan, but one is under consideration.
Through its Foundation, McIntire maintains sufficient operating reserves to meet the Board of Visitors Capital and Operating Reserves Policy requirement that self-supporting schools/departments maintain operating reserves equivalent to three months of operating expenses.
MAJ
OR
BU
DG
ET U
NIT
OVE
RVI
EWS
52
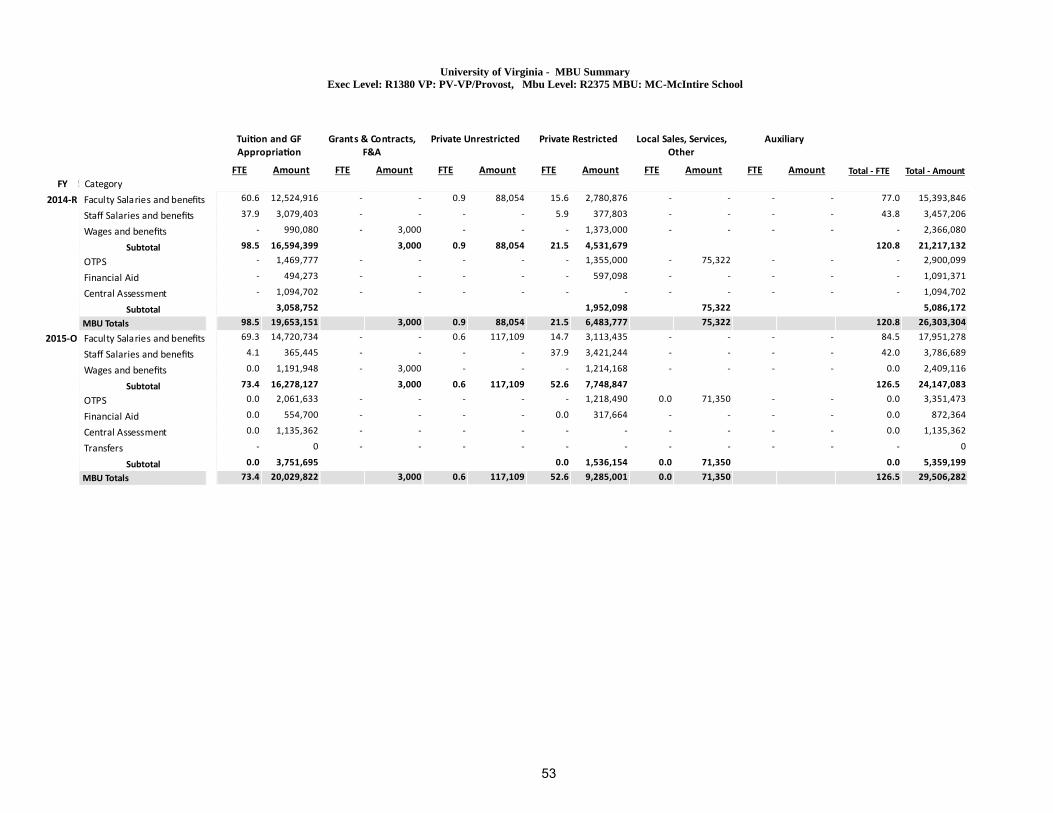
University of Virginia - MBU SummaryExec Level: R1380 VP: PV-VP/Provost, Mbu Level: R2375 MBU: MC-McIntire School
1
Tui on and GFAppropria on
FTE Amount
2
Grants & Contracts,F&A
FTE Amount
3
Private Unrestricted
FTE Amount
4
Private Restricted
FTE Amount
5
Local Sales, Services,Other
FTE Amount
6
Auxiliary
FTE Amount Total ‐ FTE Total ‐ Amount
FY CTCS Category
2014‐R Faculty Salaries and benefitsStaff Salaries and benefitsWages and benefits
Subtotal
OTPS
Financial Aid
Central Assessment
Subtotal
MBU Totals
2015‐O Faculty Salaries and benefitsStaff Salaries and benefitsWages and benefits
Subtotal
OTPS
Financial Aid
Central Assessment
Transfers
Subtotal
MBU Totals
60.6 12,524,916 ‐ ‐ 0.9 88,054 15.6 2,780,876 ‐ ‐ ‐ ‐ 77.0 15,393,846
37.9 3,079,403 ‐ ‐ ‐ ‐ 5.9 377,803 ‐ ‐ ‐ ‐ 43.8 3,457,206
‐ 990,080 ‐ 3,000 ‐ ‐ ‐ 1,373,000 ‐ ‐ ‐ ‐ ‐ 2,366,080
98.5 16,594,399 3,000 0.9 88,054 21.5 4,531,679 120.8 21,217,132
‐ 1,469,777 ‐ ‐ ‐ ‐ ‐ 1,355,000 ‐ 75,322 ‐ ‐ ‐ 2,900,099
‐ 494,273 ‐ ‐ ‐ ‐ ‐ 597,098 ‐ ‐ ‐ ‐ ‐ 1,091,371
‐ 1,094,702 ‐ ‐ ‐ ‐ ‐ ‐ ‐ ‐ ‐ ‐ ‐ 1,094,702
3,058,752 1,952,098 75,322 5,086,172
98.5 19,653,151 3,000 0.9 88,054 21.5 6,483,777 75,322 120.8 26,303,304
69.3 14,720,734 ‐ ‐ 0.6 117,109 14.7 3,113,435 ‐ ‐ ‐ ‐ 84.5 17,951,278
4.1 365,445 ‐ ‐ ‐ ‐ 37.9 3,421,244 ‐ ‐ ‐ ‐ 42.0 3,786,689
0.0 1,191,948 ‐ 3,000 ‐ ‐ ‐ 1,214,168 ‐ ‐ ‐ ‐ 0.0 2,409,116
73.4 16,278,127 3,000 0.6 117,109 52.6 7,748,847 126.5 24,147,083
0.0 2,061,633 ‐ ‐ ‐ ‐ ‐ 1,218,490 0.0 71,350 ‐ ‐ 0.0 3,351,473
0.0 554,700 ‐ ‐ ‐ ‐ 0.0 317,664 ‐ ‐ ‐ ‐ 0.0 872,364
0.0 1,135,362 ‐ ‐ ‐ ‐ ‐ ‐ ‐ ‐ ‐ ‐ 0.0 1,135,362
‐ 0 ‐ ‐ ‐ ‐ ‐ ‐ ‐ ‐ ‐ ‐ ‐ 0
0.0 3,751,695 0.0 1,536,154 0.0 71,350 0.0 5,359,199
73.4 20,029,822 3,000 0.6 117,109 52.6 9,285,001 0.0 71,350 126.5 29,506,282
53
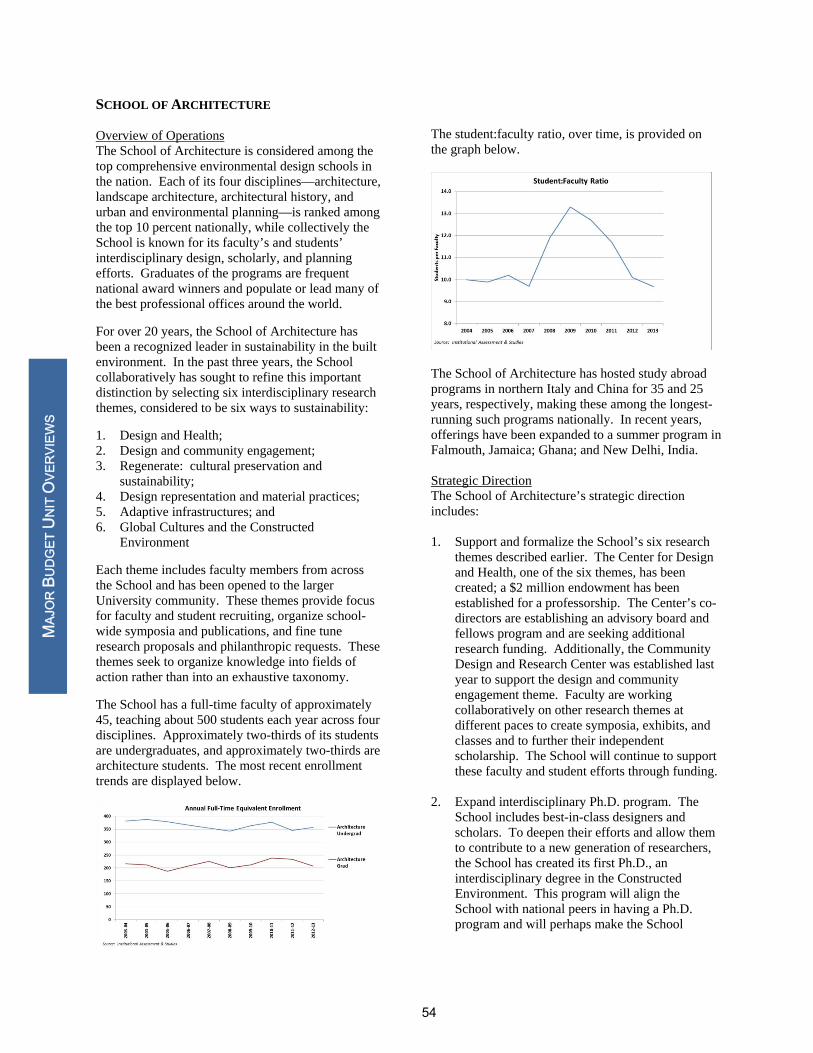
SCHOOL OF ARCHITECTURE Overview of Operations The School of Architecture is considered among the top comprehensive environmental design schools in the nation. Each of its four disciplines—architecture, landscape architecture, architectural history, and urban and environmental planning—is ranked among the top 10 percent nationally, while collectively the School is known for its faculty’s and students’ interdisciplinary design, scholarly, and planning efforts. Graduates of the programs are frequent national award winners and populate or lead many of the best professional offices around the world.
For over 20 years, the School of Architecture has been a recognized leader in sustainability in the built environment. In the past three years, the School collaboratively has sought to refine this important distinction by selecting six interdisciplinary research themes, considered to be six ways to sustainability:
1. Design and Health; 2. Design and community engagement; 3. Regenerate: cultural preservation and
sustainability; 4. Design representation and material practices; 5. Adaptive infrastructures; and 6. Global Cultures and the Constructed
Environment
Each theme includes faculty members from across the School and has been opened to the larger University community. These themes provide focus for faculty and student recruiting, organize school-wide symposia and publications, and fine tune research proposals and philanthropic requests. These themes seek to organize knowledge into fields of action rather than into an exhaustive taxonomy.
The School has a full-time faculty of approximately 45, teaching about 500 students each year across four disciplines. Approximately two-thirds of its students are undergraduates, and approximately two-thirds are architecture students. The most recent enrollment trends are displayed below.
The student:faculty ratio, over time, is provided on the graph below.
The School of Architecture has hosted study abroad programs in northern Italy and China for 35 and 25 years, respectively, making these among the longest-running such programs nationally. In recent years, offerings have been expanded to a summer program in Falmouth, Jamaica; Ghana; and New Delhi, India. Strategic Direction The School of Architecture’s strategic direction includes: 1. Support and formalize the School’s six research
themes described earlier. The Center for Design and Health, one of the six themes, has been created; a $2 million endowment has been established for a professorship. The Center’s co-directors are establishing an advisory board and fellows program and are seeking additional research funding. Additionally, the Community Design and Research Center was established last year to support the design and community engagement theme. Faculty are working collaboratively on other research themes at different paces to create symposia, exhibits, and classes and to further their independent scholarship. The School will continue to support these faculty and student efforts through funding.
2. Expand interdisciplinary Ph.D. program. The School includes best-in-class designers and scholars. To deepen their efforts and allow them to contribute to a new generation of researchers, the School has created its first Ph.D., an interdisciplinary degree in the Constructed Environment. This program will align the School with national peers in having a Ph.D. program and will perhaps make the School
MAJ
OR
BU
DG
ET U
NIT
OVE
RVI
EWS
54

among the first to offer a newly-conceived Ph.D. for the 21st century.
3. Streamline existing academic and administrative processes. The School’s leadership is methodically working to understand these processes and subsequently revise them, with the goals of fairness, efficiency, and transparency. The processes will be based, when possible, on national best practices.
4. Enhance the School’s teaching and research offerings internationally by extending and concentrating international efforts in the Mediterranean basin, Asia, and Africa in diaspora. To this end, a faculty member was appointed to the Weedon Chair in Asian Architecture, reinforcing efforts in Asia, specifically China. In addition, a visiting faculty member from New Delhi served as the Shure Professor. His exhibit, Golconde, demonstrated the power of early modernism in an Indian context. Following this extended effort, he has agreed to host a studio in New Dehli for the next several years. 5. Refine and implement Architectural Design Thinking concentration. This concentration is for students interested in interdisciplinary problem solving through exploratory design processes. The curriculum offers a strong core in the design of the built environment while offering broader studios and electives designed to collaborate across the University. The degree is listed as B.S. Architecture with a concentration in design thinking.
As one of the University’s smallest schools, and given the studio tradition, Architecture students form deep, life-long bonds with each other and with their professors during their time at the University. In the School of Architecture, many students work around the clock to accomplish demanding comprehensive assignments, and faculty and staff work to honor their commitment. Students often arrive with a passion to serve, and courses organized around community engagement, such as the recent all-school Rivanna River competition, satisfy this desire. Alumni outreach is robust, and the School’s alumni are fully engaged in supporting each other and young graduates. All the disciplines housed in the School of Architecture are considered STEM [science, technology, engineering, and mathematics] subjects, and the School works to advance this understanding
of applied technology through traditional coursework and hands-on projects such as those done in the Elmaleh Fabrications Lab or as part of the ECO-Mod, ReCOVER, and Learning Barge projects. The School of Architecture has a long history of providing global education. In recent years, efforts have resulted in faculty hired from China, Austria, the Netherlands, and Spain, and faculty visiting from Australia, Romania, and Egypt. Funded student travel in this 12-month period includes trips to China, New Dehli, and Barcelona. In addition, recent symposia have introduced students to scholars from every continent but Antarctica. 2014-15 Operating Budget The School of Architecture is funded through a traditional centralized target budget and self-generated grants, contracts, and private resources. For 2014-15, 74 percent of the School’s operating budget is from tuition and state general funds. Private funds (endowment distribution, gifts, and transfers from the School of Architecture Foundation) represent 24 percent of funding, while grants, contracts, and F&A constitute 2 percent.
The School of Architecture’s 2014-15 operating budget (see page 57 ) is $11.7 million, with the primary spending initiatives being faculty compensation (52 percent), staff salaries and wages (19 percent), and GTA/ GRA stipends and graduate fellowship support (13 percent). Funding will be allocated to the target budgets for compensation adjustments as authorized by the state or the Board of Visitors. The below graph demonstrates the average Architecture faculty salary as compared to the 60th and 75th percentile of AAU peers.
MAJ
OR
BU
DG
ET U
NIT
OVE
RVI
EWS
55

In 2014-15, the School will examine how to streamline current processes to maximize available resources to meet the research and instructional goals outlined above. Additionally, the School will be evaluating new revenue sources and improving recruitment efforts to increase enrollment. The School is in the final stages of hiring the Deshong Professor in Design and Health and will be moving forward with expanding the collaborative efforts of the center and further integrating the concepts into the curriculum. The School will continue to devote the efforts of faculty and staff towards the implementation of the Ph.D. in the Constructed Environment program. Capital Plan The School of Architecture has no current or upcoming capital projects planned.
MAJ
OR
BU
DG
ET U
NIT
OVE
RVI
EWS
56
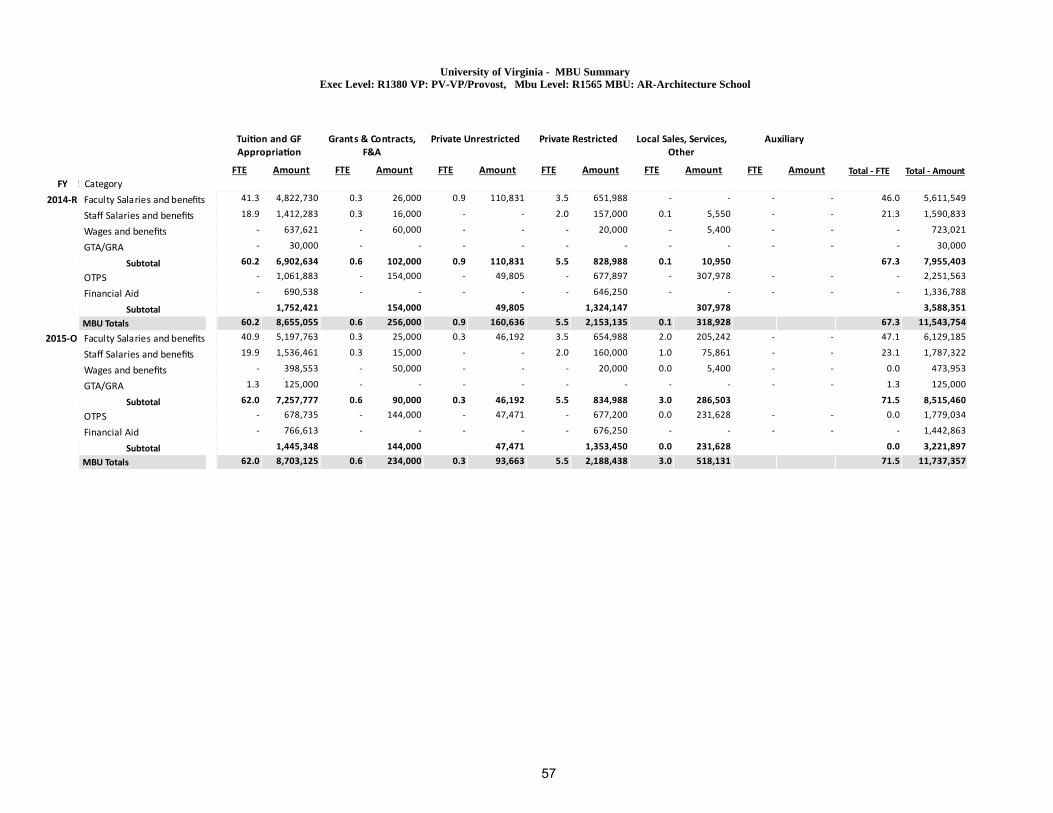
University of Virginia - MBU SummaryExec Level: R1380 VP: PV-VP/Provost, Mbu Level: R1565 MBU: AR-Architecture School
1
Tui on and GFAppropria on
FTE Amount
2
Grants & Contracts,F&A
FTE Amount
3
Private Unrestricted
FTE Amount
4
Private Restricted
FTE Amount
5
Local Sales, Services,Other
FTE Amount
6
Auxiliary
FTE Amount Total ‐ FTE Total ‐ Amount
FY CTCS Category
2014‐R Faculty Salaries and benefitsStaff Salaries and benefitsWages and benefitsGTA/GRA
Subtotal
OTPS
Financial Aid
Subtotal
MBU Totals
2015‐O Faculty Salaries and benefitsStaff Salaries and benefitsWages and benefitsGTA/GRA
Subtotal
OTPS
Financial Aid
Subtotal
MBU Totals
41.3 4,822,730 0.3 26,000 0.9 110,831 3.5 651,988 ‐ ‐ ‐ ‐ 46.0 5,611,549
18.9 1,412,283 0.3 16,000 ‐ ‐ 2.0 157,000 0.1 5,550 ‐ ‐ 21.3 1,590,833
‐ 637,621 ‐ 60,000 ‐ ‐ ‐ 20,000 ‐ 5,400 ‐ ‐ ‐ 723,021
‐ 30,000 ‐ ‐ ‐ ‐ ‐ ‐ ‐ ‐ ‐ ‐ ‐ 30,000
60.2 6,902,634 0.6 102,000 0.9 110,831 5.5 828,988 0.1 10,950 67.3 7,955,403
‐ 1,061,883 ‐ 154,000 ‐ 49,805 ‐ 677,897 ‐ 307,978 ‐ ‐ ‐ 2,251,563
‐ 690,538 ‐ ‐ ‐ ‐ ‐ 646,250 ‐ ‐ ‐ ‐ ‐ 1,336,788
1,752,421 154,000 49,805 1,324,147 307,978 3,588,351
60.2 8,655,055 0.6 256,000 0.9 160,636 5.5 2,153,135 0.1 318,928 67.3 11,543,754
40.9 5,197,763 0.3 25,000 0.3 46,192 3.5 654,988 2.0 205,242 ‐ ‐ 47.1 6,129,185
19.9 1,536,461 0.3 15,000 ‐ ‐ 2.0 160,000 1.0 75,861 ‐ ‐ 23.1 1,787,322
‐ 398,553 ‐ 50,000 ‐ ‐ ‐ 20,000 0.0 5,400 ‐ ‐ 0.0 473,953
1.3 125,000 ‐ ‐ ‐ ‐ ‐ ‐ ‐ ‐ ‐ ‐ 1.3 125,000
62.0 7,257,777 0.6 90,000 0.3 46,192 5.5 834,988 3.0 286,503 71.5 8,515,460
‐ 678,735 ‐ 144,000 ‐ 47,471 ‐ 677,200 0.0 231,628 ‐ ‐ 0.0 1,779,034
‐ 766,613 ‐ ‐ ‐ ‐ ‐ 676,250 ‐ ‐ ‐ ‐ ‐ 1,442,863
1,445,348 144,000 47,471 1,353,450 0.0 231,628 0.0 3,221,897
62.0 8,703,125 0.6 234,000 0.3 93,663 5.5 2,188,438 3.0 518,131 71.5 11,737,357
57

SCHOOL OF CONTINUING AND PROFESSIONAL
STUDIES Overview of Operations The School of Continuing and Professional Studies (SCPS) responds to the academic and professional needs of adult learners for useful knowledge. SCPS operates seven regional outreach centers located throughout the Commonwealth of Virginia. Each of these centers offers noncredit and credit professional development and certificate programs. Additionally, SCPS offers a part-time Bachelor of Interdisciplinary Studies (BIS) degree program in Charlottesville, as well as other sites, in partnership with Tidewater Community College and Northern Virginia Community College (NVCC). In 2012-13, SCPS expanded the BIS program to NVCC’s Loudoun campus and to the residents of the Greater Richmond region. SCPS serves nearly 6,000 students (unduplicated headcount) each fiscal year. Over the past decade, an increasing number of public, private, and for-profit schools have entered into the academic outreach market. This increased competition has contributed to a continuous decline in SCPS’s off-Grounds credit enrollments; also contributing to the decline in enrollments are budget cuts to SCPS and the Curry School of Education and eroding local support for K-12 educators seeking graduate degrees. As of fall 2013, SCPS no longer administered Curry degree programs or courses. However, SCPS continues to deliver a small portfolio of academic programs for K-12 educators that are requested by the K-12 market but not offered through Curry. Although SCPS has experienced declines in credit registrations, some of these declines generally have been offset by increases in non-credit programming and tuition rates. The following graphs show the trends in SCPS’s annual enrollment and total revenues.
In addition to academic offerings, SCPS operates a conference center, a satellite uplink facility, and a television studio. Strategic Direction SCPS has implemented a set of guiding principles to ensure that resource commitments are aligned to support the School’s mission, the University’s Cornerstone Plan, and the Commonwealth’s TJ21 priorities. Given this context, faculty and staff will be initiating a process to review and refine SCPS’s strategic plan to ensure tighter alignment with these important planning documents. SCPS has developed and implemented a multi-year program review calendar, which enables SCPS to evaluate the curriculum, courses, and faculty of its programs and, ultimately, to identify strategic priorities and drive resource allocations. In order to effectively complete the program reviews and improve decision-making, processes and systems have been implemented to become more data driven. Data is analyzed from the enrollment funnel, including data associated with inquiries, prospects, applicants, enrolled students, matriculated students, students on leave, and so forth. SCPS also analyzes (1) student retention rates for existing programs; (2) assessments of marketing activities and investments; and (3) fiscal reporting by program. An integral part of SCPS’ strategic planning has been the implementation of cross-functional teams to complete program analyses for about 20 academic programs. The results of these reviews have enhanced curriculum, will drive resource allocations and reallocations in 2014-15, and allowed SCPS to classify its “brand-building” academic programs as Tier 1, Tier 2, or Tier 3 programs. Resources will be
$10,000,000$12,000,000$14,000,000$16,000,000$18,000,000$20,000,000
2003‐04
2004‐05
2005‐06
2006‐07
2007‐08
2008‐09
2009‐10
2010‐11
2011‐12
2012‐13
Annual Total Revenues
MAJ
OR
BU
DG
ET U
NIT
OVE
RVI
EWS
58
allocated accordingly amongst these priorities and in a manner that will increase enrollment growth through allocation of marketing resources, administrative support of the programs, program delivery changes, academic content changes, etc. As a result of these program reviews, up to 13 programs have been identified for sun-setting or have been retired, which will allow resources to be reallocated to grow enrollments in Tier 1 and Tier 2 programs and/or to develop new or emerging programs over the next several years. SCPS’s program review is a multi-year effort and will involve review of additional programs and reassessment of recommendations and results during 2014-15 and beyond. Key programs that will be supported from additional resources reallocated through these efforts include the Bachelor of Professional Studies - Health Sciences Management (BPHM) undergraduate degree program, Business and Professional graduate and undergraduate certificate programs, and continuance of professional education programs in a variety of fields (Environmental Management, K12, and Higher Education) for Chinese professionals through the Triway International Group. SCPS’s Strategic Marketing Plan encompasses tactical efforts that continue to build upon the SCPS web presence, as well as commitments to publications, engagement communications, and recruitment advertising. The plan focuses on both single-year and multi-year approaches that allow for ongoing tactics that continue to demonstrate return on investments, while allowing for the introduction of new efforts that can be tested and evaluated before further expenditure investments are made. Performance metrics for the marketing and communications efforts include: web analytics, due to a robust set-up of Google Analytics; tracking of all print and electronic recruitment advertising; measuring click-thru rates of electronic marketing and communications efforts; and survey data from prospective and current students. Another data collection and analysis initiative to support strategic decision-making has been the development and implementation of an Outreach and Contracts Database system. This is the system of record for tracking and reporting of contacts and opportunities with SCPS’s clients and is used to generate and track the status of revenue contracts. This system assists SCPS in providing reports of revenues as well as clients and students served.
Also supporting strategic planning and program initiatives is the new Chart of Accounts, which provides financial information and reporting by program, program area, and location. SCPS is uniquely poised to assist the University in contributing to the HEOA goal to award an additional 100,000 degrees over the next 15 years through expanding its BIS degree program. Beginning fall 2012, SCPS expanded delivery of the BIS program to the Richmond metropolitan area and its partnership with NVCC by delivering the program to students at the NVCC Loudoun campus. SCPS has begun discussions to continue to expand the BIS offering at others areas within the state, including responding to interest from Thomas Nelson Community College to bring the BIS degree program to its adult students in the Williamsburg area once academic approvals are completed. SCPS has responded to the Medical Center’s demand for bachelor-credentialed health science professionals by developing a new BPHM degree program in conjunction with Piedmont Virginia Community College (PVCC) and other community colleges throughout the Commonwealth. SCHEV approval was received in January 2014, and the initial cohort will matriculate in spring 2015. This program will support the HEOA and the University’s six-year plan. SCPS continues to offer noncredit, customized education programs and professional training at its seven regional outreach centers, including its center at the Southwest Virginia Higher Education Center. Furthermore, SCPS is continuing its strategic partnership with China to provide customized professional development programs for visiting higher education faculty and working professionals. 2014-15 Operating Budget SCPS’s primary revenue source is the tuition and fees generated by its regional outreach centers. The School has a hybrid budget model, with a portion of funds allocated from the University and a portion directly related to tuition revenues generated, as governed by a revenue-sharing agreement that has been in place since 1998. Under the agreement, SCPS shares in 90 percent of revenues collected in excess of budget and also returns to the University 90 percent of any revenue shortfall. Approximately 98 percent of the School’s operating budget is funded from tuition and state general funds. One percent of the operating budget is funded from local sales and services, with the remainder from grants and contracts, private funds, and auxiliary activities.
MAJ
OR
BU
DG
ET U
NIT
OVE
RVI
EWS
59

SCPS’s 2014-15 operating budget (see the following page) totals $13.1 million, of which approximately 77 percent relates to faculty and staff compensation. SCPS has unique costs due to its statewide operation, which include lease payments for regional outreach centers and travel costs to provide services at each of the seven centers. Primary spending initiatives for 2014-15 represent the direct educational costs of SCPS programs and the supporting administrative costs for these programs and the School. The 2014-15 budget includes additional resources to support outreach staff; enrollment growth in the BIS degree program; additional resources to grow Business and Professional Development academic programs; and development of online versions of current courses in order to provide additional opportunities for adult learners across the entire state. These additional investments are critical to fund SCPS’s strategic priorities and to expand SCPS’s academic portfolio. The budget reflects support to the implementation of the BPHM in partnership between the UVA Medical Center, PVCC, and other community colleges throughout the Commonwealth. Funding will be allocated to the target budgets for compensation adjustments as authorized by the state or the Board of Visitors. SCPS anticipates up to $457,000 of advertising and media expenses will be paid from non-recurring funds. Capital Plan SCPS currently does not have any capital projects on the Major Capital Projects Plan. The School maintains a reserve associated with its satellite transmission auxiliary; this reserve has been established as a replacement fund for the future maintenance and/or replacement of satellite technology. The operating reserve for the satellite transmission auxiliary is projected to have a balance at June 30, 2014 of $1,000,000, which exceeds the requirement of the
Board of Visitors Capital and Operating Reserves Policy.
MAJ
OR
BU
DG
ET U
NIT
OVE
RVI
EWS
60

University of Virginia - MBU SummaryExec Level: R1380 VP: PV-VP/Provost, Mbu Level: R1915 MBU: CP-School of Cont/Prof Studies
1
Tui on and GFAppropria on
FTE Amount
2
Grants & Contracts,F&A
FTE Amount
3
Private Unrestricted
FTE Amount
4
Private Restricted
FTE Amount
5
Local Sales, Services,Other
FTE Amount
6
Auxiliary
FTE Amount Total ‐ FTE Total ‐ Amount
FY CTCS Category
2014‐R Faculty Salaries and benefitsStaff Salaries and benefitsWages and benefitsGTA/GRA
Subtotal
OTPS
Financial Aid
Recoveries
Subtotal
MBU Totals
2015‐O Faculty Salaries and benefitsStaff Salaries and benefitsWages and benefitsGTA/GRA
Subtotal
OTPS
Financial Aid
Recoveries
Subtotal
MBU Totals
22.1 2,942,407 0.2 9,981 ‐ ‐ ‐ ‐ 1.0 116,060 ‐ ‐ 23.3 3,068,448
65.5 4,732,898 0.2 10,519 ‐ ‐ ‐ ‐ 1.6 102,422 0.3 18,516 67.4 4,864,355
‐ 2,768,937 ‐ 24,382 ‐ ‐ ‐ ‐ ‐ 341,070 ‐ ‐ ‐ 3,134,389
‐ 1,400 ‐ ‐ ‐ ‐ ‐ ‐ ‐ ‐ ‐ ‐ ‐ 1,400
87.6 10,445,642 0.4 44,882 2.6 559,552 0.3 18,516 90.8 11,068,592
‐ 4,980,567 ‐ 73,469 ‐ 74,038 ‐ 700 ‐ 135,524 ‐ 38,271 ‐ 5,302,569
‐ 79,518 ‐ ‐ ‐ ‐ ‐ 82,600 ‐ ‐ ‐ ‐ ‐ 162,118
‐ ‐650,089 ‐ ‐ ‐ ‐ ‐ ‐ ‐ ‐45,000 ‐ ‐7,000 ‐ ‐702,089
4,409,996 73,469 74,038 83,300 90,524 31,271 4,762,598
87.6 14,855,638 0.4 118,351 74,038 83,300 2.6 650,076 0.3 49,787 90.8 15,831,190
26.2 3,127,391 ‐ ‐ ‐ ‐ ‐ ‐ 0.1 6,870 ‐ ‐ 26.2 3,134,261
66.2 4,752,320 ‐ ‐ ‐ ‐ ‐ ‐ 0.4 22,354 0.5 42,272 67.1 4,816,946
‐ 2,134,640 ‐ 39,220 ‐ ‐ ‐ ‐ ‐ 25,440 ‐ ‐ ‐ 2,199,300
‐ 15,550 ‐ ‐ ‐ ‐ ‐ ‐ ‐ ‐ ‐ ‐ ‐ 15,550
92.4 10,029,901 39,220 0.5 54,663 0.5 42,272 93.4 10,166,056
‐ 3,101,447 ‐ 30,501 ‐ ‐ ‐ 1,000 ‐ 102,550 ‐ 38,270 ‐ 3,273,768
‐ 79,518 ‐ ‐ ‐ ‐ ‐ 67,000 ‐ ‐ ‐ ‐ ‐ 146,518
‐ ‐408,769 ‐ ‐ ‐ ‐ ‐ ‐ ‐ ‐45,000 ‐ ‐7,000 ‐ ‐460,769
2,772,196 30,501 68,000 57,550 31,270 2,959,517
92.4 12,802,097 69,721 68,000 0.5 112,213 0.5 73,542 93.4 13,125,573
61
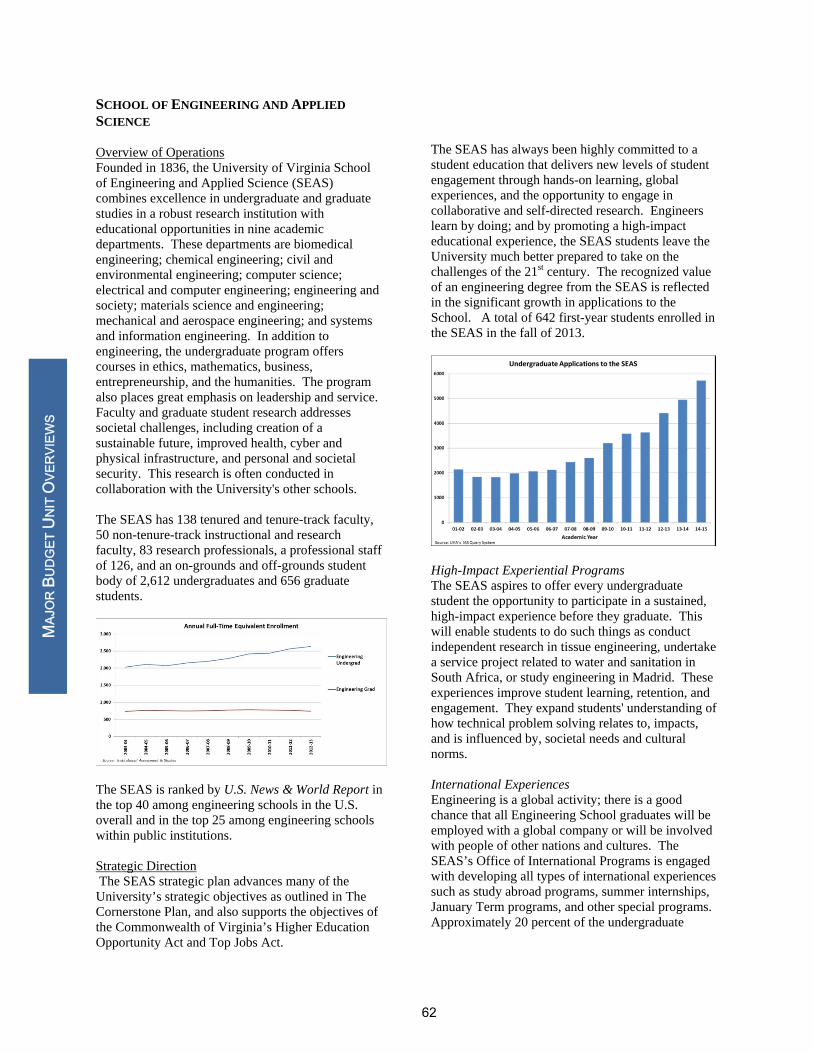
SCHOOL OF ENGINEERING AND APPLIED
SCIENCE Overview of Operations Founded in 1836, the University of Virginia School of Engineering and Applied Science (SEAS) combines excellence in undergraduate and graduate studies in a robust research institution with educational opportunities in nine academic departments. These departments are biomedical engineering; chemical engineering; civil and environmental engineering; computer science; electrical and computer engineering; engineering and society; materials science and engineering; mechanical and aerospace engineering; and systems and information engineering. In addition to engineering, the undergraduate program offers courses in ethics, mathematics, business, entrepreneurship, and the humanities. The program also places great emphasis on leadership and service. Faculty and graduate student research addresses societal challenges, including creation of a sustainable future, improved health, cyber and physical infrastructure, and personal and societal security. This research is often conducted in collaboration with the University's other schools. The SEAS has 138 tenured and tenure-track faculty, 50 non-tenure-track instructional and research faculty, 83 research professionals, a professional staff of 126, and an on-grounds and off-grounds student body of 2,612 undergraduates and 656 graduate students.
The SEAS is ranked by U.S. News & World Report in the top 40 among engineering schools in the U.S. overall and in the top 25 among engineering schools within public institutions. Strategic Direction The SEAS strategic plan advances many of the University’s strategic objectives as outlined in The Cornerstone Plan, and also supports the objectives of the Commonwealth of Virginia’s Higher Education Opportunity Act and Top Jobs Act.
The SEAS has always been highly committed to a student education that delivers new levels of student engagement through hands-on learning, global experiences, and the opportunity to engage in collaborative and self-directed research. Engineers learn by doing; and by promoting a high-impact educational experience, the SEAS students leave the University much better prepared to take on the challenges of the 21st century. The recognized value of an engineering degree from the SEAS is reflected in the significant growth in applications to the School. A total of 642 first-year students enrolled in the SEAS in the fall of 2013.
High-Impact Experiential Programs The SEAS aspires to offer every undergraduate student the opportunity to participate in a sustained, high-impact experience before they graduate. This will enable students to do such things as conduct independent research in tissue engineering, undertake a service project related to water and sanitation in South Africa, or study engineering in Madrid. These experiences improve student learning, retention, and engagement. They expand students' understanding of how technical problem solving relates to, impacts, and is influenced by, societal needs and cultural norms. International Experiences Engineering is a global activity; there is a good chance that all Engineering School graduates will be employed with a global company or will be involved with people of other nations and cultures. The SEAS’s Office of International Programs is engaged with developing all types of international experiences such as study abroad programs, summer internships, January Term programs, and other special programs. Approximately 20 percent of the undergraduate
MAJ
OR
BU
DG
ET U
NIT
OVE
RVI
EWS
62
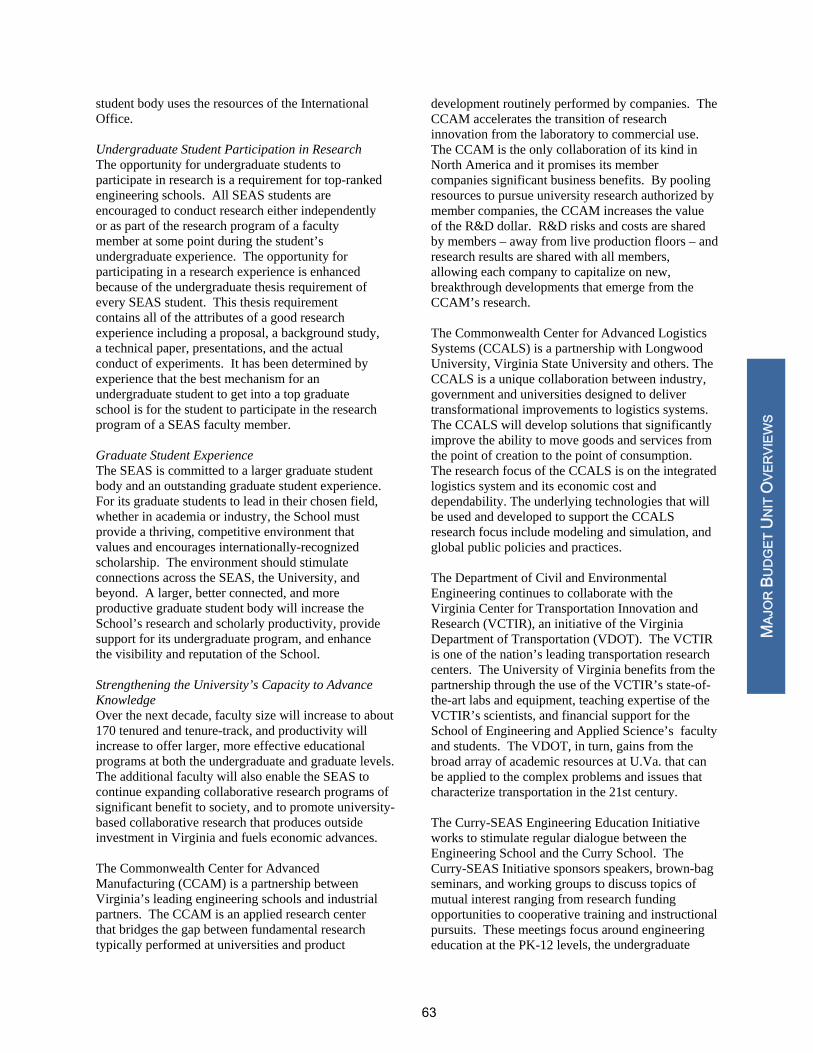
student body uses the resources of the International Office. Undergraduate Student Participation in Research The opportunity for undergraduate students to participate in research is a requirement for top-ranked engineering schools. All SEAS students are encouraged to conduct research either independently or as part of the research program of a faculty member at some point during the student’s undergraduate experience. The opportunity for participating in a research experience is enhanced because of the undergraduate thesis requirement of every SEAS student. This thesis requirement contains all of the attributes of a good research experience including a proposal, a background study, a technical paper, presentations, and the actual conduct of experiments. It has been determined by experience that the best mechanism for an undergraduate student to get into a top graduate school is for the student to participate in the research program of a SEAS faculty member. Graduate Student Experience The SEAS is committed to a larger graduate student body and an outstanding graduate student experience. For its graduate students to lead in their chosen field, whether in academia or industry, the School must provide a thriving, competitive environment that values and encourages internationally-recognized scholarship. The environment should stimulate connections across the SEAS, the University, and beyond. A larger, better connected, and more productive graduate student body will increase the School’s research and scholarly productivity, provide support for its undergraduate program, and enhance the visibility and reputation of the School. Strengthening the University’s Capacity to Advance Knowledge Over the next decade, faculty size will increase to about 170 tenured and tenure-track, and productivity will increase to offer larger, more effective educational programs at both the undergraduate and graduate levels. The additional faculty will also enable the SEAS to continue expanding collaborative research programs of significant benefit to society, and to promote university-based collaborative research that produces outside investment in Virginia and fuels economic advances. The Commonwealth Center for Advanced Manufacturing (CCAM) is a partnership between Virginia’s leading engineering schools and industrial partners. The CCAM is an applied research center that bridges the gap between fundamental research typically performed at universities and product
development routinely performed by companies. The CCAM accelerates the transition of research innovation from the laboratory to commercial use. The CCAM is the only collaboration of its kind in North America and it promises its member companies significant business benefits. By pooling resources to pursue university research authorized by member companies, the CCAM increases the value of the R&D dollar. R&D risks and costs are shared by members – away from live production floors – and research results are shared with all members, allowing each company to capitalize on new, breakthrough developments that emerge from the CCAM’s research. The Commonwealth Center for Advanced Logistics Systems (CCALS) is a partnership with Longwood University, Virginia State University and others. The CCALS is a unique collaboration between industry, government and universities designed to deliver transformational improvements to logistics systems. The CCALS will develop solutions that significantly improve the ability to move goods and services from the point of creation to the point of consumption. The research focus of the CCALS is on the integrated logistics system and its economic cost and dependability. The underlying technologies that will be used and developed to support the CCALS research focus include modeling and simulation, and global public policies and practices. The Department of Civil and Environmental Engineering continues to collaborate with the Virginia Center for Transportation Innovation and Research (VCTIR), an initiative of the Virginia Department of Transportation (VDOT). The VCTIR is one of the nation’s leading transportation research centers. The University of Virginia benefits from the partnership through the use of the VCTIR’s state-of-the-art labs and equipment, teaching expertise of the VCTIR’s scientists, and financial support for the School of Engineering and Applied Science’s faculty and students. The VDOT, in turn, gains from the broad array of academic resources at U.Va. that can be applied to the complex problems and issues that characterize transportation in the 21st century. The Curry-SEAS Engineering Education Initiative works to stimulate regular dialogue between the Engineering School and the Curry School. The Curry-SEAS Initiative sponsors speakers, brown-bag seminars, and working groups to discuss topics of mutual interest ranging from research funding opportunities to cooperative training and instructional pursuits. These meetings focus around engineering education at the PK-12 levels, the undergraduate
MAJ
OR
BU
DG
ET U
NIT
OVE
RVI
EWS
63

experience, and informal and continuing educational contexts. The Department of Biomedical Engineering was established as a joint program between the School of Medicine and the School of Engineering and Applied Science. The department is home to a Wallace H. Coulter Foundation Translational Partnership Award, which draws on the joint strengths of the School of Engineering, School of Medicine, Darden School of Business, and Health Sciences Center around engineering education at the PK-12 levels, the undergraduate experience, and informal and continuing educational contexts. 2014-15 Operating Budget The SEAS is funded through a traditional centralized budget target and self-generated grants, contracts, and private resources. For 2014-15, 45 percent of the School’s operating budget is funded from grants, contracts, and F&A distributions. Approximately 46 percent is provided from tuition and state general funds, while private funds (endowment distribution, gifts, and funds transferred from the Engineering Foundation) represent 8 percent of the budget.
Funding nearly half of the School’s operations, grants and contracts, along with the accompanying return of F&A cost recoveries, are a critical source. The following graphs demonstrate grant and F&A support to the SEAS, as well as the diversity of sponsors.
The School’s 2014-15 operating budget (see page 66) is $93.1 million; the primary spending initiatives are faculty compensation (41 percent), GTA/ GRA stipends and graduate fellowship support (18 percent), and staff salaries and wages (13 percent). The School’s 2014-15 operating budget includes an allocation of $1,326,716 related to fall 2014 enrollment growth. The School’s budget also includes an allocation of $318,000 to support the hiring of two new faculty, which was committed as a part of the dean’s re-appointment. Funding will be allocated to the target budgets for compensation adjustments as authorized by the state or the Board of Visitors. Recruiting and retaining faculty will be a continued emphasis, in compensation as well as start-up packages. The below graph demonstrates the average SEAS faculty salary as compared to the 60th and 75th percentile of AAU peers.
MAJ
OR
BU
DG
ET U
NIT
OVE
RVI
EWS
64
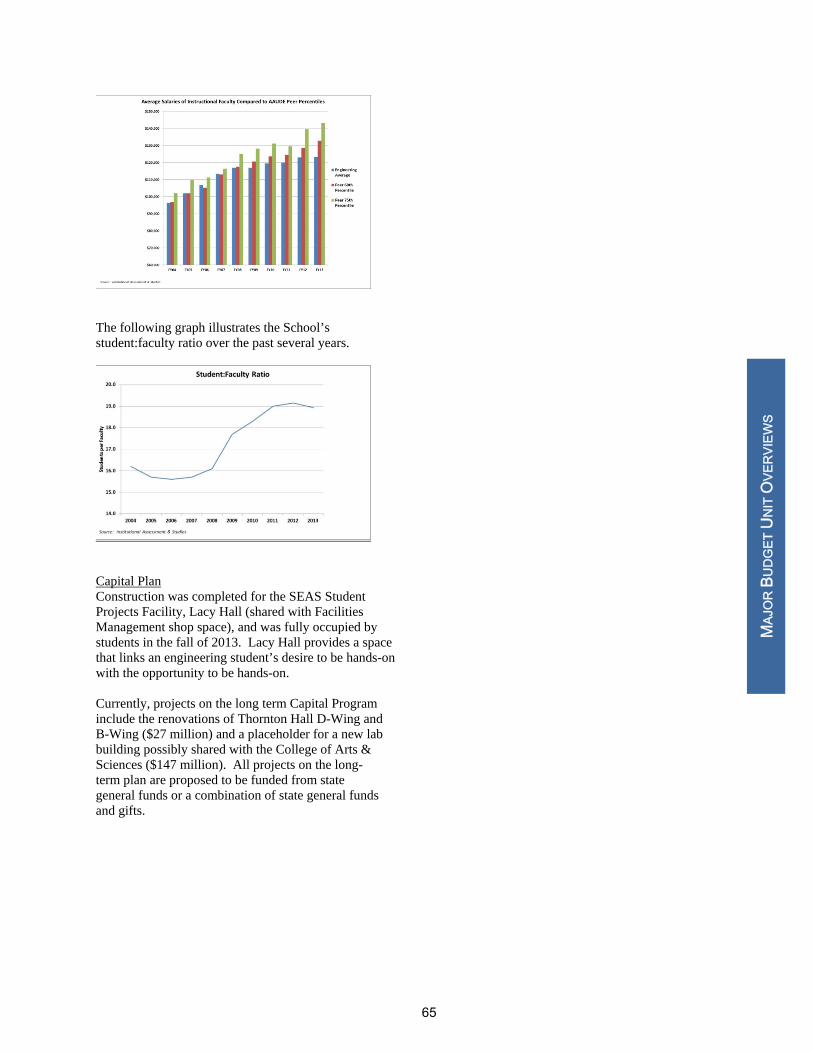
The following graph illustrates the School’s student:faculty ratio over the past several years.
Capital Plan Construction was completed for the SEAS Student Projects Facility, Lacy Hall (shared with Facilities Management shop space), and was fully occupied by students in the fall of 2013. Lacy Hall provides a space that links an engineering student’s desire to be hands-on with the opportunity to be hands-on. Currently, projects on the long term Capital Program include the renovations of Thornton Hall D-Wing and B-Wing ($27 million) and a placeholder for a new lab building possibly shared with the College of Arts & Sciences ($147 million). All projects on the long-term plan are proposed to be funded from state general funds or a combination of state general funds and gifts.
MAJ
OR
BU
DG
ET U
NIT
OVE
RVI
EWS
65
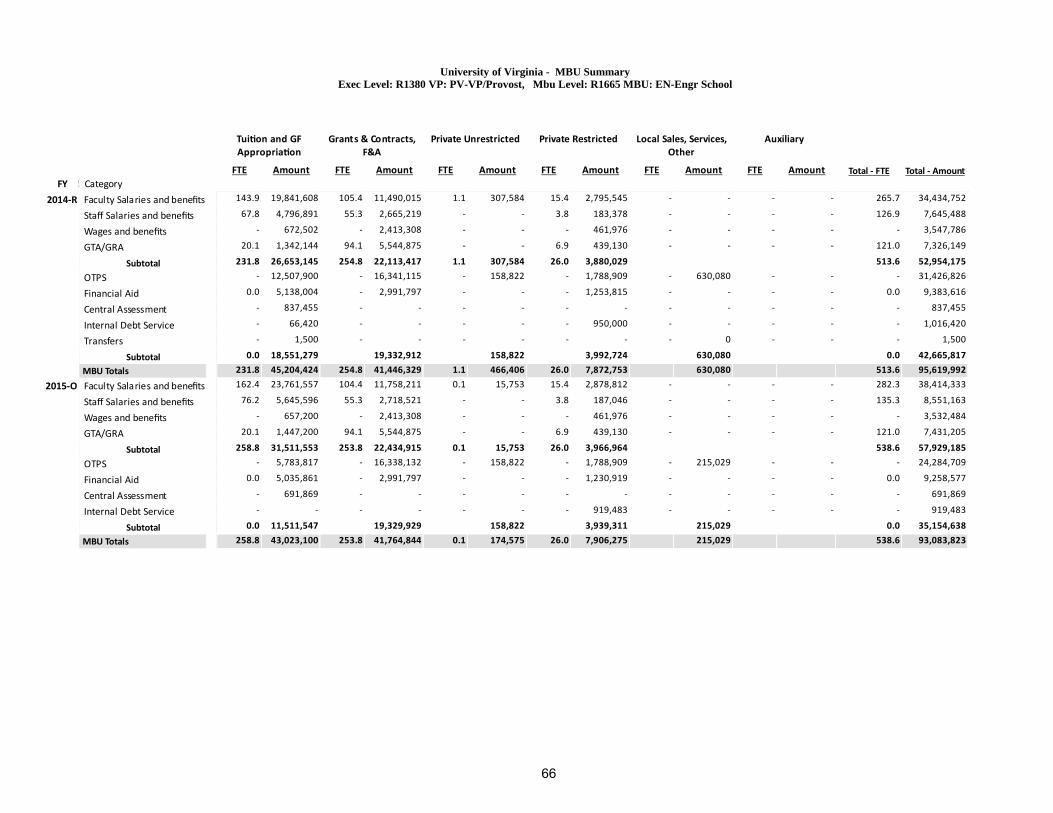
University of Virginia - MBU SummaryExec Level: R1380 VP: PV-VP/Provost, Mbu Level: R1665 MBU: EN-Engr School
1
Tui on and GFAppropria on
FTE Amount
2
Grants & Contracts,F&A
FTE Amount
3
Private Unrestricted
FTE Amount
4
Private Restricted
FTE Amount
5
Local Sales, Services,Other
FTE Amount
6
Auxiliary
FTE Amount Total ‐ FTE Total ‐ Amount
FY CTCS Category
2014‐R Faculty Salaries and benefitsStaff Salaries and benefitsWages and benefitsGTA/GRA
Subtotal
OTPS
Financial Aid
Central Assessment
Internal Debt Service
Transfers
Subtotal
MBU Totals
2015‐O Faculty Salaries and benefitsStaff Salaries and benefitsWages and benefitsGTA/GRA
Subtotal
OTPS
Financial Aid
Central Assessment
Internal Debt Service
Subtotal
MBU Totals
143.9 19,841,608 105.4 11,490,015 1.1 307,584 15.4 2,795,545 ‐ ‐ ‐ ‐ 265.7 34,434,752
67.8 4,796,891 55.3 2,665,219 ‐ ‐ 3.8 183,378 ‐ ‐ ‐ ‐ 126.9 7,645,488
‐ 672,502 ‐ 2,413,308 ‐ ‐ ‐ 461,976 ‐ ‐ ‐ ‐ ‐ 3,547,786
20.1 1,342,144 94.1 5,544,875 ‐ ‐ 6.9 439,130 ‐ ‐ ‐ ‐ 121.0 7,326,149
231.8 26,653,145 254.8 22,113,417 1.1 307,584 26.0 3,880,029 513.6 52,954,175
‐ 12,507,900 ‐ 16,341,115 ‐ 158,822 ‐ 1,788,909 ‐ 630,080 ‐ ‐ ‐ 31,426,826
0.0 5,138,004 ‐ 2,991,797 ‐ ‐ ‐ 1,253,815 ‐ ‐ ‐ ‐ 0.0 9,383,616
‐ 837,455 ‐ ‐ ‐ ‐ ‐ ‐ ‐ ‐ ‐ ‐ ‐ 837,455
‐ 66,420 ‐ ‐ ‐ ‐ ‐ 950,000 ‐ ‐ ‐ ‐ ‐ 1,016,420
‐ 1,500 ‐ ‐ ‐ ‐ ‐ ‐ ‐ 0 ‐ ‐ ‐ 1,500
0.0 18,551,279 19,332,912 158,822 3,992,724 630,080 0.0 42,665,817
231.8 45,204,424 254.8 41,446,329 1.1 466,406 26.0 7,872,753 630,080 513.6 95,619,992
162.4 23,761,557 104.4 11,758,211 0.1 15,753 15.4 2,878,812 ‐ ‐ ‐ ‐ 282.3 38,414,333
76.2 5,645,596 55.3 2,718,521 ‐ ‐ 3.8 187,046 ‐ ‐ ‐ ‐ 135.3 8,551,163
‐ 657,200 ‐ 2,413,308 ‐ ‐ ‐ 461,976 ‐ ‐ ‐ ‐ ‐ 3,532,484
20.1 1,447,200 94.1 5,544,875 ‐ ‐ 6.9 439,130 ‐ ‐ ‐ ‐ 121.0 7,431,205
258.8 31,511,553 253.8 22,434,915 0.1 15,753 26.0 3,966,964 538.6 57,929,185
‐ 5,783,817 ‐ 16,338,132 ‐ 158,822 ‐ 1,788,909 ‐ 215,029 ‐ ‐ ‐ 24,284,709
0.0 5,035,861 ‐ 2,991,797 ‐ ‐ ‐ 1,230,919 ‐ ‐ ‐ ‐ 0.0 9,258,577
‐ 691,869 ‐ ‐ ‐ ‐ ‐ ‐ ‐ ‐ ‐ ‐ ‐ 691,869
‐ ‐ ‐ ‐ ‐ ‐ ‐ 919,483 ‐ ‐ ‐ ‐ ‐ 919,483
0.0 11,511,547 19,329,929 158,822 3,939,311 215,029 0.0 35,154,638
258.8 43,023,100 253.8 41,764,844 0.1 174,575 26.0 7,906,275 215,029 538.6 93,083,823
66

SCHOOL OF LAW Overview of Operations Founded by Thomas Jefferson in 1819, the University of Virginia School of Law is a world-renowned training ground for distinguished lawyers and public servants. Consistently ranked among the top law schools in the nation, the Law School enrolls approximately 1,050 students in a three-year J.D. program, approximately 55 students in a one-year L.L.M. program, and approximately 5 students in an S.J.D. program. The following graph shows the Law School’s enrollment trend for the J.D. program.
The Law School instills in its students a commitment to leadership, integrity, and community service. The Law School is known for its collegial environment that bonds students and faculty, and student satisfaction is consistently cited as among the highest in American law schools. At the University, law students share their experiences in a cooperative spirit, both in and out of the classroom, and build a network that lasts well beyond their time at the University. Strategic Direction The Law School’s strategic goals for 2014-15 include: 1. Maintaining the quality and diversity of its
student body while managing the challenges presented by a substantial nation-wide decline in applications to law schools;
2. Continuing to improve faculty quality;
3. Continuing to refine and improve the placement services provided to students through the Career Services and Public Service offices; and
4. Managing leadership transitions in key student services offices.
2014-15 Operating Budget Financial self-sufficiency was first endorsed by the Board of Visitors in 1995 and formalized by memorandum of understanding in 2002. As a financially self-sufficient school, the Law School retains its tuition revenues, receives a small subsidy for each in-state student (the University and the Law School split the cost of the differential between in-state and out-of-state tuition), and is responsible for generating sufficient revenues to cover all of its operating and capital expenditures. Under self-sufficiency, other than the in-state student subsidy ($622,000 in the 2014-15 budget), the only central allocations to the Law School are $105,000 from state general funds for financial aid to in-state students and $130,000 from private funds for financial aid. Approximately 89 percent of the School’s operating budget is funded from tuition, 10 percent from gift and endowment distributions (including transfers from the Law School Foundation), and the remainder from grants and contracts and other sources.
The Law School’s net tuition revenue is projected to decline by 1.3 percent in 2014-15. Tuition and fees for non-residents will increase by 3.6 percent; the increase for returning residents will be 4.0 percent. These are the second-lowest increases in almost 20 years. Tuition and fees for new resident students will increase by 8.1 percent. Total enrollment is projected to decline slightly. The Law School’s 2014-15 operating budget (see page 69) is $62.9 million, with approximately 60 percent spent on faculty and staff compensation. The Law School is pleased with the progress that has been made on improving its student:faculty ratio, so the focus now is on maintaining, rather than increasing, the relative size of the faculty.
MAJ
OR
BU
DG
ET U
NIT
OVE
RVI
EWS
67

The following graph shows the average Law School salary as compared to the 60th and 75th percentile of all AAU peers, which is a broader peer group than the Law School uses internally to measure the competitiveness of its compensation.
The Law School continues to face stiff competition from its smaller group of top ten peer institutions for first-rate faculty. Pursuant to the President’s plan, the Law School will be aggressive in recruiting and retaining talented faculty in the coming years. Student financial aid and scholarships comprise approximately 18 percent of the 2014-15 operating budget. Under the self-sufficiency agreement, the Law School is directly responsible for building maintenance and utilities. In addition, the School returns 10 percent of tuition and fees ($5.4 million in the 2014-15 budget) to the University to cover overhead expenses. Remaining budgeted expenses include library collections, equipment, and travel. Capital Plan The Law School has no projects on the Major Capital Projects Plan.
As a self-supporting school, the Law School is required by the Board of Visitors Capital and Operating Reserves Policy to have operating reserves equivalent to three months of operating expenses. Per the same policy, the Law School must demonstrate annual capital expenditures or contributions to capital reserves of at least 1.5 percent of replacement value of buildings and equipment. The Law School meets both requirements.
MAJ
OR
BU
DG
ET U
NIT
OVE
RVI
EWS
68
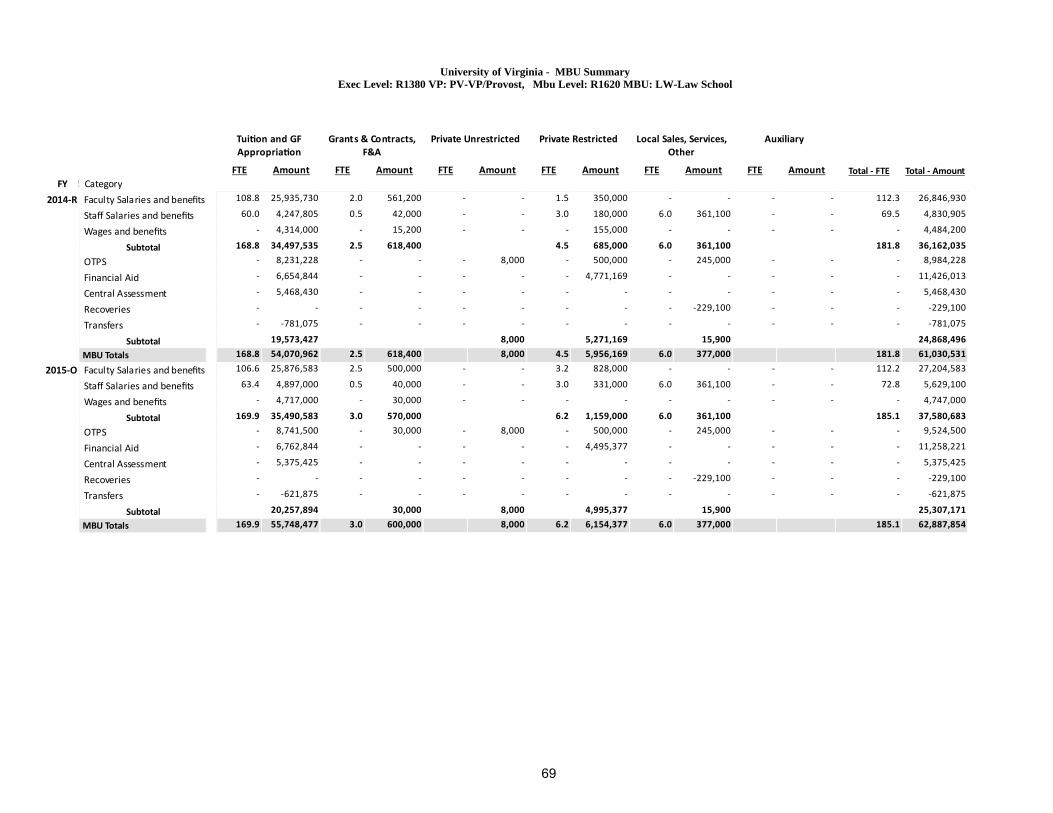
University of Virginia - MBU SummaryExec Level: R1380 VP: PV-VP/Provost, Mbu Level: R1620 MBU: LW-Law School
1
Tui on and GFAppropria on
FTE Amount
2
Grants & Contracts,F&A
FTE Amount
3
Private Unrestricted
FTE Amount
4
Private Restricted
FTE Amount
5
Local Sales, Services,Other
FTE Amount
6
Auxiliary
FTE Amount Total ‐ FTE Total ‐ Amount
FY CTCS Category
2014‐R Faculty Salaries and benefitsStaff Salaries and benefitsWages and benefits
Subtotal
OTPS
Financial Aid
Central Assessment
Recoveries
Transfers
Subtotal
MBU Totals
2015‐O Faculty Salaries and benefitsStaff Salaries and benefitsWages and benefits
Subtotal
OTPS
Financial Aid
Central Assessment
Recoveries
Transfers
Subtotal
MBU Totals
108.8 25,935,730 2.0 561,200 ‐ ‐ 1.5 350,000 ‐ ‐ ‐ ‐ 112.3 26,846,930
60.0 4,247,805 0.5 42,000 ‐ ‐ 3.0 180,000 6.0 361,100 ‐ ‐ 69.5 4,830,905
‐ 4,314,000 ‐ 15,200 ‐ ‐ ‐ 155,000 ‐ ‐ ‐ ‐ ‐ 4,484,200
168.8 34,497,535 2.5 618,400 4.5 685,000 6.0 361,100 181.8 36,162,035
‐ 8,231,228 ‐ ‐ ‐ 8,000 ‐ 500,000 ‐ 245,000 ‐ ‐ ‐ 8,984,228
‐ 6,654,844 ‐ ‐ ‐ ‐ ‐ 4,771,169 ‐ ‐ ‐ ‐ ‐ 11,426,013
‐ 5,468,430 ‐ ‐ ‐ ‐ ‐ ‐ ‐ ‐ ‐ ‐ ‐ 5,468,430
‐ ‐ ‐ ‐ ‐ ‐ ‐ ‐ ‐ ‐229,100 ‐ ‐ ‐ ‐229,100
‐ ‐781,075 ‐ ‐ ‐ ‐ ‐ ‐ ‐ ‐ ‐ ‐ ‐ ‐781,075
19,573,427 8,000 5,271,169 15,900 24,868,496
168.8 54,070,962 2.5 618,400 8,000 4.5 5,956,169 6.0 377,000 181.8 61,030,531
106.6 25,876,583 2.5 500,000 ‐ ‐ 3.2 828,000 ‐ ‐ ‐ ‐ 112.2 27,204,583
63.4 4,897,000 0.5 40,000 ‐ ‐ 3.0 331,000 6.0 361,100 ‐ ‐ 72.8 5,629,100
‐ 4,717,000 ‐ 30,000 ‐ ‐ ‐ ‐ ‐ ‐ ‐ ‐ ‐ 4,747,000
169.9 35,490,583 3.0 570,000 6.2 1,159,000 6.0 361,100 185.1 37,580,683
‐ 8,741,500 ‐ 30,000 ‐ 8,000 ‐ 500,000 ‐ 245,000 ‐ ‐ ‐ 9,524,500
‐ 6,762,844 ‐ ‐ ‐ ‐ ‐ 4,495,377 ‐ ‐ ‐ ‐ ‐ 11,258,221
‐ 5,375,425 ‐ ‐ ‐ ‐ ‐ ‐ ‐ ‐ ‐ ‐ ‐ 5,375,425
‐ ‐ ‐ ‐ ‐ ‐ ‐ ‐ ‐ ‐229,100 ‐ ‐ ‐ ‐229,100
‐ ‐621,875 ‐ ‐ ‐ ‐ ‐ ‐ ‐ ‐ ‐ ‐ ‐ ‐621,875
20,257,894 30,000 8,000 4,995,377 15,900 25,307,171
169.9 55,748,477 3.0 600,000 8,000 6.2 6,154,377 6.0 377,000 185.1 62,887,854
69

SCHOOL OF MEDICINE Overview of Operations The School of Medicine (SOM), the tenth medical school to be established in the United States, was authorized by the Board at its first meeting in 1819. The SOM was established in 1824 as one of the University's original eight schools and opened in March 1825. The first degree offered at the University was the Doctor of Medicine in 1828. The School’s primary mission mirrors that of the University – to help people achieve healthy productive lives and to advance knowledge through education, research, and public service/patient care in the medical sciences. Education The SOM is changing how medicine and science are learned. Its innovative undergraduate medical education Next Generation "Cells to Society” curriculum eschews the traditional split of basic and clinical sciences and, instead, employs an organ system learning experience in which students learn science in the context of its clinical application. The approach uses the best evidenced-based models for medical education to foster student learning. The curriculum contains a careful balance of active and experiential activities, clinical cases, problem-based learning, small group and team-based experiences, hands-on laboratories, self-directed learning, lectures, and hospital- and community-based clinical experiences. The SOM has established a developmental approach to student assessment using validated tests of student knowledge and skills to ensure readiness for graduation and residency education. The graduate school curriculum for PhD students similarly has been revamped to a more nimble and modular approach to classes and increasing opportunities to hone fundamental skills of oral and written presentations, primary data evaluation, and critique. The school’s primary PhD program is the Biomedical Sciences (BIMS) Graduate Program, an interdisciplinary graduate program designed to train PhD candidates in becoming the next generation of scientific leaders. The first-year curriculum launches students into a “culture of learning” through highly interactive and problem-based teaching modalities. In parallel, students are offered a broad spectrum of research opportunities from which they select a thesis advisor and area of study. Throughout their tenure in the BIMS program, students are exposed to state-of-the-art technologies and collaborative science as active members of research teams. Upon completion of their degree, graduates choose traditional
postdoctoral positions in academia or industry, teach, or pursue careers in government. The following graph shows the enrollment trend for medical students as well as basic medical sciences graduate students.
The Department of Public Health Sciences is the administrative and academic home of the Master in Public Health and the Master in Clinical Research degree programs granted through the University's Graduate School of Arts and Sciences. The department also offers a Graduate Certificate in Public Health Sciences and an undergraduate degree Global Public Health Major. The Master in Public Health program is a nationally accredited degree program that provides graduate public health professional training in quantitative and qualitative research methodologies; health policy, law, and ethics; and translational and community-engagement strategies. The program focuses on the competencies professionals need to improve the health of individuals and populations, and has two tracks, "Health Policy, Law. & Ethics," and "Research in Practice." The individualized and interdisciplinary curriculum includes courses in the five core areas of public health and a wide range of interdisciplinary courses. Students complete a minimum of 42 credit hours of course work: core courses, courses in a chosen track, a field placement in a community health setting, and a culminating experience project. The following dual degrees options are available: MD-MPH, JD-MPH, MBA-MPH and MPP-MPH. Graduates are prepared for a variety of positions in health care and research, community health, and health policy. The Master of Science Program in Clinical Research (MS-CR) in the Department of Public Health Sciences is an interdisciplinary graduate degree program that provides training to health and medical professionals who desire and need quantitative and
MAJ
OR
BU
DG
ET U
NIT
OVE
RVI
EWS
70

analytic skills in patient-oriented and translational research, as well as more traditional clinical investigation. Using an interdisciplinary blend of biostatistics, epidemiology, clinical trial design, medical informatics, and health services research, the MS-CR program equips clinical researchers with the statistical and data management tools needed to conduct translational clinical and comparative effectiveness studies in medical care. Another central activity of the school is resident education, also known as graduate medical education. This is the continued training of future physicians who have graduated from medical school but have not yet achieved independence within a specialty. The Health System has approximately 720 physician residents and fellows participating in 100 training programs, plus approximately 60 non-physician residents (e.g., chaplains, dentists). The Office of Continuing Medical Education of the SOM/Health System is an ACCME (Accreditation Council for Continuing Medical Education) accredited sponsor of continuing medical education (CME) for physicians and other health professionals. U.Va.-sponsored CME programs include specialty and sub-specialty departmental conferences; special seminars; international, national, and regional meetings; activities developed with other organizations and specialty societies; mini-fellowship opportunities; and enduring materials (self-paced learning). Through the CME program and the Center for Telehealth, U.Va. offers access to educational and clinical resources for physicians, other health professionals, and patients, regardless of geographic location. Access to knowledge, both traditional and in increasingly new forms and technologies, is essential for the research, education, and patient care missions of the Health System. The Claude Moore Health Sciences Library (HSL) monitors and seeks out potentially important trends and makes them available to the community through education, hands-on experience, or general awareness. Information about changing publication impact metrics, access to innovative education material, and data management resources are examples of expertise that librarians provide for the Health System. By forming collaborative relationships, such as providing a home for the Bioinformatics Core, the HSL becomes a nexus of knowledge-based services. The HSL plays a role in stimulating collaboration by providing useful spaces, seating, and equipment that offer a fruitful and attractive environment for reflection and interaction.
Patient Care The SOM, with its partners in the Health System, provides excellence, innovation, and superlative quality in the care of patients, the training of health professionals, and the creation and sharing of health knowledge. SOM faculty are innovators in offering new treatments to patients, bringing research breakthroughs to patient care, harnessing new technologies to reach out to underserved populations, and restructuring clinical approaches and facilities to better meet patients’ needs. Revenue from the clinical mission provides necessary support for the education and research missions – which, in turn, provide the physicians with knowledge and new and more effective treatments in the clinical arena. Research Research at the SOM is based on a collaborative model and built around multidisciplinary teams of basic and clinical scientists who are organized to answer disease- or organ-based problems. This approach builds upon the strength of the basic science departments, three of which rank among the top 10 in the nation in National Institutes of Health funding, and on several areas of research excellence within the clinical departments. The School ranks #26 in the Spring 2014 U.S. News & World Report annual rankings of research medical schools.
Discoveries being made in these laboratories fuel a translational research effort aimed at bridging the gap between bench and bedside and translating promising laboratory findings rapidly into clinical applications for patients in the Medical Center and wherever medicine is practiced. As an example of this effort, Dr. Christopher Kramer is studying how to develop better risk predictors for hypertrophic cardiomyopathy with the long-term goal of enabling more focused therapies. He is co-principal investigator of a consortium of institutions, led by
MAJ
OR
BU
DG
ET U
NIT
OVE
RVI
EWS
71

U.Va., which has received a $14.4 million NIH grant for this research. Another example is the alliance formed by the Cardiovascular Research Center with pharmaceutical company AstraZeneca to promote novel discovery research and the translation of important findings to humans. AstraZeneca helps to fund U.V. scientists doing key research related to coronary artery disease, heart failure, diabetic nephropathy, and islet cell health.. Strategic Direction The Decade Plan is a planning effort implemented in 2002 as a collaboration of the SOM, the Medical Center, the University Physician’s Group (UPG), the HSL, and the School of Nursing. It provided the framework for “Move as One,” a consolidated initiative that focuses on Health System-wide collaboration for development and innovation in areas such as patient service, translational research, professionalism in teaching, and service to the community. Under this umbrella, clinical strategic plan has been developed with a focus on advancing the care provided to patients through exceptional medical skill, the most advanced medical technology, and greater access to U.Va. health professionals through community outreach activities and increasing clinical activities on Grounds. The SOM has undertaken a comprehensive academic planning effort with the consulting services of Navigant. The planning process is expected to continue through June 2014 and will link the academic plan to the Health System clinical strategy. Implementation of the plan will begin immediately. In 2013-14, progress was noted in several important areas:
The fourth year of the Next Generation
curriculum was implemented.
A new director of the Cancer Center was hired. Thomas Loughran, Jr., MD, has extensive experience as a researcher and clinician, and he brings an impressive team who will extend the SOM’s capacity in trials, population studies, immunology, and other areas related to curing and treating cancer.
The SOM collaborated with its Health System
partners to launch Well Virginia, an accountable care organization. Well Virginia will emphasize primary care, prevention, and wellness through seamless coordination of care, the timely and accurate sharing of information, and effective transitions of care across the healthcare continuum.
The SOM, Medical Center, and UPG collaborated on a Gallup survey to assess the level of employment engagement. The survey results are leading to positive revisions in the ways in which teams, supervisors, and employees interact.
The SOM, UPG, and Medical Center
collaborated to develop and implement a streamlined clinical faculty hiring process. The new process has been redesigned to increase satisfaction for clinical faculty and staff working to hire them, reduce cycle time from 72 to 25 business days, and reduce defects and rework.
The recently formed SOM Diversity Consortium
has developed a strategic plan and has begun implementing steps to foster a diverse SOM faculty.
The SOM purchased 560 Ray C. Hunt Drive,
which will be the Ivy Clinical and Translational Research Building. The Ivy Building will house the Virginia Center for Translational and Regulatory Sciences, several multidisciplinary research teams, and a clinical research unit.
The Fund for the Future, established in 2007-08 through agreement between the Medical Center and the SOM, has provided a mechanism for the Medical Center to invest directly in the SOM. Actual and planned disbursements from the Fund through the remainder of 2013-14 and current outstanding commitments include:
Anticipated Funding From SOM Funds for the Future (in Millions )
Department of Medicine Block Grant Support ($5M)
$4.90
Cancer Center Director Package ($5.0 Million) $4.60
Microbiology chair package ($6.7 Million) $4.75
Public Health Sciences chair package ($3 Million)
$3.00
Jordan Hall HVAC Renovation & Contingency $24.80
Department of Surgery Chair Renewal $0.70
Radiology Research Infrastructure Support $0.70
Biochemistry Chair Package $0.40
Medical Education Building Debt Service $1.57
Cyclotron Renovations $0.30
Orthopaedics $0.20
Total $45.92
MAJ
OR
BU
DG
ET U
NIT
OVE
RVI
EWS
72
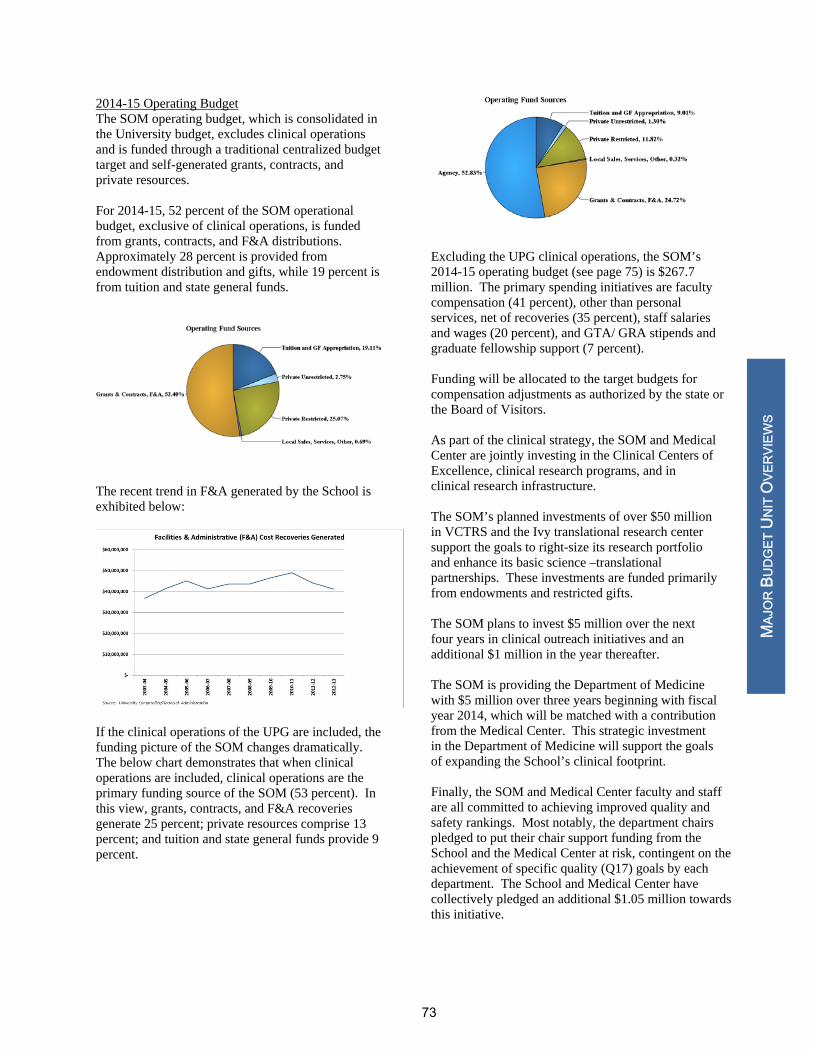
2014-15 Operating Budget The SOM operating budget, which is consolidated in the University budget, excludes clinical operations and is funded through a traditional centralized budget target and self-generated grants, contracts, and private resources. For 2014-15, 52 percent of the SOM operational budget, exclusive of clinical operations, is funded from grants, contracts, and F&A distributions. Approximately 28 percent is provided from endowment distribution and gifts, while 19 percent is from tuition and state general funds.
The recent trend in F&A generated by the School is exhibited below:
If the clinical operations of the UPG are included, the funding picture of the SOM changes dramatically. The below chart demonstrates that when clinical operations are included, clinical operations are the primary funding source of the SOM (53 percent). In this view, grants, contracts, and F&A recoveries generate 25 percent; private resources comprise 13 percent; and tuition and state general funds provide 9 percent.
Excluding the UPG clinical operations, the SOM’s 2014-15 operating budget (see page 75) is $267.7 million. The primary spending initiatives are faculty compensation (41 percent), other than personal services, net of recoveries (35 percent), staff salaries and wages (20 percent), and GTA/ GRA stipends and graduate fellowship support (7 percent). Funding will be allocated to the target budgets for compensation adjustments as authorized by the state or the Board of Visitors. As part of the clinical strategy, the SOM and Medical Center are jointly investing in the Clinical Centers of Excellence, clinical research programs, and in clinical research infrastructure. The SOM’s planned investments of over $50 million in VCTRS and the Ivy translational research center support the goals to right-size its research portfolio and enhance its basic science –translational partnerships. These investments are funded primarily from endowments and restricted gifts. The SOM plans to invest $5 million over the next four years in clinical outreach initiatives and an additional $1 million in the year thereafter. The SOM is providing the Department of Medicine with $5 million over three years beginning with fiscal year 2014, which will be matched with a contribution from the Medical Center. This strategic investment in the Department of Medicine will support the goals of expanding the School’s clinical footprint. Finally, the SOM and Medical Center faculty and staff are all committed to achieving improved quality and safety rankings. Most notably, the department chairs pledged to put their chair support funding from the School and the Medical Center at risk, contingent on the achievement of specific quality (Q17) goals by each department. The School and Medical Center have collectively pledged an additional $1.05 million towards this initiative.
MAJ
OR
BU
DG
ET U
NIT
OVE
RVI
EWS
73

Capital Plan In March 2014 SOM will purchase 560 Ray C. Hunt Drive in the Fontaine Research Park to house the Ivy Translational Research Program. Significant investments are planned during this upcoming fiscal year to convert the space into a premier facility for translational research. These renovations, along with the cost of the purchase, will be funded primarily from a gift from the Ivy Foundation. Additionally, the School continues to commit to renovating and optimizing current space on the primary campus The renovation of the Microbiology lab space in Old Jordan Hall continues and is anticipated to be completed in fiscal year 2014. The School also renovated a portion of the Old Medical School Barringer wing to create permanent space for the Clinical Research Unit and provide the Department of Neurosurgery with updated administrative space. With a strong focus on investing in translational research, the SOM intends for these investments to provide the necessary space to foster translational research and facilitate the shift in its research portfolio towards clinical and translational programs.
MAJ
OR
BU
DG
ET U
NIT
OVE
RVI
EWS
74

University of Virginia - MBU SummaryExec Level: R1380 VP: PV-VP/Provost, Mbu Level: R2485 MBU: MD-School of Medicine
1
Tui on and GFAppropria on
FTE Amount
2
Grants & Contracts,F&A
FTE Amount
3
Private Unrestricted
FTE Amount
4
Private Restricted
FTE Amount
5
Local Sales, Services,Other
FTE Amount
6
Auxiliary
FTE Amount Total ‐ FTE Total ‐ Amount
FY CTCS Category
2014‐R Faculty Salaries and benefitsStaff Salaries and benefitsWages and benefitsGTA/GRA
Subtotal
OTPS
Financial Aid
Recoveries
Internal Debt Service
Transfers
Subtotal
MBU Totals
2015‐O Faculty Salaries and benefitsStaff Salaries and benefitsWages and benefitsGTA/GRA
Subtotal
OTPS
Financial Aid
Recoveries
Internal Debt Service
Transfers
Subtotal
MBU Totals
161.6 29,298,075 291.5 40,371,120 2.1 856,974 229.4 33,919,614 14.0 1,580,524 ‐ ‐ 698.7 106,026,307
151.7 8,657,459 311.9 22,580,016 2.9 214,463 195.6 14,172,201 30.5 1,685,413 ‐ ‐ 692.5 47,309,552
‐ 242,524 ‐ 2,573,627 ‐ 42,711 ‐ 1,854,079 ‐ 24,501 ‐ ‐ ‐ 4,737,442
5.0 57,500 78.6 2,725,400 ‐ ‐ 4.2 244,242 ‐ ‐ ‐ ‐ 87.8 3,027,142
318.3 38,255,558 682.1 68,250,163 4.9 1,114,148 429.3 50,190,136 44.4 3,290,438 1,479.0 161,100,443
0.0 31,684,594 ‐ 62,113,987 0.0 3,076,849 ‐ 15,312,481 ‐ 2,171,022 ‐ ‐ 0.0 114,358,933
‐ 2,347,291 ‐ 5,225,370 ‐ 125,834 ‐ 8,056,304 ‐ 15,853 ‐ ‐ ‐ 15,770,652
‐ ‐18,460,008 ‐ ‐26,895 ‐ ‐ ‐ ‐ ‐ ‐3,242,749 ‐ ‐ ‐ ‐21,729,652
‐ 1,817,230 ‐ 7,984,173 ‐ 2,234,275 ‐ ‐ ‐ ‐ ‐ ‐ ‐ 12,035,678
‐ ‐1,273,322 ‐ ‐ ‐ ‐ ‐ ‐ ‐ ‐ ‐ ‐ ‐ ‐1,273,322
0.0 16,115,785 75,296,635 0.0 5,436,958 23,368,785 ‐1,055,874 0.0 119,162,289
318.3 54,371,343 682.1 143,546,798 4.9 6,551,106 429.3 73,558,921 44.4 2,234,564 1,479.0 280,262,732
222.4 40,286,338 284.7 39,341,428 3.3 1,121,949 164.0 28,315,354 5.8 935,458 ‐ ‐ 680.1 110,000,527
172.9 14,967,749 296.6 21,843,241 4.5 338,375 180.1 13,770,697 12.5 938,677 ‐ ‐ 666.6 51,858,739
‐ 240,851 ‐ 863,554 ‐ 27,939 ‐ 266,426 ‐ 1,264 ‐ ‐ ‐ 1,400,034
5.1 124,053 81.5 2,934,812 ‐ ‐ 10.2 748,524 ‐ ‐ ‐ ‐ 96.8 3,807,389
400.4 55,618,991 662.8 64,983,035 7.8 1,488,263 354.2 43,101,001 18.3 1,875,399 1,443.6 167,066,689
0.0 8,342,792 ‐ 62,118,019 ‐ 3,553,589 ‐ 17,670,366 ‐ 1,028,452 ‐ ‐ 0.0 92,713,218
‐ 3,540,665 ‐ 5,117,535 ‐ 76,800 ‐ 6,318,872 ‐ 1,977 ‐ ‐ ‐ 15,055,849
‐ ‐18,182,630 ‐ ‐ ‐ ‐ ‐ ‐ ‐ ‐1,070,793 ‐ ‐ ‐ ‐19,253,423
‐ 1,817,231 ‐ 8,028,119 ‐ 2,233,900 ‐ ‐ ‐ ‐ ‐ ‐ ‐ 12,079,250
‐ 0 ‐ ‐ ‐ ‐ ‐ ‐ ‐ ‐ ‐ ‐ ‐ 0
0.0 ‐4,481,942 75,263,673 5,864,289 23,989,238 ‐40,364 0.0 100,594,894
400.4 51,137,049 662.8 140,246,708 7.8 7,352,552 354.2 67,090,239 18.3 1,835,035 1,443.6 267,661,583
75

University of Virginia - MBU SummaryExec Level: R0215 VP: HS-EVP for Health Affairs, Mbu Level: <All>
1
Tui on and GFAppropria on
FTE Amount
2
Grants & Contracts,F&A
FTE Amount
3
Private Unrestricted
FTE Amount
4
Private Restricted
FTE Amount
5
Local Sales, Services,Other
FTE Amount
6
Auxiliary
FTE Amount Total ‐ FTE Total ‐ Amount
FY CTCS Category
2014‐R Faculty Salaries and benefitsStaff Salaries and benefitsWages and benefits
Subtotal
OTPS
Recoveries
Subtotal
MBU Totals
2015‐O Faculty Salaries and benefitsStaff Salaries and benefitsWages and benefits
Subtotal
OTPS
Subtotal
MBU Totals
9.3 911,756 2.4 117,302 ‐ ‐ 2.2 180,547 ‐ ‐ ‐ ‐ 13.9 1,209,605
13.2 768,390 2.0 123,985 ‐ ‐ 2.0 123,863 ‐ ‐ ‐ ‐ 17.2 1,016,238
‐ ‐ ‐ 4,026 ‐ ‐ ‐ 14,575 ‐ ‐ ‐ ‐ ‐ 18,601
22.5 1,680,146 4.4 245,313 4.2 318,985 31.0 2,244,444
‐ 450,160 ‐ 745,617 ‐ ‐ ‐ 1,352,847 ‐ 3,100 ‐ ‐ ‐ 2,551,724
‐ ‐ ‐ ‐ ‐ ‐ ‐ ‐ ‐ ‐3,100 ‐ ‐ ‐ ‐3,100
450,160 745,617 1,352,847 0 2,548,624
22.5 2,130,306 4.4 990,930 4.2 1,671,832 0 31.0 4,793,068
8.6 958,695 2.2 166,830 ‐ ‐ 2.2 189,046 ‐ ‐ ‐ ‐ 13.0 1,314,571
14.0 826,265 2.0 112,253 ‐ ‐ 2.0 133,653 ‐ ‐ ‐ ‐ 18.0 1,072,171
‐ ‐ ‐ 16,192 ‐ ‐ ‐ 16,192 ‐ ‐ ‐ ‐ ‐ 32,384
22.6 1,784,960 4.2 295,275 4.2 338,891 31.0 2,419,126
‐ 344,678 ‐ 891,267 0.0 3,000 ‐ 1,091,655 ‐ 3,100 ‐ ‐ 0.0 2,333,700
344,678 891,267 0.0 3,000 1,091,655 3,100 0.0 2,333,700
22.6 2,129,638 4.2 1,186,542 0.0 3,000 4.2 1,430,546 3,100 31.0 4,752,826
76

SCHOOL OF NURSING Overview of Operations The School of Nursing (SON) has a 113-year legacy of nurturing compassionate nurse leaders who excel as independent clinicians and as members of health care teams, and who understand the critical role resilience plays in safe, high quality care. Part of the University of Virginia Health System, which includes the Medical Center, School of Medicine, and the Claude Moore Health Sciences Library, the SON is ranked by U.S. News & World Report among the top two percent of nursing schools in the nation. The School currently enrolls 755 students -- a five percent increase from a year ago -- including 396 undergraduates and 359 graduate students. Programs of undergraduate study include the traditional Bachelor of Science in Nursing (BSN) and Registered Nurse to Bachelor of Science in Nursing (RN to BSN) degrees. The School also offers a variety of Master of Science in Nursing (MSN) degrees, several post-master’s programs, and two doctoral degree programs, the Doctorate of Nursing Practice (DNP) and PhD. A pioneer in establishing novel and responsive curricula, the SON established the Clinical Nurse Leader (CNL) master’s program in 2005 for bachelor’s degree-holding non-nurses, the first such degree in the country and the only program of its kind in Virginia and Washington, D.C., and plans to double this program’s size by 2015, thanks to a transformative $5 million gift. The DNP offers nurses a route to the terminal clinical degree on a variety of tracks, including a MSN to DNP track and a new BSN to DNP track established in 2013. The RN to BSN program – which fortifies the skills and education of practicing nurses with associate’s degrees – will accommodate more students under a 2013 agreement with the Virginia Community College System (VCCS) guaranteeing entry to VCCS-educated nurses. Post-master’s programs are offered in primary care, acute care, psychiatric-mental health, and wound, ostomy, and continence. Two largely online master’s degree tracks include certificates in community and public health leadership and health systems management.
Among the current 114 full- and part-time faculty at the School, there are 22 American Academy of Nursing fellows, eight National Academy Fellows, and 12 endowed professorships that have attracted an internationally recognized group of scholars from a wide cross-section of disciplines. Yet, with a wave of recent and pending retirements, the SON – like many of the nation’s top nursing schools – is increasingly reliant on single-course and adjunct faculty even as it conducts intensive searches for additional tenure-track faculty. These trends have caused a swell in the student-to-faculty ratio, as shown on the following graph:
Following its $2.2 million renovation and expansion of the 9,200-square foot Mary Morton Parsons Clinical Simulation Learning Center (CSLC) in late 2012, the SON has continued to modernize its McLeod Hall facilities. The CSLC’s facilities include a mock ICU, a physical assessment lab, a mock OR suite, a labor and delivery unit as well as a mock isolation unit designed to teach students the critical steps of infection control. Strategic Direction The SON’s Strategic Plan through 2015 was developed in partnership with faculty, staff, students, and community partners, and includes goals to: 1. Cultivate the SON’s multicultural community of
scholars and researchers;
MAJ
OR
BU
DG
ET U
NIT
OVE
RVI
EWS
77
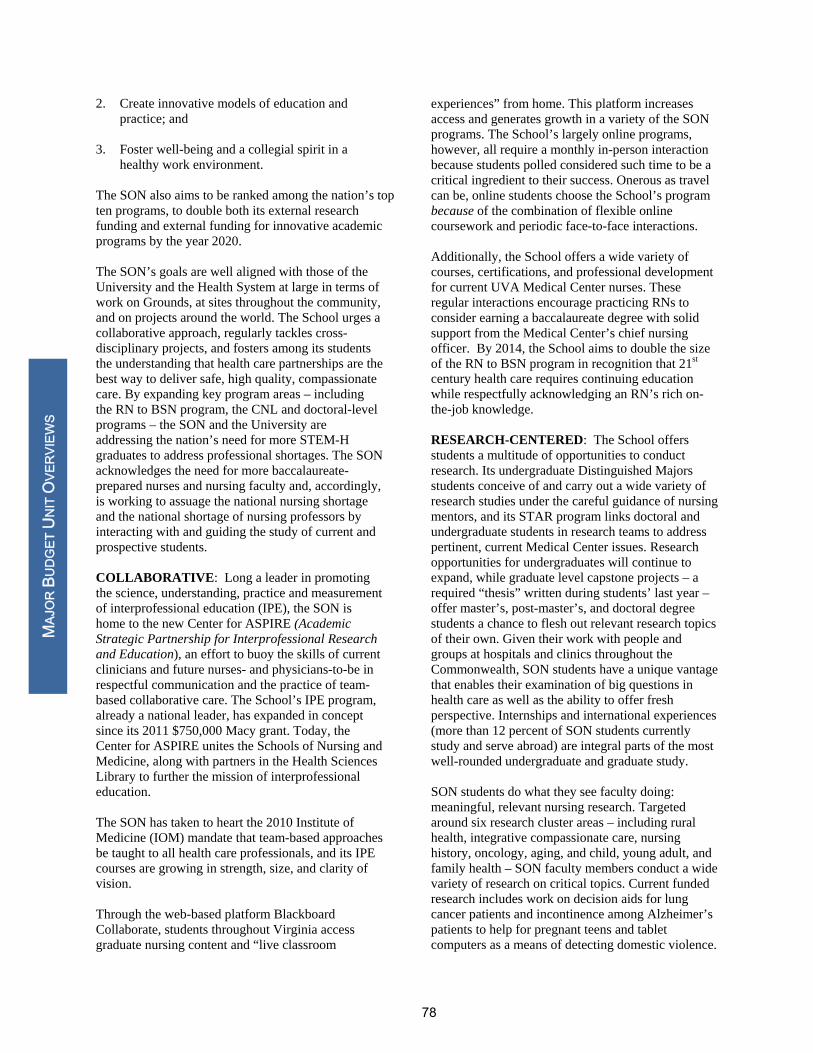
2. Create innovative models of education and practice; and
3. Foster well-being and a collegial spirit in a healthy work environment.
The SON also aims to be ranked among the nation’s top ten programs, to double both its external research funding and external funding for innovative academic programs by the year 2020. The SON’s goals are well aligned with those of the University and the Health System at large in terms of work on Grounds, at sites throughout the community, and on projects around the world. The School urges a collaborative approach, regularly tackles cross-disciplinary projects, and fosters among its students the understanding that health care partnerships are the best way to deliver safe, high quality, compassionate care. By expanding key program areas – including the RN to BSN program, the CNL and doctoral-level programs – the SON and the University are addressing the nation’s need for more STEM-H graduates to address professional shortages. The SON acknowledges the need for more baccalaureate-prepared nurses and nursing faculty and, accordingly, is working to assuage the national nursing shortage and the national shortage of nursing professors by interacting with and guiding the study of current and prospective students. COLLABORATIVE: Long a leader in promoting the science, understanding, practice and measurement of interprofessional education (IPE), the SON is home to the new Center for ASPIRE (Academic Strategic Partnership for Interprofessional Research and Education), an effort to buoy the skills of current clinicians and future nurses- and physicians-to-be in respectful communication and the practice of team-based collaborative care. The School’s IPE program, already a national leader, has expanded in concept since its 2011 $750,000 Macy grant. Today, the Center for ASPIRE unites the Schools of Nursing and Medicine, along with partners in the Health Sciences Library to further the mission of interprofessional education. The SON has taken to heart the 2010 Institute of Medicine (IOM) mandate that team-based approaches be taught to all health care professionals, and its IPE courses are growing in strength, size, and clarity of vision. Through the web-based platform Blackboard Collaborate, students throughout Virginia access graduate nursing content and “live classroom
experiences” from home. This platform increases access and generates growth in a variety of the SON programs. The School’s largely online programs, however, all require a monthly in-person interaction because students polled considered such time to be a critical ingredient to their success. Onerous as travel can be, online students choose the School’s program because of the combination of flexible online coursework and periodic face-to-face interactions. Additionally, the School offers a wide variety of courses, certifications, and professional development for current UVA Medical Center nurses. These regular interactions encourage practicing RNs to consider earning a baccalaureate degree with solid support from the Medical Center’s chief nursing officer. By 2014, the School aims to double the size of the RN to BSN program in recognition that 21st century health care requires continuing education while respectfully acknowledging an RN’s rich on-the-job knowledge. RESEARCH-CENTERED: The School offers students a multitude of opportunities to conduct research. Its undergraduate Distinguished Majors students conceive of and carry out a wide variety of research studies under the careful guidance of nursing mentors, and its STAR program links doctoral and undergraduate students in research teams to address pertinent, current Medical Center issues. Research opportunities for undergraduates will continue to expand, while graduate level capstone projects – a required “thesis” written during students’ last year – offer master’s, post-master’s, and doctoral degree students a chance to flesh out relevant research topics of their own. Given their work with people and groups at hospitals and clinics throughout the Commonwealth, SON students have a unique vantage that enables their examination of big questions in health care as well as the ability to offer fresh perspective. Internships and international experiences (more than 12 percent of SON students currently study and serve abroad) are integral parts of the most well-rounded undergraduate and graduate study. SON students do what they see faculty doing: meaningful, relevant nursing research. Targeted around six research cluster areas – including rural health, integrative compassionate care, nursing history, oncology, aging, and child, young adult, and family health – SON faculty members conduct a wide variety of research on critical topics. Current funded research includes work on decision aids for lung cancer patients and incontinence among Alzheimer’s patients to help for pregnant teens and tablet computers as a means of detecting domestic violence.
MAJ
OR
BU
DG
ET U
NIT
OVE
RVI
EWS
78

The newly-christened Eleanor Crowder Bjoring Center for Nursing Historical Inquiry, one of just two such nurse history centers in the U.S. and four around the world, offers a central repository for important nursing artifacts; a dynamic, often digitized collection of journals, photographs, articles; and various memorabilia that may be pored over by students, professors, and researchers for generations to come. The history center offers students, clinicians and others a sense of what nursing programs worked in times past – and what didn’t – lessons that ultimately inform today’s programs and health care reform as a whole. COMPASSIONATE: In a profession where burnout and compassion fatigue are rampant, the SON urges its students and colleagues in the Health System to practice resilience, deal with grief and grieving, and, most critically, to care for themselves as a means of becoming more compassionate caregivers. The School’s Compassionate Care Initiative (CCI) brings together nursing and medical students, faculty, working nurses, chaplains, physicians, and others to discuss meaningful, concrete ways to promote compassion and nurture resilience. The CCI also offers methods of coping – through resilient activities that include deep breathing exercises, meditation, yoga and other mindful practices – to faculty, clinicians and student nurses-to-be. Contemplative practices and exercises (part of the School’s work with the Contemplative Sciences Center that includes retreats, keeping journals, and learning meditation) are woven into a wide variety of nursing curricula for undergraduates to graduate students. GLOBAL: Every UVA nurse must become culturally competent to appreciate the wide variety of patients they’ll care for. The SON boasts a revolving door to the international community, both through an ethnically diverse faculty and the tight-knit collaborations established with programs in a wide variety of countries around the world. The perspectives gathered from such work – a global understanding of health and health care – remains an essential ingredient for all nursing students practicing in an increasingly diverse society. The Rural and Global Health Care Center, founded in 2013, provides a central place for information about study abroad programs and international research opportunities. The School currently enjoys partnerships with sites in Australia, China, Columbia, Denmark, Grand Bahamas Island, Guatemala, Honduras, India, Malawi, New Zealand, Nicaragua, and South Africa, and has established a “virtual exchange” program with the University of Lund in
Sweden and the University of Venda in South Africa. Nursing students are also regular participants in the Semester at Sea program. A number of PhD and DNP students focus their research on global health issues, and the School often hosts visiting scholars from Denmark, Hong Kong, Sweden, Taiwan, Thailand, and Indonesia who provide intimate knowledge of health issues and perspectives from abroad. Here in Charlottesville, the School’s undergraduates volunteer for a wide variety of extracurricular service projects that give them perspective on vulnerable and underserved populations at Madison House, Nursing Students without Borders, and the Remote Area Medical Clinic in Wise County, among many others. HEALTHY WORK ENVIRONMENT: We acknowledge that nurses must look and sound like those people they treat. Given this, the SON actively recruits racially diverse faculty and staff and continues to cultivate more racially diverse students to join our ranks. As nursing professors have grown scarcer and increasingly sought-after, the School strives to offer a work environment that is healthy, balanced and flexible. The School’s Roberts Scholars Program, a mentoring program for junior faculty that provides protected time and funding to develop individual research programs and areas of study, is one route to such balance. The School also offers grant development resources to support the preparation of National Institutes of Health proposals. The SON places a keen emphasis too on an environment that is collegial, supportive, and collaborative as it works to make the School a place that is student-centered, focuses on research and practice, and serves Charlottesville, the Commonwealth, and the world. Ample opportunities for dialogue and contributions, coupled with the dean’s open-door policy, have made the SON a work environment that is respectful, caring, and warm. 2014-15 Operating Budget The SON is funded through a traditional centralized budget, self-generated grants, contracts and private resources, as well as support from UVA Medical Center. For fiscal year 2014-15, 60 percent of the SON operating budget is from tuition and state general funds. Private funds from endowment distribution and gifts provide 33 percent of funding, while grants, contracts, and F&A constitute 7 percent.
MAJ
OR
BU
DG
ET U
NIT
OVE
RVI
EWS
79
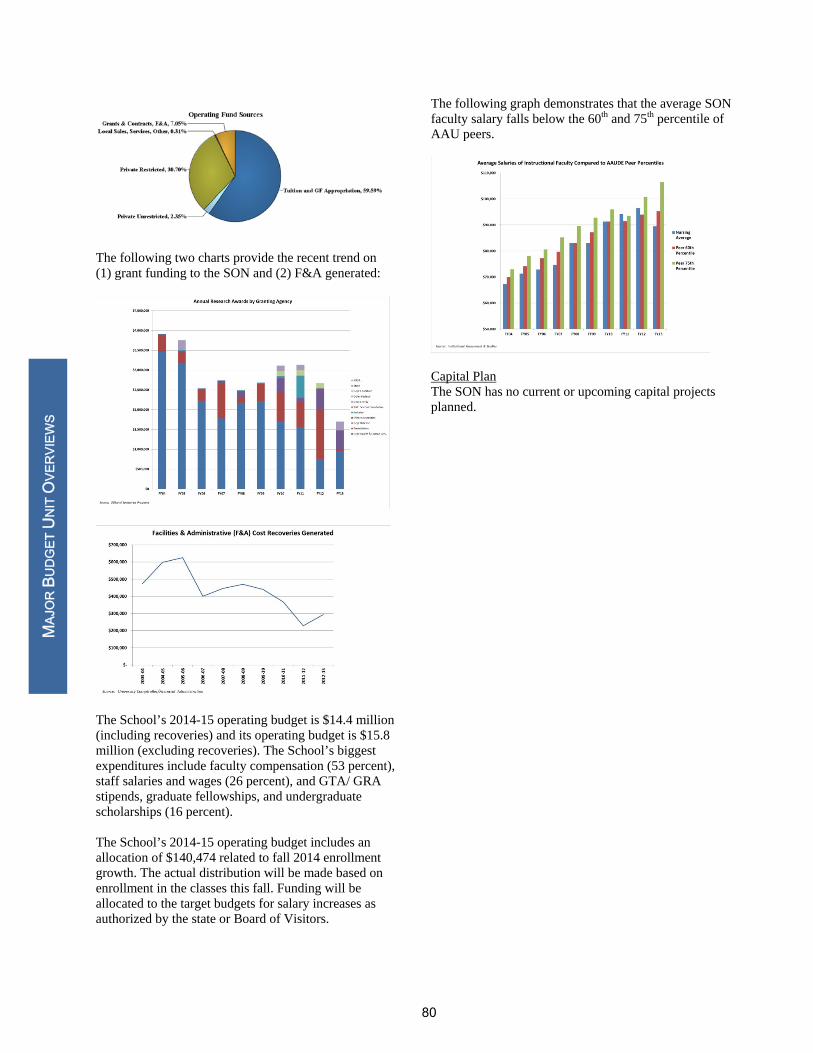
The following two charts provide the recent trend on (1) grant funding to the SON and (2) F&A generated:
The School’s 2014-15 operating budget is $14.4 million (including recoveries) and its operating budget is $15.8 million (excluding recoveries). The School’s biggest expenditures include faculty compensation (53 percent), staff salaries and wages (26 percent), and GTA/ GRA stipends, graduate fellowships, and undergraduate scholarships (16 percent). The School’s 2014-15 operating budget includes an allocation of $140,474 related to fall 2014 enrollment growth. The actual distribution will be made based on enrollment in the classes this fall. Funding will be allocated to the target budgets for salary increases as authorized by the state or Board of Visitors.
The following graph demonstrates that the average SON faculty salary falls below the 60th and 75th percentile of AAU peers.
Capital Plan The SON has no current or upcoming capital projects planned.
MAJ
OR
BU
DG
ET U
NIT
OVE
RVI
EWS
80

University of Virginia - MBU SummaryExec Level: R1380 VP: PV-VP/Provost, Mbu Level: R2465 MBU: NR-Nursing School
1
Tui on and GFAppropria on
FTE Amount
2
Grants & Contracts,F&A
FTE Amount
3
Private Unrestricted
FTE Amount
4
Private Restricted
FTE Amount
5
Local Sales, Services,Other
FTE Amount
6
Auxiliary
FTE Amount Total ‐ FTE Total ‐ Amount
FY CTCS Category
2014‐R Faculty Salaries and benefitsStaff Salaries and benefitsWages and benefitsGTA/GRA
Subtotal
OTPS
Financial Aid
Central Assessment
Recoveries
Subtotal
MBU Totals
2015‐O Faculty Salaries and benefitsStaff Salaries and benefitsWages and benefitsGTA/GRA
Subtotal
OTPS
Financial Aid
Central Assessment
Recoveries
Subtotal
MBU Totals
47.3 4,915,924 2.4 337,021 0.7 74,810 9.0 1,125,982 0.2 23,820 ‐ ‐ 59.6 6,477,557
27.6 1,640,455 4.4 172,841 4.0 260,963 4.3 536,589 ‐ ‐ ‐ ‐ 40.2 2,610,848
‐ 367,796 ‐ 207,288 ‐ ‐ ‐ ‐ ‐ ‐ ‐ ‐ ‐ 575,084
4.3 275,000 ‐ ‐ ‐ ‐ ‐ ‐ ‐ ‐ ‐ ‐ 4.3 275,000
79.1 7,199,175 6.8 717,150 4.7 335,773 13.3 1,662,571 0.2 23,820 104.1 9,938,489
‐ 1,697,483 ‐ 363,889 ‐ ‐ ‐ 833,296 ‐ 50,878 ‐ ‐ ‐ 2,945,546
‐ 1,086,038 ‐ 71,832 ‐ ‐ ‐ 965,027 ‐ ‐ ‐ ‐ ‐ 2,122,897
‐ 92,945 ‐ ‐ ‐ ‐ ‐ ‐ ‐ ‐ ‐ ‐ ‐ 92,945
‐ ‐1,437,600 ‐ ‐ ‐ ‐ ‐ ‐ ‐ ‐ ‐ ‐ ‐ ‐1,437,600
1,438,866 435,721 1,798,323 50,878 3,723,788
79.1 8,638,041 6.8 1,152,871 4.7 335,773 13.3 3,460,894 0.2 74,698 104.1 13,662,277
52.0 5,450,356 3.0 411,848 0.1 7,937 10.0 1,776,692 0.2 19,431 ‐ ‐ 65.3 7,666,264
25.4 1,784,489 2.0 145,260 4.7 325,439 4.0 579,753 ‐ ‐ ‐ ‐ 36.1 2,834,941
0.0 665,576 ‐ 145,983 ‐ 4,505 ‐ ‐ ‐ ‐ ‐ ‐ 0.0 816,064
4.3 250,000 4.0 61,788 ‐ ‐ ‐ ‐ ‐ ‐ ‐ ‐ 8.2 311,788
81.6 8,150,421 9.0 764,879 4.8 337,881 14.1 2,356,445 0.2 19,431 109.6 11,629,057
‐ 968,474 ‐ 232,168 ‐ ‐ ‐ 829,337 ‐ 25,000 ‐ ‐ ‐ 2,054,979
‐ 795,766 ‐ 15,000 ‐ ‐ ‐ 1,223,065 ‐ ‐ ‐ ‐ ‐ 2,033,831
‐ 83,113 ‐ ‐ ‐ ‐ ‐ ‐ ‐ ‐ ‐ ‐ ‐ 83,113
0.0 ‐1,439,402 ‐ ‐ ‐ ‐ ‐ ‐ ‐ ‐ ‐ ‐ 0.0 ‐1,439,402
0.0 407,951 247,168 2,052,402 25,000 0.0 2,732,521
81.6 8,558,372 9.0 1,012,047 4.8 337,881 14.1 4,408,847 0.2 44,431 109.6 14,361,578
81
UNIVERSITY LIBRARY Overview of Operations The University Library’s established Strategic Directions are:
1. Develop collections, services and spaces that
foster preeminent academic programs and research.
2. Ensure that important content in all formats is preserved in perpetuity.
3. Make new forms of scholarly engagement central to the Library’s collections and service models.
4. Position the Library for future success.
The University Library (UL) enables research, teaching, and learning through strong collections, versatile spaces, and exceptional public services in support of faculty and students. The UL serves UVa’s faculty, undergraduates, and graduate students from all disciplines and is also open to the public and to scholars worldwide. The UL is also nationally recognized as a leader in collaborations with peer institutions to solve some of the big challenges faced by all academic libraries, such as preservation of scholarship in all formats. It is also known for innovation, especially in digital scholarship. Collections The UL provides access to a rich array of digital and physical scholarly materials that include archives, 5 million print and digital books, over 180,000 journals, hundreds of thousands of non-text materials such as images, videos, databases, etc., and over 16 million manuscripts. The world-class collection of rare and unique materials is exceptionally strong in American history, literature, and culture. The UL actively develops the Library’s online catalog (VIRGO) to maximize the discovery and use of both physical and digital resources.
Spaces The UL’s multiple libraries offer spaces for collaboration and study, discipline-specific physical collections and access to digital collections, and specialized expertise and tools for using Library resources. Undergraduates are especially heavy users of library spaces, and six libraries offer evening and weekend access, including Clemons Library, a 1,500 seat facility that closes only between midnight and early morning on Saturday and Sunday when classes are in session.
Services Library staff contribute daily to the academic endeavor, from building innovative programs for the digital humanities to answering a research question texted by a student. Library staff members often collaborate with faculty on their research and teach students how best to use and evaluate collections. The Scholars’ Lab, Digital Media Lab, and Data Research Services group offer specialized expertise and tools for many forms of digital scholarship including digital humanities, rich media, and data-intensive research. In addition to face-to-face services, the UL actively develops virtual services that maximize the use of web-accessible content and ensure the preservation of born-digital material. The UL is nationally recognized as a leader in innovative services; examples include LEO (faculty delivery service), Hydra and Fedora (open-source technologies to support repositories for digital content), and Praxis (graduate student fellowship program in the digital humanities). Contributions to born-digital content and new tools and models for digital scholarship have also brought the UL recognition. Strategic Directions The UL’s Strategic Directions align with the University’s strategic planning. Our collections, services, and spaces directly support the core mission of the University by providing the resources necessary for faculty and student teaching, learning & research. To help position the University as a leader in the next decade, the UL priorities support University-wide objectives and align with school missions:
Data-intensive scholarship – Responding to the growth in data-intensive research across disciplines, the UL has realigned existing resources and hired new expertise to support the acquisition, use, and management of complex data sets. New services will be developed to complement the activities of related initiatives such as the College’s Quantitative Collaborative, and to expand the available corpus of data resources. Digital Humanities programs --Since the early 1990s, the UL has nurtured and invested in the projects, programs, and centers that establish UVa as a world leader in digital humanities (DH). This field has seen explosive growth in the age of big data, as technology transforms research agendas in core liberal arts disciplines and enables new forms of interpretation and exchange. Moving outward from
MAJ
OR
BU
DG
ET U
NIT
OVE
RVI
EWS
82
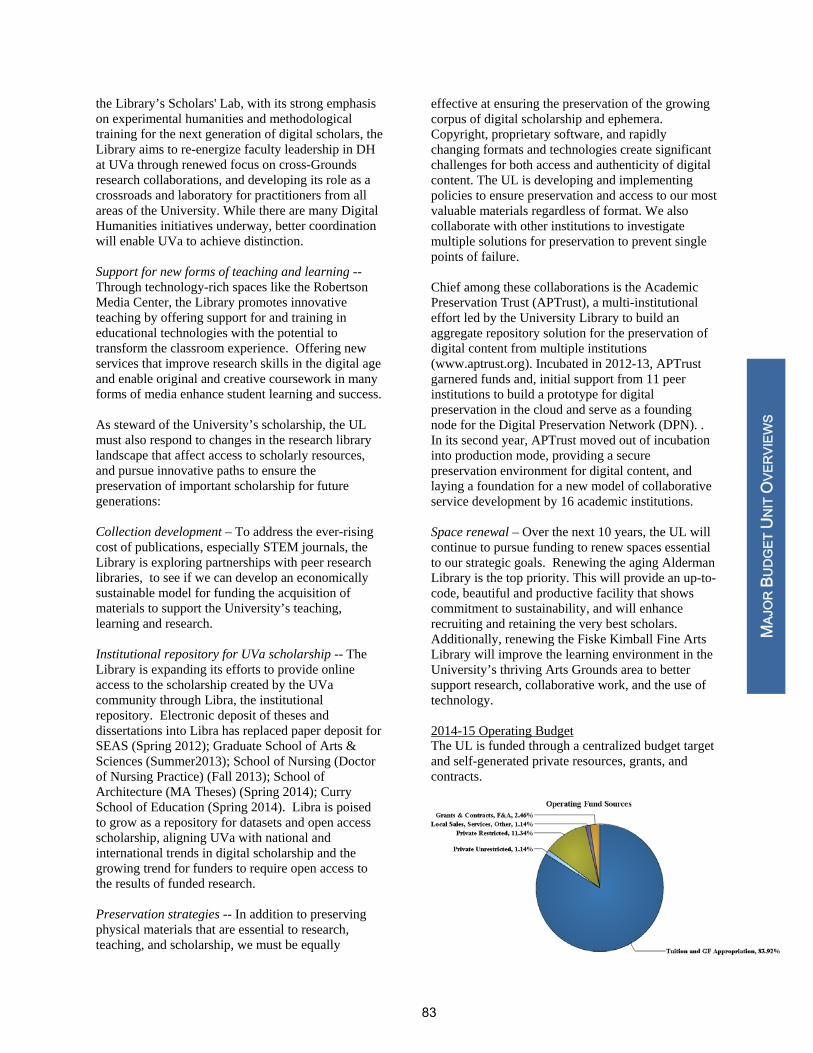
the Library’s Scholars' Lab, with its strong emphasis on experimental humanities and methodological training for the next generation of digital scholars, the Library aims to re-energize faculty leadership in DH at UVa through renewed focus on cross-Grounds research collaborations, and developing its role as a crossroads and laboratory for practitioners from all areas of the University. While there are many Digital Humanities initiatives underway, better coordination will enable UVa to achieve distinction. Support for new forms of teaching and learning -- Through technology-rich spaces like the Robertson Media Center, the Library promotes innovative teaching by offering support for and training in educational technologies with the potential to transform the classroom experience. Offering new services that improve research skills in the digital age and enable original and creative coursework in many forms of media enhance student learning and success.
As steward of the University’s scholarship, the UL must also respond to changes in the research library landscape that affect access to scholarly resources, and pursue innovative paths to ensure the preservation of important scholarship for future generations:
Collection development – To address the ever-rising cost of publications, especially STEM journals, the Library is exploring partnerships with peer research libraries, to see if we can develop an economically sustainable model for funding the acquisition of materials to support the University’s teaching, learning and research.
Institutional repository for UVa scholarship -- The Library is expanding its efforts to provide online access to the scholarship created by the UVa community through Libra, the institutional repository. Electronic deposit of theses and dissertations into Libra has replaced paper deposit for SEAS (Spring 2012); Graduate School of Arts & Sciences (Summer2013); School of Nursing (Doctor of Nursing Practice) (Fall 2013); School of Architecture (MA Theses) (Spring 2014); Curry School of Education (Spring 2014). Libra is poised to grow as a repository for datasets and open access scholarship, aligning UVa with national and international trends in digital scholarship and the growing trend for funders to require open access to the results of funded research.
Preservation strategies -- In addition to preserving physical materials that are essential to research, teaching, and scholarship, we must be equally
effective at ensuring the preservation of the growing corpus of digital scholarship and ephemera. Copyright, proprietary software, and rapidly changing formats and technologies create significant challenges for both access and authenticity of digital content. The UL is developing and implementing policies to ensure preservation and access to our most valuable materials regardless of format. We also collaborate with other institutions to investigate multiple solutions for preservation to prevent single points of failure.
Chief among these collaborations is the Academic Preservation Trust (APTrust), a multi-institutional effort led by the University Library to build an aggregate repository solution for the preservation of digital content from multiple institutions (www.aptrust.org). Incubated in 2012-13, APTrust garnered funds and, initial support from 11 peer institutions to build a prototype for digital preservation in the cloud and serve as a founding node for the Digital Preservation Network (DPN). . In its second year, APTrust moved out of incubation into production mode, providing a secure preservation environment for digital content, and laying a foundation for a new model of collaborative service development by 16 academic institutions. Space renewal – Over the next 10 years, the UL will continue to pursue funding to renew spaces essential to our strategic goals. Renewing the aging Alderman Library is the top priority. This will provide an up-to-code, beautiful and productive facility that shows commitment to sustainability, and will enhance recruiting and retaining the very best scholars. Additionally, renewing the Fiske Kimball Fine Arts Library will improve the learning environment in the University’s thriving Arts Grounds area to better support research, collaborative work, and the use of technology. 2014-15 Operating Budget The UL is funded through a centralized budget target and self-generated private resources, grants, and contracts.
MAJ
OR
BU
DG
ET U
NIT
OVE
RVI
EWS
83

The UL’s 2014-15 operating budget is $29.1 million, with 84 percent from tuition and state general funds. Private funds (endowment distribution, gifts) represent 14 percent of funding, while grants, contracts, and F&A constitute 2 percent. Funding will be allocated to the target budgets for compensation adjustments as authorized by the state or the Board of Visitors. Successful fundraising will continue to be essential to ensure strong collections and services while retaining the flexibility to innovate. One-half of the UL’s total budget is spent on collections and staff who select, acquire, describe, and preserve materials so they are accessible now and will remain so in the future. Strong collections are essential to the University’s standing in the scholarly community and often play a significant role in the successful recruitment and retention of faculty. Another one-third of the budget covers direct services to faculty and students, including services for digital scholarship and online access to digital content. Facility support and basic staffing for the UL’s 10 spaces (physical facilities) is currently a small part of the budget. Administrative costs make up the remaining 10 percent of the budget.
University Library Expenditures 14-15 Budget (% of total)
Collections Purchase/lease of materials Selection/Curation Metadata Digital & physical storage Preservation
$14,549,242
(50%)
Services Interlibrary loan and scanning services Information services Online services Technology and research services
$8,438,560
(29%)
Spaces Staffing Technology support Facility support
$3,200,834
(11%)
Administration Senior leadership Finance & HR staff Development & Communications
$2,909,848 (10%)
Total Library Budget $29,098,484
Together, the UL and the professional school libraries (Darden, Health Sciences, and Law) spend less per full-time student than the library systems at many peer institutions, as the chart below demonstrates.
2012-13 University Library Expenditures
Institution Total Expenditures
Full-time students
Expenditure/ student
University of Michigan
$67,289,114
40,966
$1643
Cornell University
$51,287,542 22,335
$2,296
Pennsylvania*
$44,396,070
21,344 $2077
UNC, Chapel Hill
$41,369,630 24,498
$1689
Duke University
$ 51,551,807
14,924
$3,454
Indiana University
$33,204,272
37,609
$883
Emory University
$40,276,565
13,061
$3084
Johns Hopkins University
$37,319,899
13,521
$2,760
University of Virginia $32,696,,918 20,984 $1558 Includes libraries in Darden, Health Sciences, and Law Data from Association of Research Libraries 2012 ARL Statistics *Penn data is from FY12 (FY13 not yet posted)
Capital Plan There are no ongoing projects in construction. Currently, projects in the capital program include the renewals of Alderman Library ($120 million) and Fiske-Kimball Fine Arts Library ($19 million). Both projects are contingent on state funding, with the Alderman Library slated for consideration by the 2015 General Assembly session and we anticipate planning to start this year.
MAJ
OR
BU
DG
ET U
NIT
OVE
RVI
EWS
84

University of Virginia - MBU SummaryExec Level: R1380 VP: PV-VP/Provost, Mbu Level: R1530 MBU: LB-Library-UVa
1
Tui on and GFAppropria on
FTE Amount
2
Grants & Contracts,F&A
FTE Amount
3
Private Unrestricted
FTE Amount
4
Private Restricted
FTE Amount
5
Local Sales, Services,Other
FTE Amount
6
Auxiliary
FTE Amount Total ‐ FTE Total ‐ Amount
FY CTCS Category
2014‐R Faculty Salaries and benefitsStaff Salaries and benefitsWages and benefitsGTA/GRA
Subtotal
OTPS
Financial Aid
Subtotal
MBU Totals
2015‐O Faculty Salaries and benefitsStaff Salaries and benefitsWages and benefits
Subtotal
OTPS
Financial Aid
Subtotal
MBU Totals
60.3 5,414,000 0.1 6,048 0.5 76,592 2.0 149,500 ‐ ‐ ‐ ‐ 62.8 5,646,140
172.8 10,379,971 0.6 39,443 ‐ ‐ 4.0 341,000 ‐ ‐ ‐ ‐ 177.4 10,760,414
‐ 168,800 ‐ 4,000 ‐ ‐ ‐ 65,000 ‐ ‐ ‐ ‐ ‐ 237,800
‐ 30,000 ‐ ‐ ‐ ‐ ‐ ‐ ‐ ‐ ‐ ‐ ‐ 30,000
233.1 15,992,771 0.7 49,491 0.5 76,592 6.0 555,500 240.3 16,674,354
‐ 7,265,148 ‐ 756,349 ‐ 1,364,140 ‐ 2,300,000 ‐ 235,701 ‐ ‐ ‐ 11,921,338
‐ ‐ ‐ ‐ ‐ ‐ ‐ 91,000 ‐ ‐ ‐ ‐ ‐ 91,000
7,265,148 756,349 1,364,140 2,391,000 235,701 12,012,338
233.1 23,257,919 0.7 805,840 0.5 1,440,732 6.0 2,946,500 235,701 240.3 28,686,692
55.0 5,100,000 ‐ ‐ 0.5 77,271 2.0 152,000 ‐ ‐ ‐ ‐ 57.5 5,329,271
176.0 10,704,598 ‐ ‐ ‐ ‐ 4.0 359,000 ‐ ‐ ‐ ‐ 180.0 11,063,598
‐ 50,615 ‐ ‐ ‐ ‐ ‐ 68,000 ‐ ‐ ‐ ‐ ‐ 118,615
231.0 15,855,213 0.5 77,271 6.0 579,000 237.5 16,511,484
‐ 8,565,510 ‐ 715,000 ‐ 254,490 ‐ 2,631,000 ‐ 331,000 ‐ ‐ ‐ 12,497,000
‐ ‐ ‐ ‐ ‐ ‐ ‐ 90,000 ‐ ‐ ‐ ‐ ‐ 90,000
8,565,510 715,000 254,490 2,721,000 331,000 12,587,000
231.0 24,420,723 715,000 0.5 331,761 6.0 3,300,000 331,000 237.5 29,098,484
85
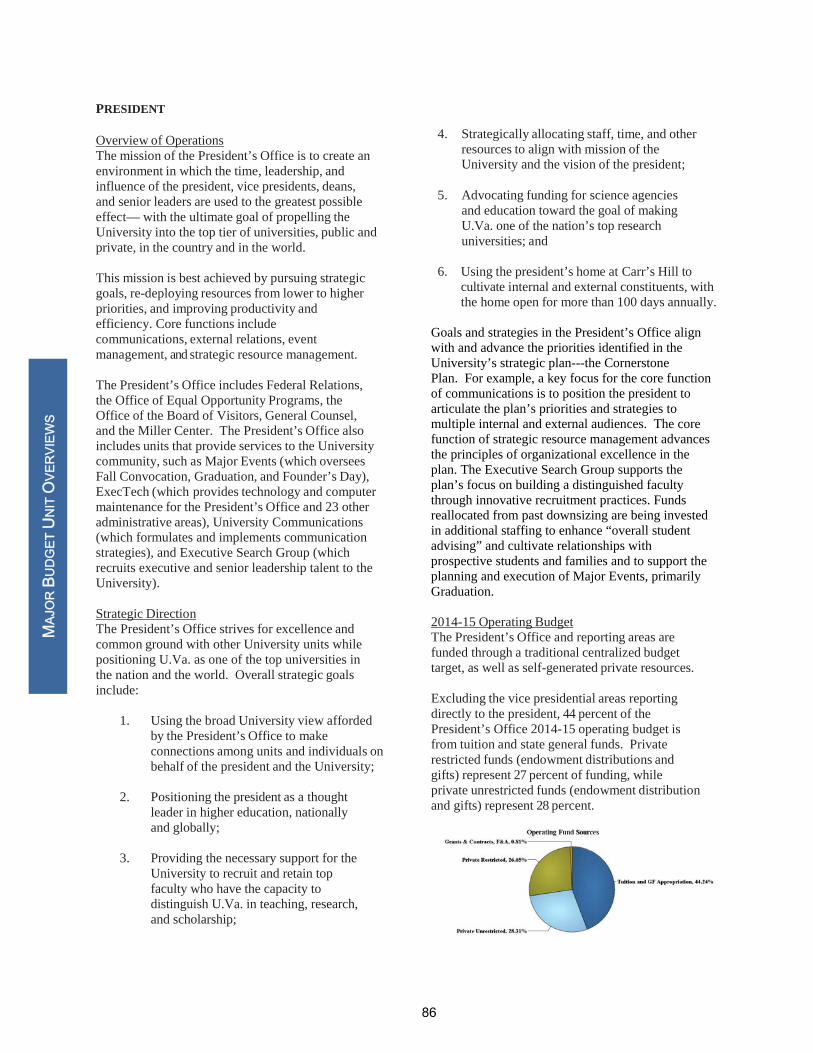
MAJ
OR
BU
DG
ET U
NIT
OVE
RVI
EWS
PRESIDENT Overview of Operations The mission of the President’s Office is to create an environment in which the time, leadership, and influence of the president, vice presidents, deans, and senior leaders are used to the greatest possible effect— with the ultimate goal of propelling the University into the top tier of universities, public and private, in the country and in the world. This mission is best achieved by pursuing strategic goals, re-deploying resources from lower to higher priorities, and improving productivity and efficiency. Core functions include communications, external relations, event management, and strategic resource management. The President’s Office includes Federal Relations, the Office of Equal Opportunity Programs, the Office of the Board of Visitors, General Counsel, and the Miller Center. The President’s Office also includes units that provide services to the University community, such as Major Events (which oversees Fall Convocation, Graduation, and Founder’s Day), ExecTech (which provides technology and computer maintenance for the President’s Office and 23 other administrative areas), University Communications (which formulates and implements communication strategies), and Executive Search Group (which recruits executive and senior leadership talent to the University). Strategic Direction The President’s Office strives for excellence and common ground with other University units while positioning U.Va. as one of the top universities in the nation and the world. Overall strategic goals include:
1. Using the broad University view afforded by the President’s Office to make connections among units and individuals on behalf of the president and the University;
2. Positioning the president as a thought
leader in higher education, nationally and globally;
3. Providing the necessary support for the
University to recruit and retain top faculty who have the capacity to distinguish U.Va. in teaching, research, and scholarship;
4. Strategically allocating staff, time, and other
resources to align with mission of the University and the vision of the president;
5. Advocating funding for science agencies
and education toward the goal of making U.Va. one of the nation’s top research universities; and
6. Using the president’s home at Carr’s Hill to
cultivate internal and external constituents, with the home open for more than 100 days annually.
Goals and strategies in the President’s Office align with and advance the priorities identified in the University’s strategic plan---the Cornerstone Plan. For example, a key focus for the core function of communications is to position the president to articulate the plan’s priorities and strategies to multiple internal and external audiences. The core function of strategic resource management advances the principles of organizational excellence in the plan. The Executive Search Group supports the plan’s focus on building a distinguished faculty through innovative recruitment practices. Funds reallocated from past downsizing are being invested in additional staffing to enhance “overall student advising” and cultivate relationships with prospective students and families and to support the planning and execution of Major Events, primarily Graduation. 2014-15 Operating Budget The President’s Office and reporting areas are funded through a traditional centralized budget target, as well as self-generated private resources. Excluding the vice presidential areas reporting directly to the president, 44 percent of the President’s Office 2014-15 operating budget is from tuition and state general funds. Private restricted funds (endowment distributions and gifts) represent 27 percent of funding, while private unrestricted funds (endowment distribution and gifts) represent 28 percent.
MAJ
OR
BU
DG
ET U
NIT
OVE
RVI
EWS
86

For the President’s Office and direct reporting units excluding vice presidents, the 2014-15 operating budget (see page 88) is $21.3 million, with the primary spending on compensation (78 percent). The remaining expenditures are primarily in OTPS expenditures and include communications, equipment, special events, and travel for presidential trips and donor cultivation. Funding will be allocated to the target budgets for compensation adjustments as authorized by the state or the Board of Visitors. For the President’s Office and all reporting units including vice presidents, the 2014-15 operating budget is $231.8 million. This includes all areas reporting to the vice presidents for Diversity and Equity, Student Affairs, Research, and University Advancement, as well as to the Director of Athletics. The president also oversees the President’s Fund for Excellence, which was authorized by the Board as an emergency measure in response to the loss of $52 million in state general funds in 2002 and later made permanent as a means to provide one-time, short-term funding when base budget is not available for significant priorities. The Fund, $3 million annually, is allocated from the University’s unrestricted endowment distribution and used at the president’s discretion. Capital Plan The Miller Center retains its commitment to “Phase III” in the 2016-18 cycle, without amendment at this time. The Rotunda project has been partially funded by the General Assembly.
MAJ
OR
BU
DG
ET U
NIT
OVE
RVI
EWS
87

University of Virginia - MBU SummaryExec Level: R0005 VP: PR-President's Office, Mbu Level: <All>
1
Tui on and GFAppropria on
FTE Amount
2
Grants & Contracts,F&A
FTE Amount
3
Private Unrestricted
FTE Amount
4
Private Restricted
FTE Amount
5
Local Sales, Services,Other
FTE Amount
6
Auxiliary
FTE Amount Total ‐ FTE Total ‐ Amount
FY CTCS Category
2014‐R Faculty Salaries and benefitsStaff Salaries and benefitsWages and benefits
Subtotal
OTPS
Financial Aid
Recoveries
Subtotal
MBU Totals
2015‐O Faculty Salaries and benefitsStaff Salaries and benefitsWages and benefits
Subtotal
OTPS
Financial Aid
Recoveries
Subtotal
MBU Totals
25.9 3,311,840 0.5 42,717 6.0 1,001,812 12.8 2,056,719 ‐ ‐ ‐ ‐ 45.1 6,413,088
40.3 2,567,720 0.9 60,382 24.7 1,960,481 17.7 1,435,809 6.0 667,000 ‐ ‐ 89.5 6,691,392
‐ 81,421 ‐ 22,100 ‐ 253,926 ‐ 379,171 ‐ 30,000 ‐ ‐ ‐ 766,618
66.1 5,960,981 1.4 125,199 30.7 3,216,219 30.4 3,871,699 6.0 697,000 134.6 13,871,098
‐ 5,448,981 ‐ 31,381 ‐ 6,065,352 ‐ 1,183,970 ‐ 105,122 ‐ ‐ ‐ 12,834,806
‐ ‐ ‐ ‐ ‐ 2,217 ‐ 206,100 ‐ ‐ ‐ ‐ ‐ 208,317
‐ ‐930,562 ‐ ‐ ‐ ‐ ‐ ‐ ‐ ‐787,000 ‐ ‐ ‐ ‐1,717,562
4,518,419 31,381 6,067,569 1,390,070 ‐681,878 11,325,561
66.1 10,479,400 1.4 156,580 30.7 9,283,788 30.4 5,261,769 6.0 15,122 134.6 25,196,659
24.9 4,270,118 0.7 49,923 5.8 1,102,879 12.2 2,118,603 ‐ ‐ ‐ ‐ 43.6 7,541,523
41.3 3,490,588 0.3 27,450 25.1 1,994,238 21.3 1,848,654 9.0 981,000 ‐ ‐ 96.9 8,341,930
0.0 199,714 ‐ 17,440 0.0 185,026 ‐ 361,288 ‐ ‐ ‐ ‐ 0.0 763,468
66.1 7,960,420 1.0 94,813 30.9 3,282,143 33.5 4,328,545 9.0 981,000 140.5 16,646,921
0.0 2,442,366 ‐ 76,337 0.0 2,733,416 ‐ 1,153,750 0.0 100,000 ‐ ‐ 0.0 6,505,869
‐ ‐ ‐ ‐ ‐ ‐ ‐ 180,000 ‐ ‐ ‐ ‐ ‐ 180,000
0.0 ‐1,001,732 ‐ ‐ ‐ ‐ ‐ ‐ 0.0 ‐1,081,000 ‐ ‐ 0.0 ‐2,082,732
0.0 1,440,634 76,337 0.0 2,733,416 1,333,750 0.0 ‐981,000 0.0 4,603,137
66.1 9,401,054 1.0 171,150 30.9 6,015,559 33.5 5,662,295 9.0 0 140.5 21,250,058
88

DIRECTOR OF ATHLETIC PROGRAMS Overview of Operations The Director of Athletic Programs oversees the University’s Intercollegiate Athletics Programs and Intramural-Recreational Sports. Athletics Athletics is an integral part of the University's commitment to educational excellence. Its mission is to enhance and support the intellectual purpose of the University and its exemplary academic standards and traditions. Critical to the Athletics mission are high academic achievement; nationally competitive and successful teams; comprehensive integration of student athletes within the University and local communities; a strict adherence to NCAA, ACC, and University rules and regulations; fiscal integrity, which is embodied through the generation and efficient use of resources; and the attraction and retention of the highest quality student athletes and staff, which includes equitable opportunities for women and minorities. Athletics pursues its mission by uniting the varied constituencies of the University community through its intercollegiate and intramural programs. These programs are designed to build support for, and add value to, the academic purposes of the institution while developing students with strong values of leadership, sportsmanship, equity, citizenship, physical fitness, teamwork, and a commitment to excellence. The operating principles of Athletics require that in pursuing its mission, it will consistently provide exemplary service to all of its internal and external constituencies. Athletics’ operations support 12 intercollegiate sports for men and 13 for women, providing competition opportunities for 651 student athletes, 244 of whom receive scholarship support. Intramural-Recreational Sports The Department of Intramural-Recreational Sports (IM-Rec Sports) addresses student and faculty/staff life outside the classroom as it relates to health, wellness, fitness, and overall quality of life through enriching and supporting healthy lifestyles and aiding in employee recruitment/retention. IM-Rec Sports serves the diverse needs of the entire University community, fostering fellowship and meaningful interactions through high-quality programs, facilities, equipment, and personnel; this encourages ethically responsible behavior, sportsmanship, and cooperation. IM-Rec Sports educates participants in the worthy use of leisure time through development of lifetime sports skills and self-awareness in a
recreational context, while also offering meaningful opportunities for personal development and the acquisition of leadership, management, and technical skills. In addition, IM-Rec Sports programs and facilities provide the opportunity for interaction among undergraduate students, graduate students, and faculty/staff. The University operates four venues -- the Aquatic and Fitness Center (AFC), Slaughter Recreation Center (SRC), Memorial Gym, and North Grounds Recreation Center (NGRC), which total over 300,000 square feet -- and over 30 acres of sports fields and courts for students and employee members. These locations offer a variety of equipment, multipurpose space, services, and classes. IM-Rec Sports membership sales have been relatively flat the past few years, with increases expected in 2014-2015. The completion of the expansion and renovation of the NGRC in early 2014 will reduce the use burden on the AFC, as well as create new demand for lap swimming, aquatic programming, drop-in fitness, fitness programming, and squash. Strategic Direction Athletics Athletics’ focus is on excellence -- in both academics and on the field or court of play -- in a fiscally responsible way. Athletics’ goals include: • Graduate 100 percent of its student athletes;
• Win 12 national championships and 70
conference championships;
• Fully endow all of its scholarships and provide operational support required to meet other stated goals;
• Build and maintain the highest quality facilities
in the country, with the purpose of attracting and developing the best student athletes to the University annually;
• Attract top prospective student athletes to the
University annually; and
• Fully comply with Title IX.
MAJ
OR
BU
DG
ET U
NIT
OVE
RVI
EWS
89
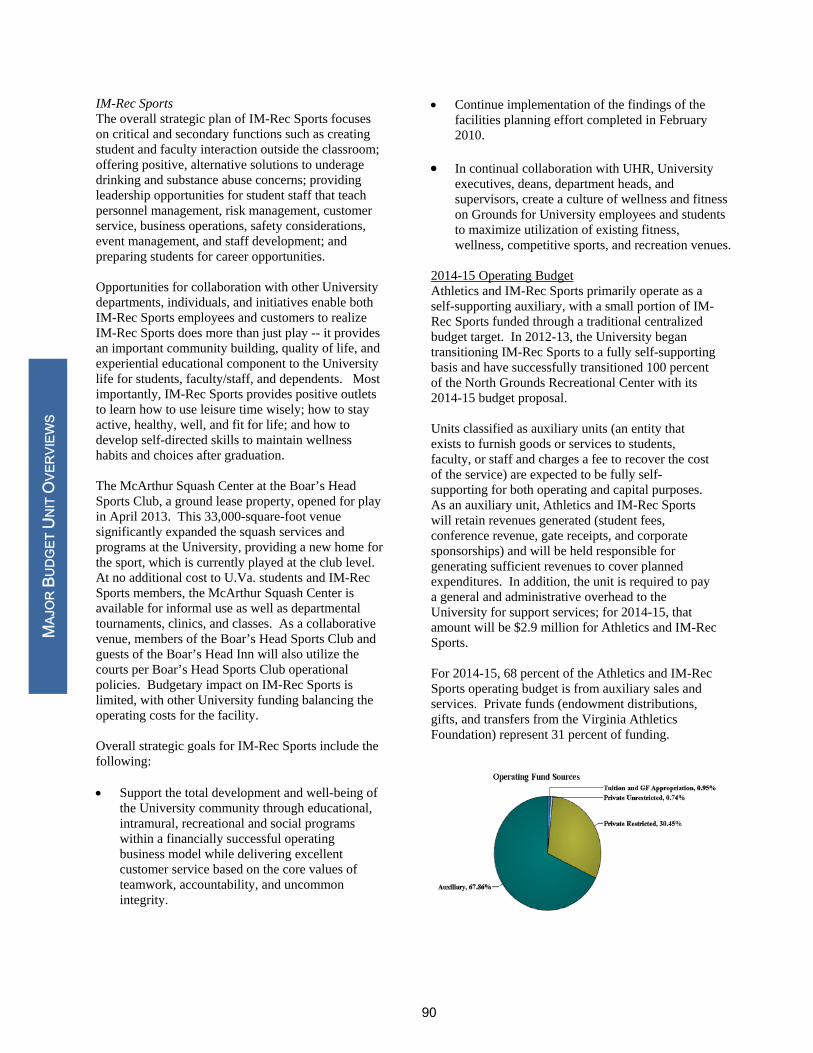
IM-Rec Sports The overall strategic plan of IM-Rec Sports focuses on critical and secondary functions such as creating student and faculty interaction outside the classroom; offering positive, alternative solutions to underage drinking and substance abuse concerns; providing leadership opportunities for student staff that teach personnel management, risk management, customer service, business operations, safety considerations, event management, and staff development; and preparing students for career opportunities. Opportunities for collaboration with other University departments, individuals, and initiatives enable both IM-Rec Sports employees and customers to realize IM-Rec Sports does more than just play -- it provides an important community building, quality of life, and experiential educational component to the University life for students, faculty/staff, and dependents. Most importantly, IM-Rec Sports provides positive outlets to learn how to use leisure time wisely; how to stay active, healthy, well, and fit for life; and how to develop self-directed skills to maintain wellness habits and choices after graduation. The McArthur Squash Center at the Boar’s Head Sports Club, a ground lease property, opened for play in April 2013. This 33,000-square-foot venue significantly expanded the squash services and programs at the University, providing a new home for the sport, which is currently played at the club level. At no additional cost to U.Va. students and IM-Rec Sports members, the McArthur Squash Center is available for informal use as well as departmental tournaments, clinics, and classes. As a collaborative venue, members of the Boar’s Head Sports Club and guests of the Boar’s Head Inn will also utilize the courts per Boar’s Head Sports Club operational policies. Budgetary impact on IM-Rec Sports is limited, with other University funding balancing the operating costs for the facility. Overall strategic goals for IM-Rec Sports include the following: Support the total development and well-being of
the University community through educational, intramural, recreational and social programs within a financially successful operating business model while delivering excellent customer service based on the core values of teamwork, accountability, and uncommon integrity.
Continue implementation of the findings of the facilities planning effort completed in February 2010.
In continual collaboration with UHR, University
executives, deans, department heads, and supervisors, create a culture of wellness and fitness on Grounds for University employees and students to maximize utilization of existing fitness, wellness, competitive sports, and recreation venues.
2014-15 Operating Budget Athletics and IM-Rec Sports primarily operate as a self-supporting auxiliary, with a small portion of IM-Rec Sports funded through a traditional centralized budget target. In 2012-13, the University began transitioning IM-Rec Sports to a fully self-supporting basis and have successfully transitioned 100 percent of the North Grounds Recreational Center with its 2014-15 budget proposal. Units classified as auxiliary units (an entity that exists to furnish goods or services to students, faculty, or staff and charges a fee to recover the cost of the service) are expected to be fully self-supporting for both operating and capital purposes. As an auxiliary unit, Athletics and IM-Rec Sports will retain revenues generated (student fees, conference revenue, gate receipts, and corporate sponsorships) and will be held responsible for generating sufficient revenues to cover planned expenditures. In addition, the unit is required to pay a general and administrative overhead to the University for support services; for 2014-15, that amount will be $2.9 million for Athletics and IM-Rec Sports. For 2014-15, 68 percent of the Athletics and IM-Rec Sports operating budget is from auxiliary sales and services. Private funds (endowment distributions, gifts, and transfers from the Virginia Athletics Foundation) represent 31 percent of funding.
MAJ
OR
BU
DG
ET U
NIT
OVE
RVI
EWS
90
The 2014-15 operating budget for Athletics and IM-Rec Sports (see the following page) is $97.6 million, with 39 percent related to compensation, 16 percent related to athletic grants-in-aid (fully funded by Virginia Athletics Foundation gifts), 10 percent related to debt service on facilities, and 6 percent related to transfers to reserves (described in detail below). Approximately 29 percent of the budget falls into the OTPS category, which includes O&M of facilities, equipment, uniforms, and other supporting expenses. Funding will be allocated to the target budgets for salary increases and compression adjustments as authorized by the state and Board of Visitors. Capital Plan Construction of the NGRC expansion and renovation was completed in December 2013 ($17.2 million from debt and student fees). The Indoor Football Practice Facility ($13 million in gifts) was completed in spring 2013, impacting operational costs. Two projects on the Capital Plan for the long term represent the next phases in the IM-Rec Sports’ Program Planning and Project Formulation Study, with a renovation and expansion of Slaughter Recreational Center and a renovation of Memorial Gymnasium. At this time, Athletics does not have any projects on the capital plan. The Director of Athletics anticipates the possible need to update its Capital Plan; however any update to the plan for new projects will be dependent on fundraising progress. The below schedules outline the expected activity in the Repair & Renewal (R&R) and Expansion reserves for both Athletics and IM-Rec Sports. IM-Rec Sports will meet the Board reserve policy of re-investing at least 1.5 percent of replacement value of the facilities. Athletics relies on the stadium endowment to meet the Board’s reserve policy. The Athletics quasi-endowment principal balances totaling $31.3 million comprise athletic reserves.
Athletics (in thousands) R&R
Reserve Expansion
Reserve Total Projected Balance, 7/1/14 $34,150 $- $34,150 Less: Transfers to Operating
68 - 68
Less: Planned Expenditures
2,806 - 2,806
Projected Balance, 6/30/15
$31,276 $- $31,276
Athletics plans for the following expenditures from the reserves in 2014-2015: $0.25 million for softball improvements, $1.75 million for JPJ Arena
waterproofing and debt service on the indoor football practice facility, and several other venue improvements, including Klockner and University Hall (men’s soccer locker room). In addition to the balances reflected above, Athletics holds several true endowments valued at $9.4 million as of April 2014.
IM-Rec Sports (in thousands)
R&R Reserve
Expansion Reserve Total
Projected Balance, 7/1/14
$2,098 $753 $2,851
Plus: Transfers from Operating
1,678 2,103 3,781
Less: Planned Expenditures
(1,775) (2,010) (3,785)
Projected Balance, 6/30/15
$2,001 $846 $2,847
IM-Rec Sports plans for the following expenditures from the reserves in 2014-2015: $2.0 million for debt service, and approximately $1.55 million for various facility and pool repairs and equipment replacement.
MAJ
OR
BU
DG
ET U
NIT
OVE
RVI
EWS
91

University of Virginia - MBU SummaryExec Level: R0825 VP: AT-Athletics Department, Mbu Level: <All>
1
Tui on and GFAppropria on
FTE Amount
2
Grants & Contracts,F&A
FTE Amount
3
Private Unrestricted
FTE Amount
4
Private Restricted
FTE Amount
5
Local Sales, Services,Other
FTE Amount
6
Auxiliary
FTE Amount Total ‐ FTE Total ‐ Amount
FY CTCS Category
2014‐R Faculty Salaries and benefitsStaff Salaries and benefitsWages and benefits
Subtotal
OTPS
Financial Aid
Recoveries
Internal Debt Service
Transfers
Subtotal
MBU Totals
2015‐O Faculty Salaries and benefitsStaff Salaries and benefitsWages and benefits
Subtotal
OTPS
Financial Aid
Recoveries
Internal Debt Service
Transfers
Subtotal
MBU Totals
4.0 291,885 ‐ ‐ ‐ ‐ 6.0 456,174 ‐ ‐ 63.8 7,470,720 73.8 8,218,779
10.0 628,714 ‐ ‐ ‐ ‐ 9.0 778,427 ‐ ‐ 173.0 15,985,916 192.0 17,393,057
‐ ‐ ‐ ‐ ‐ ‐ 0.0 4,057,611 ‐ ‐ ‐ 6,546,922 0.0 10,604,533
14.0 920,599 15.0 5,292,212 236.8 30,003,558 265.8 36,216,369
‐ ‐ ‐ ‐ ‐ 612,003 0.0 4,531,927 ‐ ‐ 0.0 23,930,667 0.0 29,074,597
‐ ‐ ‐ ‐ ‐ ‐ 0.0 15,590,930 ‐ ‐ ‐ ‐ 0.0 15,590,930
‐ ‐ ‐ ‐ ‐ ‐ ‐ ‐ ‐ ‐ ‐ ‐152,947 ‐ ‐152,947
‐ ‐ ‐ ‐ ‐ ‐ ‐ 8,431,562 ‐ ‐ ‐ 1,110,821 ‐ 9,542,383
‐ ‐ ‐ ‐ ‐ 108,050 ‐ ‐ ‐ ‐ ‐ 4,373,175 ‐ 4,481,225
720,053 0.0 28,554,419 0.0 29,261,716 0.0 58,536,188
14.0 920,599 720,053 15.0 33,846,631 236.8 59,265,274 265.8 94,752,557
4.0 312,905 ‐ ‐ ‐ ‐ 5.0 646,443 ‐ ‐ 59.0 7,598,737 68.0 8,558,085
8.0 586,691 ‐ ‐ ‐ ‐ 9.0 528,076 ‐ ‐ 179.0 17,351,326 196.0 18,466,093
‐ 23,154 ‐ ‐ ‐ ‐ 0.0 2,152,900 ‐ ‐ 0.0 8,466,851 0.0 10,642,905
12.0 922,750 14.0 3,327,419 238.0 33,416,914 264.0 37,667,083
‐ ‐ ‐ ‐ 0.0 612,003 0.0 1,592,195 ‐ ‐ 0.0 26,335,712 0.0 28,539,910
‐ ‐ ‐ ‐ ‐ ‐ 0.0 16,234,579 ‐ ‐ ‐ ‐ 0.0 16,234,579
‐ ‐ ‐ ‐ ‐ ‐ ‐ ‐ ‐ ‐ ‐ ‐152,947 ‐ ‐152,947
‐ ‐ ‐ ‐ ‐ ‐ ‐ 7,866,383 ‐ ‐ ‐ 1,676,000 ‐ 9,542,383
‐ ‐ ‐ ‐ ‐ 108,050 ‐ 697,776 ‐ ‐ ‐ 4,949,300 ‐ 5,755,126
0.0 720,053 0.0 26,390,933 0.0 32,808,065 0.0 59,919,051
12.0 922,750 0.0 720,053 14.0 29,718,352 238.0 66,224,979 264.0 97,586,134
92
CHIEF INFORMATION OFFICER Background Central Information Technology (IT) supports both strategic and routine operational needs for the University. The daily activities of the University depend on having a robust, efficient, and predictable IT infrastructure. This support includes providing over 120 different IT services to the University community, including network services, messaging services, storage, data center services, administrative services, classroom support, application development, help desk, and server management. IT at the University operates in a rapidly-changing external IT environment—technology change itself, along with user expectations for that technology, creates significant challenges in delivering IT services. It is as if IT were a car driving down the road, with IT staff changing the tires, all while the road is under constant construction with dirt being changed to asphalt and the direction re-routed at a moment’s notice. IT must continually re-invent itself to remain relevant in the environment in which it operates and to the constituency it serves. Speaking recently to a Wall Street Journal IT conference, a CEO of a large software company observed:
“When we think about this period that we’re in—the combination of cloud, mobile, and big data disrupting both consumer IT and enterprise IT—we are in the period of the greatest tectonic shift in the IT industry in the last 30 years. We think about the internet wave, the mainframe, the minicomputer, this is the granddaddy of them all. And the companies that we’ve seen fall so far, these are the minor tremors of the things that are going to happen over the course of the next few years.”1
External forces also increase the need for security (preventing loss of data or compromised systems with thousands of daily attempts by entities all over the world), compliance, and records management (especially dealing with increasing FOIA and other legal requests efficiently). In addition to the external environment, the University’s internal environment will be shaping services provided by central IT. The new financial model positions central IT as a cost center, providing 1 Pat Gelsinger, CEO, VMWare, Inc., The Wall Street Journal, February 11, 2014, p. R1.
services at either direct cost or indirect cost (cost allocation) to the revenue-generating schools. This model will drive increasing transparency, accountability, and ultimately more efficient and effective service from central IT, along with other central service providers. This pressure provides an opportunity for central IT to help schools make choices for IT spending that optimize the use of IT, both for the types of services provided and the economies of scale with which it can be provided. Finally, IT will play a significant role in enabling initiatives within the University Cornerstone Plan’s articulated strategic direction for teaching and research, supported by organizational excellence. Areas of Focus Given the current environment and strategic needs of the University, central IT will be focused on the following primary areas in the coming fiscal year:
1. Organizational Excellence, in support of the University’s mission and Cornerstone Plan. This focus includes ensuring: Operational Excellence--ensuring that
central IT is better, faster, and cheaper than other alternatives for IT services. Operational excellence will be accomplished by continuing to develop the following: o IT Service Management: continuing
to implement Information Technology Infrastructure Library (ITIL) best practices
o IT project management: continuing to establish and maintain project management best practices for all IT projects
o Agility: in the ever-changing IT environment, ensure that central IT becomes more agile. This will be accomplished by fostering an environment that rewards learning and staff willingness to change, hiring to bring in new skills, and partnering with vendors and others to facilitate changing to new technologies.
o Staff development: emphasize succession planning, acquisition of new skills, and cross-training
o Shoring up operational foundations: continue to become more operationally stable and efficient (examples include consolidating back-up systems, standardizing
MAJ
OR
BU
DG
ET U
NIT
OVE
RVI
EWS
93

storage, updating disaster recovery plans, performing capacity planning, implementing production-readiness checklists, and implementing more formal portfolio management)
o Automation vs. labor-intensive solutions: automate monitoring, and ensure streamlined, standardized IT solutions (and less custom, one-off solutions which are labor-intensive and inefficient)
o As savings are accrued from operational efficiencies, central IT will pursue prudent reinvestment of human and other resources
Leveraging scale—ensuring that the University can take advantage of standardization and scale where it makes sense (for example, server management, data centers, standard desktop services, web & small application development). This will result in greater efficiency and savings for the University.
Providing State-of-the-Art Technology--ensuring key technology refreshes on reasonable cycles. Upcoming refreshes in the next 12-20 months include large scale storage replacement, an upgrade to the wireless network, and implementation of a new VoIP telephone system.
Organizational alignment, enabling success of schools and other units--central IT must be viewed as a “trusted partner” to schools and units in the University. Projects and services must be aligned to support strategic and operational initiatives, and this will be accomplished through stronger governance as well as increased interaction at the cabinet and individual school and unit levels.
Partnering with other units—working with other business units to further organizational excellence. Current initiatives in this area include working with the Office of Sponsored Programs to streamline research administration operations and supporting the University’s Managerial Reporting initiative.
2. Additional Strategic Plan Alignment:
Big data/research infrastructure--central IT will partner with the director of the
Data Science Initiative as well as schools with data-intensive research programs to develop a robust high performance computing (HPC) environment, which includes compute power, storage, and network bandwidth tailored to research activities across the University.
Other Strategic plan support—as other strategies in the Cornerstone Plan are developed, central IT will partner as appropriate with the strategy leaders to help enable their initiatives. Among the strategies that will likely include significant IT components are Total Advising and teaching (online/hybrid) strategies.
Organizational excellence—as mentioned above, central IT can be a significant enabler of University organizational excellence, centralizing, standardizing, and automating, helping the University administrative operations to be more efficient and effective. As data from external benchmarking is supplemented and validated, IT will be able to support targeted strategies for technology-enabled organizational improvements.
3. Strengthening IT Security, Policy, and
Records Management The University faces growing
challenges with cyber security, compliance, and records management. With additional funding, the University will be able to enhance its ability to operate effectively in this ever-changing environment.
2014-15 Operating Budget The CIO and Information Technology Services (ITS) are funded in a hybrid model, with Communications Services operating as a self-supporting auxiliary. The remainder of the unit is funded through a traditional centralized budget target and a direct allocation of 2.27 percent of all generated F&A cost recoveries.
MAJ
OR
BU
DG
ET U
NIT
OVE
RVI
EWS
94

Units classified as auxiliary units (an entity that exists to furnish goods or services to students, faculty, or staff and charges a fee to recover the cost of the service) are expected to be fully self-supporting for both operating and capital purposes. An auxiliary unit, Communications Services will retain revenues generated (charges to Academic Division and Medical Center units and fee assessments to students) and will be held responsible for generating sufficient revenues to cover its planned expenditures. In addition, the unit is required to pay a general and administrative overhead to the University for support services; in 2014-15, that amount will be $244,000. For 2014-15, 63 percent of the CIO’s operating budget is from tuition and state general funds. Communication Services’ sales and services revenue (including student fees) will provide 34 percent, while distributions from the University’s F&A cost recoveries will provide another 3 percent. For regular session students, the 2014-15 fees are set at $24 for debt service related to the new data center and $20 for the University-wide Microsoft licensing agreement. For CIO/ITS, the 2014-15 operating budget (see page 96) is $46.2 million, with the primary spending initiatives being compensation (56 percent), Communication Services’ non-personal services expenditures, such as equipment and licensing (22 percent), and other non-personal services and strategic initiatives (14 percent). Funding will be allocated to the target budgets for salary increases and compression adjustments as authorized by the state. The 2014-15 budget includes $850,000 allocated from state general funds in support of U.Va.’s participation in the 4-VA program initiative with George Mason University, James Madison University, and Virginia Tech. This funding has been received since 2011-12. In 2014-15, the CIO will use student fee revenue to cover internal debt service of $480,000 for the students’ share of the new data center.
Capital Plan In 2014-15, Communication Services plans to transfer $2.9 million from operations into its reserve. The 10 Year Plan demonstrates that we can replace much of our most expensive system, our telephone infrastructure, via cash from the Medical Center and debt service with no planned fee increases in the near term. The Voice over Internet Protocol (VoIP) implementation project is underway, and is scheduled to conclude in September 2015.
.
Communications Services (in thousands) R&R ReserveProjected Balance, 7/1/13 $3,209
Plus: Transfers from Operating 2,863
Less: Planned Expenditures 4,048
Projected Balance, 6/30/14 $2,024
MAJ
OR
BU
DG
ET U
NIT
OVE
RVI
EWS
95
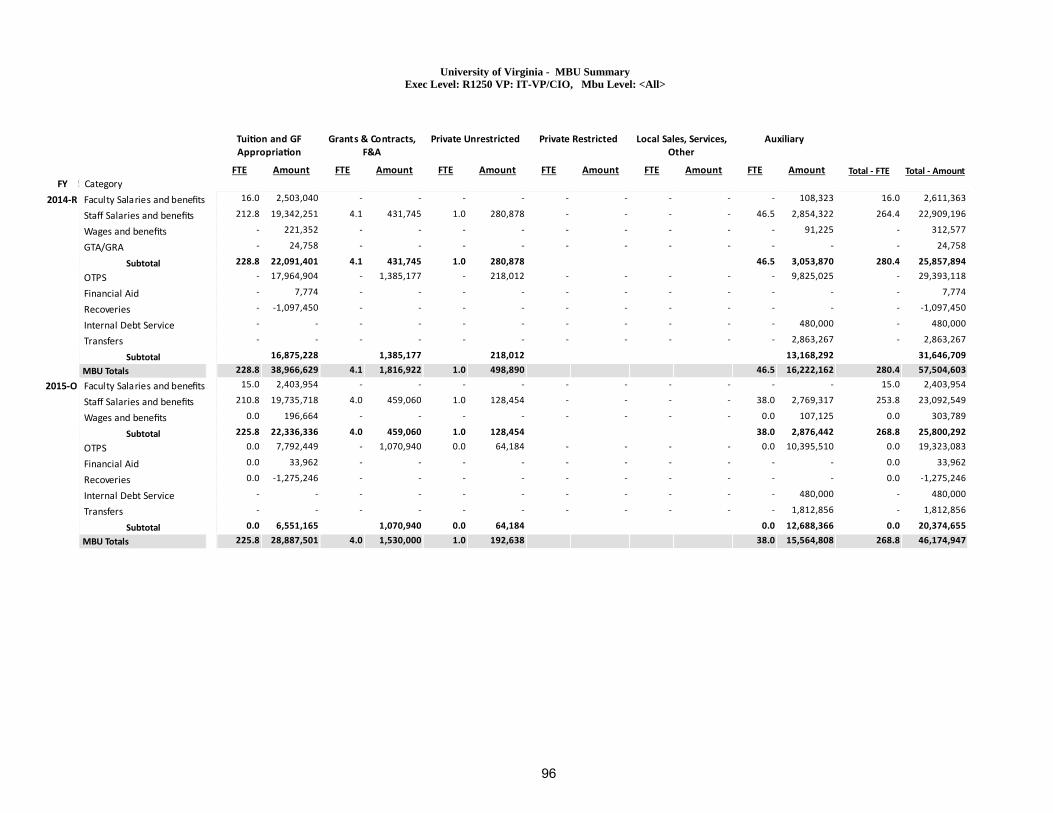
University of Virginia - MBU SummaryExec Level: R1250 VP: IT-VP/CIO, Mbu Level: <All>
1
Tui on and GFAppropria on
FTE Amount
2
Grants & Contracts,F&A
FTE Amount
3
Private Unrestricted
FTE Amount
4
Private Restricted
FTE Amount
5
Local Sales, Services,Other
FTE Amount
6
Auxiliary
FTE Amount Total ‐ FTE Total ‐ Amount
FY CTCS Category
2014‐R Faculty Salaries and benefitsStaff Salaries and benefitsWages and benefitsGTA/GRA
Subtotal
OTPS
Financial Aid
Recoveries
Internal Debt Service
Transfers
Subtotal
MBU Totals
2015‐O Faculty Salaries and benefitsStaff Salaries and benefitsWages and benefits
Subtotal
OTPS
Financial Aid
Recoveries
Internal Debt Service
Transfers
Subtotal
MBU Totals
16.0 2,503,040 ‐ ‐ ‐ ‐ ‐ ‐ ‐ ‐ ‐ 108,323 16.0 2,611,363
212.8 19,342,251 4.1 431,745 1.0 280,878 ‐ ‐ ‐ ‐ 46.5 2,854,322 264.4 22,909,196
‐ 221,352 ‐ ‐ ‐ ‐ ‐ ‐ ‐ ‐ ‐ 91,225 ‐ 312,577
‐ 24,758 ‐ ‐ ‐ ‐ ‐ ‐ ‐ ‐ ‐ ‐ ‐ 24,758
228.8 22,091,401 4.1 431,745 1.0 280,878 46.5 3,053,870 280.4 25,857,894
‐ 17,964,904 ‐ 1,385,177 ‐ 218,012 ‐ ‐ ‐ ‐ ‐ 9,825,025 ‐ 29,393,118
‐ 7,774 ‐ ‐ ‐ ‐ ‐ ‐ ‐ ‐ ‐ ‐ ‐ 7,774
‐ ‐1,097,450 ‐ ‐ ‐ ‐ ‐ ‐ ‐ ‐ ‐ ‐ ‐ ‐1,097,450
‐ ‐ ‐ ‐ ‐ ‐ ‐ ‐ ‐ ‐ ‐ 480,000 ‐ 480,000
‐ ‐ ‐ ‐ ‐ ‐ ‐ ‐ ‐ ‐ ‐ 2,863,267 ‐ 2,863,267
16,875,228 1,385,177 218,012 13,168,292 31,646,709
228.8 38,966,629 4.1 1,816,922 1.0 498,890 46.5 16,222,162 280.4 57,504,603
15.0 2,403,954 ‐ ‐ ‐ ‐ ‐ ‐ ‐ ‐ ‐ ‐ 15.0 2,403,954
210.8 19,735,718 4.0 459,060 1.0 128,454 ‐ ‐ ‐ ‐ 38.0 2,769,317 253.8 23,092,549
0.0 196,664 ‐ ‐ ‐ ‐ ‐ ‐ ‐ ‐ 0.0 107,125 0.0 303,789
225.8 22,336,336 4.0 459,060 1.0 128,454 38.0 2,876,442 268.8 25,800,292
0.0 7,792,449 ‐ 1,070,940 0.0 64,184 ‐ ‐ ‐ ‐ 0.0 10,395,510 0.0 19,323,083
0.0 33,962 ‐ ‐ ‐ ‐ ‐ ‐ ‐ ‐ ‐ ‐ 0.0 33,962
0.0 ‐1,275,246 ‐ ‐ ‐ ‐ ‐ ‐ ‐ ‐ ‐ ‐ 0.0 ‐1,275,246
‐ ‐ ‐ ‐ ‐ ‐ ‐ ‐ ‐ ‐ ‐ 480,000 ‐ 480,000
‐ ‐ ‐ ‐ ‐ ‐ ‐ ‐ ‐ ‐ ‐ 1,812,856 ‐ 1,812,856
0.0 6,551,165 1,070,940 0.0 64,184 0.0 12,688,366 0.0 20,374,655
225.8 28,887,501 4.0 1,530,000 1.0 192,638 38.0 15,564,808 268.8 46,174,947
96

VICE PRESIDENT AND CHIEF OFFICER FOR
DIVERSITY AND EQUITY Overview of Operations The Office for Diversity and Equity (ODE) provides leadership, information, consultation, coordination, and assistance to the various units and constituencies within the University in an effort to embrace diversity and equity as pillars of excellence, synergize actions at all levels of the institution, and cultivate inclusiveness and mutual respect throughout the community. ODE also reaches beyond the University to establish beneficial relationships with individual and institutional partners who share mutual goals and interests. The University is committed to a diverse and inclusive environment in which differences are welcomed and valued. Collaboration with student groups, alumni, faculty, individuals, and organizations from the local community helps to enrich the appreciation for diversity within the community. Together, an institutional infrastructure can be built that will sustain what has been set in motion and take the University to the next level. ODE’s vision is to maximize and leverage diversity, equity, and inclusion to create welcoming, engaging, and productive learning environments for faculty, staff, students, and community. Strategic Direction ODE’s mission is to promote an inclusive, welcoming, and respectful environment by embracing diversity as a core value tied inextricably to the University’s priorities. In 2014-15, the ODE will strive to: Encourage commitment to diversity and equity in
all aspects of academics, extracurricular activities, the workplace, and within the surrounding communities;
Enhance the student experience academically and
culturally; Enhance staff relations in collaboration with the
Vice President and Chief Human Resources Officer; and
Enhance faculty relations in collaboration with the
Vice Provost for Faculty Recruitment and Retention.
The UVA IDEA (inclusion, diversity, equity, access) Fund trustees will enhance and support the Office for Diversity and Equity initiatives.
2014-15 Operating Budget The ODE is funded through a traditional centralized budget target and self-generated grants, contracts and F&A. For 2014-15, 73 percent of ODE’s operating budget is funded by the University’s unrestricted endowment fund, with the remaining 27 percent from the National Science Foundation’s Louis Stokes Alliances for Minority Participation grant, a five-year, $3.5 million mid-level alliance grant (1 of 9 institutions) and F&A.
For the ODE, the 2014-15 operating budget (see the following page) is $1.1 million, with the primary spending initiatives being compensation (69 percent), non-personal services, and strategic initiatives. OTPS expenditures include providing support for a wide range of student, faculty, and community activities. These engagements are manifestations of efforts to increase communication and interaction across lines of race, ethnicity, gender, religion, class, sexual orientation, and physical condition. Funding will be allocated to the target budgets for salary increases and compression adjustments as authorized by the state. Capital Plan The ODE does not have any projects on the Major Capital Projects Plan.
MAJ
OR
BU
DG
ET U
NIT
OVE
RVI
EWS
97

University of Virginia - MBU SummaryExec Level: R0061 VP: DE-VP/Diversity and Equity, Mbu Level: <All>
1
Tui on and GFAppropria on
FTE Amount
2
Grants & Contracts,F&A
FTE Amount
3
Private Unrestricted
FTE Amount
4
Private Restricted
FTE Amount
5
Local Sales, Services,Other
FTE Amount
6
Auxiliary
FTE Amount Total ‐ FTE Total ‐ Amount
FY CTCS Category
2014‐R Faculty Salaries and benefitsStaff Salaries and benefitsWages and benefits
Subtotal
OTPS
Financial Aid
Subtotal
MBU Totals
2015‐O Faculty Salaries and benefitsStaff Salaries and benefitsWages and benefits
Subtotal
OTPS
Financial Aid
Subtotal
MBU Totals
‐ ‐ ‐ 5,992 1.0 388,120 ‐ ‐ ‐ ‐ ‐ ‐ 1.0 394,112
‐ ‐ 1.3 61,941 4.0 299,294 ‐ ‐ ‐ ‐ ‐ ‐ 5.3 361,235
‐ ‐ ‐ 3,814 ‐ 20,517 ‐ ‐ ‐ ‐ ‐ ‐ ‐ 24,331
1.3 71,747 5.0 707,931 6.3 779,678
‐ ‐ ‐ 277,372 ‐ 111,392 ‐ ‐ ‐ ‐ ‐ ‐ ‐ 388,764
‐ ‐ ‐ 7,719 ‐ ‐ ‐ ‐ ‐ ‐ ‐ ‐ ‐ 7,719
285,091 111,392 396,483
1.3 356,838 5.0 819,323 6.3 1,176,161
‐ ‐ ‐ ‐ 1.0 398,805 ‐ ‐ ‐ ‐ ‐ ‐ 1.0 398,805
‐ ‐ 1.3 61,308 4.0 302,195 ‐ ‐ ‐ ‐ ‐ ‐ 5.3 363,503
‐ ‐ ‐ 1,908 0.0 10,600 ‐ ‐ ‐ ‐ ‐ ‐ 0.0 12,508
1.3 63,216 5.0 711,600 6.3 774,816
‐ ‐ ‐ 203,389 0.0 109,931 ‐ ‐ ‐ ‐ ‐ ‐ 0.0 313,320
‐ ‐ ‐ 36,054 ‐ ‐ ‐ ‐ ‐ ‐ ‐ ‐ ‐ 36,054
239,443 0.0 109,931 0.0 349,374
1.3 302,659 5.0 821,531 6.3 1,124,190
98

VICE PRESIDENT FOR RESEARCH Overview of Operations The Office of the Vice President for Research (VPR) supports five main ongoing strategic functions: 1) research enhancement; 2) graduate studies and postdoctoral programs; 3) research compliance; 4) U.Va. innovation, external research partnerships, and technology commercialization; and 5) research fundraising and development. The role of VPR is to enhance academic excellence by creating, catalyzing and nurturing early-stage, collaborative, high-value, cross-school, multi-disciplinary research, scholarship and innovation opportunities that distinguish the University, and by providing service to school and non-school units to integrate, align and realize the vision set forth in the University’s Cornerstone Plan and the President’s priorities of faculty retention and recruitment, curriculum enhancement, and research. The VPR’s strategic and service missions are linked, and equip us with a University-wide landscape view to explore, seed, and enhance distinctive collaborative research opportunities. Offices that report to the VPR include Environmental Health and Safety (EHS), the Center for Comparative Medicine (CCM) and the Virginia Quarterly Review (VQR). Strategic Direction Our financial planning incorporates the continued investment of funds to support strategic efforts that move the institutional research mission and President’s priorities forward and further distinguish the University. To that end, the VPR Office will anticipate future opportunities and continuously explore and seed the research landscape in fiscal year 14-15, including investing in proof-of-concept projects, matching funds for distinctive grant proposals, lab bridge and gap funds for research-active faculty, and awards for faculty excellence, so that opportunities, when they arise, can be assessed and seized rapidly. The VPR Office also continuously catalyzes several early-stage pan-University initiatives, similar in approach to that used in early stages of the Big Data initiative . Fiscal year 2014-15 goals for these initiatives are outlined below and will advance and reinforce the five pillars of the Cornerstone Plan and the President’s priorities to bring distinction to U.Va. through high-value collaborations and the resulting impact on the world.
We expect the resultant outcomes to include the generation of new external research support, including philanthropy; new interdisciplinary, multi-school recruiting; higher performance from existing faculty; enhanced experiential learning opportunities for students; and extraordinary leadership in creating new ideas and solutions to complex world challenges. Sustainability and the Environment Sustainability initiatives will focus on developing innovative pan-university cross-disciplinary research and education collaborations that will bring together colleagues from UVa’s eleven schools. Initiatives will build on current project-based collaborations in the Schools of Architecture, Arts & Sciences, Commerce, Business, Medicine, Education, Engineering, Law and Nursing, and will develop new partnerships across grounds and with external partners, as follows:
1. Hold Sustainability Summit, bringing together
thought leaders from U.Va. and partner institutions to discuss the vision and opportunities for a pan-university initiative in sustainability research.
2. Establish and enhance collaborations with external partners including corporations, private individuals, universities, NGOs and foundations. Examples include The Brookings Institution, the National Fish and Wildlife Foundation (NFWF), the Security and Sustainability Forum and The Nature Conservancy.
3. Increase opportunities for high-impact student engagement in sustainability research in local, regional, and global settings.
4. Continue to develop the Global Water Games template for wide application and distribution.
5. Establish a global center for Coastal Sustainability and Resilience by expanding UVa's Coastal Reserve Long-Term Ecological Research program.
Quantitative Systems Biosciences 1. Continue to promote potentially distinguishing
areas in the biosciences identified jointly with Deans, unit leadership and faculty. Current area of focus is an interdisciplinary cognitive science initiative which conjoins the College of Arts & Sciences, the Schools of Medicine, Education and Engineering.
2. Seed fund 2-3 collaborations under cognitive science to generate follow-on funding.
MAJ
OR
BU
DG
ET U
NIT
OVE
RVI
EWS
99

Energy Systems Prototyping, Research, Innovation and Translation, or ESPRIT 1. Create a Max Planck Institute-UVA Joint
Laboratory at UVA in Chemical Energy Sciences, involving faculty and students from the College of Arts and Science and the School of Engineering, in collaboration with scientists from the Max Planck Institute for Chemical Energy Conversion.
2. Create a competition for seed ESPRIT design/initial prototyping Capstone projects focused upon grand challenge problems, in partnership with Schools. Topical areas might include the energy/water/environment nexus, and prototype systems to substantially capture and utilize waste heat for energy generation.
3. In collaboration with U.Va. Licensing and Ventures Group, the Darden School iLab, and Central Development, establish external funding opportunities for ESPRIT and i6 energy systems seed projects which have matured beyond proof-of-concept and have developed initial IP.
U.Va. – Latin America Initiative or INSPIRE-LA Catalytic VPR initiatives in Latin America will be enhanced, in collaboration with the Executive Vice President and Provost, and the Vice Provost for Global Affairs.
1. Establish new research partnerships, expand
funded research, and increase exchange of graduate and post-doc trainees with top-10 ranked Latin American universities, leading institutes and industry in Brazil, Chile, Mexico and Colombia, particularly in grand challenge areas of U.Va. strategic focus, including Big Data, Sustainability, Energy, Water, Food, Democratic Institutions, Life Sciences and Health, and Humanities and Social Sciences.
2. Engage U.Va. alumni living in Latin America, with initial emphasis in Brazil, to engender support and financial contributions in support of INSPIRE-LA through "friends and family" events.
3. Establish a Latin America Leadership Speakers Series, hosting Latin American national leaders to visit and speak at U.Va.
4. Translate recently established bilateral research partnerships between U.Va. and Brazil into multilateral U.Va.-Brazil-other nation networks focused upon global challenge multidisciplinary topics. Near-term focus is on sustainable cities (U.Va.-Federal U Rio de Janeiro, BR-Tsinghua
U, China), Astronomy (with Chile and Brazil), and Public Health.
OpenGrounds In the Cornerstone Plan, strategy 5 calls for the expansion of OpenGrounds space in year 1, increased faculty and staff participation in year 2 and further expansion of interior and exterior spaces in years 3-5. OpenGrounds is currently in the design process for the initial space expansion, with construction scheduled for Summer 2014. Key goals for 14-15 include: 1. Prototype new models of university-wide student
challenges at a range of time frames, for both internal and external partnerships.
2. Complete the expansion of the Corner Studio space in the corner building.
3. Prototype the on-Grounds virtual network and platform with capacity to extend nationally.
4. Work with student interns to link collaborative culture fostered at OpenGrounds to first year dorms.
5. Develop "Friends of OpenGrounds" program to reach and involve a broad array of alumni and supporters of the mission of OpenGrounds.
6. Enhance partnerships with university organizations that provide student experiences, for example, Jefferson Public Citizens, Center for Global Health, Art Scholars, Undergraduate research network, Global Grounds research initiative, and Morven/Presidential precinct partnerships.
We next discuss the primary goals for 2014-15 of each VPR operational unit. U.Va. Innovation 1. Enhance customer service by providing educational
opportunities in innovation for U.Va. faculty, staff and students; simplifying the invention disclosure process, and establishing event-based and open feedback channels for stakeholders.
2. Improve target pursue rates by increasing the number of strategic technology investments and investing in select technologies; providing high-quality support for U.Va. translational research and related initiatives within and outside U.Va. Innovation; and implementing consistent diligence and invention processing timelines.
MAJ
OR
BU
DG
ET U
NIT
OVE
RVI
EWS
100

Graduate Studies and Postdoctoral Programs 1. Increase opportunities for interdisciplinary and
problem-based research and engagement of graduate students and faculty collaborations by replicating the successful model followed last year under the Big Data area with the support of the Jefferson Trust and the new Data Science Institute.
2. Working in partnership with Schools and personnel from Development and Corporate and Foundation Relations, increase the number of externally-funded fellowship opportunities for graduate students, especially in areas related to goal #1 above.
3. Enhance career development support and career opportunities for postdoctoral researchers and scholars.
Environmental Health and Safety 1. Expand the University’s laboratory safety program
beyond those highly-regulated areas by emphasizing the better-management of chemicals to ensure safe labs and compliance with the state’s fire codes; create a group of laboratory safety consultants who will assist laboratories with reviewing their programs to make procedures safer and assist in the development of training specific to the equipment and procedures of each research group; implement a more rigorous laboratory inspection program to meet the expectations of the State Fire Marshal; and more efficiently identify new faculty, new programs, and new specialized equipment early in the planning stages of renovations, installations, etc. to ensure safe, efficient and timely operations.
Center for Comparative Medicine (CCM) 1. Ensure that veterinary care and animal husbandry
are performed and documented in compliance with federal and Commonwealth regulations to maintain the accreditation of the University’s animal use program by the Association for the Assessment and Accreditation of Laboratory Animal Care, Intl (AAALAC), and the Animal Welfare Act (CFR 9).
2. Ensure that the needs of UVa’s basic sciences, biomedical research, preclinical testing and translational medicine and continuing medical education communities and activities are met in advance of changes in requirements for research animal models.
3. Facilitate the generation of highly reproducible data from biomedical research through the provision and validation of disease-free animals.
Virginia Quarterly Review (VQR) 1. Produce editorially excellent, visually engaging
print content for the VQR magazine. A targeted direct mail campaign will be implemented to attract new subscribers and to retain existing ones.
2. Continue award-winning editorial strategy by focusing VQR’s content in five areas: (1) literature, (2) long-form journalism, (3) photojournalism, (4) commentary, and (5) multimedia.
3. Engage the national audience and university community through public events and partnerships with organizations and venues with shared interests to create conversations around VQR's content and to advance the goal of intellectual inquiry for societal benefit. Engage student interns in the process.
4. Promote the new VQR digital magazine to maximize VQR’s reach and impact.
Research Fundraising and Development 1. Double annual philanthropic commitments to $4
million and double the size of the prospective donor pool for the following pan-university initiatives: bioscience proof-of-concept funds, ESPRIT, graduate fellowships, Latin America, OpenGrounds, and sustainability.
2. Enhance communication and engagement strategies by updating research giving Web pages and evaluating the FY13-14 translational research crowd-funding pilot and making a recommendation to University Advancement regarding a broader phase focused on Presidential-, School- and unit-based priorities.
3. Raise funds for a new partnership with the School of Engineering and the Graduate School of Arts and Sciences involving a joint laboratory with the Max Planck Institute for Chemical Energy Conversion.
2014-15 Operating Budget The Office of the Vice President for Research has a hybrid budget model, funded through a traditional centralized budget target, a direct allocation of 10.9 percent of all generated F&A cost recoveries, private funds (endowment distributions and gifts), and assessments and recoveries for services (including assessment of animal husbandry per diem rates and recoveries of research compliance expenditures). For 2014-15, 59 percent of the Vice President for Research’s expenditure budget (net of $9.3 million in recoveries from schools for animal husbandry, veterinary care services, and research compliance) is
MAJ
OR
BU
DG
ET U
NIT
OVE
RVI
EWS
101
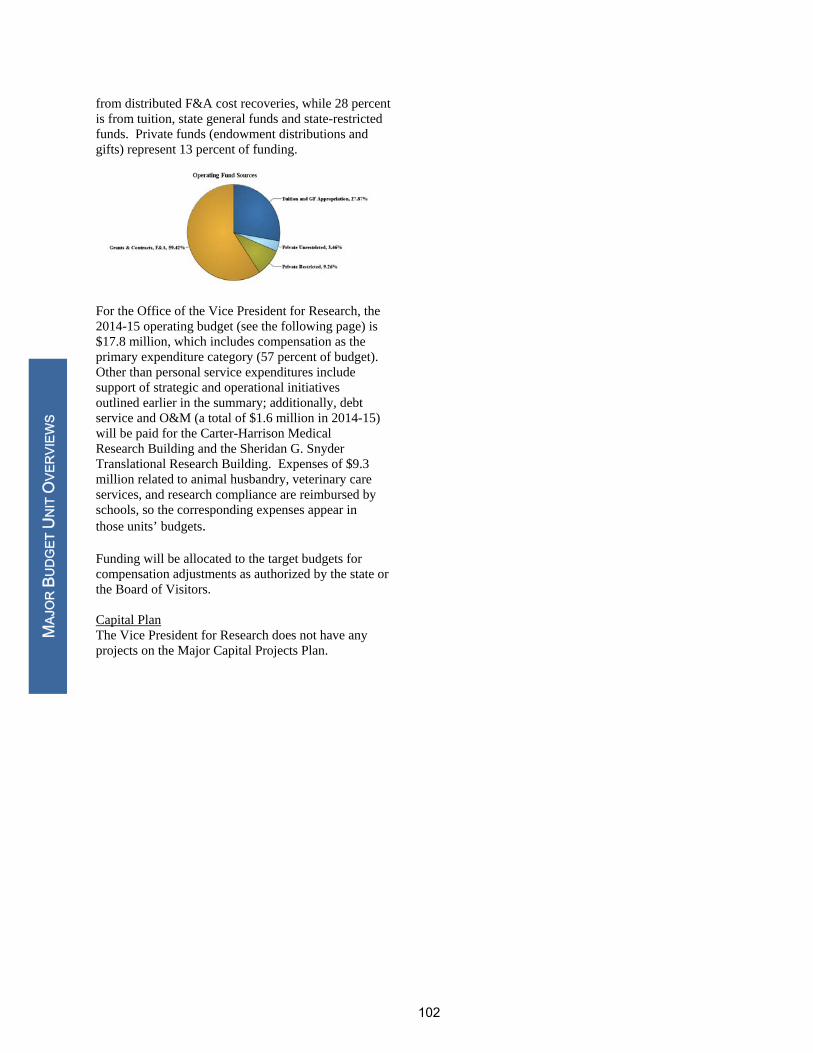
from distributed F&A cost recoveries, while 28 percent is from tuition, state general funds and state-restricted funds. Private funds (endowment distributions and gifts) represent 13 percent of funding.
For the Office of the Vice President for Research, the 2014-15 operating budget (see the following page) is $17.8 million, which includes compensation as the primary expenditure category (57 percent of budget). Other than personal service expenditures include support of strategic and operational initiatives outlined earlier in the summary; additionally, debt service and O&M (a total of $1.6 million in 2014-15) will be paid for the Carter-Harrison Medical Research Building and the Sheridan G. Snyder Translational Research Building. Expenses of $9.3 million related to animal husbandry, veterinary care services, and research compliance are reimbursed by schools, so the corresponding expenses appear in those units’ budgets. Funding will be allocated to the target budgets for compensation adjustments as authorized by the state or the Board of Visitors. Capital Plan The Vice President for Research does not have any projects on the Major Capital Projects Plan.
MAJ
OR
BU
DG
ET U
NIT
OVE
RVI
EWS
102

University of Virginia - MBU SummaryExec Level: R1350 VP: RS-VP/Res&Public Svc, Mbu Level: <All>
1
Tui on and GFAppropria on
FTE Amount
2
Grants & Contracts,F&A
FTE Amount
3
Private Unrestricted
FTE Amount
4
Private Restricted
FTE Amount
5
Local Sales, Services,Other
FTE Amount
6
Auxiliary
FTE Amount Total ‐ FTE Total ‐ Amount
FY CTCS Category
2014‐R Faculty Salaries and benefitsStaff Salaries and benefitsWages and benefitsGTA/GRA
Subtotal
OTPS
Financial Aid
Recoveries
Internal Debt Service
Subtotal
MBU Totals
2015‐O Faculty Salaries and benefitsStaff Salaries and benefitsWages and benefitsGTA/GRA
Subtotal
OTPS
Financial Aid
Recoveries
Internal Debt Service
Subtotal
MBU Totals
5.3 982,550 17.6 2,238,070 1.0 124,639 0.6 109,540 0.7 324,036 ‐ ‐ 25.2 3,778,835
23.5 1,916,517 52.0 3,984,242 3.0 362,028 0.9 164,032 59.7 2,804,198 ‐ ‐ 139.0 9,231,017
‐ 27,193 ‐ 228,248 ‐ 8,250 ‐ 384,178 ‐ 109,540 ‐ ‐ ‐ 757,409
‐ ‐ 3.1 198,781 ‐ ‐ 0.3 19,764 ‐ ‐ ‐ ‐ 3.4 218,545
28.8 2,926,259 72.6 6,649,341 4.0 494,917 1.8 677,514 60.4 3,237,774 167.6 13,985,805
‐ 1,950,766 ‐ 4,366,326 ‐ 367,796 ‐ 441,503 ‐ 4,096,500 ‐ ‐ ‐ 11,222,891
‐ 513,937 ‐ 240,503 ‐ ‐ ‐ 239,095 ‐ ‐ ‐ ‐ ‐ 993,535
‐ ‐90,000 ‐ ‐2,650,000 ‐ ‐ ‐ ‐ ‐ ‐7,489,440 ‐ ‐ ‐ ‐10,229,440
‐ ‐ ‐ 1,572,472 ‐ ‐ ‐ ‐ ‐ ‐ ‐ ‐ ‐ 1,572,472
2,374,703 3,529,301 367,796 680,598 ‐3,392,940 3,559,458
28.8 5,300,962 72.6 10,178,642 4.0 862,713 1.8 1,358,112 60.4 ‐155,166 167.6 17,545,263
4.4 976,604 17.8 2,393,530 1.0 123,405 0.8 127,544 0.6 209,786 ‐ ‐ 24.6 3,830,869
19.6 1,792,215 61.6 4,799,599 2.5 364,446 0.8 145,713 74.8 3,480,025 ‐ ‐ 159.3 10,581,998
0.0 26,500 ‐ 244,579 0.0 10,424 ‐ 421,103 0.0 77,780 ‐ ‐ 0.0 780,386
‐ ‐ 3.0 179,486 ‐ ‐ 0.5 31,452 ‐ ‐ ‐ ‐ 3.5 210,938
24.0 2,795,319 82.4 7,617,194 3.5 498,275 2.1 725,812 75.4 3,767,591 187.4 15,404,191
0.0 1,749,308 ‐ 4,433,380 0.0 131,206 0.0 666,589 0.0 2,030,000 ‐ ‐ 0.0 9,010,483
0.0 625,781 ‐ 179,500 ‐ ‐ 0.0 292,078 ‐ ‐ ‐ ‐ 0.0 1,097,359
0.0 ‐100,000 ‐ ‐3,000,000 ‐ ‐ ‐ ‐ 0.0 ‐6,198,534 ‐ ‐ 0.0 ‐9,298,534
‐ ‐ ‐ 1,581,816 ‐ ‐ ‐ ‐ ‐ ‐ ‐ ‐ ‐ 1,581,816
0.0 2,275,089 3,194,696 0.0 131,206 0.0 958,667 0.0 ‐4,168,534 0.0 2,391,124
24.0 5,070,408 82.4 10,811,890 3.5 629,481 2.1 1,684,479 75.4 ‐400,943 187.4 17,795,315
103

VICE PRESIDENT AND CHIEF STUDENT AFFAIRS
OFFICER Overview of Operations The Division of Student Affairs supports the University’s primary goal of developing citizen leaders by promoting the intellectual, cultural, personal and social growth of students while encouraging their physical and psychological well-being. In practice, Student Affairs: 1) seeks to ensure all students are safe and well so that they can focus on academics; 2) promotes ways for students to apply what they learn in the classroom outside the classroom, which is exemplified by how they govern themselves and hold themselves responsible and accountable (student self-governance); and 3) provides structures and programs that support development of skills and knowledge, including those that align with career development and that help the students forge institutional and community connections. All Student Affairs programs and services are shaped by the core values that define the student experience– self-governance, academic rigor, honor, public service, health and wellness, and multiculturalism and diversity. The Office of the Vice President and Chief Student Affairs Officer (VP&CSAO) provides leadership and direction to the units that comprise the Division. Offices reporting to the VP&CSAO include the Dean of Students and its units (i.e., Orientation and New Student Programs, Residence Life, Newcomb Hall, Fraternity and Sorority Life), the Office of African-American Affairs, Student Health and University Career Services (UCS). The VP&CSAO works collaboratively with the major unit heads to ensure that all Divisional areas render programs and services in the most effective and efficient manner in support of the Student Experience and the University’s overall mission. In particular Student Affairs programs and services align with the vision set forth in the Cornerstone Plan, specifically in Pillar 1 (Extend and Strengthen the University’s Distinctive Residential Culture) and Pillar 3 (Provide Educational Experiences that Deliver New Levels of Student Engagement): Strategic Direction Student Affairs plays a unique role in engaging students in University life by supporting students’ social, physical, psychological and aspirational development, and connecting their experiences across schools in ways that shape their connection to the University of Virginia during their tenure on Grounds and beyond. As reflected in the VP&CSAO annual goals, Student Affairs’ strategies relate to the Division’s
five core functions: student behavior, student involvement, student climate, residence life, and health and wellness. The VP&CSAO works closely with the major unit heads to systematize individual unit planning so that it is consonant with Divisional planning; a process that enables the Division to direct resources in ways that support major strategies and to identify initiatives that could be supported through fundraising. The Division maximizes operating efficiencies and uses available resources creatively to meet its core objectives in support of the University’s mission. The FY15 base budgets of all major units align with this practice. Consistent with the vision articulated in the Cornerstone Plan, Student Affairs FY15 budget proposals – specifically its plan to move forward with a new vision for career development, to benefit from new partnerships between Student Health and internal and external partners, to pursue new strategies that strengthen prevention in Sexual Misconduct, and to collaborate with the Deans of the Batten School of Public Policy and the McIntire School of Commerce to implement a distinctive, year-round student leadership development program that integrates curricular, co-curricular and extracurricular opportunities - are examples of initiatives that advance the President’s priorities to Extend and Strengthen the University’s Distinctive Residential Culture, Provide Educational Experiences that Deliver New Levels of Student Engagement, and Steward the University’s Resources to Promote Academic Excellence and Affordable Access. .
2014-15 Operating Budget The VP&CSAO areas are funded on a hybrid model. Student Health, Newcomb Hall, and Student Programming operate as self-supporting auxiliaries, while New Student Orientation functions as a self-supporting, non-auxiliary activity. The remaining units are funded through a traditional centralized budget target and self-generated grants and contracts and private resources. Units classified as auxiliary units (an entity that exists to furnish goods or services to students, faculty, or staff and charges a fee to recover the cost of the service) are expected to be fully self-supporting for both operating and capital purposes. As auxiliary units, Student Health, Newcomb Hall, and Student Programming retain revenues generated (primarily fee assessments to students) and are held
MAJ
OR
BU
DG
ET U
NIT
OVE
RVI
EWS
104

responsible for generating sufficient revenues to cover their planned expenditures. In addition, the units are required to pay a general and administrative overhead to the University for support services; for 2014-15, that amount will total $0.9 million. As a self-supporting activity, the Office of Orientation and New Student Programs retains the revenues generated through student payments and is held responsible for meeting direct expenditures (including salary increases). However, the unit does not pay a general and administrative assessment. As shown on the pie chart, approximately 58 percent of the VP&CSAO’s 2014-15 operating budget comes from student fees paid to the auxiliary activities. For regular session students, the 2014-15 fees are set at $417 for Student Health, $208 for Newcomb Hall, and $27 for Student Programming. Approximately 22 percent of the operating budget is from tuition and state general funds (including new student orientation revenues), while 14 percent is provided from endowment distributions and gifts. Approximately 6 percent of the budget is related to activity fees assessed to students and managed by students for student-initiated programs (including the student activity fee managed by Student Council and the programming fees collected by each residential college).
For the VP&CSAO, the 2014-15 operating budget (see page 106) is $28.3 million, primarily related to compensation (59.7 percent of budget). OTPS expenditures include support for the strategic and operational initiatives outlined earlier in the summary. The University proposes to allocate $48,664 to Residence Life in support of net increases in housing and dining rates for residence staff; $16,284 for additional residence staff and restructured pay plan. Funding will be allocated to the target budgets for compensation adjustments as authorized by the state or the Board of Visitors.
Capital Plan The VP&CSAO does not have any projects on the Major Capital Projects Plan.The charts below demonstrate the Repair & Renewal (R&R) activities for Newcomb Hall, the Newcomb Hall Expansion Reserve and the Repair & Renewal for Student Health. The Newcomb Hall Expansion Reserve planned expenditures includes $1.2 million in annual debt service for the Newcomb Hall Expansion and $1.4 million in debt service for the Central Grounds/Alderman Clemons Library Chiller. Both units are in compliance with the Board reserve requirement for reinvesting in facilities at 1.5 percent annually:
Newcomb Hall (in thousands) R&R ReserveProjected Balance, 7/1/14 $3,116Plus: Transfers from Operating 1,468Less: Planned Expenditures 1,600Projected Balance, 6/30/15 $2,984
Newcomb Hall (in thousands) Expansion ReserveProjected Balance, 7/1/14 $2,770Plus: Transfers from Operating 2,515Less: Planned Expenditures 3,589Projected Balance, 6/30/15 $1,696
Student Health (in thousands) R&R ReserveProjected Balance, 7/1/14 $1,341Plus: Transfers from Operating 125Less: Planned Expenditures 110Projected Balance, 6/30/15 $1,356
MAJ
OR
BU
DG
ET U
NIT
OVE
RVI
EWS
105

University of Virginia - MBU SummaryExec Level: R1140 VP: SA-VP/Student Affairs, Mbu Level: <All>
1
Tui on and GFAppropria on
FTE Amount
2
Grants & Contracts,F&A
FTE Amount
3
Private Unrestricted
FTE Amount
4
Private Restricted
FTE Amount
5
Local Sales, Services,Other
FTE Amount
6
Auxiliary
FTE Amount Total ‐ FTE Total ‐ Amount
FY CTCS Category
2014‐R Faculty Salaries and benefitsStaff Salaries and benefitsWages and benefitsGTA/GRA
Subtotal
OTPS
Financial Aid
Recoveries
Internal Debt Service
Transfers
Subtotal
MBU Totals
2015‐O Faculty Salaries and benefitsStaff Salaries and benefitsWages and benefitsGTA/GRA
Subtotal
OTPS
Financial Aid
Central Assessment
Recoveries
Transfers
Subtotal
MBU Totals
17.2 2,187,303 0.4 68,069 4.1 443,074 3.6 490,862 ‐ ‐ 28.9 3,740,013 54.3 6,929,321
34.6 2,151,549 1.0 59,116 11.0 685,925 3.0 227,399 5.8 327,081 68.0 4,327,492 123.4 7,778,562
‐ 233,115 ‐ 16,843 ‐ 86,398 ‐ 38,240 ‐ 55,844 ‐ 1,105,139 ‐ 1,535,579
‐ ‐ ‐ ‐ ‐ ‐ 0.3 13,501 ‐ ‐ ‐ ‐ 0.3 13,501
51.8 4,571,967 1.4 144,028 15.1 1,215,397 6.8 770,002 5.8 382,925 96.9 9,172,644 177.9 16,256,963
‐ 2,183,288 ‐ 23,862 ‐ 1,863,598 ‐ 327,915 ‐ 1,446,132 ‐ 4,558,963 ‐ 10,403,757
‐ ‐ ‐ ‐ ‐ ‐ ‐ 20,368 ‐ ‐ ‐ ‐ ‐ 20,368
‐ ‐ ‐ ‐ ‐ ‐ ‐ ‐1,056 ‐ ‐ ‐ ‐319,701 ‐ ‐320,757
‐ ‐ ‐ ‐ ‐ ‐ ‐ ‐ ‐ ‐ ‐ 1,000 ‐ 1,000
‐ ‐ ‐ ‐ ‐ ‐ ‐ ‐ ‐ ‐ ‐ 2,996,622 ‐ 2,996,622
2,183,288 23,862 1,863,598 347,227 1,446,132 7,236,884 13,100,990
51.8 6,755,255 1.4 167,890 15.1 3,078,995 6.8 1,117,229 5.8 1,829,057 96.9 16,409,528 177.9 29,357,953
16.2 2,192,360 ‐ ‐ 3.6 396,599 3.4 562,619 ‐ ‐ 27.6 3,779,344 50.8 6,930,922
36.3 2,455,262 1.0 60,475 12.3 748,441 3.0 240,515 5.5 327,297 70.0 4,733,415 128.1 8,565,406
‐ 177,482 ‐ 16,903 ‐ 120,958 ‐ 37,240 0.0 71,968 ‐ 995,550 0.0 1,420,100
‐ ‐ ‐ ‐ ‐ ‐ 0.3 13,501 ‐ ‐ ‐ ‐ 0.3 13,501
52.6 4,825,103 1.0 77,378 15.9 1,265,998 6.6 853,875 5.5 399,265 97.6 9,508,309 179.2 16,929,929
0.0 1,365,607 ‐ 23,334 0.0 1,661,791 ‐ 291,879 0.0 1,234,240 ‐ 4,188,282 0.0 8,765,133
‐ ‐ ‐ ‐ ‐ ‐ ‐ 9,940 ‐ ‐ ‐ ‐ ‐ 9,940
‐ ‐ ‐ ‐ ‐ ‐ ‐ ‐ ‐ ‐ ‐ 266,000 ‐ 266,000
‐ ‐ ‐ ‐ ‐ ‐ ‐ ‐ ‐ ‐ ‐ ‐292,305 ‐ ‐292,305
‐ ‐ ‐ ‐ ‐ ‐ ‐ ‐ ‐ ‐ ‐ 2,668,522 ‐ 2,668,522
0.0 1,365,607 23,334 0.0 1,661,791 301,819 0.0 1,234,240 6,830,499 0.0 11,417,290
52.6 6,190,710 1.0 100,712 15.9 2,927,789 6.6 1,155,694 5.5 1,633,505 97.6 16,338,809 179.2 28,347,219
106

EXECUTIVE VICE PRESIDENT AND CHIEF
OPERATING OFFICER Overview of Operations The Executive Vice President and Chief Operating Officer (EVP-COO) is charged by the Board of Visitors and President with overseeing the financial operations of the University, including the Medical Center, and supporting special initiatives that have a University-wide impact. The EVP-COO partners with the Provost and others to foster strong relationships between academic and administrative areas, ensuring strong and sustainable resources to finance academic excellence. Current priorities focus on achieving Organizational Excellence across academic and administrative areas, shifting to a new financial model that fosters entrepreneurial and collaborative actions in all schools and units, and funding and implementing the University’s strategic plan. The EVP-COO Office upholds the charge to embrace the UVa brand of "quality" and to deliver the skills, energy, and credibility needed to translate aspirations into established programs. We value the creativity of employees at all levels and strive to empower them to lead and excel , whether they teach, care for patients, or maintain the services on which the University relies, now and in the future. Most importantly, the job of the EVP-COO is to enable the work of others in the support of the University’s mission and strategic priorities. Work to accomplish these goals reflects the leadership and close collaboration of the entire Executive Vice President and Chief Operating Officer (EVP-COO) team including Finance, Management and Budget, Human Resources, Athletics, Police, Emergency Preparedness, Audit, Office of the Chief Information Officer, Organizational Excellence, Strategic Initiatives, Compliance/ERM and Treasury. The EVP-COO also works closely with the University of Virginia Investment Management Company and the University of Virginia Foundation. Strategic Direction To ensure sustainable support for the desired growth and aspirations of the University and Health System, the EVP-COO will:
Promote a culture of excellence and wisely
steward all resources (human, financial, facilities, technology, etc.) by overseeing the implementation and execution of the Strategic
Plan’s Pillar 5, “Steward the University’s resources to promote academic excellence and affordable access” related to: 1. Affordable Excellence 2. Leadership in Promoting Staff Excellence 3. Organizational Excellence 4. Philanthropy in Service to Strategic
Priorities
Develop and refine: o the pricing of strategic plan priorities
(integrating them into the 2014-2015 budget process) while supporting their implementation;
o a holistic tuition and financial aid model; and
o an updated six-year operational, capital and financial forecast – Financing Academic Excellence
Work closely with the Executive Vice President
and Provost to foster greater partnerships between academic and administrative areas by: o Supporting the funding and implementation
of the strategic plan pillars and strategies; o continuing to facilitate cross-Grounds
collaboration on the AccessUVa program; and
o supporting the new financial model by service level agreements and performance benchmarks for all central service units that are charged to schools;
Re-energize Enterprise Risk Management
(ERM) efforts and incorporate ERM principles into the strategic plan to document how related risks will be identified and mitigated;
Work with the Executive Vice President for Health Affairs, to implement the Health System Strategic Plan transition to a new organizational structure with a focus on achieving targeted improvement in health care quality and patient safety while sustaining solid financial performance in the face of many changes in the health care industry. .
Advance the implementation of institutional
goals as expressed by the five pillars of the Cornerstone Plan: 1. Enrich and strengthen the University’s
distinctive residential culture.
MAJ
OR
BU
DG
ET U
NIT
OVE
RVI
EWS
107
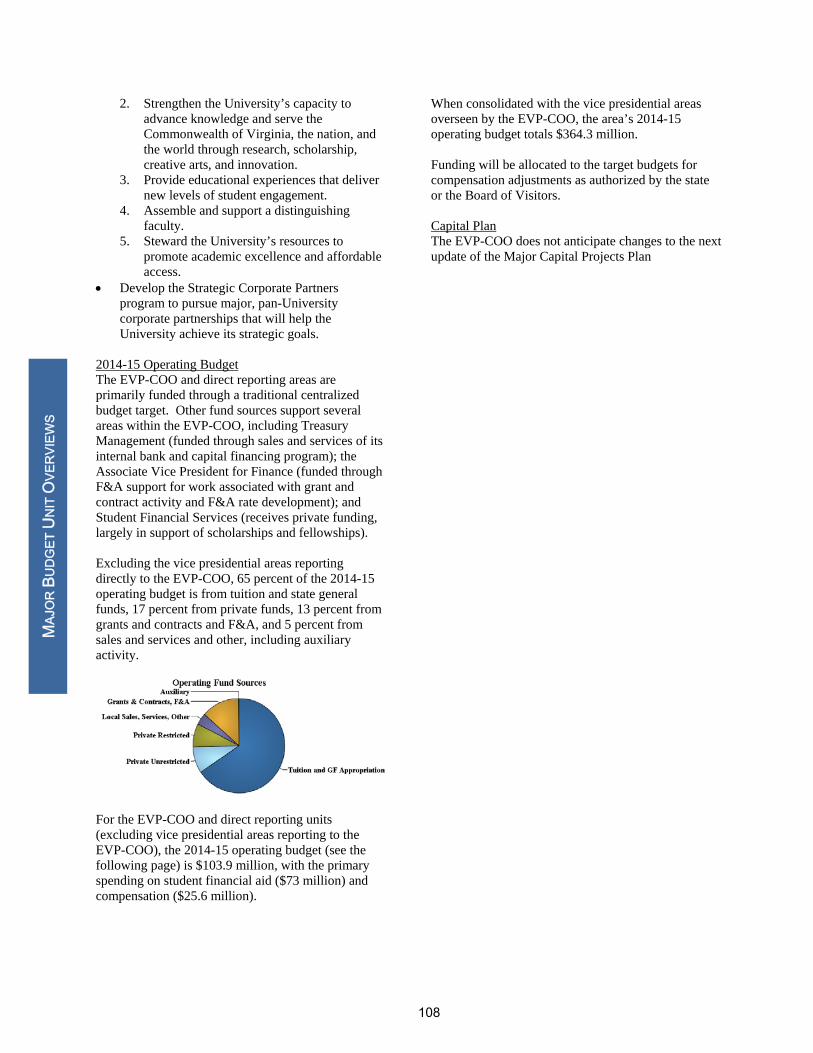
2. Strengthen the University’s capacity to advance knowledge and serve the Commonwealth of Virginia, the nation, and the world through research, scholarship, creative arts, and innovation.
3. Provide educational experiences that deliver new levels of student engagement.
4. Assemble and support a distinguishing faculty.
5. Steward the University’s resources to promote academic excellence and affordable access.
Develop the Strategic Corporate Partners program to pursue major, pan-University corporate partnerships that will help the University achieve its strategic goals.
2014-15 Operating Budget The EVP-COO and direct reporting areas are primarily funded through a traditional centralized budget target. Other fund sources support several areas within the EVP-COO, including Treasury Management (funded through sales and services of its internal bank and capital financing program); the Associate Vice President for Finance (funded through F&A support for work associated with grant and contract activity and F&A rate development); and Student Financial Services (receives private funding, largely in support of scholarships and fellowships). Excluding the vice presidential areas reporting directly to the EVP-COO, 65 percent of the 2014-15 operating budget is from tuition and state general funds, 17 percent from private funds, 13 percent from grants and contracts and F&A, and 5 percent from sales and services and other, including auxiliary activity.
For the EVP-COO and direct reporting units (excluding vice presidential areas reporting to the EVP-COO), the 2014-15 operating budget (see the following page) is $103.9 million, with the primary spending on student financial aid ($73 million) and compensation ($25.6 million).
When consolidated with the vice presidential areas overseen by the EVP-COO, the area’s 2014-15 operating budget totals $364.3 million. Funding will be allocated to the target budgets for compensation adjustments as authorized by the state or the Board of Visitors. Capital Plan The EVP-COO does not anticipate changes to the next update of the Major Capital Projects Plan
MAJ
OR
BU
DG
ET U
NIT
OVE
RVI
EWS
108

University of Virginia - MBU SummaryExec Level: R0205 VP: CO-Exec VP/COO, Mbu Level: <All>
1
Tui on and GFAppropria on
FTE Amount
2
Grants & Contracts,F&A
FTE Amount
3
Private Unrestricted
FTE Amount
4
Private Restricted
FTE Amount
5
Local Sales, Services,Other
FTE Amount
6
Auxiliary
FTE Amount Total ‐ FTE Total ‐ Amount
FY CTCS Category
2014‐R Faculty Salaries and benefitsStaff Salaries and benefitsWages and benefitsGTA/GRA
Subtotal
OTPS
Financial Aid
Recoveries
Transfers
Subtotal
MBU Totals
2015‐O Faculty Salaries and benefitsStaff Salaries and benefitsWages and benefitsGTA/GRA
Subtotal
OTPS
Financial Aid
Recoveries
Transfers
Subtotal
MBU Totals
14.8 2,153,464 ‐ ‐ ‐ ‐ ‐ ‐ 1.0 136,000 1.0 153,716 16.8 2,443,180
257.3 17,290,413 32.3 2,484,434 3.8 532,950 ‐ ‐ 4.0 484,000 4.0 331,008 301.3 21,122,805
‐ 395,800 ‐ 1,143,953 ‐ ‐ ‐ ‐ ‐ ‐ ‐ ‐ ‐ 1,539,753
‐ 16,000 ‐ ‐ ‐ ‐ ‐ ‐ ‐ ‐ ‐ ‐ ‐ 16,000
272.1 19,855,677 32.3 3,628,387 3.8 532,950 5.0 620,000 5.0 484,724 318.1 25,121,738
‐ 7,745,487 ‐ 426,537 ‐ 871,823 ‐ ‐ ‐ 1,974,312 ‐ 6,265,905 ‐ 17,284,064
‐ 39,359,350 ‐ 9,507,124 ‐ 10,588,700 ‐ 8,452,000 ‐ ‐ ‐ ‐ ‐ 67,907,174
‐ ‐2,988,485 ‐ ‐ ‐ ‐ ‐ ‐ ‐ ‐ ‐ ‐6,481,629 ‐ ‐9,470,114
‐ 355,792 ‐ ‐355,792 ‐ ‐ ‐ ‐ ‐ ‐362,500 ‐ ‐ ‐ ‐362,500
44,472,144 9,577,869 11,460,523 8,452,000 1,611,812 ‐215,724 75,358,624
272.1 64,327,821 32.3 13,206,256 3.8 11,993,473 8,452,000 5.0 2,231,812 5.0 269,000 318.1 100,480,362
11.8 1,595,524 ‐ ‐ ‐ ‐ ‐ ‐ 3.0 519,414 1.0 167,514 15.8 2,282,452
266.9 17,600,516 33.4 2,680,585 2.7 515,002 ‐ ‐ 4.5 628,920 4.0 352,920 311.5 21,777,943
0.0 278,718 0.0 1,269,269 ‐ ‐ ‐ ‐ ‐ ‐ ‐ ‐ 0.0 1,547,987
0.5 16,736 ‐ ‐ ‐ ‐ ‐ ‐ ‐ ‐ ‐ ‐ 0.5 16,736
279.2 19,491,494 33.4 3,949,854 2.7 515,002 7.5 1,148,334 5.0 520,434 327.8 25,625,118
0.0 4,869,326 ‐ 469,737 0.0 266,710 ‐ ‐ 0.0 2,377,420 0.0 6,556,600 0.0 14,539,793
0.0 46,242,369 0.0 9,697,811 0.0 8,623,700 0.0 8,400,000 ‐ ‐ ‐ ‐ 0.0 72,963,880
0.0 ‐2,988,485 ‐ ‐ ‐ ‐ ‐ ‐ ‐ ‐ ‐ ‐6,808,034 0.0 ‐9,796,519
‐ 393,056 ‐ ‐393,056 ‐ ‐ ‐ ‐ ‐ 578,246 ‐ ‐ ‐ 578,246
0.0 48,516,266 0.0 9,774,492 0.0 8,890,410 0.0 8,400,000 0.0 2,955,666 0.0 ‐251,434 0.0 78,285,400
279.2 68,007,760 33.4 13,724,346 2.7 9,405,412 0.0 8,400,000 7.5 4,104,000 5.0 269,000 327.8 103,910,518
109

VICE PRESIDENT AND CHIEF HUMAN
RESOURCES OFFICER Overview of Operations University Human Resources (UHR) supports the mission of the University of Virginia by creating a work environment that attracts, develops, and retains an outstanding and diverse workforce. UHR is responsible for all human resource (HR) functions for the Academic Division of the University, including recruitment, compensation, employee relations, employee development, benefits administration, employee wellness, payroll, recruitment and placement of temporary and wage personnel, and compliance and immigration services. The Vice President and Chief Human Resources Officer (CHRO) also has oversight responsibility for human resources at the College at Wise and for health and retirement benefits for the University’s Medical Center, as well as non-academic aspects of the faculty personnel system. Strategic Direction UHR strives to make the University of Virginia a place people want to work—where careers can grow, employees are passionate about contributing to the mission of the University, and employees are equipped to meet the challenges of the workplace and beyond. UHR is committed to promoting and achieving the behaviors, culture, and competencies needed to support and enhance the University’s strategy and goals. To do this, UHR is guided by three overarching themes: 1. A Culture of Leadership:
Strengthen leadership capability of individual contributors and those who lead others to encourage high levels of performance and productivity, promote diversity, and sustain organizational excellence.
2. Health and Wellbeing: Create a best-in-class work environment that supports the overall health of employees, faculty and staff.
3. Efficiency and Effectiveness: Increase operational effectiveness and efficiencies to be responsible stewards of University resources.
These priorities, and their related deliverables, dovetail with the strategic direction outlined in the Cornerstone Plan. Most notably, UHR is poised to create a Center for Leadership Excellence in support of Pillar 5, Strategy 13 of the Plan: Promoting Academic Excellence. The Center will advance a
culture of excellence at the University, helping employees see themselves as leaders. Existing resources within UHR will be redirected to support the Center of Leadership Excellence start-up. Achieving the full potential of the strategic initiatives in the Center will require additional resources. UHR is well into a service delivery project, examining its processes in order to deliver “One HR”, where there are clear roles and responsibilities for field and central HR, workflow is streamlined, and appropriate accountability and meaningful metrics for success are in place. UHR will reallocate resources, gaining efficiencies from service improvements to support initial programming. UHR looks forward to collaborations across Grounds on related initiatives where its expertise can be employed, such as faculty onboarding and leadership development. Two critical issues that represent the most significant human resource-related financial challenges to the University are competitive staff compensation and the cost of fringe benefits. The University’s ability to maintain academic excellence is directly linked to its ability to attract and retain top quality faculty and staff. The graph below shows the dramatic decrease in staff turnover going into the recent recession. Turnover is gradually increasing again. This trend, combined with recent reports of continuing declines in the Central Virginia unemployment rates, makes it essential for the University to offer competitive compensation.
An investment in staff compensation is critical to ensure support for new initiatives in research and teaching and reverse the trend in employee dissatisfaction with pay. The graph below shows the
MAJ
OR
BU
DG
ET U
NIT
OVE
RVI
EWS
110

initial goal for staff is a salary average at the 50th percentile of the market range. With the implementation of the University Staff HR Plan, which allows for market and merit pay increases, the average market range penetration for staff was first tracked in 2010 at 34.9%. Preliminary projections for 2014 indicate market range penetration of 41%, still short of a 50th percentile goal.
As part of its strategic financial planning process, UHR has outlined an aggressive five-year staff salary plan that will continue this trend and position U.Va. competitively. Fringe benefits represent a large institutional investment, approaching $250 million per year. Fringe benefits also represent an essential component of faculty and staff total compensation and for many is a key consideration in making employment decisions. A recent study by Aon Hewitt shows that the University’s benefits are highly competitive in health, vision, and dental coverage compared to peers. At a time when employee benefits across the country are seriously eroding, the graph below shows that U.Va. has been able to improve benefits while controlling costs. This is an area of distinction for the University. Fringe costs are expected to increase 4% over the next four years due to several factors, including state mandated retirement contribution increases.
2014-15 Operating Budget The VP/CHRO and reporting areas are funded through a traditional centralized budget target, as well as self-generated sales and services revenues. For 2014-15, 81 percent of the VP/CHRO operational budget is from tuition and state general funds. Sales and services activities (Temporary Search Group and Compliance and Immigration Services) represent 16 percent of funding, while an allocation from private unrestricted represents 3 percent of funding.
For the VP/CHRO, the 2014-15 operating budget (see the following page) is $8.9 million, with the primary spending on compensation (97 percent). The remaining expenditures are primarily OTPS expenditures. Funding will be allocated to the target budgets for compensation adjustments as authorized by the state or the Board of Visitors. Capital Plan The VP/CHRO does not have any projects on the Major Capital Projects Plan. .
MAJ
OR
BU
DG
ET U
NIT
OVE
RVI
EWS
111

University of Virginia - MBU SummaryExec Level: R0800 VP: HR-Human Resources, Mbu Level: <All>
1
Tui on and GFAppropria on
FTE Amount
2
Grants & Contracts,F&A
FTE Amount
3
Private Unrestricted
FTE Amount
4
Private Restricted
FTE Amount
5
Local Sales, Services,Other
FTE Amount
6
Auxiliary
FTE Amount Total ‐ FTE Total ‐ Amount
FY CTCS Category
2014‐R Staff Salaries and benefitsWages and benefits
Subtotal
OTPS
Recoveries
Transfers
Subtotal
MBU Totals
2015‐O Staff Salaries and benefitsWages and benefits
Subtotal
OTPS
Recoveries
Transfers
Subtotal
MBU Totals
76.3 6,839,732 ‐ ‐ ‐ ‐ ‐ ‐ 15.7 1,385,121 ‐ ‐ 92.0 8,224,853
‐ 49,350 ‐ ‐ ‐ 15,870 ‐ 5,795 ‐ 86,829 ‐ ‐ ‐ 157,844
76.3 6,889,082 15,870 5,795 15.7 1,471,950 92.0 8,382,697
‐ 891,404 ‐ ‐ ‐ 299,008 ‐ ‐ ‐ 760,045 ‐ ‐ ‐ 1,950,457
‐ ‐264,548 ‐ ‐ ‐ ‐ ‐ ‐ ‐ ‐1,060,357 ‐ ‐ ‐ ‐1,324,905
‐ ‐150,000 ‐ ‐ ‐ 150,000 ‐ ‐ ‐ ‐ ‐ ‐ ‐ 0
476,856 449,008 ‐300,312 625,552
76.3 7,365,938 464,878 5,795 15.7 1,171,638 92.0 9,008,249
76.1 6,825,388 ‐ ‐ ‐ ‐ ‐ ‐ 18.1 1,637,362 ‐ ‐ 94.2 8,462,750
‐ 44,900 ‐ ‐ ‐ 7,000 ‐ 5,900 ‐ 115,212 ‐ ‐ ‐ 173,012
76.1 6,870,288 7,000 5,900 18.1 1,752,574 94.2 8,635,762
‐ 706,405 ‐ ‐ ‐ 108,442 ‐ ‐ ‐ 1,096,122 ‐ ‐ ‐ 1,910,969
‐ ‐236,436 ‐ ‐ ‐ ‐ ‐ ‐ ‐ ‐1,409,257 ‐ ‐ ‐ ‐1,645,693
‐ ‐122,000 ‐ ‐ ‐ 122,000 ‐ ‐ ‐ ‐ ‐ ‐ ‐ 0
347,969 230,442 ‐313,135 265,276
76.1 7,218,257 237,442 5,900 18.1 1,439,439 94.2 8,901,038
112
VICE PRESIDENT FOR MANAGEMENT AND
BUDGET
Overview of Operations The Vice President for Management and Budget portfolio includes: the Budget Office, Business Operations, Facilities Management, Office of the Architect, Procurement and Supplier Diversity Services, Real Estate and Leasing Services, and State Governmental Relations.
Collectively, the Management and Budget service units perform the following core functions: Develop, implement, and monitor the annual
operating budget, capital budget, and the biennial state budget;
Provide financial planning to assist in
identifying and allocating resources required to achieve strategic goals;
Lead integrated, physical planning, including the design of new facilities, renovations, and land use for effective, efficient, and sustainable capital development and historic preservation;
Manage the construction program for the
Academic Division, Medical Center, and College at Wise, with $200 million of construction work in place anticipated for the current fiscal year;
Maintain and operate the academic and health
system physical plant, including maintenance, utilities, custodial services, and grounds care for 16.7 million gross square feet in 561 buildings;
Direct the purchasing of goods and services (120,000 purchase orders through the Marketplace and 85,400 p-card transactions) and accounts payable operations (312,000 payable transactions);
Broaden and diversify the supply chain for goods and services;
Develop and maintain effective state relations
with the Executive Branch and the General Assembly in order to advance legislative, operating, and capital priorities;
Coordinate the implementation of the provisions in the Restructuring Act, the Management
Agreement, and the Virginia Higher Education Opportunity Act of 2011;
Develop space planning strategies and policies; Review and coordinate the purchase and sale of
real estate and manage a portfolio of 101 expense leases and 34 income leases; and
Deliver housing, dining, transit, and other auxiliary services to support the University’s living and learning community.
Strategic Direction The Management and Budget vision statement is “to be a prudent steward of University resources and a valued partner in achieving teaching, research, service, and health care excellence.” In 2014-15, Management and Budget service units will:
Continue to enhance the organizational capacity
for financial decision-making through robust analytics and regular reporting;
Support multi-year financial planning by projecting cost drivers, monitoring commitments, and modeling sources and uses;
Further the stewardship of financial, physical, and human assets through continuous improvement of business processes and the redesign of business models to achieve an improved level of service and efficiencies;
Transition the budget to the new financial model;
Provide innovative approaches, support services, and infrastructure to advance institutional priorities; and
Focus on meeting the needs of customers
(faculty, staff, students, and general public) with competitive, high-quality services.
2014-15 Operating Budget The Management and Budget service units are primarily funded through a traditional centralized budget target, with the exception of Facilities
MAJ
OR
BU
DG
ET U
NIT
OVE
RVI
EWS
113
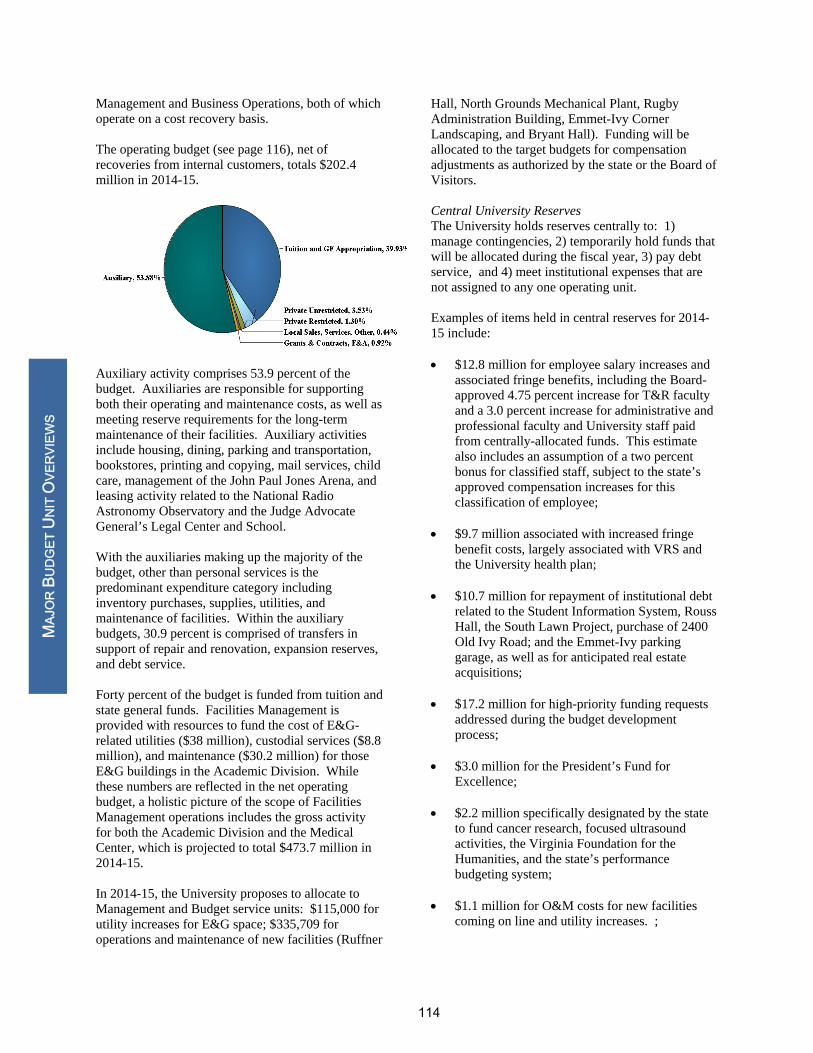
Management and Business Operations, both of which operate on a cost recovery basis. The operating budget (see page 116), net of recoveries from internal customers, totals $202.4 million in 2014-15.
Auxiliary activity comprises 53.9 percent of the budget. Auxiliaries are responsible for supporting both their operating and maintenance costs, as well as meeting reserve requirements for the long-term maintenance of their facilities. Auxiliary activities include housing, dining, parking and transportation, bookstores, printing and copying, mail services, child care, management of the John Paul Jones Arena, and leasing activity related to the National Radio Astronomy Observatory and the Judge Advocate General’s Legal Center and School. With the auxiliaries making up the majority of the budget, other than personal services is the predominant expenditure category including inventory purchases, supplies, utilities, and maintenance of facilities. Within the auxiliary budgets, 30.9 percent is comprised of transfers in support of repair and renovation, expansion reserves, and debt service. Forty percent of the budget is funded from tuition and state general funds. Facilities Management is provided with resources to fund the cost of E&G-related utilities ($38 million), custodial services ($8.8 million), and maintenance ($30.2 million) for those E&G buildings in the Academic Division. While these numbers are reflected in the net operating budget, a holistic picture of the scope of Facilities Management operations includes the gross activity for both the Academic Division and the Medical Center, which is projected to total $473.7 million in 2014-15. In 2014-15, the University proposes to allocate to Management and Budget service units: $115,000 for utility increases for E&G space; $335,709 for operations and maintenance of new facilities (Ruffner
Hall, North Grounds Mechanical Plant, Rugby Administration Building, Emmet-Ivy Corner Landscaping, and Bryant Hall). Funding will be allocated to the target budgets for compensation adjustments as authorized by the state or the Board of Visitors. Central University Reserves The University holds reserves centrally to: 1) manage contingencies, 2) temporarily hold funds that will be allocated during the fiscal year, 3) pay debt service, and 4) meet institutional expenses that are not assigned to any one operating unit. Examples of items held in central reserves for 2014-15 include: $12.8 million for employee salary increases and
associated fringe benefits, including the Board-approved 4.75 percent increase for T&R faculty and a 3.0 percent increase for administrative and professional faculty and University staff paid from centrally-allocated funds. This estimate also includes an assumption of a two percent bonus for classified staff, subject to the state’s approved compensation increases for this classification of employee;
$9.7 million associated with increased fringe
benefit costs, largely associated with VRS and the University health plan;
$10.7 million for repayment of institutional debt related to the Student Information System, Rouss Hall, the South Lawn Project, purchase of 2400 Old Ivy Road; and the Emmet-Ivy parking garage, as well as for anticipated real estate acquisitions;
$17.2 million for high-priority funding requests
addressed during the budget development process;
$3.0 million for the President’s Fund for Excellence;
$2.2 million specifically designated by the state
to fund cancer research, focused ultrasound activities, the Virginia Foundation for the Humanities, and the state’s performance budgeting system;
$1.1 million for O&M costs for new facilities
coming on line and utility increases. ;
MAJ
OR
BU
DG
ET U
NIT
OVE
RVI
EWS
114
$5.8 million in fees collected from out-of-state students, required by the Commonwealth to be remitted to cover a proportionate share of capital project and Equipment Trust Fund debt service; and
$8.8 million reserved for general contingencies,
uncollectible tuition, and unexpected cold weather and higher utility rates.
Capital Plan After replacing the roof on the Rotunda, the remaining scope of renovation work began immediately after Final Exercises ($43.5 million from state and gift funds).Planning is complete for the North Grounds Mechanical Plant ($13.1 million in debt and utility infrastructure reserves), Newcomb Road Chiller Plant ($11.6 million from debt, utility infrastructure reserves, and auxiliary funding), and Facilities Management Shop Support Building ($6.0 million from debt and facilities management operating reserves) all of which will be under construction in 2014-15. Planning will continue for the renovation of Gilmer Hall and the Chemistry Building. Business Operations units, as auxiliaries, manage their own capital budgets. Construction is underway for the sixth new Alderman Road Residence Hall to be completed for occupancy in the fall 2015.
The below schedule outlines expected activity in the R&R and expansion reserves for the Business Operations auxiliary units. It is expected that all units, except for Housing, will meet the Board reserve policy of re-investing at least 1.5 percent of replacement value of the facilities. Housing continues to work towards meeting the contribution target of 1.5 percent by transferring $9.3 million or 1 percent of replacement value.
Business Operations (in thousands)
R&R Reserve
Expansion Reserve Total
Projected Balance, 7/1/14
$24,782 $12,907 $37,689
Plus: Transfers from Operating
$10,472 $7,217 $17,689
Less: Planned Expenditures
($13,724) ($3,031) ($16,755)
Projected Balance, 6/30/15
$21,530 $17,093 $38,623
For Housing, planned 2014-15 expenditures totaling $8 million include the Gooch/Dillard Phase I renovation to Building 381; Brown College roof replacement and bathroom repairs; Hereford flooring replacement; and the balance toward numerous other safety and security and repair and renovation projects addressing deficiencies identified in the facilities audit.
For Dining, planned 2014-15 expenditures
include $2.4 million earmarked for facility repairs and improvements to dining facilities, including New Cabell.
For Parking and Transportation, planned
2014-15 expenditures from the reserves include $1.8 million for the purchase of 5 transit buses, $843,000 for parking lot and garage repairs and lighting upgrades, and other needs.
For Printing and Copying Services, planned
2014-15 planned reserve expenditures include $489,000 for equipment, and system purchases.
The University Bookstore’s planned 2014-15
reserve expenditures include $100,000 for the computer system replacement. Additionally, $135,000 is earmarked for Bookstore and Cavalier Computers unforeseen facility repairs and improvements and equipment and computer system upgrades.
Other repair and renovation reserves are held for
the Child Development Centers, the Cemetery, Mail Services, JPJ Arena, Business Operations, and Cavalier Advantage. Planned expenditures from the reserves in 2014-15 include: Cemetery Expansion, Child Development Center roof replacement, JPJ Arena equipment and furnishing replacements, and Mail Services processing equipment.
MAJ
OR
BU
DG
ET U
NIT
OVE
RVI
EWS
115
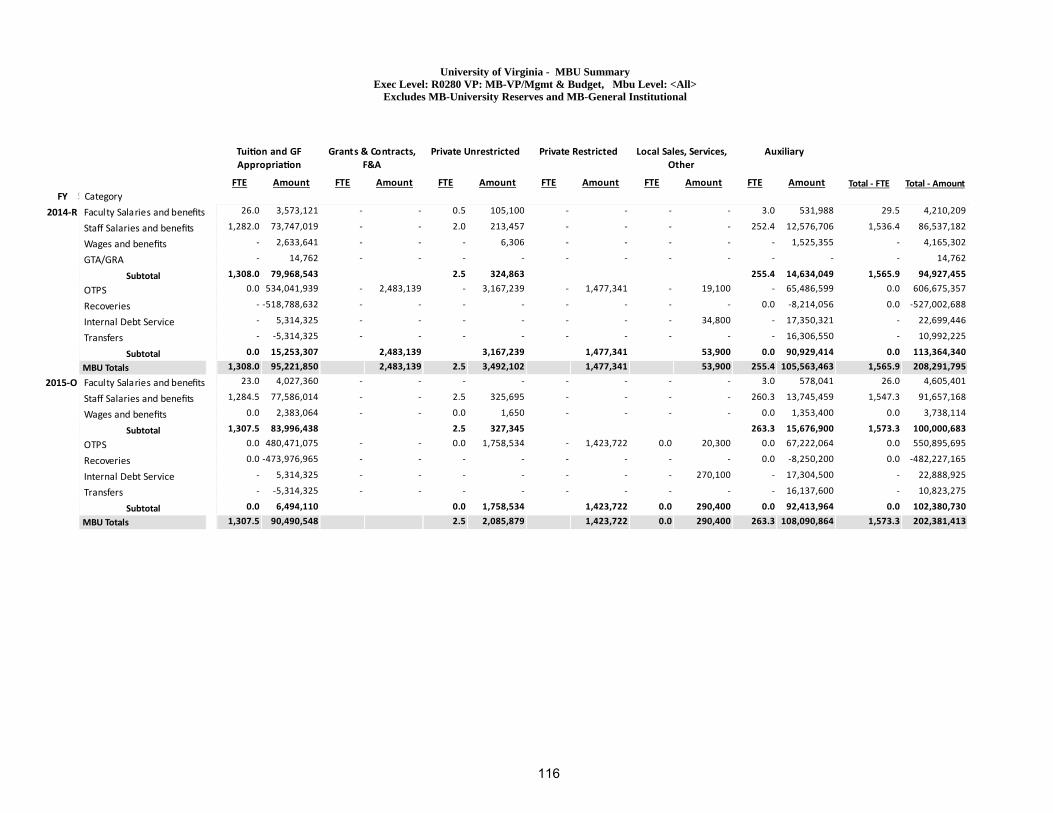
University of Virginia - MBU SummaryExec Level: R0280 VP: MB-VP/Mgmt & Budget, Mbu Level: <All>
Excludes MB-University Reserves and MB-General Institutional
1
Tui on and GF
Appropria on
FTE Amount
2
Grants & Contracts,
F&A
FTE Amount
3
Private Unrestricted
FTE Amount
4
Private Restricted
FTE Amount
5
Local Sales, Services,
Other
FTE Amount
6
Auxiliary
FTE Amount Total ‐ FTE Total ‐ Amount
FY CTCS Category
2014‐R Faculty Salaries and benefitsStaff Salaries and benefitsWages and benefitsGTA/GRA
Subtotal
OTPS
Recoveries
Internal Debt Service
Transfers
Subtotal
MBU Totals
2015‐O Faculty Salaries and benefitsStaff Salaries and benefitsWages and benefits
Subtotal
OTPS
Recoveries
Internal Debt Service
Transfers
Subtotal
MBU Totals
26.0 3,573,121 ‐ ‐ 0.5 105,100 ‐ ‐ ‐ ‐ 3.0 531,988 29.5 4,210,209
1,282.0 73,747,019 ‐ ‐ 2.0 213,457 ‐ ‐ ‐ ‐ 252.4 12,576,706 1,536.4 86,537,182
‐ 2,633,641 ‐ ‐ ‐ 6,306 ‐ ‐ ‐ ‐ ‐ 1,525,355 ‐ 4,165,302
‐ 14,762 ‐ ‐ ‐ ‐ ‐ ‐ ‐ ‐ ‐ ‐ ‐ 14,762
1,308.0 79,968,543 2.5 324,863 255.4 14,634,049 1,565.9 94,927,455
0.0 534,041,939 ‐ 2,483,139 ‐ 3,167,239 ‐ 1,477,341 ‐ 19,100 ‐ 65,486,599 0.0 606,675,357
‐ ‐518,788,632 ‐ ‐ ‐ ‐ ‐ ‐ ‐ ‐ 0.0 ‐8,214,056 0.0 ‐527,002,688
‐ 5,314,325 ‐ ‐ ‐ ‐ ‐ ‐ ‐ 34,800 ‐ 17,350,321 ‐ 22,699,446
‐ ‐5,314,325 ‐ ‐ ‐ ‐ ‐ ‐ ‐ ‐ ‐ 16,306,550 ‐ 10,992,225
0.0 15,253,307 2,483,139 3,167,239 1,477,341 53,900 0.0 90,929,414 0.0 113,364,340
1,308.0 95,221,850 2,483,139 2.5 3,492,102 1,477,341 53,900 255.4 105,563,463 1,565.9 208,291,795
23.0 4,027,360 ‐ ‐ ‐ ‐ ‐ ‐ ‐ ‐ 3.0 578,041 26.0 4,605,401
1,284.5 77,586,014 ‐ ‐ 2.5 325,695 ‐ ‐ ‐ ‐ 260.3 13,745,459 1,547.3 91,657,168
0.0 2,383,064 ‐ ‐ 0.0 1,650 ‐ ‐ ‐ ‐ 0.0 1,353,400 0.0 3,738,114
1,307.5 83,996,438 2.5 327,345 263.3 15,676,900 1,573.3 100,000,683
0.0 480,471,075 ‐ ‐ 0.0 1,758,534 ‐ 1,423,722 0.0 20,300 0.0 67,222,064 0.0 550,895,695
0.0 ‐473,976,965 ‐ ‐ ‐ ‐ ‐ ‐ ‐ ‐ 0.0 ‐8,250,200 0.0 ‐482,227,165
‐ 5,314,325 ‐ ‐ ‐ ‐ ‐ ‐ ‐ 270,100 ‐ 17,304,500 ‐ 22,888,925
‐ ‐5,314,325 ‐ ‐ ‐ ‐ ‐ ‐ ‐ ‐ ‐ 16,137,600 ‐ 10,823,275
0.0 6,494,110 0.0 1,758,534 1,423,722 0.0 290,400 0.0 92,413,964 0.0 102,380,730
1,307.5 90,490,548 2.5 2,085,879 1,423,722 0.0 290,400 263.3 108,090,864 1,573.3 202,381,413
116

University of Virginia - MBU SummaryIncludes MB-University Reserves and MB-General Institutional
1
Tui on and GFAppropria on
FTE Amount
2
Grants & Contracts,F&A
FTE Amount
3
Private Unrestricted
FTE Amount
4
Private Restricted
FTE Amount
5
Local Sales, Services,Other
FTE Amount
6
Auxiliary
FTE Amount Total ‐ FTE Total ‐ Amount
FY CTCS Category
2014‐R Staff Salaries and benefitsSubtotal
OTPS
Financial Aid
Central Assessment
Recoveries
Internal Debt Service
Transfers
Subtotal
MBU Totals
2015‐O Faculty Salaries and benefitsStaff Salaries and benefitsGTA/GRA
Subtotal
OTPS
Financial Aid
Central Assessment
Recoveries
Internal Debt Service
Transfers
Subtotal
MBU Totals
‐ ‐ ‐ ‐ ‐ 751,700 ‐ ‐ ‐ ‐ ‐ ‐ ‐ 751,700
751,700 751,700
0.0 10,689,817 ‐ ‐ ‐ 181,439 ‐ ‐ ‐ ‐ ‐ ‐639,000 0.0 10,232,256
‐ ‐33,235,608 ‐ ‐ ‐ ‐ ‐ ‐ ‐ ‐ ‐ ‐ ‐ ‐33,235,608
‐ ‐26,684,548 ‐ ‐ ‐ ‐2,664,027 ‐ ‐ ‐ ‐ ‐ ‐ ‐ ‐29,348,575
‐ ‐1,290,807 ‐ ‐398,482 ‐ ‐ ‐ ‐ ‐ ‐ ‐ ‐ ‐ ‐1,689,289
‐ 1,923,074 ‐ 656,064 ‐ 700,760 ‐ ‐ ‐ ‐ ‐ ‐ ‐ 3,279,898
‐ 11,273,883 ‐ 1,171,846 ‐ ‐7,200,900 ‐ 70,000 ‐ 699,449 ‐ 1,952,700 ‐ 7,966,978
0.0 ‐37,324,189 1,429,428 ‐8,982,728 70,000 699,449 1,313,700 0.0 ‐42,794,340
0.0 ‐37,324,189 1,429,428 ‐8,231,028 70,000 699,449 1,313,700 0.0 ‐42,042,640
‐ 10,867,160 ‐ ‐ 2.0 427,500 ‐ ‐ ‐ ‐ ‐ ‐ 2.0 11,294,660
1.0 10,442,025 ‐ ‐ 36.0 6,005,926 ‐ ‐ ‐ ‐ ‐ ‐ 37.0 16,447,951
‐ 313,800 ‐ ‐ ‐ ‐ ‐ ‐ ‐ ‐ ‐ ‐ ‐ 313,800
1.0 21,622,985 38.0 6,433,426 39.0 28,056,411
0.0 32,166,823 ‐ 500,000 0.0 9,986,625 ‐ 212,500 ‐ ‐ ‐ ‐1,150,487 0.0 41,715,461
‐ ‐40,454,158 ‐ ‐ ‐ ‐ ‐ 1,040,500 ‐ ‐ ‐ ‐ ‐ ‐39,413,658
0.0 ‐26,683,067 ‐ ‐ 0.0 ‐2,694,186 ‐ ‐ ‐ ‐ ‐ ‐ 0.0 ‐29,377,253
‐ ‐1,143,540 ‐ ‐398,482 ‐ ‐ ‐ ‐ ‐ ‐ ‐ ‐ ‐ ‐1,542,022
‐ 1,107,904 ‐ 656,064 ‐ 700,760 ‐ ‐ ‐ ‐ ‐ ‐ ‐ 2,464,728
‐ 4,874,459 ‐ 1,131,574 ‐ ‐9,275,000 ‐ ‐ ‐ 612,850 ‐ 3,686,931 ‐ 1,030,814
0.0 ‐30,131,579 1,889,156 0.0 ‐1,281,801 1,253,000 612,850 2,536,444 0.0 ‐25,121,930
1.0 ‐8,508,594 1,889,156 38.0 5,151,625 1,253,000 612,850 2,536,444 39.0 2,934,481
117

SENIOR VICE PRESIDENT FOR UNIVERSITY
ADVANCEMENT Overview of Operations The mission of University Advancement is to ensure the University’s future by engaging alumni, parents and friends, supporting the University’s strategic priorities, and inspiring the minds, hearts and generous support of both internal and external partners. University Advancement is organized into three major divisions—University Development, Engagement and Annual Giving, and Advancement Services, which includes WTJU, a non-commercial radio station serving the University and surrounding communities with 24-hour programming throughout the year. University Advancement consists of approximately 148 full-time professionals who work in partnership with the University’s 11 schools, 15 University-related fundraising foundations, and more than 300 members of the University’s advancement community (administrators, fundraisers, communicators, and alumni relations professionals) to advance the strategic priorities of the University. Strategic Direction University Advancement’s fundraising divisions (Pan-University Priorities, Regional, Reunions, Corporate and Foundations, Planned Giving, Principal Gifts and Annual Giving) provide direct support for the University’s strategic plan by soliciting gifts for identified priorities. Engagement officers share information about institutional priorities through numerous events featuring university leaders and faculty speakers; its regional officers also solicit annual gifts in support of the same. WTJU reflects the broadest educational goals of the University, serving as a communications link between the University and the surrounding community and bringing the resources of the University to its neighbors. University Advancement’s budget for 2014-15 aligns directly with the University's strategic focus as it continues to re-organize and re-deploy resources in direct support of three identified institutional priorities: Faculty Support AccessUVa Historic Preservation and Restoration:
Jeffersonian Grounds Initiative University Advancement also supports strategic initiatives coming out of the University’s Strategic
Plan (i.e., data science). University Advancement will continue to work closely with academic and volunteer leadership to collaborate in support of fundraising objectives that integrate with the priorities of the University and its academic schools and units. 2014-15 Operating Budget University Advancement is predominately funded through a traditional centralized budget target, with a small auxiliary operation in WTJU Radio. Units classified as auxiliary units (an entity that exists to furnish goods or services to students, faculty, or staff and charges a fee to recover the cost of the service) are expected to be fully self-supporting for both operating and capital purposes. An auxiliary unit, WTJU will retain revenues generated (student fees) and will be held responsible for generating sufficient revenues to cover its planned expenditures. In addition, the unit is required to pay a general and administrative overhead to the University for support services; for 2014-15, WTJU will pay $10,000. For 2014-15, 91 percent of University Advancement’s operating budget is from private unrestricted funds (endowment fee and endowment distribution), while 9 percent is funded from other school support for Health Sciences fundraising, restricted gifts, grants, and WTJU’s student fees. All development activities are funded from non-state sources.
University Advancement’s 2014-15 operating budget (see page 120) is $19.5 million, with the majority of spending on compensation (67 percent). The remaining expenditures are allocated around completing the present fundraising initiatives, while preparing to go further, faster, and with greater intensity in programs for all aspects of the University’s constituency (cultivation, solicitation, stewardship, and recognition).
MAJ
OR
BU
DG
ET U
NIT
OVE
RVI
EWS
118

Funding will be allocated to the target budgets for compensation adjustments as authorized by the state or the Board of Visitors. Capital Plan University Advancement does not have any projects on the Major Capital Projects Plan but plays a significant role in the fundraising needed for many projects in the Capital Plan. University Advancement’s priority for Historic Preservation and Restoration, as it relates to required fundraising for both the Rotunda Renovation and the Jeffersonian Grounds Initiative, will be key factors for the success of both capital initiatives. .
MAJ
OR
BU
DG
ET U
NIT
OVE
RVI
EWS
119
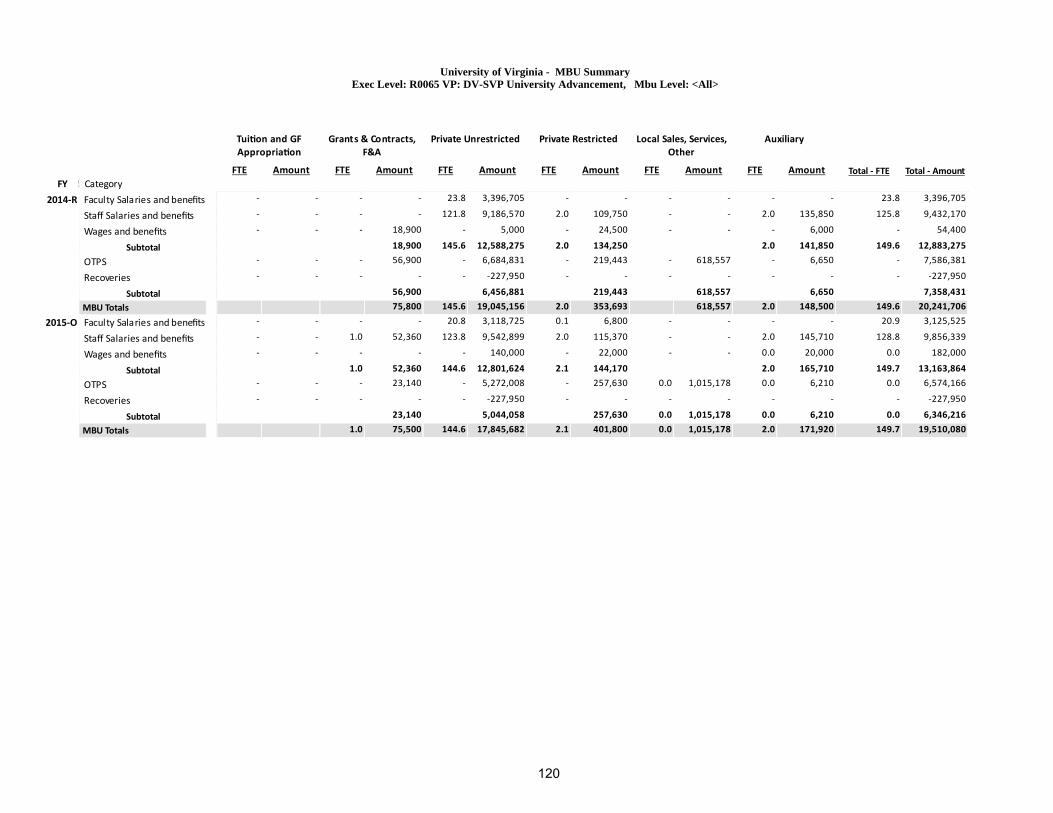
University of Virginia - MBU SummaryExec Level: R0065 VP: DV-SVP University Advancement, Mbu Level: <All>
1
Tui on and GFAppropria on
FTE Amount
2
Grants & Contracts,F&A
FTE Amount
3
Private Unrestricted
FTE Amount
4
Private Restricted
FTE Amount
5
Local Sales, Services,Other
FTE Amount
6
Auxiliary
FTE Amount Total ‐ FTE Total ‐ Amount
FY CTCS Category
2014‐R Faculty Salaries and benefitsStaff Salaries and benefitsWages and benefits
Subtotal
OTPS
Recoveries
Subtotal
MBU Totals
2015‐O Faculty Salaries and benefitsStaff Salaries and benefitsWages and benefits
Subtotal
OTPS
Recoveries
Subtotal
MBU Totals
‐ ‐ ‐ ‐ 23.8 3,396,705 ‐ ‐ ‐ ‐ ‐ ‐ 23.8 3,396,705
‐ ‐ ‐ ‐ 121.8 9,186,570 2.0 109,750 ‐ ‐ 2.0 135,850 125.8 9,432,170
‐ ‐ ‐ 18,900 ‐ 5,000 ‐ 24,500 ‐ ‐ ‐ 6,000 ‐ 54,400
18,900 145.6 12,588,275 2.0 134,250 2.0 141,850 149.6 12,883,275
‐ ‐ ‐ 56,900 ‐ 6,684,831 ‐ 219,443 ‐ 618,557 ‐ 6,650 ‐ 7,586,381
‐ ‐ ‐ ‐ ‐ ‐227,950 ‐ ‐ ‐ ‐ ‐ ‐ ‐ ‐227,950
56,900 6,456,881 219,443 618,557 6,650 7,358,431
75,800 145.6 19,045,156 2.0 353,693 618,557 2.0 148,500 149.6 20,241,706
‐ ‐ ‐ ‐ 20.8 3,118,725 0.1 6,800 ‐ ‐ ‐ ‐ 20.9 3,125,525
‐ ‐ 1.0 52,360 123.8 9,542,899 2.0 115,370 ‐ ‐ 2.0 145,710 128.8 9,856,339
‐ ‐ ‐ ‐ ‐ 140,000 ‐ 22,000 ‐ ‐ 0.0 20,000 0.0 182,000
1.0 52,360 144.6 12,801,624 2.1 144,170 2.0 165,710 149.7 13,163,864
‐ ‐ ‐ 23,140 ‐ 5,272,008 ‐ 257,630 0.0 1,015,178 0.0 6,210 0.0 6,574,166
‐ ‐ ‐ ‐ ‐ ‐227,950 ‐ ‐ ‐ ‐ ‐ ‐ ‐ ‐227,950
23,140 5,044,058 257,630 0.0 1,015,178 0.0 6,210 0.0 6,346,216
1.0 75,500 144.6 17,845,682 2.1 401,800 0.0 1,015,178 2.0 171,920 149.7 19,510,080
120

THE UNIVERSITY OF VIRGINIA’S COLLEGE AT WISE
121

THE UNIVERSITY OF VIRGINIA’S COLLEGE AT WISE OPERATING BUDGET SUMMARY
The 2014-15 operating expenditure budget for the College at Wise is projected to total $41.5 million, representing an increase of 4.2 percent as compared to the revised 2013-14 budget. As explained in more detail below, a conservative approach was taken for purposes of developing the 2014-15 budget while the 2014 General assembly finalizes its work. The College at Wise Advisory Board reviewed and approved this budget on March 21, 2014. FUNDING SOURCES OF THE OPERATING BUDGET Wise’s 2014-15 operating financial plan on page 125 projects $41.5 million in available operating resources from state general funds, tuition and fees, sponsored research and F&A cost recoveries, endowment distributions, gifts, auxiliary revenues, and other sources, a 4.2 percent increase from the revised sources available for 2013-14 of $39.8 million. The charts below demonstrate which operating revenues will provide the resources to fund the operating expenditure budget.
2014-15 2013-14
In 2014-15, the general fund appropriation (38.6 percent) will continue to provide the greatest proportion of the operating budget. Tuition and fees revenue will comprise 26 percent of the 2014-15 funding sources, followed by sales and services and other (including auxiliary revenues, investment income, and other miscellaneous revenue) (23.6 percent), endowment income (8.1 percent), grants and contracts (2 percent), and gifts (1.7 percent). FUNDING SOURCES State General Fund Appropriation The general fund appropriation for 2014-2015 is projected to total $16.0 million. This represents an increase of 0.6 percent as compared to the revised 2013-14 budget, which included general
funds provided for state-authorized salary increases during 2013-14. The 2014-15 appropriation reflects a $350,000 increase for undergraduate student financial aid, but does not reflect expected incremental general funds for related retirement and other fringe benefits likely to result from approval of the 2014 General Assembly budget. State funded financial aid is projected to total $2.4 million. A general fund appropriation totaling $195,860 for the Southwest Virginia Public Education Consortium (SVPEC) will continue in 2014-15. This appropriation is through the Virginia Department of Education. Wise serves as the fiscal agent for the SVPEC.
UVA
’S C
OLL
EGE
AT W
ISE
122

Tuition and Fees Tuition and fees, net of $50,000 for financial aid, are projected to total $10.8 million in 2014-15. This represents a $1.2 million or 12.1 percent increase over revised projections and includes both E&G and auxiliary fees. Wise’s continued commitment to student affordability is reflected in the recommendation of a 4.0 percent increase in tuition for in-state students and a 4.0 percent increase for out-of-state students and all foreign study courses. The Center for Teaching Excellence will continue to offer dual enrollment opportunities and professional teaching training programs. The technology fee will be $130 in 2014-15, an increase of $5 over 2013-14. The state-required out-of-state capital fee assessed to all non-resident students will remain at $632 per year in 2014-15. Planned enrollment, consistent with the Board-approved projections, continues to aid in providing incremental tuition and E&G revenue. Actual full-time equivalent enrollment for the fall 2013 semester totaled 1,636, a decrease of 4.2 percent as compared to fall 2012. Wise continues to implement strategies to improve retention, progression, and six-year graduation rates, including the early alert retention program, implemented in 2012-13. Through the support of the entire College community, these strategies and goals have resulted in improved student success. The more selective process in the offer of provisional admission to freshman and transfer applicants has also impacted student success. Wise continues to offer reduced tuition rates for students residing in targeted counties in Kentucky and Tennessee. Enrollment is projected at 1,652 for fall 2014, a 1 percent increase as compared to fall 2013. Student fees provide operating revenue for the majority of Wise’s student life programs. Activities receiving funds from student fee revenue include the student government association; student publications; intramural and outdoor recreational activities; graduation fee; student health services; athletics; student life programs; operating, maintenance, and housekeeping personnel assigned to Cantrell Hall and the Slemp Student Center; and debt service for the Slemp Student Center, Smith
Dining Commons, and the football stadium. No state E&G funds are available to support these programs and operations. Historically, Wise has been in the middle of the 15 public higher education institutions in Virginia in overall fees and has been one of the lowest in total cost of attendance in the Commonwealth. The student service fee for full-time students will increase 4.0 percent from $3,708 in 2013-14 to $3,856 in 2014-15. Grants, Contracts, and F&A Recoveries Sponsored research direct costs and indirect cost recoveries are projected to decrease by $33,197 or 3.8 percent in 2014-15 as compared to the revised 2013-14 budget. Grants ending in 2013-14 include the SEED Leadership Grant and the Entrepreneurship Initiative. Endowment Income and Gifts Projected endowment distributions total $3.4 million in 2014-15, an increase of 9.6 percent as compared to 2013-14. Private gifts, including $67,000 of athletic gift revenue, are projected to total $652,661 in 2014-15, representing a 22.8 percent increase over the 2013-14 revised projection. Sales and Services and Other Sources of Funds Other sources of funds for the 2014-15 operating budget represents sales and services, which include non-academic revenues supporting auxiliary services to students, faculty, and staff, such as housing rents, board rates, bookstore sales, parking passes and fines, athletic conference revenues and gate receipts, and other activities. Sales and services income is estimated to total $9.8 million in 2014-15, an increase of 0.4 percent as compared to 2013-14. The 2014-15 operating budget reflects revenues generated from increased housing rents, and increased meal plan rates as a result of implementing new meal plan options for students. As explained in more detail on page 128, these revenues will be used to support increased operating expenses of Wise’s auxiliary enterprises. The Graduate Medical Education Consortium (GMEC) will receive estimated revenues in 2014-15 totaling $117,111 from the Virginia
UVA
’S C
OLL
EGE
AT W
ISE
123
Department of Health (VDH). Prior to 2013-14, Wise received funding from VDH as state appropriation. This classification changed as a result of the Attorney General’s report concluding the GMEC program is only permissible with a bona fide contract. The GMEC entered into a contract with VDH effective July 1, 2013 and as a result, Wise submitted a 2014 Session Budget Amendment request to change the language in Chapter 806 of the 2013 Acts of Assembly; Item 297H to insert “GMEC is a program of the University of Virginia’s College at Wise.” For this reason, these revenues are now reflected as Sales and Services rather than state appropriations.
UVA
’S C
OLL
EGE
AT W
ISE
124

University of Virginia's College at Wise Projected Operating Sources
( $ )
Sources Amount
1
Tui on and GF
Appropria on
2
Grants & Contracts, F&A
3
Private Unrestricted
4
Private Restricted
5
Local Sales, Services,
Other
6
Auxiliary Total‐Amount
FY Resources Category
2014‐R Appropria ons: State
Tui on
Less: Tui on to Financial Aid
Student Fees
Sales & Services
Grants & Contracts
F&A ‐ Cost Recoveries
Endowment Distribu on
Endowment Admin Fee
Gi s
MBU Totals
2015‐O Appropria ons: State
Tui on
Less: Tui on to Financial Aid
Student Fees
Sales & Services
Grants & Contracts
F&A ‐ Cost Recoveries
Endowment Distribu on
Endowment Admin Fee
Gi s
MBU Totals
15,930,750 ‐ ‐ ‐ ‐ ‐ 15,930,750
7,267,956 ‐ ‐ ‐ ‐ ‐ 7,267,956
‐100,000 ‐ ‐ ‐ ‐ ‐ ‐100,000
212,223 ‐ ‐ ‐ ‐ 2,251,919 2,464,142
183,872 ‐ ‐ ‐ 72,600 9,520,562 9,777,034
‐ 836,001 ‐ ‐ ‐ ‐ 836,001
10,191 35,151 ‐ ‐ ‐ ‐ 45,342
‐ ‐ ‐ 2,982,073 ‐ ‐ 2,982,073
‐ ‐ 95,261 ‐ ‐ ‐ 95,261
‐ ‐ ‐ 531,340 ‐ ‐ 531,340
23,504,992 871,152 95,261 3,513,413 72,600 11,772,481 39,829,899
16,022,145 ‐ ‐ ‐ ‐ ‐ 16,022,145
8,146,320 ‐ ‐ ‐ ‐ ‐ 8,146,320
‐50,000 ‐ ‐ ‐ ‐ ‐ ‐50,000
296,225 ‐ ‐ ‐ ‐ 2,406,014 2,702,239
119,611 ‐ ‐ ‐ 72,600 9,621,485 9,813,696
‐ 811,379 ‐ ‐ ‐ ‐ 811,379
‐ 36,767 ‐ ‐ ‐ ‐ 36,767
‐ ‐ ‐ 3,273,175 ‐ ‐ 3,273,175
‐ ‐ 99,054 ‐ ‐ ‐ 99,054
‐ ‐ ‐ 652,661 ‐ ‐ 652,661
24,534,301 848,146 99,054 3,925,836 72,600 12,027,499 41,507,436
125

OPERATING USES BY ACTIVITY The schedule of Wise’s projected operating uses by activity on page 127 summarizes total expenditures by program: direct instruction, research, public service, academic support, student services, general administration, O&M of physical plant, scholarships and fellowships, and auxiliary/self-supporting. The following charts show the percentage of the total operating budget dedicated to each major activity: 2014-15 2013-14
Direct Instruction Direct instruction includes teaching and research (T&R) faculty, support staff, equipment, and operating costs associated directly with teaching. The 2014-15 instruction budget totals $11.4 million, an increase of 7.0 percent as compared to the revised 2013-14 budget. Wise will fund the third year of the six-year plan to address T&R faculty salary needs, non-general fund allocation for the planning and development of the STEM Early College Academy, High Need Degree funding to support the increased engagement of T&R faculty in the recruitment process and to investigate the feasibility of an RN-to-BSN online program, and fund a new full-time position for the Healthy Appalachia Institute in support of the Appalachian Prosperity Project. Research and Public Service The SVPEC, GMEC, the Office of Economic Development and the Pro-Art Association of Wise County, and the City of Norton make up the public service activities on the Wise campus. Sponsored research, both state and federal grant funded, is also included within this program. The 2014-15 operating budget for research and public service decreases by 4.8 percent to $1. 1 million, primarily as a result of completion of several sponsored program awards.
The 2014-15 general fund appropriation for the SVPEC will total $196,000. From this amount, $71,849 will be allocated to the William King Regional Arts Center, a non-state agency located in Abingdon, Virginia, for the Van Gogh outreach program that serves the far southwest Virginia region. The SVPEC also approved the allocation of $23,340 of its appropriation to the College’s E&G budget during 2013-14. GMEC will receive funding from the Virginia Department of Health in the projected amount of $117,111, a decrease of 30.7 percent as compared to the revised 2013-14 budget. The GMEC mission will continue, improving access to high-quality primary care for the citizens of Virginia by forming educational partnerships between rural and underserved communities in Southwest Virginia. Funding for the Pro-Art Association of Wise County and the City of Norton will total $19,000 in 2014-15.
UVA
’S C
OLL
EGE
AT W
ISE
126
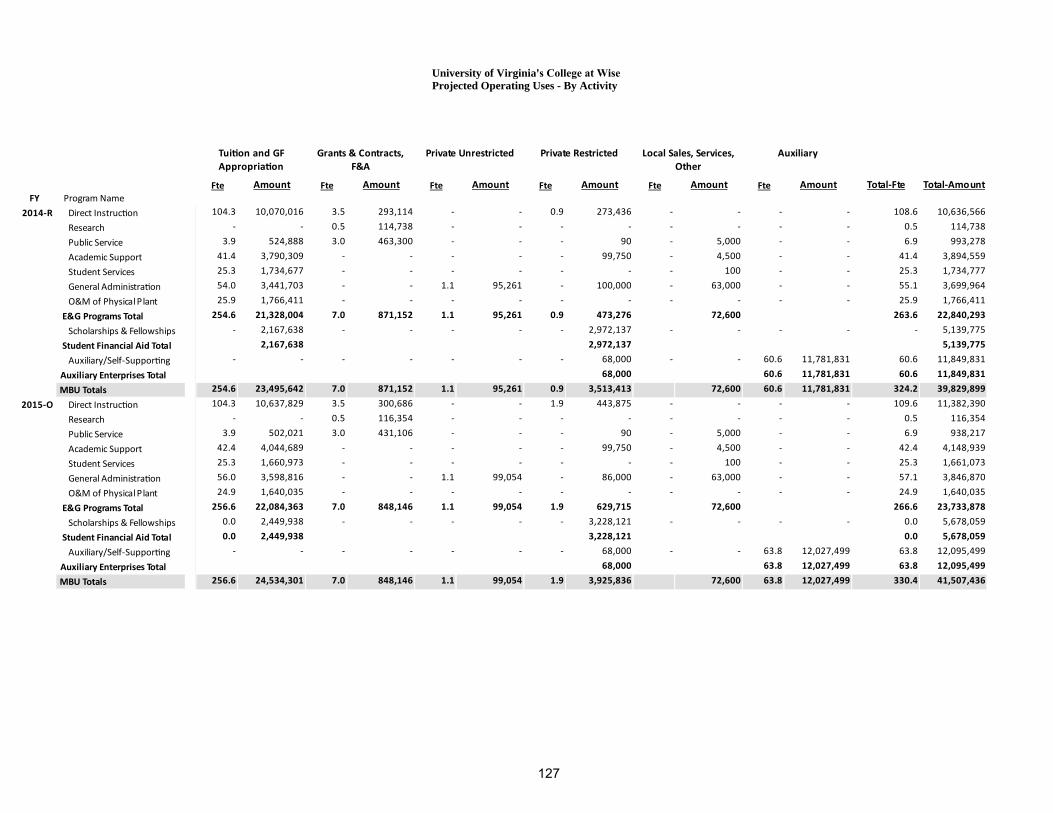
University of Virginia's College at Wise Projected Operating Uses - By Activity
1
Tui on and GF
Appropria on
Fte Amount
2
Grants & Contracts,
F&A
Fte Amount
3
Private Unrestricted
Fte Amount
4
Private Restricted
Fte Amount
5
Local Sales, Services,
Other
Fte Amount
6
Auxiliary
Fte Amount Total‐Fte Total‐AmountFY Subtotal for Program Name 1Program SortProgram Name
2014‐R 1 Direct Instruc on
1 Research
1 Public Service
1 Academic Support
1 Student Services
1 General Administra on
1 O&M of Physical Plant
E&G Programs Total
1 Scholarships & Fellowships
Student Financial Aid Total
8 Auxiliary/Self-Suppor ng
Auxiliary Enterprises Total
MBU Totals
2015‐O 1 Direct Instruc on
1 Research
1 Public Service
1 Academic Support
1 Student Services
1 General Administra on
1 O&M of Physical Plant
E&G Programs Total
1 Scholarships & Fellowships
Student Financial Aid Total
8 Auxiliary/Self-Suppor ng
Auxiliary Enterprises Total
MBU Totals
104.3 10,070,016 3.5 293,114 - - 0.9 273,436 - - - - 108.6 10,636,566
- - 0.5 114,738 - - - - - - - - 0.5 114,738
3.9 524,888 3.0 463,300 - - - 90 - 5,000 - - 6.9 993,278
41.4 3,790,309 - - - - - 99,750 - 4,500 - - 41.4 3,894,559
25.3 1,734,677 - - - - - - - 100 - - 25.3 1,734,777
54.0 3,441,703 - - 1.1 95,261 - 100,000 - 63,000 - - 55.1 3,699,964
25.9 1,766,411 - - - - - - - - - - 25.9 1,766,411
254.6 21,328,004 7.0 871,152 1.1 95,261 0.9 473,276 72,600 263.6 22,840,293
- 2,167,638 - - - - - 2,972,137 - - - - - 5,139,775
2,167,638 2,972,137 5,139,775
- - - - - - - 68,000 - - 60.6 11,781,831 60.6 11,849,831
68,000 60.6 11,781,831 60.6 11,849,831
254.6 23,495,642 7.0 871,152 1.1 95,261 0.9 3,513,413 72,600 60.6 11,781,831 324.2 39,829,899
104.3 10,637,829 3.5 300,686 - - 1.9 443,875 - - - - 109.6 11,382,390
- - 0.5 116,354 - - - - - - - - 0.5 116,354
3.9 502,021 3.0 431,106 - - - 90 - 5,000 - - 6.9 938,217
42.4 4,044,689 - - - - - 99,750 - 4,500 - - 42.4 4,148,939
25.3 1,660,973 - - - - - - - 100 - - 25.3 1,661,073
56.0 3,598,816 - - 1.1 99,054 - 86,000 - 63,000 - - 57.1 3,846,870
24.9 1,640,035 - - - - - - - - - - 24.9 1,640,035
256.6 22,084,363 7.0 848,146 1.1 99,054 1.9 629,715 72,600 266.6 23,733,878
0.0 2,449,938 - - - - - 3,228,121 - - - - 0.0 5,678,059
0.0 2,449,938 3,228,121 0.0 5,678,059
- - - - - - - 68,000 - - 63.8 12,027,499 63.8 12,095,499
68,000 63.8 12,027,499 63.8 12,095,499
256.6 24,534,301 7.0 848,146 1.1 99,054 1.9 3,925,836 72,600 63.8 12,027,499 330.4 41,507,436
127

Academic Support Academic support includes library services, technological and computer services, and general academic services to both students and instructional faculty. Faculty development and recruitment are also included within this program. The 2014-15 academic support budget totals $4.1 million, an increase of 6.5 percent as compared to the revised 2013-14 budget. Student Services Student Services includes social and cultural development activities, counseling and career guidance, as well as general student affairs services. Enrollment management, financial aid services, registration services, publication costs associated with student recruitment, and programs designed to meet the guidelines of the American Disabilities Act also are part of the student services activity. The 2014-15 student services budget totals $1.7 million, a 4.2 percent decrease as compared to the revised 2013-14 budget. The decrease reflects one-time funding in the 2013-14 budget for initiatives related to recruitment and other student service initiatives. General Administration Institutional support from executive management, fiscal operations, logistical services, development, public relations, and staff training and development totals $3.8 million in 2014-15, an increase of 4 percent as compared to the revised 2013-14 budget. O&M of Plant Physical plant services in housekeeping, maintenance operations, utilities, landscaping and grounds maintenance totals $1.6 million in 2014-15, a decrease of 7.2 percent as compared to the revised 2013-14 budget. This decrease is due to increased O&M recoveries and unfilled positions. Student Financial Aid The student financial aid budget totals $5.7 million in 2014-15, an increase of 10.5 percent as compared to the revised 2013-14 budget. The general fund appropriation for student financial aid in 2014-15 totals $2.4 million, reflecting projected increased state support of $350,000
per Governor McDonald’s 2014 Introduced Budget. Student financial aid from private funds and grants totals $3.3 million in 2014-15, an increase of 8.7 percent over the revised 2013-14 budget. Auxiliary Enterprises The 2014-15 auxiliary enterprise operating budgets total $12.1 million. Self-supporting activities include student housing operations, conference events, bookstore, dining services, fleet vehicle management, SWVA Tech Center conferences, printing and copying services, parking and transportation, student health services, student union operations, athletics, and debt service for residence halls, dining hall, football stadium, student union buildings, and the Winston Ely Health and Wellness Center. Funded solely by revenue collected for services provided to students, faculty, staff and the general public, the auxiliary enterprise operating budget comprises 29.1 percent of Wise’s total operating budget. Student Housing Occupancy levels are projected to remain at 82 percent in 2014-15. The college recently completed work with Noel-Levitz, a nationally known higher education consulting firm to identify creative solutions and programmatic improvements to bring the occupancy rate to the 90 to 100 percent. To maintain and effectively operate Wise’s residence halls, revenue must reflect the cost of operation because the Commonwealth does not provide operational funding for residence halls. Continuing to provide residence life opportunities to meet the needs and expectations of the student body will require a 3.2 percent increase in room rates. This increase includes the funding stream to maintain the financial model for the capital outlay program that is currently underway. The 2014-15 operating budget for residence hall programs totals $2.7 million. Parking & Transportation The 2014-15 operating budget for parking and transportation services totals $159,150. Services include parking management, along with associated staffing including campus police.
UVA
’S C
OLL
EGE
AT W
ISE
128

Dining Services Projected 2014-15 expenditures in the dining services operating budget will total $2 million. To maintain and effectively operate Wise’s dining services, revenue must reflect the cost of operation. To continue providing meal opportunities that meet the needs and expectations of the student body, Wise must keep its meal revenue in line with inflationary increases and operational needs. The CPI for the out-of-home food service for 2013 was 2.3 percent. Based on negotiations with Chartwells, Wise’s dining service provider, the meal plan rate for on-campus residents will increase 4 percent, with an increase of 5 percent for optional meal plan contracts for commuting students. Bookstore The 2014-15 operating budget for the bookstore will total $1.1 million. This represents a $294,225 or 21.7% decrease as compared to revised 2013-14 projections. External online options for the purchase and rental of textbooks, including sales from general merchandise and changes to the Student Charge policy have resulted in deceased revenue in the campus bookstore. Athletics The 2014-15 operating budget for the intercollegiate athletics program totals $2.6 million. In February 2013, the Mountain East Conference (MEC), of which Wise is a charter member, announced that its application for membership had been approved by the NCAA Division II Membership Committee. The MEC officially became the 25th NCAA Division II conference on September 1, 2013 and immediately assumed active status. New positions for 2014-15 include the Assistant Women’s Lacrosse Coach, Trainer, and Assistant Director of Sports Information. Expenditures for intercollegiate athletic programs include all athletic team travel and meals, wages for student and part-time coaching
personnel, uniforms, and equipment, as well as all expenses related to recruitment activities. Staffing FTE positions for 2014-15 have been allocated as follows and reflect an increase of six positions over revised staffing levels in 2013-14:
E&G 256.6 Auxiliary Enterprises 63.8 Sponsored Programs 7.0 Private Sources 3.0 Total 330.4 The increase of 3 FTEs in E&G over the revised 2013-14 budget is due to new positions in Instructional Technology, College Services and Public Relations & Development. Of the 3.25 additional auxiliary FTE positions, three have been allocated to support Women’s Lacrosse, Trainer, and Winston Ely Health & Wellness Center. The remaining 0.25 auxiliary FTE is a net reallocation of current athletic positions. On average, FTE levels have increased about 9.6 positions each year over the past four years. Increases have reflected the College’s efforts to meet staffing needs related to new facilities, the Graduate Medical Education Consortium (GMEC), enhanced student services and student activities including intercollegiate athletics, and faculty positions needed for classroom instruction.
FTE Levels, Fiscal Years 2011-12 to 2014- 15
0
100
200
300
400
2011‐2012 2012‐2013 2013‐2014 2014‐2015
UVA
’S C
OLL
EGE
AT W
ISE
129

THE UNIVERSITY OF VIRGINIA MEDICAL CENTER
130

.UNIVERSITY OF VIRGINIA MEDICAL CENTER 2014-2015 BUDGET SUMMARY
The Medical Center’s 2014-2015 fiscal plan has been developed while considering the challenge of providing patient care, teaching, and research services in an increasingly changing health care industry. The full impact of the Accountable Care Act will not be realized for a number of years; however, many of its provisions have already been implemented. The impact will be decreased reimbursements from government payors and an industry-wide erosion of pricing power with private payors. Nationally and locally there has been downward pressure on inpatient utilization and growth in demand for outpatient services. At the same time, costs associated with providing quality patient care will continue to have upward pressure due to increases in medical supply, pharmaceutical, and medical device expenses, growing administrative burden, and a shortage of health care workers. These changes require proactive fiscal planning now to ensure meeting the mission of the Health System in the future.
To meet these challenges, the Medical Center utilizes a priority-based budget process to align resource allocations with Medical Center strategies and goals to achieve the Health System’s strategic planning goal of becoming a top decile academic medical center based on quality measures. The Medical Center budget development process is operationally focused and highly participatory. Patient care service management, support function management, and physicians have significant roles in the budget development cycle. The budget process begins with senior management developing basic budget assumptions such as discharges, length of stay, and productivity standards which drive the number of employees. The budget is consistent with the Long Range Financial Plan. The final budget provides each operating unit a cumulative operating budget that contains service demand forecasts, required full-time equivalent personnel, and non-labor expenses. BUDGET DEVELOPMENT ASSUMPTIONS Market Conditions For 2014-15, discharges are budgeted to grow 1.8 percent from 2013-14 projected levels. Inpatient demand for healthcare services from the existing population is expected to remain flat and demand for outpatient services to grow by
3.2 percent. The Medical Center is also expected to capture additional market share in high case mix index (CMI) services by implementing the Centers of Excellence in the strategic plan. The following table includes historical and projected patient volumes:
Actual
2012-13 Projected 2013-14
Budget 2014-15
Discharges - Medical Center 28,859 28,120 28,637 Discharges - Transitional Care Hospital 305 303 426 Adjusted Discharges 54,578 55,218 58,079 Average Length of Stay (ALOS) -Medical Center
5.62 5.74 5.40
ALOS - Transitional Care Hospital 26.43 31.00 28.99 Patient Days – Medical Center 161,487 161,771 154,640 Patient Days – Transitional Care Hospital 8,389 9,534 12,346 Clinic & Emergency Room Visits 824,941 848,840 911,731
UVA
MED
ICAL
CEN
TER
131

Revenues The Medical Center has seen growth in volumes over the last year, but a disproportionate share of the growth has been Medicaid and Medicare patients. One of the Medical Center’s largest challenges is the unwillingness of government payors to increase their payments commensurate with the increases in medical delivery costs. Growth in revenues will result from the impact of increasing volume and negotiated contracts that include rate increases. Medical Center volume growth is focused on outpatient services with continued implementation of the Centers of Excellence, opening of the Battle Building for pediatric services, expansion of the Outpatient Surgery Center from eight operating rooms to twelve, and the implementation of the outreach strategy. Rate Changes The Medical Center proposes an overall rate increase of 5 percent to 7 percent, which is commensurate with rate increases expected to be implemented in the hospital industry. Expenses Expenses from operations are projected to increase by $93.5 million from the 2013-14 projection. Expenses per CMI weighted adjusted discharges are projected to increase, going from $10,656 to $10,926 (excluding the Transitional Care Hospital). The 2014-15 expense per adjusted discharge includes $11.8 million for implementation of the Centers of Excellence Strategic Initiative, $4.5 million for Accountable Care Organization, and $1.5 million for conversion to ICD-10 (10th revision of the International Statistical Classification of Diseases and Related Health Problems). Without the items noted above, the 2013-14 cost per adjusted discharge would be $10,626, and 2014-15 would be $10,771. The Medical Center anticipates that expense per CMI weighted adjusted discharge included in the budget will be approximately equal to the academic medical center median expense as shown in the University Health System Consortium Operational Data Base.
Previous increases in capital investment will result in additional depreciation expense of $11 million for 2014-15. Interest on capital investments is increasing by $2.5 million for 2014-15. The Medical Center’s 2014-15 fiscal plan accounts for these additional expenses while preserving its goal of providing high-quality and cost-effective health care, education, and research services.
The pay-for-performance pool has been established at $8 million, which includes the impact on benefit costs and is based on a 3 percent salary adjustment with an October implementation date. Other salary adjustments, such as market and compensation design adjustments total $4 million, including the impact on benefit costs. Staffing The Medical Center’s 2014-15 budget has been benchmarked with comparable academic medical centers. FTEs are planned at 7,495, an increase of 297 FTEs from the current fiscal year projection of 7,198 FTEs. Increased staffing for the Centers of Excellence and related patient care account for an increase of 100 FTEs. The remainder of the growth is to support facility expansion and core program growth for existing operations, including 44 additional FTEs to support bedside staffing ratios at the Medical Center and the Transitional Care Hospital. OPERATING PLAN The operating plan is presented on page 132 and includes actual results from 2012-13, the original 2013-14 budget, the 2013-14 projection, and the 2014-15 budget. The Medical Center’s 2014-15 fiscal plan projects an operating margin of $59.2 million or 4.4 percent. With non-operating activities contributing $37.4 million, net income is budgeted at $96.7 million. In comparison, it is projected that the 2013-14 operating margin will be $66.9 million or 5.3 percent. Non-operating activities in 2013-14 are expected to contribute $48.3 million, for a net income of $115.2 million.
UVA
MED
ICAL
CEN
TER
132
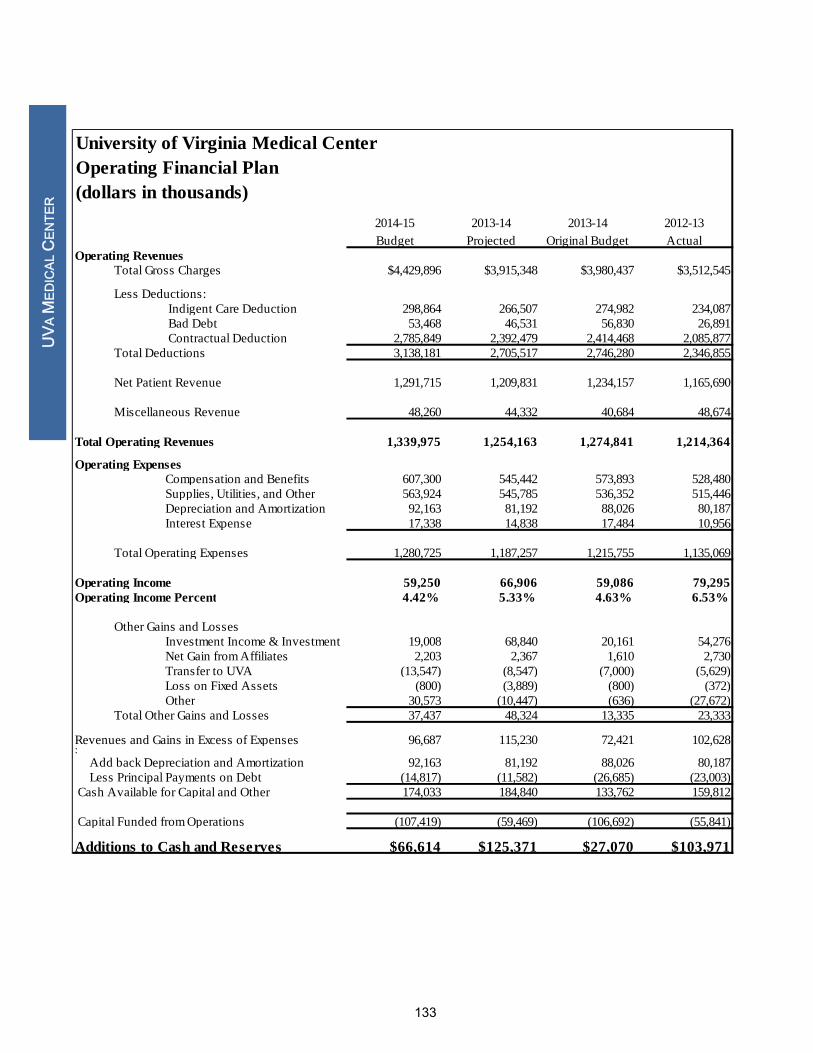
2014-15 2013-14 2013-14 2012-13
Budget Projected Original Budget Actual
$4,429,896 $3,915,348 $3,980,437 $3,512,545
Indigent Care Deduction 298,864 266,507 274,982 234,087 Bad Debt 53,468 46,531 56,830 26,891 Contractual Deduction 2,785,849 2,392,479 2,414,468 2,085,877
3,138,181 2,705,517 2,746,280 2,346,855
1,291,715 1,209,831 1,234,157 1,165,690
48,260 44,332 40,684 48,674
1,339,975 1,254,163 1,274,841 1,214,364
Compensation and Benefits 607,300 545,442 573,893 528,480 Supplies, Utilities, and Other 563,924 545,785 536,352 515,446 Depreciation and Amortization 92,163 81,192 88,026 80,187 Interest Expense 17,338 14,838 17,484 10,956
1,280,725 1,187,257 1,215,755 1,135,069
59,250 66,906 59,086 79,295 4.42% 5.33% 4.63% 6.53%
Investment Income & Investment 19,008 68,840 20,161 54,276 Net Gain from Affiliates 2,203 2,367 1,610 2,730 Transfer to UVA (13,547) (8,547) (7,000) (5,629) Loss on Fixed Assets (800) (3,889) (800) (372) Other 30,573 (10,447) (636) (27,672)
37,437 48,324 13,335 23,333
96,687 115,230 72,421 102,628
92,163 81,192 88,026 80,187 (14,817) (11,582) (26,685) (23,003) 174,033 184,840 133,762 159,812
(107,419) (59,469) (106,692) (55,841)
$66,614 $125,371 $27,070 $103,971Additions to Cash and Reserves
: Add back Depreciation and Amortization Less Principal Payments on Debt Cash Available for Capital and Other
Capital Funded from Operations
Revenues and Gains in Excess of Expenses
Less Deductions:
Total Deductions
Net Patient Revenue
Miscellaneous Revenue
Total Operating Revenues
Operating Expenses
Total Operating Expenses
Operating IncomeOperating Income Percent
Other Gains and Losses
Total Other Gains and Losses
Total Gross Charges
University of Virginia Medical CenterOperating Financial Plan(dollars in thousands)
Operating Revenues
UVA
MED
ICAL
CEN
TER
133

The rapidly changing health care environment will require continuous examination of budget assumptions. Management will monitor budget versus actual performance on a monthly basis and, where appropriate, make changes to operations. Also, management will continue to identify and implement process improvement strategies that will allow for operational streamlining and cost efficiencies. The Medical Center financial objectives for the next fiscal year include: Continuously improving quality to achieve recognition as a top decile provider of clinical care among
academic health centers;
Maintaining financial stability; defined as maintaining financial ratios used by rating agencies at a level that supports a top rated bond;
Maintaining adequate working capital to foster growth in capacity, technology, and innovation to meet healthcare needs in Virginia;
Continuing investment in the capital requirements of the Medical Center with the priorities of
maintaining the current patient care infrastructure, Electronic Medical Record, Emergency Department Expansion and the Education Resource Center;
Maintaining market-driven and performance-based salaries for employees;
Funding the Strategic Investment Pool to grow the tri-partite mission of clinical care, education, and research; and
Beginning to fund emerging activities around population health. The major risk factors that impact the ability to accomplish the fiscal plan include:
Medicaid and Indigent Care Funding and whether the Commonwealth of Virginia participates;
Impact of federal healthcare reform including, mandatory coverage; further reductions to Graduate
Medical Education, Indirect Medical Education, and Facility Fees; and lack of resolution by Centers for Medicaid and Medicare Services (CMS) of the sustainable growth rate issue for physicians;
Emerging highly competitive environment;
Medicare payments at risk due to value based purchasing, electronic health record meaningful use,
and hospital readmissions;
Centers of Excellence and Outreach fail to achieve market share and volume goals;
Inability to adapt to continued shifts in healthcare utilization trends from being inpatient-centric to a balanced mix of inpatient and outpatient services; and
Changes in market dynamics from emerging Accountable Care Organizations and Clinically Integrated Networks.
UVA
MED
ICAL
CEN
TER
134

CAPITAL PLAN Funds available to meet capital requirements are derived from operating cash flows, funded depreciation reserves, philanthropy, and interest income. The Medical Center faces many challenges regarding capital funding as continued pressures on the operating margin affect cash flow, while demand for capital has increased significantly due to space requirements, technological advances, and aging of existing equipment. Subject to funds availability, the Medical Center management recommends $107.4 million be authorized for capital requirements, which includes $5.0 million for contingencies and $12.3 million for the Strategic Investment Pool.
UVA
MED
ICAL
CEN
TER
135
ANNUAL RENOVATION & INFRASTRUCTURE PROJECTS PLAN
136

UNIVERSITY OF VIRGINIA ACADEMIC DIVISION AND MEDICAL CENTER ANNUAL RENOVATION AND INFRASTRUCTURE PROJECTS PLAN
Under Restructuring and the 2011 Acts of Assembly, Chapter 890, the Board has been delegated
the authority to approve all capital projects (acquisitions, capital leases, or new construction or renovation projects costing more than $2 million and impacting more than 5,000 gross square feet) funded with non-general funds. To facilitate the consideration of certain projects, the Board considers the Annual Renovation and Infrastructure Projects (ARIP) Plan each year.
With the Budget Summary presentation to the Board, the Academic Division and the Medical
Center will present a detailed list of renovation and infrastructure projects expected to cost between $2 million and $5 million, to be funded with non-general fund cash (no debt), and expected to be initiated within the next fiscal year. This shorter, annual approval process allows these smaller projects to be planned in a more appropriate timeline based on the nature of the project. For example, renovating a lab for a new scientist is a project for which the need will arise during recruitment and which requires completion before the scientist joins the faculty. The 2014-15 ARIP Plan is shown on the following page.
The Academic Division’s 2014-15 ARIP Plan incorporates projects totaling $10.7 million to
$12.8 million and addresses Brown College bathroom renovations; Faulkner kitchen and bathroom renovations, flooring, air handling, and fire detection improvements; Jordan Hall Lab renovation for Histology; and an increase to the previously authorized ARIP for the JPJ Arena water intrusion project. All of the projects will be funded from maintenance cash reserves. The Medical Center’s 2014-15 ARIP Plan adds one project for renovation of the Primary Care Center with a budget range of $2.7 million to $3.3 million. This project will be funded from Medical Center operating funds. The Medical Center is authorized to substitute a new project costing between $2 million and $5 million for a project included on the approved ARIP, provided that the total capital budget as approved by the Board is not exceeded and that a report is provided at each Board meeting listing the changes made to the original project list.
ANN
UAL
REN
OVA
TIO
N &
INFR
ASTR
UC
TUR
E PR
OJE
CTS
PLA
N
137

2014-15 Annual Renovation and Infrastructure Projects Plan
School/ Unit Low High
ACADEMIC DIVISION Housing Brown College - Bathroom renovation. Includes the
replacement of finishes and fixtures, asbestos abatement and installation of exhaust. Construction to occur summer of 2014 and 2015.
94,292 gsf 2,000,000$ -$ -$ 1,800,000$ 2,200,000$
Housing Faulkner: Renovation of kitchens and bathrooms in all apartment units; replacement of all floor finishes; replacement of air handling units; enhancement of fire detection system. Construction to occur FY16 and FY17. Design to occur FY15
77,086 gsf 2,480,000$ -$ 2,200,000$ 2,800,000$
SOM Jordan Hall Histology Laboratory Office Renovations / 2nd Floor
3,715 gsf -$ -$ 2,500,000$ 2,200,000$ 2,800,000$
Athletics JPJ Arena Water Intrusion - Increase Existing Authorization of $3.3M to $5.0M
5,000,000$ -$ -$ 4,500,000$ 5,000,000$
TOTAL ACADEMIC DIVISION 9,480,000$ -$ 2,500,000$ 10,700,000$ 12,800,000$
MEDICAL CENTERMed Ctr Primary Care Center Reoccupancy Renovation 20,000 gsf -$ 3,000,000$ -$ 2,700,000$ 3,300,000$
TOTAL MEDICAL CENTER -$ 3,000,000$ -$ 2,700,000$ 3,300,000$
Other
Total Project Budget Range
Auxiliary Reserve
Medical Center OperatingProject Description Scope
138

RESOLUTION
139
APPROVAL OF THE 2014-2015 OPERATING BUDGET AND ANNUAL RENOVATION AND INFRASTRUCTURE PLAN FOR THE ACADEMIC DIVISION RESOLVED, the 2014-2015 Operating Budget and Annual Renovation and Infrastructure Plan for the Academic Division is approved as recommended by the President and the Chief Operating Officer subject to any necessary revisions when a final state budget is approved by the General Assembly and the Governor. APPROVAL OF PRATT FUND DISTRIBUTION FOR 2014-2015
RESOLVED, the budget for the expenditure of funds from the Estate of John Lee Pratt is approved to supplement appropriations made by the Commonwealth of Virginia for the School of Medicine and the Departments of Biology, Chemistry, Mathematics, and Physics in the College of Arts and Sciences. Departmental allocations, not to exceed $8,633,000 for 2014-2015, are suggested by the department chairs and recommended by the dean of each school; the disbursement of each allotment will be authorized by the Executive Vice President and Provost. To the extent the annual income from the endowment is not adequate to meet the recommended distribution, the principal of the endowment will be disinvested to provide funds for the approved budgets. APPROVAL OF THE 2014-2015 OPERATING BUDGET FOR THE UNIVERSITY OF VIRGINIA'S COLLEGE AT WISE RESOLVED, the 2014-2015 Operating Budget for The University of Virginia’s College at Wise is approved as recommended by the President and the Chief Operating Officer subject to any necessary revisions when a final state budget is approved by the General Assembly and the Governor. APPROVAL OF THE 2014-2015 OPERATING AND CAPITAL BUDGETS AND ANNUAL RENOVATION AND INFRASTRUCTURE PLAN FOR THE UNIVERSITY OF VIRGINIA MEDICAL CENTER RESOLVED, the 2014-2015 Operating and Capital Budgets and the Annual Renovation and Infrastructure Plan for the University of Virginia Medical Center is approved as recommended by the President, the Chief Operating Officer, and the Medical Center Operating Board. APPROVAL OF THE 2014-2015 OPERATING AND CAPITAL BUDGETS FOR THE UNIVERSITY OF VIRGINIA TRANSITIONAL CARE HOSPITAL
RESOLVED, the 2014-2015 Operating and Capital Budgets for the University of Virginia Transitional Care Hospital, presented as a component of the Medical Center Operating Budget, is approved as recommended by the President, Chief Operating Officer, and the Medical Center Operating Board.
RES
OLU
TIO
N
140