ambit capital - dish tv india ltd. - water, water everywhere (company insight) (sell)
DESCRIPTION
Ambit Capital - Dish TV India Ltd. - Water, Water Everywhere (Company Insight) (SELL)TRANSCRIPT
Ambit Capital and / or its affiliates do and seek to do business including investment banking with companies covered in its research reports. As a result, investors should be aware that Ambit Capital may have a conflict of interest that could affect the objectivity of this report. Investors should not consider this report as the only factor in making their investment decision.
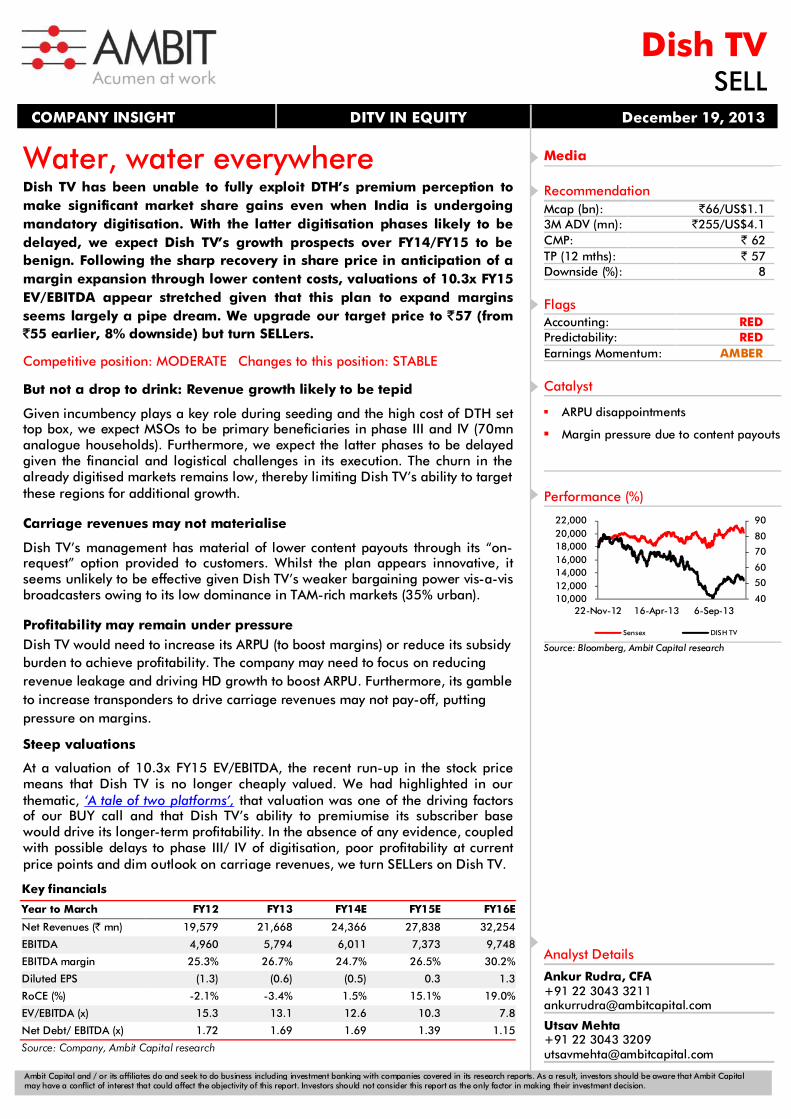
Water, water everywhere Dish TV has been unable to fully exploit DTH’s premium perception to make significant market share gains even when India is undergoing mandatory digitisation. With the latter digitisation phases likely to be delayed, we expect Dish TV’s growth prospects over FY14/FY15 to be benign. Following the sharp recovery in share price in anticipation of a margin expansion through lower content costs, valuations of 10.3x FY15 EV/EBITDA appear stretched given that this plan to expand margins seems largely a pipe dream. We upgrade our target price to `57 (from `55 earlier, 8% downside) but turn SELLers.
Competitive position: MODERATE Changes to this position: STABLE
But not a drop to drink: Revenue growth likely to be tepid
Given incumbency plays a key role during seeding and the high cost of DTH set top box, we expect MSOs to be primary beneficiaries in phase III and IV (70mn analogue households). Furthermore, we expect the latter phases to be delayed given the financial and logistical challenges in its execution. The churn in the already digitised markets remains low, thereby limiting Dish TV’s ability to target these regions for additional growth.
Carriage revenues may not materialise
Dish TV’s management has material of lower content payouts through its “on-request” option provided to customers. Whilst the plan appears innovative, it seems unlikely to be effective given Dish TV’s weaker bargaining power vis-a-vis broadcasters owing to its low dominance in TAM-rich markets (35% urban).
Profitability may remain under pressure Dish TV would need to increase its ARPU (to boost margins) or reduce its subsidy burden to achieve profitability. The company may need to focus on reducing revenue leakage and driving HD growth to boost ARPU. Furthermore, its gamble to increase transponders to drive carriage revenues may not pay-off, putting pressure on margins.
Steep valuations
At a valuation of 10.3x FY15 EV/EBITDA, the recent run-up in the stock price means that Dish TV is no longer cheaply valued. We had highlighted in our thematic, ‘A tale of two platforms’, that valuation was one of the driving factors of our BUY call and that Dish TV’s ability to premiumise its subscriber base would drive its longer-term profitability. In the absence of any evidence, coupled with possible delays to phase III/ IV of digitisation, poor profitability at current price points and dim outlook on carriage revenues, we turn SELLers on Dish TV.
Dish TV SELL
COMPANY INSIGHT DITV IN EQUITY December 19, 2013
Key financials
Year to March FY12 FY13 FY14E FY15E FY16E
Net Revenues (` mn) 19,579 21,668 24,366 27,838 32,254
EBITDA 4,960 5,794 6,011 7,373 9,748
EBITDA margin 25.3% 26.7% 24.7% 26.5% 30.2%
Diluted EPS (1.3) (0.6) (0.5) 0.3 1.3
RoCE (%) -2.1% -3.4% 1.5% 15.1% 19.0%
EV/EBITDA (x) 15.3 13.1 12.6 10.3 7.8
Net Debt/ EBITDA (x) 1.72 1.69 1.69 1.39 1.15
Source: Company, Ambit Capital research
Media
Recommendation Mcap (bn): `66/US$1.1 3M ADV (mn): `255/US$4.1 CMP: ` 62 TP (12 mths): ` 57 Downside (%): 8
Flags Accounting: RED Predictability: RED Earnings Momentum: AMBER
Catalyst
ARPU disappointments
Margin pressure due to content payouts
Performance (%)
Source: Bloomberg, Ambit Capital research
Analyst Details
Ankur Rudra, CFA +91 22 3043 3211 [email protected]
Utsav Mehta +91 22 3043 3209 [email protected]
40
50
60
70
80
90
10,000 12,000 14,000 16,000 18,000 20,000 22,000
22-Nov-12 16-Apr-13 6-Sep-13
Sensex DISH TV

Dish TV
19 December 2013 Ambit Capital Pvt. Ltd. Page 2
Revenue growth likely to stagnate Dish TV’s growth in the past was largely driven by a growing customer base even as ARPU had only inched upwards (see Exhibit 1). Given that the first two phases of digitisation have resulted in limited subscriber additions (net 1.1mn in the year-ended 1QFY14) and the uncertain timeline for the latter phases, subscriber additions are likely to remain tepid over FY14/ FY15. Furthermore, as direct billing continues to be delayed, with no dramatic pick-up in HD services on the horizon, ARPU may not rise enough to make incremental growth profitable. Thus, we expect revenue growth to stagnate over the next two years at 13% in FY14 and 14% in FY15 despite optimistic ARPU assumptions (of 6% in FY14 and 8% in FY15).
Exhibit 1: Dish TV’s revenue growth has been driven by subscriber growth, as ARPU growth has remained tepid
Source: Company, Ambit Capital research
Subscriber additions likely to remain slow: DTH’s performance during phase II of digitisation was disappointing, with the company adding ~11% of the total digitising subscribers between March and June 2013. Dish TV’s share of these customers is likely to be ~18-20%. With phase III and IV on the agenda in 2QFY15 and 3QFY15, the outlook on subscriber additions is negative. Note that prior to FY13, Dish TV’s gross additions (see Exhibit 1) was aided by competing against analogue cable and limited competition from MSOs. With limited churn in already digitised phase I and II and increasing competition in voluntary digitisation of phase III and IV, Dish TV’s subscriber additions are likely to remain weak. We have estimated net additions of 0.8mn in FY14 and FY15 each, as we anticipate the latter phases of digitisation to be delayed.
Is phase III/ IV as large an opportunity as believed? The phase III/IV opportunity is pegged at 70-75mn analogue households by the management of Den, Hathway and Dish TV. We do not expect these households to be digitised at one shot and expect significant delays to full digitisation. The delays would become starker as it moves into phase IV. We expect full digitisation (90% in phase IV) only by FY19. The delays would be led by pending implementation of the digital addressable system (DAS) in the earlier phases, logistical issues and capital requirements.
Furthermore, although DTH is more dominant in these regions vis-à-vis major cities, it must be highlighted that most of the subscribers in this opportunity are already cable users. As seen in the earlier phases, incumbency plays a significant role in the selection of a platform.
100 110 120 130 140 150 160 170 180 190
0
2
4
6
8
10
12
14
FY09 FY10 FY11 FY12 FY13 FY14E FY15E
ARPU (Rs)Subs (mn) Subscribers (LHS) ARPU (RHS)
Estimates

Dish TV
19 December 2013 Ambit Capital Pvt. Ltd. Page 3
Exhibit 2: Cable vs DTH in phase I – share of subscribers (mn)
Source: MIB
Exhibit 3: Cable vs DTH in phase II – share of subscribers (mn)
Source: MIB
Hence, a customer share heavily in favour of DTH is unlikely. Only the customers of those independent MSOs that do not have the capital to seed STBs and those customers that have not been absorbed by the national MSOs may opt for DTH. The MSOs have already begun to seed set-top boxes in phase-III regions adjoining major cities, leading to an expansion in the subscriber universe for MSOs such as Hathway.
Exhibit 4: Market share split for phase III – our expectations
Source: Ambit Capital research
Carriage plans may not materialise: Dish TV’s management has high hopes on the ‘on-request’ option that it provides to customers as a means to reduce content costs significantly (http://goo.gl/BrtUwL). Furthermore, the company has indicated that it may lease up to five additional transponders and use the excess capacity to charge carriage fees. The company recently published its carriage rate card (http://goo.gl/tSe5Ig). Whilst we highlight that the plan is innovative, it is unlikely to payoff since execution has failed in the past. Despite the management’s well-laid plans, the company does not possess the quality of subscriber base to bargain better against broadcasters. However, note that Dish TV does not have the same regional dominance in TAM markets to significantly impact the viewership numbers.
DTH, 2.2
Cable, 6.5
DTH, 5.0
Cable, 12.7
Phase III/ IV70mn analogue
Cable35mn
- Peripheral regions of large cities such as Vasai, Faridabad. - TAM rich and relatively high ARPU areas- Done through partnership with already exisitng cable operators- Benefit from incumbency
DTH35mn
- Stronger in scarcely populated regions where cable cannot compete- Relatively poorer ARPU regions- High STB costs may delay seeding/ uptake- No incumbency benefits

Dish TV
19 December 2013 Ambit Capital Pvt. Ltd. Page 4
Exhibit 5: Dish TV’s management is bullish on carriage fees…
“We expect our content costs to come down significantly through this scheme over a period of time and we can also pass on the benefits to the consumer.
This new initiative will free up the bandwidth. It will also help the company have a model to earn additional revenues through carriage fees. We have already circulated a rate card to all broadcasters for carriage services.”
- Mr Venkateish, CEO, Dish TV on “request only option”, 14 Nov 2013
Source: Media sources
Exhibit 6: …as it is bullish on mobile revenues…
"We expect that this section would scale rapidly and would cover 20-25 per cent of our revenue from this section (in the next two to three years)"
- Mr Venkateish, CEO, Dish TV on the launch of its mobile apps, 6 Oct 2013
Source: Media sources
Exhibit 7: …but execution has been patchy
Time of guidance Guidance Achieved Actual
1QFY09 Looking for a 10% increase over the next two quarters (`164 current ARPU) No `137
3QFY09 Should be `145-150 going ahead; full-year average should be ̀ 150 No `135-142
4QFY09 Should go up to ̀ 170-172 by close of FY10 No `139
1QFY10 Should be `165-170 in the third and fourth quarter No `135-138
3QFY10 To be `145-150 in the next three months No `138
4QFY10 FY11 exit ARPU should be `155 No `150
1QFY11 FY11 exit ARPU should be `150-155 Yes `150
4QFY11 FY12 exit ARPU should be `165 with an average of ̀ 160-165 No `151
3QFY12 FY12 exit ARPU to be over `155 and not in the `160-165 range No `151
Source: Company, Ambit Capital research
Whilst we assume a higher growth in carriage led by viewership fragmentation, Dish TV would not achieve significant progress, as it does not have market share dominance in TAM-rich areas. MSOs such as Hathway, Siti Cable and Den are dominant in phase I/ II regions which drive TAM ratings. Given that 30-35% of Dish TV’s customers are from urban regions (which includes phase-III urban regions), its presence in the first two phases may be at most 4mn subscribers, lower than Hathway (6.5mn), Den Networks (5mn) and most likely Tata Sky. Furthermore, unlike the MSOs, Dish TV is not dominant in any particular region, which erodes its ability to demand carriage. Hence, smaller channels that are willing to pay carriage may prefer to be associated with an MSO rather than Dish TV.
Dish TV
19 December 2013 Ambit Capital Pvt. Ltd. Page 5
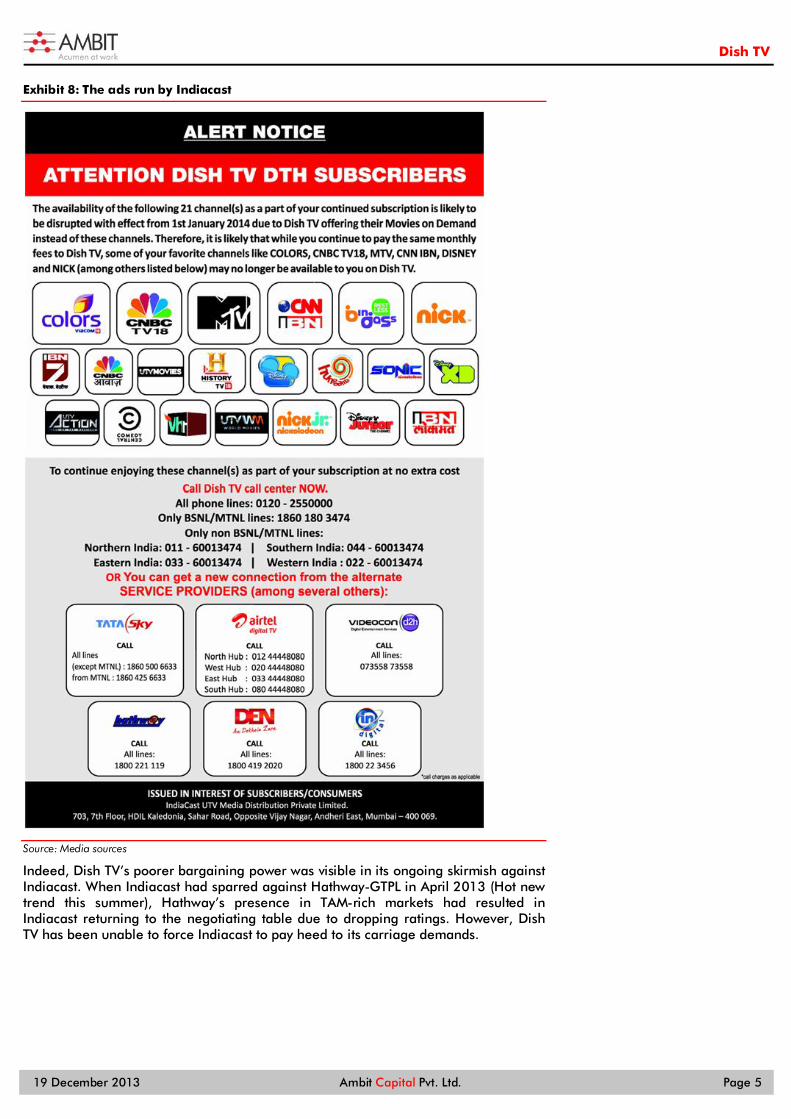
Exhibit 8: The ads run by Indiacast
Source: Media sources
Indeed, Dish TV’s poorer bargaining power was visible in its ongoing skirmish against Indiacast. When Indiacast had sparred against Hathway-GTPL in April 2013 (Hot new trend this summer), Hathway’s presence in TAM-rich markets had resulted in Indiacast returning to the negotiating table due to dropping ratings. However, Dish TV has been unable to force Indiacast to pay heed to its carriage demands.
Dish TV
19 December 2013 Ambit Capital Pvt. Ltd. Page 6
Is the growth profitable? Dish TV has a poor presence in urban regions (only 30-35% of customer base) and therefore it lacks presence in higher-ARPU regions. At the current ARPU and set-top box (STB) subsidies, the company has a long payback period on new subscriber acquisitions (three years). The company needs to reduce its STB subsidies and increase ARPUs, both of which would require an increase in tariffs, thereby further increasing the pricing gap between cable and themselves. This may lead to poorer seeding.
Is this profitable growth? At `62/USD, we estimate the cost of a STB of ~`3,000 for Dish TV. The company recognises ~`1,250 as rental and `500 as activation revenues from the upfront fees charged to subscribers. Of this, the activation revenue is clubbed with subscription revenues and hence is included in the ARPU numbers for the quarter. Hence, the subsidy on the STB is ~`1,750/customer. As shown in Exhibit 9 below, assuming an ARPU of `170 (2QFY14 ARPU of `163) and EBITDA margins of 25% (2QFY14 EBITDA margin of 25%), the company has a payback period of three years on its set-top box.
Exhibit 9: Returns on each STB
` `
ARPU 2,040 Cost of STB 3,000
EBITDA margin 25% Recovery from customer 1,250
EBITDA 510 Invested Capital 1,750
EBIT (Year 1) 160 Payback period (Capital employed less cash) 3.4
RoIC (Year 1) 9.1%
Source: Ambit Capital research
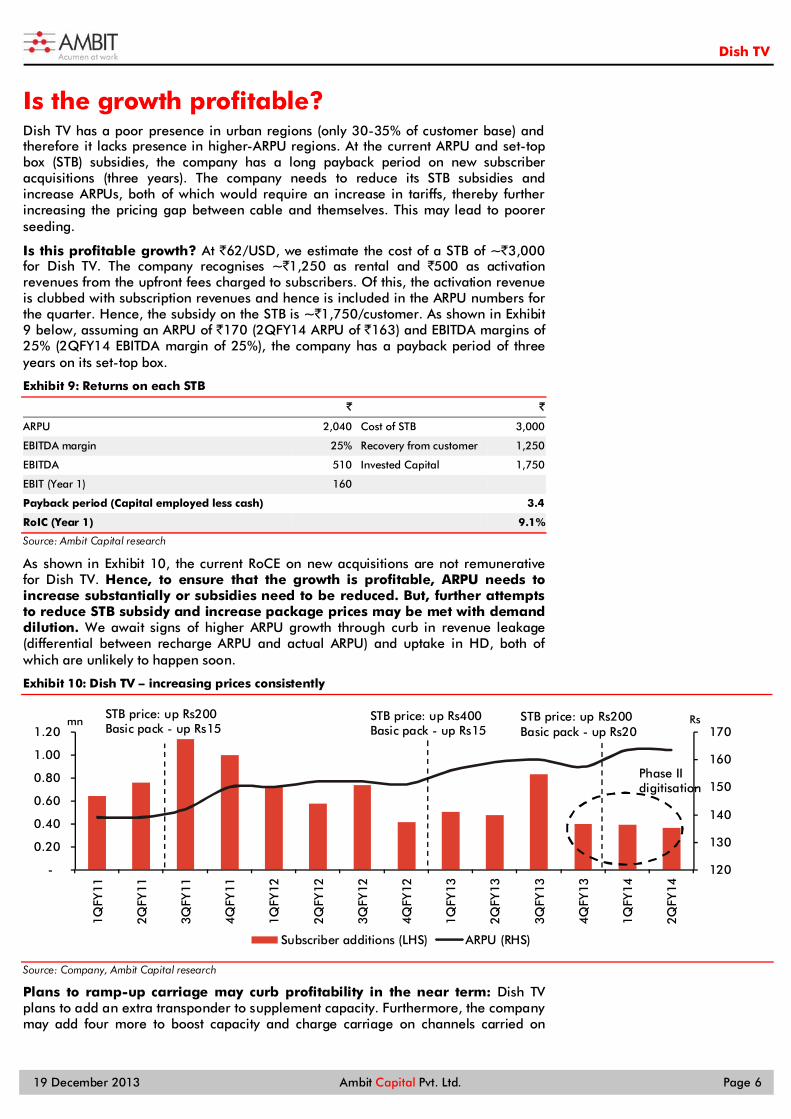
As shown in Exhibit 10, the current RoCE on new acquisitions are not remunerative for Dish TV. Hence, to ensure that the growth is profitable, ARPU needs to increase substantially or subsidies need to be reduced. But, further attempts to reduce STB subsidy and increase package prices may be met with demand dilution. We await signs of higher ARPU growth through curb in revenue leakage (differential between recharge ARPU and actual ARPU) and uptake in HD, both of which are unlikely to happen soon.
Exhibit 10: Dish TV – increasing prices consistently
Source: Company, Ambit Capital research
Plans to ramp-up carriage may curb profitability in the near term: Dish TV plans to add an extra transponder to supplement capacity. Furthermore, the company may add four more to boost capacity and charge carriage on channels carried on
120
130
140
150
160
170
-
0.20
0.40
0.60
0.80
1.00
1.20
1QFY
11
2QFY
11
3QFY
11
4QFY
11
1QFY
12
2QFY
12
3QFY
12
4QFY
12
1QFY
13
2QFY
13
3QFY
13
4QFY
13
1QFY
14
2QFY
14
Rsmn
Subscriber additions (LHS) ARPU (RHS)
STB price: up Rs200Basic pack - up Rs15
STB price: up Rs400Basic pack - up Rs15
STB price: up Rs200Basic pack - up Rs20
Phase II digitisation
Dish TV
19 December 2013 Ambit Capital Pvt. Ltd. Page 7
those transponders. If the company is unable to generate carriage revenues, margins may contract due to the transponder costs.
An additional transponder leads to an operational cost increase of US$1.3mn (`81mn) annually. Hence, to break even on one additional transponder, Dish TV needs to increase its carriage revenues by 25% (FY13 carriage income of `320mn). Five additional transponders would result in an increase of `403mn in operational costs, representing 145bps of FY15 revenues.
Are we missing the replacement cycle? Dish TV has grown primarily through growth in its subscriber base as ARPUs have remained flat. The company had 2.5mn subscribers by the end of FY08 and added 3.2mn through FY09 and FY10. Given that the management estimates the life of the STB to be five years (and hence the depreciation and revenue recognition policies), these STBs might come up for replacement over the next three years. Whilst we have assumed the life of the set-top box to be seven years, we expect break-downs to increase which may result in increased capex or higher churn (if Dish TV does not subsidise the replacement STB).
Furthermore, unlike MSOs, DTH does not have a return path for collecting defective or malfunctioning STBs. This is likely to result in significantly higher overheads in customer maintenance as the company moves towards its STB replacement cycle.
Dish TV
19 December 2013 Ambit Capital Pvt. Ltd. Page 8
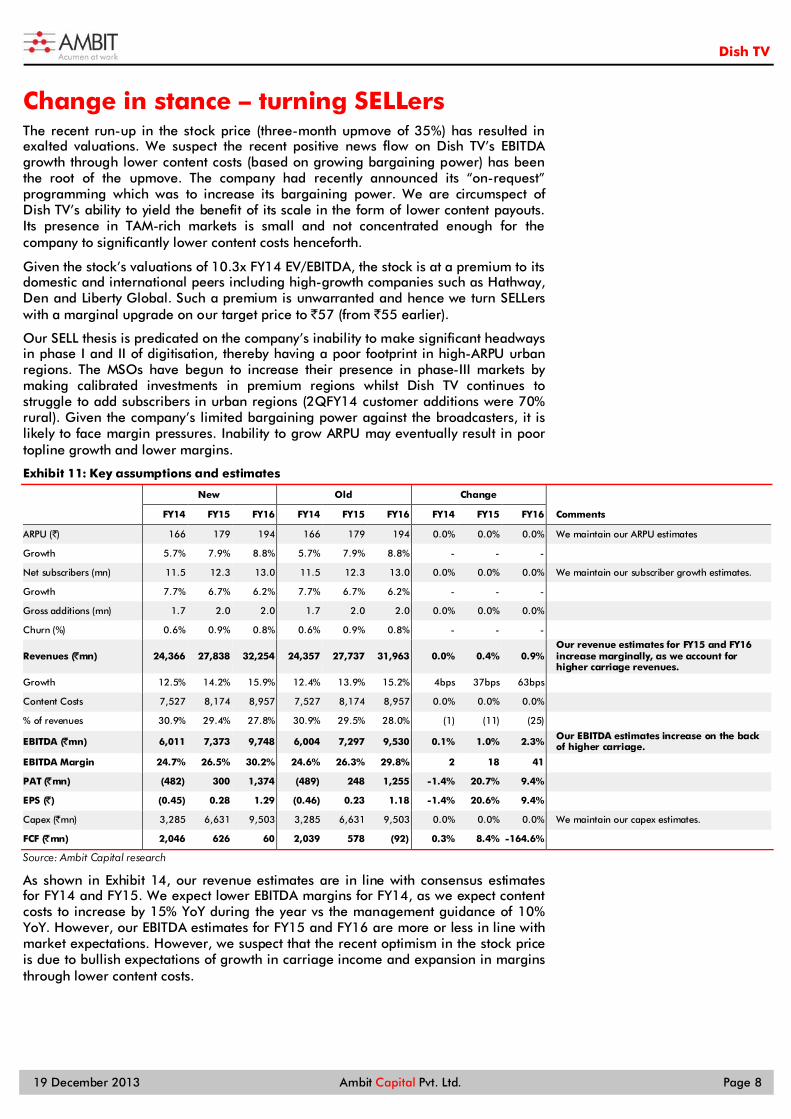
Change in stance – turning SELLers The recent run-up in the stock price (three-month upmove of 35%) has resulted in exalted valuations. We suspect the recent positive news flow on Dish TV’s EBITDA growth through lower content costs (based on growing bargaining power) has been the root of the upmove. The company had recently announced its “on-request” programming which was to increase its bargaining power. We are circumspect of Dish TV’s ability to yield the benefit of its scale in the form of lower content payouts. Its presence in TAM-rich markets is small and not concentrated enough for the company to significantly lower content costs henceforth.
Given the stock’s valuations of 10.3x FY14 EV/EBITDA, the stock is at a premium to its domestic and international peers including high-growth companies such as Hathway, Den and Liberty Global. Such a premium is unwarranted and hence we turn SELLers with a marginal upgrade on our target price to `57 (from `55 earlier).
Our SELL thesis is predicated on the company’s inability to make significant headways in phase I and II of digitisation, thereby having a poor footprint in high-ARPU urban regions. The MSOs have begun to increase their presence in phase-III markets by making calibrated investments in premium regions whilst Dish TV continues to struggle to add subscribers in urban regions (2QFY14 customer additions were 70% rural). Given the company’s limited bargaining power against the broadcasters, it is likely to face margin pressures. Inability to grow ARPU may eventually result in poor topline growth and lower margins.
Exhibit 11: Key assumptions and estimates
New Old Change
FY14 FY15 FY16 FY14 FY15 FY16 FY14 FY15 FY16 Comments
ARPU (`) 166 179 194 166 179 194 0.0% 0.0% 0.0% We maintain our ARPU estimates
Growth 5.7% 7.9% 8.8% 5.7% 7.9% 8.8% - - -
Net subscribers (mn) 11.5 12.3 13.0 11.5 12.3 13.0 0.0% 0.0% 0.0% We maintain our subscriber growth estimates.
Growth 7.7% 6.7% 6.2% 7.7% 6.7% 6.2% - - -
Gross additions (mn) 1.7 2.0 2.0 1.7 2.0 2.0 0.0% 0.0% 0.0%
Churn (%) 0.6% 0.9% 0.8% 0.6% 0.9% 0.8% - - -
Revenues (̀ mn) 24,366 27,838 32,254 24,357 27,737 31,963 0.0% 0.4% 0.9% Our revenue estimates for FY15 and FY16 increase marginally, as we account for higher carriage revenues.
Growth 12.5% 14.2% 15.9% 12.4% 13.9% 15.2% 4bps 37bps 63bps
Content Costs 7,527 8,174 8,957 7,527 8,174 8,957 0.0% 0.0% 0.0%
% of revenues 30.9% 29.4% 27.8% 30.9% 29.5% 28.0% (1) (11) (25)
EBITDA (̀ mn) 6,011 7,373 9,748 6,004 7,297 9,530 0.1% 1.0% 2.3% Our EBITDA estimates increase on the back of higher carriage.
EBITDA Margin 24.7% 26.5% 30.2% 24.6% 26.3% 29.8% 2 18 41
PAT (̀ mn) (482) 300 1,374 (489) 248 1,255 -1.4% 20.7% 9.4%
EPS (̀ ) (0.45) 0.28 1.29 (0.46) 0.23 1.18 -1.4% 20.6% 9.4%
Capex (`mn) 3,285 6,631 9,503 3,285 6,631 9,503 0.0% 0.0% 0.0% We maintain our capex estimates.
FCF (̀ mn) 2,046 626 60 2,039 578 (92) 0.3% 8.4% -164.6%
Source: Ambit Capital research
As shown in Exhibit 14, our revenue estimates are in line with consensus estimates for FY14 and FY15. We expect lower EBITDA margins for FY14, as we expect content costs to increase by 15% YoY during the year vs the management guidance of 10% YoY. However, our EBITDA estimates for FY15 and FY16 are more or less in line with market expectations. However, we suspect that the recent optimism in the stock price is due to bullish expectations of growth in carriage income and expansion in margins through lower content costs.

Dish TV
19 December 2013 Ambit Capital Pvt. Ltd. Page 9
Exhibit 12: Ambit vs consensus
Ambit Consensus Deviation
Revenues (̀ mn)
2014E 24,366.2 24,456.0 0%
2015E 27,837.9 27,961.0 0%
2016E 32,253.7 32,868.0 -2%
EBITDA (̀ mn) 2014E 6,010.8 6,301.0 -5%
2015E 7,372.6 7,365.0 0%
2016E 9,748.4 9,609.0 1%
EBITDA Margin 2014E 24.7% 25.8% (110)
2015E 26.5% 26.3% 14
2016E 30.2% 29.2% 99
EPS (̀ ) 2014E (0.5) (0.5) -3%
2015E 0.3 0.6 -52%
2016E 1.3 2.7 -52%
Source: Bloomberg
Dish TV
19 December 2013 Ambit Capital Pvt. Ltd. Page 10
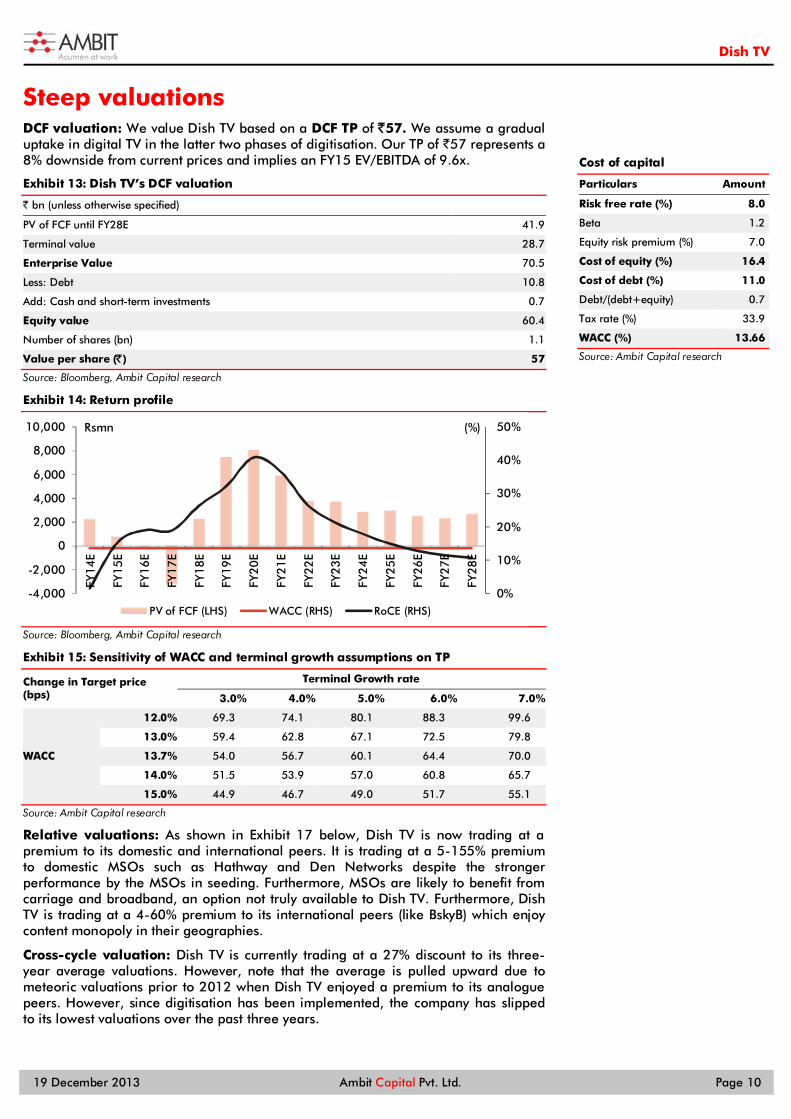
Steep valuations DCF valuation: We value Dish TV based on a DCF TP of `57. We assume a gradual uptake in digital TV in the latter two phases of digitisation. Our TP of `57 represents a 8% downside from current prices and implies an FY15 EV/EBITDA of 9.6x.
Exhibit 13: Dish TV’s DCF valuation
` bn (unless otherwise specified)
PV of FCF until FY28E 41.9
Terminal value 28.7
Enterprise Value 70.5
Less: Debt 10.8
Add: Cash and short-term investments 0.7
Equity value 60.4
Number of shares (bn) 1.1
Value per share (̀ ) 57
Source: Bloomberg, Ambit Capital research
Exhibit 14: Return profile
Source: Bloomberg, Ambit Capital research
Exhibit 15: Sensitivity of WACC and terminal growth assumptions on TP
Change in Target price (bps)
Terminal Growth rate
3.0% 4.0% 5.0% 6.0% 7.0%
WACC
12.0% 69.3 74.1 80.1 88.3 99.6
13.0% 59.4 62.8 67.1 72.5 79.8
13.7% 54.0 56.7 60.1 64.4 70.0
14.0% 51.5 53.9 57.0 60.8 65.7
15.0% 44.9 46.7 49.0 51.7 55.1
Source: Ambit Capital research
Relative valuations: As shown in Exhibit 17 below, Dish TV is now trading at a premium to its domestic and international peers. It is trading at a 5-155% premium to domestic MSOs such as Hathway and Den Networks despite the stronger performance by the MSOs in seeding. Furthermore, MSOs are likely to benefit from carriage and broadband, an option not truly available to Dish TV. Furthermore, Dish TV is trading at a 4-60% premium to its international peers (like BskyB) which enjoy content monopoly in their geographies.
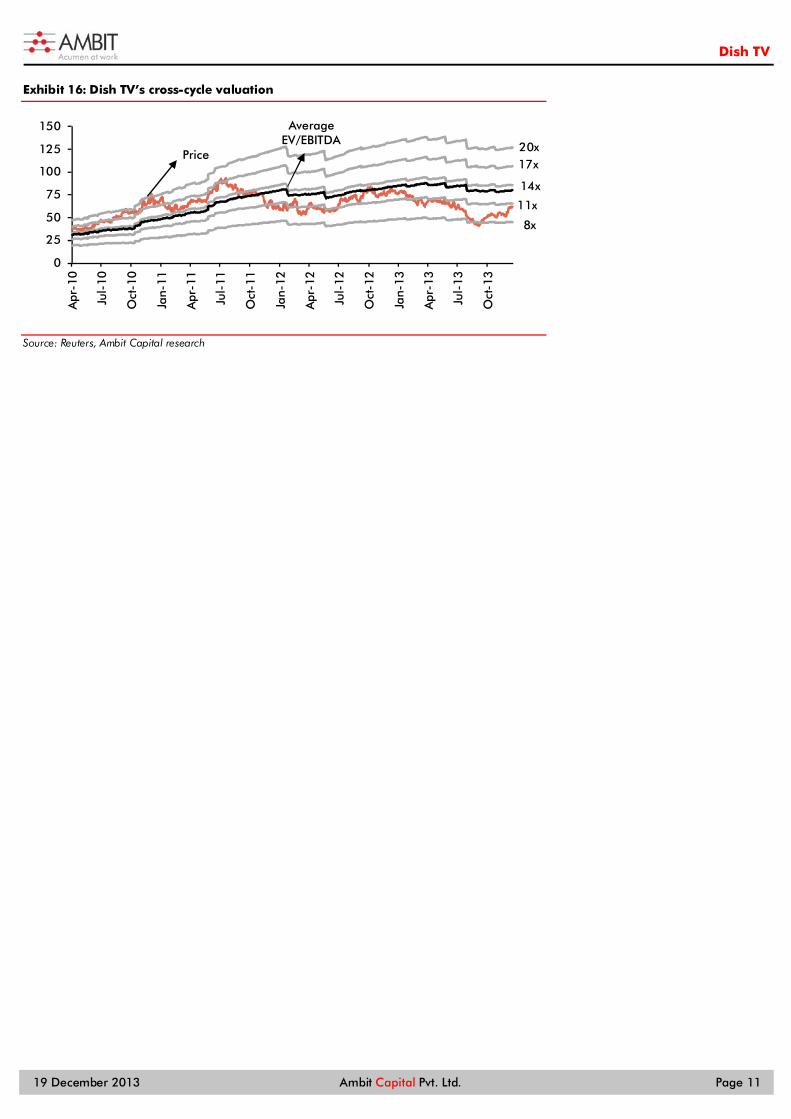
Cross-cycle valuation: Dish TV is currently trading at a 27% discount to its three-year average valuations. However, note that the average is pulled upward due to meteoric valuations prior to 2012 when Dish TV enjoyed a premium to its analogue peers. However, since digitisation has been implemented, the company has slipped to its lowest valuations over the past three years.
0%
10%
20%
30%
40%
50%
-4,000
-2,000
0
2,000
4,000
6,000
8,000
10,000
FY14
E
FY15
E
FY16
E
FY17
E
FY18
E
FY19
E
FY20
E
FY21
E
FY22
E
FY23
E
FY24
E
FY25
E
FY26
E
FY27
E
FY28
E
(%)Rsmn
PV of FCF (LHS) WACC (RHS) RoCE (RHS)
Cost of capital
Particulars Amount
Risk free rate (%) 8.0
Beta 1.2
Equity risk premium (%) 7.0
Cost of equity (%) 16.4
Cost of debt (%) 11.0
Debt/(debt+equity) 0.7
Tax rate (%) 33.9
WACC (%) 13.66
Source: Ambit Capital research
Dish TV
19 December 2013 Ambit Capital Pvt. Ltd. Page 11
Exhibit 16: Dish TV’s cross-cycle valuation
Source: Reuters, Ambit Capital research
0
25
50
75
100
125
150
Apr
-10
Jul-
10
Oct
-10
Jan-
11
Apr
-11
Jul-
11
Oct
-11
Jan-
12
Apr
-12
Jul-
12
Oct
-12
Jan-
13
Apr
-13
Jul-
13
Oct
-13
Average EV/EBITDA 20x
17x
14x
11x
8x
Price

Dish TV
December 19, 2013 Ambit Capital Pvt Ltd Page 12
Exhibit 17: Relative valuations
Curr Price Mkt Cap Div Yield Sales CAGR EV/SALES EBITDA CAGR EV/EBITDA EPS CAGR P/E P/B
(`) (US$ Mn) FY13 (FY13-15) FY14 FY15 (FY13-15) FY14 FY15 (FY13-15) FY14 FY15 FY14 FY15
Dish TV INR 63 1,075 0.0% 14% 3.1 2.7 14% 12.1 10.0 n.a. n.a. 105.2 (28.9) (38.7)
Hathway INR 256 627 0.0% 37% 3.4 2.4 38% 13.6 9.5 n.a. n.a. 44.6 3.6 3.4
Hinduja Ventures INR 270 90 5.6% na na na na na na na na na na na
Den Networks INR 139 400 0.0% 43% 1.5 1.0 53% 6.0 3.9 40% 43.9 15.1 1.3 1.2
Median 0.0% 40% 2.5 1.7 46% 9.8 6.7 40% 43.9 29.8 2.5 2.3
Mean 1.9% 40% 2.5 1.7 46% 9.8 6.7 40% 43.9 29.8 2.5 2.3
Zee TV INR 284 4,406 0.7% 15% 6.2 5.4 21% 22.8 18.7 19% 31.8 26.7 6.1 5.2
Sun TV INR 362 2,310 2.6% 17% 6.0 5.3 12% 9.1 7.8 15% 18.3 15.3 4.6 4.0
TV 18 INR 23 624 0.0% 12% 2.1 1.9 31% 22.3 15.1 na 45.1 25.1 1.1 1.1
Median 0.4% 15% 6.0 5.3 21% 22.3 15.1 17% 31.8 25.1 4.6 4.0
Mean 0.8% 15% 4.8 4.2 21% 18.1 13.8 17% 31.7 22.3 4.0 3.5
Global Peers
Beijing Gehua CNY 8 1,409 1.2% 5% 2.9 2.8 7% 6.1 5.9 10% 26.4 23.7 na na
Astro Malaysia MYR 3 4,754 1.3% 11% 3.6 3.3 2% 11.0 9.5 -29% 33.9 26.8 23.8 20.6
Shenzhen Topway CNY 13 707 0.7% 5% 4.0 3.9 7% 10.0 9.5 10% 27.3 27.7 na na
Median 1.0% 5% 3.6 3.3 7% 10.0 9.5 10% 27.3 26.8 23.8 20.6
Mean 0.8% 7% 3.5 3.3 5% 9.0 8.3 -3% 29.2 26.1 23.8 20.6
Comcast USD 49 127,497 1.3% 5% 2.6 2.5 7% 7.9 7.5 11% 19.6 17.0 2.5 2.3
Time Warner Cable USD 133 37,500 1.7% 3% 2.8 2.7 3% 7.7 7.5 4% 20.3 17.5 5.8 5.9
Liberty Global USD 84 32,324 0.0% 35% 5.0 3.9 33% 11.0 8.7 2% (37.3) 67.0 3.2 3.4
Direct TV USD 65
34,348 0.0% 6% 1.7 1.6 7% 6.5 6.2 12% 12.9 11.2 (5.3) (4.2)
Dish USA USD 55
25,112 1.8% 2% 2.0 2.0 1% 10.5 9.6 18% 31.1 28.2 27.4 12.1
British Sky Broadcasting GBP 8 20,631 3.7% 5% 1.9 1.8 4% 8.5 7.9 4% 13.7 12.3 13.7 9.5
Source: Bloomberg, Ambit Capital research

Dish TV
19 December 2013 Ambit Capital Pvt. Ltd. Page 13
Key catalysts ARPU disappointments due to delay in direct billing on cable and poor
HD pick-up: As mentioned earlier, Dish TV’s profitability is heavily dependent on ARPUs rising. Whilst we do anticipate ARPUs to increase steadily as direct billing in cable drives the price table upwards for the entire industry, this is likely to be delayed as the cable industry continues to grapple with LCO-related issues. Furthermore, Dish TV has shown no concrete movement in curbing its revenue leakage (difference between recharge ARPU and reported ARPU). Apart from plugging revenue leakage, HD remains Dish TV’s only option to increase ARPUs. However, HD continues to be a small portion of revenue with no significant increase in uptake.
Margin disappointments due to increasing content costs despite measure to charge carriage: Content contract remains fixed in nature. Whilst we do expect the content payouts for the cable industry to rise faster than DTH, Dish TV is unlikely to be immune from a significant rise in payouts especially as viewership fragments. Hence, margin pressures led by content increase are likely. Furthermore, we expect Dish TV’s gamble of adding additional transponders to grow carriage revenues to not pay-off due to the aforementioned reasons. We expect EBITDA margin of 24.7% for FY14 vs consensus expectations of 24.7%.
Key risks Net content payouts reduce: If Dish TV is able to stave off further inflation in
content costs through its “on-request” programming (resulting in margin expansion), then this may result in upgrades to our target price. It may indicate the company’s growing bargaining power.
Pick up in HD intensifies: Dish TV added 11% of its incremental adds to its HD subscriber base in 2QFY14, significantly higher than the 5-8% in the preceding four quarters. If the pace of HD additions intensifies and results in an ARPU uptick, the company is likely to have stronger revenue growth and margin expansion.
Exhibit 18: Explanation for our forensic accounting scores on the front page
Segment Score Comments
Accounting RED
Dish TV has recently changed its revenue recognition policy on rentals recognition from three years to five years. Furthermore, the company clubs activation revenues with subscription and remains inconsistent in the quantum of activation recognised. Dish TV scores poorly on our accounting parameters due to high auditor fees, poor cash yields and high contingent liabilities.
Predictability RED Dish TV has consistently surprised on the upside and downside in its quarterly earnings. Please refer to Exhibit 12 below which highlights the company’s inconsistent quarterly results.
Earnings Momentum AMBER Whilst the earnings outlook prior to 2QFY14 was tepid, the 2QFY14 results were largely in line in ours and consensus expectations. Although consensus expects a recovery in margins henceforth, we remain more circumspect and expect moderate earnings growth momentum.
Source: Ambit Capital research
Dish TV’s ability to surprise in quarterly earnings
Source: Company, Bloomberg
3%
-2%-1%
-4%
4%
-1% -2%-1%
-5%
0%
-1%
223 91
(82)
(325)
270 322
26
(364)
(106)
(506)
7
(600)
(400)
(200)
-
200
400
-6%-4%-2%0%2%4%6%
4QFY
11
1QFY
12
2QFY
12
3QFY
12
4QFY
12
1QFY
13
2QFY
13
3QFY
13
4QFY
13
1QFY
14
2QFY
14
Revenue surprise (LHS)

Dish TV
19 December 2013 Ambit Capital Pvt. Ltd. Page 14
Balance Sheet
In ̀ mn FY13 FY14E FY15E FY16E
Share capital 1,065 1,065 1,065 1,065
Reserves and surplus (2,621) (3,103) (2,803) (1,429)
Shareholder's funds (1,556) (2,038) (1,738) (364)
Total borrowings 16,330 10,952 10,787 12,287
Other long term liabilities 3 3 3 3
Long term provisions 127 153 179 209
Total sources of funds 14,904 9,069 9,231 12,135
Gross block 35,790 42,675 49,196 59,142
Less accumulated depreciation 21,450 27,280 33,268 39,936
Net Block 14,340 15,395 15,928 19,206
Capital work in progress 6,535 4,647 4,593 4,150
Investments 2,782 - - -
Inventories 86 119 136 156
Trade receivables 304 360 414 475
Cash and bank 3,742 817 512 1,071
Loans and advances 3,706 4,280 4,919 5,641
Other current assets 53 76 88 101
Trade payables 2,138 2,196 2,050 1,946
Other current liabilities 3,511 4,412 4,412 4,412
Advance Revenue 4,448 3,470 4,350 5,759
Short term provisions 6,547 6,547 6,547 6,547
Net Current Assets (8,753) (10,973) (11,290) (11,221)
Total application of funds 14,904 9,069 9,231 12,135
Source: Ambit Capital research
Income statement
In ̀ mn FY13 FY14E FY15E FY16E
Operating Income 21,668 24,366 27,838 32,254
Expenditure 15,874 18,355 20,465 22,505
Cost of Goods Sold 75 93 111 129
Operating Expenses 11,081 12,806 14,265 15,857
Employee benefit expenses 822 934 974 1,129
Administration and Other Expenses 860 1,043 1,087 1,283
Selling and Distribution Expenses 3,036 3,479 4,028 4,107
EBITDA 5,794 6,011 7,373 9,748
EBITDA margin (%) 26.7% 24.7% 26.5% 30.2%
Depreciation/Amortization 6,276 5,830 5,987 6,669
EBIT (482) 180 1,385 3,080
Finance costs 1,284 1,380 973 1,089
Other Income 511 718 42 88
PBT (1,254) (482) 454 2,079
Tax (1) - 154 705
PAT for the year (1,253) (482) 300 1,374
Exceptional (594) - - -
PAT after prior period adjustments (659) (482) 300 1,374
EPS (0.6) (0.5) 0.3 1.3
Source: Ambit Capital research

Dish TV
19 December 2013 Ambit Capital Pvt. Ltd. Page 15
Cash flow
In ̀ mn FY13 FY14E FY15E FY16E
PBT (660) (482) 454 2,079
Depreciation/ amortisation 6,388 5,830 5,987 6,669
Interest income (345) (718) (42) (88)
Interest expense 1,102 1,380 973 1,089
Operating profit before changes in working capital 5,651 6,011 7,373 9,748
Changes to WC 526 (680) 39 520
Cash from operations 6,177 5,331 7,411 10,268
Direct taxes paid (82) - (154) (705)
Net cash flow from operating activities 6,095 5,331 7,257 9,563
Purchases of fixed assets/ CWIP (6,980) (3,285) (6,631) (9,503)
Purchase of investments (1,241) 2,782 - -
Interest received 342 718 42 88
Net cash flow from investing activities (7,699) 214 (6,589) (9,415)
Interest paid (691) (1,380) (973) (1,089)
Proceeds from borrowing 3,421 (7,090) - 1,500
Repayment of borrowing (1,526) - - -
Net cash flow from financing activities 1,222 (8,470) (973) 411
Net cash flow during the year (379) (2,925) (305) 559
Cash and cash equivalents at the beginning of the year 3,734 3,742 817 512
Cash and cash equivalents at the end of the year 3,355 817 512 1,071
Source: Ambit Capital research
Ratios
Ratios FY13 FY14 FY15 FY16
Growth (%) Operating Revenue 10.7% 12.5% 14.2% 15.9%
EBITDA 16.8% 3.7% 22.7% 32.2%
EBIT 86.2% -137.4% 668.3% 122.3%
Margins EBITDA 26.7% 24.7% 26.5% 30.2%
EBIT -2.2% 0.7% 5.0% 9.5%
PAT -3.0% -2.0% 1.1% 4.3%
Leverage Net Debt/ Equity (6.30) (4.97) (5.91) (30.78)
Net Debt/ EBITDA 1.69 1.69 1.39 1.15
Equity/ Net assets (0.10) (0.22) (0.19) (0.03)
Return RoE na na -15.9% -130.7%
RoCE -3.4% 1.5% 15.1% 19.0%
RoIC -4.7% 1.9% 16.3% 20.6%
Valuation P/E (101.8) (139.5) 222.8 48.8
P/BV (43.1) (32.9) (38.6) (184.1)
EV/EBITDA 13.3 12.8 10.3 7.9
EV/Sales 3.5 3.2 2.8 2.4
FCF/EV -1.2% 2.7% 0.8% 0.1%
Others CFO/EBITDA 105.2% 88.7% 98.4% 98.1%
Source: Ambit Capital research

Dish TV
19 December 2013 Ambit Capital Pvt. Ltd. Page 16
Institutional Equities Team
Saurabh Mukherjea, CFA CEO, Institutional Equities (022) 30433174 [email protected]
Research
Analysts Industry Sectors Desk-Phone E-mail
Aadesh Mehta Banking & Financial Services (022) 30433239 [email protected]
Achint Bhagat Cement / Infrastructure (022) 30433178 [email protected]
Ankur Rudra, CFA Technology / Telecom / Media (022) 30433211 [email protected]
Ashvin Shetty, CFA Automobile (022) 30433285 [email protected]
Bhargav Buddhadev Power / Capital Goods (022) 30433252 [email protected]
Dayanand Mittal, CFA Oil & Gas (022) 30433202 [email protected]
Gaurav Mehta, CFA Strategy / Derivatives Research (022) 30433255 [email protected]
Karan Khanna Strategy (022) 30433251 [email protected]
Krishnan ASV Banking & Financial Services (022) 30433205 [email protected]
Nitin Bhasin E&C / Infrastructure / Cement (022) 30433241 [email protected]
Nitin Jain Technology (022) 30433291 [email protected]
Pankaj Agarwal, CFA Banking & Financial Services (022) 30433206 [email protected]
Pratik Singhania Real Estate / Retail (022) 30433264 [email protected]
Parita Ashar Metals & Mining (022) 30433223 [email protected]
Rakshit Ranjan, CFA Consumer / Real Estate (022) 30433201 [email protected]
Ravi Singh Banking & Financial Services (022) 30433181 [email protected]
Ritika Mankar Mukherjee, CFA Economy / Strategy (022) 30433175 [email protected]
Ritu Modi Automobile / Healthcare (022) 30433292 [email protected]
Shariq Merchant Consumer (022) 30433246 [email protected]
Tanuj Mukhija, CFA E&C / Infrastructure (022) 30433203 [email protected]
Utsav Mehta Telecom / Media (022) 30433209 [email protected]
Sales
Name Regions Desk-Phone E-mail
Deepak Sawhney India / Asia (022) 30433295 [email protected]
Dharmen Shah India / Asia (022) 30433289 [email protected]
Dipti Mehta India / USA (022) 30433053 [email protected]
Nityam Shah, CFA USA / Europe (022) 30433259 [email protected]
Parees Purohit, CFA UK / USA (022) 30433169 [email protected]
Praveena Pattabiraman India / Asia (022) 30433268 [email protected]
Sarojini Ramachandran UK +44 (0) 20 7614 8374 [email protected]
Production
Sajid Merchant Production (022) 30433247 [email protected]
Joel Pereira Editor (022) 30433284 [email protected]
E&C = Engineering & Construction

Dish TV
19 December 2013 Ambit Capital Pvt. Ltd. Page 17
Explanation of Investment Rating Investment Rating Expected return
(over 12-month period from date of initial rating)
Buy >5%
Sell <5%
Disclaimer
This report or any portion hereof may not be reprinted, sold or redistributed without the written consent of Ambit Capital. AMBIT Capital Research is disseminated and available primarily electronically, and, in some cases, in printed form.
Additional information on recommended securities is available on request.
Disclaimer 1. AMBIT Capital Private Limited (“AMBIT Capital”) and its affiliates are a full service, integrated investment banking, investment advisory and brokerage group. AMBIT Capital is a Stock
Broker, Portfolio Manager and Depository Participant registered with Securities and Exchange Board of India Limited (SEBI) and is regulated by SEBI 2. The recommendations, opinions and views contained in this Research Report reflect the views of the research analyst named on the Research Report and are based upon publicly
available information and rates of taxation at the time of publication, which are subject to change from time to time without any prior notice. 3. AMBIT Capital makes best endeavours to ensure that the research analyst(s) use current, reliable, comprehensive information and obtain such information from sources which the
analyst(s) believes to be reliable. However, such information has not been independently verified by AMBIT Capital and/or the analyst(s) and no representation or warranty, express or implied, is made as to the accuracy or completeness of any information obtained from third parties. The information or opinions are provided as at the date of this Research Report and are subject to change without notice.
4. If you are dissatisfied with the contents of this complimentary Research Report or with the terms of this Disclaimer, your sole and exclusive remedy is to stop using this Research Report and AMBIT Capital shall not be responsible and/ or liable in any manner.
5. If this Research Report is received by any client of AMBIT Capital or its affiliate, the relationship of AMBIT Capital/its affiliate with such client will continue to be governed by the terms and conditions in place between AMBIT Capital/ such affiliate and the client.
6. This Research Report is issued for information only and should not be construed as an investment advice to any recipient to acquire, subscribe, purchase, sell, dispose of, retain any securities. Recipients should consider this Research Report as only a single factor in making any investment decisions. This Research Report is not an offer to sell or the solicitation of an offer to purchase or subscribe for any investment or as an official endorsement of any investment.
7. If 'Buy', 'Sell', or 'Hold' recommendation is made in this Research Report such recommendation or view or opinion expressed on investments in this Research Report is not intended to constitute investment advice and should not be intended or treated as a substitute for necessary review or validation or any professional advice. The views expressed in this Research Report are those of the research analyst which are subject to change and do not represent to be an authority on the subject. AMBIT Capital may or may not subscribe to any and/ or all the views expressed herein.
8. AMBIT Capital makes no guarantee, representation or warranty, express or implied; and accepts no responsibility or liability as to the accuracy or completeness or currentess of the information in this Research Report. AMBIT Capital or its affiliates do not accept any liability whatsoever for any direct or consequential loss howsoever arising, directly or indirectly, from any use of this Research Report.
9. Past performance is not necessarily a guide to evaluate future performance. 10. AMBIT Capital and/or its affiliates (as principal or on behalf of its/their clients) and their respective officers directors and employees may hold positions in any securities mentioned in this
Research Report (or in any related investment) and may from time to time add to or dispose of any such securities (or investment). Such positions in securities may be contrary to or inconsistent with this Research Report.
11. This Research Report should be read and relied upon at the sole discretion and risk of the recipient. 12. The value of any investment made at your discretion based on this Research Report or income therefrom may be affected by changes in economic, financial and/ or political factors and
may go down as well as up and you may not get back the full or the expected amount invested. Some securities and/ or investments involve substantial risk and are not suitable for all investors.
13. This Research Report is being supplied to you solely for your information and may not be reproduced, redistributed or passed on, directly or indirectly, to any other person or published, copied in whole or in part, for any purpose. Neither this Research Report nor any copy of it may be taken or transmitted or distributed, directly or indirectly within India or into any other country including United States (to US Persons), Canada or Japan or to any resident thereof. The distribution of this Research Report in other jurisdictions may be strictly restricted and/ or prohibited by law or contract, and persons into whose possession this Research Report comes should inform themselves about such restriction and/ or prohibition, and observe any such restrictions and/ or prohibition.
14. Neither AMBIT Capital nor its affiliates or their respective directors, employees, agents or representatives, shall be responsible or liable in any manner, directly or indirectly, for views or opinions expressed in this Report or the contents or any errors or discrepancies herein or for any decisions or actions taken in reliance on the Report or inability to use or access our service or this Research Report or for any loss or damages whether direct or indirect, incidental, special or consequential including without limitation loss of revenue or profits that may arise from or in connection with the use of or reliance on this Research Report or inability to use or access our service or this Research Report.
Conflict of Interests 15. In the normal course of AMBIT Capital’s business circumstances may arise that could result in the interests of AMBIT Capital conflicting with the interests of clients or one client’s interests
conflicting with the interest of another client. AMBIT Capital makes best efforts to ensure that conflicts are identified and managed and that clients’ interests are protected. AMBIT Capital has policies and procedures in place to control the flow and use of non-public, price sensitive information and employees’ personal account trading. Where appropriate and reasonably achievable, AMBIT Capital segregates the activities of staff working in areas where conflicts of interest may arise. However, clients/potential clients of AMBIT Capital should be aware of these possible conflicts of interests and should make informed decisions in relation to AMBIT Capital’s services.
16. AMBIT Capital and/or its affiliates may from time to time have investment banking, investment advisory and other business relationships with companies covered in this Research Report and may receive compensation for the same. Research analysts provide important inputs into AMBIT Capital’s investment banking and other business selection processes.
17. AMBIT Capital and/or its affiliates may seek investment banking or other businesses from the companies covered in this Research Report and research analysts involved in preparing this Research Report may participate in the solicitation of such business.
18. In addition to the foregoing, the companies covered in this Research Report may be clients of AMBIT Capital where AMBIT Capital may be required, inter alia, to prepare and publish research reports covering such companies and AMBIT Capital may receive compensation from such companies in relation to such services. However, the views reflected in this Research Report are objective views, independent of AMBIT Capital’s relationship with such company.
19. In addition, AMBIT Capital may also act as a market maker or risk arbitrator or liquidity provider or may have assumed an underwriting commitment in the securities of companies covered in this Research Report (or in related investments) and may also be represented in the supervisory board or on any other committee of those companies.
Additional Disclaimer for U.S. Persons 20. The research report is solely a product of AMBIT Capital 21. AMBIT Capital is the employer of the research analyst(s) who has prepared the research report 22. Any subsequent transactions in securities discussed in the research reports should be effected through J.P.P. Euro-Securities, Inc. (“JPP”). 23. JPP does not accept or receive any compensation of any kind for the dissemination of the AMBIT Capital research reports. 24. The research analyst(s) preparing the research report is resident outside the United States and is/are not associated persons of any U.S. regulated broker-dealer and that therefore the
analyst(s) is/are not subject to supervision by a U.S. broker-dealer, and is/are not required to satisfy the regulatory licensing requirements of FINRA or required to otherwise comply with U.S. rules or regulations regarding, among other things, communications with a subject company, public appearances and trading securities held by a research analyst account.
© Copyright 2013 AMBIT Capital Private Limited. All rights reserved.
Ambit Capital Pvt. Ltd. Ambit House, 3rd Floor 449, Senapati Bapat Marg, Lower Parel, Mumbai 400 013, India. Phone: +91-22-3043 3000 Fax: +91-22-3043 3100