ambient metals evaluation aluminum, cobalt, … ambient metals evaluation aluminum, cobalt,...
TRANSCRIPT

FINAL
Ambient Metals Evaluation Aluminum, Cobalt, Manganese, and Nickel Technical Memorandum Richmond Field Station Site Berkeley Global Campus at Richmond Bay University of California, Berkeley
Prepared for Office of Environment, Health and Safety University of California, Berkeley 317 University Hall, No. 1150 Berkeley, California 94720 December 11, 2015 Prepared by
TETRA TECH, INC. 1999 Harrison Street, Suite 500 Oakland, California 94612
Jason Brodersen, P.G., No 6262


Ambient Metals Technical Memorandum i December 11, 2015 UC Berkeley, Richmond Field Station Site
CONTENTS
CONTENTS ..................................................................................................................................... i
1.0 INTRODUCTION ...............................................................................................................1
2.0 METALS BACKGROUND INFORMATION ...................................................................2
2.1 ALUMINUM ...............................................................................................................2
2.2 COBALT ....................................................................................................................3
2.3 MANGANESE .............................................................................................................4
2.4 NICKEL .....................................................................................................................5
3.0 RFS STATISTICAL EVALUATION .................................................................................7
3.1 INTRODUCTION .........................................................................................................7
3.2 COMPREHENSIVE ANALYSIS METHODOLOGY ...........................................................9
3.3 COMPREHENSIVE ANALYSIS METHODOLOGY RESULTS ............................................9
3.4 CONTAMINATED AND PRESUMED UNCONTAMINATED ANALYSIS
METHODOLOGY ......................................................................................................10
3.5 CONTAMINATED AND PRESUMED UNCONTAMINATED ANALYSIS RESULTS ............11
4.0 LITERATURE REVIEW ..................................................................................................13
4.1 ANALYSIS OF BACKGROUND DISTRIBUTIONS OF METALS IN THE SOIL AT LBNL, JUNE 2002, REVISED APRIL 2009 ............................................................................13
4.2 BACKGROUND CONCENTRATIONS OF TRACE AND MAJOR ELEMENTS IN
CALIFORNIA SOILS, KEARNEY FOUNDATION, MARCH 1996 ...................................14
4.3 ELEMENT CONCENTRATIONS IN SOILS AND OTHER SURFICIAL MATERIALS OF
THE CONTERMINOUS UNITED STATES, USGS 1984 ................................................15
5.0 SUMMARY AND RECOMMENDATIONS....................................................................16
6.0 REFERENCES ..................................................................................................................19
Appendices
A Comprehensive Data Analysis Results
B Identification and Locations of Contaminated and Presumed Uncontaminated Samples
C Contaminated and Presumed Uncontaminated Data Analysis Results

Ambient Metals Technical Memorandum 1 December 11, 2015 UC Berkeley, Richmond Field Station Site
1.0 INTRODUCTION
This technical memorandum was prepared on behalf of The Regents of the University of California (UC) in accordance with California Environmental Protection Agency, Department of Toxic Substances Control, Site Investigation and Remediation Order, Docket No. IS/E-RAO 06/07-004, dated September 15, 2006. The order provides for investigation and cleanup of 96 acres of upland and 13 acres of tidal marsh and transition habitat within the Richmond Field Station (RFS) Site, located at the Berkeley Global Campus at Richmond Bay.
UC Berkeley has conducted site investigation and cleanup activities at the RFS Site since the 1980s. Generally, analytical soil sampling results have been compared to (1) published regulatory criteria, such as California Human Health Screening Levels (California Environmental Protection Agency 2005), (2) published background documents, such as “Use of the Northern and Southern California Polynuclear Aromatic Hydrocarbon (PAH) Studies in the Manufactured Gas Plant Site Cleanup Process” (Department of Toxic Substances Control 2009), and RFS site-specific criteria, such as Remedial Goals for Soil (Tetra Tech 2014). These criteria are used to evaluate volatile organic compounds, semi-volatile compounds, pesticides, polychlorinated biphenyls, total petroleum hydrocarbons, and metals. For metals which occur naturally in the soil, the application of regulatory screening levels or site-specific risk-based criteria can be ineffective if those levels are lower than the naturally-occurring or ambient concentrations in soil. For these metals, background studies or weight-of-evidence evaluations may be conducted to establish ambient or background concentrations. Establishing background or ambient concentrations helps ensure that investigation or cleanup efforts are not expended towards metals concentrations which are not associated with suspected contamination. “Ambient” concentrations represent metals in soils in the vicinity of a site but which are unaffected by site-related activities. Ambient conditions are some-times referred to as “local background” (Department of Toxic Substances Control 1997). There are five metals in soil at the RFS Site which may be present in the absence of suspected contamination at concentrations higher than the human health screening criteria: aluminum, arsenic, cobalt, manganese, and nickel. A detailed background study was previously conducted to establish a background concentration for arsenic at the adjacent Campus Bay site (Erler & Kalinowski, Inc. 2007) and the findings have been applied to the RFS Site (Tetra Tech 2014) since the time critical removal action was conducted in 2007 at the former Forest Products Laboratory Wood Treatment Lab. Background studies have not been conducted for aluminum, cobalt, manganese, and nickel. This technical memorandum presents a weight-of-evidence evaluation for aluminum, cobalt, manganese, and nickel. Section 2 presents a summary of each metal, including properties, chemical use, range of concentrations detected at RFS, and existing remedial goals for RFS, consisting of site-specific risk-based screening criteria. Section 3 presents statistical evaluations of site-specific soil chemical data. Section 4 presents a summary of the four metals from applicable literature reviews. Section 5 summarizes the findings from the statistical analyses and literature reviews, and identifies a range of natural or ambient soil concentrations for each metal.

Ambient Metals Technical Memorandum 2 December 11, 2015 UC Berkeley, Richmond Field Station Site
2.0 METALS BACKGROUND INFORMATION
Section 2 presents a brief description of each metal and established regulatory and site-specific criteria. General descriptions, industrial uses, and information on potential chemical sources to the environment are based on toxicological profiles prepared by the Agency for Toxic Substances and Disease Registry (ATSDR). The summary of detected concentrations at the RFS Site are based on data presented in the Final Current Conditions Report (Tetra Tech 2008), Final Site Characterization Report (Tetra Tech 2013), and Draft Phase IV Sampling Results Technical Memorandum (Tetra Tech 2015). The soil remedial goals for the RFS Site are based on the Final Removal Action Workplan (Tetra Tech 2014). The regulatory criteria are based on the California Human Health Screening Levels (California Environmental Protection Agency 2005).
2.1 ALUMINUM
Aluminum is the most abundant metal in the earth's crust and is always found combined with other elements such as oxygen, silicon, and fluorine; aluminum as the metal is obtained from aluminum-containing minerals. Aluminum is often mixed with small amounts of other metals to form aluminum alloys, which are stronger and harder. Aluminum compounds are used in many diverse and important industrial applications such as alums (aluminum sulfate) in water-treatment and alumina in abrasives and furnace linings. They are also found in consumer products such as antacids, astringents, buffered aspirin, food additives, and antiperspirants. Aluminum is used to make beverage cans, pots and pans, airplanes, siding, roofing, and foil (ATSDR 2008). Elevated levels of aluminum in the environment can be caused by the mining and processing of aluminum ores or the production of aluminum metal, alloys, and compounds. Small amounts of aluminum are released into the environment from coal-fired power plants and incinerators (ATSDR 2008). Aluminum is common and widespread in the environment and exposure to the levels of aluminum that are naturally present in food and water and the forms that are present in soil and aluminum pots and pans are not considered to be harmful. Exposure to higher levels of aluminum through industrial exposure or through consumption of process food containing aluminum additives and other sources are known or suspected to cause health effects (ATSDR 2008). As a result of potential exposure to the higher levels of aluminum, RFS Site-Specific Remedial Goals were established in the Final Removal Action Workplan (Tetra Tech 2014). Aluminum has been detected in all soil samples analyzed for metals at the RFS Site. Aluminum concentrations in soil at RFS Site have ranged from 8,500 to 28,000 mg/kg.
The RFS Site-Specific Remedial Goals for aluminum are:
Receptor Concentration Commercial Worker 100,000 mg/kg Construction Worker 20,300 mg/kg Maintenance Worker 100,000 mg/kg Off-Site Residents 100,000 mg/kg
There are no California Human Health Screening Levels for aluminum.

Ambient Metals Technical Memorandum 3 December 11, 2015 UC Berkeley, Richmond Field Station Site
There are no known or documented releases or spills of materials containing aluminum or aluminum compounds at the RFS Site.
2.2 COBALT
Cobalt is a naturally occurring element found in rocks, soil, water, plants, and animals with properties similar to iron and nickel. Elemental cobalt is a hard, silvery-grey metal, but cobalt is usually found in the environment combined with other elements such as oxygen, sulfur, and arsenic. Cobalt occurs as the biochemically important vitamin B12 and is essential for good health in animals and humans (ATSDR 2004). Cobalt is an important industrial metal used in manufacturing mixed with other metals to form alloys which are harder or more resistant to corrosion, including use in artificial hip and knee joints. Cobalt compounds are used as colorants in glass, ceramics, and paints; as catalysts in the petroleum industry; as paint driers; and as trace element additives in agriculture and medicine. Radioactive cobalt is used for commercial and medical purposes (ATSDR 2004). Cobalt is dispersed in the environment in low concentrations. The primary anthropogenic sources of cobalt in the environment are from the burning of fossil fuels, application of cobalt-containing phosphate fertilizers, mining and smelting of cobalt-containing ores, processing of cobalt-containing alloys, and industries that use or process cobalt compounds (ATSDR 2004). Cobalt has been associated with elevated elevations of manganese present in chert rocks, which may be present at the RFS Site; a more complete discussion of elevated concentrations of manganese in chert is presented in Section 2.3 below. Cobalt-bearing manganese oxide is commonly associated with sandstone, chert, and other siliceous rocks (U.S. Department of the Interior 1944), which are present in the Franciscan Complex local to the RFS Site.
Cobalt has both beneficial and harmful effect on human health. It is present in vitamin B12 which is essential to maintain human health and has been used as a treatment of anemia. Excessive exposure and uptake of cobalt in industrial exposure is known to cause health effects, although it is not known to cause cancer. As a result of potential exposure to the higher levels of cobalt, RFS Site-Specific Remedial Goals were established in the Final Removal Action Workplan (Tetra Tech 2014).
Cobalt has been detected in all soil samples analyzed for metals at the RFS Site. Cobalt concentrations in soil at RFS Site have ranged from 3.1 to 73 mg/kg. The RFS Site-Specific Remedial Goals for cobalt are:
Receptor Concentration Commercial Worker 273 mg/kg Construction Worker 19.9 mg/kg Maintenance Worker 34.1 mg/kg Off-Site Residents 356 mg/kg

Ambient Metals Technical Memorandum 4 December 11, 2015 UC Berkeley, Richmond Field Station Site
The California Human Health Screening Levels for cobalt are:
Receptor Concentration Residential 660 mg/kg Commercial Worker 3,200 mg/kg
The calculation of RFS Site-specific Remedial Goals for cobalt are based on estimated exposures specific to workers at RBC. The RFS Site exposure estimates are higher (for example more days per year working in contact with soil) than the default exposures included in the California Human Health Screening Level calculations, and therefore result in remedial goals which are more stringent than the California Human Health Screening Levels. There are no known or documented releases or spills of materials containing cobalt or cobalt compounds at the RFS Site. 2.3 MANGANESE
Manganese is a naturally-occurring metal found in many types of rocks and is a normal constituent of air, soil, water, and food. Pure manganese is silver-colored, but does not occur naturally. It combines with other substances such as oxygen, sulfur, or chlorine. Manganese can also be combined with carbon to make organic manganese compounds. Manganese occurs naturally in most foods and may be added to food or made available in nutritional substances. Manganese is a trace element and is necessary for good health (ATSDR 2012).
In addition to being used as a nutritional substance, manganese occurs in a wide variety of commercial products, including fireworks, dry-cell batteries, fertilizer, paints, and cosmetics. In manufacturing, it is used principally in steel production to improve hardness, stiffness, and strength. It is also used as a gasoline additive and in some pharmaceuticals and pesticides (ATSDR 2012).
Manganese is present at elevated concentrations and mined from many geologic formations throughout the U.S. Specifically, elevated concentrations of manganese are associated with the Franciscan Complex, specifically within chert rocks (National Park Service 2001). The U.S. Geological Survey has mapped Franciscan Complex at Brooks Island, Point Molate, the East Shore Park and Albany Hill, indicating a high likelihood of manganese-rich chert source rocks may be present at the RFS Site (U.S. Geological Survey 2006). The presence of manganese is so prevalent that manganese ore was mined in the late 1860s from Red Rock Island, part of the Franciscan Complex located west of the RFS Site at the Richmond Bridge (U.S. Geological Survey 1910). People are exposed to manganese primarily by eating food or manganese-containing nutritional supplements. Vegetarians may have a higher intake of manganese than the average person. Certain occupations like welding increase chances of exposure. Air emissions from industry, mining, automobile exhaust, and tobacco smoke may also increase chances of exposure (ATSDR 2012).

Ambient Metals Technical Memorandum 5 December 11, 2015 UC Berkeley, Richmond Field Station Site
While manganese is an essential nutrient, uptake of excessive manganese is known to cause adverse health effects, although it is not known to cause cancer or birth defects. As a result of potential exposure to the higher levels of manganese, RFS Site-Specific Remedial Goals were established in the Final Removal Action Workplan (Tetra Tech 2014).
Manganese has been detected in all soil samples analyzed for metals at the RFS Site. Manganese concentrations in soil at RFS Site have ranged from 120 to 5,900 mg/kg.
The RFS Site-Specific Remedial Goals for manganese are:
Receptor Concentration Commercial Worker 20,500 mg/kg Construction Worker 212 mg/kg Maintenance Worker 5,300 mg/kg Off-Site Residents 68,600 mg/kg
There are no California Human Health Screening Levels for manganese.
There are no known or documented releases or spills of materials containing manganese or manganese compounds at the RFS Site.
2.4 NICKEL
Nickel is present in all soil and is a very abundant natural element which can be combined with other metals, such as iron, copper, chromium, and zinc, to form alloys. These alloys are used to make coins, jewelry, and items such as valves and heat exchangers. Nickel compounds are used for nickel plating, to color ceramics, to make some batteries, and as substances known as catalysts that increase the rate of chemical reactions. Most nickel is used to make stainless steel (ATSDR 2005).
The major source of nickel exposure to the general population is food. Some foods are naturally high in nickel including chocolate, soybeans, nuts, and oatmeal. Higher levels of exposure can occur in industries that use nickel. The most common harmful health effect of nickel in humans is an allergic reaction. Approximately 10 to 20% of the population is sensitive to nickel, which can cause skin rashes on contact (with jewelry). Industrial exposures to higher concentrations in air are known to cause serious health effects. As a result of potential exposure to industrial concentrations of nickel, RFS Site-Specific Remedial Goals were established in the Final Removal Action Workplan (Tetra Tech 2014).Nickel has been detected in all soil samples analyzed for all metals at the RFS Site. Nickel concentrations in soil at RFS Site have ranged from 20 to 280 mg/kg.
The RFS Site-Specific Remedial Goals for Nickel are:
Receptor Concentration Commercial Worker 14,900 mg/kg Construction Worker 60.6 mg/kg Maintenance Worker 1,180 mg/kg Off-Site Residents 12,300 mg/kg

Ambient Metals Technical Memorandum 6 December 11, 2015 UC Berkeley, Richmond Field Station Site
The California Human Health Screening Levels for Nickel are:
Receptor Concentration Residential 1,600 mg/kg Commercial Worker 16,000 mg/kg
The calculation of RFS Site-specific Remedial Goals for nickel are based on estimated exposures specific to workers at RBC. The RFS Site exposure estimates are higher (for example more days per year working in contact with soil) than the default exposures included in the California Human Health Screening Level calculations, and therefore result in remedial goals which are more stringent than the California Human Health Screening Levels. There are no known or documented releases or spills of materials containing nickel or nickel compounds at the RFS Site.

Ambient Metals Technical Memorandum 7 December 11, 2015 UC Berkeley, Richmond Field Station Site
3.0 RFS STATISTICAL EVALUATION
This section presents the two statistical evaluations for each of the four metals conducted with data collected from the RFS Site: (1) a comprehensive analysis of soil data collected to date; and (2) an analysis of data from contaminated soil samples compared with data from presumed uncontaminated soil samples. A summary of each evaluation is presented below, followed by the results for each metal.
3.1 INTRODUCTION
Statistical populations were examined for two different cases using graphical and mathematical techniques. First, the comprehensive data set from the RFS site was examined as a single data set in an attempt to identify multiple data populations. Second, the comprehensive data set was split into two subsets (contaminated and presumed uncontaminated) for comparison of these two subsets. Presumably if multiple populations are not observed and the contaminated subset is statistically equivalent to or less than the presumed uncontaminated subset, then the metal evaluated is not associated with known or suspected contaminant sources at the RFS Site, as defined in the Final Removal Action Workplan (Tetra Tech 2014).
Two graphical methods were used in the analysis: quantile-quantile (Q-Q) plots and cumulative probability plots were generated to enable visual analysis. Both types of plots provide visual indications of whether multiple populations are present in a data set. As examples, the two plots presented below demonstrate normal probability plots (similar to Q-Q plots and cumulative probability plots). The first example identifies a data set which appears to represent multiple populations, as evidenced by the multiple inflection points; the second example appears to represent a single population (DTSC 1997). The examples illustrate the general appearance of Q-Q plots with single and multiple populations.
Example 1. Normal probability plot for log-transformed data with multiple apparent populations.

Ambient Metals Technical Memorandum 8 December 11, 2015 UC Berkeley, Richmond Field Station Site
Example 2. Normal probability plot for log-transformed data with a single population of detected data on the right side of plot, and a series of non-detect results on the left side of the plot.
A spreadsheet program was used to prepare Q-Q plots and cumulative probability plots for the four metals being studied, as summarized below.
Q-Q plots show the concentration (or the log of the concentration) plotted against the theoretical quantile for a standard normal distribution based on the number of points in the data set. In this case, the distributions were expected to be lognormal, which is common for environmental data sets, so the log of the concentration was plotted initially. When the data points follow a straight line, it is likely that there is a single population.
Cumulative probability plots show the concentration plotted against the cumulative percentage of the distribution. In the cumulative probability plots, the ends of the plot are compacted relative to the Q-Q plot. As such, it is easier to view the center of the plot on the cumulative probability plots, even though the ends are skewed away from the normal line. For a normal distribution, the cumulative probability plot will naturally show a linear response in the center, but resemble an s-shaped curve at the ends.
In addition, mathematical methods were used to determine whether the data sets appeared normal, lognormal, or nonparametric. ProUCL 5.0 was used to perform these tests (EPA 2013). Shapiro-Wilk tests of normality were used on the log-transformed data to test whether the data sets appeared lognormal. In some cases, Shapiro-Wilk tests were also used on the untransformed data to test whether the data sets appeared normal.
For the comparison of the contaminated and presumed uncontaminated data sets, Student’s t-tests or Wilcoxon-Mann-Whitney (WMW) tests were conducted in ProUCL to compare the data sets (EPA 2013). Both tests are used to test for statistical differences between data sets that may or may not be from the same population. The t-test is appropriate when both data sets appear to be normal. The WMW test (equivalent to a Wilcoxon Rank-Sum test) is appropriate when the

Ambient Metals Technical Memorandum 9 December 11, 2015 UC Berkeley, Richmond Field Station Site
data sets do not appear to be normal. One-sided tests are used to assess whether the one data set appears to be below the other. Two-sided tests are conducted to assess whether the data sets do or do not appear statistically different.
3.2 COMPREHENSIVE ANALYSIS METHODOLOGY
The purpose of the comprehensive analysis was to identify disparate statistical populations, if present, for consideration as possible background or ambient populations. Soil data were reviewed for quality and appropriateness for acceptance into the data query for a comprehensive analysis. The data is comprehensive of all discrete soil sampling results from investigations conducted from 1990 through present. The data query includes field duplicates and sample results from soil which has been removed from the RFS Site, including sample results from soil disposed off-site with mercury-, PCB-, and cinder-impacted soils. The data query does not include waste characterization samples, sediment samples, composite samples, laboratory duplicates, and incremental sampling method samples.
A statistical evaluation was conducted for each metal. Statistical analyses consisted of standard data normality testing, data transformation (if necessary) and the creation of Q-Q and cumulative probability plots for each metal. For the plotting, nondetected results were plotted at the reporting limit.
3.3 COMPREHENSIVE ANALYSIS METHODOLOGY RESULTS
Each plot was reviewed for correlation, breaks, and possible inflection points. The analysis did not result in any significant conclusions; each plot appears to be generally consistent with standard scatter plots. Results from the statistical evaluation are presented in Appendix A. The visual analysis indicated a few minor findings for aluminum, cobalt, manganese, and nickel:
Aluminum appears to be a normal or lognormal distribution, although there is a slight downward deflection at the top of the Q-Q plot for the normal plot, and a slight upward deflection at the bottom of the Q-Q plot for the lognormal plot. These minor deflections do not impact the finding of normal or lognormal distribution for aluminum. The statistical evaluation of aluminum strongly supports one data population.
Cobalt appears close to lognormally distributed, although there is a limited number of concentrations above 26 mg/kg that appear to deviate from a lognormal distribution. These data do not indicate a separate population as traditionally observed in contaminant data sets; however, the evaluation of normality is not entirely conclusive for cobalt.
Manganese appears close to lognormally although there are concentrations above 2,000 mg/kg that deviate from a lognormal distribution. There may also be a minor statistical break at 1,000 mg/kg. These data do not indicate separate populations as traditionally observed in contaminant data sets; however, the evaluation of normality is not entirely conclusive for manganese.
Nickel appears close to lognormally distributed, although there are concentrations above 120 mg/kg that appear to deviate from a lognormal distribution. These data do not indicate a separate population as traditionally observed in contaminant data sets; however, the evaluation of normality is not entirely conclusive for nickel.

Ambient Metals Technical Memorandum 10 December 11, 2015 UC Berkeley, Richmond Field Station Site
Shapiro-Wilk tests for normality were also performed on the untransformed or log-transformed data using ProUCL 5.0. The population for aluminum was found to be normally distributed by Shapiro-Wilk tests, consistent with the findings presented above. Cobalt, manganese, and nickel were not found to have definitive normal or lognormal distributions, indicating the possibility of multiple populations, although visual indications do not provide strong indications that multiple populations are present.
Sample locations of the cobalt, manganese, and nickel concentrations potentially outside of the normal or lognormal distributions are plotted in Appendix A on Figures A-1, A-2, and A-3, The spatial distribution of the samples with concentrations greater than the possible normal or lognormal distributions indicates that the sample locations are random and do not support location-specific or systematic contamination of cobalt, manganese, or nickel beyond the comprehensive data set.
3.4 CONTAMINATED AND PRESUMED UNCONTAMINATED ANALYSIS METHODOLOGY
Because the comprehensive analysis did not provide a clear indication that single populations are present for cobalt, manganese, and nickel, an analysis of contaminated and presumed uncontaminated sample results was conducted. While the aluminum distribution appears to represent one population, it was also included in this evaluation. The purpose of this analysis is to identify if any of the four metals are associated with known contamination. If elevated concentrations of aluminum, cobalt, manganese, or nickel are correlated with known RFS-contamination, such as cinder-related metals, PCBs, PAH, or mercury, then elevated levels may not represent background or ambient conditions. If there is no correlation between elevated concentrations of the four metals with known contamination, then there is a higher confidence that the concentrations are representative of background or ambient conditions.
The data query for this analysis is a subset of the comprehensive data query discussed in the previous subsection. The contaminated data set is composed of sample data with exceedences of RFS Site Remedial Goals (Tetra Tech 2014). If a sample did not include analysis for the four metals, then it was not included in the contaminated data set. The list of contaminated samples and locations are presented on Figure B-1 and Table B-1 of Appendix B.
The presumed uncontaminated data set is composed of samples not associated with any exceedences or even proximity to areas suspected of contamination. For example, no samples from the Mercury Fulminate Area, the RFS Corporation Yard, or historic areas of known California Cap Company industrial operations are included. Confirmation samples associated with previous cleanup or removal actions are not included. No sample results from boreholes with known contamination are included. If data results did not include analysis for the four metals, then it was not included in the presumed uncontaminated data set. The list of presumed uncontaminated samples and locations are presented on Figure B-1 and Table B-2 of Appendix B.
Each data set was evaluated for goodness of fit test for normality, and then evaluated against each other (metal by metal) with one- and two-sided tests statistical tests in EPA ProUCL 5.0 software (EPA 2013). For metals with normal distributions, t-tests were used to test for differences of central tendency. For metals that were not consistent with normal distributions, a nonparametric Wilcoxon-Mann-Whitney (WMW) test was used to test for differences. One-

Ambient Metals Technical Memorandum 11 December 11, 2015 UC Berkeley, Richmond Field Station Site
sided tests were used to test whether the contaminated samples were statistically lower than or equal to the presumed contaminated samples. Two-sided tests were used to test whether the contaminated samples were statistically equivalent to or not equivalent to the presumed contaminated samples. This information together was used to conclude whether the contaminated samples were statistically less than, equivalent to, or greater than the presumed contaminated samples.
In addition to tests for central tendency, a test of differences in upper quantiles was performed. The Quantile Test was used to perform these tests in EPA ProUCL 4.1 software (EPA 2010).
3.5 CONTAMINATED AND PRESUMED UNCONTAMINATED ANALYSIS RESULTS
Both data sets from the aluminum results are consistent with normal distributions; cobalt, manganese, and nickel results are not consistent with normal distributions. The evaluation of one-sided and two-sided test for each metal (contaminated and presumed uncontaminated) support that none of the metals concentrations within the contaminated data sets appear higher than the metals detected in the presumed uncontaminated data sets. The results support that single, elevated concentrations in the presumed uncontaminated data sets are not associated with known contaminant sources at RFS. The table below summarizes the results of the tests of central tendency:
Metal Type of Test One-Sided Test Result Two-sided Test Result Overall Conclusion
Aluminum t-test Contaminated less than or equal to Presumed
Uncontaminated
Contaminated not equivalent to Presumed
Uncontaminated
Contaminated less than Presumed Uncontaminated
Cobalt Wilcoxon-
Mann-Whitney
Contaminated less than or equal to Presumed
Uncontaminated
Contaminated equivalent to Presumed
Uncontaminated
Contaminated equivalent toPresumed Uncontaminated
Manganese Wilcoxon-
Mann-Whitney
Contaminated less than or equal to Presumed
Uncontaminated
Contaminated not equivalent to Presumed
Uncontaminated
Contaminated less than Presumed Uncontaminated
Nickel Wilcoxon-
Mann-Whitney
Contaminated less than or equal to Presumed
Uncontaminated
Contaminated not equivalent to Presumed
Uncontaminated
Contaminated less than Presumed Uncontaminated
The results of the Quantile test for all four metals indicated that the contaminated samples were lower than or equal to the presumed uncontaminated samples. Results from the statistical evaluation are presented in Appendix C.
A summary of chemical concentrations identified within the contaminated data set, presumed uncontaminated data set, and comprehensive data set is provided on the following page.

Ambient Metals Technical Memorandum 12 December 11, 2015 UC Berkeley, Richmond Field Station Site
RFS Statistical Evaluation Summary
Metal Number of
Samples Minimum(mg/kg)
Maximum(mg/kg)
Average (mg/kg)
Median (mg/kg)
GeometricMean
(mg/kg)
95th Upper Confidence Limit of the Mean 1
(mg/kg)
99th Upper Tolerance Limit 2
(mg/kg) Aluminum Contaminated Uncontaminated Comprehensive
18 71
164
10,000 8,500 7,800
20,300 28,000 29,000
15,200 18,600 17,700
15,700 18,600 18,000
15,000 18,100 17,100
16,400 19,500 18,300
23,654 28,220 27,000
Cobalt Contaminated Uncontaminated Comprehensive
24 82
208
2.82 3.1
2.82
32 73 73
12.2 14.6 13.7
11 12
11.7
11.0 12.8 12.0
14.6 16.5 14.8
32 63 40
Manganese Contaminated Uncontaminated Comprehensive
24 82
195
130 120 89
1,700 5,900 5,900
575 765 742
513 630 620
482 645 591
728
1,100 956
1,700 2,900 2,600
Nickel Contaminated Uncontaminated Comprehensive
85 90
660
8.3 20 5.9
260 280 280
40.3 47.3 45.9
34 42 39
35.6 42.6 40.4
52.8 45.4 47.7
85
170 110
Notes:
All reported values rounded to three significant figures. See Appendices B and C for ProUCL output.
1 95th Upper Confidence Limit is the recommended value from ProUCL 5.0 (EPA 2013).
2 99th Upper Tolerance Limit was calculated using 95% coverage (EPA 2013). Aluminum was based on a normal distribution, other metals on a nonparametric distribution.
Ambient Metals Technical Memorandum 13 December 11, 2015 UC Berkeley, Richmond Field Station Site
4.0 LITERATURE REVIEW
Many studies have been conducted both nation-wide and regionally regarding naturally-occurring metals concentrations. This section presents the results of three metals background studies.
4.1 ANALYSIS OF BACKGROUND DISTRIBUTIONS OF METALS IN THE SOIL AT LBNL, JUNE 2002, REVISED APRIL 2009
The Lawrence Berkeley National Laboratory (LBNL) Environmental Restoration Program conducted an evaluation of naturally occurring metals to determine if soils at specific locations contained elevated concentrations of metals relative to ambient conditions. The study was conducted at the LBNL facility, located adjacent to the UC Berkeley Campus in the Berkeley, CA. The study was first published in 2002 and updated in 2009 (LBNL 2009). The study defines “Ambient conditions” as concentrations of metals in the vicinity of a site, but which are unaffected by site-related activities (Cal-EPA 1997). The study is relevant to the RFS Site since there is overlap in the geologic classifications among the two properties. The study evaluated 17 metals through the analyses of more than 1,600 soil samples collected from boreholes ranging in depth from the surface to a maximum depth of 180.5 feet throughout the LBNL facility. Cobalt and nickel were evaluated; aluminum and manganese were not included in the chemical analyses. A complete discussion of sampling protocols, statistical methods, and detailed results is presented in the LBNL study. Data Evaluation
A maximum background level was selected for each metal based on the results of the statistical analyses. Due to the very large size of the data sets, calculated estimates of the 99th percentile of the data sets were used to identify background levels for metals with low numbers of non-detects and well-defined distributions, including cobalt and nickel. In total, 1,397 samples were analyzed for cobalt; 1,392 were analyzed for nickel.
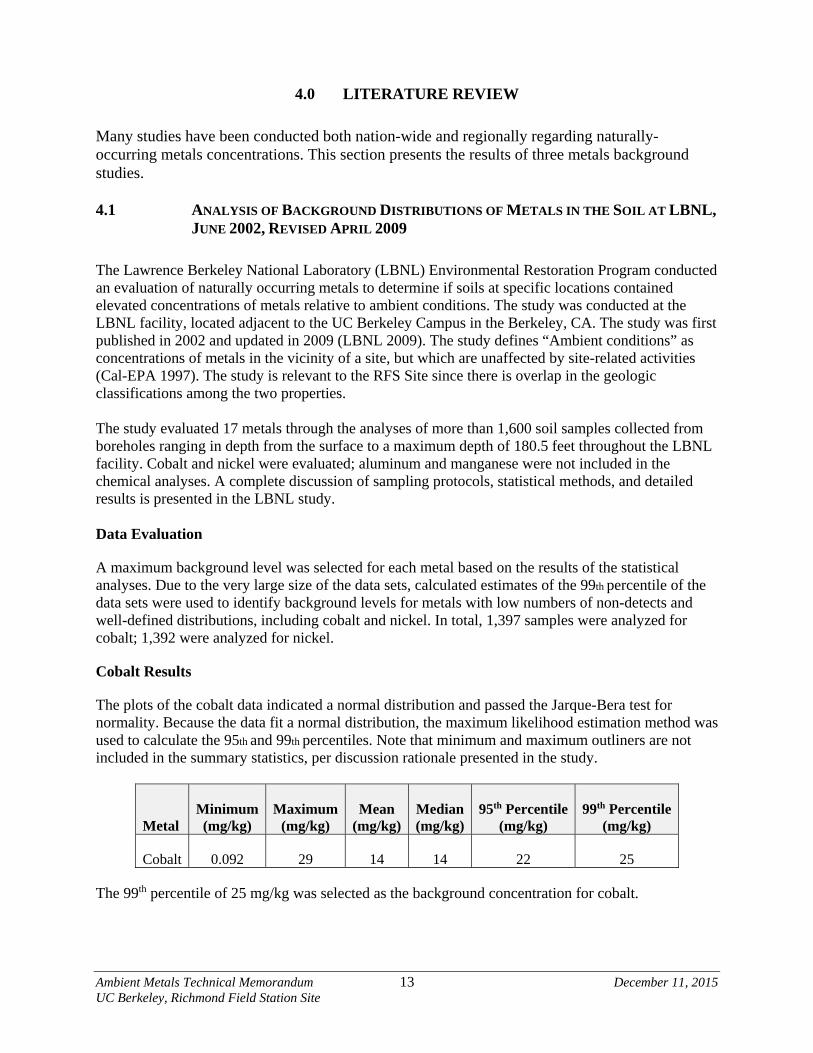
Cobalt Results
The plots of the cobalt data indicated a normal distribution and passed the Jarque-Bera test for normality. Because the data fit a normal distribution, the maximum likelihood estimation method was used to calculate the 95th and 99th percentiles. Note that minimum and maximum outliners are not included in the summary statistics, per discussion rationale presented in the study.
Metal Minimum (mg/kg)
Maximum(mg/kg)
Mean (mg/kg)
Median(mg/kg)
95th Percentile(mg/kg)
99th Percentile(mg/kg)
Cobalt 0.092 29 14 14 22 25
The 99th percentile of 25 mg/kg was selected as the background concentration for cobalt.
Ambient Metals Technical Memorandum 14 December 11, 2015 UC Berkeley, Richmond Field Station Site
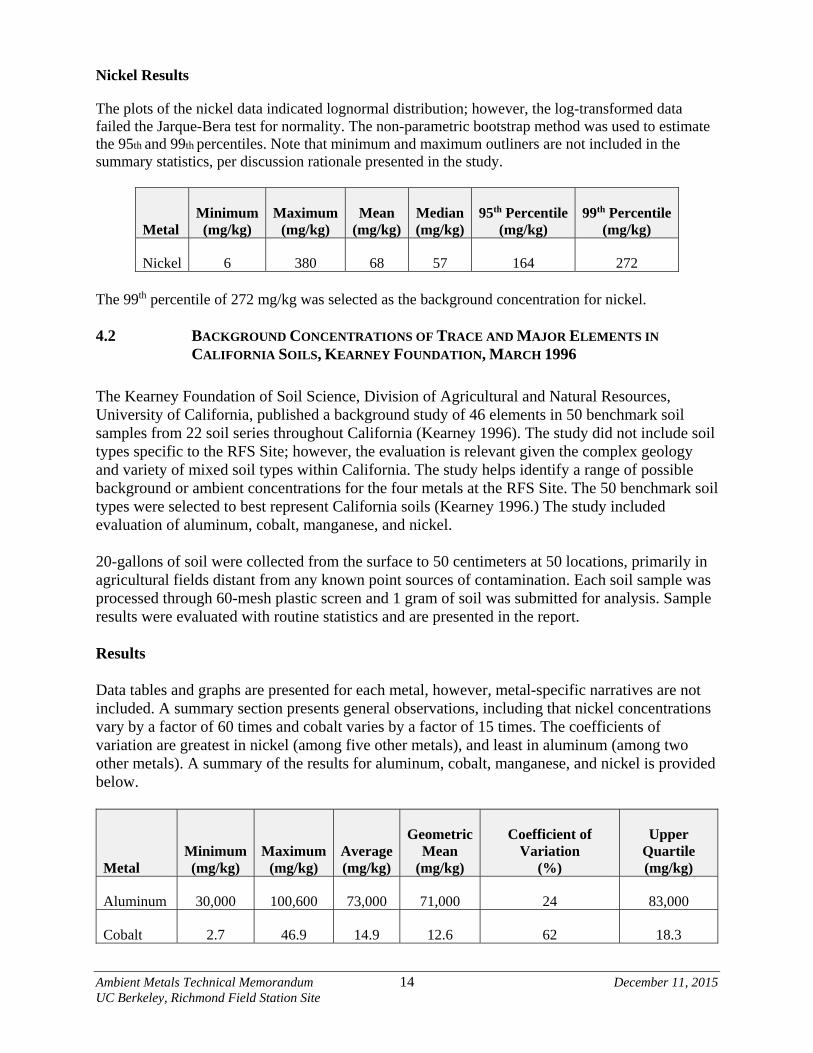
Nickel Results
The plots of the nickel data indicated lognormal distribution; however, the log-transformed data failed the Jarque-Bera test for normality. The non-parametric bootstrap method was used to estimate the 95th and 99th percentiles. Note that minimum and maximum outliners are not included in the summary statistics, per discussion rationale presented in the study.
Metal Minimum (mg/kg)
Maximum(mg/kg)
Mean (mg/kg)
Median(mg/kg)
95th Percentile(mg/kg)
99th Percentile(mg/kg)
Nickel 6 380 68 57 164 272 The 99th percentile of 272 mg/kg was selected as the background concentration for nickel. 4.2 BACKGROUND CONCENTRATIONS OF TRACE AND MAJOR ELEMENTS IN
CALIFORNIA SOILS, KEARNEY FOUNDATION, MARCH 1996
The Kearney Foundation of Soil Science, Division of Agricultural and Natural Resources, University of California, published a background study of 46 elements in 50 benchmark soil samples from 22 soil series throughout California (Kearney 1996). The study did not include soil types specific to the RFS Site; however, the evaluation is relevant given the complex geology and variety of mixed soil types within California. The study helps identify a range of possible background or ambient concentrations for the four metals at the RFS Site. The 50 benchmark soil types were selected to best represent California soils (Kearney 1996.) The study included evaluation of aluminum, cobalt, manganese, and nickel. 20-gallons of soil were collected from the surface to 50 centimeters at 50 locations, primarily in agricultural fields distant from any known point sources of contamination. Each soil sample was processed through 60-mesh plastic screen and 1 gram of soil was submitted for analysis. Sample results were evaluated with routine statistics and are presented in the report. Results Data tables and graphs are presented for each metal, however, metal-specific narratives are not included. A summary section presents general observations, including that nickel concentrations vary by a factor of 60 times and cobalt varies by a factor of 15 times. The coefficients of variation are greatest in nickel (among five other metals), and least in aluminum (among two other metals). A summary of the results for aluminum, cobalt, manganese, and nickel is provided below.
Metal Minimum (mg/kg)
Maximum (mg/kg)
Average(mg/kg)
GeometricMean
(mg/kg)
Coefficient of Variation
(%)
Upper Quartile (mg/kg)
Aluminum 30,000 100,600 73,000 71,000 24 83,000
Cobalt 2.7 46.9 14.9 12.6 62 18.3

Ambient Metals Technical Memorandum 15 December 11, 2015 UC Berkeley, Richmond Field Station Site
Metal Minimum (mg/kg)
Maximum (mg/kg)
Average(mg/kg)
GeometricMean
(mg/kg)
Coefficient of Variation
(%)
Upper Quartile (mg/kg)
Manganese 253 1,687 646 592 44 809
Nickel 9 509 412 290 141 56 4.3 ELEMENT CONCENTRATIONS IN SOILS AND OTHER SURFICIAL MATERIALS OF
THE CONTERMINOUS UNITED STATES, USGS 1984
The U.S. Geological Survey conducted a background analysis of 50 elements collected from approximately 20 centimeters below ground surface from locations approximately 80 kilometers apart throughout the conterminous United States (USGS 1984). 1,318 sampling points were selected for analyses. The study included aluminum, cobalt, manganese, and nickel. The report also includes a summary of sampling results from five previous soil sampling studies from a variety of locations throughout the world. Results The study presents the range, average and geometric means, the geometric deviation, and histograms showing frequency distributions for each element across the entire study area; metal-specific narratives are not provided. The summary tables present the conterminous Unites States, Western United States (west of the 96th meridian), and Eastern United States. A summary of the Western United States results for aluminum, cobalt, manganese, and nickel is provided below.
Metal Minimum (mg/kg)
Maximum(mg/kg)
ArithmeticMean
(mg/kg)
Geometric Mean
(mg/kg)
Relative Standard Deviation
Aluminum 5,000 >100,000 74,000 58,000 2.00
Cobalt <3 50 9 7.1 1.97
Manganese 30 5,000 480 380 1.98
Nickel <5 700 19 15 2.10

Ambient Metals Technical Memorandum 16 December 11, 2015 UC Berkeley, Richmond Field Station Site
5.0 SUMMARY AND RECOMMENDATIONS
This section provides a summary of the statistical evaluation and literature reviews for each metal. Recommendations regarding background or ambient concentrations to be considered at the RFS Site are presented in the summary table on the following page.
Aluminum The results presented in Section 3 support that the population of aluminum concentrations detected in contaminated samples is not statistically different than the population of presumed clean samples, which demonstrates a strong weight of evidence that elevated aluminum detections are not likely related to known contamination. The mean, median, and maximum aluminum concentrations detected in the comprehensive RFS Site data are below the respective values within the Kearny and USGS studies presented in Section 4; aluminum was not evaluated in the LBNL study. The weight of evidence strongly suggests that all detected concentrations of aluminum at RFS are related to ambient or background concentrations. Aluminum is recommended to be eliminated from further consideration as a chemical of concern at the RFS Site. Cobalt The results presented in Section 3 support that the population of cobalt concentrations detected in contaminated samples is not statistically different than the population of presumed clean samples, which demonstrates a strong weight of evidence that elevated cobalt detections are not likely related to known contamination. The maximum cobalt concentrations detected in the comprehensive RFS data are above the maximum values within the LBNL, Kearny, and USGS studies presented in Section 4. The RFS comprehensive data set mean and median concentrations are below the LBNL and Kearney studies; which are the studies most relevant to RFS soils. Cobalt has been identified as existing at elevated concentrations associated with manganese present in chert rocks, which are likely present at the RFS Site. While the maximum concentrations are above the reference study maximum concentrations, the weight of evidence suggests that all detected concentrations of cobalt at RFS are related to ambient or background concentrations. Cobalt concentrations identified within the uncontaminated data set are recommended to represent ambient conditions at the RFS Site, and sample results up to 73 mg/kg should not be considered for further evaluation. Manganese The results presented in Section 3 support that the population of manganese concentrations detected in contaminated samples is not statistically different than the population of presumed clean samples, which demonstrates a strong weight of evidence that elevated manganese detections are not likely related to known contamination. The maximum manganese concentrations detected in the comprehensive RFS data are above the maximum values within the Kearny and USGS studies presented in Section 4; manganese was not evaluated in the LBNL study. The RFS comprehensive data set mean and median concentrations are slightly above the

Ambient Metals Technical Memorandum 17 December 11, 2015 UC Berkeley, Richmond Field Station Site
Kearney study; which is the study most relevant to RFS soils. While the manganese concentrations appear above the reference study concentrations, the weight of evidence suggests that all detected concentrations of manganese at RFS are related to ambient or background concentrations. Manganese has been identified at elevated concentrations in the Franciscan Complex, specifically within chert rocks, which are likely present at the RFS Site. Manganese concentrations identified within the uncontaminated data set are recommended to represent ambient conditions at the RFS Site, and sample results up to 5,900 mg/kg should not be considered for further evaluation. Nickel The results presented in Section 3 support that the population of nickel concentrations detected in contaminated samples is not statistically different than the population of presumed clean samples, which demonstrates a strong weight of evidence that elevated nickel detections are not likely related to known contamination. The mean, median, and maximum nickel concentrations detected in the comprehensive RFS data are below the respective values within the LBNL, Kearny, and USGS studies presented in Section 4. The weight of evidence strongly suggests that all detected concentrations of nickel at RFS are related to ambient or background concentrations. Nickel concentrations identified within the uncontaminated data set are recommended to represent ambient conditions at the RFS Site, and sample results up to 280 mg/kg should not be considered for further evaluation.

Ambient Metals Technical Memorandum 18 December 11, 2015 UC Berkeley, Richmond Field Station Site
Statistical and Literature Summary and Recommendations
Metal Minimum(mg/kg)
Median (mg/kg)
Mean (mg/kg)
Maximum (mg/kg)
Aluminum LBNL Study -- -- -- -- Kearney Study 30,000 71,000 73,000 100,600 USGS Study 5,000 58,000 74,000 >100,000 RFS Data Contaminated Uncontaminated Comprehensive
10,000 8,500 7,800
15,000 18,100 18,000
15,200 18,600 17,700
20,300 28,000 29,000
RFS Aluminum Background or Ambient: Up to 29,000 mg/kg Cobalt LBNL Study 0.92 14 14 29 Kearney Study 2.7 12.6 14.9 46.9 USGS Study <3 7.1 9 50 RFS Data Contaminated Uncontaminated Comprehensive
2.82 3.1
2.82
11 12
11.7
12.2 14.6 13.7
32 73 73
RFS Cobalt Background or Ambient: Up to 73 mg/kg Manganese LBNL Study -- -- -- -- Kearney Study 253 592 646 1,687 USGS Study 30 380 480 5,000 RFS Data Contaminated Uncontaminated Comprehensive
130 120 89
513 630 620
575 765 742
1,700 5,900 5,900
RFS Manganese Background or Ambien: Up to 5,900 mg/kg Nickel LBNL Study 6 57 68 380 Kearney Study 9 290 412 509 USGS Study <5 15 19 700 RFS Data Contaminated Uncontaminated Comprehensive
8.3 20 5.9
34 42 39
40.3 47.3 45.9
260 280 280
RFS Nickel Background or Ambient: Up to 280 mg/kg

Ambient Metals Technical Memorandum 19 December 11, 2015 UC Berkeley, Richmond Field Station Site
6.0 REFERENCES
Agency for Toxic Substances and Disease Registry (ATSDR). 2004. Toxicological Profile for Cobalt, U.S. Department of Health and Human Services, Public Health Service, Agency for Toxic Substances and Disease Registry. September.
ATSDR. 2005. Toxicological Profile for Nickel, U.S. Department of Health and Human Services, Public Health Service, Agency for Toxic Substances and Disease Registry. September.
ATSDR. 2008. Toxicological Profile for Aluminum, U.S. Department of Health and Human Services, Public Health Service, Agency for Toxic Substances and Disease Registry. September.
ATSDR. 2012. Toxicological Profile for Manganese, U.S. Department of Health and Human Services, Public Health Service, Agency for Toxic Substances and Disease Registry. September.
California Environmental Protection Agency. 2005. Use of California Human Health Screening Levels (CHHSLs) in Evaluation of Contaminated Properties. January.
Department of Toxic Substances Control (DTSC). 1997. Selecting Inorganic Constituents as
Chemicals of Potential Concern at Risk Assessments at Hazardous Waste Sites and Permitted Facilities. Final Policy. February.
DTSC. 2009. Use of the Northern and Southern California Polynuclear Aromatic Hydrocarbon
(PAH) Studies in the Manufactured Gas Plant Site Cleanup Process. July 1. Erler & Kalinowski, Inc. 2007. Technical Memorandum: Background Concentrations of Arsenic
in Soil at Campus Bay, Campus Bay Site, Richmond, California. July 23.
Kearney 1996. Background Concentrations of Trace and Major Elements in California Soils. Kearney Foundation of Soil Science, Division of Agricultural and Natural Resources, University of California. March.
LBNL. 2009. Analysis of Background Distributions of Metals in the Soil at Lawrence Berkeley National Laboratory. Environmental Restoration Program. April.
National Park Service. 2001 Geology and Natural History of the San Francisco Bay Area: A 2001 NAGT Field-Trip Guidebook, prepared by William Elder, National Park Service, Golden Gate National Recreation Area, California. Located online at http://pubs.usgs.gov/bul/b2188/b2188ch3.pdf.
Tetra Tech. 2008. Final Current Conditions Report, University of California, Richmond Field Station. November 21.
Tetra Tech. 2013. Final Site Characterization Report. Proposed Richmond Bay Campus, Research, Education, and Support Area and Groundwater within the Richmond Field Station Site. May 28.

Ambient Metals Technical Memorandum 20 December 11, 2015 UC Berkeley, Richmond Field Station Site
Tetra Tech. 2014. Final Removal Action Workplan. Proposed Richmond Bay Campus, Research, Education, and Support Area and Groundwater within the Richmond Field Station Site. July 18.
Tetra Tech. 2015. Draft Phase IV Sampling Results Technical Memorandum, Richmond Field Station Site, Berkeley Global Campus at Richmond Bay, University of California, Berkeley. June 5.
U.S. Environmental Protection Agency (EPA). 2010. ProUCL 4.1.00 Technical Guide (Draft), Statistical Software for Environmental Applications for Data Sets with and without Nondetect Observations. EPA/600/R-07/041. May.
EPA. 2013. ProUCL 5.0.00 Technical Guide, Statistical Software for Environmental Applications for Data Sets with and without Nondetect Observations. EPA/600/R-07/041. September.
U.S. Department of the Interior. 1944. Cobalt-Bearing Manganese Deposits of Alabama, Georgia, and Tennessee, Bulletin 940-J. W.G. Pierce, Washington Government Printing Office, 1944.
U.S. Geological Survey (USGS). 1910. Manganese Deposits of the United States, Bulletin 427. Edmund Cecil Harder, Washington Government Printing Office, 1910.
USGS. 1984. Element Concentrations in Soils and Other Surficial Materials of the Conterminous United States. U.S. Geological Survey Professional Paper 1270.
USGS. 2006. Geologic Map of the San Francisco Bay Region. Prepared by R.W. Graymer et al. 2006.

Appendix AComprehensive Data Analysis Results

¨¨¨¨¨¨¨¨¨¨¨¨¨¨¨¨¨
¨¨¨¨¨¨¨¨
¨¨¨¨
¨¨¨¨ ¨ ¨ ¨¨
!(!(!(!(!(!(
!(!(
!(!(
!(!(!(!(
!(!(!(!(!(!(!(
!(!(!(!(!(!(!(!(!(
!(!(!(
!(!(!(!(
!(!(!(!(!(!(!(!(!(!(!(!(!(!(!(!(!(!(!(!(
!(!(!(
!(!(!(!(!(
!(!(!(
!(!(!(!(!(!(!(!(
!(!(!(!(!(!(!(!(
!(!(!(!(!(!(!(!(!(!(!(!(
!(!(!(!(!( !(!(
!(!(
!(!( !(!(
!(!( !(
!( !(!(!(!(!(
!(!( !( !(!( !(
!( !(!( !( !(!(
!( !(!( !(
!(!( !( !(!( !(!(!(
!( !(!( !( !(!(
!( !(!(
!( !(!( !(!( !(!(
!(!(!(!(!(!( !( !(!(
!( !(!( !( !(!(
!(
!( !(
!(
!(!(
!(
!(
!(!(
!(
!(!(
!(
!(
!(
!(
!(
!(
!(
!(
CR
YS
TAL C
OV
E C
OU
RT
SOU
TH 4
6TH
ST
REE
T
SO
SOU
TH 4
6TH
STR
EET
ROBIN DRIVE
EGR
ET
WAY
EG
RE
T W
AY
EAST MONTGOMERY AVENUE
REGATTA BOULEVARD
CARL
80
MEADE STREET
M
SO
UT
ROBIN DRIVE
ERLA
NDS
ON
STR
ST
AR
L IN
G W
AY
OW
L W
AY
OW
L W
AY
OW
L W
AY
CROW DRIVE
OW
L W
AY
AVO
CE
T W
AY
HERON DRIVE
LARK DRIVE
WREN DRIVE
PLOVER DRIVE
EGR
ET
WAY
JAY
WA
Y
Area 1
Area 2Phase 1
Area 3
Area 2Phase 2
AreaM3
Area 4
Storm DrainExcavation
AreaM1a
RA5
RA3
RA1RA2
RA1RA2RA2
RA5
RA4
RA6
Forest ProductsLaboratory Wood
Treatment Lab Area Excavation
M3 Channels
GroutedLine
CCCT01CCCT02
CY03
CY11
RFSWTLRA010
UM04-FR3
UM28-FR1
UM33
UM38
UM39
400280
B
472420
300
421 473
484
445
478
486480
450
102
163110
185
178
112
113
128
116125 11411812
1
197
149
201 EPALab
150
175
198
153 177276
275
151
154158159
160 161196
194
277
38
190164
167
180
454
453
452
451
280
A
400
482
AsphaltPad C
AsphaltPad B
ConcretePad
Cobalt in Soil
!( Greater than 26 mg/kg
!( Less than 26 mg/kg
Known Pyrite Cinders Area
Suspect Pyrite Cinders (PresenceNot Verified)
Phase 3 Marsh Channel Widening
Remediated Area (RA)
Approximate Site Boundary
Roads and Other LandscapeFeatures
Former Seawall (Approximate)
Slurry Wall
¨ ¨ ¨ ¨Biologically Active Permeable BarrierWall
Marsh Boundary
Surface Water
Storm Drain Lines:
Open Swale
Underground Culvert
Underground Culvert, Abandoned(Grouted at Manholes)
Sanitary Sewer Lines:
Existing Sewer Line
Removed Sewer Line
Abandoned Sewer Line
250 0 250
Feet
Richmond Field Station SiteBerkeley Global Campus at Richmond Bay
Ambient Metals Evaluation Technical Memorandum2015-11-03 V:\Misc_GIS\Richmond_Field_Station\Projects\008_Metals_Evaluation\Cobalt.mxd TtEMI-AL simon.cardinale
Note:mg/kg Milligrams per kilogram
FIGURE A-1 COBALT DATA SET
EVALUATION

¨¨¨¨¨¨¨¨¨¨¨¨¨¨¨¨¨
¨¨¨¨¨¨¨¨
¨¨¨¨
¨¨¨¨ ¨ ¨ ¨¨
!(!(!(!(!(!(
!(!(
!(!(
!(!(!(!(
!(!(!(!(!(!(!(
!(!(!(!(!(!(!(!(!(
!(!(!(
!(!(!(!(
!(!(!(!(!(!(!(!(!(!(!(!(!(!(!(!(!(!(!(
!(!(
!(!(!(
!(!(!(
!(!(!(!(!(!(
!(!(!(!(!(!(!(!(
!(!(!(!(!(!(!(!(!(!(
!(!(!(!(!( !(!(
!(
!(!( !(!(
!(!( !(
!( !(!(!(!(!(
!(!( !( !(!( !(
!( !(!( !( !(!(
!( !(!( !(
!(!( !( !( !(!(!(
!( !(!( !( !(!(
!( !(!(
!( !(!( !(!( !(!(
!(!(!(!(!( !(!(
!(!( !( !(!(
!(
!(
!(
!(!(
!(!(
!(
!(
!(!(
!(
!(
!(
!(
!( !( !(
!(
!(
!(
!(
!(
!(
!(
!(
!(
CR
YS
TAL C
OV
E C
OU
RT
SOU
TH 4
6TH
ST
REE
T
SO
SOU
TH 4
6TH
STR
EET
ROBIN DRIVE
EGR
ET
WAY
EG
RE
T W
AY
EAST MONTGOMERY AVENUE
REGATTA BOULEVARD
CARL
80
MEADE STREET
M
SO
UT
ROBIN DRIVE
ERLA
NDS
ON
STR
ST
AR
L IN
G W
AY
OW
L W
AY
OW
L W
AY
OW
L W
AY
CROW DRIVE
OW
L W
AY
AVO
CE
T W
AY
HERON DRIVE
LARK DRIVE
WREN DRIVE
PLOVER DRIVE
EGR
ET
WAY
JAY
WA
Y
Area 1
Area 2Phase 1
Area 3
Area 2Phase 2
AreaM3
Area 4
Storm DrainExcavation
AreaM1a
RA5
RA3
RA1RA2
RA1RA2RA2
RA5
RA4
RA6
Forest ProductsLaboratory Wood
Treatment Lab Area Excavation
M3 Channels
GroutedLine
CCCT01
CCCT02
CY03
CY07 CY09
CY10
CY11
DH02
DH04
RFSWTLRA010
SM03
UM04-FR3
UM18
UM28-FR1
UM30-FR3
UM31UM33
UM34UM38
UM39
400280
B
472420
300
421 473
484
445
478
486480
450
102
163110
185
178
112
113
128
116125 11411812
1
197
149
201 EPALab
150
175
198
153 177276
275
151
154158159
160 161196
194
277
38
190164
167
180
454
453
452
451
280
A
400
482
AsphaltPad C
AsphaltPad B
ConcretePad
Manganese in Soil
!( Greater than 2,000 mg/kg
!( Greater than 1,000 mg/kg
!( Less than 1,000 mg/kg
Known Pyrite Cinders Area
Suspect Pyrite Cinders (PresenceNot Verified)
Phase 3 Marsh Channel Widening
Remediated Area (RA)
Approximate Site Boundary
Roads and Other LandscapeFeatures
Former Seawall (Approximate)
Slurry Wall
¨ ¨ ¨ ¨Biologically Active Permeable BarrierWall
Marsh Boundary
Surface Water
Storm Drain Lines:
Open Swale
Underground Culvert
Underground Culvert, Abandoned(Grouted at Manholes)
Sanitary Sewer Lines:
Existing Sewer Line
Removed Sewer Line
Abandoned Sewer Line
250 0 250
Feet
Richmond Field Station SiteBerkeley Global Campus at Richmond Bay
Ambient Metals Evaluation Technical Memorandum2015-11-12 V:\Misc_GIS\Richmond_Field_Station\Projects\008_Metals_Evaluation\Manganese.mxd TtEMI-AL simon.cardinale
Note:mg/kg Milligrams per kilogram
FIGURE A-2 MANGANESE DATA SET
EVALUATION

¨¨¨¨¨¨¨¨¨¨¨¨¨¨¨¨¨
¨¨¨¨¨¨¨¨
¨¨¨¨
¨¨¨¨ ¨ ¨ ¨¨
!(!(
!(!(
!( !(!( !(
!(
!(!(
!(
!(!(
!(!(!(
!(!(
!(
!(
!(
!(
!(
!(
!(
!(
!(
!(
!(!(!(!(!(!(!(!(!(!(!(!(
!(!(!(!(!(!(!(!(!(!(!(!(
!(!(!(!(!(!(
!(!(
!(!(
!(!(!(!(
!(
!(!(
!(!(
!(!(
!(!(
!(!(!(!(
!(!(!(!(!(!(
!(
!(!(
!(!(
!(!(!(!(!(!(!(!(!(
!(
!(!(
!(!(!(!(!(!(!(!(
!(!(!(!(
!(!(!(!(
!(!(!(!(!(!(!(!(!(!(!(!(!(!(!(!(!(!(!(
!(!(!(
!(!(!(!(!(!(
!(!(!(
!(!(!(!(!(!(!(!(
!(!(!(!(!(!(
!(!(!(!(
!(!(
!(!(
!(!(!(!(!(
!(!(
!(!(
!(!(!(!(!(!(
!(!(
!(!(
!(!(
!(!(
!(!(
!(!(!(
!(!(
!(
!(!(
!(!(!(!(!(!(!(
!( !(
!(
!(!(!(!(
!(!(!(!(
!(!(!(!(!(!(!(!(
!(!(!(!(!(!(!(!(!(!(
!(!(!(!(!(!(!(!(!(
!(!(!(
!(!(!(!(!(!(
!(!(!(!(!(!(
!(!(!(!(!(!(
!(!(
!(!( !(!(!(!(!(!(
!(!(!(
!(!(
!(!(!(!(
!(!(!(!(!(!(!(
!(!(!(!(!(
!(!(!(
!(!(!(!(!(
!(!( !(!(!(!(
!(!(!(!(!(!(!(
!(!(!(
!(!(!(
!(!(!(
!(!(!(
!(!(!(!(!(!(
!(!(!(
!(!(!(!(
!(!(
!(!(!(
!(!(!(
!(!(!(
!(!(!(
!(!(!(
!(!(
!(!(!(
!(
!(
!(!(!(
!(!(
!(
!(
!(!(!(!(!(!(!(!(
!(!(!(!(!(!(!(!(!(!(!(!(!(
!(!(!(
!(!(!(
!(!(!(
!(!(!(
!(
!(!(
!(
!(!(
!(!(!(!(!(
!(!(!(
!(!(
!(!(!(
!(!(!(!(
!(!(
!(!( !(!(!(!(!(
!(!( !(!(!(!(!(!(!(!(
!(!(!(!(
!(!(
!(!(!(
!(!(
!(!(!(!(!( !(!(
!(!(
!(!( !(!(
!(!(
!(
!(
!(!(!(
!(!(!(
!(!(!(!(
!(!(
!(!(
!(!(
!(!(!(!(
!(!(
!(!(!(
!(!(
!(!(
!(
!(
!(!( !(!(!(
!(!(!(
!(!(
!(!(!(
!(!(!(
!(!(!(!(!(
!(!(
!(!(
!(!(
!(!(!(!(
!(!(
!(!(!(!(!(
!(!( !(
!( !(!(!(!(!(!(
!(!( !( !(!( !(
!( !(!( !( !(!(
!( !(!( !(
!(!( !( !(!( !(!(
!( !(!( !( !(!(
!( !(!(
!( !(!( !(!(!( !(!(
!(!(!(!(!(!( !( !(!( !(
!( !(!( !( !(!(
!(!(
!( !(
!(
!(!(
!(
!(
!(!(
!(
!(
!(
!(
!(
!(
!(
!(
!( !(
!(
!(
CR
YS
TAL C
OV
E C
OU
RT
SOU
TH 4
6TH
ST
REE
T
SO
SOU
TH 4
6TH
STR
EET
ROBIN DRIVE
EGR
ET
WAY
EG
RE
T W
AY
EAST MONTGOMERY AVENUE
REGATTA BOULEVARD
CARL
80
MEADE STREET
M
SO
UT
ROBIN DRIVE
ERLA
NDS
ON
STR
ST
AR
L IN
G W
AY
OW
L W
AY
OW
L W
AY
OW
L W
AY
CROW DRIVE
OW
L W
AY
AVO
CE
T W
AY
HERON DRIVE
LARK DRIVE
WREN DRIVE
PLOVER DRIVE
EGR
ET
WAY
JAY
WA
Y
Area 1
Area 2Phase 1
Area 3
Area 2Phase 2
AreaM3
Area 4
Storm DrainExcavation
AreaM1a
RA5
RA3
RA1RA2
RA1RA2RA2
RA5
RA4
RA6
Forest ProductsLaboratory Wood
Treatment Lab Area Excavation
M3 Channels
GroutedLine
2AU-16
CY02CY07
FP106
MF102
SH2-1
SH2-10
SH2-11
TP2-5
UM19-FR1
UM39
400280
B
472420
300
421 473
484
445
478
486480
450
102
163110
185
178
112
113
128
116125 11411812
1
197
149
201 EPALab
150
175
198
153 177276
275
151
154158159
160 161196
194
277
38
190164
167
180
454
453
452
451
280
A
400
482
AsphaltPad C
AsphaltPad B
ConcretePad
Nickel in Soil
!( Greater than 120 mg/kg
!( Less than 120 mg/kg
Known Pyrite Cinders Area
Suspect Pyrite Cinders (PresenceNot Verified)
Phase 3 Marsh Channel Widening
Remediated Area (RA)
Approximate Site Boundary
Roads and Other LandscapeFeatures
Former Seawall (Approximate)
Slurry Wall
¨ ¨ ¨ ¨Biologically Active Permeable BarrierWall
Marsh Boundary
Surface Water
Storm Drain Lines:
Open Swale
Underground Culvert
Underground Culvert, Abandoned(Grouted at Manholes)
Sanitary Sewer Lines:
Existing Sewer Line
Removed Sewer Line
Abandoned Sewer Line
250 0 250
Feet
Richmond Field Station SiteBerkeley Global Campus at Richmond Bay
Ambient Metals Evaluation Technical Memorandum2015-11-03 V:\Misc_GIS\Richmond_Field_Station\Projects\008_Metals_Evaluation\Nickel.mxd TtEMI-AL simon.cardinale
Note:mg/kg Milligrams per kilogram
FIGURE A-3 NICKEL DATA SET
EVALUATION

Appendix A, Ambient Metals Technical Memorandum December 11, 2015 UC Berkeley, Richmond Field Station Site
Aluminum
The lognormal Q-Q plot generally appear consistent a lognormal distribution. The Q-Q plot data at the top deflect downward instead of upward, as compared to the cumulative probability plot. This likely indicates that the distribution is closer to a normal distribution than a lognormal one, so the non-transformed concentrations were also plotted.

Appendix A, Ambient Metals Technical Memorandum December 11, 2015 UC Berkeley, Richmond Field Station Site

Appendix A, Ambient Metals Technical Memorandum December 11, 2015 UC Berkeley, Richmond Field Station Site
Cobalt
The distribution appears consistent with a lognormal distribution over most of the range, with an apparent break above 26 mg/kg.

Appendix A, Ambient Metals Technical Memorandum December 11, 2015 UC Berkeley, Richmond Field Station Site
Manganese
The distribution appears consistent with a lognormal distribution, with a slight break at about 2,000 mg/kg. There may also be a very slight break at around 1,000 mg/kg.

Appendix A, Ambient Metals Technical Memorandum December 11, 2015 UC Berkeley, Richmond Field Station Site
Nickel
The distribution looks similar to cobalt and consistent with a lognormal distribution, with a break at about 120 mg/kg.

Adjusted Level of Significance 0.0485 Adjusted Chi Square Value 4112
Theta hat (MLE) 1339 Theta star (bias corrected MLE) 1364
nu hat (MLE) 4342 nu star (bias corrected) 4264
MLE Mean (bias corrected) 17729 MLE Sd (bias corrected) 4917
Approximate Chi Square Value (0.05) 4114
95% Modified-t UCL (Johnson-1978) 18344
Gamma Statistics
k hat (MLE) 13.24 k star (bias corrected MLE) 13
5% K-S Critical Value 0.0728Detected data appear Gamma Distributed at 5% Significance Lev
Detected data appear Gamma Distributed at 5% Significance Level
0.0583 Lilliefors GOF Test
K-S Test Statistic 0.0707 Kolmogrov-Smirnoff Gamma GOF Test
Gamma GOF Test
A-D Test Statistic 0.72 Anderson-Darling Gamma GOF Test
Data appear Approximate Normal at 5% Significance Level
Assuming Normal Distribution
95% Normal UCL 95% UCLs (Adjusted for Skewness)
5% A-D Critical Value 0.751Detected data appear Gamma Distributed at 5% Significance Lev
95% Student's-t UCL 18343 95% Adjusted-CLT UCL (Chen-1995) 18344
Coefficient of Variation 0.268 Skewness 0.13
5% Lilliefors Critical Value 0.0692 Data appear Normal at 5% Significance Level
Maximum 29000 Median 18000
SD 4759 Std. Error of Mean 371.6
Normal GOF Test
Shapiro Wilk Test Statistic 0.968 Shapiro Wilk GOF Test
5% Shapiro Wilk P Value 0.0195 Data Not Normal at 5% Significance Level
Lilliefors Test Statistic
mber of Bootstrap Operations 2000
Al
General Statistics
Total Number of Observations 164 Number of Distinct Observations 65
Number of Missing Observations 0
Minimum 7800 Mean 17729
From File WorkSheet.xls
Full Precision OFF
Confidence Coefficient
UCL Statistics for Uncensored Full Data Sets
User Selected Options
Date/Time of Computation 7/30/2015 2:47:28 PM
95%
Appendix A, Ambient Metals Technical Memorandum UC Berkeley, Richmond Field Station Site Page 1 of 7

UCL Statistics for Uncensored Full Data Sets
Total Number of Observations 208 Number of Distinct Observations 96
Number of Missing Observations 0
Co
General Statistics
Note: Suggestions regarding the selection of a 95% UCL are provided to help the user to select the most appropriate 95% UCL.
These recommendations are based upon the results of the simulation studies summarized in Singh, Singh, and Iaci (2002)
and Singh and Singh (2003). However, simulations results will not cover all Real World data sets.
For additional insight the user may want to consult a statistician.
Suggested UCL to Use
95% Student's-t UCL 18343
95% BCA Bootstrap UCL 18374
90% Chebyshev(Mean, Sd) UCL 18843 95% Chebyshev(Mean, Sd) UCL 19348
97.5% Chebyshev(Mean, Sd) UCL 20049 99% Chebyshev(Mean, Sd) UCL 21426
95% Hall's Bootstrap UCL 18312 95% Percentile Bootstrap UCL 18314
95% Bootstrap-t UCL 18361
Nonparametric Distribution Free UCL Statistics
Data appear to follow a Discernible Distribution at 5% Significance Level
Nonparametric Distribution Free UCLs
95% CLT UCL 18340 95% Jackknife UCL 18343
95% Standard Bootstrap UCL 18331
95% Chebyshev (MVUE) UCL 19507 97.5% Chebyshev (MVUE) UCL 20263
99% Chebyshev (MVUE) UCL
Assuming Lognormal Distribution
95% H-UCL 18454 90% Chebyshev (MVUE) UCL 18962
21748
Maximum of Logged Data 10.28 SD of logged Data 0.284
Minimum of Logged Data 8.962 Mean of logged Data 9.745
Lognormal Statistics
5% Shapiro Wilk P Value 9.5302E-4 Data Not Lognormal at 5% Significance Level
Lilliefors Test Statistic 0.0869 Lilliefors Lognormal GOF Test
Assuming Gamma Distribution
95% Approximate Gamma UCL (use when n>=50)) 18378 95% Adjusted Gamma UCL (use when n<50) 18384
5% Lilliefors Critical Value 0.0692 Data Not Lognormal at 5% Significance Level
Data Not Lognormal at 5% Significance Level
Lognormal GOF Test
Shapiro Wilk Test Statistic 0.959 Shapiro Wilk Lognormal GOF Test
Appendix A, Ambient Metals Technical Memorandum UC Berkeley, Richmond Field Station Site Page 2 of 7

UCL Statistics for Uncensored Full Data Sets
Maximum of Logged Data 4.29 SD of logged Data 0.48
Lognormal Statistics
Minimum of Logged Data 1.037 Mean of logged Data 2.487
5% Shapiro Wilk P Value 5.1546E-8 Data Not Lognormal at 5% Significance Level
Lilliefors Test Statistic 0.111 Lilliefors Lognormal GOF Test
95% Adjusted Gamma UCL (use when n<50) 14.56
5% Lilliefors Critical Value 0.0614 Data Not Lognormal at 5% Significance Level
Data Not Lognormal at 5% Significance Level
Shapiro Wilk Test Statistic 0.946 Shapiro Wilk Lognormal GOF Test
Assuming Gamma Distribution
95% Approximate Gamma UCL (use when n>=50)) 14.55
Adjusted Level of Significance 0.0488 Adjusted Chi Square Value 1526
nu hat (MLE) 1641 nu star (bias corrected) 1619
Approximate Chi Square Value (0.05) 1526
Lognormal GOF Test
3.945 k star (bias corrected MLE)
6.551 Anderson-Darling Gamma GOF Test
5% A-D Critical Value 0.757 Data Not Gamma Distributed at 5% Significance Level
MLE Mean (bias corrected) 13.72 MLE Sd (bias corrected) 6.956
Theta hat (MLE) 3.479 Theta star (bias corrected MLE) 3.527
3.891
95% Adjusted-CLT UCL (Chen-1995) 14.96
K-S Test Statistic 0.153 Kolmogrov-Smirnoff Gamma GOF Test
5% K-S Critical Value 0.063 Data Not Gamma Distributed at 5% Significance Level
Gamma GOF Test
A-D Test Statistic
95% Modified-t UCL (Johnson-1978) 14.81
Data Not Gamma Distributed at 5% Significance Level
Gamma Statistics
k hat (MLE)
95% Normal UCL 95% UCLs (Adjusted for Skewness)
95% Student's-t UCL 14.78
Data Not Normal at 5% Significance Level
5% Shapiro Wilk P Value 0 Data Not Normal at 5% Significance Level
Lilliefors Test Statistic 0.224 Lilliefors GOF Test
5% Lilliefors Critical Value 0.0614 Data Not Normal at 5% Significance Level
Normal GOF Test
Shapiro Wilk Test Statistic 0.647 Shapiro Wilk GOF Test
Assuming Normal Distribution
SD 9.247 Std. Error of Mean 0.641
Coefficient of Variation
Minimum 2.82 Mean 13.72
Maximum 73 Median 11.65
0.674 Skewness 3.805
Appendix A, Ambient Metals Technical Memorandum UC Berkeley, Richmond Field Station Site Page 3 of 7

UCL Statistics for Uncensored Full Data Sets
95% Normal UCL 95% UCLs (Adjusted for Skewness)
Assuming Normal Distribution
5% Lilliefors Critical Value 0.0634 Data Not Normal at 5% Significance Level
Data Not Normal at 5% Significance Level
5% Shapiro Wilk P Value 0 Data Not Normal at 5% Significance Level
Lilliefors Test Statistic 0.241 Lilliefors GOF Test
Minimum 89 Mean 742
Maximum 5900
Normal GOF Test
Shapiro Wilk Test Statistic 0.605 Shapiro Wilk GOF Test
SD 686.9 Std. Error of Mean 49.19
Median 620
Coefficient of Variation 0.926 Skewness 4.387
Note: Suggestions regarding the selection of a 95% UCL are provided to help the user to select the most appropriate 95% UCL.
These recommendations are based upon the results of the simulation studies summarized in Singh, Singh, and Iaci (2002)
and Singh and Singh (2003). However, simulations results will not cover all Real World data sets.
For additional insight the user may want to consult a statistician.
Mn
General Statistics
Total Number of Observations 195 Number of Distinct Observations 124
Number of Missing Observations 0
Suggested UCL to Use
95% Student's-t UCL 14.78 or 95% Modified-t UCL
95% Hall's Bootstrap UCL 15.03 95% Percentile Bootstrap UCL 14.85
95% BCA Bootstrap UCL 15.03
90% Chebyshev(Mean, Sd) UCL 15.64 95% Chebyshev(Mean, Sd) UCL 16.52
97.5% Chebyshev(Mean, Sd) UCL 17.73 99% Chebyshev(Mean, Sd) UCL 20.1
14.81
95% Standard Bootstrap UCL 14.74 95% Bootstrap-t UCL 15.06
Nonparametric Distribution Free UCL Statistics
Data do not follow a Discernible Distribution (0.05)
Nonparametric Distribution Free UCLs
Assuming Lognormal Distribution
95% H-UCL 14.33 90% Chebyshev (MVUE) UCL 14.9
95% CLT UCL 14.78 95% Jackknife UCL 14.78
95% Chebyshev (MVUE) UCL 15.55 97.5% Chebyshev (MVUE) UCL 16.44
99% Chebyshev (MVUE) UCL 18.19
Appendix A, Ambient Metals Technical Memorandum UC Berkeley, Richmond Field Station Site Page 4 of 7

UCL Statistics for Uncensored Full Data Sets
95% BCA Bootstrap UCL 850.5
95% Hall's Bootstrap UCL 863.8 95% Percentile Bootstrap UCL 828
95% Bootstrap-t UCL 847.8
Nonparametric Distribution Free UCL Statistics
Data do not follow a Discernible Distribution (0.05)
Nonparametric Distribution Free UCLs
95% CLT UCL 822.9 95% Jackknife UCL 823.3
95% Standard Bootstrap UCL 823
95% Chebyshev (MVUE) UCL 884.9 97.5% Chebyshev (MVUE) UCL 953.9
99% Chebyshev (MVUE) UCL
Assuming Lognormal Distribution
95% H-UCL 793.1 90% Chebyshev (MVUE) UCL 835.2
1089
Maximum of Logged Data 8.683 SD of logged Data 0.644
Minimum of Logged Data 4.489 Mean of logged Data 6.381
Lognormal Statistics
5% Shapiro Wilk P Value 0.00411 Data Not Lognormal at 5% Significance Level
Lilliefors Test Statistic 0.0882 Lilliefors Lognormal GOF Test
Assuming Gamma Distribution
95% Approximate Gamma UCL (use when n>=50)) 803.2 95% Adjusted Gamma UCL (use when n<50) 803.7
5% Lilliefors Critical Value 0.0634 Data Not Lognormal at 5% Significance Level
Data Not Lognormal at 5% Significance Level
Lognormal GOF Test
Shapiro Wilk Test Statistic 0.966 Shapiro Wilk Lognormal GOF Test
Adjusted Level of Significance 0.0488 Adjusted Chi Square Value 831.7
Theta hat (MLE) 316.8 Theta star (bias corrected MLE) 321.2
nu hat (MLE) 913.6 nu star (bias corrected) 900.8
MLE Mean (bias corrected) 742 MLE Sd (bias corrected) 488.2
Approximate Chi Square Value (0.05) 832.2
k hat (MLE) 2.342 k star (bias corrected MLE) 2.31
K-S Test Statistic 0.135 Kolmogrov-Smirnoff Gamma GOF Test
5% K-S Critical Value 0.0656 Data Not Gamma Distributed at 5% Significance Level
95% Modified-t UCL (Johnson-1978) 825.9
Data Not Gamma Distributed at 5% Significance Level
Gamma Statistics
Gamma GOF Test
A-D Test Statistic 4.585 Anderson-Darling Gamma GOF Test
5% A-D Critical Value 0.764 Data Not Gamma Distributed at 5% Significance Level
95% Student's-t UCL 823.3 95% Adjusted-CLT UCL (Chen-1995) 839.4
Appendix A, Ambient Metals Technical Memorandum UC Berkeley, Richmond Field Station Site Page 5 of 7

UCL Statistics for Uncensored Full Data Sets
nu hat (MLE) 5337 nu star (bias corrected) 5314
4.043 k star (bias corrected MLE)
9.887 Anderson-Darling Gamma GOF Test
5% A-D Critical Value 0.759 Data Not Gamma Distributed at 5% Significance Level
Theta hat (MLE) 11.36 Theta star (bias corrected MLE) 11.41
4.026
95% Adjusted-CLT UCL (Chen-1995) 47.92
K-S Test Statistic 0.0934 Kolmogrov-Smirnoff Gamma GOF Test
5% K-S Critical Value 0.0369 Data Not Gamma Distributed at 5% Significance Level
Gamma GOF Test
A-D Test Statistic
95% Modified-t UCL (Johnson-1978) 47.79
Data Not Gamma Distributed at 5% Significance Level
Gamma Statistics
k hat (MLE)
95% Normal UCL 95% UCLs (Adjusted for Skewness)
95% Student's-t UCL 47.77
Data Not Normal at 5% Significance Level
5% Shapiro Wilk P Value 0 Data Not Normal at 5% Significance Level
Lilliefors Test Statistic 0.164 Lilliefors GOF Test
5% Lilliefors Critical Value 0.0345 Data Not Normal at 5% Significance Level
Normal GOF Test
Shapiro Wilk Test Statistic 0.736 Shapiro Wilk GOF Test
Assuming Normal Distribution
SD 28.43 Std. Error of Mean 1.107
Coefficient of Variation
Total Number of Observations 660 Number of Distinct Observations 145
Number of Missing Observations 0
Minimum 5.9 Mean 45.94
Maximum 280 Median 39
0.619 Skewness 3.347
Ni
General Statistics
Note: Suggestions regarding the selection of a 95% UCL are provided to help the user to select the most appropriate 95% UCL.
These recommendations are based upon the results of the simulation studies summarized in Singh, Singh, and Iaci (2002)
and Singh and Singh (2003). However, simulations results will not cover all Real World data sets.
For additional insight the user may want to consult a statistician.
Suggested UCL to Use
95% Chebyshev (Mean, Sd) UCL 956.4
90% Chebyshev(Mean, Sd) UCL 889.6 95% Chebyshev(Mean, Sd) UCL 956.4
97.5% Chebyshev(Mean, Sd) UCL 1049 99% Chebyshev(Mean, Sd) UCL 1231
Appendix A, Ambient Metals Technical Memorandum UC Berkeley, Richmond Field Station Site Page 6 of 7

UCL Statistics for Uncensored Full Data Sets
50.77
Suggested UCL to Use
95% Student's-t UCL 47.77 or 95% Modified-t UCL 47.79
Note: Suggestions regarding the selection of a 95% UCL are provided to help the user to select the most appropriate 95% UCL.
These recommendations are based upon the results of the simulation studies summarized in Singh, Singh, and Iaci (2002)
and Singh and Singh (2003). However, simulations results will not cover all Real World data sets.
For additional insight the user may want to consult a statistician.
97.5% Chebyshev(Mean, Sd) UCL 52.85 99% Chebyshev(Mean, Sd) UCL 56.96
95% Standard Bootstrap UCL 47.71 95% Bootstrap-t UCL 47.9
Nonparametric Distribution Free UCL Statistics
Data do not follow a Discernible Distribution (0.05)
Nonparametric Distribution Free UCLs
95% Hall's Bootstrap UCL 47.94 95% Percentile Bootstrap UCL 47.72
95% BCA Bootstrap UCL 47.95
90% Chebyshev(Mean, Sd) UCL 49.26 95% Chebyshev(Mean, Sd) UCL
Assuming Lognormal Distribution
95% H-UCL 47 90% Chebyshev (MVUE) UCL 48.17
95% CLT UCL 47.76 95% Jackknife UCL 47.77
95% Chebyshev (MVUE) UCL 49.4 97.5% Chebyshev (MVUE) UCL 51.11
99% Chebyshev (MVUE) UCL 54.48
Maximum of Logged Data 5.635 SD of logged Data 0.486
Lognormal Statistics
Minimum of Logged Data 1.775 Mean of logged Data 3.699
5% Shapiro Wilk P Value 0.0019 Data Not Lognormal at 5% Significance Level
Lilliefors Test Statistic 0.0574 Lilliefors Lognormal GOF Test
95% Adjusted Gamma UCL (use when n<50) 47.45
5% Lilliefors Critical Value 0.0345 Data Not Lognormal at 5% Significance Level
Data Not Lognormal at 5% Significance Level
Shapiro Wilk Test Statistic 0.977 Shapiro Wilk Lognormal GOF Test
Assuming Gamma Distribution
95% Approximate Gamma UCL (use when n>=50)) 47.45
Adjusted Level of Significance 0.0496 Adjusted Chi Square Value 5145
Approximate Chi Square Value (0.05) 5146
Lognormal GOF Test
MLE Mean (bias corrected) 45.94 MLE Sd (bias corrected) 22.9
Appendix A, Ambient Metals Technical Memorandum UC Berkeley, Richmond Field Station Site Page 7 of 7
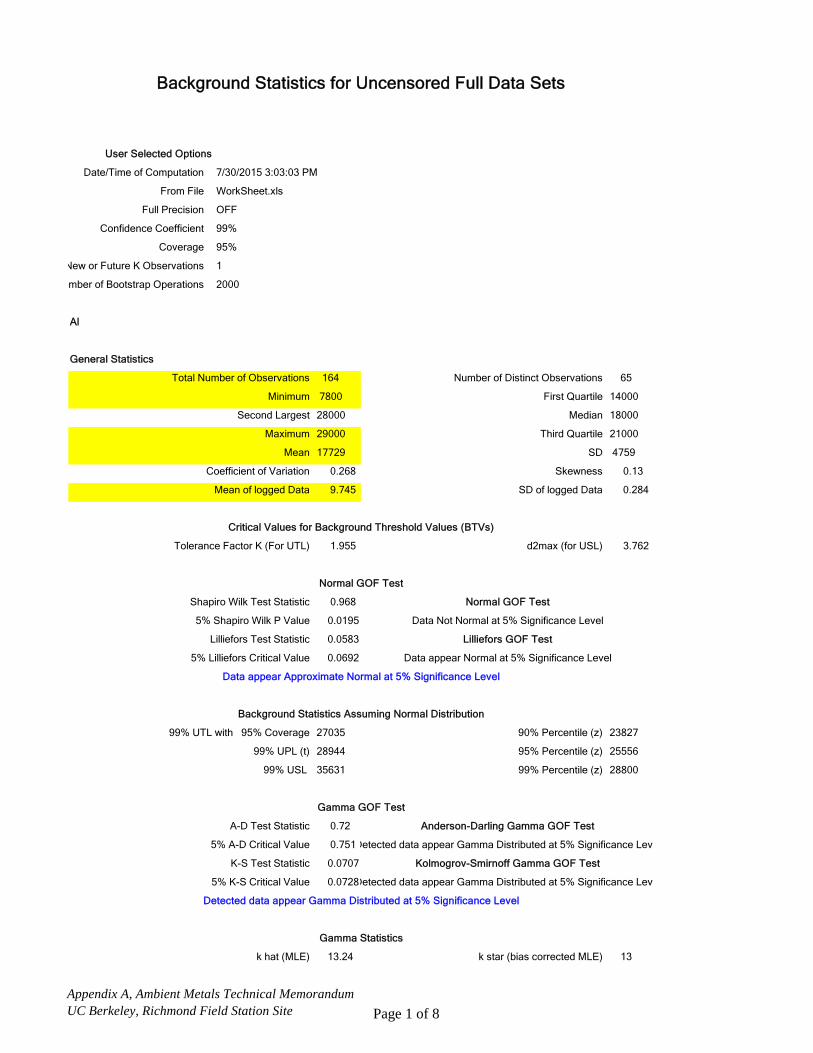
Background Statistics for Uncensored Full Data Sets
Coverage 95%
New or Future K Observations 1
Minimum 7800 First Quartile 14000
User Selected Options
Date/Time of Computation 7/30/2015 3:03:03 PM
Number of Distinct Observations 65
mber of Bootstrap Operations 2000
From File WorkSheet.xls
Full Precision OFF
Confidence Coefficient 99%
Second Largest 28000 Median 18000
Al
General Statistics
Total Number of Observations 164
Maximum 29000 Third Quartile 21000
Mean 17729 SD 4759
Coefficient of Variation 0.268 Skewness 0.13
Normal GOF Test
Shapiro Wilk Test Statistic 0.968 Normal GOF Test
5% Lilliefors Critical Value 0.0692 Data appear Normal at 5% Significance Level
Mean of logged Data 9.745 SD of logged Data 0.284
Critical Values for Background Threshold Values (BTVs)
Tolerance Factor K (For UTL) 1.955 d2max (for USL) 3.762
Data appear Approximate Normal at 5% Significance Level
5% Shapiro Wilk P Value 0.0195 Data Not Normal at 5% Significance Level
Lilliefors Test Statistic 0.0583
35631 99% Percentile (z) 28800
Background Statistics Assuming Normal Distribution
99% UTL with 95% Coverage 27035 90% Percentile (z) 23827
Lilliefors GOF Test
Gamma GOF Test
A-D Test Statistic 0.72 Anderson-Darling Gamma GOF Test
99% UPL (t) 28944 95% Percentile (z) 25556
99% USL
5% A-D Critical Value 0.751Detected data appear Gamma Distributed at 5% Significance Leve
K-S Test Statistic 0.0707 Kolmogrov-Smirnoff Gamma GOF Test
Gamma Statistics
k hat (MLE) 13.24 k star (bias corrected MLE) 13
5% K-S Critical Value 0.0728Detected data appear Gamma Distributed at 5% Significance Leve
Detected data appear Gamma Distributed at 5% Significance Level
Appendix A, Ambient Metals Technical Memorandum UC Berkeley, Richmond Field Station Site Page 1 of 8

Background Statistics for Uncensored Full Data Sets
Theta hat (MLE) 1339 Theta star (bias corrected MLE) 1364
nu hat (MLE) 4342 nu star (bias corrected) 4264
Background Statistics Assuming Gamma Distribution
99% Wilson Hilferty (WH) Approx. Gamma UPL 31272 90% Percentile 24249
MLE Mean (bias corrected) 17729 MLE Sd (bias corrected) 4917
99% Hawkins Wixley (HW) Approx. Gamma UPL 31701 95% Percentile 26514
99% WH Approx. Gamma UTL with 95% Coverage 28496 99% Percentile 31121
99% HW Approx. Gamma UTL with 95% Coverage 28759
5% Shapiro Wilk P Value 9.5302E-4 Data Not Lognormal at 5% Significance Level
Lilliefors Test Statistic 0.0869
99% WH USL 42411 99% HW USL 43818
Lilliefors Lognormal GOF Test
Lognormal GOF Test
Shapiro Wilk Test Statistic 0.959 Shapiro Wilk Lognormal GOF Test
Background Statistics assuming Lognormal Distribution
99% UTL with 95% Coverage 29714 90% Percentile (z) 24544
5% Lilliefors Critical Value 0.0692 Data Not Lognormal at 5% Significance Level
Data Not Lognormal at 5% Significance Level
Nonparametric Distribution Free Background Statistics
Data appear Approximate Normal at 5% Significance Level
Nonparametric Upper Limits for Background Threshold Values
99% UPL (t) 33295 95% Percentile (z) 27208
99% USL 49602 99% Percentile (z) 33011
Order of Statistic, r 161 99% UTL with 95% Coverage 27000
Approximate f 2.118 Confidence Coefficient (CC) achieved by UTL 0.966
99% Percentile Bootstrap UTL with 95% Coverage 27000 99% BCA Bootstrap UTL with 95% Coverage 27000
99% UPL 28350 90% Percentile 24140
90% Chebyshev UPL 32049 95% Percentile 26000
95% Chebyshev UPL 38536 99% Percentile 27559
data set free of outliers and consists of observations collected from clean unimpacted locations.
The use of USL tends to provide a balance between false positives and false negatives provided the data
represents a background data set and when many onsite observations need to be compared with the BTV.
99% USL 29000
Note: The use of USL to estimate a BTV is recommended only when the data set represents a background
Appendix A, Ambient Metals Technical Memorandum UC Berkeley, Richmond Field Station Site Page 2 of 8

Background Statistics for Uncensored Full Data Sets
Co
General Statistics
Total Number of Observations 208 Number of Distinct Observations 96
Minimum 2.82 First Quartile 9.368
Second Largest 70.6 Median 11.65
Maximum 73 Third Quartile 15
Mean 13.72 SD 9.247
Coefficient of Variation 0.674 Skewness 3.805
Mean of logged Data 2.487 SD of logged Data 0.48
5% Shapiro Wilk P Value 0 Data Not Normal at 5% Significance Level
Lilliefors Test Statistic 0.224
Critical Values for Background Threshold Values (BTVs)
Tolerance Factor K (For UTL) 1.917 d2max (for USL) 3.834
Lilliefors GOF Test
Normal GOF Test
Shapiro Wilk Test Statistic 0.647 Normal GOF Test
Background Statistics Assuming Normal Distribution
99% UTL with 95% Coverage 31.45 90% Percentile (z) 25.57
5% Lilliefors Critical Value 0.0614 Data Not Normal at 5% Significance Level
Data Not Normal at 5% Significance Level
Gamma GOF Test
A-D Test Statistic 6.551 Anderson-Darling Gamma GOF Test
99% UPL (t) 35.45 95% Percentile (z) 28.93
99% USL 49.17 99% Percentile (z) 35.23
5% A-D Critical Value 0.757 Data Not Gamma Distributed at 5% Significance Level
K-S Test Statistic 0.153 Kolmogrov-Smirnoff Gamma GOF Test
Gamma Statistics
k hat (MLE) 3.945 k star (bias corrected MLE) 3.891
5% K-S Critical Value 0.063 Data Not Gamma Distributed at 5% Significance Level
Data Not Gamma Distributed at 5% Significance Level
Theta hat (MLE) 3.479 Theta star (bias corrected MLE) 3.527
nu hat (MLE) 1641 nu star (bias corrected) 1619
Background Statistics Assuming Gamma Distribution
99% Wilson Hilferty (WH) Approx. Gamma UPL 34.66 90% Percentile 23.05
MLE Mean (bias corrected) 13.72 MLE Sd (bias corrected) 6.956
99% Hawkins Wixley (HW) Approx. Gamma UPL 35.01 95% Percentile 26.79
99% WH Approx. Gamma UTL with 95% Coverage 29.43 99% Percentile 34.81
99% HW Approx. Gamma UTL with 95% Coverage 29.47
99% WH USL 57.21 99% HW USL 60.05
Appendix A, Ambient Metals Technical Memorandum UC Berkeley, Richmond Field Station Site Page 3 of 8

Background Statistics for Uncensored Full Data Sets
5% Shapiro Wilk P Value 5.1546E-8 Data Not Lognormal at 5% Significance Level
Lilliefors Test Statistic 0.111 Lilliefors Lognormal GOF Test
Lognormal GOF Test
Shapiro Wilk Test Statistic 0.946 Shapiro Wilk Lognormal GOF Test
Background Statistics assuming Lognormal Distribution
99% UTL with 95% Coverage 30.19 90% Percentile (z) 22.25
5% Lilliefors Critical Value 0.0614 Data Not Lognormal at 5% Significance Level
Data Not Lognormal at 5% Significance Level
Nonparametric Distribution Free Background Statistics
Data do not follow a Discernible Distribution (0.05)
Nonparametric Upper Limits for Background Threshold Values
99% UPL (t) 37.17 95% Percentile (z) 26.49
99% USL 75.78 99% Percentile (z) 36.74
Order of Statistic, r 204 99% UTL with 95% Coverage 40
Approximate f 2.147 Confidence Coefficient (CC) achieved by UTL 0.98
99% Percentile Bootstrap UTL with 95% Coverage 38.7 99% BCA Bootstrap UTL with 95% Coverage 39.55
99% UPL 69.92 90% Percentile 20
90% Chebyshev UPL 41.53 95% Percentile 29.25
95% Chebyshev UPL 54.13 99% Percentile 62.12
data set free of outliers and consists of observations collected from clean unimpacted locations.
The use of USL tends to provide a balance between false positives and false negatives provided the data
represents a background data set and when many onsite observations need to be compared with the BTV.
99% USL 73
Note: The use of USL to estimate a BTV is recommended only when the data set represents a background
Appendix A, Ambient Metals Technical Memorandum UC Berkeley, Richmond Field Station Site Page 4 of 8

Background Statistics for Uncensored Full Data Sets
Mn
General Statistics
Total Number of Observations 195 Number of Distinct Observations 124
Minimum 89 First Quartile 412.5
Second Largest 4690 Median 620
Maximum 5900 Third Quartile 790
Mean 742 SD 686.9
Coefficient of Variation 0.926 Skewness 4.387
Mean of logged Data 6.381 SD of logged Data 0.644
5% Shapiro Wilk P Value 0 Data Not Normal at 5% Significance Level
Lilliefors Test Statistic 0.241
Critical Values for Background Threshold Values (BTVs)
Tolerance Factor K (For UTL) 1.927 d2max (for USL) 3.815
Lilliefors GOF Test
Normal GOF Test
Shapiro Wilk Test Statistic 0.605 Normal GOF Test
Background Statistics Assuming Normal Distribution
99% UTL with 95% Coverage 2066 90% Percentile (z) 1622
5% Lilliefors Critical Value 0.0634 Data Not Normal at 5% Significance Level
Data Not Normal at 5% Significance Level
Gamma GOF Test
A-D Test Statistic 4.585 Anderson-Darling Gamma GOF Test
99% UPL (t) 2357 95% Percentile (z) 1872
99% USL 3362 99% Percentile (z) 2340
5% A-D Critical Value 0.764 Data Not Gamma Distributed at 5% Significance Level
K-S Test Statistic 0.135 Kolmogrov-Smirnoff Gamma GOF Test
Gamma Statistics
k hat (MLE) 2.342 k star (bias corrected MLE) 2.31
5% K-S Critical Value 0.0656 Data Not Gamma Distributed at 5% Significance Level
Data Not Gamma Distributed at 5% Significance Level
Theta hat (MLE) 316.8 Theta star (bias corrected MLE) 321.2
nu hat (MLE) 913.6 nu star (bias corrected) 900.8
Background Statistics Assuming Gamma Distribution
99% Wilson Hilferty (WH) Approx. Gamma UPL 2289 90% Percentile 1396
MLE Mean (bias corrected) 742 MLE Sd (bias corrected) 488.2
99% Hawkins Wixley (HW) Approx. Gamma UPL 2340 95% Percentile 1683
99% WH Approx. Gamma UTL with 95% Coverage 1884 99% Percentile 2314
99% HW Approx. Gamma UTL with 95% Coverage 1899
99% WH USL 4123 99% HW USL 4466
Appendix A, Ambient Metals Technical Memorandum UC Berkeley, Richmond Field Station Site Page 5 of 8

Background Statistics for Uncensored Full Data Sets
5% Shapiro Wilk P Value 0.00411 Data Not Lognormal at 5% Significance Level
Lilliefors Test Statistic 0.0882 Lilliefors Lognormal GOF Test
Lognormal GOF Test
Shapiro Wilk Test Statistic 0.966 Shapiro Wilk Lognormal GOF Test
Background Statistics assuming Lognormal Distribution
99% UTL with 95% Coverage 2041 90% Percentile (z) 1347
5% Lilliefors Critical Value 0.0634 Data Not Lognormal at 5% Significance Level
Data Not Lognormal at 5% Significance Level
Nonparametric Distribution Free Background Statistics
Data do not follow a Discernible Distribution (0.05)
Nonparametric Upper Limits for Background Threshold Values
99% UPL (t) 2683 95% Percentile (z) 1702
99% USL 6878 99% Percentile (z) 2639
Order of Statistic, r 191 99% UTL with 95% Coverage 2600
Approximate f 2.011 Confidence Coefficient (CC) achieved by UTL 0.969
99% Percentile Bootstrap UTL with 95% Coverage 2600 99% BCA Bootstrap UTL with 95% Coverage 2620
99% UPL 4738 90% Percentile 1160
90% Chebyshev UPL 2808 95% Percentile 1630
95% Chebyshev UPL 3744 99% Percentile 4352
data set free of outliers and consists of observations collected from clean unimpacted locations.
The use of USL tends to provide a balance between false positives and false negatives provided the data
represents a background data set and when many onsite observations need to be compared with the BTV.
99% USL 5900
Note: The use of USL to estimate a BTV is recommended only when the data set represents a background
Appendix A, Ambient Metals Technical Memorandum UC Berkeley, Richmond Field Station Site Page 6 of 8

Background Statistics for Uncensored Full Data Sets
Ni
General Statistics
Total Number of Observations 660 Number of Distinct Observations 145
Minimum 5.9 First Quartile 30
Second Largest 260 Median 39
Maximum 280 Third Quartile 52.7
Mean 45.94 SD 28.43
Coefficient of Variation 0.619 Skewness 3.347
Mean of logged Data 3.699 SD of logged Data 0.486
5% Shapiro Wilk P Value 0 Data Not Normal at 5% Significance Level
Lilliefors Test Statistic 0.164
Critical Values for Background Threshold Values (BTVs)
Tolerance Factor K (For UTL) 1.791 d2max (for USL) 4.145
Lilliefors GOF Test
Normal GOF Test
Shapiro Wilk Test Statistic 0.736 Normal GOF Test
Background Statistics Assuming Normal Distribution
99% UTL with 95% Coverage 96.87 90% Percentile (z) 82.38
5% Lilliefors Critical Value 0.0345 Data Not Normal at 5% Significance Level
Data Not Normal at 5% Significance Level
Gamma GOF Test
A-D Test Statistic 9.887 Anderson-Darling Gamma GOF Test
99% UPL (t) 112.3 95% Percentile (z) 92.71
99% USL 163.8 99% Percentile (z) 112.1
5% A-D Critical Value 0.759 Data Not Gamma Distributed at 5% Significance Level
K-S Test Statistic 0.0934 Kolmogrov-Smirnoff Gamma GOF Test
Gamma Statistics
k hat (MLE) 4.043 k star (bias corrected MLE) 4.026
5% K-S Critical Value 0.0369 Data Not Gamma Distributed at 5% Significance Level
Data Not Gamma Distributed at 5% Significance Level
Theta hat (MLE) 11.36 Theta star (bias corrected MLE) 11.41
nu hat (MLE) 5337 nu star (bias corrected) 5314
Background Statistics Assuming Gamma Distribution
99% Wilson Hilferty (WH) Approx. Gamma UPL 114.6 90% Percentile 76.63
MLE Mean (bias corrected) 45.94 MLE Sd (bias corrected) 22.9
99% Hawkins Wixley (HW) Approx. Gamma UPL 116.4 95% Percentile 88.91
99% WH Approx. Gamma UTL with 95% Coverage 93.35 99% Percentile 115.1
99% HW Approx. Gamma UTL with 95% Coverage 93.71
99% WH USL 208.3 99% HW USL 222.5
Appendix A, Ambient Metals Technical Memorandum UC Berkeley, Richmond Field Station Site Page 7 of 8

Background Statistics for Uncensored Full Data Sets
5% Shapiro Wilk P Value 0.0019 Data Not Lognormal at 5% Significance Level
Lilliefors Test Statistic 0.0574 Lilliefors Lognormal GOF Test
Lognormal GOF Test
Shapiro Wilk Test Statistic 0.977 Shapiro Wilk Lognormal GOF Test
Background Statistics assuming Lognormal Distribution
99% UTL with 95% Coverage 96.42 90% Percentile (z) 75.28
5% Lilliefors Critical Value 0.0345 Data Not Lognormal at 5% Significance Level
Data Not Lognormal at 5% Significance Level
Nonparametric Distribution Free Background Statistics
Data do not follow a Discernible Distribution (0.05)
Nonparametric Upper Limits for Background Threshold Values
99% UPL (t) 125.5 95% Percentile (z) 89.81
99% USL 302.6 99% Percentile (z) 125.1
Order of Statistic, r 639 99% UTL with 95% Coverage 110
Approximate f 1.529 Confidence Coefficient (CC) achieved by UTL 0.985
99% Percentile Bootstrap UTL with 95% Coverage 110 99% BCA Bootstrap UTL with 95% Coverage 110
99% UPL 173.5 90% Percentile 73
90% Chebyshev UPL 131.3 95% Percentile 98
95% Chebyshev UPL 170 99% Percentile 165.9
data set free of outliers and consists of observations collected from clean unimpacted locations.
The use of USL tends to provide a balance between false positives and false negatives provided the data
represents a background data set and when many onsite observations need to be compared with the BTV.
99% USL 280
Note: The use of USL to estimate a BTV is recommended only when the data set represents a background
Appendix A, Ambient Metals Technical Memorandum UC Berkeley, Richmond Field Station Site Page 8 of 8

Appendix BIdentification and Location of Contaminated and Presumed Uncontaminated Samples

¨¨¨¨¨¨¨¨¨¨¨¨¨¨¨¨¨
¨¨¨¨¨¨¨¨
¨¨¨¨
¨¨¨¨ ¨ ¨ ¨¨
")
") ")
")
")")
")
")
")
")")
")
")
")
")
")
")
")
")
")
")")
")
")")
")
")")")")
")")
")")")")
")")
")")")")
")")")")
")
")")
")")
")
")")")")
")
")")
")
")
")")")
")
")")")
")
")
")")
")")")
")
")")")
")
")")
")
")
")
")")
")
")
")
")
")
!(!(!(!( !(
!(
!(!(
!(!(!(!(!( !(!(
!(!(
!(!( !(!(
!(!( !(
!( !(!(!(!(!(!(
!(!( !( !(!( !(
!( !(!( !( !(!(
!( !(!( !(
!(!( !( !(!( !(!(!(
!( !(!( !( !(!(
!( !(!(
!( !(!( !(!(!( !(!(
!(!(!(!(!(!( !( !(!(
!( !(!( !(!(
!(!(
!(!(
!(!(
")
CR
YS
TAL C
OV
E C
OU
RT
SOU
TH 4
6TH
ST
REE
T
SO
SOU
TH 4
6TH
STR
EET
ROBIN DRIVE
EGR
ET
WAY
EG
RE
T W
AY
EAST MONTGOMERY AVENUE
REGATTA BOULEVARD
CARL
80
MEADE STREET
M
SO
UT
ROBIN DRIVE
ERLA
NDS
ON
STR
ST
AR
L IN
G W
AY
OW
L W
AY
OW
L W
AY
OW
L W
AY
CROW DRIVE
OW
L W
AY
AVO
CE
T W
AY
HERON DRIVE
LARK DRIVE
WREN DRIVE
PLOVER DRIVE
EGR
ET
WAY
JAY
WA
Y
Area 1
Area 2Phase 1
Area 3
Area 2Phase 2
AreaM3
Area 4
Storm DrainExcavation
AreaM1a
RA5
RA3
RA1RA2
RA1RA2RA2
RA5
RA4
RA6
Forest ProductsLaboratory Wood
Treatment Lab Area Excavation
M3 Channels
GroutedLine
400280
B
472420
300
421 473
484
445
478
486480
450
102
163110
185
178
112
113
128
116125 11411812
1
197
149
201 EPALab
150
175
198
153 177276
275
151
154158159
160 161196
194
277
38
190164
167
180
454
453
452
451
280
A
400
482
AsphaltPad C
AsphaltPad B
ConcretePad
") Set A: Known contamination
!(Set B: Native or ambient soils,contamination not suspected
Known Pyrite Cinders Area
Suspect Pyrite Cinders(Presence Not Verified)
Phase 3 Marsh ChannelWidening
Remediated Area (RA)
Approximate Site Boundary
Roads and Other LandscapeFeatures
Former Seawall (Approximate)
Slurry Wall
¨ ¨ ¨ ¨Biologically Active PermeableBarrier Wall
Marsh Boundary
Surface Water
Storm Drain Lines:
Open Swale
Underground Culvert
Underground Culvert,Abandoned (Grouted atManholes)
Sanitary Sewer Lines:
Existing Sewer Line
Removed Sewer Line
Abandoned Sewer Line
250 0 250
Feet
Richmond Field Station SiteBerkeley Global Campus at Richmond Bay
Ambient Metals Technical Memorandum2015-07-14 V:\Misc_GIS\Richmond_Field_Station\Projects\008_Metals_Evaluation\02_Metals_Eval.mxd TtEMI-AL simon.cardinale
FIGURE B-1METALS EVALUATION
SAMPLING LOCATIONS

Table B-1: List of Contaminated SamplesAmbient Metals Technical MemorandumUC Berkeley, Richmond Field Station Site
Point ID Sample ID Sample Date Sample TypeTop Depth (ft
bgs)Bottom Depth
(ft bgs)Aluminum
(mg/kg)Cobalt
(mg/kg)Manganese
(mg/kg)Nickel
(mg/kg)Arsenic (mg/kg)
BAP(EQ) (mg/kg)
Diesel Range
Organics (mg/kg)
Mercury (mg/kg)
Motor Oil Range
Organics (mg/kg)
Total Aroclor (mg/kg)
2AU-1 2AU-1-4 18-APR-02 ORIG 4 4 62 210 412AU-13 2AU-13-3.5 17-APR-02 ORIG 3.5 3.5 40 170 602AU-16 2AU-16-7 16-APR-02 ORIG 7 7 260 1002AU-18 2AU-18-9 16-APR-02 ORIG 9 9 83 942AU-23 2AU-23-4.8 09-JUL-02 ORIG 4.8 4.8 34 110 252AU-24 2AU-24-4.5 09-JUL-02 ORIG 4.5 4.5 19 38 352AU-25 2AU-25-4 09-JUL-02 ORIG 4 4 42 110 882AU-3 2AU-3-4 18-APR-02 ORIG 4 4 41 662AU-6 2AU-6-2.5 17-APR-02 ORIG 2.5 2.5 49 260 85A4-10 A4-10Z1 10-OCT-01 ORIG 4.5 4.5 36 67A4-12 A4-12Z1 10-OCT-01 ORIG 7.5 7.5 59 130 62A4-13 A4-13Z1 10-OCT-01 ORIG 7 7 65 150 27A4-14 A4-14Z1 12-OCT-01 ORIG 4.5 4.5 29 49A4-15 A4-15Z1 12-OCT-01 ORIG 4 4 56 57A4-16 A4-16Z1 12-OCT-01 ORIG 5.5 5.5 36 100 1000A4-17 A4-17Z1 10-OCT-01 ORIG 7 7 62 74A4-2 A4-2 21-SEP-01 ORIG 4 4 47 150 85A4-6 A4-6Z1 12-OCT-01 ORIG 5.5 5.5 34 64 57A4-7 A4-7Z1 12-OCT-01 ORIG 5.5 5.5 18 57 62A4-9 A4-9Z1 10-OCT-01 ORIG 4.5 4.5 27 140B-1 B-1 (ECI)Z1 01-AUG-98 ORIG 4.5 5 0 62B-1 B-1 (ECI)Z2 01-AUG-98 ORIG 8.5 9 11 160
B12803 B1280301 14-AUG-12 ORIG 0 0.5 13 720 29 77B12804 B1280401 14-AUG-12 ORIG 0 0.5 9.2 380 27 17 130B12804 B1280402 14-AUG-12 ORIG 1.5 2 8.5 480 25 48 85 1400B12805 B1280501 14-AUG-12 ORIG 0 0.5 12 580 27 26 110B12806 B1280601 14-AUG-12 ORIG 0 0.5 10 550 26 190B12806 B1280601-DUP 14-AUG-12 FIELDDUP 0 0.5 12 500 27 180B12806 B1280601-DUP2 14-AUG-12 FIELDDUP 0 0.5 12 520 31 220B12806 B1280602 14-AUG-12 ORIG 1.5 2 19 410 26 45
B-2 B-2 (ECI) 01-AUG-98 ORIG 0.5 1 20 35B-2 B-2 (ECI)Z2 01-AUG-98 ORIG 8 8.5 0 54B-4 B-4 (ECI)Z2 01-AUG-98 ORIG 8 8.5 0 110B-5 B-5 (ECI)Z1 01-AUG-98 ORIG 4 4.5 8.3 140B-5 B-5 (ECI)Z2 01-AUG-98 ORIG 8 8.5 23 120 32B-6 B-6 (ECI)Z2 01-AUG-98 ORIG 8.5 9 0 160 32B-8 B-8 (ECI)Z1 01-AUG-98 ORIG 4.5 5 25 160B-8 B-8 (ECI)Z2 01-AUG-98 ORIG 8.5 9 0 210
BLDG 102-3 BLDG 102-3 18-MAR-05 ORIG 0 0.5 44 280BLDG 102-3 BLDG 102-3-2 14-APR-05 ORIG 2 2.5 22 51BLDG 102-4 BLDG 102-4 18-MAR-05 ORIG 0 0.5 28 330BLDG 102-4 BLDG 102-4-4 14-APR-05 ORIG 4 4.5 21 81
CCCT02 PCB43 26-OCT-11 ORIG 0 0.5 12500 8 327 22.4 22 2.9088
Sample Results Contaminant of Concern
Appendix B, Ambient Metals Technical MemorandumUC Berkeley, Richmond Field Station Site Page 1 of 3
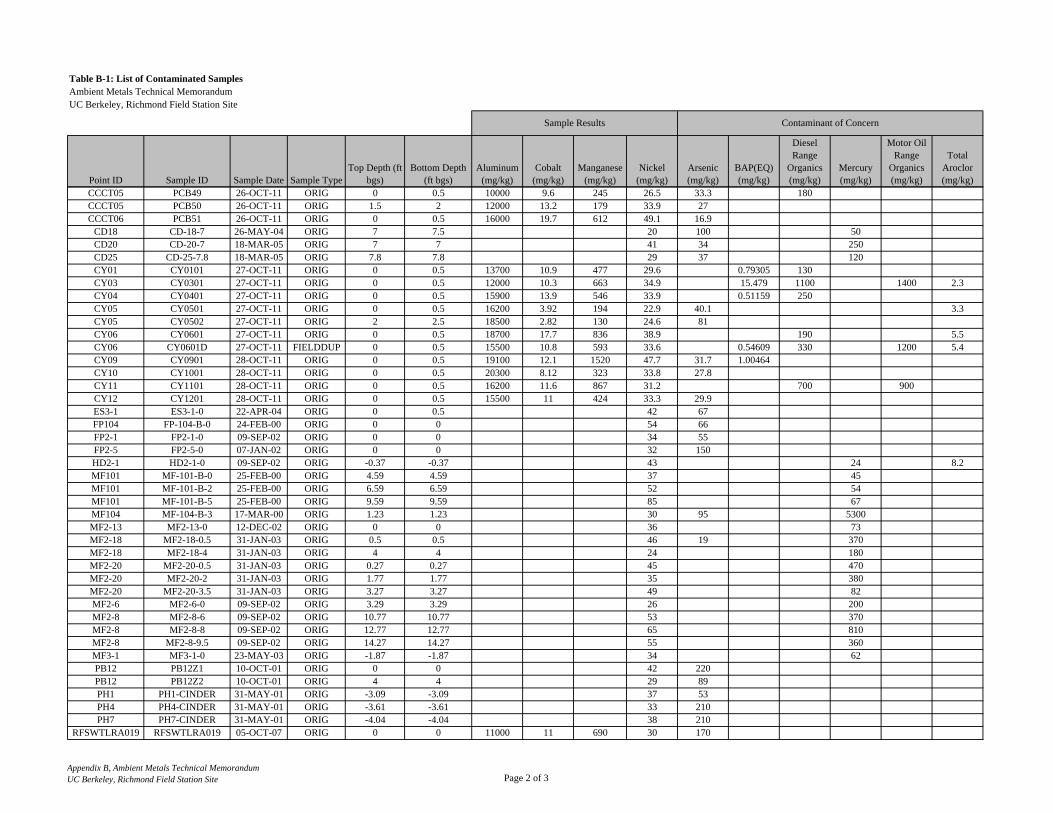
Table B-1: List of Contaminated SamplesAmbient Metals Technical MemorandumUC Berkeley, Richmond Field Station Site
Point ID Sample ID Sample Date Sample TypeTop Depth (ft
bgs)Bottom Depth
(ft bgs)Aluminum
(mg/kg)Cobalt
(mg/kg)Manganese
(mg/kg)Nickel
(mg/kg)Arsenic (mg/kg)
BAP(EQ) (mg/kg)
Diesel Range
Organics (mg/kg)
Mercury (mg/kg)
Motor Oil Range
Organics (mg/kg)
Total Aroclor (mg/kg)
Sample Results Contaminant of Concern
CCCT05 PCB49 26-OCT-11 ORIG 0 0.5 10000 9.6 245 26.5 33.3 180CCCT05 PCB50 26-OCT-11 ORIG 1.5 2 12000 13.2 179 33.9 27CCCT06 PCB51 26-OCT-11 ORIG 0 0.5 16000 19.7 612 49.1 16.9
CD18 CD-18-7 26-MAY-04 ORIG 7 7.5 20 100 50CD20 CD-20-7 18-MAR-05 ORIG 7 7 41 34 250CD25 CD-25-7.8 18-MAR-05 ORIG 7.8 7.8 29 37 120CY01 CY0101 27-OCT-11 ORIG 0 0.5 13700 10.9 477 29.6 0.79305 130CY03 CY0301 27-OCT-11 ORIG 0 0.5 12000 10.3 663 34.9 15.479 1100 1400 2.3CY04 CY0401 27-OCT-11 ORIG 0 0.5 15900 13.9 546 33.9 0.51159 250CY05 CY0501 27-OCT-11 ORIG 0 0.5 16200 3.92 194 22.9 40.1 3.3CY05 CY0502 27-OCT-11 ORIG 2 2.5 18500 2.82 130 24.6 81CY06 CY0601 27-OCT-11 ORIG 0 0.5 18700 17.7 836 38.9 190 5.5CY06 CY0601D 27-OCT-11 FIELDDUP 0 0.5 15500 10.8 593 33.6 0.54609 330 1200 5.4CY09 CY0901 28-OCT-11 ORIG 0 0.5 19100 12.1 1520 47.7 31.7 1.00464CY10 CY1001 28-OCT-11 ORIG 0 0.5 20300 8.12 323 33.8 27.8CY11 CY1101 28-OCT-11 ORIG 0 0.5 16200 11.6 867 31.2 700 900CY12 CY1201 28-OCT-11 ORIG 0 0.5 15500 11 424 33.3 29.9ES3-1 ES3-1-0 22-APR-04 ORIG 0 0.5 42 67FP104 FP-104-B-0 24-FEB-00 ORIG 0 0 54 66FP2-1 FP2-1-0 09-SEP-02 ORIG 0 0 34 55FP2-5 FP2-5-0 07-JAN-02 ORIG 0 0 32 150HD2-1 HD2-1-0 09-SEP-02 ORIG -0.37 -0.37 43 24 8.2MF101 MF-101-B-0 25-FEB-00 ORIG 4.59 4.59 37 45MF101 MF-101-B-2 25-FEB-00 ORIG 6.59 6.59 52 54MF101 MF-101-B-5 25-FEB-00 ORIG 9.59 9.59 85 67MF104 MF-104-B-3 17-MAR-00 ORIG 1.23 1.23 30 95 5300MF2-13 MF2-13-0 12-DEC-02 ORIG 0 0 36 73MF2-18 MF2-18-0.5 31-JAN-03 ORIG 0.5 0.5 46 19 370MF2-18 MF2-18-4 31-JAN-03 ORIG 4 4 24 180MF2-20 MF2-20-0.5 31-JAN-03 ORIG 0.27 0.27 45 470MF2-20 MF2-20-2 31-JAN-03 ORIG 1.77 1.77 35 380MF2-20 MF2-20-3.5 31-JAN-03 ORIG 3.27 3.27 49 82MF2-6 MF2-6-0 09-SEP-02 ORIG 3.29 3.29 26 200MF2-8 MF2-8-6 09-SEP-02 ORIG 10.77 10.77 53 370MF2-8 MF2-8-8 09-SEP-02 ORIG 12.77 12.77 65 810MF2-8 MF2-8-9.5 09-SEP-02 ORIG 14.27 14.27 55 360MF3-1 MF3-1-0 23-MAY-03 ORIG -1.87 -1.87 34 62PB12 PB12Z1 10-OCT-01 ORIG 0 0 42 220PB12 PB12Z2 10-OCT-01 ORIG 4 4 29 89PH1 PH1-CINDER 31-MAY-01 ORIG -3.09 -3.09 37 53PH4 PH4-CINDER 31-MAY-01 ORIG -3.61 -3.61 33 210PH7 PH7-CINDER 31-MAY-01 ORIG -4.04 -4.04 38 210
RFSWTLRA019 RFSWTLRA019 05-OCT-07 ORIG 0 0 11000 11 690 30 170
Appendix B, Ambient Metals Technical MemorandumUC Berkeley, Richmond Field Station Site Page 2 of 3

Table B-1: List of Contaminated SamplesAmbient Metals Technical MemorandumUC Berkeley, Richmond Field Station Site
Point ID Sample ID Sample Date Sample TypeTop Depth (ft
bgs)Bottom Depth
(ft bgs)Aluminum
(mg/kg)Cobalt
(mg/kg)Manganese
(mg/kg)Nickel
(mg/kg)Arsenic (mg/kg)
BAP(EQ) (mg/kg)
Diesel Range
Organics (mg/kg)
Mercury (mg/kg)
Motor Oil Range
Organics (mg/kg)
Total Aroclor (mg/kg)
Sample Results Contaminant of Concern
SH2-3 SH2-3-0 12-DEC-02 ORIG 0 0 38 64SL101 SL-101-B-6 25-FEB-00 ORIG 4.71 4.71 85 160 77SM3-4 SM3-4-0 26-APR-04 ORIG 0 0.5 17 35TP2-7 TP2-7-0 17-JAN-03 ORIG 0 0 31 56UM33 UM3301 22-OCT-14 ORIG 0 0.5 16000 32 1700 62 4.76UM41 UM4101 22-OCT-14 ORIG 0 0.5 15000 14 350 57 51
Notes:
FIELDDUP Field duplicate
ft bgs Feet below ground surface
mg/kg Milligrams per kilogram
ORIG Original
Appendix B, Ambient Metals Technical MemorandumUC Berkeley, Richmond Field Station Site Page 3 of 3

Table B-2: List of Presumed Uncontaminated SamplesAmbient Metals Technical MemorandumUC Berkeley, Richmond Field Station Site
Point ID Sample ID Sample Date Sample TypeTop Depth
(ft bgs)Bottom Depth
(ft bgs)Aluminum
(mg/kg)Cobalt
(mg/kg)Manganese
(mg/kg)Nickel
(mg/kg)EMI-1 EMI-1 30-MAR-05 ORIG 0 0.5 29EMI-2 EMI-2 30-MAR-05 ORIG 0 0.5 25EMI-4 EMI-4 30-MAR-05 ORIG 0 0.5 45EMI-5 EMI-5 30-MAR-05 ORIG 0 0.5 44EMI-6 EMI-6 30-MAR-05 ORIG 0 0.5 51NP-1 NP1-0.5 10-SEP-02 ORIG 0.5 0.5 20
OW2-1 OW2-1-0 09-SEP-02 ORIG 1.02 1.02 29OW2-1 OW2-1-8 09-SEP-02 ORIG 9.02 9.02 50SM01 SM0101 15-AUG-12 ORIG 0 0.5 11 580 62SM01 SM0101D 15-AUG-12 ORIG 0 0.5 10 480 53SM01 SM0101-DUP 15-AUG-12 FIELDDUP 0 0.5 11 190 58SM01 SM0101-DUP2 15-AUG-12 FIELDDUP 0 0.5 11 780 67SM01 SM0102 15-AUG-12 ORIG 2 2.5 14 1000 72SM02 SM0201 15-AUG-12 ORIG 0 0.5 8.4 630 26SM02 SM0202 15-AUG-12 ORIG 2 2.5 9.2 340 26SM03 SM0301 15-AUG-12 ORIG 0 0.5 9.1 560 24SM03 SM0302 15-AUG-12 ORIG 1.5 2 9.1 1200 27SM04 SM0401 15-AUG-12 ORIG 0 0.5 11 470 24SM04 SM0402 15-AUG-12 ORIG 1.5 2 9.6 560 21SM05 SM0501 15-AUG-12 ORIG 0 0.5 17 700 32SM05 SM0502 15-AUG-12 ORIG 1.5 2 16 930 28UM01 UM0101 20-OCT-14 ORIG 0 0.5 24000 9.6 470 51UM01 UM0102 20-OCT-14 ORIG 1.5 2 26000 12 520 56UM02 UM0201 20-OCT-14 ORIG 0 0.5 19000 14 650 61UM03 UM0301 20-OCT-14 ORIG 0 0.5 24000 20 790 48
UM04-FR1 UM0401-R1 20-OCT-14 ORIG 0 0.5 26000 18 830 50UM04-FR1 UM0402-R1 20-OCT-14 ORIG 1.5 2 26000 5.9 260 49UM04-FR2 UM0401-R2 20-OCT-14 ORIG 0 0.5 20000 17 840 46UM04-FR2 UM0402-R2 20-OCT-14 ORIG 1.5 2 26000 7.1 270 55
Sample Results
Appendix B, Ambient Metals Technical MemorandumUC Berkeley, Richmond Field Station Site Page 1 of 4
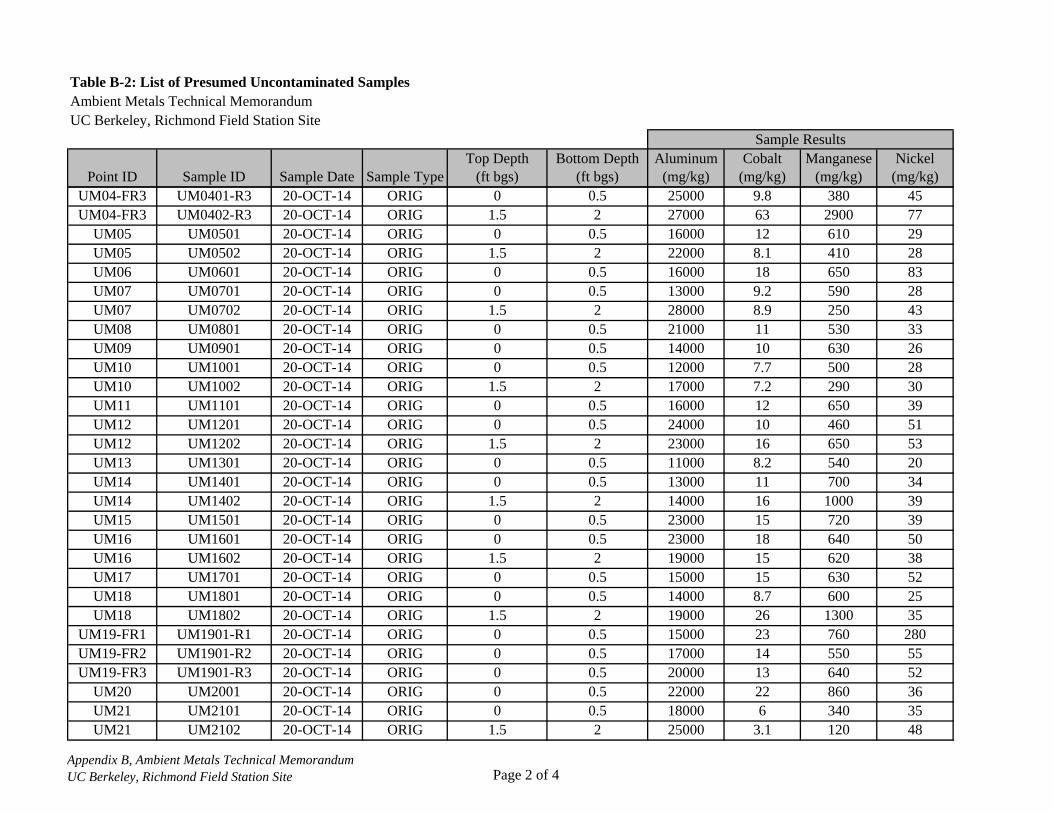
Table B-2: List of Presumed Uncontaminated SamplesAmbient Metals Technical MemorandumUC Berkeley, Richmond Field Station Site
Point ID Sample ID Sample Date Sample TypeTop Depth
(ft bgs)Bottom Depth
(ft bgs)Aluminum
(mg/kg)Cobalt
(mg/kg)Manganese
(mg/kg)Nickel
(mg/kg)
Sample Results
UM04-FR3 UM0401-R3 20-OCT-14 ORIG 0 0.5 25000 9.8 380 45UM04-FR3 UM0402-R3 20-OCT-14 ORIG 1.5 2 27000 63 2900 77
UM05 UM0501 20-OCT-14 ORIG 0 0.5 16000 12 610 29UM05 UM0502 20-OCT-14 ORIG 1.5 2 22000 8.1 410 28UM06 UM0601 20-OCT-14 ORIG 0 0.5 16000 18 650 83UM07 UM0701 20-OCT-14 ORIG 0 0.5 13000 9.2 590 28UM07 UM0702 20-OCT-14 ORIG 1.5 2 28000 8.9 250 43UM08 UM0801 20-OCT-14 ORIG 0 0.5 21000 11 530 33UM09 UM0901 20-OCT-14 ORIG 0 0.5 14000 10 630 26UM10 UM1001 20-OCT-14 ORIG 0 0.5 12000 7.7 500 28UM10 UM1002 20-OCT-14 ORIG 1.5 2 17000 7.2 290 30UM11 UM1101 20-OCT-14 ORIG 0 0.5 16000 12 650 39UM12 UM1201 20-OCT-14 ORIG 0 0.5 24000 10 460 51UM12 UM1202 20-OCT-14 ORIG 1.5 2 23000 16 650 53UM13 UM1301 20-OCT-14 ORIG 0 0.5 11000 8.2 540 20UM14 UM1401 20-OCT-14 ORIG 0 0.5 13000 11 700 34UM14 UM1402 20-OCT-14 ORIG 1.5 2 14000 16 1000 39UM15 UM1501 20-OCT-14 ORIG 0 0.5 23000 15 720 39UM16 UM1601 20-OCT-14 ORIG 0 0.5 23000 18 640 50UM16 UM1602 20-OCT-14 ORIG 1.5 2 19000 15 620 38UM17 UM1701 20-OCT-14 ORIG 0 0.5 15000 15 630 52UM18 UM1801 20-OCT-14 ORIG 0 0.5 14000 8.7 600 25UM18 UM1802 20-OCT-14 ORIG 1.5 2 19000 26 1300 35
UM19-FR1 UM1901-R1 20-OCT-14 ORIG 0 0.5 15000 23 760 280UM19-FR2 UM1901-R2 20-OCT-14 ORIG 0 0.5 17000 14 550 55UM19-FR3 UM1901-R3 20-OCT-14 ORIG 0 0.5 20000 13 640 52
UM20 UM2001 20-OCT-14 ORIG 0 0.5 22000 22 860 36UM21 UM2101 20-OCT-14 ORIG 0 0.5 18000 6 340 35UM21 UM2102 20-OCT-14 ORIG 1.5 2 25000 3.1 120 48
Appendix B, Ambient Metals Technical MemorandumUC Berkeley, Richmond Field Station Site Page 2 of 4

Table B-2: List of Presumed Uncontaminated SamplesAmbient Metals Technical MemorandumUC Berkeley, Richmond Field Station Site
Point ID Sample ID Sample Date Sample TypeTop Depth
(ft bgs)Bottom Depth
(ft bgs)Aluminum
(mg/kg)Cobalt
(mg/kg)Manganese
(mg/kg)Nickel
(mg/kg)
Sample Results
UM22 UM2201 20-OCT-14 ORIG 0 0.5 11000 11 560 40UM23 UM2301 20-OCT-14 ORIG 0 0.5 21000 13 610 41UM23 UM2302 20-OCT-14 ORIG 1.5 2 25000 8.5 370 39UM24 UM2401 20-OCT-14 ORIG 0 0.5 13000 10 450 51UM25 UM2501 20-OCT-14 ORIG 0 0.5 14000 12 790 79UM25 UM2502 20-OCT-14 ORIG 1.5 2 8500 9.8 630 37UM26 UM2601 22-OCT-14 ORIG 0 0.5 21000 13 680 56UM27 UM2701 22-OCT-14 ORIG 0 0.5 15000 17 790 40UM27 UM2702 22-OCT-14 ORIG 1.5 2 19000 15 960 37
UM28-FR1 UM2801-R1 22-OCT-14 ORIG 0 0.5 12000 40 2500 41UM28-FR2 UM2801-R2 22-OCT-14 ORIG 0 0.5 15000 14 810 37UM28-FR3 UM2801-R3 22-OCT-14 ORIG 0 0.5 15000 11 780 32
UM29 UM2901 20-OCT-14 ORIG 0 0.5 19000 9.3 660 46UM29 UM2902 20-OCT-14 ORIG 1.5 2 23000 8.4 410 47
UM30-FR1 UM3001-R1 22-OCT-14 ORIG 0 0.5 19000 12 690 57UM30-FR1 UM3002-R1 22-OCT-14 ORIG 1.5 2 20000 11 580 39UM30-FR2 UM3001-R2 22-OCT-14 ORIG 0 0.5 20000 12 570 52UM30-FR2 UM3002-R2 22-OCT-14 ORIG 1.5 2 20000 10 550 38UM30-FR3 UM3001-R3 22-OCT-14 ORIG 0 0.5 19000 18 1200 69UM30-FR3 UM3002-R3 22-OCT-14 ORIG 1.5 2 19000 12 560 33
UM31 UM3101 22-OCT-14 ORIG 0 0.5 19000 25 1400 54UM32 UM3201 22-OCT-14 ORIG 0 0.5 13000 12 720 42UM32 UM3202 22-OCT-14 ORIG 1.5 2 14000 9.3 600 43UM34 UM3401 22-OCT-14 ORIG 0 0.5 18000 17 1100 70UM35 UM3501 22-OCT-14 ORIG 0 0.5 17000 9.2 460 35UM35 UM3502 22-OCT-14 ORIG 1.5 2 20000 12 560 45UM37 UM3701 22-OCT-14 ORIG 0 0.5 15000 11 530 37UM37 UM3702 22-OCT-14 ORIG 1.5 2 19000 22 790 42UM38 UM3801 22-OCT-14 ORIG 0 0.5 16000 14 690 35
Appendix B, Ambient Metals Technical MemorandumUC Berkeley, Richmond Field Station Site Page 3 of 4

Table B-2: List of Presumed Uncontaminated SamplesAmbient Metals Technical MemorandumUC Berkeley, Richmond Field Station Site
Point ID Sample ID Sample Date Sample TypeTop Depth
(ft bgs)Bottom Depth
(ft bgs)Aluminum
(mg/kg)Cobalt
(mg/kg)Manganese
(mg/kg)Nickel
(mg/kg)
Sample Results
UM38 UM3802 22-OCT-14 ORIG 1.5 2 21000 31 1100 54UM39 UM3901 22-OCT-14 ORIG 0 0.5 19000 21 1100 65UM39 UM3902 22-OCT-14 ORIG 1.5 2 19000 73 5900 170UM42 UM4202 22-OCT-14 ORIG 0 0.5 15000 14 650 54UM42 UM4202 22-OCT-14 ORIG 1.5 2 17000 13 380 61
Notes:
FIELDDUP Field duplicate
ft bgs Feet below ground surface
mg/kg Milligrams per kilogram
ORIG Original
Appendix B, Ambient Metals Technical MemorandumUC Berkeley, Richmond Field Station Site Page 4 of 4

Appendix CContaminated and Presumed Uncontaminated Data Analysis Results

Appendix C, Ambient Metals Technical Memorandum C-1 UC Berkeley, Richmond Field Station Site

Appendix C, Ambient Metals Technical Memorandum C-2 UC Berkeley, Richmond Field Station Site

From File WorkSheet_a.xls
Full Precision OFF
Confidence Coefficient
General Statistics
Total Number of Observations 18 Number of Distinct Observations 14
UCL Statistics for Uncensored Full Data Sets
User Selected Options
Date/Time of Computation 7/30/2015 3:50:30 PM
Number of Missing Observations 67
Minimum 10000
95%
Coefficient of Variation 0.19 Skewness -0.111
Maximum 20300 Median 15700
mber of Bootstrap Operations 2000
Al (contaminated)
0.173
5% Lilliefors Critical Value 0.209 Data appear Normal at 5% Significance Level
Normal GOF Test
Shapiro Wilk Test Statistic 0.957 Shapiro Wilk GOF Test
5% Shapiro Wilk Critical Value 0.897 Data appear Normal at 5% Significance Level
Mean 15228
Data appear Normal at 5% Significance Level
Assuming Normal Distribution
95% Normal UCL 95% UCLs (Adjusted for Skewness)
Lilliefors Test Statistic 0.148 Lilliefors GOF Test
SD 2901 Std. Error of Mean 683.7
nu star (bias corrected) 837.3
MLE Mean (bias corrected) 15228 MLE Sd (bias corrected) 3158
Approximate Chi Square Value (0.05) 771.1
95% Student's-t UCL 16417 95% Adjusted-CLT UCL (Chen-1995) 16333
95% Modified-t UCL (Johnson-1978) 16414
Kolmogrov-Smirnoff Gamma GOF Test
Gamma GOF Test
A-D Test Statistic 0.467 Anderson-Darling Gamma GOF Test
5% K-S Critical Value 0.203Detected data appear Gamma Distributed at 5% Significance Lev
Detected data appear Gamma Distributed at 5% Significance Level
5% A-D Critical Value 0.739Detected data appear Gamma Distributed at 5% Significance Lev
K-S Test Statistic
Adjusted Level of Significance 0.0357 Adjusted Chi Square Value 765.1
Gamma Statistics
k hat (MLE) 27.87 k star (bias corrected MLE) 23.26
Theta hat (MLE) 546.5 Theta star (bias corrected MLE) 654.7
nu hat (MLE) 1003
Appendix C, Ambient Metals Technical MemorandumUC Berkeley, Richmond Field Station Site Page 1 of 16

UCL Statistics for Uncensored Full Data Sets
16534 95% Adjusted Gamma UCL (use when n<50) 16666
Lilliefors Test Statistic 0.183 Lilliefors Lognormal GOF Test
Lognormal GOF Test
Shapiro Wilk Test Statistic 0.944 Shapiro Wilk Lognormal GOF Test
5% Shapiro Wilk Critical Value 0.897 Data appear Lognormal at 5% Significance Level
Assuming Gamma Distribution
95% Approximate Gamma UCL (use when n>=50))
Lognormal Statistics
Minimum of Logged Data 9.21 Mean of logged Data 9.613
5% Lilliefors Critical Value 0.209 Data appear Lognormal at 5% Significance Level
Data appear Lognormal at 5% Significance Level
Assuming Lognormal Distribution
95% H-UCL 16622 90% Chebyshev (MVUE) UCL 17387
Maximum of Logged Data 9.918 SD of logged Data 0.198
Suggested UCL to Use
95% Student's-t UCL 16417
90% Chebyshev(Mean, Sd) UCL
Nonparametric Distribution Free UCL Statistics
Data appear to follow a Discernible Distribution at 5% Significance Level
Nonparametric Distribution Free UCLs
95% Chebyshev (MVUE) UCL 18361 97.5% Chebyshev (MVUE) UCL 19713
99% Chebyshev (MVUE) UCL
95% CLT UCL 16352 95% Jackknife UCL 16417
95% Standard Bootstrap UCL 16312 95% Bootstrap-t UCL 16446
95% Hall's Bootstrap UCL 16360 95% Percentile Bootstrap UCL 16333
95% BCA Bootstrap UCL 16222
17279 95% Chebyshev(Mean, Sd) UCL 18208
97.5% Chebyshev(Mean, Sd) UCL 19497 99% Chebyshev(Mean, Sd) UCL 22030
22369
Note: For highly negatively-skewed data, confidence limits (e.g., Chen, Johnson, Lognormal, and Gamma) may not be
reliable. Chen's and Johnson's methods provide adjustments for positvely skewed data sets.
Note: Suggestions regarding the selection of a 95% UCL are provided to help the user to select the most appropriate 95% UCL.
These recommendations are based upon the results of the simulation studies summarized in Singh, Singh, and Iaci (2002)
and Singh and Singh (2003). However, simulations results will not cover all Real World data sets.
For additional insight the user may want to consult a statistician.
Appendix C, Ambient Metals Technical MemorandumUC Berkeley, Richmond Field Station Site Page 2 of 16

UCL Statistics for Uncensored Full Data Sets
Al (uncontaminated)
General Statistics
Total Number of Observations 71 Number of Distinct Observations 19
Number of Missing Observations 19
Minimum 8500 Mean
Coefficient of Variation 0.239 Skewness 0.0894
Maximum 28000 Median 19000
SD
0.105 Data appear Normal at 5% Significance Level
Normal GOF Test
Shapiro Wilk Test Statistic 0.968 Shapiro Wilk GOF Test
5% Shapiro Wilk P Value 0.203 Data appear Normal at 5% Significance Level
18641
Data appear Normal at 5% Significance Level
Assuming Normal Distribution
95% Normal UCL 95% UCLs (Adjusted for Skewness)
Lilliefors Test Statistic 0.0955 Lilliefors GOF Test
5% Lilliefors Critical Value
4456 Std. Error of Mean 528.9
95% Modified-t UCL (Johnson-1978) 19523
Theta hat (MLE) 1101 Theta star (bias corrected MLE) 1149
5% K-S Critical Value 0.106 Data Not Gamma Distributed at 5% Significance Level
Gamma GOF Test
A-D Test Statistic 0.53 Anderson-Darling Gamma GOF Test
95% Student's-t UCL 19522 95% Adjusted-CLT UCL (Chen-1995) 19517
5% A-D Critical Value 0.75 Detected data appear Gamma Distributed at 5% Significance Lev
K-S Test Statistic 0.127 Kolmogrov-Smirnoff Gamma GOF Test
2190
MLE Mean (bias corrected) 18641 MLE Sd (bias corrected) 4629
Approximate Chi Square Value (0.05) 2193
Detected data follow Appr. Gamma Distribution at 5% Significance Level
Assuming Gamma Distribution
95% Approximate Gamma UCL (use when n>=50)) 19580 95% Adjusted Gamma UCL (use when n<50) 19600
Adjusted Level of Significance 0.0466 Adjusted Chi Square Value
nu hat (MLE) 2403 nu star (bias corrected) 2303
Gamma Statistics
k hat (MLE) 16.93 k star (bias corrected MLE) 16.22
Lognormal GOF Test
Shapiro Wilk Test Statistic 0.964 Shapiro Wilk Lognormal GOF Test
5% Shapiro Wilk P Value 0.113 Data appear Lognormal at 5% Significance Level
Lilliefors Test Statistic 0.141 Lilliefors Lognormal GOF Test
5% Lilliefors Critical Value 0.105 Data Not Lognormal at 5% Significance Level
Appendix C, Ambient Metals Technical MemorandumUC Berkeley, Richmond Field Station Site Page 3 of 16

UCL Statistics for Uncensored Full Data Sets
95% Chebyshev (MVUE) UCL 21118 97.5% Chebyshev (MVUE) UCL 22181
Maximum of Logged Data
Lognormal Statistics
Minimum of Logged Data 9.048 Mean of logged Data 9.803
Data appear Approximate Lognormal at 5% Significance Level
10.24 SD of logged Data 0.251
95% Hall's Bootstrap UCL 19487 95% Percentile Bootstrap UCL 19521
95% Bootstrap-t UCL 19561
99% Chebyshev (MVUE) UCL 24268
Assuming Lognormal Distribution
95% H-UCL 19662 90% Chebyshev (MVUE) UCL 20353
Nonparametric Distribution Free UCL Statistics
Data appear to follow a Discernible Distribution at 5% Significance Level
Nonparametric Distribution Free UCLs
90% Chebyshev(Mean, Sd) UCL 20227 95% Chebyshev(Mean, Sd) UCL 20946
95% BCA Bootstrap UCL 19535
95% CLT UCL 19511 95% Jackknife UCL 19522
95% Standard Bootstrap UCL 19516
97.5% Chebyshev(Mean, Sd) UCL 21944 99% Chebyshev(Mean, Sd) UCL 23903
Note: Suggestions regarding the selection of a 95% UCL are provided to help the user to select the most appropriate 95% UCL.
These recommendations are based upon the results of the simulation studies summarized in Singh, Singh, and Iaci (2002)
and Singh and Singh (2003). However, simulations results will not cover all Real World data sets.
For additional insight the user may want to consult a statistician.
Suggested UCL to Use
95% Student's-t UCL 19522
Appendix C, Ambient Metals Technical MemorandumUC Berkeley, Richmond Field Station Site Page 4 of 16

UCL Statistics for Uncensored Full Data Sets
23
Minimum 2.82 Mean 12.18
Number of Missing Observations 61
SD 5.779 Std. Error of Mean 1.18
Coefficient of Variation 0.474 Skewness
Data Not Normal at 5% Significance Level
5% Shapiro Wilk Critical Value 0.916 Data Not Normal at 5% Significance Level
Lilliefors Test Statistic 0.21 Lilliefors GOF Test
Co (contaminated)
General Statistics
5% Lilliefors Critical Value 0.181 Data Not Normal at 5% Significance Level
Normal GOF Test
Maximum 32 Median 11
Total Number of Observations 24 Number of Distinct Observations
nu hat (MLE) 238.8 nu star (bias corrected) 210.3
95% Modified-t UCL (Johnson-1978) 14.27
Assuming Normal Distribution
95% Normal UCL 95% UCLs (Adjusted for Skewness)
95% Student's-t UCL 14.2 95% Adjusted-CLT UCL (Chen-1995) 14.57
1.736
Gamma GOF Test
A-D Test Statistic 0.78 Anderson-Darling Gamma GOF Test
5% A-D Critical Value 0.746 Data Not Gamma Distributed at 5% Significance Level
Shapiro Wilk Test Statistic 0.849 Shapiro Wilk GOF Test
K-S Test Statistic 0.154 Kolmogrov-Smirnoff Gamma GOF Test
5% K-S Critical Value 0.178Detected data appear Gamma Distributed at 5% Significance Lev
Detected data follow Appr. Gamma Distribution at 5% Significance Level
Gamma Statistics
k hat (MLE) 4.975 k star (bias corrected MLE) 4.381
Theta hat (MLE) 2.448 Theta star (bias corrected MLE) 2.78
MLE Mean (bias corrected) 12.18 MLE Sd (bias corrected) 5.82
Approximate Chi Square Value (0.05) 177.7
Assuming Gamma Distribution
95% Approximate Gamma UCL (use when n>=50) 14.41 95% Adjusted Gamma UCL (use when n<50) 14.59
Adjusted Level of Significance 0.0392 Adjusted Chi Square Value 175.6
Lognormal GOF Test
Shapiro Wilk Test Statistic 0.904 Shapiro Wilk Lognormal GOF Test
5% Shapiro Wilk Critical Value 0.916 Data Not Lognormal at 5% Significance Level
Lilliefors Test Statistic 0.174 Lilliefors Lognormal GOF Test
5% Lilliefors Critical Value 0.181 Data appear Lognormal at 5% Significance Level
Appendix C, Ambient Metals Technical MemorandumUC Berkeley, Richmond Field Station Site Page 5 of 16

UCL Statistics for Uncensored Full Data Sets
95% Chebyshev (MVUE) UCL 17.81 97.5% Chebyshev (MVUE) UCL 20.2
Maximum of Logged Data
Lognormal Statistics
Minimum of Logged Data 1.037 Mean of logged Data 2.396
Data appear Approximate Lognormal at 5% Significance Level
3.466 SD of logged Data 0.486
95% Hall's Bootstrap UCL 16.53 95% Percentile Bootstrap UCL 14.15
95% Bootstrap-t UCL 14.9
99% Chebyshev (MVUE) UCL 24.9
Assuming Lognormal Distribution
95% H-UCL 15.09 90% Chebyshev (MVUE) UCL 16.09
Nonparametric Distribution Free UCL Statistics
Data appear to follow a Discernible Distribution at 5% Significance Level
Nonparametric Distribution Free UCLs
90% Chebyshev(Mean, Sd) UCL 15.72 95% Chebyshev(Mean, Sd) UCL 17.32
95% BCA Bootstrap UCL 14.64
95% CLT UCL 14.12 95% Jackknife UCL 14.2
95% Standard Bootstrap UCL 14.05
97.5% Chebyshev(Mean, Sd) UCL 19.55 99% Chebyshev(Mean, Sd) UCL 23.92
Note: Suggestions regarding the selection of a 95% UCL are provided to help the user to select the most appropriate 95% UCL.
These recommendations are based upon the results of the simulation studies summarized in Singh, Singh, and Iaci (2002)
and Singh and Singh (2003). However, simulations results will not cover all Real World data sets.
For additional insight the user may want to consult a statistician.
Suggested UCL to Use
95% Adjusted Gamma UCL 14.59
Appendix C, Ambient Metals Technical MemorandumUC Berkeley, Richmond Field Station Site Page 6 of 16

UCL Statistics for Uncensored Full Data Sets
36
Minimum 3.1 Mean 14.58
Number of Missing Observations 8
SD 10.26 Std. Error of Mean 1.133
Coefficient of Variation 0.703 Skewness
Data Not Normal at 5% Significance Level
5% Shapiro Wilk P Value 0 Data Not Normal at 5% Significance Level
Lilliefors Test Statistic 0.235 Lilliefors GOF Test
Co (uncontaminated)
General Statistics
5% Lilliefors Critical Value 0.0978 Data Not Normal at 5% Significance Level
Normal GOF Test
Maximum 73 Median 12
Total Number of Observations 82 Number of Distinct Observations
nu hat (MLE) 643.4 nu star (bias corrected) 621.2
95% Modified-t UCL (Johnson-1978) 16.54
Assuming Normal Distribution
95% Normal UCL 95% UCLs (Adjusted for Skewness)
95% Student's-t UCL 16.46 95% Adjusted-CLT UCL (Chen-1995) 16.96
3.876
Gamma GOF Test
A-D Test Statistic 3.326 Anderson-Darling Gamma GOF Test
5% A-D Critical Value 0.756 Data Not Gamma Distributed at 5% Significance Level
Shapiro Wilk Test Statistic 0.615 Shapiro Wilk GOF Test
K-S Test Statistic 0.147 Kolmogrov-Smirnoff Gamma GOF Test
5% K-S Critical Value 0.0991 Data Not Gamma Distributed at 5% Significance Level
Data Not Gamma Distributed at 5% Significance Level
Gamma Statistics
k hat (MLE) 3.923 k star (bias corrected MLE) 3.788
Theta hat (MLE) 3.716 Theta star (bias corrected MLE) 3.849
MLE Mean (bias corrected) 14.58 MLE Sd (bias corrected) 7.491
Approximate Chi Square Value (0.05) 564.3
Assuming Gamma Distribution
95% Approximate Gamma UCL (use when n>=50)) 16.05 95% Adjusted Gamma UCL (use when n<50) 16.07
Adjusted Level of Significance 0.0471 Adjusted Chi Square Value 563.4
Lognormal GOF Test
Shapiro Wilk Test Statistic 0.933 Shapiro Wilk Lognormal GOF Test
5% Shapiro Wilk P Value 3.1077E-4 Data Not Lognormal at 5% Significance Level
Lilliefors Test Statistic 0.113 Lilliefors Lognormal GOF Test
5% Lilliefors Critical Value 0.0978 Data Not Lognormal at 5% Significance Level
Appendix C, Ambient Metals Technical MemorandumUC Berkeley, Richmond Field Station Site Page 7 of 16

UCL Statistics for Uncensored Full Data Sets
95% Chebyshev (MVUE) UCL 17.63 97.5% Chebyshev (MVUE) UCL 19.1
Maximum of Logged Data
Lognormal Statistics
Minimum of Logged Data 1.131 Mean of logged Data 2.547
Data Not Lognormal at 5% Significance Level
4.29 SD of logged Data 0.471
95% Hall's Bootstrap UCL 18.26 95% Percentile Bootstrap UCL 16.53
95% Bootstrap-t UCL 17.56
99% Chebyshev (MVUE) UCL 21.98
Assuming Lognormal Distribution
95% H-UCL 15.7 90% Chebyshev (MVUE) UCL 16.57
Nonparametric Distribution Free UCL Statistics
Data do not follow a Discernible Distribution (0.05)
Nonparametric Distribution Free UCLs
90% Chebyshev(Mean, Sd) UCL 17.98 95% Chebyshev(Mean, Sd) UCL 19.51
95% BCA Bootstrap UCL 17.01
95% CLT UCL 16.44 95% Jackknife UCL 16.46
95% Standard Bootstrap UCL 16.43
97.5% Chebyshev(Mean, Sd) UCL 21.65 99% Chebyshev(Mean, Sd) UCL 25.85
Note: Suggestions regarding the selection of a 95% UCL are provided to help the user to select the most appropriate 95% UCL.
These recommendations are based upon the results of the simulation studies summarized in Singh, Singh, and Iaci (2002)
and Singh and Singh (2003). However, simulations results will not cover all Real World data sets.
For additional insight the user may want to consult a statistician.
Suggested UCL to Use
95% Student's-t UCL 16.46 or 95% Modified-t UCL 16.54
Appendix C, Ambient Metals Technical MemorandumUC Berkeley, Richmond Field Station Site Page 8 of 16

UCL Statistics for Uncensored Full Data Sets
24
Minimum 130 Mean 574.8
Number of Missing Observations 61
SD 375.8 Std. Error of Mean 76.71
Coefficient of Variation 0.654 Skewness
Data Not Normal at 5% Significance Level
5% Shapiro Wilk Critical Value 0.916 Data Not Normal at 5% Significance Level
Lilliefors Test Statistic 0.183 Lilliefors GOF Test
Mn (contaminated)
General Statistics
5% Lilliefors Critical Value 0.181 Data Not Normal at 5% Significance Level
Normal GOF Test
Maximum 1700 Median 513
Total Number of Observations 24 Number of Distinct Observations
nu hat (MLE) 143 nu star (bias corrected) 126.4
95% Modified-t UCL (Johnson-1978) 711
Assuming Normal Distribution
95% Normal UCL 95% UCLs (Adjusted for Skewness)
95% Student's-t UCL 706.3 95% Adjusted-CLT UCL (Chen-1995) 731.2
1.802
Gamma GOF Test
A-D Test Statistic 0.346 Anderson-Darling Gamma GOF Test
5% A-D Critical Value 0.751Detected data appear Gamma Distributed at 5% Significance Lev
Shapiro Wilk Test Statistic 0.822 Shapiro Wilk GOF Test
K-S Test Statistic 0.109 Kolmogrov-Smirnoff Gamma GOF Test
5% K-S Critical Value 0.179Detected data appear Gamma Distributed at 5% Significance Lev
Detected data appear Gamma Distributed at 5% Significance Level
Gamma Statistics
k hat (MLE) 2.978 k star (bias corrected MLE) 2.634
Theta hat (MLE) 193 Theta star (bias corrected MLE) 218.3
MLE Mean (bias corrected) 574.8 MLE Sd (bias corrected) 354.2
Approximate Chi Square Value (0.05) 101.5
Assuming Gamma Distribution
95% Approximate Gamma UCL (use when n>=50) 716.3 95% Adjusted Gamma UCL (use when n<50) 727.6
Adjusted Level of Significance 0.0392 Adjusted Chi Square Value 99.88
Lognormal GOF Test
Shapiro Wilk Test Statistic 0.976 Shapiro Wilk Lognormal GOF Test
5% Shapiro Wilk Critical Value 0.916 Data appear Lognormal at 5% Significance Level
Lilliefors Test Statistic 0.0904 Lilliefors Lognormal GOF Test
5% Lilliefors Critical Value 0.181 Data appear Lognormal at 5% Significance Level
Appendix C, Ambient Metals Technical MemorandumUC Berkeley, Richmond Field Station Site Page 9 of 16

UCL Statistics for Uncensored Full Data Sets
95% Chebyshev (MVUE) UCL 906.9 97.5% Chebyshev (MVUE) UCL 1050
Maximum of Logged Data
Lognormal Statistics
Minimum of Logged Data 4.868 Mean of logged Data 6.177
Data appear Lognormal at 5% Significance Level
7.438 SD of logged Data 0.612
95% Hall's Bootstrap UCL 898 95% Percentile Bootstrap UCL 703.5
95% Bootstrap-t UCL 785.3
99% Chebyshev (MVUE) UCL 1332
Assuming Lognormal Distribution
95% H-UCL 757.6 90% Chebyshev (MVUE) UCL 803.6
Nonparametric Distribution Free UCL Statistics
Data appear to follow a Discernible Distribution at 5% Significance Level
Nonparametric Distribution Free UCLs
90% Chebyshev(Mean, Sd) UCL 805 95% Chebyshev(Mean, Sd) UCL 909.2
95% BCA Bootstrap UCL 729.6
95% CLT UCL 701 95% Jackknife UCL 706.3
95% Standard Bootstrap UCL 704.2
97.5% Chebyshev(Mean, Sd) UCL 1054 99% Chebyshev(Mean, Sd) UCL 1338
Note: Suggestions regarding the selection of a 95% UCL are provided to help the user to select the most appropriate 95% UCL.
These recommendations are based upon the results of the simulation studies summarized in Singh, Singh, and Iaci (2002)
and Singh and Singh (2003). However, simulations results will not cover all Real World data sets.
For additional insight the user may want to consult a statistician.
Suggested UCL to Use
95% Adjusted Gamma UCL 727.6
Appendix C, Ambient Metals Technical MemorandumUC Berkeley, Richmond Field Station Site Page 10 of 16

UCL Statistics for Uncensored Full Data Sets
50
Minimum 120 Mean 765
Number of Missing Observations 8
SD 699.4 Std. Error of Mean 77.23
Coefficient of Variation 0.914 Skewness
Data Not Normal at 5% Significance Level
5% Shapiro Wilk P Value 0 Data Not Normal at 5% Significance Level
Lilliefors Test Statistic 0.275 Lilliefors GOF Test
Mn (uncontaminated)
General Statistics
5% Lilliefors Critical Value 0.0978 Data Not Normal at 5% Significance Level
Normal GOF Test
Maximum 5900 Median 630
Total Number of Observations 82 Number of Distinct Observations
nu hat (MLE) 506 nu star (bias corrected) 488.8
95% Modified-t UCL (Johnson-1978) 901.4
Assuming Normal Distribution
95% Normal UCL 95% UCLs (Adjusted for Skewness)
95% Student's-t UCL 893.5 95% Adjusted-CLT UCL (Chen-1995) 942.4
5.531
Gamma GOF Test
A-D Test Statistic 4.3 Anderson-Darling Gamma GOF Test
5% A-D Critical Value 0.759 Data Not Gamma Distributed at 5% Significance Level
Shapiro Wilk Test Statistic 0.497 Shapiro Wilk GOF Test
K-S Test Statistic 0.183 Kolmogrov-Smirnoff Gamma GOF Test
5% K-S Critical Value 0.0994 Data Not Gamma Distributed at 5% Significance Level
Data Not Gamma Distributed at 5% Significance Level
Gamma Statistics
k hat (MLE) 3.085 k star (bias corrected MLE) 2.98
Theta hat (MLE) 248 Theta star (bias corrected MLE) 256.7
MLE Mean (bias corrected) 765 MLE Sd (bias corrected) 443.1
Approximate Chi Square Value (0.05) 438.5
Assuming Gamma Distribution
95% Approximate Gamma UCL (use when n>=50)) 852.7 95% Adjusted Gamma UCL (use when n<50) 854.3
Adjusted Level of Significance 0.0471 Adjusted Chi Square Value 437.7
Lognormal GOF Test
Shapiro Wilk Test Statistic 0.923 Shapiro Wilk Lognormal GOF Test
5% Shapiro Wilk P Value 4.5594E-5 Data Not Lognormal at 5% Significance Level
Lilliefors Test Statistic 0.129 Lilliefors Lognormal GOF Test
5% Lilliefors Critical Value 0.0978 Data Not Lognormal at 5% Significance Level
Appendix C, Ambient Metals Technical MemorandumUC Berkeley, Richmond Field Station Site Page 11 of 16

UCL Statistics for Uncensored Full Data Sets
95% Chebyshev (MVUE) UCL 933.9 97.5% Chebyshev (MVUE) UCL 1019
Maximum of Logged Data
Lognormal Statistics
Minimum of Logged Data 4.787 Mean of logged Data 6.469
Data Not Lognormal at 5% Significance Level
8.683 SD of logged Data 0.522
95% Hall's Bootstrap UCL 1436 95% Percentile Bootstrap UCL 894.9
95% Bootstrap-t UCL 1017
99% Chebyshev (MVUE) UCL 1186
Assuming Lognormal Distribution
95% H-UCL 823 90% Chebyshev (MVUE) UCL 872.7
Nonparametric Distribution Free UCL Statistics
Data do not follow a Discernible Distribution (0.05)
Nonparametric Distribution Free UCLs
90% Chebyshev(Mean, Sd) UCL 996.7 95% Chebyshev(Mean, Sd) UCL 1102
95% BCA Bootstrap UCL 955.1
95% CLT UCL 892 95% Jackknife UCL 893.5
95% Standard Bootstrap UCL 889.1
97.5% Chebyshev(Mean, Sd) UCL 1247 99% Chebyshev(Mean, Sd) UCL 1533
Note: Suggestions regarding the selection of a 95% UCL are provided to help the user to select the most appropriate 95% UCL.
These recommendations are based upon the results of the simulation studies summarized in Singh, Singh, and Iaci (2002)
and Singh and Singh (2003). However, simulations results will not cover all Real World data sets.
For additional insight the user may want to consult a statistician.
Suggested UCL to Use
95% Chebyshev (Mean, Sd) UCL 1102
Appendix C, Ambient Metals Technical MemorandumUC Berkeley, Richmond Field Station Site Page 12 of 16

UCL Statistics for Uncensored Full Data Sets
59
Minimum 8.3 Mean 40.28
Number of Missing Observations 0
SD 28.59 Std. Error of Mean 3.101
Coefficient of Variation 0.71 Skewness
Data Not Normal at 5% Significance Level
5% Shapiro Wilk P Value 0 Data Not Normal at 5% Significance Level
Lilliefors Test Statistic 0.191 Lilliefors GOF Test
Ni (contaminated)
General Statistics
5% Lilliefors Critical Value 0.0961 Data Not Normal at 5% Significance Level
Normal GOF Test
Maximum 260 Median 34
Total Number of Observations 85 Number of Distinct Observations
nu hat (MLE) 708.6 nu star (bias corrected) 684.9
95% Modified-t UCL (Johnson-1978) 45.75
Assuming Normal Distribution
95% Normal UCL 95% UCLs (Adjusted for Skewness)
95% Student's-t UCL 45.44 95% Adjusted-CLT UCL (Chen-1995) 47.4
5.617
Gamma GOF Test
A-D Test Statistic 1.836 Anderson-Darling Gamma GOF Test
5% A-D Critical Value 0.756 Data Not Gamma Distributed at 5% Significance Level
Shapiro Wilk Test Statistic 0.578 Shapiro Wilk GOF Test
K-S Test Statistic 0.107 Kolmogrov-Smirnoff Gamma GOF Test
5% K-S Critical Value 0.0973 Data Not Gamma Distributed at 5% Significance Level
Data Not Gamma Distributed at 5% Significance Level
Gamma Statistics
k hat (MLE) 4.168 k star (bias corrected MLE) 4.029
Theta hat (MLE) 9.663 Theta star (bias corrected MLE) 9.997
MLE Mean (bias corrected) 40.28 MLE Sd (bias corrected) 20.07
Approximate Chi Square Value (0.05) 625.2
Assuming Gamma Distribution
95% Approximate Gamma UCL (use when n>=50)) 44.13 95% Adjusted Gamma UCL (use when n<50) 44.19
Adjusted Level of Significance 0.0472 Adjusted Chi Square Value 624.2
Lognormal GOF Test
Shapiro Wilk Test Statistic 0.965 Shapiro Wilk Lognormal GOF Test
5% Shapiro Wilk P Value 0.085 Data appear Lognormal at 5% Significance Level
Lilliefors Test Statistic 0.0668 Lilliefors Lognormal GOF Test
5% Lilliefors Critical Value 0.0961 Data appear Lognormal at 5% Significance Level
Appendix C, Ambient Metals Technical MemorandumUC Berkeley, Richmond Field Station Site Page 13 of 16

UCL Statistics for Uncensored Full Data Sets
95% Chebyshev (MVUE) UCL 48.71 97.5% Chebyshev (MVUE) UCL 52.66
Maximum of Logged Data
Lognormal Statistics
Minimum of Logged Data 2.116 Mean of logged Data 3.571
Data appear Lognormal at 5% Significance Level
95% Standard Bootstrap UCL 45.26
5.561 SD of logged Data 0.466
95% Hall's Bootstrap UCL 68.19 95% Percentile Bootstrap UCL 46.07
95% Bootstrap-t UCL 49.4
99% Chebyshev (MVUE) UCL 60.42
Assuming Lognormal Distribution
95% H-UCL 43.48 90% Chebyshev (MVUE) UCL 45.86
49.58 95% Chebyshev(Mean, Sd) UCL 53.79
97.5% Chebyshev(Mean, Sd) UCL 59.64 99% Chebyshev(Mean, Sd) UCL 71.13
Suggested UCL to Use
95% Student's-t UCL 45.44 or 95% Modified-t UCL 45.75
Nonparametric Distribution Free UCL Statistics
Data appear to follow a Discernible Distribution at 5% Significance Level
Nonparametric Distribution Free UCLs
or 95% H-UCL 43.48
90% Chebyshev(Mean, Sd) UCL
95% BCA Bootstrap UCL 48.47
95% CLT UCL 45.38 95% Jackknife UCL 45.44
ProUCL computes and outputs H-statistic based UCLs for historical reasons only.
H-statistic often results in unstable (both high and low) values of UCL95 as shown in examples in the Technical Guide.
It is therefore recommended to avoid the use of H-statistic based 95% UCLs.
se of nonparametric methods are preferred to compute UCL95 for skewed data sets which do not follow a gamma distribution.
Note: Suggestions regarding the selection of a 95% UCL are provided to help the user to select the most appropriate 95% UCL.
These recommendations are based upon the results of the simulation studies summarized in Singh, Singh, and Iaci (2002)
and Singh and Singh (2003). However, simulations results will not cover all Real World data sets.
For additional insight the user may want to consult a statistician.
Appendix C, Ambient Metals Technical MemorandumUC Berkeley, Richmond Field Station Site Page 14 of 16

UCL Statistics for Uncensored Full Data Sets
Ni (uncontaminated)
General Statistics
Total Number of Observations 90 Number of Distinct Observations 46
Number of Missing Observations 0
Minimum 20 Mean
Coefficient of Variation 0.663 Skewness 5.368
Maximum 280 Median 42
SD
0.0934 Data Not Normal at 5% Significance Level
Normal GOF Test
Shapiro Wilk Test Statistic 0.549 Shapiro Wilk GOF Test
5% Shapiro Wilk P Value 0 Data Not Normal at 5% Significance Level
47.26
Data Not Normal at 5% Significance Level
Assuming Normal Distribution
95% Normal UCL 95% UCLs (Adjusted for Skewness)
Lilliefors Test Statistic 0.246 Lilliefors GOF Test
5% Lilliefors Critical Value
31.35 Std. Error of Mean 3.304
95% Modified-t UCL (Johnson-1978) 53.06
Theta hat (MLE) 9.462 Theta star (bias corrected MLE) 9.774
5% K-S Critical Value 0.0944 Data Not Gamma Distributed at 5% Significance Level
Gamma GOF Test
A-D Test Statistic 2.637 Anderson-Darling Gamma GOF Test
95% Student's-t UCL 52.75 95% Adjusted-CLT UCL (Chen-1995) 54.69
5% A-D Critical Value 0.755 Data Not Gamma Distributed at 5% Significance Level
K-S Test Statistic 0.151 Kolmogrov-Smirnoff Gamma GOF Test
801.8
MLE Mean (bias corrected) 47.26 MLE Sd (bias corrected) 21.49
Approximate Chi Square Value (0.05) 802.8
Data Not Gamma Distributed at 5% Significance Level
Assuming Gamma Distribution
95% Approximate Gamma UCL (use when n>=50)) 51.23 95% Adjusted Gamma UCL (use when n<50) 51.29
Adjusted Level of Significance 0.0473 Adjusted Chi Square Value
nu hat (MLE) 898.9 nu star (bias corrected) 870.3
Gamma Statistics
k hat (MLE) 4.994 k star (bias corrected MLE) 4.835
Lognormal GOF Test
Shapiro Wilk Test Statistic 0.92 Shapiro Wilk Lognormal GOF Test
5% Shapiro Wilk P Value 8.5013E-6 Data Not Lognormal at 5% Significance Level
Lilliefors Test Statistic 0.107 Lilliefors Lognormal GOF Test
5% Lilliefors Critical Value 0.0934 Data Not Lognormal at 5% Significance Level
Appendix C, Ambient Metals Technical MemorandumUC Berkeley, Richmond Field Station Site Page 15 of 16

UCL Statistics for Uncensored Full Data Sets
90% Chebyshev (MVUE) UCL 52.43
95% Chebyshev (MVUE) UCL 55.23 97.5% Chebyshev (MVUE) UCL 59.11
Maximum of Logged Data
Lognormal Statistics
Minimum of Logged Data 2.996 Mean of logged Data 3.752
Data Not Lognormal at 5% Significance Level
Note: Suggestions regarding the selection of a 95% UCL are provided to help the user to select the most appropriate 95% UCL.
These recommendations are based upon the results of the simulation studies summarized in Singh, Singh, and Iaci (2002)
and Singh and Singh (2003). However, simulations results will not cover all Real World data sets.
95% BCA Bootstrap UCL 55.2
95% CLT UCL 52.69 95% Jackknife UCL 52.75
95% Standard Bootstrap UCL 52.74
5.635 SD of logged Data 0.407
95% Hall's Bootstrap UCL 80.44 95% Percentile Bootstrap UCL 53.31
95% Bootstrap-t UCL 57.13
99% Chebyshev (MVUE) UCL 66.74
Assuming Lognormal Distribution
95% H-UCL 50.03
90% Chebyshev(Mean, Sd) UCL 57.17 95% Chebyshev(Mean, Sd) UCL 61.66
97.5% Chebyshev(Mean, Sd) UCL 67.89 99% Chebyshev(Mean, Sd) UCL 80.13
For additional insight the user may want to consult a statistician.
Suggested UCL to Use
95% Student's-t UCL 52.75 or 95% Modified-t UCL 53.06
Nonparametric Distribution Free UCL Statistics
Data do not follow a Discernible Distribution (0.05)
Nonparametric Distribution Free UCLs
Appendix C, Ambient Metals Technical MemorandumUC Berkeley, Richmond Field Station Site Page 16 of 16

Coverage 95%
New or Future K Observations 1
mber of Bootstrap Operations 2000
From File WorkSheet.xls
Full Precision OFF
Confidence Coefficient 99%
User Selected Options
Date/Time of Computation 7/30/2015 3:51:18 PM
Background Statistics for Uncensored Full Data Sets
Second Largest 19100 Median 15700
Maximum 20300 Third Quartile 16200
Number of Missing Observations 67
Minimum 10000 First Quartile 12800
Al (contaminated)
General Statistics
Total Number of Observations 18 Number of Distinct Observations 14
Critical Values for Background Threshold Values (BTVs)
Tolerance Factor K (For UTL) 2.905 d2max (for USL) 2.821
Mean of logged Data 9.613 SD of logged Data 0.198
Mean 15228 SD 2901
Coefficient of Variation 0.19 Skewness -0.111
Background Statistics Assuming Normal Distribution
99% UTL with 95% Coverage 23654 90% Percentile (z) 18945
5% Lilliefors Critical Value 0.209 Data appear Normal at 5% Significance Level
Data appear Normal at 5% Significance Level
5% Shapiro Wilk Critical Value 0.897 Data appear Normal at 5% Significance Level
Lilliefors Test Statistic 0.148 Lilliefors GOF Test
Normal GOF Test
Shapiro Wilk Test Statistic 0.957 Shapiro Wilk GOF Test
5% A-D Critical Value 0.739Detected data appear Gamma Distributed at 5% Significance Leve
K-S Test Statistic 0.173 Kolmogrov-Smirnoff Gamma GOF Test
Gamma GOF Test
A-D Test Statistic 0.467 Anderson-Darling Gamma GOF Test
99% UPL (t) 22878 95% Percentile (z) 19999
99% USL 23410 99% Percentile (z) 21976
Gamma Statistics
5% K-S Critical Value 0.203Detected data appear Gamma Distributed at 5% Significance Leve
Detected data appear Gamma Distributed at 5% Significance Level
Appendix C, Ambient Metals Technical MemorandumUC Berkeley, Richmond Field Station Site Page 1 of 16

Background Statistics for Uncensored Full Data Sets
Theta hat (MLE) 546.5 Theta star (bias corrected MLE) 654.7
nu hat (MLE) 1003 nu star (bias corrected) 837.3
k hat (MLE) 27.87 k star (bias corrected MLE) 23.26
99% Hawkins Wixley (HW) Approx. Gamma UPL 24454 95% Percentile 20766
99% WH Approx. Gamma UTL with 95% Coverage 25328 99% Percentile 23519
Background Statistics Assuming Gamma Distribution
99% Wilson Hilferty (WH) Approx. Gamma UPL 24229 90% Percentile 19388
MLE Mean (bias corrected) 15228 MLE Sd (bias corrected) 3158
5% Shapiro Wilk Critical Value 0.897 Data appear Lognormal at 5% Significance Level
Lilliefors Test Statistic 0.183 Lilliefors Lognormal GOF Test
Lognormal GOF Test
Shapiro Wilk Test Statistic 0.944 Shapiro Wilk Lognormal GOF Test
99% HW Approx. Gamma UTL with 95% Coverage 25613
99% WH USL 24979 99% HW USL 25244
99% UPL (t) 25243 95% Percentile (z) 20729
99% USL 26179 99% Percentile (z) 23732
Background Statistics assuming Lognormal Distribution
99% UTL with 95% Coverage 26620 90% Percentile (z) 19287
5% Lilliefors Critical Value 0.209 Data appear Lognormal at 5% Significance Level
Data appear Lognormal at 5% Significance Level
99% Percentile Bootstrap UTL with 95% Coverage 20300 99% BCA Bootstrap UTL with 95% Coverage 20300
99% UPL 20300 90% Percentile 18820
Order of Statistic, r 18 99% UTL with 95% Coverage 20300
Approximate f 0.947 Confidence Coefficient (CC) achieved by UTL 0.603
Nonparametric Distribution Free Background Statistics
Data appear Normal at 5% Significance Level
Nonparametric Upper Limits for Background Threshold Values
data set free of outliers and consists of observations collected from clean unimpacted locations.
The use of USL tends to provide a balance between false positives and false negatives provided the data
represents a background data set and when many onsite observations need to be compared with the BTV.
99% USL 20300
Note: The use of USL to estimate a BTV is recommended only when the data set represents a background
90% Chebyshev UPL 24168 95% Percentile 19280
95% Chebyshev UPL 28218 99% Percentile 20096
Appendix C, Ambient Metals Technical MemorandumUC Berkeley, Richmond Field Station Site Page 2 of 16

Background Statistics for Uncensored Full Data Sets
Al (uncontaminated)
Second Largest 27000 Median 19000
Maximum 28000 Third Quartile 21500
Number of Missing Observations 19
Minimum 8500 First Quartile 15000
General Statistics
Total Number of Observations 71 Number of Distinct Observations 19
Critical Values for Background Threshold Values (BTVs)
Tolerance Factor K (For UTL) 2.15 d2max (for USL) 3.476
Mean of logged Data 9.803 SD of logged Data 0.251
Mean 18641 SD 4456
Coefficient of Variation 0.239 Skewness 0.0894
Background Statistics Assuming Normal Distribution
99% UTL with 95% Coverage 28220 90% Percentile (z) 24352
5% Lilliefors Critical Value 0.105 Data appear Normal at 5% Significance Level
Data appear Normal at 5% Significance Level
5% Shapiro Wilk P Value 0.203 Data appear Normal at 5% Significance Level
Lilliefors Test Statistic 0.0955 Lilliefors GOF Test
Normal GOF Test
Shapiro Wilk Test Statistic 0.968 Normal GOF Test
5% A-D Critical Value 0.75 Detected data appear Gamma Distributed at 5% Significance Leve
K-S Test Statistic 0.127 Kolmogrov-Smirnoff Gamma GOF Test
Gamma GOF Test
A-D Test Statistic 0.53 Anderson-Darling Gamma GOF Test
99% UPL (t) 29325 95% Percentile (z) 25971
99% USL 34132 99% Percentile (z) 29008
Theta hat (MLE) 1101 Theta star (bias corrected MLE) 1149
nu hat (MLE) 2403 nu star (bias corrected) 2303
Gamma Statistics
k hat (MLE) 16.93 k star (bias corrected MLE) 16.22
5% K-S Critical Value 0.106 Data Not Gamma Distributed at 5% Significance Level
Detected data follow Appr. Gamma Distribution at 5% Significance Level
99% Hawkins Wixley (HW) Approx. Gamma UPL 31705 95% Percentile 26850
99% WH Approx. Gamma UTL with 95% Coverage 29772 99% Percentile 31061
Background Statistics Assuming Gamma Distribution
99% Wilson Hilferty (WH) Approx. Gamma UPL 31344 90% Percentile 24764
MLE Mean (bias corrected) 18641 MLE Sd (bias corrected) 4629
99% HW Approx. Gamma UTL with 95% Coverage 30045
Appendix C, Ambient Metals Technical MemorandumUC Berkeley, Richmond Field Station Site Page 3 of 16

Background Statistics for Uncensored Full Data Sets
5% Shapiro Wilk P Value 0.113 Data appear Lognormal at 5% Significance Level
Lilliefors Test Statistic 0.141 Lilliefors Lognormal GOF Test
Lognormal GOF Test
Shapiro Wilk Test Statistic 0.964 Shapiro Wilk Lognormal GOF Test
99% WH USL 38834 99% HW USL 39744
99% UPL (t) 33016 95% Percentile (z) 27335
99% USL 43278 99% Percentile (z) 32432
Background Statistics assuming Lognormal Distribution
99% UTL with 95% Coverage 31026 90% Percentile (z) 24954
5% Lilliefors Critical Value 0.105 Data Not Lognormal at 5% Significance Level
Data appear Approximate Lognormal at 5% Significance Level
99% Percentile Bootstrap UTL with 95% Coverage 27500 99% BCA Bootstrap UTL with 95% Coverage 26500
99% UPL 28000 90% Percentile 25000
Order of Statistic, r 71 99% UTL with 95% Coverage 28000
Approximate f 3.737 Confidence Coefficient (CC) achieved by UTL 0.974
Nonparametric Distribution Free Background Statistics
Data appear Normal at 5% Significance Level
Nonparametric Upper Limits for Background Threshold Values
data set free of outliers and consists of observations collected from clean unimpacted locations.
The use of USL tends to provide a balance between false positives and false negatives provided the data
represents a background data set and when many onsite observations need to be compared with the BTV.
99% USL 28000
Note: The use of USL to estimate a BTV is recommended only when the data set represents a background
90% Chebyshev UPL 32104 95% Percentile 26000
95% Chebyshev UPL 38202 99% Percentile 27300
Appendix C, Ambient Metals Technical MemorandumUC Berkeley, Richmond Field Station Site Page 4 of 16

Background Statistics for Uncensored Full Data Sets
Co (contaminated)
Second Largest 19.7 Median 11
Maximum 32 Third Quartile 13.38
Number of Missing Observations 61
Minimum 2.82 First Quartile 9.5
General Statistics
Total Number of Observations 24 Number of Distinct Observations 23
Critical Values for Background Threshold Values (BTVs)
Tolerance Factor K (For UTL) 2.662 d2max (for USL) 2.987
Mean of logged Data 2.396 SD of logged Data 0.486
Mean 12.18 SD 5.779
Coefficient of Variation 0.474 Skewness 1.736
Background Statistics Assuming Normal Distribution
99% UTL with 95% Coverage 27.57 90% Percentile (z) 19.59
5% Lilliefors Critical Value 0.181 Data Not Normal at 5% Significance Level
Data Not Normal at 5% Significance Level
5% Shapiro Wilk Critical Value 0.916 Data Not Normal at 5% Significance Level
Lilliefors Test Statistic 0.21 Lilliefors GOF Test
Normal GOF Test
Shapiro Wilk Test Statistic 0.849 Shapiro Wilk GOF Test
5% A-D Critical Value 0.746 Data Not Gamma Distributed at 5% Significance Level
K-S Test Statistic 0.154 Kolmogrov-Smirnoff Gamma GOF Test
Gamma GOF Test
A-D Test Statistic 0.78 Anderson-Darling Gamma GOF Test
99% UPL (t) 26.93 95% Percentile (z) 21.69
99% USL 29.44 99% Percentile (z) 25.63
Theta hat (MLE) 2.448 Theta star (bias corrected MLE) 2.78
nu hat (MLE) 238.8 nu star (bias corrected) 210.3
Gamma Statistics
k hat (MLE) 4.975 k star (bias corrected MLE) 4.381
5% K-S Critical Value 0.178Detected data appear Gamma Distributed at 5% Significance Leve
Detected data follow Appr. Gamma Distribution at 5% Significance Level
99% Hawkins Wixley (HW) Approx. Gamma UPL 32.19 95% Percentile 23.06
99% WH Approx. Gamma UTL with 95% Coverage 32.18 99% Percentile 29.6
Background Statistics Assuming Gamma Distribution
99% Wilson Hilferty (WH) Approx. Gamma UPL 31.02 90% Percentile 19.98
MLE Mean (bias corrected) 12.18 MLE Sd (bias corrected) 5.82
99% HW Approx. Gamma UTL with 95% Coverage 33.5
Appendix C, Ambient Metals Technical MemorandumUC Berkeley, Richmond Field Station Site Page 5 of 16
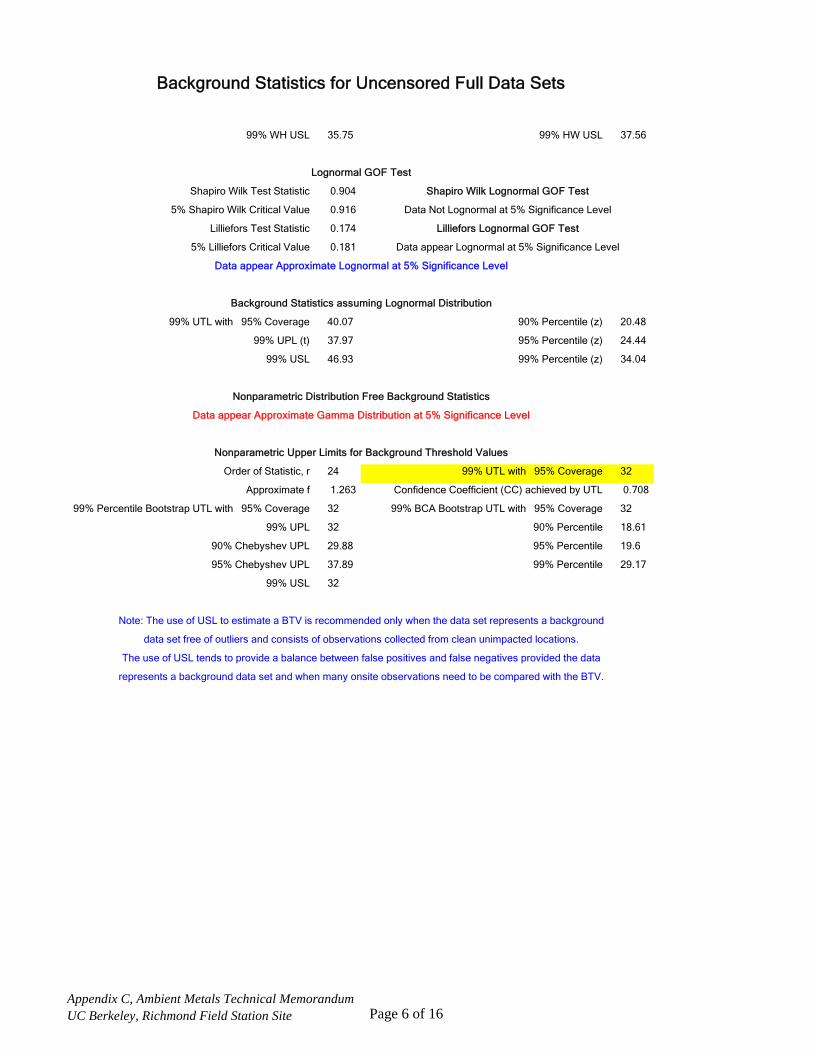
Background Statistics for Uncensored Full Data Sets
5% Shapiro Wilk Critical Value 0.916 Data Not Lognormal at 5% Significance Level
Lilliefors Test Statistic 0.174 Lilliefors Lognormal GOF Test
Lognormal GOF Test
Shapiro Wilk Test Statistic 0.904 Shapiro Wilk Lognormal GOF Test
99% WH USL 35.75 99% HW USL 37.56
99% UPL (t) 37.97 95% Percentile (z) 24.44
99% USL 46.93 99% Percentile (z) 34.04
Background Statistics assuming Lognormal Distribution
99% UTL with 95% Coverage 40.07 90% Percentile (z) 20.48
5% Lilliefors Critical Value 0.181 Data appear Lognormal at 5% Significance Level
Data appear Approximate Lognormal at 5% Significance Level
99% Percentile Bootstrap UTL with 95% Coverage 32 99% BCA Bootstrap UTL with 95% Coverage 32
99% UPL 32 90% Percentile 18.61
Order of Statistic, r 24 99% UTL with 95% Coverage 32
Approximate f 1.263 Confidence Coefficient (CC) achieved by UTL 0.708
Nonparametric Distribution Free Background Statistics
Data appear Approximate Gamma Distribution at 5% Significance Level
Nonparametric Upper Limits for Background Threshold Values
data set free of outliers and consists of observations collected from clean unimpacted locations.
The use of USL tends to provide a balance between false positives and false negatives provided the data
represents a background data set and when many onsite observations need to be compared with the BTV.
99% USL 32
Note: The use of USL to estimate a BTV is recommended only when the data set represents a background
90% Chebyshev UPL 29.88 95% Percentile 19.6
95% Chebyshev UPL 37.89 99% Percentile 29.17
Appendix C, Ambient Metals Technical MemorandumUC Berkeley, Richmond Field Station Site Page 6 of 16
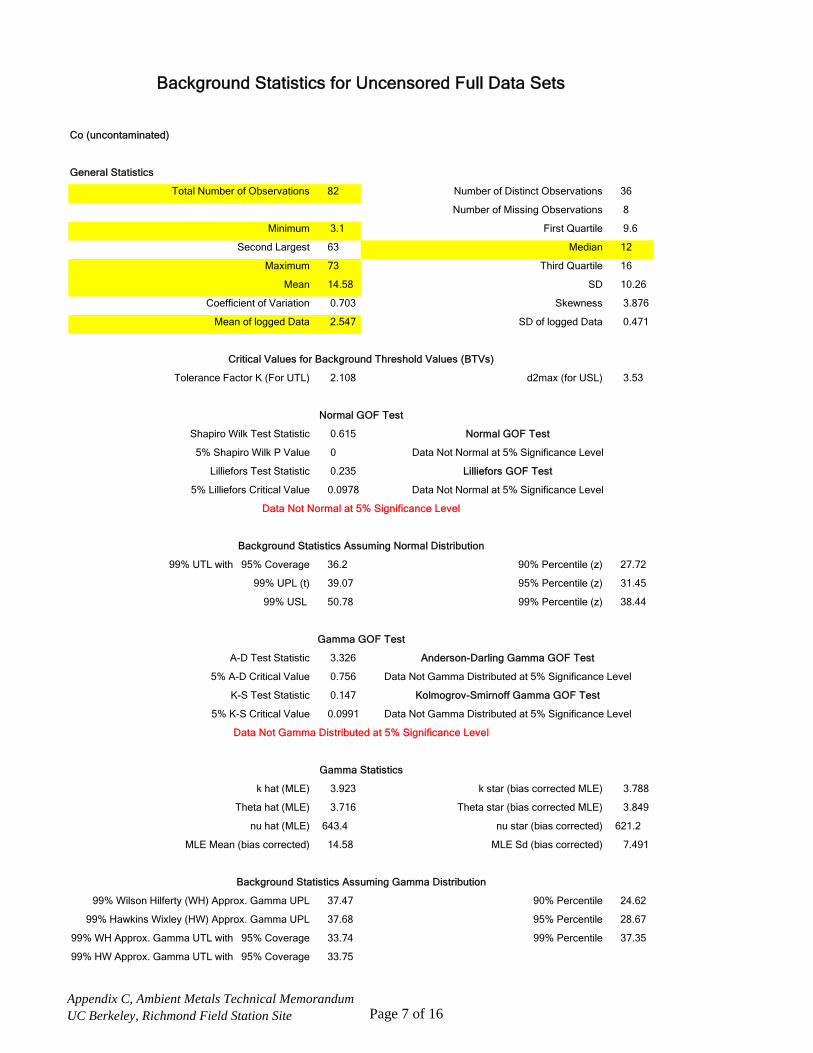
Background Statistics for Uncensored Full Data Sets
Co (uncontaminated)
Second Largest 63 Median 12
Maximum 73 Third Quartile 16
Number of Missing Observations 8
Minimum 3.1 First Quartile 9.6
General Statistics
Total Number of Observations 82 Number of Distinct Observations 36
Critical Values for Background Threshold Values (BTVs)
Tolerance Factor K (For UTL) 2.108 d2max (for USL) 3.53
Mean of logged Data 2.547 SD of logged Data 0.471
Mean 14.58 SD 10.26
Coefficient of Variation 0.703 Skewness 3.876
Background Statistics Assuming Normal Distribution
99% UTL with 95% Coverage 36.2 90% Percentile (z) 27.72
5% Lilliefors Critical Value 0.0978 Data Not Normal at 5% Significance Level
Data Not Normal at 5% Significance Level
5% Shapiro Wilk P Value 0 Data Not Normal at 5% Significance Level
Lilliefors Test Statistic 0.235 Lilliefors GOF Test
Normal GOF Test
Shapiro Wilk Test Statistic 0.615 Normal GOF Test
5% A-D Critical Value 0.756 Data Not Gamma Distributed at 5% Significance Level
K-S Test Statistic 0.147 Kolmogrov-Smirnoff Gamma GOF Test
Gamma GOF Test
A-D Test Statistic 3.326 Anderson-Darling Gamma GOF Test
99% UPL (t) 39.07 95% Percentile (z) 31.45
99% USL 50.78 99% Percentile (z) 38.44
Theta hat (MLE) 3.716 Theta star (bias corrected MLE) 3.849
nu hat (MLE) 643.4 nu star (bias corrected) 621.2
Gamma Statistics
k hat (MLE) 3.923 k star (bias corrected MLE) 3.788
5% K-S Critical Value 0.0991 Data Not Gamma Distributed at 5% Significance Level
Data Not Gamma Distributed at 5% Significance Level
99% Hawkins Wixley (HW) Approx. Gamma UPL 37.68 95% Percentile 28.67
99% WH Approx. Gamma UTL with 95% Coverage 33.74 99% Percentile 37.35
Background Statistics Assuming Gamma Distribution
99% Wilson Hilferty (WH) Approx. Gamma UPL 37.47 90% Percentile 24.62
MLE Mean (bias corrected) 14.58 MLE Sd (bias corrected) 7.491
99% HW Approx. Gamma UTL with 95% Coverage 33.75
Appendix C, Ambient Metals Technical MemorandumUC Berkeley, Richmond Field Station Site Page 7 of 16

Background Statistics for Uncensored Full Data Sets
5% Shapiro Wilk P Value 3.1077E-4 Data Not Lognormal at 5% Significance Level
Lilliefors Test Statistic 0.113 Lilliefors Lognormal GOF Test
Lognormal GOF Test
Shapiro Wilk Test Statistic 0.933 Shapiro Wilk Lognormal GOF Test
99% WH USL 55.5 99% HW USL 57.36
99% UPL (t) 39.33 95% Percentile (z) 27.71
99% USL 67.38 99% Percentile (z) 38.21
Background Statistics assuming Lognormal Distribution
99% UTL with 95% Coverage 34.47 90% Percentile (z) 23.35
5% Lilliefors Critical Value 0.0978 Data Not Lognormal at 5% Significance Level
Data Not Lognormal at 5% Significance Level
99% Percentile Bootstrap UTL with 95% Coverage 63 99% BCA Bootstrap UTL with 95% Coverage 63
99% UPL 73 90% Percentile 21.9
Order of Statistic, r 81 99% UTL with 95% Coverage 63
Approximate f 2.132 Confidence Coefficient (CC) achieved by UTL 0.921
Nonparametric Distribution Free Background Statistics
Data do not follow a Discernible Distribution (0.05)
Nonparametric Upper Limits for Background Threshold Values
data set free of outliers and consists of observations collected from clean unimpacted locations.
The use of USL tends to provide a balance between false positives and false negatives provided the data
represents a background data set and when many onsite observations need to be compared with the BTV.
99% USL 73
Note: The use of USL to estimate a BTV is recommended only when the data set represents a background
90% Chebyshev UPL 45.53 95% Percentile 25.95
95% Chebyshev UPL 59.55 99% Percentile 64.9
Appendix C, Ambient Metals Technical MemorandumUC Berkeley, Richmond Field Station Site Page 8 of 16

Background Statistics for Uncensored Full Data Sets
Mn (contaminated)
Second Largest 1520 Median 513
Maximum 1700 Third Quartile 669.8
Number of Missing Observations 61
Minimum 130 First Quartile 344.3
General Statistics
Total Number of Observations 24 Number of Distinct Observations 24
Critical Values for Background Threshold Values (BTVs)
Tolerance Factor K (For UTL) 2.662 d2max (for USL) 2.987
Mean of logged Data 6.177 SD of logged Data 0.612
Mean 574.8 SD 375.8
Coefficient of Variation 0.654 Skewness 1.802
Background Statistics Assuming Normal Distribution
99% UTL with 95% Coverage 1575 90% Percentile (z) 1056
5% Lilliefors Critical Value 0.181 Data Not Normal at 5% Significance Level
Data Not Normal at 5% Significance Level
5% Shapiro Wilk Critical Value 0.916 Data Not Normal at 5% Significance Level
Lilliefors Test Statistic 0.183 Lilliefors GOF Test
Normal GOF Test
Shapiro Wilk Test Statistic 0.822 Shapiro Wilk GOF Test
5% A-D Critical Value 0.751Detected data appear Gamma Distributed at 5% Significance Leve
K-S Test Statistic 0.109 Kolmogrov-Smirnoff Gamma GOF Test
Gamma GOF Test
A-D Test Statistic 0.346 Anderson-Darling Gamma GOF Test
99% UPL (t) 1534 95% Percentile (z) 1193
99% USL 1697 99% Percentile (z) 1449
Theta hat (MLE) 193 Theta star (bias corrected MLE) 218.3
nu hat (MLE) 143 nu star (bias corrected) 126.4
Gamma Statistics
k hat (MLE) 2.978 k star (bias corrected MLE) 2.634
5% K-S Critical Value 0.179Detected data appear Gamma Distributed at 5% Significance Leve
Detected data appear Gamma Distributed at 5% Significance Level
99% Hawkins Wixley (HW) Approx. Gamma UPL 1882 95% Percentile 1253
99% WH Approx. Gamma UTL with 95% Coverage 1884 99% Percentile 1697
Background Statistics Assuming Gamma Distribution
99% Wilson Hilferty (WH) Approx. Gamma UPL 1802 90% Percentile 1050
MLE Mean (bias corrected) 574.8 MLE Sd (bias corrected) 354.2
99% HW Approx. Gamma UTL with 95% Coverage 1976
Appendix C, Ambient Metals Technical MemorandumUC Berkeley, Richmond Field Station Site Page 9 of 16

Background Statistics for Uncensored Full Data Sets
5% Shapiro Wilk Critical Value 0.916 Data appear Lognormal at 5% Significance Level
Lilliefors Test Statistic 0.0904 Lilliefors Lognormal GOF Test
Lognormal GOF Test
Shapiro Wilk Test Statistic 0.976 Shapiro Wilk Lognormal GOF Test
99% WH USL 2138 99% HW USL 2270
99% UPL (t) 2294 95% Percentile (z) 1317
99% USL 2994 99% Percentile (z) 1999
Background Statistics assuming Lognormal Distribution
99% UTL with 95% Coverage 2455 90% Percentile (z) 1055
5% Lilliefors Critical Value 0.181 Data appear Lognormal at 5% Significance Level
Data appear Lognormal at 5% Significance Level
99% Percentile Bootstrap UTL with 95% Coverage 1700 99% BCA Bootstrap UTL with 95% Coverage 1700
99% UPL 1700 90% Percentile 857.7
Order of Statistic, r 24 99% UTL with 95% Coverage 1700
Approximate f 1.263 Confidence Coefficient (CC) achieved by UTL 0.708
Nonparametric Distribution Free Background Statistics
Data appear Gamma Distributed at 5% Significance Level
Nonparametric Upper Limits for Background Threshold Values
data set free of outliers and consists of observations collected from clean unimpacted locations.
The use of USL tends to provide a balance between false positives and false negatives provided the data
represents a background data set and when many onsite observations need to be compared with the BTV.
99% USL 1700
Note: The use of USL to estimate a BTV is recommended only when the data set represents a background
90% Chebyshev UPL 1726 95% Percentile 1422
95% Chebyshev UPL 2247 99% Percentile 1659
Appendix C, Ambient Metals Technical MemorandumUC Berkeley, Richmond Field Station Site Page 10 of 16

Background Statistics for Uncensored Full Data Sets
Mn (uncontaminated)
Second Largest 2900 Median 630
Maximum 5900 Third Quartile 790
Number of Missing Observations 8
Minimum 120 First Quartile 530
General Statistics
Total Number of Observations 82 Number of Distinct Observations 50
Critical Values for Background Threshold Values (BTVs)
Tolerance Factor K (For UTL) 2.108 d2max (for USL) 3.53
Mean of logged Data 6.469 SD of logged Data 0.522
Mean 765 SD 699.4
Coefficient of Variation 0.914 Skewness 5.531
Background Statistics Assuming Normal Distribution
99% UTL with 95% Coverage 2239 90% Percentile (z) 1661
5% Lilliefors Critical Value 0.0978 Data Not Normal at 5% Significance Level
Data Not Normal at 5% Significance Level
5% Shapiro Wilk P Value 0 Data Not Normal at 5% Significance Level
Lilliefors Test Statistic 0.275 Lilliefors GOF Test
Normal GOF Test
Shapiro Wilk Test Statistic 0.497 Normal GOF Test
5% K-S Critical Value 0.0994 Data Not Gamma Distributed at 5% Significance Level
Data Not Gamma Distributed at 5% Significance Level
5% A-D Critical Value 0.759 Data Not Gamma Distributed at 5% Significance Level
K-S Test Statistic 0.183 Kolmogrov-Smirnoff Gamma GOF Test
Gamma GOF Test
A-D Test Statistic 4.3 Anderson-Darling Gamma GOF Test
99% UPL (t) 2435 95% Percentile (z) 1915
99% USL 3234 99% Percentile (z) 2392
MLE Mean (bias corrected) 765 MLE Sd (bias corrected) 443.1
Theta hat (MLE) 248 Theta star (bias corrected MLE) 256.7
nu hat (MLE) 506 nu star (bias corrected) 488.8
Gamma Statistics
k hat (MLE) 3.085 k star (bias corrected MLE) 2.98
99% HW Approx. Gamma UTL with 95% Coverage 1895
99% Hawkins Wixley (HW) Approx. Gamma UPL 2137 95% Percentile 1608
99% WH Approx. Gamma UTL with 95% Coverage 1904 99% Percentile 2149
Background Statistics Assuming Gamma Distribution
99% Wilson Hilferty (WH) Approx. Gamma UPL 2134 90% Percentile 1359
Appendix C, Ambient Metals Technical MemorandumUC Berkeley, Richmond Field Station Site Page 11 of 16

Background Statistics for Uncensored Full Data Sets
99% WH USL 3265 99% HW USL 3370
Background Statistics assuming Lognormal Distribution
99% UTL with 95% Coverage 1938 90% Percentile (z) 1259
5% Lilliefors Critical Value 0.0978 Data Not Lognormal at 5% Significance Level
Data Not Lognormal at 5% Significance Level
5% Shapiro Wilk P Value 4.5594E-5 Data Not Lognormal at 5% Significance Level
Lilliefors Test Statistic 0.129 Lilliefors Lognormal GOF Test
Lognormal GOF Test
Shapiro Wilk Test Statistic 0.923 Shapiro Wilk Lognormal GOF Test
Order of Statistic, r 81 99% UTL with 95% Coverage 2900
Approximate f 2.132 Confidence Coefficient (CC) achieved by UTL 0.921
Nonparametric Distribution Free Background Statistics
Data do not follow a Discernible Distribution (0.05)
Nonparametric Upper Limits for Background Threshold Values
99% UPL (t) 2243 95% Percentile (z) 1522
99% USL 4070 99% Percentile (z) 2172
99% USL 5900
Note: The use of USL to estimate a BTV is recommended only when the data set represents a background
90% Chebyshev UPL 2876 95% Percentile 1295
95% Chebyshev UPL 3832 99% Percentile 3470
99% Percentile Bootstrap UTL with 95% Coverage 2900 99% BCA Bootstrap UTL with 95% Coverage 2880
99% UPL 5900 90% Percentile 1100
data set free of outliers and consists of observations collected from clean unimpacted locations.
The use of USL tends to provide a balance between false positives and false negatives provided the data
represents a background data set and when many onsite observations need to be compared with the BTV.
Appendix C, Ambient Metals Technical MemorandumUC Berkeley, Richmond Field Station Site Page 12 of 16

Background Statistics for Uncensored Full Data Sets
Minimum 8.3 First Quartile 27
Second Largest 85 Median 34
General Statistics
Total Number of Observations 85 Number of Distinct Observations 59
Ni (contaminated)
Critical Values for Background Threshold Values (BTVs)
Tolerance Factor K (For UTL) 2.098 d2max (for USL) 3.543
Coefficient of Variation 0.71 Skewness 5.617
Mean of logged Data 3.571 SD of logged Data 0.466
Maximum 260 Third Quartile 46
Mean 40.28 SD 28.59
Background Statistics Assuming Normal Distribution
99% UTL with 95% Coverage 100.3 90% Percentile (z) 76.92
5% Lilliefors Critical Value 0.0961 Data Not Normal at 5% Significance Level
Data Not Normal at 5% Significance Level
5% Shapiro Wilk P Value 0 Data Not Normal at 5% Significance Level
Lilliefors Test Statistic 0.191 Lilliefors GOF Test
Normal GOF Test
Shapiro Wilk Test Statistic 0.578 Normal GOF Test
5% K-S Critical Value 0.0973 Data Not Gamma Distributed at 5% Significance Level
Data Not Gamma Distributed at 5% Significance Level
5% A-D Critical Value 0.756 Data Not Gamma Distributed at 5% Significance Level
K-S Test Statistic 0.107 Kolmogrov-Smirnoff Gamma GOF Test
Gamma GOF Test
A-D Test Statistic 1.836 Anderson-Darling Gamma GOF Test
99% UPL (t) 108.5 95% Percentile (z) 87.3
99% USL 141.6 99% Percentile (z) 106.8
MLE Mean (bias corrected) 40.28 MLE Sd (bias corrected) 20.07
Theta hat (MLE) 9.663 Theta star (bias corrected MLE) 9.997
nu hat (MLE) 708.6 nu star (bias corrected) 684.9
Gamma Statistics
k hat (MLE) 4.168 k star (bias corrected MLE) 4.029
99% HW Approx. Gamma UTL with 95% Coverage 91.12
99% WH USL 148.9 99% HW USL 154.2
99% Hawkins Wixley (HW) Approx. Gamma UPL 101.8 95% Percentile 77.93
99% WH Approx. Gamma UTL with 95% Coverage 90.9 99% Percentile 100.9
Background Statistics Assuming Gamma Distribution
99% Wilson Hilferty (WH) Approx. Gamma UPL 100.9 90% Percentile 67.17
Appendix C, Ambient Metals Technical MemorandumUC Berkeley, Richmond Field Station Site Page 13 of 16
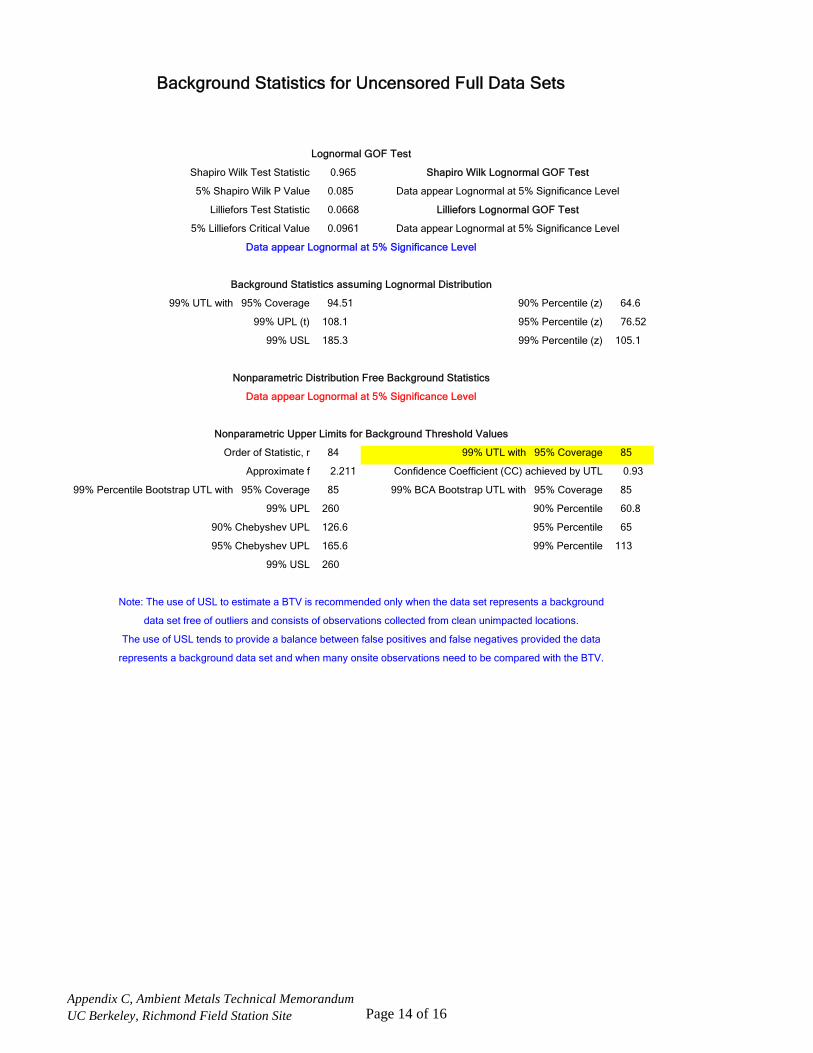
Background Statistics for Uncensored Full Data Sets
Background Statistics assuming Lognormal Distribution
99% UTL with 95% Coverage 94.51 90% Percentile (z) 64.6
5% Lilliefors Critical Value 0.0961 Data appear Lognormal at 5% Significance Level
Data appear Lognormal at 5% Significance Level
5% Shapiro Wilk P Value 0.085 Data appear Lognormal at 5% Significance Level
Lilliefors Test Statistic 0.0668 Lilliefors Lognormal GOF Test
Lognormal GOF Test
Shapiro Wilk Test Statistic 0.965 Shapiro Wilk Lognormal GOF Test
Order of Statistic, r 84 99% UTL with 95% Coverage 85
Approximate f 2.211 Confidence Coefficient (CC) achieved by UTL 0.93
Nonparametric Distribution Free Background Statistics
Data appear Lognormal at 5% Significance Level
Nonparametric Upper Limits for Background Threshold Values
99% UPL (t) 108.1 95% Percentile (z) 76.52
99% USL 185.3 99% Percentile (z) 105.1
99% USL 260
Note: The use of USL to estimate a BTV is recommended only when the data set represents a background
90% Chebyshev UPL 126.6 95% Percentile 65
95% Chebyshev UPL 165.6 99% Percentile 113
99% Percentile Bootstrap UTL with 95% Coverage 85 99% BCA Bootstrap UTL with 95% Coverage 85
99% UPL 260 90% Percentile 60.8
data set free of outliers and consists of observations collected from clean unimpacted locations.
The use of USL tends to provide a balance between false positives and false negatives provided the data
represents a background data set and when many onsite observations need to be compared with the BTV.
Appendix C, Ambient Metals Technical MemorandumUC Berkeley, Richmond Field Station Site Page 14 of 16

Background Statistics for Uncensored Full Data Sets
Minimum 20 First Quartile 33.25
Second Largest 170 Median 42
General Statistics
Total Number of Observations 90 Number of Distinct Observations 46
Ni (uncontaminated)
Critical Values for Background Threshold Values (BTVs)
Tolerance Factor K (For UTL) 2.083 d2max (for USL) 3.563
Coefficient of Variation 0.663 Skewness 5.368
Mean of logged Data 3.752 SD of logged Data 0.407
Maximum 280 Third Quartile 52
Mean 47.26 SD 31.35
Background Statistics Assuming Normal Distribution
99% UTL with 95% Coverage 112.6 90% Percentile (z) 87.43
5% Lilliefors Critical Value 0.0934 Data Not Normal at 5% Significance Level
Data Not Normal at 5% Significance Level
5% Shapiro Wilk P Value 0 Data Not Normal at 5% Significance Level
Lilliefors Test Statistic 0.246 Lilliefors GOF Test
Normal GOF Test
Shapiro Wilk Test Statistic 0.549 Normal GOF Test
5% A-D Critical Value 0.755 Data Not Gamma Distributed at 5% Significance Level
K-S Test Statistic 0.151 Kolmogrov-Smirnoff Gamma GOF Test
Gamma GOF Test
A-D Test Statistic 2.637 Anderson-Darling Gamma GOF Test
99% UPL (t) 121.9 95% Percentile (z) 98.81
99% USL 158.9 99% Percentile (z) 120.2
Theta hat (MLE) 9.462 Theta star (bias corrected MLE) 9.774
nu hat (MLE) 898.9 nu star (bias corrected) 870.3
Gamma Statistics
k hat (MLE) 4.994 k star (bias corrected MLE) 4.835
5% K-S Critical Value 0.0944 Data Not Gamma Distributed at 5% Significance Level
Data Not Gamma Distributed at 5% Significance Level
99% Hawkins Wixley (HW) Approx. Gamma UPL 110.7 95% Percentile 87.24
99% WH Approx. Gamma UTL with 95% Coverage 100.1 99% Percentile 110.9
Background Statistics Assuming Gamma Distribution
99% Wilson Hilferty (WH) Approx. Gamma UPL 110.8 90% Percentile 76.03
MLE Mean (bias corrected) 47.26 MLE Sd (bias corrected) 21.49
99% HW Approx. Gamma UTL with 95% Coverage 99.57
99% WH USL 160.7 99% HW USL 163.9
Appendix C, Ambient Metals Technical MemorandumUC Berkeley, Richmond Field Station Site Page 15 of 16

Background Statistics for Uncensored Full Data Sets
5% Shapiro Wilk P Value 8.5013E-6 Data Not Lognormal at 5% Significance Level
Lilliefors Test Statistic 0.107 Lilliefors Lognormal GOF Test
Lognormal GOF Test
Shapiro Wilk Test Statistic 0.92 Shapiro Wilk Lognormal GOF Test
99% UPL (t) 112.4 95% Percentile (z) 83.28
99% USL 181.9 99% Percentile (z) 109.9
Background Statistics assuming Lognormal Distribution
99% UTL with 95% Coverage 99.55 90% Percentile (z) 71.82
5% Lilliefors Critical Value 0.0934 Data Not Lognormal at 5% Significance Level
Data Not Lognormal at 5% Significance Level
99% Percentile Bootstrap UTL with 95% Coverage 170 99% BCA Bootstrap UTL with 95% Coverage 170
99% UPL 280 90% Percentile 62.3
Order of Statistic, r 89 99% UTL with 95% Coverage 170
Approximate f 2.342 Confidence Coefficient (CC) achieved by UTL 0.943
Nonparametric Distribution Free Background Statistics
Data do not follow a Discernible Distribution (0.05)
Nonparametric Upper Limits for Background Threshold Values
data set free of outliers and consists of observations collected from clean unimpacted locations.
The use of USL tends to provide a balance between false positives and false negatives provided the data
represents a background data set and when many onsite observations need to be compared with the BTV.
99% USL 280
Note: The use of USL to estimate a BTV is recommended only when the data set represents a background
90% Chebyshev UPL 141.8 95% Percentile 74.75
95% Chebyshev UPL 184.6 99% Percentile 182.1
Appendix C, Ambient Metals Technical MemorandumUC Berkeley, Richmond Field Station Site Page 16 of 16

17 2.360 0.050
Conclusion with Alpha = 0.05
Two variances appear to be equal
Numerator DF Denominator DF F-Test Value P-Value
70
Variance of Sample 2 19858451
Test of Equality of Variances
Variance of Sample 1 8413889
Conclusion with Alpha = 0.050
Student t (Pooled) Test: Do Not Reject H0, Conclude Sample 1 <= Sample 2
Welch-Satterthwaite Test: Do Not Reject H0, Conclude Sample 1 <= Sample 2
t-Test Critical
Welch-Satterthwaite (Unequal V 40.0 -3.949 1.684 1.000
Method DF Value t (0.05) P-Value
Mean 15228 18641
Median 15700 19000
Pooled SD 4197.875
SE of Mean 683.7 528.9
Pooled (Equal Variance) 87 -3.081 1.663 0.999
Sample 1 vs Sample 2 Two-Sample t-Test
H0: Mean of Sample 1 - Mean of Sample 2 <= 0
SD 2901 4456
Number of Valid Observations 18 71
Number of Missing Observations 67 19
Number of Distinct Observations 14 19
Minimum 10000 8500
Maximum 20300 28000
Raw Statistics
Sample 1 Sample 2
Sample 1 Data: Al(contaminated)
Sample 2 Data: Al(uncontaminated)
Alternative Hypothesis Sample 1 Mean > the Sample 2 Mean
t-Test Sample 1 vs Sample 2 Comparison for Uncensored Full Data Sets without NDs
User Selected Options
Date/Time of Computation 7/30/2015 4:19:35 PM
From File WorkSheet_a.xls
Full Precision OFF
Confidence Coefficient 95%
Substantial Difference (S) 0.000
Selected Null Hypothesis Sample 1 Mean <= Sample 2 Mean (Form 1)
Appendix C, Ambient Metals Technical MemorandumUC Berkeley, Richmond Field Station Site Page 1 of 1

2.360 0.050
Conclusion with Alpha = 0.05
Two variances appear to be equal
Numerator DF Denominator DF F-Test Value P-Value
70 17
Variance of Sample 2 19858451
0.000
Pooled (Equal Variance) 87 -3.081 -1.988 1.988
Pooled SD: 4197.875
Conclusion with Alpha = 0.050
Student t (Pooled): Reject H0, Conclude Sample 1 <> Sample 2
0.003
Welch-Satterthwaite (Unequal Varian 40.0 -3.949 -2.021
Upper C.Va
2901 4456
Test of Equality of Variances
Variance of Sample 1 8413889
2.021
Welch-Satterthwaite: Reject H0, Conclude Sample 1 <> Sample 2
SD
Mean 15228 18641
Method DF Value t (0.025) t (0.975) P-Value
SE of Mean 683.7 528.9
Sample 1 vs Sample 2 Two-Sample t-Test
H0: Mean of Sample 1 = Mean of Sample 2
t-Test Lower C.Va
Minimum 10000
Raw Statistics
Sample 1 Sample 2
Median 15700 19000
Maximum 20300 28000
8500
Sample 1 Mean <> Sample 2 Mean
Number of Valid Observations 18 71
Number of Missing Observations 67 19
Sample 1 Data: Al(contaminated)
Sample 2 Data: Al(uncontaminated)
Number of Distinct Observations 14 19
Substantial Difference (S) 0.000
Selected Null Hypothesis Sample 1 Mean = Sample 2 Mean (Two Sided Alternative)
Alternative Hypothesis
t-Test Sample 1 vs Sample 2 Comparison for Uncensored Full Data Sets without NDs
User Selected Options
Date/Time of Computation 7/30/2015 4:25:58 PM
From File WorkSheet_a.xls
Full Precision OFF
Confidence Coefficient 95%
Appendix C, Ambient Metals Technical MemorandumUC Berkeley, Richmond Field Station Site Page 1 of 1

Wilcoxon-Mann-Whitney Sample 1 vs Sample 2 Comparison Test for Uncensored Full Data Sets without NDs
User Selected Options
Date/Time of Computation 7/30/2015 4:30:06 PM
Sample 1 Mean/Median > Sample 2 Mean/Median
From File WorkSheet_a.xls
Full Precision OFF
Confidence Coefficient 95%
Substantial Difference 0.000
Selected Null Hypothesis Sample 1 Mean/Median <= Sample 2 Mean/Median (Form 1)
Alternative Hypothesis
Sample 1 Data: Co(contaminated)
Sample 2 Data: Co(uncontaminated)
Raw Statistics
Sample 1 Sample 2
Number of Valid Observations 24 82
Number of Missing Observations 61 8
Number of Distinct Observations 23 36
Minimum 2.82 3.1
Maximum 32 73
1.18 1.133
Mean 12.18 14.58
Median 11 12
SD 5.779 10.26
SE of Mean
Wilcoxon-Mann-Whitney (WMW) Test
H0: Mean/Median of Sample 1 <= Mean/Median of Sample 2
0.836
Sample 1 Rank Sum W-Stat 1155
Standardized WMW U-Stat -0.979
Mean (U) 984
SD(U) - Adj ties 132.3
Approximate U-Stat Critical Value (0.05) 1.645
P-Value (Adjusted for Ties)
Conclusion with Alpha = 0.05
Do Not Reject H0, Conclude Sample 1 <= Sample 2
P-Value >= alpha (0.05)
Appendix C, Ambient Metals Technical MemorandumUC Berkeley, Richmond Field Station Site Page 1 of 1

P-Value >= alpha (0.05)
P-Value (Adjusted for Ties) 0.33
Conclusion with Alpha = 0.05
Do Not Reject H0, Conclude Sample 1 = Sample 2
SD(U) - Adj ties 132.3
Lower Approximate U-Stat Critical Value (0.025) -1.96
Upper Approximate U-Stat Critical Value (0.975) 1.96
WMW U-Stat 855
Standardized WMW U-Stat -0.975
Mean (U) 984
Sample 1 Rank Sum W-Stat 1155
SD 5.779 10.26
Wilcoxon-Mann-Whitney (WMW) Test
H0: Mean/Median of Sample 1 = Mean/Median of Sample 2
SE of Mean 1.18 1.133
Mean 12.18 14.58
Median 11 12
Minimum 2.82 3.1
Maximum 32 73
Number of Missing Observations 61 8
Number of Distinct Observations 23 36
Sample 1 Sample 2
Number of Valid Observations 24 82
Raw Statistics
Substantial Difference 0.000
Selected Null Hypothesis Sample 1 Mean/Median = Sample 2 Mean/Median (Two Sided Alternative
Alternative Hypothesis Sample 1 Mean/Median <> Sample 2 Mean/Median
Sample 1 Data: Co(contaminated)
Sample 2 Data: Co(uncontaminated)
From File WorkSheet_a.xls
Full Precision OFF
Confidence Coefficient 95%
Wilcoxon-Mann-Whitney Sample 1 vs Sample 2 Comparison Test for Uncensored Full Data Sets without NDs
User Selected Options
Date/Time of Computation 7/30/2015 4:32:22 PM
Appendix C, Ambient Metals Technical MemorandumUC Berkeley, Richmond Field Station Site Page 1 of 1

Wilcoxon-Mann-Whitney Sample 1 vs Sample 2 Comparison Test for Uncensored Full Data Sets without NDs
User Selected Options
Date/Time of Computation 7/30/2015 4:31:11 PM
Sample 1 Mean/Median > Sample 2 Mean/Median
From File WorkSheet_a.xls
Full Precision OFF
Confidence Coefficient 95%
Substantial Difference 0.000
Selected Null Hypothesis Sample 1 Mean/Median <= Sample 2 Mean/Median (Form 1)
Alternative Hypothesis
Sample 1 Data: Mn(contaminated)
Sample 2 Data: Mn(uncontaminated)
Raw Statistics
Sample 1 Sample 2
Number of Valid Observations 24 82
Number of Missing Observations 61 8
Number of Distinct Observations 24 50
Minimum 130 120
Maximum 1700 5900
76.71 77.23
Mean 574.8 765
Median 513 630
SD 375.8 699.4
SE of Mean
Wilcoxon-Mann-Whitney (WMW) Test
H0: Mean/Median of Sample 1 <= Mean/Median of Sample 2
0.987
Sample 1 Rank Sum W-Stat 991.5
Standardized WMW U-Stat -2.212
Mean (U) 984
SD(U) - Adj ties 132.4
Approximate U-Stat Critical Value (0.05) 1.645
P-Value (Adjusted for Ties)
Conclusion with Alpha = 0.05
Do Not Reject H0, Conclude Sample 1 <= Sample 2
P-Value >= alpha (0.05)
Appendix C, Ambient Metals Technical MemorandumUC Berkeley, Richmond Field Station Site Page 1 of 1

Sample 1
24 82
61 8
24 50
130 120
1700 5900
574.8 765
513 630
375.8 699.4
76.71 77.23
991.5
691.5
-2.209
984
132.4
-1.96
1.96
0.0272
Standardized WMW U-Stat
Mean (U)
SD(U) - Adj ties
ower Approximate U-Stat Critical Value (0.025)
pper Approximate U-Stat Critical Value (0.975)
P-Value (Adjusted for Ties)
Conclusion with Alpha = 0.05
Reject H0, Conclude Sample 1 <> Sample 2
P-Value < alpha (0.05)
WMW U-Stat
Maximum
Mean
Median
SD
SE of Mean
Wilcoxon-Mann-Whitney (WMW) Test
H0: Mean/Median of Sample 1 = Mean/Median of Sample 2
Sample 1 Rank Sum W-Stat
Minimum
Sample 1 Data: Mn(contaminated)
Sample 2 Data: Mn(uncontaminated)
Raw Statistics
Sample 2
Number of Valid Observations
Number of Missing Observations
Number of Distinct Observations
Substantial Difference 0.000
Selected Null Hypothesis Sample 1 Mean/Median = Sample 2 Mean/Median (Two Sided Alternative)
Alternative Hypothesis Sample 1 Mean/Median <> Sample 2 Mean/Median
From File WorkSheet_a.xls
Full Precision OFF
Confidence Coefficient 95%
Wilcoxon-Mann-Whitney Sample 1 vs Sample 2 Comparison Test for Uncensored Full Data Sets without NDs
User Selected Options
Date/Time of Computation 7/30/2015 4:35:34 PM
Appendix C, Ambient Metals Technical MemorandumUC Berkeley, Richmond Field Station Site Page 1 of 1

Conclusion with Alpha = 0.05
Do Not Reject H0, Conclude Sample 1 <= Sample 2
P-Value >= alpha (0.05)
Approximate U-Stat Critical Value (0.05) 1.645
P-Value (Adjusted for Ties) 0.998
Standardized WMW U-Stat -2.94
Mean (U) 3825
SD(U) - Adj ties 334.9
Wilcoxon-Mann-Whitney (WMW) Test
H0: Mean/Median of Sample 1 <= Mean/Median of Sample 2
Sample 1 Rank Sum W-Stat 6496
SE of Mean 3.101 3.304
28.59 31.35
Maximum 260 280
Mean 40.28 47.26
Median 34 42
SD
Number of Distinct Observations 59 46
Minimum 8.3 20
Raw Statistics
Sample 1 Sample 2
Number of Valid Observations 85 90
Sample 1 Data: Ni(contaminated)
Sample 2 Data: Ni(uncontaminated)
Sample 1 Mean/Median > Sample 2 Mean/Median
From File WorkSheet_a.xls
Full Precision OFF
Confidence Coefficient 95%
Substantial Difference 0.000
Selected Null Hypothesis Sample 1 Mean/Median <= Sample 2 Mean/Median (Form 1)
Alternative Hypothesis
Wilcoxon-Mann-Whitney Sample 1 vs Sample 2 Comparison Test for Uncensored Full Data Sets without NDs
User Selected Options
Date/Time of Computation 7/30/2015 4:31:40 PM
Appendix C, Ambient Metals Technical MemorandumUC Berkeley, Richmond Field Station Site Page 1 of 1

Wilcoxon-Mann-Whitney Sample 1 vs Sample 2 Comparison Test for Uncensored Full Data Sets without NDs
User Selected Options
Date/Time of Computation 7/30/2015 4:36:07 PM
From File WorkSheet_a.xls
Full Precision OFF
Confidence Coefficient 95%
Raw Statistics
Substantial Difference 0.000
Selected Null Hypothesis Sample 1 Mean/Median = Sample 2 Mean/Median (Two Sided Alternative)
Alternative Hypothesis Sample 1 Mean/Median <> Sample 2 Mean/Median
Sample 1 Data: Ni(contaminated)
Sample 2 Data: Ni(uncontaminated)
Sample 1 Sample 2
Number of Valid Observations 85 90
Number of Distinct Observations 59 46
Minimum 8.3 20
Maximum 260 280
Mean 40.28 47.26
Wilcoxon-Mann-Whitney (WMW) Test
Median 34 42
SD 28.59 31.35
WMW U-Stat 2841
SE of Mean 3.101 3.304
H0: Mean/Median of Sample 1 = Mean/Median of Sample 2
Sample 1 Rank Sum W-Stat 6496
Standardized WMW U-Stat -2.938
Mean (U) 3825
SD(U) - Adj ties 334.9
Lower Approximate U-Stat Critical Value (0.025) -1.96
Upper Approximate U-Stat Critical Value (0.975) 1.96
P-Value (Adjusted for Ties) 0.0033
Conclusion with Alpha = 0.05
Reject H0, Conclude Sample 1 <> Sample 2
P-Value < alpha (0.05)
Appendix C, Ambient Metals Technical MemorandumUC Berkeley, Richmond Field Station Site Page 1 of 1