ambient insight's worldwide 2014-2019 mobile learning · pdf filemorocco (in us$...
TRANSCRIPT
Ambient Insight's 2014-2019 Worldwide Mobile Learning Market Forecast: Premium Edition
For more information about this research, email: [email protected] 2
Table of Contents
List of Tables ............................................................... 8
List of Figures ............................................................ 17
Ambient Insight’s Organizational Enterprise Licensing Model ........ 18
Executive Overview: Mobile Learning is Mainstream ....... 19
Convergent Catalysts in the Global Mobile Learning Market .... 22
Mobile-only Countries will Always be Mobile-only ........................ 23
Boom in Mobile Learning Value-added Services (VAS) ................. 25
Strong Consumer Demand for Mobile Learning Content ............... 28
Large-Scale Smart Device Adoption .......................................... 29
Next Generation Mobile Learning Products Hit the Market ............ 31
Proximity Triggers Location-based Learning on Mobile Devices ..............32
Rapid Adoption of Augmented Learning Products .................................33
Next Generation Mobile Virtual Reality Learning Products .....................36
Sources of Data on the Worldwide Mobile Learning Market..... 39
What You Will Find in This Report ....................................... 40
Who are the Buyers? ............................................................... 41
What Are They Buying? ........................................................... 42
Related Research ............................................................................45
2014-2019 Mobile Learning Forecast and Analysis .......... 46
Africa .............................................................................. 46
Africa Demand-side Analysis .................................................... 49
Algeria ...........................................................................................50
Angola ...........................................................................................52
Benin.............................................................................................54
Botswana .......................................................................................55
Burkina Faso ..................................................................................56
Cameroon ......................................................................................56
Chad .............................................................................................58
Côte d'Ivoire (The Ivory Coast) .........................................................58
The Democratic Republic of Congo (DRC) ...........................................60
Ethiopia .........................................................................................61
Ghana ...........................................................................................63
Kenya ............................................................................................66
Madagascar ....................................................................................69
Ambient Insight's 2014-2019 Worldwide Mobile Learning Market Forecast: Premium Edition
For more information about this research, email: [email protected] 3
Malawi ...........................................................................................70
Mali ...............................................................................................70
Mauritius ........................................................................................71
Morocco .........................................................................................72
Moçambique ...................................................................................73
Namibia .........................................................................................75
Niger .............................................................................................76
Nigeria...........................................................................................77
Rwanda .........................................................................................80
Senegal .........................................................................................82
South Africa ...................................................................................85
Tanzania ........................................................................................90
Tunisia...........................................................................................93
Uganda ..........................................................................................95
Zambia ..........................................................................................97
Zimbabwe ......................................................................................99
Africa Supply-side Analysis (All Countries Combined) ................ 101
Asia Pacific .................................................................... 103
Asia Pacific Demand-side Analysis ........................................... 107
Australia ...................................................................................... 108
Bangladesh .................................................................................. 111
Cambodia .................................................................................... 114
China (including Hong Kong and Macao) .......................................... 116
Consumers ............................................................................................ 117
Corporations .......................................................................................... 121
PreK-12 Schools ..................................................................................... 122
Higher Education .................................................................................... 127
Federal Government ............................................................................... 129
Local/Provincial Government .................................................................... 130
India ........................................................................................... 133
Consumers ............................................................................................ 134
Corporations .......................................................................................... 137
PreK-12 Schools ..................................................................................... 138
Higher Education .................................................................................... 140
Federal Government ............................................................................... 141
Local/State Government .......................................................................... 141
Ambient Insight's 2014-2019 Worldwide Mobile Learning Market Forecast: Premium Edition
For more information about this research, email: [email protected] 4
Indonesia ..................................................................................... 142
Consumers ............................................................................................ 144
Corporations .......................................................................................... 146
PreK-12 Schools ..................................................................................... 147
Higher Education .................................................................................... 148
Federal Government ............................................................................... 149
Local/Provincial Government .................................................................... 149
Japan .......................................................................................... 150
Consumers ............................................................................................ 151
Corporations .......................................................................................... 154
PreK-12 Schools ..................................................................................... 155
Higher Education .................................................................................... 157
Federal Government ............................................................................... 158
Local/Prefecture Government ................................................................... 159
Laos ............................................................................................ 160
Malaysia ...................................................................................... 163
Mongolia ...................................................................................... 166
Myanmar (Burma) ......................................................................... 168
Nepal .......................................................................................... 171
New Zealand ................................................................................ 173
Pakistan ....................................................................................... 175
The Philippines ............................................................................. 178
Singapore .................................................................................... 182
South Korea ................................................................................. 187
Consumers ............................................................................................ 187
Corporations .......................................................................................... 190
PreK-12 Schools ..................................................................................... 191
Higher Education .................................................................................... 192
Federal Government ............................................................................... 193
Local/Provincial Government .................................................................... 194
Sri Lanka ..................................................................................... 195
Taiwan......................................................................................... 198
Thailand ....................................................................................... 200
Vietnam ....................................................................................... 204
Ambient Insight's 2014-2019 Worldwide Mobile Learning Market Forecast: Premium Edition
For more information about this research, email: [email protected] 5
Asia Pacific Supply-side Analysis ............................................. 208
Supply-side Analysis for Asia Pacific (All Countries Combined) ............ 208
Supply-side Analysis for China ........................................................ 210
Supply-side Analysis for India ......................................................... 213
Supply-side Analysis for Indonesia .................................................. 215
Supply-side Analysis for Japan ........................................................ 216
Supply-side Analysis for South Korea............................................... 217
Eastern Europe .............................................................. 217
Eastern Europe Demand-side Analysis ..................................... 218
Albania ........................................................................................ 219
Armenia ....................................................................................... 220
Azerbaijan .................................................................................... 222
Belarus ........................................................................................ 223
Bosnia and Herzegovina ................................................................. 225
Georgia........................................................................................ 227
Kazakhstan .................................................................................. 229
Kyrgyzstan ................................................................................... 232
Moldova ....................................................................................... 233
Serbia ......................................................................................... 234
The Russian Federation .................................................................. 236
Tajikistan ..................................................................................... 238
Turkmenistan ............................................................................... 240
Ukraine ........................................................................................ 240
Uzbekistan ................................................................................... 242
Eastern Europe Supply-side Analysis (All Countries Combined) ... 243
Latin America ................................................................. 245
Latin America Demand-side Analysis ....................................... 246
Argentina ..................................................................................... 247
Bolivia ......................................................................................... 250
Brazil ........................................................................................... 253
Consumers ............................................................................................ 255
Corporations & Businesses ....................................................................... 260
PreK-12 Academic Systems ..................................................................... 262
Higher Education Institutions ................................................................... 265
Federal Government Agencies .................................................................. 268
State and Municipal Government Agencies................................................. 270
Chile ........................................................................................... 272

Ambient Insight's 2014-2019 Worldwide Mobile Learning Market Forecast: Premium Edition
For more information about this research, email: [email protected] 6
Colombia ..................................................................................... 274
Costa Rica .................................................................................... 276
The Dominican Republic ................................................................. 278
Ecuador ....................................................................................... 280
Guatemala ................................................................................... 282
Honduras ..................................................................................... 285
Mexico ......................................................................................... 286
Panama ....................................................................................... 288
Paraguay ..................................................................................... 290
Peru ............................................................................................ 292
Uruguay ....................................................................................... 293
Venezuela .................................................................................... 295
Latin America Supply-side Analysis (All Countries Combined) ..... 297
Brazil Supply-side Analysis ............................................................. 299
The Middle East .............................................................. 302
Middle East Demand-side Analysis .......................................... 304
Bahrain ........................................................................................ 305
Egypt .......................................................................................... 307
Israel .......................................................................................... 309
Jordan ......................................................................................... 311
Kuwait ......................................................................................... 313
Lebanon ....................................................................................... 315
Oman .......................................................................................... 317
Qatar ........................................................................................... 318
Saudi Arabia ................................................................................. 321
Turkey ......................................................................................... 324
The United Arab Emirates (UAE) ..................................................... 326
Yemen ......................................................................................... 330
Middle East Supply-side Analysis (All Countries Combined) ........ 331
North America ......................................................... 334
North America Demand-side Analysis ................................ 334
Canada................................................................................ 334
Canada Demand-side Analysis by Six Buyer Segments ...................... 335
Consumers ............................................................................................ 335
Federal Government ............................................................................... 336
Provincial and Local Government .............................................................. 338
PreK-12 ................................................................................................ 339

Ambient Insight's 2014-2019 Worldwide Mobile Learning Market Forecast: Premium Edition
For more information about this research, email: [email protected] 7
Higher Education .................................................................................... 340
Corporations .......................................................................................... 342
The United States (US) .......................................................... 343
US Demand-side Analysis by Six Buyer Segments ............................. 344
Consumers ................................................................................... 345
Consumer Spending in Eight Types of Mobile Learning Content ........... 346
Consumer Spending on Mobile Edugames by Six Categories ............... 350
Brain Trainers and Brain Fitness Games .................................................... 351
Knowledge-based Games ........................................................................ 352
Skill-based Games .................................................................................. 353
Language Learning Games ...................................................................... 353
Location-based Learning Games ............................................................... 354
Mobile Augmented Reality Edugames ........................................................ 354
Federal Government ...................................................................... 355
State and Local Governments ......................................................... 357
PreK-12 ....................................................................................... 359
Higher Education ........................................................................... 362
Corporations ................................................................................. 364
North America Supply-side Analysis ........................................ 366
Canada Supply-side Analysis by Four Product Types .......................... 368
US Supply-side Analysis by Four Product Types ................................ 370
Western Europe ............................................................. 371
Western Europe Demand-side Analysis .................................... 372
Austria ......................................................................................... 374
Belgium ....................................................................................... 376
Bulgaria ....................................................................................... 379
Croatia ........................................................................................ 381
The Czech Republic ....................................................................... 383
Denmark ...................................................................................... 386
Finland ........................................................................................ 388
France ......................................................................................... 391
Germany ...................................................................................... 394
Greece ......................................................................................... 396
Hungary ....................................................................................... 398
Ireland ........................................................................................ 401
Italy ............................................................................................ 403
Lithuania ...................................................................................... 405
Ambient Insight's 2014-2019 Worldwide Mobile Learning Market Forecast: Premium Edition
For more information about this research, email: [email protected] 8
The Netherlands ........................................................................... 407
Norway ........................................................................................ 410
Poland ......................................................................................... 412
Portugal ....................................................................................... 414
Romania ...................................................................................... 416
Slovakia ....................................................................................... 417
Spain ........................................................................................... 419
Sweden ....................................................................................... 421
Switzerland .................................................................................. 423
The United Kingdom (UK)............................................................... 426
Western Europe Supply-side Analysis (All Countries Combined) .. 429
Worldwide Supply-side Analysis ................................. 432
Retail Education Apps and Edugames ...................................... 433
Mobile Learning VAS ............................................................. 434
Custom Content Development Services ................................... 435
Authoring Tools and Platforms ................................................ 436
Index of Suppliers .................................................... 437
List of Tables Table 1 – 2014-2019 Worldwide Mobile Learning Market: The 119 Countries in Seven Regions Analyzed in this Report ....................................19
Table 2 –Number of Mobile Learning VAS Products by Region by End of 2014 ....................................................................................................27
Table 3 - 2014-2019 Worldwide Revenue Forecasts for Mobile Learning Products and Services by Region (in US$ Millions) ......................................46
Table 4 - 2014-2019 Revenue Forecasts for Mobile Learning by
Fourteen Countries in Africa (in US$ Millions) ............................................49
Table 5 - 2014-2019 Revenue Forecasts for Mobile Learning in Algeria (in US$ Millions) ....................................................................................50
Table 6 - 2014-2019 Revenue Forecasts for Mobile Learning in Angola (in US$ Millions) ....................................................................................52
Table 7 - 2014-2019 Revenue Forecasts for Mobile Learning in Benin (in US$ Millions) ....................................................................................54
Table 8 - 2014-2019 Revenue Forecasts for Mobile Learning in Botswana (in US$ Millions) ......................................................................55
Table 9 - 2014-2019 Revenue Forecasts for Mobile Learning in Burkina Faso (in US$ Millions) .............................................................................56
Table 10 - 2014-2019 Revenue Forecasts for Mobile Learning in Cameroon (in US$ Millions ......................................................................56

Ambient Insight's 2014-2019 Worldwide Mobile Learning Market Forecast: Premium Edition
For more information about this research, email: [email protected] 9
Table 11 - 2014-2019 Revenue Forecasts for Mobile Learning in Chad
(in US$ Millions) ....................................................................................58
Table 12 - 2014-2019 Revenue Forecasts for Mobile Learning in the Ivory Coast (in US$ Millions) ...................................................................58
Table 13 - 2014-2019 Revenue Forecasts for Mobile Learning in the Democratic Republic of Congo (in US$ Millions)..........................................60
Table 14 - 2014-2019 Revenue Forecasts for Mobile Learning in Ethiopia (in US$ Millions) ........................................................................61
Table 15 - 2014-2019 Revenue Forecasts for Mobile Learning in Ghana (in US$ Millions) ....................................................................................63
Table 16 - 2014-2019 Revenue Forecasts for Mobile Learning in Kenya
(in US$ Millions) ....................................................................................66
Table 17 - 2014-2019 Revenue Forecasts for Mobile Learning in
Madagascar (in US$ Millions) ...................................................................69
Table 18 - 2014-2019 Revenue Forecasts for Mobile Learning in Malawi (in US$ Millions) ....................................................................................70
Table 19 - 2014-2019 Revenue Forecasts for Mobile Learning in Mali (in
US$ Millions) .........................................................................................70
Table 20 - 2014-2019 Revenue Forecasts for Mobile Learning in Mauritius (in US$ Millions) .......................................................................71
Table 21 - 2014-2019 Revenue Forecasts for Mobile Learning in Morocco (in US$ Millions) ........................................................................72
Table 22 - 2014-2019 Revenue Forecasts for Mobile Learning in Mozambique (in US$ Millions) ..................................................................74
Table 23 - 2014-2019 Revenue Forecasts for Mobile Learning in
Namibia (in US$ Millions) ........................................................................75
Table 24 - 2014-2019 Revenue Forecasts for Mobile Learning in Niger (in US$ Millions) ....................................................................................76
Table 25 - 2014-2019 Revenue Forecasts for Mobile Learning in Nigeria (in US$ Millions) ....................................................................................77
Table 26 - 2014-2019 Revenue Forecasts for Mobile Learning in
Rwanda (in US$ Millions) ........................................................................80
Table 27 - 2014-2019 Revenue Forecasts for Mobile Learning in Senegal (in US$ Millions ..........................................................................82
Table 28 - 2014-2019 Revenue Forecasts for Mobile Learning in South Africa (in US$ Millions)............................................................................85
Table 29 - 2014-2019 Revenue Forecasts for Mobile Learning in
Tanzania (in US$ Millions ........................................................................90
Table 30 - 2014-2019 Revenue Forecasts for Mobile Learning in Tunisia (in US$ Millions ......................................................................................93
Table 31 - 2014-2019 Revenue Forecasts for Mobile Learning in Uganda (in US$ Millions ..........................................................................95
Table 32 - 2014-2019 Revenue Forecasts for Mobile Learning in Zambia (in US$ Millions ..........................................................................97
Table 33 - 2014-2019 Revenue Forecasts for Mobile Learning in Zimbabwe (in US$ Millions ......................................................................99
Ambient Insight's 2014-2019 Worldwide Mobile Learning Market Forecast: Premium Edition
For more information about this research, email: [email protected] 10
Table 34 - 2014-2019 Africa Revenue Forecasts for Mobile Learning by
Five Product Types (in US$ Millions) ....................................................... 102
Table 35 - 2014-2019 Revenue Forecasts for Mobile Learning by Twenty One Buying Countries in Asia (in $US Millions) .............................. 107
Table 36 - 2014-2019 Revenue Forecasts for Mobile Learning Products in Australia (in US$ Millions) .................................................................. 108
Table 37 - 2014-2019 Revenue Forecasts for Mobile Learning Products in Bangladesh (in US$ Millions) .............................................................. 111
Table 38 - 2014-2019 Revenue Forecasts for Mobile Learning Products in Cambodia (in US$ Millions) ................................................................ 114
Table 39 - 2014-2019 Revenue Forecasts for Mobile Learning Products
in China (in US$ Millions) ...................................................................... 116
Table 40 - 2014-2019 China Revenue Forecasts for Mobile Learning
Products by Six Buyer Segments (in US$ Millions) .................................... 117
Table 41 - 2014-2019 China Consumer Revenue Forecasts for Four Mobile Learning Products and Services (in US$ Millions) ............................ 117
Table 42 - 2014-2019 China Consumer Forecasts for Mobile Learning
Content by Nine Subject Categories (in US$ Millions) ................................ 119
Table 43 - 2014-2019 China Corporate Revenue Forecasts for Four Mobile Learning Products and Services (in US$ Millions) ............................ 121
Table 44 - 2014-2019 China PreK-12 Revenue Forecasts for Four Mobile Learning Products and Services (in US$ Millions) ............................ 123
Table 45 - 2014-2019 China Higher Education Revenue Forecasts for Four Mobile Learning Products and Services (in US$ Millions) .................... 127
Table 46 - 2014-2019 China Federal Government Revenue Forecasts
for Four Mobile Learning Products and Services (in US$ Millions) ................ 129
Table 47 - 2014-2019 China Local/Provincial Government Revenue Forecasts for Four Mobile Learning Products and Services (in US$ Millions) .............................................................................................. 130
Table 48 - 2014-2019 Revenue Forecasts for Mobile Learning Products in India (in US$ Millions) ....................................................................... 133
Table 49 - 2014-2019 India Revenue Forecasts for Mobile Learning Products by Six Buyer Segments (in US$ Millions) .................................... 133
Table 50 - 2014-2019 India Consumer Forecasts for Mobile Learning Content by Nine Subject Categories (in US$ Millions) ................................ 134
Table 51 - 2014-2019 Revenue Forecasts for Mobile Learning Products in Indonesia (in US$ Millions) ................................................................ 142
Table 52 - 2014-2019 Indonesia Revenue Forecasts for Mobile Learning Products by Six Buyer Segments (in US$ Millions) .................................... 143
Table 53 - 2014-2019 Indonesia Consumer Forecasts for Mobile Learning Content by Nine Subject Categories (in US$ Millions)................... 144
Table 54 - 2014-2019 Revenue Forecasts for Mobile Learning Products in Japan (in US$ Millions) ...................................................................... 150
Table 55 - 2014-2019 Japan Revenue Forecasts for Mobile Learning
Products by Six Buyer Segments (in US$ Millions) .................................... 150
Table 56 - 2014-2019 Japan Consumer Forecasts for Mobile Learning Content by Nine Subject Categories (in US$ Millions) ................................ 152
Ambient Insight's 2014-2019 Worldwide Mobile Learning Market Forecast: Premium Edition
For more information about this research, email: [email protected] 11
Table 57 - 2014-2019 Revenue Forecasts for Mobile Learning Products
in Laos (in US$ Millions) ........................................................................ 161
Table 58 - 2014-2019 Revenue Forecasts for Mobile Learning Products in Malaysia (in US$ Millions) .................................................................. 163
Table 59 - 2014-2019 Revenue Forecasts for Mobile Learning Products in Mongolia (in US$ Millions) .................................................................. 166
Table 60 - 2014-2019 Revenue Forecasts for Mobile Learning Products in Myanmar (in US$ Millions) ................................................................. 168
Table 61 - 2014-2019 Revenue Forecasts for Mobile Learning Products in Nepal (in US$ Millions) ...................................................................... 171
Table 62 - 2014-2019 Revenue Forecasts for Mobile Learning Products
in New Zealand (in US$ Millions) ............................................................ 173
Table 63 - 2014-2019 Revenue Forecasts for Mobile Learning Products
in Pakistan (in US$ Millions) .................................................................. 175
Table 64 - 2014-2019 Revenue Forecasts for Mobile Learning Products in the Philippines (in US$ Millions) .......................................................... 178
Table 65 - 2014-2019 Revenue Forecasts for Mobile Learning Products
in Singapore (in US$ Millions) ................................................................ 182
Table 66 - 2014-2019 Revenue Forecasts for Mobile Learning Products in South Korea (in US$ Millions) ............................................................. 187
Table 67 - 2014-2019 South Korea Revenue Forecasts for Mobile Learning Products by Six Buyer Segments (in US$ Millions) ....................... 187
Table 68 - 2014-2019 South Korea Consumer Forecasts for Mobile Learning Content by Nine Subject Categories (in US$ Millions)................... 188
Table 69 - 2014-2019 Revenue Forecasts for Mobile Learning Products
in Sri Lanka (in US$ Millions) ................................................................. 195
Table 70 - 2014-2019 Revenue Forecasts for Mobile Learning Products in Taiwan (in US$ Millions) .................................................................... 198
Table 71 - 2014-2019 Revenue Forecasts for Mobile Learning Products in Thailand (in US$ Millions) .................................................................. 200
Table 72 - 2014-2019 Revenue Forecasts for Mobile Learning Products
in Vietnam (in US$ Millions) .................................................................. 204
Table 73 - 2014-2019 Asia Revenue Forecasts for Mobile Learning by Five Product Types (in US$ Millions) ....................................................... 208
Table 74 - 2014-2019 China Revenue Forecasts for Mobile Learning by Four Product Types (in US$ Millions) ...................................................... 210
Table 75 - 2014-2019 India Revenue Forecasts for Mobile Learning by
Four Product Types (in US$ Millions) ...................................................... 213
Table 76 - 2014-2019 Indonesia Revenue Forecasts for Mobile Learning by Four Product Types (in US$ Millions) .................................................. 215
Table 77 - 2014-2019 Japan Revenue Forecasts for Mobile Learning by Four Product Types (in US$ Millions) ...................................................... 216
Table 78 - 2014-2019 South Korea Revenue Forecasts for Mobile Learning by Four Product Types (in US$ Millions) ..................................... 217
Table 79 - 2014-2019 Revenue Forecasts for Mobile Learning by Ten Top Buying Countries in Eastern Europe (in US$ Millions) .......................... 218
Ambient Insight's 2014-2019 Worldwide Mobile Learning Market Forecast: Premium Edition
For more information about this research, email: [email protected] 12
Table 80 - 2014-2019 Revenue Forecasts for Mobile Learning in Albania
(in US$ Millions) .................................................................................. 219
Table 81 - 2014-2019 Revenue Forecasts for Mobile Learning in Armenia (in US$ Millions) ...................................................................... 220
Table 82 - 2014-2019 Revenue Forecasts for Mobile Learning in Azerbaijan (in US$ Millions) ................................................................... 222
Table 83 - 2014-2019 Revenue Forecasts for Mobile Learning in Belarus (in US$ Millions) ....................................................................... 223
Table 84 - 2014-2019 Revenue Forecasts for Mobile Learning in Bosnia and Herzegovina (in US$ Millions) .......................................................... 225
Table 85 - 2014-2019 Revenue Forecasts for Mobile Learning in
Georgia (in US$ Millions) ....................................................................... 228
Table 86 - 2014-2019 Revenue Forecasts for Mobile Learning in
Kazakhstan (in US$ Millions) ................................................................. 229
Table 87 - 2014-2019 Revenue Forecasts for Mobile Learning in Kyrgyzstan (in US$ Millions) .................................................................. 232
Table 88 - 2014-2019 Revenue Forecasts for Mobile Learning in
Moldova (in US$ Millions) ...................................................................... 233
Table 89 - 2014-2019 Revenue Forecasts for Mobile Learning in Serbia (in US$ Millions) .................................................................................. 234
Table 90 - 2014-2019 Revenue Forecasts for Mobile Learning in the Russian Federation (in US$ Millions) ....................................................... 236
Table 91 - 2014-2019 Revenue Forecasts for Mobile Learning in Tajikistan (in US$ Millions) .................................................................... 238
Table 92 - 2014-2019 Revenue Forecasts for Mobile Learning in
Turkmenistan (in US$ Millions) .............................................................. 240
Table 93 - 2014-2019 Revenue Forecasts for Mobile Learning in Ukraine (in US$ Millions) ....................................................................... 241
Table 94 - 2014-2019 Revenue Forecasts for Mobile Learning in Uzbekistan (in US$ Millions) .................................................................. 243
Table 95 - 2014-2019 Eastern Europe Revenue Forecasts for Mobile
Learning by Product Type (in US$ Millions) .............................................. 244
Table 96 - 2014-2019 Revenue Forecasts for Mobile Learning by Sixteen Countries in Latin America (in US$ Millions) ................................. 246
Table 97 - 2014-2019 Revenue Forecasts for Mobile Learning in Argentina (in US$ Millions) .................................................................... 247
Table 98 - 2014-2019 Revenue Forecasts for Mobile Learning in Bolivia
(in US$ Millions) .................................................................................. 250
Table 99 - 2014-2019 Revenue Forecasts for Mobile Learning Products in Brazil (in US$ Millions) ...................................................................... 253
Table 100 - 2014-2019 Brazil Revenue Forecasts for Mobile Learning Products by Six Buyer Segments (in US$ Millions) .................................... 255
Table 101 - 2014-2019 Brazil Revenue Forecasts for Mobile Learning Products by Consumers (in US$ Millions)................................................. 256
Table 102 - 2014-2019 Brazil Consumer Forecasts for Mobile Learning Content by Nine Categories (in US$ Millions) ........................................... 256
Ambient Insight's 2014-2019 Worldwide Mobile Learning Market Forecast: Premium Edition
For more information about this research, email: [email protected] 13
Table 103 - 2014-2019 Brazil Revenue Forecasts for Mobile Learning
Products by Corporations (in US$ Millions) .............................................. 261
Table 104 - 2014-2019 Brazil Revenue Forecasts for Mobile Learning Products by PreK-12 Buyers (in US$ Millions) .......................................... 262
Table 105 - 2014-2019 Brazil Revenue Forecasts for Mobile Learning Products by Higher Education Buyers (in US$ Millions) .............................. 266
Table 106 - 2014-2019 Brazil Revenue Forecasts for Mobile Learning Products by Federal Government Agencies (in US$ Millions) ...................... 268
Table 107 - 2014-2019 Brazil Revenue Forecasts for Mobile Learning Products by State and Local Government Agencies (in US$ Millions ............ 270
Table 108 - 2014-2019 Revenue Forecasts for Mobile Learning in Chile
(in US$ Millions) .................................................................................. 272
Table 109 - 2014-2019 Revenue Forecasts for Mobile Learning in
Colombia (in US$ Millions)..................................................................... 274
Table 110 - 2014-2019 Revenue Forecasts for Mobile Learning in Costa Rica (in US$ Millions) ............................................................................ 276
Table 111 - 2014-2019 Revenue Forecasts for Mobile Learning in the
Dominican Republic (in US$ Millions) ...................................................... 279
Table 112 - 2014-2019 Revenue Forecasts for Mobile Learning in Ecuador (in US$ Millions) ...................................................................... 280
Table 113 - 2014-2019 Revenue Forecasts for Mobile Learning in Guatemala (in US$ Millions) .................................................................. 282
Table 114 - 2014-2019 Revenue Forecasts for Mobile Learning in Honduras (in US$ Millions) .................................................................... 285
Table 115 - 2014-2019 Revenue Forecasts for Mobile Learning in
Mexico (in US$ Millions) ........................................................................ 286
Table 116 - 2014-2019 Revenue Forecasts for Mobile Learning in Panama (in US$ Millions) ...................................................................... 288
Table 117 - 2014-2019 Revenue Forecasts for Mobile Learning in Paraguay (in US$ Millions) .................................................................... 290
Table 118 - 2014-2019 Revenue Forecasts for Mobile Learning in Peru
(in US$ Millions) .................................................................................. 292
Table 119 - 2014-2019 Revenue Forecasts for Mobile Learning in Uruguay (in US$ Millions) ...................................................................... 293
Table 120 - 2014-2019 Revenue Forecasts for Mobile Learning in Venezuela (in US$ Millions) ................................................................... 295
Table 121 - 2014-2019 Latin America Revenue Forecasts for Mobile
Learning by Four Product Types (in US$ Millions) ..................................... 297
Table 122 - 2014-2019 Brazil Revenue Forecasts for Mobile Learning by Four Product Types (in $US Millions) .................................................. 299
Table 123 - 2014-2019 Revenue Forecasts for Mobile Learning by Top Buying Countries in the Middle East (in US$ Millions) ................................ 304
Table 124 - 2014-2019 Revenue Forecasts for Mobile Learning in Bahrain (in US$ Millions) ....................................................................... 305
Table 125 - 2014-2019 Revenue Forecasts for Mobile Learning in Egypt (in US$ Millions) .................................................................................. 307
Ambient Insight's 2014-2019 Worldwide Mobile Learning Market Forecast: Premium Edition
For more information about this research, email: [email protected] 14
Table 126 - 2014-2019 Revenue Forecasts for Mobile Learning in Israel
(in US$ Millions) .................................................................................. 309
Table 127 - 2014-2019 Revenue Forecasts for Mobile Learning in Jordan (in US$ Millions) ........................................................................ 311
Table 128 - 2014-2019 Revenue Forecasts for Mobile Learning in Kuwait (in US$ Millions) ........................................................................ 313
Table 129 - 2014-2019 Revenue Forecasts for Mobile Learning in Lebanon (in US$ Millions) ...................................................................... 315
Table 130 - 2014-2019 Revenue Forecasts for Mobile Learning in Oman (in US$ Millions) .................................................................................. 317
Table 131 - 2014-2019 Revenue Forecasts for Mobile Learning in Qatar
(in US$ Millions) .................................................................................. 319
Table 132 - 2014-2019 Revenue Forecasts for Mobile Learning in Saudi
Arabia (in US$ Millions) ......................................................................... 321
Table 133 - 2014-2019 Revenue Forecasts for Mobile Learning in Turkey (in US$ Millions) ........................................................................ 324
Table 134 - 2014-2019 Revenue Forecasts for Mobile Learning in the
UAE (in US$ Millions) ............................................................................ 326
Table 135 - 2014-2019 Revenue Forecasts for Mobile Learning in the UAE (in US$ Millions) ............................................................................ 330
Table 136 - 2014-2019 Middle East Revenue Forecasts for Mobile Learning by Product Type (in US$ Millions) .............................................. 332
Table 137 - 2014-2019 Mobile Learning Revenue Forecasts for North America Broken out by the US and Canada (in US$ Millions)...................... 334
Table 138 - 2014-2019 Revenue Forecasts for Mobile Learning Products
and Services in Canada (in US$ Millions) ................................................. 334
Table 139 - 2014-2019 Canada Revenue Forecasts for Mobile Learning Products by Six Buyer Segments (in US$ Millions) .................................... 335
Table 140 - 2014-2019 Canada Consumer Forecasts for Mobile Learning Products and Services (in US$ Millions) ...................................... 335
Table 141 - 2014-2019 Canada Federal Government Forecasts for
Mobile Learning Products and Services (in US$ Millions) ............................ 337
Table 142 - 2014-2019 Canada Provincial and Local Government Forecasts for Mobile Learning Products and Services (in US$ Millions) ......... 338
Table 143 - 2014-2019 Canada PreK-12 Forecasts for Mobile Learning Products and Services (in US$ Millions) ................................................... 339
Table 144 - 2014-2019 Canada Higher Education Forecasts for Mobile
Learning Products and Services (in US$ Millions) ...................................... 340
Table 145 - 2014-2019 Canada Corporate Forecasts for Mobile Learning Products and Services (in US$ Millions) ...................................... 342
Table 146 - 2014-2019 Revenue Forecasts for Mobile Learning Products and Services in the US (in US$ Millions) .................................................. 343
Table 147 - 2014-2019 US Revenue Forecasts for Mobile Learning Products by Six Buyer Segments (in US$ Millions) .................................... 345
Table 148 - 2014-2019 US Consumer Forecasts for Mobile Learning Content by Eight Categories (in US$ Millions) .......................................... 346
Ambient Insight's 2014-2019 Worldwide Mobile Learning Market Forecast: Premium Edition
For more information about this research, email: [email protected] 15
Table 149 - 2014-2019 US Healthcare Continuing Medical Education
(CME) Expenditures by Delivery Medium (in US$ Millions) ......................... 349
Table 150 - 2014-2019 US Consumer Forecasts for Mobile Learning CE versus Mobile CME Content (in US$ Millions) ........................................... 350
Table 151 – 2014-2019 US Consumer Forecasts for Non-Gaming Mobile Learning Content versus Mobile Edugames (in US$ Millions) ...................... 351
Table 152 - 2014-2019 US Consumer Forecasts for Mobile Edugames by Six Game Categories (in US$ Millions) ................................................ 351
Table 153 - 2014-2019 US Federal Government Forecasts for Mobile Learning Products and Services (in US$ Millions) ...................................... 355
Table 154 - 2014-2019 US State and Local Government Forecasts for
Mobile Learning Products and Services (in US$ Millions) ............................ 357
Table 155 - 2014-2019 US PreK-12 Forecasts for Mobile Learning
Products and Services (in US$ Millions) ................................................... 360
Table 156 - 2014-2019 US Higher Education Forecasts for Mobile Learning Products and Services (in US$ Millions) ...................................... 362
Table 157 - 2014-2019 US Corporate Forecasts for Mobile Learning
Products and Services (in US$ Millions) ................................................... 365
Table 158 – 2014-2019 North America (Canada and the US Combined) Revenue Forecasts for Mobile Learning by Four Product Types (in US$ Millions) .............................................................................................. 367
Table 159 - 2014-2019 Canada Revenue Forecasts for Mobile Learning by Five Product Types (in US$ Millions) ................................................... 368
Table 160 - 2014-2019 US Revenue Forecasts for Mobile Learning by
Four Product Types (in US$ Millions) ...................................................... 370
Table 161 - 2014-2019 Revenue Forecasts for Mobile Learning by Twenty-Four Top Buying Countries in Western Europe (in US$ Millions) ...... 373
Table 162 - 2014-2019 Revenue Forecasts for Mobile Learning in Austria (in US$ Millions) ........................................................................ 374
Table 163 - 2014-2019 Revenue Forecasts for Mobile Learning in Belgium (in US$ Millions) ...................................................................... 376
Table 164 - 2014-2019 Revenue Forecasts for Mobile Learning in Bulgaria (in US$ Millions) ...................................................................... 379
Table 165 - 2014-2019 Revenue Forecasts for Mobile Learning in Croatia (in US$ Millions) ....................................................................... 381
Table 166 - 2014-2019 Revenue Forecasts for Mobile Learning in the Czech Republic (in US$ Millions) ............................................................ 383
Table 167 - 2014-2019 Revenue Forecasts for Mobile Learning in Denmark (in US$ Millions) ..................................................................... 386
Table 168 - 2014-2019 Revenue Forecasts for Mobile Learning in Finland (in US$ Millions) ....................................................................... 388
Table 169 - 2014-2019 Revenue Forecasts for Mobile Learning in France (in US$ Millions) ........................................................................ 391
Table 170 - 2014-2019 Revenue Forecasts for Mobile Learning in
Germany (in US$ Millions) ..................................................................... 394
Table 171 - 2014-2019 Revenue Forecasts for Mobile Learning in Greece (in US$ Millions) ........................................................................ 397
Ambient Insight's 2014-2019 Worldwide Mobile Learning Market Forecast: Premium Edition
For more information about this research, email: [email protected] 16
Table 172 - 2014-2019 Revenue Forecasts for Mobile Learning in
Hungary (in US$ Millions) ...................................................................... 398
Table 173 - 2014-2019 Revenue Forecasts for Mobile Learning in Ireland (in US$ Millions)........................................................................ 401
Table 174 - 2014-2019 Revenue Forecasts for Mobile Learning in Italy (in US$ Millions) .................................................................................. 403
Table 175 - 2014-2019 Revenue Forecasts for Mobile Learning in Lithuania (in US$ Millions) ..................................................................... 405
Table 176 - 2014-2019 Revenue Forecasts for Mobile Learning in the Netherlands (in US$ Millions) ................................................................. 407
Table 177 - 2014-2019 Revenue Forecasts for Mobile Learning in
Norway (in US$ Millions) ....................................................................... 410
Table 178 - 2014-2019 Revenue Forecasts for Mobile Learning in
Poland (in US$ Millions) ........................................................................ 412
Table 179 - 2014-2019 Revenue Forecasts for Mobile Learning in Portugal (in US$ Millions) ...................................................................... 414
Table 180 - 2014-2019 Revenue Forecasts for Mobile Learning in
Romania (in US$ Millions) ..................................................................... 416
Table 181 - 2014-2019 Revenue Forecasts for Mobile Learning in Slovakia (in US$ Millions) ...................................................................... 417
Table 182 - 2014-2019 Revenue Forecasts for Mobile Learning in Spain (in US$ Millions) .................................................................................. 419
Table 183 - 2014-2019 Revenue Forecasts for Mobile Learning in Sweden (in US$ Millions) ...................................................................... 421
Table 184 - 2014-2019 Revenue Forecasts for Mobile Learning in
Switzerland (in US$ Millions) ................................................................. 423
Table 185 -2014-2019 Revenue Forecasts for Mobile Learning in the United Kingdom (in US$ Millions) ........................................................... 426
Table 186 - 2014-2019 Western Europe Revenue Forecasts for Mobile Learning by Four Product Types (in US$ Millions) ..................................... 430
Table 187 - 2014-2019 Worldwide Revenue Forecasts for Mobile
Learning by Product Type Across All Regions Combined (in US$ Millions) .............................................................................................. 432
Table 188 - 2014-2019 Worldwide Revenue Forecasts for Mobile Learning Packaged Content by Region (in US$ Millions) ............................ 433
Table 189 – 2014-2019 Worldwide Revenue Forecasts for Mobile Learning Value Added Service (VAS) by Region (in US$ Millions) ................ 434
Table 190 – 2014-2019 Worldwide Revenue Forecasts for Mobile Learning Custom Content Development Services by Region (in US$ Millions) .............................................................................................. 436
Table 191 – 2014-2019 Worldwide Revenue Forecasts for Mobile Learning Authoring Tools and Platforms by Region (in US$ Millions) ........... 436
Ambient Insight's 2014-2019 Worldwide Mobile Learning Market Forecast: Premium Edition
For more information about this research, email: [email protected] 17
List of Figures Figure 1 - 2014-2019 Worldwide Mobile Learning Five-year Growth Rates by Region .....................................................................................20
Figure 2 – 2014-2019 Top Fifteen Worldwide Mobile Learning Five-year Growth Rates by Country (across all products) ..........................................21
Figure 3 – The Primary Catalysts in the Booming 2014 Worldwide
Mobile Learning Market ...........................................................................22
Figure 4 – 2008-2014 Worldwide Number of Mobile Learning VAS Products on the Market ...........................................................................26
Figure 5 - Mobile Location-based Learning (LBL): Proximity Triggers the Learning Experience ..........................................................................32
Figure 6 - 2014-2019 Worldwide Mobile Learning Five-year Growth
Rates by Four Product Types ...................................................................43
Figure 7 – 2014-2019 Top Fifteen Africa Mobile Learning Five-year Growth Rates by Country (across all products) ..........................................47
Figure 8 - 2014-2019 Africa Mobile Learning Five-year Growth Rates by Four Product Types ................................................................................48
Figure 9 - 2014-2019 Africa Mobile Learning Five-year Growth Rates by Four Product Types .............................................................................. 102
Figure 10 - 2014-2019 Top Ten Mobile Learning Five-year Growth Rates in Asia by Country ....................................................................... 104
Figure 11 - Primary Catalysts Driving the 2014-2019 Mobile Learning Market in Asia ...................................................................................... 106
Figure 12 - 2014-2019 Asia Pacific Mobile Learning Five-year Growth Rates by Four Product Types ................................................................. 209
Figure 13 - 2014-2019 Top Eight Mobile Learning Five-year Growth
Rates in Eastern Europe by Country ....................................................... 218
Figure 14 - 2014-2019 Eastern Europe Mobile Learning Five-year Growth Rates by Four Product Types ...................................................... 244
Figure 15 - 2014-2019 Top Eight Mobile Learning Five-year Growth Rates in Latin America by Country .......................................................... 245
Figure 16 - Catalysts Driving the 2014-2019 Mobile Learning Market in
Brazil .................................................................................................. 254
Figure 17 - 2014-2019 Latin America Mobile Learning Five-year Growth Rates by Five Product Types .................................................................. 298
Figure 18 - 2014-2019 Seven Mobile Learning Five-year Growth Rates in the Middle East by Country ................................................................ 302
Figure 19 - 2014-2019 Middle East Mobile Learning Five-year Growth Rates by Four Product Types ................................................................. 332
Figure 20 - Professions in the US with Continuing Education Licensure Requirements ...................................................................................... 349
Ambient Insight's 2014-2019 Worldwide Mobile Learning Market Forecast: Premium Edition
For more information about this research, email: [email protected] 18
Figure 21 - 2014-2019 North America Mobile Learning Five-year
Growth Rates by Four Product Types ...................................................... 367
Figure 22 - 2014-2019 Top Seven Mobile Learning Five-year Growth Rates in Western Europe by Country ...................................................... 372
Figure 23 - 2014-2019 Western Europe Mobile Learning Five-year Growth Rates by Four Product Types ...................................................... 430
Figure 24 – The 2012 Worldwide Mobile Learning VAS Ecosystem .............. 434
Ambient Insight’s Organizational Enterprise Licensing Model
The buyer of this report is granted an Ambient Insight
Organizational Enterprise Site License. The Ambient Insight
Organizational Enterprise Site License is an organization-wide
volume license, which allows companies that buy reports to
post the reports on their internal portals, intranets, and servers
and grants unlimited access to all of the company's employees,
including employees in wholly owned subsidiaries.
The Ambient Insight Organizational Enterprise Site License
covers an unlimited number of users within your enterprise,
school, district/county, or organization, regardless of the
number of locations and distance between them.
An Ambient Insight Organizational Enterprise Site license does
not have any geographical restrictions whatsoever. There is no
time limitation and the license is granted in perpetuity.
The Ambient Insight Organizational Enterprise Site License also
permits purchasers to share the report(s) with investors,
private equity firms, and investment banks. The license does
not permit reproduction or distribution of the report(s) to
external customers, consultants, channel partners, distributors,
or suppliers without the express permission of Ambient Insight.
Permission is required to reproduce or distribute sections,
tables, diagrams, or charts from Ambient Insight research in
press releases, external blogs, promotional material, external
presentations, or commercial publications.
Ambient Insight's 2014-2019 Worldwide Mobile Learning Market Forecast: Premium Edition
For more information about this research, email: [email protected] 19
Executive Overview: Mobile Learning is
Mainstream The worldwide market for Mobile Learning products and services reached
$8.4 billion in 2014. The global five-year compound annual growth rate
(CAGR) is 11.3% and revenues will reach $14.5 billion by 2019. By the end
of the forecast period, revenues for Mobile Learning will more than double in
66 countries out of the 119 countries analyzed in this report. Revenues will
more than triple in 32 countries by 2019.
Mobile Learning is the fastest evolving learning technology in the global
learning technology industry being driven by a tailwind of innovations
including (among many other things) location-based technology, proximity
beacons, motion sensors, smartphone-enabled virtual reality, mobile
augmented reality, image recognition, biological sensors, eye tracking,
haptics, gesture recognition, tilt sensors, Fresnel lenses, and biometrics.
Mobile Learning is now the most advanced learning technology in the world.
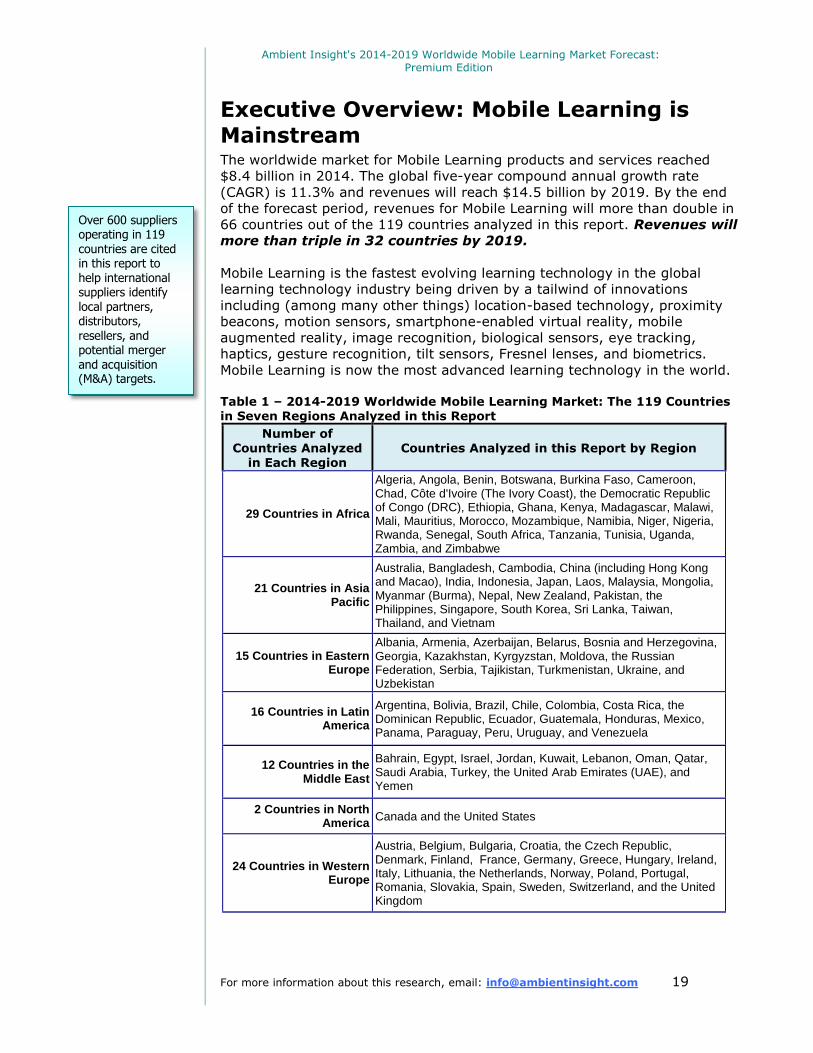
Table 1 – 2014-2019 Worldwide Mobile Learning Market: The 119 Countries in Seven Regions Analyzed in this Report
Number of Countries Analyzed
in Each Region Countries Analyzed in this Report by Region
29 Countries in Africa
Algeria, Angola, Benin, Botswana, Burkina Faso, Cameroon, Chad, Côte d'Ivoire (The Ivory Coast), the Democratic Republic of Congo (DRC), Ethiopia, Ghana, Kenya, Madagascar, Malawi, Mali, Mauritius, Morocco, Mozambique, Namibia, Niger, Nigeria, Rwanda, Senegal, South Africa, Tanzania, Tunisia, Uganda, Zambia, and Zimbabwe
21 Countries in Asia Pacific
Australia, Bangladesh, Cambodia, China (including Hong Kong and Macao), India, Indonesia, Japan, Laos, Malaysia, Mongolia, Myanmar (Burma), Nepal, New Zealand, Pakistan, the Philippines, Singapore, South Korea, Sri Lanka, Taiwan, Thailand, and Vietnam
15 Countries in Eastern Europe
Albania, Armenia, Azerbaijan, Belarus, Bosnia and Herzegovina, Georgia, Kazakhstan, Kyrgyzstan, Moldova, the Russian Federation, Serbia, Tajikistan, Turkmenistan, Ukraine, and Uzbekistan
16 Countries in Latin America
Argentina, Bolivia, Brazil, Chile, Colombia, Costa Rica, the Dominican Republic, Ecuador, Guatemala, Honduras, Mexico, Panama, Paraguay, Peru, Uruguay, and Venezuela
12 Countries in the Middle East
Bahrain, Egypt, Israel, Jordan, Kuwait, Lebanon, Oman, Qatar, Saudi Arabia, Turkey, the United Arab Emirates (UAE), and Yemen
2 Countries in North America
Canada and the United States
24 Countries in Western Europe
Austria, Belgium, Bulgaria, Croatia, the Czech Republic, Denmark, Finland, France, Germany, Greece, Hungary, Ireland, Italy, Lithuania, the Netherlands, Norway, Poland, Portugal, Romania, Slovakia, Spain, Sweden, Switzerland, and the United Kingdom
Over 600 suppliers operating in 119 countries are cited in this report to help international suppliers identify local partners, distributors,
resellers, and potential merger and acquisition (M&A) targets.
Ambient Insight's 2014-2019 Worldwide Mobile Learning Market Forecast: Premium Edition
For more information about this research, email: [email protected] 20
Five-year forecasts for Mobile Learning revenues are broken out for 119
countries in this report. The countries are grouped in seven regions. It is
important to note that revenues are only addressable at the country level;
aggregate regional revenues do not provide suppliers with any meaningful
tactical data. The five-year country forecasts provided in this report are
addressable revenue opportunities for suppliers.
In 2014, the top buying Mobile Learning countries in terms of expenditures
were the US, China, India, Japan, and South Korea, respectively. By 2019,
the top-buying country will be China, followed by the US, India, Indonesia,
and Brazil.
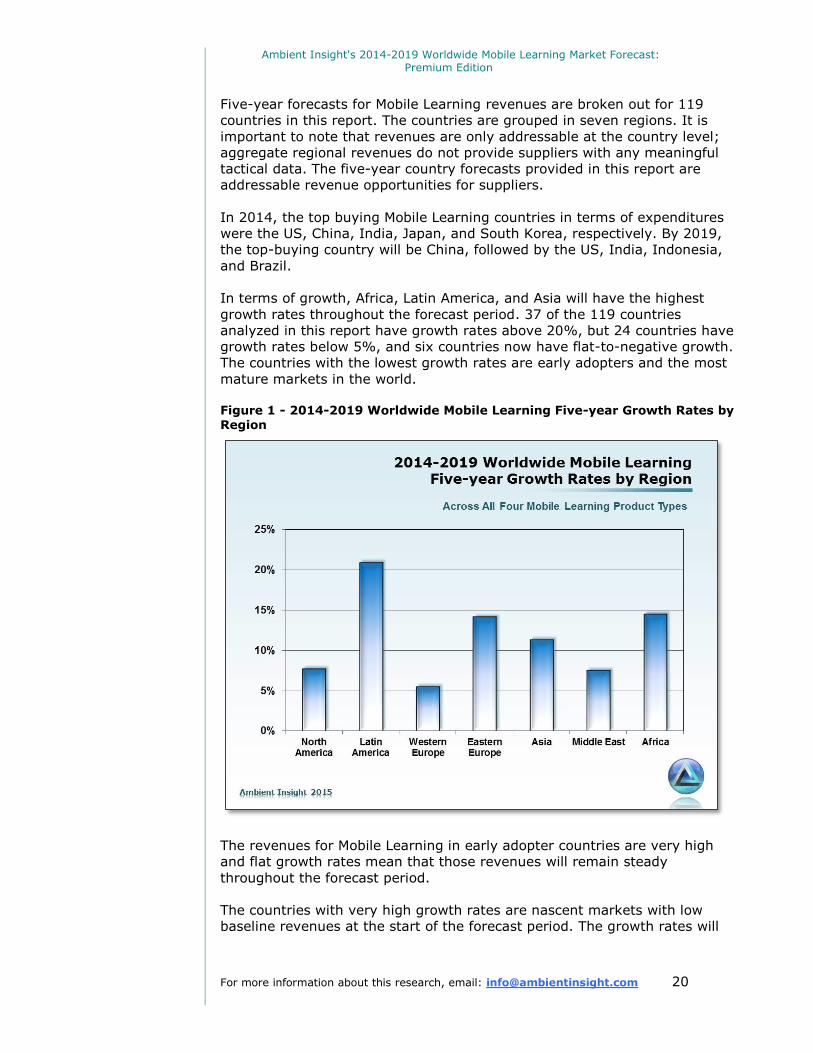
In terms of growth, Africa, Latin America, and Asia will have the highest
growth rates throughout the forecast period. 37 of the 119 countries
analyzed in this report have growth rates above 20%, but 24 countries have
growth rates below 5%, and six countries now have flat-to-negative growth.
The countries with the lowest growth rates are early adopters and the most
mature markets in the world.
Figure 1 - 2014-2019 Worldwide Mobile Learning Five-year Growth Rates by Region
The revenues for Mobile Learning in early adopter countries are very high
and flat growth rates mean that those revenues will remain steady
throughout the forecast period.
The countries with very high growth rates are nascent markets with low
baseline revenues at the start of the forecast period. The growth rates will
Ambient Insight's 2014-2019 Worldwide Mobile Learning Market Forecast: Premium Edition
For more information about this research, email: [email protected] 21
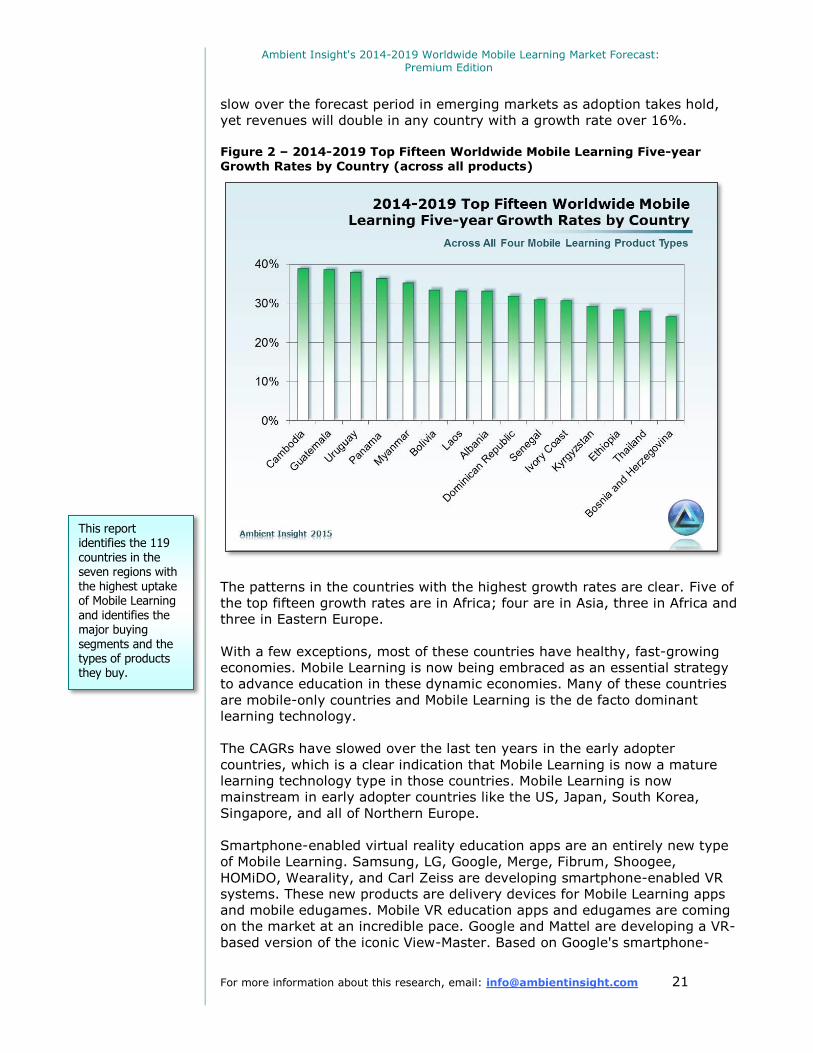
slow over the forecast period in emerging markets as adoption takes hold,
yet revenues will double in any country with a growth rate over 16%.
Figure 2 – 2014-2019 Top Fifteen Worldwide Mobile Learning Five-year Growth Rates by Country (across all products)
The patterns in the countries with the highest growth rates are clear. Five of
the top fifteen growth rates are in Africa; four are in Asia, three in Africa and
three in Eastern Europe.
With a few exceptions, most of these countries have healthy, fast-growing
economies. Mobile Learning is now being embraced as an essential strategy
to advance education in these dynamic economies. Many of these countries
are mobile-only countries and Mobile Learning is the de facto dominant
learning technology.
The CAGRs have slowed over the last ten years in the early adopter
countries, which is a clear indication that Mobile Learning is now a mature
learning technology type in those countries. Mobile Learning is now
mainstream in early adopter countries like the US, Japan, South Korea,
Singapore, and all of Northern Europe.
Smartphone-enabled virtual reality education apps are an entirely new type
of Mobile Learning. Samsung, LG, Google, Merge, Fibrum, Shoogee,
HOMiDO, Wearality, and Carl Zeiss are developing smartphone-enabled VR
systems. These new products are delivery devices for Mobile Learning apps
and mobile edugames. Mobile VR education apps and edugames are coming
on the market at an incredible pace. Google and Mattel are developing a VR-
based version of the iconic View-Master. Based on Google's smartphone-
This report identifies the 119
countries in the seven regions with the highest uptake of Mobile Learning and identifies the major buying segments and the types of products they buy.
Ambient Insight's 2014-2019 Worldwide Mobile Learning Market Forecast: Premium Edition
For more information about this research, email: [email protected] 22
based Cardboard VR technology, the new View-Master "is your portal to
immersive, virtual reality adventures that will transport you around the
world and beyond. Stunning, 360-degree vistas will completely surround
you."
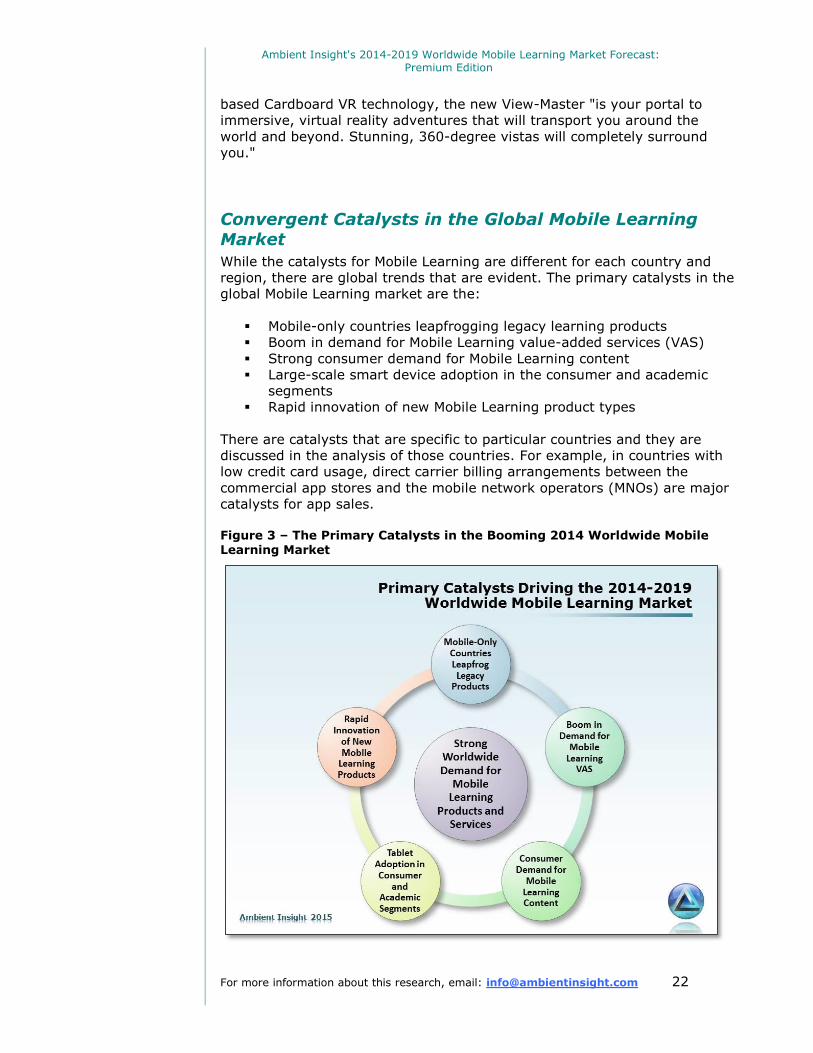
Convergent Catalysts in the Global Mobile Learning Market
While the catalysts for Mobile Learning are different for each country and
region, there are global trends that are evident. The primary catalysts in the
global Mobile Learning market are the:
Mobile-only countries leapfrogging legacy learning products
Boom in demand for Mobile Learning value-added services (VAS)
Strong consumer demand for Mobile Learning content
Large-scale smart device adoption in the consumer and academic
segments
Rapid innovation of new Mobile Learning product types
There are catalysts that are specific to particular countries and they are
discussed in the analysis of those countries. For example, in countries with
low credit card usage, direct carrier billing arrangements between the
commercial app stores and the mobile network operators (MNOs) are major
catalysts for app sales.
Figure 3 – The Primary Catalysts in the Booming 2014 Worldwide Mobile Learning Market
Ambient Insight's 2014-2019 Worldwide Mobile Learning Market Forecast: Premium Edition
For more information about this research, email: [email protected] 23
A host of new commercial Mobile Learning products are now on the market
including smart Location-based Learning apps, industrial augmented mobile
decision support products, and more recently, smartphone-enabled virtual
reality education apps. These next generation products are altering the
competitive landscape and represent significant new revenues for content
suppliers that target the specialized authoring platforms and delivery
devices.
Until recently, corporations were slow adopters of Mobile Learning, largely
because there was no business need in companies that employ information
workers. Self-paced eLearning is still the dominant learning technology type
used to train information workers; they spend the bulk of their day on
computers.
Mobile Learning has finally gained traction in the corporate segments across
the planet due in large part to the growing adoption of augmented mobile
performance and decision support products in particular industrial verticals
like warehousing, manufacturing, energy, aviation, automotive, and in
clinical and field-based companies.
For example, assembly workers at France-based Airbus wear smart glasses
as they install the interiors of planes. "The head-worn technology features a
camera to scan barcodes so the user can see the specific cabin plans and
information based on individual customer requirements, as well as view the
marking zone. The glasses also feature an offset screen that displays several
navigation icons and items in augmented reality. In addition, when the mark
has been made, the tool checks its location to validate the operation."
Mobile-only Countries will Always be Mobile-only
"For many, the first and only computing experience will be
mobile."
Kristin Atkins, Senior Director at Qualcomm
In many countries in across the planet, accessing the web on an Internet-
enabled feature phone or a smartphone is often a user's first Internet
experience, in what is often referred to as a Post-PC experience. In
developing economies, PC penetration is often low, yet mobile subscriptions
are quite high. In this scenario, Mobile Learning are the users' primary
learning technology and they may never be exposed to other learning
products.
Mobile Learning is the first and only learning technology experienced by
mobile users in mobile-only countries. By default, Mobile Learning is the
dominant learning technology in mobile-only countries. In 67 of the 119
countries analyzed in this report, mobile Internet access rates are
higher than PC access.
Over 93% (5.3 million) of Internet users in Nepal access the web exclusively via mobile devices. Nepal is the quintessential mobile-only country in Asia.
Ambient Insight's 2014-2019 Worldwide Mobile Learning Market Forecast: Premium Edition
For more information about this research, email: [email protected] 24
These countries are concentrated in Asia, Latin America, and Africa. For
example, over 85% of mobile subscribers in India access the Internet via a
mobile device; 54% of all Internet users in India are mobile-only. A full 90%
of Internet users in Cambodia access the web via their mobile device. By the
end of 2014, 46% of the Cambodian urban population and 24% of the rural
population were using smartphones.
According to Bangladesh Telecommunication Regulatory Commission
(BTRC), the country had 43.6 million active Internet users by December
2014 and 42 million of them accessed the Internet via a mobile device.
By March 2015, Thailand had a population of 67.4 million people and a
mobile penetration rate of 136%. The smartphone penetration rate by the
end of 2014 was 51%, up from 34% the year before. Only five million of the
22 million households in Thailand have a computer. Over 90% of the
population between the ages of 18 and 24 and 70% of the population over
25 access the Internet via a mobile device on a daily basis.
Laos had a mobile penetration rate of 101% by February 2015, up from 65%
in 2012. In contrast, only 13% of the population has PC access to the
Internet, mostly via Internet cafes in the urban areas.
According to the China Internet Network Information Center (CNNIC), a
government regulatory agency, mobile Internet access surpassed PC
Internet access in China by mid-2014. Over 86% of Internet users access
the web on their mobile device compared to 81% that use a PC.
Large rural populations across Latin America are now avid users of Mobile
Learning technology, while relatively few have experienced Self-paced
eLearning on a PC.
As of May 2015, all sixteen of the Latin American countries analyzed in this
report have significantly higher mobile penetration rates compared to PC-
based Internet access. In some countries, it is dramatically higher.
The Pew Research Center surveyed over 7,000 people in Ghana, Kenya,
Nigeria, Senegal, South Africa, Tanzania, and Uganda in 2014. According to
the survey, Africa has "all but skipped the landline stage of development."
The survey found that mobile penetration rates in South Africa and Nigeria
rivalled that of the US at 89%. "Landline penetration, by comparison, is
close to zero. Only about 2 percent reported having one; In the US 60
percent of Americans has a landline."
In South Africa, over 70% of all mobile users and 85% of high school and
higher education students use their phones to access the web.
At the current growth rate, over 40 million Nigerians will be accessing the
web on their mobile devices by the end of 2015. By the end of the forecast
period, over 100 million people will access the web in Nigeria via a mobile
device, far outstripping PC access.
According to the Guatemalan government, as of May 2013, Guatemala had a mobile penetration rate of over 142% compared to a PC-based Internet penetration rate of only 27.8%.
Ambient Insight's 2014-2019 Worldwide Mobile Learning Market Forecast: Premium Edition
For more information about this research, email: [email protected] 25
In Uganda, over 90% of the access to the Internet is via mobile devices,
making the web experience a quintessentially mobile experience for users in
that country.
Mobile users in African countries are quite advanced in the use of mobile
technology for a variety of things that are still quite rare in developed
economies. Africans now use their devices for banking, payrolls, healthcare,
everyday purchases (like bus fare and vending machines), agriculture, and
social media (the largest social media network in Africa is the mobile Mxit
platform).
Botswana had the highest mobile penetration in Africa by the end of 2014 at
a breathtaking 163%. By the end of 2014, Burkina Faso had a population of
just over 20 million and an impressive 76% mobile penetration rate. Burkina
Faso is the epitome of a mobile-only country. Over 91% of Internet access is
via mobile devices.
Morocco had 32.5 million people by the end of 2014. As of March 2015,
Morocco had a mobile penetration rate of 128%. According to the
government telecom regulator, the Agence Nationale de Reglementation de
Telecom (ANRT), 9.29 million people were accessing the web via a 3G device
at that time, up 68.8% from the year before.
According to a GSMA report called "Mobile Economy 2014: Sub-Saharan
Africa" released in November 2014, Africa "has been the world’s fastest-
growing mobile region over the last five years in terms of both unique
mobile subscribers and mobile connections, and is forecast to continue to
lead global growth through 2020. Unique mobile subscriber penetration as a
percentage of the region’s population is forecast to rise to 49 per cent by
this point." That equates to a half a billion people.
Boom in Mobile Learning Value-added Services (VAS)
Mobile Learning VAS has dramatically altered the global Mobile Learning
landscape. To date, Mobile Learning VAS products are heavily concentrated
in Asia, Africa, and Latin America.
Mobile Learning VAS is a subscription-based product sold directly to
consumers and organizations by mobile network operators (MNOs), device
makers, and content suppliers. The content is usually delivered over mobile
networks via audio, SMS, or Interactive Voice Response (IVR).
Subscription-based Mobile Learning content sold as a value-added service is
relatively new on the market and essentially represents a new type of Mobile
Learning product – a fusion of packaged content and services. Ambient
Insight has labeled this new product type "Mobile Learning VAS".
Mobile Learning VAS did not exist before 2008. There are now over 600
million subscribers across the planet; over half are in Asia. Mobile Leaning
VAS providers license content from third parties and this is now a significant
distribution model for suppliers that specialize in this type of content.
Worldwide revenues for Mobile Learning VAS products will more than quadruple over the 2014-2019 forecast period.
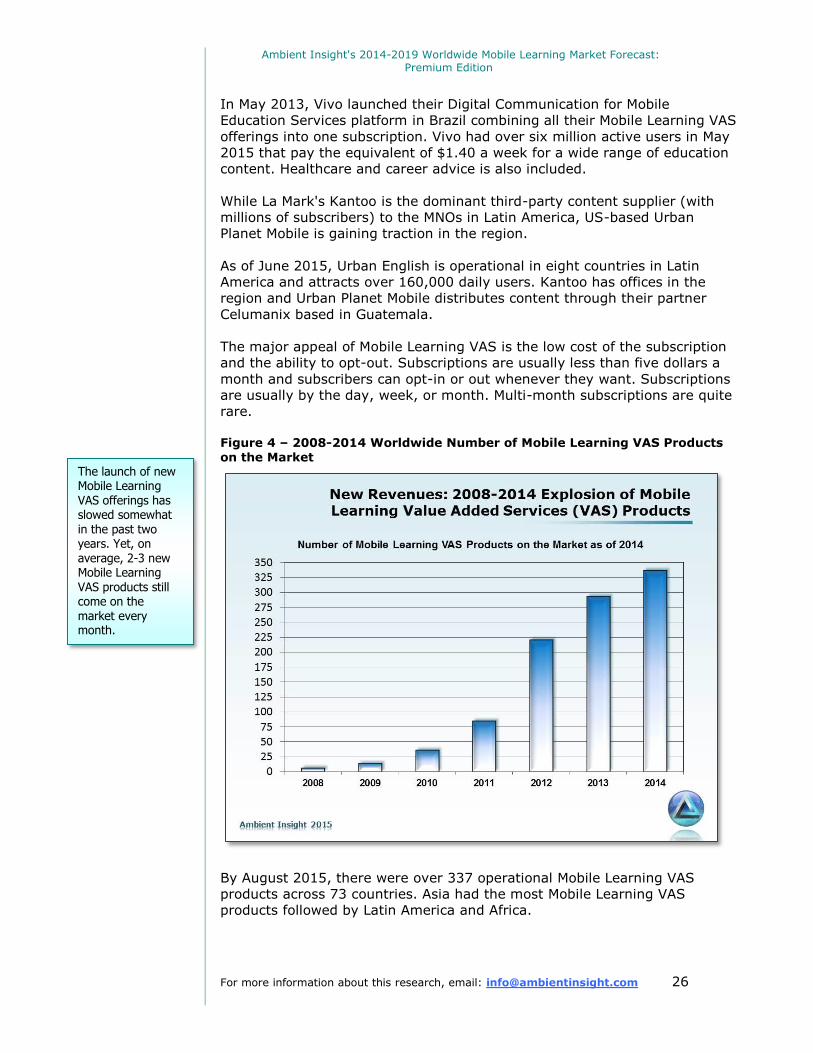
Ambient Insight's 2014-2019 Worldwide Mobile Learning Market Forecast: Premium Edition
For more information about this research, email: [email protected] 26
In May 2013, Vivo launched their Digital Communication for Mobile
Education Services platform in Brazil combining all their Mobile Learning VAS
offerings into one subscription. Vivo had over six million active users in May
2015 that pay the equivalent of $1.40 a week for a wide range of education
content. Healthcare and career advice is also included.
While La Mark's Kantoo is the dominant third-party content supplier (with
millions of subscribers) to the MNOs in Latin America, US-based Urban
Planet Mobile is gaining traction in the region.
As of June 2015, Urban English is operational in eight countries in Latin
America and attracts over 160,000 daily users. Kantoo has offices in the
region and Urban Planet Mobile distributes content through their partner
Celumanix based in Guatemala.
The major appeal of Mobile Learning VAS is the low cost of the subscription
and the ability to opt-out. Subscriptions are usually less than five dollars a
month and subscribers can opt-in or out whenever they want. Subscriptions
are usually by the day, week, or month. Multi-month subscriptions are quite
rare.
Figure 4 – 2008-2014 Worldwide Number of Mobile Learning VAS Products on the Market
By August 2015, there were over 337 operational Mobile Learning VAS
products across 73 countries. Asia had the most Mobile Learning VAS
products followed by Latin America and Africa.
The launch of new Mobile Learning VAS offerings has slowed somewhat in the past two years. Yet, on
average, 2-3 new Mobile Learning VAS products still come on the market every month.
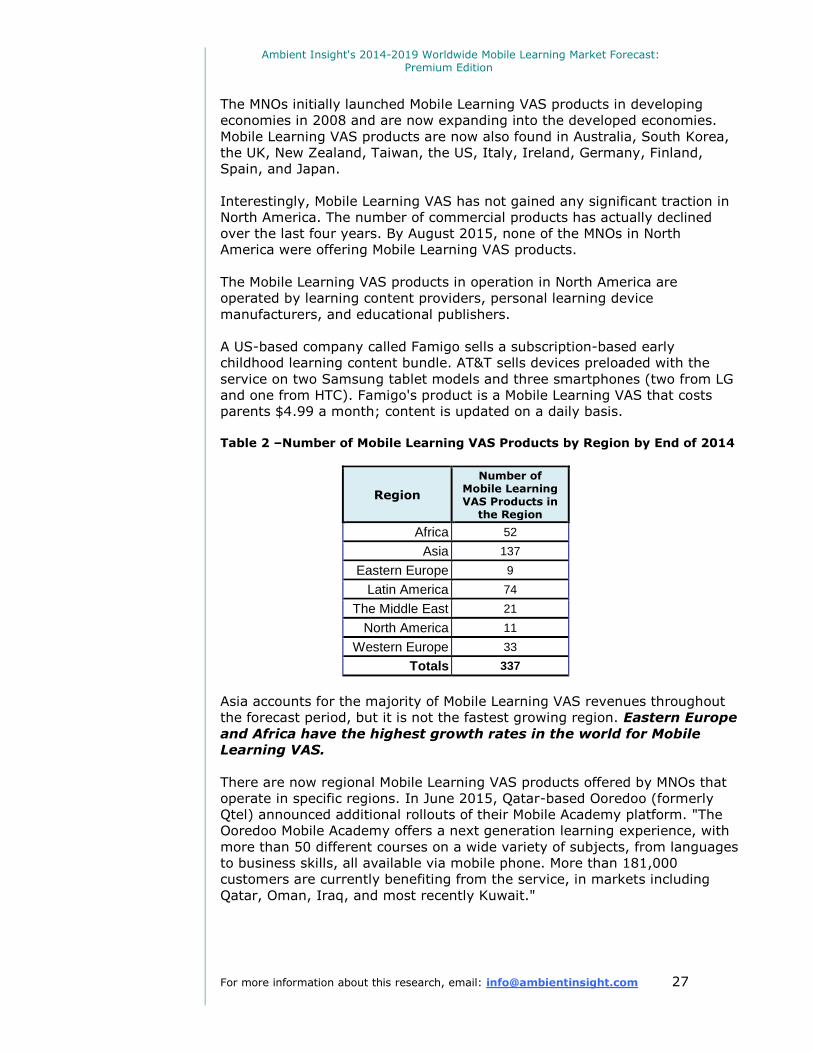
Ambient Insight's 2014-2019 Worldwide Mobile Learning Market Forecast: Premium Edition
For more information about this research, email: [email protected] 27
The MNOs initially launched Mobile Learning VAS products in developing
economies in 2008 and are now expanding into the developed economies.
Mobile Learning VAS products are now also found in Australia, South Korea,
the UK, New Zealand, Taiwan, the US, Italy, Ireland, Germany, Finland,
Spain, and Japan.
Interestingly, Mobile Learning VAS has not gained any significant traction in
North America. The number of commercial products has actually declined
over the last four years. By August 2015, none of the MNOs in North
America were offering Mobile Learning VAS products.
The Mobile Learning VAS products in operation in North America are
operated by learning content providers, personal learning device
manufacturers, and educational publishers.
A US-based company called Famigo sells a subscription-based early
childhood learning content bundle. AT&T sells devices preloaded with the
service on two Samsung tablet models and three smartphones (two from LG
and one from HTC). Famigo's product is a Mobile Learning VAS that costs
parents $4.99 a month; content is updated on a daily basis.
Table 2 –Number of Mobile Learning VAS Products by Region by End of 2014
Region
Number of Mobile Learning VAS Products in
the Region
Africa 52
Asia 137
Eastern Europe 9
Latin America 74
The Middle East 21
North America 11
Western Europe 33
Totals 337
Asia accounts for the majority of Mobile Learning VAS revenues throughout
the forecast period, but it is not the fastest growing region. Eastern Europe
and Africa have the highest growth rates in the world for Mobile
Learning VAS.
There are now regional Mobile Learning VAS products offered by MNOs that
operate in specific regions. In June 2015, Qatar-based Ooredoo (formerly
Qtel) announced additional rollouts of their Mobile Academy platform. "The
Ooredoo Mobile Academy offers a next generation learning experience, with
more than 50 different courses on a wide variety of subjects, from languages
to business skills, all available via mobile phone. More than 181,000
customers are currently benefiting from the service, in markets including
Qatar, Oman, Iraq, and most recently Kuwait."
Ambient Insight's 2014-2019 Worldwide Mobile Learning Market Forecast: Premium Edition
For more information about this research, email: [email protected] 28
Strong Consumer Demand for Mobile Learning Content
Consumers account for the vast majority of spending on Mobile Learning in
the world. Consumers buy mobile education content and edugames; they do
not buy services or tools.
With a few exceptions, the three dominant types of Mobile Learning apps
that consistently rank as bestsellers in the various app stores in the world
are language learning apps, early childhood learning apps, and brain
trainers. Astronomy apps also rank very high in the app stores. Apple's
iTunes U is now the top downloaded free educational app in 87 of the 119
countries analyzed in this report. The iTunes U app rarely ranks below third
place in any given country.
The demand for early childhood apps is found in the consumer segment and
the PreK-3 academic sub-segment. The vast majority of Mobile Learning
products designed for young children are game-based.
Toy "R"Us sells 26 tablets for young children including devices from
LeapFrog, VTech, Little Scholar, Sprout Channel, nabi Jr, Fisher-Price,
Linsay, Tabby, and Ematic. In July 2015, the top three bestsellers were
VTech tablets.
Kurio operates in twenty-two countries and sells four devices for young
children; two tablets, a smartphone, and a small mini-tablet handheld touch
device. All of the devices have robust parental control features and come
preloaded with a large library of curated educational content. Kurio operates
their own app store; parents prepay for a "Piggy Bank" dollar amount limit
and children cannot download apps that exceed that limit. Their Kurio
XTREME tablet is quite unique and has a motion sensor allowing children to
physically interact with mobile apps and edugames.
The nabi Jr tablet is developed by a company called Fuhu. In June 2015,
Fuhu launched a subscription-based product called nabi Pass Tab, which is a
hardware and content bundle; the subscription costs $9.99 for a two-year
subscription and $14.99 for a one-year subscription.
The subscription includes unlimited access to premium content from
publishers like Disney, Discovery Communications, National Geographic Kids,
and DreamWorks Animation. The subscription "also includes full access to
Wings Learning System, a comprehensive and personalized learning system
designed to build confidence and passion for learning through skill set
mastery."
The nabi Pass Tab service is essentially a Mobile Learning VAS; Mobile
Learning VAS products that include a delivery device are rare outside of
Asia. Fuhu has garnered $66.2 million in private investment since they
launched in 2008 including a $27 million investment from the Japanese
telecom KDDI in April 2014.
In August 2015, Houghton Mifflin Harcourt (HMH) acquired MeeGenius, a
Mobile Learning content aggregator that sells content for children up to eight
years old. "Available in both iOS and Android, the award winning MeeGenius
app and subscription service offer mobile access to hundreds of classic
The demand for educational tablets for young children has attracted the attention of the major players. Samsung launched their Samsung Galaxy Tab 3 Kids tablet in August 2013. Amazon launched their Amazon Fire HD 6 Kids Edition in late
2014.
Ambient Insight's 2014-2019 Worldwide Mobile Learning Market Forecast: Premium Edition
For more information about this research, email: [email protected] 29
children’s stories, MeeGenius originals, and content from authors around the
world, enhanced with interactive digital features such as read-along word
highlighting, audio playback, and engaging story narration."
One relatively new trend is the adoption of educational tablets in the
preschools. Tablets and personal learning devices are now common in the
early grades, but the adoption in preschools is just gaining traction. Global
suppliers like LeapFrog and VTech cater to this demographic with tablets
preloaded with educational content for preschool children. VINCI also
operates physical preschools in North America and China and provides every
child with their VINCI tablet.
The learning technology adoption in China's preschools is unique and the
scale of adoption is not found anywhere else in the world. There are over
200,000 kindergartens (up from 134,000 in 2008) in China and over 74%
were private. In fact, the preschool segment is so commercialized in China
that the schools are often referred to as "preschool educational stores." In
China, preschools are three-year programs.
A preschool in China enrolls children from 2-5 years old and is referred to as
a kindergarten, although it is different from kindergartens in other countries
that are usually one year programs prior to first grade. As of the end of
2013, there were 42 million children enrolled in preschools in China; this is
out of a cohort of 68 million 3-5 year olds in the country.
The private chains tend to license digital learning content from third-party
suppliers. RYB Education licenses Scholastic's content and Oriental BabyCare
licenses content from McGraw-Hill. Singapore's Popular Holdings has
preschools in several major cities in China and licenses digital English
language learning products from the BBC for use in their preschool language
learning centers.
In October 2013, Australia-based SmartTrans announced that they had been
hired by 123 Education Group to develop "online and mobile services in a
rollout of an early childhood learning program." The 123 Education Group
operates a chain of kindergartens and "Early Years Centers" across China.
A company called KBTC raised $16 million in funding in June 2014. KBTC has
a licensing agreement with Sesame Street to distribute their content in
China. The company is "developing a cloud-based solution for pre-school
education."
The companies that make the educational tablets for children usually license
third-party content and this is a new distribution channel for publishers and
game companies developing content for very young children.
Large-Scale Smart Device Adoption
This report analyzes Mobile Learning content for seven primary delivery
devices: handheld gaming devices (Nintendo, Wikipad, Razer Edge, etc.),
eBook eReaders, smartphones, phablets, tablets, augmented reality
headsets (smart glasses), and smartphone-based virtual reality headsets.
Canada-based VINCI Foundation acquired a chain of over 50 preschools in China and reach over 50,000 students. Every
child in the schools is provided with the branded VINCI kids tablet preloaded with educational content.
Ambient Insight's 2014-2019 Worldwide Mobile Learning Market Forecast: Premium Edition
For more information about this research, email: [email protected] 30
Several suppliers develop specialized devices for education and training.
These are hardware solutions and those revenues are not part of this
analysis. That said, dedicated education tablets and personized learning
devices (PLDs) are distribution channels for content suppliers and
educational device suppliers are identified in this report.
Phablets are very popular in Asia and now in the US as well. The sales of
phablets (large screen smartphones) in the US spiked in the first half of
2015. Phablets are cannibalizing the sales of smaller smartphones and
tablets. Phablet sales in the US in the first half of 2015 were more than triple
the phablet sales for the entire year of 2014.
Smartphone adoption rates are quite high in the developed countries in
North America, Western Europe, and Asia. Yet it is in the developing
economies where smartphones sales are booming. This is due to the rollout
of wireless broadband and the availability of low-cost devices priced for the
local economies. It is the speed of the adoption that is astonishing.
Broadband penetration has more than doubled in the last two years
in South Africa. According to a December 2012 government study,
"the number of broadband subscriptions grew from 3.6 million at the
end of 2010 to 8.2 million by the end of 2012, marking a growth rate
of 128 percent." By the end of 2015, at least 80% of subscribers will
be using smartphones in South Africa.
According to the Associação Brasileira da Indústria Elétrica e
Eletrônica (ABINEE) trade group, just over 52 million smartphones
were sold in Brazil in 2014 alone; this is 16 million more than 2013.
ABINEE reported in May 2015 that 14 million smartphones were sold
in the first quarter of 2015. Over 95% of phones now sold in Brazil
are smartphones.
Ecuador had just under 16 million people by the end of 2104 and a
mobile penetration rate of 123%. The smartphone penetration rate
was 42% by the end of 2014, double from the year before.
In Malaysia, smartphone usage jumped from 47% to 63% from
2012 to 2013. By the end of 2014, 74% of mobile users in Malaysia
were using smartphones.
By the end of 2014, 38% of Vietnam’s population owned a
smartphone, up from 20% the year before. By the end of 2015,
over 50% of all phones in use in the country will be smartphones
running on 3G networks.
By the end of December 2014, barely 5% of mobile subscribers in
Pakistan were using smartphones on wireless 3G and 4G networks;
yet this is growing by 2 million people a month. By the end of
2015, there will be over 33 million smartphone users in Pakistan.
In February 2015, Cisco released the results of a study that showed that by
the end of 2014, there were 140 million smartphones in use in India, a
Intel estimates that devices makers that are using the Intel Education Tablet design specification will ship over a million Education Tablets in 2015.
In Sri Lanka, smartphones sales increased over 100% in 2014 compared to the year before and now account for 20% of all phones in Sri Lanka.

Ambient Insight's 2014-2019 Worldwide Mobile Learning Market Forecast: Premium Edition
For more information about this research, email: [email protected] 31
growth of 49.3 million in one year. The study predicted that by 2019, 51% of
all phones in India will be smartphones.
The most significant trend driving the uptake of Mobile Learning in academic
segments across the globe is the adoption of tablets in the schools. This is
occurring at various levels in almost every country analyzed in this report.
Governments are launching national programs to provide tablets (and digital
content) to schools and many are large-scale efforts.
The presence of large tablet deployments is a significant revenue
opportunity for the major Mobile Learning content suppliers. Yet, the smaller
scale mid-tier deployments can also offer revenue opportunities, particularly
for domestic suppliers.
There are hundreds of smaller scale deployments ranging from 25,000 to
200,000 in school systems across the planet. Along with the large-scale
deployments, hundreds of mid-tier deployments are also identified by
country in this report.
It should be noted that tablet procurement in the academic segments is by
and large a policy decision and things can literally change overnight. Major
tablet initiatives were rolled back in the Russian Federation, South Korea,
and Thailand. Of course, the infamous botched rollout in the Los Angeles
United School District is now the poster child of how not to deploy tablets.
Other countries have stayed the course and are systematically deploying
tablets in the schools. In August 2014, the Mexican federal government
began distributing 710,000 tablets in the elementary schools: 93% of the
tablets went to students and 7% went to teachers.
In March 2015, the Mexican government announced a tender for an
additional 1.14 million tablets that will be given to fifth graders in 15 states.
The government's goal is to connect every school in Mexico with Internet
access by 2018.
The Turkish government began distributing tablets to schools in February
2012. In June 2013, the Turkish Education Ministry issued a tender for 10.6
million tablet PCs. Although the tender was open to international device
makers, three domestic firms obtained the first contracts: Mobile, Vestel,
and Telpa Telekom. In May 2015, the government stated that they
were on track to distribute over ten million additional tablets
between 2016 and 2020.
Next Generation Mobile Learning Products Hit the Market
A wave of new sophisticated (and relatively inexpensive) augmented reality
(AR) and virtual reality (VR) education and training products have come on
the market in just the last two years. Smartphone-enabled virtual reality
education apps are an entirely new type of Mobile Learning.
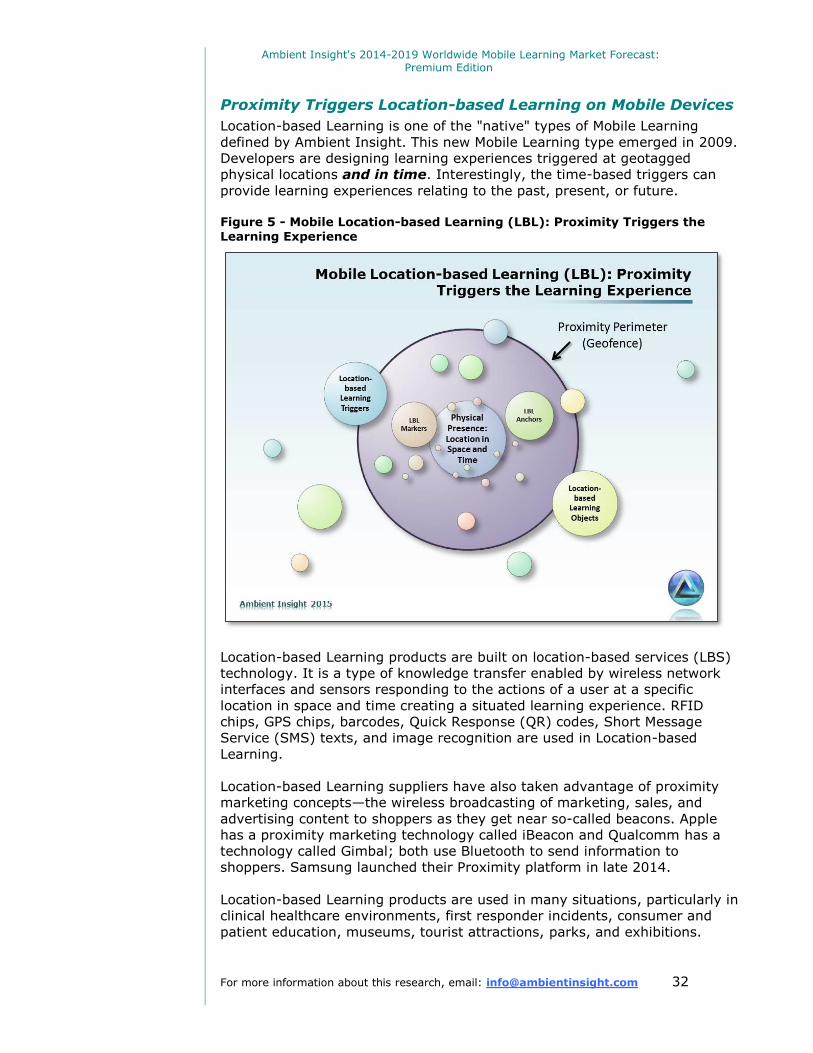
Ambient Insight's 2014-2019 Worldwide Mobile Learning Market Forecast: Premium Edition
For more information about this research, email: [email protected] 32
Proximity Triggers Location-based Learning on Mobile Devices
Location-based Learning is one of the "native" types of Mobile Learning
defined by Ambient Insight. This new Mobile Learning type emerged in 2009.
Developers are designing learning experiences triggered at geotagged
physical locations and in time. Interestingly, the time-based triggers can
provide learning experiences relating to the past, present, or future.
Figure 5 - Mobile Location-based Learning (LBL): Proximity Triggers the Learning Experience
Location-based Learning products are built on location-based services (LBS)
technology. It is a type of knowledge transfer enabled by wireless network
interfaces and sensors responding to the actions of a user at a specific
location in space and time creating a situated learning experience. RFID
chips, GPS chips, barcodes, Quick Response (QR) codes, Short Message
Service (SMS) texts, and image recognition are used in Location-based
Learning.
Location-based Learning suppliers have also taken advantage of proximity
marketing concepts—the wireless broadcasting of marketing, sales, and
advertising content to shoppers as they get near so-called beacons. Apple
has a proximity marketing technology called iBeacon and Qualcomm has a
technology called Gimbal; both use Bluetooth to send information to
shoppers. Samsung launched their Proximity platform in late 2014.
Location-based Learning products are used in many situations, particularly in
clinical healthcare environments, first responder incidents, consumer and
patient education, museums, tourist attractions, parks, and exhibitions.

Ambient Insight's 2014-2019 Worldwide Mobile Learning Market Forecast: Premium Edition
For more information about this research, email: [email protected] 33
Tour guides and exhibition guides are among the fastest growing type of
Location-based Learning. Suppliers create their own apps to sell directly to
consumers and offer a range of custom content services for organizational
buyers that provide museum tours, gallery tours, history tours, nature tours,
and city tours to tourists and patrons.
Google's Field Trip app is a good example of a GPS-enabled Location-based
Learning product. The app sends users information about nearby restaurants
and entertainment venues, but also information about historical sites and
notable architectural sites close to the user. The user's proximity to the
locations trigger the data feeds.
Rapid Adoption of Augmented Learning Products
Augmented reality (AR) technology is evolving at a fast pace; new
commercial innovations are coming on the market at a rapid rate. Mobile AR
is an ideal technology for Mobile Learning and there are dozens of successful
products on the market.
Mobile augmented reality (AR) overlays images, schematics, multimedia, 3D
objects, animation, location data, and other forms of digital content on real-
world objects and locations via the device’s camera; most AR content is
interactive.
The augmented elements are "triggered" by object recognition, print-based
markers, barcodes, and geotags (collectively these are known as triggers).
Mobile augmented reality educational apps emerged in 2010 and had a rocky
start. The demand diminished in 2012-2013, but came roaring back in 2014
and the first half of 2015; this is due to the proliferation of new
augmentation hardware and software being developed and marketed by
large companies like Microsoft, Sony, Google, Intel, Apple, and Qualcomm
and the renewed focus on corporate buyers by the industrial AR platform
providers.
Until recently, the most successful mobile augmented reality learning apps
were consumer-facing products for astronomy, anatomy, and tourism.
Popular augmented Mobile Learning apps include Star Chart with 18 million
global users and Star Walk with 10 million users across the planet.
All of the major mobile players are now in the augmented reality market;
they have entered the market by acquisition and internal product
development. In May 2015, Apple acquired Germany-based Metaio. Metaio
developed the popular augmented reality platform called Junaio; this is a
strong validation of the AR market. The vast majority of apps developed with
Junaio are travel and tourism guides.
In January 2014, Qualcomm acquired the Switzerland-based image
recognition company kooaba "in what is clearly a move to expand its
augmented reality platform Vuforia." Qualcomm's Vuforia app catalog had 89
educational apps, 39 tourism apps, and 26 architecture apps as of May
2015.
Augmented reality and virtual reality are not the same. In AR, digital information is overlaid on the real world. In virtual reality, the user is totally immersed in a simulated environment.
Ambient Insight's 2014-2019 Worldwide Mobile Learning Market Forecast: Premium Edition
For more information about this research, email: [email protected] 34
Google and Microsoft are developing their own augmentation products.
Google is developing the Google Glass headset and the Cardboard viewer
and Microsoft is working on the HoloLens headset. In late May 2015, Google
announced that they had shipped over a million Cardboard viewer kits in just
one year.
Vuzix is a smart glasses manufacturer and began trading on the NASDAQ in
January 2015; they reported that their 2014 revenues were $3.0 million, up
from $2.3 million the year before. Intel invested $24.8 million in the
company in early 2015, a clear leading indicator for the AR market.
A company called Vidyo develops AR software for the Vuzix platform.
"Vidyo’s patented dynamic adaptation technology works over variable
wireless networks to efficiently deploy applications requiring remote
expertise to see and provide guidance to field workers."
In June 2015, Intel acquired the smart glasses manufacturer Recon
Instruments, which sells smart glasses designed for sports. "Intel hopes the
formal acquisition will expand its presence in the head mounted display
market." Recon will "now partner with Intel's New Devices Group to develop
smart device platforms for a broader set of customers and market
segments."
Recon had already started expanding beyond sports. In March 2015, they
announced the integration of SAP's augmented realty apps into their Jet
headset. "The integration with SAP’s AR platform promises to expand the
company’s horizons towards other verticals such as manufacturing, oil & gas
field work and health care." SAP's augmented realty apps are compatible
with the Vuzix headset as well.
In March 2015, NASA announced an agreement with Osterhout Design
Group (ODG), a developer of sophisticated smart glasses. Astronauts will
wear the smart glasses during "line of sight check lists, guided support via
telepresence." The headset will provide them with "the ability to overlay
digital markers on machinery or equipment while keeping the user’s eyes
and hands focused on their task."
ODG launched their latest headset in June 2014 called R-7. "ODG’s Glasses
improve the productivity and collaboration of users and are already used in a
number of different industries including automotive, medical, industrial and
government sectors." ODG supports Qualcomm's Vuforia AR tool, among
others. ODG has a long history in the military and the industrial verticals;
they have a loyal developer community.
Microsoft's HoloLens is a self-contained device with a built in computer; it
does not have to be tethered to an external PC. In June 2015, NASA and
Microsoft announced a partnership in which two HoloLens headsets would be
sent to the International Space Station (ISS). "The units will be used for a
new 'Sidekick' pilot program that's designed to help crews work on the ISS.
The program provides augmented-reality overlays to educate astronauts
about how to perform certain procedures on the station, which could
eventually reduce the need for extensive crew training."
Case Western Reserve University has already developed an anatomy educational app for the new HoloLens headset from Microsoft.
Ambient Insight's 2014-2019 Worldwide Mobile Learning Market Forecast: Premium Edition
For more information about this research, email: [email protected] 35
In July 2015, Microsoft opened an RFP for higher education research facilities
to submit project ideas for the HoloLens headset. Microsoft is "interested in
seeing its technology used for things like data visualization, new forms of
collaboration, interactive art and new teaching tools." Microsoft will provide
$100 thousand in seed funding for the new projects for at least five
institutions.
A relatively recent trend is the focus on corporate buyers by AR services and
platform suppliers. Viewar is an Austria-based AR supplier that develops
custom AR apps for international corporations and businesses. NGRAIN and
DAQRI design AR products for industrial clients. It is interesting that
Microsoft is initially focusing on corporate solutions with their HoloLens
headset.
Canada-based NGRAIN has optimized their AR tools to run on the Epson
Moverio BT-200 smart glasses (headset). Lockheed Martin uses the platform
and the headset for aircraft maintenance on the F-22 and the F-35.
"Maintenance and construction are big areas. We can provide the
information the worker needs whether they're using a mobile device or the
augmented reality glasses. You can get information and step-by-step
instructions right in the field on the display in front of you. You can get
feedback on whether you're doing something right."
In June 2015, NGRAIN launched three specialized versions of their AR
platform: NGRAIN Scout, NGRAIN Consort, and NGRAIN Envoy. NGRAIN
Scout is designed for manufacturing companies, NGRAIN Consort is for
quality and repair inspections, and NGRAIN Envoy is a "virtual 3D and
augmented reality application that eliminates inefficiencies in field-based
operations."
A company called iQagent was founded in 2012 and provides AR-based
solutions to manufacturing plants. They focus on pharmaceutical and
automotive manufacturers. They first launch on the iOS platform and
launched a Windows version in May 2015. "iQagent, released in 2012, was
created originally for iOS to display data and resources associated with
equipment it ‘recognizes’ on the plant floor. With more tablets available that
are compatible with Microsoft, it became necessary to create a Windows-
based version. Knowing that manufacturing plants are 97% integrated with
Microsoft Windows software, manufacturers are able to get more out of their
investment using iQagent."
APX Labs sells an AR platform called Skylight. The software is compatible
with a range of headsets, making it device independent. In November 2014,
APX announced that Boeing was licensing the platform "for hands-free, real-
time access to engineering specifications and complex assembly
instructions." SAP also uses the APX Labs platform.
One of DAQRI's innovative products is their Smart Helmet, which is a
hardhat that has a visor that displays procedural data over objects
(machinery, construction sites, etc.) They are targeting the industrial
verticals with the helmet. "Reduce talent and experience gap with
repeatable, fully modularized, and contextualized training capturing experts’
Industrial mobile decision support products continue to come on the market at a rapid pace. The most recent products have integrated next-generation augmented reality technology.

Ambient Insight's 2014-2019 Worldwide Mobile Learning Market Forecast: Premium Edition
For more information about this research, email: [email protected] 36
knowledge and experience; avoid costly human teaching errors with the use
of precise data driven decision-support training."
Mobile augmented learning is also spreading to the schools. London-based
Blippar sells an AR authoring tool called Blippbuilder that embeds AR triggers
(what they call Blipps) in print material. "Using our simple, drag-and-drop,
web-based platform you can enable readers to buy products directly off your
magazine pages; add 3D sequences, animations and videos to your
packaging; fill your newspaper with additional image galleries; include
interactive digital polls in your printed employee handbooks; add contextual
web-links and informative PDFs to your art gallery’s paintings, or make your
school’s textbooks digitally interactive."
Blippar launched their new education division called Blippar for Education at
the BETT 2015 education trade show in London in January 2015. "Blippar's
goal in the education space is to enable educators to seamlessly enhance
learning spaces and materials digitally - which students access using their
smart device."
Next Generation Mobile Virtual Reality Learning Products
"We believe this is going to be one of the most transformative
platforms for education of all time."
Brendan Iribe, Oculus CEO, September 2014
Virtual reality (VR) immerses the user entirely in a simulated world unlike
augmented reality (AR), which overlays digital content on the real world.
Virtual reality is ideal for specific types of learning experiences including
travel, history, exploration, science, medicine, architecture, and engineering.
Commercial virtual reality educational products were quite rare prior to
2014. This changed in late 2014 and 2015; new virtual reality educational
apps are coming on the market at a steady pace.
This coincides with a spate of new VR headsets hitting the market (or that
will hit the market in 2016). In March 2014, FaceBook bought Oculus, a
virtual reality headset developer, for a staggering $2 billion; this clearly
validates the market for VR. As of July 2015, the headset was only available
to developers; the consumer version of the headset will be released in early
2016. It will interface with the Xbox One and Windows 10 provides native
support for Oculus. It will certainly be marketed heavily by FaceBook. Oculus
already has over 50 education titles in their developer catalog.
In May 2015, Oculus acquired the 3D mapping and image recognition
company Surreal Vision. "We’re developing breakthrough techniques to
capture, interpret, manage, analyze, and finally re-project in real-time a
model of reality back to the user in a way that feels real, creating a new,
mixed reality that brings together the virtual and real worlds.”
Most VR systems coming on the market require integration with either a PC
or a gaming console. In that sense, only the wireless headset can be
considered a mobile device. The proliferation of new PC-based and console
Teracle, a learning technology company serving the PreK-12 segment, launched their TerraGlass headset in July 2015. Unlike the decision support AR suppliers, they are focusing on students and consumers.
Ambient Insight's 2014-2019 Worldwide Mobile Learning Market Forecast: Premium Edition
For more information about this research, email: [email protected] 37
virtual reality platforms is a catalyst for Game-based Learning and
Simulation-based Learning.
Samsung, LG, Google, Merge, Fibrum, Shoogee, HOMiDO, Wearality, and
Carl Zeiss are developing smartphone-enabled VR systems. These new
products are delivery devices for Mobile Learning apps and mobile
edugames.
Samsung Gear VR is a smartphone-enabled headset that uses the Oculus
technology. Australia's Qantas airlines provides first-class passengers with
the Sony Gear VR headset; the content is a series of virtual tours of various
destinations served by Qantas. Apps for the Gear VR are available in the
Oculus store. One interesting Gear VR app is House of Languages, which is
an immersive language learning app for children that teaches German,
English, or Spanish.
LG launched their VR for G3 viewer in February 2015 in a partnership with
Google. The viewer is free to G3 smartphone buyers and uses Google's
Cardboard VR software. The smartphone is inserted into the viewer and the
apps are hosted in Google's Play Store.
Germany-based Shoogee claims to have launched the first smartphone VR
viewer and markets a commercial product called the Durovis Dive, "the
original Virtual Reality smartphone holder for consumers." They manage a
portal with compatible VR apps that includes tour guides, flight simulators,
and astronomy apps.
A unique VR headset is the Merge VR device, which is made of soft foam
instead of hard plastic. It can accommodate a range of smartphones from
smaller older devices to the newer Phablets. It is compatible with iOS and
Android phones. They claim it can be used as an augmented reality device
by removing the front plate. The smartphone can then be used to view
augmented content in apps.
Another unique headset is the inexpensive Wearality Sky device. It is a small
folding frame that can be carried in your pocket. It uses the Cardboard
technology and works with 5 or 6-inch Android or iOS smartphones. Any
Cardboard app will run on the small headset. It is unique in that it has a 180
degree field of view (FOV) enabled by Fresnel lenses developed by Lockheed
and Martin. The Fresnel lenses significantly reduce motion sickness.
Wearality is a spin out of Lockheed.
Sony's Morpheus headset is set for release in the first half of 2016 and
integrates with the PlayStation 4 console. In May 2015, Sony announced
they were opening a dedicated game studio to build games for the headset.
They are setting their sights beyond VR games. At the Tokyo Game Show in
September 2014, Shuhei Yoshida, the executive leading the development of
the device, stated that "With the Morpheus and PlayStation 4, we can offer a
totally new virtual reality experience in a lighthearted and fun manner,
particularly for virtual travel and education. The 3-D virtual world will allow
teachers to show students objects in a way that isn’t possible through
textbooks or tablets."
AMD launched their Liquid VR platform
in March 2015. It is an add-on for the Oculus platform designed to reduce motion sickness and latency of the 3D display. It is marketed to industrial customers.
Ambient Insight's 2014-2019 Worldwide Mobile Learning Market Forecast: Premium Edition
For more information about this research, email: [email protected] 38
The game company Valve, which operates the Stream platform, and
smartphone maker HTC, are collaborating on the Vive headset, which will
also hit the market in 2016. Even though HTC is one of the world's largest
smartphone vendors, the Vive will be tethered to a PC.
In May 2015, the Google Project Tango team and South Korea-based SK
Telecom (SKT) announced an agreement to develop an augmented reality
platform called T-AR. "T-AR will lay the foundation for many new AR and
virtual reality services to enhance customers’ experience at museums,
shopping malls, and factories."
Google and Mattel announced a partnership in February 2015 to launch a
smartphone enabled product for the iconic View-Master that displays
animated virtual learning experiences when the viewer is pointed at a
physical "experience reel". The reel triggers a virtual reality experience on
Cardboard's smartphone display. "Mattel's new View-Master offers an easy-
to-use and affordable platform that will enable users to take engaging field
trips where they can explore famous places, landmarks, nature, planets, and
more in 360 degree 'photospheres'. By pairing the View-Master's 'experience
reel' and app with an Android smartphone, kids will immediately experience
an imaginative and interactive learning environment."
The boom in virtual reality technology has created an emerging cottage
industry for VR education companies.
Boston-based Alchemy Learning has a product bundle called
Alchemy VR designed for the PreK-12 segment. It includes
hardware, software, teacher training, and custom app development.
"Alchemy VR is Alchemy Learning’s end-to-end virtual reality
solution for teachers and schools. Alchemy VR provides teachers
and schools virtual reality hardware configured to be easily
integrated into classrooms, a growing portal of educational virtual
reality experiences, and adaptive web-based curriculum and
learning management tools."
A company called Unimersiv focusses on educational VR apps and
has over 20 apps available on their site. Their most popular VR app
is Teleport: Google Street View for VR. They had 20 VR "courses"
available on their site as of July 2015.
Immersive VR Education has a range of educational VR apps
including the Apollo 11 moon landing (and moon walking)
experience. "We will cover a wide range of subjects including
History, Geography, Biology, Mathematics, Medicine, Astronomy,
and Science in an engaging and fun manor which will inspire a new
hunger for learning with our users." They support the headsets from
Oculus, Sony, and Samsung's smartphone-enabled headset.
Google started offering schools a free bundle called Expeditions based on the
low-cost Cardboard VR technology in May 2015. The bundle comes with
smartphones for the students, the cardboard (literally) viewer, and a tablet
for the teacher preloaded with a variety of field trips. The teacher selects the
expedition on the tablet and all the students experience it simultaneously in
A relatively new (and inexpensive) mobile-based VR viewer is from the German optics company Carl Zeiss; they released a $99 viewer that uses a Samsung or iPhone device inserted in "a tray" to enable VR experiences.
In January 2015, the game developer Nival launched a new division called NivalVR that focusses on mobile education VR games. Their first game was inMind and their inCell app comes out in late 2015.
Ambient Insight's 2014-2019 Worldwide Mobile Learning Market Forecast: Premium Edition
For more information about this research, email: [email protected] 39
the VR viewers. Google announced that it was working with the Planetary
Society, the American Museum of Expeditions, and the Palace of Versailles
on content for Expeditions.
A company called WEARVR operates a VR App marketplace. They have
several categories related to learning including educational, architecture,
travel, exploration, space, and virtual worlds. They support all the major VR
headsets. They publish a weekly top-ten list and educational apps
consistently rank in the top ten. WEARVR obtained $1.5 million in private
equity in March 2015.
In July 2015, a research company called Touchstone Research released the
results of a survey of 500 children regarding VR. 79% of the kids were
aware of VR. But the interesting thing is what they said they wanted to do
with VR: 64% wanted to visit another country, 64% wanted to go someplace
they could not go in reality (space), 62% wanted to go on an adventure, and
58% wanted to travel back in time (not surprisingly, most of them wanted to
go back to see dinosaurs in their natural surroundings.) This is invaluable
information for suppliers developing education VR apps for children.
Suppliers are already meeting the demand for VR for children. A learning
technology company called EXO U serves the PreK-12 segment and launched
their first Oculus title called Dinosaurs in March 2015. The app is designed to
be used in the classroom and teachers can "teleport" all the students
simultaneously to one of sixteen dinosaurs in the virtual 100 million year old
landscape.
Sources of Data on the Worldwide Mobile Learning Market
The financial reports from the domestic and international online education
companies provide invaluable insight into the rapidly evolving market
conditions and revenue opportunities in any given country.
The financial reports of publicly-traded online education suppliers are
particularly useful in providing insight into buying behavior in specific regions
and countries. Most of these learning technology companies focus on
particular products, buying segments, and specific types of content so their
financial reports provide targeted information on specific buying behavior
patterns.
The mobile network operators (MNOs) sell Mobile Learning VAS subscriptions
and post the VAS prices on their sites. They often issue press releases that
identify the total number of subscribers. Their content partners also issue
press releases on the total number of subscribers.
The major international educational publishers are active in most countries
of the world. Pearson, Sanoma, McGraw-Hill, Santillana, Cambridge
University Press, Houghton Mifflin Harcourt, Oxford University Press, and
Macmillan all have significant market presence across the globe and their
financial reports provide detailed data on the academic segments. All of
All revenue forecasts in this report are in US$ dollars based on the exchange rate for each country's currency as of May 2015.
Ambient Insight's 2014-2019 Worldwide Mobile Learning Market Forecast: Premium Edition
For more information about this research, email: [email protected] 40
these educational publishers are rapidly expanding the content catalogs with
Mobile Learning.
There are several analytics firms that track the top selling mobile apps in the
major app stores in countries across the planet. All of them have an
education category. App Annie is the best-known global app analytics firms;
they provide extensive data on the top selling and top downloaded Mobile
Learning apps in all of the countries analyzed in this report. Their top 100
rankings provide insight on the demand for specific types of content. There
are regional and country-centric mobile analytics firms as well.
There are global telecom industry trade associations like GSMA, CTIA (The
Wireless Association), and the Telecommunications Industry Association
(TIA) that offer a wealth of current data on the rapid evolution of mobile
technology in countries across the world and market forecasts for specific
products and services. GSMA has a dedicated team that tracks the uptake of
Mobile Learning across the planet.
There are dozens of regional and national telecom trade associations that
focus on market trends in specific regions and countries. There are hundreds
of news portals that focus on the telecom industry in particular regions and
countries. The Netherlands-based Telecompaper is the major global telecom
news portal and tracks the adoption of mobile technology (including Mobile
Learning) in countries across the globe.
The telecom industry is highly regulated by government regulatory agencies
in every country in the world. These agencies provide ongoing updates on
the mobile industry in their respective countries, including wireless
broadband rollouts, subscriber statistics, and mobile penetration rates; the
regulators also track the rollout of connectivity in the schools.
AR-based education products are spreading like wildfire in the industrial
verticals and in the military. A good source of information on this trend is the
Augmented Reality for Enterprise Alliance (AREA), "the only global member-
based organization focusing on accelerating AR adoption through creating
and expanding a vibrant technology ecosystem."
What You Will Find in This Report
This is an Ambient Insight Premium report. There are seven regional
sections in this report and each includes a demand-side analysis and a
supply-side analysis for that region. The seven regions analyzed in this
report include:
Africa
Asia Pacific
Eastern Europe
Latin America
The Middle East
North America
Western Europe
The various municipal, state, and federal government agencies in countries across the world disclose details on tablet initiatives including the budget, the number of tablets to be deployed, and the expenditures on digital content for the devices.
Ambient Insight's 2014-2019 Worldwide Mobile Learning Market Forecast: Premium Edition
For more information about this research, email: [email protected] 41
In the demand-side analysis, a detailed breakout of revenue forecasts is
provided for the top buying countries in each region. There are breakouts for
consumer spending on nine types of Mobile Learning content types for Brazil,
China, India, Indonesia, Japan, South Korea, and the US.
The supply-side analysis in each regional section breaks out the addressable
revenues for four Mobile Learning product types across the region (for all
countries combined). A supply side breakout is also provided for the
following countries: for Brazil, China, India, Indonesia, Japan, South Korea,
and the US.
The worldwide supply-side analysis combines all the global Mobile Learning
market revenues and breaks out revenues by four product types. Revenues
for each product type are further broken out by the seven regions.
Over 600 suppliers competing in specific countries across the planet are
cited in this Premium report. This will help international suppliers identify
local partners, distributors, resellers, and potential merger and acquisition
(M&A) targets.
Who are the Buyers?
The 2014-2019 global Mobile Learning revenues are heavily concentrated in
specific countries and this report provides an in depth analysis of those
countries. Detailed breakouts by six buyer segments are provided for seven
countries in this report including Brazil, China, India, Indonesia, Japan,
South Korea, and the US. The buyer segments are:
Consumers
Corporations and businesses
PreK-12 systems
Higher education institutions
Federal government agencies
State/provincial/municipal government agencies.
In terms of aggregated global revenues, consumers, academic, and
government buyers will dominate the worldwide market throughout the
forecast period. That said, buying behavior in each country is different; this
report identifies buying behavior that is specific to each of the 119 countries
covered in this report.
Consumers dominate most of the countries in this report, but not always.
Academic and government buyers tend to outspend consumers in countries
that have federal school systems and national digitization efforts underway.
Corporations across the planet are adopting Mobile Learning at a rapid rate
due in large part to the availability of new mobile performance and handheld
decision support products designed primarily for industrial and field-based
verticals.
These new products increase productivity and reduce error rates. For
example, Airbus reports that the use of augmented workflow on smart
glasses has reduced the final assembly error rate to zero.
The consumer buying behaviors in each of the countries analyzed in this report are quite different. This report identifies the mobile educational apps in the highest demand in each country.

Ambient Insight's 2014-2019 Worldwide Mobile Learning Market Forecast: Premium Edition
For more information about this research, email: [email protected] 42
Government agencies in many countries buy Mobile Learning content for
government initiatives including language learning, tourism, literacy,
healthcare, and, in some countries, for employee, military, and vocational
training.
There is a highly specialized type of Mobile Learning product used in the
military to enable what is known as situational awareness, a close relative of
Location-based Learning and often referred to as Geospatial Situational
Awareness. General Dynamics sells the Otus Integrated Mobile Situational
Awareness System that is designed for "remote reconnaissance and
surveillance, emergency first response, drug interdiction, border patrol, and
law enforcement."
Commandware Systems sells a similar situational awareness product. "We
started with first responders to build a simple and affordable platform that
integrates smartphones, wearables and tablets to improve your situational
awareness."
One surprising finding is the lack of Mobile Learning in the non-profit higher
education segments in several countries. This is particularly surprising in
countries with very high smart device and mobile penetration rates. Even in
countries with large-scale eLearning initiatives, Mobile Learning is often
confined to research projects and small-scale pilots in the non-profit
institutions.
Mobile patient education is now becoming common in countries with high
smartphone and tablet penetration rates. Most mHealth initiatives have a
significant degree of educational content and this is also helping drive
adoption of Mobile Learning in mobile-only countries.
What Are They Buying?
This report identifies the revenue opportunities for each region and across all
the regions for four product types. The regional and worldwide supply-side
sections provide revenue forecasts for four types of Mobile Learning products
and services including:
Retail education apps and edugames
Value added services (VAS)
Custom content development services
Authoring tools and platforms
Ambient Insight defines three types of "native" Mobile Learning products:
Mobile Decision Support, Location-based Learning, and Mobile Learning VAS
(value added service). The first two are usually sold as retail software apps
and the third is sold on a subscription basis. There are commercial tools on
the market used to develop Mobile Decision Support and Location-based
Learning and those are categorized as authoring tools and platforms in the
Ambient Insight Research Taxonomy.
In many countries, the private for-profit schools (both PreK-12 and higher education) are avid adopters of Mobile Learning, while the public schools lag behind. Those countries are identified in this report.
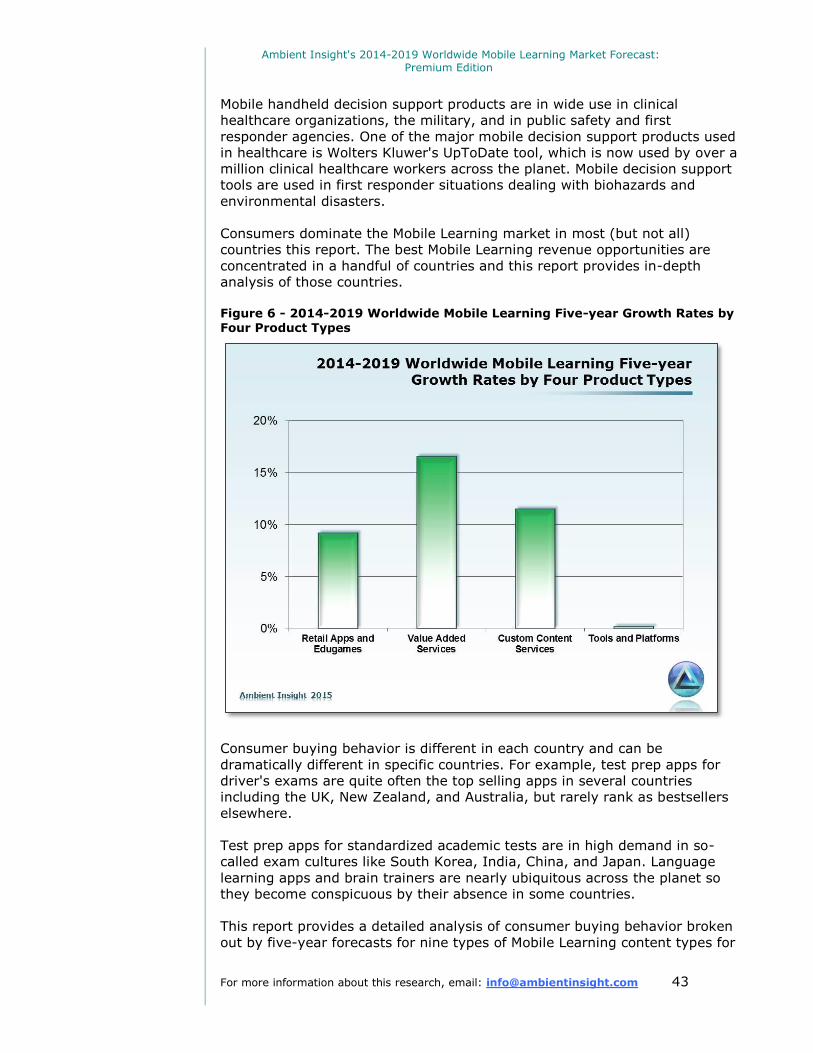
Ambient Insight's 2014-2019 Worldwide Mobile Learning Market Forecast: Premium Edition
For more information about this research, email: [email protected] 43
Mobile handheld decision support products are in wide use in clinical
healthcare organizations, the military, and in public safety and first
responder agencies. One of the major mobile decision support products used
in healthcare is Wolters Kluwer's UpToDate tool, which is now used by over a
million clinical healthcare workers across the planet. Mobile decision support
tools are used in first responder situations dealing with biohazards and
environmental disasters.
Consumers dominate the Mobile Learning market in most (but not all)
countries this report. The best Mobile Learning revenue opportunities are
concentrated in a handful of countries and this report provides in-depth
analysis of those countries.
Figure 6 - 2014-2019 Worldwide Mobile Learning Five-year Growth Rates by Four Product Types
Consumer buying behavior is different in each country and can be
dramatically different in specific countries. For example, test prep apps for
driver's exams are quite often the top selling apps in several countries
including the UK, New Zealand, and Australia, but rarely rank as bestsellers
elsewhere.
Test prep apps for standardized academic tests are in high demand in so-
called exam cultures like South Korea, India, China, and Japan. Language
learning apps and brain trainers are nearly ubiquitous across the planet so
they become conspicuous by their absence in some countries.
This report provides a detailed analysis of consumer buying behavior broken
out by five-year forecasts for nine types of Mobile Learning content types for
Ambient Insight's 2014-2019 Worldwide Mobile Learning Market Forecast: Premium Edition
For more information about this research, email: [email protected] 44
Brazil, China, India, Indonesia, Japan, South Korea, and the US. Those
content types are:
Language learning
Early childhood learning
General education, study guides, and reference
Test prep for standardized exams
How-to guides and procedural manuals
Medical, health, wellness, nutrition, and fitness (including brain
trainers)
Business, investment, and finance
Continuing Education (CE) and Continuing Medical Education
(CME)
Training and professional development
Academic buying behavior is quite different from consumer buying behavior.
Most of the content purchased by government-operated school systems is
tightly mapped to government-mandated curriculums. An analysis of those
trends are provided for every country in this report.
Device manufacturers and education publishers offer education bundles with
digital content preloaded on general-purpose tablets. So far, all of these are
sold at the state and local level. The device maker is the seller and markets
the bundles to the state education agencies and local schools. Acer and
Samsung are just two examples of device makers that provide these bundles
in several countries in Asia.
Conversely, the publishers form partnerships with third-party device makers
and sell educational bundles with the publisher's brand. The publisher is the
seller. Vibal Publishing and Diwa Learning Systems in the Philippines are
good examples. Both work directly with Filipino provincial education agencies
and local schools. Pearson sells a branded education tablet called the
Pearson MX Touch tablet in India on third-party tablets.
The global growth rate for packaged retail mobile education content is 9.2%.
The vast majority of Mobile Learning revenues on the planet are for
packaged content.
The global growth rate for native Mobile Learning tools and platforms is flat
at 0.2%. The demand is being dampened by the availability of cross platform
tools in the developed economies and by the presence of highly specialized
tools used to develop specific types of mobile content such as tour guides
and mobile decision support (and more recently mobile augmented
educational apps and smartphone-enabled VR learning apps). That said,
several new native tools and platforms came on the market in 2014 and
2015, mostly in Asia.
Wikitude is a pioneer in mobile Location-based Learning and has specialized
authoring tools used to create location-based content. They released the
2015 version of their annual AR developer survey in early 2015. These
developers provide custom services to corporate and government buyers
and the survey provides invaluable insight into what apps their clients need.
The presence of national, state, and local tablet deployments is essentially a vast new delivery channel for Mobile Learning content
suppliers.
Ambient Insight's 2014-2019 Worldwide Mobile Learning Market Forecast: Premium Edition
For more information about this research, email: [email protected] 45
"Respondents were asked what are the most relevant use cases of AR for
their clients.
53% of respondents indicated that their clients view user guidance
to points of interest, especially in the context of tourism, as the
most relevant use case.
51% of participants consider visualization of large 3D models (e.g.
historic buildings) in the real world as the second most important
application of AR for their clients.
Product visualization (50%) and optimization of work processes or
maintenance work (47%) were also mentioned as relevant use-
cases."
In terms of growth, Mobile Learning VAS has the highest worldwide growth
rate at 16.6% followed by custom content development services at 11.2%.
VAS revenues are still concentrated in Asia, Africa, and Latin America.
Custom development services are in high demand in every country analyzed
in this report. Corporations and government agencies hire developers to
create wide range of custom apps.
A brand new trend is the entry of the Asian telecoms into the personal
learning device market. In May 2012, China Telecom launched their personal
learning device called Yi Zhi Yi Ben, designed for Chinese children under 12.
In November 2012, KDDI, Japan's second largest telecom, invested $5
million in US-based Fuhu, a developer of personal learning devices for young
children. KDDI invested an additional a $27 million investment to Fuhu in
April 2014. KDDI intends to market a localized version of the device in
Japan.
Asia is the only region in the world where telecoms sell inexpensive
"education editions" of smartphones preloaded with learning content,
effectively making them personal learning devices. NTT DoCoMo in Japan is
the latest telecom to do this launching their Smartphone for Juniors device in
January 2013. The phone comes preloaded with an English-Japanese
dictionary, eBook reader, and "an education navigator app" called docomo-
zemi.
Related Research
Buyers of this report may also benefit by the following Ambient Insight
market research:
The 2014-2019 Asia Learning Market
The 2014- 2019 US Mobile Learning Market
The 2014-2019 China Mobile Learning Market
The 2014-2019 Brazil Learning Market
Ambient Insight’s 2015 Learning Technology Research Taxonomy