ambac second lien rmbs update second lien update.pdf · 6 abk second lien portfolio performance...
TRANSCRIPT

. ®. ®
Ambac Second Lien RMBS Update
August 6, 2008
2
RMBS Reserves Methodology: Overview
Key Elements in Analyzing Potential Claims: 2nd Lien RMBS
– Default rate estimation
– Prepayment rate estimation
– Loss severity assumptions
– Cash flow waterfall model
All assumptions and estimates employed are grounded by observation of historical performance of each individual mortgage pool
Seasoning should allow for more stable loss estimate
Remediation very active, likely to favorably impact ultimate losses

3
RMBS Reserves Methodology:Default Rate Estimation
Unique projection for each deal (generic vintage assumptions are not made)
A set of deal-specific roll rates (current to 30-day delinquent, 30-59 day delinquent to 60-89 days, 60-89 days delinquent to 90+ days/ foreclosure etc.) is estimated using actual recorded period-to-period roll rates and linear regression
Derived roll rate vectors are used to simulate defaults over the remaining life of the transaction
No burnout from peak levels is assumed for 24 months, beyond which the default rate is halved

4
RMBS Reserves Methodology:
Prepayment Rate Estimation:
Unique projection for each transaction
Single scalar CPR employed
Severity Assumption:
Second Lien Mortgages generally have high severities
At this stage, we use 100% for all pools
5
RMBS Reserves Methodology:Cash Flow Waterfall Model
Reverse-engineering provided by Intex solutions
Clean-up call option “turned off”
Utilized inputs for Intex model
– Default rates
– Prepayment rate
– Loss severity
– Forward interest rates
Intex returns a time-profile of potential claims that for reserving purposes are discounted at 4.5%

6
ABK Second Lien Portfolio PerformanceShows Signs of Improvement
Trend line for 30 – 59 day delinquencies for CES and HELOCs has noticeably flattened
On an unweighted basis, the average of the performance for the transaction pools shows that delinquencies appear to be flattening out, while default rates may have begun to decline
Select ABK CES and HELOC:30-59 Delinquencies Select ABK CES and HELOC: CDRs
0%5%
10%15%20%25%30%35%40%45%50%
Nov-05
Jan-0
6Mar-
06May
-06Ju
l-06
Sep-06
Nov-06
Jan-0
7Mar-
07May
-07Ju
l-07
Sep-07
Nov-07
Jan-0
8Mar-
08May
-08Ju
l-08
FFM 07FFC, Group 1 FFM 07FFC, Group 2 BSL07001, Group 2 BSL07001, Group 3OWM L06O1, Group INDS0603, Group TM T06006, Group 1 TM T064SL, Group 1SACO0602, Group 2 SACO0602, Group 1 SACO0510, Group HEM T0701, Group
SACO0608, Group CWHE06C, Group 1 CWHE06C, Group 2 CWHE06B, Group 1CWHE06B, Group 2 CWHE05F, Group 1 CWHE05F, Group 2 Average
0.0%
1.0%
2.0%
3.0%
4.0%
5.0%
6.0%
7.0%
Nov-05
Jan-0
6Mar-
06May
-06Ju
l-06
Sep-06
Nov-06
Jan-0
7Mar-
07May
-07Ju
l-07
Sep-07
Nov-07
Jan-0
8Mar-
08May
-08Ju
l-08
FFM 07FFC, Group 1 FFM 07FFC, Group 2 BSL07001, Group 2 BSL07001, Group 3 OWM L06O1, Group INDS0603, Group TM T06006, Group 1 TM T064SL, Group 1 SACO0602, Group 2 SACO0602, Group 1SACO0510, Group HEM T0701, Group SACO0608, Group INM C06H2, Group CWHE06C, Group 1CWHE06C, Group 2 CWHE06B, Group 1 CWHE06B, Group 2 CWHE05F, Group 1 CWHE05F, Group 2Average
FFM07FFC
BSL07001
FFM07FFC
BSL07001
6
77
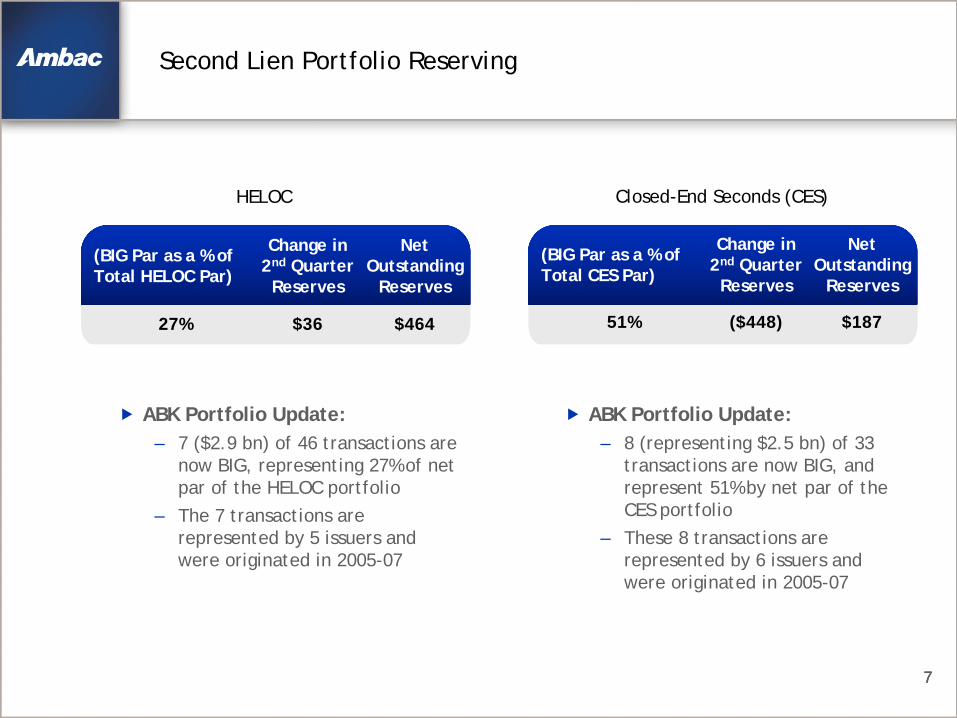
Second Lien Portfolio Reserving
ABK Portfolio Update: – 7 ($2.9 bn) of 46 transactions are
now BIG, representing 27% of net par of the HELOC portfolio
– The 7 transactions are represented by 5 issuers and were originated in 2005-07
HELOC Closed-End Seconds (CES)
(BIG Par as a % of Total HELOC Par)
Change in 2nd Quarter Reserves
Net Outstanding
Reserves
27% $36 $464
(BIG Par as a % of Total CES Par)
Change in 2nd Quarter Reserves
Net Outstanding
Reserves
51% ($448) $187
7
ABK Portfolio Update:– 8 (representing $2.5 bn) of 33
transactions are now BIG, and represent 51% by net par of the CES portfolio
– These 8 transactions are represented by 6 issuers and were originated in 2005-07

8
Significant Progress Towards Remediation Related to Second Lien Exposures
2Q 2008 estimated remediation recoveries aggregate to $263mm on a PV basis across 8 second lien collateral transactions
The estimate is based upon substantiated breaches of representations and warranties on over 1,800 loans where actual loan file examinations were performed by consultants to Ambac. These consultants have significant experience in the quantitative and qualitative aspects of mortgage lending
This remediation estimate is only an initial sampling of mortgage loans for which we are seeking recoveries and we are significantly expanding the number of loans and transactions under review
– The 8 second lien transactions contain over 85,000 loans
– There are an additional 6 second lien collateral transactions with NPO of $1.5 bn
Detailed loan file review reveals a significant number of deal representation and warranty breaches. We are continuing to build cases to support loan repurchase demands
The estimated recoveries will be revised as the scrutiny of the mortgage loan pools progresses
8

999
HELOC Performance Summary
Bank originated and pre-2005 transactions performing in-line with expectations
Certain HELOC transactions have shown largely significant deterioration over the last few months
Remediation efforts focused on non-bank originated product
Bank Originated Non-Bank Originated 2005-07 Originated <2005
Net Par Outstandingas of 6/30/08
$4,078 $4,306 $2,310
Reserves $0 $464 $0
Weighted Average Cumulative Collateral Loss
0.7% 5.3% 1.7%
Weighted Average 60+ dlq. (incl. FC & REO)
0.4% 8.8% 6.5%
Weighted Average Loan Age (months)
43 32 52
9

10
CES Summary
Conventional CES showing acceptable performance – Mainly refinance, full doc or streamlined loans with good geographic
diversification and lower CLTVsPiggy-back CES with high concentrations of purchase and stated doc loans encompass 100% of CES reserves
– Started to pay claims on one transaction in the 2nd quarter
10
($mm) Conventional CES80/20 Piggy-back CES with
High concentration of Purchaseand Stated Doc Loans
Net Par Outstanding at 6/30/08 $2,390 $2,441
Reserves $0 $187
Weighted Average Cumulative Collateral Loss 3.2% 18.5%
Weighted Average 60+ del. (including FC & REO) 5.4% 13.6%
Weighted Average Loan Age (months) 39 23
10

11
Summary: Loss Reserve Methodology and Results
Ambac has developed a conservative reserving methodology, utilizing pool specific assumptions, which it has consistently applied to all reserved second lien product
The methodology throws up clear adverse outliers in performance, but also demonstrates that this poor performance is not systemic
Similarly, a more detailed product segmentation within both the HELOC and CES categories illustrates the highly differentiated nature of clear segments of the portfolio
Adverse performance is not systemic, but instead highly concentrated in limited sub-segments of the portfolio i.e. Non bank HELOCs and piggy back CES

12
Remediation Summary
Ambac has a track record of successful RMBS recoveries
Engaged top level consultants
– Experts in diagnostic, forensic and legal transaction scrutiny
Aggressively remediating current portfolio
– Exercising full contractual rights and remedies
– Actively pursuing select repurchase opportunities, being mindful of capital / liquidity implications
Recoveries beginning to yield significant value